STARWOOD HOTELS 8~ RESORT WORLDWIDE (HOT) . ___._ _ _i _i— I _ ~ `--- r ni ` 3 > >o ans St~< ~. r ~f .r i ,~ 1 ~ I 1 I 1 1 1 1~ 6 ~'~ Method #1 - $ 83.60 Method #2 $ 73.97 Method #3 $ 72.08 Method #4 $ 43.68 Average of other methods $ 68.33 w~;. - ~-, ---------- ;., , ~ .., Market Data Market Cap (intraday)': 14.21 B Enterprise Value (Mar 29, 2016) 3 : 15.44B Enterprise Value/EBITDA (ttm)~: 14.6x Financial Summary (12/31/2015) Revenues $5.76 B EB[TDA $1.03B Net [ncome $489mm Financial Analysis Solvency Ratios LTD /Total Capitalization 64.5% EBITDA /Interest (Interest Coverage) 4.78x LTD / EBITDA 2.28x Protitability Ratios Gross Margin 73.6% EBITDA Margin 17.9% EBIT Margin 12.8% Return on Assets (ROA) 4.1% Gross Return on Assets 8.7% Return on Equity (ROE) 24.4% Profile Starwood Hotels & Resorts Worldwide, Inc., together with its subsidiaries, operates as a hotel and leisure company worldwide. The company owns, operates, and franchises luxury and upscale full -service hotels, resorts, residences, retreats, select -service hotels, and extended stay hotels under the St. Regis, The Luxury Collection, W, Westin, Le Meridien, Sheraton, Four Points, Aloft,- Tribute Portfolio, and Element brand names. It also develops, owns, and operates vacation ownership resorts; and markets and sells vacation ownership interests in the resorts, as well as provides financing to customers who purchase such interests. In addition, the company develops, markets, and sells residential units at mixed use hotel projects. As of December 31, 2015, the company had 1,282 owned, managed, or franchised hotels with approximately 362,300 rooms; and approximately 15 stand-alone vacation ownership resorts and residential properties. The company was founded in 1969 and is headquartered in Stamford, Connecticut. Page ~ 1

Welcome message from author
This document is posted to help you gain knowledge. Please leave a comment to let me know what you think about it! Share it to your friends and learn new things together.
Transcript

STARWOOD HOTELS 8~ RESORT WORLDWIDE (HOT)
. ___._ _ _i _i— I _ ~`--- r
ni ` 3
> >o ans
St~< ~.r ~f .r
i
,~ 1 ~ I
1 I 1 1 1 1~6
~'~ Method #1 - $ 83.60
Method #2 $ 73.97
Method #3 $ 72.08
Method #4 $ 43.68
Average of other methods $ 68.33
w~;.- ~-, ---------- ;., , ~ ..,
Market Data
Market Cap (intraday)': 14.21 B
Enterprise Value (Mar 29, 2016)3: 15.44B
Enterprise Value/EBITDA (ttm)~: 14.6x
Financial Summary (12/31/2015)Revenues $5.76 B
EB[TDA $1.03B
Net [ncome $489mm
Financial AnalysisSolvency Ratios
LTD /Total Capitalization 64.5%EBITDA /Interest (InterestCoverage) 4.78x
LTD / EBITDA 2.28x
Protitability Ratios
Gross Margin 73.6%
EBITDA Margin 17.9%
EBIT Margin 12.8%
Return on Assets (ROA) 4.1%
Gross Return on Assets 8.7%
Return on Equity (ROE) 24.4%
ProfileStarwood Hotels & Resorts Worldwide, Inc.,together with its subsidiaries, operates as a hoteland leisure company worldwide. The companyowns, operates, and franchises luxury and upscalefull-service hotels, resorts, residences, retreats,select-service hotels, and extended stay hotels underthe St. Regis, The Luxury Collection, W, Westin,Le Meridien, Sheraton, Four Points, Aloft,- TributePortfolio, and Element brand names. It alsodevelops, owns, and operates vacation ownershipresorts; and markets and sells vacation ownershipinterests in the resorts, as well as provides financingto customers who purchase such interests. Inaddition, the company develops, markets, and sellsresidential units at mixed use hotel projects. As ofDecember 31, 2015, the company had 1,282 owned,managed, or franchised hotels with approximately362,300 rooms; and approximately 15 stand-alonevacation ownership resorts and residentialproperties. The company was founded in 1969 andis headquartered in Stamford, Connecticut.
Page ~ 1

Financial Analysis
FY15 vs. FY14
Operations:• Net sales for FY15 were $5,763MM, a decrease of $220MM or 3.7% compared to $5,983MM for FY14. The
decrease was due to the continue sell down of the Time Share business. Excluding the sale of this business thehotel operations increased more than 2.5% .
• COGS slightly decreased by 11.1% to $1,519MM in FY15 vs. $1,708MM in FY14. COGS benefited from thesale of the sale of Time Share business -this contributed to an increase in Gross Margins from 71.5% to 73.6%- significantly higher than the 56.2% 10-year gross margin average.
• Operating expenses increased by 33% to $3,504MM in FY15 vs. $3,392MM in FY14 primarily driven by aone-time non-recurring expense of $100MM associated with the sale of the Time Share business and increasedcompetitive promotional activity.
• As a result of the above, operating income for FY15 was $740MM, a decrease of $143MM, or 16.2%,compared to $883MM for FY14.
• EBITDA/EBITDA margin slightly decreased to $1,033MM/17.9% in FY15 vs. $1.080MM/18.1% in FY14 dueto the above issues.
Cash Flow:• OCF decreased to $890MM in FY15 from $994MM in FY14 primarily due to lower income as described above• Capex totaled $261MM in FY15 vs. $327MM in FY 14; the lower Capex is the lowest in 5 years.• Financing activities used $1,096MM of cash in FY 14 vs. a used of cash of $1,240MM in FY 15 primarily due to
net capital contributions in connection with the proceeds from Acquisition-related financing, partially.• As a result of the above, change in cash for FY15 was +$100MM vs 310MM in FY14 and total cash on hand
was $1,102MM at FYE2015.
Leverage:• Total debt decreased to $2,359MM FY15 vs. $2,944MM at the end of FY14. Total leverage decreased to 2.3x
at the end of 2015 vs. 2.73x at the end of FY14 due to lower Debt and flat EBITDA .
• Interest coverage ratio slightly increased to 4.81x at the end of 2015 vs. 4.78x at the end of FY14 primarily dueto lower EBITDA.
• Total Debt/Capitalization was flat at 64.5% at the end of FY15 vs. 65.9% at the end of FY14
Operating Info:December 31,
2015 2014 Variance
Worldwide (996 hotels with approximately
291,900 rooms)
REVPAR (1) $ 121.57 $ 122.02 (0.4 )%
ADR $ 172.11 $ 176.56 (2.5 )%
Occupancy 70.6 g 69.1 ~ 1.5
Americas (565 hotels with approximately
163,000 rooms)
REVPAR (1) $ 129.82 $ 125.17 3.7 0
ADR $ 176.26 $ 173.06 1.8 g
Occupancy 73.7 0 72.3 $ 1.4
FAME (195 hotels with approximately 51,100
rooms)
REVPAR (1) $ 133.14 $ 146.17 (8.9 )°s
ADR $ 196.44 $ 219.75 (10.6 )o
Occupancy 67.8 g 66.5 g 1.3
Page ~ 2

Asia Pacific (236 hotels with approximately
77,800 rooms)
REVPAR (1)
ADR
Occupancy
Ratio Analysis
PERIOD ENDING 31-Dec-15 31-Dec-14 31-Dec-13 31-Dec-12
Solvency RatiosLTD /TotalCapitalization 64.5% 65.9°/o 36.6% 36.6%
EBITDA / Interest(Interest Coverage) 4.78x 4.58x 3.70x 6.29x
LTD / EBITDA 2.28x 2.73x 1.65x 1.69x
Profitability Ratios
Gross Margin 73.6% 71.5% 68.5% 62.8%
EBITDA Margin 17.9% 18.1% 17.9% 16.9%
EBIT Margin 12.8% 143% 10.9% 14.1%
Return on Assets(ROA) 4.1% 5.4% 2.0% 6.1%
Gross Return on Assets 8.7% 9.7°/a 7.5°/a 9.7%
Return on Equity(ROE) 24.4% 20.1°/a 5.6°/a 18.5°/a
Trend Analysis Ratios
Revenue Growth -3.7% -2.2% -3.3% 12.4%
Pier AnalysisDirect Competitor Comparison
Market Cap:
Employees:
Qtrly Rev Growth (yoy):
Revenue (ttm):
Gross Margin (ttm):
EBITDA (ttm):
Operating Margin (ttm):
Net Income (ttm):
HLT =Hilton Worldwide Holdings Inc.
MAR =Marriott International, Inc.
~ H =Hyatt Hotels Corporation
Industry =Lodging
HOT HLT MAR H Industry
14.21 B 22.196 17.926 6.506 2.896
188,000 164,000 127,500 45,000 7.80K
-0.10 0.01 0.01 -0.02 0.14
3.036 7.146 2.866 2.546 634.10M
0.50 0.43 0.74 0.37 0.43
1.056 2.478 1.556 643.00M 117.08M
0.28 0.26 0.48 0.13 0.14
489.00M 1.408 859.00M 124.00M N/A
$ 96.82 $ 99.86 (3.0 )o
$ 146.38 $ 155.92 (6.1 )%
66.1 a 64.0 °s 2.1
Page~3

Projections Analysis
Income Statement ProleCtionS
Operating10-year Assumpt.
PERIOD ENDING Average Input 30•Dec•16 30-Dec-17 30-Dec-18 30-Dec•19 30•Dec-20 30-Dec-21
5,935,890 6,410,761 6,859,514 7,202,490 7,582,615 7,940,745Total RevenueCOSt Of R2~,C~uB 2,552,433 2,756,827 2,949,591 3,097,071 3,251,924 3,414,521
Gro$ Profit 3,383,457 3,654,134 3,909,923 4,105,419 4,310,690 4,528,225
Total Operating Expenses 2,671,151 2,884,843 3,088,782 3,241,121 3,403,177 3,573,335
712.307 789.291 823.142 884,298 907.514 952.889EBIT
Interest Expense 173,079 164,425 155,771 147,117. 138,4&3 129,808
538,228 804,866 887,371 717,182 789,051 823,080EBT
Income Tax Expense ~ iB1,788~ 181,460 200,211 215,155 230,715 248,924
377,460 423,407. 487,180 502,027 538,336 578,156Net Income
Income Statement Aswmptions
Revenue Growth o.os% a.00% e.00x 7.00% 5.00q 5.00% 5.00%
Gross Margin es.n% s~.00q e7.00h szoox sz00% sz00% ez00% sz00%Operating Exp as % of Reeenue aa.~s% as.00% as.00% ae.00% 4s.00% as.00% as.00% a5.00q
TeX 85 % of EBT -sz.~~q 30.W% 30.00% 30.00% 30.00% 30.00% 30.00% 30.00%
O1herA~umpdons % ofRevenue
237,436 258,430 274,381 288,100 302,505 317,830DepreciationCepBX 358,153 384,&i6 411,571 432,149 453,757 476,445
Depreciation 3.77% 4.00% 4.00°k 4.00% 4.00% 4.00% 4.00% 4.00%
Capital Expenditures ses~ aoow s.00% s.00% s.00% s.00% s.00/ s.00%
Debt Schedule
Short Term DebtLong Term Debt
z zai oso z,iza,ioo z,00s,~so ~,ea~,zoo i ~ss,zso i,es~,aooTotal Debt Outstanding
Increase/Decease s.005v (~~~,eso~ ~ii~,sso~ (~n,sso) ~ii~,seo) (ii~,sao~ ~in,seo)
Interest Payment zaa% 173,079 isapz5 t55,n~ ia~,in 138,463 izs,eoe
Ratio Ana lysis - A~umpdons
30-Deo-18 30-Deo-17 30-Dec18 30-Deo-19 29-Dec-20 29-Wo-21
sas,~az ~,oz5,~2z ~,ae~,szz t,i5z,3sa i,2iopia ~,z7o,5i9EBITDA
Trend Malysis3.00% e.00% ~.00% s.00% s.00i s.00%Revenue Growth
Solvency Ratios (Leverage
2.38x 2.o7x 1.a3x t.sax i.asx 1.3oxTotal Debt / EBITDA (Intl. CPLTD)EBITDA /Interest Coverage Ratio s.asx s.zax zoex zeax s pax s.~s c
EBIT/Interest Coverage Ratio a.12x a.sez 52ez s.e~x s.ssx zaax
ProfiWbilily Rados57.00i s~.00q 57.00% 57.00i s~.00i s~.00%Gross Margin %
EBITDA Margin % ~s.00r is.00% ~s.00% ~s.00~ is.00r ~s.00~
EBITMargin % X2.00% i2.00~ X2.00% iz.00/ iz.00/ iz.00%
Page ~ 4
Projection Analysis Assumptions
Revenue:
• Total revenue growth ranges from 4.2% to 5.6% from FY14 to FY18 with average annual growth ofBase Business of 4.5% from 2013-2018E. Total revenue growth will stay at 3% over the remainingyears of tenor.
EBITDA:
EBITDA margin will improve from 18.6% PF 2013 to 23.3% over the tenor as a result of EBITDAmargin improvement from Base Business and EBITDA from Luxottica's Synergies.~ Base case assumes flat gross margin at 41.9% over the tenor.
• Operating expenses to gow at 3.8%from 2013~ Projections conservatively forecast $5-7MM of cost savings over time for 1-800 Contacts from
better pricing terms and increased co-op payments from manufacturers.
Other Assumptions:
Capital expenditures consistent with historical levels at ~2% of sales with limited working capitalrequirements.CBDA-II assumes deal closes in the PF FYE 13 period with first principal payment starting 1 Q 14(3/31/2014).USCB-5 conservatively assumes a cash build which keeps leverage and cash interest expense atelevated levels as opposed to using FCF to repay debt.
Results:
• The Company does not draw on the RC facility throughout the projection period and it is assumedthat it will be refinanced at maturity in FY19 in order to maintain the liquidity cushion. Therefinancing risk is mitigated by the Company's ability to de-lever by more than 2.Sx on gross basissince the closing of the LBO.
• FCF (OCF — Capex) to pay principal ranges from $31-65MM annually over the tenor.
• Total 1S` Lien Leverage and Total Leverage improve from S.Ox at FYE13 to 0.8x by FYE20 (one yearbefore TL B maturity) and from 6.6x at FYE13 to 1.7x at FYE20, respectively.
• No additional drawings on the R/C with build-up of cash from $34MM in FY13 to $275MM byFYi9.
• At FYE20, ls' Lien TL will have $376MM principal outstanding one year prior to maturity. CBDA-IIassumes the Company will keep approximately $61 MM cash on hand (higher than minimum cashrequirement of $3.7MM) and use the remaining excess cash to pay down the principal at maturity.The refinancing of the remaining $ l 00MM would be manageable given the Total 15̀ Lien leverage of0.8x and Total Leverage of 1.7x at FYE20 and the fact that the projection shows the Company willbe able to make the debt payment over the tenor.
Page ~ 5

Valuation Analysis
METHOD #1 -Stock Price
Stanwood Hotels 8~ Resorts Worldwide Inc. (HOT)
Calculations - SP SO SP'SO=EQ D C ED+D-C=EV
Stxks Debt Enterprise
Stock Price Outstanding Equity Value (STBLT) Cash Vale
Com n S mbol (as of 312 912 01 6) (EOW) (E~) (E~) (E~) 5000
Stvm~ond Ilatele & R..orb rypT S 83.80 170,000 14,212,OW 2,359.000 1.102,000 i6,COD,000
Stalwood's EV 15,4W,000
METHOD #2 - EBITDA Multiples
Stanwood Hotels &Resorts Worldwide Inc. (HOT)SP SO SP'SO=EQ D C E~t~-C=EV E EV/E
Com n S mbol
Stock Price
(as of 3129/2016)
Stacks
Outstanding
($000)
EquiTy Value
(EOW)
Debt
(STBLT)
(5000)
Cash
(EWO)
EnterpriseValue
(5000)EBITDA
(5000)
EBI7DA
Multiple Beta
Choice lbtels lu~eruati000l CIiH $ 52.98 56.620 2.998.595 81],560 199,430 3,Bie,M5 22]8]0 75.8]x 135x
Milton KT $ 22.42 98],450 22,138,629 10,840,000 fi28000 32.350.8]8 2,<20,000 73.37%
IIYott H 5 47.91 168.290 ].106.5]4 1380.000 634,000 7A~S74 640,000 12.372 t.50z
Ivcercootiucnhl Haul IHG $ 4090 235,000 9,x70,500 1820,000 205,000 11,185,500 ]39000 15.74x 1.3h
Nurcue Corpnn~iou ISMS $ 19.35 18.950 386,683 258,020 6.190 818,513 95,]90 8.48u OA7z
~lamion iorcruv~i000l M4R 5 ]0.81 256.840 18,1%,840 3,920.000 140,000 11.888.840 tp80.000 14.84x t.39x4begvn lioccl Cro~~p hTiGC S 1.36 3M1.]10 4],208 608,210 38.1]0 814.808 44,480 13.83x 2.13%
Bcimavt (NKOrien~tiprexr~ BEL b 942 102,190 9fi2,630 606,130 1]4,600 1,384,180 102,520 13.BOa 1.~3x
lVyodhem Worldwide WVN $ ]5.02 112.510 8,440,500 5,210,000 1]1000 13,d]8,500 1260000 10.]Ox 1.
Srorwoad ilotele&Resort FIOT $ 83.60 1]0,000 14,212000 2359,000 1,102,000 ib,48B4O00 1033,000 14.872 7
Average tz.eox t.aex
EBITDA'Averege Multiple 1,033,000 13.39~e Excl. Outlier 13.3Dx
(taken out the high and low)
Starwood's EV 13,831 633
METHOD #3 -Transaction Comparative Analysis
Stanwood Hotels 8~ Resorts Worldwide Inc. (HOT)
Calculations PP SO AP'SO=ED D EQ*D=EV E EV/E
Date Anouncement Target Acquirer
Acquisition
Price IShare
Shares
OutNanding
Equity Value
Emm
Total Debt
Emma
Enterpised
Value (EV)
EBITDA (last
reported
EBITDA
Multlple
11/16/2015 Staiwood Hotels Anbang Gmup $ 82.75 170,000,000 $ 14,067.50 $ 2,359.00 $ 16,426.50 $ 7,033.00 15.90%
9/8/2015Strategic Hot &Res
(REIT of upscale hotels)Blackstone Group $ 14.25 275,500,000 $ 3,925.88 $ 7,272.04 $ 5,197.91 $ 402.00 12.93%
5/4/2012 Great WoN Resort A Ito Global $ 7.85 $ 1,103.70 $ 130.00 8.49%
7/4/2007 Hilton Hotels Blackstone Group $ 47.50 390,400,000 $ 18,544.00 $ 6,180.00 $ 24,724.00 $ 1,680.00 14.72%
i V6/2006 Four Seasons'
Kingtom Hotels Int'IGates' Cascade
Irnstmen[s
$ 82.00 33,078,000 $ 3,300.00 $ 278.68 $ 3,578.68 $ 112.18 31.90%
5/11/2006 FairmoM/Rafles Ki om Hotels Inl'I $ 45.00 73,333,333 $ 3,300.00 $ 123.50 $ 3,423.50 $ 18720 1829%
1/10/2006 Hilton IrRemational Hilton Hotels Co $ 5,578.00 S $ 5,578.00 $ 504.00 11.07%
71/1M2005 Stanwood Hotels Host Martioft $ 4,096.00 $ 315.08 13.00%
10/24/2005 La-Quints Co $ 12.22 203 $ 2,474.00 $ 925.77 $ 3,400.00 $ 229.70 14.80%
8/16/2005 W nham loft Blackstone Grou $ 1.75 772,053,000 $ 197.86 S 2,681.96 $ 2,879.82 $ 275.18 10.47%
8/8/2005 John Q. Hammons Hotels JQH Ac uisition LAC $ 24.00 19,583 $ 470.00 $ 76520 $ 1,235.00 $ 123.07 10.00%
07/22/2005 Societe du Lou~+e Stanwood Ca ital $ 1,028.90 $ 91.05 71.30%
3/10!2005 Intercontinental Hotels LRG $ 981.00 $ 106.63 920%
12/10/2004 Boca Resorts Blackstone Grou $ 24.00 40,284,000 $ 966.82 $ 217.29 $ 1,184.17 $ 90.07 13.15%
8/18/2004 Prime Hos italic Blackstone Grou $ 72.25 44,808,000 $ 548.90 5 243.60 $ 792.50 $ 55.12 ~4.38x
3/8/2004 Extended Sta Blackstone Grou $ 79.93 95,077,000 $ 1,894.88 $ '1,231.50 $ 3,126.38 $ 224.85 13.90%
Foul Seasons $112.18 mllwn ~ep~esen~s 100/ ttlllUH ~LUUS ttlllUA was Jt l 4 nega~rve)
EBITDA ̀ Average MWtiple 1,033,000 13.082
Stanvood's EV 13,509,992
Avefege 13.Wx
Adjust. Outlier ta.oax
Page ~ 6

Valuation Analysis DiscussionComparing Starwood's current trading Enterprise Value (EV) with the trading EV of their peers, Stanwood isovervalued at EBITDA multiple of 14.97x versus the average of 12.39x. Even if we compare specific hotelcompanies that Stanwood directly competes such as Marriott, Hyatt, Wyndham and Hilton, Starwood's current stockstill trades higher as illustrated on Method #2.
Method #3 also suggests that the on-going comparable acquisition multiple is lower on an average than Starwood'strading multiple (13.97x vs 14.97x).
More convincing that the other methods that suggest that Stanwood is overvalued is Method#4 or using DCFanalysis (see chart below). Based on the projections discussed above the DCF analysis suggests that the value of
Stanwood is significant lower than the trading levels.
METHOD #4 -Discount Cash Flow Valuation AnalysisCalculafin WACC
Amount %Cap Returnllnter After Tax WACC
Markel Value of Equity (Tiadirg) 14,272,000 85.8% 18.48% 16.48% 15.85%
Total Debl 2359,000 14.2% 7.34% 5.14% o.73%
Total Capital 76,571,000 'Iao.O% 16.58%
6y~r Treasury Nae = 1.65% (given)
Historical Market Premium = 9.~~%. (given)
Company Beta = 1.87x
Historical Tax Rate = ~.~%
Stanwood Hotels 8~ Resorts Worldwide Inc. (HOT)yea (n) = 1 2 3 d 5 6
Discout Cash Flow Valuation Analysis Projected (yr7-yr6) In ut Actual IXIT YEAR
Assumptions 31-Deo-15 36Dea18 30.Deo17 30-Dao18 30.Dea19 3ODeo- 30~Deo-21
Revenues 5,763.000 5.935.890 6,410,761 6,731.299 7,067,efi4 7.421.257 8,405,635
Re~enUe GloW[h ASsu(IIPI'lOns 3.0% 8.0% 5.0% 50% 5.0% 13.3% 80%
Cost of Re~enu~(COGS) 43.0% (1,519,000 (2,552,433) (2,758,627) (2,894,459) (3,039,182 (3,191,141 (3,814,423)
Operating Expenses 45.0% 3,504,000 2671151 2,884843 3,0290&5 3,180,539 3,339,SBfi 3,782,536
EBIT 740,000 712,307 769,291 807,756 848,144 890,551 1,008,676
Less Taxes / % of EBIT 30.0% (222,OW (213,692) (230,787) (242,327) (254,443) (267,165) (302,603)
Plus Depreciation 4.0% 193,000 237,436 256,430 269,252 282,715 296,850 336,225
less Capex 6.0% 26 ,000 356153 384,646 403 878 424 072 445 275 504 338
Cash Flay 450,000 379,897 410,289 430,803 452,343 470. 537,961
EBIIDA 1,033,000 949,742 1.025.722 1,077.008 1,130.858 1.187,401 1,344,902
Terminal Value Assumptions
EBIiDA Multiple Method 13.39x (EBIiDA x Market EBIlDA Multiple) 15,898,030
Perp~uity MelFrod 16.58% Next Yr Cash Flow / (WACC -Next Yr Rev Growth) 16,222,820
Average 16,060,925
Less Debt Outstanding (at Exil) (1,789,250 f-(75% of orginal Debt)
Plus Cash (at Exit)
EquRy Value a[ Terminal 14,291,675
Equity Cash Flaxs 379,897 410,289 430,803 452,343 14,766,635
PV Table or (7 I [ (1 + i) " n ] ~ 0.89402 0.71238 0.60126 0.50748 0.42833
Present Value of Equity 320,842 292,280 259,026 229,556 6,324,939
Togl Present Value of Equity 7,426,443
+PV of Deb[= 2,359,000
-Less Cash = 1,102,000
'3 EV 8,683,443
Valuations ResultsBased on all three methods (method 2-4) the conclusion is that Starwood's' current trading level is overvalued. Thereasons are more technical in nature as Marriott and Anbang are bidding for Stanwood pushing the stock to newhighs.
EV Debt Cash E Value Shares Outs Stock Price
Method #1 - Currerrt Market Price 15,469,000 2,359,000 1,102,000 14,212,000 170,000 $ 83.60
Method #2 13,831,633 2,359,000 1,102,000 12,574,633 170,000 $ 73.97
Method #3 13,509,992 2,359,000 1,102,000 12,252,992 170,000 $ 72.08
Method #4 8,683,443 2,359,000 1,102,000 7,426,443 170,000 $ 43.68
Av of other methods 12,873,517 2,359,000 1,102,000 11,616,517 $ 68.33
Page ~ 7

Technical Analysis_ _.
~.. ,.a~a`;
! ti ! ) ".
_w /~ 7 ~ ~ ~ 1
~r~SRt~F~—
't' ~ __- : - awl_"__._ ..._
C
µ 1'15 — i Z 4 ~_, ; ~ ~r
.i.. _.____ __ . .. S. _. _... _ _. _ _ _. ~.a !. •.. ~ ,s ~ ~ ~'
. ~ rj ~ r .~.~ ,. °~.. E - ~ M Jl .. ._ _....~
#• i
~~
... .. p
STARWOOD STOCK10 Year Average Stock (Adj) 50.2876210 Year High 83.8410 Year Low 10.0610 year Median 49.055
10 Year Monthly Average Change 1.17%Standard Deviation 11.7°/aSkew 1.222
Return /Standard Deviation 0.10029
S&P INDEX10 Year Average 1454.00510 Year High 2107.3910 Year Low 735.0910 year Median 1391.75
10 Year Monthly Average Change 0.49%Standard Deviation 4.4%Skew -0.718
Return /Standard Deviation 0.110763
10 Year Beta Coefficient 1.994737
Page ~ 8

APPENDIX
Page ~ 9

Stanwood Hotels &Resorts Worldwide Inc
. (HOT)
Income Statement
Annual
7 8 9 10
11 12
13
14
151617
1819
20
21 2223
2425
2627
282930
31 3233
34
35
3637
PERIOD ENDING
1-Dec-15
3 -Dec-14
1-Dec-
1-Dec-
-Dec-1
-Dec-
1-Dec-
-Dec-
-De c
- 7
31-De c-
Total Revenue
5,763,000
5,983,000
6,115,000
6,321,000
5,624,000
5,071,000
4,696,000
5,907,000
6,153,000
5,979,000
Cost of Revenue
1,519,000
1,708,000
1,924,000
2,352,000
1,970,000
1,800,000
1,737,000
4,347,000
4,423,000
4,344,000
Gross Prot
4,244,000
4,275,000
4,191,000
3,969,000
3,654,000
3,271,000
2,959,000
1,560,000
1,730,000
1,635,000
Operating Expenses
Rese
arch
Development
--
--
--
--
-
Sel(ing Ge
nera
l and Adm
inis
trat
ive
3,124,000
3,113,000
2,99
8,00
02,
818,
000
2,69
1,00
02,
461,
000
2,24
5,00
0477,000
513,000
470,000
Non Recurring -One time
100,
000
(4,000)
1,00
0(12,000)
68,000
(75,000)
379,000
141,
000
53,000
20,000
Others
280,000
283,000
267,000
251,000
265,000
285,000
309,000
323,000
306,000
306,000
Total Operating Expenses
3,504,000
3,392,000
3,266,000
3,057,000
3,024,000
2,671,000
2,933,000
941,000
872,000
796,000
Operating Income or Loss
740,000
883,000
925,000
912,000
630,000
600,000
26,000
619,000
858,000
839,000
One time
(29,000)
(22,000)
(21,000)
(29,000)
(318,000)
(79,000)
43,000
87,000
Earnings Before Interest And Taxes
740,000
854,000
666,000
891,000
630,000
571,000
(292,000)
540,000
901,000
666,000
Interest Expense
216,000
236,000
296,000
170,000
200,000
236,000
-210,000
168,000
244,000
Income Before Tax
524,000
618,000
370,000
721,000
430,000
335,000
(292,000)
330,000
733,000
422,000
Income Tax Expense
180,000
139,000
263,000
148,000
(75,000)
27,000
(293,000)
76,000
189,000
(434,000)
Minoritylnterest
--
--
2,000
2,000
2,000
-(1,000)
(1,000)
Net Income From Continuing Ops
344,000
479,000
107,000
573,000
507,000
310,000
3,000
254,000
543,000
855,000
Non-recurring Events
Discontinued Operations
- (10,000)
70,000
(11,000)
(]8,000)
167,000
74,000
75,000
(1,000)
(2,000)
Extraordinary Items
- -
- -
- -
- -
-
Eff'ect Of Accounting Changes
- -
- -
- -
- -
(70,000)
Oili
er Items
- -
- -
- -
- -
-
Net Income
344,000
469,000
177,000
562,000
489,000
477,000
77,000
329,000
542,000
783,000
Preferred Stock And Oth
er AdjusUnents
- -
- -
- -
- -
-
Net Income App
lica
ble To Common
344,000
469,000
177,000
562,000
489,000
477,000
77,000
329,000
542,000
783,000
End of Period Stock Price Close
$
68.98 $
57.36 $
46.86 $
52.00 $
58.76 $
53.30 $
35.18 $
17.1
3 $
39.91 $
62.79
%Change
20.3%
22.4%
-9.9%
-I1.5%
10.2%
51.5%
105.4%
-57.1%
-36.4%
42
43
44
45
4647
484950
51 5253
54
55
56575859
60
61 62
63
64
65
6667
686970
71 7273
74
757677
7879
80
81828384
858687
8$
Stanwood Hotels &Resorts Worldwide Inc
. (HOT).
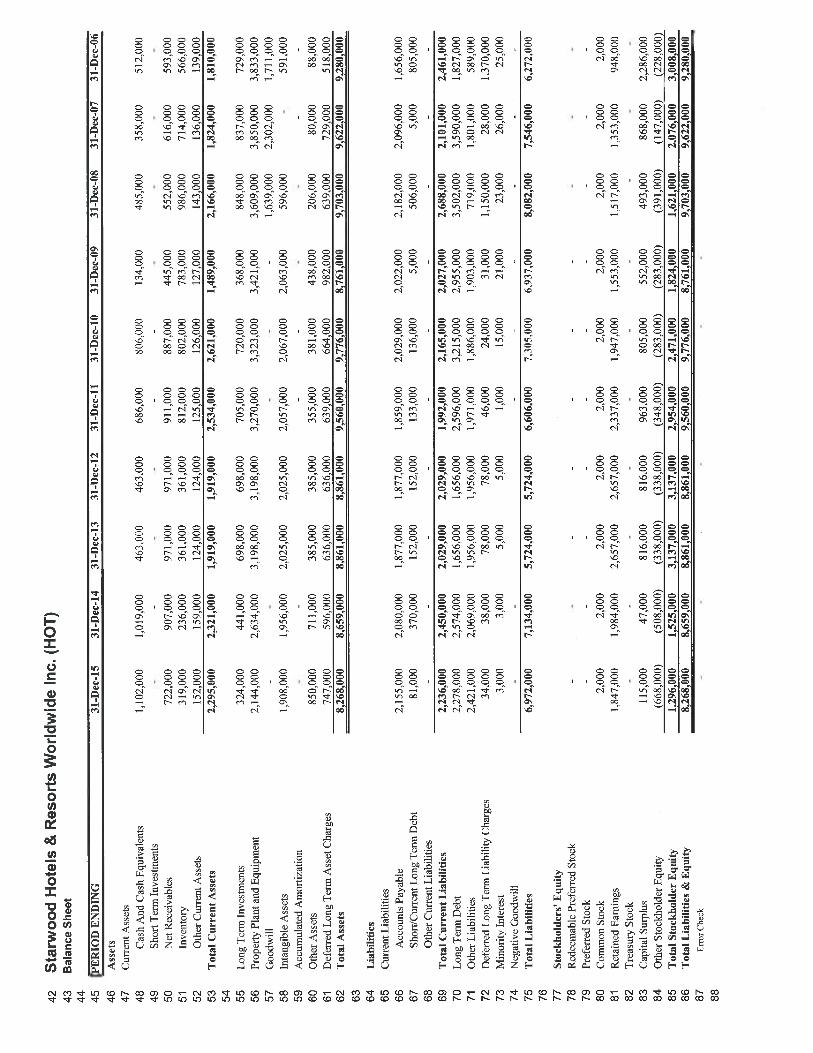
Balance Sheet
PERIOD ENDING
31-Dec-15
31-Dec-1
431-Dec-13
31-Dec-1
231-Dec-1
131-Dec-1
031-Dec-09
31-Dec-08
31-Dec-07
31-Dec-0
6
Assets
Curr
ent As
sets
Cash And Cash Eq
uiva
lent
s1,102,000
1,019,000
463,000
463,000
686,
000
806,
000
134,000
485,
000
358,
000
512,000
Short Te
nn Inv
estm
ents
--
--
--
--
--
Net Re
ceiv
able
s722,000
907,000
971,000
971,000
911,000
887,000
445,
000
552,000
616,000
593,000
Inventory
319,
000
236,000
361,
000
361,
000
812,
000
802,000
783,000
986,000
714,000
566,000
Othe
r Cu
rren
t As
sets
152,
000
159,
000
124,
000
124,
000
125,
000
126,
000
127,
000
143,
000
136,
000
139,
000
Tota
l Current Assets
2,295,000
2,321,000
1,919,000
1,919,000
2,534,000
2,621,000
1,489,000
2,166,000
1,824,000
1,810,000
Long Ten
n In
vest
ment
s32
4,00
0441,000
698,
000
698,000
705,000
720,000
368,
000
848,
000
837,
000
729,000
Property Plant and
Equ
ipme
nt2,144,000
2,634,000
3,198,000
3,198,000
3,270,000
3,323,000
3,421,000
3,609,000
3,850,000
3,833,000
Goodwill
--
--
-1,639,000
2,302,000
1,711,000
Intangible Ass
ets
1,908,000
1,956,000
2,025,000
2,025,000
2,057,000
2,067,000
2,063,000
596,000
-59
1,00
0
Accumulated Amortizarion
--
--
--
--
Othe
r As
sets
850,
000
711,000
385,
000
385,
000
355,
000
381,
000
438,000
206,000
80,000
88,000
Deferred Long Term Ass
et Charges
747,000
596,000
636,
000
636,
000
639,
000
664,
000
982,000
639,000
729,000
518,000
Tota
l Assets
8,26
8,00
08,
659,
000
8,86
1,00
08,
861,
000
9,56
0,00
09,
776,
000
8,76
1,00
09,
703,
000
9,62
2,00
09,
280,
000
Liabilities
Curr
ent Liabilities
Accounts Pay
able
2,155,000
2,080,000
1,877,000
1,877,000
1,859,000
2,029,000
2,022,000
2,182,000
2,096,000
1,656,000
ShordCurrent Long Term Debt
81,0
0037
0,00
015
2,00
015
2,00
013
3,00
0136,000
5,00
0506,000
5,00
080
5,00
0Ot
her Cu
rren
t Liabilities
--
--
--
--
--
Tota
l Current Liabilities
2,236,000
2,450,000
2,029,000
2,029,000
1,992,000
2,165,000
2,027,000
2,688,000
2,101,000
2,461,000
Long Ten
n Debt
2,278,000
2,574,000
1,656,000
1,656,000
2,596,000
3,215,000
2,955,000
3,502,000
3,590,000
1,827,000
Othe
r Liabilities
2,421,000
2,069,000
1,956,000
1,956,000
1,971,000
1,886,000
1,903,000
719,000
1,801,000
589,
000
Deferred Long Term Liability Charges
34,0
0038
,000
78,000
78,0
0046,000
24,000
31,0
001,150,000
28,000
1,370,000
Minority Interest
3,00
03,
000
5,00
05,
000
1,000
15,0
0021,000
23,000
26,000
25,000
Negative Goo
dw}l
l-
--
--
--
-To
tal Liabilities
6,972,000
7,13
4,00
05,724,000
5,72
4,00
06,606,000
7,30
5,00
06,937,000
8,08
2,00
07,
546,
000
6,272,000
Stoc
khol
ders
' Equ
ity
Redeemable Preferred Sto
ck-
--
--
--
--
-Preferred St
ock
--
--
--
--
--
Common Stock
2,000
2,000
2,000
2,000
2,000
2,000
2,000
2,000
2,000
2,000
Reta
ined
Ear
ning
s1,847,000
1,984,000
2,657,000
2,657,000
2,337,000
1,947,000
1,553,000
1,517,000
1,353,000
948,000
Trea
sury
Sto
ck-
--
--
--
--
-Ca
pita
l Surplus
115,
000
47,000
816,
000
816,
000
963,000
805,000
552,000
493,000
868,
000
2,286,000
Othe
r St
ockh
olde
r Equity
(668,000)
(508
,000
)(3
38,0
00)
(338
,000
)(3
48,0
00)
(283,000)
(283,000)
(391,000)
(147,000)
(228,000)
Tota
l Stockholder Eq
uity
1,296,000
1,525,000
3,13
7,00
03,137,000
2,954,000
2,471,000
1,824,000
1,621,000
2,076,000
3,00
8,00
0To
tal Liabilities & Equity
8,26
8,00
08,
659,
000
8,86
1,00
08,
861,
000
9,56
0,00
09,
776,
000
8,76
1,00
09,703,000
9,62
2,00
09,
280,
000
Eaor Che
ck-
--
--
--

ss Stanwood Hotels &Resorts Worldwide Inc. (HOT)
90
Cash Flow Sta
teme
nt
9293
Annual
94
PERIOD ENDING
31-Dec-l5
31-Dec-1
431-Dec-1
331-Dec-1
231-Dec-1
131-Dec-1
031-Dec-09
31-Dec-O8
31-Dec-07
31 -Dec-06
95
Net In
come
489,000
633,
000
562,
000
562,
000
489,000
477,000
73,000
329,
000
542,
000
1,043,000
9697
Depr
ecia
tion
193,
000
201,000
170,
000
170,
000
189,
000
217,000
245,000
245,000
229,000
311,
000
98
Adju
stme
nts To Net Income
93,000
96,000
(72,000)
(72,000)
179,
000
(49,000)
161,000
249,000
69,0
00(566,000)
99
Changes In
Accounts Receivables
(70,000)
(19,000)
(20,000)
(20,000)
(45,000)
(22,000)
230,000
(116,000)
(23,000)
(89,000)
100
Changes In
Lia
bili
ties
124,
000
233,000
89,0
0089
,000
(117,000)
213,000
(94,000)
63,0
00387,000
(52,000)
101
Changes In
Inv
ento
ries
(69,000)
22,000
448,000
448,
000
(14,000)
(110,000)
(98,000)
(280,000)
(143,000)
(82,000)
102
Changes In
Oth
er Operating Act
ivit
ies
130,000
(172,000)
7,00
07,
000
(38,000)
40,000
56,000
156,
000
(166,000)
(65,000)
103
Tota
l Cash Flo
w From Operaring Activities
890,
000
994,000
1,184,000
1,18
4,00
0643,000
766,000
573,
000
646,000
895,
000
578,
000
104
105
Investing Activities, Cash Flo
ws Provided By or Us
ed In
106
Capi
tal Expenditures
(261
,000
)(3
27,0
00)
(362
,000
)(3
62,0
00)
(385,000)
(227,000)
(196,000)
(476,000)
(384,000)
(371,000)
107
Inve
shne
nts
8,00
04,
000
2,000
2,000
(7,000)
18,0
0028,000
5,00
010
8,00
0286,000
108
Othe
r Cashflows from Investing Act
ivir
ies
720,000
744,000
486,
000
486,000
216,000
138,
000
284,000
299,000
61,000
1,487,000
109
Tota
l Cash Flo
ws From Investing Activities
467,000
421,000
126,
000
126,
000
(176,000)
(71,000)
116,
000
(172,000)
(215,000)
1,402,000
110
111
Financing Acrivities, Cash Flo
ws Provided By orUsed In
112
Divi
dend
s Pa
id(259,000)
(735
,000
)(2
42,0
00)
(242
,000
)(99,000)
(93,000)
(165,000)
(172,000)
(90,000)
(276
,000
)113
Sale
Purchase of
Stock
(358
,000
)(1,609,000)
(246
,000
)(2
46,0
00)
70,000
141,000
2,000
(473,000)
(1,597,000)
(907
,000
)114
Net Borrowings
(595
,000
)1,276,000
(981
,000
)(9
81,0
00)
(709,000)
(64,000)
(1,0
57,0
00)
412,
000
942,000
(1,459,000)
115
Othe
r Cash Flows fro
m Financing Ac
tivi
ties
(28,000)
(28,000)
(59,000)
(59,000)
(39,000)
(30,000)
227,000
(10,000)
33,0
007,
000
116
Tota
l Cash Flo
ws From Fin
anci
ng Activiries
(1,2
40,0
00)
(1,0
96,0
00)
(1,5
28,0
00)
(1,5
28,0
00)
(777,000)
(46,
000)
(993
,000
)(243,000)
(712,000)
(2,635,000)
117
Effect Of Ex
change Rat
e Changes
(17,000)
(9,000)
(3,000)
(3,000)
(9,000)
(1,000)
4,000
7,00
011
,000
19,0
00118
Change In Cash and
Cash Equivalents
100,
000
310,
000
(221,000)
(221,000)
(319,000)
648,
000
(300
,000
)238,000
(21,
000)
(636,000)
119
120
121
Stanwood Hot
els &Resorts Worldwide Inc. (HOT)
122
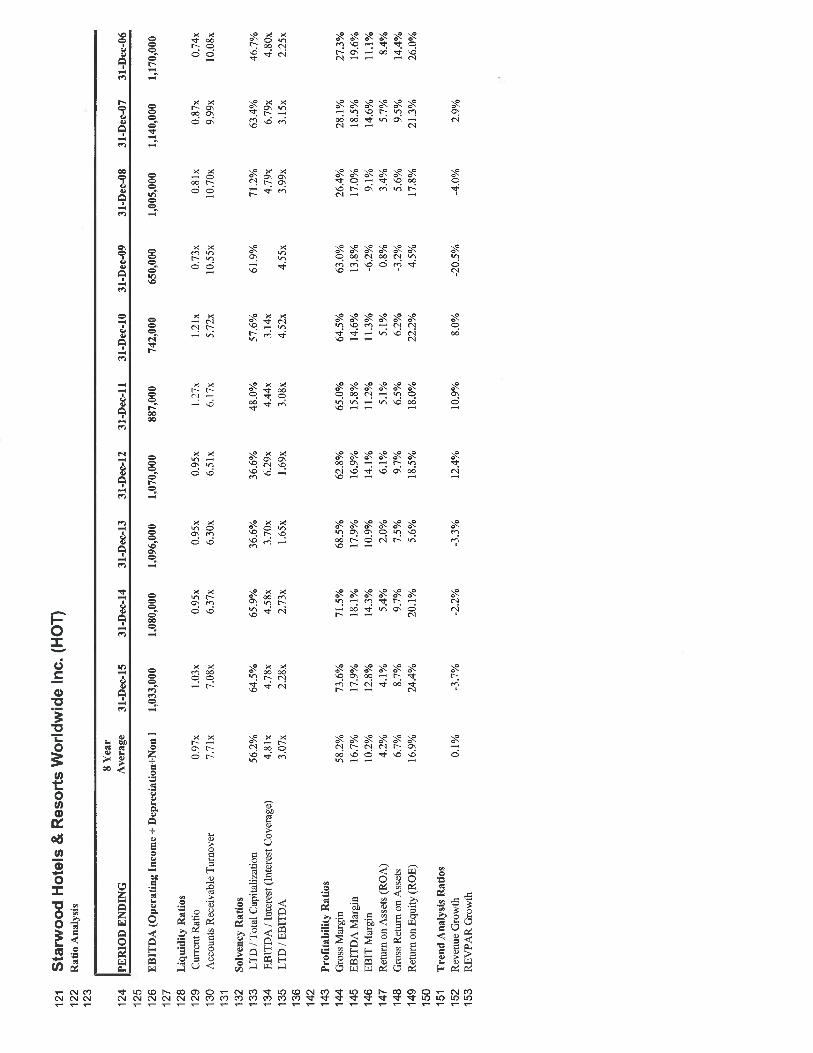
Ratio Analysis
123
S Year
124
PERIOD ENDING
Average
3l-Dec-15
31-Dec-1
431-Dec-13
31-Dco-12
31-Dec-] 1
31-Dec
-10
31-Dec-0
931
-Dec
-OK
31-Dec-07
31-Dec-0
6
125
126
EBITDA (O
pera
ting
Income +Depreciation+Non
I1,
033,
000
1,08
0,00
01,096,000
1,070,000
887,000
742,000
650,
000
1,005,000
1,14Q000
1,170,000
127
128
Liquidity Rados
129
CunentRatio
0.97x
1.03x
0.95x
0.95x
0.95x
1.27x
1.21
x0.73x
0.81x
0.87x
0.74x
130
Accounts Receivable Turnover
7.71
x7.
08x
637x
6.30
x6.
Slx
6.17
x5.
72x
10.55x
10.70x
9.99x
10.O8x
131
132
Solv
ency
Rados
133
LTD /Total Capitalization
56.2%
64.5%
65.9%
36.6
%36
.6%
48.0
%57.6%
61.9%
71.2
%63.4%
46.7%
134
EBITDA /In
tere
st (I
nter
est Coverage)
4.81x
4.78x
4.58x
3.70
x6.
29x
4.44x
3.14x
4.79x
6.79x
4.80x
135
LTD / EBITDA
3.07x
2.28x
2.73x
1.65x
1.69x
3.08x
4.52x
4.SSx
3.99
x3.15x
2.25x
136
142
143
Profiitability Ratios
144
Gross Margin
58.2%
73.6
%71
.5%
68.5%
62.8%
65.0%
64.5%
63.0%
26.4%
28.1%
27.3%
145
EBITDA Margin
16.7
%17.9%
18.1
%17.9%
16.9%
15.8%
14.6
%13
.8%
17.0
%18.5%
19.6
%146
EBIT Margin
10.2%
12.8
%143%
10.9
%14
.1%
11.2
%113%
-6.2
%9.1%
14.6%
11.1%
147
Return on As
sets
(ROA)
4.2%
4.1%
5.4%
2.0%
6.1%
5.1%
5.1%
0.8%
3.4%
5.7%
8.4%
148
Gross Return on As
sets
6.7%
8.7%
9.7%
7.5%
9.7%
6.5%
6.2%
-3.2
%5.
6%9.5%
14.4%
149
Return on Equity (ROE)
16.9
%24.4%
20.1%
5.6%
1.8.
5%18
.0%
22.2%
4.5%
17.8
%21.3%
26.0%
150
151
Tren
d Analysis Ratios
152
Reve
nue Growth
0.1%
-3.7
%-2
.2%
-3.3
%12
.4%
10.9
%8.0%
-20.5%
-4.0
%2.9%
153
REVPAR Gro
wth
Related Documents