WellBeing International WellBeing International WBI Studies Repository WBI Studies Repository 8-2018 Companion Animal Statistics in the USA Companion Animal Statistics in the USA Andrew N. Rowan The Humane Society of the United States Follow this and additional works at: https://www.wellbeingintlstudiesrepository.org/demscapop Part of the Animal Studies Commons, Other Anthropology Commons, and the Social Statistics Commons Recommended Citation Recommended Citation Rowan, Andrew N., "Companion Animal Statistics in the USA" (2018). Demography and Statistics for Companion Animal Populations Collection. 7. https://www.wellbeingintlstudiesrepository.org/demscapop/7 This material is brought to you for free and open access by WellBeing International. It has been accepted for inclusion by an authorized administrator of the WBI Studies Repository. For more information, please contact [email protected].

Welcome message from author
This document is posted to help you gain knowledge. Please leave a comment to let me know what you think about it! Share it to your friends and learn new things together.
Transcript

WellBeing International WellBeing International
WBI Studies Repository WBI Studies Repository
8-2018
Companion Animal Statistics in the USA Companion Animal Statistics in the USA
Andrew N. Rowan The Humane Society of the United States
Follow this and additional works at: https://www.wellbeingintlstudiesrepository.org/demscapop
Part of the Animal Studies Commons, Other Anthropology Commons, and the Social Statistics
Commons
Recommended Citation Recommended Citation Rowan, Andrew N., "Companion Animal Statistics in the USA" (2018). Demography and Statistics for Companion Animal Populations Collection. 7. https://www.wellbeingintlstudiesrepository.org/demscapop/7
This material is brought to you for free and open access by WellBeing International. It has been accepted for inclusion by an authorized administrator of the WBI Studies Repository. For more information, please contact [email protected].

COMPANION ANIMAL STATISTICS IN THE USA.
Andrew N. Rowan
August 2018
Introduction
Early in 2008, a number of organizations and individuals interested in accurate statistics on pet population
numbers and trends gathered in a hotel in Houston, TX to review the available data on estimated pet
populations and shelter demographics. While the data and analysis below was produced and subsequently
added to by just one of those individuals, the following document takes into account the input from those
who attended. For example, it was generally accepted that the AVMA pet population estimates from their
quinquennial surveys are likely to be more reliable than the biennial surveys used to produce the APPMA
demographic reports. [In the following report, all references to the AVMA surveys are to the quinquennial
surveys by the American Veterinary Medical Association starting in 1981. APPA data refers to the surveys
by the American Pet Products Association produced every two years since 1988.]
A. Number of Dogs and Cats in the USA
Survey Methods
There are several ways in which estimates of the total number of dogs and cats in the USA have been
developed. These include surveys using Household Panel samples (APPA has used the Ipsos panel but has
shifted to internet surveying more recently while the AVMA has used panels drawn from the TNS Custom
Research database). Surveys conducted by Random Digit Dial (RDD) technology (e.g. Mediamark
Research conducted annual RDD pet population surveys from 1985-1996) were common in the twentieth
century and, more recently, surveys have been conducted via the internet. All have problems and none are
100% accurate but they do provide an estimate of the number of dogs and cats in the country (or, more
rarely, a state or a community).
Survey Results
The results from these surveys differ, sometimes by substantial amounts. In the twentieth century, the
results from household panel surveys differed from RDD methods by approximately 20% (Patronek and
Rowan, 1995). The APPA and AVMA survey results have been diverging steadily since the 1980s and the
APPA estimates are now about 20-25% higher than the AVMA estimates. By contrast, an American
Census Bureau survey of 25 metropolitan statistical areas reported much lower pet ownership (42.3% of
households owning pets) than either the AVMA (56%) or the APPA (68%). These are substantial
differences that lead to very different estimates of the total number of dogs and cats in the USA. The
different surveys have different sources of bias but the data currently available is not sufficient to decide
which method produces the most accurate estimate. It is recommended that estimates of national dog and
cat population numbers be developed from trend lines generated from the AVMA surveys but people using
these estimates should recognize that these estimates may not be accurate. In addition, there are significant
variations in state-by-state numbers of dogs and cats so one should NOT apply the national estimates to
generate local dog and cat population numbers unless no other method is available. .
B. Population trends of owned dogs and cats in USA
There are three good sets of “trend” data for pet “ownership” – those produced biannually by the APPA
from 1988 to the present, those produced every five years by the AVMA (from 1986 to the present), and
those produced by Mediamark Research from 1985-1996. (The reason these trend data are reliable is
because the methods used were broadly the same each time the survey was done. Therefore, even though
the APPA data might overestimate dog and cat populations, the method would likely have the same bias
towards overestimation each time.)

APPA Data 1988 1990 1992 1994 1996 1998 2000 2002 2004 2006 2008 2010 2012 2014 2016
% HH
with pets
56.0 57.0 58.0 56.0 59.0 61.0 62.0 62.0 63.0 63.0 62.0 62.4 68.1 64.7 67.9
% HH
with dogs
37 38 38 36 37 39 39 39 39 39 45.6 46.3 46.7 44.0 48.0
% HH
with cats
30 33 32 30 32 32 34 34 34 34 33.0 33.0 37.3 34.8 38.0
Total occ.
HHs (mill)
91 93 96 97 99 100 102 104 107 110 115.7 118.2 121.4 122.5 124.6
Ave
Dogs/HH
1.70 1.50 1.50 1.60 1.50 1.60 1.70 1.60 1.70 1.67 1.70 1,69 1.47 1.43 1.49
Ave Cats
HH
1.90 2.00 2.10 2.10 2.10 2.40 2.10 2.20 2.40 2.30 2.45 2.22 2.11 2.00 2.00
Total
Dogs(mill)
57.8 52.7 53.1 54.2 54.6 62.6 68.0 65.0 73.9 74.8 77.5 78.2 83.3 77.8 89.7
Total Cats
(mill)
52.6 60.8 62.6 59.4 66.1 77.0 72.9 77.7 90.5 88.3 93.6 86.6 95.6 85.8 94.2
AVMA Data
1986 1991 1996 2001 2006 2011
% HH with pets anytime 57.9 58.9 58.3 59.5 62.4
% HH with dogs 38.2 36.5 31.6 36.1 37.2 36.5
% HH with cats 30.5 30.9 27.3 31.6 32.4 30.4
Total occupied
HHs(million)
88 93 99 102 110 119
Ave Dogs/HH 1.5 1.5 1.7 1.6 1.7 1.6
Ave Cats HH 2.0 2.0 2.2 2.1 2.2 2.1
Total Dogs (million) 52.4 52.5 52.9 61.5 72.1 69.9
Total Cats (million) 54.6 57.0 59.1 70.8 81.7 74.1
Overall, these surveys find that the total number of dogs and cats in the country has increased steadily since
1980. This has occurred despite the fact that the percentage of households with dogs and cats has not
changed much since the 1990s (however, see the chart below that tracks survey data for % of households
that have dogs from 1985 through 1996 when dog ownership rates declined).

Both the Household Panel methods (NPD, AVMA & APPA) and the Random Digit Dial approach (MRI)
indicated that the % of households with dogs declined from 1985 through 1995. Notice how the RDD
method produces an estimate that is consistently around 20% lower than the Household Panel approach.
Since the 1990s, the percentage of households with dogs has stabilized at 38% while the percentage of
households with cats has increased slightly from around 30% to 32-34%.
Dog and cat populations have generally grown because the total number of occupied households has
increased by almost 20% from around 88 million in the 1986 to 119 million in 2011.
AVMA Data presented graphically
One can produce an estimate of the total pet dog and cat populations in the United States for any year by
using the trend equations from the above graph. Therefore, the total number of dogs and cats in the USA in
2017 calculated from the above trend line would be as follows:
Cats = (1.096 x 2017) – 2123.9 = 2210.632 – 2123.9 = 86.73 million
Dogs = (0.8857 x 2017) – 1709.9 = 1786.4569 – 1709.9 = 76.56 million
C. Calculating the Number of “Owned” Dogs or Cats in your Community.
Typically, the surveys determine the percentage of households with dogs and cats and the average number
of dogs and cats in each household. If one then knows the number of occupied households in the country
(or community) it is a simple matter to calculate the total number of dogs and cats in the country using the
following formula:
Number of “owned” dogs (or cats) =
Total # occupied HHs X % of HHs with dogs(cats) X Average # per HH.
For very rough work, one can estimate the number of “owned” dogs or “owned” cats by multiplying the
total number of occupied households by 0.6 (dogs) or 0.7 (cats). It is a simple matter to obtain the number
of occupied households in a county, city or state. Simply access the Census Bureau’s QuickFacts website
at http://quickfacts.census.gov/qfd/index.html and select the state, county or city in which you are
interested.
However, as indicated earlier, be aware that both dog and cat ownership rates differ from state to state. The
difference between high and low ownership states can be greater than two-fold and, for a specific
community, the differences can be even larger. Typically, dense urban areas have much lower rates of dog
(and cat?) ownership than the suburbs or rural communities. (See section D below.)
D. Identifying differences in rates of ownership in different regions and types of community.
While a simple formula for calculating the number of dogs and cats in the USA is provided above, more
accurate estimates would necessitate taking into account a range of human demographic factors such as
housing density, regional differences in pet “ownership,” ethnic differences in pet “ownership,” differences
in household life-stage and other variations. The discussion below provides some guidance on the relevant
variances observed.
The AVMA surveys do not simply report national data, they also provide state-by-state data on the
percentage of households that have either dogs and cats (although the average number of dogs and cats per
owning household is only provided for the nation as a whole).
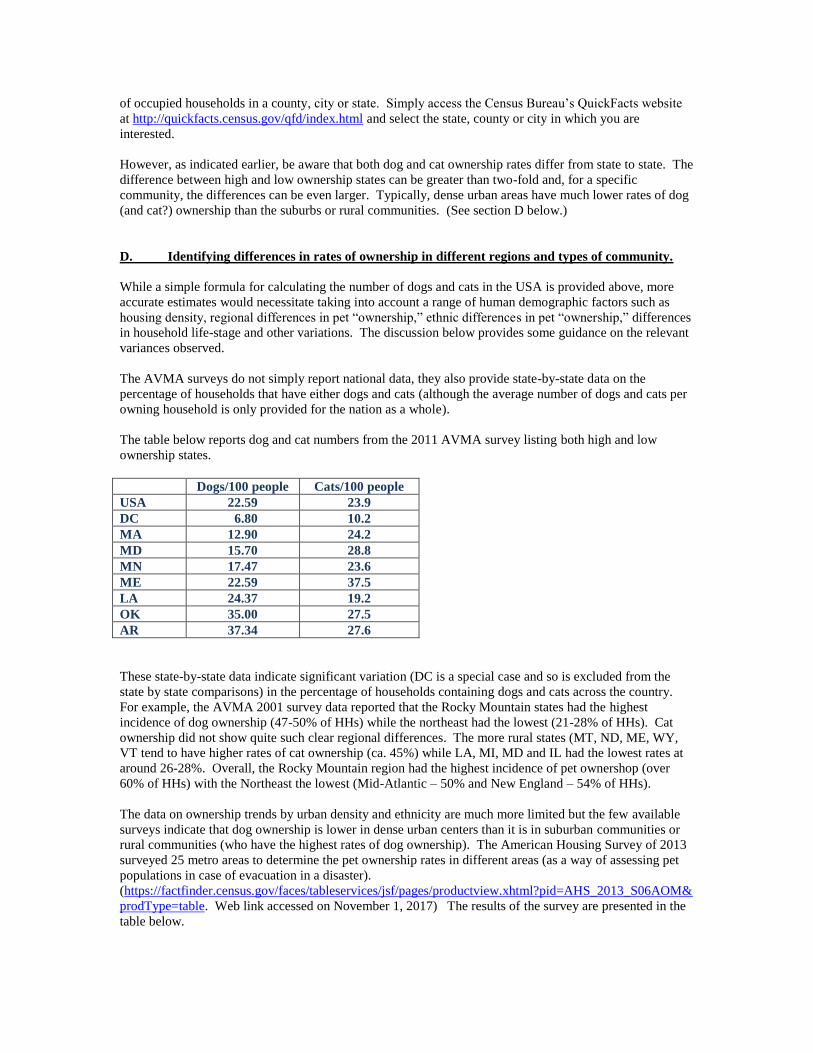
The table below reports dog and cat numbers from the 2011 AVMA survey listing both high and low
ownership states.
Dogs/100 people Cats/100 people
USA 22.59 23.9
DC 6.80 10.2
MA 12.90 24.2
MD 15.70 28.8
MN 17.47 23.6
ME 22.59 37.5
LA 24.37 19.2
OK 35.00 27.5
AR 37.34 27.6
These state-by-state data indicate significant variation (DC is a special case and so is excluded from the
state by state comparisons) in the percentage of households containing dogs and cats across the country.
For example, the AVMA 2001 survey data reported that the Rocky Mountain states had the highest
incidence of dog ownership (47-50% of HHs) while the northeast had the lowest (21-28% of HHs). Cat
ownership did not show quite such clear regional differences. The more rural states (MT, ND, ME, WY,
VT tend to have higher rates of cat ownership (ca. 45%) while LA, MI, MD and IL had the lowest rates at
around 26-28%. Overall, the Rocky Mountain region had the highest incidence of pet ownershop (over
60% of HHs) with the Northeast the lowest (Mid-Atlantic – 50% and New England – 54% of HHs).
The data on ownership trends by urban density and ethnicity are much more limited but the few available
surveys indicate that dog ownership is lower in dense urban centers than it is in suburban communities or
rural communities (who have the highest rates of dog ownership). The American Housing Survey of 2013
surveyed 25 metro areas to determine the pet ownership rates in different areas (as a way of assessing pet
populations in case of evacuation in a disaster).
(https://factfinder.census.gov/faces/tableservices/jsf/pages/productview.xhtml?pid=AHS_2013_S06AOM&
prodType=table. Web link accessed on November 1, 2017) The results of the survey are presented in the
table below.

Human
Population
% HHs with Pets
% Black HHs with pets
% Hispanic HHs with
Pets
% Elderly (65+) HHs
Austin, TX 1,716,289 56.3% 37.1% 51.1% 42.3%
Baltimore, MD 2,710,489 45.6% 26.8% 51.1% 29.7%
Bostoan, MA 4,552,402 36.2% 26.0% 30.4% 28.5%
Chicago, IL 9,461,105 37.9% 20.5% 40.9% 27.4%
Detroit, MI 4,296,250 43.7% 25.1% 53.5% 32.6%
Hartford, CT 1,212,381 46.1% 20.1% 36.3% 32.4%
Houston, TX 5,920,416 47.2% 30.0% 44.5% 41.0%
Jacksonville, FL 1,345,596 50.2% 23.8% 34.9% 39.3%
Las Vegas, NV 1,951,269 45.2% 27.4% 45.7% 34.4%
Louisville, KY 1,235,708 55.1% 24.9% 40.7% 41.3%
Miami, FL 5,564,635 39.3% 18.2% 38.5% 31.2%
Minneapolis Area, MN 3,348,859 47.8% 20.4% 34.2% 32.9%
Nashville, TN 1,670,890 54.6% 24.9% 36.3% 40.8%
New York, NY 19,567,410 25.5% 19.1% 21.9% 20.3%
Northern NJ, NJ 10,380,000 38.2% 25.4% 30.0% 27.9%
Oklahoma City, OK 1,252,987 57.0% 25.1% 40.4% 47.1%
Orlando, FL 2,134,411 49.4% 28.2% 48.5% 37.7%
Philadelphia, PA-NJ 5,965,343 44.5% 32.4% 41.7% 31.7%
Richmond, VA 1,208,101 49.1% 25.8% 36.7% 37.3%
Rochester, NY 1,079,671 51.4% 25.8% 35.9% 36.3%
San Antonio, TX 2,142,508 55.1% 24.6% 49.0% 51.0%
Seattle Area, WA 3,439,809 50.5% 17.9% 35.4% 38.5%
Tampa Area, FL 2,783,243 50.2% 26.8% 50.6% 35.8%
Tucson, AZ 980,263 59.9% 40.0% 53.0% 46.0%
Washington, DC Area 5,636,232 38.4% 19.8% 36.4% 28.7%
Totals 101,556,267 42.3%
Percentage pet ownership in the twenty-five metro areas varies from 25.5% in New York City to 59.9% in
Tucson but ownership rates in black and elderly households are generally lower than the metro average.
Cat ownership is lower among African-American and Hispanic communities than in white communities.
Asian communities tend to have lower pet ownership rates in general.
Household lifestage is also an important determinant of pet “ownership.” Around 70-75% of families with
children aged 5-17 have pet dogs or cats while only about 40% of single households have dogs and cats.
We cannot be confident that current dog and cat ownership rates and overall numbers are particularly
accurate or relevant to specific communities in the United States. If a shelter wishes to benchmark its
activities in a community, it is recommended that it perform its own survey to identify baseline dog and cat
populations and their characteristics and distribution in a specific community.
E. Number of animal groups – such as shelters, private and municipal shelters and other
groups.
There are a number of data sets that have been used to estimate the total number of shelters (organizations
with a building or structure that houses dogs and cats). Most of them do not distinguish between
organizations with an actual shelter and organizations without a shelter building. Such a distinction may
not be important to the animals being rescued and placed but it is relevant to those of us who need to know
how many shelter operations there are, whether they are private or municipal, how large they are, and so
on.
Early this century, The HSUS commissioned two Tufts graduates to comb through databases, to use
Guidestar, and to make phone calls to determine how many animal organizations there were in the United
States. When the list was finished, it contained approximately 9,500 independent entities (plus or minus a
few percent). Of these, 3,352 identified themselves as being shelters (i.e. organizations with a building at
their official address that housed animals). Of these 3,352, 1,554 identified themselves as being municipal
and 1,809 identified themselves as being private 501(c)3 organizations.
The table below indicates the approximate breakdown of shelters by type.
Type of Shelter Percentage of Total
Municipal 46%
HS/SPCA (no contract) 16%
HS/SPCA with housing contract 19%
HS/SPCA with full animal control contract 19%
Several other important points came out of the above survey.
1. There are an average of 1.13 shelters per 100,000 people in the United States.
Some states have as many as 5-7 shelters per 100,000 people with the low end
being around 0.6 shelters per 100,000 people.
2. Total income recorded for the animal groups identified (the Fiscal Years were
usually for 2002 or 2003) came out to $3.48 per capita with 12 national
organizations raising another $0.80 per capita.
3. This means that the average animal group (not including the national
organizations) exists on an annual budget of around $300,000 per annum.
4. There is approximately one shelter per county on average (there are around
3,100 counties in the US).
A second data set for 2004, compiled by the National Center for Charity Statistics, records all the
organizations that are classified under category D20 by the Internal Revenue Service. (D is the animal
category and D20 are “animal protection” groups.) The database identified 5,800 D20 organizations of
which 3,523 filed Form 990 (meaning they have income of greater than $25,000 per annum). Many of
these are not shelters and a quick inspection of the list indicates that about half (or 1,750) are shelters. This
is close to the estimate of 1,809 private shelters identified above.
More recent data sets (Guidestar data – mostly for FY 2006) indicate that private animal protection
organizations have annual income of around $2 billion a year (or just under $7 per capita). Of this income,
the “national” groups (including Best Friends and the ASPCA) raised $357 million. There are 290 “local”
groups with budgets of more than $1 million. These raised $960 million while 311 “local” groups with
budgets of more than $500,000 raised $225 million. The municipal animal control agencies were estimated
to have about $750 million a year to spend and employ (according to Department of Labor statistics)
14,600 people at an average of $38,000 per employee ($554 million for employee costs).
Other data indicates that shelter operations (both municipal and private) are divided approximately as
follows as regards size (determined by annual budget).
Annual Budget Range Percentage of total Approx. #
$0 to $249,999 45.0% 1,500
$250,000 to $499,999 22.8% 760
$500,000 to $999,999 16.6% 550
$1 million to $2.499 million 8.7% 300
$2.5 million or greater 6.6% 220
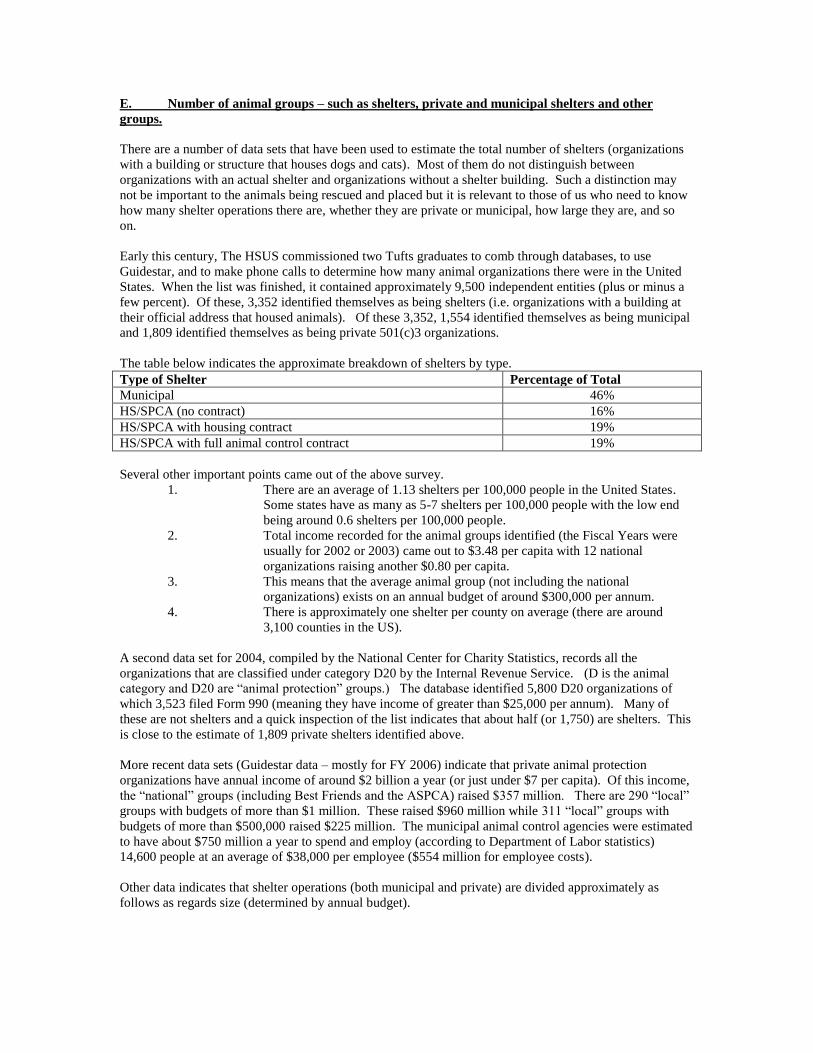
The HSUS does not have data on the number of rescue and fostering operations nor on how many of the
above are limited admission facilities. However, it is clear that the number of private animal protection
groups is exploding. Looking at the “date of founding” data in the National Center for Charity Statistics
database for 2006, one finds the following data for D20 animal protection organizations. Almost three
quarters of all the organizations in the data base were founded after 1990.
Year Founded Number Number Filing
990
Total Receipts Total Assets
Pre 1950 109 104 $701,209,907 $1,110,115,829
1950s 113 108 $343,694,282 $456,806,680
1960s 194 188 $190,759,395 $317,162,009
1970s 469 423 $233,989,184 $366,322,793
1980s 596 521 $161,228,338 $222,114,985
1990s 1,803 1,074 $276,531,354 $306,612,315
2000s 2,564 726 $46,660,219 $49,983,844
Unknown 18 17 $7,447,320 $11,126,172
Total 5,866 3,161 $1,961,510,999 $2,840,244,627
The latest examination of Guidestar data indicates that income of the main “national” groups (The HSUS
and affiliates, the ASPCA, Best Friends and PETA) is growing much faster than inflation and in 2016
amounted to $720 million (from around $200 million at the beginning of the century). Overall income for
private animal protection groups (including “national” groups) has grown from $4.3 per capita in 2002 to
$10.7 per capita in 2013 (a 250% increase). Over the same period, the Consumer Price Index increased by
27%.
F. Dogs in Shelters
There are no national estimates of the demographics of dogs entering or leaving shelters in the United
States. However, there are sufficient data sources that all point to a substantial reduction in the numbers of
dogs (and cats) entering shelters in the United States. The chart below shows what has been happening in
US shelters since 1970 according to data that ANR has collected over the years. Merritt Clifton, the only
other person who has attempted to track shelter animal numbers over the past 50 years estimates that over
100 dogs and cats per 1,000 people entered shelters in 1970.
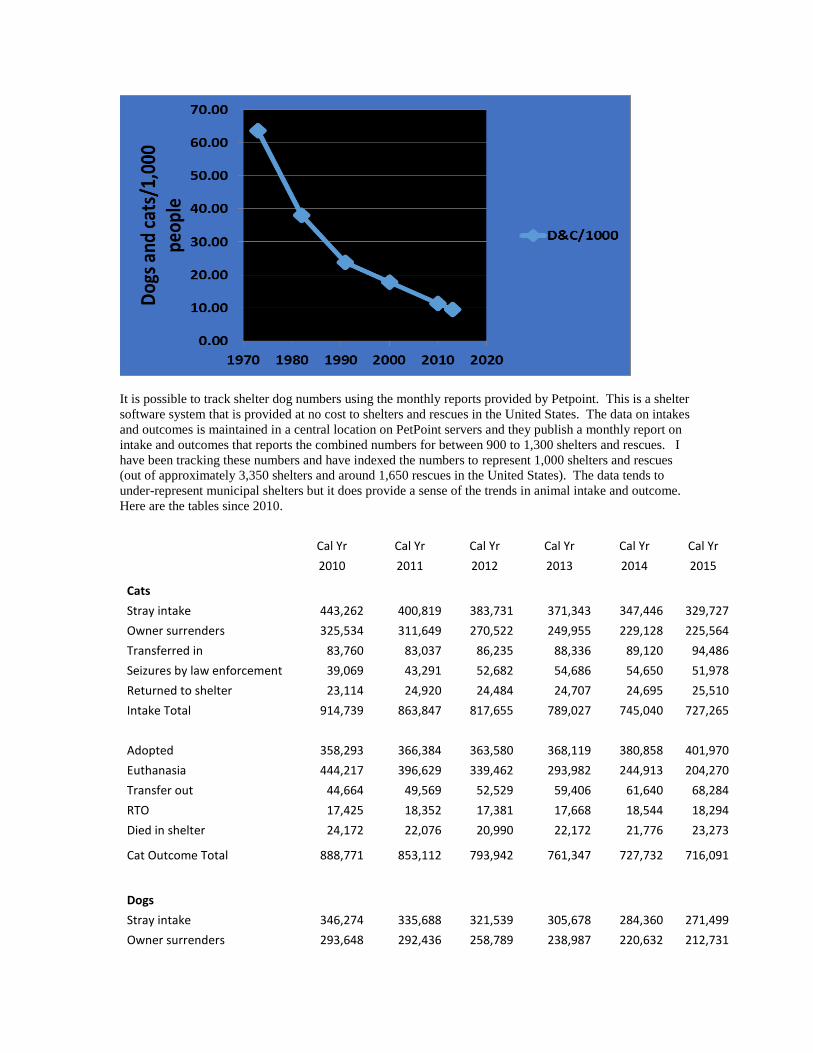
It is possible to track shelter dog numbers using the monthly reports provided by Petpoint. This is a shelter
software system that is provided at no cost to shelters and rescues in the United States. The data on intakes
and outcomes is maintained in a central location on PetPoint servers and they publish a monthly report on
intake and outcomes that reports the combined numbers for between 900 to 1,300 shelters and rescues. I
have been tracking these numbers and have indexed the numbers to represent 1,000 shelters and rescues
(out of approximately 3,350 shelters and around 1,650 rescues in the United States). The data tends to
under-represent municipal shelters but it does provide a sense of the trends in animal intake and outcome.
Here are the tables since 2010.
Cal Yr Cal Yr Cal Yr Cal Yr Cal Yr Cal Yr
2010 2011 2012 2013 2014 2015
Cats Stray intake 443,262 400,819 383,731 371,343 347,446 329,727
Owner surrenders 325,534 311,649 270,522 249,955 229,128 225,564
Transferred in 83,760 83,037 86,235 88,336 89,120 94,486
Seizures by law enforcement 39,069 43,291 52,682 54,686 54,650 51,978
Returned to shelter 23,114 24,920 24,484 24,707 24,695 25,510
Intake Total 914,739 863,847 817,655 789,027 745,040 727,265
Adopted 358,293 366,384 363,580 368,119 380,858 401,970
Euthanasia 444,217 396,629 339,462 293,982 244,913 204,270
Transfer out 44,664 49,569 52,529 59,406 61,640 68,284
RTO 17,425 18,352 17,381 17,668 18,544 18,294
Died in shelter 24,172 22,076 20,990 22,172 21,776 23,273
Cat Outcome Total 888,771 853,112 793,942 761,347 727,732 716,091
Dogs
Stray intake 346,274 335,688 321,539 305,678 284,360 271,499
Owner surrenders 293,648 292,436 258,789 238,987 220,632 212,731

Transferred in 183,449 184,644 189,593 194,771 193,994 203,325
Seizures by law enforcement 73,651 83,648 86,236 89,052 93,658 89,739
Returned to shelter 44,496 44,674 44,700 45,331 43,525 45,182
Intake Total 943,127 941,101 900,855 873,820 836,169 822,476
Adopted 423,021 430,406 435,707 438,448 438,346 450,342
Euthanasia 288,878 280,084 232,083 200,629 170,043 140,442
Transfer out 87,932 95,728 99,745 106,697 110,598 117,892
RTO 111,385 112,158 107,920 107,337 108,204 109,928
Died in shelter 15,380 14,007 9,358 8,827 8,150 7,101
Dog outcomes 926,597 932,383 884,814 861,938 835,311 825,631
To convert these numbers to annual estimates, multiply by 5. Recently, faculty members at Mississippi
State Veterinary College conducted a survey to estimate shelter intake and outcome numbers in the US and
they produced estimated totals that are close to those seen above when multiplied by 5.
G. Feral/Stray Cat Numbers.
The estimates of overall feral/stray cat numbers probably show the greatest range of dog and cat
demographic numbers. There are estimates in the published literature ranging from less than 10 million to
over 70 million. The main two competing numbers are those by Dr Julie Levy of the University of Florida,
who estimates in one published paper that the US feral/stray cat population numbers around 50 million, and
from Merritt Clifton, who estimates that the feral cat population ranges from around 6.5 million in winter to
around 12.5 million in summer. Both protagonists can point to different data sets and data analyses to
support their estimates and it is unlikely that the range will be narrowed any time soon without a careful
study of stray and feral cat numbers across the nation.
Since 2008, there have been several papers published by conservation biologists that argue that
outdoor cats kill an increasing number of birds every year. The number of birds estimated to be
killed by cats has increased with each new published paper and most of the papers refer to an
increasing number of cats in the environment. Careful attention to the available cat population
estimates and to various data sources (e.g. surveys of where pet cats are kept during the day and
night, shelter trends, dead cat pick-ups, kittens handled by shelters) fly in the face of claims that the
outdoor “footprint” of cats is increasing.
The APPA surveys indicate that more and more pet cats are kept indoors and that the ecological
burden of pet cats has declined in the past decade, despite the overall increase in pet cat numbers.
For example, the number of pet cats outdoors has declined steadily over the past decade (see below
chart from APPA data).
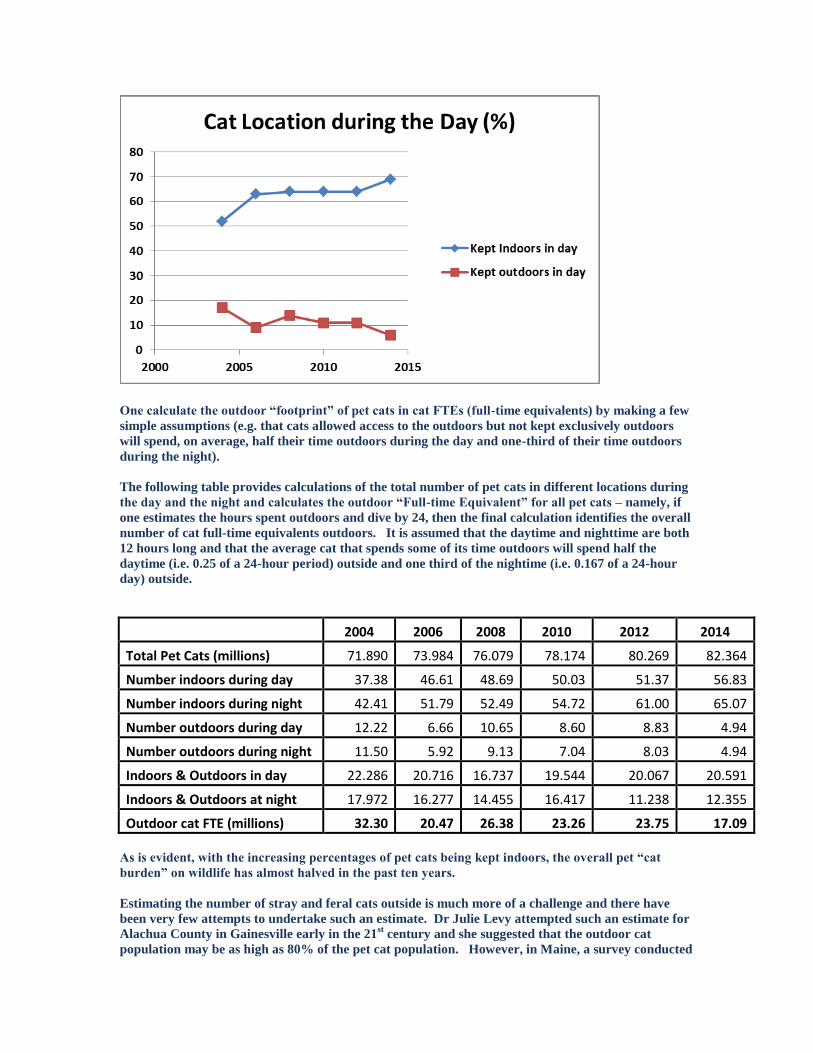
One calculate the outdoor “footprint” of pet cats in cat FTEs (full-time equivalents) by making a few
simple assumptions (e.g. that cats allowed access to the outdoors but not kept exclusively outdoors
will spend, on average, half their time outdoors during the day and one-third of their time outdoors
during the night).
The following table provides calculations of the total number of pet cats in different locations during
the day and the night and calculates the outdoor “Full-time Equivalent” for all pet cats – namely, if
one estimates the hours spent outdoors and dive by 24, then the final calculation identifies the overall
number of cat full-time equivalents outdoors. It is assumed that the daytime and nighttime are both
12 hours long and that the average cat that spends some of its time outdoors will spend half the
daytime (i.e. 0.25 of a 24-hour period) outside and one third of the nightime (i.e. 0.167 of a 24-hour
day) outside.
2004 2006 2008 2010 2012 2014
Total Pet Cats (millions) 71.890 73.984 76.079 78.174 80.269 82.364
Number indoors during day 37.38 46.61 48.69 50.03 51.37 56.83
Number indoors during night 42.41 51.79 52.49 54.72 61.00 65.07
Number outdoors during day 12.22 6.66 10.65 8.60 8.83 4.94
Number outdoors during night 11.50 5.92 9.13 7.04 8.03 4.94
Indoors & Outdoors in day 22.286 20.716 16.737 19.544 20.067 20.591
Indoors & Outdoors at night 17.972 16.277 14.455 16.417 11.238 12.355
Outdoor cat FTE (millions) 32.30 20.47 26.38 23.26 23.75 17.09
As is evident, with the increasing percentages of pet cats being kept indoors, the overall pet “cat
burden” on wildlife has almost halved in the past ten years.
Estimating the number of stray and feral cats outside is much more of a challenge and there have
been very few attempts to undertake such an estimate. Dr Julie Levy attempted such an estimate for
Alachua County in Gainesville early in the 21st century and she suggested that the outdoor cat
population may be as high as 80% of the pet cat population. However, in Maine, a survey conducted
by Katie Lisnik of The HSUS indicated that the number of outdoor cats may be no more than 10% of
the pet cat population. It seems intuitively likely that states with hard winters (and an abundance of
mesopredators) will have far fewer outdoor cats than states like Florida. In addition, scientific
reports from around the world indicate that cat densities away from human habitation tends to be
low (less than 1 cat per square kilometer) unless there is some concentrated food source to support
higher cat populations. For example, San Nicolas island off the California coast (where there were
no permanent human residents) had almost precisely one cat per square kilometer after over 100
years of cat presence on the island. By contrast, the island fox density (an animal a little smaller than
the feral cats) existed at a density of around 4 foxes per square kilometer.
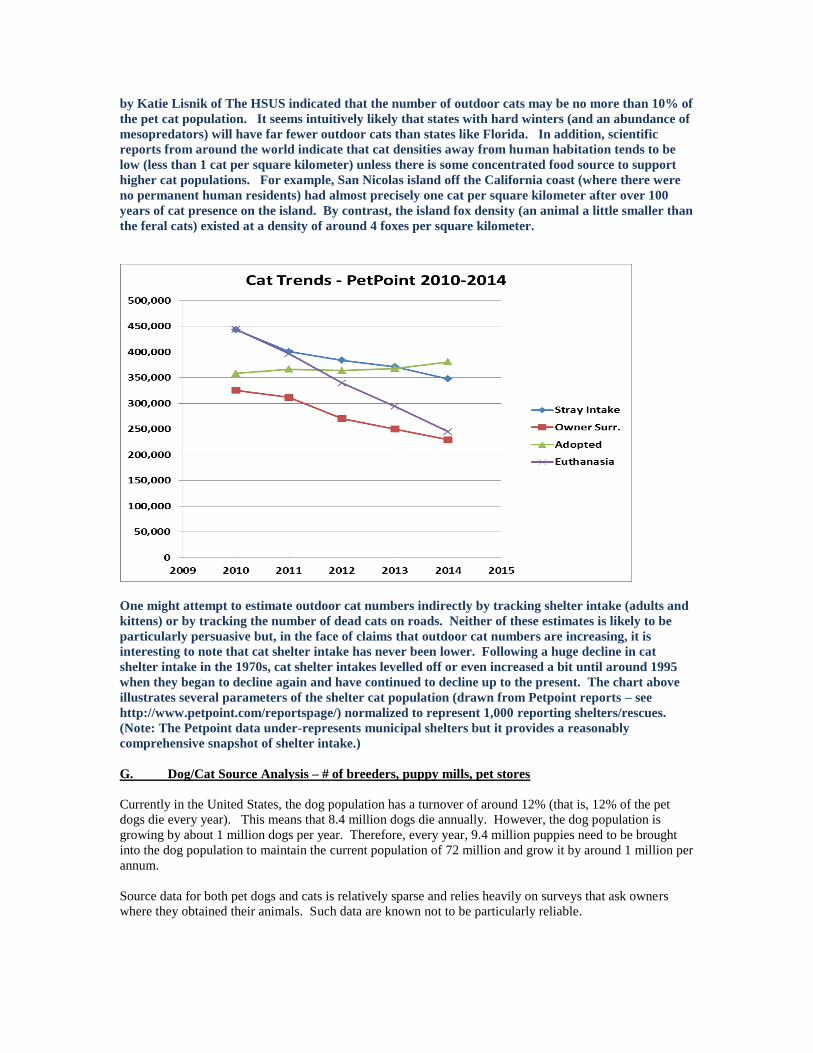
One might attempt to estimate outdoor cat numbers indirectly by tracking shelter intake (adults and
kittens) or by tracking the number of dead cats on roads. Neither of these estimates is likely to be
particularly persuasive but, in the face of claims that outdoor cat numbers are increasing, it is
interesting to note that cat shelter intake has never been lower. Following a huge decline in cat
shelter intake in the 1970s, cat shelter intakes levelled off or even increased a bit until around 1995
when they began to decline again and have continued to decline up to the present. The chart above
illustrates several parameters of the shelter cat population (drawn from Petpoint reports – see
http://www.petpoint.com/reportspage/) normalized to represent 1,000 reporting shelters/rescues.
(Note: The Petpoint data under-represents municipal shelters but it provides a reasonably
comprehensive snapshot of shelter intake.)
G. Dog/Cat Source Analysis – # of breeders, puppy mills, pet stores
Currently in the United States, the dog population has a turnover of around 12% (that is, 12% of the pet
dogs die every year). This means that 8.4 million dogs die annually. However, the dog population is
growing by about 1 million dogs per year. Therefore, every year, 9.4 million puppies need to be brought
into the dog population to maintain the current population of 72 million and grow it by around 1 million per
annum.
Source data for both pet dogs and cats is relatively sparse and relies heavily on surveys that ask owners
where they obtained their animals. Such data are known not to be particularly reliable.
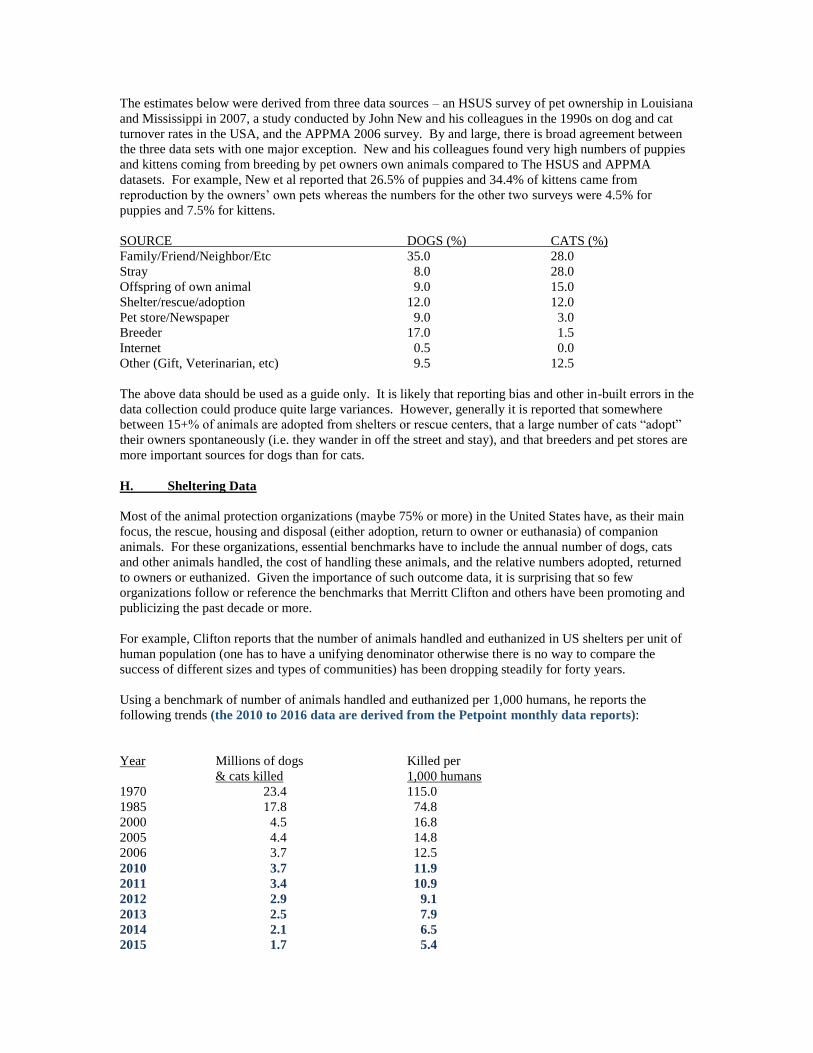
The estimates below were derived from three data sources – an HSUS survey of pet ownership in Louisiana
and Mississippi in 2007, a study conducted by John New and his colleagues in the 1990s on dog and cat
turnover rates in the USA, and the APPMA 2006 survey. By and large, there is broad agreement between
the three data sets with one major exception. New and his colleagues found very high numbers of puppies
and kittens coming from breeding by pet owners own animals compared to The HSUS and APPMA
datasets. For example, New et al reported that 26.5% of puppies and 34.4% of kittens came from
reproduction by the owners’ own pets whereas the numbers for the other two surveys were 4.5% for
puppies and 7.5% for kittens.
SOURCE DOGS (%) CATS (%)
Family/Friend/Neighbor/Etc 35.0 28.0
Stray 8.0 28.0
Offspring of own animal 9.0 15.0
Shelter/rescue/adoption 12.0 12.0
Pet store/Newspaper 9.0 3.0
Breeder 17.0 1.5
Internet 0.5 0.0
Other (Gift, Veterinarian, etc) 9.5 12.5
The above data should be used as a guide only. It is likely that reporting bias and other in-built errors in the
data collection could produce quite large variances. However, generally it is reported that somewhere
between 15+% of animals are adopted from shelters or rescue centers, that a large number of cats “adopt”
their owners spontaneously (i.e. they wander in off the street and stay), and that breeders and pet stores are
more important sources for dogs than for cats.
H. Sheltering Data
Most of the animal protection organizations (maybe 75% or more) in the United States have, as their main
focus, the rescue, housing and disposal (either adoption, return to owner or euthanasia) of companion
animals. For these organizations, essential benchmarks have to include the annual number of dogs, cats
and other animals handled, the cost of handling these animals, and the relative numbers adopted, returned
to owners or euthanized. Given the importance of such outcome data, it is surprising that so few
organizations follow or reference the benchmarks that Merritt Clifton and others have been promoting and
publicizing the past decade or more.
For example, Clifton reports that the number of animals handled and euthanized in US shelters per unit of
human population (one has to have a unifying denominator otherwise there is no way to compare the
success of different sizes and types of communities) has been dropping steadily for forty years.
Using a benchmark of number of animals handled and euthanized per 1,000 humans, he reports the
following trends (the 2010 to 2016 data are derived from the Petpoint monthly data reports):
Year Millions of dogs Killed per
& cats killed 1,000 humans
1970 23.4 115.0
1985 17.8 74.8
2000 4.5 16.8
2005 4.4 14.8
2006 3.7 12.5
2010 3.7 11.9
2011 3.4 10.9
2012 2.9 9.1
2013 2.5 7.9
2014 2.1 6.5
2015 1.7 5.4

2016 1.5 4.7
Others are now using the “Per 1,000 humans” numbers to report on how communities (and the animal
organizations in those communities) are doing in reducing euthanasia of healthy and adoptable animals (as
defined by the Asilomar principles -
http://www.hsus.org/pets/pets_related_news_and_events/differences_aside_animal_welfare_groups_come_
together/Asilomar-2004-Accords.html)
The euthanasia rate has dropped by 57% since 2011. This is a faster rate of decline than the 30%
drop between 2000 and 2010.
Dr Linda Lord at Ohio State Veterinary School surveyed animal care and sheltering facilities across Ohio
in 1996 and 2004. She reported the following trends in the “per 1,000 humans” benchmarking statistic for
the whole state.
1996 2004
Dogs Handled 19.14 15.59
Dogs Euthanized 11.50 6.85
Cats Handled 10.27 11.26
Cats Euthanized 7.23 8.04
Total Animals Handled 29.41 26.84
Total Animals Euthanized 18.73 14.89
This type of table makes it very easy to assess progress and to compare oneself with the national average of
12.5 animals euthanized per 1,000 people nationwide.
Clifton also reports significant variations in euthanasia rates from part of the country to another with large
variations within the various regions. The lowest euthanasia rates are around 2 to 2.5 dogs and cats per
1,000 people (in the Northeast and in selected West Coast cities). By contrast, places like Fresno (CA),
Lincoln County and Louisville (KY), Augusta (GA), Columbia (MO), Amarillo (TX), Gulfport (MS) and
Shreveport (LA) all euthanize more than 40 animals per 1,000 people. An analysis of the number of
animals handled and euthanized versus the funding available for animal sheltering and animal rescues in
the larger Florida counties indicates that the more money spent, the more animals one ends up “saving”
(“saved” refers to the number of animals handled/1,000 people minus the number euthanized/1,000 people)
– see table below.
This table was constructed to provide county-wide information rather than data from individual
organizations (whether animal control or private). The only way to chart progress reliably is to use
comprehensive data from all organizations in the community (as pushed by Maddie’s Fund). However, the
above data should still be interpreted with caution. For example, the “saved” number seems intuitively
important but it will obviously be easier to record a higher “save” rate the more animals are handled.
Therefore, perhaps the “save” rate should be recorded as a percentage of the total number of animals
handled.
Area Animals
Handled/1,000
Animals
Euthan./1,000
Animals
“Saved”/1,000
$ Spent per
capita
Alachua Co. 41.1 14.8 26.3 $15.0
Brevard Co. 34.3 17.9 16.4 $13.5
Broward Co. 17.6 7.0 10.6 $7.7
Collier Co. 27.4 14.4 13.0 $15.7
Duval Co. 32.9 19.4 13.5 $7.7
Hillsboro Co. 31.2 25.8 5.4 $9.0
Lee Co. 48.2 28.4 19.8 $11.0
Miami-Dade Co. 15.8 9.5 6.3 $6.3
Orange Co. 27.8 14.9 12.9 $12.6
Palm Beach Co. 26.7 15.9 10.8 $15.7
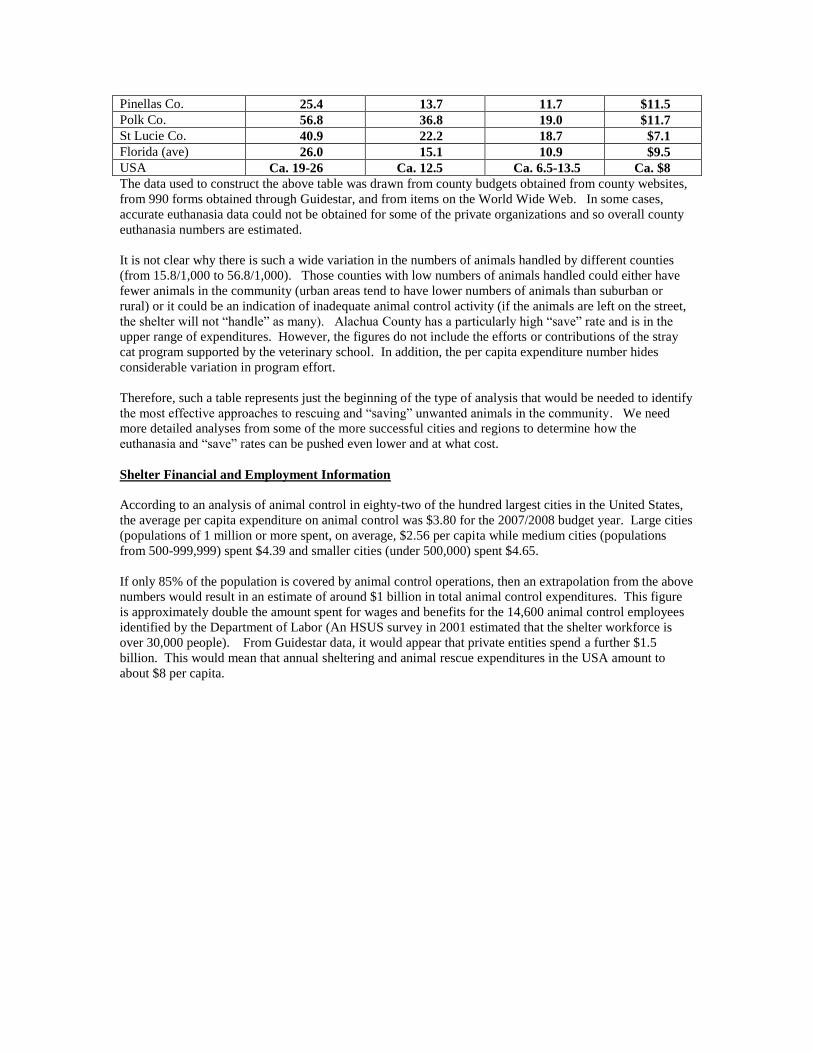
Pinellas Co. 25.4 13.7 11.7 $11.5
Polk Co. 56.8 36.8 19.0 $11.7
St Lucie Co. 40.9 22.2 18.7 $7.1
Florida (ave) 26.0 15.1 10.9 $9.5
USA Ca. 19-26 Ca. 12.5 Ca. 6.5-13.5 Ca. $8
The data used to construct the above table was drawn from county budgets obtained from county websites,
from 990 forms obtained through Guidestar, and from items on the World Wide Web. In some cases,
accurate euthanasia data could not be obtained for some of the private organizations and so overall county
euthanasia numbers are estimated.
It is not clear why there is such a wide variation in the numbers of animals handled by different counties
(from 15.8/1,000 to 56.8/1,000). Those counties with low numbers of animals handled could either have
fewer animals in the community (urban areas tend to have lower numbers of animals than suburban or
rural) or it could be an indication of inadequate animal control activity (if the animals are left on the street,
the shelter will not “handle” as many). Alachua County has a particularly high “save” rate and is in the
upper range of expenditures. However, the figures do not include the efforts or contributions of the stray
cat program supported by the veterinary school. In addition, the per capita expenditure number hides
considerable variation in program effort.
Therefore, such a table represents just the beginning of the type of analysis that would be needed to identify
the most effective approaches to rescuing and “saving” unwanted animals in the community. We need
more detailed analyses from some of the more successful cities and regions to determine how the
euthanasia and “save” rates can be pushed even lower and at what cost.
Shelter Financial and Employment Information
According to an analysis of animal control in eighty-two of the hundred largest cities in the United States,
the average per capita expenditure on animal control was $3.80 for the 2007/2008 budget year. Large cities
(populations of 1 million or more spent, on average, $2.56 per capita while medium cities (populations
from 500-999,999) spent $4.39 and smaller cities (under 500,000) spent $4.65.
If only 85% of the population is covered by animal control operations, then an extrapolation from the above
numbers would result in an estimate of around $1 billion in total animal control expenditures. This figure
is approximately double the amount spent for wages and benefits for the 14,600 animal control employees
identified by the Department of Labor (An HSUS survey in 2001 estimated that the shelter workforce is
over 30,000 people). From Guidestar data, it would appear that private entities spend a further $1.5
billion. This would mean that annual sheltering and animal rescue expenditures in the USA amount to
about $8 per capita.
Related Documents