1 Krause Fund Research Fall 2020 Communications Recommendation: HOLD Analysts Connor Hoeft [email protected] Hieu Nguyen Hieu-nguyen- [email protected] Daniel Poncer [email protected] Adam Topping [email protected] Company Overview Alphabet Inc. provides online advertising around the world through performance and brand advertising. The firm operates through Google and Other Bets segments. Google offers products such as Ads, Search, Google Cloud, Maps, Hardware, and YouTube. The Other Bets segment operates businesses like Waymo, Verily, Calico, and Nest. The company was founded in 1998 by Larry Page and Sergey Brin and is currently headquartered in Mountain View, CA. Stock Performance Highlights 52 week High $1,816.89 52 week Low $1,008.87 Beta (5yr Weekly) 0.96 Average Volume (3 months) 1.86 M Share Highlights Market Capitalization $1.202 T Shares Outstanding 688.34 M EPS (FY19) $49.16 P/E Ratio (TTM) 34.28 Dividend Yield 0% Company Performance Highlights ROA 13.5% ROE 18.1% Sales $161.9 b Financial Ratios Current Ratio 3.4 Debt to Equity 7.9% Source: FactSet Alphabet Inc. (NASDAQ: GOOGL) November 17, 2020 Alphabet Continues to Grow Investment Thesis • Alphabet continues to be one of the best growth stories of the last 20 years. Their acquisitions and new product lines will drive their growth over the next decade. • Google.com absolutely dominates the world of internet search. More money is flooding to digital advertising as they offer a better ROI for advertisers and Google’s network is larger than almost any in the world. • We see YouTube as a key growth driver over the next few years. With the advent of 5G and adoption of video advertising, YouTube is positioned to grow upwards of 25% each year through 2024 and maintain doubt digit growth thereafter. • The adjustments required by businesses in the age of COVID-19 have accelerated adoption of Cloud services. With Google’s brand awareness and massive infrastructure, they should capitalize on this secular trend over the next decade. Risks to Thesis • Regulatory threats loom large across the digital ad industry but particularly for Alphabet because of their dominance on desktop and mobile devices. • Increased competition from other mega cap technology companies could eat at their market share and profitability. One Year Stock Performance Source: FactSet Current Price: $1,774 Target Price: $1,875 - $1,975 DCF / EP Target Price: $1,932 Relative P/E: $1,948

Welcome message from author
This document is posted to help you gain knowledge. Please leave a comment to let me know what you think about it! Share it to your friends and learn new things together.
Transcript

1
Krause Fund Research Fall 2020
Communications Recommendation: HOLD Analysts Connor Hoeft [email protected] Hieu Nguyen Hieu-nguyen- [email protected] Daniel Poncer [email protected] Adam Topping [email protected]
Company Overview
Alphabet Inc. provides online advertising around the world through performance and brand advertising. The firm operates through Google and Other Bets segments. Google offers products such as Ads, Search, Google Cloud, Maps, Hardware, and YouTube. The Other Bets segment operates businesses like Waymo, Verily, Calico, and Nest. The company was founded in 1998 by Larry Page and Sergey Brin and is currently headquartered in Mountain View, CA.
Stock Performance Highlights 52 week High $1,816.89 52 week Low $1,008.87 Beta (5yr Weekly) 0.96 Average Volume (3 months) 1.86 M
Share Highlights Market Capitalization $1.202 T Shares Outstanding 688.34 M EPS (FY19) $49.16 P/E Ratio (TTM) 34.28 Dividend Yield 0%
Company Performance Highlights ROA 13.5% ROE 18.1% Sales $161.9 b
Financial Ratios Current Ratio 3.4 Debt to Equity 7.9% Source: FactSet
Alphabet Inc. (NASDAQ: GOOGL)
November 17, 2020
Alphabet Continues to Grow
Investment Thesis • Alphabet continues to be one of the best growth stories of the last 20 years. Their acquisitions and new product lines will drive their growth over the next decade.
• Google.com absolutely dominates the world of internet search. More money is flooding to digital advertising as they offer a better ROI for advertisers and Google’s network is larger than almost any in the world.
• We see YouTube as a key growth driver over the next few years. With the advent of 5G and adoption of video advertising, YouTube is positioned to grow upwards of 25% each year through 2024 and maintain doubt digit growth thereafter.
• The adjustments required by businesses in the age of COVID-19 have accelerated adoption of Cloud services. With Google’s brand awareness and massive infrastructure, they should capitalize on this secular trend over the next decade.
Risks to Thesis • Regulatory threats loom large across the digital ad industry but particularly for Alphabet because of their dominance on desktop and mobile devices.
• Increased competition from other mega cap technology companies could eat at their market share and profitability.
One Year Stock Performance
Source: FactSet
Current Price: $1,774 Target Price: $1,875 - $1,975 DCF / EP Target Price: $1,932 Relative P/E: $1,948
2
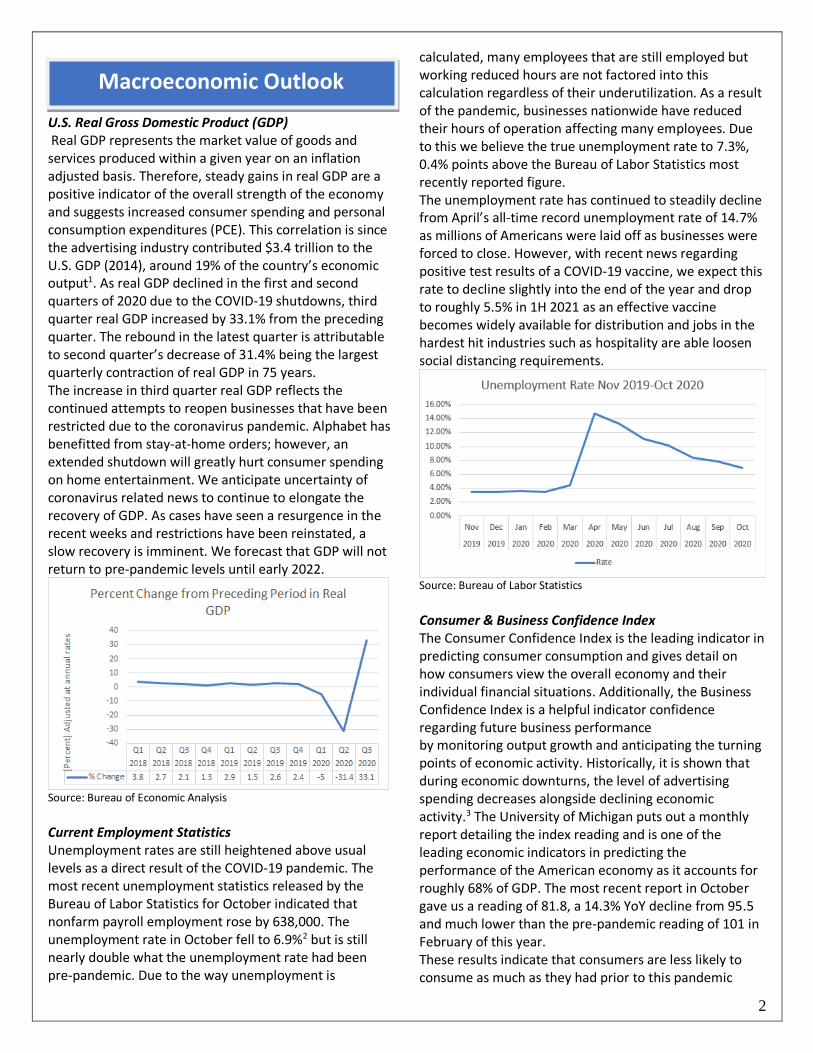
Macroeconomic Outlook U.S. Real Gross Domestic Product (GDP) Real GDP represents the market value of goods and services produced within a given year on an inflation adjusted basis. Therefore, steady gains in real GDP are a positive indicator of the overall strength of the economy and suggests increased consumer spending and personal consumption expenditures (PCE). This correlation is since the advertising industry contributed $3.4 trillion to the U.S. GDP (2014), around 19% of the country’s economic output1. As real GDP declined in the first and second quarters of 2020 due to the COVID-19 shutdowns, third quarter real GDP increased by 33.1% from the preceding quarter. The rebound in the latest quarter is attributable to second quarter’s decrease of 31.4% being the largest quarterly contraction of real GDP in 75 years. The increase in third quarter real GDP reflects the continued attempts to reopen businesses that have been restricted due to the coronavirus pandemic. Alphabet has benefitted from stay-at-home orders; however, an extended shutdown will greatly hurt consumer spending on home entertainment. We anticipate uncertainty of coronavirus related news to continue to elongate the recovery of GDP. As cases have seen a resurgence in the recent weeks and restrictions have been reinstated, a slow recovery is imminent. We forecast that GDP will not return to pre-pandemic levels until early 2022.
Source: Bureau of Economic Analysis
Current Employment Statistics Unemployment rates are still heightened above usual levels as a direct result of the COVID-19 pandemic. The most recent unemployment statistics released by the Bureau of Labor Statistics for October indicated that nonfarm payroll employment rose by 638,000. The unemployment rate in October fell to 6.9%2 but is still nearly double what the unemployment rate had been pre-pandemic. Due to the way unemployment is
calculated, many employees that are still employed but working reduced hours are not factored into this calculation regardless of their underutilization. As a result of the pandemic, businesses nationwide have reduced their hours of operation affecting many employees. Due to this we believe the true unemployment rate to 7.3%, 0.4% points above the Bureau of Labor Statistics most recently reported figure. The unemployment rate has continued to steadily decline from April’s all-time record unemployment rate of 14.7% as millions of Americans were laid off as businesses were forced to close. However, with recent news regarding positive test results of a COVID-19 vaccine, we expect this rate to decline slightly into the end of the year and drop to roughly 5.5% in 1H 2021 as an effective vaccine becomes widely available for distribution and jobs in the hardest hit industries such as hospitality are able loosen social distancing requirements.
Source: Bureau of Labor Statistics
Consumer & Business Confidence Index The Consumer Confidence Index is the leading indicator in predicting consumer consumption and gives detail on how consumers view the overall economy and their individual financial situations. Additionally, the Business Confidence Index is a helpful indicator confidence regarding future business performance by monitoring output growth and anticipating the turning points of economic activity. Historically, it is shown that during economic downturns, the level of advertising spending decreases alongside declining economic activity.3 The University of Michigan puts out a monthly report detailing the index reading and is one of the leading economic indicators in predicting the performance of the American economy as it accounts for roughly 68% of GDP. The most recent report in October gave us a reading of 81.8, a 14.3% YoY decline from 95.5 and much lower than the pre-pandemic reading of 101 in February of this year. These results indicate that consumers are less likely to consume as much as they had prior to this pandemic

3
and feel more sensitive in their financial situation. However, due to the release of positive vaccine results, we believe that this does not accurately the true confidence of consumers in the economy. As positive vaccine results indicate a return to normalcy in the near term, we believe many consumers negatively affected financially by the COVID-19 pandemic will look more favorably upon the economy in the near term and their financial situations going forward. As a result of this, we estimate that the true Consumer Confidence Index to be 89 and expecting to return to pre-COVID levels during 2022. We also estimate the same time of return for the Business Confidence Index, with a return to true value of 100.
Source: Organization for Economic Cooperation and Development
Inflation The Consumer Price Index is a measure of the average change over time that consumers pay for a basket of market goods and services and is the most widely used index to measure price inflation. As a result of the COVID-19 pandemic, trillions of dollars have been pushed into the system to help support capital markets and to help consumers support themselves as many find themselves still unemployed. An influx of cash like this has never been seen before, not even during the financial crisis of 2008. This influx in cash has caused the price of common goods across the board to raise YoY by 1.4%. Without factoring energy costs into the CPI, which has seen cost decreases as global consumption of oil has decreased, consumer goods such as food has seen YoY price increases of 3.9%. Certain food items such as meat and poultry have seen larger price increases of roughly 6.3%, used car prices have risen 10.3%, and the cost to eat out has roughly increased 3.8%. Due to the deflationary effects that energy costs have on the overall CPI, we believe the true CPI has been much higher than reported throughout the pandemic. Disregarding the deflationary effects that oil prices have had on the overall CPI basket of consumer goods, we believe the true CPI to be closer to 3.1%. Higher inflation rates harm consumers as their purchasing
power is negatively affected as consumer goods prices rise.
Source: Bureau of Labor Statistics
Industry Analysis Industry Overview Alphabet falls under the Interactive Media & Services industry within the Communications sector of the S&P 500. To gather more relevant comparisons, we will consider them as members of the Digital Advertising Industry. Digital advertising uses the web to share marketing materials with consumers. Search advertisements, promoted social media content, margin advertising banners, and sponsored content promoted before a viral video are used to reach the public.4
Industry Trends The US and global advertising markets are shifting away from TV and Print media to more digital platforms. Mass marketing has taken a hit as digital ad curators have offered firms a better ROI with the advent of data collection and targeted advertising. More time is being spent in front of computers and smart phone screens than ever before. We believe that Alphabet will be able to capitalize on this trend. Four of the top five most popular smartphone apps are owned by Alphabet.5 As our dependence on Smartphones escalates, they are well-positioned for location-based advertising. The secular trends away from traditional media are only going to be accelerated by the rollout and adoption of 5G. CFRA reports that US Internet ad revenues are expected to grow in the high teens through 2024, contingent on 5G. This new wireless revolution will give broader and faster internet access to consumers of all ages. It is not only to the public’s advantage, however. Technology platforms will benefit from faster data exchanges and increase their ad targeting capabilities
4
Video advertising is expected to be a top gainer with the 5G advent. Current connections give marketers the ability to share data rich ads. But 5G will be 100x faster than today’s technology.6 With faster streaming and more impactful ads, we think that video content will grow much faster than search in the coming years. This positions Alphabet’s Youtube squarely in the middle two massive consumer trends. Regulation One of the biggest challenges facing not only Alphabet, but the whole tech industry, are the government regulations. The two biggest issues that are presented to Google are anti-trust and data privacy, which stems from its dominance in Google Search. Search processes around 90% of all online searches in the US. 7
There is an ongoing anti-trust case being built against Google. The main case revolves around the idea that the company utilizes its search engine to maintain a dominant position over its peers by giving them less exposure to users.
Last year, the EU fined Google €50 million for the violation of privacy laws. This was part of the new General Data Protection Regulation that was imposed in May 2018. The main argument against Google was that the company did not get proper consent from its users to use their data for personalized advertising.
Currently, there is high uncertainty regarding how the biggest tech companies will be regulated. If governments decide to further regulate this industry, it is almost certain the Alphabet will be targeted. The most common approach in doing so is to break up Alphabet, forcing it to sell one of its divisions. Recently, the US Department of Justice announced (October 20th) that it was filing a suit against Google for illegal practices in the search market. There has been talk that US prosecutors may force Google to sell its Chrome browser. If this is the case, it would be a huge hit towards Google. Google Chrome as a browser has the largest market share in the U.S. and is a strong force in tunneling revenue for Google.
Historically, this has almost happened in the past. In a lawsuit that began in 1998, the Department of Justice accused Microsoft of engaging in the same behavior (illegal anti-competitive behaviors). It was ruled that they were guilty and ordered to be broken up into two separate entities. However, Microsoft won its appeal and the idea was later abandoned. If the same situation were
to happen to Google, it would be uncertain if the same outcome would occur. Another factor that could affect the company’s outlook are the Net Neutrality regulations, which will be contingent on the upcoming election results. Net Neutrality will determine if internet service companies must charge their services equally. Depending on the outcome of these regulations, Alphabets earnings will increase as they would be allowed to charge prices on their products and services. Competition of Big Tech In order to understand Alphabet’s position, it helps to know how the largest US firms all operate and how tech has come to dominate. Alphabet is clearly the king of search advertising and has a growing video ad segment through YouTube. They have also been investing heavily in Google Cloud and seen substantial growth over the last few years. Facebook dominates the world of social media advertising through facebook.com, Instagram, and Whatsapp. With nearly 2.5 billion monthly active users worldwide8, they are connecting the globe and offering a cost-effective way for small businesses to engage in targeted advertising.
Amazon is the world’s largest internet retailer. They also operate Amazon Web Services, a cloud-based service for business and data optimization. Their share of the digital ad market has increased recently through sponsored products on their retail site. Ad revenue recently topped $10 billion, up drastically from just a few years ago.9
We view Microsoft as another competitor because of their exposure to digital advertising and success with their cloud segment, Azure. They offer advertising through Linkedin and Bing. This is a small revenue segment for MSFT but Bing does represent competition in search for those who are partial to Microsoft systems. Azure on the other hand is a dominant player in the cloud computing industry. If Alphabet wants to become a big player, they will have to eat into Microsoft’s market share. Twitter is the last formidable player we foresee in the digital ad space. They have done better at monetizing their platform in recent years. However, TWTR have not achieve consistently high growth rates like other firms in the industry. With a smaller network of 350

5
million monthly active users, they have a high hill to climb to achieve the same scale as other sites. Overall, we believe that Alphabet ranks among the top firms in terms of their ability to adapt and invest in a fast-changing landscape. Their liquidity and low debt level allow them to invest quicker into new projects than other firms in the space. Facebook closely rivals the strength of GOOGL’s balance sheet and profitability, but they are tied much more to ad revenue as that is 99% of their total sales in FY19. Alphabet already has some infrastructure in place to pursue other ventures and is seeing profound growth.
Most Recent FYE Data Current Ratio Total D/E
GOOGL 3.4 x 7.9 %
FB 4.4 x 11.0 %
AMZN 1.1 x 124.9 %
MSFT 2.5 x 69.4 %
TWTR 9.2 x 37.8 % Source: FactSet
Source: FactSet
Porter’s Five Forces
Existing Competition: High and increasing – The largest US tech companies that dominate the S&P 500 are all competing for the ad dollars of businesses big and small. Alphabet, Facebook, Amazon, Microsoft, and Twitter have enough capital to drive their growth initiatives into the coming years. All the firms in this industry are investing heavily in infrastructure and technology that allow them to provide the best ROI to virtual advertisers. Each company mentioned above has their own core competency but must fend of the others from encroaching on their niche slice of the internet. For example, Amazon and Facebook are beginning to cross paths more as Amazon extends banner advertising opportunities on their home site. Facebook has begun to rollout Facebook Shops for small businesses to begin selling direct to consumer.
Threat of Entry: Low – The initial cost of creating a website is very cheap and we do not see that changing in the future. However, that is not the most important factor when considering new threats. It is all about eyeballs. The network effects of Big Tech are what make them so incredibly hard to take on. There will certainly be competition that arises over the next decade, but without any significant anti-trust legislation, they are not likely to steal a large share of industry revenue. Threat of Substitutes: Moderate and decreasing – With end users, substitutions are made many times a day10. More and more time is being spent in front of computers and smartphones, meaning that they engage with many platforms with sponsored content. Advertisers know the statistics about active users, shoppers, and search queries. Big Tech has dominated each quarter of each year over the last half decade. Going forward, we believe that the biggest substitutes for targeted advertising are already present in the digital ad market. Power of Suppliers: Low and decreasing – Competitors in this industry have a lot of influence over their suppliers. This is a unique industry in that they have two types of suppliers. First, they have the manufacturers of servers, storage systems, and network equipment. These businesses are subject to the demand of Big Tech. Companies like Google, Facebook, and Amazon can buy the components they need then build much of the hardware themselves to best suit their needs. The other group of suppliers for this industry is us, the consumer. We are what make their platforms so valuable. More advertising recipients on their sites make the advertising companies more willing to pay for impressions. With their vast swaths of data and complex algorithms, they have consumers engaging on their sites more and more each day. It is hard to escape the online networks that Google, Microsoft, Facebook, and Twitter have developed. Power of Buyers: Moderate and decreasing – The same algorithms that keep us using their sites help to increase the ROI on ad dollars spent, so they are viewed as better than traditional media. However, ad buyers have enough options across big tech platforms to make companies compete on pricing. Thankfully, the entire internet is not a monopoly. But it is quickly becoming an oligopoly where smaller companies must decide between dominant digital ad platforms to reach the end consumer.
FYE 2019 Data
Gross Margins (%)
EBIT Margins (%)
EBIT Growth (% YoY)
GOOGL 55.5 22.0 16.5
FB 81.9 41.0 16.3
AMZN 41.0 5.3 15.9
BIDU 41.5 5.9 (61.1)
MSFT 67.8 37.0 24.3
TWTR 67.1 10.6 (18.4)

6
Industry Catalysts for Growth We believe that the biggest change coming for the industry is the adoption of 5G. It presents opportunities for increased connectivity in an already mobile world. A report from Cisco in 2020 projected 8% CAGR in the number of mobile devices from 2018 to 2023. This would mean that 8.7 billion mobile devices would be connected to high-speed networks.11 This number paired with blazing wireless speeds across the US present a massive moment for digital platforms. Those that can position themselves at the forefront of this new revolution should see accelerated growth in the coming years. In the same report from Cisco, they anticipated that 79% of mobile data traffic will be for video content. This can come in the form of short videos on social media, podcast streaming, or viral clips on Youtube. Regardless, video advertising will be a key growth driver as 5G becomes more mainstream.
Company Specific Analysis
Alphabet is the parent company of one of the world’s biggest tech giants, Google. Starting off as a search engine, Google has now diversified to hundreds of products and services from phones to cloud services in its efforts organize all the world’s data and make it accessible for all its users. It is most of the most dominant providers of its services, with 86.9%% of desktop searches being handled by Google.12
Alphabet Breakdown Google’s multiple segments include the commonly known internet offerings such as Search, Youtube, Google Network Members’ Properties, Google Cloud, Google Other, and Other Bets. Alphabet’s other offerings are known as the Other Bets. These include a wide range of products from Nest (connected home) to Calico (Biotech) The Other Bets pursue initiatives with similar goals of Google. This is a company that is continually looking to invest towards the future and avoid becoming complacent. Examples could be seen when they acquired YouTube or had launch their own browser (Chrome) to compete with Microsoft Explorer. Revenue Drivers With billions of users, the main revenue driver for this company is advertisement revenue, which made up of around 89% of total revenue. Google primarily advertises in two ways: Performance Advertising – Delivering relevant ads that will result in direct engagement, typically prices are charged only when users engage in their ads. Data is used to custom tailor set populations for ads to be presented
to for the most engagement. They have experienced a strong growth in total paid clicks for these ads. At the same time, the cost per click has decreased at a lower rate – driving revenue and profitability. Brand Advertising – Rather than focusing on engagement, brand advertising focuses on creating more awareness of a specific brand via exposure.
Youtube has been a phenomenal growth story since they began reporting their sales separate from Google Search. From 2017 to FYE 2019, its ad revenue has grown at an average annual rate of 36.3%. In the 3Q20 conference call, Alphabet’s CFO noted 32% YoY growth in YouTube ads.13
Another young segment with promising growth is Google Cloud. They’ve seen an average annual growth rate of 48.4% since they began reporting in 2017. Management were quick to point out this segment performance as well in the most recent quarter. Ruth Porat noted that they saw 45% YoY growth driven both by increased demand and cost per user.14
Catalysts for Growth Google Search advertising still represents an opportunity for mid-single digit growth going forward. In their Q3 earnings report, Alphabet experienced 6.5% YoY growth in their search segment. Management indicated that the growth was driven by user adoption but stifled in part due to the uncertainty in ad spending due to COVID-19.15 We expect to see moderately higher growth going forward as the economy recovers. Youtube advertising is gaining strength due to new ad formatting and delivery, which was met with increased advertising spend. In Q3, they saw over 32% growth. Management highlighted the uptake by advertisers thanks to direct response marketing products, which were improved by the new platform layout. We believe that Youtube is in the early innings of their growth story. We see this site as a great opportunity to expand Alphabet’s reach into social media. Youtube also recently released “Shorts”, a feature for the Youtube app available in India only. This new feature will be modeled after TikTok, allowing users to release short 15 second videos with licensed music attached, this comes after India banned TikTok in July. According to NPR, 1/3 of Tik Toks estimated daily users were believed to be from India prior to the ban, representing a market that will likely be receptive of the new product.16 A successful release in India could lead to the creation of a stand-alone app and widespread release into other markets.

7
The last key growth driver we see for Google is in the Cloud. COVID-19 has transformed the way that large and small businesses are doing business. Even prior to the pandemic, Alphabet had seen its highest growth rates in the Cloud segment. This business segment averaged 48% annual growth since the end of 2017 and we believe that it will continue at this level as the world relies more on software services. Google cloud has become a larger portion of overall revenue at Alphabet.
In the first three quarters of FY20 Cloud represented 7.4% of total revenue, up from 5.5% in 2019. The initial costs for cloud infrastructure and data centers have driven revenue costs up a bit higher recently. But the exact margins figures have yet to be reported by management. Regardless, we see this as a segment that can stabilize overall gross margins as the digital ad industry matures in the coming years.
SWOT Analysis Strengths: Google is synonymous with internet search and has been since the early 2000s. Their reach into nearly every household in the United States makes them a top choice for advertisers in an increasingly digital world. As of July 2020, google accounted for 86.86% of global internet search on desktops.17 The next closest competitor was Bing, who made up 6.43%. In the United States, Google made up 96% and 92% of mobile and overall search visits, respectively. Their brand recognition ranks among the top of all tech companies in the US. A survey conducted by Statista in 2018 revealed that 93% of respondents knew about Google, at least by name. That is higher than Cisco, Apple, and Microsoft.18 Weaknesses: Significant dependence on advertising revenue exposes them to risks that more diversified firms in the communications sector may not experience. Over 83% of 2019 revenue was attributable to online ads. The advertising budgets of their customers are susceptible to macroeconomic effects and any significant blow to them, could affect Google as well. Opportunities: The world was already running toward cloud networks and storage and the COVID-19 pandemic has caused the entire world to sprint to it. Google cloud presents an even larger opening for them to expand their reach. The cloud business accounted for 5.5% of their revenue in 2019. This
is a growing business segment for Alphabet, and they are experiencing accelerated revenue growth over the last two years. We believe that the change in small business and corporate work settings lead to a continuation of this trend going forward. Google recently pledged to invest $10 billion in India over the next five to seven years. Of the 1.3 billion people, only about half have access to the internet. Google's CEO said that the investment would help gain reach in four areas: they want to provide access in the Indian language, new rollouts targeted at Indians, digital support for businesses, and the promotion of key social issues. Google has been developing hardware and apps that are more conducive to the economic and structural realities in India. Namely, the development of voice software in their phones for people who are not familiar with English or American keyboards19. They have also been creating apps that are specifically designed to use less data since the infrastructure in India rarely supports high-speed video streaming.
Threats: The competitive environment of internet advertising could be quite problematic for Google. The rollout of Facebook Shops and the increasing user base make them a formidable opponent to the king of search. Social media ad spending has more than doubled over the last five years20 and Facebook is one of the top choices for small businesses who have a hard time competing on Google's platform. The other behemoth that Google must fend off is Amazon. They have the same massive data warehouses about consumers. There's may even be more useful data since many people go to their website with the sole intention of making a purchase or at least checking competitive prices. A recent survey of US retail brands selling on Amazon revealed that 59% saw Amazon ads generating the highest return on ad spending while Google only represented 22% of sellers.21 This indicates that those who have made the switch to advertising on Amazon are seeing more seeing more success than they were with Google.
Source: Statista

8
These two giants could eat into Google's market share if they continue to attract eyeballs at the blistering growth rates, we've seen in recent years. They are certainly making a run at the leader in internet search by offering attractive propositions to advertisers looking to sell online.
Last, if Alphabet remains a dominant player in the industry, there will always be regulatory concerns for the company. The company has faced numerous fines in the past for its monopolistic practices and is currently undergoing a lawsuit in which the U.S. government is looking to potentially break up the company. Nevertheless, regulation is a common threat among all tech companies (Microsoft in ‘98) and will remain that way as the emerging improvements with tech will continually bring unchartered territory that will need to be regulated.
Valuation Analysis Revenue Decomposition Google Search Ad revenue is the biggest contributor to the company’s revenue and has remained that way considering that the search browser has been the reason why the company has grown to the size it is today. In 2019, advertisements from Google Search & Other generated around 60% of the company's total revenue with about almost $100 billion. This is also not considering the amount of revenue that Alphabet brings in from the advertisements it does with Youtube and Google Network Members (which consists of another ~22%). As mentioned, YouTube will be a key growth segment for Alphabet as 5G networks develop and consumers adopt it in the coming years. They have achieved excellent growth recently and we project that this will continue as advertisers look to make more meaningful impressions on
consumers. With this in mind, we see a 25% to 35%
revenue growth over the next four years and continued double digit growth beyond that. While Alphabet has consistently generated and grown its Google Search ad revenue for the entirety of the company’s lifespan, we are projecting that this growth will slowly decrease and make up for less of Google’s revenue in the future. The revenue growth of Google Search has been very high the past decade and it will be very hard to sustain these numbers, especially considering
the changes in product mix, advertising preferences and the online advertising market. Another main reason being is that Alphabet is continuously diversifying its revenue streams, in tandem with the rapid growth of technology. One key figure to look at is Google Cloud, in which Alphabet is heavily investing towards as the needs and demands of cloud services is expected to tremendously increase. As of 2019, Google Cloud only made up around 5% of total revenue, but we are expecting this to increase to around 25% by 2029.
Expenses The biggest expense for Google is Cost of Revenue. A big reason is that Cost of Revenue include traffic-acquisition costs (TAC), which is the cost that Google pays for partners to run its ads and services. As noted above, since advertisements are crucial to Google’s income, we have projected this expense to increase as the industry matures. As with many tech companies, R&D is very important in ensuring that Google can continue to diversify its offerings all the while staying on top of the continually emerging competition. R&D is the second largest expense, and we expect that it will continue to stay this way as Google is constantly expanding via its offerings and Other Bets. We are projecting R&D expense at 16.5% of total sales, which is very similar to the historical average.
Weighted Average Cost of Capital (WACC) For our valuation, we calculated and used a WACC of 5.83%. We calculated a cost of equity by using a risk-free rate of 0.8% (10-year treasury bond). Our beta value was taken from Bloomberg with a value of 0.96. The equity risk premium was taken from Aswath Damodaran’s forward looking projection for November 2020. With these values, we got to a cost of equity of 5.94%. For our cost of debt, we used the same risk-free rate with an implied default premium of 1.78% (2030 corporate bond rate). We used a pre-tax cost of debt of 2.58% and marginal tax rate of 16% (Bloomberg) to derive our post-tax cost of Debt at 2.16%
Our final calculated WACC value weighed equity tremendously more than debt considering that the company has very low borrowing rates as Alphabet is a highly credit rated company, and considerably high value on equity.
9
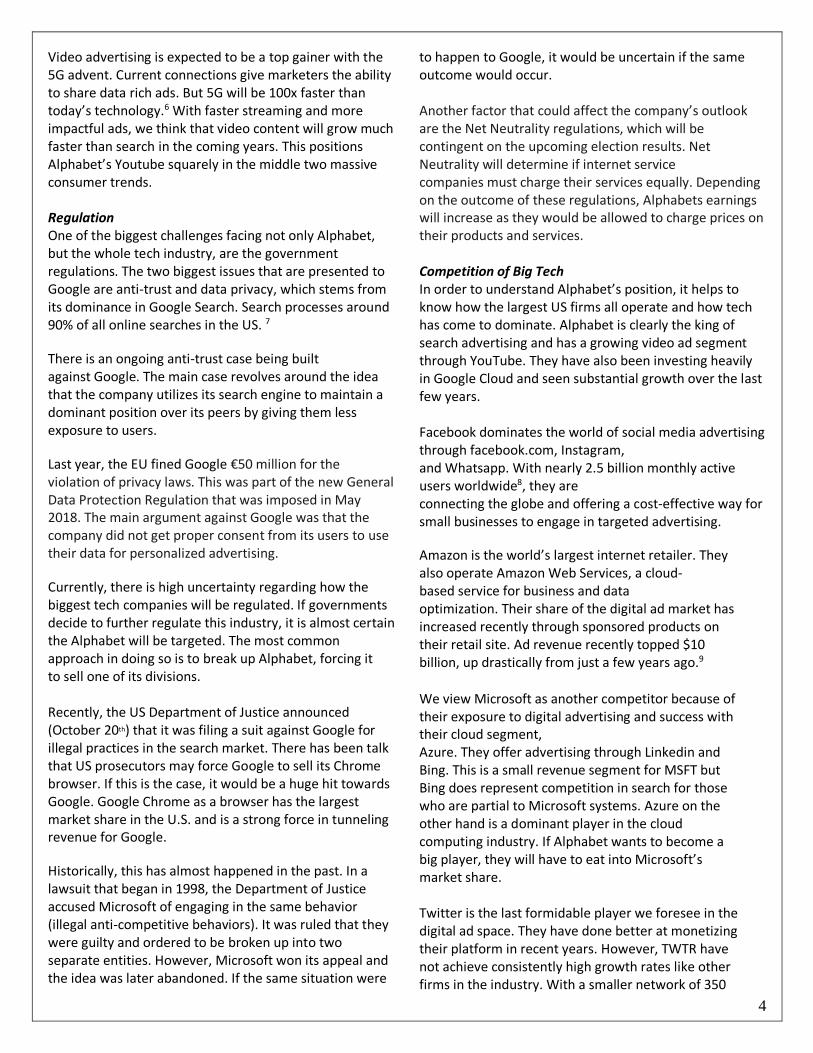
Discounted Cash Flow / Economic Profit (DCF / EP) Two of the four valuation methods that were used were the DCF and EP model. The DCF model required us to forecast Alphabet’s free cash flows to 2029 in the Drivers tab of our model. These values came from the assumptions about revenue and expenses as mentioned above. We then discounted these projected cash flows and a large 2029 continuing value cashflow back to the current date. The EP model was created similarly, but rather than free cash flow, we projected the beginning invested capital of each fiscal year. Then our growth was forecasted by the multiplying each year’s beginning invested capital * (ROIC – WACC). Our continuing value ROIC was 34.3% and the WACC remained 5.83% to calculate discounted CV in 2029. Both models arrived at an intrinsic value of $1,932 We believe that these models indicate the best intrinsic value of Alphabet. They are the most comprehensive assessment of the firm’s growth prospects, capital structure, and cost mechanisms.
Dividend Discount Model (DDM) Another valuation model that was used is the DDM. We believe this method of valuing Alphabet would be less accurate, considering that Alphabet does not currently pay a dividend. This means that the valuation consisted of theoretical dividends that they can afford to pay given our EPS, CV growth, and CV ROE projections. Our DDM value for Alphabet was $1030.91, which is considerably lower than the valuations from the other methods. We do not feel that this accurately reflects the intrinsic value of the firm. Relative Comparable Companies The last method that we used to value Alphabet is through looking at numerous ratios of other relative companies. While Alphabet is a unique company, we were able to value them relative to other Big Tech firms with significant exposure to digital advertising and the cloud. We place less emphasis on this valuation because it deals much less with company fundamentals. However, it served as a good check that our DCF and EP models were not outlandish. The implied relative value using a P/E ratio gives us a valuation of $1,948, which is very similar to the valuation we derived from the DCF & EP models.
Sensitivity Analysis
Beta vs Equity risk premium
Neither the beta nor equity risk premium have a drastic impact on our stock price when we adjust them in either direction. There is only a $4 change in our valuation if the forward-looking ERP were to increase by 30 basis points from current levels. If we were to increase Alphabet’s beta from 0.96 to 1.16, the implied price only increases $16 or less than 1%.
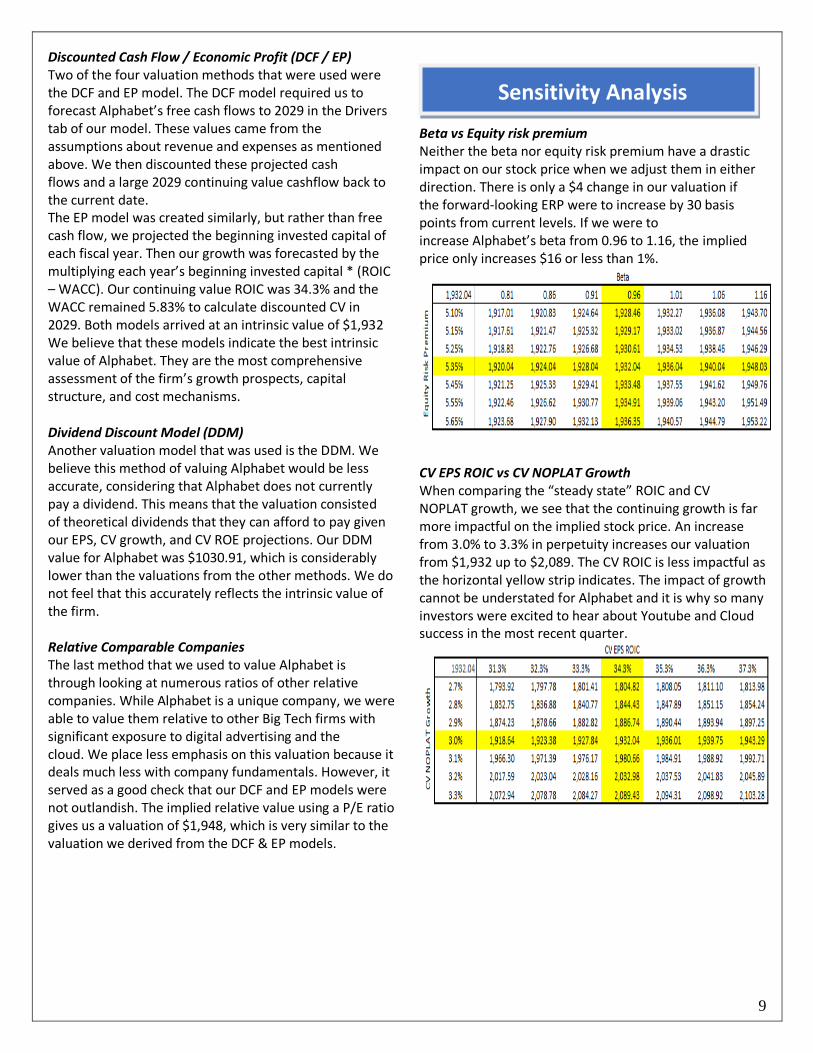
CV EPS ROIC vs CV NOPLAT Growth
When comparing the “steady state” ROIC and CV NOPLAT growth, we see that the continuing growth is far more impactful on the implied stock price. An increase from 3.0% to 3.3% in perpetuity increases our valuation from $1,932 up to $2,089. The CV ROIC is less impactful as the horizontal yellow strip indicates. The impact of growth cannot be understated for Alphabet and it is why so many investors were excited to hear about Youtube and Cloud success in the most recent quarter.

10
WACC vs CV ROIC As mentioned above, a 1 percentage point change in ROIC has less impact on the implied value than other variables. We do not anticipate a CV ROIC outside the data table we’ve created. Meaning, the WACC is far more important to GOOGL’s valuation. The value is very sensitive to the rate at which we discount their cash flows. If Alphabet’s WACC were to drop only 30 basis points, it would imply an increase of more than $200 per share.
Risk Free Rate vs WACC
We know that the WACC of any firm is vitally important to its overall valuation. Alphabet is no different, but where they do differ is in their capital structure. Alphabet carries very little debt and so interest rate risk is of little concern for their valuation. Changes in US treasuries are not likely to impact our valuation nearly at all. As you can see, a 30-basis point swing in the risk free rate only changes our valuation by $5. Firms with higher leverage would be far more susceptible to changes in the bond market.
Marginal Tax Rate vs CV COGS (as % of sales) Alphabet has benefitted from the corporate tax cuts that have been in place since FY18. Their marginal tax rate is now just above 16% and should remain stable going forward. If things were to change and they experience unfavorable changes upwards of 18%, our valuation remains mostly the same. However, the cost of sales for Alphabet is very susceptible to change between now and FY29. An increase in assumed costs can drastically cut the firms value. The same is true with lower costs, the firm could achieve much higher valuation levels if they manage to keep their COGS low into perpetuity.
11
References
1-Association of National Advertisers - https://www.ana.net/content/show/id/37679#:~:text=New%20Study%20Confirms%20Advertising%20as,the%20nation's%20total%20economic%20output. 2-U.S. Bureau of Labor - https://www.bls.gov/news.release/empsit.toc.htm 3-Beykent University - http://avekon.org/papers/1141.pdf 4-Statista - https://www.statista.com/study/42540/digital-advertising-report/ 5-Statista - https://www.statista.com/statistics/216573/worldwide-market-share-of-search-engines/ 6-CFRA Research - https://www.capitaliq.com/CIQDotNet/Research/DocumentViewer.aspx?documentViewerDocumentId=44993169 7-Statista - https://www.statista.com/statistics/511358/market-share-mobile-search-usa/ 8-FactSet - https://my.apps.factset.com/navigator/company-security/all-estimates/FB-US 9-Debugger - https://debugger.medium.com/amazons-growing-ad-business-could-forever-change-tech-ea231b1459af?gi=f8639867321d 10-CFRA Research - https://www.capitaliq.com/CIQDotNet/Research/DocumentViewer.aspx?documentViewerDocumentId=44993169 11-CFRA Research - https://www.capitaliq.com/CIQDotNet/Research/DocumentViewer.aspx?documentViewerDocumentId=44993169 12-Statista - https://www.statista.com/statistics/216573/worldwide-market-share-of-search-engines/ 13-Alphabet Investor Relations 3Q20 10Q - https://abc.xyz/investor/ 14-Alphabet Investor Relations 3Q20 10Q - https://abc.xyz/investor/ 15-Alphabet Investor Relations 3Q20 10Q - https://abc.xyz/investor/ 16-NPR - https://www.npr.org/2020/07/16/890382893/tiktok-changed-my-life-india-s-ban-on-chinese-app-leaves-
video-makers-stunned#:~:text=TikTok%20is%20estimated%20to%20have,terms%20of%20traffic%2C%20outside%20China 17-Statista - https://www.statista.com/study/42540/digital-advertising-report/ 18-Statista - https://www.statista.com/forecasts/1011621/brand-awareness-of-tech-companies-in-the-us 19-Wallstreet Journal - https://www.wsj.com/articles/google-to-invest-10-billion-in-india-11594635725 20-Statista - https://www.statista.com/statistics/736971/social-media-ad-spend-usa/ 21-Statista - https://www.statista.com/statistics/1105025/amazon-sellers-best-roas-generating-channels-usa/

12
Important Disclaimer This report was created by students enrolled in the Security Analysis (6F:112) class at the University of Iowa. The report was originally created to offer an internal investment recommendation for the University of Iowa Krause Fund and its advisory board. The report also provides potential employers and other interested parties an example of the students’ skills, knowledge and abilities. Members of the Krause Fund are not registered investment advisors, brokers or officially licensed financial professionals. The investment advice contained in this report does not represent an offer or solicitation to buy or sell any of the securities mentioned. Unless otherwise noted, facts and figures included in this report are from publicly available sources. This report is not a complete compilation of data, and its accuracy is not guaranteed. From time to time, the University of Iowa, its faculty, staff, students, or the Krause Fund may hold a financial interest in the companies mentioned in this report.

Alphabet
Revenue Decomposition
in millions
Fiscal Years Ending Dec. 31 2017 2018 2019 2020E 2021E 2022E 2023E 2024E 2025E 2026E 2027E 2028E 2029E
Google Search & other 69,811 85,296 98,115 106,945 116,570 127,062 138,497 149,577 160,048 169,650 179,829 188,821 194,485
growth% 9.4% 22.2% 15.0% 9.0% 9.0% 9.0% 9.0% 8.0% 7.0% 6.0% 6.0% 5.0% 3.0%
% of Total sales 62.98% 62.34% 60.62% 57.99% 54.74% 51.49% 48.34% 45.05% 41.75% 38.99% 37.04% 36.64% 36.64%
Youtube ads 8,150 11,155 15,149 20,451 26,586 34,562 43,203 54,004 64,805 74,525 81,978 86,077 88,659
growth% 36.9% 35.8% 35.0% 30.0% 30.0% 25.0% 25.0% 20.0% 15.0% 10.0% 5.0% 3.0%
% of Total sales 7.4% 8.2% 9.4% 11.1% 12.5% 14.0% 15.1% 16.3% 16.9% 17.1% 16.9% 16.7% 16.7%
Google Network Members'
Properties 17,616 20,010 21,547 22,624 24,887 27,375 30,113 33,124 36,437 40,080 44,088 46,293 47,682
growth% 12.9% 13.6% 7.7% 5.0% 10.0% 10.0% 10.0% 10.0% 10.0% 10.0% 10.0% 5.0% 3.0%
% of Total sales 15.9% 14.6% 13.3% 12.3% 11.7% 11.1% 10.5% 10.0% 9.5% 9.2% 9.1% 9.0% 9.0%
Google Cloud 4,056 5,838 8,918 13,199 19,534 27,348 38,287 51,687 69,777 90,711 113,388 124,727 128,469
growth% 43.93% 52.76% 48.00% 48.00% 40.00% 40.00% 35.00% 35.00% 30.00% 25.00% 10.00% 3.00%
% of Total sales 3.7% 4.3% 5.5% 7.2% 9.2% 11.1% 13.4% 15.6% 18.2% 20.8% 23.4% 24.2% 24.2%
Google Other 10,914 14,063 17,014 20,417 24,500 29,400 35,280 42,336 50,804 58,424 64,266 67,480 69,504
growth% 8.3% 28.9% 21.0% 20.0% 20.0% 20.0% 20.0% 20.0% 20.0% 15.0% 10.0% 5.0% 3.0%
% of Total sales 9.8% 10.3% 10.5% 11.1% 11.5% 11.9% 12.3% 12.8% 13.3% 13.4% 13.2% 13.1% 13.1%
Other Bets 477 595 659 725 834 959 1,102 1,268 1,458 1,677 1,844 1,937 1,995
growth% -41.0% 24.7% 10.8% 10.0% 15.0% 15.0% 15.0% 15.0% 15.0% 15.0% 10.0% 5.0% 3.0%
% of Total sales 0.4% 0.4% 0.4% 0.4% 0.4% 0.4% 0.4% 0.4% 0.4% 0.4% 0.4% 0.4% 0.4%
Hedging Gains (losses) (169) (138) 455 49 49 49 49 49 49 49 49 49 49
growth% -18.3% -429.7% -89.2% 0.0% 0.0% 0.0% 0.0% 0.0% 0.0% 0.0% 0.0% 0.0%
% of Total sales -0.2% -0.1% 0.3% 0.0% 0.0% 0.0% 0.0% 0.0% 0.0% 0.0% 0.0% 0.0% 0.0%
Total Revenues 110,855 136,819 161,857 184,411 212,961 246,755 286,532 332,046 383,377 435,117 485,444 515,383 530,843
growth% 22.8% 23.4% 18.3% 13.9% 15.5% 15.9% 16.1% 15.9% 15.5% 13.5% 11.6% 6.2% 3.0%
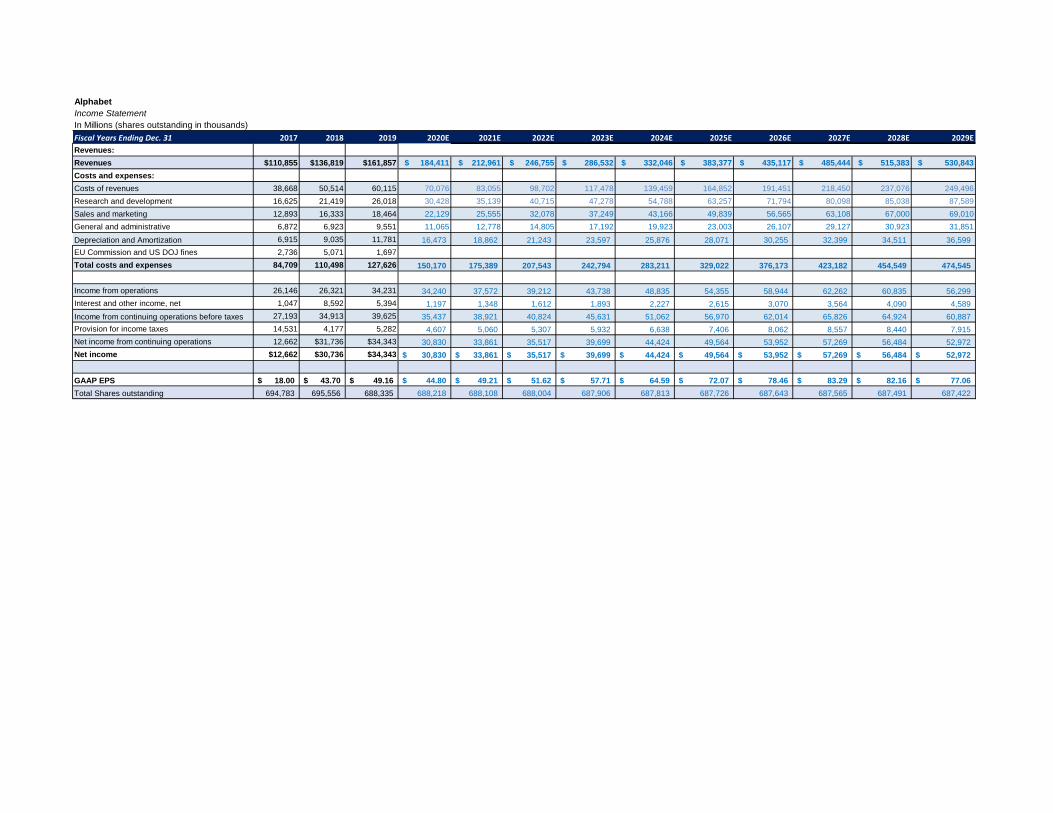
Alphabet
Income Statement
In Millions (shares outstanding in thousands)
Fiscal Years Ending Dec. 31 2017 2018 2019 2020E 2021E 2022E 2023E 2024E 2025E 2026E 2027E 2028E 2029E
Revenues:
Revenues $110,855 $136,819 $161,857 $ 184,411 $ 212,961 $ 246,755 $ 286,532 $ 332,046 $ 383,377 $ 435,117 $ 485,444 $ 515,383 $ 530,843
Costs and expenses:
Costs of revenues 38,668 50,514 60,115 70,076 83,055 98,702 117,478 139,459 164,852 191,451 218,450 237,076 249,496
Research and development 16,625 21,419 26,018 30,428 35,139 40,715 47,278 54,788 63,257 71,794 80,098 85,038 87,589
Sales and marketing 12,893 16,333 18,464 22,129 25,555 32,078 37,249 43,166 49,839 56,565 63,108 67,000 69,010
General and administrative 6,872 6,923 9,551 11,065 12,778 14,805 17,192 19,923 23,003 26,107 29,127 30,923 31,851
Depreciation and Amortization 6,915 9,035 11,781 16,473 18,862 21,243 23,597 25,876 28,071 30,255 32,399 34,511 36,599
EU Commission and US DOJ fines 2,736 5,071 1,697
Total costs and expenses 84,709 110,498 127,626 150,170 175,389 207,543 242,794 283,211 329,022 376,173 423,182 454,549 474,545
Income from operations 26,146 26,321 34,231 34,240 37,572 39,212 43,738 48,835 54,355 58,944 62,262 60,835 56,299
Interest and other income, net 1,047 8,592 5,394 1,197 1,348 1,612 1,893 2,227 2,615 3,070 3,564 4,090 4,589
Income from continuing operations before taxes 27,193 34,913 39,625 35,437 38,921 40,824 45,631 51,062 56,970 62,014 65,826 64,924 60,887
Provision for income taxes 14,531 4,177 5,282 4,607 5,060 5,307 5,932 6,638 7,406 8,062 8,557 8,440 7,915
Net income from continuing operations 12,662 $31,736 $34,343 30,830 33,861 35,517 39,699 44,424 49,564 53,952 57,269 56,484 52,972
Net income $12,662 $30,736 $34,343 30,830$ 33,861$ 35,517$ 39,699$ 44,424$ 49,564$ 53,952$ 57,269$ 56,484$ 52,972$
GAAP EPS 18.00$ 43.70$ 49.16$ 44.80$ 49.21$ 51.62$ 57.71$ 64.59$ 72.07$ 78.46$ 83.29$ 82.16$ 77.06$
Total Shares outstanding 694,783 695,556 688,335 688,218 688,108 688,004 687,906 687,813 687,726 687,643 687,565 687,491 687,422
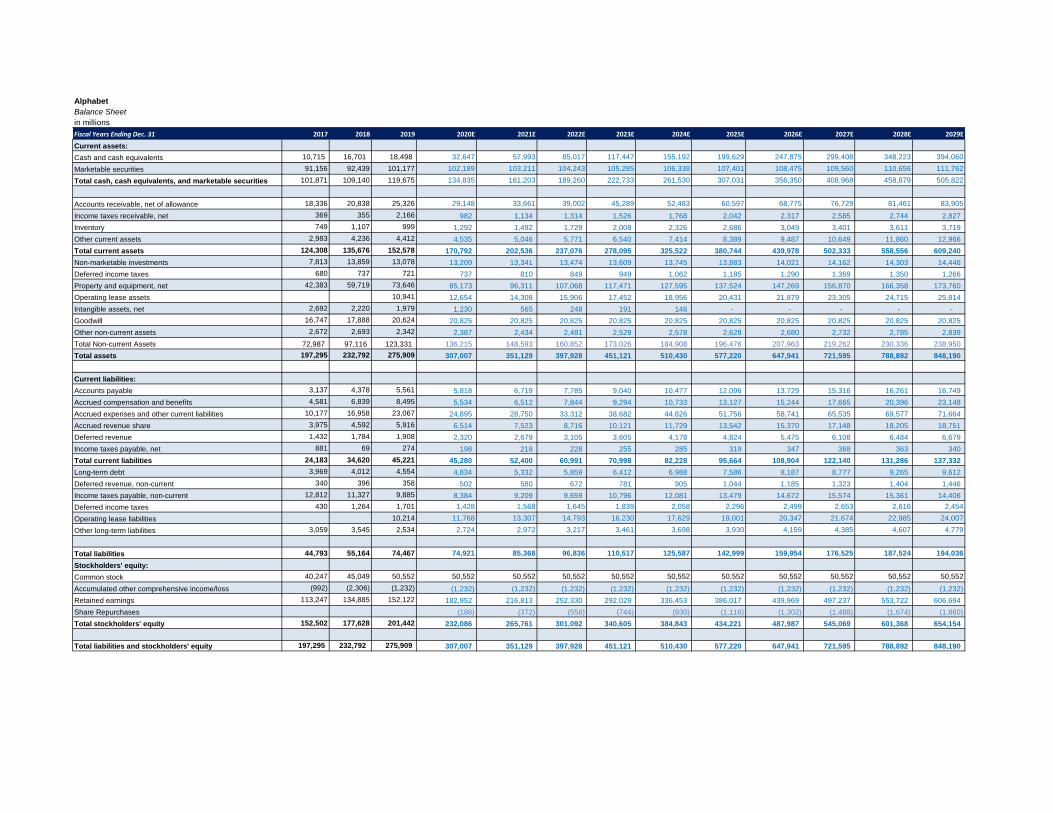
Alphabet
Balance Sheet
in millions
Fiscal Years Ending Dec. 31 2017 2018 2019 2020E 2021E 2022E 2023E 2024E 2025E 2026E 2027E 2028E 2029E
Current assets:
Cash and cash equivalents 10,715 16,701 18,498 32,647 57,993 85,017 117,447 155,192 199,629 247,875 299,408 348,223 394,060
Marketable securities 91,156 92,439 101,177 102,189 103,211 104,243 105,285 106,338 107,401 108,475 109,560 110,656 111,762
Total cash, cash equivalents, and marketable securities 101,871 109,140 119,675 134,835 161,203 189,260 222,733 261,530 307,031 356,350 408,968 458,879 505,822
Accounts receivable, net of allowance 18,336 20,838 25,326 29,148 33,661 39,002 45,289 52,483 60,597 68,775 76,729 81,461 83,905
Income taxes receivable, net 369 355 2,166 982 1,134 1,314 1,526 1,768 2,042 2,317 2,585 2,744 2,827
Inventory 749 1,107 999 1,292 1,492 1,729 2,008 2,326 2,686 3,049 3,401 3,611 3,719
Other current assets 2,983 4,236 4,412 4,535 5,046 5,771 6,540 7,414 8,389 9,487 10,649 11,860 12,966
Total current assets 124,308 135,676 152,578 170,792 202,536 237,076 278,095 325,522 380,744 439,978 502,333 558,556 609,240
Non-marketable investments 7,813 13,859 13,078 13,209 13,341 13,474 13,609 13,745 13,883 14,021 14,162 14,303 14,446
Deferred income taxes 680 737 721 737 810 849 949 1,062 1,185 1,290 1,369 1,350 1,266
Property and equipment, net 42,383 59,719 73,646 85,173 96,311 107,068 117,471 127,595 137,524 147,269 156,870 166,358 173,760
Operating lease assets 10,941 12,654 14,308 15,906 17,452 18,956 20,431 21,879 23,305 24,715 25,814
Intangible assets, net 2,692 2,220 1,979 1,230 565 248 191 146 - - - - -
Goodwill 16,747 17,888 20,624 20,825 20,825 20,825 20,825 20,825 20,825 20,825 20,825 20,825 20,825
Other non-current assets 2,672 2,693 2,342 2,387 2,434 2,481 2,529 2,578 2,628 2,680 2,732 2,785 2,839
Total Non-current Assets 72,987 97,116 123,331 136,215 148,593 160,852 173,026 184,908 196,476 207,963 219,262 230,336 238,950
Total assets 197,295 232,792 275,909 307,007 351,129 397,928 451,121 510,430 577,220 647,941 721,595 788,892 848,190
Current liabilities:
Accounts payable 3,137 4,378 5,561 5,818 6,719 7,785 9,040 10,477 12,096 13,729 15,316 16,261 16,749
Accrued compensation and benefits 4,581 6,839 8,495 5,534 6,512 7,844 9,294 10,733 13,127 15,244 17,665 20,396 23,148
Accrued expenses and other current liabilities 10,177 16,958 23,067 24,895 28,750 33,312 38,682 44,826 51,756 58,741 65,535 69,577 71,664
Accrued revenue share 3,975 4,592 5,916 6,514 7,523 8,716 10,121 11,729 13,542 15,370 17,148 18,205 18,751
Deferred revenue 1,432 1,784 1,908 2,320 2,679 3,105 3,605 4,178 4,824 5,475 6,108 6,484 6,679
Income taxes payable, net 881 69 274 198 218 228 255 285 319 347 368 363 340
Total current liabilities 24,183 34,620 45,221 45,280 52,400 60,991 70,998 82,228 95,664 108,904 122,140 131,286 137,332
Long-term debt 3,969 4,012 4,554 4,834 5,332 5,859 6,412 6,988 7,586 8,187 8,777 9,265 9,612
Deferred revenue, non-current 340 396 358 502 580 672 781 905 1,044 1,185 1,323 1,404 1,446
Income taxes payable, non-current 12,812 11,327 9,885 8,384 9,209 9,659 10,796 12,081 13,479 14,672 15,574 15,361 14,406
Deferred income taxes 430 1,264 1,701 1,428 1,568 1,645 1,839 2,058 2,296 2,499 2,653 2,616 2,454
Operating lease liabilities 10,214 11,768 13,307 14,793 16,230 17,629 19,001 20,347 21,674 22,985 24,007
Other long-term liabilities 3,059 3,545 2,534 2,724 2,972 3,217 3,461 3,698 3,930 4,159 4,385 4,607 4,779
Total liabilities 44,793 55,164 74,467 74,921 85,368 96,836 110,517 125,587 142,999 159,954 176,525 187,524 194,036
Stockholders' equity:
Common stock 40,247 45,049 50,552 50,552 50,552 50,552 50,552 50,552 50,552 50,552 50,552 50,552 50,552
Accumulated other comprehensive income/loss (992) (2,306) (1,232) (1,232) (1,232) (1,232) (1,232) (1,232) (1,232) (1,232) (1,232) (1,232) (1,232)
Retained earnings 113,247 134,885 152,122 182,952 216,813 252,330 292,029 336,453 386,017 439,969 497,237 553,722 606,694
Share Repurchases (186) (372) (558) (744) (930) (1,116) (1,302) (1,488) (1,674) (1,860)
Total stockholders' equity 152,502 177,628 201,442 232,086 265,761 301,092 340,605 384,843 434,221 487,987 545,069 601,368 654,154
Total liabilities and stockholders' equity 197,295 232,792 275,909 307,007 351,129 397,928 451,121 510,430 577,220 647,941 721,595 788,892 848,190

Alphabet
Historical Cash Flow Statement
in millions
Fiscal Years Ending Dec. 31 2009 2010 2011 2012 2013 2014 2015 2016 2017 2018 2019
Operating activities
Net income $6,520 $8,505 $9,737 $10,737 $12,920 $14,444 $16,348 $19,478 $12,662 $30,736 $34,343
Adjustments:
Depreciation and impairment of property and equipment 1,240 1,067 1,396 1,988 2,781 3,523 4,132 5,267 6,103 8,164 10,856
Amortization and impairment of intangible assets 284 329 455 974 1,158 1,456 931 877 812 871 925
Stock-based compensation expense 1,164 1,376 1,974 2,692 3,343 4,279 5,203 6,703 7,679 9,353 10,794
Excess tax benefits from stock-based award activities (90) (94) (86) (188) (481) (648) (548)
Deferred income taxes (268) 9 343 (266) (437) (104) (179) (38) 258 778 173
Gain on divestiture of business - - - (188) (700) (740) - - - - -
Gain on equity interest - - - - - (126) - - - - -
(Gain) loss on marketable and non-marketable investments,
net - - 110 - - (159) 334 275 37 (6,650) (2,798)
Other (20) (12) 6 - - 87 212 174 294 (189) (592)
Changes in assets and liabilities, net of effects of
acquisitions:
Accounts receivable (504) (1,129) (1,156) (787) (1,307) (1,641) (2,094) (2,578) (3,768) (2,169) (4,340)
Income taxes, net 217 102 731 1,492 401 283 (179) 3,125 8,211 (2,251) (3,128)
Prepaid revenue share, expenses and other assets 262 (414) (262) (532) (930) 459 (318) 312 (2,164) (1,207) (621)
Accounts payable 34 272 101 (499) 605 436 203 110 731 1,067 428
Accrued expenses and other liabilities 243 745 795 762 713 757 1,597 1,515 4,891 8,614 7,170
Accrued revenue share 158 214 259 299 254 245 339 593 955 483 1,273
Deferred revenue 76 111 162 163 233 (175) 43 223 390 371 37
Net cash provided by operating activities 9,316 11,081 14,565 16,619 18,659 22,376 26,024 36,036 37,091 47,971 54,520
Investing activities
Purchases of property and equipment (810) (4,018) (3,438) (3,273) (7,358) (10,959) (9,915) (10,212) (13,184) (25,139) (23,548)
Proceeds from disposals of property and equipment - - - - - - - 240 - 98 -
Purchases of marketable securities (29,139) (43,985) (61,672) (33,410) (45,444) (56,310) (74,368) (84,509) (92,195) (50,158) (100,315)
Maturities and sales of marketable securities 22,103 37,099 48,746 35,180 38,314 51,315 62,905 66,895 73,959 48,507 97,825
Purchases of non-marketable investments (65) (320) (428) (696) (569) (1,227) (2,172) (1,109) (1,745) (2,073) (1,932)
Maturities and sales of non-marketable investments - - - - - - - 494 533 1,752 405
Cash collateral related to securities lending - 2,361 (354) (334) (299) 1,403 (350) (2,428) - - -
Investments in reverse repurchase agreements - (750) 5 45 600 (775) 425 450 - - -
Proceeds from divestiture of business - - - - 2,525 386 - - - - -
Acquisitions, net of cash acquired, and purchases of
intangibles and other assets (108) (1,067) (1,900) (10,568) (1,448) (4,888) (236) (986) (287) (1,491) -
Proceeds from collection of notes receivable - - - - - - - - 1,419 - -
other investing activities - - - - - - - - - - 589
Net cash used in investing activities (8,019) (10,680) (19,041) (13,056) (13,679) (21,055) (23,711) (31,165) (31,401) (28,504) (29,491)
Financing activities
Net payments related to stock-based award activities 143 294 (5) (287) (781) (2,069) (2,375) (3,304) (4,166) (4,993) (4,765)
Excess tax benefits from stock-based award activities 90 94 86 188 481 648 548 - - - -
Adjustment Payment to Class C capital stockholders - - - - - - (47) - - - -
Repurchases of capital stock - (801) - - - - (1,780) (3,693) (4,846) (9,075) (18,396)
Proceeds from issuance of debt, net of costs - 5,246 10,905 16,109 10,768 11,625 13,705 9,729 4,291 6,766 317
Repayments of debt - (1,783) (10,179) (14,781) (11,325) (11,643) (13,728) (10,064) (4,377) (6,827) (585)
Proceeds from sale of subsidiary shares - - - - - - - - 800 950 220
Net cash used in financing activities 233 3,050 807 1,229 (857) (1,439) (3,677) (8,332) (8,298) (13,179) (23,209)Effect of exchange rate changes on cash and cash
equivalents 11 (19) 22 3 (3) (433) (434) (170) 405 (302) (23)
Net increase (decrease) in cash and cash equivalents 1,541 3,432 (3,647) 4,795 4,120 (551) (1,798) (3,631) (2,203) 5,986 1,797
Cash and cash equivalents at beginning of period 8,657 10,198 13,630 9,983 14,778 18,898 18,347 16,549 12,918 10,715 16,701
Cash and cash equivalents at end of period 10,198 13,630 9,983 14,778 18,898 18,347 16,549 12,918 10,715 16,701 18,498
FCFF 8,506 7,063 11,127 13,346 11,301 11,417 16,109 25,824 23,907 22,832 30,972

Alphabet
Forecasted Cash Flow Statement
in millionsFiscal Years Ending Dec. 31 2020E 2021E 2022E 2023E 2024E 2025E 2026E 2027E 2028E 2029E
Operating activities
Net income 30,830 33,861 35,517 39,699 44,424 49,564 53,952 57,269 56,484 52,972
Adjustments:
Depreciation amortization (Combined with line 10) 16,473 18,862 21,243 23,597 25,876 28,071 30,255 32,399 34,511 36,599
Change in Deferred income taxes (289) 68 37 94 106 115 98 74 (18) (79)
Changes in assets and liabilities, net of effects of acquisitions:
Accounts receivable (3,822) (4,513) (5,342) (6,287) (7,194) (8,113) (8,178) (7,955) (4,732) (2,444)
Income tax receivable, net 1,184 (152) (180) (212) (242) (273) (276) (268) (159) (82)
Inventory (293) (200) (237) (279) (319) (360) (363) (353) (210) (108)
other current assets (123) (511) (725) (769) (874) (975) (1,098) (1,162) (1,211) (1,106)
Accounts payable 257 901 1,066 1,255 1,436 1,620 1,632 1,588 945 488
Accrued compensation and Benefits (2,961) 977 1,333 1,450 1,439 2,394 2,116 2,421 2,731 2,753
Accrued expenses and other liabilities 1,828 3,854 4,562 5,370 6,144 6,930 6,985 6,794 4,042 2,087
Accrued revenue share 598 1,009 1,194 1,405 1,608 1,813 1,828 1,778 1,058 546
income taxes payable, net (76) 19 11 27 30 33 28 21 (5) (23)
Deferred revenue 412 359 425 500 573 646 651 633 377 195
change in long-term deferred revenue 144 78 92 108 124 140 141 137 82 42
change in long-term tax payable (1,501) 824 450 1,137 1,285 1,398 1,193 902 (213) (955)
change in operating lease liabilities 1,554 1,539 1,486 1,437 1,399 1,372 1,346 1,326 1,311 1,023
change in long term other liabilities 190 248 245 243 238 231 230 226 221 172
Net cash provided by operating activities 44,407 57,224 61,178 68,776 76,051 84,606 90,543 95,832 95,213 92,079
Investing activities
CapEx (28,000) (30,000) (32,000) (34,000) (36,000) (38,000) (40,000) (42,000) (44,000) (44,000)
Change in Marketable Securities (1,012) (1,022) (1,032) (1,042) (1,053) (1,063) (1,074) (1,085) (1,096) (1,107)
Change in Non-marketable securities (131) (132) (133) (135) (136) (137) (139) (140) (142) (143)
change in intangible assets 749 665 317 57 45 146 - - - -
change in other noncurrent assets (45) (46) (47) (48) (49) (50) (51) (52) (53) (54)
change in operating lease assets (1,713) (1,655) (1,598) (1,545) (1,504) (1,475) (1,448) (1,426) (1,410) (1,100)
change in goodwill (201) - - - - - - - - -
Net cash used in investing activities (30,353) (32,190) (34,494) (36,714) (38,697) (40,580) (42,712) (44,703) (46,700) (46,403)
Financing activities
Repurchases of capital stock (note 11 on 10k) (186) (186) (186) (186) (186) (186) (186) (186) (186) (186)
Repayments of debt 280 498 526 554 576 598 601 591 488 347
Net cash used in financing activities 94 312 340 368 390 412 415 405 302 161
Net increase (decrease) in cash and cash equivalents 14,149 25,346 27,024 32,430 37,744 44,438 48,246 51,533 48,815 45,837
Cash and cash equivalents at beginning of period 18,498 32,647 57,993 85,017 117,447 155,192 199,629 247,875 299,408 348,223
Cash and cash equivalents at end of period 32,647 57,993 85,017 117,447 155,192 199,629 247,875 299,408 348,223 394,060

Alphabet
Common Size Income Statement
% of sales
Fiscal Year Ending Dec. 31 2016 2017 2018 2019 2020E 2021E 2022E 2023E 2024E 2025E 2026E 2027E 2028E 2029E
Revenues:
Revenues 100.00% 100.00% 100.00% 100.00% 100.00% 100.00% 100.00% 100.00% 100.00% 100.00% 100.00% 100.00% 100.00% 100.00%
Costs and expenses:
Costs of revenues 32.12% 34.88% 36.92% 37.14% 38.00% 39.00% 40.00% 41.00% 42.00% 43.00% 44.00% 45.00% 46.00% 47.00%
Research and development 15.45% 15.00% 15.65% 16.07% 16.50% 16.50% 16.50% 16.50% 16.50% 16.50% 16.50% 16.50% 16.50% 16.50%
Sales and marketing 11.61% 11.63% 11.94% 11.41% 12.00% 12.00% 13.00% 13.00% 13.00% 13.00% 13.00% 13.00% 13.00% 13.00%
General and administrative 7.74% 6.20% 5.06% 5.90% 6.00% 6.00% 6.00% 6.00% 6.00% 6.00% 6.00% 6.00% 6.00% 6.00%
Depreciation and Amortization 6.81% 6.24% 6.60% 7.28% 8.93% 8.86% 8.61% 8.24% 7.79% 7.32% 6.95% 6.67% 6.70% 6.89%
European Commission fines - 2.47% 3.71% 1.05% 0.00% 0.00% 0.00% 0.00% 0.00% 0.00% 0.00% 0.00% 0.00% 0.00%
Total costs and expenses 73.73% 76.41% 80.76% 78.85% 81.43% 82.36% 84.11% 84.74% 85.29% 85.82% 86.45% 87.17% 88.20% 89.39%
Income from operations 26.27% 23.59% 19.24% 21.15% 18.57% 17.64% 15.89% 15.26% 14.71% 14.18% 13.55% 12.83% 11.80% 10.61%
Interest and other income, net 0.48% 0.94% 6.28% 3.33% 0.65% 0.63% 0.65% 0.66% 0.67% 0.68% 0.71% 0.73% 0.79% 0.86%
Income from continuing operations before income taxes 26.75% 24.53% 25.52% 24.48% 19.22% 18.28% 16.54% 15.93% 15.38% 14.86% 14.25% 13.56% 12.60% 11.47%
Provision for income taxes 5.18% 13.11% 3.05% 3.26% 2.50% 2.38% 2.15% 2.07% 2.00% 1.93% 1.85% 1.76% 1.64% 1.49%
Net income from continuing operations 21.58% 11.42% 23.20% 21.22% 16.72% 15.90% 14.39% 13.85% 13.38% 12.93% 12.40% 11.80% 10.96% 9.98%
Net income 21.58% 11.42% 22.46% 21.22% 16.72% 15.90% 14.39% 13.85% 13.38% 12.93% 12.40% 11.80% 10.96% 9.98%

Alphabet
Common Size Balance Sheet
% of Assets
Fiscal Years Ending Dec. 31 2017 2018 2019 2020E 2021E 2022E 2023E 2024E 2025E 2026E 2027E 2028E 2029E
Current assets:
Cash and cash equivalents 5.43% 7.17% 6.70% 10.63% 16.52% 21.36% 26.03% 30.40% 34.58% 38.26% 41.49% 44.14% 46.46%
Marketable securities 46.20% 39.71% 36.67% 33.29% 29.39% 26.20% 23.34% 20.83% 18.61% 16.74% 15.18% 14.03% 13.18%
Total cash, cash equivalents, and marketable securities51.63% 46.88% 43.37% 43.92% 45.91% 47.56% 49.37% 51.24% 53.19% 55.00% 56.68% 58.17% 59.64%
Accounts receivable, net of allowance 9.29% 8.95% 9.18% 9.49% 9.59% 9.80% 10.04% 10.28% 10.50% 10.61% 10.63% 10.33% 9.89%
Income taxes receivable, net 0.19% 0.15% 0.79% 0.32% 0.32% 0.33% 0.34% 0.35% 0.35% 0.36% 0.36% 0.35% 0.33%
Inventory 0.38% 0.48% 0.36% 0.42% 0.42% 0.43% 0.45% 0.46% 0.47% 0.47% 0.47% 0.46% 0.44%
Other current assets 1.51% 1.82% 1.60% 1.48% 1.44% 1.45% 1.45% 1.45% 1.45% 1.46% 1.48% 1.50% 1.53%
Total current assets 63.01% 58.28% 55.30% 55.63% 57.68% 59.58% 61.65% 63.77% 65.96% 67.90% 69.61% 70.80% 71.83%
Non-marketable investments 3.96% 5.95% 4.74% 4.30% 3.80% 3.39% 3.02% 2.69% 2.41% 2.16% 1.96% 1.81% 1.70%
Deferred income taxes 0.34% 0.32% 0.26% 0.24% 0.23% 0.21% 0.21% 0.21% 0.21% 0.20% 0.19% 0.17% 0.15%
Property and equipment, net 21.48% 25.65% 26.69% 27.74% 27.43% 26.91% 26.04% 25.00% 23.83% 22.73% 21.74% 21.09% 20.49%
Operating lease assets 0.00% 0.00% 3.97% 4.12% 4.07% 4.00% 3.87% 3.71% 3.54% 3.38% 3.23% 3.13% 3.04%
Intangible assets, net 1.36% 0.95% 0.72% 0.40% 0.16% 0.06% 0.04% 0.03% 0.00% 0.00% 0.00% 0.00% 0.00%
Goodwill 8.49% 7.68% 7.47% 6.78% 5.93% 5.23% 4.62% 4.08% 3.61% 3.21% 2.89% 2.64% 2.46%
Other non-current assets 1.35% 1.16% 0.85% 0.78% 0.69% 0.62% 0.56% 0.51% 0.46% 0.41% 0.38% 0.35% 0.33%
Total assets 100.00% 100.00% 100.00% 100.00% 100.00% 100.00% 100.00% 100.00% 100.00% 100.00% 100.00% 100.00% 100.00%
Current liabilities:
Accounts payable 1.59% 1.88% 2.02% 1.90% 1.91% 1.96% 2.00% 2.05% 2.10% 2.12% 2.12% 2.06% 1.97%
Accrued compensation and benefits 2.32% 2.94% 3.08% 1.80% 1.85% 1.97% 2.06% 2.10% 2.27% 2.35% 2.45% 2.59% 2.73%
Accrued expenses and other current liabilities5.16% 7.28% 8.36% 8.11% 8.19% 8.37% 8.57% 8.78% 8.97% 9.07% 9.08% 8.82% 8.45%
Accrued revenue share 2.01% 1.97% 2.14% 2.12% 2.14% 2.19% 2.24% 2.30% 2.35% 2.37% 2.38% 2.31% 2.21%
Deferred revenue 0.73% 0.77% 0.69% 0.76% 0.76% 0.78% 0.80% 0.82% 0.84% 0.84% 0.85% 0.82% 0.79%
Income taxes payable, net 0.45% 0.03% 0.10% 0.06% 0.06% 0.06% 0.06% 0.06% 0.06% 0.05% 0.05% 0.05% 0.04%
Total current liabilities 12.26% 14.87% 16.39% 14.75% 14.92% 15.33% 15.74% 16.11% 16.57% 16.81% 16.93% 16.64% 16.19%
Long-term debt 2.01% 1.72% 1.65% 1.57% 1.52% 1.47% 1.42% 1.37% 1.31% 1.26% 1.22% 1.17% 1.13%
Deferred revenue, non-current 0.17% 0.17% 0.13% 0.16% 0.17% 0.17% 0.17% 0.18% 0.18% 0.18% 0.18% 0.18% 0.17%
Income taxes payable, non-current 6.49% 4.87% 3.58% 2.73% 2.62% 2.43% 2.39% 2.37% 2.34% 2.26% 2.16% 1.95% 1.70%
Deferred income taxes 0.22% 0.54% 0.62% 0.47% 0.45% 0.41% 0.41% 0.40% 0.40% 0.39% 0.37% 0.33% 0.29%
Operating lease liabilities - - 3.70% 3.83% 3.79% 3.72% 3.60% 3.45% 3.29% 3.14% 3.00% 2.91% 2.83%
Other long-term liabilities 1.55% 1.52% 0.92% 0.89% 0.85% 0.81% 0.77% 0.72% 0.68% 0.64% 0.61% 0.58% 0.56%
Total liabilities 22.70% 23.70% 26.99% 24.40% 24.31% 24.33% 24.50% 24.60% 24.77% 24.69% 24.46% 23.77% 22.88%
Stockholders' equity:
Class A, Class B, Class C common stock20.40% 19.35% 18.32% 16.47% 14.40% 12.70% 11.21% 9.90% 8.76% 7.80% 7.01% 6.41% 5.96%
Accumulated other comprehensive income/loss-0.50% -0.99% -0.45% -0.40% -0.35% -0.31% -0.27% -0.24% -0.21% -0.19% -0.17% -0.16% -0.15%
Retained earnings 57.40% 57.94% 55.13% 59.59% 61.75% 63.41% 64.73% 65.92% 66.88% 67.90% 68.91% 70.19% 71.53%
Total stockholders' equity 77.30% 76.30% 73.01% 75.60% 75.69% 75.67% 75.50% 75.40% 75.23% 75.31% 75.54% 76.23% 77.12%
Total liabilities and stockholders' equity100.00% 100.00% 100.00% 100.00% 100.00% 100.00% 100.00% 100.00% 100.00% 100.00% 100.00% 100.00% 100.00%
Common Size Balance Sheet
% of Sales
Fiscal Years Ending 2017 2018 2019 2020E 2021E 2022E 2023E 2024E 2025E 2026E 2027E 2028E 2029E
Current assets:
Cash and cash equivalents 9.67% 12.21% 11.43% 17.70% 27.23% 34.45% 40.99% 46.74% 52.07% 56.97% 61.68% 67.57% 74.23%
Marketable securities 82.23% 67.56% 62.51% 55.41% 48.46% 42.25% 36.74% 32.03% 28.01% 24.93% 22.57% 21.47% 21.05%
Total cash, cash equivalents, and marketable securities91.90% 79.77% 73.94% 73.12% 75.70% 76.70% 77.73% 78.76% 80.09% 81.90% 84.25% 89.04% 95.29%
Accounts receivable, net of allowance 16.54% 15.23% 15.65% 15.81% 15.81% 15.81% 15.81% 15.81% 15.81% 15.81% 15.81% 15.81% 15.81%
Receivable under reverse repurchase agreements0.00% 0.00% 0.00% 0.00% 0.00% 0.00% 0.00% 0.00% 0.00% 0.00% 0.00% 0.00% 0.00%
Income taxes receivable, net 0.33% 0.26% 1.34% 0.53% 0.53% 0.53% 0.53% 0.53% 0.53% 0.53% 0.53% 0.53% 0.53%
Inventory 0.68% 0.81% 0.62% 0.70% 0.70% 0.70% 0.70% 0.70% 0.70% 0.70% 0.70% 0.70% 0.70%
Other current assets 2.69% 3.10% 2.73% 2.46% 2.37% 2.34% 2.28% 2.23% 2.19% 2.18% 2.19% 2.30% 2.44%
Total current assets 112.14% 99.16% 94.27% 92.62% 95.10% 96.08% 97.06% 98.04% 99.31% 101.12% 103.48% 108.38% 114.77%
Non-marketable investments 7.05% 10.13% 8.08% 7.16% 6.26% 5.46% 4.75% 4.14% 3.62% 3.22% 2.92% 2.78% 2.72%
Deferred income taxes 0.61% 0.54% 0.45% 0.40% 0.38% 0.34% 0.33% 0.32% 0.31% 0.30% 0.28% 0.26% 0.24%
Property and equipment, net 38.23% 43.65% 45.50% 46.19% 45.22% 43.39% 41.00% 38.43% 35.87% 33.85% 32.31% 32.28% 32.73%
Operating lease assets - - 6.76% 6.86% 6.72% 6.45% 6.09% 5.71% 5.33% 5.03% 4.80% 4.80% 4.86%
Intangible assets, net 2.43% 1.62% 1.22% 0.67% 0.27% 0.10% 0.07% 0.04% 0.00% 0.00% 0.00% 0.00% 0.00%
Goodwill 15.11% 13.07% 12.74% 11.29% 9.78% 8.44% 7.27% 6.27% 5.43% 4.79% 4.29% 4.04% 3.92%
Other non-current assets 2.41% 1.97% 1.45% 1.29% 1.14% 1.01% 0.88% 0.78% 0.69% 0.62% 0.56% 0.54% 0.53%
Total assets 177.98% 170.15% 170.46% 166.48% 164.88% 161.26% 157.44% 153.72% 150.56% 148.91% 148.65% 153.07% 159.78%
Current liabilities:
Accounts payable 2.83% 3.20% 3.44% 3.16% 3.16% 3.16% 3.16% 3.16% 3.16% 3.16% 3.16% 3.16% 3.16%
Accrued compensation and benefits 4.13% 5.00% 5.25% 3.00% 3.06% 3.18% 3.24% 3.23% 3.42% 3.50% 3.64% 3.96% 4.36%
Accrued expenses and other current liabilities9.18% 12.39% 14.25% 13.50% 13.50% 13.50% 13.50% 13.50% 13.50% 13.50% 13.50% 13.50% 13.50%
Accrued revenue share 3.59% 3.36% 3.66% 3.53% 3.53% 3.53% 3.53% 3.53% 3.53% 3.53% 3.53% 3.53% 3.53%
Deferred revenue 1.29% 1.30% 1.18% 1.26% 1.26% 1.26% 1.26% 1.26% 1.26% 1.26% 1.26% 1.26% 1.26%
Income taxes payable, net 0.79% 0.05% 0.17% 0.11% 0.10% 0.09% 0.09% 0.09% 0.08% 0.08% 0.08% 0.07% 0.06%
Total current liabilities 21.81% 25.30% 27.94% 24.55% 24.61% 24.72% 24.78% 24.76% 24.95% 25.03% 25.16% 25.47% 25.87%
0.00% 0.00% 0.00% 0.00% 0.00% 0.00% 0.00% 0.00% 0.00% 0.00% 0.00% 0.00% 0.00%
Long-term debt 3.58% 2.93% 2.81% 2.62% 2.50% 2.37% 2.24% 2.10% 1.98% 1.88% 1.81% 1.80% 1.81%
Deferred revenue, non-current 0.31% 0.29% 0.22% 0.27% 0.27% 0.27% 0.27% 0.27% 0.27% 0.27% 0.27% 0.27% 0.27%
Income taxes payable, non-current 11.56% 8.28% 6.11% 4.55% 4.32% 3.91% 3.77% 3.64% 3.52% 3.37% 3.21% 2.98% 2.71%
Deferred income taxes 0.39% 0.92% 1.05% 0.77% 0.74% 0.67% 0.64% 0.62% 0.60% 0.57% 0.55% 0.51% 0.46%
Operating lease liabilities - - 6.31% 6.38% 6.25% 5.99% 5.66% 5.31% 4.96% 4.68% 4.46% 4.46% 4.52%
Other long-term liabilities 2.76% 2.59% 1.57% 1.48% 1.40% 1.30% 1.21% 1.11% 1.02% 0.96% 0.90% 0.89% 0.90%
Total liabilities 40.41% 40.32% 46.01% 40.63% 40.09% 39.24% 38.57% 37.82% 37.30% 36.76% 36.36% 36.39% 36.55%
Stockholders' equity:
Class A, Class B, Class C common stock36.31% 32.93% 31.23% 27.41% 23.74% 20.49% 17.64% 15.22% 13.19% 11.62% 10.41% 9.81% 9.52%
Accumulated other comprehensive income/loss-0.89% -1.69% -0.76% -0.67% -0.58% -0.50% -0.43% -0.37% -0.32% -0.28% -0.25% -0.24% -0.23%
Retained earnings 102.16% 98.59% 93.99% 99.21% 101.81% 102.26% 101.92% 101.33% 100.69% 101.12% 102.43% 107.44% 114.29%
Total stockholders' equity 137.57% 129.83% 124.46% 125.85% 124.79% 122.02% 118.87% 115.90% 113.26% 112.15% 112.28% 116.68% 123.23%
Total liabilities and stockholders' equity177.98% 170.15% 170.46% 166.48% 164.88% 161.26% 157.44% 153.72% 150.56% 148.91% 148.65% 153.07% 159.78%

Alphabet
Value Driver Estimation
Numbers denoted in millions
Fiscal Years Ending Dec. 31 2017 2018 2019 2020E 2021E 2022E 2023E 2024E 2025E 2026E 2027E 2028E 2029E
NOPLAT:
operating revenues 110,855 136,819 161,857 184,411 212,961 246,755 286,532 332,046 383,377 435,117 485,444 515,383 530,843
COGS 38,668 50,514 60,115 70,076 83,055 98,702 117,478 139,459 164,852 191,451 218,450 237,076 249,496
SG&A 19,765 23,256 28,015 33,194 38,333 46,884 54,441 63,089 72,842 82,672 92,234 97,923 100,860
Depreciation (combined starting 2020) 6,103 8,164 10,856 16,473 18,862 21,243 23,597 25,876 28,071 30,255 32,399 34,511 36,599
Amortization of Non-Goodwill Intangibles 812 871 925 - - - - - - - - - -
R&D expenses 16,625 21,419 26,018 30,428 35,139 40,715 47,278 54,788 63,257 71,794 80,098 85,038 87,589
Implied interest on operating leases 180 201 232 304 343 382 419 455 490 525 559 593 619
EBITA 29,062 32,796 36,160 34,544 37,916 39,594 44,157 49,289 54,845 59,469 62,822 61,428 56,918
Income Tax Provision 14,531 4,177 5,282 4,607 5,060 5,307 5,932 6,638 7,406 8,062 8,557 8,440 7,915
"+ tax shield on oper. least int." 36 32 38 49 55 61 67 73 79 85 90 95 100
"-tax shield on interest income" 210 1,349 890 193 217 260 305 359 421 494 574 658 739
"+ Tax shield effect on Gov't Fines" 550 796 280 - - - - - - - - - -
Total Adjusted Taxes 14,907 3,656 4,710 4,463 4,898 5,109 5,695 6,353 7,064 7,652 8,074 7,877 7,276
Change in Deferred taxes 258 778 173 (273) 140 77 194 219 238 203 154 (36) (163)
NOPLAT: 14,414 29,919 31,623 29,808 33,158 34,561 38,656 43,156 48,019 52,020 54,902 53,514 49,479
Invested Capital (IC):
Operating Current Assets
Cash and cash equivalents 1,189 1,854 2,053 3,624 6,437 9,437 13,037 17,226 22,159 27,514 33,234 38,653 43,741
Accounts receivable, net of allowance 18,336 20,838 25,326 29,148 33,661 39,002 45,289 52,483 60,597 68,775 76,729 81,461 83,905 Receivable under reverse repurchase
agreements - - - - - - - - - - - - -
Income taxes receivable, net 369 355 2,166 982 1,134 1,314 1,526 1,768 2,042 2,317 2,585 2,744 2,827
Inventory 749 1,107 999 1,292 1,492 1,729 2,008 2,326 2,686 3,049 3,401 3,611 3,719
Other current assets 2,983 4,236 4,412 4,535 5,046 5,771 6,540 7,414 8,389 9,487 10,649 11,860 12,966
Total Operating Current Assets 23,626 28,390 34,956 39,581 47,770 57,253 68,400 81,219 95,872 111,141 126,599 138,330 147,158
Non Interest-Bearing CL:
Accounts payable 3,137 4,378 5,561 5,818 6,719 7,785 9,040 10,477 12,096 13,729 15,316 16,261 16,749
Accrued compensation and benefits 4,581 6,839 8,495 5,534 6,512 7,844 9,294 10,733 13,127 15,244 17,665 20,396 23,148 Accrued expenses and other current
liabilities 10,177 16,958 23,067 24,895 28,750 33,312 38,682 44,826 51,756 58,741 65,535 69,577 71,664
Accrued revenue share 3,975 4,592 5,916 6,514 7,523 8,716 10,121 11,729 13,542 15,370 17,148 18,205 18,751
Deferred revenue 1,432 1,784 1,908 2,320 2,679 3,105 3,605 4,178 4,824 5,475 6,108 6,484 6,679
Income taxes payable, net 881 69 274 198 218 228 255 285 319 347 368 363 340
Total Non Interest-Bearing CL 24,183 34,620 45,221 45,280 52,400 60,991 70,998 82,228 95,664 108,904 122,140 131,286 137,332
Net Operating Working Capital (557) (6,230) (10,265) (5,700) (4,630) (3,738) (2,599) (1,010) 209 2,237 4,460 7,044 9,826
Plus: PPE (net) 42,383 59,719 73,646 85,173 96,311 107,068 117,471 127,595 137,524 147,269 156,870 166,358 173,760
Plus: Intangible Assets (net) 2,692 2,220 1,979 1,230 565 248 191 146 - - - - -
Plus: PV of operating leases 7,804 8,993 10,941 12,654 14,308 15,906 17,452 18,956 20,431 21,879 23,305 24,715 25,814
Less: Deferred revenue (non-current) 340 396 358 502 580 672 781 905 1,044 1,185 1,323 1,404 1,446
Invested Capital (IC): 51,982 64,305 75,943 92,855 105,973 118,812 131,734 144,783 157,119 170,199 183,312 196,712 207,954
Free Cash Flow (FCF):
NOPLAT 14,414 29,919 31,623 29,808 33,158 34,561 38,656 43,156 48,019 52,020 54,902 53,514 49,479
Change in IC 3,900 12,323 11,638 16,911 13,119 12,839 12,922 13,048 12,336 13,080 13,112 13,401 11,241
FCF 10,514 17,595 19,985 12,897 20,039 21,723 25,733 30,107 35,683 38,940 41,789 40,113 38,238
Return on Invested Capital (ROIC):
NOPLAT 14,414 29,919 31,623 29,808 33,158 34,561 38,656 43,156 48,019 52,020 54,902 53,514 49,479
Beg. IC 48,082 51,982 64,305 75,943 92,855 105,973 118,812 131,734 144,783 157,119 170,199 183,312 196,712
ROIC 29.98% 57.56% 49.18% 39.25% 35.71% 32.61% 32.54% 32.76% 33.17% 33.11% 32.26% 29.19% 25.15%
Economic Profit (EP):
Beg. IC 48,082 51,982 64,305 75,943 92,855 105,973 118,812 131,734 144,783 157,119 170,199 183,312 196,712
x (ROIC - WACC) 24.15% 51.73% 43.35% 33.42% 29.88% 26.78% 26.71% 26.93% 27.34% 27.28% 26.43% 23.36% 19.32%
EP 11,610 26,888 27,874 25,380 27,745 28,383 31,729 35,475 39,579 42,860 44,979 42,827 38,011

Alphabet
Weighted Average Cost of Capital (WACC) Estimation
Actual values as they appear
Cost of Equity: ASSUMPTIONS:
Risk-Free Rate 0.80% 10-year treasury bond
Beta 0.96 5yr weekly raw beta from damodaran link and Bloomberg
Equity Risk Premium 5.35% Damodaran's forward looking projections for October 2020
Cost of Equity 5.94%
Cost of Debt:
Risk-Free Rate 0.80% 10 yr US treasury
Implied Default Premium 1.78% 2030 yr corporate bond - risk-free rate
Pre-Tax Cost of Debt 2.58% YTM on 2060 Corporate bond from Bloomberg
Marginal Tax Rate 16%
After-Tax Cost of Debt 2.16%
Market Value of Common Equity: MV Weights
Total Shares Outstanding 688,335,000
Current Stock Price $1,593.01
MV of Equity 1,096,524,538,350 98.67%
Market Value of Debt:
Long-Term Debt 4,554,000,000
PV of Operating Leases 10,214,000,000
MV of Total Debt 14,768,000,000 1.33%
Market Value of the Firm 1,111,292,538,350 100.00%
Estimated WACC 5.89%
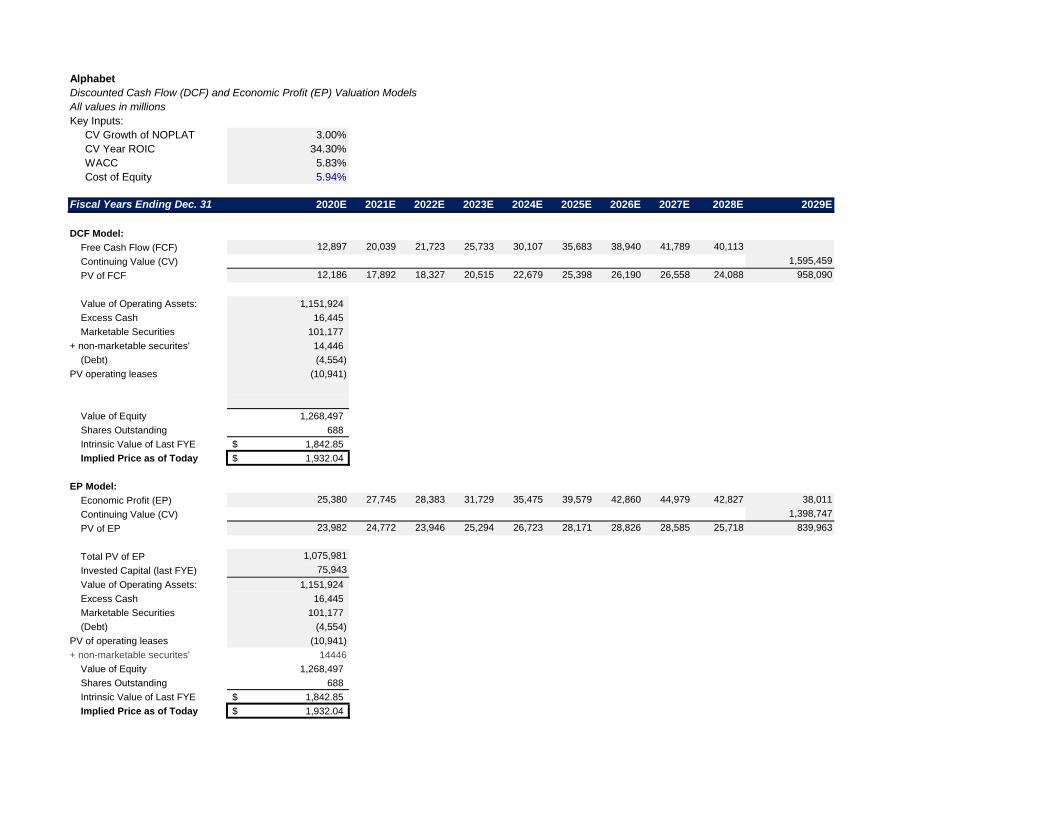
Alphabet
Discounted Cash Flow (DCF) and Economic Profit (EP) Valuation Models
All values in millions
Key Inputs:
CV Growth of NOPLAT 3.00%
CV Year ROIC 34.30%
WACC 5.83%
Cost of Equity 5.94%
Fiscal Years Ending Dec. 31 2020E 2021E 2022E 2023E 2024E 2025E 2026E 2027E 2028E 2029E
DCF Model:
Free Cash Flow (FCF) 12,897 20,039 21,723 25,733 30,107 35,683 38,940 41,789 40,113
Continuing Value (CV) 1,595,459
PV of FCF 12,186 17,892 18,327 20,515 22,679 25,398 26,190 26,558 24,088 958,090
Value of Operating Assets: 1,151,924
Excess Cash 16,445
Marketable Securities 101,177
+ non-marketable securites' 14,446
(Debt) (4,554)
PV operating leases (10,941)
Value of Equity 1,268,497
Shares Outstanding 688
Intrinsic Value of Last FYE 1,842.85$
Implied Price as of Today 1,932.04$
EP Model:
Economic Profit (EP) 25,380 27,745 28,383 31,729 35,475 39,579 42,860 44,979 42,827 38,011
Continuing Value (CV) 1,398,747
PV of EP 23,982 24,772 23,946 25,294 26,723 28,171 28,826 28,585 25,718 839,963
Total PV of EP 1,075,981
Invested Capital (last FYE) 75,943
Value of Operating Assets: 1,151,924
Excess Cash 16,445
Marketable Securities 101,177
(Debt) (4,554)
PV of operating leases (10,941)
+ non-marketable securites' 14446
Value of Equity 1,268,497
Shares Outstanding 688
Intrinsic Value of Last FYE 1,842.85$
Implied Price as of Today 1,932.04$

Alphabet
Dividend Discount Model (DDM) or Fundamental P/E Valuation Model
Fiscal Years Ending Dec.
31 2020E 2021E 2022E 2023E 2024E 2025E 2026E 2027E 2028E 2029E
EPS 44.80$ 49.21$ 51.62$ 57.71$ 64.59$ 72.07$ 78.46$ 83.29$ 82.16$ 77.06$
Key Assumptions
CV growth of EPS 3.00%
CV Year ROE 8.10%
Cost of Equity 5.94%
Future Cash Flows
P/E Multiple (CV Year) 21.4
EPS (CV Year) 77.06$
Future Stock Price 1,652.28$
theoretical Dividends Per Share -
Discounted Cash Flows - - - - - - - - - 983.31$
Intrinsic Value as of Last FYE 983.31$
Implied Price as of Today 1,030.91$

Alphabet
Relative Valuation Models
EPS EPS
Ticker Company Price 2020E 2021E P/E 20 P/E 21
FB Facebook $267.67 $8.09 $10.26 33.09 26.09
BIDU Baidu $130.70 $4.75 $6.64 27.52 19.68
TCTZF Tencent $76.64 $1.88 $2.27 40.77 33.76
MSFT Microsoft $202.68 $6.69 $7.36 30.30 27.54
APPL Apple $111.20 $3.24 $3.91 34.32 28.44
AMZN Amazon.com $3,311.37 $34.87 $45.48 94.96 72.81
Average 43.49 34.72
GOOG
L Alphabet $1,593.01 $ 44.80 $ 49.21 35.6 32.4
Implied Relative Value:
P/E (EPS20) $ 1,948.29
P/E (EPS21) 1,708.54$

Alphabet
Key Management Ratios
Fiscal Years Ending Dec. 31 2017 2018 2019 2020E 2021E 2022E 2023E 2024E 2025E 2026E 2027E 2028E 2029E
Liquidity Ratios:
Quick ratio 5.1 3.9 3.4 3.7 3.8 3.9 3.9 3.9 4.0 4.0 4.1 4.2 4.4
Current Ratio 5.1 3.9 3.4 3.8 3.9 3.9 3.9 4.0 4.0 4.0 4.1 4.3 4.4
Cash Ratio 4.2 3.2 2.6 3.0 3.1 3.1 3.1 3.2 3.2 3.3 3.3 3.5 3.7
Asset-Management Ratios:
Total Asset Turnover (Sales / avg Total assets) 0.97 1.05 1.12 1.14 1.14 1.12 1.11 1.10 1.09 1.06 1.03 0.97 0.91
Fixed Asset Turnover (sales / avg PPE) 2.89 2.68 2.43 2.32 2.35 2.43 2.55 2.71 2.89 3.06 3.19 3.19 3.12
Financial Leverage Ratios:
debt-equity ratio (Total Liab./SE) 29.37% 31.06% 36.97% 32.28% 32.12% 32.16% 32.45% 32.63% 32.93% 32.78% 32.39% 31.18% 29.66%
L-T Debt ratio (Long-Term debt / total assets) 2.01% 1.72% 1.65% 1.57% 1.52% 1.47% 1.42% 1.37% 1.31% 1.26% 1.22% 1.17% 1.13%
Profitability Ratios:
return on assets (net income / total assets ) 6.42% 13.20% 12.45% 10.04% 9.64% 8.93% 8.80% 8.70% 8.59% 8.33% 7.94% 7.16% 6.25%
net profit margin (net income / revenue) 11.42% 22.46% 21.22% 16.72% 15.90% 14.39% 13.85% 13.38% 12.93% 12.40% 11.80% 10.96% 9.98%
return on equity (net income / shareholders' equity) 8.30% 17.30% 17.05% 13.28% 12.74% 11.80% 11.66% 11.54% 11.41% 11.06% 10.51% 9.39% 8.10%
Payout Policy Ratios:
Dividend Payout Ratio (Dividend/EPS) 0.00% 0.00% 0.00% 0.00% 0.00% 0.00% 0.00% 0.00% 0.00% 0.00% 0.00% 0.00% 0.00%
Total Payout Ratio ((Divs. + Repurchases)/NI) 38.27% 29.53% 53.57% 0.60% 0.55% 0.52% 0.47% 0.42% 0.38% 0.34% 0.32% 0.33% 0.35%
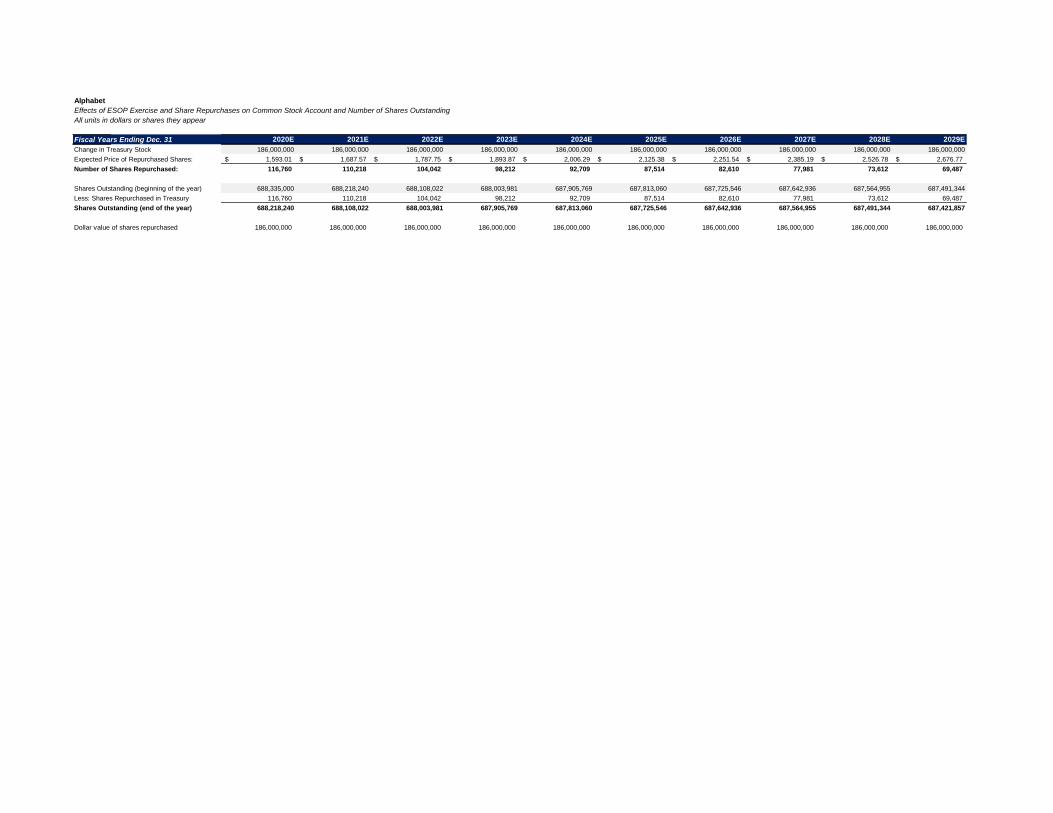
Alphabet
Effects of ESOP Exercise and Share Repurchases on Common Stock Account and Number of Shares Outstanding
All units in dollars or shares they appear
Fiscal Years Ending Dec. 31 2020E 2021E 2022E 2023E 2024E 2025E 2026E 2027E 2028E 2029E
Change in Treasury Stock 186,000,000 186,000,000 186,000,000 186,000,000 186,000,000 186,000,000 186,000,000 186,000,000 186,000,000 186,000,000
Expected Price of Repurchased Shares: 1,593.01$ 1,687.57$ 1,787.75$ 1,893.87$ 2,006.29$ 2,125.38$ 2,251.54$ 2,385.19$ 2,526.78$ 2,676.77$
Number of Shares Repurchased: 116,760 110,218 104,042 98,212 92,709 87,514 82,610 77,981 73,612 69,487
Shares Outstanding (beginning of the year) 688,335,000 688,218,240 688,108,022 688,003,981 687,905,769 687,813,060 687,725,546 687,642,936 687,564,955 687,491,344
Less: Shares Repurchased in Treasury 116,760 110,218 104,042 98,212 92,709 87,514 82,610 77,981 73,612 69,487
Shares Outstanding (end of the year) 688,218,240 688,108,022 688,003,981 687,905,769 687,813,060 687,725,546 687,642,936 687,564,955 687,491,344 687,421,857
Dollar value of shares repurchased 186,000,000 186,000,000 186,000,000 186,000,000 186,000,000 186,000,000 186,000,000 186,000,000 186,000,000 186,000,000

Alphabet
Sensitivity Tables
1,932.04 0.81 0.86 0.91 0.96 1.01 1.06 1.16 1932.04 0.65% 0.70% 0.75% 0.80% 0.85% 0.90% 0.95%
5.10% 1,917.01 1,920.83 1,924.64 1,928.46 1,932.27 1,936.08 1,943.70 5.53% 2,149.46 2,150.30 2,151.13 2,151.96 2,152.79 2,153.63 2,154.46
5.15% 1,917.61 1,921.47 1,925.32 1,929.17 1,933.02 1,936.87 1,944.56 5.63% 2,070.65 2,071.46 2,072.26 2,073.06 2,073.86 2,074.66 2,075.47
5.25% 1,918.83 1,922.76 1,926.68 1,930.61 1,934.53 1,938.46 1,946.29 5.73% 1,997.64 1,998.41 1,999.18 1,999.96 2,000.73 2,001.51 2,002.28
5.35% 1,920.04 1,924.04 1,928.04 1,932.04 1,936.04 1,940.04 1,948.03 5.83% 1,929.80 1,930.55 1,931.30 1,932.04 1,932.79 1,933.54 1,934.29
5.45% 1,921.25 1,925.33 1,929.41 1,933.48 1,937.55 1,941.62 1,949.76 5.93% 1,866.62 1,867.34 1,868.06 1,868.79 1,869.51 1,870.23 1,870.95
5.55% 1,922.46 1,926.62 1,930.77 1,934.91 1,939.06 1,943.20 1,951.49 6.03% 1,807.62 1,808.32 1,809.02 1,809.72 1,810.42 1,811.12 1,811.82
5.65% 1,923.68 1,927.90 1,932.13 1,936.35 1,940.57 1,944.79 1,953.22 6.13% 1,752.41 1,753.09 1,753.77 1,754.45 1,755.13 1,755.80 1,756.48
1932.04 31.3% 32.3% 33.3% 34.3% 35.3% 36.3% 37.3%
2.7% 1,793.92 1,797.78 1,801.41 1,804.82 1,808.05 1,811.10 1,813.98 1,932.04 44.00% 45.00% 46.00% 47.00% 48.00% 49.00% 50.00%
2.8% 1,832.75 1,836.88 1,840.77 1,844.43 1,847.89 1,851.15 1,854.24 13.10% 2,355.51 2,212.99 2,070.48 1,927.96 1,785.44 1,642.93 1,500.41
2.9% 1,874.23 1,878.66 1,882.82 1,886.74 1,890.44 1,893.94 1,897.25 14.10% 2,356.87 2,214.35 2,071.84 1,929.32 1,786.81 1,644.29 1,501.77
3.0% 1,918.64 1,923.38 1,927.84 1,932.04 1,936.01 1,939.75 1,943.29 15.10% 2,358.23 2,215.71 2,073.20 1,930.68 1,788.17 1,645.65 1,503.14
3.1% 1,966.30 1,971.39 1,976.17 1,980.66 1,984.91 1,988.92 1,992.71 16.10% 2,359.59 2,217.08 2,074.56 1,932.04 1,789.53 1,647.01 1,504.50
3.2% 2,017.59 2,023.04 2,028.16 2,032.98 2,037.53 2,041.83 2,045.89 17.10% 2,360.95 2,218.44 2,075.92 1,933.41 1,790.89 1,648.37 1,505.86
3.3% 2,072.94 2,078.78 2,084.27 2,089.43 2,094.31 2,098.92 2,103.28 18.10% 2,362.31 2,219.80 2,077.28 1,934.77 1,792.25 1,649.74 1,507.22
19.10% 2,363.68 2,221.16 2,078.64 1,936.13 1,793.61 1,651.10 1,508.58
Cost of Equity
1,932.04 5.53% 5.63% 5.73% 5.83% 5.93% 6.03% 6.13% 1,030.91$ 5.636% 5.736% 5.836% 5.936% 6.036% 6.136% 6.236%
31.30% 2,136.58 2,058.39 1,985.94 1,918.64 1,855.95 1,797.41 1,742.63 2.85% 1144.64 1096.46 1051.57 1009.66 970.44 933.68 899.15
32.30% 2,142.02 2,063.58 1,990.90 1,923.38 1,860.49 1,801.77 1,746.81 2.90% 1154.46 1105.16 1059.29 1016.51 976.52 939.07 903.93
33.30% 2,147.14 2,068.46 1,995.57 1,927.84 1,864.76 1,805.86 1,750.75 2.95% 1164.64 1114.17 1067.27 1023.59 982.80 944.63 908.85
34.30% 2,151.96 2,073.06 1,999.96 1,932.04 1,868.79 1,809.72 1,754.45 3.00% 1175.20 1123.51 1075.54 1030.91 989.28 950.37 913.93
35.30% 2,156.51 2,077.40 2,004.10 1,936.01 1,872.58 1,813.36 1,757.94 3.05% 1186.17 1133.20 1084.10 1038.48 995.98 956.30 919.17
36.30% 2,160.80 2,081.49 2,008.02 1,939.75 1,876.17 1,816.80 1,761.24 3.10% 1197.58 1143.26 1092.98 1046.32 1002.91 962.42 924.58
37.30% 2,164.87 2,085.37 2,011.72 1,943.29 1,879.56 1,820.05 1,764.36 3.15% 1209.44 1153.70 1102.19 1054.44 1010.08 968.75 930.16
CV
RO
IC
Beta
Eq
uity R
isk P
rem
ium
CV EPS ROIC
CV
NO
PL
AT
Gro
wth
WACC
CV
EP
S G
row
th
Risk Free Rate
WA
CC
CV COGS (%sales)
Ma
rgin
al T
ax R
ate
Related Documents