COMMUNICATION AT ICG: THE INTERNAL COMMUNICATION AUDIT AS AN INTEGRATED MEASURING INSTRUMENT by SAMANTHA WALT submitted in partial fulfillment of the requirements for the degree of MASTER OF ARTS WITH SPECIALISATION IN ORGANISATIONAL COMMUNICATION RESEARCH AND PRACTICE at the UNIVERSITY OF SOUTH AFRICA SUPERVISOR: PROF R BARKER JOINT SUPERVISOR: MS N SCHOONRAAD MARCH 2006

Welcome message from author
This document is posted to help you gain knowledge. Please leave a comment to let me know what you think about it! Share it to your friends and learn new things together.
Transcript
COMMUNICATION AT ICG: THE INTERNAL COMMUNICATION AUDIT AS AN INTEGRATED MEASURING INSTRUMENT
by
SAMANTHA WALT
submitted in partial fulfillment of the requirements for
the degree of
MASTER OF ARTS WITH SPECIALISATION IN ORGANISATIONAL COMMUNICATION RESEARCH AND PRACTICE
at the
UNIVERSITY OF SOUTH AFRICA
SUPERVISOR: PROF R BARKER
JOINT SUPERVISOR: MS N SCHOONRAAD
MARCH 2006


i
SUMMARY
Title COMMUNICATION AT ICG: THE INTERNAL COMMUNICATION
AUDIT AS AN INTEGRATED MEASURING INSTRUMENT By S. Walt Degree Submitted in partial fulfillment of the requirements for
the degree of Master of Arts
Subject MA with specialisation in organisational communication research and practice
Promoter Prof R Barker
Joint-promoter
Ms S Schoonraad
Summary Motivated and responsive employees ultimately translate into happy
customers, impacting on the bottom line. Attracting and retaining
employees is just as important as attracting and retaining customers.
Organisations are realising that employees must be treated as
internal customers and their needs must first be satisfied before the
needs of external customers can be addressed. One way to retain
employees is to continually evaluate and measure employee
perceptions of integrated internal communication. While the
Integrated Internal Communication (IIC) analysis proposed in this
study in no way replaces traditional communication audits or
integrated audits, it does propose a combination of the two. Adapting
externally focused integrated audits to evaluate the extent to which
integrated internal communication is practiced within an organisation,
adds an additional dimension to traditional communication audits.
The IIC analysis posits that before an organisation can be truly
customer-focused, an employee-centric approach needs to be
adopted.
Key
words
Internal communication, integrated communication, integrated
internal communication, communication audit, and integrated
measuring instruments.

ii
ACKNOWLEDGMENTS
I would like to thank the CEO and Marketing and Advertising Manager of ICG
for allowing me to use ICG as a case study.
My sincere thanks go to my supervisors Prof Rachel Barker and Ms Norle
Schoonraad for their insightful suggestions, guidance and encouragement.
I would also like to thank Ms Marie-Helene Bataille for her constant
support and quick responses.
Thank you to my husband and family for their kind support and
understanding.

iii
ABSTRACT
There is global agreement that in today’s business environment an integrated
approach to communication is a necessity. Although there is a need to evaluate
the application and quality of integrated communication, after almost 20 years of
existence, it is still viewed as a difficult concept to implement. Definitions of
integrated communication still vary, with no universal consensus. Although the
literature on communications does propose various implementation models for
evaluating integrated communication, these models are predominantly
marketing-related, with parameters pertaining to the customer-experience. As
such, these models have serious shortcomings when it comes to measuring the
employee-experience.
In this study, employee relationships are seen as the building blocks of the
strategic management of communication between an organisation and its
external publics. Recognising this significance of employee relationships two
decades ago, Cutlip, Center, and Broom (1985) proposed that no organisational
relationships are as important as those with employees. They advocated that the
first step in promoting positive external relationships is achieving good internal
communication. The central thrust is that employees who are truly customer-
focused need to work within an employee-centric environment. Customarily, the
traditional internal communication audit is used to evaluate the employee
environment, employee perceptions of communication and employee attitudes.
However, traditional audits have limitations when it comes to measuring
integration. Traditional audits do not evaluate the role of the employee in building
customer relationships, or the extent to which employees are integrated into an

iv
organisation. There is, therefore, a need to extend the traditional internal
communication audit, so as to evaluate integrated internal communication and its
application and quality.
Duncan (2001) maintains that integrated communication must first exist internally
if a company is to effectively communicate externally. Therefore, the primary
research objective of this study was to develop a measuring instrument (using
elements from existing audits and models) to evaluate integrated internal
communication. This entailed a literature review to determine the theoretical
status of the concept of integrated communication and internal communication. A
measuring instrument was then developed to evaluate integrated internal
communication. The second objective was to apply the developed instrument so
as to measure employee perceptions of communication at the International
Colleges Group (ICG). These perceptions were measured through a group
administered perception survey and personal interviews. Research results where
used to determine the extent of integrated internal communication at ICG in
accordance with four identifiable stages. Findings signifyed some success in the
first stage of integrated communication. However, there was no indication of
integrated communication in the later stages. The final objective was to test the
shortcomings of the proposed instrument.
.

v
TABLE OF CONTENTS
CHAPTER 1 Page INTRODUCTION AND CONTEXT OF STUDY 1.1 INTRODUCTION 1 1.2 MOTIVATION AND OBJECTIVES OF THE STUDY 2 1.3 BACKGROUND 5 1.3.1 History of ICG 5 1.3.2 The impact of change 6 1.3.3 The ICG mono-brand 6 1.4 RELEVANCE OF THE TOPIC 8 1.5 RELATIONSHIP OF THE STUDY TO THE
DISCIPLINE OF COMMUNICATION 9 1.6 EVALUATION CRITERIA AND KEY RESEARCH
QUESTIONS 10 1.7 RESEARCH METHODOLOGY 12 1.7.1 Research design 12 1.7.2 Data gathering 12 1.7.3 Sampling 13 1.7.4 Data analysis 14 1.8 LIMITATIONS OF STUDY 14 1.9 DEMARCATION OF CHAPTERS 14 1.10 CONCLUSION 15

vi
CHAPTER 2 THEORETICAL PERSPECTIVES ON INTEGRATED AND INTERNAL COMMUNICATION 2.1 INTRODUCTION 16 2.2 KEY CONCEPTS DEFINED 18 2.3 THEORETICAL UNDERPINNINGS 20 2.3.1 General systems theory 20 2.3.2 Limitations of systems theory 22 2.3.3 Contingency theory 23 2.4 INTEGRATED COMMUNICATION 25 2.4.1 The emergence of integrated communication 26 2.4.2 The role of IMC 28 2.4.3 The role of integrated communication 30 2.5 INTERNAL COMMUNICATON AS A MULTI-DIMENTIONAL
CONSTRUCT 32 2.5.1 Internal organisational climate 34 2.5.2 Communication climate 35 2.5.3 Employee satisfaction 36 2.6 INTEGRATED INTERNAL COMMUNICATION (IIC) 40 2.7 CONCLUSION 44 CHAPTER 3 COMMUNICATION MEASURING INSTRUMENTS: AN INTEGRATED APPROACH 3.1 INTRODUCTION 46 3.2 TRADITIONAL INTERNAL COMMUNICATION AUDITS 47

vii
Page
3.2.1 Historical overview of internal communication audits 48 3.2.1.1 The International Communication Association
(ICA) audit 49
3.2.1.2 Survey of Organisational Communication (SOC) 51
3.2.1.3 Information Systems Analysis (ISA) 52 3.2.14 Critical evaluation of traditional internal
communication audits 53
3.3 IC IMPLEMENTATION INSTRUMENTS 55 3.3.1 The Renaissance Communicator 56 3.3.2 Stakeholder Relations Model 57 3.3.3 Four stages in IC development 58 3.3.4 Duncan and Moriarty’s integration audit and mini-audit 61 3.3.5 Ten strategic drivers of integration 63 3.4 EVALUATING INTEGRATED INTERNAL COMMUNICATION 64 3.4.1 Five strategic internal drivers for integrated internal
communication 65 3.4.2 The four stages of integrated internal communication 68 3.5 PROPOSED INTEGRATED INTERNAL COMMUNICATON
(IIC) ANALYSIS 71 3.5.1 Applying the five evaluation criteria to IIC 73 3.5.1.1 Cross-functional planning and monitoring 73
3.5.1.2 Mission marketing 73
3.5.1.3 Data-driven 74
3.5.1.4 Employee-centric 75
3.5.1.5 Strategic consistency 75
3.6 CONCLUSION 76

viii
CHAPTER 4 RESEARCH METHODOLOGY 4.1 INTRODUCTION 77 4.2 RESEARCH OBJECTIVES 77 4.3 RESEARCH STRATEGY 78 4.3.1 Research paradigm 79 4.3.2 Triangulation 81 4.3.3 Pilot study 82 4.4 SAMPLING DESIGN 83 4.5 RESEARCH METHOD 84 4.5.1 Group administered communication perception survey 84
4.5.1.1 Selection 84
4.5.1.2 Method followed 85
4.5.1.3 Group administered perception survey format 86
4.5.1.4 Measurement levels 89
4.5.1.5 Measurement rating, ranking and categorisation scales 89
4.5.1.6 Data analysis 90
4.5.1.7 Validity 92
4.5.1.8 Reliability 92 4.5.2 Personal Interviews 93
4.5.2.1 Selection 95
4.5.2.2 Personal interview format 96
4.5.2.3 Data analysis 97 4.5.2.4 Validity 98
4.5.2.5 Reliability 98 4.6 ETHICAL CONSIDERATIONS 99 4.7 CONCLUSION 99
ix
CHAPTER 5 DATA ANALYSIS AND RESEARCH RESULTS
5.1 INTRODUCTION 101 5.2 RESEARCH FINDINGS: GROUP ADMINISTERED
PERCEPTION SURVEY 101 5.2.1 Summary of quantitative results 116
5.2.2 Qualitative analysis of employee perception survey 117 5.2.3 Summary of qualitative survey results 128 5.3 PERSONAL INTERVIEWS 129 5.3.1 Summary of quantitative results: personal interviews 138 5.4 CONCLUSION 140 CHAPTER SIX CONCLUSIONS AND RECOMMENDATIONS 6.1 INTRODUCTION 141 6.2 INTEGRATED INTERNAL COMMUNICATION AT ICG 141 6.3 LIMITATIONS OF THIS STUDY 147 6.4 RECOMMENDATIONS FOR FUTURE RESEARCH 148 6.5 CONCLUSIONS AND FINDINGS 148 6.6 INEGRATED INTERNAL COMMUNICATION (IIC) ANALYSIS
AS AN INTEGRATED MEASURING INSTRUMENT 149 6.7 CONCLUSION 150
SOURCES 151

x
LIST OF FIGURES
Page Figure 2.1: The role of IIC within a changing environment 41 Figure 3.1: Four stages of IC evolution within organisations 59 Figure 3.2: Parallel between marketing concepts as applied to managing employees as internal customers 64 Figure 3.3: Strategic drivers of integrated communication 68 Figure 3.4: Instrument for evaluating integrated internal communication 72 Figure 5.1: Overall how satisfied are you with communication
at ICG? 102 Figure 5.2: Which best describes your impressions of
communication at ICG? 103 Figure 5.3: How do you feel about the information you receive
from management? 104 Figure 5.4: How satisfied are you with communication
received from management? 105 Figure 5.5: How well do you know the company? 106 Figure 5.6: Compared to last time this year are you more or
less informed about ICG’s strategic goals and direction? 107
Figure 5.7: Information wanted by employees 108 Figure 5.8: How much of news@ICG do you read? 109 Figure 5.9: Overall evaluation of news@ICG 109 Figure 5.10: Current top employee information sources 110

xi
Figure 5.11: Preferred source of information 111 Figure 5.12: How well do you know ICG’s vision, mission
and values? 112 Figure 5.13: Do you contribute to the overall success of ICG? 113 Figure 5.14: ICG cares about its employees 113 Figure 5.15: How long have you worked at ICG? 114 Figure 5.16: What is your gender? 115 Figure 5.17: Who participated in the survey? 115 Figure 5.18: Perceived communication problem areas 120 Figure 5.19: What needs to change for improved performance
and efficiency? 123 Figure 5.20: If made CEO for one day, what changes would
you make? 127 Figure 5.21: Summary of qualitative analysis 129 Figure 5.22: To what extent is employee information and
behaviour captured and used as a strategic tool to enhance internal communication at ICG? 130
Figure 5.23: Does ICG’s internal mission marketing develop a positive feeling of personal identity between employees and the company? 132
Figure 5.24: Does ICG communicate the same core values and brand messages of the company through every aspect of the employee experience? 134
Figure 5.25: Does ICG’s internal structure create silos or departmentalisation? 136
Figure 5.26: Does ICG build long term relationships with its employees? 137
Figure 5.27: Summary of quantitative personal interview results 139

xii
LIST OF TABLES
Page
Table 2.1: The differences between IMC and IC 18 Table 4.1: Key differences between quantitative and qualitative
research 79 Table 4.2: Aim of survey questions linked to evaluation criteria 87 Table 4.3 Personal interview questions linked to key
criteria/drivers 94 Table 4.4: Personal interview schedule 97 Table 5.1: Summary of quantitative data 116 Table 5.2: Summary of qualitative survey results 125 Table 5.3: Criticism of web-based technology 130 Table 5.4: Positive comments pertaining to values launch 132 Table 5.5: Negative comments pertaining to values launch 133 Table 5.6: Qualitative comments pertaining to strategic
consistency 135 Table 5.7: Qualitative comments pertaining to organisational
structure 136 Table 6.1: Four stages of integrated internal communication linked to five strategic drivers 142

xiii
APPENDIX
Page Appendix 1: Group administered perception survey 160 Appendix 2: Interview questions 165 Appendix 3: Specific categories for open-ended questions 168 Appendix 4: Content analysis example: specific
categories and syntactical units 171

xiv
1
CHAPTER ONE
INTRODUCTION AND CONTEXT OF STUDY
1.1 INTRODUCTION
Experienced employees with specialised skills and knowledge are in demand,
and retaining these employees is vital. Recognising the importance of human
capital has led companies to change their paradigms about people
management. Ho (2001:2) maintains that companies can no longer treat
employees as a resource whose primary function is to produce goods.
Instead, employees should be seen as important stakeholders who make
valuable contributions that often impact on the bottom line. Many companies
are realising that motivated and responsive employees might ultimately
translate into happy customers. Attracting and retaining a company’s internal
stakeholders is just as important as attracting and retaining customers. The
logical step is to treat employees as internal customers.
Scholes and Clutterbuck (1998:229) contend that employees are pivotal in the
process of balancing the needs of different stakeholder audiences. They
predict that internal and external communications will consequently become
so closely aligned that they will be carried out by the same people, and that
the internal dimension may even become the more significant. Managers are
starting to realise that employees as internal customers must be satisfied
before the needs of external customers can be addressed. In that regard,
Duncan and Moriarty (1997a:10) recognise that every department and
function within an organisation has a communication dimension, and that all
messages, both internal and external, must be aligned with the corporate
brand of the organisation. Everything an organisation communicates (or fails
to communicate) sends a brand message to internal and external
stakeholders.

2
According to a study cited in Ho (2001:2), closed communication ranked as
one of the primary reasons for employees leaving the company and taking on
new jobs. Employees cited feeling disempowered and not being listened to as
major sources of dissatisfaction. In today’s networked economy employees
are used to receiving more information than in the past, and this extends to
information expectations in the workplace. Ho (2001:3) thus suggests that
organisations that want to survive need to re-evaluate the role of
communication and to find ways of creating an emotional connection with
employees through effective communication that is targeted, customised and
integrated. Organisations then have the challenge of evaluating and
measuring employee perceptions of these communication efforts.
1.2 MOTIVATION AND OBJECTIVES OF THE STUDY
Organisations are strongly affected by the changing environment and as they
transform, communication strategies need to change so as to reflect the
organisations’ business objectives. This study is based on research
undertaken at International Colleges Group (ICG), which has undergone a
great deal of change over the past three years. Changes at the company
include new acquisitions, expansion, structural changes, increased customer
demands, new competition and the changing nature of their products.
According to Duncan and Moriarty (1997:3a), change of this nature not only
widens relationship gaps with stakeholders, but often results in problems with
an organisation’s internal and external communication when it comes to
consistency and alignment with the corporate brand. In today’s increasingly
competitive marketplace, organisations are realising the importance of
measuring and evaluating their integrated communication efforts. There is no
generally accepted definition of integrated communication but at a minimum it
refers to consistent messages. In the absence of a generally accepted
definition, the concept of integrated marketing communication (IMC) is a
useful starting point for a discussion of integrated communication (IC). The
reason being that IMC (for example, advertising, sales promotion, product
publicity, direct marketing and so on) according to Hanekom (2006:241), does
play a role in centralising marketing communication messages. However,
3
IMC plays a limited role in determining and implementing truly integrated
communication in an organisation.
According to Angelopulo and Barker (2005:107), there is global agreement
that if organisations want to flourish in today’s business environment, an
integrated approach to marketing communication is a necessity. They argue
that if IMC is indeed a necessity, it follows that there is a need to evaluate its
application and quality.
Theorists and proponents of integrated marketing communication strive to
implement the communication of an organisation as a seamless whole. The
American Productivity and Quality Center Best-practice Report (1998)
describes integrated marketing communication as a strategic-business
process used to plan, develop, execute and evaluate coordinated and
measurable brand communication programmes over time with customers,
consumers, employees and other relevant stakeholders. According to this
report, integrated marketing communication employs a variety of traditional
and non-traditional communication tools and methods to deliver messages to
customers, stakeholders and other important audiences in a coordinated way,
so as to achieve synergy and consistency. The ultimate goal of integrated
marketing communication is to institute customer-oriented sensibilities and
business processes throughout the organisation and its operations, so as to
add value for customers. The report, however, does not directly address the
role of employees in the organisation.
According to Christensen and Cheney (2005:7) the term IMC refers to the
notion that all parts of a successful organisation derive their identity and
legitimacy from an orientation towards the external market. Accordingly, the
term IMC tends to assume a priori that integration only takes place by way of
marketing or that it is primarily marketing-related parameters that are
integrated. Christensen and Cheney (2005:7) propose using the term IC
rather than IMC. IC purports to address a broader audience than just
customers. This study focuses on IC (Caywood 1997; Gronstedt 2000;
Kitchen & Schultz 2000; Niemann 2005) and not IMC, which the literature

4
review of this study shows was the preferred term before the late 1990s. The
term IC, as adopted in this study from this point forward, includes, but goes
beyond, marketing parameters. IC is thereby seen as an extension of, and
broader view of, IMC.
While Duncan and Moriarty’s (1997a:64) model of integration with ten
strategic drivers of brand value (relationship building, stakeholder focus,
strategic consistency, interactivity, market mission, zero-based planning,
cross-functionality, core competencies, data-driven, and integrated agency)
offers significant benefits, a valuable conceptual framework and an
implementable set of operational criteria, the model’s primary focus is on
marketing and building the brand process externally (Angelopulo & Barker
2005:108). There is no focus on employee communication, one of a number
of important aspects of IC.
In this study the customer-centric focus of integrated communication shifts to
the employee experience. The employee experience refers to the extent to
which employees feel listened to, valued, informed and empowered. An
employee-centric organisation facilitates the employee experience. However,
in order to measure the extent of integrated internal communication,
integrated concepts focusing on customer experience (Duncan 2001; Duncan
& Moriarty 1997a, 1997b; Schultz & Schultz 1998) have been adapted and
applied so as to measure employee experience. Integrated Internal
Communication (IIC) is concerned with aligning the corporate brand with all of
an organisation’s internal communication efforts. This study maintains that
there are a number of parallels between the concepts and drivers used to
evaluate the customer experience and concepts used to manage the
employee experience.
According to Du Plessis and Schoonraad (2006:374), a number of methods
and techniques have been developed to measure and evaluate IMC, but there
are few methods and techniques to measure and evaluate IC. In the case of
ICG, a traditional internal communication audit might well provide the
necessary data on employee attitudes and perceptions and also on actual
communication behaviour. However, the traditional communication audit does

5
have shortcomings (as discussed in section 1.5 and 3.2.1.4) when it comes to
measuring integrated internal communication and its alignment with the
corporate brand.
In light of the above, the objectives of this study are to:
• develop a measuring instrument, using elements of existing audits, to
evaluate integrated internal communication (IIC).
• use the developed instrument to evaluate and measure employee
perceptions of communication efforts at ICG Cape Town over the
period 1 September 2004 – 31 August 2005.
• use these research results to determine the extent to which integrated
internal communication is practiced at ICG.
• to test the shortcomings of the proposed instrument.
1.3 BACKGROUND Research for this study was undertaken at the International Colleges Group
(ICG), which has experienced rapid growth over the past few years.
1.3.1 History of ICG ICG is the largest private distance-learning provider in South Africa, servicing
more than 300 000 learners a year. 90% of ICG learners are South African,
serviced through the group’s 12 brands. ICG is a Naspers subsidiary and part
of Via Afrika. Some ICG brands include INTEC College, Success Career
College, Lyceum Advancement College, Damelin Correspondence, the
Academy for Maths and Science, The Michegan Ross School of Business and
INTEC Mozambique. ICG’s head office is located in Cape Town, with smaller
sales offices in Johannesburg, Durban, Port Elizabeth and Pretoria. In total,
ICG head office has a staff base of 320 employees.

6
International Correspondence School (ICS) began in the United States in
1896, opening a division in Cape Town in 1906. In 1988 ICS changed
ownership and became locally incorporated. It was renamed INTEC College.
The name of the holding company was later changed to the International
Colleges Group (ICG), which owns the INTEC brand.
1.3.2 The impact of change
Recent growth into new markets and the move into new areas of operation
have resulted in ICG expanding its workforce rapidly over the past two years
in order to support a multi-disciplined, multi-branded organisation. Acquiring
new brands and maintaining this upward pace of growth have risks attached.
Rapid growth, for example, might result in a loss of focus, failure to
communicate and a demotivated workforce.
In 2004 ICG expanded from three companies to 12, with a 19% increase in
student numbers. As a result, new employees joined the group to manage
these brands. A number of organisational shifts accompanied this expansion,
including a number of senior employee resignations and new appointments
company-wide.
1.3.3 The ICG mono-brand
In September 2004 management at ICG decided to unify individual brands
and colleges internally under the ICG mono-brand. As a result an internal
communication drive was piloted to Cape Town based employees, to explain
the mono-brand. Sales offices based in Johannesburg, Durban, Port Elizabeth
and other small towns have received limited exposure to the ICG mono-brand.
Prior to the internal marketing drive, employees were loyal to individual
colleges or brands, and functioned autonomously within the organisation.
Employees, essentially, operated as separate colleges with no unified outlook.
Internally, employees were committed to, and aligned themselves exclusively
with, individual brands, functioning in silos, and often competed against one
7
another. Furthermore, within each college, departments operated in isolation,
with little cross-functional knowledge or teamwork. The goal, therefore, was to
unite all employees from the various colleges under the ICG brand. The brand
promise made to employees included:
ICG’s vision: Together, we make learning part of living!
ICG’s mission: Leading the way in customising learning solutions.
ICG’s values: Innovation; realness through integrity; respect;
achievement and enjoyment.
ICG’s rule: First think the impossible, then work back to reality, not
the other way around.
Duncan and Moriarty (1997a:3) suggest that the increase in mergers and
acquisitions, resulting in the assimilation of inherited employees into a new
organisational environment. Together with expansions of the global
marketplace and growing competition among internal departments,
relationship gaps have never been greater than they are today. Recognising
internal relationship gaps, the new Chief Executive Officer (CEO) of ICG, Rob
Bartosch, earmarked internal communication as an area of priority for 2006.
Formerly the marketing and operations director of ICG, Bartosch was
appointed as CEO in January 2005. Bartosch believes that embracing change
will lead to progress, ultimately ensuring that ICG plays a major role in the
business of the future. To demonstrate the CEO’s commitment to internal
communication, the following quote as been cited. “However, amidst this
change,” says Bartosch (2005), “it is vital that our basis should be solid,
clearly understood and truly lived within our organisation. Each ICG employee
needs to understand how he/she fits into and contributes to the success of our
organisation and makes a difference not only within ICG but to South African
education as a whole. I believe that for ICG to become a truly great company,
our students and all staff need to be really proud of being associated with
ICG.”

8
1.4 RELEVANCE OF THE TOPIC
According to Christensen and Cheney (2005:2), developing unified
communication that transcends disciplinary demarcations has become a
priority of most communication disciplines. Smith (1994:64) indicates that non-
integrated or disintegrated communication sends out disjointed messages to
both internal and external audiences. According to Christensen and Cheney
(2005:4), corporate communication maps out all the internal and external
communication dimensions relevant to the projection of a coherent image of
the organisation in its surroundings.
Internal communication dimensions might include tools used to communicate
with employees such as newsletters, the intranet, noticeboards, printed
documents and face-to-face interactions. An organisations’ brand values and
culture thereby permeate through all aspects of an organisations internal
communication. As internal communication is incorporated into organisational
norms, each employee within an organisation needs to understand that the
“brand” is not the responsibility of one department. From leaders to
managers, back-office to receptionist, it works across the business and is
every employee’s responsibility. The different forms of corporate internal and
external communication are brought into some unity or shared whole through
IC (Christensen & Cheney 2005:1).
Brown (1996:245) argues that IC should answer the question of whether
employees with a better understanding of brand values deliver better
customer service. According to Duncan and Moriarty (1997a:66), auditing an
organisation’s internal processes can uncover major inefficiencies and
integration gaps. Duncan (2001:30) maintains that IC must first exist internally
if a company is to communicate effectively externally. To this end, Duncan
and Moriarty (1997a:23) acknowledge the role of every employee as a
corporate brand ambassador and the extent to which every employee needs
to support the corporate brand in everything that is said and done.

9
To measure integrated internal communication at ICG an Integrated Internal
Communication (IIC) analysis was developed and applied in this study. This
IIC analysis is a multi-tiered audit, combining adapted elements from
traditional internal communication audits, enhanced by aspects of Duncan and
Moriarty’s (1997a) ten strategic drivers and broader research in the field of
integration (Angelopulo & Barker 2005; Duncan 2001; Duncan & Moriarty
1997a, 1997b). The IIC analysis was developed for internal use, so as to
address the gaps in traditional auditing methods and explore the value of
employees as communicators and supporters of the organisation’s corporate
brand.
1.5 RELATIONSHIP OF THE STUDY TO THE DISCIPLINE OF COMMUNICATION According to Kopec (1982:24), a communication audit can be defined as a
complete analysis of an organisation's internal and/or external
communications. A communication audit is designed to 'take a picture' of
communication needs, policies, practices and capabilities, and to uncover
necessary data to allow top management to make informed, economical
decisions about the future objectives of the organisation's communication.
Since the development of the International Communication Association (ICA)
audit in 1976, traditional internal communication audits have been used
extensively (Tourish & Hargie 1996:39). However, today, this audit and
subsequent versions (DeWine & James 1988; Tourish & Hargie 1996) fall
short in addressing the demands of the changing business environment. The
ICA audit and other versions are difficult to understand, long-winded, costly
and time consuming. The qualitative questions in adapted versions of the ICA
audit are rigidly structured and intimidating. Quantitative questions with dual-
column formatting are confusing and daunting. The length of the ICA audit
and amended versions do not fit in with today’s fast paced business
environment. This study proposes, that surveys using language that is simple,
easily accessible, with a clear layout (for example the layout found in an
online communication survey) might result in better response rates.

10
The proposed IIC analysis perception survey draws from existing traditional
communication audits and evaluation scales but aims to present a simplified,
shorter, hard-copy version, with a fresh “online” look. In this study the term
“audit” is replaced with the term “analysis”. DeWine and James (1988:147)
describe the term “audit” as a misnomer indicating a financial assessment,
often heightening employee resistance to partake in procedures. The
integrated mini-audit and integrated in-depth audit presented in Duncan
(2001:727) both evaluate a number of processes that do not specifically apply
to internal communication. Duncan’s integrated mini-audit consists of 20
quantitative questions, and is considered to be a quick test to measure levels
of integration. Duncan’s integrated in-depth audit is a lengthy procedure,
consisting of open-ended questions, which take between 60 and 90 minutes
per interview. The interview questions are qualitative, which can prove
difficult to evaluate and measure.
What differentiates the personal interviews used in the proposed IIC analysis
is that they combine Duncan’s integrated mini and in-depth audits, thereby
allowing for some closed and some open-ended questions. The personal
interview questions used in the proposed IIC analysis have been adapted to
focus specifically on integrated internal communication criteria. Aspects of the
two audits are combined with a specific focus on internal communication.
Drawing from Duncan’s (2001:727) integrated mini-audit format, the length of
personal interviews in the IIC analysis were considerably reduced to
approximately 30 minutes per interview.
1.6 EVALUATION CRITERIA AND KEY RESEARCH QUESTIONS Using the theoretical framework of Duncan and Moriarty’s (1997a:15) ten
strategic drivers and broader research in the field of integration this study has
developed a set of criteria for the evaluation of integrated internal
communication (Angelopulo & Barker 2005; Caywood 1997; Gronstedt 2000;
Kitchen & Schultz 2000; Niemann 2005 and Schultz & Schultz 1998).

11
In line with the study conducted by Angelopulo and Barker (2005:108), five
internal integration criteria of evaluation have been identified, with assigned
values. The values assigned to each of the criteria are: employee-centrism
(20%); data-driven (20%); strategic consistency (20%); marketing the mission
(20%) and cross-functional planning (20%). As pointed out by Angelopulo and
Barker (2005:109), Duncan and Moriarty’s model (1997a) does not give
specific weightings or values to identified integration criteria. In this study, as
in the Angelopulo and Barker (2005) study, the weightings allocated to each of
the five key internal integration criteria are seen as equally important. This
forms part of the foundational argument of IC, in that all communication is
seen as contributing equally to the synergy of an organisation.
Each of the five integration internal criteria with related research questions:
Research question one: Cross-functional planning and monitoring
Does ICG’s structure create functional divisions and departmentalisation?
Research question two: Mission marketing
Does ICG’s internal mission develop a positive feeling of identity between
employees and the company?
Research question three: Become data-driven
Does ICG’s data-driven approach add to the employee experience and
enhance communication?
Research question four: Employee-centrism
Does ICG apply employee-centric concepts by listening to, informing, valuing
and empowering employees?
Research question five: Maintain strategic consistency
Does ICG communicate the same core values of the company through every
aspect of the employee’s experience, regardless of rapid growth?

12
1.7 RESEARCH METHODOLOGY This objective of this study is exploratory in nature. According to Du Plooy
(2001:48) an exploratory study allows for new insights, identifies
consequences of communication problems, and confirms or denounces
existing assumptions about communication. Research in this study used a
combined quantitative and qualitative research paradigm, or what is known as
a triangulated approach.
1.7.1 Research design
The research design of this study is qualitative. Mouton (2001:53) indicates
that an empirical question asks something about the world, in this instance
communication at ICG. Mouton (2001) indicates that in order to resolve an
empirical question it is necessary to either collect new data or analyse existing
data. An exploratory research design is appropriate to this study as it allows
for flexibility and facilitates understanding of existing data or unknown areas of
research. In order to meet the objectives of this study it is necessary to
measure integrated internal communication at ICG. As this study is
exploratory in nature, it allows for flexibility in generating new research
questions and problems.
1.7.2 Data gathering
The first instrument in the proposed IIC analysis is a group administered
communication perceptions survey broadly based on traditional internal
communication audits with open and closed-ended questions. The group
administered perception survey evaluates employee perceptions of internal
communication efforts and the extent to which ICG is employee-centric. This
is measured by evaluating the extent to which employees feel listened to,
valued, informed and empowered. Qualitative questions focus on
communication problem areas, such as internal efficiency and cultivating
relationships.

13
The second instrument in the proposed IIC analysis is a series of personal
interviews. The personal interviews are based on an adaptation of Duncan’s
(2001:727) mini-audit, which focuses on relevant internal drivers, as well as,
new tools proposed by Ho (2001), so as to determine levels of integrated
internal communication at ICG. The personal interviews are a series of on-site
interviews consisting of closed-ended (quantitative) and open-ended
(qualitative) questions. Specifically the instrument aims to measure levels of
integration within the organisation pertaining to cross-functional planning, the
existence of a data-driven approach, strategic consistency, mission marketing
and employee-centricity.
1.7.3 Sampling The unit of analysis for the purpose of this study is employees based at ICG’s
head office in Cape Town. Data was collected by conducting a series of group
administered surveys. Employees who participated in the group administered
surveys included all ICG employees at the Cape Town head office. As a result
of growth and a number of new appointments, many of the employees who
participated were not exposed to the internal communication drive which
occurred in the period September, 2004 to August 31, 2005. The aim of the
communication drive was to unify individual brands and colleges under the
ICG mono-brand. Of the 320 employees at the Cape Town head office, 254
participated in the group administered surveys and these surveys were carried
out over a two-week period. Approximately 30 employees attended each
session.
Selection for personal interviews was guided by purposive sampling in an
attempt to reach a cross sample of employees at middle to senior levels who
had relevant exposure to the inner workings of the organisation. Fourteen
personal interviews with employees took place over a two-day period.

14
1.7.4 Data analysis Cooper and Schindler (2003:25) distinguish between rating scales, ranking
scales and categorisation scales. In this study various types of quantitative
rating scales, category scales, multiple choice response scales and rank order
scales have been custom-designed. Qualitative answers were coded and
electronically captured so as to identify process gaps and show common
patterns.
1.8 LIMITATIONS OF THE STUDY
Selection and subsequent data-gathering was not extended to include ICG
employees based in national sales offices and call centres across the country.
In total, ICG’s staff base consists of approximately 640 employees (many of
which are contract workers), and approximately 50% of these employees are
based in Cape Town. The exclusion of employee participation at national
offices is a serious limitation, impacting on the validity of this study. The
decision to exclude national employees was made by the CEO, who felt that
national sales and call centres had not been sufficiently exposed to the
internal marketing drive, so as to warrant a true reflection. This study is
therefore limited to Cape Town based employees situated at the ICG head
office. Another barrier was the absence of existing integrated communication
measuring instruments on which to base this study.
1.9 DEMARCATION OF CHAPTERS
In Chapter 2, key concepts are defined and the theoretical assumptions of
integration are related to internal communication. Chapter 3 consists of a
literature review of the history, role, benefits and limitations of traditional
internal communication audits and IC audits, as well as a discussion of them.
In order to meet the first objective of this study, a measuring instrument is
developed using elements of these existing audits. A combination of elements
from traditional and IC audits gives birth to the Integrated Internal
Communication (IIC) analysis, an evaluation instrument adapted for internal

15
use. In Chapter 4, the methodology surrounding the second and third
objectives of this study is outlined. The research paradigm, strategy and
methods used are discussed.
In Chapter 5, numerical and verbal data collected from the group administered
perception survey and one-on-one mini interviews are statistically analysed
and interpreted so as to identify meaningful patterns pertaining to integrated
internal communication at ICG (objective two).
Finally, in Chapter 6, research results are measured against the four stages of
IC evolution devised by Schultz and Schultz (1998) so as to assess the stage
of integrated internal communication at ICG (objectives three and four).
Concluding observations are made, including shortcomings and
recommendations.
1.10 CONCLUSION Organisations are realising that employees should not be seen primarily as
resources. Rather, employees should be seen as important internal
stakeholders with a direct impact on the bottom line. Creating an employee-
centric environment enables employees to feel secure, motivated and
empowered to understand and best serve customer and other stakeholder
needs. One way to build an employee-centric environment and thus retain
employees is to continually evaluate and measure employee perceptions of
integrated internal communication.
In the next chapter the concepts of internal communication and integrated
communication are discussed. Together these concepts give rise to integrated
internal communication. In this study integrated internal communication is
seen as an evolutionary process. The skills, processes and practices of
integrated internal communication develop over a period of time and in step
with an organisation’s own transitions over time.

16
CHAPTER TWO
THEORETICAL PERSPECTIVES ON INTEGRATED AND INTERNAL COMMUNICATION
______________________________________________________________
2.1 INTRODUCTION
Effective communication can be seen as the foundation of modern
organisations (D’Aprix 1996; Grenier & Metes 1992; Witherspoon 1997).
Organisations are strongly affected by their environments, and worldwide are
in continual flux, exposed to a number of environmental changes, which over
the past two decades have given rise to a new kind of organisation that is
more brand aligned than ever before. In order to survive, modern brand
aligned companies inspire employees to value the brand they work for in a
way that is personally motivating for the individual and also results in bottom-
line benefits for the organisation (Overman 2006).
According to Smit and Cronjè (2002: 461), some challenges faced by modern
organisations include globalisation; technological advances; building
relationships with internal and external stakeholders; new workforce
structures; increased customer power and demands; the importance of
continual learning and of intellectual capital; and the new roles and
expectations of workers. Change has become an inherent part of business
and in order to survive organisations need to somehow anticipate change and
then respond to it. According to Lee (2005), the means by which an
organisation copes with its external environment is through strategy.
Individuals and teams in an organisation seeking to implement strategy must
understand not only the strategy itself but the reasons for it, and must also be
able to measure its success. Only an internal communication system
anchored in the company’s external environment can provide this information
in a compelling and relevant way.

17
The scope of this chapter encapsulates the essence of systems and
contingency theory in relation to organisations and the environment. Internal
communication and integrated communication, as key concepts of this study,
are defined and identified, with a historical account of how they came about,
and what these concepts might mean in the future.
2.2 KEY CONCEPTS DEFINED
The total organisation is articulated from a systems approach, whereby
members think of all organisational processes, activities, functions and
interactions with the environment as part of a system of interrelationships
(Robbins, Odendaal & Roodt 2001:418). This means unity of effort, unity of
purpose, unity of process, unity of goal and unity of action (Duncan & Moriarty
1997a:23). Integration denotes the interrelationship of the whole system with
its parts.
There are a number of overlapping definitions for integrated marketing
communication (IMC) and integrated communication (IC). According to Swain,
Zatepilina, Chmiola, Hua, Moceri & Dev (2001), IMC is weak in terms of
definition.
At the most basic level, IMC is a process for managing the customer
relationships that drive brand value. More specifically, Duncan (2001:8)
defines IMC as a cross-functional process for creating and nourishing
profitable relationships with customers and other stakeholders by strategically
controlling or influencing all messages sent to these groups and encouraging
data-driven, purposeful dialogue with them.
Integrated communication (IC) can be thought of as the bringing together of
different forms of internal and external communications into some unity or
shared whole, within which differences are allowed to coexist to the extent
that they do not challenge the identity of the integrating unit (Christensen &
Cheney 2005:1). Hanekom (2006:242) emphasises the need for coordination,
harmonisation and integration of all forms of internal and external

18
communication in any organisation. Integrated communication is the key
process that influences the behaviour, attitudes, opinions and perceptions of
the target audience.
Whereas proponents of IMC regard coordinating various aspects of the
marketing mix as integrative, scholars of integrated communication envision
integration as extending to all dimensions of an organisation’s life. Table 2.1.
lists the main differences between IMC and IC as identified in the literature
review of this study.
Table 2.1: The differences between IMC and IC
IMC IC
Focus is predominantly on the
customer.
A more holistic perspective, including
all stakeholders.
Focuses on messages sent out by the
organisation.
Focuses on two-way communication,
implying that all communication, not
just sent messages, contribute to the
brand of the organisation.
Focuses on external messages. Focuses on internal and external
messages in alignment with the
corporate brand.
The marketing or communication
department drives the messages of
an organisation.
The strategic intent of the
organisation as a whole drives all the
communication of the organisation.
Contributes to the technical aspects
of the organisation.
Contributes to the strategic thinking
processes within the system of the
organisation.
Source: adapted from Niemann (2005)
According to Niemann (2005), the concept of IC has been used since 1997,
with more active use from 2000. Some authors, such as Schultz and Schultz

19
(2004), still prefer to use the term IMC. Kitchen and Schultz (2000:4) refer to
IC as the umbrella term for all strategic organisational communication.
Gronstedt (2000) and Caywood (1997) refined the specific characteristics of
IMC, and developed the concept of IC.
In this study the concept of IC, rather than IMC, is employed. IC is regarded
as the offspring of IMC and an evolution of it. Although IC retains some
characteristics of IMC, IC is viewed as a separate discipline and discussed in
terms of its relation to internal employee communication.
Katz and Kahn (1978) view internal communication as the flow of information,
the exchange of information and the transmission of meaning within an
organisation. Internal communication may thereby be defined as all kinds of
formal or informal interactions that take place between members of an
organisation (Skinner, von Essen & Mersham 1999:96).
For the purposes of this study, the concept of Integrated Internal
Communication (IIC) is defined as the application of internal analysis,
communication and evaluation so as to create integrated, multi-faced
interventions (combining information, instruction, collaboration, business
process design, feedback and incentive systems) in order to improve human
performance and productivity in the workplace and achieve organisational
communication goals and objectives which are aligned to the corporate brand
and the organisation’s internal communication efforts (adapted from
Angelopulo & Barker 2005; Gayeski & Woodward 1996).
The Integrated Internal Communication (IIC) analysis therefore denotes a
research procedure which assesses the effectiveness of an organisational
communication system according to the standards of IIC. The analysis
determines how well communication activity is carried out within an
organisation (Goldhaber, Dennis, Richetto & Wiio 1984).

20
2.3 THEORETICAL UNDERPINNING
Although various models can be used to explain the changing environment
that organisations have to cope with, two main approaches, namely general
systems theory and contingency theory, have been selected for the purposes
of this study. According to theorists, these two theories facilitate the view of an
organisation for the purpose of understanding communication as a social
system (Van der Walt 2006:118). Du Plessis (2006:201) maintains that both
approaches are widely used and multidisciplinary. According to Van der Walt
(2006:117), contingency theory and systems theory are premised on the idea
that there is an interdependent relationship between an organisation, its
subsystems and its environment. This implies, according to Van der Walt
(2006:117), that an organisation, as a system, is in continual interaction with
its environment(s). Should an organisation fail to adapt to changes in its
environment, it tends to move towards a state of severe conflict among its
internal subsystems.
Furthermore, these theories consider the bigger picture of the
interrelationships of the members and the parts of the organisation. Cutlip et
al (1985:2) maintains that organisations depend on their environments for
everything they need to survive. Change is a constant occurrence, particularly
in modern societies, where unstable environments continually impact on
organisations. According to Van der Walt (2006:108), change in the
organisation resides initially in its external environments. However, being an
open system, the organisation is continually affected by change in the external
environment and as a result often has to adapt. Change is reflected internally
and organisation might have to adjust or realign internal communication
messages, management structures and systems and processes accordingly.
2.3.1 General systems theory
According to Baker (2005), systems theory models are widespread in
organisational theory. During the 1950s and 1960s systems theories were a
popular framework for conducting analysis. Furthermore, Baker (2005) notes

21
that the systems theory model is still influential today and has informed
relatively recent work. According to Niemann (2005:21), systems-thinking
provides a model for seeing interrelationships, rather than just focusing on
individual factors. Niemann (2005:22) argues that the general systems theory
has been “an immensely useful tool in the study of communication”.
Organisational behaviour, according to Clark (1998), is the study and
application of knowledge about how people, individuals and groups act in
organisations. It does this by taking a systems approach, interpreting people-
organisational relationships in terms of the whole person, whole group, whole
organisation and whole system.
Katz and Kahn (1978:32) define organisations as open systems which import
energy from the environment. This energy is transformed into products or
services, which are then released into the environment, re-energising the
system. The writers maintain that the systems approach views an organisation
as a group of interrelated parts with a single purpose of retaining balance.
Katz and Kahn (1978:32) contend that in open systems, units within an
organisation affect and are affected by other units and the organisation as a
whole is responsive to environmental change. A primary aim of general
systems theory, according to Niemann (2005:23), is to integrate accumulated
knowledge into a clear and realistic framework. An organisation is thereby
seen as an integrated whole, and all employees need to be aware that
anything they say or do, as well as any decisions they make, will affect the
other parts of the organisation. A balance therefore needs to be maintained
between the different parts of an organisation, as well as between the
organisation and its changing environment. Weick (1969) uses general
systems theory to explain the interconnectedness of individuals in an
organisation, contending that all positive actions taken by individuals in an
organisation strengthen the organisation. In this perspective, more emphasis
is placed on the actions taken individually than on the systematic planning and
execution of actions. As such, systems theory demonstrates links with the
concepts of “integrated communication” and “internal communication”, the two
key concepts of this chapter. This study takes a general systems theory

22
approach in its examination of ICG in relation to its internal environment, and
in its development of an instrument to evaluate integrated internal
communication at ICG.
A way in which to perceive how change can be effected throughout an
organisation is to study change using organisational development (OD). Van
der Walt (2006:108) defines OD as a planned attempt to use what is known
about organisations and employee behaviour in order to facilitate
organisational change. Tushman and Nadler (1999:47) indicate that the
Congruence Model of Organisational Behaviour views the organisation as an
open system that transforms input from the external environment into output
of various types. In this model the organisation is seen to consist of formal
and informal arrangements and the people and core work are seen to be
driven by an articulated strategy. The more closely each component of the
organisation is aligned with the others and with the strategy, the more
effective the overall performance. Furthermore, Tushman and Nadler
(1999:45) contend that the relationship between strategy and organisational
design is reciprocal, for the way in which an organisation is organised might
encourage employees to restrict or develop their creative strategies. Duncan
and Moriarty (1997a:5) propose that information sharing can also strengthen
brand relationships and help integrate organisational strategies. This idea is
based on the systems theory view that every interaction with and experience
of the organisation, its products and services, communicates something.
Constant change in the environment continually elevates the role and
significance of integrated internal communication in the management of
information, problem solving, decision making, and the establishment and
pursuit of common goals.
2.3.2 Limitations of systems theory
According to Baker (2005), a systems theory approach argues that
organisations can be seen as discrete units that conduct interorganisational
relations for the purposes of exchange. Fiol (1989), however, argues that the
systems theory approach seems to preclude the formation of

23
interorganisational hybrids, as it demands the establishment of strong
organisational boundaries. Organisations with strong boundaries are unlikely
to engage in the joint decision-making processes that hybrid development
requires, as managers within these organisations are likely to fear loss of
control.
A second implication of the systems theory approach, according to Baker
(2005), is that boundary-spanning individuals are not necessarily seen as
organisational managers and as involved in hybrid formation. Rather, their
organisational function is seen as one of facilitating exchange between the
organisation and the environment. Barker (2006:76) defines boundary
spanners as network members who communicate with people or
organisations outside the organisation. Furthermore, if an organisational
hybrid was studied under a systems theory approach, the theory would
require that the organisation should be seen as a new system, a distinct
organisational entity that would, in the pursuit of efficiency, employ its own
dedicated boundary spanners.
Lastly, the increasing interdependence between the organisation, the
environment and the system in which an organisation functions, emphasises
the vital role of communication for an organisation’s survival (Niemann 2005).
It is argued that IC is the new role of communication within such a changed
environment. Communication creates and maintains relationships with internal
(employees) and external stakeholders and it is driven by the strategic intent
of an organisation. An organisation cannot build relationships externally until it
builds them internally (Cutlip et al 1985).
2.3.3 Contingency theory
Baker (2005) indicates that as a theory of the organisation, the contingency
theory holds that organisations interact with and are dependent upon their
environment. The contingency theory is based on the systems approach to
management, which suggests, according to Smit and Cronjè (2002:232) that
organisations tend to be more effective when they are structured to meet the

24
demands of the environment. However, the contingency theory developed
from a need to address certain shortcomings in systems theory, particularly
the view that an organisation’s relationship with the external environment is
based on an uncomplicated exchange and that an organisation’s structure can
be determined independently of its environment.
According to Donaldson (2001), organisational structure is determined by
external pressures on the organisation. He maintains that the pressures an
organisation faces may vary depending on the size of the organisation, its
strategy for operation and the external environment itself. Under a
contingency theory approach, the successful organisation is able to match its
form and strategy to the contingency pressures facing it. Furthermore, Burrell
and Morgan (1979:168) point out that in contingency theory, the environment
is seen as the defining force upon the organisation, and the organisation as
involved in a process of “mutual influence and interdependence”. In other
words, organisations are shaped by the environment, but as the environment
is composed of other organisations, organisations themselves shape the
environment through their actions (Baker 2005).
In terms of their relationship with the external environment, organisations are,
in the first instance, required to interact with the environment in order to
secure the resources necessary for continued operation (Kickert, Klijn &
Koppenjan 1997). These resources are controlled by other organisations and
the prevailing uncertainty regarding the continued stability of supply forms a
major contingency pressure upon the organisation.
Van der Walt (2006:117) maintains that there is no best way to shape or
manage all organisations. Rather, each organisation needs to find its own
“best way”. Van der Walt stipulates that each organisation must adapt its
internal structure to its environment(s). A highly structured organisation, for
example, in a stable environment, might function effectively; however, in
turbulent, changing environments, a less structured organisation might be
more effective. Cutlip et al (1985:2) maintain that if organisations want to

25
survive, they must achieve integration with the internal and external
communities which they were created to serve. Van der Walt (2006:117) points out that the humanistic approach to
contingency and systems theories allows for communication to take place
within the organisation as a whole, as well as with stakeholders and the
environment. She maintains that proponents of the humanistic approach
argue that organisations need employees more than employees need
organisations. Van der Walt maintains that the dictum “a satisfied worker is a
happier worker” should encourage managers and organisations to improve
the internal organisational climate, which, in turn, includes the internal
communication climate and employee satisfaction. These concepts are
discussed in more detail in section 2.5 of this chapter.
Theorists and practitioners of integrated communication have begun to
envisage and implement the communication of an organisation as a seamless
whole. In the next section, the first key concept, integrated communication, is
discussed.
2.4 INTEGRATED COMMUNICATION
Kitchen (1999:235) contends that the raising of a corporate umbrella over all
communication activities makes sense. In this way the same look and feel,
identity, organisational culture and values permeate into all internal and
external organisational touch points. Overman (2003) maintains that
integrated communication messages need to be aligned with an
organisation’s corporate brand promise, which should be embedded
consistently throughout the organisation and across every touch point
(including performance measures, internal and external environment and
communication). According to Schultz and Kitchen (2000), all the
communication activities of today’s business corporation need to be integrated
in order for the business to survive and prosper in a globalised world. Duncan
and Moriarty (1997a:23) indicate that for integrated communication messages
to have maximum impact, an organisation must integrate employees,

26
customers, and other stakeholders with corporate learning, brand positioning
and “a big creative idea”. Overman (2003) maintains that integrated
communication is the lifeblood of an organisation, incorporating the corporate
brand code which determines how a product, service or employees should
act, look and evolve.
According to Christensen and Cheney (2005:12), although communication
literature points to a strong drive towards integrated communication, not all
writers agree with this direction. Christensen and Cheney (2005:12) argue that
attempts to construct, project and preserve an integrated communication
approach tend to overlook the fact that organisations are complex and
dynamic systems with several, often competing, goals and agendas. The
same authors propose that integrated communication can become oppressive
to employees who are forced to labour under an aligned brand promise with
associated images and values that may have little meaning for employees
working in the organisation.
In the next section the concepts IC and IMC are defined, together with a
historical account of how they came about, and what these concepts might
mean in the future.
2.4.1 The emergence of integrated communication Duncan (2001) maintains that a number of trends within organisations have
increased the need for integrated communication. Over the last decade there
has been a proliferation of publications on the concepts of integrated
communication and IMC. According to Cornelissen (2001:7), the concept of
IMC was originally advanced as a corrective to the view that the techniques of
the disciplines of marketing communications, including advertising,
promotions, public relations and selling, are employed in isolation and should
be organised into functional departments. According to Angelopulo (2006:43),
in many organisations communication is seen as a specialised function,
undertaken only by the marketing communication or public relations

27
departments. However, communication is not limited to specific departments
but plays an active role in all areas of the modern organisation.
According to Schultz and Schultz (2004:3), in the past, few organisations
entertained the idea of integrating business functional areas. Organisations
were divided into departments operating as independent silos. Gronstedt
(2000:7) indicates that few organisations felt there was any need to integrate
the marketing and communication functions. When the four Ps of marketing
(product, price, place and promotion) were expanded and adapted in the
1980s as a result of a shift in focus to a “market share” orientation, similar
factors were driving change in communications (Niemann 2005). In place of
the promotional mix of the early 1980s emerged a new type of communication
strategy. The shift was from the four Ps to the four Cs (customer solution,
customer cost, convenience and communication) in the 1990’s, a more
customer-focused approach (Schwartz 2005).
According to Duncan (2001:14), this meant moving from using inside-out
thinking, which focused on the needs of the organisation, to using outside-in
thinking, where the focus was external, on the needs and wants of the
customer. This gave rise to the concept of “Relationship Marketing”, which,
according to McKenna (1995:2), challenged the marketing industry to become
more customer-focused. Kitchen (1999:406) defines relationship marketing as
the mutual exchange and fulfilment of promises achieved by establishing,
maintaining and enhancing relationships with customers and other partners at
a profit, so that the objectives of the parties involved are met. Barker
(2006:181) predicts that the relationship marketing movement, with its
acknowledgment of the significant role of the customer, will have a powerful
impact on IMC, turning it into an “integrative function” which could provide
other departments with the market-related input that they need to function in a
coordinated way. Barker (2006:181) further maintain that relationship
marketing and IMC are interconnected, as the purpose of marketing is to build
relationships.

28
In the next section it is necessary to discuss the debate around the definition
and implementation of IMC in more detail, so as to further differentiate
between the concepts IC and IMC.
2.4.2 The role of IMC The literature on IMC in the latter half of the 1990s offers evidence that the
debate over the definition of the concept remains unresolved (Cornelissen &
Lock 2000; Percy, Rossiter & Elliott 2001; Swain et al 2001). Insofar as
organisational communication is concerned, IMC is undoubtedly the major
communications development of the last decade of the 20th century (Kitchen &
Schultz 1999, 2000). This is despite, according to Kitchen, Brignell, Li and
Jones (2004), the fact that most of the history of IMC approaches, theories
and contribution is very recent in nature. Swain et al (2001:1) challenge IMC,
calling it a “management fashion” rather than a theoretical concept. These
charges are defended against by Don E Schultz who admits that IMC is “not
yet a theory”. Schultz argues that “IMC’s progression as a concept and
discipline is entirely appropriate and in accordance with scientific theory,
insofar as a new emergent paradigm is concerned” (Swain et al 2001:1).
Schultz and Kitchen (2000, 2004) acknowledge that they are currently unable
to measure IMC and that it might be some time before they are able to do so.
Swain et al (2001:1) indicate that much of the literature of IMC over the last
decade identifies a substantial but far less than universally accepted
application for IMC. Cornelissen and Lock (2000) argue that because there is
no established academic or professional definition of IMC, or recognised
measurement system in place to gauge the influence and bearing of the
various IMC concepts, it must be a managerial fad. Percy et al (2001) go so
far as to say that although some view IMC as a valuable concept, there is a
large amount of evidence to suggest that “truly integrated marketing
communication is the exception, rather than the rule”. IMC is then considered
to be nothing more than the use of several means of delivering a message. It
is widely acknowledged, though, that using a range of different marketing
communication tools does not necessarily constitute an IMC programme.

29
In a study by Kitchen and Schultz (1999) they redefine IMC as a hierarchical
process with four development stages, namely: communication coordination;
redefining marketing communication through consumer research and
feedback; building databases to refine customer communication; and financial
and strategic integration. Schultz, Tannenbaum and Lauterborn (1992) state
that the essence of IMC is in building positive relationships by placing
consumers first. Swain et al (2001:2) maintain that this notion remains the
element that most consistently distinguishes IMC from established inside-out
marketing principles. Kitchen and Schultz (1999) advocate an outside-in,
customer-oriented market planning approach rather than the product push-pull
inside-out approach that focuses on the promoter’s welfare and on the
audience as a means to an end. They further propose that all potential
contacts an organisation or brand may have with current or potential
customers are part of the marketing communication impact.
Lastly, Kitchen and Schultz (1999) support the application of information
technology to build consumer relationships. Kitchen et al (2004:23)
summarise this as follows: the IMC process starts with the customer or
prospect and then works back to determine and define the forms and methods
through which persuasive communication programmes should be developed.
Duncan (2001:7) offers a revised definition of IMC, as a process for managing
relationships that drive brand value. More specifically, it is a cross-functional
process for creating and nourishing profitable relationships with customers
and other stakeholders by strategically controlling or influencing all messages
sent to these groups and encouraging data-driven, purposeful dialogue with
them.
Kaye (1999:13) argues that the generally accepted definitions of IMC (Duncan
2001; Kitchen & Schultz 1999) are self-limiting because these definitions
focus on external, non-personal communications. Kitchen et al (2004)
maintain that there are so many different definitions and ideas of what IMC is
that perceptions of IMC are tainted by what people believe to be the true
definition. Kitchen et al (2004) indicate that the value of formal definitions of
30
IMC has been continually underlined by academic authors, but little has been
done to resolve the fact that the theoretical concept of IMC remains vague
and uncertain. Although there has been some scepticism surrounding the
value of IMC campaigns, Kitchen et al (2004) advocate that there can be little
doubt that IMC is an emergent concept whose time seems to have arrived.
Another criticism of IMC centres on the lack of measurement of the
effectiveness of IMC programs. Swain et al (2001) maintain that there is a
continuing need for research towards the development of IMC theoretical
propositions and models, as well as towards the advancement of the
professional practice of integrated marketing communication. Furthermore,
Swain et al (2001:12) advocate research of the kind that identifies ways of
overcoming barriers to the adoption of IMC and tracks the impacts of
developing technologies of IMC as a concept. According to Kitchen et al
(2004), IMC is becoming more widely accepted and recognised, but there are
still many conceptual issues that need further exploration and analysis.
Further critical discussion is also needed from a conceptual perspective.
There are clear distinctions between the concepts IC and IMC, which are
pointed out in the next section.
2.4.3 The role of integrated communication According to Niemann (2005), there are conflicting views as to when IC was
first devised and put into practice. Although Niemann (2005) verifies the
evolution of IC from IMC, Gayeski and Woodward (1996) maintain that it is
important to note that IC is different from IMC. Du Plessis and Schoonraad
(2006:374), clearly distinguish between IMC and integrated communication.
The authors maintain that, whereas integrated communication is concerned
with the corporate brand – that is, what the organisation is and stands for, IMC
is concerned with individual products or service brands.
Drobis (1997:2), Duncan (2001:11) and Schultz and Schultz (1998:1), indicate
that the basic concepts of IC have been practiced since the 1970s, when the
role and impact of advertising in the marketplace started shifting. According to
31
Niemann (2005), other scholars contend that the idea behind IC emerged and
gained importance in the early 1980s. According to this view, the term IC first
emerged in the public relations and corporate literature of the 1980s. Kitchen
and Schultz (1999:21) disagree with this view and trace IC’s origins to the
Medill School of Journalism at North Western University in the United States
(Niemann 2005).
Gayeski and Woodward (1996), explain the differences between IMC and IC
as follows: IMC establishes a model for coordinating marketing, advertising
and public relations efforts, all of which are promotional and external in nature,
whereas IC is a model that encompasses both internal and external
communications and their joint application to information dissemination,
collaboration, learning and performance support. Gayeski and Woodward
(1996) maintain that IC is the application of analysis, communication and
evaluation techniques to create and manage integrated, multifaceted
interventions (combining information, instruction, collaboration, business
process design, feedback and incentive schemes to improve human
performance in the workplace) in order to achieve an organisation’s mission,
vision and goals.
Because they are confined to the area of marketing, most discussions of IMC
tend to limit the scope of integration to brand-related communication
programs. Schultz and Kitchen (2000), for example, suggest that all marketing
communication should be integrated around and in consonance with the
brand identity. Christensen and Cheney (2005) explain that IMC refers to the
notion that all parts of a successful organisation derive their identity and
legitimacy from an orientation to the market. Following this perspective, some
marketing theorists argue that IC comprises not only of the marketing
parameters but the whole organisation, including the internal dimension. IC is
typically conceived of as a broader effort to unify communication practices,
beyond the arena of marketing (Christensen & Cheney 2005).
Whereas marketing has always regarded itself as an integrative practice,
coordinating the various aspects of the marketing mix, scholars of IC have a
32
more expansive view. Gronstedt (1996:201) describes IC as equivalent to
total quality management in its focus on optimisation of the whole synergy.
Gronstedt suggests that IC, essentially, is about the management of long-term
relationships between an organisation and its various internal and external
stakeholders. Gronstedt (1996:201) defines total quality management as
holistically managing the entire business organisation to ensure customer
quality at every stage of the value chain.
Pettegrew (2000:1) argues that despite the appeal of integrated
communication, since introduced, most major organisations have yet to fully
implement the foundational ideas contained in IC. Pettegrew (2000:2)
stresses that for IC to be properly implemented, the CEO must voice direct
support for IC. IC should start at the top management level and filter down.
Pettegrew (2000:34) stresses that senior management commitment is vital for
IC to succeed. In the next section the second key concept of this chapter,
internal communication is discussed.
2.5 INTERNAL COMMUNICATION AS A MULTI-DIMENSIONAL
CONSTRUCT Internal communication is a multi-dimensional construct. Employees are not
merely satisfied or dissatisfied with communication in general, but they can
experience varying degrees of satisfaction about aspects of communication
(Clampitt & Downs 1993).
Of the many possible distinctions between types of internal communication,
one is that between horizontal and vertical communication (Postmes, Tanis &
de Wit 2001). Horizontal communication refers to the informal interpersonal
and socio-emotional interaction with close colleagues at the same level. In
contrast, vertical communication refers to work-related communications up
and down the organisational hierarchy and may range from employees
receiving information about the organisation strategy to the ability for giving
bottom-up feedback and advice to management (Postmes et al 2001).

33
Although definitions of internal communication vary greatly, the following
common strands can be detected in many of the wide variety of viewpoints,
which define internal communication (Goldhaber 1993):
• Internal communication involves messages, their flow, purpose,
direction, and media;
• Internal communication involves people, their attitudes, feelings,
relationships, and skills; and
• Internal communication occurs within a complex open system that is
influenced by and influences its environment.
Kitchen (2005) maintains that firms need to develop soundly based internal
communication strategies, primarily because of the primacy of the brand.
According to Kitchen (2005), if an organisation cannot convince its own staff
of the benefits and virtues of the brand, whether corporate or product, they
could not possibly persuade, remind and inform consumers, customers,
constituencies and stakeholders. According to Kitchen (2005), a major study
in the United States distinguishing strongly successful brands from
“wannabees”, determined that a major differentiating factor in successful
branded companies was a strong belief by both the organisation and its
employees that the brand would deliver on its brand promises. Furthermore,
such companies had stronger internal communication strategies and brand
relationship networks, which they analysed and communicated more regularly
than other companies. Organisations need to identify the means by which
they can affect corporate culture. Some examples of communication tools to
consider might include internal newsletters, the Intranet, notice boards, staff
bulletins, face-to-face communication, and team meetings.
Overman (2003) maintains that brand aligned companies inspire employees
to value the brand they work for in a way that is both personally motivating for
the individual and a bottom-line benefit for the company itself. By virtue of
being the medium by which organisational work is accomplished, internal
34
communication is related to internal organisational climate, communication
climate and employee satisfaction.
In the next section, internal organisational climate, which has been identified
as a critical link between the members of an organisation and the organisation
itself, is discussed in more detail.
2.5.1 Internal organisational climate
The concept of internal organisational climate has received considerable
attention over the past 40 years. Much effort has been made to isolate,
explain and determine its place in organisational theory and numerous
definitions are suggested in the literature (Falcione, Herden & Sussman
1987:197). According to Tilev (1994:16), internal organisational climate refers
to the collective views and interpretations that employees have towards the
present practises of the organisation and their satisfaction towards their own
situation in the organisation.
Welsch and La Van's (1981) research directly associates internal
organisational climate with organisational commitment. Specifically, they
identify five internal organisational climate variables (communication, decision
making, leadership, motivation and goal-setting) as significant predictors of
employee commitment. Rytkonen (2003) identifies an interesting circular
relationship between organisational climate and organisational
communication, whereby communication behaviour leads to the development
of a climate, and organisational climate, in turn, is a major influence on the
way in which organisational members behave and communicate. Kreps
(1990) too maintains that communication influences and is influenced by
organisational climate. This circular relationship between the communication
and organisational climate is discussed in the next chapter.

35
2.5.2 Communication climate
Rytkonen (2003) maintains that communication climate is a difficult concept to
define. According to Timm (1986:74), communication climate can be viewed
as a psychological condition established by, firstly, the employees’
understanding and their commitment to organisational values and, secondly,
the employees’ interpersonal relationships with other organisational members.
According to Tilev (1994:17), communication climate refers to the collective
views, interpretations and satisfaction of organisation members towards
organisational communication. Kreps (1990:193) defines communication
climate as the emotional tone of the organisation, based on how comfortable
employees feel with one another and with the organisation.
Clampitt and Downs (1993) maintain that communication climate reflects
communication on both the organisational and personal level. On the one
hand, the communication climate of an organisation provides a gauge of the
extent to which communication in the organisation motivates employees to
meet organisational goals and identify with the organisation. On the other
hand, communication climate reflects people’s attitudes toward
communication in the organisation.
According to DeWine and James (1988), supportive organisational
communication can lead to supportive organisational communication climate
and can increase employee satisfaction. The final outcome is evident in
employee performance, individual satisfaction, personal growth and
development. For employees, these factors constitute quality of work life,
which in turn directs their motivation. For this reason, communication climate
is bound up with employee satisfaction. A supportive internal communication
climate is necessary to an employee-centric organisation in which employees
feel listened to, valued, informed and empowered.

36
2.5.3 Employee satisfaction
Bennis and Nanus (1985:151) and Peters (1994:7) state that employee
satisfaction is linked to employee empowerment. In this study employee
empowerment is fostered through decision-making. In this way, empowered
employees are sanctioned to make decisions in an employee-centric
environment. Employee satisfaction is achieved through a shared vision of
the future and can only be implemented in an organisation where all staff
influences internal communication principles and values and where there is a
culture of sharing, openness, fairness, honesty and trust.
Employee satisfaction is also bound up with job motivation. According to Tilev
(1994:18), job motivation is a changing, psychological state that is connected
to a certain employee situation. It determines the level of employee
performance and what an employee’s interests are directed towards.
Ho (2001) maintains that in today’s knowledge based society, an employee’s
currency is the knowledge that they possess. The intellectual capital of people
within an organisation is often just as valuable as the physical assets or
products produced. Peters (1994:5) declares that valuable employees give
organisations a competitive edge. Ho (2001) maintains that retaining talent is
paramount, as this knowledge is easily transferable from company to
company. Employees often act as free agents, choosing to give their time and
energy to the company of their choice.
Denton and Vloeberghs (2003:88) claim that there is a move towards a
greater degree of employee empowerment and a tendency towards a more
humane and employee-centred, as opposed to task-centred management
style. Belasco and Stayer (1993:7) indicate that if managers want employees
to perform as if a business belongs to them, they have to make it their
business. Buckingham (1997:6) concurs, indicating that managers should
spend less time “managing” and more time “mentoring”.

37
According to Eisenberg, Huntington, Hutchison and Sowa (1986:501),
perceived organisational support by employees, reflects the quality of the
employee-organisation relationship, by measuring the extent to which
employees believe that their organisation values their contributions and is
concerned about their welfare. Perceived organisational support develops
through employee assessment of their treatment by organisations, and they
subsequently use their judgments of perceived organisational support to
estimate their effort-outcome expectancy. Employee-centric organisations
who treat employees well and value their efforts, can expect to have
employees devoted to greater effort toward helping the organisation achieve
its goals (Setton, Bennett and Liden 1996; Wayne, Shore and Liden 1997).
Hyo-Sook (2003) maintains that excellent organisations have management
structures that empower employees through internal communication and
participation in decision-making. The importance of internal communication
and participation in decision-making has been recognised by organisational
scholars. Participatory management practices diminish the hierarchical
structure of the organisation and involve employees in information processing,
decision making, or problem solving endeavours. According to Heller, Drenth,
Koopman and Rus (1988), increased participation in decision-making by
lower-level members of the organisation has been found to have a positive
effect on the efficiency of the decision-making process. Research has shown
that employees who participate in decision-making have higher levels of
organisational commitment and employee satisfaction (Boshoff & Mels 1995).
In an extensive review of the effect of participation on performance, Hyo-Sook
(2003) concluded that participation could have a statistically significant effect
on both performance and satisfaction.
An example of the impact of employee satisfaction on the bottom line is
illustrated in the following case study in Conradie (2005b:37). In the first
quarter of 2005, Deloitte Human Capital conducted its annual Best Company
to Work for Survey. This survey is a rigorous process of various dimensions.
One organisational element which consistently stood out for all the companies
involved was that of the “values and culture” of an organisation. According to

38
Conradie (2005a:23), values and culture essentially refers to the extent to
which employees experience a sense of belonging within their employer
organisations and identify strongly with the organisational values. This
dimension contributes significantly towards quality relationships between
employees and the organisation and is the result of constant, clear, relevant
communication. Pretoria Portland Cement (PPC), the organisation which
ranked highest in the 2005 Best Company to Work for Survey, earmarks
nurturing their employee relationships and maintaining two-way
communication channels, as crucial for all organisations.
Conradie (2005a:23) cites PPC’s “Kambuku” programme, as a key contributor
to the company’s success. In this programme, employees at PPC were invited
to submit innovative ideas for cheaper, better and faster ways of doing things.
The organisation focuses on taking a personal interest in the well-being and
satisfaction of every employee, by providing all employees with a clear
purpose, an inspiring climate, the opportunity to engage in dialogue and an
appropriate reward and recognition system. An employee-centric culture has
its financial rewards. After being named best company to work for in 2005, the
PPC share price reached its highest level ever. While share price is influenced
by many internal and external factors, there is little doubt that satisfied
employees also influence the bottom line of any organisation (Conradie
2005a:23).
Another element impacting on employee satisfaction according to Clark
(1998) is organisational culture. Culture is the conventional behaviour of a
society that encompasses beliefs, customs, knowledge and practices. An
established culture provides people with a sense of stability, security and
understanding. Clark (1998) indicates that this is why employees fear change.
They fear that the system will become unstable, their security will be lost and
they will not understand the new process or respond in the right way to the
new situation.
Conradie (2005a:24) maintains that the environment in which employees work
contributes significantly to the extent to which employees feel valued and

39
cared about. A negative atmosphere can send discontent throughout the
company whereas a positive environment of open two-way communication,
empowering all employees with a voice, creates trust and confidence in
management and the organisation. Bennis and Nanus (1985) maintain that
trust is the emotional glue that binds followers and leaders. Trust is seen as
the basic ingredient of all organisations, and leaders should aim to establish
organisational cultures where trust exists in all directions.
According to Ho (2001), a study conducted by the National Study of the
Changing Workplace to determine causes of employee dissatisfaction
indicated that lack of “open two-way communication,” raked higher than work-
life balance and meaningful work, as reasons to leave an organisation’s
employ. Other reasons were not being listened to and ignoring employee
views, ideas and opinions.
Bernstein (2000:2) proposes that the more employees feel part of the
organisation and the better informed they are about its business strategies,
the higher their morale will be. Research in Duncan (2001:23) indicates that
organisations with higher employee morale and employee satisfaction lead to
higher levels of customer satisfaction. According to Ho (2001), organisations
strive to gain customer loyalty because it increases bottom-line profitability
and leads to long-term valuable relationships. Ho (2001) maintains that
organisations need to strive to gain employee loyalty in the same way.
Employee-centric organisations that value employee input and gain employee
loyalty, ultimately reduce employee turnover, and also reap increased bottom-
line results.
In the next section the two key concepts of this chapter, integrated
communication and internal communication, are brought together in a
discussion of integrated internal communication (IIC).
40
2.6 INTEGRATED INTERNAL COMMUNICATION (IIC)
According to Angelopulo (2000:14), the brand equity of an organisation exists
as the accumulated experiences of every interaction with it. In this way brand
equity is the value both tangible and intangible that a brand adds to a product
or service. The implication is that IIC originates within the organisation and
then moves to all interactions within and then outside of the organisation,
including employee satisfaction, customer services and product delivery, the
management of expectations and creation of integrated internal and external
messages. IIC represents a fundamental shift from manipulating employees
to genuine organisational involvement, from telling employees, to rather
asking, listening, empowering and sharing information. To achieve this, an
organisation needs to create a continuous and purposeful dialogue with
employees (Duncan 1995).
Integrated communication and internal communication combine to form
integrated internal communication. This concept is defined as the application
of internal analysis, communication and evaluation techniques so as to create
and manage integrated, multi-faced interventions, in order to achieve
organisational communication goals and objectives which are aligned to the
corporate brand and internal communication efforts (adapted from Angelopulo
& Barker 2005, Gayeski & Woodward 1996).

41
Figure 2.1: The role of IIC within a changing environment
Source: own conceptualisation
Figure 2.1 depicts the changing environment in which organisations exist.
Within this open system, inputs from the external environment impact on an
organisation’s survival. Every organisation has a unique internal
organisational and communication climate. These climates combine to form
the internal organisation communication climate referring to the collective
views and interpretations of employees towards organisational practices, as
well as employee satisfaction towards their own situation within the
organisation.
ORGANISATIONS WITHIN A CHANGING ENVIRONMENT
(GENERAL SYSTEMS THEORY)
INTERNAL ORGANISATIONAL CLIMATE
COMMUNICATION CLIMATE
INTERNAL ORGANISATIONAL COMMUNICATION CLIMATE
(employee satisfaction, employee-centric)
INTEGTRATED COMMUNICATION (evolving from IMC)
INTERNAL COMMUNICATION
INTEGRATED INTERNAL COMMUNICATION
42
Within this internal organisational communication climate, the role of
integrated communication is a key factor in recognising that every department
and function within an organisation has a communication dimension, and that
all messages, systems and processes must be aligned with the corporate
brand of the organisation. Internal communication is the medium by which
integrated internal communication is accomplished within an internal
organisational communication climate.
An example of IIC is illustrated in a case study presented by The Forum for
People Performance Management and Measurement (2005). This case study
chronicles the transformation of British utility company SEEBOARD Energy. In
this case study it was found that part of the reason for the company’s
turnaround was due to the implementation of comprehensive integrated
internal communication processes and systems, designed to convey
integrated brand information, but also change the culture of the company, with
a new, unified vision and strategy. The study maintains that the most powerful
incentives for integrated internal communication, was having it mandated by
senior management. Energising the internal force behind the corporate brand
played a crucial role in getting and keeping employee attention, loyalty and
increased job longevity. An integrated internal communication approach
ultimately leads to better customer service as employees understood the
brand promise. Furthermore, it encouraged employees to believe in and live
the brand. However, for integrated internal communication to succeed it is
necessary for organisations to implement a number of changes, some of
which include restructuring the organisation into cross-functional teams, with
proper employee incentives, motivation and training.
According to a study by the American Productivity and Quality Center (APQC)
(1998) organisations do not simply decide to implement integrated
communication practices but rather evolve into integrated organisations over a
period of time. The APQC study is based on the hypothesis that integrated
communication transitions through four identifiable stages and that the skills,
processes and practices developed at one level, lays the groundwork for the
organisation to move on to the next stage. The underlying constructs for these
43
four stages of integrated communication (namely tactical coordination,
redefining scope of marketing communication, application of information
technology and financial and strategic integration) are discussed in Kitchen et
al (2004) and Schultz and Schultz (1998). These constructs are adapted in
this study thereby outlining the parameters of integrated internal
communication (see section 3.4.2).
Briefly, in this study, the parameters for integrated internal communication are
seen as a “concord of endeavours” (Niemann 2005). The four stages in IC
development (see section 3.3.3.) are adapted for internal use and applied to
integrated internal communication as follows (see section 3.4.2):
• In the first stage, integrated internal communication refers to tactical
coordination or integrated message consistency – the “one look, one
voice” approach.
• At the second stage of integrated internal communication, employees
start living the corporate mission. Organisations begin to examine
integrated internal communication from the employee’s point of view,
asking if the same internal brand message is communicated at every
employee contact point.
• At the third stage, organisations make use of empirical data, behavioural
data and web technology to enhance integrated internal communication
on multiple fronts.
• Finally, at the fourth stage, organisations apply employee-centric
concepts by listening to, informing, valuing and empowering employees.

44
2.7 CONCLUSION In this chapter the following aspects were highlighted:
The organisation was defined as an open system, which imports energy from
and releases energy back into an ever changing environment. The
interdependence between the organisation, the changing environment and the
system in which an organisation functions, emphasised the vital role of
communication for an organisation’s survival.
Organisational climate was identified as a critical link between employees of
an organisation and the organisation itself. In turn communication influenced
and was influenced by organisational climate. By virtue of being the medium
by which organisational work is accomplished, internal communication was
related to organisational climate. The parameters of employee satisfaction
within an organisational and communication climate were discussed in relation
to the concepts internal communication, empowerment and trust within a
culture of sharing, openness, fairness and honesty. Customer satisfaction
although intrinsically linked from employee satisfaction was seen as the
ultimate objective of every organisation
This was followed by a discussion around integration in the organisation and
the evolution of organisational integration. The role of IMC and IC concepts
with conflicting and associated debates around implementation, measurement
and universal definitions of the terms were discussed.
Finally, integrated internal communication with reference to the SEEBOARD
Energy case study was outlined. The four stages of IC (Kitchen et al 2004;
Schultz & Kitchen 2000; Schultz & Schultz 1998) as adapted for internal use
were briefly outlined (these parameters are discussed in more detail in section
3.4.2 of this study).

45
The next chapter outlines the benefits and shortcomings of existing IC and
traditional internal communication audit measuring instruments. Elements of
these measuring instruments are then adapted to develop the IIC analysis.

46
______________________________________________________________
CHAPTER THREE
COMMUNICATION MEASURING INSTRUMENTS: AN INTEGRATED APPROACH
3.1 INTRODUCTION Various IC measuring instruments are described in IC literature. In this
chapter a number of these instruments are discussed, paying particular
attention to the extent to which they are internally, externally or dually
focused. The literature review traces the rise of integrated communication and
the history of internal communication audits.
Existing measuring instruments are adapted and amended so as to meet the
first objective of this study, namely to develop a measuring instrument to
evaluate integrated internal communication (IIC).
In this chapter, existing IC measuring instruments and traditional internal
communication audits are reviewed so as to identify concepts that can be
used as criteria for measuring integrated internal communication. A new
measuring instrument, namely the Integrated Internal Communication (IIC)
analysis, is developed. While the proposed IIC analysis in no way replaces
existing measuring instruments such as traditional internal communication
audits or IC audits, criteria from these measuring instruments form the basic
building blocks of the proposed IIC analysis.
The next section provides an overview and historical account of traditional
internal communication audits.

47
3.2 TRADITIONAL INTERNAL COMMUNICATION AUDITS
According to Opyt, Stewart and Soy (2001), an internal communication audit
can be described as an organisational communication measurement system.
Traditionally, internal communication audits have been used to measure and
address areas such as an organisation’s flow of formal and informal
messages; the communication role of individuals in an organisational
communication system; employee perceptions of information adequacy; and
employees’ identification with an organisation and sense of belonging
(Goldhaber 1993).
Fogelman-Beyer (1999:19) contends that internal communication audits help
companies to define the relationship between their objectives and the
communication methods used to promote these objectives. According to
Tourish and Wilson (2002), the ability of the internal communication audit to
improve organisational performance is well documented. However, little is
known about the actual impact that internal communication audits have on
organisations. Research by Tourish and Wilson (2002) indicates that effective
internal communication audits can reduce uncertainty, increase trust, and help
facilitate important management objectives.
According to Downs and Adrian (2004), a 1983 survey of Fortune 500
companies revealed that 45% of these organisations had conducted an
internal communication audit. An internal communication audit is often used
as a benchmark against which to later compare assessments and watch the
development of an organisation’s culture. Where cultural adjustments are
made, assessments can provide unique insights into managing in an era of
globalisation and constant change. Downs and Adrian (2004) contend that the
internal communication audit adopts a communication perspective on
organisations. The authors observe that the role of communication is often
oversimplified and they highlight the importance of the total environmental
context, noting that the internal communication audit provides a framework for
getting things done and should not be a side concern. Internal communication
audits are identified as valuable because they enable repair of

48
communication, thus preventing a breakdown before it occurs; generate new
information that can ascertain employee perceptions and help the
organisation strategically; forecast problems; identify strengths to be
reinforced; and contribute to the development of communication systems
within the organisation (Downs & Adrian 2004). Lee (2005) maintains that the
best measurement processes address not only formal communication but also
semi-formal and informal communication, and focus on outcomes, not outputs
or inputs. In order to contextualise the role of the internal communication audit
as a measuring instrument which assists organisations in determining
employee’s perceptions of internal communication efforts, it is necessary to
first provide a historical overview.
3.2.1 Historical overview of internal communication audits
According to Tourish and Hargie (1996:39), the practice of surveying
employees has been widespread since the 1920s and by 1981 45% of
manufacturing firms in the United States of America were conducting
employee attitude surveys. The term communication audit did not emerge
until the 1950s. In the 1970s Greenbaum pioneered the first large-scale
development effort to address the lack of standardised procedures for
assessing organisational communication systems. The project aimed to
develop a large sample size, use measurements that could be replicated,
provide predictive value to those interested in communication effectiveness in
organisations, and to build data stores that could be studied over time to
provide a basis for comparative analysis (Goldhaber et al 1984). According to
Tourish and Hargie (1996:39), results from these early communication audits
found that employees: (a) wanted to receive more information, (b) wanted a
greater opportunity to voice complaints and evaluate superiors, (c) wanted
more involvement with decision-making, including more follow-up from
information sent to top management, and (d) wanted more job related
information from immediate supervisors. Research revealed that employees
tended to get most of their information from the grapevine, which was seen as
a fast and informal way of finding out what was happening in an organisation,
albeit that the source of information was often unreliable. No general

49
relationship between demographic variables and communication variables
was found (Goldhaber et al 1984).
Although there are a number of internal communication audit instruments
available. Tourish and Hargie (1996:39) maintain that the most widely used
internal communication audit tool originated from the work of the International
Communication Association (ICA) in the 1970s. The next section looks in
greater detail at the ICA audit and at more recent audits, including the Survey
of Organisational Communication (SOC) and Information Systems Analysis
(ISA). Although there are a number of measuring instruments used to
measure employee perceptions of communication, the three audits discussed
in the next section provide a progressive overview of some of the concepts
that form the basic building blocks of internal communication audits.
3.2.1.1 The International Communication Association (ICA) audit
The International Communication Association (ICA) is a professional
organisation dedicated to the study of communication processes in a variety
of contexts. According to DeWine and James (1988:144), the ICA devoted
more than five years (1971-1976) to the development of the ICA audit. This
audit includes five measurement tools: 1) questionnaire survey, 2) interviews,
3) network analysis, 4) communication experience analysis, and 5)
communication diaries (Goldhaber 1993).
The ICA audit requires respondents to identify the amount of information
currently received on key topics, against the amount of information they would
like to receive. The differences between such scores are then tested for
significance (Tourish & Hargie 1996:39). The results provide a comprehensive
picture, quantifying the nature of communication and information flow within
broad sections of an organisation. According to DeWine and James
(1988:144), the advantages of the ICA audit are well documented and include
overcoming the use of single instruments, limited situationalism, small
unrepresentative samples, lack of standardisation and norms, and limited
measurement of actual behaviours.

50
Tourish and Hargie (1996:39) assert that one of the main limitations of the ICA
audit is that it does not provide managers with qualitative as well as
quantitative data on communication functioning. The authors suggest
expanding the questionnaire format to include focused open-ended questions
which enable respondents to express their views at length, using first person
descriptions. They argue that surveys should register the actual voices of
research subjects, rather than reduce their responses to quantitative
categories. They maintain that quantitative data should be strengthened by
providing a check for convergent validity. This can be achieved by adding a
qualitative dimension, which provides accessible accounts of how employees
interact with one another within the wider organisational system. Burnett
(1991:121) concurs with the idea of an added qualitative dimension, indicating
that an outsider’s commentary is never a substitute for a story told by
employees in their own words. Other advantages of adding a qualitative
dimension to traditional internal communication audits include the
encouragement of freedom of speech, expression and opinion.
This qualitative dimension as a way of supplementing quantitative data is built
into the IIC measuring instrument proposed in section 3.5. In this way,
qualitative dialogue complements quantitative data with lively vignettes of how
employees interact.
DeWine and James (1988:145) identified seven main criticisms of the ICA
audit: 1) lack of centralised control over the data collection process, 2) inability
to compare local organisations to national norms, 3) lack of follow-up
procedures to test for impact, 4) the limitations of an essentially perception-
based measurement tool, 5) problems with the audit’s present structure, 6)
methods of analysis are not well-documented, and 7) procedures of
developing recommendations for the client-organisation based on the
interpretation of the results.
Additional limitations of the ICA audit, according to DeWine and James
(1988), include high costs and lengthy administration. They argue that the five
point Likert scales restrict the opportunity to measure the finer changes in an
organisation’s communication patterns. Despite obvious problems though,

51
follow-up interviews assessing the usefulness of the ICA audit revealed that
the audit had the ability to identify communication problems and potential
solutions within an organisation. However, research showed that managers
very often did not make use of this data, preferring their own version of
organisational reality, regardless of recommendations. To address the
shortcomings of the ICA audit, DeWine and James (1988:159) proposed an
alternative internal communication audit, namely the Survey of Organisational
Communication, which is discussed in the next section.
3.2.1.2 Survey of Organisational Communication (SOC)
As an internal communication audit, the Survey of Organisational
Communication (SOC) presents a series of modifications, designed to shorten
and improve on the utility of the ICA audit. The SOC enhances the
instruments and procedures of the ICA audit and streamlines its
administration
According to DeWine and James (1988:157) a primary goal of the SOC was
to reduce costs by shortening the length of time needed to administer the
instrument. They also added a qualitative dimension with three open-ended
questions. Qualitative questions aimed to collect data on the quality of
information relating to decisions affecting employees, organisational decisions
and how employees related to organisational goals.
Despite attempts to revise the ICA audit, the SOC has a number of
shortcomings. Although slightly reduced, it is still long, time consuming and
overly complicated. Like the ICA audit, the SOC also requires respondents to
fill in dual columns rating the amount of communication currently received
against the amount of communication they would like to receive. This rating
system is confusing and difficult to follow. A shortcoming of rating
communication in this way, according to Gayeski (2000), is that employees
often say what is expected of them and not what they really think or feel. This
is described as the demand effect, in that organisations often rely on opinions
that are influenced by pre-ordained positive expectations.
52
Gayeski (2000) contends that while the internal communication audit has
benefits as a measure of employee perceptions or the quality of interaction
between employee and manager, there are a number of shortcomings. In
today’s ever-changing career market and with continual job-hopping, Gayeksi
(2000) suggests that it might be more productive to focus on the
communication “tools and rules” of an organisation, rather than the behaviour
of employees. The next section looks at Gayeski’s Information System
Analysis (ISA) as a modern alternative to the many shortcomings of traditional
internal communication audits (ICA communication audit and SOC).
3.2.1.3 Information Systems Analysis (ISA)
An ISA includes a review of the systems, tools and templates that are used to
exchange information within an organisation. According to Gayeski (2000), the
ISA is an all-encompassing measure of an organisation’s employee-centricity.
Key evaluation areas include the means available for communication,
infrastructure paths and channels, network flexibility, initiation of messages,
communication overload, communication budgets and efficiency,
communication integrity, effectiveness and communication appropriateness.
Gayeski (2000) defines the principal output of an ISA as a set of
recommendations that influences performance. The analysis finds wasted
effort, resulting from gaps in the information structure. This translates into
huge savings and improvements to an organisation’s bottom line. The ISA
also identifies missed opportunities as a result of weak communication
systems.
The ISA consists of a number of qualitative and quantitative components:
• An initial meeting with executives to determine overall goals and
organisational culture.
• A systematic content analysis to determine consistency of messages
and voice.
• A behaviour-setting analysis of key staff to determine and observe how
they use information and communication channels.

53
• An audit of communication tools (such as the intranet, newsletters,
internal emails) and rules (templates used, or standards used to
produce the information).
• Focus groups or small group interviews to determine the needs and
issues of key employee groups.
Gayeski (2000) further points out that, increasingly, communication and
learning constitute the critical infrastructure for becoming a high-performance
organisation. To achieve this excellence, employees need to understand the
organisation’s goals and culture; know what is expected of them; have
appropriate tools to perform their jobs; have the right environment in which to
perform; have the required knowledge and skills to perform as ambassadors
for the company; receive regular and clear feedback on performance; and
perceive and receive rewards for good performance.
The ISA does not attempt to replace traditional internal communication audits.
Rather, Gayeski (2000) suggests that once an organisation has undertaken a
traditional internal communication audit, this information can be taken to the
next stage through the implementation of an ISA. The next section offers a
critical evaluation of traditional internal communication audits.
3.2.1.4 Critical evaluation of traditional internal communication
audits
The internal communication audit is used to help management understand the
communication environment better, to provide management with increased
awareness of current communication behaviour, and to help them remove or
prevent communication barriers. Internal communication audits can be
particularly useful for assessing an organisation’s communication patterns in
the case of restructuring. In addition, internal communication audits address
communication between management and employees; interpersonal
communication; public relations activities; and overall internal communication
effectiveness (Ellis, Barker, Potter & Pridgeon 1993). Research results from
an internal communication audit can be used to assess the impact of ongoing
programmes; identify key communication groupings; target new

54
communication training programmes; and determine what environmental
factors affect the organisation's communication system (Clampitt & Downs
1993; Goldhaber 1993).
The benefits of conducting an internal communication audit may be gauged by
reviewing some of the changes and improvements made by organisations as
a result of findings. According to Goldhaber (1993), clients implemented the
following recommendations as a result of internal communication audit
findings: 1) adding new formal channels of communication (including
communication technology); 2) development and disclosure of communication
goals, policies, and objectives; 3) developing methods to improve informal
communication; 4) changing the amount of information communicated about
human resources, opportunities, and training; 5) improving upward input
solicited by top management; 6) adding or shifting staff resources, and 7)
periodic monitoring and evaluation of the company's external image as
perceived by significant publics.
According to Downs and Adrian (2004), terms used in audits have a profound
effect on people’s perceptions. The word audit, for example, remains
threatening to many people, despite efforts to explain that it should not be
seen as either a threatening term or process. The term audit remains linked to
accountancy and possible unfavourable financial outcomes.
Gayeski and Woodward (1996) argue that traditional internal communication
audits assume that if the sender sends a well-designed message, it will
automatically be understood by the “receiver”. Traditional internal
communication audits are thereby reactive rather than proactive. Gayeski and
Woodward (1996) indicate that traditional internal communication audits
measure outcomes of communication projects by satisfaction indicators. For
example, employees are asked how much they like a particular medium, such
as the newsletter. These statements of satisfaction are assumed to relate to
the effectiveness of an intervention in terms of organisational goals. However,
Gayeski and Woodward (1996) maintain that traditional internal
communication audits do not link intervention to the bottom line.
55
Traditional internal communication audits such as the ICA audit and the SOC
presented by De Wine and James (1998) are long, overly complicated and not
suited to today’s fast-paced work environment. The ICA audit and other
traditional internal communication audits are academic in feel and language
and inaccessible to the average blue-collar worker often called upon to fill in
surveys. Other barriers leading to non-completion of audits include increased
work pressures and time constraints, waning concentration spans and
information load.
In light of these constraints, the average employee faced with the challenge of
filling in a traditional internal communication audit may very well try to avoid
the experience. Another shortcoming of the traditional internal
communications audit, according to Gayeski (2000), is that it relies on
employees supplying an honest account. This means that the benefits of the
audit are lost if employees are not entirely honest. More specifically, the
traditional internal communication audit as it stands is not an integrated
measuring instrument.
A traditional internal communication audit might evaluate employee
perceptions and knowledge of an organisation’s vision, mission and values,
but it does not gauge whether the vision is understood and lived at all
employee contact points. There are clearly integration gaps and shortcomings
in traditional internal communication audits. For example, a traditional internal
communication audit might address communication networks between
departments within an organisation, but it does not measure shortcomings
and gaps in cross-functional planning and monitoring. The next section
proposes and evaluates various IC models and instruments, so as to elucidate
the issue of implementing IC effectively within an organisation.
3.3 IC MODELS AND MEASURING INSTRUMENTS Christensen and Cheney (2005:5) point out that directions on how to
implement integrated communication in practice, or to measure its successful
implementation, are often absent in the relevant literature. Several
56
approaches have been proposed in literature on how to measure integrated
communication in the organisation, including: the Renaissance Communicator
(Gayeski & Woodward 1996); the Stakeholder Relations Model (Gronstedt
1996; Murphy, Murphy, Woodall & O ‘Hare 1999); the four stages in IC
development (Kitchen et al 2004; Schultz & Kitchen 2000; Schultz & Schultz
1998); ten strategic drivers (Duncan and Moriarty 1997a:15); and the
integration audit and mini-audit (Duncan 2001; Duncan & Moriarty 1997a,
1997b). These approaches which are discussed in more detail later in this
chapter, have shortcomings when it comes to the “what and how” of aligning
and measuring integrated internal communication in the organisation.
Ho (2001), however, maintains that while marketing communication concepts
have traditionally focused more on external stakeholders, they can be
powerful tools in managing internal stakeholders (employees). Many of the
key concepts used to measure customer experience, as identified by Duncan
and Moriarty’s (1997a:15) ten strategic drivers, can be used just as effectively
to measure internal communication. The four stages of IC development, as
identified by Schultz and Kitchen (2004), can also be adapted to measure
integrated internal communication. The next section discusses five models of
IC implementation.
3.3.1 The Renaissance Communicator
As business and management styles changed, Gayeski and Woodward
(1996) proposed a new model for IC management in response to these
changes. They maintained that the model should be based on strategic
communication, human performance, technology, business process re-
engineering and a systematic method for the analysis and development of
communication interventions. Gayeski and Woodward (1996) call this model
the Renaissance Communicator. The writers note, though, that there are not
yet many real-life examples of Renaissance Communicators.
The IC model proposed examines customer and market needs and centres on
identifying and solving “performance gaps”, defined as discrepancies between

57
an organisation’s expectations and its actual performance. The model
consists of five phases: 1) initiating, 2) descriptive, 3) conceptual, 4) prototype
and 5) actual and continuous improvement (Gayeski & Woodward 1996).
Questions focus on the identification of performance goals and gaps, and the
systematic identification, implementation and evaluation of a coordinated set
of communication solutions.
The IC model consists of twenty-one questions or “development steps”. A
team, or a multi-disciplinary person, poses these questions to “the client” and
a “representative constituency” of the target audience. The team then
analyses the situation and evaluates interventions. The analysis and
development steps from an integrated approach are as follows: problem
identification; determine what cause(s) the gaps and identify potential
solutions; and select, prototype, implement and elevate interventions. Results
are then measured against the bottom-line result in performance.
According to Gayeski and Woodward (1996:7), one limitation is that despite
interest in, and the successful application of IC models, this approach is still
not widely accepted. The writers maintain that the use of qualitative and
quantitative research techniques to plan and evaluate communication
programmes is still something new to most practitioners. The IC model
proposed by Gayeski and Woodward (1996:4) essentially aims to examine
customer and market needs. Although human performance plays a key role,
the needs of employees are only considered insofar as they impact on
external organisational goals and objectives and the bottom line.
3.3.2 Stakeholder Relations Model
Gronstedt’s (1996:287) proposed Stakeholder Relations Model explains and
unites the main dimensions of public relations and marketing communication.
Identifying an overlap between the tools used by marketing and public
relations, Gronstedt maintains that public relations’ publics tend to merge with
the markets of marketing. Gronstedt (1996:292) views good relationships with
customers as the ultimate measure of the successful functioning of an
58
organisation. Ehlers (2002:155) points out that in this model all stakeholders
(including customers, government, trade stakeholders, suppliers and
distributors, the community, employees, financial stakeholders, the media and
scholars, opinion leaders and interest groups) function interdependently in
that changes in one group are likely to have consequences for other group.
Gronstedt (1996:302) summarises the need for an integrative approach to
communication as follows:
“The theory of integrated communication recognises that organisational
communication is too complex and interactive to be fractionalised into insular
disciplines. The interdisciplinary theory inserts various communication
disciplines into a holistic perspective, drawing from the concepts,
methodologies, crafts, experiences and artistries of marketing communication
and public relations. Specialists in certain communication tools will still be in
demand, but instead of being solo customers, they will find themselves being
instrumentalists in an orchestra, under the conductorship of the integrated
communicator.”
The main limitation of this model, according to Niemann (2005), is that the
model makes no reference to the organisation itself and to the relationships
between stakeholders within the organisation. In this way all emphasis is
placed on stakeholders and none on how the organisation should position and
organise itself to build relationships with stakeholders. Niemann (2005) further
contends that the model focuses predominately on external messages to
stakeholders without placing sufficient emphasis on the internal messages to
internal stakeholders. Although employees are mentioned in the model, there
is no mention of communicating with employees.
3.3.3 Four stages of IC development
Schultz and Kitchen (2000) define four stages of integrated communication
evolution. The four stages are: 1) tactical coordination of promotional
elements, 2) redefining the scope of marketing communication, 3) the

59
application of information technology and 4) financial and strategic integration.
They maintain that most organisations are anchored in either stage one or
two. Some organisations are moving into stage three, but only a handful of
organisations have moved to stage four. IC is about much more than the
alignment of tactics. In Figure 3.1 Schultz and Schultz (1998), in a study for
the Best-Practice Report for the American Productivity and Quality Centre
(APQC), define four stages of IC evolution within an organisation.
Figure 3.1: Four stages of IC evolution within organisations
Stage 4
Stage 3
Stage 2
Stage 1
Source: adapted from Kitchen et al (2004)
According to the APQC study, organisations go through four identifiable
stages of integration. The stages are not sharply defined; rather, organisations
might address different concerns at each stage and gradually develop the
skills and tools appropriate for each.
Schultz and Schultz (1998) identify the following as key milestones measuring
communication integration:
Stage 1: Tactical coordination of marketing communication The emphasis at this stage is on developing overall communication policies
and practices and delivering “one sight, one sound” through marketing
communication. There is an attempt to achieve greater consistency and
synergy among all programme elements. Kitchen et al (2004:27) argue,
Tactical Coordination of Marketing communications
Redefining the scope of marketing communications
Application of information technology
Financial and strategic integration

60
however, that a stage one focus is inside-out marketing, as there is little focus
on customers, consumers or their needs. Rather, the focus at this stage is on
bundling the promotional mix elements together, so that they speak with one
voice. Kitchen et al (2004:27) declare that research has shown that most
organisations and their agencies operate at this level and that this could be
detrimental to organisational development and growth.
Stage 2: Redefining the scope of marketing communication Organisations start to examine communication from the customer’s point of
view. Consideration is given to all brand and company contacts that a
customer has with the product or service. Additionally, management broadens
the scope of communication activities to encompass internal marketing to
employees, suppliers and other business partners, and to align these with the
existing external communication programme. Kitchen et al (2004:27) believe
that stage two is at least an attempt by businesses to actively consider what
customers and consumers want to see and hear. This stage represents
outside-in marketing and, being driven by customers and their needs, is a
major step in IC.
Stage 3: Application of information technology At this stage empirical data is consolidated and stored in a central database.
Behavioural data on customers provides a basis for identifying and monitoring
the impact of integrated internal and external communication programmes on
key customer segments.
Stage 4: Financial and strategic Integration This is the highest level of integration, where the emphasis shifts to using the
skills and data generated in the earlier stages so as to drive corporate
strategic planning by using customer information and insight. Organisations
commonly re-evaluate their financial information infrastructure in order to
foster creation of “closed-loop” planning and capabilities. This helps them to
evaluate marketing expenditures based on return-on-customer investment
measures. Kitchen et al (2004:37) indicate that it is only in stages three and
four that businesses have to invest significant resources in building

61
segmented databases and organisational restructuring to become customer-
focused and customer-driven.
The most significant contribution of this model is that it proposes a clear
understanding of the value of customers; however, this is also a point of
criticism. By focusing predominately on customers it excludes a broader
stakeholder approach and thus does not place sufficient emphasis on
employees or internal communication. This model is adapted in section 3.4.2
of this study so as to include an internal communication dimension.
3.3.4 Duncan and Moriarty’s integration audit and mini-audit
Moriarty (1994:49) maintains that all IC planning should begin with a
communication audit, as well as opinion and consumer behaviour research.
These findings should then be used in conjunction with an integration audit.
According to Moriarty (1994:49), the Colorado Integration audit identifies
communication contact points as well as the activities of all the various
communication functions. The integration audit maps the message objectives
as well as the messages sent to various stakeholders and evaluates
consistency through content analysis. The audit also investigates the
communication network within a company, using a knowledge and attitude
assessment to identify integrative and specialist attitudes and practices. The
integration audit can be seen as an added dimension to the communication
audit. Duncan and Moriarty (1997a) point out that although the integration
audit was designed to be an evaluation tool, it also provides a road map
showing how a company can become more integrated. The integration audit
provides an objective, well-documented list of what must be changed in order
to strengthen brand relationships. Duncan and Moriarty (1997a:265) point out
that although the integration audit incorporates elements of traditional
communication audits, it differs in focus because the basic tenet is that all
elements of marketing and communication should be integrated and work
towards a common goal.
62
Duncan and Moriarty (1997a:65) maintain that the integration audit should be
undertaken by an outside, objective team and should be a census, not a
sample of the managers of all departments impacting on the brand
relationships. They also indicate that the objectives and benefits of the
integration audit are self-evident. According to Duncan and Moriarty
(1997a:275), personal interviews should be undertaken by trained
interviewers, onsite and should take about 90 minutes. The audit consists of
three basic interviewing instruments and additional optional in-depth tools.
The three basic interviewing tools are:
• Knowledge, Attitude and Practices Questionnaire - determines the
respondents’ knowledge of the marketing and marketing
communication plans and the targeted audience. Answers to these
questions are then compared to what employees are actually working
to accomplish.
• Communication Network Survey – a matrix of closed-ended questions
to pinpoint who talks to whom, how often, and about what.
• Content Analysis – of all marketing communications or planned
messages used by the company over the past 12 months to determine
whether the messages are consistent with marketing communication
objectives.
The complete audit is complex and can take a research team anywhere
between six and eight weeks to complete. For this reason, Duncan and
Moriarty (1997a:26) developed a shortened integrated mini-audit for use in
workshops and seminars. The integrated mini-audit is a greatly simplified
version with 20 questions aimed at providing a rough idea of where an
organisation stands on the integration scale. The integrated mini-audit focuses
on the following areas: organisational infrastructure, interactivity, mission
marketing, strategic consistency and planning and evaluation.

63
A limitation of the integration audits proposed by Duncan and Moriarty is that
they focus on measuring the effectiveness of the brand message in improving
customer awareness with little focus on the role of employees in building
corporate brand equity.
3.3.5 Ten strategic drivers of integration
Duncan and Moriarty (1997a:15) identified ten strategic drivers used by
organisations benefiting from integration. They maintain that not all ten drivers
need to be fully in place before an organisation can benefit from integration,
because integration is a continuum. The drivers identified by Duncan and
Moriarty (1997a:15) can be divided into three categories:
Category one: Corporate focus
This category of drivers necessitates that top management focuses on
building relationships with customers and other stakeholders and not just
focus on making sales or transactions. Organisations need to get to know
their customers and build up customer information databases.
Category two: Corporate processes This category of drivers focuses on strategic consistency of brand messages.
This includes purposeful interactivity rather than mass media monologue,
marketing a corporate mission rather than just product claims, and using zero-
based planning rather than just tweaking last year’s plan.
Category three: Cross-functional planning and monitoring This category of drivers focuses on cross-functional, as opposed to
departmental, planning and monitoring. Cross-functional planning and
monitoring facilitates shared expertise and customer information so as to
enhance consistency. The aim is to create core competencies rather than just
communication specialisation and expertise. Using an integrated agency,
rather than a traditional, full-service agency is recommended and so too is
building and managing databases so as to retain customers, rather than
simply acquiring new customers.
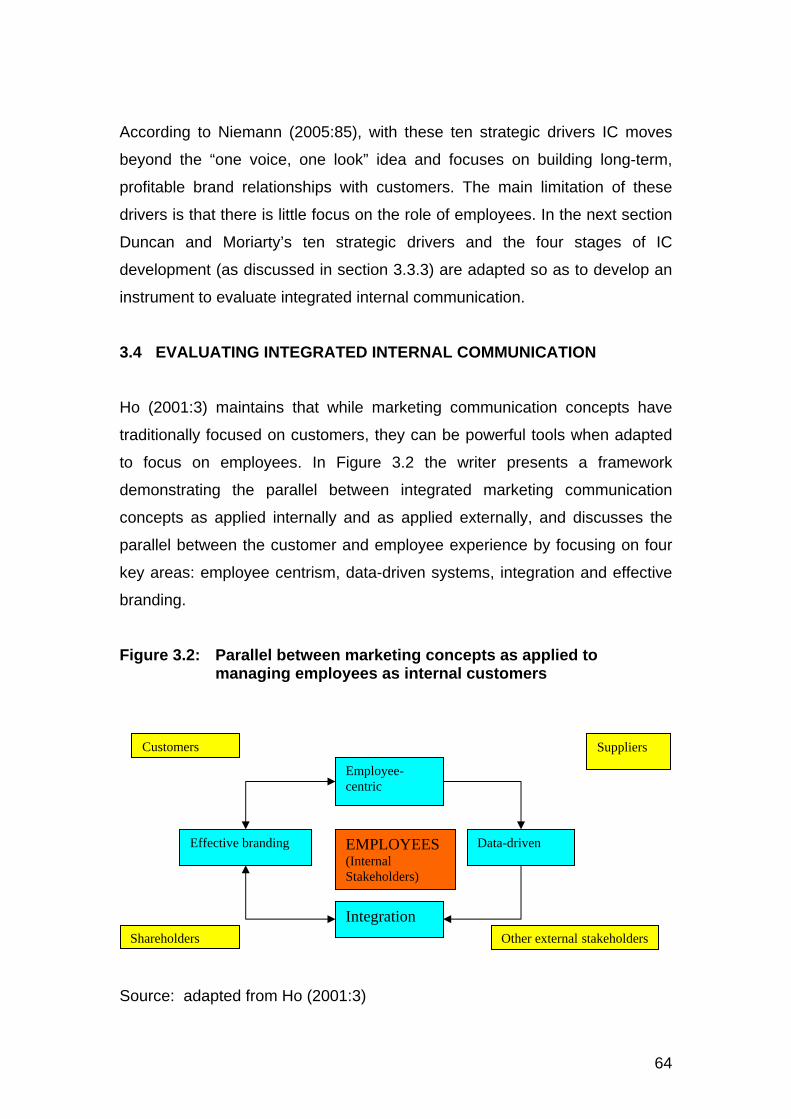
64
According to Niemann (2005:85), with these ten strategic drivers IC moves
beyond the “one voice, one look” idea and focuses on building long-term,
profitable brand relationships with customers. The main limitation of these
drivers is that there is little focus on the role of employees. In the next section
Duncan and Moriarty’s ten strategic drivers and the four stages of IC
development (as discussed in section 3.3.3) are adapted so as to develop an
instrument to evaluate integrated internal communication.
3.4 EVALUATING INTEGRATED INTERNAL COMMUNICATION Ho (2001:3) maintains that while marketing communication concepts have
traditionally focused on customers, they can be powerful tools when adapted
to focus on employees. In Figure 3.2 the writer presents a framework
demonstrating the parallel between integrated marketing communication
concepts as applied internally and as applied externally, and discusses the
parallel between the customer and employee experience by focusing on four
key areas: employee centrism, data-driven systems, integration and effective
branding.
Figure 3.2: Parallel between marketing concepts as applied to
managing employees as internal customers
Source: adapted from Ho (2001:3)
Employee-centric
Data-driven
Integration
Effective branding
Shareholders
Customers Suppliers
Other external stakeholders
EMPLOYEES (Internal Stakeholders)

65
Figure 3.2 illustrates the parallel between the customer and employee
experience through four key concepts. In order to achieve this, Ho (2004)
proposes that organisations adopt best practices. The first concept,
employee-centric, applies customer-centric concepts to employees as follows:
• In the same way that organisations listen to customers, organisations
need to listen to their employees and incorporate their feedback;
• Communication should be targeted to both internal and external
audiences; and
• The most effective medium should be used to communicate to
employees and customers.
The second concept in the framework relates to how the use of data to
personalise and mass customise products and services to create a better
customer experience can be applied to improve the employee experience.
The third concept in the framework relates to integration. The writer maintains
that integrating all touch points of customer contact is key to creating a
consistent brand image. The concept of integrating all employee touch points
should then be applied internally so as to ensure alignment with the corporate
brand. The last concept in the framework relates to effective branding. Here
the writer maintains that just as customers can demonstrate loyalty to a
company’s products, services and corporate brands, employees who feel
connected to their company tend to be more motivated and loyal.
The next section applies this framework to five strategic internal drivers based
on Duncan and Moriarty’s (1997a:15) ten strategic drivers.
3.4.1 Five strategic internal drivers for integrated internal communication
Although Duncan and Moriarty (1997a:15) ten strategic drivers apply
predominantly to the customer experience, Ho (2001) maintains that these
strategic drivers can be adapted and applied internally (see Figure 3.3).

66
In this study five of the ten strategic drivers identified by Duncan and Moriarty
have been selected and adapted to reflect the internal dimension. These five
strategic drivers have been selected because they are directly linked to the
five internal integration evaluation criteria (cross-functional planning and
monitoring, mission marketing, data-driven, employee-centric and maintaining
strategic consistency) and are appropriate to related research questions
identified in section 1.6 of this study. For integrated internal communication to
be realised, an organisation needs to focus on the following key areas:
1) People focus
• Employee-centric - creating and nourishing internal relationships with
employees by listening to, informing, valuing and empowering
employees. According to Ho (2001:3), companies that are employee-
centric have evaluated the role of communication within their
organisations and found ways to create an emotional connection with
employees through effective communication that is targeted,
customised and integrated. Ho (2001:1) maintains that companies can
no longer view employees as a resource whose primary function is to
produce goods. Rather, organisations are realising that IC starts with
motivated and responsive employees, which translates into happy
customers through customer-centric employee attitudes.
2) Processes
• Strategic consistency – communicating the same core values of the
company through every aspect of the employee’s experience, even at
times of crisis or during rapid growth periods. According to Ho (2001:6),
strategic consistency means that the same internal brand message is
communicated at all times, through every employee contact point,
including initial recruitment, through training, when compensated, and
incentivised, to information sharing and two-way communication
channels.
• Mission marketing – Internal mission marketing should develop a
positive feeling of identity between an employee and the company. Ho

67
(2001:6) maintains that employees that feel connected to their
company tend to be more motivated and loyal. This higher motivation
translates into improved productivity and higher employee retention,
which ultimately contributes to overall company performance.
Successful internal marketing can help employees understand that they
make a difference and create a sense of belonging to the organisation.
3) Infrastructure
• Cross-functional management – the way in which an organisation is
structured can create functional divisions, silos and
departmentalisation. Many organisations are realising that creating
cross-functional teams, rather than working in isolated silos, allows for
enhanced internal performance, which ultimately impacts on service
delivery.
• Data-driven – the extent to which employee information and behaviour
is captured and can be utilised as a strategic tool to enhance internal
communication within an organisation. Duncan and Moriarty (1997a:19)
maintain that information is a fundamental part of integration. How
employee data is collected, organised and shared determines the
extent to which an organisation takes advantage of internal
communication on multiple fronts. For example, employee access to
customer databases on the Intranet allows customer-facing employees
to establish personalised communication with outside customers. Ho
(2001:6) maintains that data can be captured and used to improve the
employee experience by creating a web-based knowledge base that
plays a role on multiple fronts including: recruitment, measuring high
performance, succession planning, information sharing and keeping
track of employee concerns and major issues.

68
Figure 3.3: Strategic drivers of integrated communication
Source: adapted from Duncan and Moriarty (1997a:16)
3.4.2 The four stages of integrated internal communication
The four stages of IC development as discussed in section 3.3.3 have been
adapted so as to reflect four stages of integrated internal communication.
A White Paper developed for the Forum of People Performance Management
and Measurement (FPPMM) entitled: Motivating employees to embrace
integrated marketing (2005) focuses predominantly on the first two stages of
Schultz and Shultz’s four stage development model. Drawing from Schultz
and Schultz (1998), this paper, referred to from here on as the FPPMM
(2005), looks at ways of motivating employees to think and cooperate beyond
their functional silos. Elements from the FPPMM (2005) have been applied to
Shultz and Schultz’s (1998) four stages of IC development in developing
the four stages of integrated internal communication.
CORPORATE FOCUS 1) Creating and nourishing customer relationships 2) Stakeholders Focus
CORPORATE PROCESSES 3) Strategic consistency 4) Purposeful interactivity 5) Mission marketing 6) Zero-based planning
INFRASTRUCTURE 7) Cross-functional management 8) Data-driven 9) Core Competencies 10) Integrated agency
PEOPLE FOCUS 1) Creating and nourishing employee-centric internal relationships.
PROCESSES 2) Strategic consistency 3) Mission marketing
INFRASTRUCTURE 4) Cross-functional management 5) Data-driven
INTE
RN
AL
EXTE
RN
AL

69
Stage one: Tactical coordination. Organisations need to communicate the
same, strategically consistent vision, core values and brand message of the
company through every aspect of the employee experience. The emphasis at
this stage is on the development of overall internal communication policies
and practices and delivering “one sight, one sound” messages. IC at this
stage refers to consistent messages – the “one look, one voice” approach. Stage two: Redefining the scope of integrated internal communication.
According to the FPPMM (2005:4), the goal at this stage is to ensure that
every employee lives the brand mission and is not just following the dictates of
senior management. Organisations begin to examine communication from the
employee’s point of view, asking if the same internal brand message is
communicated at every employee contact point. An organisation’s internal
mission marketing needs to go a step further at this stage and develop
positive feelings of identity between employees and the company. According
to the FPPMM (2005:4), a full-scale internal marketing campaign energises
employees by not only underscoring senior management’s commitment to
ensuring a customer-focused organisation, but by enabling employees to
participate in and own the brand mission. According to the FPPMM (2005),
rewards and incentives need to be aligned with meeting customer-centric
objectives and employees need to be actively motivated to live the brand
mission. IC goes further than the “one look, one voice” approach, to include a
concord of organisational procedures, purpose and achievements.
Stage three: The application of information technology. Employee
information and behaviour is captured and used as a strategic tool to enhance
internal communication. Organisations make use of empirical data,
behavioural data and web technology (intranet for information sharing) to
enhance internal communication on multiple fronts.
Stage four: Financial and strategic integration. According to the FPPMM
(2005:7), a relatively new and important finding is that organisations that place
a high emphasis on employees and connect them to strategy will perform
70
better financially. At this level organisations need to apply employee-centric
concepts by listening to, informing, valuing and empowering employees.
Furthermore, the FPPMM (2005:8) indicates that the adoption of an integrated
approach runs counter to ingrained processes within most organisations,
where functional silos are the norm. According to Kitchen et al (2004:27), the
way in which a firm is put together is the most challenging problem of
integration. According to the results of a survey in the FPPMM (2005:8), over
50% of respondents listed organisational structure as a key factor that
hindered integration. At this stage organisations ensure that internal structures
do not create functional divisions and departmentalisation. Furthermore, the
most powerful incentive for integration within an organisation is having it
mandated by senior management (FPPMM 2005:8). Senior management
sponsorships of integration require an overall structural change: specifically,
an orientation towards employees, who in turn need to be motivated and
incentivised to adopt a customer-centric orientation.
According to Schultz and Schultz (1998:351 organisations with a consumer
focus create cross-functional teams to concentrate on the needs of the
consumer or customers. By creating an employee-centric environment,
employees feel secure, motivated and empowered to understand and best
serve consumer needs and perspectives. Ho (2001:2) maintains that
companies should not see employees as a resource whose primary function is
to produce goods. Rather, employees should be seen as important
stakeholders with a direct impact on the bottom line. Attracting and retaining a
company’s internal stakeholders should be just as important as attracting and
retaining customers.
Organisations with a customer-centric approach focus on acquiring, retaining
and upgrading consumers. This is expressed as customer lifetime value
(CLV). Effectively an employee-centric approach would start with the
employee, building employee lifetime value (ELV). An ELV approach
underscored by management’s commitment to driving integration internally
and externally would relate directly to the bottom line. It is as important to
71
acquire, retain, and maintain quality employees as it is to acquire, retain and
maintain customers and consumers (FPPMM 2005:11).
3.5 PROPOSED INTEGRATED INTERNAL COMMUNICATION (IIC) ANALYSIS
To meet the first objective of this study, elements of Ho’s (2001) framework
(see Figure 3.2), together with Duncan and Moriarty’s (1997a:15) ten strategic
drivers, adapted for internal use in section 3.4.1 and linked to the five key
research questions of this study, were used to develop an instrument for
evaluating integrated internal communication.
The four stages of IC development as identified by Schulz and Schultz (1998)
are also adapted so as to reflect four stages of integrated internal
communication. In meeting the third objective of this study the key internal
integration evaluation criteria with related research questions in section 1.6
are measured against the four stages of integrated internal communication so
as to evaluate the extent to which integrated internal communication is
practiced at ICG.
This is represented in Figure 3.4.

72
Figure 3.4: Instrument for evaluating integrated internal communication
PRIMARY RESEARCH OBJECTIVE: to develop an instrument, using elements of existing audits, to evaluate integrated internal communication
General Systems Theory and Contingency Theory GRAND THEORIES
Theoretical domains
INTEGRATED COMMUNICATION
INTERNAL COMMUNICATION
Exis
ting
audi
ts/m
easu
ring
tool
s
Ten strategic drivers (Duncan and Moriarty 1997) Integration audit and mini-audit Duncan and Moriarty (1997a, 1997b) The Renaissance Communicator (Gayeksi and Woodward 1996) Four Stages in IC Development (Schultz and Kitchen 2000, Schultz and Schultz 1998).
ICA communication audit Survey for Organisational Communication (DeWine and James 1988) Information Systems Analysis (Gayeski 2000) Ho (2001) FPPMM (2005)
Development of Integrated Internal Communication (IIC) analysis • Five key internal integration evaluation criteria: cross-functional planning; mission marketing, data-
driven; employee centricism; and strategic consistency with related research questions. • Five internal strategic drivers for integrated internal communication (adapted from Duncan and
Moriarty’s ten strategic drivers)
RESEARCH OBJECTIVE TWO: To use the developed instrument to evaluate and measure employee perceptions of communication efforts at ICG Cape Town over the period 1 September 2004 – 31 August 2005.
Four states of integrated internal communication: Stage one: Tactical coordination of communication Stage two: Redefining the scope of communication Stage three: Application of information technology Stage four: Financial and strategic integration
RESEARCH OBJECTIVE THREE: To determine the extent to which integrated internal communication is practiced at ICG.
RESEARCH OBJECTIVE FOUR: To test the shortcomings of the proposed instrument

73
3.5.1 Appling the five evaluation criteria to IIC
The key evaluation criteria with related research questions as discussed in
section 1.6 are explained in more detail in this section. The aim is to apply
and demonstrate the relevance of the five evaluation criteria in relation to the
practice of IIC.
3.5.1.1 Cross-functional planning and monitoring
In a study by Rodney (2000:6) despite efforts, cross-functional or
departmental communication was found to be extremely poor. According to
Rodney (2000), modern organisational structures, that facilitate cross-
functional teams, forced employees to understand consumer needs and the
customer perspective, because ultimately each team serviced the customer.
With a customer end-point in mind, employees who ordinarily did not have any
contact with customers were put into contact with the customer perspective.
Creating cross-functional teams at ICG for example, might empower
employees to feel a part of the greater whole and understand how they touch
student’s lives. Rather than departments working in structural silos, with little
or no contact with students, cross-functional teams could enhance employee
performance, ultimately impacting on service delivery.
3.5.1.2 Mission marketing
For successful mission marketing, senior management needs to provide
visible leadership and vision, as well as articulate an organisation’s purpose.
Lower level managers are required to interpret the mission and values and
communicate these practically to their teams. According to a survey by Right
Management Consultants and the International Association of Business
Communicators (2005), 48% out of 472 organisations surveyed worldwide
maintained that management had not effectively communicated their business
strategies to employees. As a result, only about one-third, or 37% of
organisations reported that their employees were effectively aligned to the
missions and visions of their businesses. According to the survey, effective
leadership communication means that an organisation’s leaders have taken

74
the time to clearly and succinctly articulate the vision of the business. This
would entail management demonstrating how the vision can be ‘lived’ in their
daily jobs. At the senior leadership level, ongoing, consistent communication
is critical, even when there is nothing new or vital to communicate. Continual
communication from senior management builds trust and credibility.
3.5.1.3 Data-driven
Ho (2001) gives examples of how organisations can take advantage of web
technology to enhance communication on multiple fronts. In 1998 at a large
energy company, a Total Rewards intranet site was built, allowing employees
to create a personalised career plan, based on individual interests and goals.
The data for each individual was stored in a central database allowing
employees to revisit and track their goals and keep track of their careers. The
company blended high-touch with high-technology by allowing employees to
contact career counsellors telephonically so as to discuss their career paths.
A “talent database” capturing key employee skills was seen as an invaluable
resource for employees to share knowledge as well as for managers staffing
projects. At this company, for example, every employee profile included the
language they spoke and their areas of expertise. Employees looking for
peers, as well as management looking for specific expertise to staff projects,
could easily access this information through a “people search” function on the
intranet.
Ho (2001) cites employee service centers as another example of how the use
of data can improve the employee experience. Creating a knowledge base of
all possible employee benefits and compensation-related questions and
answers, enables companies to keep track of major employee issues and
concerns.
Similar to a customer database which tracks customer billings information and
allows a company to analyze who their most profitable customers are, a data-
driven approach can be used to help identify an organisations most valued or
high-performing employees. With information such knowledge, skills and
75
interests, the company can track career paths. A talent database can be
extended for succession planning where the most valued employees are
identified and matched with potential opening positions.
3.5.1.4 Employee-centric
According to Bizcommunity (2005), internal communication is vital for the
success of every organisation. There is now incontrovertible evidence that
good communication within organisations improves employee performance.
Well-informed employees are happier and work more productively. Ho (2001)
maintains that listening to employees is the first step towards open
communication. According to Ho (2001) for communication to be effective it
must be targeted appropriately. Although there is no ideal or best way to
communicate with employees, there are advantages in finding out how
employees prefer to be communicated with. The effectiveness of internal
communication tools, such as ICG’s internal newsletter, should be continually
monitored so as to determine whether or not the tool in questions is effective
(see Figure 5.8 and 5.9). The employee perception survey in this study asks
participants to indicate how they preferred to receive information (see Figure
5.7). However, Ho (2001) maintains that different communication tools and
strategies can be used at different times depending on the nature of the
communication.
3.5.1.5 Strategic consistency
According to Bizcommunity (2005), leadership alignment needs to take place
for brand participation to filter down to all levels of an organisation. Strategic
consistency entails the aligned of all processes and supporting systems,
within an employee focused environment. This is summed up by Richard
Branson. When asked who his customers were, he replied that his customers
were his staff (Bizcommunity 2005).
Ho (2001) maintains that to retain key talent within an organisation and meet
the changing expectations of employees, companies must find a way to
manage all the touch points employees have with the company. Integration

76
means that the same core values of the company must be clearly
communicated into every aspect of the organisation from initial recruitment
and training, to compensation and information sharing. Ho (2001) provides
examples of organisations recruiting potential employees based on cultural fit
and attitude, rather than skills base. In this instance, management contended,
that skills could be learned. The organisation’s primary was living the brand
values which were worked into every aspect of the employee’s experience.
3.6 CONCLUSION
This chapter discussed various IC and traditional internal communication
audits. The literature review traced the evolution of integrated communication
and the history of internal communication audits. It was argued that the
existing instruments consulted and evaluated under the literature review did
not sufficiently combine and measure communication integration and internal
communication.
Elements of existing integration instruments and traditional internal audits
were combined and adapted so as to develop a new measuring instrument,
namely the Integrated Internal Communication (IIC) analysis, which is aimed
at evaluating integrated internal communication and thereby meets the first
objective of this study.
In meeting the second objective of this study, the IIC analysis is used to
evaluate and measure employee perceptions of communication efforts at ICG
Cape Town over the period 1 September 2004 – 31 August 2005. The next
chapter discusses the research methodology.
.

77
______________________________________________________________
CHAPTER FOUR
RESEARCH METHODOLOGY
4.1 INTRODUCTION This chapter describes the research methodology used in this study. The IIC
analysis which was developed to evaluate integrated internal communication
is a multi-tiered measuring instrument. This new measuring instrument was
developed by adapting and combining elements from traditional internal
communication audits and IC audits and measuring instruments. The IIC
analysis has been developed for internal use, as a way of addressing the
gaps in traditional internal communication audits and IC measuring
instruments. The IIC analysis consists of two data gathering methods: a group
administered perception survey and personal interviews. This chapter
demonstrates the appropriateness of these methods, the research design,
measurement items and the data analysis methods. Lastly, ethical
considerations are explored.
4.2 RESEARCH OBJECTIVES According to Mouton (2001), the choice of methodology depends on the
research objectives. It is therefore appropriate to restate the research
objectives of this study.
The primary research objective of this study was to develop an integrated
internal communication instrument to evaluate IIC. The achievement of this
objective was described in Chapter 3, which explained how the IIC analysis
was developed by combining and adapting elements of traditional internal
communication audits and existing IC audits and measuring instruments.

78
The second research objective was to use the IIC analysis so as to evaluate
and measure employee perceptions of communication efforts at ICG Cape
Town over the period 1 September 2004 – 31 August 2005. The research
results are presented in Chapter 5.
In meeting the third objective of this study, research results are measured
against the four stages of integrated internal communication as discussed in
section 3.4.2, so as to determine the extent to which IIC is practiced at ICG.
The final research objective is to test the shortcomings of the IIC analysis.
4.3 RESEARCH STRATEGY The main function of a research strategy is to enable the researcher to
anticipate what the appropriate research decisions should be, so as to
maximise the validity of the eventual results (Niemann 2005). According to
Cooper and Schindler (2003:146), research studies can be classified as
exploratory or formal, depending on the degree of research development.
Exploratory studies are often used when little research has been conducted
on a specific topic. This study is explorative in nature as the primary research
objective is to develop a new measuring instrument so as to measure IIC.
Babbie and Mouton (2001:80) state that exploratory studies are essential
whenever a researcher is breaking new ground or developing new hypotheses
about an existing phenomenon.
Du Plooy (1995:32) maintains that exploration is an attempt to develop an
initial, rough understanding of some phenomenon. Using an exploratory
research strategy enables the researcher to generate new research questions
and problems. According to Niemann (2005), the most important research
design consideration that applies to exploratory research is the necessity of
following an open and flexible research strategy. Methods such as literature
reviews, interviews and case studies should lead to insight and
comprehension.

79
Baker (1999:204) asserts that a shortcoming of exploratory studies is that they
seldom provide satisfactory answers to research questions. Baker claims,
however, that exploratory studies do give insights into the research methods
that could provide definitive answers.
4.3.1 Research paradigm Mouton (2001:37) argues that the highest level of complexity in research is
referred to as methodological paradigms, including qualitative and quantitative
paradigms. Niemann (2005) describes qualitative research as a paradigm that
allows the researcher to obtain an “insider perspective on social action”.
Research in this study used a combined quantitative and qualitative research
paradigm, or what is known as a triangulated approach. The views of Du
Plooy (2001:82-84), Leedy (1993), Matveev (2002) and Mouton (2001:161) all
inform the identification of the differing characteristics of qualitative and
quantitative in Table 4.1, below.
Table 4.1: Key differences between quantitative and qualitative research
Quantitative research Qualitative research
Largely empirical or experimental Analytical and interpretative
Measures quantity or amount Examines phenomena in a holistic manner
Process oriented Outcome oriented
Unknown variables Known variables
Flexible guidelines Established guidelines
Usually inductive analysis Usually deductive analysis
Manipulates variables and attempts to
control natural phenomena
No attempt is made to control events or
extraneous variables
Constructs research questions or
hypotheses and “tests” them against
the facts of “reality
Researchers prefer to conduct their studies
in the field in an attempt to capture the
normal flow of events

80
Data is numerical Data is verbal
Linear research path, following a fixed
straight sequence of steps
Grounded or nonlinear research path, often
moving backward and sideways, gaining
new insights along the way
Source: Du Plooy (2001:82-84), Leedy (1993), Matveev (2002) and Mouton
(2001:161).
The advantage of using qualitative research methods is that the researcher
can view behaviour in natural surroundings, rather than in a laboratory or
artificial surroundings (Mouton 2001:161; Wimmer & Dominick 1983:49).
Qualitative methods are flexible, thus allowing researchers to explore new
ideas and concerns and to increase their depth of understanding throughout
the process. Such flexibility is important for this study, which is exploratory in
nature. Qualitative research can intensify a researcher’s depth of
understanding of the occurrence under investigation, enabling participants the
freedom to voice their opinions without restriction (Du Plooy 2001:82; Mouton
2001:161).
Shortcomings of qualitative research methods are often linked to a restricted
sample size. Niemann (2005:185) maintains that in qualitative research,
sample sizes are commonly too small to allow the researcher to generalise
the data beyond the sample selected for the specific study. To counter this
limitation, in this study qualitative research is conducted together with
quantitative research so as to enable a large sample size and allow for
generalisations. Furthermore, reliability of data can be difficult in qualitative
research, as single observations describe once-off events. Also, the
researcher is in close contact with respondents, which may result in a loss of
objectivity (Du Plooy 2001:32; Niemann 2005:185; Wimmer & Dominick
1983:49). In this study qualitative results do not replace objective quantitative
data; rather, a qualitative dialogue complements objective quantitative data
which eliminates or minimises subjectivity of judgment.
81
Another area of concern is that poor planning of qualitative research can
result in unconvincing results. This is, however, seldom the case when
qualitative research is complimented with quantitative data, as all variables
under investigation are specified clearly and precisely (Du Plooy 2001:32;
Matveev 2002).
4.3.2 Triangulation
An exploratory research study warrants a qualitative approach, as qualitative
research enables the gathering of in-depth information. Cooper and Schindler
(2003:151) note, however, that exploratory studies can use both qualitative
and quantitative studies. Recent debates on the relative strengths and
weaknesses of qualitative and quantitative research have shown that there is
a trend towards combining the approaches in a single study. This is known as
triangulation. Du Plooy (1995:33) describes triangulation as an attempt to
include multiple sources of data collection in a single research project, in order
to increase the reliability of the results and to compensate for the limitation of
each method. Van der Walt and Breet-van Niekerk (2006:348) describe
triangulation as a multi-method approach used to present a more complete
picture of the phenomenon than would be the case if only one method of
enquiry were used. In this study qualitative and quantitative strategies are
combined so as to enhance understanding of data gathered and to increase
the credibility of conclusions (Van der Walt & Breet-van Niekerk 2006:348).
In this study, data was collected via a triangulated approach, using qualitative
and quantitative methods of inquiry. During the research phase, a triangulated
approach yielded a number of benefits. For example, quantitative research
results from the group administered perception survey were overall very
positive. An added qualitative perspective, however, enabled participants to
input answers unrestricted by pre-determined quantitative categories and this
revealed an entirely different perceptive. Matveev (2002) highly recommends
using both methods of inquiry so as to ensure high reliability of data,
understanding of the contextual aspects of the research, flexibility and
openness of the data collection, and a more holistic interpretation of the
research problem.
82
4.3.3 Pilot study
The purpose of a pilot study is to improve the success and effectiveness of
the questionnaire: modifications can be made after the pilot study and before
the questionnaires are given to other respondents (De Vos 1998:183).
According to Cooper and Schindler (2003:86), a pilot test can be conducted to
detect weaknesses in research design and instrumentation. During the
research for this study, a pilot test was conducted in August 2005.
In the first phase the opinions of the Chief Executive Officer (CEO) and
Advertising and Communications Manager of ICG regarding the content and
format of the questionnaire were obtained. Minor structural changes were
made and some wording revised.
In the second phase, under the guidance of the CEO and Advertising and
Communications Manager of ICG, five employees at various levels of the
organisation were selected from the sample to pilot the group administered
perception survey. The group met in the boardroom on Tuesday, August 30,
at 10:00 am. The purpose of the pilot test was to pre-test the readability, flow
and clarity of questions, as well as to establish the length of time necessary to
complete the survey and spot potential problem areas before “going live” with
the survey at group sessions. Participants took between 10 minutes and 30
minutes to complete the survey. The average mean was 14 minutes,
depending on the extent to which qualitative questions were answered. The
one participant who completed the survey in ten minutes offered very little by
way of qualitative comment. Based on the results of the pilot test, it was
decided to include a further open-ended question, inviting participants to input
their ideas about the future of the organisation. Question 24 was added (see
Appendix 1). The question asks “if you were made CEO of ICG for one day,
what changes would you make?” Other small cosmetic changes were made.
In question 15 the words “number 1 being your TOP choice” was added for
additional clarity (see question 15 – Appendix 1). The sentence “please tick
the appropriate circle” was added to relevant questions for added clarity.

83
In the third phase, personal interview questions were sent via e-mail to the
CEO and Advertising and Communications Manager of ICG on October 20
2005. The CEO and Advertising and Communications Manager were asked to
comment and provide suggestions for improvement. Both parties indicated
that the questions were adequate (see personal interview questions –
Appendix 2).
4.4 SAMPLING DESIGN
Du Plooy (2001:100) describes sampling as a rigorous procedure of selecting
units of analysis from a larger population. The choice of a specific sampling
technique is guided by the research objectives. The unit of analysis for the
purpose of this study is employees based at ICG’s head office. According to
Wimmer and Dominick (1983:69), the chances of investigating an entire
population are remote, if not non-existent. Therefore, a sample is drawn from
the population for research purposes. For the first method, the group
administered questionnaires; all employees based at the Cape Town head
office were invited to attend sessions at which the questionnaires were
administered. The CEO’s personal assistant was instrumental in dividing
Cape Town based employees into groups of 30 participants per session.
For the second method, personal interviews, 17 interviewees were selected
via purposive (judgmental) sampling. Niemann (2005:195) maintains that
purposive sampling is an acceptable type of sampling for special situations in
that it uses the judgement of an expert in selecting samples with a specific
purpose in mind. The CEO and Advertising and Communications Manager
were instrumental in selecting participants thought to be representative of the
organisation’s management team. This expert judgement was based on
insightful knowledge gained through many years experience within the
organisation. Selection was purposive as in order to qualify participants
needed to fulfil certain requirements, such as: working for the organisation for
at least one year; understanding the organisation’s systems and processes;
and exposure to the internal branding campaign in the period September 2004
(section 1.3.3).

84
4.5 RESEARCH METHOD Primary data was collected through two methods, a group administered
communication perceptions survey and personal interviews.
4.5.1 Group administered communication perception survey
Du Plooy (1995) maintains that the main advantage of using a group
administered method of collecting data is the high rate of response. All
respondents are present and complete the questionnaire at the same time.
The data-collection time is thereby also shorter. This method enables the
researcher to explain the purpose of the survey to groups and to answer any
questions that may arise.
Du Plooy (1995:131) notes that one disadvantage to this method is that often
it is not easy to assemble in one place and at one time a sample that
represents a diverse population. As a result, the researcher might be tempted
to use a convenience sample.
The CEO of ICG decided to change the method of his regular quarterly review
and update information session. Rather than have one large en masse
session or send a lengthy e-mail update, the CEO opted to hold a number of
one-hour personalised small group sessions. The aim of the sessions was to
explain and communicate to all employees ICG’s success strategy and to
indicate to each employee how they fitted into the bigger picture and
contributed to the organisation. The CEO agreed that this was an ideal
opportunity to administer group administered surveys.
4.5.1.1 Selection
The group administered communication perception survey at ICG’s head
office in Cape Town was carried out over ten sessions, in the period 1
September - 9 September 2005. Of 320 employees based at the Cape Town
head office, 254 (80.3%) attended sessions and completed the survey. The

85
CEO of ICG addressed approximately 30 employees per session in the ICG
boardroom, over a two-week period.
4.5.1.2 Method followed
At each session the CEO discussed ICG’s performance over the past year.
The organisation’s strategic direction, goals for the remainder of 2005 and
2006, and problem areas and concerns were discussed. Employees were
invited to ask questions or make recommendations. At the end of each
session, the CEO encouraged employees to complete a survey within the
group situation before leaving the boardroom. The CEO explained the
purpose of the survey and answered questions. Of employees who attended
sessions 98% readily agreed to complete the survey, which took between ten
and fifteen minutes to complete. Once all questions had been answered, the
CEO left the boardroom so as not to put undue pressure on employees, and
the rest of the session was monitored by the researcher, who attended all
sessions and was available to answer any queries.
According to Sinickas (2004), if a CEO or senior management want to see
high response rates they need to show support for the process by giving
employees time to complete the audit. Sinickas (2004) believes that incentives
are always well received and group administered surveys in small meetings
get the best response rates. Once the surveys had been completed and
placed in a box, employees were thanked and received a chocolate in
appreciation.
All employees based at the Cape Town head office were invited to attend
sessions in their clusters. Depending on size, some departments were
grouped together as follows:
86
Session Department Session one Enrolments; enquiries and mail room Session two Finance, IT, HR and quality
assurance Session three Session four
Call centre Call centre
Session five Stores Session six education publishing, copywriters,
editors, proof readers Session seven Maintenance, drivers, reception and
tea ladies Session eight Tutorial and academic heads Session nine Learning solutions, call centre, credit
and Xoanon, (the advertising and marketing department at ICG is known internally as Xoanon).
Session ten Marketing and commercial 4.5.1.3 Group administered perception survey format
The group administered perception survey (see Appendix 1) included both
closed (quantitative) and open-ended (qualitative) questions. Perception
survey questions ran in line with Tourish and Hargie’s (1996:38) reasoning
that internal communication audits are suitable for evaluating information flow
between managers and staff; providing a comprehensive picture of how much
information key sections of the organisation are receiving and sending; and
establishing through which channels such information flows, as well as what
the preferred channels are, and what the level of interpersonal trust is. The
survey evaluated the extent to which ICG is an employee-centric organisation
by measuring and evaluating whether employees felt listened to, valued,
informed and empowered. The inclusion of a number of open-ended
questions enabled respondents to express their views about the kind and
quality of relationships experienced at ICG, thereby securing employee
feedback. According to Tourish and Hargie (1996:39), it is often difficult to
secure employee feedback from subordinates, and especially so when it
comes to rating superiors. For this reason the perceptions survey was
anonymous. Open-ended questions were coded and linked to the five key
internal integration evaluation criteria and research questions as identified in
section 1.6. Key internal integrated evaluation criteria, namely cross-functional

87
planning and monitoring; mission marketing; data-driven; employee-centric;
and maintaining strategic consistency were linked to the internal strategic
drivers for integrated internal communication (see section 3.4.1).
Table 4.2 lists group administered perception survey questions (see Appendix
1) according to their quantitative or qualitative status. In the first column of
Table 4.2 the survey question appears. In the second column the purpose or
reasoning behind the question is detailed. In the third column the question is
linked to the five integrated internal evaluation criteria.
Table 4.2: Aim of survey questions linked to evaluation criteria Question Aim Linked to which
evaluation criteria QUANTITATIVE QUESTIONS
Question 1 Overall how satisfied are you with communication at ICG?
To gauge overall employee satisfaction with the organisation.
Employee-centric
Question 3 Which best describes your impression of communication at ICG?
To evaluate quantity and quality of information received.
Employee-centric
Question 4 How do you feel about the information you receive from management?
To ascertain levels of trust in the organisation. Do employees believe the information they receive?
Employee-centric Strategic consistency Mission marketing
Questions 5 and 6 How satisfied are you with communication received from the CEO, EXCO, senior managers, middle managers, direct supervisors?
An attempt to pinpoint communication performance gaps. Participants ranked performance in order of preference.
Employee-centric and Strategic consistency
Question 7 How well do you know the company?
To ascertain if employees have developed a personal identity with the company?
Mission marketing and employee-centric
Question 8 Compared to last year this time, do you feel more or less informed about the company’s strategic goals
Has the internal communication drive helped employees in feeling more included, valued and informed
Mission marketing, strategic consistency and employee-centric
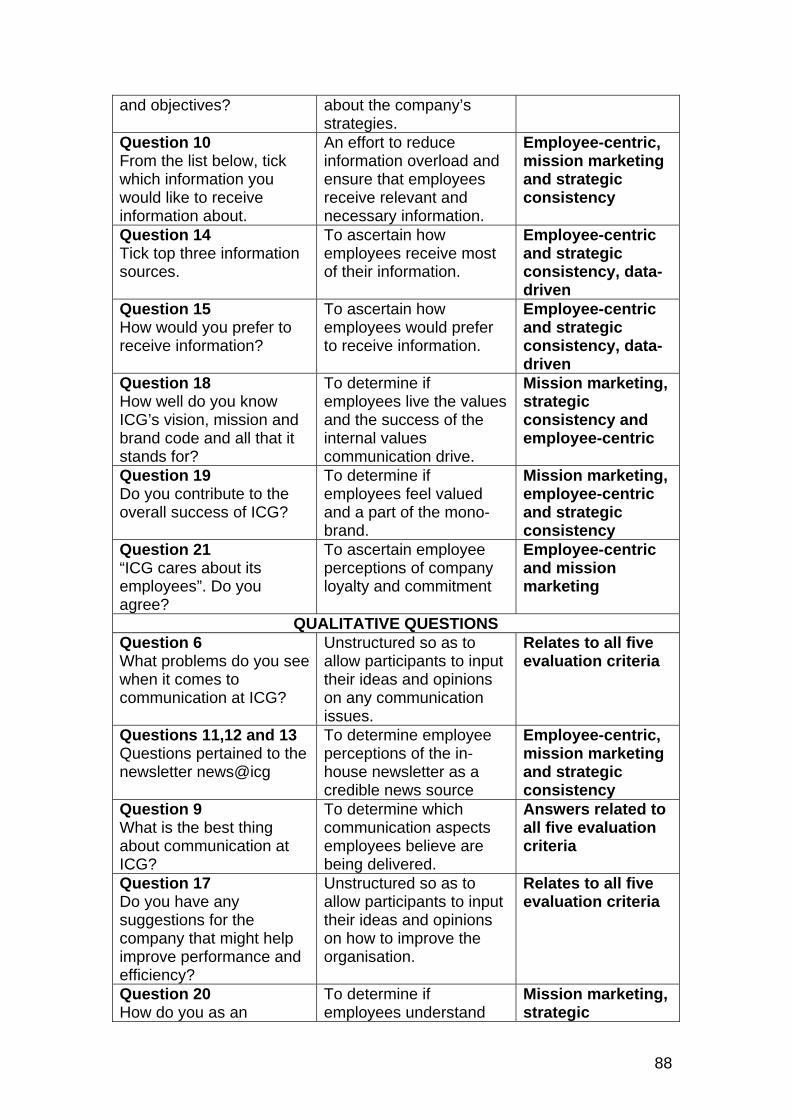
88
and objectives? about the company’s strategies.
Question 10 From the list below, tick which information you would like to receive information about.
An effort to reduce information overload and ensure that employees receive relevant and necessary information.
Employee-centric, mission marketing and strategic consistency
Question 14 Tick top three information sources.
To ascertain how employees receive most of their information.
Employee-centric and strategic consistency, data-driven
Question 15 How would you prefer to receive information?
To ascertain how employees would prefer to receive information.
Employee-centric and strategic consistency, data-driven
Question 18 How well do you know ICG’s vision, mission and brand code and all that it stands for?
To determine if employees live the values and the success of the internal values communication drive.
Mission marketing, strategic consistency and employee-centric
Question 19 Do you contribute to the overall success of ICG?
To determine if employees feel valued and a part of the mono-brand.
Mission marketing, employee-centric and strategic consistency
Question 21 “ICG cares about its employees”. Do you agree?
To ascertain employee perceptions of company loyalty and commitment
Employee-centric and mission marketing
QUALITATIVE QUESTIONS Question 6 What problems do you see when it comes to communication at ICG?
Unstructured so as to allow participants to input their ideas and opinions on any communication issues.
Relates to all five evaluation criteria
Questions 11,12 and 13 Questions pertained to the newsletter news@icg
To determine employee perceptions of the in-house newsletter as a credible news source
Employee-centric, mission marketing and strategic consistency
Question 9 What is the best thing about communication at ICG?
To determine which communication aspects employees believe are being delivered.
Answers related to all five evaluation criteria
Question 17 Do you have any suggestions for the company that might help improve performance and efficiency?
Unstructured so as to allow participants to input their ideas and opinions on how to improve the organisation.
Relates to all five evaluation criteria
Question 20 How do you as an
To determine if employees understand
Mission marketing, strategic
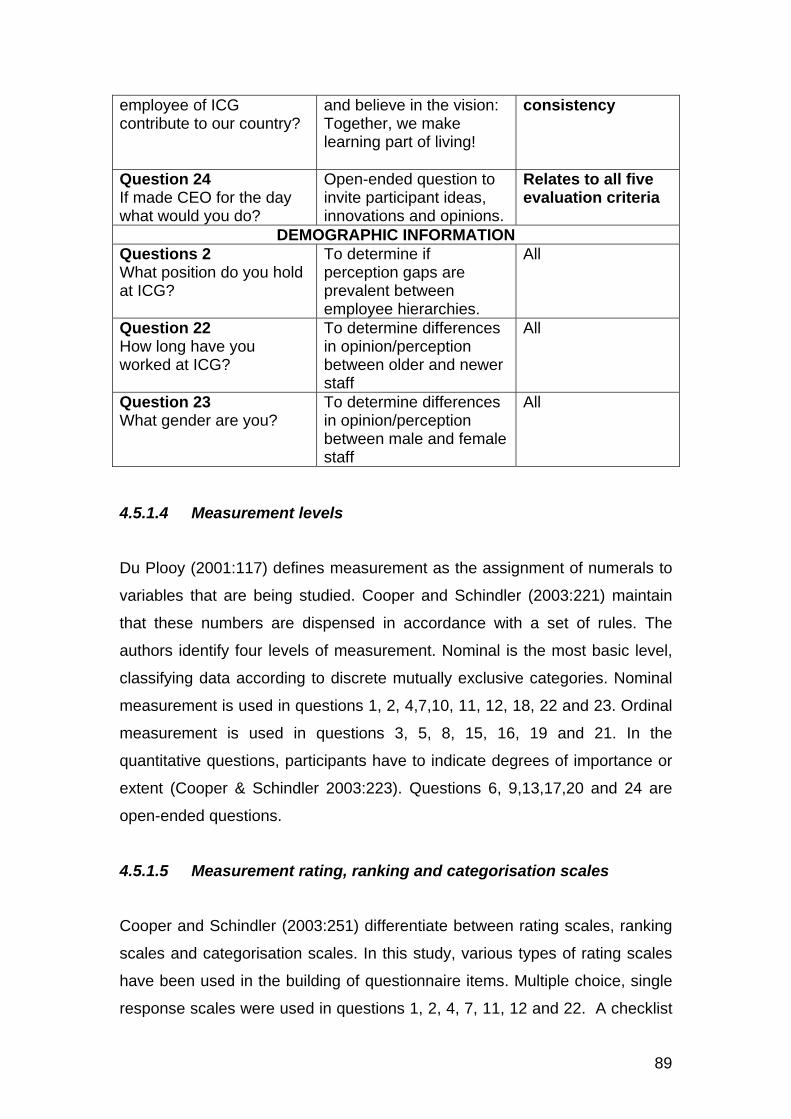
89
employee of ICG contribute to our country?
and believe in the vision: Together, we make learning part of living!
consistency
Question 24 If made CEO for the day what would you do?
Open-ended question to invite participant ideas, innovations and opinions.
Relates to all five evaluation criteria
DEMOGRAPHIC INFORMATION Questions 2 What position do you hold at ICG?
To determine if perception gaps are prevalent between employee hierarchies.
All
Question 22 How long have you worked at ICG?
To determine differences in opinion/perception between older and newer staff
All
Question 23 What gender are you?
To determine differences in opinion/perception between male and female staff
All
4.5.1.4 Measurement levels
Du Plooy (2001:117) defines measurement as the assignment of numerals to
variables that are being studied. Cooper and Schindler (2003:221) maintain
that these numbers are dispensed in accordance with a set of rules. The
authors identify four levels of measurement. Nominal is the most basic level,
classifying data according to discrete mutually exclusive categories. Nominal
measurement is used in questions 1, 2, 4,7,10, 11, 12, 18, 22 and 23. Ordinal
measurement is used in questions 3, 5, 8, 15, 16, 19 and 21. In the
quantitative questions, participants have to indicate degrees of importance or
extent (Cooper & Schindler 2003:223). Questions 6, 9,13,17,20 and 24 are
open-ended questions.
4.5.1.5 Measurement rating, ranking and categorisation scales
Cooper and Schindler (2003:251) differentiate between rating scales, ranking
scales and categorisation scales. In this study, various types of rating scales
have been used in the building of questionnaire items. Multiple choice, single
response scales were used in questions 1, 2, 4, 7, 11, 12 and 22. A checklist

90
or multiple choice, multi-response scale is used in questions 10 and 14. A
simple category scale is used in question 23, where participants could specify
either “male” or “female”.
Multiple rating list scales are used in questions 5 and 15. According to Cooper
and Schindler (2003:252), these scales acknowledge that an object or
occurrence can be depicted in terms of multiple dimensions. Questions 3, 8,
16, 19 and 21 used uni-dimensional scaling with five-scale points. Question
10, a close-ended question, provided the option to choose “other” and then
specify.
Questions 6, 9,13,17,20 and 24 were open-ended questions.
4.5.1.6 Data analysis
A dissimilar type of data analysis is required for open-ended and close-ended
questions.
Various types of measurement scales were used in the close-ended
questions. Questions that used multiple choice single-response scales
(questions 1, 2, 4, 7, 11, 12 and 22) and multiple choice multi-response scales
(questions 10 and 14) provided nominal data. Statistical analysis for nominal
data was presented visually with bar and pie charts using Microsoft Excel.
Descriptive statistics were used to calculate the mean and standard deviation
values for each variable for questions 5 and 15, which used multiple rating
scales. The measurement scale used in question five consisted of 5 points. .
The measurement scale used in question 15 consisted of 9 points. The mean
variables in each question are presented graphically by means of bar charts.
According to Cooper and Schindler (2003:460), various content analyses can
be used to code and analyse responses to open-ended questions. According
to Barker and Angelopulo (2004:251), data investigated by content analysis
consist of collections of encoded symbols or messages used in
91
communication. The writers maintain that as a research tool, content analysis
is used to determine the significance of certain words or concepts within texts.
The meanings and relationships of words and concepts are then quantified
and analysed by the researcher, who makes inferences about the messages.
They maintain that in the field of organisational communication research,
content analysis can be used to identify the intentions, focus or
communication trends of an individual, group or organisation, or to describe
attitudinal and behavioural responses to communication within an
organisation.
Raw data was transformed into a form suitable for analysis through a process
called coding. Following the pattern of analysis and coding that is suggested
by Strauss and Corbin (1990), open coding was used to scrutinise the data.
Labels were used to identify a range of phenomena and create specific
categories (see Appendix 3).
Specific categories were divided into meaningful groups, into which units of
analysis could be placed. Du Plooy (2001:191) differentiates between
syntactical, thematic, referential and propositional units of analysis.
Syntactical units are words, phrases, sentences or paragraphs; referential
units are objects, events or persons referred to in the text; propositional units
include questions, answers, statements, assertions, and arguments; and
thematic units are repeating patterns of ideas or issues (Cooper & Schindler
2003:461; Du Plooy 2001:191). Content analysis was used to code and
analyse responses to questions 6, 9,13,17,20 and 24. Various syntactical
units or phrases were identified in the responses (see Appendix 4).
Clear directions on how to complete the questionnaire were stated at the top
of the questionnaire, with clear instruction above each question. A brief thank
you note appeared at the end of the survey.

92
4.5.1.7. Validity
As a result of illness, work pressures or for other reasons, not all employees
attended the allotted sessions. Approximately 5% of employees left sessions
without filling in surveys. Some surveys were not completed correctly, with
unanswered questions or sections. Some surveys were handed in without any
answers. Other factors that limited evaluation were illegible handwriting,
incorrectly filled in questions (especially for rank order questions), and
answers that were misdirected or off the mark. In total, 80.3% of employees
attended the sessions and completed the surveys (254 out of 320
employees). Of the remaining 19.7% of employees who did not fill in surveys -
12% did not attend sessions and 2% opted to leave the boardroom without
filling in surveys. Of surveys received 5% where either handed in without any
data, or were illegible to the extent that no information could be accurately
captured.
Prior consultation with the CEO and the Advertising and Marketing Manager
of ICG regarding questionnaire content helped to improve the validity of the
perceptions survey. A major limitation of this study was the CEO advising
against the distribution of survey questionnaires to all employees within the
ICG stable. The survey is therefore representative of only 40.1% of total staff
at ICG.
The survey did not successfully measure inter-departmental communication
and whether or not participants felt as if they worked in a silo environment.
The majority of questions used five scale points; however, seven or more
points might have produced greater sensitivity of measurement.
4.5.1.8 Reliability
To enhance reliability the perception survey was piloted. The high number of
new staff members impacted on reliability. Almost 50% of respondents who
completed surveys had been with the organisation for less than one year. As
a result, they were unable to answer questions pertaining to the values rollout

93
in 2004, as well as the question pertaining to whether or not they felt more or
less informed about ICG’s goals and strategies compared to a year ago.
4.5.2 Personal interviews The second research tool determined levels of integrated internal
communication using the IIC analysis. Van Vuuren, Maree and De Beer
(1998:406) maintain that, because of the personal contact with respondents,
there is a high question completion and response rate during face-to-face
personal interviews. Respondents are less likely to ignore a person sitting in
their office than a written questionnaire with no-one administering responses.
Another advantage is interviewers can use follow-up questions, which invite
participants to talk more about the topic from their own point of view.
Participants can be asked to expand or explain answers. In this study
interview questions were drawn up in advance. Although the interviews were
“semi-structured”, qualitative data collection was relatively relaxed, often
resulting in emotive discussion.
Semi-structured personal interviews were scheduled over a full two-day period
with 17 ICG employees. Interviews were held at the ICG head office in Cape
Town. Interviews commenced at 09h00 on 31 October 2005 and ran at half an
hour intervals for the duration of the day, ending at 16h30. Interviews were
concluded on 2 November 2005. Each interview lasted approximately 30
minutes. Extensive notes were made during all interviews in an attempt to
closely record precise comments made by participants.
The interview questions formulated were based on Duncan’s (2001:728)
integrated mini-audit format, to which a qualitative dimension was added, and
also on broader research in the field of integration (see Appendix 2).
Interviews were semi-structured, consisting of nine questions, each pertaining
to one of the five key internal integration evaluation criteria identified in this
study (see section 1.6) and to one of the five identified strategic internal
drivers for integration internal communication (see section 3.4.1).

94
Interviewees were each asked nine questions. Four of the key internal
integration evaluation criteria (mission marketing, strategic consistency, cross-
functional planning and monitoring) listed in Table 4.3 have one open-ended
and one closed-ended question. A final open-ended question is linked to one
of the key internal integration evaluation criteria: employee-centric.
Table 4.3 Personal interview questions linked to key criteria/drivers
Questions Five key internal integration evaluation criteria/strategic drivers
Data analysis
Question one To what extent is employee information and behaviour captured and used as a strategic tool to enhance communication at ICG?
DATA-DRIVEN Quantitative Measurement scales
Question two How does ICG take advantage of web technology to enhance internal communication on multiple fronts?
DATA-DRIVEN Qualitative Idiosyncratic insights supported by textual analysis (verbal)
Question three Does ICG’s internal mission marketing develop a positive feeling of identity between employees and the company?
MISSION MARKETING
Quantitative Measurement scales
Question four ICG recently communicated its vision, mission and values to Cape Town based employees. In your opinion, how successful was this campaign and why?
MISSION MARKETING
Qualitative Idiosyncratic insights supported by textual analysis (verbal)
Question five Does ICG communicate the same core values and brand messages of the company through every aspect of the employee experience?
STRATEGIC CONSISTENCY
Quantitative Measurement scales
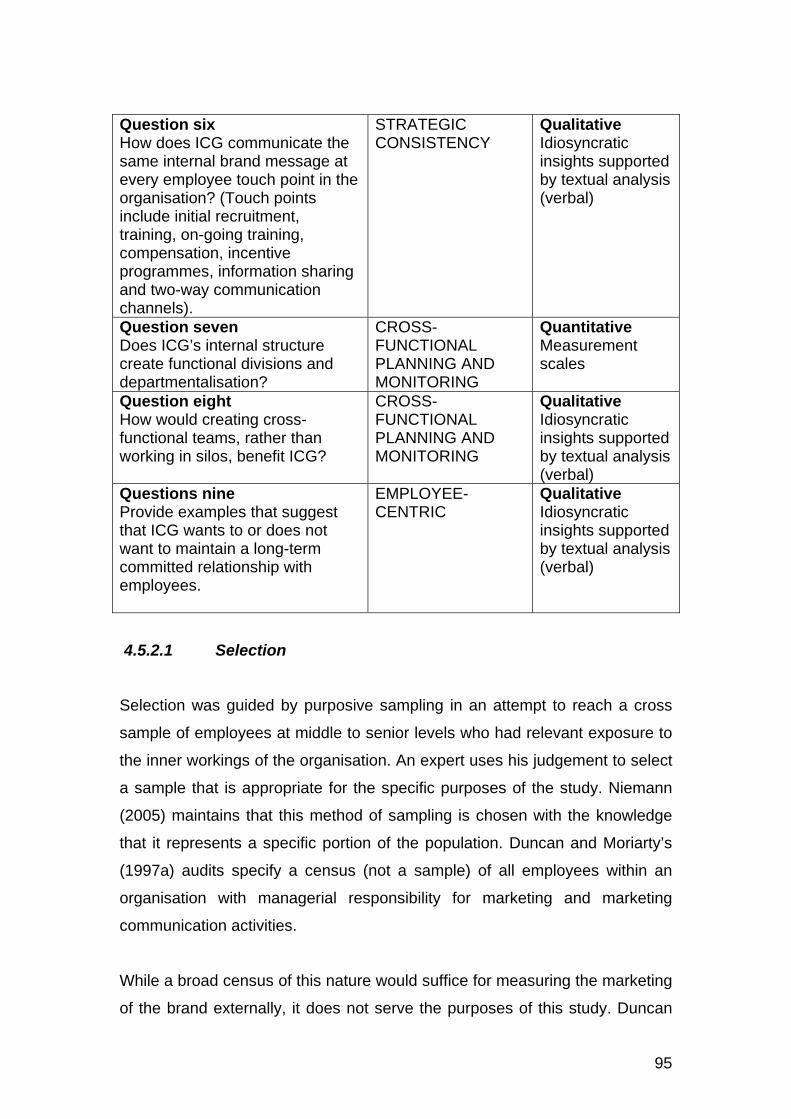
95
4.5.2.1 Selection
Selection was guided by purposive sampling in an attempt to reach a cross
sample of employees at middle to senior levels who had relevant exposure to
the inner workings of the organisation. An expert uses his judgement to select
a sample that is appropriate for the specific purposes of the study. Niemann
(2005) maintains that this method of sampling is chosen with the knowledge
that it represents a specific portion of the population. Duncan and Moriarty’s
(1997a) audits specify a census (not a sample) of all employees within an
organisation with managerial responsibility for marketing and marketing
communication activities.
While a broad census of this nature would suffice for measuring the marketing
of the brand externally, it does not serve the purposes of this study. Duncan
Question six How does ICG communicate the same internal brand message at every employee touch point in the organisation? (Touch points include initial recruitment, training, on-going training, compensation, incentive programmes, information sharing and two-way communication channels).
STRATEGIC CONSISTENCY
Qualitative Idiosyncratic insights supported by textual analysis (verbal)
Question seven Does ICG’s internal structure create functional divisions and departmentalisation?
CROSS- FUNCTIONAL PLANNING AND MONITORING
Quantitative Measurement scales
Question eight How would creating cross-functional teams, rather than working in silos, benefit ICG?
CROSS- FUNCTIONAL PLANNING AND MONITORING
Qualitative Idiosyncratic insights supported by textual analysis (verbal)
Questions nine Provide examples that suggest that ICG wants to or does not want to maintain a long-term committed relationship with employees.
EMPLOYEE-CENTRIC
Qualitative Idiosyncratic insights supported by textual analysis (verbal)

96
and Moriarty (1997b) stipulate that externally the audit should include creative
directors in key marketing communication agencies, as well as other relevant
stakeholders with direct involvement in, or impact on, marketing
communication. In this study no appropriate external agencies were identified
as having a direct bearing on internal communication at ICG. Rather, selection
for interviews was guided by purposive sampling. The CEO and the
Advertising and Communication Manager of ICG provided a list from a cross-
section of employees in different departments. The list included employees
from the advertising and human resources departments, as well as divisional
managers and marketing and business managers.
4.5.2.2 Personal interview format
Pre-planning meeting: September 2005 An orientation meeting took place with the CEO and the Advertising and
Communication Manager of ICG to discuss the relevance of the proposed
personal interview questions. Questions were reviewed and customised. A list
of employees to be interviewed was agreed upon. Timetables for interviews
were determined and the CEO’s personal assistant was assigned to set up
the interview schedule. The CEO sent out a letter explaining the process to all
participants.
Personal interviews: October 31 and November 3, 2006 Personal interviews were carried out on site, with identified employees seated
at their desks in the Cape Town head office. Each interview took
approximately 30 minutes. Detailed notes of interviewee comments were
taken at each session.

97
Table 4.4: Personal interview schedule
Position Time of interview
MONDAY, OCTOBER 31, 2005
Procurement Manager 09h00-09h30 Financial Manager 09h30-10h00 Colleges Manager 10h00-10h30 HR Executive 10h30-11h00 Learning Solutions Manager
13h00-13h30
IT Senior Manager 14h30-15h00 Publishing Operations Manager
15h00-15h30
Senior Manager 15h30-16h00
WEDNESDAY, NOVEMBER 2, 2005
Creative and Vocational School Business Manager
09h00-09h30
Business School Manager
09h30-10h00
Creative Director 10h00-10h30 Technical School Business Manager
11h30-12h00
Media Planner 13h00- 13h30 Below the Line Direct Response Planner
14h00-14h30
Product Marketing Manager
Missed Interview
Advertising and Communication Manager
Missed interview
Commercial Executive On maternity leave
4.5.2.3 Data analysis
Quantitative mode of analysis
To add depth to the data collected, ordinal interval measurement is used. In
these questions, participants have to indicate degrees of importance or extent
(Cooper & Schindler 2003:223). Ordinal interval measurement (see section
4.5.1.4) was used for questions 1, 3, 5 and 7, where participants were asked
to indicate degrees of importance or extent using uni-dimensional scaling (see
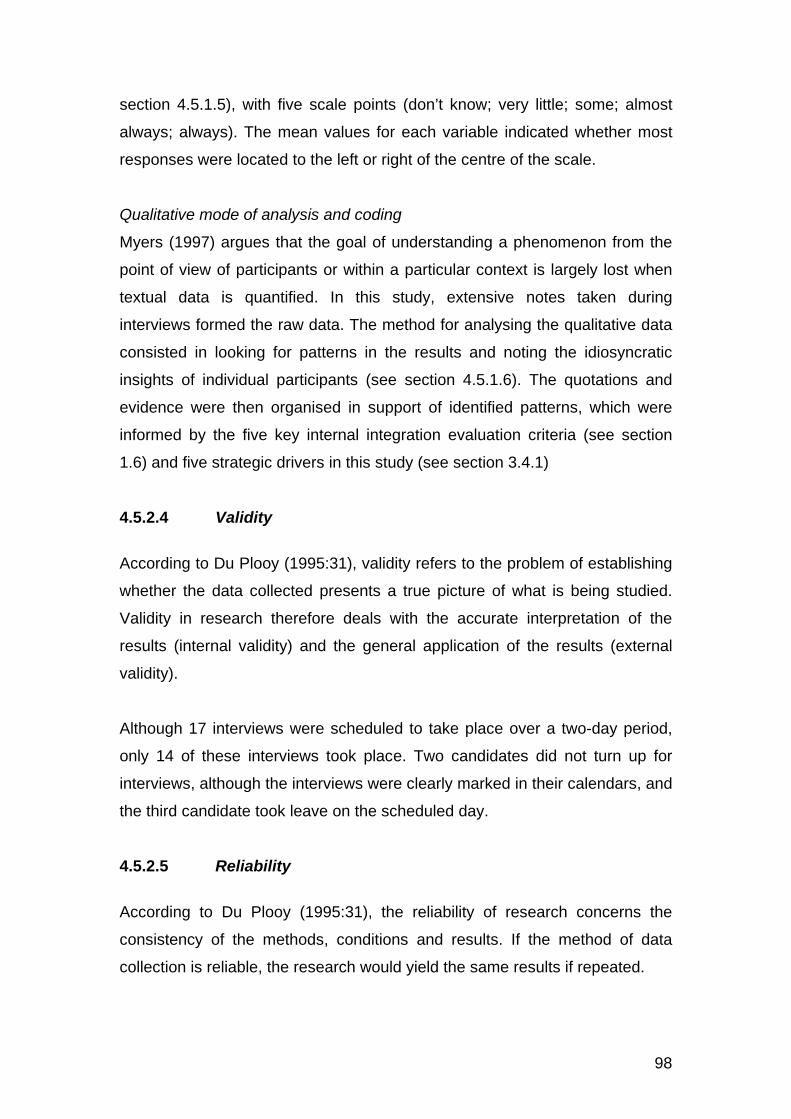
98
section 4.5.1.5), with five scale points (don’t know; very little; some; almost
always; always). The mean values for each variable indicated whether most
responses were located to the left or right of the centre of the scale.
Qualitative mode of analysis and coding
Myers (1997) argues that the goal of understanding a phenomenon from the
point of view of participants or within a particular context is largely lost when
textual data is quantified. In this study, extensive notes taken during
interviews formed the raw data. The method for analysing the qualitative data
consisted in looking for patterns in the results and noting the idiosyncratic
insights of individual participants (see section 4.5.1.6). The quotations and
evidence were then organised in support of identified patterns, which were
informed by the five key internal integration evaluation criteria (see section
1.6) and five strategic drivers in this study (see section 3.4.1)
4.5.2.4 Validity According to Du Plooy (1995:31), validity refers to the problem of establishing
whether the data collected presents a true picture of what is being studied.
Validity in research therefore deals with the accurate interpretation of the
results (internal validity) and the general application of the results (external
validity).
Although 17 interviews were scheduled to take place over a two-day period,
only 14 of these interviews took place. Two candidates did not turn up for
interviews, although the interviews were clearly marked in their calendars, and
the third candidate took leave on the scheduled day.
4.5.2.5 Reliability According to Du Plooy (1995:31), the reliability of research concerns the
consistency of the methods, conditions and results. If the method of data
collection is reliable, the research would yield the same results if repeated.

99
Interviews took place at a highly volatile time and this impacted on the
reliability of this study. Year-end pressures and job insecurity (as a result of
new senior management) put many interviewees under strain. As a result,
many interviewees were very emotive and possibly not as reliable or focused
as they might have been if questioned at a less difficult time. To increase
reliability, questions were first approved at an orientation meeting with the
CEO and the Advertising and Communication Manager of ICG. Methods used
for analysing qualitative data are often subjective in nature, impacting on
reliability. In this case, analysis consisted of looking for patterns in the results
as well as noting the idiosyncratic insights of individual participants.
Quotations were then organised as evidence of existing patterns based on the
five internal integration evaluation criteria (see section 1.6) and five strategic
drivers (see section 3.4.1).
4.6 ETHICAL CONSIDERATIONS
Couchman and Dawson (1995) state that the rights of any individual involved
in research study are confidentiality, anonymity, voluntary participation,
informed consent, immunity from harm, dignity and self-respect. This study
employed several methods to ensure confidentiality and anonymity. Group
administered surveys were anonymous and discussions during personal
interviews were confidential. Data and verbal analysis was presented as a
generalised whole, with no reference to specific participants. Participants that
partook in the group administered survey were fully informed by the CEO, of
the nature and purpose of the research. Interviewee participants were fully
informed by the CEO, in writing, prior to the interview process.
4.7 CONCLUSION This chapter introduced the empirical component of the study. In Chapter 3,
the first objective of this study, to develop an instrument to evaluate integrated
internal communication, resulted in the development of the IIC analysis. In
meeting the second objective of this study, the developed measuring
instrument was applied at ICG.
100
The next chapter discusses research findings. However, prior to discussing
these research results it is first necessary to acquaint the reader with the
research strategy, design, methods and techniques used to obtain these
results. Numerical and verbal data collected from the group administered
perception survey and personal interviews are statistically analysed and
interpreted so as to identify meaningful patterns pertaining to integrated
internal communication at ICG.

101
______________________________________________________________
CHAPTER FIVE:
DATA ANALYSIS AND RESEARCH RESULTS
5.1 INTRODUCTION This chapter bridges the gap between theory and practice. Research findings
of the group administered perception survey and personal interviews are
presented. Various types of measurement scales, as explained in the
previous chapter, are used to analyse quantitative, closed-ended questions
(see section 4.5.1.6). The results of these closed-ended questions are
represented visually in this chapter, using tables, bar and pie-charts.
Qualitative open-ended questions are coded and analysed using content
analysis, as explained in the previous chapter (section 4.5.2.3). Specific
categories were divided into meaningful groups into which units of analysis
could be placed (see Appendix 4).
5.2 RESEARCH RESULTS: GROUP ADMINISTERED PERCEPTION SURVEY
Responses from the group administered perception survey (see Appendix 1)
were recorded into a database compiled in Microsoft Excel. Each question is
discussed separately and linked to one of the five integration evaluation
criteria and research questions as identified in section 1.6. Key internal
integrated evaluation criteria, namely: cross-functional planning and
monitoring; mission marketing; data-driven; employee-centric and maintaining
strategic consistency, are linked to the internal strategic drivers for integrated
internal communication (see section 3.4.2). For the purposes of clarity,
research findings for closed-ended questions appear first, followed by open-
ended questions.

102
Question one: Links to employee-centric evaluation criteria This question evaluated how satisfied employees were with overall
communication received. The question was broad-based aimed at obtaining
an overall view of employee perceptions of communication at ICG. In Figure
5.1, it is clear from the results presented, that respondents’ perceptions of
communication are moderately positive. While 45% of respondents were
“satisfied” and 6% “very satisfied” with overall communication, 32% of
respondents took a “neutral” middle ground. The remaining negative
responses indicate a clear need for improved overall communication at ICG.
Figure 5.1: Overall how satisfied are you with communication at ICG?
6%
45%32%
16% 1% Very satisfiedSatisfiedNeutralDissatisfiedVery dissatisfied
Question three: Links to employee-centric evaluation criteria The results of this question indicate that employees in general do believe (to
varying degrees) that communication at ICG keeps them informed. In Figure
5.2, 15% of respondents indicated that communication at ICG kept them “fully
informed”. The largest grouping of respondents, 30%, indicated that
communication at ICG kept them “fairly informed”. The second largest group
of respondents, 28%, indicated that communication kept them “adequately
informed”. Just under a quarter of respondents, 23%, responded negatively,
indicating that communication at ICG provided “limited information”. Only 4%
of respondents indicated that communication at ICG “did not tell them what
was going on”.

103
Figure 5.2: Which best describes your impressions of communication at ICG?
Questions four and 16: Link to mission marketing, employee-centric and maintains strategic consistency evaluation criteria Question four measured whether respondents felt they could trust information
received from management. Trust is an important factor in any organisation.
Employees who trust information received from the top feel more valued and
secure, often resulting in a desire to live the corporate brand. The response
to this question was very positive. Figure 5.3 shows that a quarter of
respondents (23%) could “always trust” information received from
management. A further 52% indicated that they “usually believed” information
received from management. The remaining respondents (23%) believed
information “half of the time” and only 3% of respondents said that they
“usually could not believe” information from management. Information was
“almost never believed” by 2% of respondents. Overall, the response was
positive and respondents indicated that they mostly trusted or believed
information received from management.
Question 16, which asked respondents to rate their immediate manager or
supervisor’s communication skills, is included under this section as these two
questions are directly related. The aim was to find out whether there was a
link between levels of trust (measured in question four) and communication
skills. It could be speculated that better communication from management
15%
30%
28%
23%
4% Keeps me fully informed
Keeps me fairly informed
Keeps me adequatelyinformed
Gives me limitedinformation
Doesn't tell me w hat'sgoing on

104
results in higher levels of employee trust. The results of question 16 seemed
to indicate that this was so. Management or supervisor communication skills
were rated as “excellent” by 20% of respondents. A further 29% rated these
skills as “very good” and 28% as “good”. The remaining 17% said skills were
“fair” and only 6% rated information received from management as “poor”. The
implication from these results is that, in the main, respondents thought highly
of the information received from management.
Figure 5.3: How do you feel about the information you receive from your manager or supervisor?
Question five: Links to employee-centric and maintains strategic consistency evaluation criteria
The aim of question five was to try and pin-point performance gaps. By asking
respondents to rate communication received from management, there was an
attempt to pin-point communication skills at varying management levels. The
Y axis in Figure 5.4 indicates the number of employees who selected a
specific option, not the percentage. It is clear that under the option “very
satisfied” with communication received, supervisors, senior management and
the CEO faired best. Middle management and EXCO rated less favourably.
Under the “very dissatisfied” option, EXCO members faired worst. Although
there are clear differences depicted in Figure 5.4, no one grouping was more
prominent. Clearly respondents were dissatisfied with communication
received from EXCO and middle management. The CEO ranks best, followed
23%
52%
20%
3%
2%Can always believe it
Can usually believe it
Can believe it half the time
Usually can't believe it
Can almost never believeit
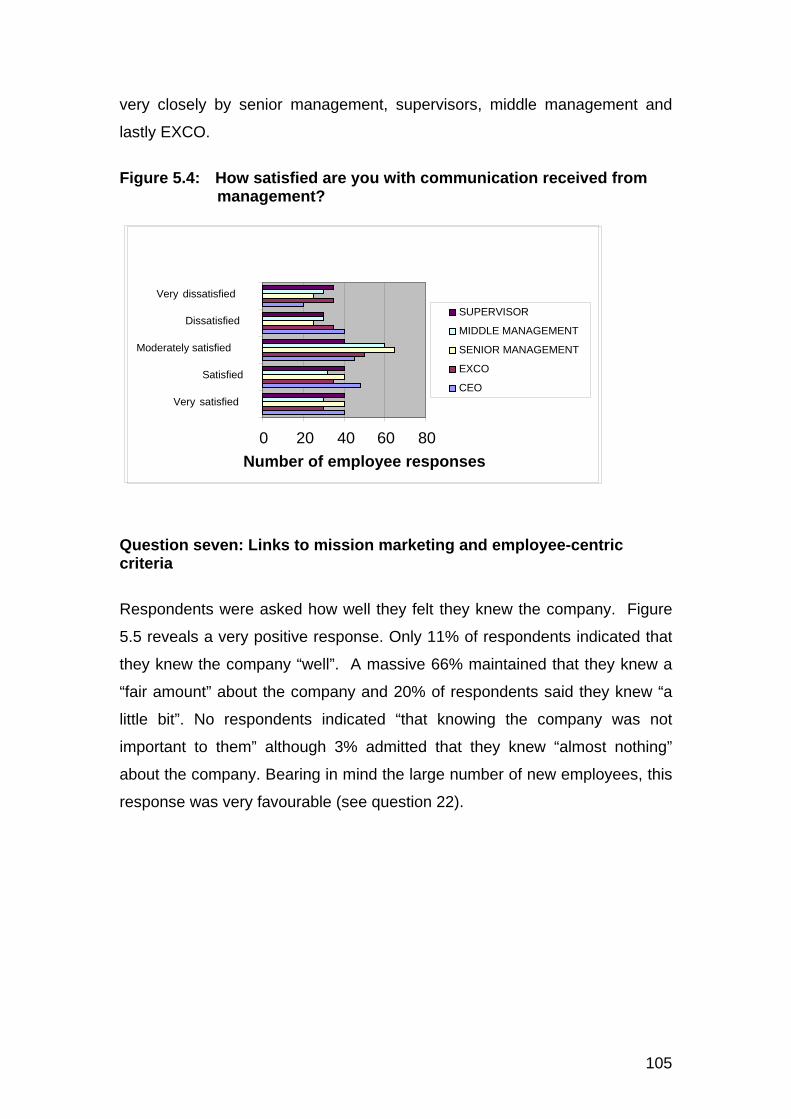
105
very closely by senior management, supervisors, middle management and
lastly EXCO.
Figure 5.4: How satisfied are you with communication received from management?
Question seven: Links to mission marketing and employee-centric criteria
Respondents were asked how well they felt they knew the company. Figure
5.5 reveals a very positive response. Only 11% of respondents indicated that
they knew the company “well”. A massive 66% maintained that they knew a
“fair amount” about the company and 20% of respondents said they knew “a
little bit”. No respondents indicated “that knowing the company was not
important to them” although 3% admitted that they knew “almost nothing”
about the company. Bearing in mind the large number of new employees, this
response was very favourable (see question 22).
0 20 40 60 80
Very satisfied
Satisfied
Moderately satisfied
Dissatisfied
Very dissatisfied
Number of employee responses
SUPERVISOR
MIDDLE MANAGEMENT SENIOR MANAGEMENT EXCO
CEO

106
Figure 5.5: How well do you know the company?
11%
66%
20%
3%
0% I know the companywellI know a fair amount
I know a little bit
I know almostnothingKnowing is notimportant to me
Question eight: Links to mission marketing, employee-centric and strategic consistency evaluation criteria The better-informed employees are about business strategies and
organisational goals, the higher employee morale should be. A number of
respondents were unable to answer question eight, as they had not been with
the company for over a year. However, of the respondents that answered (215
respondents out of 254 answered this question), 92 of them (42.7%)
maintained that they were “much more” knowledgeable” about the company’s
goals and strategies than they were a year ago. In Figure 5.6, 81 respondents
(37.6%) indicated that they were “somewhat more knowledgeable”. Only 31
respondents (14.4%) felt they were on the “same level of knowledge as the
year before. Very positively, only seven respondents (3.2%) believed that they
“were less knowledgeable” than the year before and only one respondent (or
0.4%) felt “much less knowledgeable”. Overall, the results of this question
were very favourable.
107
Figure 5.6: Compared to last time this year are you more or less informed about ICG’s strategic goals and direction?
Question 10: Links to mission marketing, employee-centric and maintaining strategic consistency Respondents were very keen to receive information pertaining to company
strategy and changes. As shown in Figure 5.7, almost all respondents, 203
out of 254 (79.9%), indicated that they wanted to receive information about
company strategy. This is significant, as it indicates employee interest in
company direction and future plans. Respondents were also keen to receive
information about changes in organisational structure (171 out of 254, or
67.3%); products and services (180 out of 254, or 70.8%); human resources
processes (180 out of 254, or 70.8%); company benefits (182 out of 254, or
71.6%), and compensation and bonuses (173 out of 254, or 68%). Employees
seemed least interested in receiving information about marketing plans (105
out 254, or 41.3%). This could relate to the erroneous perception that
marketing is a “soft” contribution to an organisation and does not impact on
the bottom line.
0 20 40 60 80 100
Number of employees
Much lessknowledgeableSomewhat lessknowledgeableSame level of knowledge
Somewhat moreknowledgeableMuch moreknowledgeable

108
Figure 5.7: Information wanted by employees
Questions 11 and 12: Links to mission marketing and employee-centric and maintain strategic consistency evaluation criteria
The internal newsletter can be an important communication tool when used
correctly. Results indicated that the newsletter is well read (at least in part) by
the majority of employees, whose overall evaluation was predominantly
favourable. Figure 5.8 shows that 41% of respondents read “all” or the entire
newsletter; 28% read “most “of it; and 21% read “some” of it. Only 9% of
respondents “skimmed” through the content. Encouragingly only 1% indicated
that they did not read the newsletter. Overall, research indicates that a large
part of the newsletter is read.
In question 12 respondents were asked to evaluate the newsletter as a
communication tool. As shown in Figure 5.9, 13% of respondents regarded
the newsletter as “excellent”; 36% as “very good”; 34% as “good” and 17% as
“fair”. None of the respondents evaluated the newsletter as “poor”.
203 180
154144160182173
105130141
171
200
50100150200250
Number of employees
Company strategies Products and servicesNew product launches Overall financial pictureHR processes Company benefitsCompensation/bonuses Marketing plansGovernment affairs Community involvementChanges in structure Other

109
Figure 5.8: How much of news@ICG do you read?
Figure 5.9: Overall evaluation of news@ICG
Question 14: Links to data-driven, employee-centric and maintains strategic consistency evaluation criteria Question 14 asked respondents how they received most of their information.
Respondents were presented with a list of seven choices and asked to select
three. As Figure 5.10 shows, the top information sources were company e-
mail and immediate supervisors. Out of 254 respondents, 132 (51.9%) chose
the former and 111 (43.7%) the latter. Another top information source was
group team meetings, which 84 out of 254 respondents (33%) chose.
Somewhat negatively, “via the grapevine” was also a popular choice, with 83
out of 254 respondents (32.6%) selecting this option. Results from this
41%
28%
21%
9% 1%
I read all of it
I read most of it
I read some of it
I only skimthrough
I don't read it atall
13%
36%34%
17% 0%
Excellent
Very good
Good
Fair
Poor

110
question were compared with those from question 15, which asks
respondents how they would prefer to receive information.
Figure 5.10: Current top employee information sources
48
111
61
84
69
132
83
My CEO
My immediate supervisor
Senior management
Group meetings with myteamnews@icg
company e-mail
The grapevine
Question 15: Links to data-driven, employee-centric and maintain strategic consistency evaluation criteria
In this question respondents indicated how they wanted to receive
information, as opposed to how they currently received information (as
evaluated in Figure 5.10). A shortcoming was that only 236 out of 254
respondents (93%) answered this question correctly. The most preferred
information source, with 45 number “one” rankings, was the option “directly
from the CEO”. The information source which ranked second highest, with 37
number “one” rankings, was “from my immediate supervisor”. Other options
which received a high rate of number “one” rankings included: “from senior
management” (36); “at group team meetings” (32); and “at group management
sessions” (31). Table 5.11 clearly indicates that respondents ranked the least
popular information sources as company e-mail (24); the Intranet (14); the
company newsletter, news@ICG, (11) and noticeboards (6).

111
When these results are compared with question 14 (Figure 5.10), some gaps
become evident. Currently employees receive information via company e-mail
(51.9%); from their immediate supervisors (43.1%); at group team meetings
(33%); and via the grapevine. A discrepancy arises between the roles of the
CEO and of company e-mails. In Figure 5.10 the CEO is ranked as the
preferred information channel, with 45 number one ratings. However, Figure
5.11 clearly shows that only 48 out of 254 respondents (18.8%) currently
receive most information from the CEO. Company e-mails are ranked as the
primary source of employee information (51.9%), as shown in Figure 5.10.
However, only 24 out of 254 respondents ranked company e-mails as their
preferred source. A shortcoming was that the option “via the grapevine” was
not included in the list of information source options for this question, making it
difficult to evaluate whether or not respondents might have chosen this option
as a desirable information source.
Figure 5.11: Preferred source of information
45 36 32 31
1124
37
146
0
20
40
60
Ranked as number "one" information source
Directly from the CEO From senior management At group team meetings At group management sessions news@ICG newsletter Company e-mailImmediate supervisor Intranet (if available)Noticeboards (if available)

112
Question 18: Links to mission marketing, employee-centric and maintain strategic consistency evaluation criteria As Figure 5.12 shows, 64% of respondents indicated that “they knew what the
values and vision [of ICG] were”. Although respondents were not asked to list
the five values, making it difficult to judge the extent of respondent knowledge,
the very high response rate seems to indicate that the internal “values”
marketing drive in 2004 was successful. Some 16% of respondents went even
further, indicating that they actually lived these values every day. A further
18% said they knew a little bit about the vision, mission and values and only
2% indicated that they knew almost nothing about the company vision and
values. No respondents said that the vision, mission and values were of no
importance.
Figure 5.12: How well do you know ICG’s vision, mission and values? Question 19: Links to mission marketing, employee-centric and maintain strategic consistency evaluation criteria
Employees feel empowered and valuable in terms of their output identifying
with the goals and objectives of the company. In Figure 5.13, 65% of
respondents believed that they “most definitely” contributed to the success of
ICG. A further 27% said that they contributed most of the time and 7%
16%
64%
18% 2% 0%
I try and live the valuesdaily
I know what the valuesand vision are
I know a little bit aboutour values and vision
I know very little aboutthe values and vision
Knowing the companyvalues and vision is notimportant to me
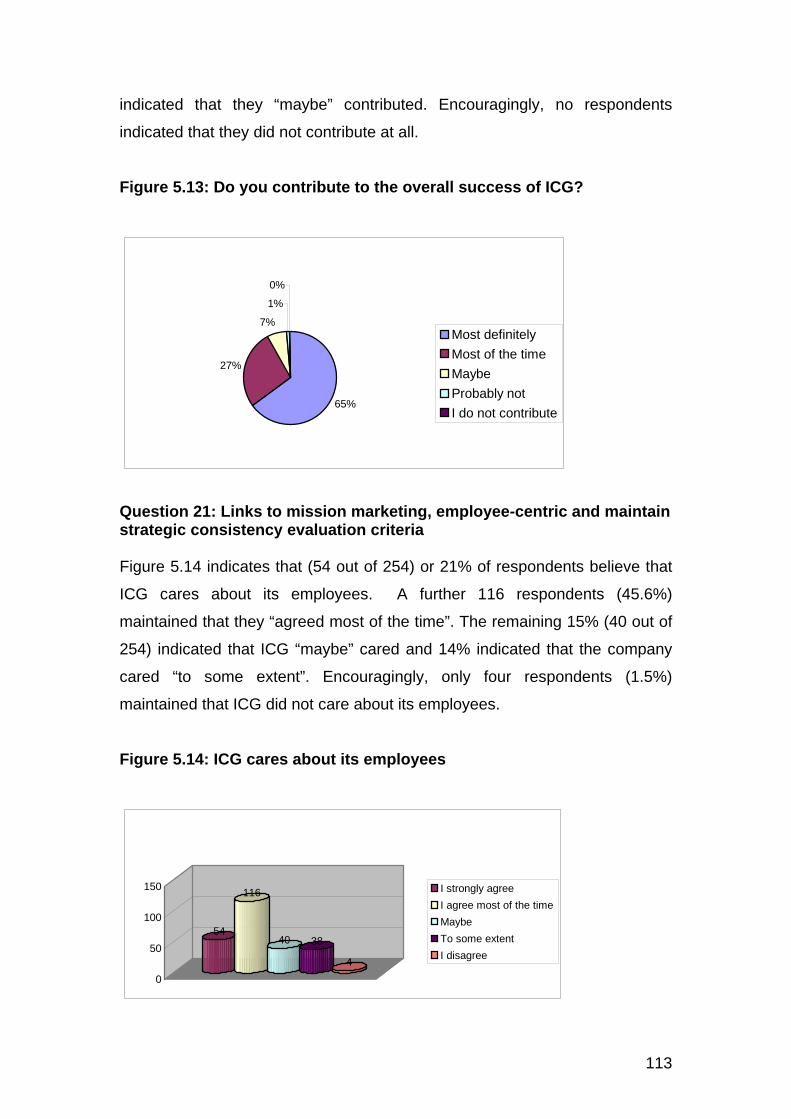
113
indicated that they “maybe” contributed. Encouragingly, no respondents
indicated that they did not contribute at all.
Figure 5.13: Do you contribute to the overall success of ICG?
65%
27%
7%
1%
0%
Most definitelyMost of the timeMaybeProbably notI do not contribute
Question 21: Links to mission marketing, employee-centric and maintain strategic consistency evaluation criteria Figure 5.14 indicates that (54 out of 254) or 21% of respondents believe that
ICG cares about its employees. A further 116 respondents (45.6%)
maintained that they “agreed most of the time”. The remaining 15% (40 out of
254) indicated that ICG “maybe” cared and 14% indicated that the company
cared “to some extent”. Encouragingly, only four respondents (1.5%)
maintained that ICG did not care about its employees.
Figure 5.14: ICG cares about its employees
54
116
40 38
40
50
100
150 I strongly agreeI agree most of the timeMaybeTo some extentI disagree

114
Question 22: How long have you worked at ICG? Of great significance is the large percentage of new Cape Town staff (worked
at ICG for less than one year or under five years). As Figure 5.15 reveals,
demographically, almost 79% of respondents has been with the company for
five years or less. Of those who had worked for five years or less, 39% had
been with the company for less than one year. This increased staff base
occurred as a result of a number of changes, including expansion, structural
changes, increased customer demands, and new competition. This is
significant because change of this nature, according to Duncan and Moriarty
(1997:3a), not only widens relationship gaps with stakeholders but often
results in problems with an organisation’s internal and external communication
when it comes to consistency and alignment with the corporate brand.
Figure 5.15: How long have you worked at ICG?
100 104
2411 13
0
20
40
60
80
100
120
Less than 1 year1 to 5 years6 to 10 years11 to 15 yearsMore than 15 years
Question 23: What is your gender? Results in Figure 5.16 indicated that 69% of respondents were female.

115
Figure 5.16: What is your gender?
31%
69%
MaleFemale
Question 2: What position do you hold at ICG?
General staff represented 70% of respondents. Of the remaining respondents
14% were middle managers, 9% were supervisors, 5% were senior managers
and 5% were EXCO members.
Figure 5.17: Who participated in the survey?
2%
5%
14%
9%
70%
EXCO memberSenior managementMiddle managementSupervisorGeneral staff

116
5.2.1 Summary of quantitative results Overall, the quantitative data seemed to paint a favourable picture of
employee perceptions of communication at ICG. Table 5.1 briefly summarises
some positive and negative results. Only nominal results of relevant questions
that used multiple choice single-response scale measurements (questions 1,
4, 7, 18 and 23) have been included (see section 4.5.1.6). Table 5.1 does not
include questions pertaining to the newsletter (questions 11 and 12) or to
demographic information (questions 2, 21 and 22) or information lists
(question 10), as these results were self-evident. Questions 3, 8 and 19,
which use ordinal uni-dimensional scaling with five scale points, have been
included.
Results with multiple-choice, multi-ranked measurement and questions with
multi-dimensional scaling were too complex to include in Table 5.1, which
condenses information into single percentages. Percentages depicted in
Table 5.1 were arrived at by consolidating the two positive aspects together
and the two negative aspects together. The neutral option was not included.
The aim was to combine the positive results together so as to highlight
favourable aspects. When negative results were evident (over 15%), they too
were consolidated, so as to show areas of concern. Where negative results
were of a minor nature (under 15%), they were not included. Negative
responses are marked in red. The purpose of Table 5.1 is to provide a brief
overview of some negative and positive results.
Table 5.1: Summary of quantitative data
Question Percentage Results indicate that…
ONE 51% employees are very satisfied (6%) or satisfied
(45%) with communication
ONE 17% employees are dissatisfied (16%) or very
dissatisfied (1%) with communication
THREE 45% communication keeps employees fully (15%) or
fairly (30%) informed

117
THREE 27% employees feel they only receive limited
information (23%) or are not told what is going on
(4%)
FOUR 75% employees could always (23%) or usually (52%)
believe the information they received
SEVEN 71% employees knew the company well (11%) or knew
a fair amount (66%) about the company
EIGHT 80% employees were more knowledgeable (42.7%) or
somewhat (37.6%) more knowledgeable about the
company’s goals and strategies than one year
ago
EIGHTEEN 80% employees tried to live the values daily (16%) or
knew what the values were (64%)
NINETEEN 92% employees felt that they most definitely (65%)
contributed to ICG’s success, or contributed to
ICG’s success most of the time (27%)
TWENTY-
THREE
65.6% respondents believed that ICG cared about its
employees all of the time (20%) or most of the
time (45.6%)
TWENTY-
THREE
15.5% employees said that ICG only cared about its
employees to some extent (14%) or believed ICG
did not care (1.5%)
5.2.2 Qualitative analysis of employee perception survey The open-ended questions in this survey allowed for an added depth of
understanding. Respondents were afforded the freedom to voice their own
opinions, without being restricted to quantitative categories. Open coding was
used to scrutinise the data. Section 4.4.1.6 explains how labels were used to
identify a range of phenomena and create specific categories (see Appendix
3). Specific categories were then divided into meaningful groups into which
units of analysis could be placed. Content analysis was used to code and

118
analyse responses to open-ended questions. Various syntactical units or
phrases were identified (see Appendix 4) and the frequency of phrases/words
calculated and depicted graphically.
Question 6: What problems do you see when it comes to communication at ICG? The first qualitative question asked respondents to identify what
communication problems they detected at ICG. Communication problems
linking to evaluation criteria one, which focuses on the extent to which cross-
functional planning and monitoring creates departmental silos at ICG were
identified by 17% of respondents. This percentage is obtained by combining
relevant identified problem areas. As shown in Figure 5.18 problem areas
pertaining to evaluation criteria one include: no integrated processes and
systems (2%), no cross-departmental communication (8%), and departments
working in isolation (7%). This suggests that there is clearly a perception that
departments work in isolation and know little about what happens in other
areas of the organisation. Information is not shared between departments,
and systems and processes are not integrated across the organisation.
Communication problems linked to evaluation criteria two were identified by
2% of respondents. This evaluation criteria links to the corporate values and
the extent to which internal mission marketing develops a positive feeling of
identity between employees and the company. Effective internal marketing
efforts help to develop a positive feeling of personal identity between
employees and the company. These respondents felt the company was not
living the corporate values and that communication was often an afterthought,
not frequent enough or timeously distributed to all departments in unison.
Respondents (6%) identified communication problems linked to evaluation
criteria three, maintaining that having no integrated data-driven
communication was a problem. There was concern that there were no central
employee, student or client databases or integrated information sources.
There was also no intranet with centralised information available to

119
employees. There was no central source for employees requiring resources,
information, insight or support.
A large percentage (61%) of respondents identified communication problems
linked to evaluation criteria four, namely that ICG does not apply employee-
centric concepts by listening to, informing, valuing and empowering
employees. Respondents felt that there was a perception gap when it came
to what was actually being done and what managers and executives said was
being done. This percentage (61%) was derived by combining a number of
problem areas in Figure 5.18, pertaining to evaluation criteria four including:
employee feedback not encouraged or facilitated (4%); communication
insufficient or enough or not timeous (20%); not enough face-to-face
communication (6%); managers don’t ensure messages or information is
received and understood (10%); managers not interested in building
relationships with employees (10%); and employees not included in decision-
making (11%). There was dissatisfaction with low levels of face-to-face
communication and employees felt that feedback channels were not
accessible. Managers did not encourage any input from staff, even on
important issues that directly impacted on them. Respondents maintained that
they were not included, consulted or given any say in decision-making
processes.
Only 12% of recipients identified communication problems linked to evaluation
criteria five. This percentage is reached by combining relevant problem areas
pertaining to evaluation criteria five. Employees believed that because of rapid
growth there was never enough time for the organisation to communicate or
make communication a priority (3%). As a result, the same core values of the
organisation were not communicated through every aspect of the employee’s
experience. Respondents also identified a lack of integrated messages as a
problem area (9%).
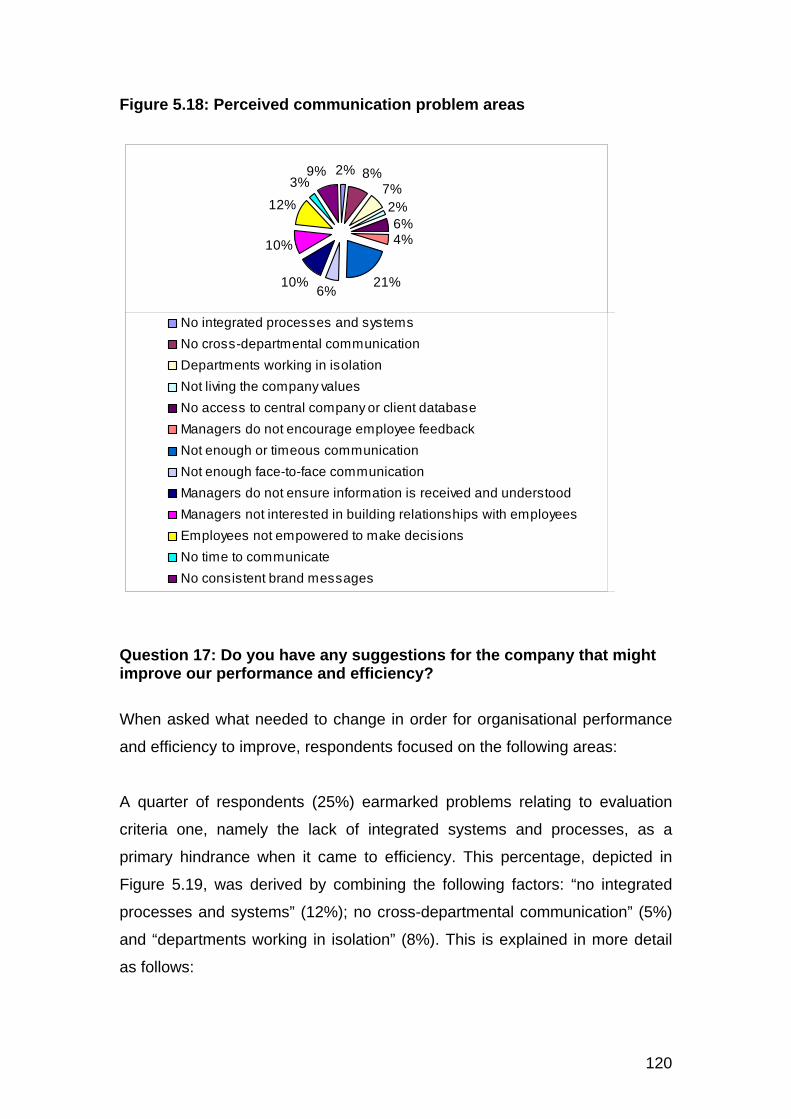
120
Figure 5.18: Perceived communication problem areas
Question 17: Do you have any suggestions for the company that might improve our performance and efficiency? When asked what needed to change in order for organisational performance
and efficiency to improve, respondents focused on the following areas: A quarter of respondents (25%) earmarked problems relating to evaluation
criteria one, namely the lack of integrated systems and processes, as a
primary hindrance when it came to efficiency. This percentage, depicted in
Figure 5.19, was derived by combining the following factors: “no integrated
processes and systems” (12%); no cross-departmental communication” (5%)
and “departments working in isolation” (8%). This is explained in more detail
as follows:
2% 8%7%2%6%4%
21%6%
10%
10%
12%
3%9%
No integrated processes and systemsNo cross-departmental communicationDepartments working in isolationNot living the company valuesNo access to central company or client databaseManagers do not encourage employee feedbackNot enough or timeous communicationNot enough face-to-face communicationManagers do not ensure information is received and understoodManagers not interested in building relationships with employeesEmployees not empowered to make decisionsNo time to communicateNo consistent brand messages
121
There was a feeling that all systems and processes needed to be revisited
and redefined, especially in the service department. Respondents felt that
processes and procedures were not formally defined and that a formal paper
audit was necessary to ensure that important information about new
processes and systems was communicated. There was a strong feeling that
all processes needed to be clearly defined and communicated, ensuring that
all employees understood exactly what was expected. A lack of cross-
departmental communication and departments working in isolation was
another area of employee concern. Respondents suggested that creating
cross-departmental teams might help improve communication and increase
information sharing between departments.
No respondents identified evaluation criteria two (mission marketing) or
improve internal brand marketing as a solution for improved performance and
efficiency.
A small 2% of respondents felt that they were not kept informed.
Respondents indicated that a lack of data-driven information about business
strategies, goals and objectives impacted on their ability to perform in a
customer-centric manner and feel valuable. This links to evaluation criteria
three, which relates to a data-driven approach to the employee experience
and enhanced performance. Respondents believed that not having access to
an integrated customer database, with easily accessible information available
to all departments, posed a serious problem as feedback from students could
not be shared and corrected. Not having an intranet with a central information
base available to all employees was regarded as decreasing efficiency. There
was also concern that existing technological structures were slow and
unreliable.
Figure 5.19 shows that 53% of respondents believed that poor management
contributed to a lack of efficiency. These issues link to evaluation criteria four
which focuses on employee-centrism. This percentage is derived by
combining the following factors: “employees not empowered to make
decisions” (9%); “managers are not interested in building relationships with

122
employees” (7%); “not empowered to service students/customers” (15%); “not
enough face-to-face communication” (5%); “communication insufficient or not
timeous” (8%); “managers do not listen to employee ideas” (7%); and “not
informed or included in strategy formulation” (2%). This is discussed in more
detail as follows:
Respondents believed that introducing empowerment programmes would
increase employee morale and empower employees in their day-to-day
functions and in their decision-making capacity when dealing with customers.
Respondents indicated that managers were not interested in relationship
building with staff. There was a perception that managers did not really care
about staff or treat them well. Communication was one-sided and managers
did not encourage employee ideas or knowledge sharing or learning. The
attitude of some middle managers was criticised as negative, tedious or “can’t
do”. These employees believed that regular report back meetings on current
tasks or projects would be more useful in viewing progress than lengthy e-
mails. Respondents felt that they were not empowered to meet student and
customer needs. Customer-centric needs were not a priority or prime focus
and many respondents complained that employees were not properly
empowered to handle customer needs. Customer contact employees felt ill-
equipped when it came to dealing with student complaints and disempowered
when making decisions. Respondents believed that a major contributing factor
to decreased morale was the lack of face-to-face interaction. Respondents
maintained that they did not feel as if they received enough communication
and that they were usually informed about changes after they had happened.
There was a feeling that managers did not listen to employee ideas or
encourage feedback. Employees believed they were not informed about, or
included in, strategy formulation.
Overall, 20% of respondents (see Figure 5.19) believed that, as a result of
rapid growth, the employee experience was not strategically consistent. These
issues link to evaluation criteria five, which focuses on maintaining strategic
consistency, regardless of rapid growth. This percentage is derived by

123
combining “no induction, training and mentoring programmes” (17%) and
“feeling less valued and informed than last year” (3%).
Respondents maintained that induction programmes were poor or not properly
initiated and that training for new employees was inadequate, as were on-the-
job training and on-going training. Respondents cited no mentoring or proper
incentive/reward programmes as a contributing factor to strategic
inconsistency. Respondents indicated that as a result of rapid growth they felt
side-lined and less valuable and informed than the previous year and that this
had contributed to decreased efficiency.
Figure 5.19: What needs to change for improved performance and efficiency?
12%5%
8%
2%9%
7%15%5%8%
7%
2%
17% 3%
No integrated processes and systemsNo cross-departmental communicationDepartments working in isolationNo access to central company or client databaseEmployees not empowered to make decisionsManagers not interested in building relationships with employeesNot empowered to service students/customersNot enough face-to-face communicationNot enough or timeous communicationManagers do not listen to employee ideasNot informed or included in strategy formulationNo induction, training and mentoring programmesFeeling less valued and informed than last year

124
Question 24: If you were made CEO for one day, what changes would you make? As shown in Figure 5.20, 33% of respondents indicated that they would
improve integration linked issues, which focus on evaluation criteria one,
cross-functional planning and monitoring. This percentage was obtained by
combining “ensure departments work together” (6%); “improve cross-
departmental communication” (13%); and “improve integrated systems and
processes” (14%). This is explained as follows:
There was a sense that ICG operated in isolated silos with little teamwork or
knowledge sharing. Respondents indicated that they worked in isolated
departments, with little knowledge about their colleagues or the roles and
functions of other departments. Respondents maintained that they would
ensure departments worked together and would improve cross-departmental
communication. Ideas included making job rotation compulsory; setting up
different business units with cross-functional teams; re-defining the notion of
teamwork; and making employees accountable by linking teamwork efforts to
performance levels. Other ideas included getting departments to talk about
and explain what they do, so that each employee knows how they contribute
to the bigger picture; letting non-customer facing staff work with customers;
and educating staff to give the best customer service (internally and
externally, irrespective of their department). It was felt that departmental
systems and processes needed to be improved, so as to ensure that the
correct tools, policies and procedures were available and were aligned so as
to meet service demands.
Of respondents represented in Figure 5.20, 4% said they would focus on
evaluation criteria two, seeking to align internal marketing efforts so that
employees developed a positive view of the company and their role within it.
Respondents maintained that they were unsure how they fitted in, or
contributed to, the greater whole. Ideas to redress this included
communicating how each employee fits into the organisation and contributes
to its overall performance. Respondents indicated that job titles were often

125
unknown and that there was a lack of knowledge regarding exactly what each
person did. As a result, it was difficult to know who to approach about job
related issues.
A quarter of respondents (25%) in Figure 5.20 focused on evaluation criteria
three, which indicates that the employee-experience is better among better
informed employees operating in a data-driven environment. This percentage
was obtained by combining “upgrade integrated data-driven communication”
(12%) and “become technologically empowered to meet customer needs”
(13%). This is discussed in more detail:
Respondents would focus on upgrading IT systems and data-driven
communication. Ideas included improving all technology; reducing paper by
scanning and linking student letters and information; ensuring all departments
shared and inputted data correctly (as incorrectly inputted data impacted on
students); reviewing the information technology department and ensuring its
integration with the rest of the organisation; and improving customer service
levels by implementing a centralised intelligent database accessible to all
employees. Respondents believed that customer contact employees were not
empowered to best meet students needs and were not taken care of or seen
as adding value. There was a need to speak to students, record their
complaints on a central database and empower contact employees to best
deal with criticism from students. One idea was to set up a strict follow-up
data system to track students’ needs and follow up on them. Another idea was
to introduce an intranet bulletin board so as to improve internal
communication by centralising information from different departments.
Figure 5.20 shows that 18% of employees would focus on evaluation criteria
four, which asks if ICG applies employee-centric concepts. There is a
performance gap between what managers and executives say is being done
and what in actual fact has been done within the organisation. This
percentage was obtained by combining “ensure managers focus on employee
relationship building” (4%), “ensure managers listen and encourage feedback”

126
(4%) and “introduce more face-to-face communication” (10%). This is
elaborated on below:
Employees believed that managers seriously needed to focus on building
relationships with employees. Managers and supervisors needed to be
accountable to staff and to really care about them. Managers needed to be
more people-oriented and spend time with general staff at all levels.
Respondents felt that managers should listen to employee ideas and
encourage feedback. Respondents believed that there was not enough face-
to-face communication or interaction. Ideas included speaking to the most
informed people in each department and finding out the real issues.
Respondents suggested more CEO update sessions rather than long e-mails.
Also, CEO and senior managers should walk around at least once a month to
meet and talk to staff about everyday things and get work input. Respondents
believed that more face-to-face contact with employees increased trust and
productivity. Another idea was for all senior people to get onto the “shop floor”,
walk around, and greet people.
The final 20% of respondents believed that evaluation criteria five, which
focuses on maintaining strategic consistency through every aspect of the
employeeexperience, even during a period of rapid change, was a problem
area. This percentage in Figure 5.20 was derived by combining “ensure
employees feel valued and informed” (4%) and “empower employees through
consistent induction, training and mentoring programmes” (16%). This is
explained as follows:
Respondents said that as a result of rapid growth, acquisitions and expansion,
employees felt less valued and informed. Suggestions included giving
retrenchment packages to older staff, as they were resistant to change and
held back new staff. There was no time for consistent and valuable induction
for new staff and there was a real need for consistency when it came to
employee rewards, incentives and mentoring systems. Morale was down as
people were unsure what the future held for them. There was a feeling that
the company did not communicate the same core values through every aspect
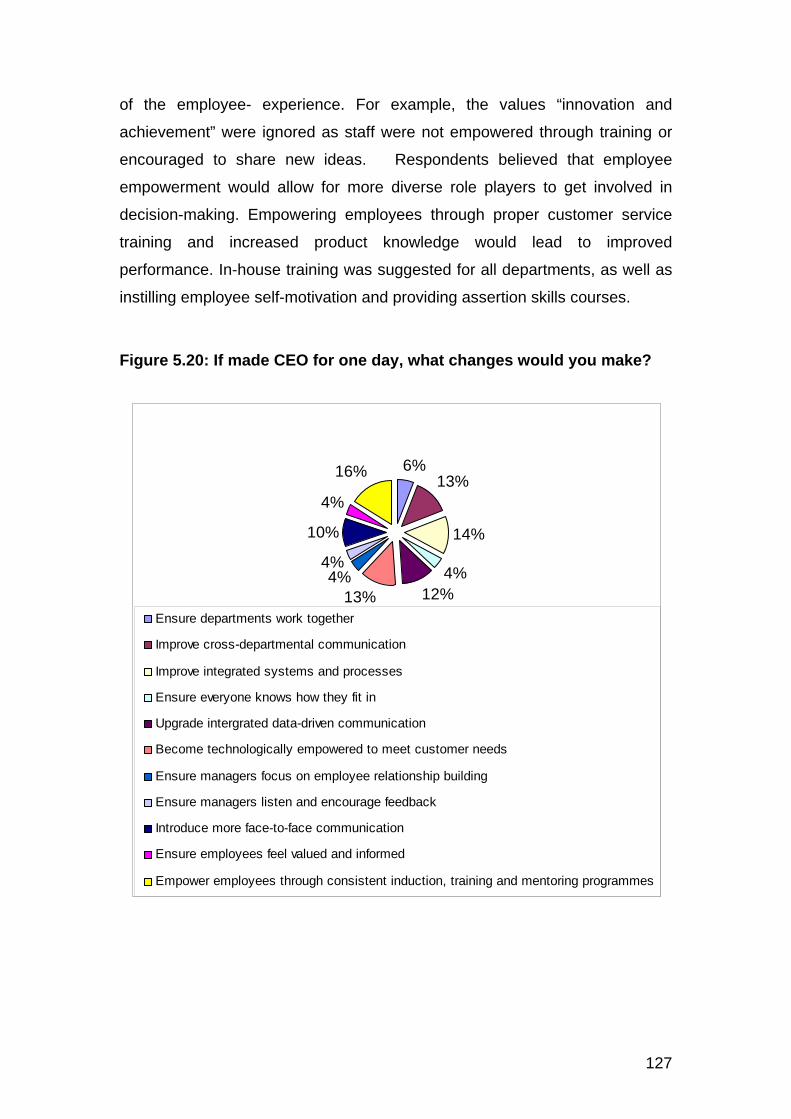
127
of the employee- experience. For example, the values “innovation and
achievement” were ignored as staff were not empowered through training or
encouraged to share new ideas. Respondents believed that employee
empowerment would allow for more diverse role players to get involved in
decision-making. Empowering employees through proper customer service
training and increased product knowledge would lead to improved
performance. In-house training was suggested for all departments, as well as
instilling employee self-motivation and providing assertion skills courses.
Figure 5.20: If made CEO for one day, what changes would you make?
6%13%
14%
4%12%13%
4%4%
10%
4%
16%
Ensure departments work together
Improve cross-departmental communication
Improve integrated systems and processes
Ensure everyone knows how they fit in
Upgrade intergrated data-driven communication
Become technologically empowered to meet customer needs
Ensure managers focus on employee relationship building
Ensure managers listen and encourage feedback
Introduce more face-to-face communication
Ensure employees feel valued and informed
Empower employees through consistent induction, training and mentoring programmes
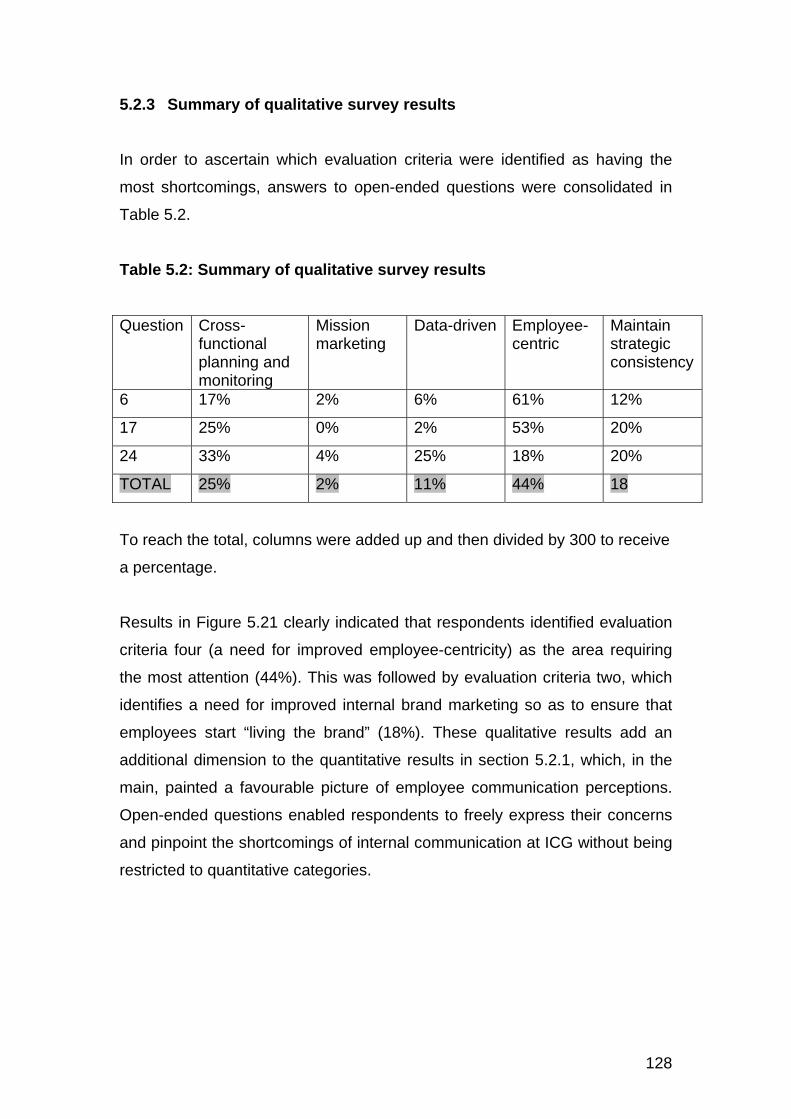
128
5.2.3 Summary of qualitative survey results In order to ascertain which evaluation criteria were identified as having the
most shortcomings, answers to open-ended questions were consolidated in
Table 5.2.
Table 5.2: Summary of qualitative survey results
Question Cross-functional planning and monitoring
Mission marketing
Data-driven Employee-centric
Maintain strategic consistency
6 17% 2% 6% 61% 12%
17 25% 0% 2% 53% 20%
24 33% 4% 25% 18% 20%
TOTAL 25% 2% 11% 44% 18
To reach the total, columns were added up and then divided by 300 to receive
a percentage.
Results in Figure 5.21 clearly indicated that respondents identified evaluation
criteria four (a need for improved employee-centricity) as the area requiring
the most attention (44%). This was followed by evaluation criteria two, which
identifies a need for improved internal brand marketing so as to ensure that
employees start “living the brand” (18%). These qualitative results add an
additional dimension to the quantitative results in section 5.2.1, which, in the
main, painted a favourable picture of employee communication perceptions.
Open-ended questions enabled respondents to freely express their concerns
and pinpoint the shortcomings of internal communication at ICG without being
restricted to quantitative categories.

129
Figure 5.21: Summary of qualitative analysis
The next section presents the research findings of the second instrument,
personal interviews.
5.3 PERSONAL INTERVIEWS
Nine interview questions were asked in total (see Appendix 2), four of which
were quantitative and five of which were qualitative. Fourteen interviews took
place over a two day period.
Question 1: Evaluation of data-driven criteria Ho (2001) maintains that in today’s networked economy, management and
human resources professionals have access to more employee information
than ever before. The challenge is how to use this information as a strategic
tool and thereby enhance internal communication. As can be seen in Figure
5.22, 67% of respondents interviewed felt that employee information and
behaviour was captured and used as a strategic tool “very little” of the time.
33% of the respondents felt that this information was used, but only “some” of
the time. None of the respondents believed that this information was used
“almost always” or “always”.
25%
2%11%
44%
18%
Cross-functional planning and monitoring
Market the missionData-driven
Employee-centricMaintain strategic consistency

130
Figure 5.22: To what extent is employee information and behaviour captured and used as a strategic tool to enhance internal communication at ICG?
Question 2: Evaluation of data-driven criteria 1 According to Ho (2001), companies are taking advantage of web technology
to enhance communication on multiple fronts, including recruitment,
performance and career planning. This question pertains to web technology
and the extent to which it is used to enhance internal communication. From
the comments contained in Table 5.3, it is clear that interviewees were
unimpressed with existing web technology. Disappointingly, ICG’s use of web
technology was perceived by some respondents to be barely existent. One
person indicated that it was too soon to see the full effects of the newly
installed Intranet. All respondents, however, felt that the Intranet needed to be
improved. The respondents’ criticisms are listed below.
Table 5.3: Criticism of web-based technology
“People should be trained and empowered to use it.” “The intranet was never launched properly; there was no excitement around it.” “Our intranet is a disaster as it is not user-friendly and is difficult to navigate” “The look and feel is awful, it doesn’t make one want to have a look.” 1 When the perception audit was undertaken the intranet was not yet installed. When one-on-one mini interviews took place, the intranet had been up and running for three weeks.
33%
0%0%
67%
Very little
Some
Almost always
Always

131
“Some departmental processes are there, but it’s all haphazard.” “We need a new program and someone to write interesting content.” “It’s not used as well as it could be. Good intranets add immense value, but there is no reason to use ours.” “It feels as if information was just dumped on without any logic behind it or definition.” “No-one owns it and it shows.” “Very few people use it. I only use it for the phone book.” “It’s got job opportunities and surface information but its not interactive or a communication tool like Outlook.” “No business plans on the intranet or strategies and information about business direction.” “We have so much information all over the place and the intranet could be an excellent way of consolidating information and resources formally, as a working tool, but it is certainly not doing that.” Question 3: Evaluation of mission marketing criteria Figure 5.23 clearly shows that, to a large extent, the vision, mission and
values have not developed positive feelings of identity between employees
and the company. Ho (2001) maintains that employees who feel connected to
their companies tend to be more motivated and loyal. Engaging employees
with a strong vision is one way of building a strong internal brand. Creative
internal mission marketing can help employees understand that they can
make a difference and create a sense of belonging to the organisation. At
ICG, however, interviewees felt that the vision, mission and values developed
a positive feeling of identity between employees and the company only “some”
(46%) or “very little” (31%) of the time. However, 23% of interviewees felt that
ICG’s mission marketing “almost always” (8%) or always (15%) instilled
identification with the organisation.
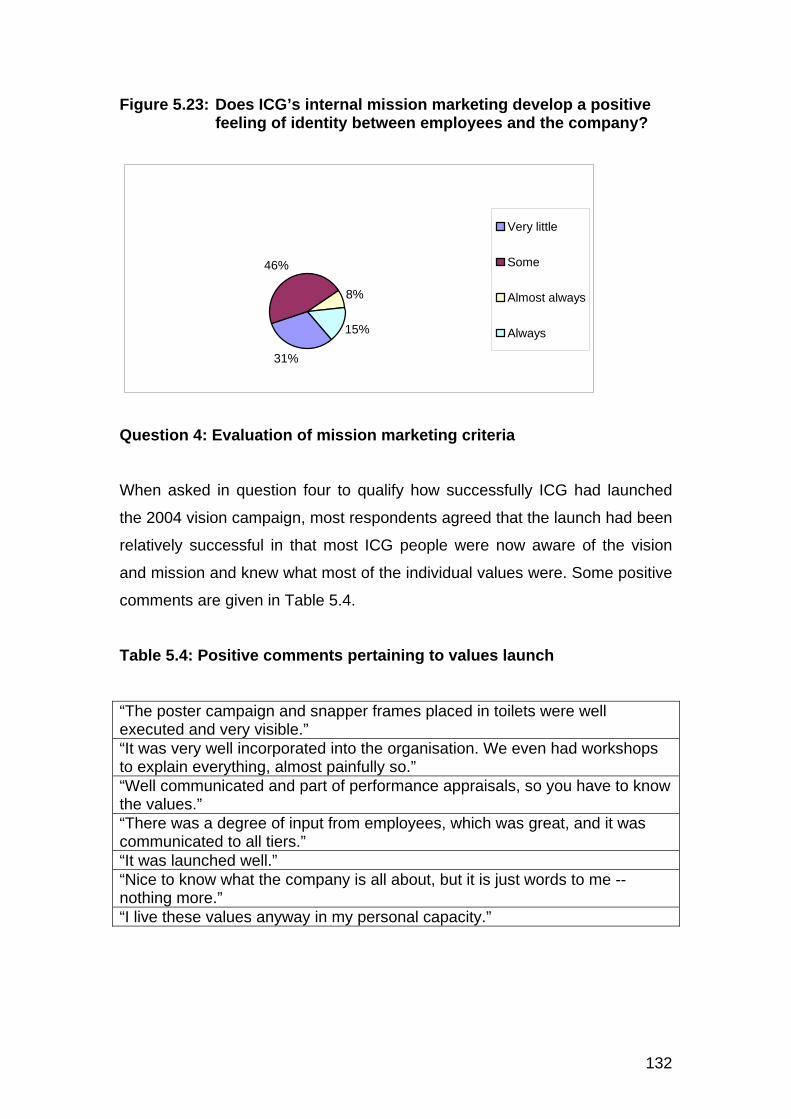
132
Figure 5.23: Does ICG’s internal mission marketing develop a positive feeling of identity between employees and the company?
Question 4: Evaluation of mission marketing criteria
When asked in question four to qualify how successfully ICG had launched
the 2004 vision campaign, most respondents agreed that the launch had been
relatively successful in that most ICG people were now aware of the vision
and mission and knew what most of the individual values were. Some positive
comments are given in Table 5.4.
Table 5.4: Positive comments pertaining to values launch
“The poster campaign and snapper frames placed in toilets were well executed and very visible.” “It was very well incorporated into the organisation. We even had workshops to explain everything, almost painfully so.” “Well communicated and part of performance appraisals, so you have to know the values.” “There was a degree of input from employees, which was great, and it was communicated to all tiers.” “It was launched well.” “Nice to know what the company is all about, but it is just words to me -- nothing more.” “I live these values anyway in my personal capacity.”
31%
46%
8%
15%
Very little
Some
Almost always
Always

133
However, many interviewees believed that although employees knew what the
values were, they did not necessarily agree with them or incorporate them into
their daily lives. Some negative comments are given in Table 5.5.
Table 5.5: Negative comments pertaining to values launch “The campaign lifted morale last year, but now morale is very low.” “The snappers on the toilet doors are telling us to be positive – that is a contradiction.” “We are not dealing with clear structures; there is no clear vision of what we are meant to be doing.” “It was successful but the momentum has dropped and needs to be relived and reawakened.” “Values mean very little if they do not link to the strategy and tie in somehow.” “EXCO and the CEO are not living the values. They always get thrown in your face but they also have to live them, there can’t be double standards.” “It is just stuff on a wall that looks pretty.” “It is very in your face and does not feel real or sincere any more.” “It does make people feel positive, but I wonder if the company really stands for those things? In the communication we get, I don’t feel it does.” “The company has relentlessly marketed the values with staff family days, sports functions, parties but staff do not want that, they’ve become suspicious. They want to feel acknowledged and appreciated. Rather pay them more or give incentives.” “The strategies and goals of the organisation are not filtered down to me. I do not feel informed. Everything is always found out through the grapevine. Nothing is communicated properly: it is just do-do-do. I should be informed about things.”
Further criticisms were voiced by a number of interviewees who objected to
the linking of performance appraisals (PAs) to the values. Some comments
included:
“PAs make values negative; the two should not be linked.”
“Employee bonuses should not be linked to the values.”
“The values are forced; we’ve got values fatigue.”
“The 360˚ appraisal is totally subjective.”
“The values are not entrenched in our behaviour so when it comes to PA time
people don’t know how to appraise the use of values.”
“If employees don’t like someone they use the 360˚ appraisal as a way of
getting back at someone.”

134
“We need a transparent values measuring tool with real strategy to check
against.”
“Not everyone does PAs and I wonder how many of the top 20/30 senior
managers have formal Pas.”
“I don’t feel managers are living the values.”
Question 5: Evaluation of strategic consistency criteria
According to Ho (2001), to retain key talent within an organisation and meet
the changing expectations of employees, organisations must find ways to
manage all the touch points employees have with the company. This question
measured strategic consistency pertaining to the communication of ICG core
values and brand messages of the company. According to Table 5.24, on a
superficial level, namely when it came to uniformity of the look and feel of
posters, snapper boards and the newsletter, interviewees felt that ICG was
“always” (13%) consistent. Some interviewees indicated that internal branding
was “almost always” (23%) consistent. Disappointingly, however, a number of
interviewees disagreed, maintaining that brand consistency happened only
“some” (31%) or “very little” (31%) of the time.
Figure 5.24: Does ICG communicate the same core values and brand messages of the company through every aspect of the employee experience?
31%
31%
23%
15%
Very little
Some
Almost always
Always

135
Question 6: Evaluation of strategic consistency criteria
When asked to evaluate how ICG communicates brand message consistency
at every touch point (including induction, training, on-going training,
compensation and incentives, information sharing, empowerment,
environment and surroundings and two-way communication) interviewees
maintained that, although they knew what the values were and found
communication messages to be fairly consistent, the core values were not
lived at a deeper level. Key shortcomings, identified by 8% of interviewees,
included: lack of information sharing; no two-way communication; and no
acknowledgement for work well done. Some comments are listed in Table 5.6.
below.
Table 5.6: Qualitative comments pertaining to strategic consistency
“There are no career plans and growth plans for all employees, only some”. “We should be communicating our strategy but we seem to focus on the hard issues first (figures/profits) and not staff issues and communication.” “The downstairs reception area is an embarrassment – it looks awful, staff at reception are not trained. It’s an awful first impression – do something”. “There is no consistent application of Pas. Every employee should have one, regardless of seniority.” “The induction programme is full of information that’s not even relevant to ICG, it relates more to Media24 and not us. It should be tailored properly.” “There is no training, incentives or any acknowledgement of work well done.” “People are not empowered. Systems and processes are not clearly defined and no one makes decisions, everyone is too scared to take responsibility.” “Times are tough at the moment, so we are not living the values right now but it will happen in the future.” “Not acknowledging achievements leaves people demotivated.” “The department of finance went through an audit but nobody from EXCO even said thank you for the audit or even acknowledged that it had happened.” “EXCO and senior management are never aware of the huge effort that some staff members go to”. “I never feel my contribution is valued. I’m not included in lots of meetings, which makes me feel unworthy.’ “I always tag the values onto projects at the end because there isn’t a smooth gel, they did not really link to the practicalities of my job.” “The CEO and senior managers don’t live the values; maybe the “enjoyment” value but “respect” and “realness with integrity” never feature in the way they behave.”

136
Question 7: Evaluation of cross-functional planning and monitoring criteria Figure 5.25 clearly indicates that ICG’s internal structure creates silos or
departmentalisation. Interviewees maintained that ICG’s internal structure
“always” (54%) or “almost always (38%) created silos or departmentalisation.
Figure 5.25: Does ICG’s internal structure create silos or departmentalisation?
Question 8: Evaluation of cross-functional planning and monitoring criteria When asked to qualify how the creation of cross-functional teams might
benefit ICG, interviewees indicated that there was a value chain process
whereby new products went through each department, but it was more like a
conveyer belt, with separate input from each department and little teamwork
required. Strategies not communicated or aligned to organisational goals and
objectives were identified as a major concern by 70% of interviewees.
Additional comments are listed in Table 5.7.
Table 5.7: Qualitative comments pertaining to organisational structure
“There are no silos at senior level but they exist everywhere else.” “Inter-departmental meetings don’t happen. If “lesser” people set meetings, people don’t come on time or most of the time don’t show up at all, which is
8%
0%
38%54%
Very little
Some
Almost always
Always

137
disempowering.” “There is no consistency, if you are part of the A-team today you might wake up tomorrow and find that you’re no longer popular. Today you might be hot and celebrated but tomorrow it can change.” “Break-downs are caused by communication breaks, not structural make-up. The kind of product we develop demands wide communication.” “Plans are afoot for project managing projects and more teamwork, which is very positive.” “If not properly initiated, project management might not work, especially if teams start making decisions on behalf of departments without consulting them – which could cause a power struggle.” “Proper training is needed to ensure teams understand how to project manage and work in teams.” “Training needs to be more constant and there is no focus on career paths and development for staff.” “Cross-functional teams could supplement departments but not replace them.” “Business managers are never involved or included in creative processes. There is no cross-functional management of the brand.”
Question 9: Evaluation of employee-centric criteria In Figure 5.26 interviewees were asked to provide examples that showed that
ICG “wants to”, or “does not” want to, build long-term committed relationships
with its employees. In total, interviewees made 21 comments, five (23%) of
which were positive and 16 (76.1%) of which were negative.
Figure 5.26: Does ICG build long-term relationships with its employees?
There is a clear indication from the comments below that ICG did not
demonstrate commitment to building long-term relationships with employees.
23%
77%
Positive comments
Negative comments

138
Positive comments included: “A high number of employees have been here for 10 years and more, which means that people do stick with us.” “New people don’t know our journey, we come from a one-man show and in just 20 years we have grown into a Naspers shareholder..” “I felt extremely supported by my boss when I started five years ago. The pressure is high in our department but I’ve always felt management support helps.” “We participated in best companies to work for which means we recognise the need to improve.” “We know how to celebrate and have a great sense of community and lots of personal relationships flourish here.”
Negative comments included: “We don’t have succession planning.” “Ultimately senior managers make the decisions, our input is not valued.” “People never respect scheduled meetings, they just don’t show up or show up very late, senior management included.” “I feel I have to watch my back all the time, things have changed since 2003.” “I don’t think ICG is committed to building long-term relationship with employees” “People are not driven they need a vision to feel secure.” “There is a feeling that ICG is not committed to its employees.” “If ICG was really committed then training and investing in people would be paramount.” “Everything is going to cave in because the old/good people are being treated so badly.” 5.3.1 Summary of quantitative results: Personal interviews
Figure 5.27 clearly shows a number of shortcomings. In Figure 5.22, 67% of
interviewees indicated that ICG had achieved “very little” when it came to
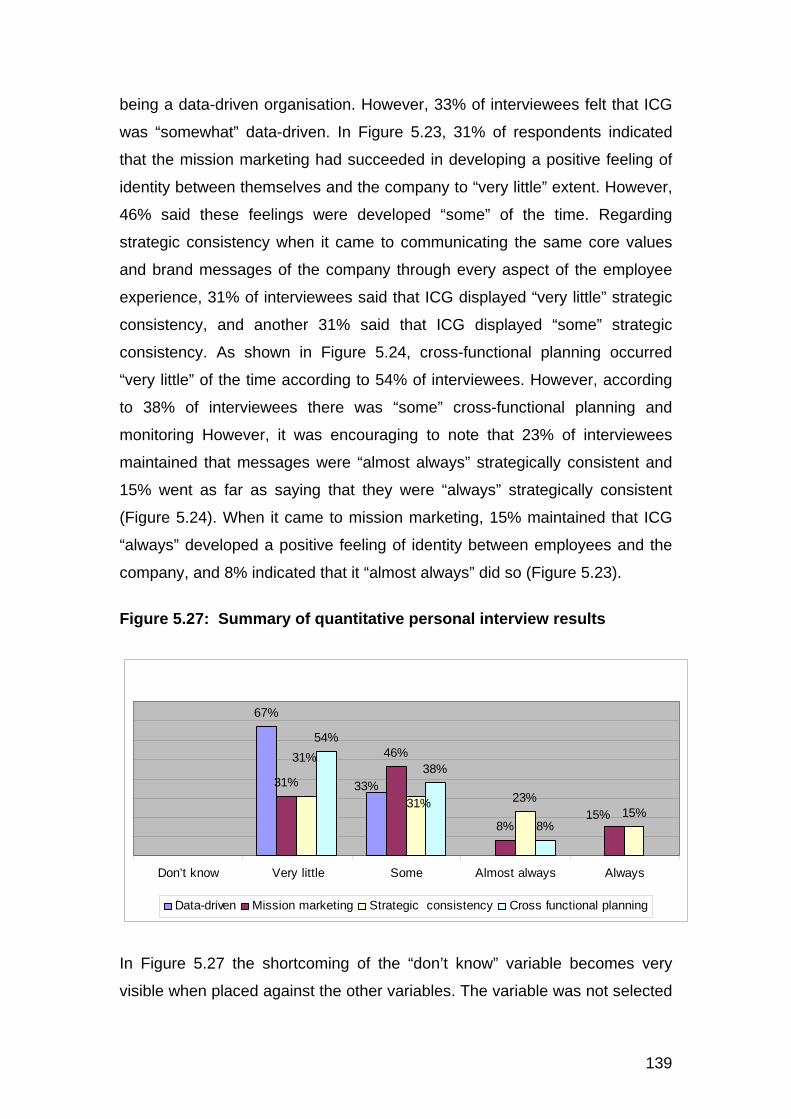
139
being a data-driven organisation. However, 33% of interviewees felt that ICG
was “somewhat” data-driven. In Figure 5.23, 31% of respondents indicated
that the mission marketing had succeeded in developing a positive feeling of
identity between themselves and the company to “very little” extent. However,
46% said these feelings were developed “some” of the time. Regarding
strategic consistency when it came to communicating the same core values
and brand messages of the company through every aspect of the employee
experience, 31% of interviewees said that ICG displayed “very little” strategic
consistency, and another 31% said that ICG displayed “some” strategic
consistency. As shown in Figure 5.24, cross-functional planning occurred
“very little” of the time according to 54% of interviewees. However, according
to 38% of interviewees there was “some” cross-functional planning and
monitoring However, it was encouraging to note that 23% of interviewees
maintained that messages were “almost always” strategically consistent and
15% went as far as saying that they were “always” strategically consistent
(Figure 5.24). When it came to mission marketing, 15% maintained that ICG
“always” developed a positive feeling of identity between employees and the
company, and 8% indicated that it “almost always” did so (Figure 5.23).
Figure 5.27: Summary of quantitative personal interview results
67%
31%
46%
8%
23%15%
54%
38%
8%
33%
15%31%
31%
Don’t know Very little Some Almost always Always
Data-driven Mission marketing Strategic consistency Cross functional planning
In Figure 5.27 the shortcoming of the “don’t know” variable becomes very
visible when placed against the other variables. The variable was not selected
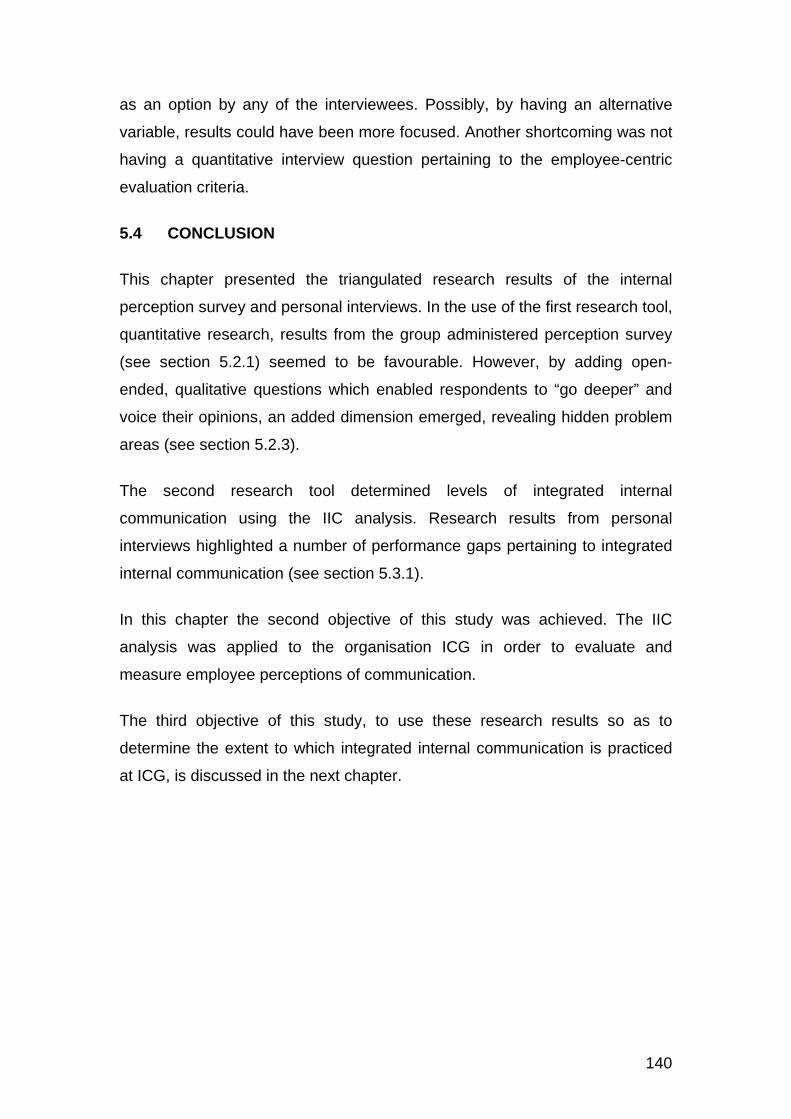
140
as an option by any of the interviewees. Possibly, by having an alternative
variable, results could have been more focused. Another shortcoming was not
having a quantitative interview question pertaining to the employee-centric
evaluation criteria.
5.4 CONCLUSION
This chapter presented the triangulated research results of the internal
perception survey and personal interviews. In the use of the first research tool,
quantitative research, results from the group administered perception survey
(see section 5.2.1) seemed to be favourable. However, by adding open-
ended, qualitative questions which enabled respondents to “go deeper” and
voice their opinions, an added dimension emerged, revealing hidden problem
areas (see section 5.2.3).
The second research tool determined levels of integrated internal
communication using the IIC analysis. Research results from personal
interviews highlighted a number of performance gaps pertaining to integrated
internal communication (see section 5.3.1).
In this chapter the second objective of this study was achieved. The IIC
analysis was applied to the organisation ICG in order to evaluate and
measure employee perceptions of communication.
The third objective of this study, to use these research results so as to
determine the extent to which integrated internal communication is practiced
at ICG, is discussed in the next chapter.

141
CHAPTER SIX
CONCLUSIONS AND RECOMMENDATIONS
6.1 INTRODUCTION
The preceding discussions argued that organisations had to apply the five
strategic internal drivers (see section 3.4.1) in order to achieve integrated
internal communication. These strategic internal drivers were identified
because they directly link to the internal integration evaluation criteria (cross-
functional planning and monitoring, mission marketing, data-driven, employee-
centric and maintaining strategic consistency) with related research questions
as indicated in the first chapter (see section 1.6). Research results from the
IIC analysis, together with these five strategic internal drivers with related
internal integration evaluation criteria, were measured against the four stages
of IC evolution devised by Schultz and Schultz (1998) and adapted in section
3.4.2 of this study to measure integrated internal communication.
This chapter discusses integrated internal communication at ICG in relation to
the four stages of integrated internal communication, so as to assess at which
stage of integration ICG currently rests. Recommendations are made for
improved integrated internal communication at ICG. The advantages and
shortcomings of the application of the IIC analysis at ICG are discussed, and
the chapter ends with final conclusions and findings.
6.2 INTEGRATED INTERNAL COMMUNICATION AT ICG
In Table 6.1 the research findings for each of the five research questions (see
section 1.6) and strategic internal drivers (see section 3.4.1) at ICG are
compared against the four stages of integrated internal communication (see

142
section 3.4.2). Table 5.1 should be read from left to right. Subheadings are
comprised of the five integrated internal evaluation criteria. The first column
indicates what actions an organisation needs to put in place so as to achieve
the four stages of integrated internal communication. Next to each action, the
level of integrated internal communication is specified in brackets. The
second column, based on research findings, discusses current levels of
integrated internal communication at ICG. The third column provides
recommendations as to how ICG could close the gap between current and
aspired levels of integrated internal communication.
Table 6.1: Four stages of integrated internal communication linked to five strategic drivers
Four stages of integrated internal communication
Current level of internal communication at ICG
Recommendations for ICG
INTEGRATED INTERNAL COMMUNICATION EVALUATION CRITERIA ONE: CROSS-FUNCTIONAL PLANNING AND MONITORING
Systems in place to allow for cross-departmental integration (stage four).
Currently ICG has silos and functional divisions. Departments work in isolation with little knowledge of what each does. There is little or no knowledge sharing across departments
Recommendation: To review internal structures so as to reduce functional divisions and departmentalisation. Introduce cross-functional teams and a culture of knowledge sharing and learning.
Processes for distributing accurate cross-departmental information and facilitating meaningful feedback systems so as to best serve the
ICG has few consistent strategic processes to distribute information. Employee feedback is not encouraged. Processes and systems are not aligned and
Recommendation: Instill two-way communication channels and formalised procedures for cross-organisational communication and information

143
customer’s needs and add to the bottom line (stage four).
streamlined so as to best serve customers.
dissemination.
INTEGRATED INTERNAL COMMUNICATION EVALUATION CRITERIA TWO: MISSION MARKETING
Every employee needs to know what the values and vision are (stage one).
Employees understand and live the brand mission daily; not just by following the dictates of management (stage two).
The majority of ICG employees know what the values are, predominantly because it is a performance appraisal requirement.
At ICG only 8% of respondents indicated that they actively lived the values.
Achieved
Recommendation: ICG management need to set an example by living the values in everything that they do and say, so as to actively motivate and demonstrate how employees can live the values.
Develops a positive feeling of identity between employees and an organisation (stage two).
ICG employees do not have a sense of personal identity as they are unsure how they fit in or contribute to the greater whole.
Recommendation: Although implementation of the values in 2004 was well received, internal marketing needs to be ongoing, not sporadic.
INTEGRATED INTERNAL COMMUNICATION EVALUATION CRITERIA THREE: DATA-DRIVEN
Employee information and web-technology are used as a strategic tool on multiple fronts to enhance communication and improve performance (stage three).
ICG employee information and behaviour is not captured and used strategically.
Recommendation: Every employee should have a unique profile captured on a central database which would allow employees to create career plans, revisit goals, and advertise their areas of expertise.
A fluid team-based environment with easily
At ICG, information is not centrally stored.
Recommendation: To review the look and feel

144
accessible central databases for knowledge sharing, data-tracking and two-way communication (stage three).
Knowledge is not shared but guarded aggressively. The intranet, which should provide an invaluable centralised knowledge source, is one-dimensional, difficult to navigate and has little useful information.
of the intranet and ensure that someone takes ownership of it. Also, to create an environment of knowledge sharing by setting up accessible employee and customer databases, and in this way improving the employee experience.
INTEGRATED INTERNAL COMMUNICATION EVALUATION CRITERIA FOUR: EMPLOYEE-CENTRIC
Creates an employee-centric environment so that employees feel secure, valued, motivated, listened to and empowered to best serve the customer (stage four).
Many employees at ICG are insecure, they feel managers do not listen to them or value their input, that they are not empowered to make decisions and best serve the customer, and that information is not shared but selfishly clung on to.
Recommendation: senior managers need to embrace communication and help employees adopt the attitude that every employee is a communicator and represents the ICG brand. This employee-centric attitude will empower employees to serve all customers both internal and external.
Effective, enlivening, two-way communication serving employee information needs so as to meet the organisation’s aims, strategies and goals. Retaining employees is seen as equally significant to retaining customers, both impact on the bottom line (stage four).
At ICG communication is often an afterthought or, when provided, is insufficient. There are few channels for two-way communication and little clear linkage of ICG’s goals and aims to daily employee life.
Recommendation: To instill a culture of knowledge sharing, and open up two-way communication channels. This will encourage employee ideas, opinions and inputs. There should be continual sharing of information about where the organisation is going and what each employee’s role is. An employee lifetime value (ELV) approach should be fostered.

145
INTEGRATED INTERNAL COMMUNICATION EVALUATION CRITERIA FIVE: STRATEGIC CONSISTENCY
Overall internal communication policies and practices are in place with consistent “one look, one voice” messages that are aligned to the corporate brand (stage one).
ICG does deliver one sight, one sound internal messages with a consistent look and feel but they are not aligned to the corporate brand.
Achieved in part. Recommendation: ICG should continue to ensure that the look and feel of messages are consistent. They should also ensure that content is strategically relevant and consistent.
A concord of rational for the organisation, a concord of organisational procedures, a concord of purpose and a concord of achievements within an organisation (stage two).
At ICG the same internal brand message is not communicated through every employee touch point.
Recommendation: Introduce consistent employee incentive and motivation programmes; develop consistent induction programmes for all new employees, as well as training for new staff and on-going continuous training and learning.
The third objective of this study was to determine the extent to which internal
communication is integrated at ICG. According to an extract from the
American Productivity and Quality Centre (APQC) Report (1998:111),
organisations evolve towards integration over a period of several years,
moving through the four identifiable stages detailed in section 3.3.3 of this
study.
According to this report, many companies have achieved success in the early
stages of integrated communication but few have fully attained integrated
communication in the later stages. With reference to Table 6.1, ICG has
achieved integrated internal communication in two areas only:
• Under the second evaluation criteria, mission marketing, ICG has
achieved the first stage of integration, which is to ensure that its
employees know what the five organisational values are.
146
• Under the fifth evaluation criteria, strategic consistency, ICG has partly
achieved the first stage of integration in that it does deliver “one sight,
one sound” internal messages with a consistent look and feel.
In accordance with the four stages of integrated internal communication
identified in section 3.4.2, ICG falls into the first stage, namely tactical
coordination of communication.
The fourth objective was to test the shortcomings of the IIC analysis.
However, because this study is limited to one case study, it is difficult to
evaluate the general application and shortcomings of the IIC analysis. In order
to test the shortcomings of the IIC analysis, further research is necessary.
The application of the IIC analysis at ICG has resulted in a number of
advantages, some of which include:
• The IIC analysis provided the CEO and senior management with in-
depth research on employee perceptions of internal communication.
• Perceptions of the CEO and other senior management were put into
perspective against employee perceptions, revealing communication
gaps.
• The IIC analysis helped to pinpoint specific shortcomings relating to
integrated internal communication, such as the lack of cross-functional
planning and monitoring, which was resulting in functional silos and
departmentalisation at ICG. As a direct result of research emanating
from the IIC analysis, ICG are currently in the process of putting into
place cross-functional teams and inter/cross-departmental skills and
knowledge sharing. Another shortcoming revealed by the IIC analysis
was ICG’s need for a central database with easily accessible customer
and employee information. ICG are currently looking at upgrading their
intranet to become “data-driven”.
• The IIC analysis evaluated and measured ICG employee perceptions
of integrated internal communication. Continual evaluation is seen as
one way in which an organisation such as ICG can retain employees.

147
• The IIC analysis enabled employees to express real concerns and
partake in a two-way flow of communication.
However, application of the IIC analysis at ICG also revealed a number of
limitations, which are discussed in the next section.
6.3 LIMITATIONS OF THIS STUDY
Any study has inherent and specific limitations, and for this study the following
limitations were identified:
• There is a lack of case studies and examples within the sphere of
integrated communication, specifically in the sphere of internal
communication and the implementation thereof. The result is the use of
integrated marketing communication examples, which generally are
applied almost exclusively to the customer or external environment,
and which for this reason do not serve as a good benchmark for this
study. The lack of significant case studies can be attributed to the fact
that the traditional internal communication audit is still widely used in
organisations as an all encompassing “integrated” measuring
instrument.
• The five categories of integrated internal evaluation used in this study
were only identified as necessary categories for evaluation during
content analysis of the group administered perception survey. Only
after interpreting qualitative data, were these categories with
associated criteria identified. As a result, the group administered
perceptions survey has a number of shortcomings when it comes to
questions about integration. For example, the survey does not
specifically ask participants to comment on cross-functional planning
and monitoring and the prevalence of silos and departmentalisation at
ICG; nor does it go into specific detail about employee perceptions of
technology and the need for a central database. However, these
shortcomings were addressed in the personal interviews, which
included specific questions about these areas.

148
• A number of quantitative questions used five-point scales, which
possibly should be increased to seven-point scales to allow for more
structured answers.
• As indicated previously (see section 1.8), the exclusion of employee
participation at national offices is seen as one of the limitations of this
study.
6.4 RECOMMENDATIONS FOR FUTURE RESEARCH
In order to measure the reliability and validity of the IIC analysis as a measure
of integrated internal communication, it is recommended that formal and
extensive future testing is undertaken. The new proposed IIC analysis, which
has been applied to ICG in this study, can be used as a benchmark for future
studies. It is therefore recommended that the IIC analysis be extended to test
internal integrated communication in other organisations as well. A
comparitative analysis of case studies in different organisations will test the
strengths and/or weaknesses as well as the advantages and limitations of the
IIC analysis. It is recommended that identified limitations and shortcomings of
existing IIC analysis tools are taken into account and applied to these tools to
improve reliability and validity. Future research will help to establish if the
proposed IIC analysis is a truthful measure of integrated internal
communication.
6.5 CONCLUSIONS AND FINDINGS
ICG’s rapid growth over the past two years has resulted in a vastly increased
employee base. Essentially, the organisational profile has changed
dramatically since its first inception into the market. The organisation has
grown from a small operation into a multi-national company. At the outset of
this study, the CEO maintained that internal communication efforts at the
company were solid and functioning well, despite rapid growth. The CEO
seemed confident that internal communication efforts implemented over the
past year at ICG, and aimed at integrating employees under the ICG mono-
brand, had been well executed and had impacted positively on employees.

149
This study shows that while the 2004 “values campaign” was successfully
implemented in accordance with stage one tactical requirements, (see Table
6.1), the organisation has a number of challenges to overcome before
meeting the requirements of stage two integration. This is evident in the
perception gap at management level in terms of the real role of values. A
good poster campaign with a “one look, one voice” feel, a requirement of
stage one strategic consistency, was achieved at ICG; however this is only
one of the many employee contact points. In order to achieve stage two
integration, ICG management would need to set an example for employees by
living the values. This needs to be demonstrated in everything that
management do and say, as a way of motivating employees to follow their
example. The values need to be intrinsically aligned with ICG’s corporate
brand, the company’s culture and the strategic goals of the organisation.
6.6 INTEGRATED INTERNAL COMMUNICATION (IIC) ANALYSIS AS AN INTEGRATED MEASURING INSTRUMENT
The many limitations of traditional communication audits have been
thoroughly discussed in this study. Although largely successful when it comes
to evaluating employee communication perceptions, these traditional
communication audits have various limitations when it comes to measuring
issues of integration. The level at which traditional communication audits
evaluate integration is predominantly at the tactical stage, which looks at the
tactical coordination of communication messages. In terms of the criteria of
Schultz and Schultz’s (1998) four levels of IC evolution, the traditional internal
communication audit only addresses the first stage of integration.
It can therefore be argued that for an internal communication audit to be seen
as an integrated measuring instrument, it would need to go beyond the
evaluation of the successful coordination of “one sight, one sound” messages,
to include all aspects of integrated internal communication. The IIC analysis
included these aspects and combined elements from the traditional
communication audits and integration audits and was proposed as an
integrated measuring instrument. The IIC analysis as an integrated measuring

150
instrument was measured against the four stages of IC evolution as identified
by Schultz and Schultz (1998). To go beyond the measurement of the tactical
coordination of communication, the IIC analysis also measured the scope of
communication, the application of information technology, and financial and
strategic integration.
6.7 CONCLUSION
While the IIC analysis, as proposed in this study, in no way replaces
traditional communication audits or integrated audits, it does suggest that a
combination of the two measuring instruments might be effective. By
evaluating integrated internal communication, an additional dimension is
added to the traditional internal communication audit. Using elements of
externally focused integrated audits to measure integrated internal
communication takes integration communication to the next dimension. The
IIC analysis posits that before an organisation can be truly customer-focused,
an employee-centric approach needs to be adopted.
Companies need to realise that motivated and responsive employees are
satisfied employees, and that employee satisfaction is reflected in employee
output and service to customers. Ultimately, employees functioning within an
employee-centric environment provide better service both inwardly and
externally, resulting in happier customers, which impacts on the bottom line.
Attracting and retaining employees is just as important as attracting and
retaining customers. Organisations are realising that employee needs as
internal customers must first be satisfied before the needs of external
customers can be addressed. One way to retain employees is to continually
evaluate and measure employee perceptions of integrated internal
communication. Hopefully, this study will be the first step in achieving
integrated internal communication.
151
SOURCES
American Productivity and Quality Center (APQC) Report. 1998. Integrated Marketing Communication: executive summary. [O]. Available: http://www.apqc.org/portal/apqc/site/store?paf_gear_id=1300011&pageselect=detail&docid=100781. Accessed on 2005-07-20. Angelopulo, GC. 2000. Scalable competency in the communication profession. Communicatio 26 (2): 3-17.
Angelopulo, G. 2006. Organisational change and management, in Integrated Organisational Communication, edited by R Barker & GC Angelopulo. CapeTown: Juta: 40-70.
Angelopulo, GC & Barker, R. 2005. Integrated web-based marketing communication: an institutional tracking study. Communicatio 31(1): 107-121.
Babbie, E & Mouton, JJ. 2001. The practice of social research. Oxford: Oxford University Press.
Bacal, R. 2005. Internal communication strategies. The neglected strategic element. [O]. Available: http://www.performance-appraisalsorg/Bascalsappraisalarticles/comstrat.html. Accessed on 2005-09-09.
Baker, TL. 1999. Doing Social Research. Boston: MGran-Hill
Baker, K. 2005. Hybrids, Paradigms and Boundary Spanning: A Conceptual Framework. [O]. Available: http://www.inlogov.bham.ac.uk.html. Accessed on 2005-11-29.
Barker, R. 2006. Dynamics of organisational communication, in Integrated Organisational Communication, edited by R Barker & GC Angelopulo. CapeTown: Juta: 73-106.
Barker, R & Angelopulo, GC. 2004. The Integrated and Web-based marketing communication model: A South African case study. The International Journal of Technology, Policy and Management 4(1): 53-61.
Bartosch, R. 2005. A year of achievement. News@icg. 7(Feb/March): 2.

152
Belasco, JA & Stayer, RC. 1993. Flight of the buffalo. New York: Warner Books.
Bennis, W & Nanus, B. 1985. Leaders: Strategies for Taking Charge. New York: Harper Business.
Bernstein, S. 2000. Get real! New ways advertisers are integrating communications into customers lives. Journal of Integrated Communications. [O]. Available: http://www.medill.nwu.edu.imc.studentwork.pubs/jic/journal/2000/bernstein.html. Accessed on 2005-10-11.
Bizcommunity. 2005. Internal branding values ignored. [O]. Available: http://www. Bizcommunity.co.za.html. Accessed: 2005-14-09. Boshoff, C & Mels, G. 1995. A causal model to evaluate the relationship among supervision, role stress, organizational commitment and internal service quality. European Journal of Marketing 29: 23-35. Brown, S. 1996. Art of science? Fifty years of marketing debate. Journal of Marketing Management 12(4): 243-267. Buckingham, S. 1997. Unorganization a handbook for company transformation. [O]. Available: http://www.unorg.com.html. Accessed: 2005-8-09.
Burnett, R. 1991. Accounts and narratives. London: Guilford Press.
Burrell, G & Morgan, G.1979. Sociological Paradigms and Organisational Analysis. London: Heinemann Educational Books.
Caywood, CL. 1997. The handbook of Strategic Public Relations & Integrated Communications. New York: McGraw-Hill Books.
Christensen, LT & Cheney, G. 2005. Integrated Organisational Identities: Challenging the “bodily” Pursuit. Critical Management Studies Conference Cambridge, July 4-6.
Clampitt, PG & Downs, CW. 1993. Employee perceptions of the relationship between communication and productivity. Journal of Business Communication, 30 (1): 5-28.
Clark. D. 1998. Big dog’s leadership page – organizational behaviour. [O]. Available: http://nwlink.com/-donclark/leader/leadob.html. Accessed: 2005- 10-12.
Conradie, D. 2005a. Build trust in your company. HR Future 12: 24-25.
Conradie, D. 2005b. Happy Employees lead to happy bottom line. HR Future 10: 37.

153
Cooper, DR and Schindler, PS. 2003. Business Research Methods. Singapore:McGraw-Hill.
Cornelissen, JP and Lock, AR. 2000. Theoretical Concepts or Management Fashion? Examining the Significance of IMC. Journal of Advertising Research 40 (5): 7-15.
Cornelissen, JP. 2001. Teleological Reasoning and Knowledge Generation in marketing Theory: Observations and Recommendations. Manchester Metropolitan University Business School Working Paper Series March 1471-857X.
Couchman, W & Dawson, J. 1995. Nursing and health-care research. London: Scutari.
Cutlip, SM, Center, AH, & Broom, GM. 1985. Effective public relations. Englewood Cliffs, NJ: Prentice-Hall.
D’Aprix, R. 1996. Communicating for change – connecting the workplace with the marketplace. San Francisco: Jersey-Bass Publishers.
Denton, M & Vloeberghs, D. 2003. Leadership challenges for organisations in the new South Africa. Leadership and Organisation Development Journal 24(2): 84-95.
De Vos, A.A. 1998. Research at grassroots. Pretoria: van Schaik.
DeWine, S & James, AC. 1988. Examining the Communication Audit: Assessment and modification. Management Communication Quarterly 2(2): 144-169.
Donaldson, L. 2001. The Contingency Theory of Organizations. London: Sage. Drobis, DR. 1997. Integrated marketing communications redefined. Journal of Integrated Communications. 8: 6-10.
Downs, CW & Adrian, AD. (2004) Assessing organisational communication: Strategic communication audits. London: Guildford.
Duncan, T. 1995. The Concept and Process of Integrated Marketing Communication. IMC Research Journal 1.
Duncan, T. 2001. IMC: Using advertising and promotion to build brands. New York: McGraw-Hill.
Duncan, T & Moriarty, S. 1997a. Driving brand value – using Integrated Marketing to Manage Profitable Stakeholder Relationships. New York: McGraw-Hill.

154
Duncan, T & Moriarty SE.1997b. Front-end alignment. Marketing Tools 4(8): 64.
Du Plessis, DF. 2006. Public relations, in Integrated Organisational Communication, edited by R Barker & GC Angelopulo. CapeTown: Juta: 193-223.
Du Plessis, DF. & Schoonraad, N. 2006. Integrated communication measurement, in Integrated Organisational Communication, edited by R Barker & GC Angelopulo. CapeTown: Juta: 367-390.
Du Plooy, GM (ed). 1995. Introduction to communication: course book 2 communication research. Cape Town: Juta.
Du Plooy, GM. 2001. Communication research: techniques, methods and applications. Landsdowne: Juta.
Ehlers, L. 2002. The development of a framework for structuring integrated communication in South African organisations. Unpublished doctoral thesis: University of Pretoria. Eisenberg, R, Huntington, R, Hutchison, S, & Sowa, D. 1986. Perceived organizational support. Journal of Applied Psychology 71: 500-507.
Ellis, D, Barker, R, Potter, S & Pridgeon, C. 1993. Information audits, communication audits, and information mapping: A review and survey. International Journal of Information Management 13:134-151.
Falcione, RL, Sussman, L & Herden, RP. 1987. Communication climate in organizations, in Handbook of organizational communication: An interdisciplinary perspective, edited by FM Jablin, LL Putnam, KH Roberts & LW Porter. Newbury Park, California: Sage. Fiol, CM. 1989. A Semiotic Analysis of Corporate Language: Organizational Boundaries and Joint Venturing. Administrative Science Quarterly 34(2): 277 – 303.
Fogelman-Beyer, A. 1999. Are you ready for a communication audit? Public Relations Tactics 6(8): August: 19-23.
Fornier, S, Dobscha, S & Mick, DG. 1998. Preventing the premature death of relationship marketing. Harvard Business Review January-February: 42-49.
Forum for People Performance Management and Measurement (FPPMM). 2005. Motivating Employees to Embrace Integrated Marketing: a white paper. PMA Educational Foundation 1-12.
Gayeski, D. 2000. From audits to analytics. Communication World. 17 (7): 28-31.

155
Gayeski, D & Woodward, B. 1996. Integrated communication: from theory to performance. [O]. Available: http://omnicomassociates.com/omninteg.html. Accessed on 2004-03-23.
Goldhaber, GM. 1993. Organizational communication. 6th edition. Madison, WI: Brown & Benchmark
Goldhaber, GM, Dennis, HS, Richetto, GM & Wiio, OA. 1984. Information strategies: New pathways to management productivity. Norwood, NJ: Ablex.
Grenier, R & Metes, G. 1992. Enterprise Networking – working together apart. Digital Equipment Corporation.
Gronstedt, A. 1996. Integrating marketing communication and public relations: A stakeholder relations model, in Integrated communications: Synergy of persuasive voices, edited by E Thorson & J Moore. Hillside:Erlbaum.
Gronstedt, A. 2000. The customer century. Lessons from world-class companies in integrated marketing and communications. New York: Routledge.
Hanekom. J. 2006. Contextualisation of traditional advertising, in Integrated Organisational Communication, edited by R Barker & GC Angelopulo. CapeTown: Juta: 224-254.
Heller, F, Drenth, P, Koopman & Rus, V. 1988. Decision in organizations: A three country comparative study. London: Sage.
Ho, N. 2001. Creating an emotional connection with your employees through marketing communications: a new tool for managing your employees as internal “customers”. [O]. Available: http://jimc.medill.northwestern.edu/2001/ho.html. Accessed on 2005-09-12.
Hyo-Sook, K. 2003. Internal communication as antecedents of employee organisation relationships in the context of organisational justice: a multilevel analysis. Asian Journal of Communication. [O]. Available: http://www.amic.org.sg/ajcv13n2.html. Accessed: 2005-08-10.
Katz, D & Kahn, RL.1978. The Social Psychology of Organizations, 2nd edition. New York: John Wiley & Sons.
Kaye, RL. 1999. Companies need to realise internal marketing’s potential. Advertising Age’s Business Marketing 84(7): 13.
Kickert, WJM, Klijn, EH & Koppenjan, JFM. 1997. Introduction: A Management Perspective on Policy Networks’ in Managing Complex Networks: Strategies for the Public Sector, edited by WJM Kickert, EH Klijn & JFM Koppenjan. London: Sage.
156
Kitchen, PJ. 1999. The drive for integrated marketing communications. London: Thomson Business Press.
Kitchen, PJ. 2005. Seven trends signal PR’s rise. [O]. Available: http://publicsphere.typepad.com/behindthespin/2005/10/seven_trends_si.html. Accessed on 2005-12-04.
Kitchen, PJ, Brignell, J, Li, T & Jones, GS. 2004. The emergence of IMC: A theoretical perspective. Journal of Advertising Research. March 19-30.
Kitchen, PJ & Schultz, DE. 1999. A multi-country comparison of the drive for IMC. Journal of advertising research 39(1):21-42.
Kitchen PJ & Schultz, DE. 2000. Communicating globally. An integrated marketing approach. London: NTC business Books.
Kopec, JA. 1982. The communication audit. Public Relations Journal 38(5): 24-27.
Kozlowski, SWJ & Doherty, ML.1989. Integration of climate and leadership: Example of neglected issue. Journal of Applied Psychology 74: 546-553.
Kreps, G. 1990. Organisational communication: Theory and practice. New York: Longman.
Lee, TJ. 2005. The Twelve Dimensions of Strategic Internal Communication. [O]. Available: http://www.melcrum.com/cgi-bin/melcrum/html. Accessed on 2005-11-02.
Leedy, PD. 1993. Practical research: planning and design. 5th edition. New York: Macmillan.
Matveev, AV. 2002. Collected research articles: Theory of communication and applied communication. Bulletin of Russian Communication Association Issue1: 59-67.
McKenna, R. 1995. Relationship marketing. Reading, Mass: Addision Wesley.
Moriarty, SE. 1994. PR and IMC: The Benefits of Integration. Public Relations Quarterly 39(3): 38-44.
Mouton, J. 2001. How to succeed in your Master’s and Doctoral studies. A South African guide and resource book. Pretoria: Van Schaik.
Murphy, B, Murphy, A, Woodall, S & O’Hare R. 1999. The stakeholder relationship audit: measuring the effectiveness of integrated marketing communications. IMC Research Journal Spring 1999:9-11.
Myers, MD. 1997. Qualitative Research in Information Systems. [O]. Available: http://www.qual.auckland.ac.nz.html. Accessed on 2005-12-10.

157
Niemann, I. 2005. Strategic Integrated Communication Implementation: towards a South African conceptual model. Phd Communication Management. The University of Pretoria. [O]. Available: http://upetd.up.ac.za/thesis/available/etd-10062005-100746/.html. Accessed on 2005-10-20.
Opyt, B, Steward, S and Soy, SK. 2001. Communication Assessment at the Austin History Centre: An examination of internal communication. [O]. Available: http://www.gslis.utexas.edu.html. Accessed on 2005-11-24.
Overman, S. 2003. The seven heuristics of brand aligned organisations. [O]. Available: http://www.jackmorton.com/360/industry_insight/print.asp. Accessed on 2006-02-10.
Percy, L, Rossiter, JR and Elliott, R. 2001. Strategic Advertising Management. New York: Oxford University Press.
Peters,T. 1994. Crazy times call for crazy organizations. London: MacMillan.
Pettergrew, LS. 2000. “If IMC is so good, why isn’t it being implemented? Barriers to IMC adoption in corporate America. [O]. Available: http://www.medill.nwu.edu/imc/studentwork/pubs/jic/journal/2000/pettegrew.html. Accessed on 2005-15-10.
Postmes, T, Tanis M & de Wit, B. 2001. Communication and commitment in organizations: A social identity approach. Group Processes and Intergroup Relations 4: 227-246. Robbins, SP, Odendaal, A & Roodt, G. 2001. Organisational behaviour: global and Southern African Perspective. Cape Town: Pearson Education. Right Management Consultants and the International Association of Business Communicators (IABC) Research Foundation. Best Practices in Employee Communication: A Study of Global Challenges and Approaches. [O]. Available: http://www.iabc.com/rfl/. Accessed on 2005-11-23. Rodney, G. 2000. The fine art of the communication audit. Total Communication Measurement 2(2): 6-10.
Rytkonen, K. 2003. Organizational internal communication. [O]. Available http://www.lu.lv//materiali/apgads/raksti/666/resursi/666.pdf.html. Accessed on 2006-02-20
Scholes, E & Clutterbuck, D. 1998. Communication with stakeholders. An integrated approach. Long Range Planning 31(2): 227-238. Schwartz. L. 2005. The four C’s Drive the 5th P. [O]. Available http://www3.bnet:fordham.edu/bus/index.asp. Accessed on 2006-02-21.
158
Schultz, DE & Kitchen, PJ. 2000. Communicating globally. An integrated marketing approach. London: Macmillan Business.
Schultz, DE & Kitchen, PJ. 2004. Managing the changes in corporate branding and communication: closing and re-opening the corporate umbrella. Corporate Reputation Review 6(4): 347-366.
Schultz, DE & Schultz, H. 1998. Integrated Marketing Communication best-practice report. Consortium benchmarking study. Houston Texas: APQC.
Schultz, DE & Schultz, H. 2004. IMC: The next generation. Five steps for delivering value and measuring returns using marketing communication. New York: McGraw-Hill.
Schultz, DE, Tannenbaum, SI, Lauterborn, RF. 1992. Integrated marketing communications: Pulling it together and making it work. Lincolnwood:NTC Business Books. Setton, RP, Bennett, N & Liden, RC. 1996. Social exchange in organizations: The differential effects of perceived organizational support and leader member exchange. Journal of Applied Psychology 81: 219-227.
Simmons, OE & Gregory, TA. 2003. Grounded Action: Achieving Optimal and Sustainable Change. Forum Qualitative Social Research 4(3): 1-16.
Sinickas, AD. 2004. The top 10 measurement mistakes. [O]. Available: http://www.sinicom.com.html. Accessed on 2005-07-23.
Skinner, C, Von Essen, L, & Mersham, F. 1999. Handbook of public relations. 6th Edition. Cape Town: Oxford University Press.
Smit PJ, & Cronjé GJ. 2002. Management Principles: A contemporary edition for Africa. 3rd Edition. Cape Town: Juta.
Smith, J. 1994. Integrated Marketing. Marketing Tools. 1(8): 63-70.
Strauss, A & Corbin, J. 1990. Basics of qualitative research. Grounded theory procedures and techniques. Newbury Park: Sage.
Swain, WN, Zatepilina, O, Chmiola, L, Hua, Q, Moceri, L & Dev, P. 2001. We Like It, We’re Doing It, But Do We Know What It Is (Yet)? An exploratory study of integrated marketing communication. [O]. Available: http://scripps.ohiou.edu/wjmcr/vo104/4-4a-b.html. Accessed on 2005-12-04.
Tilev, K. 1994. Organisational culture. Doctoral Thesis. Helsinki University, Faculty of Communication. Helsinki: University Press. Timm, PR, 1986. Management Communication. A finger on the pulse. New Jersey: Engelwood Cliffs.

159
Tourish, D & Hargie, O. 1996. Communication in the NHS: using qualitative approaches to analyse effectiveness. Journal of Management in Medicine 19(5): 38-54.
Tourish, D & Wilson, N. 2002. "Communication Audits and the Effects of Increased Information: A Follow-up Study". Journal of Business Communication. October, Volume 39.
Tushman, M & Nadler, D. 1999. The organization of the future: strategic imperatives and core competencies for the 21st Century. Organisational dynamics 28(1): 45-60.
Van der Walt, L. 2006. Organisational change and management, in Integrated Organisational Communication, edited by R Barker & GC Angelopulo. CapeTown: Juta: 107-130.
Van der Walt, L & Breet-van Niekerk, T. 2006. Assessing organisational communication, in Integrated Organisational Communication, edited by R Barker & GC Angelopulo. CapeTown: Juta: 331-336.
Van Vuuren, D, Maree, A & De Beer, AS. 1998. Mass media research: the quest for certain knowledge, in Mass media: The South African handbook of mass communication, edited by AS De Beer. Pretoria: Van Schaik.
Wayne, SJ, Shore, LM & Liden, RC. 1997. Perceived organizational support and leader-member exchange: A social exchange perspective. Academy of Management Journal 40: 82-111.
Weick, KE. 1969. The social psychology of organizing. Reading, MA: Addison-Wesley.
Welsch, HP, & La Van, H. 1981. Inter-relationships between organizational commitment and job characteristics, job satisfaction, professional behavior, and organizational climate. Human Relations Journal 34:1079-1089.
Wimmer, RD & Dominick, J. 1983. Mass Media Research: An introduction. Belmont, California: Wadsworth.
Witherspoon, PD. 1997. Communicating Leadership – an organisational perspective. Boston: Allyn and Bacon.

160
APPENDIX 1
GROUP ADMINISTERED PERCEPTION SURVEY
Hello and thank you for taking the time to fill in this survey. Please read each question carefully and tick the appropriate circle or fill in your answers in the space provided. This survey is anonymous, so we do not need to know your name, but would appreciate your honest response. It won’t take more than 15 minutes. 1. Overall, how satisfied are you with communication at ICG? Please tick the appropriate circle
2. What position do you hold at ICG? Please tick the appropriate circle
o Very satisfied o Satisfied o Neutral o Dissatisfied o Very dissatisfied
o EXCO member o Senior Management o Middle Management o Supervisor o General staff
3. Which best describes your impression
of communication at ICG? Please tick the appropriate circle
4. How do you feel about the information you receive from management? Please tick the appropriate circle
o Keeps me fully informed o Keeps me fairly informed o Keeps me adequately informed o Gives us only a limited amount of
information o Doesn’t tell us much
o I can always believe it o I can usually believe it o I can believe it about half the
time o I usually can’t believe it o I can almost never believe it
5. Overall how satisfied are you with communication received from management? Please rank in order of preference from 1-5. Write your answers in the boxes below, indicating 1 for most satisfied and 5 for least satisfied.
CEO EXCO
Senior Management Middle management Your direct Supervisors
6. What problems do you see when it comes to communication at ICG? Add your

161
comments/suggestions for improving communication below. 7. How well do you feel you know the
company? Please tick the appropriate circle below
8. Compared to last year this time, do you feel more or less informed about ICG’s goals and strategies? Please tick the appropriate circle below
o I know the company very well o I know a fair amount about the
company o I know a little bit about the
company o I know almost nothing about the
company o Knowing about the company is
not important to me
o Much more knowledgeable o Somewhat more knowledgeable o Same level of knowledge o Somewhat less knowledgeable o Much less knowledgeable
9. What is the best thing about communication at ICG? Please write you answer in the space provided below. 10. Look at the list below and indicate which information you feel is important for you to receive. Please tick all applicable boxes and add your own suggestions.
o The company’s strategies for the future o Products and services of the company o The overall financial picture of the company o Human resource processes o Company benefits o Compensation and bonus programmes o Marketing programmes o Government affairs affecting the company o Our community involvement o Changes in structure or management o Other (please list) _______________________________
11. How much of our newsletter 12. What is your overall evaluation of
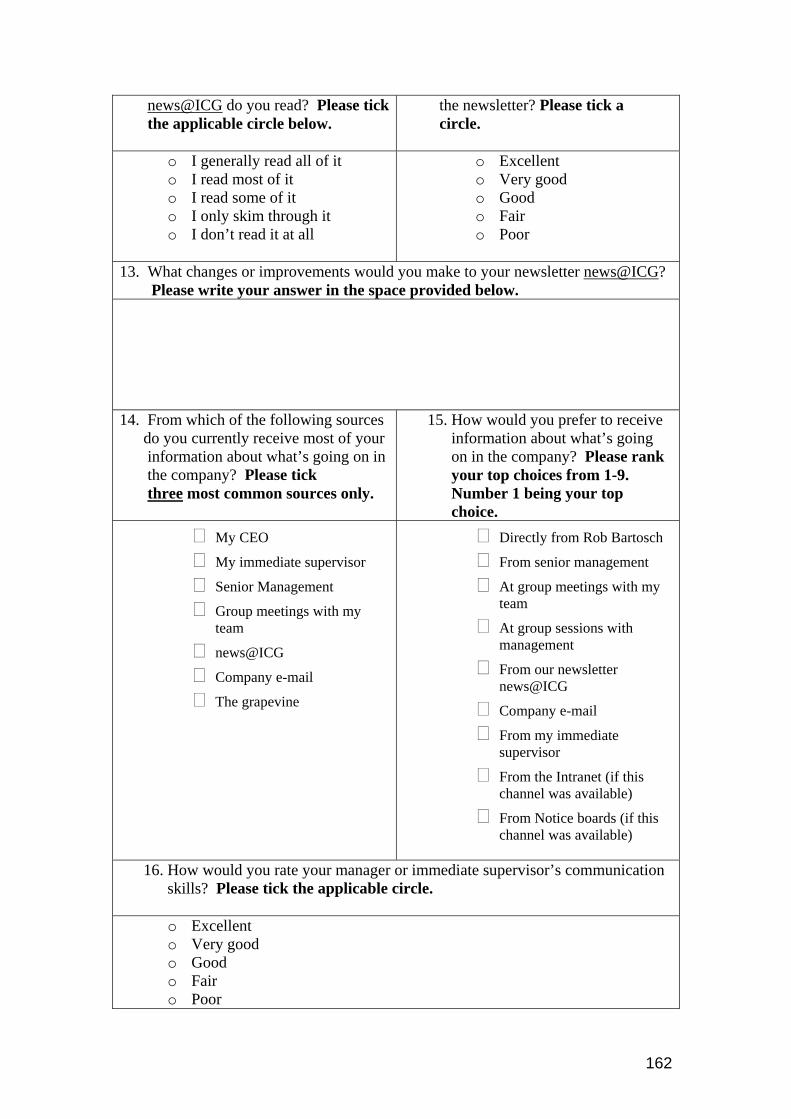
162
news@ICG do you read? Please tick the applicable circle below.
the newsletter? Please tick a circle.
o I generally read all of it o I read most of it o I read some of it o I only skim through it o I don’t read it at all
o Excellent o Very good o Good o Fair o Poor
13. What changes or improvements would you make to your newsletter news@ICG? Please write your answer in the space provided below. 14. From which of the following sources do you currently receive most of your information about what’s going on in the company? Please tick three most common sources only.
15. How would you prefer to receive information about what’s going on in the company? Please rank your top choices from 1-9. Number 1 being your top choice.
My CEO
My immediate supervisor
Senior Management
Group meetings with my team
news@ICG
Company e-mail
The grapevine
Directly from Rob Bartosch
From senior management
At group meetings with my team
At group sessions with management
From our newsletter news@ICG
Company e-mail
From my immediate supervisor
From the Intranet (if this channel was available)
From Notice boards (if this channel was available)
16. How would you rate your manager or immediate supervisor’s communication skills? Please tick the applicable circle.
o Excellent o Very good o Good o Fair o Poor

163
17. Do you have any suggestions for the company that might help to improve our
performance and efficiency? Please write you answer in the space provided
18. How well do you know ICG’s vision, mission, brand code and all that it stands for? Please tick the appropriate circle below.
19.Do you contribute to the overall success of ICG? Please tick the appropriate circle.
o I try and live the values daily o I know what the values are o I know a little about the values o I know almost nothing the
values o Knowing about the values is not
important to me
o Most definitely o Most of the time o Maybe o Probably not o I do not contribute in anyway
20. How do you as an employee of ICG contribute to our country?
21. ICG cares about its employees, do you agree? Please tick the appropriate circle
22. How long have you have you worked at ICG? Please tick the appropriate circle
o I strongly agree o I agree most of the time o Maybe o To some extent o I disagree
o Less than 1 year o 1 to 5 years o 6 to 10 years o 11 to 15 years o More than 15 years
23. What is your gender? Please tick the appropriate circle below o Male
o Female

164
24. If you were made CEO for one day what changes would you make? You may supply your name if you choose. The CEO will consult with you personally, should your ideas be considered for implementation.
NAME (Optional only)
The end Many thanks for filling in this survey.
Please hand-in and collect your chocolate!

165
APPENDIX 2
INTERVIEW QUESTIONS
Name
Tile
DATA-DRIVEN 1. To what extent is employee information and behaviour captured and used as a strategic tool to enhance internal communication at ICG?
Don’t know
Very little
Some
Almost always
Always
2. How does ICG take advantage of web technology to enhance internal communication on multiple fronts? (For example does it play a role in recruitment, measuring high performance, in succession planning, information sharing and keeping track of employee concerns and major issues? MISSION MARKETING 3. Does ICG’s internal mission marketing develop a positive feeling of personal identity between employees and the company?
Don’t know
Very little
Some
Almost always
Always
4. ICG recently communicated its vision, mission and values to Cape Town based employees, in your opinion how successful was this campaign and why?

166
STRATEGIC CONSISTENCY
5. Does ICG communicate the same core values and brand messages of the company through every aspect of the employee experience?
Don’t know
Very little
Some
Almost always
Always
6. How does ICG communicate the same internal brand message at every employee touch point in the organisation? (Touch points include initial recruitment and training, on-going training, to compensation and incentives programmes, to information sharing and two-way communication channels?
CROSS-FUNCTIONAL PLANNING AND MONITORING 7. Does ICG’s internal structure create functional divisions and departmentalisation?
Don’t know
Very little
Some
Almost always
Always
8. How would creating cross-functional teams, rather than departmental planning and monitoring benefit ICG?

167
EMPLOYEE-CENTRIC 9. Provide examples that show that ICG wants to, or does not want to build long-term committed relationships with its employees.

168
APPENDIX 3
SPECIFIC CATEGORIES FOR OPEN-ENDED QUESTIONS
Evaluation criteria one: Cross-functional planning and monitoring
Research question: Does ICG’s structure create functional divisions and
departmentalisation?
Specific categories
1.1 No integrated systems and processes
1.2 No cross-departmental communication
1.3 Departments work in isolation
1.4 Physical working environment unsuitable
Evaluation criteria two: Mission marketing
Research question: Does ICG’s internal mission marketing develop a positive
feeling of identity between employees and the company?
Specific categories
2.1 Unsure how everyone fits in
2.2 Unknown company policies or how they tie in with the values
2.3 Not living the company values
Evaluation criteria three: Become data-driven
Research question: Does ICG’s data-driven approach improve the employee
experience and enhance communication?

169
Specific categories
3.1 Not technologically empowered to meet customer needs
3.2 No access to customer or company databases
3.3 No intranet or central database for sharing information
3.4 No integrated data-driven communication
Evaluation criteria four: Employee-centrism
Research question: Does ICG apply employee-centric concepts by listening
to, informing, valuing and empowering employees?
Specific categories
4.1 Managers do not ensure messages are understood and that
employees are adequately informed
4.2 Managers do not encourage employee feedback
4.3 Managers are not interested in building employee relationship or
ensuring employees feel valued
4.4 Employee ideas are not listened to
4.5 Employees not included in decision-making or empowered to make
decisions
4.6 There is no knowledge or information sharing
4.7 Not enough or timeous communication
4.8 Not enough face-to-face communication
4.9 Not empowered to service students/customers
4.10 Employees not informed or included in strategy formulation
Evaluation criteria five: Maintain strategic consistency
Research question: Does ICG communicate the same core values of the
company through every aspect of the employee’s experience, regardless of
rapid growth?

170
Specific categories
5.1 No consistent induction, training, mentorship, incentive programmes in
place
5.2 Some employees are change resistant
5.3 No time for communication due to rapid growth
5.4 Feeling less valued and informed than a year ago
5.5 No consistent brand messages
5.6 Do not feel I have job security
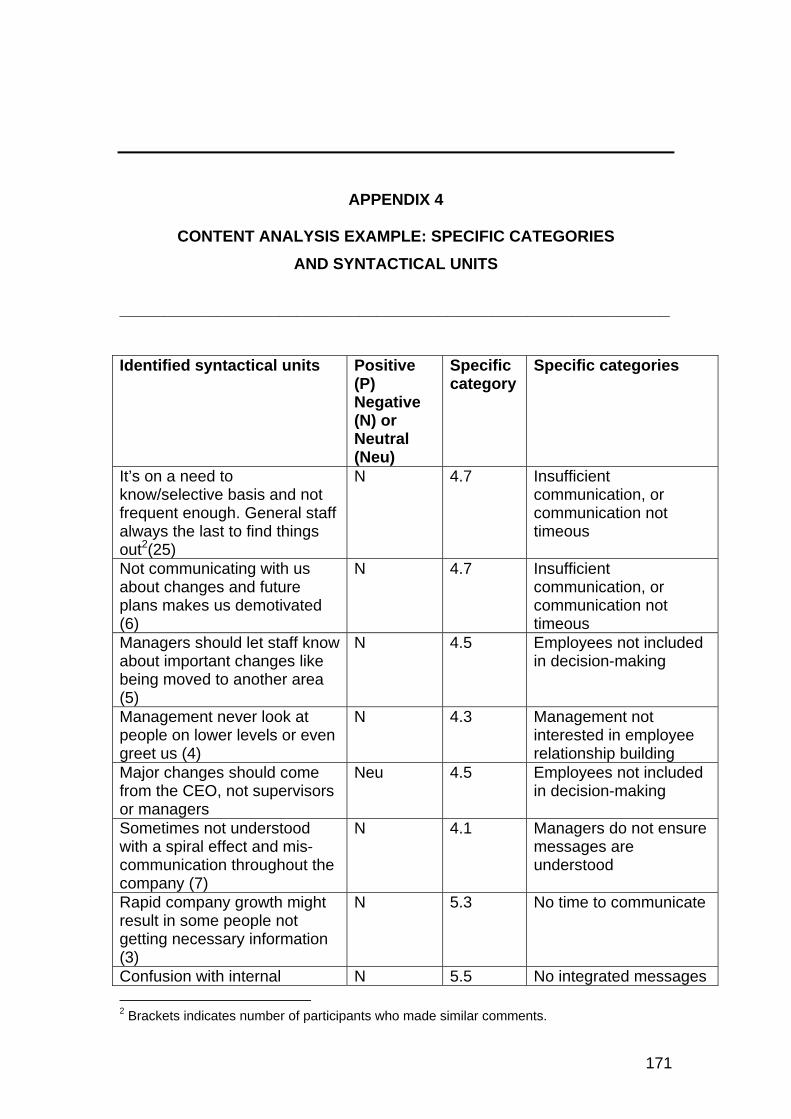
171
APPENDIX 4
CONTENT ANALYSIS EXAMPLE: SPECIFIC CATEGORIES AND SYNTACTICAL UNITS
______________________________________________________________ Identified syntactical units Positive
(P) Negative (N) or Neutral (Neu)
Specific category
Specific categories
It’s on a need to know/selective basis and not frequent enough. General staff always the last to find things out2(25)
N 4.7 Insufficient communication, or communication not timeous
Not communicating with us about changes and future plans makes us demotivated (6)
N 4.7 Insufficient communication, or communication not timeous
Managers should let staff know about important changes like being moved to another area (5)
N 4.5 Employees not included in decision-making
Management never look at people on lower levels or even greet us (4)
N 4.3 Management not interested in employee relationship building
Major changes should come from the CEO, not supervisors or managers
Neu 4.5 Employees not included in decision-making
Sometimes not understood with a spiral effect and mis-communication throughout the company (7)
N 4.1 Managers do not ensure messages are understood
Rapid company growth might result in some people not getting necessary information (3)
N 5.3 No time to communicate
Confusion with internal N 5.5 No integrated messages 2 Brackets indicates number of participants who made similar comments.
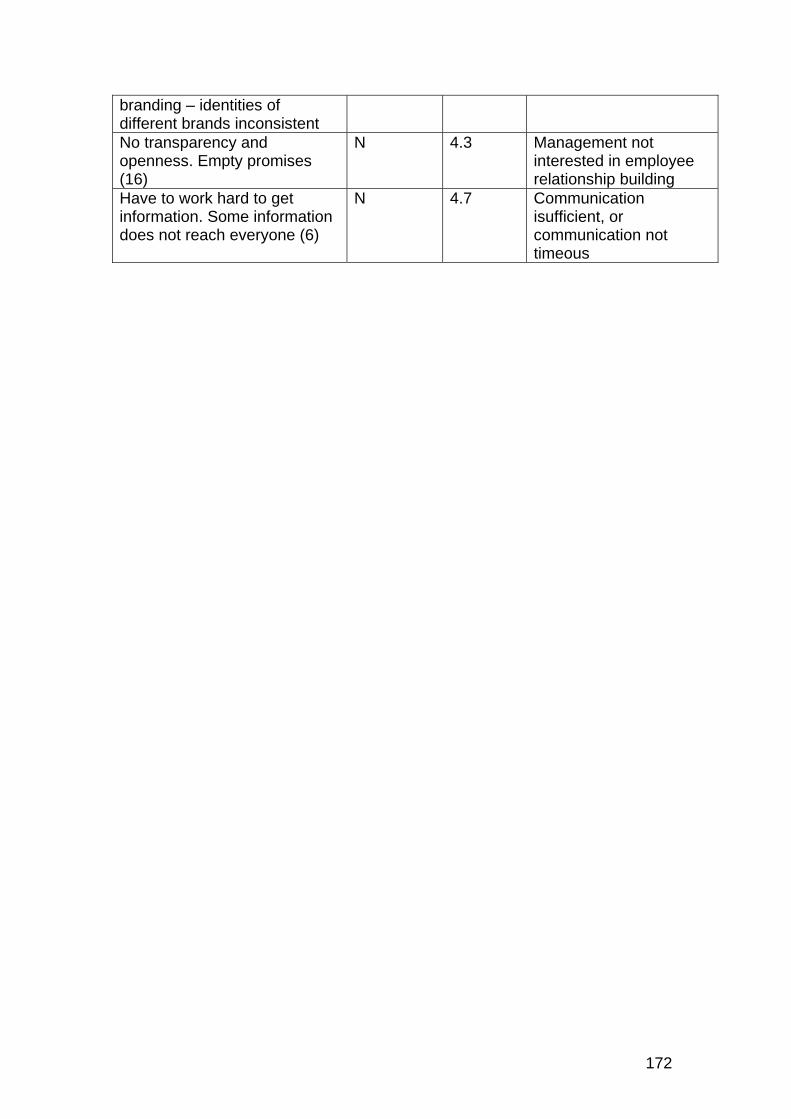
172
branding – identities of different brands inconsistent No transparency and openness. Empty promises (16)
N 4.3 Management not interested in employee relationship building
Have to work hard to get information. Some information does not reach everyone (6)
N
4.7 Communication isufficient, or communication not timeous

173
Related Documents