Working Paper 072 www.future-agricultures.org Working Paper Commercialisation of African Smallholder Farming. The Case of Smallholder Farmers in Central Tanzania Khamaldin Mutabazi**, Steve Wiggins*& Ntengua Mdoe** August 2013

Welcome message from author
This document is posted to help you gain knowledge. Please leave a comment to let me know what you think about it! Share it to your friends and learn new things together.
Transcript

Working Paper 072 www.future-agricultures.org
Wor
king
Pap
er
Commercialisation of African Smallholder Farming. The Case of Smallholder Farmers in Central Tanzania
Khamaldin Mutabazi**, Steve Wiggins*& Ntengua Mdoe**
August 2013

Working Paper 072 www.future-agricultures.org2
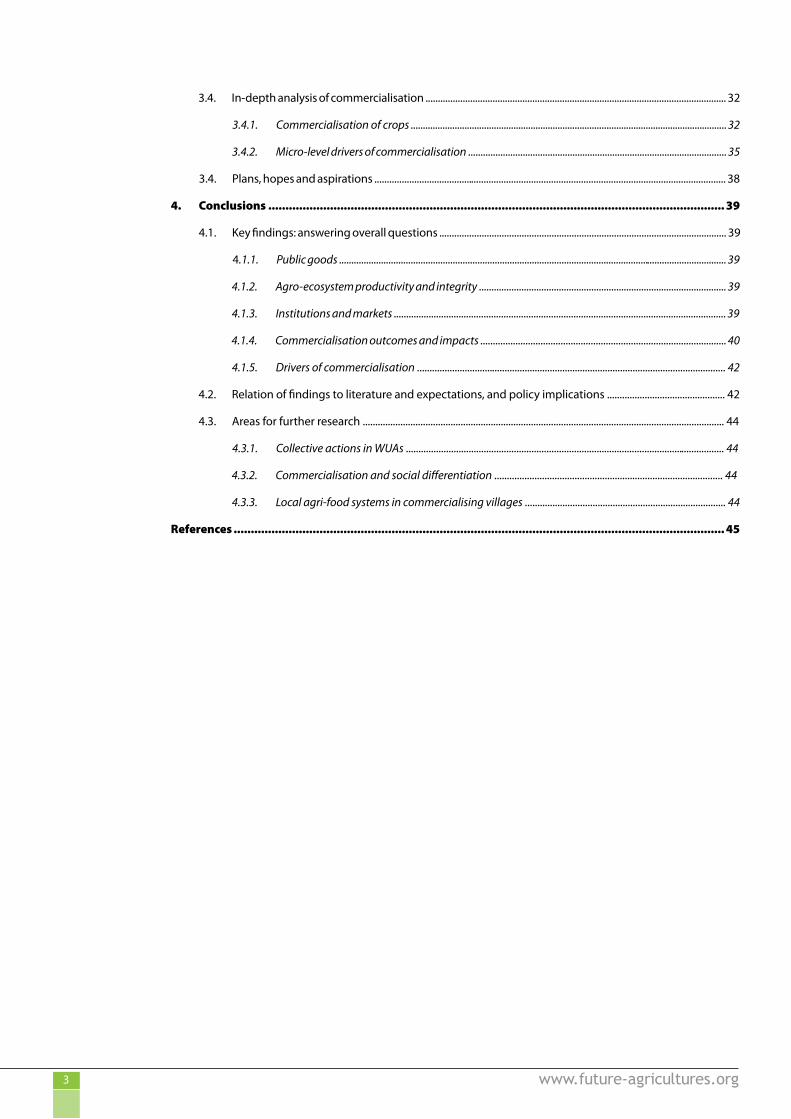
Table of Contents
Acknowledgements ................................................................................................................................. 5
Author ....................................................................................................................................................... 5
Table of contents ....................................................................................................................................... 6
Summary ................................................................................................................................................... 6
Background ......................................................................................................................................... 6
The study carried out ........................................................................................................................... 6
Major findings .......................................................................................................................................... 6
Farming households and their agriculture ........................................................................................................................ 6
Crop sales and marketing .......................................................................................................................................................... 7
Drivers of commercialisation .................................................................................................................................................. 7
Outcomes of commercialisation ............................................................................................................................................. 7
Conclusions and policy implications .................................................................................................................................... 7
1. Introduction ..................................................................................................................................... 8
1.1. African agriculture: an overview ...................................................................................................................................... 8
1.2. African agriculture – growth and commercialisation paths ................................................................................. 9
1.3. Research objective and research questions ................................................................................................................ 10
2. Methodology ....................................................................................................................................10
2.1. Analytical framework ........................................................................................................................................................10
2.2. Research design ...................................................................................................................................................................11
2.3. Sampling of farmers ...........................................................................................................................................................12
2.4. Data collection ......................................................................................................................................................................12
2.5. Data analysis ..........................................................................................................................................................................12
2.6. The villages ...............................................................................................................................................................................13
2.6.1. Ruaha-Mbuyuni ...................................................................................................................................................13
2.6.2. Malolo .....................................................................................................................................................................13
2.6.3. Lumuma .................................................................................................................................................................14
2.6.4. Msowero .................................................................................................................................................................14
2.6.5. Ecological, and socio-economic contexts ......................................................................................................14
2.6.6. Economy, markets and institutions ....................................................................................................................14
3. Findings and discussion ........................................................................................................................ 15
3.1. Farm households and assets .............................................................................................................................................. 15
3.1.1. Farming household characteristics ................................................................................................................. 15
3.1.2. Land asset and use ............................................................................................................................................... 16
3.1.3. Ownership of other Assets ................................................................................................................................ 16
3.2. General assessment of the crop sub-sector .............................................................................................................. 18
3.3. Farm economics and commercialisation ...................................................................................................................... 21
3.3.1. Highly commercialised crops ............................................................................................................................. 21
3.3.2. Farm labour .......................................................................................................................................................... 23
3.3.3. Farm investment and returns ............................................................................................................................. 26
3.3.4. Rural finance and liquidity ................................................................................................................................ 26
3.3.5. Marketing of commercial crops ...................................................................................................................... 27
3.3.6. Production and marketing risks ...................................................................................................................... 31
3.3.7. Agricultural extension and associations ....................................................................................................... 32
Working Paper 072 www.future-agricultures.org3
3.4. In-depth analysis of commercialisation ......................................................................................................................... 32
3.4.1. Commercialisation of crops ................................................................................................................................. 32
3.4.2. Micro-level drivers of commercialisation ........................................................................................................ 35
3.4. Plans, hopes and aspirations ............................................................................................................................................. 38
4. Conclusions ..................................................................................................................................... 39
4.1. Key findings: answering overall questions ................................................................................................................... 39
4.1.1. Public goods ............................................................................................................................................................. 39
4.1.2. Agro-ecosystem productivity and integrity ................................................................................................... 39
4.1.3. Institutions and markets ..................................................................................................................................... 39
4.1.4. Commercialisation outcomes and impacts .................................................................................................. 40
4.1.5. Drivers of commercialisation ........................................................................................................................... 42
4.2. Relation of findings to literature and expectations, and policy implications ............................................... 42
4.3. Areas for further research ................................................................................................................................................ 44
4.3.1. Collective actions in WUAs ............................................................................................................................... 44
4.3.2. Commercialisation and social differentiation ........................................................................................... 44
4.3.3. Local agri-food systems in commercialising villages ................................................................................ 44
References ............................................................................................................................................... 45
Working Paper 072 www.future-agricultures.org4
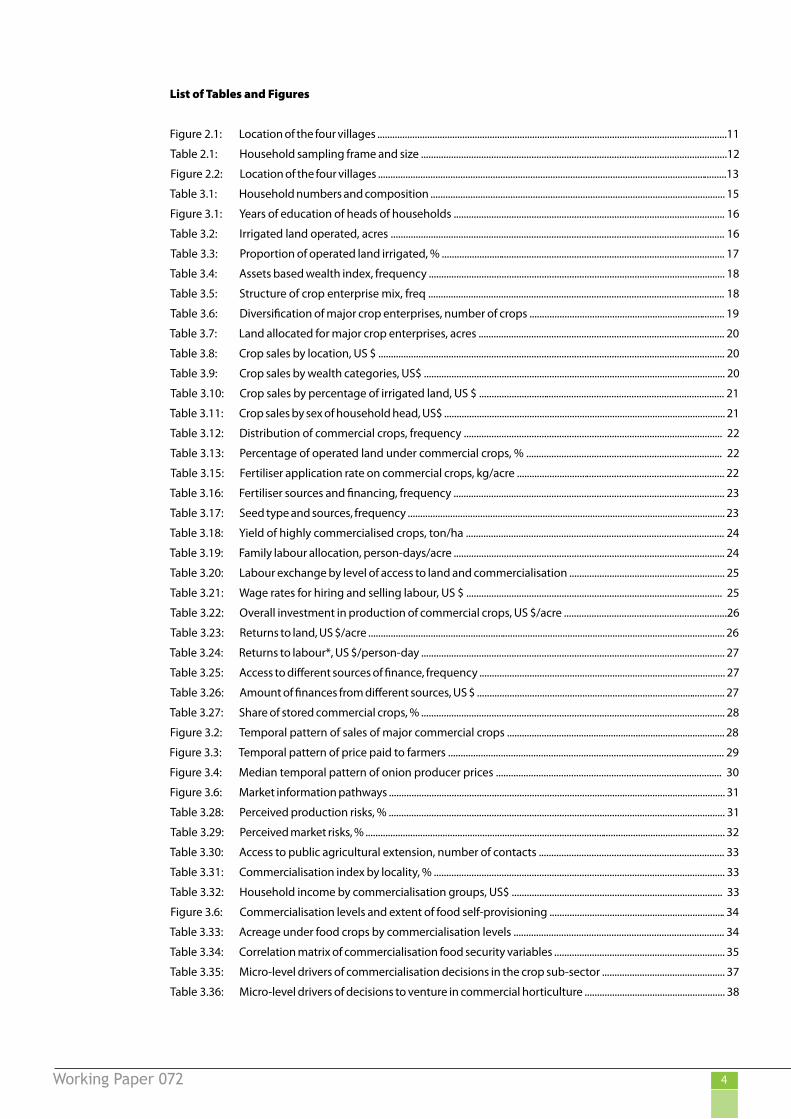
List of Tables and Figures
Figure 2.1: Location of the four villages ............................................................................................................................................11
Table 2.1: Household sampling frame and size ..........................................................................................................................12
Figure 2.2: Location of the four villages ............................................................................................................................................13
Table 3.1: Household numbers and composition ...................................................................................................................... 15
Figure 3.1: Years of education of heads of households ............................................................................................................ 16
Table 3.2: Irrigated land operated, acres ..................................................................................................................................... 16
Table 3.3: Proportion of operated land irrigated, % ................................................................................................................. 17
Table 3.4: Assets based wealth index, frequency ...................................................................................................................... 18
Table 3.5: Structure of crop enterprise mix, freq ...................................................................................................................... 18
Table 3.6: Diversification of major crop enterprises, number of crops .............................................................................. 19
Table 3.7: Land allocated for major crop enterprises, acres .................................................................................................. 20
Table 3.8: Crop sales by location, US $ .......................................................................................................................................... 20
Table 3.9: Crop sales by wealth categories, US$ ........................................................................................................................ 20
Table 3.10: Crop sales by percentage of irrigated land, US $ .................................................................................................. 21
Table 3.11: Crop sales by sex of household head, US$ ................................................................................................................ 21
Table 3.12: Distribution of commercial crops, frequency ....................................................................................................... 22
Table 3.13: Percentage of operated land under commercial crops, % .............................................................................. 22
Table 3.15: Fertiliser application rate on commercial crops, kg/acre ................................................................................... 22
Table 3.16: Fertiliser sources and financing, frequency ............................................................................................................ 23
Table 3.17: Seed type and sources, frequency ............................................................................................................................... 23
Table 3.18: Yield of highly commercialised crops, ton/ha ....................................................................................................... 24
Table 3.19: Family labour allocation, person-days/acre ............................................................................................................ 24
Table 3.20: Labour exchange by level of access to land and commercialisation .............................................................. 25
Table 3.21: Wage rates for hiring and selling labour, US $ ...................................................................................................... 25
Table 3.22: Overall investment in production of commercial crops, US $/acre .................................................................26
Table 3.23: Returns to land, US $/acre ............................................................................................................................................... 26
Table 3.24: Returns to labour*, US $/person-day ......................................................................................................................... 27
Table 3.25: Access to different sources of finance, frequency .................................................................................................. 27
Table 3.26: Amount of finances from different sources, US $ ................................................................................................... 27
Table 3.27: Share of stored commercial crops, % ......................................................................................................................... 28
Figure 3.2: Temporal pattern of sales of major commercial crops ........................................................................................ 28
Figure 3.3: Temporal pattern of price paid to farmers .............................................................................................................. 29
Figure 3.4: Median temporal pattern of onion producer prices .......................................................................................... 30
Figure 3.6: Market information pathways ...................................................................................................................................... 31
Table 3.28: Perceived production risks, % ...................................................................................................................................... 31
Table 3.29: Perceived market risks, % ................................................................................................................................................. 32
Table 3.30: Access to public agricultural extension, number of contacts .......................................................................... 33
Table 3.31: Commercialisation index by locality, % .................................................................................................................... 33
Table 3.32: Household income by commercialisation groups, US$ .................................................................................... 33
Figure 3.6: Commercialisation levels and extent of food self-provisioning ...................................................................... 34
Table 3.33: Acreage under food crops by commercialisation levels .................................................................................... 34
Table 3.34: Correlation matrix of commercialisation food security variables .................................................................... 35
Table 3.35: Micro-level drivers of commercialisation decisions in the crop sub-sector ................................................. 37
Table 3.36: Micro-level drivers of decisions to venture in commercial horticulture ........................................................ 38
Working Paper 072 www.future-agricultures.org5
Acknowledgements
The research team wishes to extend their sincere thanks to the people and institutions that helped in the implementation of this study. These include the enumeration team led by Mr Claude Maeda, respective village governments and local guides who helped to locate the respondents.
Heartfelt thanks must go to the respondent farmers especially those who participated in the onion study and accepted to be re-interviewed during this commercialisation study.
Many thanks to Thom Jayne from Michigan state University for reviewing an earlier draft of this paper and providing helpful comments.
The analysis and viewed expressed here are those of the authors and not necessarily of their colleagues or institutions.
Abbreviations
Now 1 US$ is equivalent to TShs1,300
Working Paper 072 www.future-agricultures.org6
Summary
Background
African agriculture is predominantly carried out on small-scale family farms. The big question about such family farms is whether they can be successfully commercialised within their current structures, or whether they should give way to commercial medium and large-scale farm enterprises. In more detail, the following questions arise about the experience of commercialisation of small farms in Africa and their prospects:
• Under what conditions, and with what encouragement from policy, may small farms be commercialised? Is it sufficient to provide roads and physically connect farmers to market?
• Does commercialisation benefit smallholding households? Does this improve or worsen food security?
• Does commercialisation increase social differences? How does this affect the position of females within the household? Does it lead to loss of land for some small farmers? Does it lead to increasing dependency on private corporations with monopoly power over inputs or outputs? What is the impact of commercialisation on those with little or no land? Are they marginalised, or do they benefit through labour markets and other linkages in the rural economy?
• Does commercialisation raise risks in the markets to unacceptable levels? Do different abilities to bear risk mean that some farmers can take the opportunities while others dare not?
• Does commercialisation lead to over-use of natural resources or otherwise degrade the environment?
The study carried out
This study addresses primarily the first two questions about the nature of commercialisation, its benefits and impacts on food security.
Four villages in Tanzania that produce commercial crops for sale, mainly onions, were studied. The four were distinguished by having good or bad road access, and by having mobile phone coverage or not, as follows:
• Ruaha-Mbuyuni, Kilolo District, Iringa Region — good road access, mobile network;
• Malolo B, Kilosa District, Morogoro Region — good road access, no network;
• Lumuma, Kilosa District, Morogoro Region — poor road access, mobile network; and,
• Msowero, Kilosa District, Morogoro Region — poor road access, no network.
Physically, these villages lie in sub-humid to semi-arid areas, where rainfed cropping is risky, and irrigation is the only sure way to produce crops. Farmers report that the climate is getting hotter and rainfall is becoming less reliable. Irrigated smallholder commercial horticulture is widely practiced in the villages, using gravity systems drawing on streams from the hills. The schemes were first developed locally, although later the intakes were upgraded by government and donors. Local committees allocate water and maintain the systems, apparently successfully.
The possibility of irrigation has meant that for a generation the villages have been growing quickly as incomers arrive. This makes their composition quite ethnically diverse. Pressure on the limited irrigated areas is growing and land rents are rising.
Data were collected by questionnaire from households, in a survey conducted from early October to November 2010. The questionnaire covered household socio-demographics; crop production and gender; input costs, labour and marketing of highly commercialised crops; storage; enterprise risk perceptions, labour market dynamics; livelihood capitals and food security; commodity trade and exchange; relationship between mobile phones and marketing; and farmers’ future plans, hopes and aspirations. These data complemented earlier qualitative studies in the same villages and a survey one year earlier of onion growers — reported in Mutabazi et al. 2010.
Descriptive, explorative and causal analyses were undertaken, including construction of commercialisation and wealth indexes, returns to land and labour and econometric estimations of factors underlying commercialisation of the crop-subsector and participation in commercial horticulture.
Major findings
Farming households and their agriculture
Most of the land operated, 61%, was irrigated: a typical household operated an acre of irrigable land. The rest of the land was rainfed. In the two villages with good road access, Mbuyuni and Malolo, almost all households have an irrigated plot: in Lumuma and Msowero only 63% and 70% have access to irrigation — since the streams in this area have less water. Land is the main asset owned:
Working Paper 072 www.future-agricultures.org7
there are few livestock, and most operations are carried out with hand tools.
Few households had access to credit or formal savings and hence operated their farms using their own savings. Even though this allowed many to pay for fertiliser and hired labour, most reported lack of capital as the main obstacle to expanding or intensifying their production.
Farmers grow a mix of cereals, vegetables and legumes, typically one horticultural crop on about half an acre, another half-acre to legumes, and up to two cereal crops on two acres. Cereals tend to be grown on rainfed plots. The commercial crops received considerable fertiliser, 135 kg/ha or more, obtained from mainly from private dealers and paid for using cash. A significant minority (72/216) of farmers obtained subsidised fertilisers. Most seed used comes from local seed producers and home-saved seeds, rather than certified seed.
A typical household allocated about 50 person-days per acre of its family labour force. Over 80% of the farming households hired someone to work on their farms. Interestingly, 34% of the households who hired others got hired as well.
Just over a quarter of farmers were affiliated to social associations. Water User Associations (WUAs), charged with water allocation and mediation of disputes over water, were predominant.
Crop sales and marketing
Onions were grown mainly for sale outside the villages, while maize, beans and paddy were also sold to some extent but mainly within local markets. Farmers in villages with good road access sold roughly twice as much as those in remote villages, US$1,600 for the average farm household versus US$760. Those rich in assets earned seven times more than those with few assets, US$1,307 compared to US$195. Households headed by females sold less than those headed by males: US$185 versus US$477.
Most farmers sold to small-scale brokers and traders, on the farm or in the village, almost always paid in cash. Farmers felt themselves to be takers of prices set by buyers and local brokers. They typically relied on incoming traders and brokers as sources of market information. Although there is widespread use of mobile phones, these are used mainly for socialising and for communicating with buyers, but less frequently to discover prices in distant markets. Most farmers did not see price risks as important. Few crops were stored, even though prices a few months after the harvest were typically two-thirds more.
Drivers of commercialisation
Tobit and Cragg models suggested that commercialisation was likely to be greater for households with younger heads, those seeing price risks as low,
having more savings, and belonging to water user and other associations. In contrast to any expectations that commercialisation might entail specialisation, households with more diverse crops were more commercialised.
Households in the two villages with good roads were more likely to have greater commercial sales and to have more intensive production with higher yields per hectare.
Female farmers usually had less access to irrigated land and were thus at a disadvantage.
Outcomes of commercialisation
More commercialised households had higher incomes than others.
Interestingly, more commercialised households tended to have less land planted to food crops, with less commercial households planting typically 3 acres, and the more commercial planting 2 acres. Yet there was no clear difference in months of self-provisioning in major food staples across the commercialisation levels. A typical household had around four months of maize supply. It seemed there was generalised and considerable reliance on buying in food from other farmers who had surpluses of maize.
Conclusions and policy implications
This case suggests that small farms can successfully commercialise, largely through their own initiative, thereby raising productivity on their farms and increasing their incomes.
Are there drawbacks to commercialisation? On food security, smallholders tend to grow both staples and commercial crops. Where some households specialise in commercial crops, it seems neighbouring farmers see this as an opportunity to supply them with staples.
Social differentiation takes place in that households have different access to resources such as land, irrigation water, capital and skills — the most worrying aspect being that female farmers may often be disadvantaged. Whether such differences widen income and social inequalities, is not known; since although commercialisation may allow some households to make more money than others, linkages may spread benefits — through hiring in labour, from the market for maize and other staples, and from the most commercial households spending money on local businesses and services.
Environmental impacts are similarly not clear: use of fertiliser and pesticides may lead to pollution, but the focus on irrigation may spare hillsides from being cleared of bush. Given the importance of the water supply, farmers should be interested to conserve the river catchment to sustain flows to their farmland.
Working Paper 072 www.future-agricultures.org8
What may be the policy implications? To date, public policies that have allowed this to happen have been limited largely to macro-economic stability, provision of roads, schools and health posts. The main specific agricultural intervention has been the upgrading of the irrigation intakes. Agricultural extension in these villages was almost absent. Some farmers had access to subsidised fertiliser, but most did not.
There may well be scope for measures to raise productivity by promoting better seed production and use, by training in management of water, nutrients and pests. Perhaps the main public contribution here would be to help farmers deal with threats to their horticultural plots from pests and diseases.
Lack of financial services has not prevented commercialisation, but it may limit the full potential of the irrigated fields being achieved. While this may be a candidate for public action, it is less clear what government can do effectively and efficiently to improve such services. Publicly provided credit has a poor record in most parts of the world.
For the two remote villages with poor road access, Lumuma and Msowero, however, the priority is improving the road. Poor road access has not stopped them producing commercial crops, but it does raise the cost of marketing: when there are thriving farms to be reached, this helps justify the costs of upgrading rural access roads.
Commercialisation of African small family farms is a promising path to poverty reduction and food security. However, it is not a path without planning and implementation hurdles. This should not, however, dismay us: progress will be made partly by trial and error, a process facilitated if existing experiences and evidence from case studies are documented and reviewed to learn the lessons and hence to refine plans and actions.
1. Introduction
1.1. African agriculture: an overview
African agriculture is predominantly smallholder mostly operated as small-scale family farms. The big question about such family farms is whether they can be transformed into commercial medium and large-scale farm enterprises. The debate over the relative advantages and disadvantages in Africa of large-scale versus small-scale farming models has been further stimulated by leading development economists (Collier and Dercon, 2009).
However, Collier and Dercon (2009) question the case for smallholders as engines for growth and poverty reduction as much of the focus on smallholders may actually hinder large scale poverty reduction. They argue that there is scope for large scale farmers as commercial
enterprises, often in interaction with smaller scale farmers using institutional frameworks that encourage vertical integration and scale economies in processing and marketing.
The recent global trends in climate change, biofuels and higher food prices forge uncertainties in the future growth and commercialisation of smallholder agriculture in Africa (Collier and Dercon, 2009; Cotula et al., 2008). Investor interest is driven mainly by biofuels speculators and by the desire to invest in land for food production (Cotula et al., 2008; GRAIN, 2008). There is enormous potential for competitive commercial agriculture in Africa (World Bank, 2009; Binswanger-Mkhize et al., 2009).
Transformations required to stimulate growth in smallholder agriculture would be attained through a variety of interventions, from technology to market development (World Bank, 2007). Furthermore, Juma (2011) argues that three major opportunities that can help Africa transform its agriculture include: first, advances in science, technology and engineering; second, efforts to create regional markets that will provide new incentives for agricultural production and trade; and third, a new generation of African leaders that will help the continent to focus on long-term economic transformation.
Brazilian-style commercial farms are likely to be close to the frontiers of technology, finance and logistics. The innovations of recent decades have made the rapid adaption of technology, access to finance, and high-speed logistics more important, and in the process given commercial agriculture a substantial advantage over the smallholder mode of production (Collier and Dercon, 2009).
High transactions costs in agricultural markets, combined with large price fluctuations, affect incentives for smallholder productivity growth (Collier and Dercon, 2009).
Agricultural commercialisation involves a gradual replacement of integrated farming systems by specialised agricultural enterprises (Pingali and Rosegrant, 1995). They further argue that commercialisation process should not be expected to be a frictionless process, and significant equity and environmental consequences may occur, at least in the short to medium term, particularly when inappropriate policies are followed.
The policies that can help alleviate many of the possible adverse transitional consequences include investment in rural infrastructure and crop improvement research and extension, establishment of secure rights to land and water, and development and liberalisation of capital markets (Pingali and Rosegrant, 1995). Investment in efficient agricultural water management particularly irrigation is seen by Juma (2011) as key determinant not just in the enhancement of food security but a harbinger of agricultural commercialisation.
Agricultural commercialisation means more than the marketing of agricultural output, it means the product

Working Paper 072 www.future-agricultures.org9
choice and input use decisions are based on the principles of profit maximisation.
Marketing plays a pivotal role in the commercialisation pathway. Marketing involves finding out what customers want and supplying it to them at a profit (Lashgarara, 2008; Sharma, 2006). Agricultural marketing systems that function well can reduce the cost of exchange of agro-produce. In the agri-food systems, an efficient marketing assures adequacy and stability of food supply in ways that reward farmers, agro-traders and consumers.
The major challenges underlying agricultural markets that would hamper commercialisation of African agriculture include poor infrastructure, inadequate support services, and weak institutions, increasing transaction costs and the volatility of prices (Dina, 2006). Vegetable supply chains in Tanzania are an example, with high margins between the price paid to farmers and that paid by consumers (Lynch, 1994, De Putter et al., 2007). However, Mutabazi et al. (2010) found that the difference in margins between producer and retail prices were modest. They suffer from lack of investment in physical facilities such as roads, storage, vehicles and telecommunications; the lack of which tends to raise costs and downsize payoffs.
High transactions costs are one of the principal market failures seen in contemporary Africa. For some — see, for example, Dorward et al. 2004, Poulton et al. 2004; Dorward et al., 2003 — these and other market failures are so widespread and severe that they trap rural households in poverty, since the failures prevent them from innovating, investing and generally commercialising their farming.
Public policy intents to address market failures – for example – ensuring farmers’ access to inputs can lead to dramatic (and costly) responses such as input subsidies that in long-run might lead to further market distortions. (Jayne et al., 2002). For example, the government of Tanzania reintroduced fertiliser subsidies in the early 2000s and now the subsidy package covers other inputs such as seeds. The effectiveness of subsidising inputs, however, is in debate —see Dorward et al., 2008; Juma, 2011; Dorward and Chirwa, 2011. In addition there are concerns that the cost of subsidies will limit public investment in roads, agricultural research and other public goods to stimulate agricultural development.
Significant policy commitments to commercialise Tanzanian agriculture are clearly made in KILIMO KWANZA declaration crafted in 20091. Some commercialisation related action points in this declaration include agricultural commoditisation, implementation of incentives to ensure competitiveness and address market barriers, price stabilisation mechanisms, industrialisation and infrastructure development.
Neither the advent of technologies such as mobile phones nor other ICT breakthroughs has evenly transformed agricultural marketing in rural Africa. African marketing systems still require a range of “old culture” elements to operate. Market exchanges between farmers
and downstream actors in the supply chains rely on lifelong tacit trading relations mainly based on mutual trust and overly involving physical contacts (Mutabazi et al., 2010; Eskola, 2005).
1.2. African agriculture – growth and commercialisation paths
Public investments for the development of agriculture are expected to improve following recent strategic commitments at continental, regional and national scales. Such commitments include the Comprehensive Africa Agriculture Development Programme - CAADP (CAADP, 2005), the East African Community (EAC) regional common market focusing on among other things eliminating non-tariff trade barriers (World Bank, 2008) and KILIMO KWANZA.
The unique features of sub-Saharan African agriculture that represent special challenges in terms of agricultural performance include: (i) dominance of weathered soils of poor inherent fertility; (ii) predominance of rain-fed agriculture, little irrigation and very limited mechanisation; (iii) heterogeneity and diversity of farming systems; (iv) key roles of women in agriculture and in ensuring household food security; (v) poorly functioning markets for inputs and outputs; and (vi) a large and growing impact of human health on agriculture (Binswanger-Mkhize, 2009). These challenges have direct and indirect implications on the commercialisation of African smallholder agriculture.
Agricultural commercialisation would foster a sustained market-based growth of the agriculture sector. Growth in agriculture must be the centrepiece of pro-poor economic growth as majority of the poorest depends on agriculture for their livelihoods. Over the recent decade, agricultural growth has levelled to around 3% per year. A sustained growth rate of at least 6% is required for the agriculture sector to help in fast-tracking the development targets of poverty reduction and food security (URT, 2010a). Furthermore, the impact of higher growth in agriculture in the reduction of rural poverty in Africa cannot be overemphasised. As showed nearly 50 years ago by Johnston and Mellor (1961) cited by Binswanger-Mkhize et al. (2009), the pathways through which agricultural growth reduces rural poverty include:
• raising agricultural profits and labour income;
• raising rural non-farm profits, employment and labour income via linkage effects;
• leading to lower prices for (non-tradable)
foods, which is especially beneficial for the poor;
• lowering food prices raises real urban wages
and accelerates urban growth; and
Working Paper 072 www.future-agricultures.org10
• by tightening of urban and rural labour markets it raises unskilled wages in the wider economy.
Economic growth and rural development have been the slowest in Eastern and Southern Africa of which Tanzania is a part. Of the 350 million people in the sub-region, about 260 million live in rural areas, which account for 83 per cent of extreme poverty in Africa (Binswanger-Mkhize et al., 2009).
Where will the next market opportunities for African farmers lie? Recent studies of the history and prospects of commercial agriculture in SSA suggest that domestic and sub-regional markets will represent the main opportunities for SSA producers in the short to medium term (Poulton et al., 2007). Of course, with appropriate policies and investments, including transport infrastructure and technology, positive international market trends in agriculture could eventually be captured by SSA as well. Moreover, an increasing share of output will become commercialised as the continent becomes more urbanised (Binswanger-Mkhize et al., 2009).
Frequent bans of cross-border trade in major staples within the ECA (Binswanger-Mkhize et al., 2009) have never targeted high-value fresh produce like horticultural crops. This paves a way for successful commercialisation of fresh produce entailing moderately “wet” produce such as onions and potatoes that can be traded in relatively longer distances in the absence of cold chain systems.
The institutional environment necessary for commercialisation of African agriculture has been improving. Such improvement manifests in the five institutional pillars as reported by Binswanger-Mkhize et al. (2009): the private sector, independent civil society, local government, communities, and the sector institutions that provide specific agricultural support services. Well-structured and functioning institutions can tackle all the components of rural development, from health and education to infrastructure, agricultural services, social protection, resource management, and more.
The commercialisation of food crops is also impeded by frequent and unpredictable government interventions in the market through interregional export blockade when countries anticipate insufficient local production. Intraregional trade offers major opportunities for sub- Saharan African agriculture (Binswanger-Mkhize et al., 2009). The domestic demand for most agricultural produce especially of major staples is inelastic relative to price and income shifts. As a result of this, substantive increase in production would lower domestic prices and profitability in the rural farm-sector.
However, cross-border regional export of crops that are not in the national food basket has remained relaxed. This paves a way for commercialisation of crops such as those in the horticulture sector. However, regional agricultural trade requires smart policies to address non-tariff barriers associated with inefficient administration of
phytosanitary inspections, customs bureaucracy and transport drawbacks such as numerousness of weighing bridges which raise transaction costs.
An expanded regional trade in agriculture and food products is good for growth, farmers’ incomes and regional food security; the short-term management challenges of the current food price spike and the long-term opportunities arising from prices that are expected to settle at higher than past levels only add to this imperative (Binswanger-Mkhize et al., 2009).
The different views in literature on and the actions implemented to develop African agriculture are contentious. In a large continent it is hard to test propositions that would apply across the whole region. Analysis has thus to be carried out for small areas.
1.3. Research objective and research questions
The overall aim of the research is to investigate the contexts, extent, drivers and ways, and impacts of commercialisation of African smallholder farming. The major outcome of this study is to provide empirical evidence to inform policy in Africa towards the key variables that shape smallholder commercialisation and the livelihoods of smallholder households.
This paper addresses some key policy-relevant questions including:
• Can smallholder family farms commercialise successfully?
• What conditions and drivers al low smallholders to commercialise?
• How does commercialisation affect food security, incomes, livelihoods and social differentiation?
2. Methodology
2.1. Analytical framework
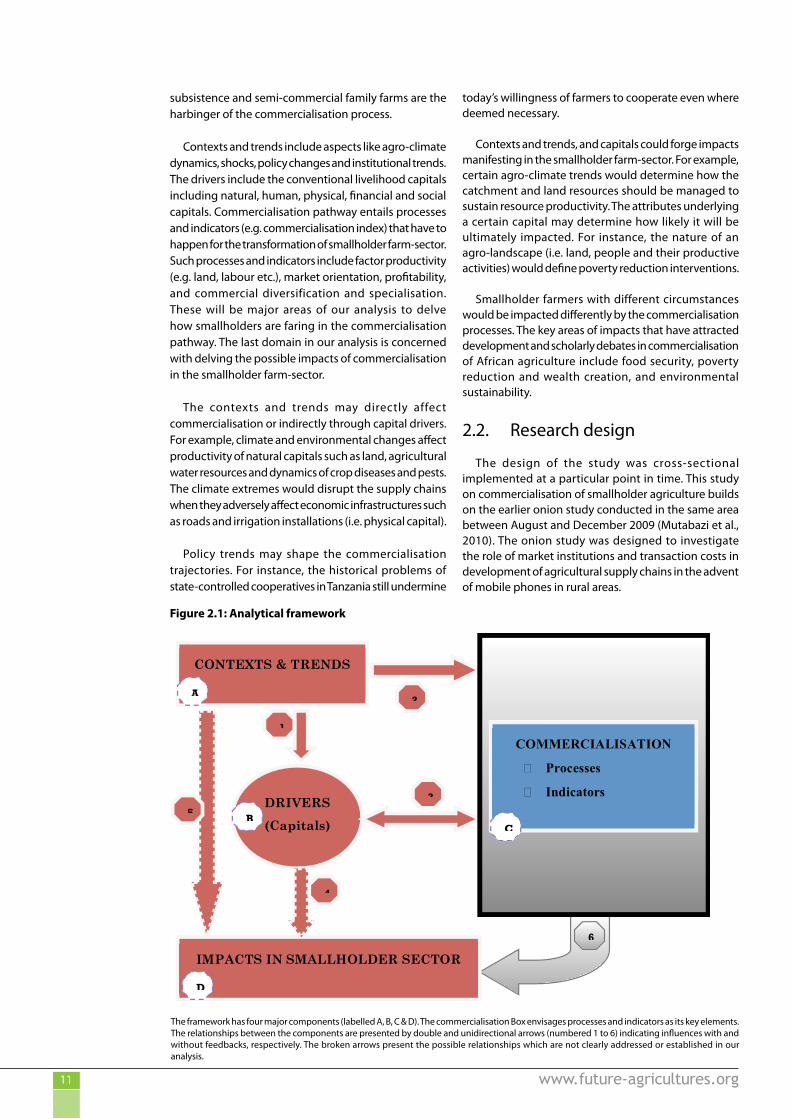
Figure 2.1 presents the major components underlying our analytical framework. Notably, this framework does not fulfil the purpose of a conceptual framework. Instead, our study is conceptually framed within the overarching questions and hypotheses. Our analytical framework borrows much from a conventional Sustainable Livelihood Framework (SLE).
The SLE is an ideal organising framework for analysing socio-economic phenomena in the rural Africa context. Commercialisation of African smallholder farming is a complex phenomenon which must be illuminated amid of other livelihood objectives. Transformations in the
Working Paper 072 www.future-agricultures.org11
subsistence and semi-commercial family farms are the harbinger of the commercialisation process.
Contexts and trends include aspects like agro-climate dynamics, shocks, policy changes and institutional trends. The drivers include the conventional livelihood capitals including natural, human, physical, financial and social capitals. Commercialisation pathway entails processes and indicators (e.g. commercialisation index) that have to happen for the transformation of smallholder farm-sector. Such processes and indicators include factor productivity (e.g. land, labour etc.), market orientation, profitability, and commercial diversification and specialisation. These will be major areas of our analysis to delve how smallholders are faring in the commercialisation pathway. The last domain in our analysis is concerned with delving the possible impacts of commercialisation in the smallholder farm-sector.
The contexts and trends may directly affect commercialisation or indirectly through capital drivers. For example, climate and environmental changes affect productivity of natural capitals such as land, agricultural water resources and dynamics of crop diseases and pests. The climate extremes would disrupt the supply chains when they adversely affect economic infrastructures such as roads and irrigation installations (i.e. physical capital).
Policy trends may shape the commercialisation trajectories. For instance, the historical problems of state-controlled cooperatives in Tanzania still undermine
today’s willingness of farmers to cooperate even where deemed necessary.
Contexts and trends, and capitals could forge impacts manifesting in the smallholder farm-sector. For example, certain agro-climate trends would determine how the catchment and land resources should be managed to sustain resource productivity. The attributes underlying a certain capital may determine how likely it will be ultimately impacted. For instance, the nature of an agro-landscape (i.e. land, people and their productive activities) would define poverty reduction interventions.
Smallholder farmers with different circumstances would be impacted differently by the commercialisation processes. The key areas of impacts that have attracted development and scholarly debates in commercialisation of African agriculture include food security, poverty reduction and wealth creation, and environmental sustainability.
2.2. Research design
The design of the study was cross-sectional implemented at a particular point in time. This study on commercialisation of smallholder agriculture builds on the earlier onion study conducted in the same area between August and December 2009 (Mutabazi et al., 2010). The onion study was designed to investigate the role of market institutions and transaction costs in development of agricultural supply chains in the advent of mobile phones in rural areas.
14 !D
D
DRIVERS
(Capitals)
CONTEXTS & TRENDS
IMPACTS IN SMALLHOLDER SECTOR
COMMERCIALISATION
Processes
Indicators
2
1
3
4
5
6
A
BC
D
The framework has four major components (labelled A, B, C & D). The commercialisation Box envisages processes and indicators as its key elements. The relationships between the components are presented by double and unidirectional arrows (numbered 1 to 6) indicating influences with and without feedbacks, respectively. The broken arrows present the possible relationships which are not clearly addressed or established in our analysis.
Figure 2.1: Analytical framework
Working Paper 072 www.future-agricultures.org12
During the study design it was hypothesised that there would be differences by road access and mobile phone connectivity. Therefore, four villages were selected through a consultation process with district agricultural officers and ward leaders. Each system was presented by one village as follows:
• Ruaha-Mbuyuni, Kilolo District, Iringa Region — good road access, mobile network;
• Malolo B, Kilosa District, Morogoro Region — good road access, no network;
• Lumuma, Kilosa District, Morogoro Region — poor road access, mobile network; and,
• Msowero, Kilosa District, Morogoro Region — poor road access, no network.
The commercialisation study involved re-surveying the onion villages. The questionnaire was designed in such a way that the commercialisation survey was not repetitive in terms of collecting already available information. The rate of resurveying the onion sample was successful as only 5 farmers out of intended 140 were missed. The data were merged into one dataset during data analysis.
2.3. Sampling of farmers
The surveys involved a systematic random survey approach. The sampling frames were established from the village registers with village leaders and local informants helping in validating the existence of the households. The onion study sampling frame consisted of mainly of onion growers. The commercialisation sampling frames consisted households growing more of other crops than onions.
The onion study sample was 140 farmers (35 from each of the 4 villages). A sample of the same size was covered in this study to make an overall sample of 287
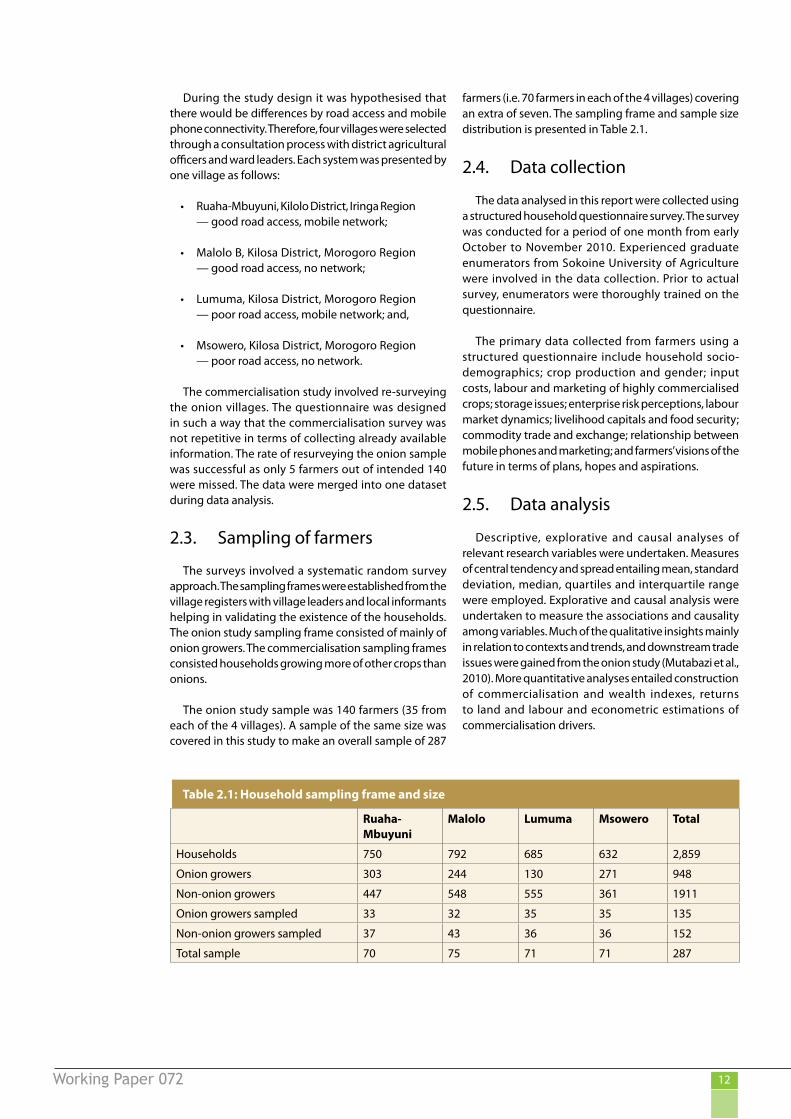
farmers (i.e. 70 farmers in each of the 4 villages) covering an extra of seven. The sampling frame and sample size distribution is presented in Table 2.1.
2.4. Data collection
The data analysed in this report were collected using a structured household questionnaire survey. The survey was conducted for a period of one month from early October to November 2010. Experienced graduate enumerators from Sokoine University of Agriculture were involved in the data collection. Prior to actual survey, enumerators were thoroughly trained on the questionnaire.
The primary data collected from farmers using a structured questionnaire include household socio-demographics; crop production and gender; input costs, labour and marketing of highly commercialised crops; storage issues; enterprise risk perceptions, labour market dynamics; livelihood capitals and food security; commodity trade and exchange; relationship between mobile phones and marketing; and farmers’ visions of the future in terms of plans, hopes and aspirations.
2.5. Data analysis
Descriptive, explorative and causal analyses of relevant research variables were undertaken. Measures of central tendency and spread entailing mean, standard deviation, median, quartiles and interquartile range were employed. Explorative and causal analysis were undertaken to measure the associations and causality among variables. Much of the qualitative insights mainly in relation to contexts and trends, and downstream trade issues were gained from the onion study (Mutabazi et al., 2010). More quantitative analyses entailed construction of commercialisation and wealth indexes, returns to land and labour and econometric estimations of commercialisation drivers.
Table 2.1: Household sampling frame and size
Ruaha-Mbuyuni
Malolo Lumuma Msowero Total
Households 750 792 685 632 2,859
Onion growers 303 244 130 271 948
Non-onion growers 447 548 555 361 1911
Onion growers sampled 33 32 35 35 135
Non-onion growers sampled 37 43 36 36 152
Total sample 70 75 71 71 287
Working Paper 072 www.future-agricultures.org13
2.6.1. Ruaha-Mbuyuni
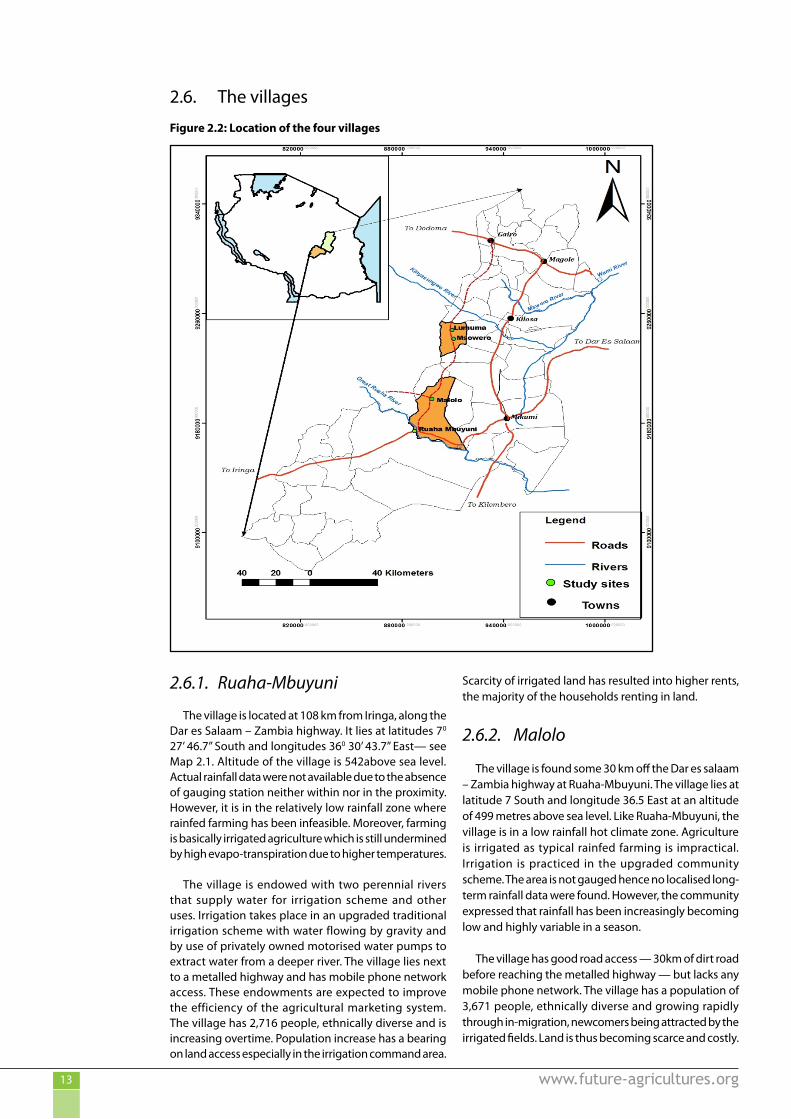
The village is located at 108 km from Iringa, along the Dar es Salaam – Zambia highway. It lies at latitudes 70 27’ 46.7” South and longitudes 360 30’ 43.7” East— see Map 2.1. Altitude of the village is 542above sea level. Actual rainfall data were not available due to the absence of gauging station neither within nor in the proximity. However, it is in the relatively low rainfall zone where rainfed farming has been infeasible. Moreover, farming is basically irrigated agriculture which is still undermined by high evapo-transpiration due to higher temperatures.
The village is endowed with two perennial rivers that supply water for irrigation scheme and other uses. Irrigation takes place in an upgraded traditional irrigation scheme with water flowing by gravity and by use of privately owned motorised water pumps to extract water from a deeper river. The village lies next to a metalled highway and has mobile phone network access. These endowments are expected to improve the efficiency of the agricultural marketing system. The village has 2,716 people, ethnically diverse and is increasing overtime. Population increase has a bearing on land access especially in the irrigation command area.
Scarcity of irrigated land has resulted into higher rents, the majority of the households renting in land.
2.6.2. Malolo
The village is found some 30 km off the Dar es salaam – Zambia highway at Ruaha-Mbuyuni. The village lies at latitude 7 South and longitude 36.5 East at an altitude of 499 metres above sea level. Like Ruaha-Mbuyuni, the village is in a low rainfall hot climate zone. Agriculture is irrigated as typical rainfed farming is impractical. Irrigation is practiced in the upgraded community scheme. The area is not gauged hence no localised long-term rainfall data were found. However, the community expressed that rainfall has been increasingly becoming low and highly variable in a season.
The village has good road access — 30km of dirt road before reaching the metalled highway — but lacks any mobile phone network. The village has a population of 3,671 people, ethnically diverse and growing rapidly through in-migration, newcomers being attracted by the irrigated fields. Land is thus becoming scarce and costly.
Figure 2.2: Location of the four villages
2.6. The villages
Working Paper 072 www.future-agricultures.org14
2.6.3. Lumuma
The village is located between latitudes 60 49’ 18.1” South and longitudes 360 38’ 48.8” East. Altitude of the village is 893 metres above sea level. The village is about 70 km west of Kilosa District headquarters. The village is in the low rainfall zone with hot humid climate, although higher elevation also makes the climate a bit cooler and humid. Unlike Ruaha-Mbuyuni and Malolo B, rainfed agriculture is practiced to some extent in the flood plains. This means rainfall is relatively higher in Lumuma compared to Ruaha-Mbuyuni and Malolo B. Irrigated agriculture is a predominant practice over rainfed agriculture which is frequently associated with crop failure.
The village has poor road network especially the one linking it with its District headquarters. It is the same shortest road that was supposed to be linking it to Dodoma-Dar es salaam trunk road. Instead, travelling by road from and into the village by vehicles is through Mpwapwa in Dodoma which is the longest route to Dar es salaam. The village is reached by the mobile phone network from a signal tower located about 20 kilometres at a hill in Kidete.
The village has a population of 2,631, and growing since like the other study villages, the opportunity for irrigated onion production has attracted people into the area. Such influx has resulted in high ethnic diversity. The surge of immigration has created demand pressure on land that has been reflected in higher land rents: for example, between 2004 and 2009 the rent per acre jumped from Tshs 25,000 to Tshs 100,000 [US$ 20 to US$ 80].
2.6.4. Msowero
The village is located between latitudes 60 50’ 50.0” South and longitudes 360 38’ 43.8” East — about 3km south of Lumuma. Altitude of the village is 935 metres above sea level. The village has a population of 3,453, expanding mainly due to immigration as the other villages. The major externality is pressure on land and agricultural water resources. The climate and farming system in this village is more or less similar to that of Lumuma; as is the poor road access. However, the village was unlucky in terms of mobile phone network as it is not reached by the signals as neighbouring Lumuma.
2.6.5. Ecological, and socio-economic contexts
It is worth noting some ecological and socio-economic contexts which sternly imply on agricultural commercialisation.
Biophysical contexts
Biophysical factors are critical for the production systems especially those directly dependent on weather.
All four villages are located in a low rainfall hot climate agro-ecological zone. The farmers reported to be facing declining and highly variable rainfall, and hotter temperatures.
Typical rainfed farming without irrigation is not an option: irrigation has become a must. Irrigation in the upgraded community schemes depends largely on gravity diversion and to less extent on use of motorised pumps by wealthier farmers which enable them to expand farming beyond the community gravity scheme. Such biophysical opportunity in irrigated agriculture seems to be propelling commercialisation among smallholders.
Population and settlements
Population and settlement dynamics relate with commercialisation in a number of ways. It could be in terms of labour migration and mobility of farmers and traders into and out of the locales. New ideas and cultures would be exchanged and commercial deals entered as people interact over time and space.
The villages are facing higher influxes of immigrants with irrigation possibility being the major pull factor. Immigration has led to high ethnic diversity which has altered native culture and values through social interactions and integrations. Outmigration is not common meaning that the local labour remains locked in the rural sector mainly on the farm.
Some paths of immigration are associated with hired labour employment and agricultural trade networks. Migrant labourers are mainly from neighbouring drier places of Dodoma where dryland rainfed agriculture has generally failed to absorb local labour. In Lumuma, one of the study villages, some wapemba have settled and fused within the village culture. These settlers serve as a trading bridge between Dar es salaam and Zanzibar based large buyers and farmers. They play an institutional role of establishing and sustaining market linkages in the onion supply chain.
2.6.6. Economy, markets and institutions
Smallholder agriculture and crop farming in particular is the predominant economic enterprise. Market oriented crop farming with a clearer attention on commercial horticulture is widespread among family farm units. As in any part of rural Africa, non-farm enterprises mainly of merchandising consumer goods and services are on a rise. This is a reality particularly in the villages situated by the sides of the highway such as Ruaha-Mbuyuni.
The multiplier economic effects of commercial horticulture manifest indirectly through other economic sectors. Some of such key sectors include roadside marketing of onions, commissioned brokering, transportation business, casual labouring entailing collection and loading of onions in trucks by youths,
Working Paper 072 www.future-agricultures.org15
and service sectors such as food vending and retailing of consumables.
In remote villages, periodic market gatherings which attract small traders from regional towns is a common practice. An apparent feature is that these market gatherings are not serving as assembly markets of agricultural produce. Marketing of agricultural produce in these remote villages have different marketing channels and arrangements. The organisational feature of agricultural marketing is that buyers of agro-produce sporadically visit the villages. The buying arrangements are either facilitated by local brokers or effected in direct contact with farmers. In areas where signals reach, mobile phones technology helps in preliminary exchange arrangements, but hardly replaces physical contacts.
Good roads are believed to be the major driver of market-led rural transformations and growth, and they largely stand to be. However, the onion study (Mutabazi, et. al., 2010) observed that in remote areas informal market institutions work, despite poor roads, so that smallholder investment and trade are still successful. Mutabazi et al. (2010) report higher level of fertiliser use (200 kg/acre vs. 100 kg/acre), productivity (60 bags/acre vs. 30 bags/acre) and returns to land (US$ 390/acre vs. US $ 127/acre) from onions for the remote villages compared to their counterpart villages.
The two remote villages (Lumuma and Msowero) have informally well-established exchange arrangements between onion farmers and some onion buyers from Zanzibar (wapemba). The relationship usually involves a backward support in input credit which has no implicit interest or any lending risk compensation. The farmer repays the input credit at the harvest but with no obligation to sell to the lender. The lender competes with other buyers in the market place — all facing the prevailing producer market price. Such institutional arrangements show the importance of trust in marketing - as also reported in Nigeria by Lyon and Porter (2007).
Given the failures of rural capital markets, smallholder farmers in the area manage to self-finance their farm investments. A few farmers receive loans from buyers and village-based money and input lenders. However, as a stereotype stemming from the past soft government loans that most farmers enjoyed and never repaid, farmers would still insist that they are unable to self-finance their farm activities. The micro-finance movement vested in rural Savings and Credit Cooperative Societies (SACCOS) is promising. Nevertheless, the movement faces local
management challenges and there is every reason to question its pro-poorness.
The governance structures and politics are at the centre stage of rural commercialisation of rural agriculture. Under her regional and local government reforms, Tanzania has devolved most of development planning and investments to local authorities. District councils are seated by politically elected ward councils and constituency MPs. Some key investment areas under local governments include rural roads, education, extension, health, and water services. The councils also administer rural taxation of which agriculture is not an exception. These are critical in the rural transformations and growth. The state of electoral democracy in the study villages was satisfactory. Some village and ward governments had elected members of opposition parties. However, farmers particularly in remote villages complained of inadequate investment in roads. This dissatisfaction was connected to complaints of higher local taxes for the produce exported outside the village.
3. Findings and discussion
3.1. Farm households and assets
3.1.1. Farming household characteristics
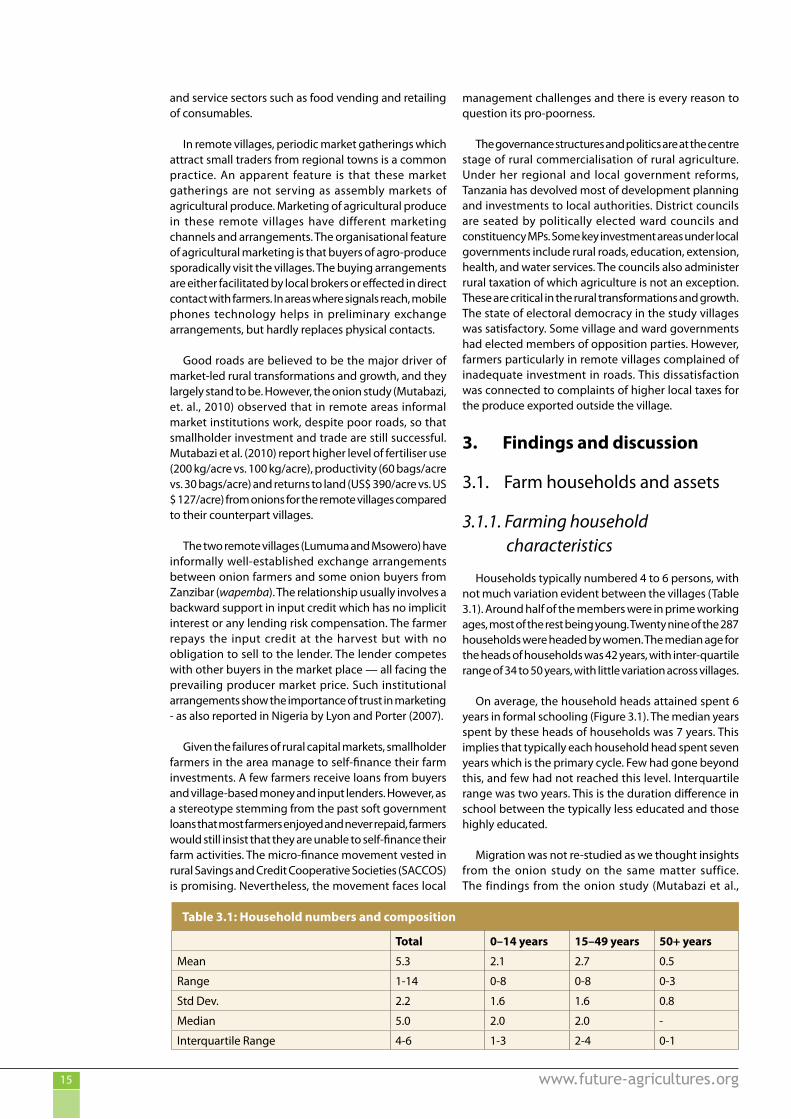
Households typically numbered 4 to 6 persons, with not much variation evident between the villages (Table 3.1). Around half of the members were in prime working ages, most of the rest being young. Twenty nine of the 287 households were headed by women. The median age for the heads of households was 42 years, with inter-quartile range of 34 to 50 years, with little variation across villages.
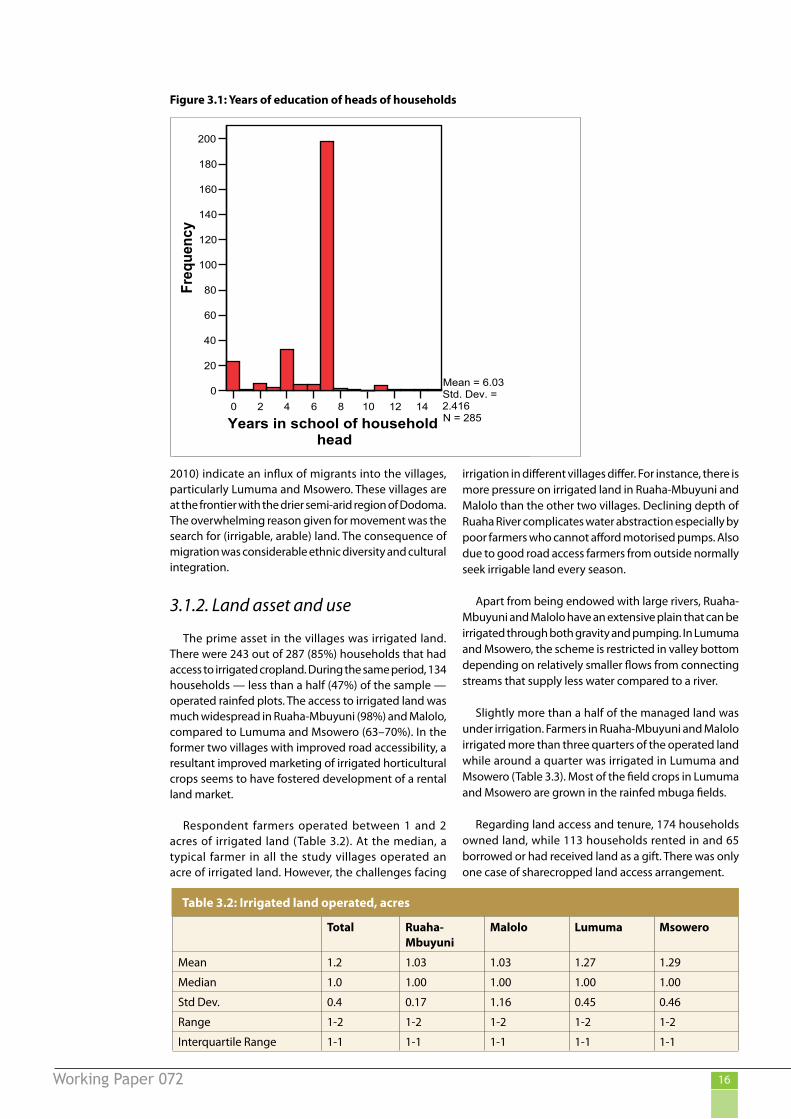
On average, the household heads attained spent 6 years in formal schooling (Figure 3.1). The median years spent by these heads of households was 7 years. This implies that typically each household head spent seven years which is the primary cycle. Few had gone beyond this, and few had not reached this level. Interquartile range was two years. This is the duration difference in school between the typically less educated and those highly educated.
Migration was not re-studied as we thought insights from the onion study on the same matter suffice. The findings from the onion study (Mutabazi et al.,
Table 3.1: Household numbers and composition
Total 0–14 years 15–49 years 50+ years
Mean 5.3 2.1 2.7 0.5
Range 1-14 0-8 0-8 0-3
Std Dev. 2.2 1.6 1.6 0.8
Median 5.0 2.0 2.0 -
Interquartile Range 4-6 1-3 2-4 0-1
Working Paper 072 www.future-agricultures.org16
2010) indicate an influx of migrants into the villages, particularly Lumuma and Msowero. These villages are at the frontier with the drier semi-arid region of Dodoma. The overwhelming reason given for movement was the search for (irrigable, arable) land. The consequence of migration was considerable ethnic diversity and cultural integration.
3.1.2. Land asset and use
The prime asset in the villages was irrigated land. There were 243 out of 287 (85%) households that had access to irrigated cropland. During the same period, 134 households — less than a half (47%) of the sample — operated rainfed plots. The access to irrigated land was much widespread in Ruaha-Mbuyuni (98%) and Malolo, compared to Lumuma and Msowero (63–70%). In the former two villages with improved road accessibility, a resultant improved marketing of irrigated horticultural crops seems to have fostered development of a rental land market.
Respondent farmers operated between 1 and 2 acres of irrigated land (Table 3.2). At the median, a typical farmer in all the study villages operated an acre of irrigated land. However, the challenges facing
irrigation in different villages differ. For instance, there is more pressure on irrigated land in Ruaha-Mbuyuni and Malolo than the other two villages. Declining depth of Ruaha River complicates water abstraction especially by poor farmers who cannot afford motorised pumps. Also due to good road access farmers from outside normally seek irrigable land every season.
Apart from being endowed with large rivers, Ruaha-Mbuyuni and Malolo have an extensive plain that can be irrigated through both gravity and pumping. In Lumuma and Msowero, the scheme is restricted in valley bottom depending on relatively smaller flows from connecting streams that supply less water compared to a river.
Slightly more than a half of the managed land was under irrigation. Farmers in Ruaha-Mbuyuni and Malolo irrigated more than three quarters of the operated land while around a quarter was irrigated in Lumuma and Msowero (Table 3.3). Most of the field crops in Lumuma and Msowero are grown in the rainfed mbuga fields.
Regarding land access and tenure, 174 households owned land, while 113 households rented in and 65 borrowed or had received land as a gift. There was only one case of sharecropped land access arrangement.
Figure 3.1: Years of education of heads of households
0 2 4 6 8 10 12 14
Years in school of household head
0
20
40
60
80
100
120
140
160
180
200
Freq
uenc
y
Mean = 6.03Std. Dev. = 2.416N = 285
Table 3.2: Irrigated land operated, acres
Total Ruaha-Mbuyuni
Malolo Lumuma Msowero
Mean 1.2 1.03 1.03 1.27 1.29
Median 1.0 1.00 1.00 1.00 1.00
Std Dev. 0.4 0.17 1.16 0.45 0.46
Range 1-2 1-2 1-2 1-2 1-2
Interquartile Range 1-1 1-1 1-1 1-1 1-1

Working Paper 072 www.future-agricultures.org17
3.1.3. Ownership of other assets
Ownership of livestock species other than chickens is uncommon in the area. The profile of productive assets was not covered during the commercialisation survey. We can still base on the onion study findings to characterise the population regarding the productive assets base. However, the commercialisation survey covered the housing assets and social amenities, which were used to construct a wealth index.
Productive assets
The onion study reported the productive assets owned to be relatively few and small in value: most households had hoes, axes, cutlasses and watering cans. Everything else was infrequently owned: 43 households had sprayers, nine had irrigation pumps. There was one tractor, one donkey, and no draft oxen, three lorries and eleven motorcycles. The rough, estimated total value of such assets per household was worth, just Tshs 38,000 [US$26] at the median, with an interquartile range of Tshs15,000 to 183,000 [US $ 11–135] (Mutabazi et al., 2010). The commercialisation survey asked about ownership of lorries and motorbikes as part of wealth assets. In a combined sample, the number of lorries increased from 3 to 5 and motorbikes from eleven to 18.
Housing and social amenities
The housing materials were simple: typically mud or adobe walls, tin roof and earth floor; less than three bedrooms; firewood used in the kitchen; water collected from spring, public tap or waterway; use of an uncovered latrine; and paraffin used for lighting. Household durables typically possessed included beds and mattresses; radios; and bicycles. Most other items — such as sofas, TVs — were only found in small number of homes.
Assets based wealth (assets index)
The asset-based approach was used to estimate the level of wealth. The approach generates welfare measures that tend to correlate with other poverty measures such as income and expenditure based approaches.
Housing characteristics, household utilities, and possession of communication and transportation assets were used to construct the wealth index. The housing
characteristics used were the type of roof, wall and floor. Type of toilet, energy sources for both cooking and lighting, and possession of bed, sofa, spongy mattress and watch were considered under the household utilities. Items used to define the communication category were mobile phones, landlines, radio and television. And the transportation assets were lorry/car, bicycle and motorbike.
During the analysis improved housing characteristics, household utilities, and possession of durables were given a code value of “1” and “0” otherwise, a binary scheme being favoured by Filmer and Pritchett (2001). A household asset score, hereto referred as Household Wealth Index (HWI), was derived as follows:
• each item in the list of housing, household utilities and assets (k) a weight equal to the reciprocal of the proportion of the study households who owned that item (wk),
• then multiplying that weight by the binary possession of item k by the household (fk),
• and summing the product over all items. Thus, for household
In computing our wealth index we borrowed empirical insights from Morris et al. (2000) particularly on deriving the weighting factors.
Filmer and Pritchett (2001) categorise different groups of the poor assigning 40% of households to the bottom, 40% to the middle and 20% to the top of the wealth index. They referred to these three clusters as poor, middle and rich, respectively.
Ruaha-Mbuyuni had majority of its respondents in the upper wealth group and relatively fewer in the poorest group compared other villages (Table 3.4). Msowero was the worst of all villages with most of its respondent households falling in the poorest group. The opportunities enhancing assets creation in Ruaha-Mbuyuni include better communication, trade and employment opportunities due to closeness to the Dar es salaam-Zambia highway and reliable irrigation. Msowero is in the remotest area deprived of both quality road and mobile phone communication networks.
Table 3.3: Proportion of operated land irrigated, %
Total Ruaha-Mbuyuni
Malolo Lumuma Msowero
Mean 53 76 77 24 32
Median 61 82 86 13 20
Std Dev. 38 24 27 31 34
Range 0-100 0-100 0-100 0-100 0-100
Interquartile Range 14-88 62-100 70-100 0-33 0-54
Commercialization of African Smallholder Agriculture: the Case of Central Tanzania 2011
22
Regarding land access and tenure, 174 households owned land, while 113 households rented in and 65 borrowed or had received land as a gift. There was only one case of sharecropped land access arrangement.
3.1.3. Ownership of other Assets Ownership of livestock species other than chickens is uncommon in the area. The profile of productive assets was not covered during the commercialisation survey. We can still base on the onion study findings to characterise the population regarding the productive assets base. However, the commercialisation survey covered the housing assets and social amenities, which were used to construct a wealth index.
Productive assets
The onion study reported the productive assets owned to be relatively few and small in value: most households had hoes, axes, cutlasses and watering cans. Everything else was infrequently owned: 43 households had sprayers, nine had irrigation pumps. There was one tractor, one donkey, and no draft oxen, three lorries and eleven motorcycles. The rough, estimated total value of such assets per household was worth, just Tshs 38,000 [US$26] at the median, with an interquartile range of Tshs15,000 to 183,000 [US $ 11–135] (Mutabazi et al., 2010). The commercialisation survey asked about ownership of lorries and motorbikes as part of wealth assets. In a combined sample, the number of lorries increased from 3 to 5 and motorbikes from eleven to 18.
Housing and social smenities
The housing materials were simple: typically mud or adobe walls, tin roof and earth floor; less than three bedrooms; firewood used in the kitchen; water collected from spring, public tap or waterway; use of an uncovered latrine; and paraffin used for lighting. Household durables typically possessed included beds and mattresses; radios; and bicycles. Most other items — such as sofas, TVs — were only found in small number of homes.
Assets based wealth (assets index)
The asset-‐based approach was used to estimate the level of wealth. The approach generates welfare measures that tend to correlate with other poverty measures such as income and expenditure based approaches.
Housing characteristics, household utilities, and possession of communication and transportation assets were used to construct the wealth index. The housing characteristics used were the type of roof, wall and floor. Type of toilet, energy sources for both cooking and lighting, and possession of bed, sofa, spongy mattress and watch were considered under the household utilities. Items used to define the communication category were mobile phones, landlines, radio and television. And the transportation assets were lorry/car, bicycle and motorbike.
During the analysis improved housing characteristics, household utilities, and possession of durables were given a code value of “1” and “0” otherwise, a binary scheme being favoured by Filmer and Pritchett (2001). A household asset score, hereto referred as Household Wealth Index (HWI), was derived as follows:
• each item in the list of housing, household utilities and assets (k) a weight equal to the reciprocal of the proportion of the study households who owned that item (wk),
• then multiplying that weight by the binary possession of item k by the household (fk),
• and summing the product over all items. Thus, for household j,𝐻𝐻𝐻𝐻𝐻𝐻! = 𝑓𝑓!"!!!! ∙ 𝑤𝑤!
In computing our wealth index we borrowed empirical insights from Morris et al. (2000) particularly on deriving the weighting factors.

Working Paper 072 www.future-agricultures.org18
3.2. General assessment of the crop sub-sector
The farm-sector in the study area is a mix of cereals, vegetables and legumes (Table 3.5). Roots and tubers are uncommon while oil seeds is an emerging enterprise, particularly in Lumuma and Msowero.
The recent developments of sunflower oil value chains have made sunflower increasingly commercialised. The demand for healthy sunflower oil among urban consumers has created a demand pull for sunflower production in most parts of rural Tanzania. Sunflower thrives in low rainfall environments such as mbuga fields in Lumuma and Msowero.
The nature of the crop mix suggests a more balanced production of food staples and commercial horticultural crops in the same localities. This reduces the risk of food insecurity that may be caused by failures in the agri-food markets. In other words, the crop enterprise choice decisions by the members of local farming communities take into account food security.
Assessment of the level of crop diversification illuminates the nature of crop enterprise choices and the degree of specialisation. With exception of Ruaha-Mbuyuni majority of farmers in other villages did not grow horticultural crops (Table 3.6). Across the villages, farmers grew at least one cereal crop and one legume crop. These means, special section of farmers who have specialised in commercial horticulture for selling outside the villages buy staples from other farmers. In this respect, even growers of food staples end up commercialising within their locales.
Allocation of land to alternative crops indicates the significance of different crops to the household (Table 3.7). Such significance is dependent on different livelihood objectives such as food self-sufficiency and income generation. Farmers in Ruaha-Mbuyuni allocated more land for horticulture than cereals and legumes. In other villages farmers allocated more land to cereal production. Ruaha-Mbuyuni has a more secure access to irrigation water than the rest of the villages.
Vegetables and legumes tend to fetch premiums in the marketplaces assuring more returns per drop of irrigation water. The possibility for quick marketing of highly perishable vegetables such as tomatoes at the highway is possible only in Ruaha-Mbuyuni.
The median proportions of irrigated land under cereals in Lumuma and Msowero were only 14% and 20% of the overall land under this category of crops, respectively (Table 3.7). Irrigated farming in Lumuma and Msowero is confined in a valley bottomland hence limited both in spatial expansion and water availability. In this regard, farmers grow field crops in rainfed mbuga fields sparing irrigated valley bottom for high value vegetables and legumes. Production of horticulture, cereals and legumes in other villages was also typically irrigated.
Crop sales by locality
A typical household in Ruaha-Mbuyuni earned the highest crop sales as much twice and above as a farmer in other villages (Table 3.8). Farmers in Ruaha-Mbuyuni and Malolo have access to good road network which favour agricultural trade. For example, roadside marketing of horticultural crops along the Dar es salaam-Zambia highway is common in Ruaha-Mbuyuni. Malolo is also close to the highway and can be easily accessed by traders particularly those from Mbeya in southern Tanzania.
Table 3.4: Assets based wealth index, frequency.
Wealth groups Ruaha-Mbuyuni
Malolo Lumuma Msowero Overall
Upper (20%) 26 10 15 6 57
Middle (40%) 27 34 26 27 114
Lower (40%) 17 29 29 38 113
Total 70 73 70 71 284
Table 3.5: Structure of crop enterprise mix, freq.
Crop categories Total Ruaha Malolo Lumuma Msowero
Vegetables 158 52 38 35 34
Cereals 260 59 73 70 59
Legumes 154 34 41 36 43
Oil seeds 40 1 0 23 16
Root and tubers 2 0 0 1 1
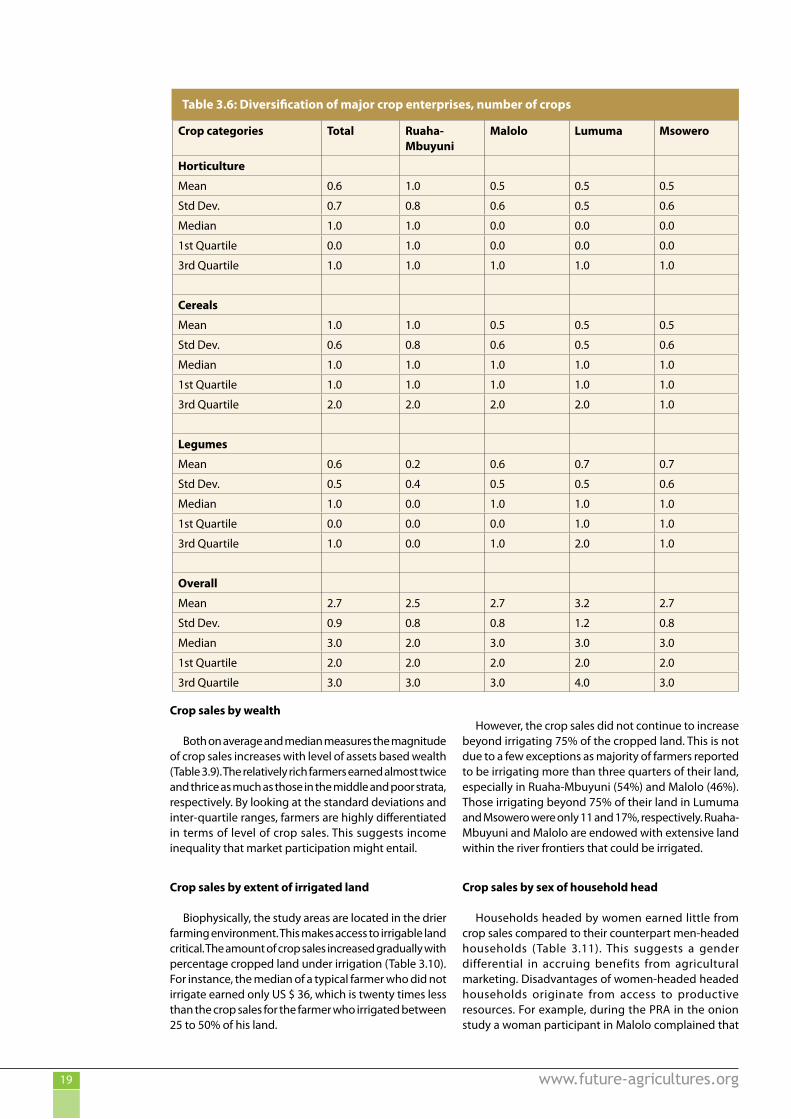
Working Paper 072 www.future-agricultures.org19
Crop sales by wealth
Both on average and median measures the magnitude of crop sales increases with level of assets based wealth (Table 3.9). The relatively rich farmers earned almost twice and thrice as much as those in the middle and poor strata, respectively. By looking at the standard deviations and inter-quartile ranges, farmers are highly differentiated in terms of level of crop sales. This suggests income inequality that market participation might entail.
Crop sales by extent of irrigated land
Biophysically, the study areas are located in the drier farming environment. This makes access to irrigable land critical. The amount of crop sales increased gradually with percentage cropped land under irrigation (Table 3.10). For instance, the median of a typical farmer who did not irrigate earned only US $ 36, which is twenty times less than the crop sales for the farmer who irrigated between 25 to 50% of his land.
However, the crop sales did not continue to increase beyond irrigating 75% of the cropped land. This is not due to a few exceptions as majority of farmers reported to be irrigating more than three quarters of their land, especially in Ruaha-Mbuyuni (54%) and Malolo (46%). Those irrigating beyond 75% of their land in Lumuma and Msowero were only 11 and 17%, respectively. Ruaha-Mbuyuni and Malolo are endowed with extensive land within the river frontiers that could be irrigated.
Crop sales by sex of household head
Households headed by women earned little from crop sales compared to their counterpart men-headed households (Table 3.11). This suggests a gender differential in accruing benefits from agricultural marketing. Disadvantages of women-headed headed households originate from access to productive resources. For example, during the PRA in the onion study a woman participant in Malolo complained that
Table 3.6: Diversification of major crop enterprises, number of crops
Crop categories Total Ruaha-Mbuyuni
Malolo Lumuma Msowero
Horticulture
Mean 0.6 1.0 0.5 0.5 0.5
Std Dev. 0.7 0.8 0.6 0.5 0.6
Median 1.0 1.0 0.0 0.0 0.0
1st Quartile 0.0 1.0 0.0 0.0 0.0
3rd Quartile 1.0 1.0 1.0 1.0 1.0
Cereals
Mean 1.0 1.0 0.5 0.5 0.5
Std Dev. 0.6 0.8 0.6 0.5 0.6
Median 1.0 1.0 1.0 1.0 1.0
1st Quartile 1.0 1.0 1.0 1.0 1.0
3rd Quartile 2.0 2.0 2.0 2.0 1.0
Legumes
Mean 0.6 0.2 0.6 0.7 0.7
Std Dev. 0.5 0.4 0.5 0.5 0.6
Median 1.0 0.0 1.0 1.0 1.0
1st Quartile 0.0 0.0 0.0 1.0 1.0
3rd Quartile 1.0 0.0 1.0 2.0 1.0
Overall
Mean 2.7 2.5 2.7 3.2 2.7
Std Dev. 0.9 0.8 0.8 1.2 0.8
Median 3.0 2.0 3.0 3.0 3.0
1st Quartile 2.0 2.0 2.0 2.0 2.0
3rd Quartile 3.0 3.0 3.0 4.0 3.0
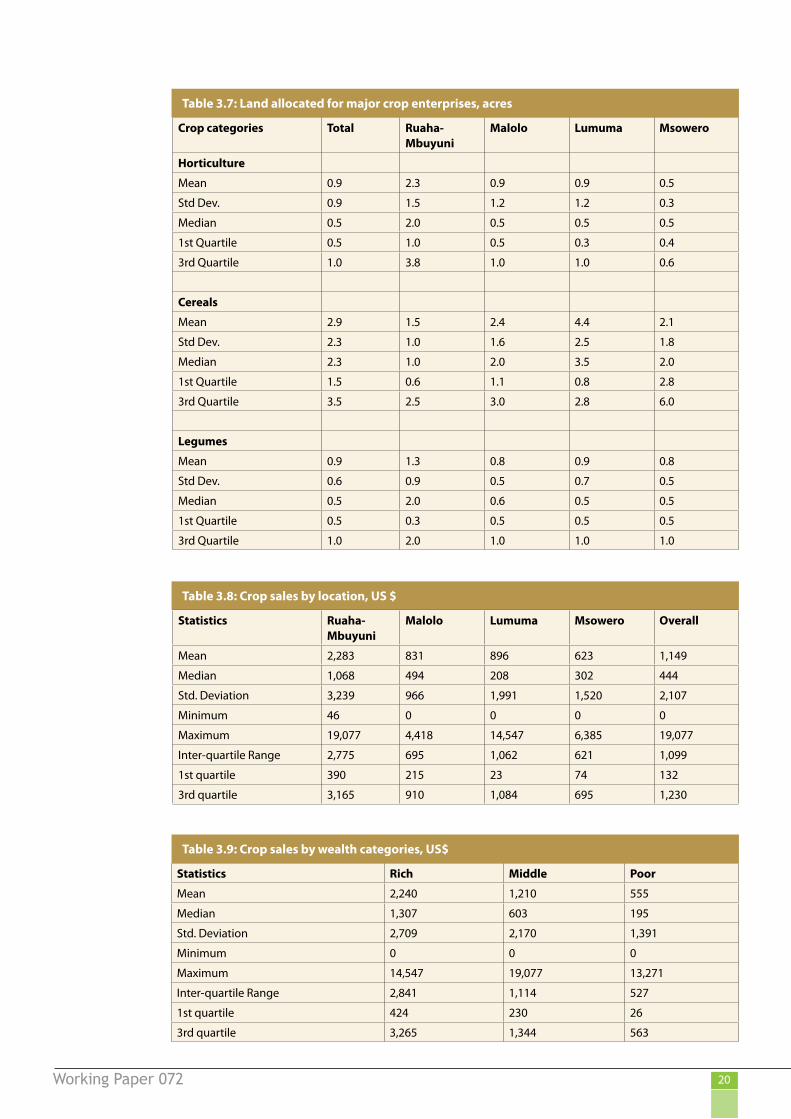
Working Paper 072 www.future-agricultures.org20
Table 3.7: Land allocated for major crop enterprises, acres
Crop categories Total Ruaha-Mbuyuni
Malolo Lumuma Msowero
Horticulture
Mean 0.9 2.3 0.9 0.9 0.5
Std Dev. 0.9 1.5 1.2 1.2 0.3
Median 0.5 2.0 0.5 0.5 0.5
1st Quartile 0.5 1.0 0.5 0.3 0.4
3rd Quartile 1.0 3.8 1.0 1.0 0.6
Cereals
Mean 2.9 1.5 2.4 4.4 2.1
Std Dev. 2.3 1.0 1.6 2.5 1.8
Median 2.3 1.0 2.0 3.5 2.0
1st Quartile 1.5 0.6 1.1 0.8 2.8
3rd Quartile 3.5 2.5 3.0 2.8 6.0
Legumes
Mean 0.9 1.3 0.8 0.9 0.8
Std Dev. 0.6 0.9 0.5 0.7 0.5
Median 0.5 2.0 0.6 0.5 0.5
1st Quartile 0.5 0.3 0.5 0.5 0.5
3rd Quartile 1.0 2.0 1.0 1.0 1.0
Table 3.8: Crop sales by location, US $
Statistics Ruaha-Mbuyuni
Malolo Lumuma Msowero Overall
Mean 2,283 831 896 623 1,149
Median 1,068 494 208 302 444
Std. Deviation 3,239 966 1,991 1,520 2,107
Minimum 46 0 0 0 0
Maximum 19,077 4,418 14,547 6,385 19,077
Inter-quartile Range 2,775 695 1,062 621 1,099
1st quartile 390 215 23 74 132
3rd quartile 3,165 910 1,084 695 1,230
Table 3.9: Crop sales by wealth categories, US$
Statistics Rich Middle Poor
Mean 2,240 1,210 555
Median 1,307 603 195
Std. Deviation 2,709 2,170 1,391
Minimum 0 0 0
Maximum 14,547 19,077 13,271
Inter-quartile Range 2,841 1,114 527
1st quartile 424 230 26
3rd quartile 3,265 1,344 563
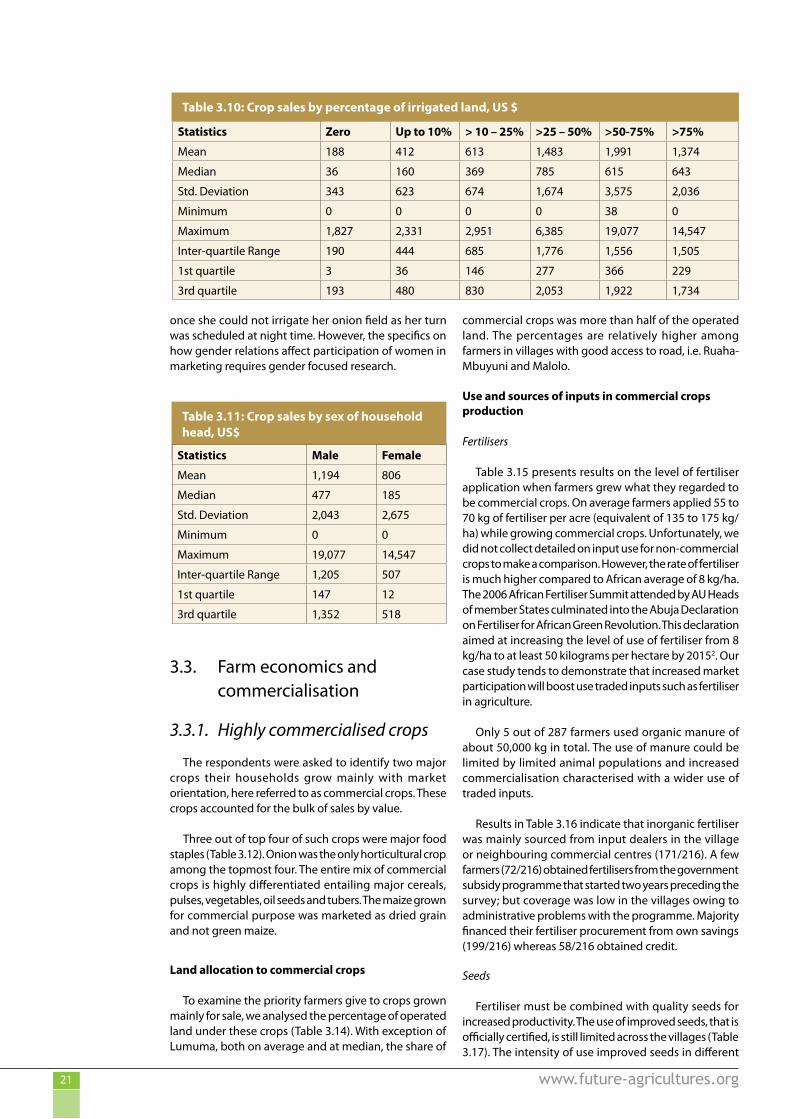
Working Paper 072 www.future-agricultures.org21
once she could not irrigate her onion field as her turn was scheduled at night time. However, the specifics on how gender relations affect participation of women in marketing requires gender focused research.
3.3. Farm economics and commercialisation
3.3.1. Highly commercialised crops
The respondents were asked to identify two major crops their households grow mainly with market orientation, here referred to as commercial crops. These crops accounted for the bulk of sales by value.
Three out of top four of such crops were major food staples (Table 3.12). Onion was the only horticultural crop among the topmost four. The entire mix of commercial crops is highly differentiated entailing major cereals, pulses, vegetables, oil seeds and tubers. The maize grown for commercial purpose was marketed as dried grain and not green maize.
Land allocation to commercial crops
To examine the priority farmers give to crops grown mainly for sale, we analysed the percentage of operated land under these crops (Table 3.14). With exception of Lumuma, both on average and at median, the share of
commercial crops was more than half of the operated land. The percentages are relatively higher among farmers in villages with good access to road, i.e. Ruaha-Mbuyuni and Malolo.
Use and sources of inputs in commercial crops production
Fertilisers
Table 3.15 presents results on the level of fertiliser application when farmers grew what they regarded to be commercial crops. On average farmers applied 55 to 70 kg of fertiliser per acre (equivalent of 135 to 175 kg/ha) while growing commercial crops. Unfortunately, we did not collect detailed on input use for non-commercial crops to make a comparison. However, the rate of fertiliser is much higher compared to African average of 8 kg/ha. The 2006 African Fertiliser Summit attended by AU Heads of member States culminated into the Abuja Declaration on Fertiliser for African Green Revolution. This declaration aimed at increasing the level of use of fertiliser from 8 kg/ha to at least 50 kilograms per hectare by 20152. Our case study tends to demonstrate that increased market participation will boost use traded inputs such as fertiliser in agriculture.
Only 5 out of 287 farmers used organic manure of about 50,000 kg in total. The use of manure could be limited by limited animal populations and increased commercialisation characterised with a wider use of traded inputs.
Results in Table 3.16 indicate that inorganic fertiliser was mainly sourced from input dealers in the village or neighbouring commercial centres (171/216). A few farmers (72/216) obtained fertilisers from the government subsidy programme that started two years preceding the survey; but coverage was low in the villages owing to administrative problems with the programme. Majority financed their fertiliser procurement from own savings (199/216) whereas 58/216 obtained credit.
Seeds
Fertiliser must be combined with quality seeds for increased productivity. The use of improved seeds, that is officially certified, is still limited across the villages (Table 3.17). The intensity of use improved seeds in different
Table 3.10: Crop sales by percentage of irrigated land, US $
Statistics Zero Up to 10% > 10 – 25% >25 – 50% >50-75% >75%
Mean 188 412 613 1,483 1,991 1,374
Median 36 160 369 785 615 643
Std. Deviation 343 623 674 1,674 3,575 2,036
Minimum 0 0 0 0 38 0
Maximum 1,827 2,331 2,951 6,385 19,077 14,547
Inter-quartile Range 190 444 685 1,776 1,556 1,505
1st quartile 3 36 146 277 366 229
3rd quartile 193 480 830 2,053 1,922 1,734
Table 3.11: Crop sales by sex of household head, US$
Statistics Male Female
Mean 1,194 806
Median 477 185
Std. Deviation 2,043 2,675
Minimum 0 0
Maximum 19,077 14,547
Inter-quartile Range 1,205 507
1st quartile 147 12
3rd quartile 1,352 518
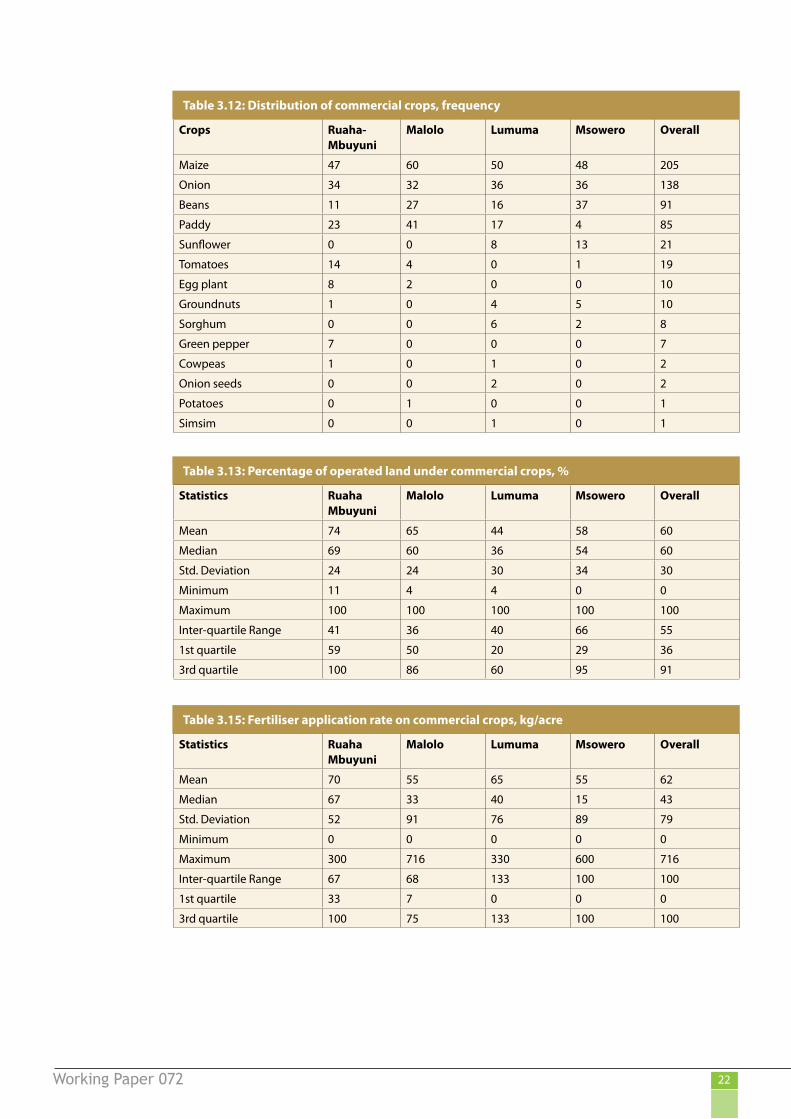
Working Paper 072 www.future-agricultures.org22
Table 3.12: Distribution of commercial crops, frequency
Crops Ruaha-Mbuyuni
Malolo Lumuma Msowero Overall
Maize 47 60 50 48 205
Onion 34 32 36 36 138
Beans 11 27 16 37 91
Paddy 23 41 17 4 85
Sunflower 0 0 8 13 21
Tomatoes 14 4 0 1 19
Egg plant 8 2 0 0 10
Groundnuts 1 0 4 5 10
Sorghum 0 0 6 2 8
Green pepper 7 0 0 0 7
Cowpeas 1 0 1 0 2
Onion seeds 0 0 2 0 2
Potatoes 0 1 0 0 1
Simsim 0 0 1 0 1
Table 3.13: Percentage of operated land under commercial crops, %
Statistics Ruaha Mbuyuni
Malolo Lumuma Msowero Overall
Mean 74 65 44 58 60
Median 69 60 36 54 60
Std. Deviation 24 24 30 34 30
Minimum 11 4 4 0 0
Maximum 100 100 100 100 100
Inter-quartile Range 41 36 40 66 55
1st quartile 59 50 20 29 36
3rd quartile 100 86 60 95 91
Table 3.15: Fertiliser application rate on commercial crops, kg/acre
Statistics Ruaha Mbuyuni
Malolo Lumuma Msowero Overall
Mean 70 55 65 55 62
Median 67 33 40 15 43
Std. Deviation 52 91 76 89 79
Minimum 0 0 0 0 0
Maximum 300 716 330 600 716
Inter-quartile Range 67 68 133 100 100
1st quartile 33 7 0 0 0
3rd quartile 100 75 133 100 100

Working Paper 072 www.future-agricultures.org23
plots under commercial crops accounted only for 43% of all responses. The villages with good road access (Ruaha-Mbuyuni and Malolo) tended to use more of improved seeds than those in remote area.
The three major sources of seeds were: other farmers who are not seed producers; local seed producers; and, producer own seed (3.17). Home saved seeds even from open pollinated varieties (OPVs) might deteriorate in qualities due to varietal contamination from neighbouring fields. Local seed producers, especially those operating in the seed systems requiring special skills such as onions, are experienced farmers trusted by the farming community. Local governments train local seed producers to become producers of Quality Declared Seeds (QDS); but the scheme has limited coverage in the study villages — just 9 out of 426 responses of sourcing from QDS producers. There were only 29 responses out of 426 of farmers who sourced from recognised input dealers.
Productivity of four topmost commercial crops
The yield of onion is around 16 ton/ha on average and 14.5 ton/ha at median (Table 3.18). The yield of the
rest of the commercial crops is not far from the national averages. The Tanzanian average maize yield is widely less than 1.5 ton/ ha, although grain yields tend to be higher in high-potential areas such as the Southern Highlands (Kaliba et al., 1998). For Tanzania, the average yields of beans range from 1.5 to 3.0 ton/ha (Hillocks et al., 2006). For paddy the national basic data indicate the average national yield ranges from 1.0 to around 2 ton/ha (Skarstein, 2005). The average of 3.4 ton/ha of paddy is above the 2.2, 0.9, 1.0 and 1.6 reported by Africa Rice Centre (WARDA) between 2001-2005 for Eastern, Southern, Central and West Africa sub-regions3.
3.3.2. Farm labour
Family Labour
We analysed the amount of family labour allocated in producing commercial crops. On average farmers allocated family labour of around 70 person-days per acre (Table 3.19). A typical farming household allocated about 50 person-days per acre. The median labour force (those above 15 years of age) was 3 persons across the villages. Even a typical household that was relatively labour constrained, in the 1st quartile, had a workforce
Table 3.16: Fertiliser sources and financing, frequency
Sources & financing Ruaha-Mbuyuni
Malolo Lumuma Msowero Overall
Fertiliser source
Government subsidy 32 22 8 10 72
Input dealer 51 50 39 31 171
Input dealer (linked buyers)
0 6 7 3 16
Source of finance
Own finance (savings) 61 65 44 29 199
External credit 9 21 11 17 58
Table 3.17: Seed type and sources, frequency
Seed types & sources Ruaha-Mbuyuni
Malolo Lumuma Msowero Overall
Seed type
Local 44 57 66 65 232
Improved 58 49 37 34 178
Seed supply sources
Produced own seeds (home-saved)
22 39 31 24 116
Farmer (not seed producer) 28 18 36 42 124
Local seed producer 31 29 32 31 123
Local seed producer (QDS) 11 14 0 0 25
Input dealer (local seeds) 1 5 1 2 9
Input dealer (certified seeds)
17 8 1 3 29

Working Paper 072 www.future-agricultures.org24
of 2 persons. Such household needs about 25 working days to supply about 48 person-days required to manage an acre in a particular growing season. This family labour is affordable to most of the farming households which have more than 2 adult members.
Rural labour market
Over 80%) at least hired someone to work on their farms. About half of sample households (52%) tended to hire but not themselves and 34% hired others and got hired as well. Most of hired labourers on the farm were men as hired women were marginally over a quarter (28%). In hiring others, majority uses piece rates (based on an acre land unit) as a basis of hiring; and when they get hired, they prefer to work on daily basis. Daily engagement means quick earnings with shorter commitment, which could be a strategy for those who work for immediate cash needs or quick money.
It is generally viewed that the landless are constantly hired to work for others, and that small farmer hire in, or exchange labour with, their neighbours at peak times. It is also thought that typical rural labourers are the destitute who constantly work for others and not otherwise. Access to land of different forms and commercialisation do influence rural labour exchange decisions.
Results in Table 3.20 shows who hires and gets hired, or do both, in light of differential access to land and level of commercialisation. Apparently, it is not mere access to land which explains labour exchange decisions, but whether that land is irrigable. A typical household that exchanged labour with its neighbours possessed the least proportion of irrigable land (5%), did not afford any acreage under vegetables and was half commercialised for its crop subsector. A similar trend holds for a typical household which neither hired nor got hired. Contrary, a typical household which regularly hired others had the highest rates in terms of proportion of irrigable land (75%), acreage under vegetables (0.5 acre) and level of commercialisation of its crop subsector (60%).
The results imply that those with little irrigated land for growing high value crops such as vegetables in the first place, and those less commercialised, would live much as rural labourers. This is the kind of social differentiation and livelihood inequity that differential access to productive resources and markets can bring in the African rural context.
Furthermore, 80% (203/253) of the respondents who hire labour hired from within the village; whereas only 50/253 employed labourers from outside, in which case they came mainly came from Dodoma (32/50) particularly Mpwapwa, then from Kilosa district (15/50), while only 3 respondents hired labourers from Kilolo and Kasulu districts.
Majority of the households (98%, 122/125) whose members sold labour worked within their own villages.
Majority of hired labourers belonged to Gogo, Sagara and Hehe, all reported by 98% of 248 respondents.
The three ethnic denominations whom household members worked for were Hehe, Pemba and Sagara accounting for 70% of 118 respondents.
The main crops on which the hired labour was used were onions, paddy and maize, all accounting for 86% of 246 respondents. When they get hired, onion is the crop
Table 3.18: Yield of highly commercialised crops, ton/ha
Statistics Onions Maize Beans Paddy
Mean 15.9 0.9 1.0 3.4
Median 14.5 0.8 0.8 2.9
Std. Deviation 10.1 0.7 0.8 2.4
Minimum 0.3 0 0.2 0
Maximum 45.0 2.0 4.0 10.5
Inter-quartile Range
11.0 1.3 0.9 3.3
1st quartile 9 0.3 0.5 1.8
3rd quartile 20.0 1.5 1.4 5.1
Table 3.19: Family labour allocation, person-days/acre
Statistics Ruaha-Mbuyuni
Malolo Lumuma Msowero Overall
Mean 62 70 87 63 71
Median 43 45 56 52 48
Std. Deviation 79 72 103 47 78
Minimum 0 1 0 5 0
Maximum 408 362 611 204 611
Inter-quartile Range 48 81 72 65 67
1st quartile 18 22 25 97 21
3rd quartile 66 103 23 88 88
Note: In computing the family labour in person-days: one person-day was treated to be equal to one adult working for 8 hours per day on the farm. A child aged between 12 and14 was equated to 0.5 of an adult.

Working Paper 072 www.future-agricultures.org25
where majority of the respondents (89/126) reported their members to be normally hired for.
We also looked at the wage rates during hiring and selling labour. The piece rate and daily bases labour exchange were asked directly from respondents in relation to the major farm activity they normally hire and got hired for. Results in Table 3.21 indicate that there were no great differences in the wage rates when one
hired someone or got hired. This is a kind of labour market with high degree of transparency and wage equity.
Respondents were asked regarding the easiness of finding someone to hire or a job over the period of five years. This helps to understand the dynamics of farm labour markets in the villages where farmers seem to be commercialising. Some 203 out of 249 respondents (82%) reported that there are many people to hire now compared to the past five years.
Table 3.21: Wage rates for hiring and selling labour, US $/acre
Statistics Piece rates Per day
Hiring Selling Hiring Selling
Mean 33 34 2.7 2.6
Median 26 26 2.3 2.3
Std. Deviation 33 42 1.2 1.6
Minimum 2 4 0.9 0.6
Maximum 307 307 7.7 12.3
Inter-quartile Range 23 23 1.9 1.5
1st quartile 15 15 1.9 1.5
3rd quartile 38 38 3.8 3.0
Table 3.20: Labour exchange by level of access to land and commercialisation
Labour exchange Land operated (acres)
% of irrigated (acres)
Food crops (acres)
Vegetables (acres)
Comm. Index (%)
Hires and gets hired
Mean 4.9 42 3.5 0.4 50
Std. dev 3.6 37 2.9 0.6 27
Median 3.8 31 3.0 0.3 53
Inter-quartile Range 4.5 78 3.5 0.5 32
Not hired but hires
Mean 5.3 66 3.0 0.8 58
Std. dev 7.7 33 2.9 1.2 26
Median 3.0 75 2.0 0.5 60
Inter-quartile Range 3.9 57 2.9 1.0 34
Do not hire but gets hired
Mean 5.2 29 3.8 0.2 49
Std. dev 3.7 40 2.6 0.3 27
Median 5.0 5 3.3 0.0 50
Inter-quartile Range 4.6 68 3.5 0.4 43
Neither hires nor gets hired
Mean 6.1 35 4.4 0.3 41
Std. dev 5.5 42 3.5 0.4 36
Median 4.5 10 3.0 0.0 46
Inter-quartile Range 7.3 72 6.4 0.6 74

Working Paper 072 www.future-agricultures.org26
Regarding the ease of finding job when the household wishes to, out of 126 respondents 55% reported an improving situation, 20% underscored stagnation whereas a quarter felt a worsening situation.
Under both scenarios of hiring and being hired, majority of the respondents reported an increasing trend of wage rate as reported by 76% and 66%, respectively.
3.3.3. Farm investment and returns
Farmers in Ruaha-Mbuyuni invested more in the production of commercial crops compared to other farmers in other villages (Table 3.22). The investment entailed financial costs of buying inputs and paying for hired labour. Compared to other villages, a relatively larger proportion of farmers in Ruaha-Mbuyuni applied more fertiliser and tended to use improved seeds. For instance, while a typical farmer in Ruaha-Mbuyuni applied about 70 kg of fertiliser per acre farmers in the rest of the villages applied between 15 to 40 kg/acre. The major factor that seems to have contributed to this include differential access to a better road that favours profitable market participation among farmers residing in Ruaha-Mbuyuni. The level of investment by a typical farmer tended to decrease gradually as the village becomes remote.
On average and at median, farmers in Ruaha-Mbuyuni realised more returns to land from commercial crops
(Table 3.23). At median, a typical farmer in Ruaha-Mbuyuni had returns to land twice as much that earned by a farmer in any of the other villages. The level of returns to labour also was higher in Ruaha-Mbuyuni compared to other villages (Table 3.24). Irrespective of spatial differences, both returns to land and labour were impressive. Considering an average national household size of 5 people, an acre under the commercialised crops would give an average of US $ 100 per person per year. This is a third of the national GDP per capita of about Tshs 400,000 at 2001 prices (URT, 2010b) which is equivalent to around US $ 300. The overall returns to labour of US$ 4/person-day, is above the global poverty line of US $ 2/person. Such global poverty comparison confidently holds given the national average household size of 5 people. This means, for every person working in the household there is likely to be one dependant, either child or old person. The findings indicate the poverty reduction potential of a commercialised crop sub-sector.
3.3.4. Rural finance and liquidity
The financial assets base was evaluated in terms of potential sources of finance. The household liquidity is critical for both investment and operating capital.
Few farmers had savings at bank. Most of bank depositors were found in Lumuma (Table 3.25). Majority of farmers had access to a range of financial sources. Almost everyone had some savings at home or in his/her
Table 3.22: Overall investment in production of commercial crops, US $/acre
Statistics Ruaha-Mbuyuni
Malolo Lumuma Msowero Overall
Mean 527 272 281 193 318
Median 386 189 165 128 208
Std. Deviation 564 290 297 230 386
Minimum 3 12 0.6 0 0
Maximum 3,850 1,674 1,232 1,146 3,850
Inter-quartile Range 466 266 414 278 346
1st quartile 207 106 29 18 86
3rd quartile 673 372 443 297 432
Table 3.23: Returns to land, US $/acre
Statistics Ruaha-Mbuyuni
Malolo Lumuma Msowero Overall
Mean 690 248 465 478 492
Median 478 180 156 190 212
Std. Deviation 1,401 566 697 553 875
Minimum -3,287 -1,264 -502 -48 -3,287
Maximum 7,342 3,484 3,335 2,314 7,342
Inter-quartile Range 1,065 413 648 713 654
1st quartile 94 67 17 43 42
3rd quartile 1,159 479 665 756 697

Working Paper 072 www.future-agricultures.org27
pocket, implying higher level of current liquidity. Other important sources of finances were informal credit, claims on good debtors and cash remittances.
Formal credit, which is normally the target of rural finance interventions, was rare: only 7 farmers, in Ruaha-Mbuyuni and Malolo, reported to have access to formal credit. Formal credit entails borrowing from institutions such as registered savings and credit associations (SACCOS) and commercial banks.
A typical farmer had about US $ 400 as cash savings at home/in pocket in a particular year (Table 3.26). Those
few who managed bank accounts kept larger amount of finance in a year.
3.3.5. Marketing of commercial cropsStorage
At median, farmers did not store any of the commercial crops. (Table 3.27). However, storage practices were much limited in Ruaha-Mbuyuni and Malolo, villages with access to a good road, compared to remote villages. Among other factors, a good road network enhances
Table 3.24: Returns to labour*, US $/person-day
Statistics Ruaha-Mbuyuni
Malolo Lumuma Msowero Overall
Mean 57 29 11 11 27
Median 8 4 2 4 4
Std. Deviation 253 107 27 21 138
Minimum -173 -84 -5 -2 -173
Maximum 1,835 726 159 122 1,835
Inter-quartile Range 21 9 9 8 13
1st quartile 1.4 1.3 0.4 1.4 1.1
3rd quartile 23 10 9 10 14* Returns to labour was computed as gross margins divided by the person-days of family labour both expressed in per acre terms.
Table 3.25: Access to different sources of finance, frequency
Sources Ruaha-Mbuyuni
Malolo Lumuma Msowero Overall
Cash savings at bank 7 2 11 2 22
Cash saving at home/pocket 70 74 65 64 273
Claim on good debtors 3 10 6 13 32
Formal credit* 4 3 0 0 7
Informal credit 9 8 7 16 40
Cash remittances 7 7 3 3 20
In-kind remittances 2 1 1 2 6* Formal credit was considered in its dimensions of actual and potential access4.
Table 3.26: Amount of finances from different sources, US $
Sources Per month Per year
Mean Std. Dev Median Mean Std. Dev Median
Cash savings at bank 115 153 77 1,366 2,268 500
Cash saving at home/pocket 61 72 38 720 966 385
Claim on good debtors 88 86 38 228 208 202
Formal credit* 137 156 118 511 891 162
Informal credit 75 126 38 246 277 115
Cash remittances 33 38 15 153 126 127
In-kind remittances 21 18 17 205 217 192

Working Paper 072 www.future-agricultures.org28
market linkages that could still give better prices that justify instant sales.
Figure 3.2 shows that maize was traded over the entire year with peak sales between May and August. Normally, the peak sales months coincide with harvesting time. The peak sales months were July and August; these are months when majority of farmers harvest their crop. Sales of onions beyond October involve storage. The strategic
month for disposing stored onions is April, 9 months after peak harvests, when the price is at the maximum. Beans are traded towards the end of the year. As bean is harvested between July and August; however it is traded through from this period until next season. Peak months of paddy sales are May and June, which also coincide with harvesting. Trade of paddy beyond the peak months is limited, which means limited storage.
Table 3.27: Share of stored commercial crops, %
Statistics Ruaha-Mbuyuni
Malolo Lumuma Msowero Overall
Mean 6 10 21 18 13
Median 0 0 0 0 0
Std. Deviation 11 20 29 29 24
Minimum 0 0 0 0 0
Maximum 70 100 100 100 100
Interquartile Range 8 13 36 27 20
1st quartile 0 0 0 0 0
3rd quartile 8 13 36 27 20
Figure 3.2: Temporal pattern of sales of major commercial crops
1 2 3 4 5 6 7 8 9 10 11 12Months maize was traded
0
2
4
6
8
10
12
14
16
18
20
Freq
uenc
y
Mean = 6.63Std. Dev. = 2.637N = 104
4 5 6 7 8 9 10 11 12Months onions was traded
02468
101214161820222426283032
Freq
uenc
y
Mean = 8.53Std. Dev. = 1.699N = 124
1 2 3 4 5 6 7 8 9 10 11 12Months beans was traded
0
2
4
6
8
10
12
14
16
18
20
22
24
26
Freq
uenc
y
Mean = 8.39Std. Dev. = 2.526N = 85
1 2 3 4 5 6 7 8 9 10 11 12Months paddy was traded
02468
1012141618202224262830323436
Freq
uenc
y
Mean = 6.05Std. Dev. = 2.187N = 85
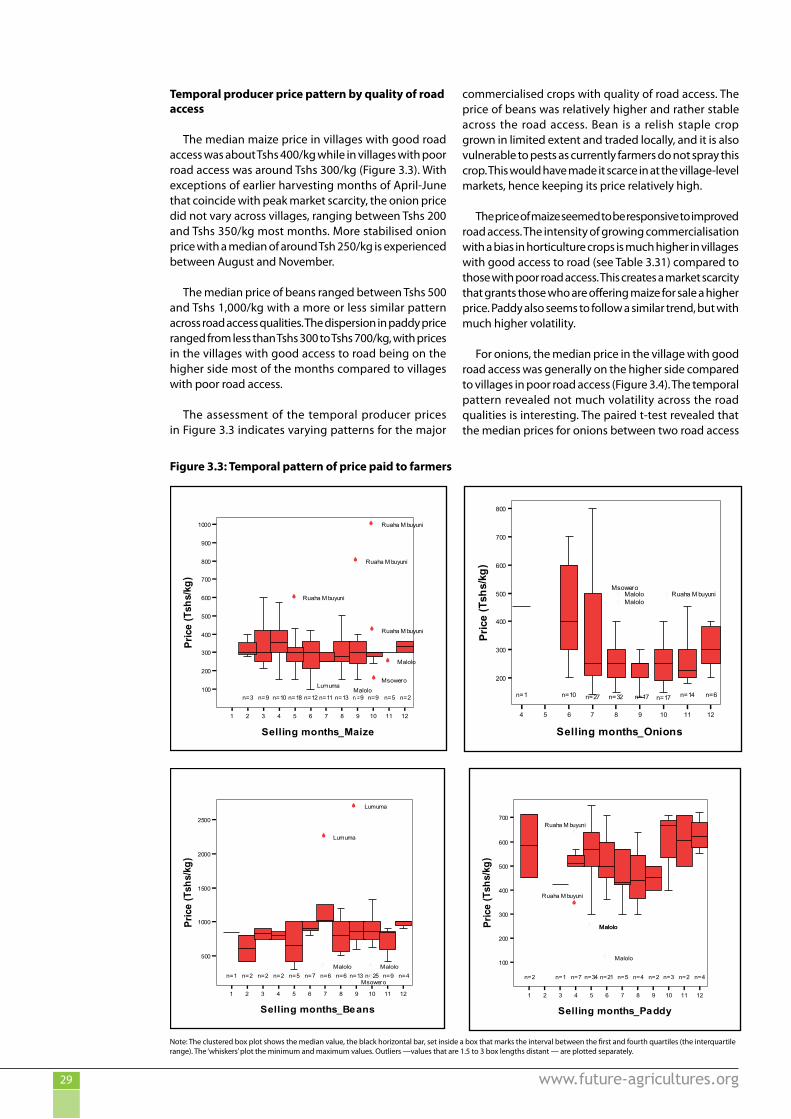
Working Paper 072 www.future-agricultures.org29
Temporal producer price pattern by quality of road access
The median maize price in villages with good road access was about Tshs 400/kg while in villages with poor road access was around Tshs 300/kg (Figure 3.3). With exceptions of earlier harvesting months of April-June that coincide with peak market scarcity, the onion price did not vary across villages, ranging between Tshs 200 and Tshs 350/kg most months. More stabilised onion price with a median of around Tsh 250/kg is experienced between August and November.
The median price of beans ranged between Tshs 500 and Tshs 1,000/kg with a more or less similar pattern across road access qualities. The dispersion in paddy price ranged from less than Tshs 300 to Tshs 700/kg, with prices in the villages with good access to road being on the higher side most of the months compared to villages with poor road access.
The assessment of the temporal producer prices in Figure 3.3 indicates varying patterns for the major
commercialised crops with quality of road access. The price of beans was relatively higher and rather stable across the road access. Bean is a relish staple crop grown in limited extent and traded locally, and it is also vulnerable to pests as currently farmers do not spray this crop. This would have made it scarce in at the village-level markets, hence keeping its price relatively high.
The price of maize seemed to be responsive to improved road access. The intensity of growing commercialisation with a bias in horticulture crops is much higher in villages with good access to road (see Table 3.31) compared to those with poor road access. This creates a market scarcity that grants those who are offering maize for sale a higher price. Paddy also seems to follow a similar trend, but with much higher volatility.
For onions, the median price in the village with good road access was generally on the higher side compared to villages in poor road access (Figure 3.4). The temporal pattern revealed not much volatility across the road qualities is interesting. The paired t-test revealed that the median prices for onions between two road access
Figure 3.3: Temporal pattern of price paid to farmers
1 2 3 4 5 6 7 8 9 10 11 12
Selling months_Maize
100
200
300
400
500
600
700
800
900
1000
Pric
e (T
shs/
kg)
n=13n=9 n=11 n=9n=3 n=12 n=9n=18 n=5n=10 n=2
LumumaMalolo
Ruaha M buyuni
Ruaha M buyuni
Msowero
Ruaha M buyuni
Ruaha M buyuni
Malolo
4 5 6 7 8 9 10 11 12
Selling months_Onions
200
300
400
500
600
700
800
Pric
e (T
shs/
kg)
n=32 n=17 n=14n=17n=10 n=27 n=6n=1
MsoweroMaloloMalolo
Ruaha M buyuni
1 2 3 4 5 6 7 8 9 10 11 12
Selling months_Beans
500
1000
1500
2000
2500
Pric
e (T
shs/
kg)
n=13 n=25 n=9n=2 n=7 n=6 n=4n=5 n=6n=2 n=2n=1Msowero
MaloloMalolo
Lumuma
Lumuma
1 2 3 4 5 6 7 8 9 10 11 12
Selling months_Paddy
100
200
300
400
500
600
700
Pric
e (T
shs/
kg)
n=21 n=4n=34 n=2n=7 n=5n=2 n=3 n=4n=1 n=2
Malolo
MaloloMalolo
Ruaha M buyuni
Ruaha M buyuni
Note: The clustered box plot shows the median value, the black horizontal bar, set inside a box that marks the interval between the first and fourth quartiles (the interquartile range). The ‘whiskers’ plot the minimum and maximum values. Outliers —values that are 1.5 to 3 box lengths distant — are plotted separately.
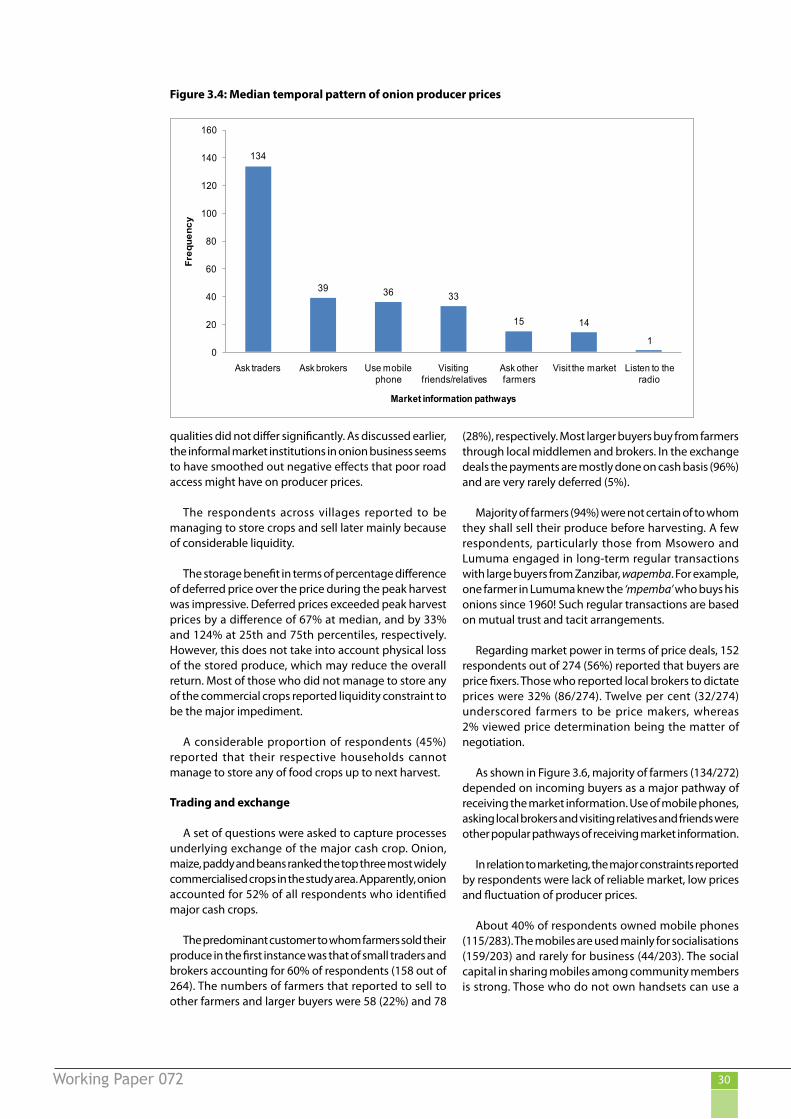
Working Paper 072 www.future-agricultures.org30
qualities did not differ significantly. As discussed earlier, the informal market institutions in onion business seems to have smoothed out negative effects that poor road access might have on producer prices.
The respondents across villages reported to be managing to store crops and sell later mainly because of considerable liquidity.
The storage benefit in terms of percentage difference of deferred price over the price during the peak harvest was impressive. Deferred prices exceeded peak harvest prices by a difference of 67% at median, and by 33% and 124% at 25th and 75th percentiles, respectively. However, this does not take into account physical loss of the stored produce, which may reduce the overall return. Most of those who did not manage to store any of the commercial crops reported liquidity constraint to be the major impediment.
A considerable proportion of respondents (45%) reported that their respective households cannot manage to store any of food crops up to next harvest.
Trading and exchange
A set of questions were asked to capture processes underlying exchange of the major cash crop. Onion, maize, paddy and beans ranked the top three most widely commercialised crops in the study area. Apparently, onion accounted for 52% of all respondents who identified major cash crops.
The predominant customer to whom farmers sold their produce in the first instance was that of small traders and brokers accounting for 60% of respondents (158 out of 264). The numbers of farmers that reported to sell to other farmers and larger buyers were 58 (22%) and 78
(28%), respectively. Most larger buyers buy from farmers through local middlemen and brokers. In the exchange deals the payments are mostly done on cash basis (96%) and are very rarely deferred (5%).
Majority of farmers (94%) were not certain of to whom they shall sell their produce before harvesting. A few respondents, particularly those from Msowero and Lumuma engaged in long-term regular transactions with large buyers from Zanzibar, wapemba. For example, one farmer in Lumuma knew the ‘mpemba’ who buys his onions since 1960! Such regular transactions are based on mutual trust and tacit arrangements.
Regarding market power in terms of price deals, 152 respondents out of 274 (56%) reported that buyers are price fixers. Those who reported local brokers to dictate prices were 32% (86/274). Twelve per cent (32/274) underscored farmers to be price makers, whereas 2% viewed price determination being the matter of negotiation.
As shown in Figure 3.6, majority of farmers (134/272) depended on incoming buyers as a major pathway of receiving the market information. Use of mobile phones, asking local brokers and visiting relatives and friends were other popular pathways of receiving market information.
In relation to marketing, the major constraints reported by respondents were lack of reliable market, low prices and fluctuation of producer prices.
About 40% of respondents owned mobile phones (115/283). The mobiles are used mainly for socialisations (159/203) and rarely for business (44/203). The social capital in sharing mobiles among community members is strong. Those who do not own handsets can use a
Figure 3.4: Median temporal pattern of onion producer prices
134
39 36 33
15 14
10
20
40
60
80
100
120
140
160
Ask traders Ask brokers Use mobile phone
Visiting friends/relatives
Ask other farmers
Visit the market Listen to the radio
Freq
uenc
y
Market information pathways
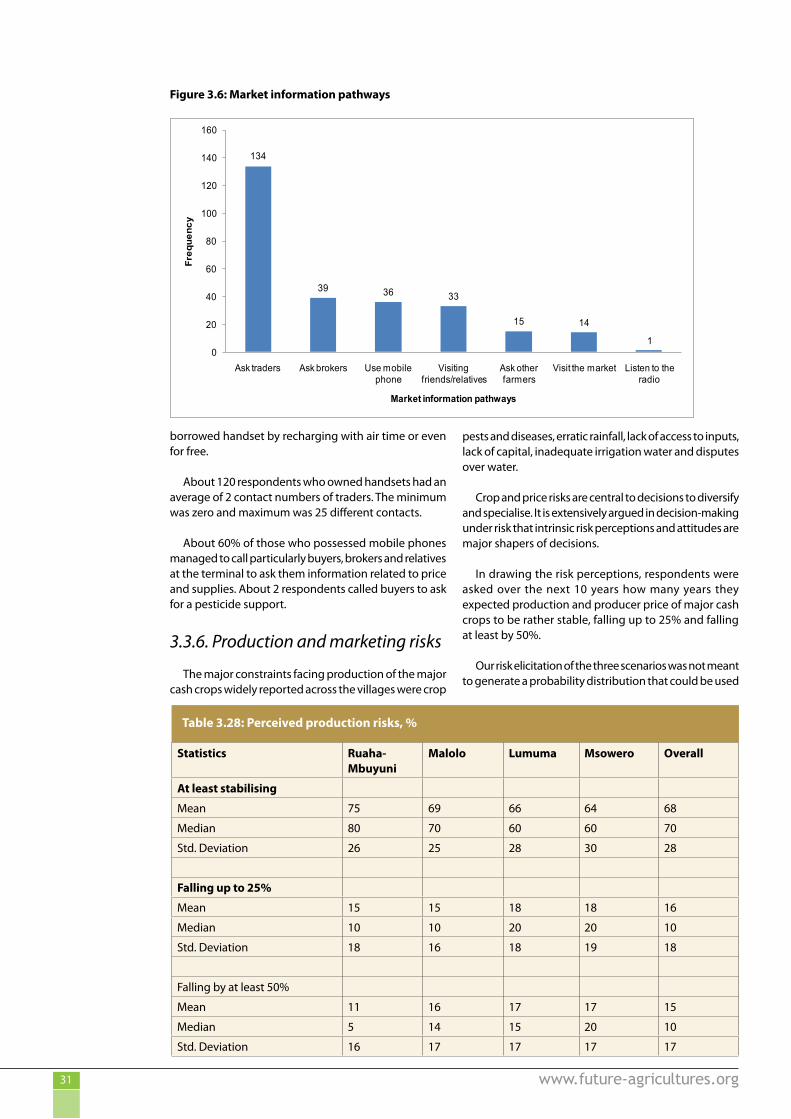
Working Paper 072 www.future-agricultures.org31
borrowed handset by recharging with air time or even for free.
About 120 respondents who owned handsets had an average of 2 contact numbers of traders. The minimum was zero and maximum was 25 different contacts.
About 60% of those who possessed mobile phones managed to call particularly buyers, brokers and relatives at the terminal to ask them information related to price and supplies. About 2 respondents called buyers to ask for a pesticide support.
3.3.6. Production and marketing risks
The major constraints facing production of the major cash crops widely reported across the villages were crop
pests and diseases, erratic rainfall, lack of access to inputs, lack of capital, inadequate irrigation water and disputes over water.
Crop and price risks are central to decisions to diversify and specialise. It is extensively argued in decision-making under risk that intrinsic risk perceptions and attitudes are major shapers of decisions.
In drawing the risk perceptions, respondents were asked over the next 10 years how many years they expected production and producer price of major cash crops to be rather stable, falling up to 25% and falling at least by 50%.
Our risk elicitation of the three scenarios was not meant to generate a probability distribution that could be used
Figure 3.6: Market information pathways
134
39 36 33
15 14
10
20
40
60
80
100
120
140
160
Ask traders Ask brokers Use mobile phone
Visiting friends/relatives
Ask other farmers
Visit the market Listen to the radio
Freq
uenc
y
Market information pathways
Table 3.28: Perceived production risks, %
Statistics Ruaha-Mbuyuni
Malolo Lumuma Msowero Overall
At least stabilising
Mean 75 69 66 64 68
Median 80 70 60 60 70
Std. Deviation 26 25 28 30 28
Falling up to 25%
Mean 15 15 18 18 16
Median 10 10 20 20 10
Std. Deviation 18 16 18 19 18
Falling by at least 50%
Mean 11 16 17 17 15
Median 5 14 15 20 10
Std. Deviation 16 17 17 17 17
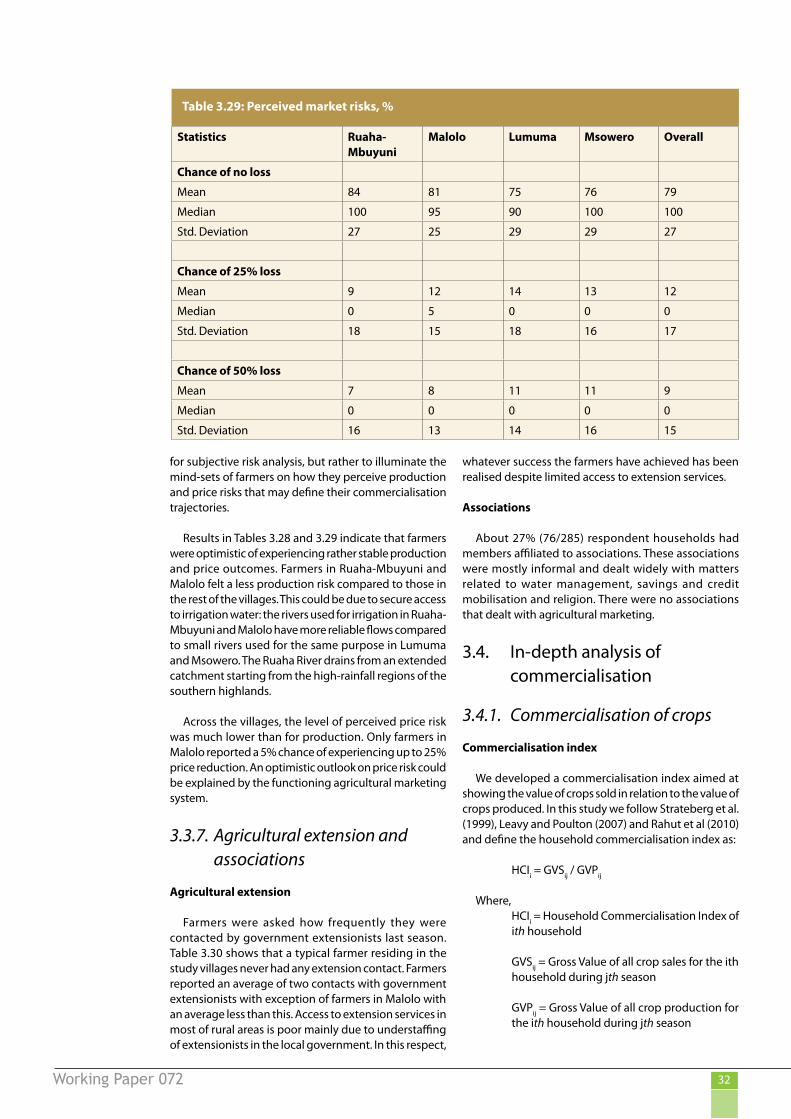
Working Paper 072 www.future-agricultures.org32
for subjective risk analysis, but rather to illuminate the mind-sets of farmers on how they perceive production and price risks that may define their commercialisation trajectories.
Results in Tables 3.28 and 3.29 indicate that farmers were optimistic of experiencing rather stable production and price outcomes. Farmers in Ruaha-Mbuyuni and Malolo felt a less production risk compared to those in the rest of the villages. This could be due to secure access to irrigation water: the rivers used for irrigation in Ruaha-Mbuyuni and Malolo have more reliable flows compared to small rivers used for the same purpose in Lumuma and Msowero. The Ruaha River drains from an extended catchment starting from the high-rainfall regions of the southern highlands.
Across the villages, the level of perceived price risk was much lower than for production. Only farmers in Malolo reported a 5% chance of experiencing up to 25% price reduction. An optimistic outlook on price risk could be explained by the functioning agricultural marketing system.
3.3.7. Agricultural extension and associations
Agricultural extension
Farmers were asked how frequently they were contacted by government extensionists last season. Table 3.30 shows that a typical farmer residing in the study villages never had any extension contact. Farmers reported an average of two contacts with government extensionists with exception of farmers in Malolo with an average less than this. Access to extension services in most of rural areas is poor mainly due to understaffing of extensionists in the local government. In this respect,
whatever success the farmers have achieved has been realised despite limited access to extension services.
Associations
About 27% (76/285) respondent households had members affiliated to associations. These associations were mostly informal and dealt widely with matters related to water management, savings and credit mobilisation and religion. There were no associations that dealt with agricultural marketing.
3.4. In-depth analysis of commercialisation
3.4.1. Commercialisation of crops
Commercialisation index
We developed a commercialisation index aimed at showing the value of crops sold in relation to the value of crops produced. In this study we follow Strateberg et al. (1999), Leavy and Poulton (2007) and Rahut et al (2010) and define the household commercialisation index as:
HCIi = GVSij / GVPij
Where, HCIi = Household Commercialisation Index of ith household
GVSij = Gross Value of all crop sales for the ith household during jth season
GVPij = Gross Value of all crop production for the ith household during jth season
Table 3.29: Perceived market risks, %
Statistics Ruaha-Mbuyuni
Malolo Lumuma Msowero Overall
Chance of no loss
Mean 84 81 75 76 79
Median 100 95 90 100 100
Std. Deviation 27 25 29 29 27
Chance of 25% loss
Mean 9 12 14 13 12
Median 0 5 0 0 0
Std. Deviation 18 15 18 16 17
Chance of 50% loss
Mean 7 8 11 11 9
Median 0 0 0 0 0
Std. Deviation 16 13 14 16 15
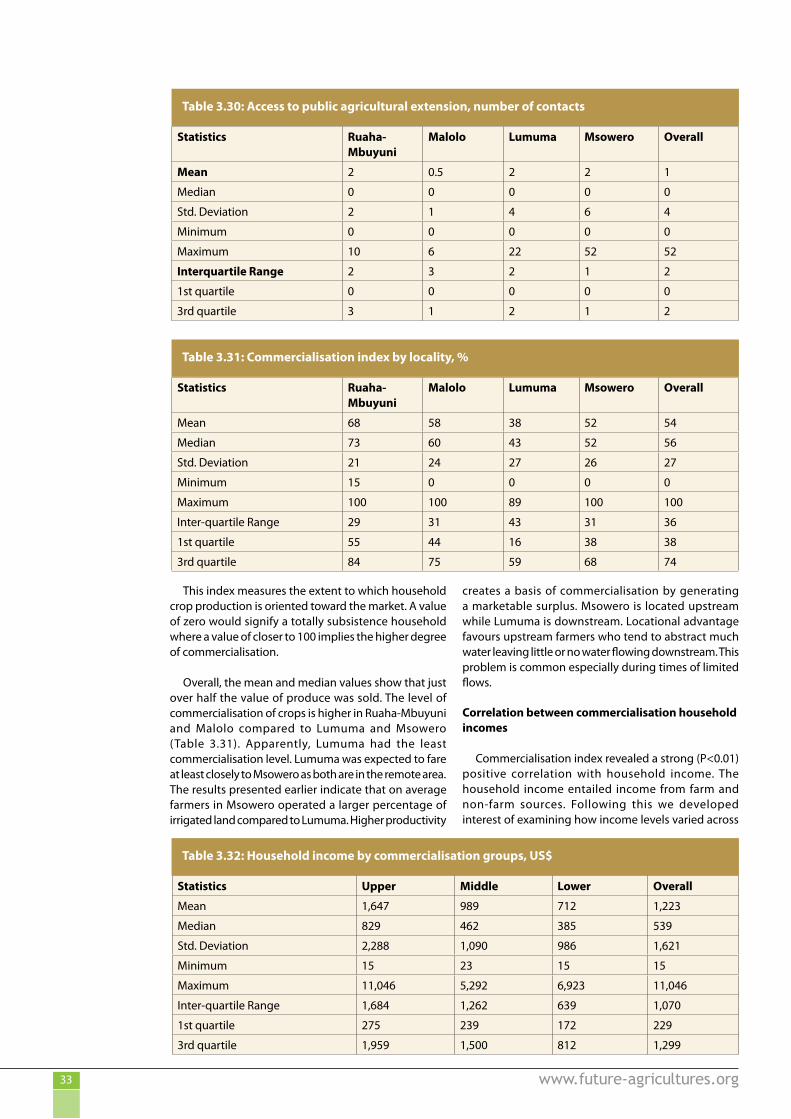
Working Paper 072 www.future-agricultures.org33
This index measures the extent to which household crop production is oriented toward the market. A value of zero would signify a totally subsistence household where a value of closer to 100 implies the higher degree of commercialisation.
Overall, the mean and median values show that just over half the value of produce was sold. The level of commercialisation of crops is higher in Ruaha-Mbuyuni and Malolo compared to Lumuma and Msowero (Table 3.31). Apparently, Lumuma had the least commercialisation level. Lumuma was expected to fare at least closely to Msowero as both are in the remote area. The results presented earlier indicate that on average farmers in Msowero operated a larger percentage of irrigated land compared to Lumuma. Higher productivity
creates a basis of commercialisation by generating a marketable surplus. Msowero is located upstream while Lumuma is downstream. Locational advantage favours upstream farmers who tend to abstract much water leaving little or no water flowing downstream. This problem is common especially during times of limited flows.
Correlation between commercialisation household incomes
Commercialisation index revealed a strong (P<0.01) positive correlation with household income. The household income entailed income from farm and non-farm sources. Following this we developed interest of examining how income levels varied across
Table 3.30: Access to public agricultural extension, number of contacts
Statistics Ruaha-Mbuyuni
Malolo Lumuma Msowero Overall
Mean 2 0.5 2 2 1
Median 0 0 0 0 0
Std. Deviation 2 1 4 6 4
Minimum 0 0 0 0 0
Maximum 10 6 22 52 52
Interquartile Range 2 3 2 1 2
1st quartile 0 0 0 0 0
3rd quartile 3 1 2 1 2
Table 3.31: Commercialisation index by locality, %
Statistics Ruaha-Mbuyuni
Malolo Lumuma Msowero Overall
Mean 68 58 38 52 54
Median 73 60 43 52 56
Std. Deviation 21 24 27 26 27
Minimum 15 0 0 0 0
Maximum 100 100 89 100 100
Inter-quartile Range 29 31 43 31 36
1st quartile 55 44 16 38 38
3rd quartile 84 75 59 68 74
Table 3.32: Household income by commercialisation groups, US$
Statistics Upper Middle Lower Overall
Mean 1,647 989 712 1,223
Median 829 462 385 539
Std. Deviation 2,288 1,090 986 1,621
Minimum 15 23 15 15
Maximum 11,046 5,292 6,923 11,046
Inter-quartile Range 1,684 1,262 639 1,070
1st quartile 275 239 172 229
3rd quartile 1,959 1,500 812 1,299
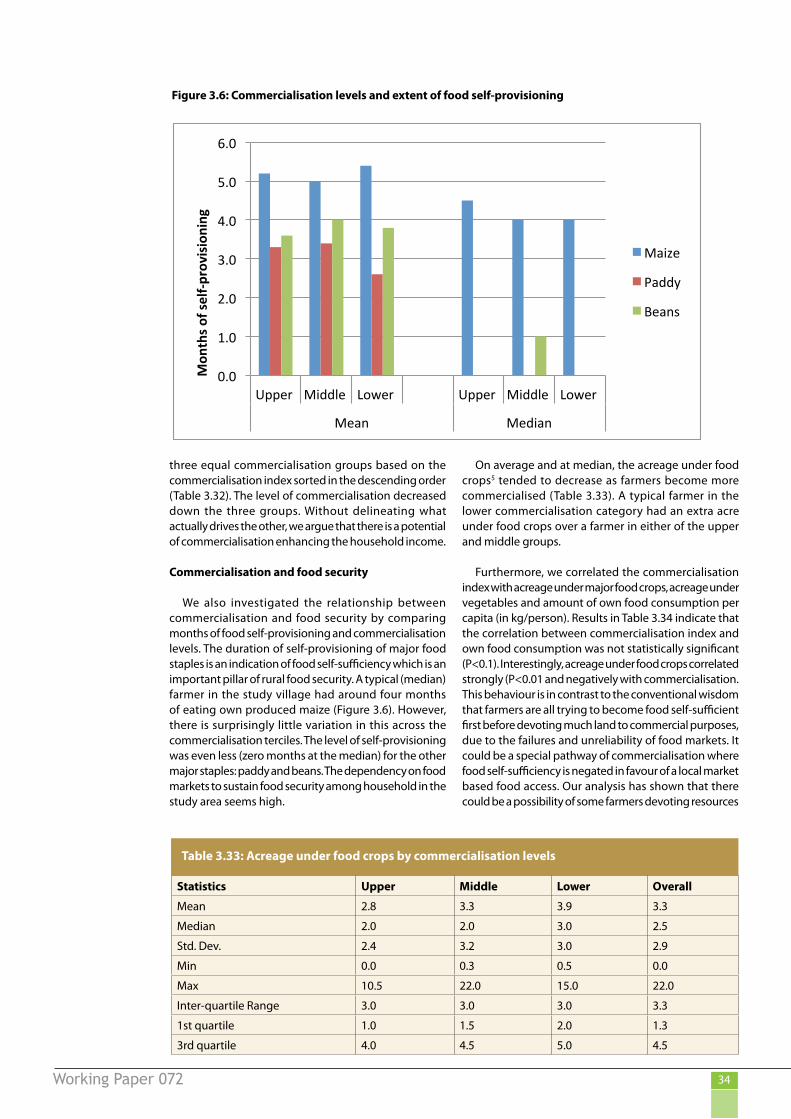
Working Paper 072 www.future-agricultures.org34
three equal commercialisation groups based on the commercialisation index sorted in the descending order (Table 3.32). The level of commercialisation decreased down the three groups. Without delineating what actually drives the other, we argue that there is a potential of commercialisation enhancing the household income.
Commercialisation and food security
We also investigated the relationship between commercialisation and food security by comparing months of food self-provisioning and commercialisation levels. The duration of self-provisioning of major food staples is an indication of food self-sufficiency which is an important pillar of rural food security. A typical (median) farmer in the study village had around four months of eating own produced maize (Figure 3.6). However, there is surprisingly little variation in this across the commercialisation terciles. The level of self-provisioning was even less (zero months at the median) for the other major staples: paddy and beans. The dependency on food markets to sustain food security among household in the study area seems high.
On average and at median, the acreage under food crops5 tended to decrease as farmers become more commercialised (Table 3.33). A typical farmer in the lower commercialisation category had an extra acre under food crops over a farmer in either of the upper and middle groups.
Furthermore, we correlated the commercialisation index with acreage under major food crops, acreage under vegetables and amount of own food consumption per capita (in kg/person). Results in Table 3.34 indicate that the correlation between commercialisation index and own food consumption was not statistically significant (P<0.1). Interestingly, acreage under food crops correlated strongly (P<0.01 and negatively with commercialisation. This behaviour is in contrast to the conventional wisdom that farmers are all trying to become food self-sufficient first before devoting much land to commercial purposes, due to the failures and unreliability of food markets. It could be a special pathway of commercialisation where food self-sufficiency is negated in favour of a local market based food access. Our analysis has shown that there could be a possibility of some farmers devoting resources
Figure 3.6: Commercialisation levels and extent of food self-provisioning
Commercialization of African Smallholder Agriculture: the Case of Central Tanzania 2011
44
Minimum 15 23 15 15
Maximum 11,046 5,292 6,923 11,046
Inter-‐quartile Range 1,684 1,262 639 1,070
1st quartile 275 239 172 229
3rd quartile 1,959 1,500 812 1,299
Commercialisation and food security
We also investigated the relationship between commercialisation and food security by comparing months of food self-‐provisioning and commercialisation levels. The duration of self-‐provisioning of major food staples is an indication of food self-‐sufficiency which is an important pillar of rural food security. A typical (median) farmer in the study village had around four months of eating own produced maize (Figure 3.6). However, there is surprisingly little variation in this across the commercialisation terciles. The level of self-‐provisioning was even less (zero months at the median) for the other major staples: paddy and beans. The dependency on food markets to sustain food security among household in the study area seems high.
Figure 3.6: Commercialisation levels and extent of food self-‐provisioning
On average and at median, the acreage under food crops5 tended to decrease as farmers become more commercialised (Table 3.33). A typical farmer in the lower commercialisation category had an extra acre under food crops over a farmer in either of the upper and middle groups.
Table 3.33: Acreage under food crops by commercialisation levels
Statistics Upper Middle Lower Overall
Mean 2.8 3.3 3.9 3.3
Median 2.0 2.0 3.0 2.5
5Food crops considered include cereals, legumes, and roots & tubers
0.0
1.0
2.0
3.0
4.0
5.0
6.0
Upper Middle Lower Upper Middle Lower
Mean Median
Mon
ths o
f self-‐p
rovision
ing
Maize
Paddy
Beans
Table 3.33: Acreage under food crops by commercialisation levels
Statistics Upper Middle Lower Overall
Mean 2.8 3.3 3.9 3.3
Median 2.0 2.0 3.0 2.5
Std. Dev. 2.4 3.2 3.0 2.9
Min 0.0 0.3 0.5 0.0
Max 10.5 22.0 15.0 22.0
Inter-quartile Range 3.0 3.0 3.0 3.3
1st quartile 1.0 1.5 2.0 1.3
3rd quartile 4.0 4.5 5.0 4.5
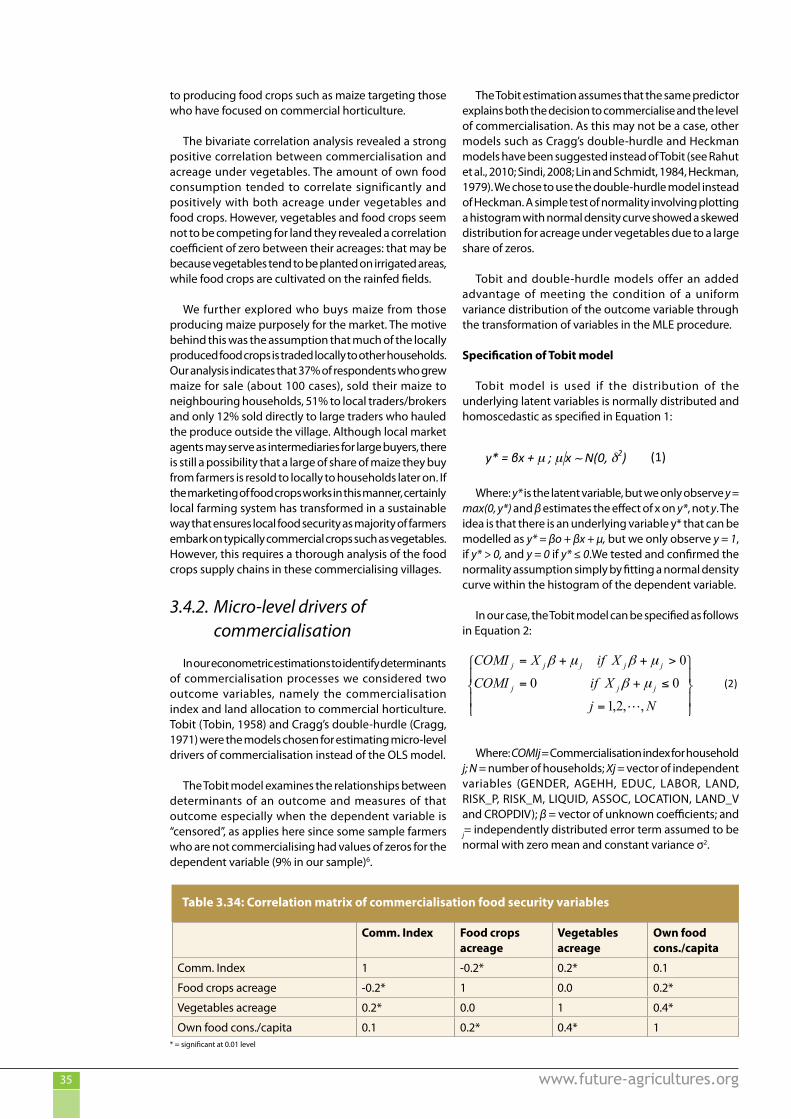
Working Paper 072 www.future-agricultures.org35
to producing food crops such as maize targeting those who have focused on commercial horticulture.
The bivariate correlation analysis revealed a strong positive correlation between commercialisation and acreage under vegetables. The amount of own food consumption tended to correlate significantly and positively with both acreage under vegetables and food crops. However, vegetables and food crops seem not to be competing for land they revealed a correlation coefficient of zero between their acreages: that may be because vegetables tend to be planted on irrigated areas, while food crops are cultivated on the rainfed fields.
We further explored who buys maize from those producing maize purposely for the market. The motive behind this was the assumption that much of the locally produced food crops is traded locally to other households. Our analysis indicates that 37% of respondents who grew maize for sale (about 100 cases), sold their maize to neighbouring households, 51% to local traders/brokers and only 12% sold directly to large traders who hauled the produce outside the village. Although local market agents may serve as intermediaries for large buyers, there is still a possibility that a large of share of maize they buy from farmers is resold to locally to households later on. If the marketing of food crops works in this manner, certainly local farming system has transformed in a sustainable way that ensures local food security as majority of farmers embark on typically commercial crops such as vegetables. However, this requires a thorough analysis of the food crops supply chains in these commercialising villages.
3.4.2. Micro-level drivers of commercialisation
In our econometric estimations to identify determinants of commercialisation processes we considered two outcome variables, namely the commercialisation index and land allocation to commercial horticulture. Tobit (Tobin, 1958) and Cragg’s double-hurdle (Cragg, 1971) were the models chosen for estimating micro-level drivers of commercialisation instead of the OLS model.
The Tobit model examines the relationships between determinants of an outcome and measures of that outcome especially when the dependent variable is “censored”, as applies here since some sample farmers who are not commercialising had values of zeros for the dependent variable (9% in our sample)6.
The Tobit estimation assumes that the same predictor explains both the decision to commercialise and the level of commercialisation. As this may not be a case, other models such as Cragg’s double-hurdle and Heckman models have been suggested instead of Tobit (see Rahut et al., 2010; Sindi, 2008; Lin and Schmidt, 1984, Heckman, 1979). We chose to use the double-hurdle model instead of Heckman. A simple test of normality involving plotting a histogram with normal density curve showed a skewed distribution for acreage under vegetables due to a large share of zeros.
Tobit and double-hurdle models offer an added advantage of meeting the condition of a uniform variance distribution of the outcome variable through the transformation of variables in the MLE procedure.
Specification of Tobit model
Tobit model is used if the distribution of the underlying latent variables is normally distributed and homoscedastic as specified in Equation 1:
Commercialization of African Smallholder Agriculture: the Case of Central Tanzania 2011
46
3.4.2. Micro-‐level drivers of commercialisation In our econometric estimations to identify determinants of commercialisation processes we considered two outcome variables, namely the commercialisation index and land allocation to commercial horticulture. Tobit (Tobin, 1958) and Cragg’s double-‐hurdle (Cragg, 1971) were the models chosen for estimating micro-‐level drivers of commercialisation instead of the OLS model.
The Tobit model examines the relationships between determinants of an outcome and measures of that outcome especially when the dependent variable is “censored”, as applies here since some sample farmers who are not commercialising had values of zeros for the dependent variable (9% in our sample).6
The Tobit estimation assumes that the same predictor explains both the decision to commercialise and the level of commercialisation. As this may not be a case, other models such as Cragg’s double-‐hurdle and Heckman models have been suggested instead of Tobit (see Rahut et al., 2010; Sindi, 2008; Lin and Schmidt, 1984, Heckman, 1979). We chose to use the double-‐hurdle model instead of Heckman. A simple test of normality involving plotting a histogram with normal density curve showed a skewed distribution for acreage under vegetables due to a large share of zeros.
Tobit and double-‐hurdle models offer an added advantage of meeting the condition of a uniform variance distribution of the outcome variable through the transformation of variables in the MLE procedure.
Specification of Tobit model
Tobit model is used if the distribution of the underlying latent variables is normally distributed and homoscedastic as specified in Equation 1:
y* = βx + µ ; µ|x ∼ N(0, δ2) (1)
Where: y* is the latent variable, but we only observe y = max(0, y*) and β estimates the effect of x on y*, not y. The idea is that there is an underlying variable y* that can be modelled as y* = βo + βx + µ, but we only observe y = 1, if y* > 0, and y = 0 if y* ≤ 0.We tested and confirmed the normality assumption simply by fitting a normal density curve within the histogram of the dependent variable.
In our case, the Tobit model can be specified as follows in Equation 2:
⎪⎭
⎪⎬
⎫
⎪⎩
⎪⎨
⎧
=
≤+=
>++=
NjXifCOMIXifXCOMI
jjj
jjjjj
,,2,1000
µβ
µβµβ
(2)
Where: COMIj = Commercialisation index for household j; N = number of households; Xj = vector of independent variables (GENDER, AGEHH, EDUC, LABOR, LAND, RISK_P, RISK_M, LIQUID, ASSOC, LOCATION, LAND_V and CROPDIV); β = vector of unknown coefficients; and j= independently distributed error term assumed to be normal with zero mean and constant variance σ2.
Specification of Cragg double-‐hurdle models
6This simply means, while we observed a predictor variable we did not observe the outcome variable, a phenomenon called “censoring” in econometrics. Farmers with a commercialisation index of “0” are taken as not commercialising, so long as we observe the predictors of commercialisation for them, we do not know how “close” they are to commercialising. Empirically, this means the zeros or limit observations are separated from the non-‐zero (continuous) or non-‐limit observations. The censoring problem is extensively explained in literature (see Greene, 2002; Gujarati, 1995; Goetz, 1995). The Tobit model has been used extensively in studies investigating commercialisation, and technology adoption decisions and diffusion (Sindi, 2008; Alene et al., 2006, Manyong et al. 2006; Peter et al., 2000).
Commercialization of African Smallholder Agriculture: the Case of Central Tanzania 2011
46
3.4.2. Micro-‐level drivers of commercialisation In our econometric estimations to identify determinants of commercialisation processes we considered two outcome variables, namely the commercialisation index and land allocation to commercial horticulture. Tobit (Tobin, 1958) and Cragg’s double-‐hurdle (Cragg, 1971) were the models chosen for estimating micro-‐level drivers of commercialisation instead of the OLS model.
The Tobit model examines the relationships between determinants of an outcome and measures of that outcome especially when the dependent variable is “censored”, as applies here since some sample farmers who are not commercialising had values of zeros for the dependent variable (9% in our sample).6
The Tobit estimation assumes that the same predictor explains both the decision to commercialise and the level of commercialisation. As this may not be a case, other models such as Cragg’s double-‐hurdle and Heckman models have been suggested instead of Tobit (see Rahut et al., 2010; Sindi, 2008; Lin and Schmidt, 1984, Heckman, 1979). We chose to use the double-‐hurdle model instead of Heckman. A simple test of normality involving plotting a histogram with normal density curve showed a skewed distribution for acreage under vegetables due to a large share of zeros.
Tobit and double-‐hurdle models offer an added advantage of meeting the condition of a uniform variance distribution of the outcome variable through the transformation of variables in the MLE procedure.
Specification of Tobit model Tobit model is used if the distribution of the underlying latent variables is normally distributed and homoscedastic as specified in Equation 1:
y* = βx + µ ; µ|x ∼ N(0, δ2) (1)
Where: y* is the latent variable, but we only observe y = max(0, y*) and β estimates the effect of x on y*, not y. The idea is that there is an underlying variable y* that can be modelled as y* = βo + βx + µ, but we only observe y = 1, if y* > 0, and y = 0 if y* ≤ 0.We tested and confirmed the normality assumption simply by fitting a normal density curve within the histogram of the dependent variable.
In our case, the Tobit model can be specified as follows in Equation 2:
⎪⎭
⎪⎬
⎫
⎪⎩
⎪⎨
⎧
=
≤+=
>++=
NjXifCOMIXifXCOMI
jjj
jjjjj
,,2,1000
µβ
µβµβ
(2)
Where: COMIj = Commercialisation index for household j; N = number of households; Xj = vector of independent variables (GENDER, AGEHH, EDUC, LABOR, LAND, RISK_P, RISK_M, LIQUID, ASSOC, LOCATION, LAND_V and CROPDIV); β = vector of unknown coefficients; and j= independently distributed error term assumed to be normal with zero mean and constant variance σ2.
Specification of Cragg double-‐hurdle models
6This simply means, while we observed a predictor variable we did not observe the outcome variable, a phenomenon called “censoring” in econometrics. Farmers with a commercialisation index of “0” are taken as not commercialising, so long as we observe the predictors of commercialisation for them, we do not know how “close” they are to commercialising. Empirically, this means the zeros or limit observations are separated from the non-‐zero (continuous) or non-‐limit observations. The censoring problem is extensively explained in literature (see Greene, 2002; Gujarati, 1995; Goetz, 1995). The Tobit model has been used extensively in studies investigating commercialisation, and technology adoption decisions and diffusion (Sindi, 2008; Alene et al., 2006, Manyong et al. 2006; Peter et al., 2000).
Where: y* is the latent variable, but we only observe y = max(0, y*) and β estimates the effect of x on y*, not y. The idea is that there is an underlying variable y* that can be modelled as y* = βo + βx + µ, but we only observe y = 1, if y* > 0, and y = 0 if y* ≤ 0.We tested and confirmed the normality assumption simply by fitting a normal density curve within the histogram of the dependent variable.
In our case, the Tobit model can be specified as follows in Equation 2:
Commercialization of African Smallholder Agriculture: the Case of Central Tanzania 2011
46
3.4.2. Micro-‐level drivers of commercialisation In our econometric estimations to identify determinants of commercialisation processes we considered two outcome variables, namely the commercialisation index and land allocation to commercial horticulture. Tobit (Tobin, 1958) and Cragg’s double-‐hurdle (Cragg, 1971) were the models chosen for estimating micro-‐level drivers of commercialisation instead of the OLS model.
The Tobit model examines the relationships between determinants of an outcome and measures of that outcome especially when the dependent variable is “censored”, as applies here since some sample farmers who are not commercialising had values of zeros for the dependent variable (9% in our sample).6
The Tobit estimation assumes that the same predictor explains both the decision to commercialise and the level of commercialisation. As this may not be a case, other models such as Cragg’s double-‐hurdle and Heckman models have been suggested instead of Tobit (see Rahut et al., 2010; Sindi, 2008; Lin and Schmidt, 1984, Heckman, 1979). We chose to use the double-‐hurdle model instead of Heckman. A simple test of normality involving plotting a histogram with normal density curve showed a skewed distribution for acreage under vegetables due to a large share of zeros.
Tobit and double-‐hurdle models offer an added advantage of meeting the condition of a uniform variance distribution of the outcome variable through the transformation of variables in the MLE procedure.
Specification of Tobit model Tobit model is used if the distribution of the underlying latent variables is normally distributed and homoscedastic as specified in Equation 1:
y* = βx + µ ; µ|x ∼ N(0, δ2) (1)
Where: y* is the latent variable, but we only observe y = max(0, y*) and β estimates the effect of x on y*, not y. The idea is that there is an underlying variable y* that can be modelled as y* = βo + βx + µ, but we only observe y = 1, if y* > 0, and y = 0 if y* ≤ 0.We tested and confirmed the normality assumption simply by fitting a normal density curve within the histogram of the dependent variable.
In our case, the Tobit model can be specified as follows in Equation 2:
⎪⎭
⎪⎬
⎫
⎪⎩
⎪⎨
⎧
=
≤+=
>++=
NjXifCOMIXifXCOMI
jjj
jjjjj
,,2,1000
µβ
µβµβ
(2)
Where: COMIj = Commercialisation index for household j; N = number of households; Xj = vector of independent variables (GENDER, AGEHH, EDUC, LABOR, LAND, RISK_P, RISK_M, LIQUID, ASSOC, LOCATION, LAND_V and CROPDIV); β = vector of unknown coefficients; and j= independently distributed error term assumed to be normal with zero mean and constant variance σ2.
Specification of Cragg double-‐hurdle models
6This simply means, while we observed a predictor variable we did not observe the outcome variable, a phenomenon called “censoring” in econometrics. Farmers with a commercialisation index of “0” are taken as not commercialising, so long as we observe the predictors of commercialisation for them, we do not know how “close” they are to commercialising. Empirically, this means the zeros or limit observations are separated from the non-‐zero (continuous) or non-‐limit observations. The censoring problem is extensively explained in literature (see Greene, 2002; Gujarati, 1995; Goetz, 1995). The Tobit model has been used extensively in studies investigating commercialisation, and technology adoption decisions and diffusion (Sindi, 2008; Alene et al., 2006, Manyong et al. 2006; Peter et al., 2000).
Where: COMIj = Commercialisation index for household j; N = number of households; Xj = vector of independent variables (GENDER, AGEHH, EDUC, LABOR, LAND, RISK_P, RISK_M, LIQUID, ASSOC, LOCATION, LAND_V and CROPDIV); β = vector of unknown coefficients; and
j= independently distributed error term assumed to be normal with zero mean and constant variance σ2.
Table 3.34: Correlation matrix of commercialisation food security variables
Comm. Index Food crops acreage
Vegetables acreage
Own food cons./capita
Comm. Index 1 -0.2* 0.2* 0.1
Food crops acreage -0.2* 1 0.0 0.2*
Vegetables acreage 0.2* 0.0 1 0.4*
Own food cons./capita 0.1 0.2* 0.4* 1* = significant at 0.01 level
Working Paper 072 www.future-agricultures.org36
Specification of Cragg double-hurdle models
Cragg double-hurdle model offers an informative extension of Tobit model. This is achieved by the ability to iron out separate influences of predictors on probability and level (Burton and Rigby, 2009; Gabremedhin and Swinton, 2003; Newman et al., 2001) of both commercialising in the crop sub-sector and growing vegetables. The premise underlying double-hurdle model is that the decision to commercialise and the level of commercialisation and the factors affecting decision for each of the two decision outcomes may be different. Similarly, for the decision to allocate land to any of the commercial vegetables and how much land to allocate may not be jointly predicted by the predictors. In this case, it is more suitable to apply a ‘Double hurdle’ model in which a probit regression on adoption (using all observations) is followed by a truncated regression on the non-zero observations (Sindi, 2008; Gabremedhin and Swinton, 2003; Cragg, 1971).
At the first stage (first hurdle), the decision to commercialise can be modelled as a probit regression as follows.
Consider the dependent variable yi:
Commercialization of African Smallholder Agriculture: the Case of Central Tanzania 2011
47
Cragg double-‐hurdle model offers an informative extension of Tobit model. This is achieved by the ability to iron out separate influences of predictors on probability and level (Burton and Rigby, 2009; Gabremedhin and Swinton, 2003; Newman et al., 2001) of both commercialising in the crop sub-‐sector and growing vegetables. The premise underlying double-‐hurdle model is that the decision to commercialise and the level of commercialisation and the factors affecting decision for each of the two decision outcomes may be different. Similarly, for the decision to allocate land to any of the commercial vegetables and how much land to allocate may not be jointly predicted by the predictors. In this case, it is more suitable to apply a ‘Double hurdle’ model in which a probit regression on adoption (using all observations) is followed by a truncated regression on the non-‐zero observations (Sindi, 2008; Gabremedhin and Swinton, 2003; Cragg, 1971).
At the first stage (first hurdle), the decision to commercialise can be modelled as a probit regression as follows.
Consider the dependent variable yi:
yi: =
Where, τ = threshold generally assumed to be 0. Virtually, what is estimated is unobservable yi* given in Equation 3 as,
iii xy µβ +=* (3)
Where: xi are predictor variables, β = coefficients to be estimated, and µi stochastic error term∼N(0,1).
At the second stage (second hurdle), the decision to intensify (increase level) of commercialisation and acreage under commercial vegetables is modelled a regression truncated at zero as shown in Equation 4:
𝑍𝑍!∗ = 𝑋𝑋!𝛽𝛽 + 𝜇𝜇!, µi∼N(0, δ2) (4)
𝑍𝑍! =𝑍𝑍!∗𝑖𝑖𝑖𝑖𝑍𝑍!∗ > 0 𝑎𝑎𝑎𝑎𝑎𝑎 𝑦𝑦! = 1
0 𝑜𝑜𝑜𝑜ℎ𝑒𝑒𝑒𝑒𝑒𝑒𝑒𝑒𝑒𝑒𝑒𝑒
Where: Zi is the level of commercialisation and acreage which depend on the unobservable being greater than zero and conditional to the decision to commercialise and grow vegetable yi.
The predictors fitted in Tobit and Cragg models are described as follows:
GENDER – refers to the sex of the household head fitted as a dummy coded ‘1’ and ‘0’ for women and men headed households, respectively.
AGEHH – is the age of household head (in years).
EDUC -‐ is the education level of household head in years of formal schooling.
LABOR -‐ presents the household labour force as numbers of adult members of over 15 years of age.
LAND -‐ refers to acreage of operated land in acres.
RISK_P -‐ is the measure of production risk based on farmers’ perceptions. The variable was constructed as the subjective probability (in per cent) of experiencing more than half loss in crop production due to production related risks. The probability elicitation involved asking a farmer how many seasons out of any 10 his crop production is likely to remain at an average level (no risk), fall by a quarter (moderate risk) or fall by more than 50% to this average(high risk). The total number of seasons had to add to 10 (i.e. 100%) across the three risk scenarios.
RISK_M – stands for market risk constructed in a similar way as RISK_P but involving producer price.
1 if yi* > τ
0 if yi* ≤ τ
Where, τ = threshold generally assumed to be 0. Virtually, what is estimated is unobservable yi* given in Equation 3 as,
Commercialization of African Smallholder Agriculture: the Case of Central Tanzania 2011
47
Cragg double-‐hurdle model offers an informative extension of Tobit model. This is achieved by the ability to iron out separate influences of predictors on probability and level (Burton and Rigby, 2009; Gabremedhin and Swinton, 2003; Newman et al., 2001) of both commercialising in the crop sub-‐sector and growing vegetables. The premise underlying double-‐hurdle model is that the decision to commercialise and the level of commercialisation and the factors affecting decision for each of the two decision outcomes may be different. Similarly, for the decision to allocate land to any of the commercial vegetables and how much land to allocate may not be jointly predicted by the predictors. In this case, it is more suitable to apply a ‘Double hurdle’ model in which a probit regression on adoption (using all observations) is followed by a truncated regression on the non-‐zero observations (Sindi, 2008; Gabremedhin and Swinton, 2003; Cragg, 1971).
At the first stage (first hurdle), the decision to commercialise can be modelled as a probit regression as follows.
Consider the dependent variable yi:
yi: =
Where, τ = threshold generally assumed to be 0. Virtually, what is estimated is unobservable yi* given in Equation 3 as,
iii xy µβ +=* (3)
Where: xi are predictor variables, β = coefficients to be estimated, and µi stochastic error term∼N(0,1).
At the second stage (second hurdle), the decision to intensify (increase level) of commercialisation and acreage under commercial vegetables is modelled a regression truncated at zero as shown in Equation 4:
𝑍𝑍!∗ = 𝑋𝑋!𝛽𝛽 + 𝜇𝜇!, µi∼N(0, δ2) (4)
𝑍𝑍! =𝑍𝑍!∗𝑖𝑖𝑖𝑖𝑍𝑍!∗ > 0 𝑎𝑎𝑎𝑎𝑎𝑎 𝑦𝑦! = 1
0 𝑜𝑜𝑜𝑜ℎ𝑒𝑒𝑒𝑒𝑒𝑒𝑒𝑒𝑒𝑒𝑒𝑒
Where: Zi is the level of commercialisation and acreage which depend on the unobservable being greater than zero and conditional to the decision to commercialise and grow vegetable yi.
The predictors fitted in Tobit and Cragg models are described as follows:
GENDER – refers to the sex of the household head fitted as a dummy coded ‘1’ and ‘0’ for women and men headed households, respectively.
AGEHH – is the age of household head (in years).
EDUC -‐ is the education level of household head in years of formal schooling.
LABOR -‐ presents the household labour force as numbers of adult members of over 15 years of age.
LAND -‐ refers to acreage of operated land in acres.
RISK_P -‐ is the measure of production risk based on farmers’ perceptions. The variable was constructed as the subjective probability (in per cent) of experiencing more than half loss in crop production due to production related risks. The probability elicitation involved asking a farmer how many seasons out of any 10 his crop production is likely to remain at an average level (no risk), fall by a quarter (moderate risk) or fall by more than 50% to this average(high risk). The total number of seasons had to add to 10 (i.e. 100%) across the three risk scenarios.
RISK_M – stands for market risk constructed in a similar way as RISK_P but involving producer price.
1 if yi* > τ
0 if yi* ≤ τ
Where: xi are predictor variables, β = coefficients to be estimated, and µi stochastic error term~N(0,1).
At the second stage (second hurdle), the decision to intensify (increase level) of commercialisation and acreage under commercial vegetables is modelled a regression truncated at zero as shown in Equation 4:
Commercialization of African Smallholder Agriculture: the Case of Central Tanzania 2011
47
Cragg double-‐hurdle model offers an informative extension of Tobit model. This is achieved by the ability to iron out separate influences of predictors on probability and level (Burton and Rigby, 2009; Gabremedhin and Swinton, 2003; Newman et al., 2001) of both commercialising in the crop sub-‐sector and growing vegetables. The premise underlying double-‐hurdle model is that the decision to commercialise and the level of commercialisation and the factors affecting decision for each of the two decision outcomes may be different. Similarly, for the decision to allocate land to any of the commercial vegetables and how much land to allocate may not be jointly predicted by the predictors. In this case, it is more suitable to apply a ‘Double hurdle’ model in which a probit regression on adoption (using all observations) is followed by a truncated regression on the non-‐zero observations (Sindi, 2008; Gabremedhin and Swinton, 2003; Cragg, 1971).
At the first stage (first hurdle), the decision to commercialise can be modelled as a probit regression as follows.
Consider the dependent variable yi:
yi: =
Where, τ = threshold generally assumed to be 0. Virtually, what is estimated is unobservable yi* given in Equation 3 as,
iii xy µβ +=* (3)
Where: xi are predictor variables, β = coefficients to be estimated, and µi stochastic error term∼N(0,1).
At the second stage (second hurdle), the decision to intensify (increase level) of commercialisation and acreage under commercial vegetables is modelled a regression truncated at zero as shown in Equation 4:
𝑍𝑍!∗ = 𝑋𝑋!𝛽𝛽 + 𝜇𝜇!, µi∼N(0, δ2) (4)
𝑍𝑍! =𝑍𝑍!∗𝑖𝑖𝑖𝑖𝑍𝑍!∗ > 0 𝑎𝑎𝑎𝑎𝑎𝑎 𝑦𝑦! = 1
0 𝑜𝑜𝑜𝑜ℎ𝑒𝑒𝑒𝑒𝑒𝑒𝑒𝑒𝑒𝑒𝑒𝑒
Where: Zi is the level of commercialisation and acreage which depend on the unobservable being greater than zero and conditional to the decision to commercialise and grow vegetable yi.
The predictors fitted in Tobit and Cragg models are described as follows:
GENDER – refers to the sex of the household head fitted as a dummy coded ‘1’ and ‘0’ for women and men headed households, respectively.
AGEHH – is the age of household head (in years).
EDUC -‐ is the education level of household head in years of formal schooling.
LABOR -‐ presents the household labour force as numbers of adult members of over 15 years of age.
LAND -‐ refers to acreage of operated land in acres.
RISK_P -‐ is the measure of production risk based on farmers’ perceptions. The variable was constructed as the subjective probability (in per cent) of experiencing more than half loss in crop production due to production related risks. The probability elicitation involved asking a farmer how many seasons out of any 10 his crop production is likely to remain at an average level (no risk), fall by a quarter (moderate risk) or fall by more than 50% to this average(high risk). The total number of seasons had to add to 10 (i.e. 100%) across the three risk scenarios.
RISK_M – stands for market risk constructed in a similar way as RISK_P but involving producer price.
1 if yi* > τ
0 if yi* ≤ τ
Where: Zi is the level of commercialisation and acreage which depend on the unobservable being greater than zero and conditional to the decision to commercialise and grow vegetable yi.
The predictors fitted in Tobit and Cragg models are described as follows:
GENDER – refers to the sex of the household head fitted as a dummy coded ‘1’ and ‘0’ for women and men headed households, respectively.AGEHH – is the age of household head (in years).
EDUC - is the education level of household head in years of formal schooling.
LABOR - presents the household labour force as numbers of adult members of over 15 years of age.
LAND - refers to acreage of operated land in acres.
RISK_P - is the measure of production risk based on farmers’ perceptions. The variable was constructed as the subjective probability (in per cent) of experiencing more than half loss in crop production due to production related risks. The probability elicitation involved asking a farmer how many seasons out of any 10 his crop production is likely to remain at an average level (no risk), fall by a quarter (moderate risk) or fall by more than 50% to this average(high risk). The total number of seasons had to add to 10 (i.e. 100%) across the three risk scenarios.
RISK_M – stands for market risk constructed in a similar way as RISK_P but involving producer price.
LIQUID - refers to liquidity (in US $/year) entailing financial assets from different sources that the household could avail for immediate spending. The sources considered were cash savings at bank or home; good debtors; formal and informal credit; and social transfers. The data were obtained as recall responses from the respondents during interviews.
ASSOC – presents any membership to different associations. The variable was fitted in the model as a dummy coded with a value of ‘1’ for the sample households with any membership to social groups among its members.
LOCATION – is a dummy variable meant to capture the effect of the quality of a road network on the decision to and extent of commercialisation. The village served with a good road network (Ruaha-Mbuyuni and Malolo) received a code of ‘1’ and the rest (Lumuma and Msowero)
were coded ‘0’.
CROPDIV – refers to crop diversification constructed as the number of crops grown by the household. The data for this variable were obtained as direct responses from respondents.
Econometric estimation results of commercialisation models
The results of the likelihood ratio test rejects the assumption (P>0.1) that Tobit is nested in the Cragg models. Therefore, Cragg models are more appropriate in explaining the commercialisation decisions in the crop sub-sector. However, it is still worth explaining the Tobit results altogether.
Commercialization of African Smallholder Agriculture: the Case of Central Tanzania 2011
47
Cragg double-‐hurdle model offers an informative extension of Tobit model. This is achieved by the ability to iron out separate influences of predictors on probability and level (Burton and Rigby, 2009; Gabremedhin and Swinton, 2003; Newman et al., 2001) of both commercialising in the crop sub-‐sector and growing vegetables. The premise underlying double-‐hurdle model is that the decision to commercialise and the level of commercialisation and the factors affecting decision for each of the two decision outcomes may be different. Similarly, for the decision to allocate land to any of the commercial vegetables and how much land to allocate may not be jointly predicted by the predictors. In this case, it is more suitable to apply a ‘Double hurdle’ model in which a probit regression on adoption (using all observations) is followed by a truncated regression on the non-‐zero observations (Sindi, 2008; Gabremedhin and Swinton, 2003; Cragg, 1971).
At the first stage (first hurdle), the decision to commercialise can be modelled as a probit regression as follows.
Consider the dependent variable yi:
yi: =
Where, τ = threshold generally assumed to be 0. Virtually, what is estimated is unobservable yi* given in Equation 3 as,
iii xy µβ +=* (3)
Where: xi are predictor variables, β = coefficients to be estimated, and µi stochastic error term∼N(0,1).
At the second stage (second hurdle), the decision to intensify (increase level) of commercialisation and acreage under commercial vegetables is modelled a regression truncated at zero as shown in Equation 4:
𝑍𝑍!∗ = 𝑋𝑋!𝛽𝛽 + 𝜇𝜇!, µi∼N(0, δ2) (4)
𝑍𝑍! =𝑍𝑍!∗𝑖𝑖𝑖𝑖𝑍𝑍!∗ > 0 𝑎𝑎𝑎𝑎𝑎𝑎 𝑦𝑦! = 1
0 𝑜𝑜𝑜𝑜ℎ𝑒𝑒𝑒𝑒𝑒𝑒𝑒𝑒𝑒𝑒𝑒𝑒
Where: Zi is the level of commercialisation and acreage which depend on the unobservable being greater than zero and conditional to the decision to commercialise and grow vegetable yi.
The predictors fitted in Tobit and Cragg models are described as follows:
GENDER – refers to the sex of the household head fitted as a dummy coded ‘1’ and ‘0’ for women and men headed households, respectively.
AGEHH – is the age of household head (in years).
EDUC -‐ is the education level of household head in years of formal schooling.
LABOR -‐ presents the household labour force as numbers of adult members of over 15 years of age.
LAND -‐ refers to acreage of operated land in acres.
RISK_P -‐ is the measure of production risk based on farmers’ perceptions. The variable was constructed as the subjective probability (in per cent) of experiencing more than half loss in crop production due to production related risks. The probability elicitation involved asking a farmer how many seasons out of any 10 his crop production is likely to remain at an average level (no risk), fall by a quarter (moderate risk) or fall by more than 50% to this average(high risk). The total number of seasons had to add to 10 (i.e. 100%) across the three risk scenarios.
RISK_M – stands for market risk constructed in a similar way as RISK_P but involving producer price.
1 if yi* > τ
0 if yi* ≤ τ
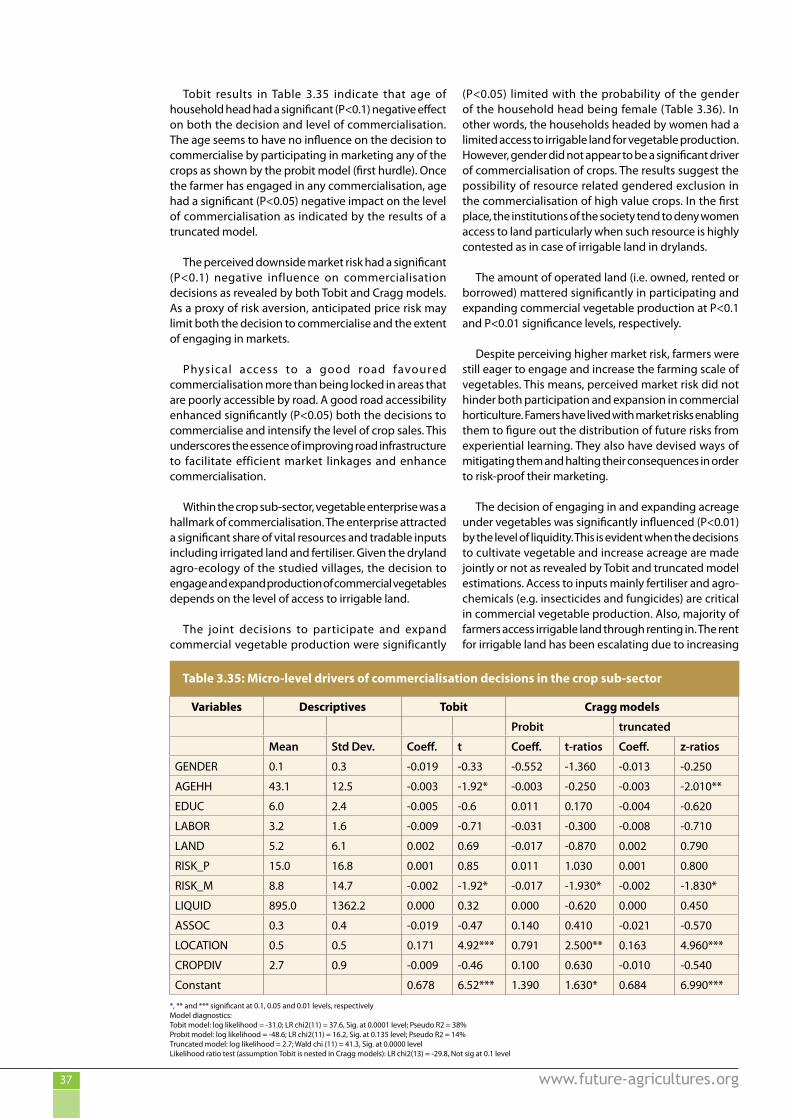
Working Paper 072 www.future-agricultures.org37
Tobit results in Table 3.35 indicate that age of household head had a significant (P<0.1) negative effect on both the decision and level of commercialisation. The age seems to have no influence on the decision to commercialise by participating in marketing any of the crops as shown by the probit model (first hurdle). Once the farmer has engaged in any commercialisation, age had a significant (P<0.05) negative impact on the level of commercialisation as indicated by the results of a truncated model.
The perceived downside market risk had a significant (P<0.1) negative influence on commercialisation decisions as revealed by both Tobit and Cragg models. As a proxy of risk aversion, anticipated price risk may limit both the decision to commercialise and the extent of engaging in markets.
Physical access to a good road favoured commercialisation more than being locked in areas that are poorly accessible by road. A good road accessibility enhanced significantly (P<0.05) both the decisions to commercialise and intensify the level of crop sales. This underscores the essence of improving road infrastructure to facilitate efficient market linkages and enhance commercialisation.
Within the crop sub-sector, vegetable enterprise was a hallmark of commercialisation. The enterprise attracted a significant share of vital resources and tradable inputs including irrigated land and fertiliser. Given the dryland agro-ecology of the studied villages, the decision to engage and expand production of commercial vegetables depends on the level of access to irrigable land.
The joint decisions to participate and expand commercial vegetable production were significantly
(P<0.05) limited with the probability of the gender of the household head being female (Table 3.36). In other words, the households headed by women had a limited access to irrigable land for vegetable production. However, gender did not appear to be a significant driver of commercialisation of crops. The results suggest the possibility of resource related gendered exclusion in the commercialisation of high value crops. In the first place, the institutions of the society tend to deny women access to land particularly when such resource is highly contested as in case of irrigable land in drylands.
The amount of operated land (i.e. owned, rented or borrowed) mattered significantly in participating and expanding commercial vegetable production at P<0.1 and P<0.01 significance levels, respectively.
Despite perceiving higher market risk, farmers were still eager to engage and increase the farming scale of vegetables. This means, perceived market risk did not hinder both participation and expansion in commercial horticulture. Famers have lived with market risks enabling them to figure out the distribution of future risks from experiential learning. They also have devised ways of mitigating them and halting their consequences in order to risk-proof their marketing.
The decision of engaging in and expanding acreage under vegetables was significantly influenced (P<0.01) by the level of liquidity. This is evident when the decisions to cultivate vegetable and increase acreage are made jointly or not as revealed by Tobit and truncated model estimations. Access to inputs mainly fertiliser and agro-chemicals (e.g. insecticides and fungicides) are critical in commercial vegetable production. Also, majority of farmers access irrigable land through renting in. The rent for irrigable land has been escalating due to increasing
Table 3.35: Micro-level drivers of commercialisation decisions in the crop sub-sector
Variables Descriptives Tobit Cragg models
Probit truncated
Mean Std Dev. Coeff. t Coeff. t-ratios Coeff. z-ratios
GENDER 0.1 0.3 -0.019 -0.33 -0.552 -1.360 -0.013 -0.250
AGEHH 43.1 12.5 -0.003 -1.92* -0.003 -0.250 -0.003 -2.010**
EDUC 6.0 2.4 -0.005 -0.6 0.011 0.170 -0.004 -0.620
LABOR 3.2 1.6 -0.009 -0.71 -0.031 -0.300 -0.008 -0.710
LAND 5.2 6.1 0.002 0.69 -0.017 -0.870 0.002 0.790
RISK_P 15.0 16.8 0.001 0.85 0.011 1.030 0.001 0.800
RISK_M 8.8 14.7 -0.002 -1.92* -0.017 -1.930* -0.002 -1.830*
LIQUID 895.0 1362.2 0.000 0.32 0.000 -0.620 0.000 0.450
ASSOC 0.3 0.4 -0.019 -0.47 0.140 0.410 -0.021 -0.570
LOCATION 0.5 0.5 0.171 4.92*** 0.791 2.500** 0.163 4.960***
CROPDIV 2.7 0.9 -0.009 -0.46 0.100 0.630 -0.010 -0.540
Constant 0.678 6.52*** 1.390 1.630* 0.684 6.990***
*, ** and *** significant at 0.1, 0.05 and 0.01 levels, respectivelyModel diagnostics: Tobit model: log likelihood = -31.0; LR chi2(11) = 37.6, Sig. at 0.0001 level; Pseudo R2 = 38%Probit model: log likelihood = -48.6; LR chi2(11) = 16.2, Sig. at 0.135 level; Pseudo R2 = 14%Truncated model: log likelihood = 2.7; Wald chi (11) = 41.3, Sig. at 0.0000 levelLikelihood ratio test (assumption Tobit is nested in Cragg models): LR chi2(13) = -29.8, Not sig at 0.1 level

Working Paper 072 www.future-agricultures.org38
demand for such land following increasing interest in commercial vegetable production. Farmers with more financial resources are better positioned to engage in and expand vegetable production given their ability to afford inputs and rentable land.
Membership in associations enhanced significantly (P<0.05) the decisions regarding entry into and acreage expansion of commercial vegetable production. Results for Tobit and Cragg models indicate significant estimates for the respective parameters of the variable (Table 3.36). Social networks are believed to be critical avenues for sharing of skills, technologies, co-innovations and social transfers through reciprocity. Water user associations (WUAs) are important social networks that bring irrigators together with a primary role of managing water and mediating water-related disputes. Whether WUAs serve other purpose that enhances commercialisation within the irrigated farm-sector or not is pending for research.
Being located in an area served with a good road connection mattered significantly (P<0.01) in the decisions to participate in and expand commercial vegetable production. Efficient linkage to markets enhanced by good road connectivity is critical in commercialisation, particularly of perishable vegetables that are traded over space with urgency. Farmers with a more diversified crop enterprise engaged in and expanded production of vegetables.
An increase in crop diversification went on along with engagement and expansion of the commercial vegetable enterprise. The parameter estimates for the Tobit and Cragg models were statistically significant at (P<0.05). This means, the decisions to venture in commercial vegetable production were reached without giving up other crops. This raises an intriguing question as there is
a strong argument that agricultural commercialisation moves with increased specialisation (Pingali and Rosegrant, 1995). One might think that farmers tended to diversify within the commercial horticulture itself. This is not the case, because the share of vegetables in the crop diversity was only 22% and 25% at average and median, respectively. The suggested bottom line is that participation in commercial horticulture and its growth goes hand in hand with growing a diversity of other food crops. This is seems to be the mechanism of addressing local food security as the agrarian community commercialises.
3.4. Plans, hopes and aspirations
In order to capture the trajectory of the commercial crop-sector, farmers were asked why they are not growing more of the cash crops. Three topmost reasons hindering growth of the commercial crop-sector were reported to be lack of capital, land scarcity and climate change, reported by 140, 20 and 13 respondents out of 211 who gave reasons, respectively. Over 80% felt that they could engage in the production of new crops if such new crops offer better opportunities and the major bottleneck such as capital are addressed.
Majority of respondents anticipated to build better houses as reported by 135 respondents out of 237. This means, much of any additional income in the local economy is quite likely to be spent locally, especially if people build a better house – employing local masons and carpenters. This is likely to be the multiplier effects the income benefits that commercialisation might bring to the local farming communities.
Table 3.36: Micro-level drivers of decisions to venture in commercial horticulture
Variables Descriptives Tobit Cragg models
Probit truncated
Mean Std Dev. Coeff. z-ratios Coeff. t-ratios Coeff. z-ratios
GENDER 0.1 0.3 -0.004 -0.010** -0.059 -0.190 0.031 0.160
AGEHH 43.1 12.5 -0.013 -1.390 -0.011 -1.220 -0.005 -0.860
EDUC 6.0 2.4 -0.030 -0.730 -0.003 -0.080 -0.021 -0.810
LABOR 3.2 1.6 0.001 0.020 -0.005 -0.070 -0.013 -0.320
LAND 5.2 6.1 0.024 1.670* -0.006 -0.400 0.025 2.740***
RISK_P 15.0 16.8 -0.004 -0.640 -0.006 -0.960 0.000 -0.030
RISK_M 8.8 14.7 0.022 3.450*** 0.014 2.170** 0.014 3.570***
LIQUID 895.0 1362.2 0.000 3.760*** 0.000 0.720 0.000 4.590***
ASSOC 0.3 0.4 0.860 4.220*** 0.972 4.300*** 0.485 3.710***
LOCATION 0.5 0.5 0.760 3.980*** 0.403 2.160** 0.479 4.130***
CROPDIV 2.7 0.9 0.349 3.410*** 0.377 3.700*** 0.156 2.480**
Constant -1.173 -2.050 -0.841 -1.560 -0.235 -0.680
*, ** and *** significant at 0.1, 0.05 and 0.01 levels, respectivelyModel diagnostics: Tobit model: log likelihood = -301.5; LR chi2(11) = 70.1, Sig. at 0.000 level; Pseudo R2 = 10%Probit model: log likelihood = -146.8; LR chi2(11) = 46.7, Sig. at 0.000 level; Pseudo R2 = 14%Truncated model: log likelihood = -311.9; Wald chi (11) = 85.6, Sig. at 0.0000 levelLikelihood ratio test (assumption Tobit is nested in Cragg models): LR chi2(13) = -314, Not sig at 0.1 level

Working Paper 072 www.future-agricultures.org39
Other important aspirations that were reported by at least 10 respondents were to start a business, expand farming and improved income. Interestingly, three respondents envisioned to be engaged in brokering and input selling.
Concerning possible migration, the majority did not expect to move out of their locales (91%). Only 25 respondents reported the possibility of relocating from the villages. Those envisioned to stay were mainly motivated by existing farming opportunities. On the other hand emigrations were particularly motivated by search of better livelihoods.
Furthermore, respondents were asked in case they are given a grant sufficient for them to lead a decent life what will they do with it. About 57% of the respondents (156 out of 275) reported that they will invest in agriculture, 22% will invest in business, 12% said will build nice houses, and 6% will spend the grant on basic needs. Such mind-set of investing in agriculture is the basic strand of commercialisation.
4. Conclusions
4.1. Key findings: answering overall questions
4.1.1. Public goods
Based on empirical evidence from our case we suggest some public goods necessary for agricultural commercialisation: agricultural water access, quality rural roads and efficient seed systems. Depending on local conditions, different places require different public goods.
Agricultural water access
This is critical to sustain production particularly in drylands like in our study villages. The magnitude of crop sales tended to increase with the proportion of irrigated land. The upgraded traditional irrigation schemes may need serious public investment in order to serve more people especially where irrigation expansion is possible such as in Ruaha-Mbuyuni. More land could be irrigated if the farming community is assisted with a pumping system or any technology that can enable abstraction of water from the river. Currently, it is only those who can afford private motorised pumps who can irrigate plots outside the gravity system.
Furthermore, management of the catchment environment in the riparian upstream areas is critical to ensure sustained flows of waters in rivers.
Improved roads
Farmers in villages readily connected to a quality road network, Dar es salaam-Zambia highway, realised higher crop sales than those in remote areas. This implies that
provision of public goods such as roads might have payoffs through improved market linkages.
Efficient seed systems
Efficient seed systems are critical in agricultural transformation through both upgraded productivity and product quality. However, for some crops such as onions, the local experiences and government backed quality declared seeds (QDS) production systems are major sources of rural seed supply.
4.1.2. Agro-ecosystem productivity and integrity
Upgrading rainfed agriculture
Access to irrigated land is the heart of crop production, hence enabling sustenance of supplies of produce in the crop value chains. Irrigation expansion is limited within the current scope of community schemes. Arguably, increased public and private investments in irrigation expansion that would mean more river abstractions may not be justified. This problem is further augmented by higher and diversified demands for fresh waters among competing sectors such as domestic use, wildlife and hydropower generation.
Most arable land falls in the drier plains where farming attempts are characterised by frequent crop failures. Soil and water conservation (SWC) and rainwater harvesting practices that could be applied to upgrade productivity of rainfed agriculture are not currently in place. Some high-value crops that could be potentially commercialised such as oil seeds and groundnuts grow well under SWC farming practices.
Upgrading the productivity is a major concern not only for rainfed system but also in irrigated agriculture. The yields of commercial crops, which mainly involve use of fertilisers and irrigation, could be improved beyond the current levels. Intervention areas with potential for direct yield improvements include development of improved seed systems and improving access to irrigation water and its underlying water use efficiency.
4.1.3. Institutions and markets
Institutions of the markets and trade
Although the institutions that allow the supply chains to work are informal and elementary, they function well enough so long as transactions are mainly spot deals. There was no strong evidence of market institutional failures. Established market relations between farmers and other market actors have worked to enable commercialisation in remote areas with poor market infrastructure.
Farmers perceived themselves to be price takers with limited market power with buyers and brokers as price fixers. This does not seem to have ebbed away the
Working Paper 072 www.future-agricultures.org40
benefits of market participation as the earnings at least surpass the national poverty thresholds.
Majority of farmers relied on incoming traders for the market information. Other three common pathways of receiving information included asking local brokers and visiting urban-based friends and relatives, and use of mobile phone. Apparently, the advent of mobile phones is yet to replace the traditional information exchange mechanisms which reflect informational trust and confidence between traders and farmers.
Furthermore, most of the farmers neither knew who exactly will buy their produce prior harvest nor sold to a regular buyer. However, a few farmers knew some buyers who regularly bought from them. For example an elderly farmer in Lumuma knew the mpemba who buys his produce today since 1960. Where such regular transactions worked they were based on mutual and tacit arrangements, otherwise the spot deals dominated the exchange process.
Most of the farmers sold their produce to small traders and local brokers as opposed to large buyers. Close to a quarter (22%) of farmers sold to their neighbouring farmers. For commercial horticulture, normally the local small traders and brokers are intermediaries bridging exchange between farmers and urban-based large buyers. Most of the food crops such as maize and paddy were traded locally among household consumers.
Across the villages, farmers felt minimum risks, especially market-related risk that was conceived in terms of the probability of producer price falling below the average. Compared to remote villages, production and market risks were less reported in villages with good access to both road and irrigation water.
Water user associations
The locally evolved water user associations (WUAs), mainly charged with management of irrigation water, seem to be working. It is the only kind of cooperation that operates across the commercialising villages. Presumably the reason farmers co-operate over water, but over little else, would be because they judge the former to be critical, while they doubt that other forms of co-operation would benefit them. However, what allows WUAs to function successfully in villages where people are otherwise reluctant to co-operate in business, is a big question. This needs to be answered empirically, in order to understand the trajectories of collective actions in the commercialisation process.
Agricultural finance
Though farmers manage to invest on the farm they still report capital as a major problem in expanding their current enterprises. Mainly through own financing, farmers are already affording to apply fertiliser in plots under commercial crops at a rate which is almost 20 times
higher than the African average rate (i.e. 135 to 175 kg/ha versus 8kg/ha). The combination of irrigation and commercialisation could be the incentive for intensive fertiliser application.
The problem of rural finance for agriculture should be looked at beyond formal credit as it used to be thought of. The results have shown that it is not only formal credit that matters but also a range of sources of finance. However, rural based SACCOS linked with commercial banks would help to mobilise rural savings and deliver loans to farmers.
Storage
The decision to store or not is a strategic decision enabling farmers to exploit the future markets as they commercialise. However, storage is justifiable with sound economics which consider among other things, the opportunity costs of holding a stock against anticipated sale prices in the future. A few farmers managed to store with the practice being predominant in remote villages compared to villages served by a good road network. The liquidity constraint was the major problem reported by majority of farmers who did not afford storage.
However, some arrangements reached between a special category of buyers (wapemba) and some farmers in the remote villages of Lumuma and Msowero offer storage related institutional solutions. The month of April, about nine months after peak harvests, is the strategic month of disposing stored onions for better prices. During this extended period a farmer might receive produce credit from wapemba to meet financial obligations. Such on-farm storage deals are rather fairer as a farmer is neither charged interest for advanced produce credit nor restricted from selling the stored produce at a price better than what can be offered by the wapemba.
4.1.4. Commercialisation outcomes and impacts
Farm investment, returns and liquidity
A typical household across the villages afforded an investment ranging between US$ 128 and US$ 386 per acre. However, committing investment on the higher side (3rd quartile) afforded up to US$ 673 per acre. Year-round production and marketing of irrigated vegetables with varying cycles ensures liquidity for on-farm operating and investment capital. Majority of the households had cash saving at home. This was coupled with a diversity of other sources of finance to enrich the financial base. A typical household had immediately spendable liquidity amounting to US$ 1,087 per year mainly from home savings and claims on good debts.
Returns to land and labour with highly commercialised crops were impressive in terms of their potential to reduce poverty. Also, highly commercialised farming
Working Paper 072 www.future-agricultures.org41
households appeared to have accumulated higher long-term welfare-indicating assets. Commercialisation and food security
Our case study has demonstrated the possibility of small family farms commercialising without compromising food security.
A more balanced production of food staples and commercial crops ensures local food security. A typical farming household across villages grew at least one food staple and one horticultural crop.
A typical household (at median) across the three commercialisation terciles had about 4 months of self-provisioning in maize, which is the major food staple. This underscores the dependency on food markets to sustain food security at household level.
Most of the food staples such as maize were traded in the village agri-food systems, whereas vegetables were exported from the respective villages.
Commercialisation revealed a strong negative relationship with acreage under food crops. This means, as the household commercialises more the tendency of growing own food diminishes.
Evidently, as farming households commercialise they seem to be relying on food markets. However, current food markets are localised particularly in the remote villages, hence putting net buyers of food at risk in case the local production is decimated by a common shock such as severe drought. Expanding the spatial scope of food markets could be through construction of better roads and communication system to enhance food trade.
Some socio-economic disparities
Commercialisation of the crop sub-sector correlated strongly and positively with household income. Commercialisation and income would enhance each other. It could be that the household income is either invested in commercial farm activities or the income earned from such activities adds to the household income. Nevertheless, there is a potential of income enhancement through commercialisation.
Men-headed households fared well above their counterpart women-headed households in terms of level of commercialisation, crop sales and crop enterprise returns. This suggests existence of gender differences that this study did not analyse.
However, sex of the household head was not significant among a set of micro-level drivers of commercialisation in the crop sub-sector.
The stake in the market in terms of crop sales increased with the proportion of irrigated land. Access to irrigated land was mainly through renting in. This means, members
of the farming communities who cannot access land mainly through rental would face market exclusion.
Notably, understanding how different pathways of commercialisation would impact different social groups; such as youth and females within households, and immigrant labourers; requires a study of its own.
Escalating rents of irrigated land
Across villages even those poorly accessible, the demand for irrigated land for horticulture production has tremendously increased the market rent. For instance, due to influx of people interest in production of onions in Lumuma, the market rent of land has increased by four times from USD$ 20 to US$80 per acre between 2004 and 2009. As income poverty exists among majority of rural farmers, this may deny majority of the poor the access to irrigable land. For example, youth who participated in the onion study focus group in Lumuma complained that increased rent has denied them free access to land as their elderly parents now rent out to non-family users.
Rural labour dynamics
A typical household allocated about 50 person-days per acre in producing highly commercialised crops. The tendency of labour exchange was evident. Over a half of the sample households hired labourers without any of their members being hired by others Over a quarter, 34% of the sample households who hired labourers had their members being hired by others too. Contrary to in-kind labour exchange practices that are common in rural Africa under reciprocity arrangements, we see increased labour exchanges for cash. In this respect, there was no a capitalist caste of farmers and wage proletariats in the study villages. This is a dynamic employment opportunity made possible by commercialisation. There is a consistent pattern, any person from any socio-economic caste can be hired and get hired.
Production and marketing constraints
Major production-related problems faced by farmers include crop pests and diseases, erratic rainfall, lack of access to inputs, lack of capital, inadequate irrigation water and disputes over water. The market-related problems reported by farmers were lack of reliable markets, and lower and fluctuating producer prices.
Crop pests and diseases could be addressed through public research and extension interventions. For example, farmers in Lumuma reported a new parasitic weed which attacks onions and spreading quickly. The problem was already communicated to district agricultural office in the past two years without any feedback. The public extension is currently very limited especially in rural areas.
Erratic rainfall could be managed through weather forecasting and efficient soil and water management in both the irrigation scheme and the rainfed flood plains.
Working Paper 072 www.future-agricultures.org42
4.1.5. Drivers of commercialisation
Drivers of commercialisation of the crop subsector
Age of the household head had a significant negative effect when the decisions to commercialise and to what extent to commercialise were jointly made. Age also had a significant negative effect on the extent of commercialisation when this decision is made separately. Age did not matter in case of mere decision to commercialise or not. This means, age tended to hinder the level of commercialisation but not a mere participation in the market. The longevity of the household reflects the demographic and resource paths and cycles it has gone through. In early stages of its establishment the household may have the motives and initial resources such as family labour to produce marketable surpluses and participate in the markets. Overtime, some younger members may leave their homes in search of own life destinies leaving their aging parents labour-constrained. The labour constraint in addition to possible changing priorities, e.g. towards food security, may reduce the level of market participation.
Perceived downside market risk has a significant negative influence on commercialisation decisions in the entire crop subsector and the opposite for engagement in commercial horticulture. This means, anticipated price risk limits commercialisation processes of a wider range of crops. However, for an established typically commercial horticulture, farmers seem to have devised ways of managing market risks from long experiences and linkages with trading actors in the supply chain. For the general crop subsector, interventions to reduce market risk may include improving efficiency of market linkages and transparency through better roads and communication infrastructure.
Location in areas with a good road network better road access ensures efficient market linkages and high-speed exchange logistics. These market features promote commercialisation processes.
Drivers of participation in commercial horticulture
The commercialisation of crop sub-sector was mostly characterised by commercial horticulture involving production of irrigated vegetables. This prompted us to identify what factors underlie the decision to participate in commercial horticulture and the level of participation in terms of acreage under commercial vegetable production.
Gender of household head had a significant negative relationship with the joint to participate in commercial vegetable production and at what cultivation scale to operate. The households headed by women had a limited access to irrigable land for vegetable production.
The amount of operated land explained significantly the level of expansion of irrigated commercial vegetables, but not the decision to engage in growing any vegetables.
This means, farmers with limited access to land can still participate in vegetable production but on a lesser scale.
Financial assets/liquidity was an important positive driver of joint decision to participate in and expand irrigated vegetable production, as well as an independent decision to increase the scale of vegetable production. Farmers with a relatively better hold on finances will have the capital needed to buy inputs mainly fertiliser and hire irrigable plots for those owning none.
Location standing for physical access to a good road was a critical positive determinant of the decisions to venture in commercial horticulture production. Most of vegetables are perishable hence access to good road will stimulate growth of the sector due to efficient market linkages
Perceived market risk did hinder the decision of engaging in and expanding the scale of commercial horticulture. Risk tends to undermine decisions when the subject lacks means of managing it. Vegetables growers in the study villages have decades of growing and marketing vegetables, in this sense they are used to do business under uncertainty.
Membership in associations enhanced participation and increased scale of vegetable production. Social networks serve as platforms for knowledge and information exchange, and co-innovations. Some farmers relied on other farmers as a channel of receiving market information. Most households (45% i.e. 36/81) with affiliation to social groups had such ties in Water User Associations (WUAs). These are important associations that manage irrigation water including mediation of water related disputes.
Crop diversification increased in the same direction with decisions of farmers to participate in and expand production of commercial vegetables. The motives of growing commercial vegetables appear not to have compromised the production of food crops. Farmers seem to be maintaining a crop mix entailing the staples and typical commercial crops such as vegetables. As opposed to specialisation, diversification renders an increase in the scope of produce range that may respond to market requirements.
4.2. Relation of findings to literature and expectations, and policy implications
Strategic provision of the basic public goods to advance commercialisation of African small farms: The commercialisation of smallholder farming in Africa holds the promise of raising farm incomes, generating further rural development through employing more labour and through economic multipliers as farmers spend enhanced incomes, and generally contributing to rural poverty reduction without compromising food security. Realisation of such development endeavours
Working Paper 072 www.future-agricultures.org43
requires strategic provision of basic public goods. Such goods include transport and communication facilities, technologies and working institutions.
Access dynamics of major factors of production: The rural markets of land and labour would evolve as small farms commercialise. Rental arrangements will dominate the land access and practices of labour hiring will blend in diverse ways with usage of family labour. In this study we found that majority of farmers do access irrigable land via rental practices. There is evidence that access to irrigable land is gendered against farming households headed by women. Normally, women are the disadvantaged groups as they are, more often than not, denied ownership to land by the institutions of the society. The use of hired labour is also growing without much evidence of the presence predominantly wage proletariats within commercialising agrarian communities. Farming households do hire and get hired depending on circumstances such as sake of quick earnings.
Commercialising while diversifying – the culture of African small farms: More often than not commercialisation has been seen as a linear process whereby households specialise as they climb the ladder of commercialisation. Our case study has demonstrated that commercialisation may go hand in hand with diversification. Three reasons explain this: an aversion to higher risks that could arise from relying on a single crop for income; a desire to exploit a diversified demand for produce; and the importance for many small farmers of continuing to produce a large share of staples for home consumption.
What has led to commercialisation? Generally, two broad factors stand out: on the demand side, profitable prices and good access to output markets; and, on the supply side the diffusion of improved technology and access to factor markets— both of which, of course, may be the result of both farm-level private initiatives and public interventions. A range of other micro-level factors have worked together with such demand and supply factors to drive commercialisation processes. These include: local institutions governing marketing and management of productive resources such as agricultural water; working rural land and labour markets; and locally mobilised finances amid rural micro-finance failures.
The advent of mobile phones has yet to change either the way of doing business or institutional functionality. Exchanges are still spot deals concluded on cash payments; where some prior commitments are part of the deals such as input credit, mutual trust remains to be basis of engagement.
If these are the main drivers, there can be obstacles and brakes to commercialisation which, if addressed, can take the small farms to new heights as successful commercial entities. These can loosely be categorised as market failures and inadequate provision of basic public goods. The lacking key public goods include: quality roads, government supported micro-finance schemes, irrigation and extension. The market failures entail: absence of market institutions limits the scope
of exchange among parties unfamiliar to each other; inefficient output and factor markets including capital markets; and market imperfections mainly due to information asymmetry. It is, however, not clear that these failings constitute absolute barriers to innovation and investment: even with such failures, there is plenty of innovation and investment to observe. For example, the informal market institutions have sustained the onion supply chain at a profitable level in remote villages where the trading risk would have failed the marketing system. However, majority of farmers still perceive problems related with factor and output markets.
There is widespread suspicion that traders exercise monopoly power to depress prices paid to farmers. Again, there is much less evidence that this is the case, especially when studies take into account the high costs of transport and the risks run by many traders.
Who commercialises? Processes of commercialisation are uneven: although higher prices, improved market access and agricultural innovations may allow commercialisation in a particular zone, the response to these stimuli will vary across individual farms. This should not surprise, since even within areas where smallholdings dominate, there can be substantial differences between farm households in access to land, capital, labour, and to knowledge and skills — that is, variations in assets, broadly defined.
How do commercialising small farms interact with larger-scale businesses in supply chains? Three different perspectives can be seen. In the past, Marxian theories stressed that commercialisation would lead to class differentiation, with exploitation and immiseration of the peasantry who might retain the means of production, but who would suffer on the terms of exchange in markets. While those Marxian approaches may be out of favour, similar arguments underlie some of the concerns over the impacts of globalisation.
Another approach, following Chayanov, has stressed the distinctive character of peasant economy, seeing it as remarkably resilient when faced by the forces of capitalism and the market. That, of course, may not be desirable if it means foregoing potential benefits from investment and specialisation.
The third approach is that of neo-liberal economics which dominates contemporary thinking about smallholder commercialisation. In this the small farm is the same as any other small enterprise. Investment and innovation should lead to higher returns, higher incomes, and overall enhanced welfare. Such dimensions have been somewhat proven in our case study. However, the main policy concern here for wider socio-economic benefits of commercialisation is how to deal with market failures and public goods deficits.
Outcomes from commercialisation of small farms: Our case study has shown that farmers are gaining higher returns to land and labour from commercialised crops. Even the assets of poor households are earning
Working Paper 072 www.future-agricultures.org44
commendable levels of income from commercialised crops. This signifies the potential of commercialisation of small farms in reducing income poverty, a phenomenon of rural Africa.
Intensifying commercialisation creates jobs in the local rural economy, to the benefit of the landless and marginal farmers unable to take full advantage of the opportunities of commercialisation. Our case study has shown a growing hired labour market across villages where farmers hire and get hired.
But concerns are frequently voiced over the potential drawbacks from commercialisation. A frequently voiced concern is that growing cash crops may reduce household food security. Our case study has shown that with growing commercialisation practices the local farming systems transform in a way that ensures local food security. This is achieved in two ways: commercialising farmers also grow staples; and some farmers grow staples that are sold locally to neighbours who entirely grow commercial crops. Most of the commercialising households had fewer months of self-provisioning in terms of major staples than those less commercialised. Seemingly, the local agri-food systems worked to ensure food access as there was either no chronic food shortage reported or food imports into the villages.
Commercialisation of small-scale farming can increase risks, most clearly that of prices of output being lower than expected in the market, as well as risks in prices and supply of inputs, and in the technical challenges when the crop is novel. Higher risk could mean calamity, including having to sell the farm to cover bad debts. Our case study indicates that generally farmers perceived less production and market risks as they envisioned more stable futures.
More commercial production could mean greater harm to the environment. Our case study did not identify any significant threat to the environment. The farming communities realised the importance of conserving the catchments. However, the extent of conservation they can affect is limited, as the vast catchments fall outside their village boundaries. This calls for basin-wide catchment conservation interventions. Nevertheless, there is still a potential risk of pollution from use of fertilisers and pesticides in producing commercial vegetables. Such risk of water pollution is not only a concern of downstream users but also the communities themselves that use the same irrigation water for domestic use and watering animals.
4.3. Areas for further research
Three areas that were not at all or adequately addressed by our case study that stand out as focal research areas include: collective actions in water user associations; social differentiation in the commercialisation process, and the local agri-food systems in commercialising villages.
4.3.1. Collective actions in WUAs
Cooperation matters particularly in managing shared resources among small farmers. It also improves the market stake of weak actors as they interact with other informed and resourced market actors. The history of Tanzanian cooperative movement, which was dominated by marketing activities, is characterised by failures. This has made collective actions unpopular in most of smallholder initiatives, particularly marketing.
However, the WUAs in the study villages have demonstrated to be effective in managing irrigation water. No cooperative initiative was sought in the area of marketing as engagement with traders remained personalised. Some overarching questions include: what made farmers cooperate in managing water but negated the practice at a marketing stage? What can be learned from the performance and conduct of WUAs for informing the possibility cooperation in other areas such as collective marketing?
4.3.2. Commercialisation and social differentiation
Access to irrigable land seems to be major factor of successful commercialisation, particularly of commercial horticulture. The irrigable land is a twofold resource combining water and land. Our findings suggest the existence of gender based differential access to irrigable land. Women-headed households tended to have less access to irrigable land for commercial horticulture compared to their counterpart men-headed households. It is possible that differential access to irrigable land spans beyond the gender frontier to envisage other forms of social differentiations. These include social dimensions such as age (e.g. youth/old), migration status (e.g. native/immigrants), income (e.g. rich/poor) and occupation (e.g. farm/off-farm).
Some pressing questions regarding this topic include: what are institutional structures and dynamics that determine access to key productive resources (land and water) in the commercialised crop sub-sectors? Are there windows of possibility of redressing resource access inequality? And where do these lie between the institutions of the community and institutions of the state? How does such socially structured resource access translate into differential impacts on commercialisation outcomes?
4.3.3. Local agri-food systems in commercialising villages
Food security threat is one among the externalities small family farms commercialise. This could be due to giving up subsistence food staples in favour of commercial crops. Our study has indicative findings suggesting that the commercialisation pathways taken by farmers in the villages tended to maintain the local
Working Paper 072 www.future-agricultures.org45
food security. However, there is still much to research on regarding how the local food supply chain (agri-food system) is operating and is structured. What are the spatial and temporal flows of food in and outside the villages? How have commercialisation trajectories shaped the local food system in terms of mix of food crops, allocation of factors of production in the crop sector and food preferences?
END NOTES** Sokoine University of Agriculture, Morogoro,
Tanzania.
* Overseas Development Institute, London
1 http://www.tzonline.org/pdf/tenpillarsofkilimokwanza.pdf
2 http://www.maep.gov.mg/eg/africafertilizer.htm
3 http://www.warda.cgiar.org/publications/Rice%20Trend%2023-10-07.pdf
4 Potential access refers to respondent’s self-assessment his/her ability to access formal credit. This underscores the overall creditworthiness of the household.
5 Food crops considered include cereals, legumes, and roots & tubers
6 This simply means, while we observed a predictor variable we did not observe the outcome variable, a phenomenon called “censoring” in econometrics. Farmers with a commercialisation index of “0” are taken as not commercialising, so long as we observe the predictors of commercialisation for them, we do not know how “close” they are to commercialising. Empirically, this means the zeros or limit observations are separated from the non-zero (continuous) or non-limit observations. The censoring problem is extensively explained in literature (see Greene, 2002; Gujarati, 1995; Goetz, 1995). The Tobit model has been used extensively in studies investigating commercialisation, and technology adoption decisions and diffusion (Sindi, 2008; Alene et al., 2006, Manyong et al. 2006; Peter et al., 2000).
References
Alene, A.D., Manyong, V.M. (2006). ‘Testing Farmers’ Cropping Decisions and Varietal Adoption Behavior: the Case of Cowpea Producers in Northern Nigeria,’ Journal of Agricultural and Food Economics. 1(1): 1-15.
Binswanger-Mkhize, H.P., McCalla, A.F., Patel, P. (2009). Structural Transformation and African Agriculture. Africa Emerging Markets Forum. Western Cape, South Africa.
GRAIN, (2008). Seized: The 2008 Land Grab for Food and Financial Security (GRAIN Briefing), from http://www.grain.org/go/landgrab
Burton, M., Rigby, D. (2009). ‘Hurdle and Latent Class Approaches to Serial Non-Participation in Choice Models,’ Environ Resource Econ, 42:211–226.
CAADP. (2005). CAADP summary prepared by the NEPAD secretariat for the Southern Africa regional implementation planning (RIP) meeting in Maputo, Mozambique, February 15th- 18th 2005.
Collier, P., Dercon, S. (2009). ‘African Agriculture in 50 Years: Smallholders in a Rapidly Changing World?’ FAO Expert Meeting on How to Feed the World in 2050, 24-26 June 2009. Rome. Italy.Cotula, L., Nat, D., Vermeulen, S. (2008). Fueling Exclusion, ‘The Biofuel Boom and Poor People’s Access to Land,’ International Institute for Environment and Development, and FAO.
Cragg J.G. (1971). ‘Some Statistical Models for Limited Dependent Variables with Application to the Demand for Durable Goods,’ Econometrica, 39, 829-844.
De Putter, H. Van Koesveld, M.J., De Visser, C.L.M. (2007). Overview of the Vegetable Sector in Tanzania.
Dina, U. (2006). Linking Small Farmers to the Market. Agriculture Economist for the South Asia Region. World Bank.(http://www1.worldbank.org/devoutreach/article.asp? id).
Dorward, A., Chirwa, E. (2011). ‘The Malawi Agricultural Input Subsidy Programme: 2005/06 to 2008/09,’ International Journal of Agricultural Sustainability, 9:1, 232-247.
Dorward, A., Chirwa, E. Boughton, D. Crawford, E. Jayne, T., Slater, R. Kelly, V. and Tsoka, M. (2008). ‘Towards ‘Smart’ Subsidies in Agriculture? Lessons from Recent Experience in Malawi,’ Natural Resource Perspective 116, ODI, UK.
Dorward, A., Kydd, J., Morrison, J., Urey, I. (2004). A Policy Agenda for Pro-Poor Agricultural Growth, World Development, 32 (1): 73–89
Doward, A., Poole, N., Marrison, J., Kydd, J., Urey, I. (2003). ‘Markets, Institutions and Technology: Missing Links in Livelihood Analysis,’ Development Policy Review 21(3): 319-332.
Eskola, E. (2005). Agricultural Marketing and Supply Chain Management in Tanzania: A Case Study. Working paper series No. 16.
Filmer, D. Pritchett, L. (2001). ‘Estimating Wealth Effects without Expenditure Data--or Tears: An Application to Educational Enrolments in States of India.’ Demography, 38(1):115-32.
Gebremedhin, B., Swinton, S.M. (2003). ‘Investment in Soil Conservation in Northern Ethiopia: The Role of Land Tenure Security and Public Programs,’ Agricultural Economics, 29: 69-84.

Working Paper 072 www.future-agricultures.org46
Goetz, S.J. (1995). Markets, Transaction Costs, and Selectivity Models in Economic Development. In: Prices, Products and People: Analyzing Agricultural Markets in Developing Countries. Scott, G.J. (ed.). Lynne Rienner Publishers, Inc., London. pp. 383-402.
Greene, W.H. (2002). Econometric Modelling Guide. LIMDEP Version 8.0, Vol. 2. Econometric software, Inc., New York, E21-120.
Gujarati, D.N. (1995). Basic Econometrics. McGraw-Hill, Inc. USA.Heckman, J. J. (1979). ‘Sample Selection Bias as a Specification Error,’ Econometrica, 47, 153-161.
Hillocks, R.J., Madata, C.S., Chirwa, R., Minja, E.M., Msolla, S. (2006). Phaseolus Bean Improvement in Tanzania, 1959-2005. Springer 2006.
Jayne, T. S., J. Govereh, A. Mwanaumo, J.K. Nyoro, Chapoto, A. (2002). ‘False Promise or False Premise? The Experience of Food and Input Market Reform in Eastern and Southern Africa,’ World Development, 30 (11), 1967–1985.
Juma, C. (2011). New Harvest: Agricultural Innovation in Africa. Oxford University Press.
Kaliba, A.R.M., Verkuijl, H., Mwangi, W., Mwilawa, A.J.T., Anandajayasekeram, P., Moshi, A. J. (1998). Adoption of Maize Production Technologies in Central Tanzania. Livestock Production Research Institute, Mpwapwa, Tanzania. http://www.tanzaniagateway.org/docs/adoption_of_maize_production_technologies_in_central_tanzania.pdf
Lashgarara F., Hosseini, J.F., Mirdamadi, M. (2008). Information Technology and Rural Marketing. Case Study in Iran.
Leavy, J., Poulton, C. (2007). ‘Commercialisations in Agriculture,’ Ethiopian Journal of Economics, Vol. XVI, No. 1.
Lin, T., Schmidt, P. (1984). ‘A Test of the Tobit Specification against an Alternative Suggested by Cragg,’ The Review of Economics and Statistics, 66(1): 174-177.
Lynch, K. (1994). ‘Urban Fruit and Vegetable Supply in Dar es Salaam,’ The Geographical Journal, Vol. 160, No. 3. (Nov., 1994), pp. 307-318.
Lyon, F., Porter, G. (2007). ‘Market Institutions, Trust and Norms: Exploring Moral Economies in Nigerian Food Systems,’ Cambridge Journal of Economics 2009, 33, 903–920.
Manyong, V.M., Okike, I., Williams, T. O. (2006). ‘Effective Dimensionality and Factors Affecting Crop-Livestock Integration in West African Savannas: A Combination of Principal Component Analysis and Tobit Approaches,’ Agricultural Economics. 35: 145-155.
Morris, S.S., Carletto, C., Hoddinott, J., Christiaensen, L.J.M. (2000). Validity of Rapid Estimates of Household Wealth and Income for Health Surveys in Rural Africa. J. Epidemiol. Community Health, 54:381–387.
Mutabazi, K., Wiggins, S., Mdoe, N. (2010). ‘Informal Institutions and Agriculture in Africa. Cell phones, Transaction Costs & Agricultural Supply Chains: The Case of Onions in central Tanzania,’ Manchester & Morogoro: IPPG Discussion Paper 49
Newman, C., Henchion, M., Matthews, A. (2001). ‘Infrequency of Purchase and Double-Hurdle Models of Irish Households’ Meat Expenditure,’ European Review of Agricultural Economics, 28(4): 393-412.
Peter, A.C., Escobar, M., Kopec., J.A. (2000). ‘The Use of the Tobit Model for Analyzing Measures of Health Status,’ Journal of Quality of Life Research. Volume 9, Number 8. September 2000.
Pingali, P.L., Rosegrant, M.W. (1995). ‘Agricultural Commercialisation and Diversification: Processes and Policies,’ Food Policy, 20(3):171-185.
Poulton, C., Kydd, J., Dorward, A. (2004). Overcoming Market Constraints to Pro-Poor Agricultural Growth in Sub Saharan Africa. A Paper prepared for the Africa Commission, November 2004, Imperial College London
Rahut, D., Castellanos, I .V. , Sahoo, P. (2010). Commercialization of Agriculture in the Himalayas. Institute of Developing Economies (IDE), Discussion Paper No. 265, Chiba, Japan.
Sharma, V.P. (2006). Cyber Extension: Information and Communication Technology (ICT) Application for Effective Agricultural Extension Services – Challenges, Opportunities, Issues and Strategies. In: Enhancement of Extension Systems in Agriculture. Published by the Asian Productivity Organization, Tokyo.
Sindi, J.K. (2008). Kenya’s Domestic Horticulture Subsector: What Drives Commercialization Decisions by Rural Households? MSc thesis (unpl.), Michigan State University, USA.
Skarstein, R. (2005). ‘Economic Liberalization and Smallholder Productivity in Tanzania. From Promised Success to Real Failure, 1985–1998,’ Journal of Agrarian Change, 5(3): 334-362.

Working Paper 072 www.future-agricultures.org47
Strasberg, P., Jayne, T.S., Yamano, T., Nyoro, J., Karanja, D., Strauss, J. (1999). Effects of Agricultural Commercialization on Food Crop Input Use and Productivity in Kenya. Policy synthesis for USAID – African Bureau Office of Sustainable Development . http : //en.sc ient i f iccommons.org/38221726.
Tobin, J. (1958). ‘Estimation of Relationships for Limited Dependent Variables,’ Econometrica, 26, 24-36.
URT-United Republic of Tanzania. (2010a). ‘National Strategy for Growth and Reduction of Poverty (NSGRP) II.’ Ministry of Finance and Economic Affairs. Dar es Salaam.
URT-United Republic of Tanzania. (2010b). ‘The Economic Survey 2009.’ Ministry of Finance and Economic Affairs. Dar es Salaam.
World Bank. (2007). World Development Report 2008: Agriculture for Development, the World Bank.
World Bank. (2008). Non-tariff Measures on Goods Trade in the East African Community. Synthesis Report, No. 45708-AFR. Washington D.C., USA.
World Bank. (2009. Awakening Africa’s Sleeping Giant: Commercial Agriculture in the Guinea Savannah and Beyond, Washington DC.

Working Paper 072 www.future-agricultures.org
This Working Paper was written by Khamaldin Mutabazi, Steve Wiggins and Ntengua Mdoe for the Future Agricultures Consortium. The FAC Working Paper series publishes work in progress by FAC members. All papers are technical research papers which have been peer reviewed, and are available in open access format. The series editor is Beatrice Ouma. Further information about this series of Working Papers at: www. future-agricultures.org
The Future Agricultures Consortium aims to encourage critical debate and policy dialogue on the future of agriculture in Africa. The Consortium is a partnership between research-based organisations across Africa and in the UK. Future Agricultures Consortium Secretariat at the University of Sussex, Brighton BN1 9RE UK T +44 (0) 1273 915670 E [email protected]
Readers are encouraged to quote or reproduce material from Future Agricultures Briefings in their own publications. In return, the Future Agricultures Consortium requests due acknowledgement and a copy of the publication.
The views expressed do not necessarily reflect the UK Government’s official policies.
Funded By
Related Documents