TT 478/10 Best Management Practices for Smallholder Farming on Two Irrigation Schemes in the Eastern Cape and KwaZulu-Natal Through Participatory Adaptive Research PNS Mnkeni, C Chiduza, AT Modi, JB Stevens, N Monde, I van der Stoep & R Dladla

Welcome message from author
This document is posted to help you gain knowledge. Please leave a comment to let me know what you think about it! Share it to your friends and learn new things together.
Transcript
TT 478/10
Best Management Practices for Smallholder Farming on Two Irrigation Schemes in the Eastern Cape and
Kwazulu-Natal Through Participatory Adaptive Research
PNS Mnkeni, C Chiduza, AT Modi, JB Stevens, N Monde, I van der Stoep & R Dladla
TT 478/10 Best Managem
ent Practices for Smallholder Farm
ing on Two Irrigation Schem
es in the Eastern Cape and Kwazulu-Natal Through Participatory Adaptive Research
BEST MANAGEMENT PRACTICES FOR SMALLHOLDER FARMING ON TWO IRRIGATION SCHEMES IN THE
EASTERN CAPE AND KWAZULU-NATAL THROUGH PARTICIPATORY ADAPTIVE RESEARCH
PNS Mnkeni, C Chiduza, AT Modi, JB Stevens, N Monde, I van der Stoep & R Dladla
Report to the Water Research Commission
by
University of Fort Hare
WRC Report No. TT 478/10
DECEMBER 2010
ii
Obtainable from: Water Research Commission Private Bag X03 Gezina 0031
The publication of this report emanates from a project entitled Best management practices for small scale subsistence farming on selected irrigation schemes and surrounding areas through participatory adaptive research (WRC Project No. K5/1477)
DISCLAIMER
This report has been reviewed by the Water Research Commission (WRC) and approved for
publication. Approval does not signify that the contents necessarily reflect the views and policies of the WRC, nor does mention of trade names or commercial products constitute endorsement or
recommendation for use.
ISBN 978-1-4312-0059-7 Printed in the Republic of South Africa
iii
EXECUTIVE SUMMARY
PROJECT BACKGROUND
This WRC project (K5/1477//4) entitled ‘Best Management Practices for Smallholder Farming on two
Irrigation Schemes and Surrounding Areas in the Eastern Cape and KwaZulu-Natal Through Participatory
Adaptive Research’ was commissioned by the Water Research Commission in 2004. Its main objective
was to carry out research in Zanyokwe and Tugela Ferry irrigation schemes with a view to develop and
implement technologies and knowledge useful for farmers in order to improve their livelihoods and those
of surrounding communities. The project was a collaborative undertaking by five institutions namely: the
Universities of Fort Hare, KwaZulu-Natal, Zululand (which withdrew in 2006), and Pretoria, as well as
Zakhe Agricultural Training Institute. It was conducted in the form of two case studies based in Zanyokwe
Irrigation Scheme (ZIS) which uses sprinkler irrigation and Tugela Ferry Irrigation Scheme (TFIS) which
uses a short-furrow irrigation system. The University of Fort Hare team was responsible for work in ZIS as
well as coordinating the entire project.The KwaZulu-Natal team was responsible for work in TFIS. The
University of Pretoria team provided engineering and irrigation water management expertise to the
resident research teams at the two schemes.
Participatory research methodologies were employed where the smallholder farmers and other
stakeholders were involved in project activities from the initial stage to the end. During year one of the
project a detailed situation analysis was carried out at the two selected irrigation schemes to determine
the reasons for their poor performance through participatory analysis and evaluation of the social
organization, institutional framework, infrastructure, natural resources, markets, livelihoods and farming
systems. This was followed by a stakeholder workshop held in Pietermaritzburg in August 2005. The
workshop discussed the findings of the situation analysis and identified four key constraints at the two
schemes that needed to be addressed in order to achieve increased productivity. These were weak or
poor institutional arrangements, lack of stable markets, dysfunctional irrigation infrastructure, and poor
crop management. An action research program was then developed, aimed at gaining a better
understanding of the underlying causes of the constraints and ways to address them. A summary of the
project findings is presented hereunder.
WEAK INSTITUTIONAL AND ORGANISATIONAL ARRANGEMENTS
The situation analysis conducted at the beginning of this project in 2004 revealed that most of the
problems at ZIS and TFIS were institutional and related to governance of the schemes. Both schemes
had very weak organisational and institutional arrangements. Therefore, any revitalization of the schemes
hinged first and foremost on the strengthening of farmer organisations at both schemes. The
organisational structure at ZIS was the Zanyokwe Agricultural Development Trust (ZADT) while at TFIS
iv
farmers in each of the seven blocks were organised into farmers’ associations affiliated to a scheme-wide
umbrella committee. Both organisations were largely ineffective and did not ably discharge their
responsibilities, which negatively affected productivity and overall performance of the two schemes.
The ineffectiveness of the farmer organisations was partly attributed to the fact that the organisations
were trying to manage all issues at the schemes, i.e. the water, land, and infrastructural issues as well as
farming related activities like mechanization, procurement of inputs and lobbying for produce markets,
contrary to an established best practice of having separate management of infrastructure and farming
related matters. To address this shortcoming, the project team worked with DWAF to form Water Users’
Associations (WUAs) at both schemes to specifically deal with the management of water and
infrastructure functions. For the management of farming related activities in ZIS, four primary
cooperatives were registered and two were at advanced stages of registration at the termination of the
project. In addition, a central Farmers’ Cooperative for ZIS was established to take the place of ZADT
which had to be disbanded due to its ineffectiveness. In Tugela Ferry, a decision was taken to revive the
defunct Msinga Vegetable Producers Cooperative (MVEPCO), to serve as the umbrella body responsible
for managing the farming related functions. The main responsibilities of the central co-op in ZIS and
MVEPCO in TFIS are to organise markets for various products, purchasing inputs as well as to solve
problems experienced by primary co-operatives. These organisational structures were in formative stages
at the time project activities terminated, so their long-term impact will depend on conclusion of the
formative processes and ensuring their continuation.
Land tenure was a major institutional challenge at the two schemes. It was particularly serious in
Zanyokwe where insecure land tenure arrangements are limiting access to land and undermining interest
and commitment to farming. Zanyokwe has at least 3 types of tenure systems: freehold (landowners),
quitrent (pay rent to magistrate) and right to occupy (communal under traditional leadership). Farmers on
quitrent and ‘right to occupy’ land tenure arrangements have no sense of ownership and hardly invest in
new technologies. While the project team tried to address the problem during the lifespan of the project,
no headway was made in solving it by the time project activities were terminated. There is thus an urgent
need to develop policy on land tenure that would favour those interested and capable of farming so as to
improve on productivity and overall scheme performance.
SOCIO-ECONOMIC CONSTRAINTS
Farmers at both ZIS and TFIS cited lack of capital and stable markets as major socio-economic problems
at the schemes. The lack of capital is due to the fact that most households in Zanyokwe and Tugela
Ferry earn incomes below the poverty line and thus have limited capacity to invest in their farming
enterprises. To compound the problem, they also have limited or no access to credit because credit
v
facilities tend to be available from big and well-structured financial institutions that do not cater for small
scale producers allegedly because of the prohibitive cost of managing many small loans. In addition, they
also lacked the security and collateral required by these financial institutions. This means that farmers
cannot invest in necessary farming inputs or hire labour, which inevitably affects their productivity. Farmer
organisations at the schemes need to explore ways of accessing credit facilities through micro-finance
institutions that are better equipped to serve clientele without the security and collateral required by
bigger financial institutions.
Lack of stable markets was singled out as significantly contributing to poor scheme performance at both
ZIS and TFIS, and therefore an important leverage point in improving performance at the schemes. The
underlying causes for the market instability included poorly organised markets, unsatisfactory marketing
services provided by middlemen, informal marketing contracts, lack of pricing standards and poor state of
infrastructure related to marketing (roads, storage facilities, etc.). Analysis of the different weaknesses in
the marketing process led to the participatory adoption of a two-pronged strategy for addressing the
marketing problems. This involved the immediate addressing of problems whose causes were known
followed by a study to unravel the less understood causes. One action that was immediately taken was
the strengthening of management structures of both schemes as articulated above. The strengthening of
farmer organisations gave farmers the collective strength they needed to influence markets to their
advantage. This intervention has started to bear fruit in that a major change in the area of marketing was
observed whereby the number of farmers involved in collective action marketing in Zanyokwe improved
from less that 20% in 2005 to 83% in 2008.
The marketing study revealed that production at both schemes was not informed by demand and quality
standards were not adhered to. The project intervened by conducting capacity building workshops at both
schemes which, coupled with a number of ‘look and see’ visits to different market outlets, helped farmers
appreciate the importance of: (i) market-linked crop production planning; (ii) careful planning of production
to ensure regular supplies and avoid surpluses; (iii) grading and good produce quality in achieving good
prices and regular sales; (iv) knowledge of alternative marketing channels; and (v) market information
including times of the year when different products fetch higher prices at the market. In response to these
interventions, farmers have started adopting cropping patterns that reflect market demands and their
production is now generally profit driven. In the case of ZIS, farmers have shifted emphasis from grain
maize to more butternut and green maize production because these products fetch higher prices. They
also perform extra marketing functions such as grading of butternut, which is earning them higher prices.
A secondary benefit is that as a result of the profit drive sparked by better and profitable marketing
arrangements there is increasing interest among farmers to learn improved crop husbandry practices so
as to produce more and improve profits.
vi
INFRASTRUCTURAL AND WATER MANAGEMENT CONSTRAINTS
The water use studies at the two schemes focussed on two things: (i) the infield irrigation systems and (ii)
in-field irrigation management. An audit of the in-field irrigation infrastructure revealed that both ZIS and
TFIS were experiencing a number of infrastructural problems. Problems at ZIS included missing hydrant
pipes, leaking sub-main pipes, uneven stand pipes and malfunctioning valves in certain parts of the
scheme. Farmers also lacked skills to do system trouble shooting as well as basic equipment and system
maintenance. The TFIS had problems with the water canals, which were not regularly repaired and
maintained. These problems seemed to be partly a result of the fact that the decisions to form the
schemes and their implementation were top down and farmers had limited or no say. Subsequently, no
effort was made at both schemes to capacitate farmers to a point where they could claim ownership of
the infrastructure and consider it their responsibility to maintain it. This needs to be done if sustainability
of the schemes is to be achieved.
The in-field water management work at ZIS involved installing and monitoring responses to wetting front
detectors (WFDs) at two farms. The responses of the detectors recorded at the two farms clearly reflected
differences in the soils at the two farms. At both farms the shallow detectors responded most of the time
while the deep detectors responded only occasionally after irrigation or a rainfall event of more than
20 mm. These results indicated that WFDs can help to make irrigation management tangible and realistic
to farmers and extension officers. Observations made during the summer season indicated that the
current irrigation scheduling at Burnshill-East of approximately 9 mm of irrigation applied every four days
to the crop was inadequate to meet peak water requirement of cabbage and butternut. The results also
revealed that farmers needed to be assisted to align irrigation scheduling with the water requirements of
the crops and the irrigation equipment available.
In-field water management by the farmers at the Tugela Ferry Scheme was done through irrigation
system evaluations and irrigation monitoring with wetting front detectors. Results obtained indicated that
water was applied inefficiently to crops, particularly with regard to distribution uniformity. This could affect
crop yield as crops may in some cases be under-irrigated and in other cases over-irrigated, leading to low
irrigation efficiencies and water loss. Water allocation among farmers was also found to be a problem as
some farmers used larger volumes compared with others, making the water less available to other
farmers. The results also indicated a need for the maintenance and cleaning of sub-canals to be
scheduled such that all farmers utilising a certain sub-canal clean or do maintenance at the same time for
the whole sub-canal, not just in front of their own plots. This would minimise instances where a farmer
clears his portion but in the end the volume of water reaching his/her plot is minimal.
vii
A cost benefit analysis of using balancing dams located at block 4 of TFIS was undertaken to determine if
money would be saved if the pump was operated during the night to fill the balancing dams, from which
irrigation could then take place during the day. The scenarios compared were: 1. The current situation –
water is pumped from 06:00 to 15:00, Monday to Friday, 2. Water is pumped from 06:00 to 15:00,
Monday to Saturday, and 3. Water is pumped from 22:00 to 07:00, Monday to Friday, and 4. The current
situation (scenario 1) but using a diesel engine to drive the pump (diesel price = R10/litre). The results
showed that the current practice (scenario 1) had the highest unit cost of electricity (R0.40/kWh) while
scenario 3 had the lowest cost per unit of electricity (R0.22/kWh), which could result in an annual
electricity cost saving of R26489.51. The use of diesel as an alternative energy source proved to be
completely unaffordable at R3.85/kWh.
Generally, work done at the two schemes revealed that there is plenty of scope to increase water
productivity at Tugela Ferry and Zanyokwe irrigation schemes. Addressing the identified infrastructural
needs and ensuring that irrigation water is available and effectively distributed through the irrigation
scheme should be given top priority. The second priority should be to introduce user friendly irrigation
scheduling tools like the wetting front detector, which helps the irrigator to decide when and how long to
irrigate.
AGRONOMIC CONSTRAINTS
The situation analysis showed that both cropping intensities and crop yields were low at ZIS and TFIS,
but the situation was worse in ZIS. Therefore, among other things, this project sought to answer the
question whether an improvement in agronomic management of crops would result in higher productivity
levels despite the state of irrigation infrastructure and other constraints. Constraint analysis showed that
the main agronomic factors constraining productivity were basic management practices such as weed,
water, fertiliser and plant population management, late planting, and choice of cultivars, all of which were
within the farmers’ abilities to control. When these issues were addressed by the project team yields
improved substantially as summarized below for the two schemes.
Technological options for addressing agronomic constraints at ZIS
Exploratory trial on the effect of planting time, fertiliser rate, plant population and variety on maize (Zea
Mays L.) grain yield at ZIS: This study was conducted to explore issues that needed research attention at
ZIS with a view to provide a basis for guiding the agronomic research agenda. The results showed that of
the four factors tested, planting time, followed by N rate, were the most important factors determining
grain yield in Zanyokwe. Higher yields were obtained when maize was planted early and fertilised at 250
kg N ha-1. The short-season cultivar, DKC 61-25, yielded optimally when grown early at 90 000 plants ha-1
whilst the long-season cultivar PAN 6777 performed better at 40 000 plants ha-1. PAN6777 was more
sensitive to reduced rates of N fertilisation than DKC61-25. Generally, new hybrids yielded 50 to 65%
viii
more than the cultivars commonly grown by farmers. These results clearly indicated that low crop
productivity at ZIS was partly a result of inappropriate agronomic practices. Although the focus of the
research was on dry grain maize, interaction with farmers revealed that they were more interested in
green mealies, hence the subsequent studies focussed on green maize production.
Effect of row spacing and post-emergence reduced dosages of atrazine on weed growth and maize (Zea
mays L.) yield in Zanyokwe irrigation scheme, Eastern Cape: The objective of this study was to determine
the relationship between row spacing and herbicide dosage on weed dynamics and on green and grain
maize yield. The results obtained demonstrated the possibility of incorporation of reduced herbicide
dosages (RHDs) and narrow rows in small-scale farming systems as an integrated weed management
strategy. However, this will depend largely on the weed spectrum in a particular locality. Planting maize in
narrower rows than the traditional 0.9 m reduced weed growth and fecundity compared to wider rows.
Integration of narrow rows with reduced herbicide dosages did not result in superior weed control
compared to the use of narrow rows or reduced herbicide dosages in isolation. The results of this study
suggest the possibility of developing a weed management system based on the use of RHDs, to slow
down or stop weed growth soon after application. This strategy will reduce the competitiveness of weeds,
without necessarily killing them, before full ground cover by the crop canopy.
Effect of row spacing and plant population on weed biomass and maize (Zea mays L.) grain yield at
Zanyokwe irrigation scheme, Eastern Cape: The objective of this study was to determine the relationship
between inter-row spacing and plant population on weed biomass and on maize yield. The results
obtained demonstrated that increasing population above farmers’ practice of 40 000 plants/ha to 60 000
plants/ha resulted in more marketable green cobs and up to 30% higher grain yields. Maize yield
response to narrow rows could only be realised when maize was grown at a higher population (60 000
plants/ha in this case), but not at lower populations (40 000 plants/ha in this case). At the higher
population, grain yield increases of up to 11% could be realised with the use of narrow rows. Narrow rows
reduced above ground weed dry matter and hence competition through earlier canopy closure. Plant
population was found to have no effect on weed growth and development. It is recommended that
farmers at ZIS should plant their maize at 60 000 plants ha-1 in narrow rows of 45 cm to reduce weed
competition and optimise maize yield.
Effect of pre-plant weed control, plant density and nitrogen on weed growth and butternut (Cucurbita
moschata Duchesne) yield: The objective of this study was to investigate the relationship between N
rate, population density and pre-plant weed control on weed biomass and butternut yield. Pre-plant weed
control resulted in a six-fold decrease in weed biomass, whereas increasing plant density from 10 000
plants ha-1 to 30 000 plants ha-1 decreased weed biomass by 47%. No marketable fruits were obtained
when planting was done without prior weed control. Yield increased significantly (p < 0.01) with increase
in plant density, and the optimum density was estimated to be 25 000 plants ha-1. Yield increased with N
ix
rate; the rate giving the highest marginal rate of return (MRR) was 120 kg N ha-1, which gave a yield of
26.7 t ha-1. To optimise on butternut yield, population density should be increased from farmer practice of
about 13 000 plants/ha to about 25 000 plants/ha. This study has demonstrated that the low butternut
yields obtained by farmers in ZIS may be attributed to poor weed control, nutrient deficiency and low plant
densities. Of the three factors, pre-plant weed control is the most important factor as it resulted in 100%
marketable yield reduction when not carried out. Pre-plant weed control to kill the first flush of weeds is,
therefore, a prerequisite to successful butternut production.
Comparative response of direct-seeded and transplanted maize (Zea Mays L.) to nitrogen application:
Transplanting can help in achieving a good plant stand which would translate to more green cobs and
higher grain yields. However, there was lack of information on N fertilizer rates for transplanted maize.
Therefore, this experiment evaluated the relationship between nitrogen rate and maize establishment
method (direct seeding vs. transplanting of seedlings) on green and grain maize performance.
Transplanting resulted in a significantly higher crop stand of 96% compared to direct seeding, which
achieved 78%. Transplanted maize had shortened growth duration in the field, reaching flowering stage
11 to 15 days earlier than direct-seeded maize. At low N rates, transplants produced higher green cob
mass, grain yield and longer cobs than direct-seeded maize. The economically optimum N rates required
to obtain marketable cobs were 149 and 98 kg ha-1, whilst those required for achieving optimum grain
yields were estimated at 240 and 227 kg ha-1 with direct seeding and transplanting, respectively. The
findings suggested that transplanted maize could be grown at lower N rates to achieve similar yield
potentials as direct-seeded maize, and that transplanting can help to improve crop stands in areas where
bird damage on emerging seedlings is a problem.
Comparative performance of directly seeded and transplanted green maize under farmer management in
Zanyokwe: Transplanting was shown to be an effective way of increasing maize crop stands in a previous
study. However, the economics of maize transplanting remained unclear especially in smallholder
irrigation schemes where labour availability can be a challenge. This participatory on-farm experiment
was conducted on six farms to evaluate comparative performance of direct-seeded and transplanted
green maize under farmer management, and to work out the economics of transplanting. The results of
this study suggest that transplanting can help in achieving a good plant stand which would translate to
more green cobs and higher returns in areas where bird damage is a problem. Despite the popularity of
transplanting during the execution of the trials, subsequent evaluation indicated that only one farmer
adopted the technology the following season, meaning that the technology might not be suitable in
situation where labour is in short supply as was the case of the study area. In this case, transplanting is
unlikely to succeed unless the labour intensiveness of manual transplanting can be solved. In spite of
this, the overall number of green maize producers in the scheme increased, indicating that farmers are
more comfortable with direct-seeded green maize production. The findings of the study suggest that use
of transplants can result in more timely operations, improved water use efficiency and higher cropping

x
intensities. Since transplanted maize produced longer cobs than direct-seeded maize at the same N rate,
this means that it might a better alternative for smallholder farmers who generally apply low fertiliser rates
to their maize.
Technological options for addressing agronomic constraints at TFIS
Field testing research activities at Tugela Ferry focussed on the development of a market-linked crop
production plan. The main focus of the agronomic work was on building up data on agronomic
management practices for crops selected to be part of the crop production plan for Tugela Ferry. The
crops studied were cabbage, onion, potato, maize and butternut. The findings of the agronomic studies
conducted are summarized below:
Yield determination for cabbage and onion in field trials at Tugela Ferry: The objective of the cabbage
study was to determine the effect of cabbage planting density on crop performance during growth and on
the final yield. Results obtained showed that above average cabbage yields could be realized at Tugela
Ferry with the adoption of the recommended cabbage planting density of 40 000 to 45 000 plants ha-1.
Planting densities that were significantly higher than those recommended for cabbage in South Africa,
caused yield reductions even under high levels of management.
The objective of the onion trial was to determine the optimum seeding rate, transplant size and planting
density for onion production at Tugela Ferry. Results obtained clearly showed that the optimum seedling
size for onion crop establishment is 20 cm (three leaves). Small seedlings (8 cm) performed poorly
possibly due to their relatively smaller photosynthetic area compared to that of the larger seedlings.
Therefore, onions need to be established using large seedlings (having three leaves or 20 cm in length).
Small seedlings are to be avoided as they take longer to establish and may contribute to a large number
of culls (non-marketable bulbs) due to small size.These results clearly demonstrated the importance of
planting density and seedling size for production of cabbage and onion, respectively.
The cabbage and onion trials were also designed to enable comparisons between experimental trials
(managed by master farmers) and farmer-managed crops. The experimental trials indicated what could
be considered as the potential crop yield of the studied crops while farmer-managed trials showed what
could be considered as the average crop yield. The results indicated that crops grown in master farmer-
managed experimental trials performed at a higher level than those grown by regular farmers at Tugela
Ferry who were not directly involved in the researcher trials. This is a remarkable result as it indicated the
ability of farmers to learn and adopt improved crop husbandry practices.
xi
Effect of potato propagule size on yield: The experiment was designed to address farmers’ concerns
about the possible effect of planting material on crop performance after they observed great variability in
seed potato size from the same source. The treatments consisted of two cultivars, BP1 and Up-to-date,
and two average seed sizes 120 g per propagule (range = 95 to 133 g) and 25 g per propagule (range =
17 to 32 g). The results showed that for both cultivars, larger propagules produced higher stand
establishment, with plants displaying greater vigour than those produced with small propagules. The yield
data obtained suggested that seed potato size influenced yield through its effect on plant vigour and tuber
setting.
Maize and butternut response to water conservation: The objective of this study was to determine the
effect of mulch on maize and butternut squash production in Tugela Ferry. The results obtained showed
that mulching improved plant growth and minimised moisture loss. The presence of mulch and weeding,
separately, caused significantly better plant growth than no mulch and no weeding. The application of
mulch improved maize cob size for two cultivars (SR 52 and SC 701) studied, and weed cultivation
minimized the decrease in cob quality caused by weeds, even in the absence of mulch. Furthermore
weed removal improved grain size for both cultivars but the amount of water in the grain was higher in the
presence of mulch compared with the absence of mulch. Generally mulch application improved prolificacy
and yield of both maize and butternut. Cultivar SR 52 had a larger grain size than SC 701, but the latter
had longer cobs with more rows per cob compared with SR 52.
Generally, crop yields attained for potatoes and butternut squash at Tugela Ferry were within the range
expected for these crops in South Africa. However, improved access to irrigation and crop protection
could increase the yields further by eliminating crop losses. Hence, training of farmers on cultural
practices to minimise stresses from diseases and pests, may contribute to increased yield with minimum
water.
ACCESS TO EXTENSION SERVICES
Availability of competent extension service support is critical to the success of farming enterprises,
including irrigated farming systems. The provision of this service is usually the mandate of the
departments of agriculture in the provinces. Observations at the two schemes showed that the
departments of agriculture in the two provinces were providing the service but not at optimal levels. The
reasons for less than optimal extension services varied between ZIS and TFIS. Farmers at ZIS no longer
have their own extension officers, unlike when the project started, because the department of agriculture
introduced the ward system, whereby ZIS together with a number of other villages form ward 10 serviced
by two extension officers. In addition, lack of transport for extension officers continued to prevent
extension officers from interacting more often with farmers. Access to extension services is much better in
xii
Tugela Ferry because the district office of the Department of Agriculture and Environmental Affairs
(DEAE) is located just about 5 km from the scheme and it had four technicians dedicated to the scheme.
The impact of extension services on farming operations at both schemes was also limited by the fact that
extension officers lacked basic technical skills on crop husbandry and irrigation management. This lack of
skills was worse in terms of irrigation management as none of the extension officers at the two schemes
had any formal training in irrigation management, and did not consider its transmission to farmers to be
part of their mandate. Capacity building is, therefore, required in crop husbandry, water management and
other areas of operation and maintenance of irrigation to enable extension officers to provide meaningful
support to farmers.
GENERAL PROJECT IMPACT
The project had a positive impact on the irrigating and non-irrigating communities of Zanyokwe and
Tugela Ferry. The participatory implementation of interventions to address identified constraints related to
institutional arrangements, socio-economic factors, water and crop management factors were to a large
extent successful. This was reflected by improvements in: (i) land use intensity, (ii) crop husbandry
practices such as timely planting, weeding, fertilizer application, choice of crop cultivars, (iii) ability of
some farmers to plan and execute crop trials from which lessons were learnt, (iv) household incomes, (v)
household food security (vi) marketing knowledge and strategies (vii) capacity of farmers and extension
officers to identify problems and solutions, (viii) record keeping by farmers and (ix) farmer institutional
and organisational arrangements.
GENERAL RECOMMENDATIONS
Of the four constraints summarised above, weak institutional and organisational arrangements and poor
crop management practices contributed the most to the underperformance of the two schemes. Weak
institutional/organisational arrangements and lack of strong decisive leadership impacted negatively on
every aspect of the irrigated cropping systems while poor crop husbandry practices such as weed,
fertiliser and water management, late planting, low plant populations, cultivar choice and low cropping
intensities contributed to the low productivity levels observed in the schemes. The findings of the action
research agronomic studies clearly indicated that it is possible to achieve potential or near-potential yields
such as attained in commercial farms by simply improving the crop husbandry practices. It is, therefore,
recommended that smallholder irrigation scheme revitalisation programs should place (i) capacity building
in basic crop and irrigation management practices, and (ii) strengthening institutional/organizational
arrangements prominently in their revitalisation agendas in any efforts to improve on the performance of
these schemes in South Africa. Other specific recommendations are:
xiii
1. The farmer organisational and management structures that were put in place at the two schemes
should be strengthened and sustained so as to ensure that the schemes are properly managed
and administered.
2. The process of forming Water Users Associations started at the schemes during the lifespan of
the project should be finalised. The new farmer management structures at the schemes need to
cooperate with DWA and the Provincial Departments of Agriculture to finalise this exercise.
3. There are many well meaning organisations that get involved in the schemes on different
occasions, but whose activities are not coordinated and sometimes end up being
counterproductive. This could be addressed through the establishment of stakeholder committees
at the schemes which would ensure that the synergies of all organisations active in the schemes
are optimally exploited for increased productivity at the schemes. This task could ideally be
spearheaded by the Provincial Department of Agriculture in each province as it is the most active
organisation in each scheme.
4. Land tenure policies that would allow increase of access to arable land to those interested and
capable of farming in the schemes must be urgently developed. This will increase land utilisation
and improve productivity and overall scheme performance. The urgency for action in this regard
is greater for ZIS than it is for TFIS.
5. Revitalisation programs should not focus on hardware issues only but rather on all constraining
factors including the soft aspects such as capacitating farmers in basic crop husbandry and
irrigation management skills.
6. Farmers at both schemes need to receive regular training in basic crop husbandry, irrigation
management, record keeping, financial management, and leadership skills. Empowering the
farmers with non-farming skills will empower them to be good managers for their farming
activities, the people they work with as well as those who work for them.
7. Poor maintenance of irrigation infrastructure at both schemes seems to be a result of the fact that
farmers do not view the scheme infrastructure as their property. To ensure that ownership is
entrenched in the minds of the irrigators, all revitalization and development initiatives at the
schemes should involve the irrigators in a participatory way at all stages of the processes.
8. Access to support services such as credit, market information and intelligence, extension services
should be strengthened. It is recommended that the departments of agriculture assign and train
extension officers dedicated to servicing the irrigation schemes.
9. Crop planning in the schemes should be market driven as informed by market information and
intelligence.
10. Both schemes need to explore alternative cropping systems that would ensure viability in the face
of limitations of labour and skills. One labour-saving technology that warrants investigation is the
practice of conservation agriculture. Adoption of conservation farming practices would (1) reduce
labour requirements especially in peak operations of land preparation and weeding, (2) increase
xiv
food security by making more efficient use of irrigation water, and by increasing soil fertility
through the introduction of N-fixing cover crops, and (3) improve pest regulation and reduce
dependence on external inputs.
11. Levels of productivity were much higher in TFIS than ZIS. There are, therefore, lessons that
farmers in ZIS can learn from those in Tugela Ferry. Exchange visits organized for the two
schemes could help irrigators at the schemes to learn from each other.
12. Academic institution partnerships can play important roles in the generation of knowledge, testing
of technologies and adoption of the same by farmers on the schemes. It is recommended that
such partnerships be institutionalised through the establishment of research chairs on irrigated
cropping systems at selected key institutions located in areas where there are many irrigation
schemes in the vicinity of the institutions. This could be implemented on a pilot basis to begin
with.
xv
ACKNOWLEDGEMENTS
The project team is grateful to the Water Research Commission (WRC) for funding this project. The
National Research Foundation (NRF) and Govan Mbeki Research and Development Centre (GMRDC) at
the University of Fort Hare are thanked for granting bursaries to Messrs Alen Manyevere and Arnold
Njaimwe who did their thesis research as part of the project. The project team gratefully acknowledges
the able guidance provided by the project Reference Group members from the inception of the project to
its completion. The reference group was made of the following members:
Dr A J Sanewe Water Research Commission (WRC) (Chair)
Dr G R Backeberg WRC
Prof I K Mariga University of Limpopo
Dr T M Everson University of KwaZulu-Natal
Mr F B Reinders ARC Institute for Agriculture Engineering
Mr J F Joubert Eastern Cape Department of Agriculture
Mr B D Msomi Department of Agriculture, Forestry, and Fisheries (DAFF)
Ms PJ Dibete DAFF
Mr FC Nemalili DAFF
Ms A D Nefale Department of Water Affairs (DWA)
Dr JN Jaganyi University of KwaZulu-Natal
Prof G de Wet University of Fort Hare
The project team is especially grateful to Drs A J Sanewe and G R Backeberg of the WRC for their
understanding, encouragement and unwavering support throughout the conduct of the project. Dr S
Mkhize is thanked for initiating the project before leaving the WRC in 2003.
Many other people contributed directly to the success of the studies undertaken in Zanyokwe and Tugela
Ferry from 2004 to 2009. Prof Sazile Mtshali made substantial contributions to the situation analysis
conducted in Tugela Ferry in 2004. Unfortunately she had to withdraw from the project due to other
commitments. The postgraduate students undertook most of the field work, especially at Zanyokwe.
Arnold Njaimwe provided much needed logistical support whilst at the same time soldiering on with his
own PhD studies. Morris Fanadzo spent many weekdays and weekends in Zanyokwe managing on-farm
trials and working with the farmers. Both Arnold and Morris provided a link for the rest of the project team
members with the farmers as a result of their constant presence in the scheme and intimate interaction
with farmers and extension officers.
xvi
The project team expresses its profound gratitude to the farmers of Zanyokwe (most especially those
from Burnshill and Lenye) and Tugela Ferry. They willingly gave their time for many meetings, hosted the
on-farm trials, participated in field days and answered numerous questions posed to them by the
postgraduate students and the project team.
The Eastern Cape Department of Agriculture (ECDA) supported the project as best as they could. Both
the Keiskammahoek and Stutterheim offices of ECDA provided much needed support in interacting with
the farmers and other agencies supporting development work in Zanyokwe. In particular, the Fort Hare
team acknowledges the support received from Ms C Erasmus and Mr Z Manona at various stages of
project implementation. The Amahlati Municipality also gave its political support to the project and even
sent a representative to the project stake holder meeting that took place in Pietermaritzburg during
August 2005. The Zakhe Training and Agriculture Institute is equally grateful to the KwaZulu-Natal
Department of Agriculture and Environmental Affairs for its support to the project in Tugela Ferry. The
uMzinyathi District Municipality, Msinga Municipality and Traditional leaders in Tugela Ferry are also
thanked for their political and logistical support to the project in Tugela Ferry.
Mr M Murhovi and Ms N Mlotshwa of the Department of Water Affairs (DWA), formerly known as the
Department of Water Affairs and Forestry (DWAF) until 2009, facilitated the establishment of Water
Users’ Associations at Zanyokwe and Tugela Ferry, respectively.
The Fort Hare Foundation in East London is thanked for ably managing the project finances.
Substantial parts of this report, especially, the Zanyokwe section of the report, are based on work done by
postgraduate students. The specific contributions of the students to the content of the report are as
follows:
1. M Fanadzo whose PhD thesis is entitled “Improving the productivity of maize-based small-scale
irrigation cropping systems: A case study of Zanyokwe irrigation scheme, Eastern Cape, South
Africa” contributed to all the agronomic work reported in the Zanyokwe section of this report.
2. M Tshuma whose MSc dissertation is entitled “A Socio-Economic Impact Assessment of the Best
Management practices (BMP) project of the Zanyokwe Irrigation Scheme at farm level”
contributed to the social economic impact report of the Zanyokwe case study report.
3. M Shongwe whose dissertation is entitled “The development of a problem-solving strategy for
water management at block level at Tugela Ferry” contributed to the water management section
of the Tugela Ferry Case study report.
The project team is extremely thankful to the inputs made by these students without which this report would not be what it is.
xvii
TABLE OF CONTENTS
PAGE EXECUTIVE SUMMARY iii ACKNOWLEDGEMENTS xv LIST OF FIGURES xxi LIST OF PLATES xxiv
LIST OF TABLES xxvi LIST OF TEXT BOXES xxviii ABBREVIATIONS AND ACRONYMNS xxix 1 GENERAL INTRODUCTION 1 2 Best Management Practices for Smallholder Sprinkler Irrigation
Farming through Participatory Adaptive Research at Zanyokwe Irrigation Scheme (ZIS), Eastern Cape Province 5
2.1 Introduction 5 2.2 Identification of socio-economic, institutional, infrastructural, and
biophysical constraints 8 2.2.1 Background 8 2.2.2 Methodology 12 2.2.3 Socio-economic constraints 12 2.2.4 Institutional constraints and organisational relationships 14 2.2.5 Infrastructural constraints 15 2.2.6 Water management within the scheme 15 2.2.7 Agronomic constraints 16 2.3 Participatory implementation of solutions to socio-economic and institutional
constraints 18 2.3.1 Introduction 18 2.3.2 Incentives of secure water use and land use rights or entitlements 19 2.3.3 Options for addressing identified socio-economic constraints 20 2.3.4 Methodology 21 2.3.5 Results and Discussion 23 2.4 Participatory Assessment of Agronomic constraints at Zanyokwe
Irrigation Scheme (ZIS) 33 2.4.1 Introduction 33 2.4.2 Materials and Methods 34 2.4.3 Results 35 2.4.4 Discussion 43 2.4.5 Conclusions 46 2.5 Options for alleviating grain maize (Zea mays L.) agronomic productivity
constraints in Zanyokwe Irrigation Scheme (ZIS) 47 2.5.1 Introduction 47 2.5.2 Materials and Methods 48 2.5.3 Results 50 2.5.4 Discussion 55 2.5.5 Conclusions 58 2.6 Testing of Technological Options for Addressing Agronomic Constraints:
1. Effect of Reduced Dosages of Atrazine and Narrow Rows on Weeds at Zanyokwe 59
2.6.1 Introduction 59 2.6.2 Materials and Methods 60 2.6.3 Results 62 2.6.4 Discussion 66 2.6.5 Conclusions 67
xviii
2.7 Testing of Technological Options for Addressing Agronomic Constraints: 2. Effect of row spacing and plant population on weed dynamics and maize (Zea mays L.) grain yield at Zanyokwe 68
2.7.1 Introduction 68 2.7.2 Materials and Methods 68 2.7.3 Results 70 2.7.4 Discussion 72 2.7.5 Conclusions 74 2.8 Testing of Technological Options for Addressing Agronomic Constraints: 3. Effect
of pre-plant weed control, population density and nitrogen rate on weed biomass and yield of butternut (Cucurbita moschata) in Zanyokwe 75
2.8.1 Introduction 75 2.8.2 Materials and methods 76 2.8.3 Results 78 2.8.4 Discussion 83 2.8.5 Conclusions 85 2.9 Testing of Technological Options for Addressing Agronomic Constraints in
Zanyokwe: 4. Comparative Response of Direct-Seeded and Transplanted Maize (Zea Mays L.) to Nitrogen Application 86
2.9.1 Introduction 86 2.9.2 Materials and Methods 87 2.9.3 Results 88 2.9.4 Discussion 92 2.9.5 Conclusions 93 2.10 Testing of Technological Options for Addressing Agronomic Constraints: 5. Comparative
performance of directly seeded and transplanted green maize under farmer management in Zanyokwe 94
2.10.1 Introduction 94 2.10.2 Materials and methods 94 2.10.3 Results 95 2.10.4 Discussion 103 2.10.5 Conclusions 105 2.11 Irrigation Water management in Zanyokwe 106 2.11.1 Introduction 106 2.11.2 Water Supply in Zanyokwe 106 2.11.3 Irrigation scheduling in Zanyokwe 114 2.11.4 Infrastructural problems in Zanyokwe 122 2.12 Project Interventions and their Impact at ZIS 123 2.12.1 Introduction 123 2.12.2 Methodology 123 2.12.3 Impact of the BMP Project on Institutions and organizations at ZIS 124 2.12.4 Project Impact on quality of extension services 127 2.12.5 Technologies and practices introduced at ZIS 128 2.12.6 Project Impact on social status of households 130 2.12.7 Impact of the BMP project on the economic status of farming households 133 2.12.8 Project Impact on household food security at ZIS 139 2.12.9 Socio-Economic Impact of the BMP Project on Surrounding Communities:
Perspectives of the non-project members 141
3 Best Management Practices for Smallholder Furrow Irrigation Farming through Participatory Adaptive Research at Tugela Ferry Irrigation Scheme (TFIS), KwaZulu-Natal Province 158
3.1 Introduction 158 3.2 Identification of institutional and biophysical constraints 160 3.2.1 Organisational Issues 160 3.2.2 Technical issues 164
xix
3.3 Constraints analysis 168 3.3.1 Approach 168 3.4 Participatory implementation of solutions to socioeconomic and institutional constraints
at Tugela Ferry 176 3.4.1 Background and objectives 176 3.4.2 An approach to link implementation of organisational arrangements, marketing and crop
production plans at Tugela Ferry 176 3.5 Participatory testing of technological options for addressing
biophysical constraints 199 3.5.1 Background and objectives 199 3.5.2 Methodology 200 3.5.3 Results and discussion 208 3.6 Irrigation Water management in Tugela Ferry Irrigation Scheme (TFIS) 223 3.6.1 Introduction 223 3.6.2 In-field evaluation of irrigation water availability and practices 225 3.6.3 Is the water reaching irrigation blocks to meet the needs of farmers? 225 3.6.4 Is water allocated effectively amongst the farmers in the block? 226 3.6.5 Does the water application at field level meet the crop irrigation requirements? 229 3.6.6 Are the users aware of ‘efficient’ irrigation scheduling methods? 235 3.6.7 Lessons learned and way forward 238 3.6.8 Water conservation techniques for best management of green mealies and
butternut squash 238 3.7 Impact of the project at Tugela Ferry Irrigation Scheme (TFIS) 249 3.7.1 Capacity building for farmers and extension officers: a general account 249 3.7.2 Empirical determination of the impact of the project 255 3.7.3 Socio-economic impact of the project on the surrounding community at Tugela Ferry 273 3.7.4 Socio-economic impact of the Tugela Ferry Irrigation project to the key buyers
of vegetables 274 3.7.5 Conclusions and recommendations 276 4 Lessons Learnt from Implementation of the Project in Zanyokwe and Tugela Ferry
Irrigation Schemes 283 4.1 Introduction 283 4.2 Lessons Learnt 283 4.2.1 Participatory Involvement of Stakeholders in the project 283 4.2.2 Socio-economic lessons 284 4.2.3 Technical lessons (cropping and water management) 288 4.2.4 Capacity building 300 5 Guidelines on Best Management Practices in Zanyokwe and Tugela Ferry Irrigation
Schemes 303 5.1 Introduction 303 5.2 Socio-economic issues 303 5.2.1 Scheme Management and Leadership 303 5.2.2 Land tenure 304 5.2.3 Training 304 5.2.4 Marketing 304 5.3 Water Management 305 5.3.1 Guidelines on best management practices for irrigating crops at ZIS 305 5.3.2 Guidelines on best management practices for irrigating crops at TFIS scheme 307 5.4 Crop production 314 5.4.1 Land preparation and Soil Sampling 314 5.4.2 Adoption of a cropping calendar 317 5.4.3 Best practices for different crops 320
xx
6 General Discussion, Conclusions and Recommendations 326 6.1 General Discussion 326 6.1.1 Introduction 326 6.1.2 Weak institutional and organisational arrangements 326 6.1.3 Socio-economic constraints 328 6.1.4 Infrastructural constraints 330 6.1.5 Agronomic constraints 331 6.1.6 Access to support services 332 6.1.7 Academic Institutions partnerships 333 6.2 Conclusions 333 6.3 Recommendations 334 Appendix A 341 Appendix A1.1 Guidelines for operation and maintenance of centrifugal pump stations and Electrical motors 341 Appendix A1.2 Guidelines for operation and maintenance of quick coupling irrigation systems 350 Appendix B Research products that arose from the project 358
xxi
LIST OF FIGURES PAGE Figure 1.1: Outline of project goals, objectives, expected outputs and outcomes 3 Figure 2.1: Schematic diagram of the Zanyokwe Irrigation Scheme 6 Figure 2.2: The irrigated agriculture crop production system 9 Figure 2.3: Areas of constraint at the Zanyokwe Irrigation Scheme 11 Figure 2.4: Poor water management issues 16 Figure 2.5: Low level of cropping intensity 17 Figure 2.6: Low levels of productivity 18 Figure 2.7: Relationship between the farming community and key institutions 24 Figure 2.8: Marketable yield response to population density with pre-plant weed control 80 Figure 2.9: Total yield response to population density with pre-plant weed control 82 Figure 2.10: Interaction between EM and N rate on green maize yield 90 Figure 2.11: Relationship between EM and N rate on cob length 91 Figure 2.12: Relationship between EM and N rate on grain yield 91 Figure 2.13: Water supply to the Zanyokwe Irrigation Scheme 107 Figure 2.14: Example of rain gauge layout for distribution tests 109 Figure 2.15: Position of wetting front after irrigation 115 Figure 2.16: ET Crop and total irrigation requirements for the production of winter
cabbage in comparison to irrigation applied by the farmer 116 Figure 2.17: ET Crop and total irrigation requirements for the production of summer cabbage in comparison to irrigation applied by the farmer 117 Figure 2.18: ET Crop and total irrigation requirements for the production of carrots in comparison to irrigation applied by the farmer 118 Figure 2.19: Crop water requirements and total irrigation requirements for production of
butternuts in comparison to applied irrigation by the farmer. 119 Figure 2.20: WFD responses at 15 cm and 30 cm under sprinkler irrigation for the production
of cabbage at Lenye south 120 Figure 2.21: ET Crop and total irrigation requirements for the production of cabbage in
comparison to irrigation applied by the farmer at Lenye south 120 Figure 2.22: Comparison between actual rainfall received and long-term average rainfall
recorded for Zanyokwe irrigation scheme during July till October 121 Figure 2.23: Average time spent by farmers in fields per day 131 Figure 2.24: Time spent in the field compared to 3yrs ago 132 Figure 2.25: Participation of non-project members in scheme affairs 132 Figure 2.26: Scheme resources accessible to non-scheme members 133 Figure 2.27: Changes in size of cultivated land since 2005 138 Figure 2.28: Crops grown by farmers at ZIS 139 Figure 2.29: Impact of practices on food security 140 Figure 3.1: Schematic diagram of the original Tugela Ferry Irrigation Scheme 159 Figure 3.2: Organisational structure of Tugela Ferry Irrigation Scheme 161 Figure 3.3: Three cascades (1, 2 and 3) representing nine key issues leading to institutional
and technical constraints to best agroecosystem management at Tugela Ferry and the compromised agroecosystem attributes (sustainability, stability, equitability and autonomy). 170
Figure 3.4: A concept map illustrating a strategy to coordinate agricultural management practices and institutional arrangements at Tugela Ferry. 178
Figure 3.5: A conceptual framework for a study to revitalise markets at Tugela Ferry 180 Figure 3.6: Key recommendations made by Tugela Ferry farmers for revival of MVEPCO 189 Figure 3.7: Expected key performance areas for MVEPCO 190 Figure 3.8: Determination of who established the Msinga Pack house 191 Figure 3.9: The original purposes of the Msinga pack house 191 Figure 3.10: Reasons that led to pack house dysfunction 192 Figure 3.11: Ownership of the pack house. AFRICARE was the funding NGO 192 Figure 3.12: Perception of the relationship between farmers and pack house management 193
xxii
Figure 3.13: Suggested traits for future pack house management. 195 Figure 3.14: Suggested roles for the WRC Best Management Practices researchers
in the pack house 196 Figure 3.15: Revised conceptual framework to link marketing, production and
institutional arrangements for the Tugela Ferry Irrigation Scheme. 198 Figure 3.16: Conceptual framework of managerial success used to introduce Tugela Ferry
farmers to farm management 201 Figure 3.17: A tree of resources and outputs used as an analogy to guide Tugela Ferry Farmers for drawing a list of resources and outputs in a farming system 202 Figure 3.18: Effect of plant population (inset: 35, 40 and 50 x 1000 plants ha -1) on the
growth of cabbage under field conditions during the first eight weeks after transplanting 209
Figure 3.19: Effect seedling size (inset: 8, 15 and 20 cm) at transplanting on the growth of onion under field conditions during the first four weeks after transplanting 210
Figure 3.20: Cabbage yield in response to different planting densities under experimental management conditions at the Tugela Ferry Irrigation Scheme 211
Figure 3.21: Cabbage yield in response to different planting densities under farmer-management conditions at the Tugela Ferry Irrigation Scheme 211
Figure 3.22: Onion bulb yield in response to three seedling sizes for crop establishment under experimental conditions at Tugela Ferry Irrigation Scheme. 213
Figure 3.23: Onion bulb yield in response to three seedling sizes for crop establishment under farmer-management conditions at Tugela Ferry Irrigation Scheme. 213
Figure 3.24: Emergence and stand establishment of two potato cultivars (inset) during the first 63 days after planting at Tugela Ferry 214
Figure 3.25: Stem prolificacy of two potato cultivars at 94 days after planting in relation to propagule size 216
Figure 3.26: Tuber set in two potato cultivars at 94 days after planting 217 Figure 3.27: Relationship between propagule size and tuber size 94 days after planting of
potato cultivars. 217 Figure 3.28: Comparison of potato cultivars (inset) for yield and potato size. 219 Figure 3.29: Classification of potatoes produced from large and small propagules of
cultivars Up-to-date and BP1 in relation to potato sizes (inset). 219 Figure 3.30: Comparison of Tugela Ferry farming blocks (inset) for yield and produce
potato size of BP1 potato produced using large and small propagules 220 Figure 3.31: Yield and classification of butternut squash produced at different blocks (inset)
of the Tugela irrigation scheme 221 Figure 3.32: Marketability of butternut squash crop produced at the Tugela Ferry irrigation
scheme farming blocks. 222 Figure 3.33: Schematic diagram of water use study activities 224 Figure 3.34: Cumulative volume irrigation water past sub-canal 2 231 Figure 3.35: ESKOM Ruraflex tariff periods 232 Figure 3.36: Percentage distribution of the respondents’ satisfaction with regard to infield
irrigation practices (N=70). 237 Figure 3.37: Changes in soil moisture content in the root zone (15 cm and 30 cm of
maize (cv SR 52) during different stages of plant growth (5, 7, 9, and 11 WAP) in response to mulch (+), no mulch (-), weeding (W) and weed cultivation (C). 244
Figure 3.38: Cob prolificacy of maize cultivars (SR 52 and SC 701) in response to mulch (+ = yes, - = no) and weed cultivation (c = yes, W = no) 245
Figure 3.39: Comparison of maize cultivars SR 52 and SC 701 for response to application of mulch (+ = yes, - = no) and weed cultivation (c = yes, W = no) determined by cob length and number of grain rows per cob under optimum fertilizer application 246
Figure 3.40: Effect of mulch (+ = yes, - = no) and weed cultivation (c = yes, W = no) on the grain size maize (cultivars SR 52 and SC 701) at physiological maturity 246
Figure 3.41: Yield of maize cultivars SR 52 and SC 701 in response to mulch (+ = yes, - = no) and weed cultivation (c = yes, w = no) under optimum fertilizer application 247
xxiii
Figure 3.42: Butternut fruit production in response to mulch (+ = yes, - = no) and weed cultivation (c = yes, w = no). 248
Figure 3.43: Effect of mulch (+ = yes, - = no) and weed cultivation (c = yes, w = no) on butternut yield. 248
Figure 3.44: Conceptualisation of the Project researcher- extension officer-farmer relationship in planning, implementation and dissemination of information derived from agronomic trials at Tugela Ferry. Note the meaning of arrows: Thick black = emphasis on bottom-up approach to decisions about implantation of trials; narrow unbroken = direction of technical advice; narrow broken (dash) = internal (scheme) dissemination; Red (dotted) = dissemination to the external environment. Other farmers = farmers who did not opt to participate in agronomic trials, but they also farm on the Tugela Ferry irrigation scheme. 252
Figure 3.45: Comparison of farmers and extension officers (EO) for performance in management of crop production trials (See Table 3.23 for performance areas). 256
Figure 3.46: Distribution of respondents by gender 258 Figure 3.47: Age distribution of respondents 258 Figure 3.48: Awareness of project objectives 259 Figure 3.49: Farmers’ views on the institutional support given to them by the BMP team 260 Figure 3.50: Types of training recognised by farmers as having been offered to them
by the BMP project team 260 Figure 3.51: Farmers’ perceptions of the organisations that offered them training 261 Figure 3.52: Frequency of meetings 262 Figure 3.53: Co-operation and collaboration between sections of the scheme 262 Figure 3.54: Conflict resolution strategy of Tugela Ferry farmers 263 Figure 3.55: Motivating factors for acquiring more land as cited by farmers at
Tugela Ferry irrigation scheme 264 Figure 3.56: Farmers’ perceptions of the effects of best management practices on
their management of irrigation farming 265 Figure 3.57: Positive effects of best management practices on households as perceived
by the Tugela Ferry irrigation scheme farmers 266 Figure 3.58: Benefits enjoyed by the other communities from the increased productivity
at Tugela Ferry Irrigation Scheme 268 Figure 3.59: Roles played by the farmers at Tugela Ferry irrigation scheme in the
maintenance of the irrigation infrastructure 269 Figure 3.60: Farmers’ perceptions (percentage of respondents) on the role played by
the BMP team in improving marketing 269 Figure 3.61: Farmers’ perceptions (percentage respondents) on the new markets
introduced by the BMP team 270 Figure 5.1: Soil sampling using the Zig zag manner 315 Figure 5.2: Soil sampling using a diagonal pattern 316 Figure 5.3: Taking soil samples in crops grown in rows 316 Figure A1.1: Addition of energy to a hydraulic system 341 Figure A1.2: Latch type coupling 349 Figure A1.3: Perrot coupling 349 Figure A1.4: Bauer coupling 350 Figure A1.5: Components of sprinkler irrigation 351 Figure A1.6: Measuring apparatus for sprinkler nozzle size 353
xxiv
LIST OF PLATES PAGE Plate 2.1: Unfertilised maize infested by weeds in a farmer’s field due to late
weeding at Zanyokwe irrigation scheme 39 Plate 2.2: Sprinkler line showing leaks and non-uniform risers in a farmer’s field at
Zanyokwe irrigation scheme 40 Plate 2.3: Members of the Lenye Phuhlani Farmers Cooperative after their monthly
meeting in February 2008 125 Plate 3.1: The extension officers servicing the Tugela Ferry Irrigation Scheme outside
the DAEA District office with Albert Modi (author) (From left to right Mr. Zenzeleni Mzila, Mr. Bheki Maphanga, Ms Thembelihle Mzimela, Albert Modi and Ms Hlezikahle Sithole) 162
Plate 3.2: The defunct Ikhwezi Cooperative building is currently used for general dealership (Photograph taken in 2005) 164
Plate 3.3: Smallholder farmers at Tugela Ferry are skilled in the use of the local system of short-furrow irrigation. Here water was diverted from a small canal into furrows in a vegetable plot using a hand hoe 165
Plate 3.4: Poor weed control constrains crop productivity at Tugela Ferry 172 Plate 3.5: Burning of crop residues and lack of fallowing threaten soil quality at
Tugela Ferry 175 Plate 3.6: Lack of maintenance of canals threatens the sufficiency of one of the most
critical natural resources at Tugela Ferry, water 175 Plate 3.7: Vegetables and fruits in a retailer store (left) and the hawkers produce derived
from the Tugela Ferry irrigation scheme (right) on the pavement compete for customers at Tugela Ferry 186
Plate 3.8: Mrs Ndlovu, at Tugela Ferry farmer, receiving seed potatoes and fertiliser to participate in crop production trials 206
Plate 3.9: Comparison of BP1 and Up-to-date potato cultivars for stand establishment 42 d after planting 215
Plate 3.10: Effect of propagule size on tuber set and size in potato cultivar BP1. Large propagules produced many large and small tubers (left), whereas small propagules produced fewer tubers (right) 218
Plate 3.11: An installed ElectroFlo water and energy meter 225 Plate 3.12: Grass cleared along the main canal in Block 4A 228 Plate 3.13: Debris removed from the canal 228 Plate 3.14: Wetting front detectors (15 cm deep) generally indicated low soil water content
where no mulch was applied (left) compared with mulch treatment (right) 243 Plate 3.15: Farmer-facilitator during a PRA exercise at Tugela 250 Plate 3.16: Tugela Ferry farmers raised hands during ranking exercises to classify
PRA data TO 250 Plate 4.1: Abandoned weedy field grown to butternut at Zanyokwe 286 Plate 4.2: Cabbage stand in farmer’s field in Zanyokwe showing good, uniform stand
and clean weeded with potential to be used as demonstration of best management practice in vegetable production 287
Plate 4.3: Carrots flowering in the field after farmers failed to find a market for the crop 287 Plate 4.4: Good stand of maize variety DKC 6125 planted in November 2006
at 40 000 plants/ha and fertilised at 220 kg N/ha (with adequate levels of P and K) which achieved a high yield 10 t/ha in ZIS. This shows potential to improve productivity of maize with timely planting, good population and adequate fertiliser application 290
Plate 4.5: Farmer managed trial comparing green maize production using seedlings (left) and direct seeding (right) (note varying stages of crop growth resulting from gap-filling in direct seeded maize on the right) 292
Plate 4.6: Pre-plant weed control results in a more uniform butternut fruits that require less labour for grading 293
xxv
Plate 4.7: (a) Weed density with (right of each picture) and without (left of each picture) pre-plant herbicide during early establishment of butternut and (b) at 3 weeks after establishment prior to weeding. Less labour is required to weed with pre-plant weed control as the fields are relatively clean of weeds, particularly if timing of weeding is early 294
Plate 4.8: Hand weeding maize in ZIS. The crop is under severe weed challenge and as a result shows yellowing. Harvested area will depend on how much of the planted area can be weeded 295
Plate 4.9: Loss in crop stand where rows are not properly aligned and crop is too big to allow for effective use of mechanical control 296
Plate 4.10: Leaking pipes cause waterlogging in portions of the scheme. Risers on this lateral line are of different heights affecting water distribution 298
Plate 4.11: Crops suffer water stress due to shortage of water caused by insufficient pipes to allow for a schedule capable of meeting peak water demand 299
Plate 4.12: ZIS farmers visited the Municipal market, Proveg, Pick n Pay and Woolworths in East London and got exposed to market requirements for vegetable quality, grading and packaging 301
Plate 4.13: Grading butternut at farmer’s homestead at Zanyokwe. Grading helps to improve quality, income and creates local jobs 302
xxvi
LIST OF TABLES PAGE Table 2.1: Degree of poverty in Zanyokwe Irrigation Scheme in 2004 (n = 61) 12 Table 2.2: Mean cropped area (ha) and percent producers (in brackets) for the main
crops grown during the 2005/06 to 2007/8 summer seasons. 35 Table 2.3: Cropping patterns from 2005/06 to 2007/08. 36 Table 2.4: Amount of nitrogen fertilizer applied (kg ha-1) and yields of grain maize, green
maize and butternut achieved in the 2005/06 to 2007/08 summer seasons. 41 Table 2.5: Plant populations (plants ha-1) in maize and butternut observed in farmers’
fields in three summer seasons, 2005/06 to 2007/08. 42 Table 2.6: Characteristics of cultivars evaluated in Experiment 2. 49 Table 2.7: Grain yield as affected by N rate and planting time at Kalawe and Sisando 51 Table 2.8: Grain yield as affected by planting time and population density at Kalawe
and Sisando. 51 Table 2.9: Grain yields of DKC61-25 and PAN6777 fertilised at 60 and 250 kg N ha-1. 51 Table 2.10: N rate x planting time x plant density x cultivar interaction on grain yield at Nofemele. 53 Table 2.11: Grain yield as affected by site and cultivar at Kalawe and Sisando farms . 54 Table 2.12: Grain yield obtained at Nofemele. 54 Table 2.13: Orthogonal contrasts comparing cultivars used by farmers to new cultivars
and comparing maturity classes at the three sites. 55 Table 2.14: Rainfall and irrigation water (mm) received during crop growth 61 Table 2.15: Weed species and their densities per square metre prior to herbicide
application 62 Table 2.16: Weed biomass (g m-2) obtained at 6 WAE at different row spacings at the
three sites 64 Table 2.17: Weed biomass (g m-2) obtained at varying herbicide dosages at the three
sites at maize physiological maturity 64 Table 2.18: Green and grain maize yield and yield components at two levels of row
spacing and three levels of atrazine dosage at Nofemele, Kalawe and Bantubantu farms 65
Table 2.19: Weed species and their density per square metre at the three sites prior to weeding at 3 WAE 71
Table 2.20: Green cob weight (kg ha-1) obtained at different population densities and row spacing at the three sites 71
Table 2.21: Grain yield obtained at the different population densities and row spacing 72 Table 2.22: Rainfall and irrigation water (mm) and mean temperatures during crop
growth at Bantubantu and Booi farms in the 2006/07 and 2007/08 seasons 77 Table 2.23: Weed biomass (g m-2) with application and non-application of a pre-plant
herbicide at Bantubantu and Booi farms 78 Table 2.24: Marketable yield obtained at varying levels of pre-plant weed control,
N rate and population density at the two sites 79 Table 2.25: MRR of switching from 60 kg N ha-1 to higher N rates 80 Table 2.26: Total yield obtained at varying levels of pre-plant weed control, N rate and
population density 81 Table 2.27: Fruit size at varying levels of pre-plant weed control and N rate at
Bantubantu farm 82 Table 2.28: Fruit size at varying levels of pre-plant weed control and population
density at Bantubantu farm 83 Table 2.29: Fruit size achieved at the different N rates and population densities with
pre-plant weed control at Booi 83 Table 2.30: Rainfall and irrigation water (mm) received during crop growth 88 Table 2.31: Days taken by maize to reach 50% flowering 89 Table 2.32: Days to 50% flowering at varying N rates at the three sites 89 Table 2.33: Interaction between EM and N rate on days to milk stage 90
xxvii
Table 2.34: Labour requirements and cost, and target population at crop establishment 96 Table 2.35: Crop establishment (% of target population) with transplanting and direct
Seedling 96 Table 2.36: Fertiliser management 97 Table 2.37: Post-plant weed control by the different farmers 98 Table 2.38: Length of maize cobs (cm) under different establishment methods
across farms 98 Table 2.39: Summary of maize sales by farmers 99 Table 2.40: Partial budget on green maize production through transplanting and direct seeding 101 Table 2.41: Adoption of technologies by the six farmers in 2008/09 102 Table 2.42: Water supply data for the Zanyokwe Irrigation Scheme 108 Table 2.43: Sprinkler system characteristics 109 Table 2.44: Uniformity and efficiency parameters: Zanyokwe Sprinkler systems (movable) 112 Table 2.45: Sprinkler characteristics 113 Table 2.46: Recommended Interventions on Operation and Maintenance for Zanyokwe
Irrigation Scheme 129 Table 2.47: Practices and technologies introduced and adopted at ZIS 130 Table 2.48: Sources of income and their contribution to household income in 2007 (n= 47) 134 Table 2.49: Categorisation of households in ZIS into poverty classes in 2005 and 2007 135 Table 2.50: Number of farmers cultivated their land during winter in 2007 (n= 47) 138 Table 3.1: Areas of irrigation blocks in Tugela Ferry irrigation scheme 158 Table 3.2: Climatic data for Tugela Ferry (Camp, 1999) 166 Table 3.3: Selected suitable and alternative crops (in no corresponding order) for
production at Tugela Ferry. Yield potential (t ha-1 annum-1) is shown in parenthesis. Where irrigation or dryland production is not specified, the author assumed that dryland production is the case. No yield data were found for the alternative crops 168
Table 3.4: Description of how the dominant institutional and technical issues identified in Figure 3.5 have a negative effect on the management of the Tugela Ferry Irrigation scheme 173
Table 3.5: Association between the dominant institutional issues and agroecosystem attributes. Indicators are selected measures of system performance to indicate good management. X indicates Agroecosystem attributes that are negatively affected by each issue 174
Table 3.6: Perceived merits and demerits of establishing a Scheme-only WUA or an encompassing WUA (including dryland areas) according to Tugela Ferry farmers and viewed in light of the key objectives identified for best management practices on the Scheme 179
Table 3.7: Proposed training of extension staff and farmer organization leaders to strengthen farmer institutions at Tugela Ferry 185
Table 3.8: Sources of produce marketed vegetable retailers around Tugela Ferry. Note: 0 = not used, 1 = minimum use, 2 = average use and = major source. Weenen, Estcourt and Washbank farmers are commercial farmers. PMB and DBN refer to the municipality fresh produce markets in Pietermaritzburg and Durban, respectively 187
Table 3.9: Produce quality specifications by supermarkets around the Tugela Ferry Irrigation scheme for the popular vegetables on the Scheme 188
Table 3.10: Reasons for poor relationship between farmers and pack house management 194 Table 3.11: Post-harvest quality enhancement types used at Tugela Ferry (N = 38) 197 Table 3.12: A summary of farming system resources and outputs according to the Tugela
Ferry farmers (N = 31) 203 Table 3.13: The production plan (planting dates) proposed for Tugela Ferry 205 Table 3.14: Flow tracker readings at edge of block 227 Table 3.15: Planted area served by sub-canal 2 and water demand from SAPWAT for
the 30 day period 230
xxviii
Table 3.16: Results of electricity cost analysis 233 Table 3.17: Cost of repairing the balancing dams 234 Table 3.18: Irrigation system performance evaluations 235 Table 3.19: Percentage distribution of the respondents’ views on water improvement
strategies at block level (N=70) 236 Table 3.20: Treatment details for the maize and butternut squash experiments. Note:
Cultivars: SR 52 and SC 701; + = mulched; - = not mulched; W = not weeded; C = weeds cultivated 242
Table 3.21: Skeleton analysis of variance for determination of the effects of mulch and weeding on maize 242
Table 3.22: Skeleton analysis of variance for determination of the effects of mulch and weeding on butternut squash. 242
Table 3.23: Criteria for assessment of the performance of extension officers and the farmers in management of agronomic trials. Note: E = excellent (more than meets the expectations), VG = very good (complies with expectations), G = good (has minor limitations); F = Fair (has minor limitations in all areas or significant limitations in some areas), P = poor (has significant limitations in all areas or shows no evidence of effort to succeed). Score: each performance grade carries one (1) point. Hence the maximum score per criterion is five (5) and the maximum total score is 50. 253
Table 3.24: Uhlelo lokusebenza kwemali yokulima (partial budgeting) 254 Table 3.25: Income for main crops grown in 2007/07 season 270 Table 3.26: Average income realised for cabbage, potato and tomato at Tugela Ferry
in comparison to the standard 271 Table 3.27: Winter Land cultivation at Tugela Ferry 272 Table 3.28: Reasons for not using land in winter at Tugela Ferry 272 Table 3.29: Vegetables bought by supermarkets from the Tugela Ferry Irrigation scheme 275 Table 5.1: Critical periods of water need by vegetable crops 307 Table 5.2: Recommended maximum time interval for maintenance inspections 308 Table 5.3: The crop production calendar proposed for Tugela Ferry 317 Table 5.4: Guidelines for fertilization of Maize [Source: FSSA Fertilizer Handbook 2007- 6th
Revised Edition] 323 Table 5.5: Guidelines for Fertilization of vegetables (for average yields) [Source: FSSA
Fertilizer Handbook 2007- 6th Revised Edition] 324 Table A1.1: Cooling methods 345 Table A1.2: Protection of electric motors 346 Table A1.3: Standard power ratings of some electric motors [Kw] 346 Table A1.4: Maintenance schedule for sprinkler irrigation systems (manual control)* 354
LIST OF BOXES
Box 1: Actual, Attainable, and Potential yields 168 Box 2: Attributes of an agroecosystem for best management 170
xxix
ABBREVIATIONS AND ACRONYMNS AE Adult Equivalent Ae Application efficiency ANOVA Analysis of variance ARDRI Agriculture and Rural Development Research Institute ARC Agricultural Research Council BMP Best Management Practices CBO Communality Business Organization CU Christiansen uniformity coefficient DAFF Department of Agriculture, Forestry, and Fisheries DBSA Development Bank of Southern Africa DEAT Department of Environmental Affairs and Tourism DU Distribution Uniformity DWA Department of Water Affairs (Previously DWAF) DWAF Department of Water Affairs and Forestry EC Eastern Cape ECDA Eastern Cape Department of Agriculture EOs Extension officers EPWP Expanded Public Works Programme FAO Food and Agricultural Organization FFS Farmer field schools FG Focus Group FPR Farmer participatory research FSSA Fertilizer Society of South Africa KZN KwaZulu-Natal LAN Lime Ammonium Nitrate MFP Massive Food Programme MPDC Msinga Peace and Development Cooperation MVEPCO Msinga Vegetable Producers Cooperative NAFU National Agricultural Farmers Union NDA National Development Agency NEPAD New Economic Partnership for African Development NGO Non Governmental Organisation NP Non poor OPV Open pollinated variety P Poor PAR Photosynthetically active radiation PGDP Provincial Growth and Development Strategy PMB Pietermaritzburg PRA Participatory Rapid Appraisal PTD Participatory Technology Development R&D Research and Development RHDs Reduced herbicide dosages SE System Efficiency SEIA Social Economic Impact Assessment SIS Small-scale irrigation scheme TFIS Tugela Ferry Irrigation Scheme UP Ultra poor USDA United States Department of Agriculture WAE Weeks after emergency WFD Wetting Front Detector WRC Water Research Commission WUA Water Users’ Association WUE Water use efficiency

xxx
ZADT Zanyokwe Agricultural Development Trust ZIS Zanyokwe Irrigation Scheme
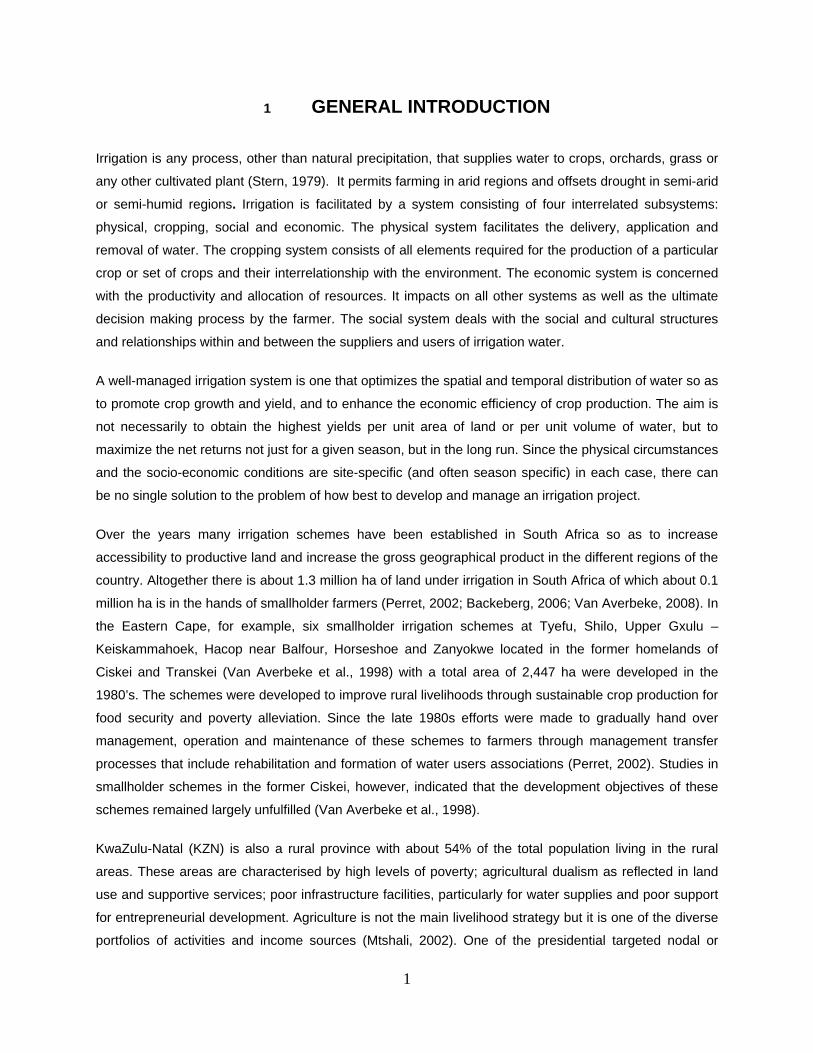
1
1 GENERAL INTRODUCTION
Irrigation is any process, other than natural precipitation, that supplies water to crops, orchards, grass or
any other cultivated plant (Stern, 1979). It permits farming in arid regions and offsets drought in semi-arid
or semi-humid regions. Irrigation is facilitated by a system consisting of four interrelated subsystems:
physical, cropping, social and economic. The physical system facilitates the delivery, application and
removal of water. The cropping system consists of all elements required for the production of a particular
crop or set of crops and their interrelationship with the environment. The economic system is concerned
with the productivity and allocation of resources. It impacts on all other systems as well as the ultimate
decision making process by the farmer. The social system deals with the social and cultural structures
and relationships within and between the suppliers and users of irrigation water.
A well-managed irrigation system is one that optimizes the spatial and temporal distribution of water so as
to promote crop growth and yield, and to enhance the economic efficiency of crop production. The aim is
not necessarily to obtain the highest yields per unit area of land or per unit volume of water, but to
maximize the net returns not just for a given season, but in the long run. Since the physical circumstances
and the socio-economic conditions are site-specific (and often season specific) in each case, there can
be no single solution to the problem of how best to develop and manage an irrigation project.
Over the years many irrigation schemes have been established in South Africa so as to increase
accessibility to productive land and increase the gross geographical product in the different regions of the
country. Altogether there is about 1.3 million ha of land under irrigation in South Africa of which about 0.1
million ha is in the hands of smallholder farmers (Perret, 2002; Backeberg, 2006; Van Averbeke, 2008). In
the Eastern Cape, for example, six smallholder irrigation schemes at Tyefu, Shilo, Upper Gxulu –
Keiskammahoek, Hacop near Balfour, Horseshoe and Zanyokwe located in the former homelands of
Ciskei and Transkei (Van Averbeke et al., 1998) with a total area of 2,447 ha were developed in the
1980’s. The schemes were developed to improve rural livelihoods through sustainable crop production for
food security and poverty alleviation. Since the late 1980s efforts were made to gradually hand over
management, operation and maintenance of these schemes to farmers through management transfer
processes that include rehabilitation and formation of water users associations (Perret, 2002). Studies in
smallholder schemes in the former Ciskei, however, indicated that the development objectives of these
schemes remained largely unfulfilled (Van Averbeke et al., 1998).
KwaZulu-Natal (KZN) is also a rural province with about 54% of the total population living in the rural
areas. These areas are characterised by high levels of poverty; agricultural dualism as reflected in land
use and supportive services; poor infrastructure facilities, particularly for water supplies and poor support
for entrepreneurial development. Agriculture is not the main livelihood strategy but it is one of the diverse
portfolios of activities and income sources (Mtshali, 2002). One of the presidential targeted nodal or
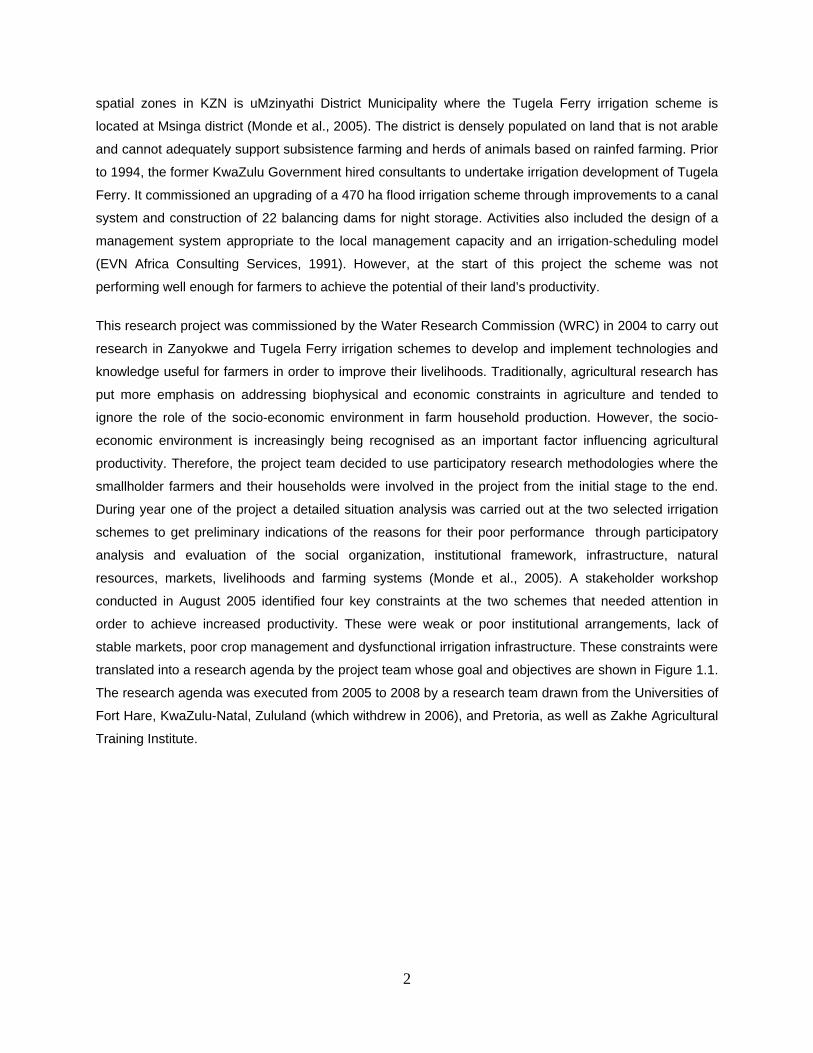
2
spatial zones in KZN is uMzinyathi District Municipality where the Tugela Ferry irrigation scheme is
located at Msinga district (Monde et al., 2005). The district is densely populated on land that is not arable
and cannot adequately support subsistence farming and herds of animals based on rainfed farming. Prior
to 1994, the former KwaZulu Government hired consultants to undertake irrigation development of Tugela
Ferry. It commissioned an upgrading of a 470 ha flood irrigation scheme through improvements to a canal
system and construction of 22 balancing dams for night storage. Activities also included the design of a
management system appropriate to the local management capacity and an irrigation-scheduling model
(EVN Africa Consulting Services, 1991). However, at the start of this project the scheme was not
performing well enough for farmers to achieve the potential of their land’s productivity.
This research project was commissioned by the Water Research Commission (WRC) in 2004 to carry out
research in Zanyokwe and Tugela Ferry irrigation schemes to develop and implement technologies and
knowledge useful for farmers in order to improve their livelihoods. Traditionally, agricultural research has
put more emphasis on addressing biophysical and economic constraints in agriculture and tended to
ignore the role of the socio-economic environment in farm household production. However, the socio-
economic environment is increasingly being recognised as an important factor influencing agricultural
productivity. Therefore, the project team decided to use participatory research methodologies where the
smallholder farmers and their households were involved in the project from the initial stage to the end.
During year one of the project a detailed situation analysis was carried out at the two selected irrigation
schemes to get preliminary indications of the reasons for their poor performance through participatory
analysis and evaluation of the social organization, institutional framework, infrastructure, natural
resources, markets, livelihoods and farming systems (Monde et al., 2005). A stakeholder workshop
conducted in August 2005 identified four key constraints at the two schemes that needed attention in
order to achieve increased productivity. These were weak or poor institutional arrangements, lack of
stable markets, poor crop management and dysfunctional irrigation infrastructure. These constraints were
translated into a research agenda by the project team whose goal and objectives are shown in Figure 1.1.
The research agenda was executed from 2005 to 2008 by a research team drawn from the Universities of
Fort Hare, KwaZulu-Natal, Zululand (which withdrew in 2006), and Pretoria, as well as Zakhe Agricultural
Training Institute.
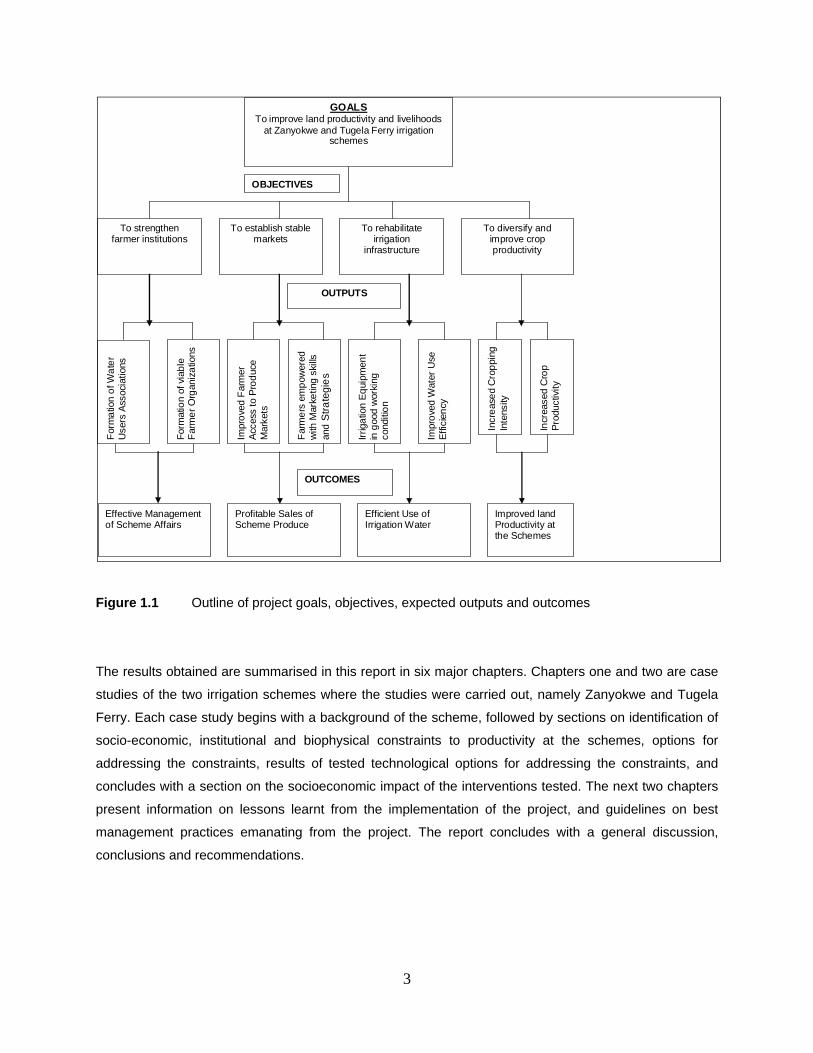
3
Figure 1.1 Outline of project goals, objectives, expected outputs and outcomes
The results obtained are summarised in this report in six major chapters. Chapters one and two are case
studies of the two irrigation schemes where the studies were carried out, namely Zanyokwe and Tugela
Ferry. Each case study begins with a background of the scheme, followed by sections on identification of
socio-economic, institutional and biophysical constraints to productivity at the schemes, options for
addressing the constraints, results of tested technological options for addressing the constraints, and
concludes with a section on the socioeconomic impact of the interventions tested. The next two chapters
present information on lessons learnt from the implementation of the project, and guidelines on best
management practices emanating from the project. The report concludes with a general discussion,
conclusions and recommendations.
For
mat
ion
of v
iab
le
Far
me
r O
rgan
iza
tions
Impr
ove
d F
arm
er
Acc
ess
to P
rod
uce
M
arke
ts
Far
me
rs e
mp
ower
ed
with
Mar
ketin
g s
kills
an
d S
tra
teg
ies
Irrig
atio
n E
qui
pmen
t in
goo
d w
orki
ng
cond
itio
n
Impr
ove
d W
ater
Use
E
ffici
ency
Incr
eas
ed
Cro
ppi
ng
Inte
nsity
Incr
ease
d C
rop
Pro
duct
ivity
Profitable Sales of Scheme Produce
Efficient Use of Irrigation Water
Improved land Productivity at the Schemes
Effective Management of Scheme Affairs
OUTCOMES
OBJECTIVES
To strengthen farmer institutions
To diversify and improve crop productivity
To rehabilitate irrigation
infrastructure
To establish stable markets
OUTPUTS
For
ma
tion
of W
ate
r U
sers
Ass
ocia
tions
GOALSTo improve land productivity and livelihoods
at Zanyokwe and Tugela Ferry irrigation schemes
4
References
BACKEBERG, G.R. 2006. Reform of user charges, market pricing and management of water: problem or
opportunity for irrigated agriculture. Irrigation and Drainage 55 (1), 1-12.
EVN AFRICA CONSULTING SERVICES, 1991. UTHUKELA FERRY IRRIGATION SCHEME
UPGRADING PROPOSALS. Report to the KwaZulu Department of Agriculture and Forestry, Ulundi
MONDE, N., MTSHALI, S., MNKENI, P.N.S., CHIDUZA, C., MODI, A.T., BRUTSCH M.O., DLADLA,
R. & MTHEMBU, B.E., 2005. A situation Analysis report on the Zanyokwe and Tugela Ferry irrigation
schemes. WRC Project K5/1477 Deliverable 2 Report. Water Research Commission, Pretoria, South
Africa.
MTSHALI, S.M., 2002. Household Livelihood Security in Rural KwaZulu-Natal, South Africa. Wageningen
University, Wageningen.
PERRET, S., 2002. Water policies and smallholding irrigation schemes in South Africa: a history and
new institutional changes. Water Policy 4(3), 283-300.
STERN, P. H. 1979. Small-Scale Irrigation: a Manual of Low Cost Water Technology. London:
Intermediate Technology Publications Ltd.
VAN AVERBEKE W., M’MARETE C.K., IGODAN C.O. & BELETE, A. 1998. An investigation into food plot
production at irrigation schemes in Central Eastern Cape. WRC Report No. 719/1/98, South Africa.
VAN AVERBEKE, W., 2008. Best management practices for small-scale subsistence farming on selected
irrigation schemes and surrounding areas through participatory adaptive research in Limpopo province.
Water Research Commission Report TT 344/08. Pretoria.
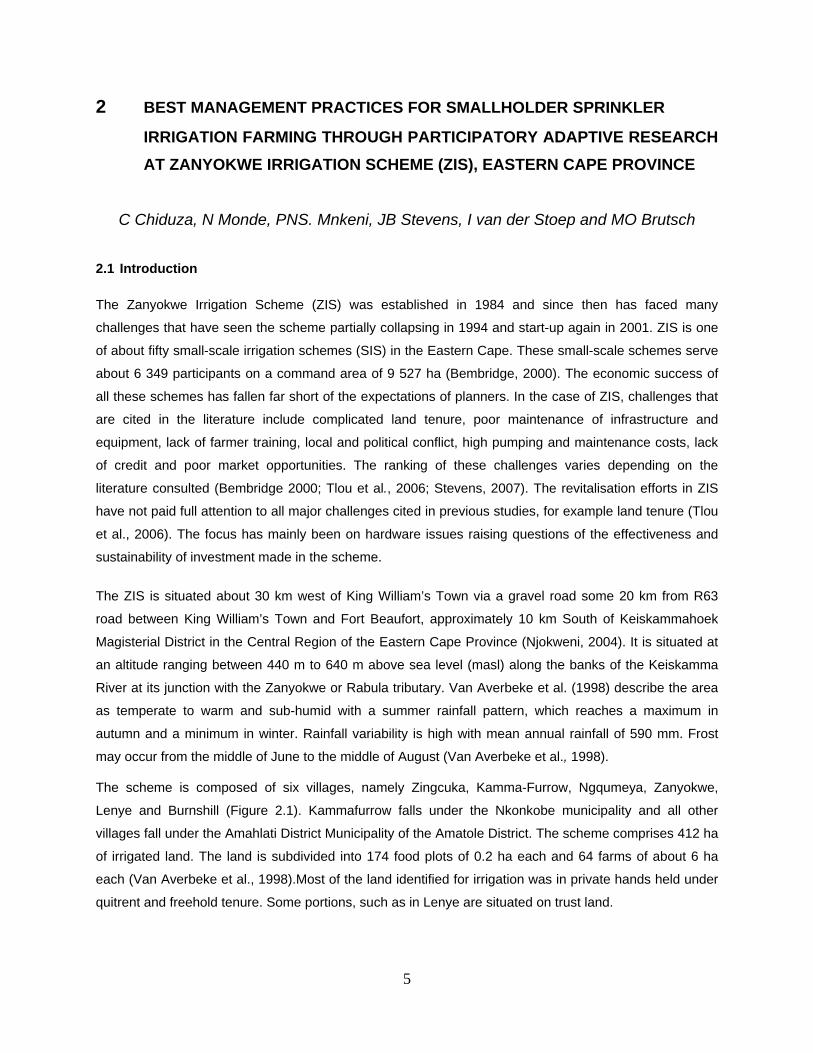
5
2 BEST MANAGEMENT PRACTICES FOR SMALLHOLDER SPRINKLER
IRRIGATION FARMING THROUGH PARTICIPATORY ADAPTIVE RESEARCH
AT ZANYOKWE IRRIGATION SCHEME (ZIS), EASTERN CAPE PROVINCE
C Chiduza, N Monde, PNS. Mnkeni, JB Stevens, I van der Stoep and MO Brutsch
2.1 Introduction
The Zanyokwe Irrigation Scheme (ZIS) was established in 1984 and since then has faced many
challenges that have seen the scheme partially collapsing in 1994 and start-up again in 2001. ZIS is one
of about fifty small-scale irrigation schemes (SIS) in the Eastern Cape. These small-scale schemes serve
about 6 349 participants on a command area of 9 527 ha (Bembridge, 2000). The economic success of
all these schemes has fallen far short of the expectations of planners. In the case of ZIS, challenges that
are cited in the literature include complicated land tenure, poor maintenance of infrastructure and
equipment, lack of farmer training, local and political conflict, high pumping and maintenance costs, lack
of credit and poor market opportunities. The ranking of these challenges varies depending on the
literature consulted (Bembridge 2000; Tlou et al., 2006; Stevens, 2007). The revitalisation efforts in ZIS
have not paid full attention to all major challenges cited in previous studies, for example land tenure (Tlou
et al., 2006). The focus has mainly been on hardware issues raising questions of the effectiveness and
sustainability of investment made in the scheme.
The ZIS is situated about 30 km west of King William’s Town via a gravel road some 20 km from R63
road between King William’s Town and Fort Beaufort, approximately 10 km South of Keiskammahoek
Magisterial District in the Central Region of the Eastern Cape Province (Njokweni, 2004). It is situated at
an altitude ranging between 440 m to 640 m above sea level (masl) along the banks of the Keiskamma
River at its junction with the Zanyokwe or Rabula tributary. Van Averbeke et al. (1998) describe the area
as temperate to warm and sub-humid with a summer rainfall pattern, which reaches a maximum in
autumn and a minimum in winter. Rainfall variability is high with mean annual rainfall of 590 mm. Frost
may occur from the middle of June to the middle of August (Van Averbeke et al., 1998).
The scheme is composed of six villages, namely Zingcuka, Kamma-Furrow, Ngqumeya, Zanyokwe,
Lenye and Burnshill (Figure 2.1). Kammafurrow falls under the Nkonkobe municipality and all other
villages fall under the Amahlati District Municipality of the Amatole District. The scheme comprises 412 ha
of irrigated land. The land is subdivided into 174 food plots of 0.2 ha each and 64 farms of about 6 ha
each (Van Averbeke et al., 1998).Most of the land identified for irrigation was in private hands held under
quitrent and freehold tenure. Some portions, such as in Lenye are situated on trust land.
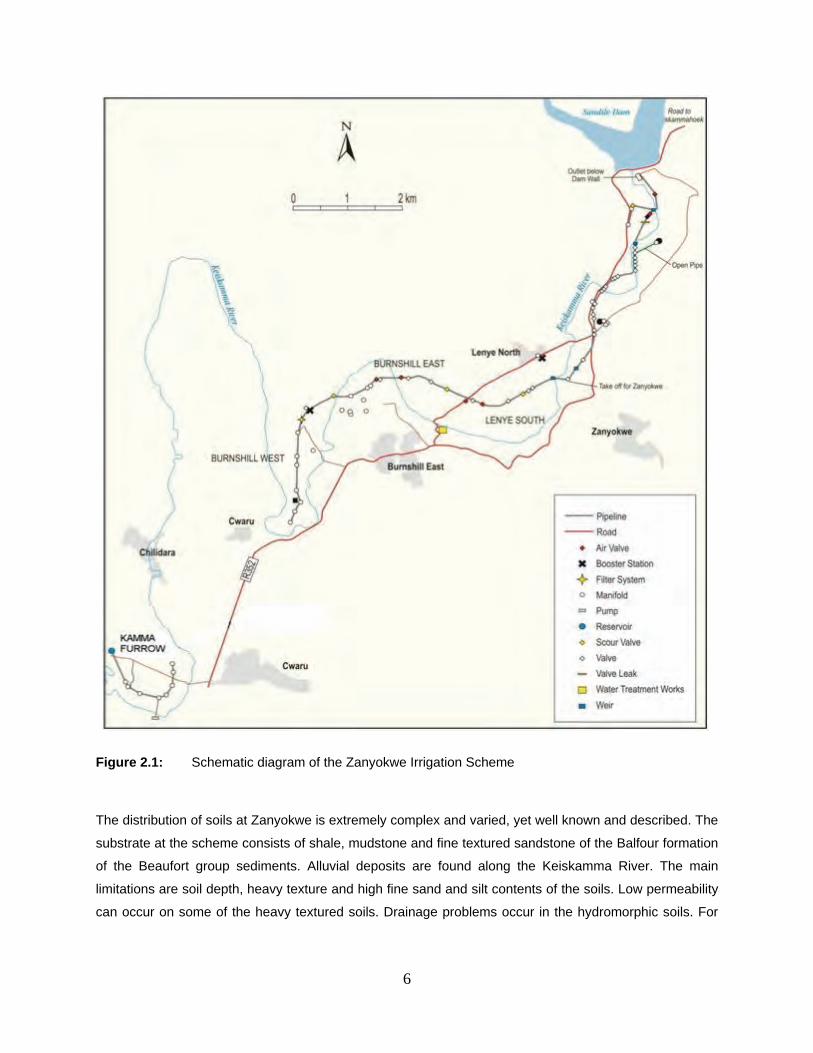
6
Figure 2.1: Schematic diagram of the Zanyokwe Irrigation Scheme
The distribution of soils at Zanyokwe is extremely complex and varied, yet well known and described. The
substrate at the scheme consists of shale, mudstone and fine textured sandstone of the Balfour formation
of the Beaufort group sediments. Alluvial deposits are found along the Keiskamma River. The main
limitations are soil depth, heavy texture and high fine sand and silt contents of the soils. Low permeability
can occur on some of the heavy textured soils. Drainage problems occur in the hydromorphic soils. For
7
these reasons, the soils on Zanyokwe are classified as having moderate to low potential for irrigation
(Loxton Venn and Associates, 1983).
Water is supplied from the Sandile dam which was completed in 1983. The water is of good quality and
imposes no limitations in its use for purposes of irrigation. The water supply consists of a single main pipe
line from Sandile dam, with nine off-take points along the pipeline to distribute water to the scheme
(Stevens, 2007). Tlou et al. (2006) cite that the scheme has five off-take points each served by electrical
pump, nine reservoirs and nine booster pumps each serving a small block of irrigated lands, implying
some modification to the scheme since its construction. Most of the fields are irrigated by gravity from the
pipeline, except for Lenye North where water has to be pumped to a reservoir, from where irrigation is
done by gravity. The high cost of delivering water to field edge makes water supply at ZIS an expensive
operation, requiring a considerable amount of electrical energy and daily maintenance of pumps. At
Kammafurrow, water is pumped directly from the river.
The Loxton and Venn model of a core estate farm on 75-90% of available land and “food plots” for use by
farmers on remaining land was used with some modification in the development of ZIS. The
Development Bank of Southern Africa (DBSA) financed the scheme and in the quest for viability, land
holdings of two or more owners were consolidated to form “economically viable farming units”. The
owners appointed “nominee farmers” who received formal training at Fort Cox College and practical
training on the estate farm during the estate phase. Training started in 1988 and the handing over of farm
units to “nominee farmers” in 1989 to 1991. Owners were paid rent for land used in the development of
infrastructure and agriculture.
From 1989 to 1991 “nominee farmers” were allowed to farm on a “no-loss” basis, drew inputs and
mechanical operations from a central unit on credit and a monthly advance on production of R250. At the
end of the financial year the scheme paid farmers if they had a positive balance between income
expenses and income generated from crop sales. When the balance was negative, the debt incurred was
written-off. In 1994, independent ”nominee farmers” accessed loan funds directly from the Ciskei
Agricultural Bank but many failed to pay and did not honour land rental agreements. As a result,
landowners sub-divided the various “economically viable units” into various individually owned parcels.
Disputes regarding boundaries of land parcels and access to hydrants (which were not positioned on all
parcels of individual farmers) led to tension and quarrels amongst landowners (Van Averbeke, 1995 and
1996).
The Eastern Cape Department of Agriculture injected funding to rationalise activities at Zanyokwe in 1994
following re-incorporation of the former Ciskei into South Africa. A brief period of success in vegetable
8
production was followed by collapse of the scheme and destruction of all properties belonging to the
scheme when government withdrew funding. The Zanyokwe Agricultural Development Trust was formed
in 2001 based on the principles that it would be the custodian of the assets of the ZIS and would be
responsible for the preservation of the common assets and provision of services to the community (Neven
et al., 2005).
The research that is presented in this report was funded by the Water Research Commission (WRC) with
the objective of identifying best management practices for small-scale irrigation. The goal and objectives
that informed the research agenda are presented in Figure 1.1. The research agenda was informed by a
situation analysis (Monde et al., 2005) some aspects of which are described in section 2.2. A participatory
process was used to agree on options for addressing constraints identified in ZIS (section 2.3). The
implementation of these options and results obtained are presented in sections 2.4 to 2.10.
2.2 Identification of socio-economic, institutional, infrastructural, and biophysical
constraints
2.2.1 Background
In order to identify, prioritise and address the constraints faced by irrigation farmers, it is necessary to
develop a common model of the system within which they operate. According to Nicholas (1990), such a
model should take into account the following:
The objective of the system and how it can be measured
The resources of the system
The elements to the system (tasks)
The environment and constraints of the system, and
The management of the system.
A model of irrigated agricultural production system in smallholder setting is presented in Figure 2.2. The
objective of the system is to enable small-scale farmers to earn a livelihood from irrigated crop production
in line with the general objective of the research project viz: “to develop and implement technologies and
knowledge useful for farmers in order to improve rural livelihoods”.
In order to reach this objective, farmers need access to various resources at different stages of
production. The main resources required are land, water, production capital and various other production
inputs (seeds / seedlings, fertiliser, chemicals, labour, etc.). Water here refers to its availability as
influenced by both its natural supply and by scheme infrastructure and management. Land includes not
only the physical area (size) but also its suitability for irrigation (quality) and the tenure system
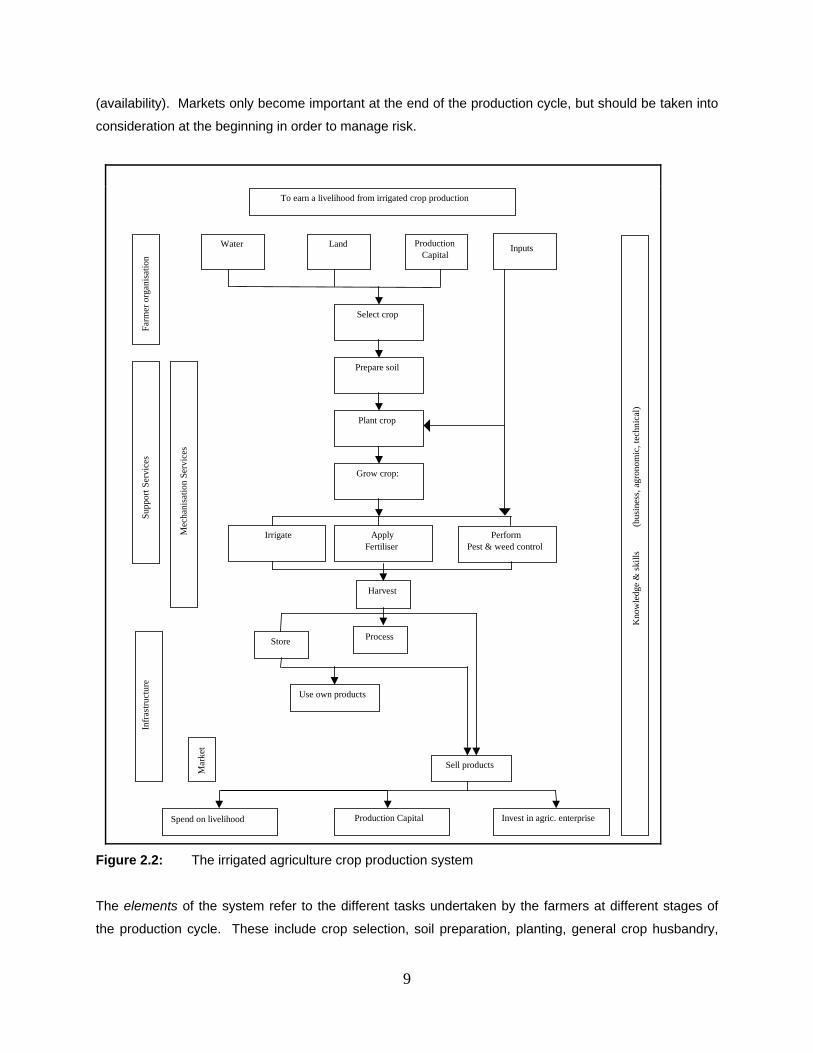
9
(availability). Markets only become important at the end of the production cycle, but should be taken into
consideration at the beginning in order to manage risk.
Figure 2.2: The irrigated agriculture crop production system
The elements of the system refer to the different tasks undertaken by the farmers at different stages of
the production cycle. These include crop selection, soil preparation, planting, general crop husbandry,
Far
mer
org
anis
atio
n
ProductionCapital
Water Land Inputs
Plant crop
Select crop
Prepare soil
Grow crop:
Irrigate
Apply
FertiliserPerform
Pest & weed control
Harvest
Store
Sell products
Process
Production Capital Invest in agric. enterprise
Use own products
Sup
port
Ser
vice
s In
fras
truc
ture
Mec
hani
satio
n Se
rvic
es
Mar
ket
Kno
wle
dge
& s
kills
(
busi
ness
, agr
onom
ic, t
echn
ical
)
To earn a livelihood from irrigated crop production
Spend on livelihood
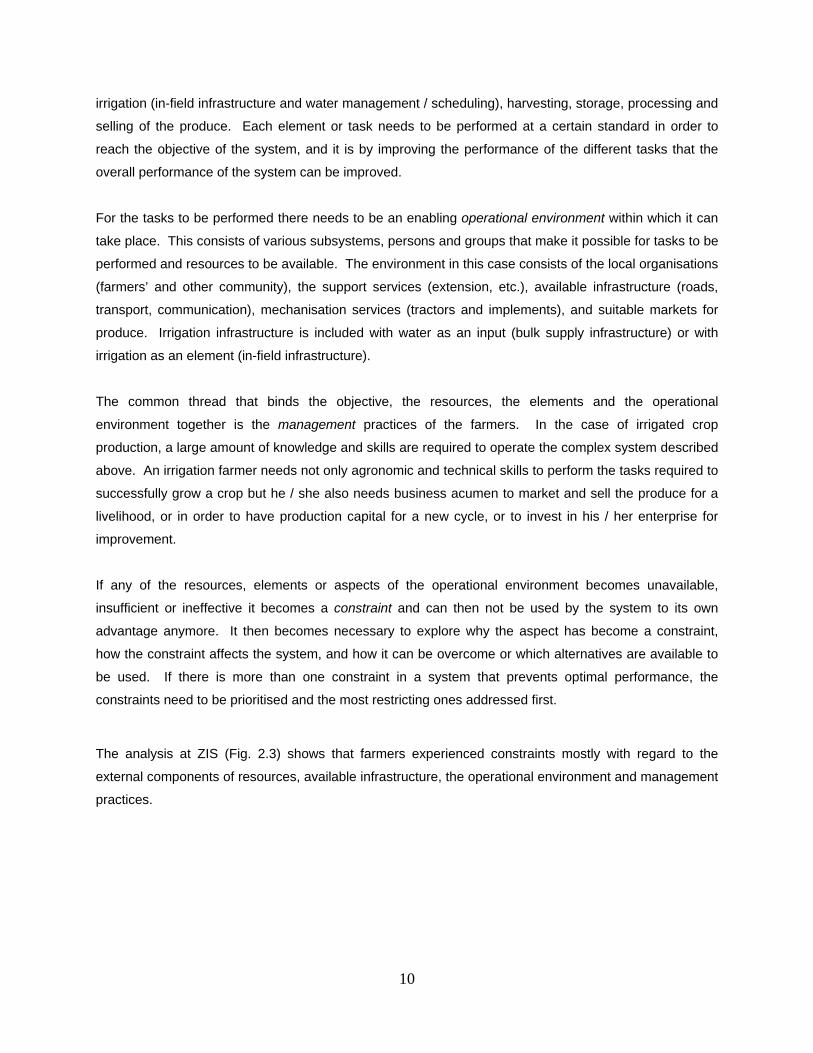
10
irrigation (in-field infrastructure and water management / scheduling), harvesting, storage, processing and
selling of the produce. Each element or task needs to be performed at a certain standard in order to
reach the objective of the system, and it is by improving the performance of the different tasks that the
overall performance of the system can be improved.
For the tasks to be performed there needs to be an enabling operational environment within which it can
take place. This consists of various subsystems, persons and groups that make it possible for tasks to be
performed and resources to be available. The environment in this case consists of the local organisations
(farmers’ and other community), the support services (extension, etc.), available infrastructure (roads,
transport, communication), mechanisation services (tractors and implements), and suitable markets for
produce. Irrigation infrastructure is included with water as an input (bulk supply infrastructure) or with
irrigation as an element (in-field infrastructure).
The common thread that binds the objective, the resources, the elements and the operational
environment together is the management practices of the farmers. In the case of irrigated crop
production, a large amount of knowledge and skills are required to operate the complex system described
above. An irrigation farmer needs not only agronomic and technical skills to perform the tasks required to
successfully grow a crop but he / she also needs business acumen to market and sell the produce for a
livelihood, or in order to have production capital for a new cycle, or to invest in his / her enterprise for
improvement.
If any of the resources, elements or aspects of the operational environment becomes unavailable,
insufficient or ineffective it becomes a constraint and can then not be used by the system to its own
advantage anymore. It then becomes necessary to explore why the aspect has become a constraint,
how the constraint affects the system, and how it can be overcome or which alternatives are available to
be used. If there is more than one constraint in a system that prevents optimal performance, the
constraints need to be prioritised and the most restricting ones addressed first.
The analysis at ZIS (Fig. 2.3) shows that farmers experienced constraints mostly with regard to the
external components of resources, available infrastructure, the operational environment and management
practices.
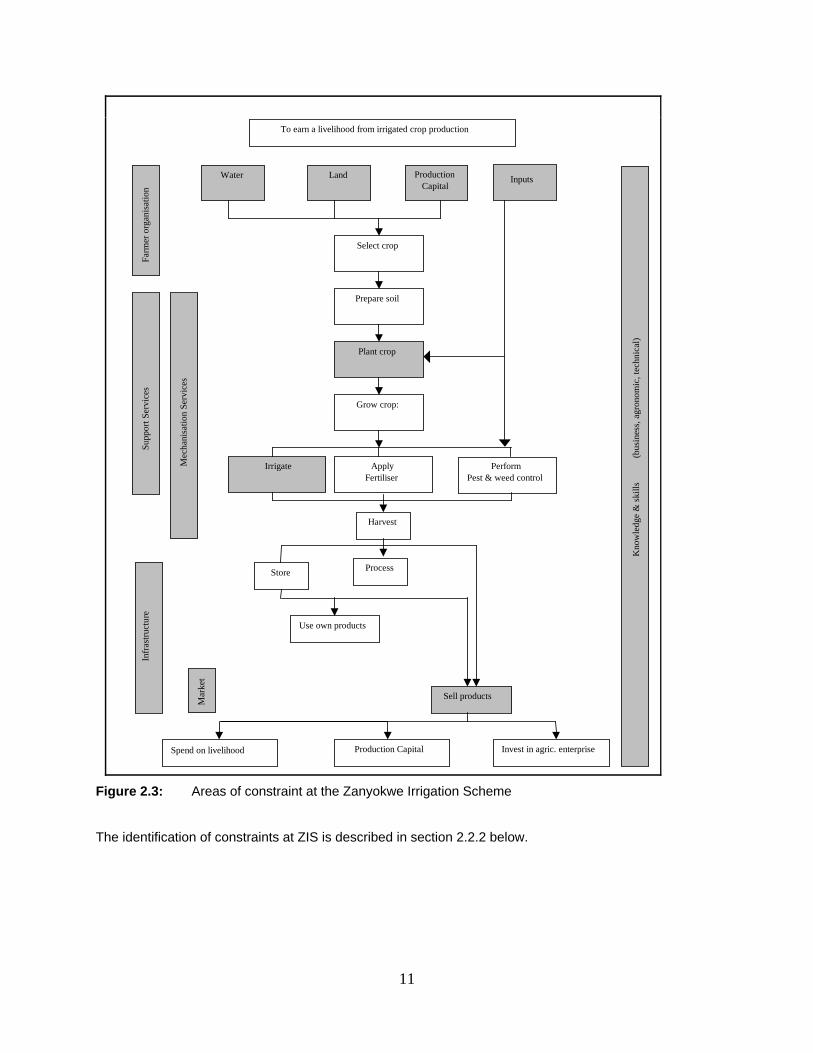
11
Figure 2.3: Areas of constraint at the Zanyokwe Irrigation Scheme
The identification of constraints at ZIS is described in section 2.2.2 below.
Far
mer
org
anis
atio
n
ProductionCapital
Water Land Inputs
Plant crop
Select crop
Prepare soil
Grow crop:
Irrigate
Apply
FertiliserPerform
Pest & weed control
Harvest
Store
Sell products
Process
Production Capital Invest in agric. enterprise
Use own products
Sup
port
Ser
vice
s In
fras
truc
ture
Mec
hani
satio
n Se
rvic
es
Mar
ket
Kno
wle
dge
& s
kills
(
busi
ness
, agr
onom
ic, t
echn
ical
)
To earn a livelihood from irrigated crop production
Spend on livelihood
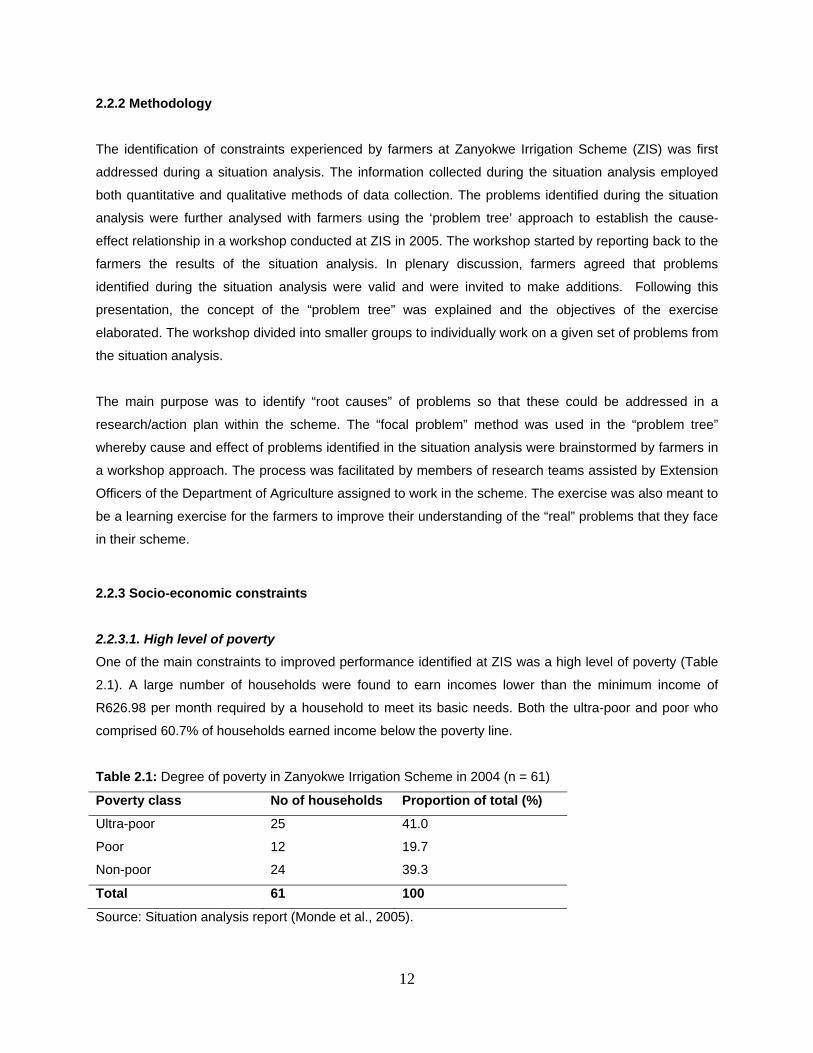
12
2.2.2 Methodology
The identification of constraints experienced by farmers at Zanyokwe Irrigation Scheme (ZIS) was first
addressed during a situation analysis. The information collected during the situation analysis employed
both quantitative and qualitative methods of data collection. The problems identified during the situation
analysis were further analysed with farmers using the ‘problem tree’ approach to establish the cause-
effect relationship in a workshop conducted at ZIS in 2005. The workshop started by reporting back to the
farmers the results of the situation analysis. In plenary discussion, farmers agreed that problems
identified during the situation analysis were valid and were invited to make additions. Following this
presentation, the concept of the “problem tree” was explained and the objectives of the exercise
elaborated. The workshop divided into smaller groups to individually work on a given set of problems from
the situation analysis.
The main purpose was to identify “root causes” of problems so that these could be addressed in a
research/action plan within the scheme. The “focal problem” method was used in the “problem tree”
whereby cause and effect of problems identified in the situation analysis were brainstormed by farmers in
a workshop approach. The process was facilitated by members of research teams assisted by Extension
Officers of the Department of Agriculture assigned to work in the scheme. The exercise was also meant to
be a learning exercise for the farmers to improve their understanding of the “real” problems that they face
in their scheme.
2.2.3 Socio-economic constraints
2.2.3.1. High level of poverty
One of the main constraints to improved performance identified at ZIS was a high level of poverty (Table
2.1). A large number of households were found to earn incomes lower than the minimum income of
R626.98 per month required by a household to meet its basic needs. Both the ultra-poor and poor who
comprised 60.7% of households earned income below the poverty line.
Table 2.1: Degree of poverty in Zanyokwe Irrigation Scheme in 2004 (n = 61)
Poverty class No of households Proportion of total (%)
Ultra-poor 25 41.0
Poor 12 19.7
Non-poor 24 39.3
Total 61 100
Source: Situation analysis report (Monde et al., 2005).
13
Causes of poverty were identified as limited access to credit to finance crop production, lack of financial
capital, and high levels of expenditure for education and health that limit investment in crop production.
Farmers prioritised the lack of working capital as the main problem contributing to their poverty. They
mentioned failure to repay loans as an underlying problem that limited their access to credit. The low
levels of household incomes, lack of access to credit, and limited ownership of economic assets all posed
threats to farming as the acquisition of inputs (seed, fertiliser and hiring of tractors) and hiring of labour all
depended on this capital.
2.2.3.2 Lack of stable markets
The markets in the immediate vicinity of ZIS were insufficient to absorb all the produce. Therefore,
farmers had to look beyond their immediate surroundings to markets in urban areas. This implied the
need for transport, information about those markets in terms of supply and demand and prices. ZIS was
at a disadvantage in terms of its location in relation to these markets and had to deal with competition
from other schemes with favourable location in terms of distance and accessibility and from a number of
commercial farmers with established linkages in the market place. Farmers brainstormed on the issue of
lack of access to markets and highlighted the following issues as underlying causes:
(i)The market was poorly organized. The underlying problem was absence of cropping programmes.
Farmers had a tendency of planting the same crops at different times resulting in high transaction costs or
at worst produce that could not be sold.
(ii)The involvement of middlemen in the sale of certain products did not seem to be helpful. Farmers felt
that these people cheated instead of helping them sell their produce.
(iii) Some farmers entered into contractual agreements on the sale of crop products without written
contracts.
(iv) Lack of transport to take produce to the market. Farmers did not own a truck and hence relied on
hiring from outside people. The problem with hired transport arose when only a few farmers (one or two)
had produce to sell. The costs became too high for the few farmers as volumes produced and transported
failed to cover transport costs resulting in low margins.
(v) Poor roads resulted in the unwillingness of transporters to service the scheme during the wet season
resulting in spoilage of produce.
(vi) Lack of regulation for pricing of products. Prices of products varied from one farmer to the next and
buyers tended to purchase produce from the less expensive farmers.
14
2.2.4 Institutional constraints and organisational relationships
2.2.4.1 A complicated land tenure system
During the period 1989 to 1994, ‘nominee farmers’ farmed in the irrigation scheme and landowners were
paid rent for use of their land. When the estate system described in 2.1 collapsed, landholders
repossessed their plots, but some have not been able to utilize them fully. In the current situation, non-
landholders who are interested in farming rent land but some landholders prefer not to lease out their
land. This has resulted in the underutilization of productive land and water in the scheme.
Most land right holders maintain that without secure tenure through title or certificate of occupancy,
evidence of ownership or rights over property on that land is not guaranteed. In the interest of intensive
use of irrigated land, it is important that land holding households no longer interested in or no longer
capable of producing on their land allocation feel secure to make their land available to other households
seeking access to more land. The willingness of households to enter into land transactions will depend on
the prevailing security of tenure. In the case of ZIS, it is not clear if the unwillingness by some landholders
to lease out irrigated plots noted in the situation analysis is related to fear that the lessee might over time
lay claim to the irrigated plot.
2.2.4.2 Weak farmer organization
The problem of weak farmer organisation in ZIS was identified by Van Averbeke et al. (1998) and this has
persisted as this study also identified the same to be a problem in 2005. The recommendation made by
Van Averbeke et al. (1998) to initiate a process of developing effective farmer organization seemed to not
have been acted upon. The effects of the past institutional arrangements are that farmers developed a
high degree of dependency on scheme services with respect to water supply and land preparation.
Discussion with farmers at ZIS identified a number of causes of weak farmer organization.
(i) Lack of cohesion amongst the different associations: Each section of the scheme had its own
association and these associations tended to have conflicting views and needs and could not
agree on common objectives.
(ii) Irregular meetings: Associations did not call for and hold meetings as agreed in terms of the
regulations of the associations. Poor leadership was identified as the underlying problem.
(iii) Poor extension service: For many years there was no extension officer attached to the
scheme to provide support to the farmers. The situation had changed by the beginning of the
BMP but support was still minimal as visits to the scheme by Extension Officers tended to be
few due to lack of transport.
(iv) Lack of trust amongst farmers: Active farmers who usually attended meetings came from only
a few of the associations. When these farmers then called for report back meetings to brief
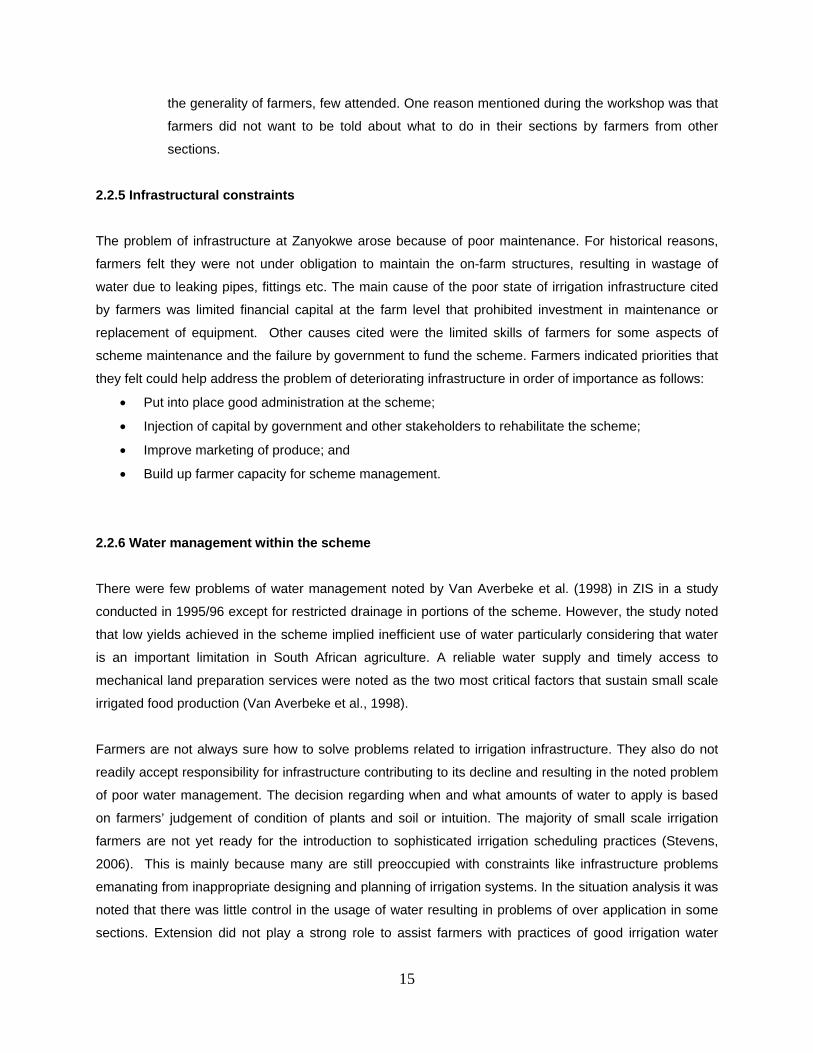
15
the generality of farmers, few attended. One reason mentioned during the workshop was that
farmers did not want to be told about what to do in their sections by farmers from other
sections.
2.2.5 Infrastructural constraints
The problem of infrastructure at Zanyokwe arose because of poor maintenance. For historical reasons,
farmers felt they were not under obligation to maintain the on-farm structures, resulting in wastage of
water due to leaking pipes, fittings etc. The main cause of the poor state of irrigation infrastructure cited
by farmers was limited financial capital at the farm level that prohibited investment in maintenance or
replacement of equipment. Other causes cited were the limited skills of farmers for some aspects of
scheme maintenance and the failure by government to fund the scheme. Farmers indicated priorities that
they felt could help address the problem of deteriorating infrastructure in order of importance as follows:
Put into place good administration at the scheme;
Injection of capital by government and other stakeholders to rehabilitate the scheme;
Improve marketing of produce; and
Build up farmer capacity for scheme management.
2.2.6 Water management within the scheme
There were few problems of water management noted by Van Averbeke et al. (1998) in ZIS in a study
conducted in 1995/96 except for restricted drainage in portions of the scheme. However, the study noted
that low yields achieved in the scheme implied inefficient use of water particularly considering that water
is an important limitation in South African agriculture. A reliable water supply and timely access to
mechanical land preparation services were noted as the two most critical factors that sustain small scale
irrigated food production (Van Averbeke et al., 1998).
Farmers are not always sure how to solve problems related to irrigation infrastructure. They also do not
readily accept responsibility for infrastructure contributing to its decline and resulting in the noted problem
of poor water management. The decision regarding when and what amounts of water to apply is based
on farmers’ judgement of condition of plants and soil or intuition. The majority of small scale irrigation
farmers are not yet ready for the introduction to sophisticated irrigation scheduling practices (Stevens,
2006). This is mainly because many are still preoccupied with constraints like infrastructure problems
emanating from inappropriate designing and planning of irrigation systems. In the situation analysis it was
noted that there was little control in the usage of water resulting in problems of over application in some
sections. Extension did not play a strong role to assist farmers with practices of good irrigation water
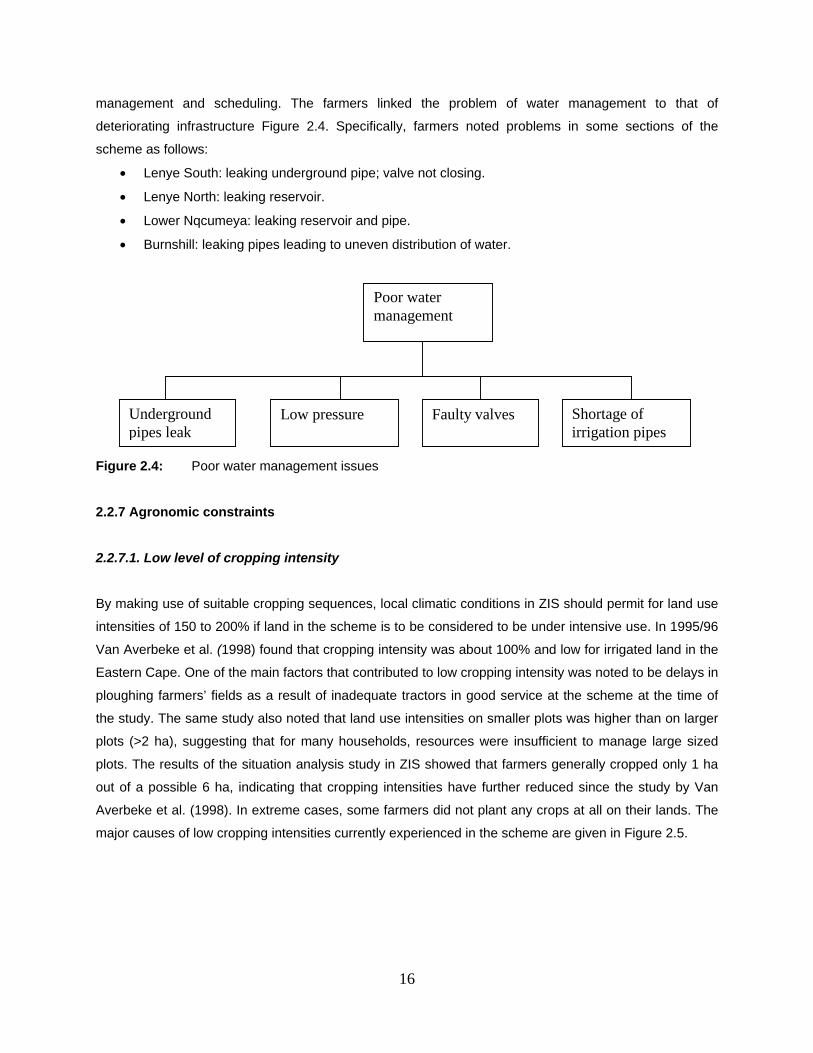
16
management and scheduling. The farmers linked the problem of water management to that of
deteriorating infrastructure Figure 2.4. Specifically, farmers noted problems in some sections of the
scheme as follows:
Lenye South: leaking underground pipe; valve not closing.
Lenye North: leaking reservoir.
Lower Nqcumeya: leaking reservoir and pipe.
Burnshill: leaking pipes leading to uneven distribution of water.
Figure 2.4: Poor water management issues
2.2.7 Agronomic constraints
2.2.7.1. Low level of cropping intensity
By making use of suitable cropping sequences, local climatic conditions in ZIS should permit for land use
intensities of 150 to 200% if land in the scheme is to be considered to be under intensive use. In 1995/96
Van Averbeke et al. (1998) found that cropping intensity was about 100% and low for irrigated land in the
Eastern Cape. One of the main factors that contributed to low cropping intensity was noted to be delays in
ploughing farmers’ fields as a result of inadequate tractors in good service at the scheme at the time of
the study. The same study also noted that land use intensities on smaller plots was higher than on larger
plots (>2 ha), suggesting that for many households, resources were insufficient to manage large sized
plots. The results of the situation analysis study in ZIS showed that farmers generally cropped only 1 ha
out of a possible 6 ha, indicating that cropping intensities have further reduced since the study by Van
Averbeke et al. (1998). In extreme cases, some farmers did not plant any crops at all on their lands. The
major causes of low cropping intensities currently experienced in the scheme are given in Figure 2.5.
Poor water management
Underground pipes leak
Low pressure Faulty valves Shortage of irrigation pipes
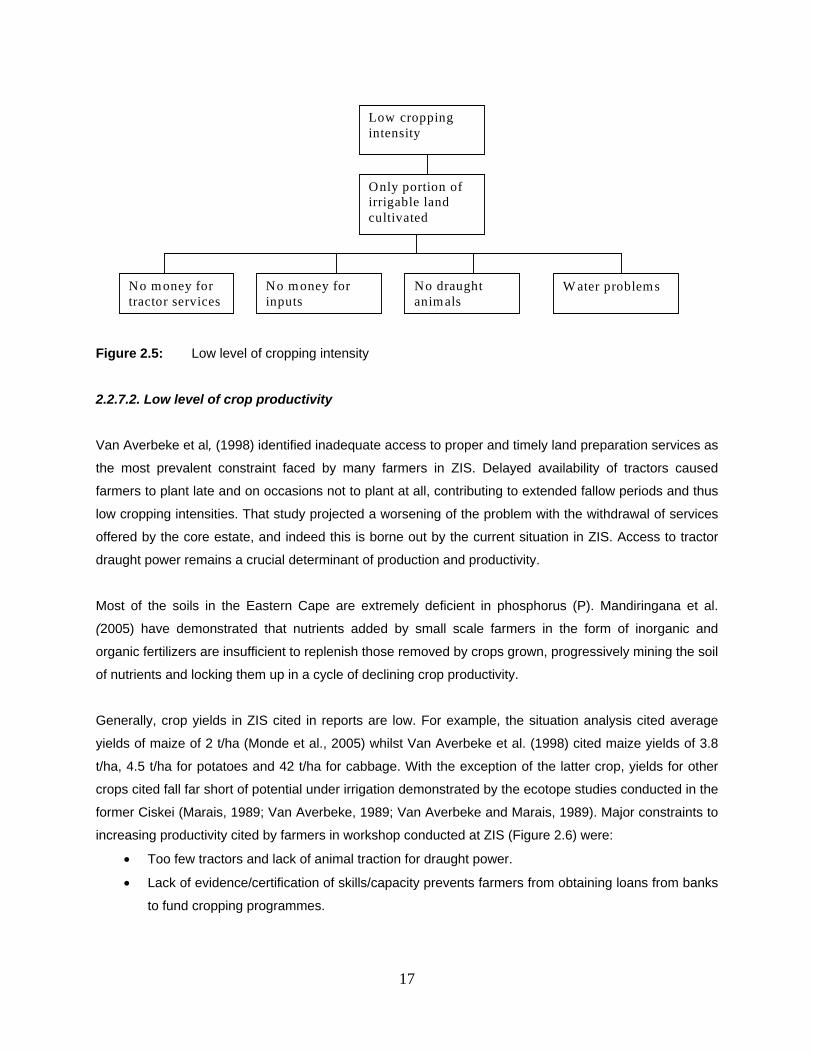
17
Figure 2.5: Low level of cropping intensity
2.2.7.2. Low level of crop productivity
Van Averbeke et al, (1998) identified inadequate access to proper and timely land preparation services as
the most prevalent constraint faced by many farmers in ZIS. Delayed availability of tractors caused
farmers to plant late and on occasions not to plant at all, contributing to extended fallow periods and thus
low cropping intensities. That study projected a worsening of the problem with the withdrawal of services
offered by the core estate, and indeed this is borne out by the current situation in ZIS. Access to tractor
draught power remains a crucial determinant of production and productivity.
Most of the soils in the Eastern Cape are extremely deficient in phosphorus (P). Mandiringana et al.
(2005) have demonstrated that nutrients added by small scale farmers in the form of inorganic and
organic fertilizers are insufficient to replenish those removed by crops grown, progressively mining the soil
of nutrients and locking them up in a cycle of declining crop productivity.
Generally, crop yields in ZIS cited in reports are low. For example, the situation analysis cited average
yields of maize of 2 t/ha (Monde et al., 2005) whilst Van Averbeke et al. (1998) cited maize yields of 3.8
t/ha, 4.5 t/ha for potatoes and 42 t/ha for cabbage. With the exception of the latter crop, yields for other
crops cited fall far short of potential under irrigation demonstrated by the ecotope studies conducted in the
former Ciskei (Marais, 1989; Van Averbeke, 1989; Van Averbeke and Marais, 1989). Major constraints to
increasing productivity cited by farmers in workshop conducted at ZIS (Figure 2.6) were:
Too few tractors and lack of animal traction for draught power.
Lack of evidence/certification of skills/capacity prevents farmers from obtaining loans from banks
to fund cropping programmes.
Low cropping intensity
No money for tractor services
No money for inputs
No draught animals
W ater problems
Only portion of irrigable land cultivated
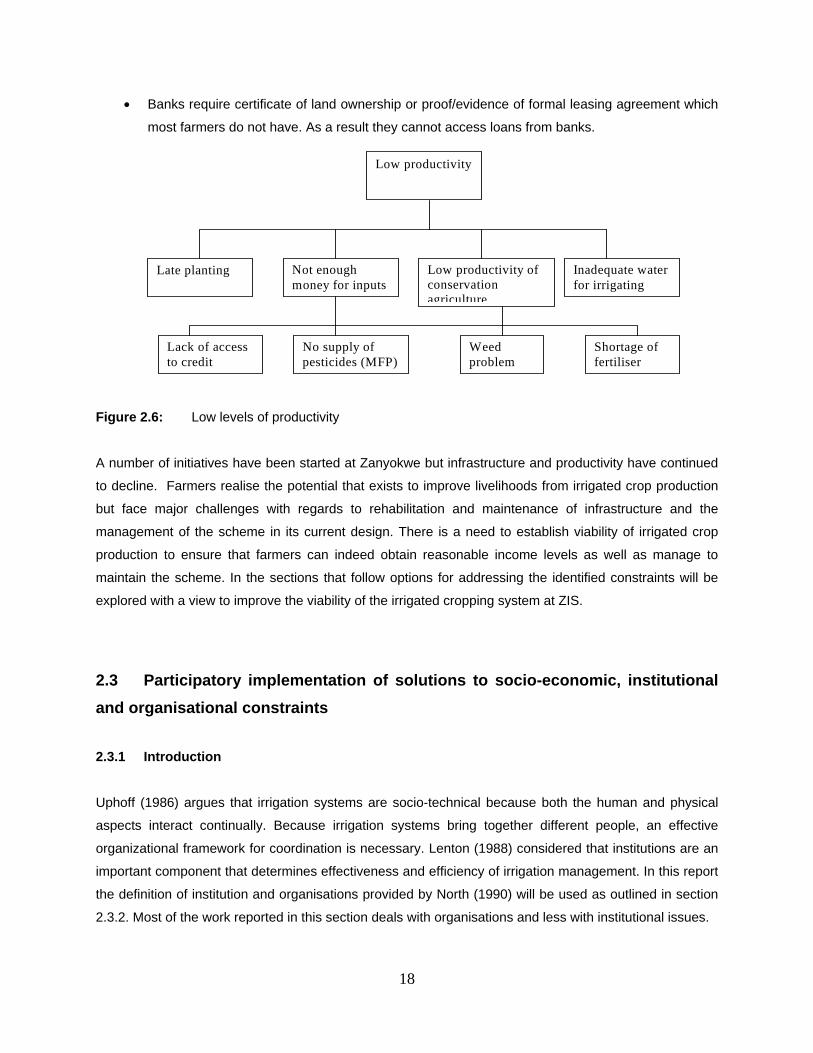
18
Banks require certificate of land ownership or proof/evidence of formal leasing agreement which
most farmers do not have. As a result they cannot access loans from banks.
Figure 2.6: Low levels of productivity
A number of initiatives have been started at Zanyokwe but infrastructure and productivity have continued
to decline. Farmers realise the potential that exists to improve livelihoods from irrigated crop production
but face major challenges with regards to rehabilitation and maintenance of infrastructure and the
management of the scheme in its current design. There is a need to establish viability of irrigated crop
production to ensure that farmers can indeed obtain reasonable income levels as well as manage to
maintain the scheme. In the sections that follow options for addressing the identified constraints will be
explored with a view to improve the viability of the irrigated cropping system at ZIS.
2.3 Participatory implementation of solutions to socio-economic, institutional
and organisational constraints
2.3.1 Introduction
Uphoff (1986) argues that irrigation systems are socio-technical because both the human and physical
aspects interact continually. Because irrigation systems bring together different people, an effective
organizational framework for coordination is necessary. Lenton (1988) considered that institutions are an
important component that determines effectiveness and efficiency of irrigation management. In this report
the definition of institution and organisations provided by North (1990) will be used as outlined in section
2.3.2. Most of the work reported in this section deals with organisations and less with institutional issues.
Low productivity
Late planting Not enough money for inputs
Low productivity of conservation agriculture
Inadequate water for irrigating
No supply of pesticides (MFP)
Weed problem
Shortage of fertiliser
Lack of access to credit
19
Access to reliable water supply is essential, though not a sufficient condition for sustainable development
in irrigated agriculture (Denison and Manona, 2007). While productive use depends on irrigation
technology, it will only be successful when market development and information supply to farmers are
made a core priority in the overall intervention design. (Merrey et al., 2003). The incentives brought about
by better market access can result in expanded production and the accompanying adoption of
productivity-enhancing technologies. It is for these reasons that the drive to improve market access is
central in any efforts aimed at developing smallholder agriculture for poverty reduction. (Al-Hassan et al.,
2006).
2.3.2 Incentives of secure water use and land use rights or entitlements
Farmers of ZIS, like those of Tugela Ferry and elsewhere on small scale irrigation schemes in South
Africa have a short history of access to land and water resources. The strategic deprivation of Africans of
these key resources occurred mainly in the 19th century (A.D.) and, over the years, it has created a
complex problem of poor institutional and organizational arrangements, especially in the former
homelands and Bantustan states of South Africa (Backeberg, 2007 and Eicher, 1999). According to
Eicher (1999) the problems of food insecurity, lack of skills and declining access of developmental
opportunities continue to be worse since the late 1950’s, when African states began to gain
independence from European colonizers. One of the challenges, and perhaps major impediments, to
solving the problems of small-scale farmers operating on the irrigation schemes that used to be managed
according the rules of separate development in favour of a minority of the well-trained and resourced
(white) population, is a frequent poor definition and distinction of institutions and organizations (Eicher,
1999). This mistake has led to poor alignment of institutions and organizations for successful and
sustainable development. Hence, before a specific discussion of institutional strengthening is made in this
chapter, it is necessary to define institutions, as being different from organizations; consequently the
relevant incentives of secure water and land use rights will be proposed in line with the situation
pertaining to ZIS and Tugela Ferry. That way, the reader will connect the reasoning and arguments made
throughout this document.
Institutions are defined as the rules, comprising the legal system, financial regulations, and property
rights, that nurture, protect and govern the operation of a market economy (North, 1990). On the other
hand, North (1990) defined organizations as bodies and/or vehicles of knowledge production and
dissemination, playing according to the rules. Examples of organizations were given as universities,
extension services and farmer cooperatives (Eicher, 1999).
Irrigated agriculture is characterized by interdependence among farmers occupying different levels of
access to water depending on (i) the location along the water canal/stream, (ii) capability to divert water to
20
one’s land at the right time and the rules of engagement among the farmers and those defined by
government policy on water use (Backeberg, 2009; Denison and Manona, 2007; Manona and Baiphethi,
2008; Van Averbeke, 2008). The physical interdependence could lead to inefficiencies in crop
management practices, and in some instances abandonment of crop production plots. For example,
Block 6 at Tugela Ferry was found abandoned during the period of the present study, mainly due to
conflicts arising from poor or lack of institutional arrangements.
At both ZIS and Tugela Ferry, farmers were found organized at the start of the present study. However,
investigations identified weaknesses in the way they were organized, largely due to lack of institutional
arrangements. Hence, farmers were subjected to inquisitive training sessions to determine their
eagerness to resolve the weaknesses in their operations. In the process, incentives for ownership of
water and land resources were identified from the perspectives of collective and individual satisfaction.
These perspectives are discussed in this chapter and are in congruence with the previous findings
(Drimie and Mini, 2003; Overseas Development Institute, 2001; Saleth, 2006).
2.3.3 Options for addressing identified socio-economic constraints
Organisational
The situation analysis conducted at the beginning of this project (Monde at al., 2005) revealed that many
of the problems at ZIS related to governance of the scheme, land tenure and the sharing of water. The
weakness of farmer organisation has been a recurring theme in studies conducted in ZIS for example
Van Averbeke et al. (1998). Therefore, the revitalization of ZIS hinged on the strengthening of farmer
organization. In order to strengthen the existing farmers’ organizations in ZIS and to improve their
effectiveness, the project team decided to undertake action research to:
Ensure that farmers’ organizations were registered as legal entities (including the formation of a
Water Users Association).
Build capacity of farmers’ organization committees and all members.
Build capacity of farmers on gender relations and equity, conflict management and resolution.
Train farmers on cooperative business management.
Train farmers on enterprise management, savings and inter-group associations.
Promote partnerships with rural organizations, NGOs and government to improve information
exchange and cooperation for achieving sustainable rural development and food security.
Form a stakeholders’ committee for the BMP in ZIS to advise, support and recommend measures
to ensure success of the project.
21
Socio-economic
Lack of capital and stable markets were two socio-economic problems prioritised by farmers in ZIS.
Further analysis indicated that lack of stable markets was at the core of poor performance and therefore
an important leverage point in improving performance of the scheme. Marketing is a process that involves
gathering of information about consumer preference, securing markets for produce, planning and
scheduling production, managing production, harvesting, grading, packaging, transporting and selling.
Without resources, skills and knowledge, it is difficult for farmers to compete in the market place.
Marketing is a complex interaction of issues that need careful analysis for informed intervention.
Therefore, in the case of ZIS a two-pronged strategy was agreed with the farmers. First, problems that
negatively impact on marketing at the scheme and are clearly understood in terms of cause and effect
would receive immediate attention. In this regard, one action agreed upon was the strengthening of
management structures of ZIS. Successful marketing depends on collective action as this allows the
farmers in a scheme to influence the markets to their advantage. Though cooperatives had been formed,
these were not fully functional as the leadership lacked appropriate training. Therefore in order to improve
the functionality of the organisational structures, various committees needed training on leadership,
management, conducting meetings and minute taking. It was also agreed that farmers needed exposure
to formal markets to learn more about marketing and this would be in-built into the first phase of the
marketing strategy. Second, a market study would be undertaken to learn more about marketing
problems at ZIS to feed into design of an action plan to address the problems.
2.3.4 Methodology
As with the other studies reported in different chapters of this report, implementation of solutions to socio-
economic and organisational constraints was conducted as participatory action research. The studies
employed both quantitative and qualitative methods of data collection to investigate socio-economic and
organisational settings at ZIS. Structured interview schedules (questionnaires) were used as tools to
gather quantitative data.
Analysis of organisational settings of ZIS
Data was collected during interactions with different stakeholders that included farmers in the scheme
and farmers outside the scheme, extension officers, traditional leaders, village chairpersons, scheme
committee chairpersons and the Agricultural and Rural Development Research Institute (ARDRI) staff at
the University of Fort Hare. Out of the six villages that make up ZIS, two villages Lenye and Burnshill
were purposefully selected because (i) the two villages are the most populated, and (ii) Burnshill has a
22
farmer cooperative while Lenye has a farmer association (Neven, Readon and Hopkins, 2005). In addition
to semi-structured questionnaires, key informant interviews were also carried out to investigate decision-
making process regarding the operation of the scheme, the maintenance of equipment and marketing of
the products. A focus group discussion was also carried out with the farmers at the scheme. Farmers
were asked to show the importance of different organisations in their lives and to indicate the type of
relationship they had with each of these. This was achieved through Venn diagramming. For the informal
interviews in Lenye and Burnshill, the sampling method used was random sampling using a snowball
chain sampling method. Eight out of the 21 farmers from Burnshill and 18 out of 38 farmers from Lenye
were interviewed.
Marketing of selected crops and vegetables at ZIS
The situation analysis of ZIS also revealed marketing of crops and vegetables to be a problem. A closer
look at the problem of marketing at ZIS indicated that the institutional environment and organisation
pertaining to marketing was weak. A study was therefore designed to address the marketing problems
experienced by farmers and to promote an efficient marketing system. The study was expected to be of
significance to farmers and to all those (researchers and policy planners) who are involved in the
development of small-scale farming sector. To the farmers, it would provide them with important
knowledge that could alter their marketing practices. To the researchers, it would encourage them to
provide the farmers with necessary information in an attempt to improve their marketing knowledge and
skills and provide the planners with current and real issues pertaining marketing by small-scale farmers.
To the policy planners, it would mean coming up with informed policies and addressing real life issues.
The study used both quantitative and qualitative methods of data collection. The data was gathered
during the period November 2005 to January 2006. A structured interview schedule (questionnaire) was
used as a tool to gather quantitative data. The tool elicited information on basic production practices for
the crops investigated, the reasons for growing these, resources used in their production, the areas
planted, yields obtained as well as incomes realised. The larger part of the study was the qualitative
investigation. For this part of investigation, data were collected through semi-structured interviews.
The qualitative investigation sought explanations from farmers regarding their marketing practices by
applying the conceptual framework to the study of marketing institutions as was developed by Grewal and
Dharwadkar (2001). As was the case with situation analysis (Monde et al., 2005), the unit of analysis was
the farming household. Using the results of the situation analysis, a probability sampling technique
(systematic) was used to select farming households. The aim was to select at least one third of
respondents interviewed during the situation analysis, which represented all the sections. The study also
targeted those farmers who were involved in contract marketing system. The intention was to document
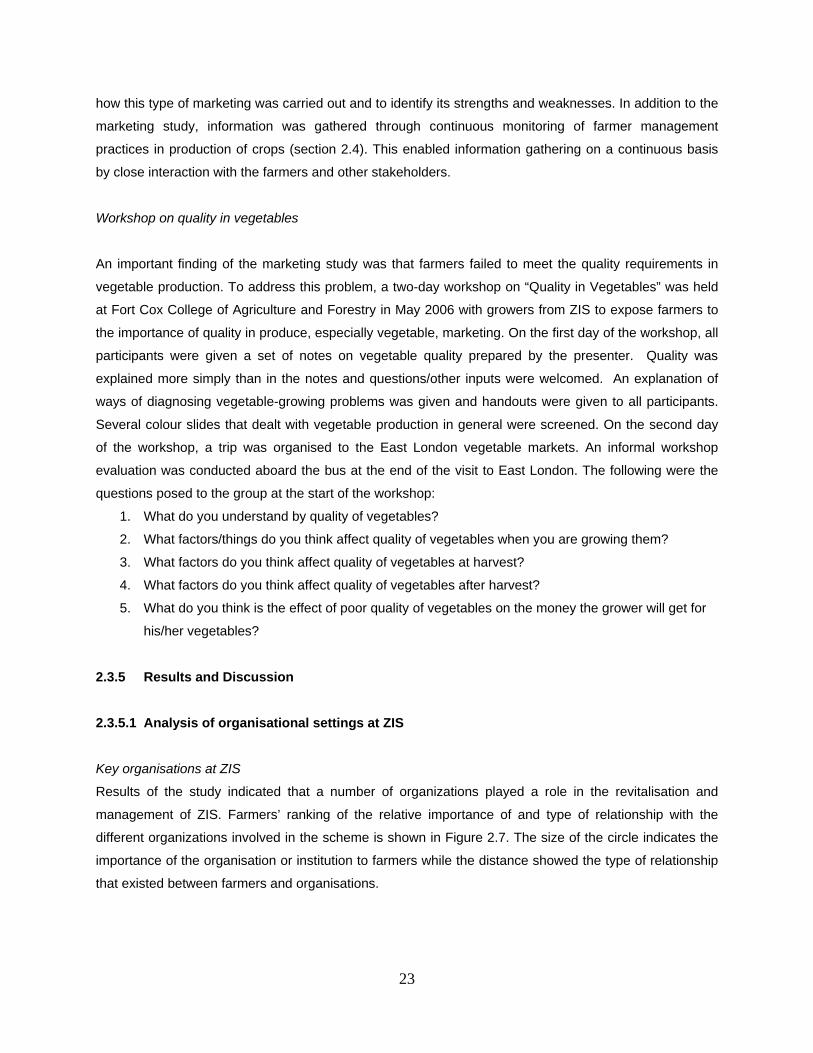
23
how this type of marketing was carried out and to identify its strengths and weaknesses. In addition to the
marketing study, information was gathered through continuous monitoring of farmer management
practices in production of crops (section 2.4). This enabled information gathering on a continuous basis
by close interaction with the farmers and other stakeholders.
Workshop on quality in vegetables
An important finding of the marketing study was that farmers failed to meet the quality requirements in
vegetable production. To address this problem, a two-day workshop on “Quality in Vegetables” was held
at Fort Cox College of Agriculture and Forestry in May 2006 with growers from ZIS to expose farmers to
the importance of quality in produce, especially vegetable, marketing. On the first day of the workshop, all
participants were given a set of notes on vegetable quality prepared by the presenter. Quality was
explained more simply than in the notes and questions/other inputs were welcomed. An explanation of
ways of diagnosing vegetable-growing problems was given and handouts were given to all participants.
Several colour slides that dealt with vegetable production in general were screened. On the second day
of the workshop, a trip was organised to the East London vegetable markets. An informal workshop
evaluation was conducted aboard the bus at the end of the visit to East London. The following were the
questions posed to the group at the start of the workshop:
1. What do you understand by quality of vegetables?
2. What factors/things do you think affect quality of vegetables when you are growing them?
3. What factors do you think affect quality of vegetables at harvest?
4. What factors do you think affect quality of vegetables after harvest?
5. What do you think is the effect of poor quality of vegetables on the money the grower will get for
his/her vegetables?
2.3.5 Results and Discussion
2.3.5.1 Analysis of organisational settings at ZIS
Key organisations at ZIS
Results of the study indicated that a number of organizations played a role in the revitalisation and
management of ZIS. Farmers’ ranking of the relative importance of and type of relationship with the
different organizations involved in the scheme is shown in Figure 2.7. The size of the circle indicates the
importance of the organisation or institution to farmers while the distance showed the type of relationship
that existed between farmers and organisations.
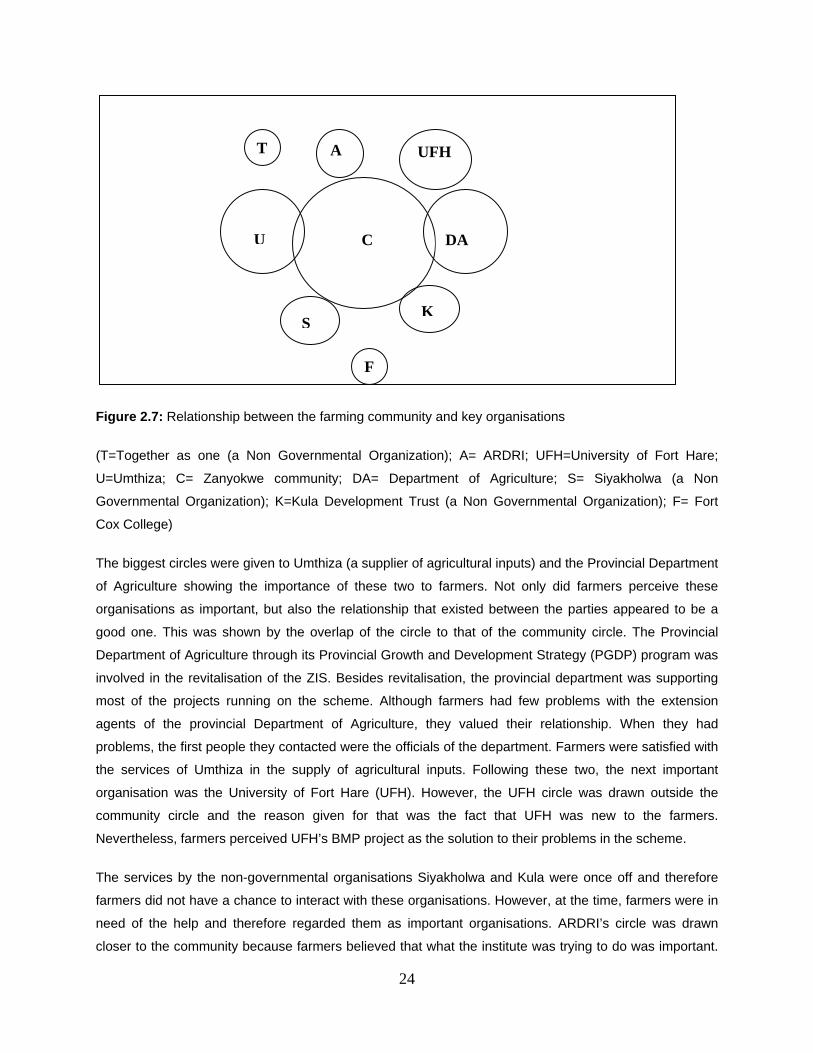
24
Figure 2.7: Relationship between the farming community and key organisations
(T=Together as one (a Non Governmental Organization); A= ARDRI; UFH=University of Fort Hare;
U=Umthiza; C= Zanyokwe community; DA= Department of Agriculture; S= Siyakholwa (a Non
Governmental Organization); K=Kula Development Trust (a Non Governmental Organization); F= Fort
Cox College)
The biggest circles were given to Umthiza (a supplier of agricultural inputs) and the Provincial Department
of Agriculture showing the importance of these two to farmers. Not only did farmers perceive these
organisations as important, but also the relationship that existed between the parties appeared to be a
good one. This was shown by the overlap of the circle to that of the community circle. The Provincial
Department of Agriculture through its Provincial Growth and Development Strategy (PGDP) program was
involved in the revitalisation of the ZIS. Besides revitalisation, the provincial department was supporting
most of the projects running on the scheme. Although farmers had few problems with the extension
agents of the provincial Department of Agriculture, they valued their relationship. When they had
problems, the first people they contacted were the officials of the department. Farmers were satisfied with
the services of Umthiza in the supply of agricultural inputs. Following these two, the next important
organisation was the University of Fort Hare (UFH). However, the UFH circle was drawn outside the
community circle and the reason given for that was the fact that UFH was new to the farmers.
Nevertheless, farmers perceived UFH’s BMP project as the solution to their problems in the scheme.
The services by the non-governmental organisations Siyakholwa and Kula were once off and therefore
farmers did not have a chance to interact with these organisations. However, at the time, farmers were in
need of the help and therefore regarded them as important organisations. ARDRI’s circle was drawn
closer to the community because farmers believed that what the institute was trying to do was important.
UFH A
F
C DA U
K
T
S
25
Farmers in Zanyokwe are faced with marketing problems, which ARDRI to a certain extent tried to solve.
Nevertheless, according to farmers, the relationship is not a good one. The last two, Fort Cox and
Together as One (a non-governmental organization) were given the smallest circles and were drawn far
away from the community circle. These two were involved in the training of farmers but apparently,
farmers were not happy with the service. Training is one of the priority needs of farmers in Zanyokwe.
They were of the opinion that Fort Cox’s involvement should be more than just to organise training
courses for them. They needed the college to interact with them on a more frequent basis and help them
solve their daily problems.
Other important organisations, which were not included in the ranking by farmers, were the Department of
Public Works, the then Department of Water Affairs and Forestry (DWAF) and Amathole municipality. The
Department of Public Works co-ordinated the Expanded Public Works Programme (EPWP) as a
mechanism for alleviating poverty in the province. The Department of Public Works and DWAF injected
funds for upgrading the scheme. DWAF was responsible for the provision of water supply and sanitation
services to households, by means of local and provincial agencies. Amathole Municipality acted as the
Water Service authority and under it are the Water Service Providers, which include the local
municipalities and the Amathole Water Board. The water board was responsible for the provision of water
to the scheme.
Lack of farmer organisations/associations was identified as the main drawback preventing farmers from
accessing services from the government, e.g. grants for resource poor farmers that seek to support legal
entities. It was agreed that a scheme-wide farmer association be established. Previous experiences by
the farmers showed that inappropriate representation results in failure of the management committees at
the scheme. To avoid the recurrence of committee failures it was suggested that the bona fide irrigation
scheme members form a scheme-wide committee. The committee should drive the establishment of a
Water User’s Associations, with assistance from DWAF. The WUA will also take responsibility for all the
institutional issues related to markets, management of production cycles on the scheme.
2.3.5.2 Organisational strengthening
Formation of Primary Cooperatives and a Central Cooperative
At the start of the project, the Zanyokwe Agricultural Development Trust (ZADT) was the most important
organisational structure at scheme level and had been established to manage the irrigation infrastructure
(Monde et al., 2005). It was made up of 12 members (trustees), two from each village. One member was
a landowner and the other one was a tenant, leasing land from those community members not using their
land. The ZADT was a legal entity established to manage the irrigation infrastructure. However, lack of
clarity on membership of the Trust raised questions as to whether this was an active or dormant
26
association. The general feeling from the key role players was that the Trust had a good working
relationship with the community and its leadership structures, but some farmers indicated that they were
unhappy with the leadership of the Trust. The main responsibilities of the Trust were to organize and unite
farmers and to maintain infrastructure.
Some weaknesses and shortcomings noted with regard to the Trust by key informants included:
Lack of farmer participation in the affairs of the Trust e.g. poor attendance of meetings
Lack of co-operation or team- work when there are problems in the scheme
Ploughing late in the season because they had to share a tractor
Decision making did not involve everybody
Lack of stable markets because of poor coordination
Lack of capacity to drive the Trust
Low literacy levels
Due to the perceived weaknesses of the Trust and the fact that it was never registered, the Department of
Agriculture agreed with recommendations of the BMP researchers that a change in the organisational
arrangements at ZIS was necessary. The Trust was, consequently, disbanded in 2006 and the
Department of Agriculture encouraged the farmers to form the co-operatives. Four primary cooperatives
were registered and two were at advanced stages of registration at the termination of the project
activities. Registered cooperatives opened bank accounts, facilitating easier payment of proceeds from
joint marketing activities to members. As a result of their legal status, primary cooperatives can source
funds for members for productivity activities. However, none of the newly established cooperatives is yet
to use its legal status to negotiate any contracts on behalf of the membership.
A central Farmers’ Cooperative for the whole scheme was established at the same time to take the place
of the disbanded Trust. This Cooperative, which is a legal registered entity, consists of members from the
six different sections of the scheme who joined it as individuals. The main responsibilities of the central
co-op are to organize markets for various products, trade (outputs and inputs) as well as to solve
problems experienced by primary co-ops. Farmers indicated that since the establishment of the farmer’s
co-op, cooperation between different sections had improved. The unity between the different sections
was also a result of the effort of the Scheme Manager appointed by the Department of Agriculture in 2006
to lead the revitalization of the scheme. With the assistance of the Scheme Manager, farmers secured
funding from the National Development Agency (NDA) for furnishing offices of the central cooperative,
purchasing farm equipment and farmer training. The Small Enterprises Development Agency initiated
installation of 20 ha of drip irrigation in consultation with farmers. Other negotiations intended to diversify
production are underway but were yet to achieve results.
27
Early results of transformation from a Trust to Cooperatives showed movement in the right direction in
terms of organisational strengthening. For instance, barely a year after the formation of cooperatives, the
farmers sourced and received funding from the National Development Agency (NDA) totalling R295,
000.00 that was used for capacity building. In addition to this, 25 farmers were trained in bookkeeping
and financial management using proceeds from NDA. The Central Cooperative also procured a plough,
bush cutter, cultivator and a night watchman using this same funding.
Formation of a Producer Assembly, Producer Council, and Management Committee
The organizational structure of the central cooperative consists of a producer assembly, producer council
and a management committee. The producers’ assembly was already in place when project activities
terminated and is composed of 30 members, five from each of the six villages that make up ZIS. These
members are working with the newly appointed scheme manager to run the affairs of the scheme. Their
activities include all aspects affecting the scheme from production to marketing.
Twelve members of the Producers’ council came from the elected 30 members of the Producers
Assembly with an equal representation of the six villages. A Management Committee elected from the
membership of the Producers’ Council was set as the supreme body to run the affairs of the scheme. It
consists of six members one each from each of the six villages. The Management Committee’s role is to
oversee the activities of scheme members ensuring that they adhere to the rules and regulations used to
run the scheme. The Management Committee was tasked with the writing of a constitution that would be
used in the running the scheme. However, at the termination of the study, activities of this committee had
been put on hold until such time that they have received training to improve their management skills.
In an attempt to strengthen farmer organization, the producer assembly members received training on
financial management in 2006. The service provider was Didisha Consultancy, a firm that focuses on
equipping communities with management, leadership and financial management skills. The assembly
members were taught how to handle money, learnt about different kinds of banking accounts and how to
keep financial transactions. According to respondents, before training they used to have a savings
account. During training, they were advised to make use of a cheque account, which they did. The main
advantage of using a cheque account is to minimize fraud and theft, as two signatories are needed as
opposed to one in the case of the savings account previously operated by the farmers. Ever since the
training, farmers keep own financial records and from time to time, these records are compared against
bank statements. Respondents were satisfied with the training they got. However, nothing has been done
yet to improve leadership, the conduct of meetings, and to improve reporting.
28
Water Users Association
A Water User Association (WUA) was in the process of being registered with the help of the provincial
DWA. The process of formation of the WUA resulted in the community becoming more united since both
irrigators and non-irrigators will be members of the WUA. At the termination of the project activities, the
WUA had not yet been registered, but a constitution had been drafted. A public participation meeting
facilitated by DWA to discuss the draft constitution took place on 29th March 2007. The process of
formation of the WUA managed to involve traditional leadership, which played an active role in the
association.
Non-irrigators in Zanyokwe were more organized in their participation in activities of the WUA and their
main expectation is the possible establishment of irrigation infrastructure in their village. Farmers hoped
that the association would improve access to water, especially at Lenye North. However, irrigators,
especially those from Burnshill and Lenye South villages were not supportive of the initiative to form a
WUA. They were concerned that formation of the WUA would lead to the payment for use of water, a
situation that is not happening at present. Therefore, although the process of establishing the WUA had
reached the stage of public participation by the close of the project, it is likely that some farmers might
resist its final registration as they see this as a way of tapping money from them. Thus, though the
primary reason for the introduction of a WUA is to improve farmer organisation, which would enable them
to access funding, irrigators do not seem too eager to have this organisation.
Promotion of market linkages committee
A steering committee comprising of farmers, the provincial Department of Agriculture, ARDRI, USAID,
Starke Ayres, and Kynoch was established to work on a market linkage project with Pick & Pay
Supermarkets. The Eastern Cape Department of Agriculture facilitated this linkage and a contract to
produce butternut, gem squash, grey and white pumpkin on 60 ha was signed by 31 farmers with Pick &
Pay. There were suggestions by the farmers that two additional members from the BMP team could be
included in the steering committee. Pick ‘n’ Pay supplied technical expertise in the form of a farm
manager to assist farmers produce quality products. The Department of Agriculture also provided one
Extension Officer to support the market linkage with Pick ‘n’ Pay.
2.3.5.3 Marketing in Zanyokwe
Main issues with marketing
The main concern with marketing was that farmers did not have the necessary knowledge and skills for
running an efficient marketing system. Both regulatory (rules and regulations) and normative institutions
(structures and associations) were very weak. In addition, the infrastructure pertaining to marketing,
especially roads, processing and storage structures were seriously limiting. The marketing system was
29
characterized by two channels, namely, individual and group marketing channel. The individual marketing
system involved marketing the produce locally and from the site of production. The main problems with
this marketing system were as follows:
There were no formal arrangements between buyers and producers.
Returns from production were very low due to low product prices so income realized by farmers
was not enough to cover all production costs.
The marketing strategy of farmers at Zanyokwe was more about producing crops and vegetables
that local people were familiar with and little about producing crops that have a demand.
The group marketing system involved a group of farmers selling their produce collectively to an identified
buyer (contract marketing). The main problems with this type of marketing were low prices of products
resulting mainly from poor quality, and failure of both producers and buyers to stick to the conditions of
the contract. Lack of storage structures meant that when the buyers failed to pick products at a time
specified in the contract, farmers were stuck with the products and thus increasing spoilage. On the other
hand, farmers were failing to inform the buyers in time when products were ready.
Solutions identified to address marketing at Zanyokwe
The marketing problems identified were addressed by means of a two-phased solution approach. Phase
one involved attending to burning issues that had potential to cripple the marketing system at the scheme
while phase two involved an investigation of the marketing system. During Phase one, of utmost
importance was to help farmers organise themselves. This started at management level whereby an effort
was made to strengthen the scheme management structure which was weak. Farmers were also
encouraged to form co-operatives as successful marketing depended on collective action. As noted
earlier, these cooperatives have been formed and registered at Zanyokwe. As farmers were involved in
marketing arrangements that involved a number of stakeholders, it became necessary for the project
researchers to link up the farmers with other stakeholders involved in marketing of products at Zanyokwe.
A couple of trips were thus organised during phase one with the objective of exposing farmers to formal
markets.
Phase two was implemented in three stages. Stage one was the investigation (research and analysis) of
the marketing system. Stage two was the drafting of a plan of action based on the findings of the study,
while stage three was the implementation of the plan. During stage one of phase two, the aim was to
carry out marketing research and investigating how the farmers could increase their income by selling
crops and vegetables more effectively. The investigation covered everything from crop production to
transport links to the market. The researchers attempted to find comparative advantages in the areas and
identified problems which needed to be overcome. The work also involved doing market research, which
30
entailed finding out about customer’s requirements (what products are wanted and in what form) and how
the marketing system works (who is involved and how the marketing system wants to be serviced).
The second stage was deciding what to do with the findings obtained during the investigation. All those
involved (farmers, extension officers and researchers) had to agree on the plan of action with regard to
what needed to be done, when and by whom. It was decided that the best way to solve marketing
problems was to come up with simple solutions that did not require major changes in current production
practices as complex plans were likely to fail. Stage three involved translating the plan into action. It
involved providing market advice to farmers before, during and after production.
The solution for the marketing problems experienced by farmers at Zanyokwe seemed to lie in producing
crops that had a demand and adding value to the products. One niche market identified was green maize.
This product was found to have high demand locally and to be more profitable than grain maize. The
challenge was to improve production practices in order to have better yield per unit area. This aspect will
be dealt with under agronomic constraints.
Workshop to build farmer capacity in marketing at ZIS
The major outcomes of the workshop and associated field trip included the following:
1. It reinforced the growers’ understanding of vegetable quality and making them aware of other
aspects of quality.
2. It made growers aware of possible marketing channels and the importance of good quality to
achieve good prices and regular sales.
3. It familiarised the growers with preferred / standard packaging.
4. It pointed out consumer preferences in terms of produce and packaging.
5. It emphasised the need for careful planning of production to ensure regular supplies and to avoid
surpluses.
6. It emphasised the fact that finding markets for fresh produce should not be a consideration left
until the produce is ready to be harvested. Rather, marketing should already be part of planning
and should inform production decisions.
7. It introduced growers to crops other than those they know and /or already grow.
8. It made growers aware of niche markets e.g. carrots and beetroots, which are tied in bunches
and sold with very fresh and attractive leaves, rather than in bags with leaves removed.
31
Through the visits to Pick ‘n’ Pay and Woolworths, growers were:
Exposed to many vegetables they did not know
Familiarised with a range of different packages
Exposed to some poor quality produce at Pick ‘n’ Pay
Exposed to excellent quality, as one would expect, at Woolworths
Made aware of retail prices, including the exceptionally high prices of garlic
Marketing
Interaction with farmers and extension officers during monitoring studies indicated that farmers benefited
immensely from the training programs during information days as well as from the workshop on “quality in
vegetables” that were conducted by the project. Farmer training in record keeping and financial
management allowed them to evaluate profitability of their various enterprises. All these efforts resulted in
noticeable positive change in quality management in crop production (section 2.12). This also translated
to farmers penetrating more market channels. For instance, farmer training and interaction during
information days and monitoring studies resulted in farmers acquiring skills in production of butternut that
meet the requirements of the market as reported in the monitoring studies (section 2.4). They learnt how
to grade, clean, package and store their products before sending to the market. This went a long way in
improving the relationship between farmers and Pick ‘n Pay and other markets as farmers were now able
to meet the market quality requirements.
The socio-economic impact assessment report (section 2.12) indicated that exposure of farmers through
training capacitated them to be able to seek markets for their products as evidenced by the number of
chain outlets that now do business with them. These include Pick ‘n’ Pay, Proveg, Umthiza and Fruit &
Veg. In 2008, farmers, through the cooperative, managed to establish a new market, the Kei Fresh
Produce market in Umtata with the assistance of the Department of Agriculture. This offered an
alternative market for butternut to Pick ‘n’ Pay. Farmers were able to sell 3 941 x 10 kg pockets of their
butternut through the cooperatives. The increase in markets was in addition to a number of hawkers who
came to buy from these farmers.
Farmers agreed that their marketing skills had improved, especially in the marketing of butternuts. They
grade butternuts at Zanyokwe, and the packaging has improved considerably (section 2.12). The
performance of these marketing functions by farmers had a positive impact on the incomes realized from
the sale of butternuts. Evidence indicated that in 2007 farmers sold a 10kg bag of butternut at an average
price of R15.00 compared to only R12.00 in 2006. The increase in price per unit of produce was brought
about mainly by performing extra marketing functions, an effort to meet Pick ’n’ Pay requirements as well
as perfect timing of production. This translated into an improved relationship between farmers and Pick ’n’
Pay contractors. Farmers managed to open a current account with the Pick ’n’ Pay, and therefore their
32
money was no longer deposited to ARDRI account as used to happen. In addition, farmers no longer had
to wait long to get payments. Initially, farmers would wait up to a year before receiving payments. The
waiting period had been reduced to three months or less. The withdrawal of the manager hired by Pick ’n’
Pay (section 2.12) meant that a trust between farmers and Pick ’n’ Pay has been built.
Access to markets was also observed to have improved as highlighted in the SEIA report (section 2.12).
Apart from supplying Pick ’n’ Pay, farmers at Zanyokwe also supply vegetables (butternut, pumpkin,
carrot, beetroot, tomatoes, and green peppers) to Proveg in East London, Fruit and Veg in King William’s
Town (KWT), Popular market also in KWT, Alice market, Fort Beaufort and Fort Cox College. Plans were
underway to improve diversity of crops grown for the market. Farmers wanted to add garlic and sweet
corn for marketing purposes as they were impressed with the higher prices of these products at the East
London market. The registering of the farmers’ cooperative was seen as an added advantage by farmers
as it has improved their collective action. In future, farmers want to use the co-op to seek financial
assistance as well as to negotiate contracts with other markets.
33
2.4 Participatory assessment of agronomic constraints at
Zanyokwe irrigation scheme (ZIS)
2.4.1 Introduction
The poor performance of many smallholder irrigation schemes (SIS) in terms of both productivity and
economic impact in SA has been largely attributed to socio-economic, political, climatic, edaphic and
design factors (Bembridge, 2000). However, Crosby et al. (2000) indicated that farmer practice may
actually be constraining performance in spite of the state of irrigation infrastructure. They cite low yield
levels achieved in SIS as evidence of poor farmer performance. Indeed, De Lange et al. (2000) note that
research and expenditure has tended to focus on infrastructure and that often this has proved to be
fruitless because the human capital was not developed to effectively utilize and maintain the
infrastructure. Machethe et al. (2004) also observed that limited knowledge and lack of skills in crop
production among farmers were significant constraints to improved productivity in SIS. Little attention has,
however, been given to the study of cropping systems and management practices in SIS (Machethe et
al., 2004), and how much these explain observed poor performance.
The low levels of crop productivity noted in many SIS in SA imply low water use efficiencies (WUE) as
available evidence indicates that water at the source is rarely limiting (Machethe et al., 2004; Stevens,
2007) and in some cases over-application has been noted (Machethe et al., 2004; Monde et al., 2005).
Improving water use efficiency in irrigation is a priority issue currently receiving attention in SA. With the
growing scarcity of water in SA, significant increases in water productivity will have to come from
improved agronomic practices rather than increasing cultivated area (Machethe et al., 2004).
In the case of Zanyokwe Irrigation Scheme (ZIS) Monde et al. (2005) noted that despite having access to
an average of 4.2 ha of irrigated land per farmer, most farmers were poor, with monthly income lower
than the poverty datum line of R626.98. This was attributed to low crop productivity which farmers
attributed to lack of adequate tillage services, fertiliser, seed, chemicals and irrigation equipment. This
study relied on farmer interviews and due to lack of farm records was limited in explaining and relating
performance to factors cited by farmers. It could thus not be relied on for purposes of designing a
research programme to address the low productivity noted in ZIS. Therefore, a study was carried out to
identify cropping systems and management practices by farmers and to determine how these were
related to performance. The results would then be used to guide the development of a research agenda
for determining best management practices at the scheme.
34
2.4.2 Materials and Methods
Monitoring surveys
The study was conducted in Burnshill and Lenye villages in ZIS. According to Monde et al. (2005), of the
total population of 48 farmers in Burnshill and Lenye villages, 19 (40%) were ultra-poor (ULP), 11 (22%)
were poor (P) while 18 (38%) were non-poor (NP). Stratified simple random sampling was used to select
eight NP, five P and seven ULP farmers from the population of 48 farmers. The farming practices of this
sample of 20 farmers were then monitored for three summer and winter seasons from 2005/06 to
2007/08.
During the growing season, records were collected on crops, cropped area, tillage, planting dates,
cultivars, fertility management, weeding, irrigation, labour and crop yields. Visits were made to the
scheme on a fortnightly basis to collect data from the farmers through semi-structured interviews and field
observations in farmers’ fields. Monitoring of crop production practices was done on grain maize, green
maize and butternut which were the main summer crops. Crop cuts (FAO, 1982) were used to estimate
maize grain yield in farmers’ fields, while butternut yields were obtained from farmer records. For the crop
cuts, stratified samples were taken from the up-slope, mid-slope and down-slope of each farmer’s field in
plots measuring 5 m × 5 m. Maize crop stand was estimated by counting the total number of plants in five
rows, each measuring 20 m and spaced 0.9 m apart to give a net plot area of 90 m2 in each farmer’s field.
The proportion of maize sold as green cobs was estimated by counting plants with harvested cobs from
the 90 m2 net plot area.
Case studies
In addition to the monitoring surveys described above, the case study approach was used to follow
farmers that provided opportunity to highlight successes and failures in production. Tools used for data
collection were informal surveys, farmers’ records and personal observation. Three farmers, one from
each of the wealth classes, were followed up throughout the duration of the study.
Agronomic performance indicators
Production, measured as the biological output from the individual farms or yield per hectare of land was
used as the overall performance indicator (FAO, 1995). Additionally, cropping intensity (CI) was defined
to evaluate land use intensity by the individual farmers. CI was expressed in terms of the number of crops
that are cultivated on a particular surface area per year or the fraction of the total available land cropped
in any given year (Noordwijk, 2002).
35
2.4.3 Results
Socio-economic characteristics of farmers
Eleven (55%) farmers, all ULP and four P, owned the land that they farmed on a freehold basis while nine
(45%), all NP and one P, leased land from quitrent owners who did not make use of it. The average size
of arable land for freeholders was 5.0 ha with a range of 3.0 to 7.0 ha per farmer. For lessees, average
size of arable land increased from 3.7 ha in 2005/06 to 5.2 ha in 2006/07 and 2007/08, with a range of 2.0
to 11 ha per farmer. Seventeen (85%) farmers were men while the 15% women farmers were all widows.
The mean household size was five people with a range of one to eight, but the mean size of the active
population (people aged between 15 and 64 years) was three people per household. All P and ULP
farmers had seven or eight years of formal education while all NP farmers had some tertiary education. Of
the NP farmers, one had a junior degree in agricultural extension; four had diplomas while the other three
had certificates. The average age of the farmers at the beginning of the study in 2005 was 52.
Cropping patterns
Maize (Zea mays L.), both green and grain, butternut (Cucurbita moschata Duchense) and sugar beans
(Phaseolus vulgaris) were the most popular summer crops while cabbage (Brassica oleracea var.
capitata) was the main winter crop (Table 2.6.1). Soy bean (Glycine max) was only produced in 2005/06
by six (30%) farmers, two NP, one P and three ULP. Other minor crops grown on an average of less than
0.1 ha were carrot (Daucus carota), beetroot (Beta vulgaris) and spinach (Spinacea oleracea). All these
were grown mainly in winter for family consumption and only surplus was sold. Grain maize, butternut and
cabbage were the only crops grown in all the three seasons of study. The number of grain maize
producers dropped from 16 (80%) in 2005/06 to three (15%) farmers, all NP, in 2007/08. Similarly, area
cropped to grain maize decreased from 1.3 to 0.5 ha per farmer from 2006/07 to 2007/08 (Table 2.2)
Table 2.2: Mean cropped area (ha) and percent producers (in brackets) for the main crops grown during
the 2005/06 to 2007/8 summer seasons
Crop 2005/06 2006/07 2007/08 Mean
Grain maize 1.0 (80%) 1.3 (70%) 0.5 (15%) 0.9 (55%)
Green maize Nil 1.5 (30%) 1.4 (45%) 0.9 (25%)
Butternut 0.9 (35%) 1.0 (45%) 1.1 (90%) 1.0 (57%)
Soy beans 0.7 (30%) Nil Nil 0.2 (10%)
Sugar beans Nil 1.3 (55%) 1.3 (40%) 0.9 (32%)
Summer cabbage 0.6 (10%) 0.8 (10%) 0.8 (15%) 0.7 (12%)
Winter cabbage 0.7 (30%) 0.9 (20%) 1.7 (25%) 1.1 (25%)
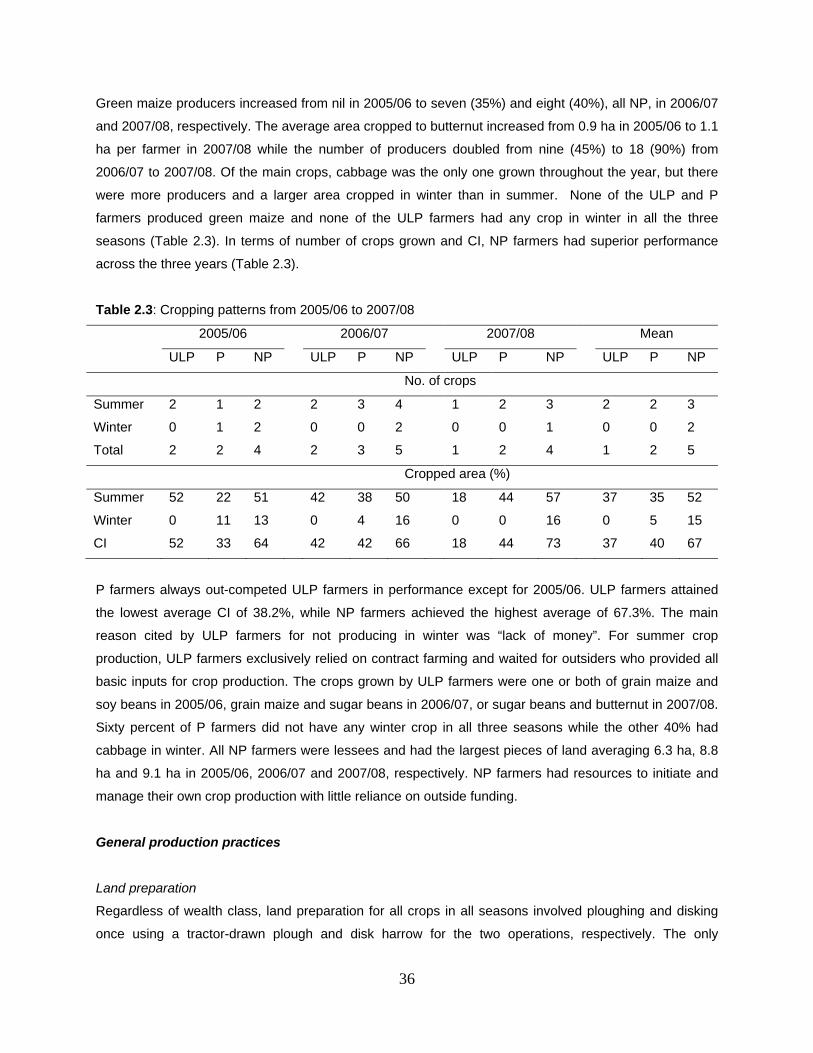
36
Green maize producers increased from nil in 2005/06 to seven (35%) and eight (40%), all NP, in 2006/07
and 2007/08, respectively. The average area cropped to butternut increased from 0.9 ha in 2005/06 to 1.1
ha per farmer in 2007/08 while the number of producers doubled from nine (45%) to 18 (90%) from
2006/07 to 2007/08. Of the main crops, cabbage was the only one grown throughout the year, but there
were more producers and a larger area cropped in winter than in summer. None of the ULP and P
farmers produced green maize and none of the ULP farmers had any crop in winter in all the three
seasons (Table 2.3). In terms of number of crops grown and CI, NP farmers had superior performance
across the three years (Table 2.3).
Table 2.3: Cropping patterns from 2005/06 to 2007/08
2005/06 2006/07 2007/08 Mean
ULP P NP ULP P NP ULP P NP ULP P NP
No. of crops
Summer 2 1 2 2 3 4 1 2 3 2 2 3
Winter 0 1 2 0 0 2 0 0 1 0 0 2
Total 2 2 4 2 3 5 1 2 4 1 2 5
Cropped area (%)
Summer 52 22 51 42 38 50 18 44 57 37 35 52
Winter 0 11 13 0 4 16 0 0 16 0 5 15
CI 52 33 64 42 42 66 18 44 73 37 40 67
P farmers always out-competed ULP farmers in performance except for 2005/06. ULP farmers attained
the lowest average CI of 38.2%, while NP farmers achieved the highest average of 67.3%. The main
reason cited by ULP farmers for not producing in winter was “lack of money”. For summer crop
production, ULP farmers exclusively relied on contract farming and waited for outsiders who provided all
basic inputs for crop production. The crops grown by ULP farmers were one or both of grain maize and
soy beans in 2005/06, grain maize and sugar beans in 2006/07, or sugar beans and butternut in 2007/08.
Sixty percent of P farmers did not have any winter crop in all three seasons while the other 40% had
cabbage in winter. All NP farmers were lessees and had the largest pieces of land averaging 6.3 ha, 8.8
ha and 9.1 ha in 2005/06, 2006/07 and 2007/08, respectively. NP farmers had resources to initiate and
manage their own crop production with little reliance on outside funding.
General production practices
Land preparation
Regardless of wealth class, land preparation for all crops in all seasons involved ploughing and disking
once using a tractor-drawn plough and disk harrow for the two operations, respectively. The only
37
exception was grain maize produced under conservation tillage by all producers of the crop in 2005/06
and 2006/07. Inadequate draught power was cited by all farmers as a major constraint to timely land
preparation and consequently planting. Farmers relied on hiring one of two tractors operating in the
scheme. A common practice observed throughout the monitoring period was fire burning of fields as part
of land preparation for the subsequent summer season. This practice was mainly used as a weed control
strategy, particularly in fields that would have been left fallow for some time. This practice resulted in the
burning of plastic water hydrants in the fields, leading to unavailability of water infield.
Planting
For maize planting, all farmers relied on hiring one of the two tractor drawn planters operating in the
scheme. Planting time was not related to wealth class, but on access to tractor based on first come first
served basis. Summer planting generally commenced in mid-September and green maize and/or
butternut were the first crops to be planted.
Grain maize
In all three seasons, planting of grain maize commenced after mid-November. In 2005/06, 30% of
producers planted between 15 and 21 December, 44% between 12 and 31 January, 13% between 5 and
15 February, and another 13% between 8 and 15 March. In 2006/07 and 2007/08, planting started on 24
November and all planting was completed by the end of December. In 2005/06 and 2006/07, all grain
maize was produced under conservation tillage promoted by the Massive Food Program (MFP) launched
by the ECDA to improve food security in the province. In 2007/08, three farmers planted out of their own
initiative and used conventional tillage. In 2005/06 and 2006/07, 88 and 86% of producers used the hybrid
cultivar PAN6480 while 12 and 14% used an open-pollinated variety (OPV) Sahara, respectively. In
2007/08, all three grain maize producers adopted the hybrid cultivar DKC61-25, which was one of the top-
performing cultivars from a varietal evaluation trial done in the scheme as part of this study.
Green maize
While three different cultivars; SC701, PAN93 and People’s choice (an OPV) were used in 2006/07, all
producers used the cultivar SC701 in 2007/08. One of the seven green maize producers in 2006/07 used
recycled seed of the hybrid cultivar SC701 while all farmers used purchased hybrid seed in 2007/08.
Traditionally, green maize production in the scheme had been through direct seeding, just like for grain
maize. However, in 2007/08, two farmers established some of their maize from seedlings purchased from
a commercial nursery to cope with bird damage to emerging seedlings and improve on crop stand.
Butternut
Planting furrows spaced at 90 cm were marked using a tractor-drawn planter and actual planting was
done by hand and spacing between plants varied between 40 and 110 cm in farmers’ fields. In 2005/06,
38
50% of producers used the variety Waltham whilst the other half used Sunset. However, in 2006/07, there
was a shift to Waltham (87.5%) and only 12.5% of producers used Sunset. In 2007/08 all producers used
Waltham, citing earliness and cheaper seed compared to Sunset.
Weed management
Weed-crop competition caused by inadequate weed control was one of the major causes of poor yields
observed in the scheme in all seasons. Major problem weeds were Cynodon dactylon L. and Cyperus
esculentus L. in all crops. In addition to these, other important weeds in butternut were the broadleaves
Ageratum conyzoides, Plantago major and Nichandra physaloides.
Grain maize
In 2006/07, 62% of grain maize producers only controlled weeds before planting, 15% never controlled
weeds, 15% controlled weeds both pre- and post-emergence, and 8% controlled weeds only after
emergence of the maize crop. Farmers who never controlled weeds or who did not exercise post-
emergence weed control cited lack of knowledge of the type of herbicides that could be used in maize
and other crops, while others cited lack of cash to purchase the herbicides. After failing to cope with the
weeding requirements, 22% of maize grain producers abandoned their crop to weeds in 2006/07.
Weed control in grain maize was mainly through mechanical inter-row cultivation and use of herbicides, or
a combination of the two.
The three grain maize producers in 2007/08 controlled weeds both before and after crop emergence.
They used cultivation to kill the first flush of weeds before planting, while for post-emergence weed
control two sprayed atrazine at 5 l ha-1 and the third used inter-row cultivation using a tractor. Whilst inter-
row cultivation was commonly done using a tractor drawn cultivator, one NP farmer possessed six
donkeys, which he used for inter-row cultivation. Observation showed that use of tractor for inter-row
cultivation resulted in significant crop loss as some crops were uprooted by the cultivator due to poor
timing of cultivation when the crop was too big for safe operation and planting rows which were not
straight.
Green maize
Generally weed control in green maize was more effectively done than in grain. In 2006/07 and 2007/08,
25 and 22% producers applied a pre-plant herbicide, atrazine. One farmer used hand hoeing for post
emergence weed control while the other farmers relied on herbicides and inter-row cultivation in both
seasons. A case study of the farmer who used hand hoeing on 0.5 ha in 2006/07 indicated that the farmer
only weeded along the crop rows once at 3 weeks after emergence (WAE) whilst leaving the inter-row
weedy as a result of shortage of labour. The main problem weeds in the farmer’s field were C. esculentus
(Plate 2.1) and C. dactylon which proved very difficult to control as they were observed to re-root after
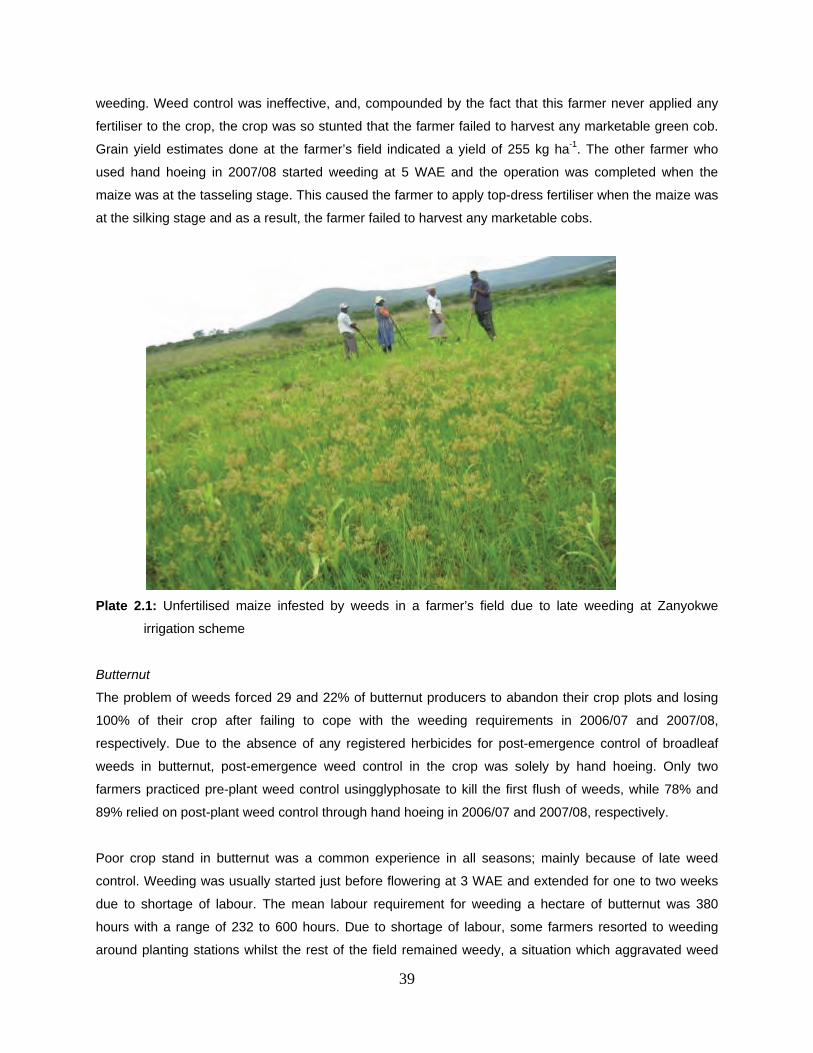
39
weeding. Weed control was ineffective, and, compounded by the fact that this farmer never applied any
fertiliser to the crop, the crop was so stunted that the farmer failed to harvest any marketable green cob.
Grain yield estimates done at the farmer’s field indicated a yield of 255 kg ha-1. The other farmer who
used hand hoeing in 2007/08 started weeding at 5 WAE and the operation was completed when the
maize was at the tasseling stage. This caused the farmer to apply top-dress fertiliser when the maize was
at the silking stage and as a result, the farmer failed to harvest any marketable cobs.
Plate 2.1: Unfertilised maize infested by weeds in a farmer’s field due to late weeding at Zanyokwe
irrigation scheme
Butternut
The problem of weeds forced 29 and 22% of butternut producers to abandon their crop plots and losing
100% of their crop after failing to cope with the weeding requirements in 2006/07 and 2007/08,
respectively. Due to the absence of any registered herbicides for post-emergence control of broadleaf
weeds in butternut, post-emergence weed control in the crop was solely by hand hoeing. Only two
farmers practiced pre-plant weed control usingglyphosate to kill the first flush of weeds, while 78% and
89% relied on post-plant weed control through hand hoeing in 2006/07 and 2007/08, respectively.
Poor crop stand in butternut was a common experience in all seasons; mainly because of late weed
control. Weeding was usually started just before flowering at 3 WAE and extended for one to two weeks
due to shortage of labour. The mean labour requirement for weeding a hectare of butternut was 380
hours with a range of 232 to 600 hours. Due to shortage of labour, some farmers resorted to weeding
around planting stations whilst the rest of the field remained weedy, a situation which aggravated weed
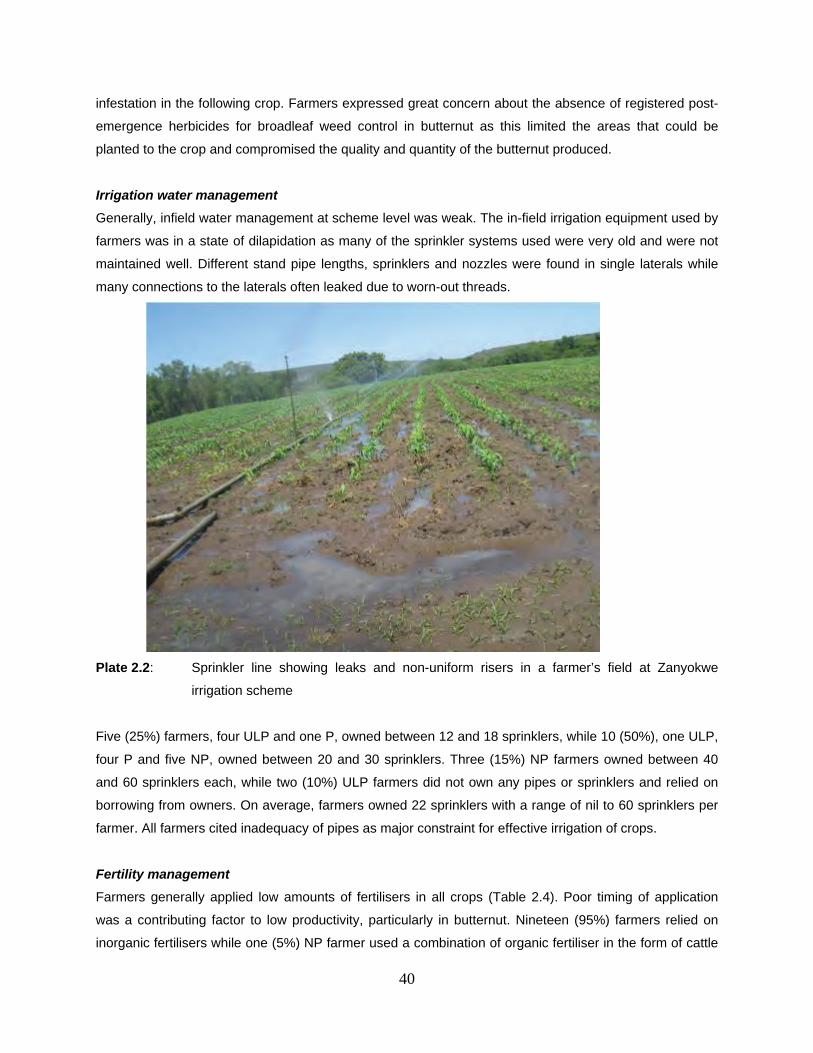
40
infestation in the following crop. Farmers expressed great concern about the absence of registered post-
emergence herbicides for broadleaf weed control in butternut as this limited the areas that could be
planted to the crop and compromised the quality and quantity of the butternut produced.
Irrigation water management
Generally, infield water management at scheme level was weak. The in-field irrigation equipment used by
farmers was in a state of dilapidation as many of the sprinkler systems used were very old and were not
maintained well. Different stand pipe lengths, sprinklers and nozzles were found in single laterals while
many connections to the laterals often leaked due to worn-out threads.
Plate 2.2: Sprinkler line showing leaks and non-uniform risers in a farmer’s field at Zanyokwe
irrigation scheme
Five (25%) farmers, four ULP and one P, owned between 12 and 18 sprinklers, while 10 (50%), one ULP,
four P and five NP, owned between 20 and 30 sprinklers. Three (15%) NP farmers owned between 40
and 60 sprinklers each, while two (10%) ULP farmers did not own any pipes or sprinklers and relied on
borrowing from owners. On average, farmers owned 22 sprinklers with a range of nil to 60 sprinklers per
farmer. All farmers cited inadequacy of pipes as major constraint for effective irrigation of crops.
Fertility management
Farmers generally applied low amounts of fertilisers in all crops (Table 2.4). Poor timing of application
was a contributing factor to low productivity, particularly in butternut. Nineteen (95%) farmers relied on
inorganic fertilisers while one (5%) NP farmer used a combination of organic fertiliser in the form of cattle
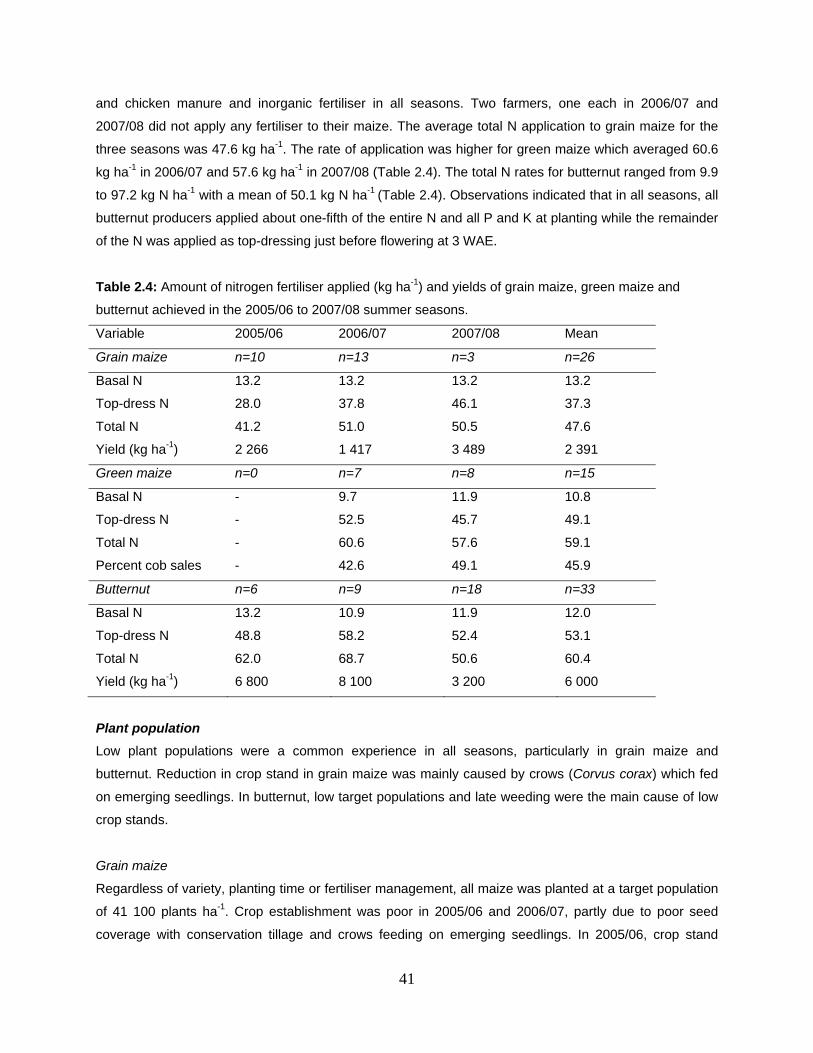
41
and chicken manure and inorganic fertiliser in all seasons. Two farmers, one each in 2006/07 and
2007/08 did not apply any fertiliser to their maize. The average total N application to grain maize for the
three seasons was 47.6 kg ha-1. The rate of application was higher for green maize which averaged 60.6
kg ha-1 in 2006/07 and 57.6 kg ha-1 in 2007/08 (Table 2.4). The total N rates for butternut ranged from 9.9
to 97.2 kg N ha-1 with a mean of 50.1 kg N ha-1 (Table 2.4). Observations indicated that in all seasons, all
butternut producers applied about one-fifth of the entire N and all P and K at planting while the remainder
of the N was applied as top-dressing just before flowering at 3 WAE.
Table 2.4: Amount of nitrogen fertiliser applied (kg ha-1) and yields of grain maize, green maize and
butternut achieved in the 2005/06 to 2007/08 summer seasons.
Variable 2005/06 2006/07 2007/08 Mean
Grain maize n=10 n=13 n=3 n=26
Basal N 13.2 13.2 13.2 13.2
Top-dress N 28.0 37.8 46.1 37.3
Total N 41.2 51.0 50.5 47.6
Yield (kg ha-1) 2 266 1 417 3 489 2 391
Green maize n=0 n=7 n=8 n=15
Basal N - 9.7 11.9 10.8
Top-dress N - 52.5 45.7 49.1
Total N - 60.6 57.6 59.1
Percent cob sales - 42.6 49.1 45.9
Butternut n=6 n=9 n=18 n=33
Basal N 13.2 10.9 11.9 12.0
Top-dress N 48.8 58.2 52.4 53.1
Total N 62.0 68.7 50.6 60.4
Yield (kg ha-1) 6 800 8 100 3 200 6 000
Plant population
Low plant populations were a common experience in all seasons, particularly in grain maize and
butternut. Reduction in crop stand in grain maize was mainly caused by crows (Corvus corax) which fed
on emerging seedlings. In butternut, low target populations and late weeding were the main cause of low
crop stands.
Grain maize
Regardless of variety, planting time or fertiliser management, all maize was planted at a target population
of 41 100 plants ha-1. Crop establishment was poor in 2005/06 and 2006/07, partly due to poor seed
coverage with conservation tillage and crows feeding on emerging seedlings. In 2005/06, crop stand
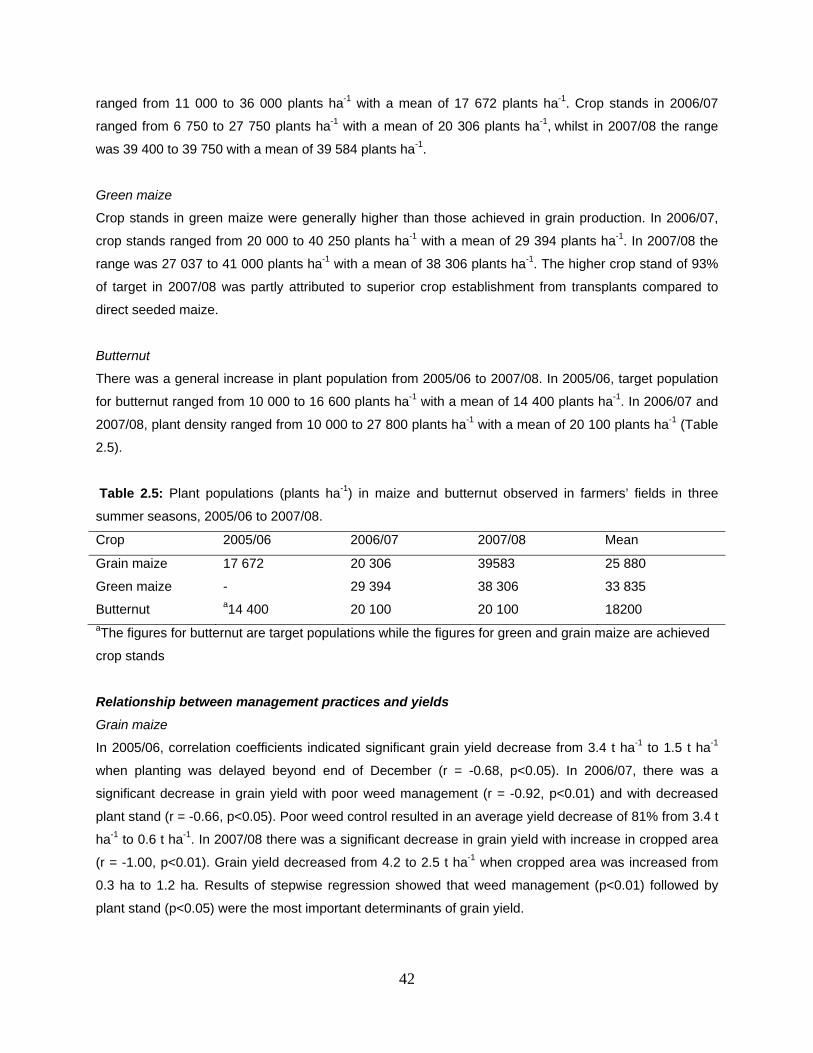
42
ranged from 11 000 to 36 000 plants ha-1 with a mean of 17 672 plants ha-1. Crop stands in 2006/07
ranged from 6 750 to 27 750 plants ha-1 with a mean of 20 306 plants ha-1, whilst in 2007/08 the range
was 39 400 to 39 750 with a mean of 39 584 plants ha-1.
Green maize
Crop stands in green maize were generally higher than those achieved in grain production. In 2006/07,
crop stands ranged from 20 000 to 40 250 plants ha-1 with a mean of 29 394 plants ha-1. In 2007/08 the
range was 27 037 to 41 000 plants ha-1 with a mean of 38 306 plants ha-1. The higher crop stand of 93%
of target in 2007/08 was partly attributed to superior crop establishment from transplants compared to
direct seeded maize.
Butternut
There was a general increase in plant population from 2005/06 to 2007/08. In 2005/06, target population
for butternut ranged from 10 000 to 16 600 plants ha-1 with a mean of 14 400 plants ha-1. In 2006/07 and
2007/08, plant density ranged from 10 000 to 27 800 plants ha-1 with a mean of 20 100 plants ha-1 (Table
2.5).
Table 2.5: Plant populations (plants ha-1) in maize and butternut observed in farmers’ fields in three
summer seasons, 2005/06 to 2007/08.
Crop 2005/06 2006/07 2007/08 Mean
Grain maize 17 672 20 306 39583 25 880
Green maize - 29 394 38 306 33 835
Butternut a14 400 20 100 20 100 18200 aThe figures for butternut are target populations while the figures for green and grain maize are achieved
crop stands
Relationship between management practices and yields
Grain maize
In 2005/06, correlation coefficients indicated significant grain yield decrease from 3.4 t ha-1 to 1.5 t ha-1
when planting was delayed beyond end of December (r = -0.68, p<0.05). In 2006/07, there was a
significant decrease in grain yield with poor weed management (r = -0.92, p<0.01) and with decreased
plant stand (r = -0.66, p<0.05). Poor weed control resulted in an average yield decrease of 81% from 3.4 t
ha-1 to 0.6 t ha-1. In 2007/08 there was a significant decrease in grain yield with increase in cropped area
(r = -1.00, p<0.01). Grain yield decreased from 4.2 to 2.5 t ha-1 when cropped area was increased from
0.3 ha to 1.2 ha. Results of stepwise regression showed that weed management (p<0.01) followed by
plant stand (p<0.05) were the most important determinants of grain yield.
43
Green maize
One and two green maize producers failed to obtain any marketable cobs in 2007/08 and 2006/07,
respectively. This was caused by inappropriate cultivar choice, poor or non-application of fertiliser and/or
weed control. One farmer used People’s choice, an OPV which bore short cobs and small grains relative
to SC701. In 2006/07 correlation coefficients indicated that percent marketable cobs tended to decrease
with reduced N fertilisation (r = -0.57), poor crop stand (r = -0.50) and use of cultivars other than SC701 (r
= -0.38), but none of these were significant at 5% level. In 2007/08, percent marketable cobs significantly
decreased with delayed planting (r = -0.61, p<0.05), increase in cropped area (r = -0.80, p<0.01), reduced
top-dress N (r = -0.84, p<0.01) and low total N (r = -0.83, p<001).
Butternut
Butternut yield averaged 6.0 t ha-1 over the three seasons. In 2005/06, correlation coefficients indicated a
significant decrease in yield with reduced N fertilisation (r = -0.93, p<0.01) and with increase in cropped
area (r = -0.80, p<0.05). Failure to control weeds before planting (r = -0.92, p<0.01) and decrease in plant
population (r = -0.71, p<0.05) resulted in a significant decrease in yield in 2006/07. In the same season,
yield tended to decrease with reduced N fertilisation (r = -0.61), but this was not significant at 5% level. In
2007/08 correlation coefficients indicated a significant decrease in yield with lack of pre-plant weed
control (r = -0.64, p<0.05).
2.4.4 Discussion
Productivity levels
The study demonstrated that cropping systems in ZIS result in poor performance due to inefficient
management. Main factors identified as limiting crop productivity were poor weed, fertiliser and water
management, low plant populations, cultivar selection and late planting. Similar factors were observed to
be the main constraints to increased productivity of SIS elsewhere in SA (Van Averbeke et al., 1998;
Bembridge, 2000; Perret et al., 2003; Machethe et al., 2004).Yields obtained were generally low and
below potential under irrigation (Table 3). Literature indicates that depending on cultivar, maize grains
yields ranging from 9 to 12 t ha-1 are possible under irrigation in SA (Du Plessis and Bruwer, 2003; USDA,
2003). The average maize grain yield of 2.4 t ha-1 achieved by farmers at ZIS is only 20 to 30% of the
potential of the cultivars used. In butternut, the average yield of 6.0 t ha-1 is 20 to 24% of the potential of
25 to 30 t ha-1 (Department of Agriculture, 2005). In green maize production, farmers sold < 50% of their
crop because some of the cobs were of small size and not marketable. These findings suggest that
training on basic management practices such as cultivar selection, population management, fertiliser
application and timing, and weed management options for different crops can help improve on
productivity.
44
Whilst CIs of 200% are possible under irrigation in the EC (Van Averbeke et al., 1998), results of this
study indicated low CIs averaging 65.7%, which is about 33% of the potential of 200%. Similar low levels
of CI have been reported in SIS elsewhere in SA (Van Averbeke et al., 1998; Bembridge, 2000; Perret
et al., 2003). Increase in crop productivity with higher CIs is well documented (FAO, 2000; Hasnip et al.,
2001; Tafese, 2003). The low CIs affected total production and income achieved by farmers. Lack of
motivation and resources were the two main factors responsible for the underutilisation of land,
particularly for the P and ULP farmers. The study indicated that there was very little cropping done in
winter and that the common crop was cabbage. Diversification to include other winter crops such as
winter wheat and other vegetable crops might be one way to improve on CI.
Constraints to crop productivity
Weed management
Poor weed management was noted as the most important factor limiting productivity of maize and
butternut, resulting in a 100% yield reduction in some cases. Poor weed control is known to decrease
water and N use efficiency, the two most important inputs to achieving high yields under irrigation
(Thomson et al., 2000). This becomes more critical in a case like ZIS where farmers apply low amounts of
N to their crops. Cultural weed control methods such as ploughing soon after harvesting and pre-plant
weed control may be some of the most effective methods to destroy the majority of weeds before they
seed and replenish the soil seed bank (Fournier and Brown, 1999; Stall, 2007) as shown by farmers who
are already doing it. The fact that some farmers were not knowledgeable about the different herbicides
that could be used in various crop enterprises suggests that training in herbicide technology might
improve adoption and use of herbicide technology among farmers. In India and Nepal, the adoption of
herbicide technology significantly improved after farmers attended training workshops on application
techniques (Bellinder et al., 2002).
Leaving a greater proportion of fields fallow after harvesting the summer crop meant that weeds were
able to grow and shed more seeds in the soil seed bank. Annual weed escapes are known to produce
seed that will be in the soil and increase weed populations for the next several years, and perennial
weeds may persist if not properly controlled (Stivers, 1999; Whitney, 1999). Rather than leaving fields idle
after harvesting, fields should be ploughed and/or disked after harvest to prevent late summer and winter
weed seed production (Whitney, 1999). The challenge of weed management was most serious in
butternut production due to lack of registered post-emergence herbicides for broad leaf weed control.
Weed control to kill the first flush of weeds prior to planting is one strategy that can be used by farmers to
reduce weed pressure after emergence of the butternut crop. Weed management in butternut should
focus on starting with a clean field and then maximising weed suppression through the augmentation of
the competitive ability of the crop by using optimum plant populations (Canadian Organic Growers Field
Crop Handbook, 1992).
45
Fertility management
Within the rates used by farmers, results indicated a weak correlation between nitrogen rate and maize
yield, yet it is known that this relationship is strong (FSSA, 2007). This suggests that improper
management of weeds and plant population and other factors could have masked this relationship. Not
only did the farmers apply very low rates of fertilisers, but in many cases the timing of application was
wrong. For instance, while butternut growers applied a fifth of the total N at planting, the recommendation
is to apply half to two thirds of the entire N at planting and the remainder as top-dressing (Boyhan et al.,
1999; Department of Agriculture, 2005).
For irrigation to be profitable, yields must be high. High crop yields require high nutrient uptake since
nutrient uptake is roughly proportional to crop yield (Crosby et al., 2000). The average N rate of 47.6 kg N
ha-1 for maize is only 16 to 22% of the recommendations of 220 kg N ha-1 (FSSA, 2007) to 300 kg N ha-1
(Kyabram, 1995) for a yield target of 10 t ha-1 possible under irrigation in the study area. N rate
recommendations for butternut vary from 80 to 200 kg ha-1 depending on yield potential (Boyhan et al.,
1999; Hill, 1999; Hochmuth and Cordasco, 2003; Prince Edward Island Agriculture, Fisheries and
Aquaculture, 2005). Thus, the mean N rate of 60.4 kg ha-1 used by farmers in ZIS is 30 to 76% of the
recommendations. Higher rates of N fertilization, especially when used in combination with optimum
populations and fast-growing cultivars can aid in cultural weed management through increased vigour
and higher growth rates, and result in higher yields.
One of the findings in this study was that farmers generally tended to apply low and blanket amounts of
the inorganic fertilisers, especially at planting. The same was reported of farmers in the Limpopo province
(Machethe et al., 2004). According to Crosby et al. (2000), the interaction of moisture supply and nutrient
supply is reciprocal such that if the farmer cannot irrigate, it is a waste to fertilise; and if a farmer cannot
fertilise, it is a waste to irrigate. Thus, if smallholder irrigation farmers are to realise higher yields, there
should be a balance between water application and fertiliser management. Therefore, for cropping
systems to remain productive and sustainable, it is necessary to replenish the nutrients removed from the
soil. Use of green manures and increased use of organic manure is one option farmers can adopt. In
addition to crop rotation, farmers can shift from single cropping systems to multiple cropping systems,
either sequential or intercropping. Legumes can be incorporated as they help in N fixation.
Plant population
The higher yield potential made possible by a favourable water regime provided by irrigation could be
achieved only with adjustments in plant population (Crosby et al., 2000). Low crop stands in maize and
butternut were caused by poor seed coverage at planting, bird damage in emerging maize seedlings and
poor weed control. Maize is the agronomic species that is most sensitive to variations in plant density
such that for each production system there is a population that maximises grain yield (Sangoi, 2000). The
46
average plant stand of 25 880 plants ha-1 achieved by farmers is about 63% of the target of 41 100 plants
ha-1 and contributes to low yields achieved. Under irrigation in SA, the recommendation is that maize
should be grown at 45 000 to 55 000 plants ha-1 for a yield potential of 8-10 t ha-1 (Department of
Agriculture, 2003). For yield potentials of more than 10 t ha-1, medium to long season cultivars should be
planted at 55 000 to 65 000 plants ha-1, whilst ultra short cultivars should be grown at 80 000 to 90 000
plants ha-1 (Department of Agriculture, 2003). The low plant stands achieved by farmers result in more
photosynthetically active radiation being transmitted to weeds under the crop canopy and exacerbates the
problem of weed management noted in ZIS.
A research agenda for ZIS
The goal of this monitoring study was to provide direction on the definition of a research agenda which
will provide solutions to the crop productivity constraints in ZIS. Findings of the study indicated that low
plant populations as well as poor weed and soil fertility management were the major constraints.
Strategies to eliminate the problem of bird damage and improve on maize crop stands need to be
explored. Maize transplanting is one strategy that has the potential to improve on stand establishment,
but the economics of the practice remain unclear, particularly where labour availability is a challenge. This
would require investigation before any recommendations could be made. The target populations used by
farmers in maize and butternut were observed to be low under irrigation. Therefore there was need to
investigate the effect of increasing planting density from farmers practice on productivity. Options to
improve weed management in a sustainable manner also warrant investigation. Given the acute shortage
of labour in ZIS, research should focus on labour-saving weed management strategies. Consideration
need to be given to integrated weed management options with special emphasis on cultural weed
management practices. In this respect, possible use of reduced herbicide dosages, conservation
agriculture, and use of draft animals warrants investigation.
Farmers tended to apply low fertiliser levels due to lack of cash to buy inputs. Low input sustainable
agricultural technologies such as substitutes for inorganic fertilisers need to be investigated. There is
need to identify crops that are higher yielding, but less demanding in terms of nutrient requirements.
Identification of alternative crops that can be included in rotations to enhance soil fertility, weed
management and give higher profits, such as legumes in SIS need to be explored.
2.4.5 Conclusions
The monitoring study made a substantial contribution to the understanding of factors limiting crop
productivity in ZIS and to the design of a focussed research agenda. The study demonstrated that crop
productivity in ZIS is limited by poor management of basic practices such as weed, fertiliser and water
management as well as late planting, low plant populations and use of inappropriate varieties. This
47
suggests that farmers lack basic management skills for irrigated crop production and “back to basics”
training courses could benefit the farmers. This emphasises the need for any efforts to improve on
performance of SIS in SA to take into consideration farmer production practices as a basis to build up
skills in the management of crop enterprises and the farm as a viable business.
2.5 Options for alleviating grain maize (Zea mays L.) agronomic productivity
constraints in Zanyokwe Irrigation Scheme (ZIS)
2.5.1 Introduction
In the problem tree analysis of the causes for low crop productivity at ZIS farmers cited lack of finance to
purchase inputs, shortage of tractors, and irrigation infrastructure that was in a state of dilapidation as the
main causes for low crop productivity (section 2.2). However, evidence from the situation analysis (Monde
et al., 2005) suggested that in spite of the factors cited by farmers, maize productivity at the scheme
could be higher with changes in the agronomic management of the crop. The monitoring study (section
2.4) confirmed this to be the case and revealed that general crop husbandry at ZIS was weak as
evidenced by poor weed, fertiliser and water management, late planting and low population densities
among other factors.
Maize is very sensitive to variations in plant density such that for each production system there is a
population density that maximises grain yield (Sangoi, 2000). The situation analysis indicated that farmers
planted maize at 40 000 plants ha-1 regardless of cultivar, planting time and other management factors
and that the planting window stretched to mid-March. The recommendation for irrigated maize in SA is to
plant at 45 000 to 65 000 plants ha-1 for medium to long-season cultivars and 80 000 to 90 000 plants ha-1
for ultra-short cultivars suggesting that adjustment in population used by ZIS farmers might contribute to
increase in yield.
For irrigation to be profitable, yields must be high and higher yields mean greater nutrient uptake by
crops, since nutrient uptake is roughly proportional to crop yield (Crosby et al., 2000). The recommended
fertiliser rates for irrigated maize vary depending on yield potential, but can be as high as 220 kg N ha-1
for a yield target of 10t ha-1 in South Africa (FSSA, 2007). However, the situation analysis at ZIS indicated
that the average N rate used by farmers at ZIS was 60 kg ha-1. This is about 27% of the recommended
rate and partly explains the low maize yield of about 3 t ha-1 cited by Monde et al. (2005).
USDA (2003) reported increase in grain yield from 6 t ha-1 in 1997 to 9-11 t ha-1 in 2003 in SA due to
higher-yielding cultivars and more efficient irrigation practices. However, in ZIS, it was noted that the
majority of farmers grew SR52 (a 1960s Southern Rhodesia release two-way hybrid) and Sahara or
48
Okavango (all open-pollinated varieties [OPVs]). Irrigated maize trials by the Agricultural Research
Council (ARC) of SA indicated good hybrids capable of yielding more than 9 t ha-1 (Du Plessis and
Bruwer, 2004). Promising hybrids ranged in terms of maturity class from short to long season cultivars
offering farmers opportunity to obtain high yields with late planting by appropriate selection of cultivar.
Most studies conducted in ZIS to date have relied on farmer interviews and noted the difficulty to explain
the relationship between many of the factors cited by farmers and the low level of crop performance in the
scheme. This study investigated agronomic factors responsible for low maize productivity in ZIS so as to
enable design of a focussed research agenda to address the constraints. The specific objectives were to:
(i) test the relationship between planting time, N rate, cultivar and population density on maize grain yield,
and (ii) compare yield of new hybrids from the ARC regional trials with cultivars grown by farmers at ZIS.
2.5.2 Materials and Methods
Experimental site
The researcher managed studies were carried out at three farmers’ fields; Nofemele, Kalawe and
Sisando. Soils at Nofemele consisted of deep dark coloured soils of the Oakleaf form, while Kalawe and
Sisando consisted of dark coloured heavy-textured soils of the Valsrivier form according to the South
African system of soil classification (Soil Classification Working Group, 1991). According to FAO, these
soils are classified as fluvisols and luvisols, respectively (FAO, 1988).
Experiment 1: Participatory evaluation of the relationship between cultivar, N rate, population density and
planting time with maize grain yield
The experiment was designed as a 24 factorial laid in a randomised complete block design (RCBD) with
three replications per site. The four factors were population density, rate of nitrogen fertilisation (N rate),
cultivar and planting time. The population densities used were 40 000 and 90 000 plants ha-1. To achieve
the former, plants were spaced 0.75 m × 0.33 m and for the latter population density a spacing of 0.75 m
× 0.15 m was used. N rates were 60 and 250 kg ha-1 both applied as three splits; a third each at planting,
5 weeks after emergence (WAE) and 7 WAE. Compound fertilizer 2:3:4 (30) was used as basal dressing
at planting while lime ammonium nitrate (LAN) (with 28% N) was used as topdressing. The two cultivars
tested were DKC61-25 and PAN6777 produced by Monsanto and PANNAR (Pty.) Ltd, respectively. The
former is a short season cultivar taking 55 -70 days to 50% flowering while the latter is a long season
cultivar taking 65-85 days to 50% flowering in cool and warm areas. The cultivars were among the top
performers from ARC regional trials in the two maturity classes (Du Plessis and Bruwer, 2004). Two
planting times, early and late were used but the actual dates varied with site. Differences in planting times
were caused by bird damage on emerging seedlings at Sisando and Kalawe, which reduced crop stand to
less than 10% of the target, necessitating replanting of the two sites at later dates. At Nofemele farm,
early planting was on 28th November and late planting on 19th December, 2005. At Kalawe, early planting
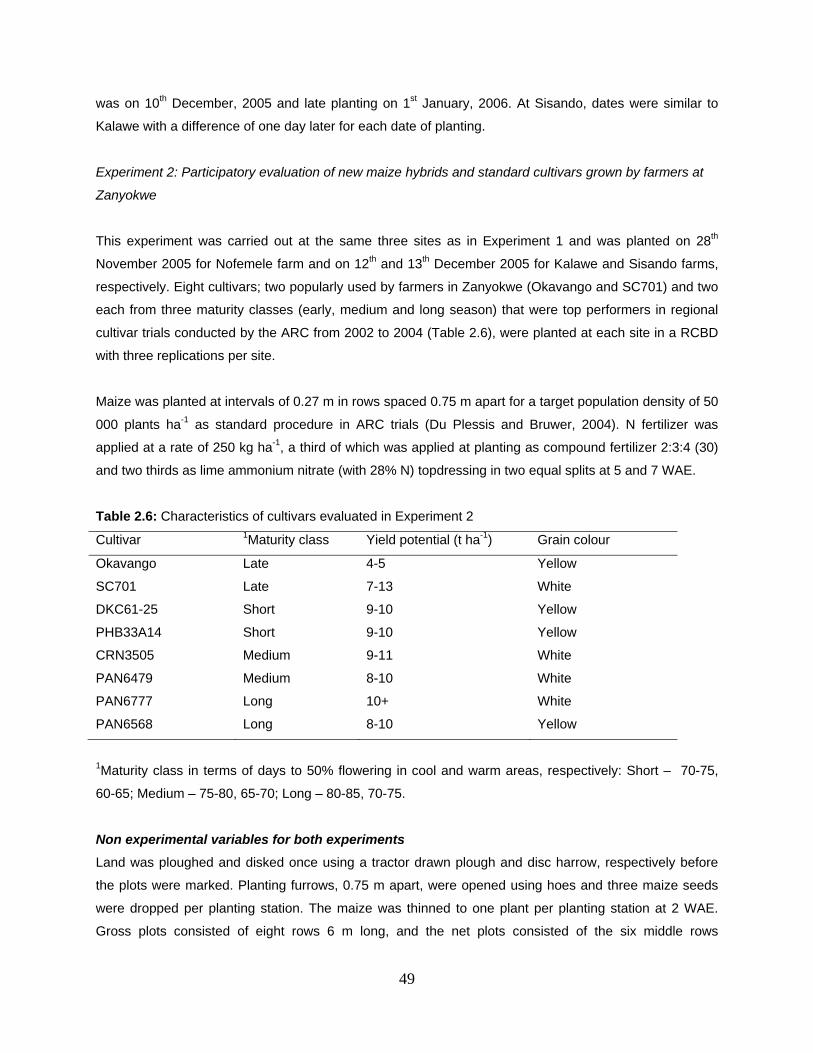
49
was on 10th December, 2005 and late planting on 1st January, 2006. At Sisando, dates were similar to
Kalawe with a difference of one day later for each date of planting.
Experiment 2: Participatory evaluation of new maize hybrids and standard cultivars grown by farmers at
Zanyokwe
This experiment was carried out at the same three sites as in Experiment 1 and was planted on 28th
November 2005 for Nofemele farm and on 12th and 13th December 2005 for Kalawe and Sisando farms,
respectively. Eight cultivars; two popularly used by farmers in Zanyokwe (Okavango and SC701) and two
each from three maturity classes (early, medium and long season) that were top performers in regional
cultivar trials conducted by the ARC from 2002 to 2004 (Table 2.6), were planted at each site in a RCBD
with three replications per site.
Maize was planted at intervals of 0.27 m in rows spaced 0.75 m apart for a target population density of 50
000 plants ha-1 as standard procedure in ARC trials (Du Plessis and Bruwer, 2004). N fertilizer was
applied at a rate of 250 kg ha-1, a third of which was applied at planting as compound fertilizer 2:3:4 (30)
and two thirds as lime ammonium nitrate (with 28% N) topdressing in two equal splits at 5 and 7 WAE.
Table 2.6: Characteristics of cultivars evaluated in Experiment 2
Cultivar 1Maturity class Yield potential (t ha-1) Grain colour
Okavango Late 4-5 Yellow
SC701 Late 7-13 White
DKC61-25 Short 9-10 Yellow
PHB33A14 Short 9-10 Yellow
CRN3505 Medium 9-11 White
PAN6479 Medium 8-10 White
PAN6777 Long 10+ White
PAN6568 Long 8-10 Yellow
1Maturity class in terms of days to 50% flowering in cool and warm areas, respectively: Short – 70-75,
60-65; Medium – 75-80, 65-70; Long – 80-85, 70-75.
Non experimental variables for both experiments
Land was ploughed and disked once using a tractor drawn plough and disc harrow, respectively before
the plots were marked. Planting furrows, 0.75 m apart, were opened using hoes and three maize seeds
were dropped per planting station. The maize was thinned to one plant per planting station at 2 WAE.
Gross plots consisted of eight rows 6 m long, and the net plots consisted of the six middle rows
50
measuring 4 m long. Weed control was done through the use of hand hoeing as was common practice in
the scheme. Maize stalk borer (Buseola fusca) was controlled by applying a pinch of Bulldock® (active
ingredient: pyrethroid) granules in the maize funnel at 4 WAE.
Data collection
For both experiments, farmer and extension officer information days were conducted during late
vegetative stage and at harvest to evaluate performance of technologies tested in the trials. During the
late vegetative stage, qualitative information was collected on uniformity of crop stand, and plant and cob
size, using focused group discussions. At harvest, farmers used pair-wise ranking to evaluate
performance of technologies. Plots were prepared for farmer and extension officer assessments. Maize
cobs from one row in each plot were dehusked to allow assessment of grain size, grain colour and other
attributes such as pest and/or disease infestation. At harvest, data on cob weight and shelling percentage
were collected and used to calculate grain yield for each site. A Willey-55 grain moisture meter (GB) was
used to standardise grain moisture content to 12.5% before statistical analysis.
Statistical analysis
Data on grain yield was subjected to analysis of variance using SAS version 8.2 (SAS, 1999) on a per site
basis. Bartlett’s test (Gomez and Gomez, 1984) was performed to determine homogeneity of error
variances before combining data across sites. Bartlett’s test showed homogeneity of the error variances
for Kalawe and Sisando, but not for Nofemele. For this reason data from Nofemele site was analysed and
presented separately whilst Sisando and Kalawe sites were combined. Least significant differences (LSD)
were calculated at 5% confidence level and used to compare treatment means using Student’s t-test (Ott,
1998).
2.5.3 Results
Experiment 1
Sisando and Kalawe farms: There was a significant (p<0.01) site × N rate × planting time interaction on
grain yield. There were significant interactions between N rate × cultivar (p<0.05), planting time ×
population density (p<0.01), N rate × planting time (p<0.05), site × N rate (p<0.01) and site × planting
time (p<0.05). Main effects of N, planting time, cultivar and population density were significant (p<0.01).
The site × N rate × planting time interaction showed that maize fertilised at 60 kg N ha-1 and planted early
produced similar yield regardless of site, but Sisando was higher yielding with late planting at the same N
rate (Table 2.7).
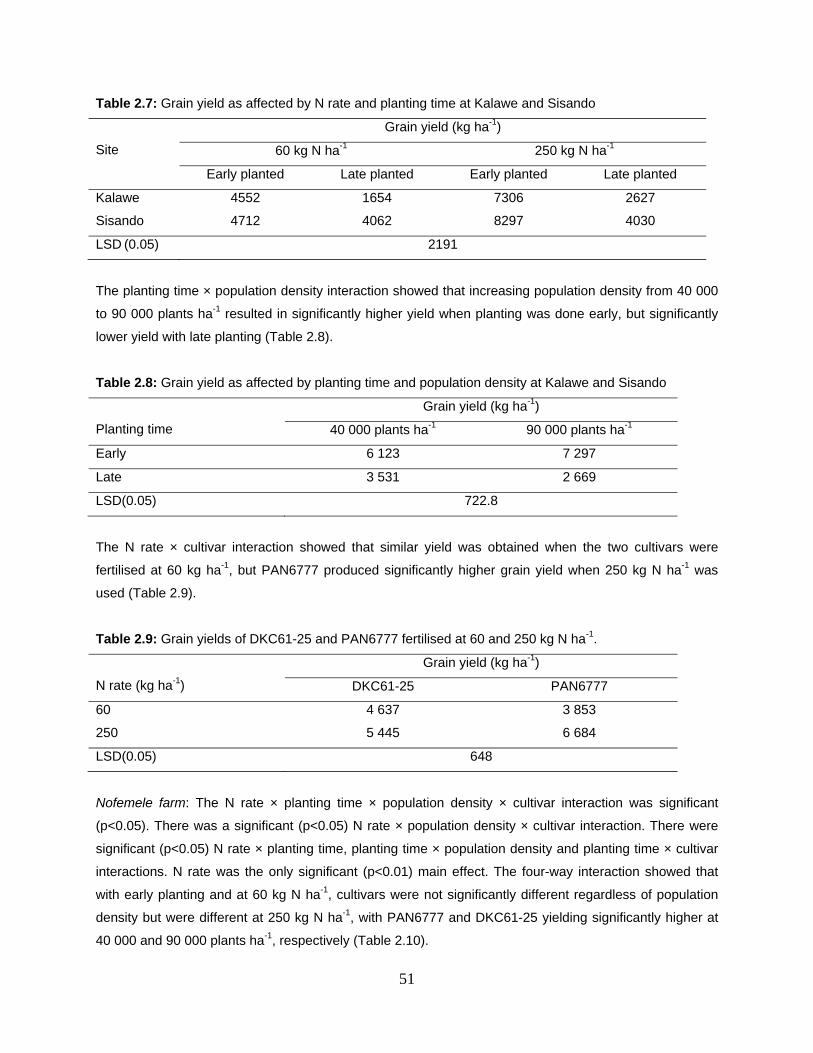
51
Table 2.7: Grain yield as affected by N rate and planting time at Kalawe and Sisando
Site
Grain yield (kg ha-1)
60 kg N ha-1 250 kg N ha-1
Early planted Late planted Early planted Late planted
Kalawe 4552 1654 7306 2627
Sisando 4712 4062 8297 4030
LSD (0.05) 2191
The planting time × population density interaction showed that increasing population density from 40 000
to 90 000 plants ha-1 resulted in significantly higher yield when planting was done early, but significantly
lower yield with late planting (Table 2.8).
Table 2.8: Grain yield as affected by planting time and population density at Kalawe and Sisando
Planting time
Grain yield (kg ha-1)
40 000 plants ha-1 90 000 plants ha-1
Early 6 123 7 297
Late 3 531 2 669
LSD(0.05) 722.8
The N rate × cultivar interaction showed that similar yield was obtained when the two cultivars were
fertilised at 60 kg ha-1, but PAN6777 produced significantly higher grain yield when 250 kg N ha-1 was
used (Table 2.9).
Table 2.9: Grain yields of DKC61-25 and PAN6777 fertilised at 60 and 250 kg N ha-1.
N rate (kg ha-1)
Grain yield (kg ha-1)
DKC61-25 PAN6777
60 4 637 3 853
250 5 445 6 684
LSD(0.05) 648
Nofemele farm: The N rate × planting time × population density × cultivar interaction was significant
(p<0.05). There was a significant (p<0.05) N rate × population density × cultivar interaction. There were
significant (p<0.05) N rate × planting time, planting time × population density and planting time × cultivar
interactions. N rate was the only significant (p<0.01) main effect. The four-way interaction showed that
with early planting and at 60 kg N ha-1, cultivars were not significantly different regardless of population
density but were different at 250 kg N ha-1, with PAN6777 and DKC61-25 yielding significantly higher at
40 000 and 90 000 plants ha-1, respectively (Table 2.10).
52
With late planting, cultivars differed at both population densities when fertilisation was applied at 250 kg N
ha-1 with PAN6777 yielding significantly higher at 40 000 plants ha-1, but lower than DKC61-25 at 90 000
plants ha-1. For DKC61-25, there was no difference in grain yield at 40 000 plants ha-1 whether planting
was done early or late regardless of N rate. The response to N rate for this cultivar was apparent at 90
000 plants ha-1 whereby higher grain yield was obtained at 250 kg N ha-1 regardless of planting time. For
PAN6777 there was a significant increase in grain yield with increase in N rate from 60 to 250 kg ha-1
when maize was grown at 40 000 plants ha-1 regardless of planting time and when maize grown at 90 000
plants ha-1 was planted late (Table 2.10).
Farmer evaluations
Farmers preferred early-planted PAN6777 grown at 40 000 plants ha-1 and fertilised at 250 kg N ha-1,
citing big size of cob and grains, which would supposedly translate to higher yield, as the main reason for
their preference. Late planted maize fertilised at 60 kg N ha-1 had similar appearance to farmers’ maize
crop and as a result farmers were able to link performance of their crop to their management of N.
Planting time effects showed poor performance of late plantings compared to early planting but farmers
were unable to separate performance of cultivars in the late planting treatment at the vegetative stage,
but this became apparent at harvesting. At harvesting, poor grain fill of PAN6777 relative to DKC61-25
was observed as a negative attribute. However, even with late planting, farmers still preferred PAN6777
because of the bigger cob size relative to DKC61-25. With early planting observation of the extension
officers was similar to that of the farmers and both preferred the lower population density of 40 000 plants
ha-1 irrespective of cultivar, planting time and N rate. However, unlike the farmers, the extension officers
preferred DKC61-25 when fertilisation was done at the lower rate and planting was done late.
Farmers were able to attribute the low productivity of their maize as being caused by low N fertilisation
and late planting. However, both farmers and extension workers were not able to link population density
with the different management factors. They preferred the lower population density regardless of the
levels of the other three factors. Thus, they tended to look at individual factors in isolation without looking
at possible interaction among factors.
Experiment 2
There was a significant (p<0.01) difference in performance amongst the cultivars across the three sites.
At Kalawe and Sisando farms there was a significant (p<0.01) interaction between cultivar and site, with
DKC61-25 and PHB33A14 yielding higher than PAN6568 and PAN6479 at Kalawe. At Sisando, there
was no significant difference between PAN6568, PAN6479, DKC61-25 and PHB33A14 (Table 2.11).
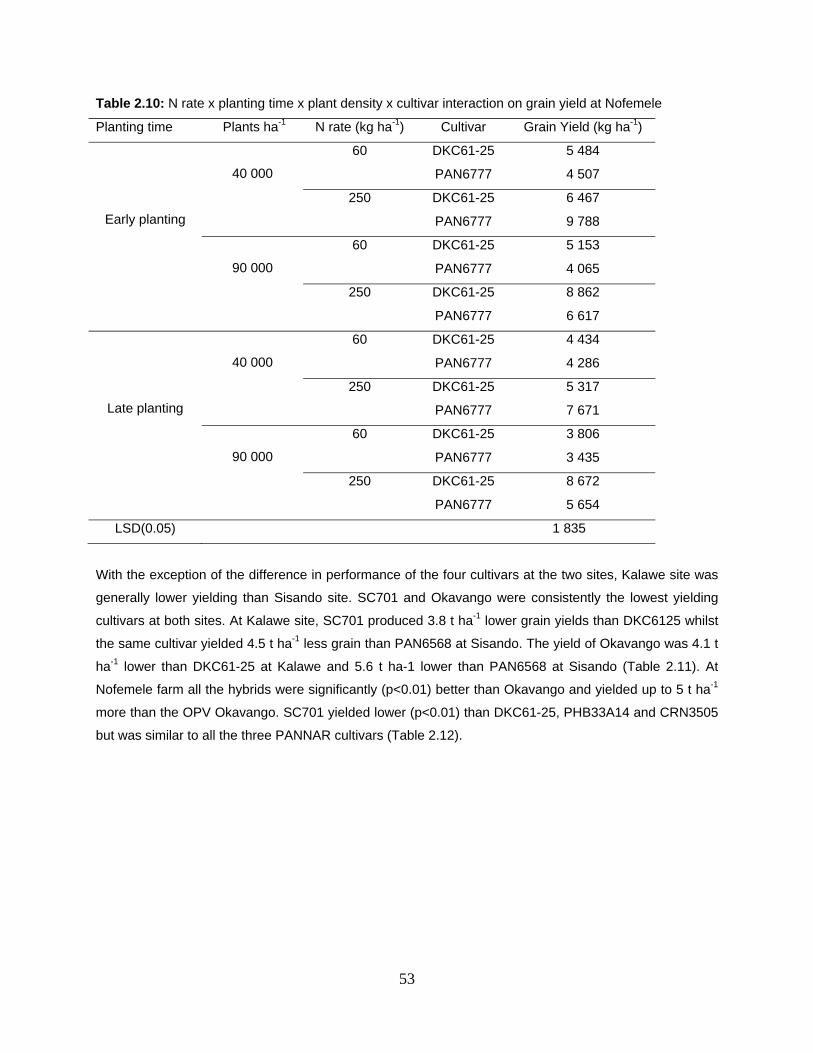
53
Table 2.10: N rate x planting time x plant density x cultivar interaction on grain yield at Nofemele
Planting time Plants ha-1 N rate (kg ha-1) Cultivar Grain Yield (kg ha-1)
Early planting
40 000
60 DKC61-25 5 484
PAN6777 4 507
250 DKC61-25 6 467
PAN6777 9 788
90 000
60
DKC61-25 5 153
PAN6777 4 065
250
DKC61-25 8 862
PAN6777 6 617
Late planting
40 000
60
DKC61-25 4 434
PAN6777 4 286
250
DKC61-25 5 317
PAN6777 7 671
90 000
60
DKC61-25 3 806
PAN6777 3 435
250
DKC61-25 8 672
PAN6777 5 654
LSD(0.05) 1 835
With the exception of the difference in performance of the four cultivars at the two sites, Kalawe site was
generally lower yielding than Sisando site. SC701 and Okavango were consistently the lowest yielding
cultivars at both sites. At Kalawe site, SC701 produced 3.8 t ha-1 lower grain yields than DKC6125 whilst
the same cultivar yielded 4.5 t ha-1 less grain than PAN6568 at Sisando. The yield of Okavango was 4.1 t
ha-1 lower than DKC61-25 at Kalawe and 5.6 t ha-1 lower than PAN6568 at Sisando (Table 2.11). At
Nofemele farm all the hybrids were significantly (p<0.01) better than Okavango and yielded up to 5 t ha-1
more than the OPV Okavango. SC701 yielded lower (p<0.01) than DKC61-25, PHB33A14 and CRN3505
but was similar to all the three PANNAR cultivars (Table 2.12).
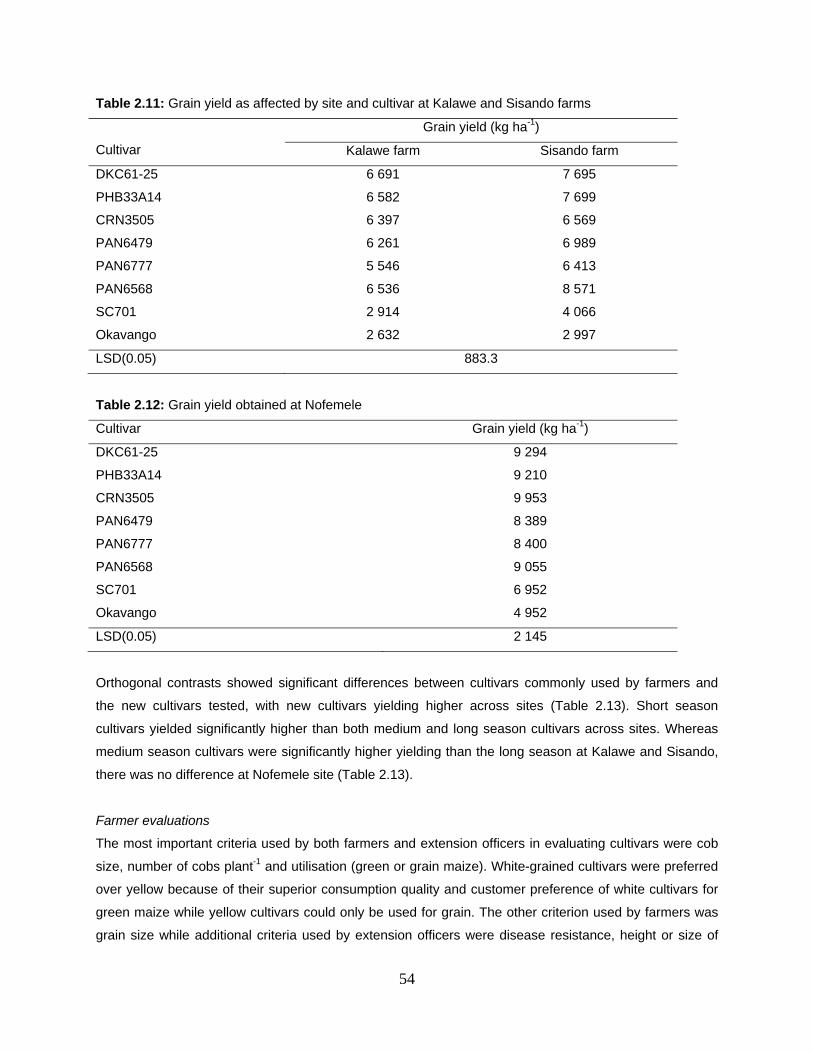
54
Table 2.11: Grain yield as affected by site and cultivar at Kalawe and Sisando farms
Cultivar
Grain yield (kg ha-1)
Kalawe farm Sisando farm
DKC61-25 6 691 7 695
PHB33A14 6 582 7 699
CRN3505 6 397 6 569
PAN6479 6 261 6 989
PAN6777 5 546 6 413
PAN6568 6 536 8 571
SC701 2 914 4 066
Okavango 2 632 2 997
LSD(0.05) 883.3
Table 2.12: Grain yield obtained at Nofemele
Cultivar Grain yield (kg ha-1)
DKC61-25 9 294
PHB33A14 9 210
CRN3505 9 953
PAN6479 8 389
PAN6777 8 400
PAN6568 9 055
SC701 6 952
Okavango 4 952
LSD(0.05) 2 145
Orthogonal contrasts showed significant differences between cultivars commonly used by farmers and
the new cultivars tested, with new cultivars yielding higher across sites (Table 2.13). Short season
cultivars yielded significantly higher than both medium and long season cultivars across sites. Whereas
medium season cultivars were significantly higher yielding than the long season at Kalawe and Sisando,
there was no difference at Nofemele site (Table 2.13).
Farmer evaluations
The most important criteria used by both farmers and extension officers in evaluating cultivars were cob
size, number of cobs plant-1 and utilisation (green or grain maize). White-grained cultivars were preferred
over yellow because of their superior consumption quality and customer preference of white cultivars for
green maize while yellow cultivars could only be used for grain. The other criterion used by farmers was
grain size while additional criteria used by extension officers were disease resistance, height or size of
55
plant, husk coverage and uniformity of cobs. At the vegetative stage, both farmers and extension officers
noted increased susceptibility of Okavango to stalk borer attack and to lodging but no scores were
recorded. Size of the plant relative to the cob, where a small cob was borne high on the plant was also a
negative attribute observed with regards to Okavango. DKC61-25 was the most popular cultivar during
the vegetative stage because of its earliness and uniformity of plants. Despite having more evaluation
criteria, extension officer assessments were in agreement with assessments by farmers at harvest.
SC701 was scored the best cultivar, followed by PAN6777 while PAN6568 was scored as the best of the
yellow cultivars. Contrary to its popularity during the vegetative stage, DKC61-25 was ranked as the worst
at harvest mainly due to the relatively smaller size of the cobs and grain, which would supposedly
translate to lower yields; and poor husk coverage which resulted in birds feeding on substantial portions
of the cob.
Table 2.13: Orthogonal contrasts comparing cultivars used by farmers to new cultivars and comparing
maturity classes at the three sites
Characteristic of
comparison
Significance (P value)
Superior cultivar Nofemele Kalawe and Sisando
Okavango and SC701
versus new cultivars
0.01
0.01
New cultivars
Short versus long
season cultivars
0.01
0.01
Short
Short versus medium
season cultivars
0.01
0.05
Short
Medium versus long
season cultivars
NS 0.01 Medium
2.5.4 Discussion
Results of this study indicate that grain yield was significantly affected by cultivar, N rate, planting time
and population density and there were interactions among these factors. Between 45 000 and 90 000
plants ha-1 are required to achieve best yields under irrigation in SA, depending on maturity class
(Department of Agriculture, 2003). Being a long season cultivar, PAN6777 was more sensitive to nutrient
stress than DKC61-25 which only responded to increased N rate when it was planted at 90 000 plants ha-
1 and not at 40 000 plants ha-1. Thus, with timely planting and optimum N rate, PAN6777 would be
favoured over DKC61-25 while the latter would be a better option when planting is delayed as long as it is
56
grown at the higher population density of 90 000 plants ha-1 and well fertilised. This contradicts extension
officers’ choice of late planted DKC61-25 at 60 kg N ha-1 at a population density of 40 000 plants ha-1. It
can, therefore, be deduced that when maize is grown at a higher population density it requires more
nutrients due to increased competition for the limited nutrients and this is irrespective of cultivar. With
nutrients and season length non-limiting, the higher population density would yield more for short season
cultivars whilst a lower population density would be favourable for long season cultivars as shown by this
study. Short season cultivars need to be grown at a higher population density in order to generate the leaf
area index that provides maximum interception of solar radiation, an essential step to maximize grain
yield (Sangoi, 2000).
Findings of this study indicated that various maize hybrids differ markedly in grain yield response to N
fertilisation. Similar results were obtained by Mkhabela et al. (2001). This means that the optimum N
requirements for maize differ from one cultivar to another, largely due to differences in yield potential.
Long season cultivars generally yield higher with timely planting and would require higher rates of N
fertilisation than short season cultivars. N rate followed by planting time had the greatest influence on
grain yield. Effects of late planting were more apparent at Kalawe and Sisando which were generally
planted later than Nofemele farm.
Similar results of grain yield decline with delayed planting have been obtained in Sudan (Rahman et al.,
2001). Variation in maize grain yield with delayed planting is mainly due to the decrease in translocation
of photosynthates to the ripening grain (Tanaka and Hara, 1974). Du Pisani et al. (1982) developed a
model for predicting planting time and reported that for much of the maize-growing areas in SA, the best
time to plant ranged from mid-November to mid-December. However, monitoring studies done in
Zanyokwe during the same season when the reported studies were conducted showed that farmers
planted their maize from December until as late as mid-March. With such a delay in planting, yields can
be adversely reduced. Since farmers in Zanyokwe are more interested in green maize, it would be
important to test the effect of planting time on green maize production as well.
Results of statistical analysis indicated that factors interact and choice of population density to use
depends on cultivar, N rate and planting time. However, unlike farmers, extension officers rightly
interpreted the interaction between cultivar, planting time and N rate, resulting in their opting for DKC61-
25 with late planting and low N fertilisation. This has been confirmed by results of statistical analysis.
Upon conduct of the information days, it became apparent that both farmers and extension officers lacked
technical skills on basic agronomic aspects of maize production and would benefit from training courses
on maize agronomy.
57
New cultivars generally performed better than the two cultivars (SC701 and Okavango) commonly grown
by farmers and short season cultivars out-yielded medium and long season cultivars. The yield of 4.95 t
ha-1 obtained from Okavango at Nofemele is within its yield potential of 4-5 t ha-1. This means that
improvement in management of the OPV Okavango will not result in any higher yield than obtained in the
study, yet it is low under irrigation. OPVs are known to perform better than hybrids in below optimum
conditions of low rainfall, but they cannot compete with hybrid maize in high potential areas (Belsitio,
2004). These findings suggest that proper selection of maize cultivars alone could almost double grain
yields at Zanyokwe.
Maize planting in the scheme is mostly done in the month of December, and planting of the cultivar
evaluation trials was done at the same time that farmers were planting their own maize. Results of this
study indicated that season length could have been shorter for both SC701 and Okavango which are long
season cultivars taking about 160 days to physiological maturity, probably the reason why the two
cultivars performed a bit better at Nofemele where planting was done about two weeks earlier than at
Kalawe and Sisando. This suggest that with current practices in terms of planting time, farmers would
obtain higher yields with short season cultivars like DKC61-25 rather than the long season cultivars
commonly used.
DKC61-25 was favoured by both farmers and extension officers during assessments at flowering, which
agreed with results of statistical analysis of grain yield data whereby this cultivar was among the top
yielding cultivars. However, at harvesting the same cultivar was scored as the worst cultivar while SC701
was scored as the best. SC701 was favoured mainly because of a larger cob size relative to the other
cultivars. Cob size, cited as the most important selection criteria by farmers and extension officers, does
not necessarily translate to higher grain yield. The most important grain yield determinant in maize is
grain number (Otegui and Bonhomme, 1998). Other important grain yield determinants include number of
cobs per unit area (Mkhabela et al., 2001) and grain weight (Anderson et al., 1984; FAO, 1980). The
criteria used by farmers and extension workers in assessing a cultivar are not in line with agronomic
aspects of grain maize production. However, cob size would be one of the most important selection
criteria in production for green maize.
Farmers have traditionally grown OPVs Okavango and/or Sahara for grain maize and SR52 or SC701 for
green maize. Farmers were right in their choice of SC701 for purposes of green maize production, since
the cob is of very good size and this sells very competitively on the market. ARC (1998) recommends this
particular cultivar and SR52 as some of the cultivars for production as green maize. While the study
focused on improving grain yield, farmers preferred green maize production with white maize, which
fetched higher prices at the market. It can therefore be said that farmers’ assessment criteria was well-
58
informed since their interest was for green maize rather than grain. Management practices to improve
productivity of SC701 might need to be explored.
It is apparent from the results that farmers and extension officers agree in terms of their choices of
cultivars. Although extension officers had more criteria used for selection of cultivars than farmers, the
ultimate choices were the same. Yields obtained for all the new cultivars tested are comparable to those
obtained from ARC evaluations (planted between 19 November and 8 December) for the early planted
Nofemele site but lower for Kalawe and Sisando sites. This means that planting time had a significant
effect on yield with later planted sites yielding lower. The shorter growing season favoured short season
cultivars. However, new cultivars tested were not preferred by the farmers and their adoption is less likely.
2.5.5 Conclusions
Findings of this study have confirmed that poor agronomic management practices by farmers are some of
the reasons for the low maize grain yields obtained in Zanyokwe. Late planting, low N fertiliser rates, and
inappropriate choice of cultivar and plant population, as well as the interaction among these factors
tended to limit grain yield. Though the focus of the research was on grain maize, farmers were more
interested in green maize and further research will therefore need to include investigations on options to
increase productivity of green maize. As a result of the preliminary studies in the scheme, focussed
research should dwell more on investigation options to improve on planting time, fertiliser and population
density management, and cultivar selection to optimise on both green and grain yield.
59
2.6 Testing of technological options for addressing agronomic constraints:
1. Effect of reduced dosages of atrazine and narrow rows on weeds at
Zanyokwe
2.6.1 Introduction
Inadequate weed control was identified as a major constraint to yield in ZIS (section.2.2.7.2) and is one of
the major causes of poor yields on smallholder farms in South Africa (SA) (Marais, 1992; Bembridge,
2000; Machethe et al., 2004; Fanadzo, 2007). Most smallholder farmers are aware of the detrimental
effects of weeds but do not have the means to control them, especially where tractor mechanisation has
resulted in an increased area of land being cultivated (Steyn, 1988). Weed control using hand hoeing is
the major contributor to the total labour input in the production of crops in smallholder irrigation in SA (Van
Averbeke et al., 1998). The efficacy of hand hoeing is often compromised by continual wet conditions
characteristic of the beginning of the rainy season. Hoe-weeding under wet conditions often causes
weeds to re-root and re-establish, necessitating several rounds of weeding to keep the crop weed-free
and avert yield losses (Mashingaidze and Chivinge, 1995; Mashingaidze, 2004). Effective hoe weeding in
maize requires 460 hours ha-1 in SA (Auerbach, 1993) and this becomes impractical given the large areas
planted to the crop and the general shortage of labour on small farms (2.5.1.1).
It was observed in ZIS that farmers tended to abandon crops to weeds after failing to meet the labour
requirement for hoe weeding (Fanadzo, 2007). The labour shortages for weeding are being worsened by
the increase in morbidity wreaked by the AIDS pandemic that is sweeping sub-Saharan Africa (Sibuga,
1999). The ability of smallholder farmers to effectively control weeds is not only threatened by the
HIV/AIDS subtracting the able-bodied weeders from the households, but also by farmers neglecting their
weeding chores to tend to the sick and attend funerals (Mashingaidze, 2004). Incorporation of herbicides
in smallholder farming has been shown to minimise labour requirements and increase profitability
(Auerbach, 1993). However, adoption of herbicide technology in the smallholder sector has traditionally
been low because of lack of technical knowledge of the farmers and extension agents, lack of funds to
purchase herbicides, fear of crop phytotoxicity and lack of equipment (Johnson and Adesina, 1993).
It has long been recognised that application of reduced herbicide dosages (RHDs) can provide similar
levels of weed control as label recommended dosages (LRDs) (Salonen, 1992; O’Sullivan and Bouw,
1993; Alm et al., 2000; Duchense et al., 2004; Mashingaidze, 2004). RHDs reduce crop injury, risk of
contamination in the ecosystem, herbicide carryover phytotoxicity problems, and the escalating problem
of herbicide-resistant weeds (Pannacci and Covarelli, 2009; Blackshaw et al., 2006), thus enhancing
sustainability in the long run. Use of RHDs costs a fraction of the LRD and is therefore more attractive to
resource-poor smallholder farmers.
60
Cultural management techniques, such as reduced crop row spacing, that provide supplemental weed
control when herbicide inputs are reduced can help reduce production costs (Grichar et al., 2004). Narrow
rows are thought to increase weed control by increasing the competitiveness of a crop with weeds and by
reducing light transmittance to the soil surface (Tharp and Kells, 2001). The reduction of competition
among crop plants while favouring competition against weeds (Acciaresi and Zuluaga, 2006) through the
use of narrow rows may be more favourable to the use of RHDs (Johnson and Hoverstad, 2002). It is
hypothesised that integration of narrow rows with RHDs will be more effective in controlling weeds and
averting yield losses compared to the use of narrow rows or RHDs in isolation. The objective of this study
was therefore to investigate the effects of row spacing and herbicide dosage on weed growth and on
green and grain maize yield in Zanyokwe irrigation scheme (ZIS).
2.6.2 Materials and Methods
Study sites
The experiment which was researcher managed was established at three farmers’ fields; Nofemele in
2006/07, and Bantubantu and Kalawe in 2007/08 in ZIS.
Treatments and experimental design
Row spacing was at two levels; 45 and 90 cm while herbicide dosage was at three levels; 750, 1500 and
2250 g active ingredient (a.i.) atrazine ha-1, representing 33%, 67%, and 100% of the LRD of atrazine for
a sandy clay loam/sandy clay (31-40% clay content). The herbicide was applied using a knapsack
sprayer calibrated to apply 200 litres of herbicide spray mixture per hectare. The herbicide treatments
were applied when the majority of the weeds were at the 2-3 leaf stage at 2 weeks after emergence
(WAE). The experiment was laid out as a split plot in a randomised complete block design replicated
three times, with row spacing as the main plot and herbicide dosage as the sub plot. In-row spacing was
27 cm and 54 cm for the 90 cm and 45 cm rows, respectively, to give a target population of 41 152 plants
ha-1. Gross plots were 9.9 × 8 m and the corresponding net plot size was 3.6 × 6 m each for the green
and grain yield assessments.
Non-experimental variables
Land was ploughed and disked once using a tractor-drawn plough and disc harrow, respectively, before
the plots were marked. Fertilizer was applied at a rate of 250 kg N ha-1, a third of which was applied as a
basal application at planting as compound fertilizer 2:3:4 (30) and the other two thirds were applied as
lime ammonium nitrate (28% N) topdressing in two equal splits at 5 and 7 WAE. Supplementary irrigation
was done using the sprinkler system which discharged 6 mm of water per hour. Irrigation water was
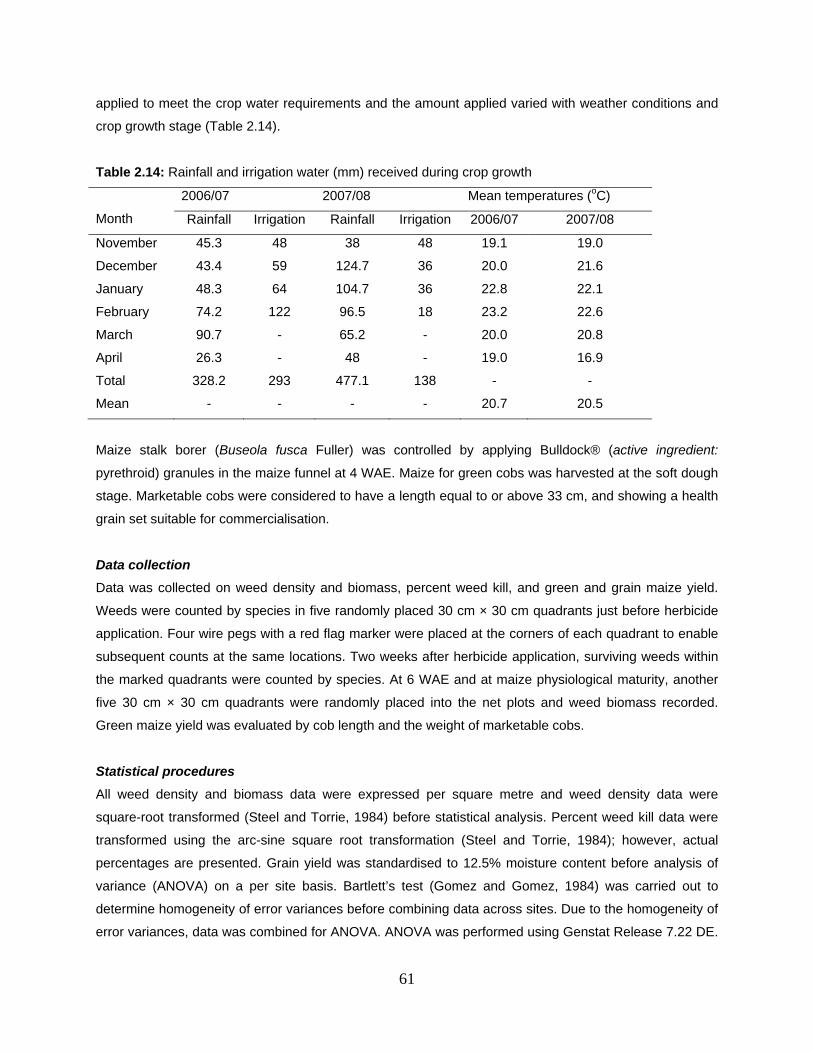
61
applied to meet the crop water requirements and the amount applied varied with weather conditions and
crop growth stage (Table 2.14).
Table 2.14: Rainfall and irrigation water (mm) received during crop growth
Month
2006/07 2007/08 Mean temperatures (oC)
Rainfall Irrigation Rainfall Irrigation 2006/07 2007/08
November 45.3 48 38 48 19.1 19.0
December 43.4 59 124.7 36 20.0 21.6
January 48.3 64 104.7 36 22.8 22.1
February 74.2 122 96.5 18 23.2 22.6
March 90.7 - 65.2 - 20.0 20.8
April 26.3 - 48 - 19.0 16.9
Total 328.2 293 477.1 138 - -
Mean - - - - 20.7 20.5
Maize stalk borer (Buseola fusca Fuller) was controlled by applying Bulldock® (active ingredient:
pyrethroid) granules in the maize funnel at 4 WAE. Maize for green cobs was harvested at the soft dough
stage. Marketable cobs were considered to have a length equal to or above 33 cm, and showing a health
grain set suitable for commercialisation.
Data collection
Data was collected on weed density and biomass, percent weed kill, and green and grain maize yield.
Weeds were counted by species in five randomly placed 30 cm × 30 cm quadrants just before herbicide
application. Four wire pegs with a red flag marker were placed at the corners of each quadrant to enable
subsequent counts at the same locations. Two weeks after herbicide application, surviving weeds within
the marked quadrants were counted by species. At 6 WAE and at maize physiological maturity, another
five 30 cm × 30 cm quadrants were randomly placed into the net plots and weed biomass recorded.
Green maize yield was evaluated by cob length and the weight of marketable cobs.
Statistical procedures
All weed density and biomass data were expressed per square metre and weed density data were
square-root transformed (Steel and Torrie, 1984) before statistical analysis. Percent weed kill data were
transformed using the arc-sine square root transformation (Steel and Torrie, 1984); however, actual
percentages are presented. Grain yield was standardised to 12.5% moisture content before analysis of
variance (ANOVA) on a per site basis. Bartlett’s test (Gomez and Gomez, 1984) was carried out to
determine homogeneity of error variances before combining data across sites. Due to the homogeneity of
error variances, data was combined for ANOVA. ANOVA was performed using Genstat Release 7.22 DE.
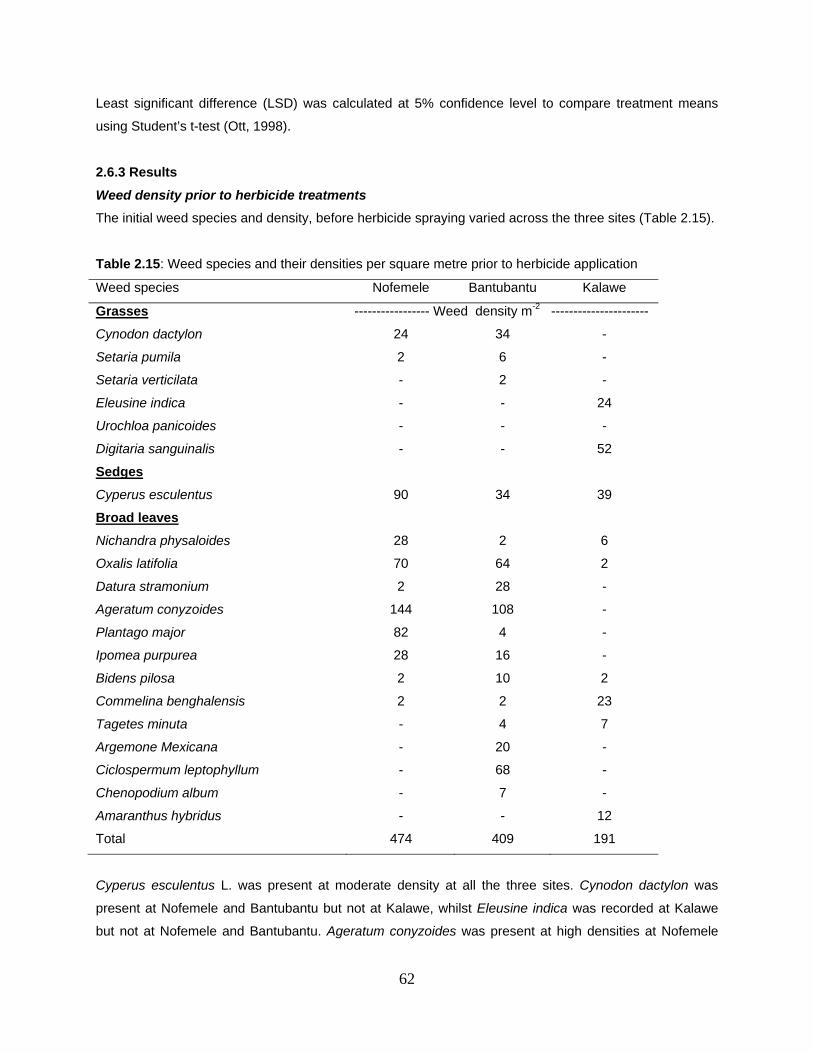
62
Least significant difference (LSD) was calculated at 5% confidence level to compare treatment means
using Student’s t-test (Ott, 1998).
2.6.3 Results
Weed density prior to herbicide treatments
The initial weed species and density, before herbicide spraying varied across the three sites (Table 2.15).
Table 2.15: Weed species and their densities per square metre prior to herbicide application
Weed species Nofemele Bantubantu Kalawe
Grasses ----------------- Weed density m-2 ----------------------
Cynodon dactylon 24 34 -
Setaria pumila 2 6 -
Setaria verticilata - 2 -
Eleusine indica - - 24
Urochloa panicoides - - -
Digitaria sanguinalis - - 52
Sedges
Cyperus esculentus 90 34 39
Broad leaves
Nichandra physaloides 28 2 6
Oxalis latifolia 70 64 2
Datura stramonium 2 28 -
Ageratum conyzoides 144 108 -
Plantago major 82 4 -
Ipomea purpurea 28 16 -
Bidens pilosa 2 10 2
Commelina benghalensis 2 2 23
Tagetes minuta - 4 7
Argemone Mexicana - 20 -
Ciclospermum leptophyllum - 68 -
Chenopodium album - 7 -
Amaranthus hybridus - - 12
Total 474 409 191
Cyperus esculentus L. was present at moderate density at all the three sites. Cynodon dactylon was
present at Nofemele and Bantubantu but not at Kalawe, whilst Eleusine indica was recorded at Kalawe
but not at Nofemele and Bantubantu. Ageratum conyzoides was present at high densities at Nofemele
63
and Bantubantu farms, but was not recorded at Kalawe. Nicandra physaloides was present at moderate
density at Nofemele farm, but at low densities at Bantubantu and Kalawe. Whilst Oxalis latifolia was
present at relatively high density at Nofemele and Bantubantu, its density at Kalawe was low. Plantago
major was the third most important weed at Nofemele after A. conyzoides and C. esculentus, but the
weed was not important at the other two sites. With a total of 16 different weed species, Bantubantu had
the most diverse weed spectrum while Kalawe had the least number of weed species totalling nine.
Nofemele had the highest weed density overall which was more than twice the density recorded at
Kalawe (Table 2.15).
Weed density at 6 WAE and at maize physiological maturity
There were no significant interactions among factors on weed density at 6 WAE and at maize
physiological maturity. The main effect of row spacing was significant (p<0.05) at physiological maturity
but not at 6 WAE. The main effects of site and herbicide dosage were not significant (p>0.05) both at 6
WAE and at physiological maturity. At physiological maturity, weed density decreased by 11% from 12.73
to 11.30 weeds m-2 when row spacing was decreased from 90 to 45 cm.
Weed mortality
There were no significant interactions among the factors on percent kill of weeds. Atrazine dosage
(p<0.01), row spacing (p<0.05) and site (p<0.05) had significant effects on overall percent weed kill.
There was a consistent increase in percent weed kill with increase in atrazine dosage. Percent kill
increased from 46.2 to 58.8 to 70.6% when dosage was increased from 33 to 67 to 100% of the LRD.
Percent kill increased by 8.2% from 54.4 to 62.6% when row spacing was reduced from 90 to 45 cm.
Kalawe had the least percent weed kill of 50.1% whilst weed mortality at Nofemele (63.9%) and
Bantubantu (61.6%) was similar.
Percent weed kill varied according to weed species. There was a 100% kill of broad leaf weeds Ageratum
conyzoides, Datura stramonium, Plantago major, Amaranthus hybridus, Nicandra physaloides and Bidens
pilosa regardless of the herbicide dosage used; no survivors could be counted at three weeks after
herbicide application. Digitaria sanguinalis, C. esculentus, C. dactylon and O. latifolia were the most
tolerant weed species; the herbicide appeared to have temporarily scotched their foliage but they were
observed re-growing from underground rhizomes later on, even at the LRD.
Weed biomass at 6 WAE
There was a significant (p<0.01) interaction between row spacing and site on weed biomass at 6 WAE.
The main effects of atrazine dosage, row spacing and site were significant (p<0.01). The row spacing ×
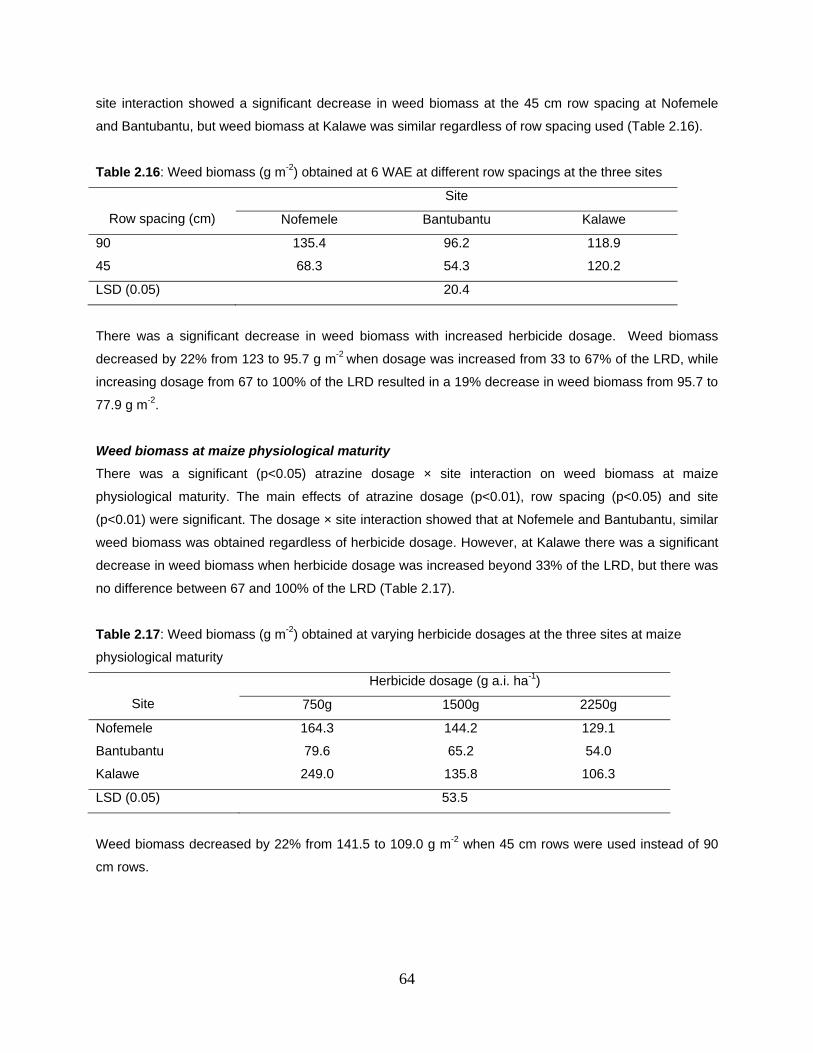
64
site interaction showed a significant decrease in weed biomass at the 45 cm row spacing at Nofemele
and Bantubantu, but weed biomass at Kalawe was similar regardless of row spacing used (Table 2.16).
Table 2.16: Weed biomass (g m-2) obtained at 6 WAE at different row spacings at the three sites
Row spacing (cm)
Site
Nofemele Bantubantu Kalawe
90 135.4 96.2 118.9
45 68.3 54.3 120.2
LSD (0.05) 20.4
There was a significant decrease in weed biomass with increased herbicide dosage. Weed biomass
decreased by 22% from 123 to 95.7 g m-2 when dosage was increased from 33 to 67% of the LRD, while
increasing dosage from 67 to 100% of the LRD resulted in a 19% decrease in weed biomass from 95.7 to
77.9 g m-2.
Weed biomass at maize physiological maturity
There was a significant (p<0.05) atrazine dosage × site interaction on weed biomass at maize
physiological maturity. The main effects of atrazine dosage (p<0.01), row spacing (p<0.05) and site
(p<0.01) were significant. The dosage × site interaction showed that at Nofemele and Bantubantu, similar
weed biomass was obtained regardless of herbicide dosage. However, at Kalawe there was a significant
decrease in weed biomass when herbicide dosage was increased beyond 33% of the LRD, but there was
no difference between 67 and 100% of the LRD (Table 2.17).
Table 2.17: Weed biomass (g m-2) obtained at varying herbicide dosages at the three sites at maize
physiological maturity
Site
Herbicide dosage (g a.i. ha-1)
750g 1500g 2250g
Nofemele 164.3 144.2 129.1
Bantubantu 79.6 65.2 54.0
Kalawe 249.0 135.8 106.3
LSD (0.05) 53.5
Weed biomass decreased by 22% from 141.5 to 109.0 g m-2 when 45 cm rows were used instead of 90
cm rows.
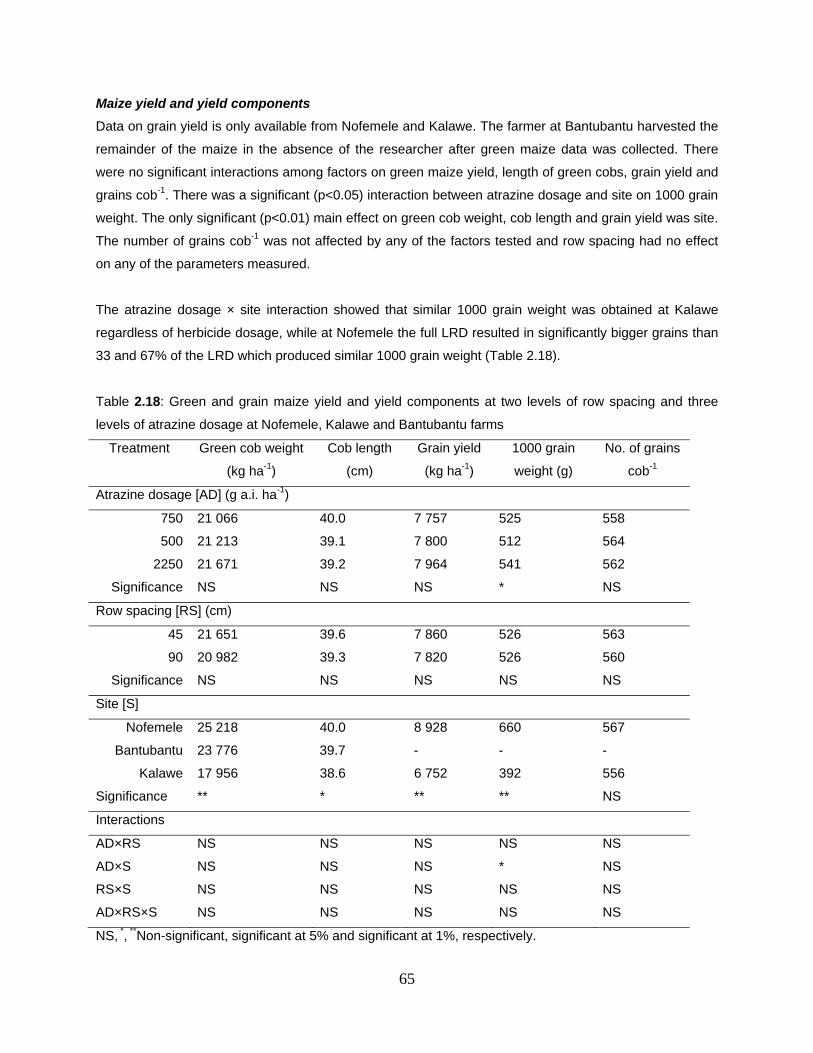
65
Maize yield and yield components
Data on grain yield is only available from Nofemele and Kalawe. The farmer at Bantubantu harvested the
remainder of the maize in the absence of the researcher after green maize data was collected. There
were no significant interactions among factors on green maize yield, length of green cobs, grain yield and
grains cob-1. There was a significant (p<0.05) interaction between atrazine dosage and site on 1000 grain
weight. The only significant (p<0.01) main effect on green cob weight, cob length and grain yield was site.
The number of grains cob-1 was not affected by any of the factors tested and row spacing had no effect
on any of the parameters measured.
The atrazine dosage × site interaction showed that similar 1000 grain weight was obtained at Kalawe
regardless of herbicide dosage, while at Nofemele the full LRD resulted in significantly bigger grains than
33 and 67% of the LRD which produced similar 1000 grain weight (Table 2.18).
Table 2.18: Green and grain maize yield and yield components at two levels of row spacing and three
levels of atrazine dosage at Nofemele, Kalawe and Bantubantu farms
Treatment Green cob weight
(kg ha-1)
Cob length
(cm)
Grain yield
(kg ha-1)
1000 grain
weight (g)
No. of grains
cob-1
Atrazine dosage [AD] (g a.i. ha-1)
750 21 066 40.0 7 757 525 558
500 21 213 39.1 7 800 512 564
2250 21 671 39.2 7 964 541 562
Significance NS NS NS * NS
Row spacing [RS] (cm)
45 21 651 39.6 7 860 526 563
90 20 982 39.3 7 820 526 560
Significance NS NS NS NS NS
Site [S]
Nofemele 25 218 40.0 8 928 660 567
Bantubantu 23 776 39.7 - - -
Kalawe 17 956 38.6 6 752 392 556
Significance ** * ** ** NS
Interactions
AD×RS NS NS NS NS NS
AD×S NS NS NS * NS
RS×S NS NS NS NS NS
AD×RS×S NS NS NS NS NS
NS, *, **Non-significant, significant at 5% and significant at 1%, respectively.
66
Nofemele produced the highest weight of green cobs whilst Kalawe had the least. Nofemele and
Bantubantu produced cobs of similar length while Kalawe produced shorter cobs. Nofemele produced 2
176 kg ha-1 more grain yield than Kalawe (Table 2.18).
2.6.4 Discussion
Results of this study indicated that whilst reduced dosages of atrazine can be used successfully; this
depends on the main weed species in an area. If more tolerant weed species such as D. sanguinalis and
C. esculentus are the main weed species, then RHDs may not achieve adequate weed control as
demonstrated by the study. The reduction in grain yield at Kalawe may be attributed to the increased
weed pressure at that site. The dominant weed present at that site was the grass weed Digitaria
sanguinalis, which proved very difficult to control even at the recommended dosage. This is also
supported by the fact that this site recorded the least percent weed kill. Our results agree with those of
Shrestha et al. (2001) who reported that the effectiveness of narrow rows in reducing weed biomass was
influenced by weed spectrum and weed density among other factors.
Findings by Mashingaidze (2004) indicated that mixing reduced dosages of atrazine and nicosulfuron
provided better weed control compared to similar or higher doses of each individual herbicide. This
means that application of reduced doses of mixtures of complementary herbicides in terms of target
species spectrum (nicosulfuron is mainly a grass herbicide while atrazine controls mainly broadleaf
weeds), rather than individual herbicides, may reduce the need to follow up application of reduced
dosages with weed control tillage to remove weed escapes. Results of this study indicate that a RHD
strategy applied over a number of seasons may increasingly select for the moderately tolerant weed
species to the herbicides being applied. In the case of atrazine as used in the study, the moderately
tolerant weeds C. esculentus, C. dactylon and D. sanguinalis and the broad leaf weed O. latifolia would
be selected for by the strategy as more of these weeds species escaped the herbicide treatments at low
doses. The RHD strategy, therefore, needs to be integrated with other weed control tactics that will
remove herbicide escapes and prevent them from producing seed (Mashingaidze, 2004).
Numerous studies have indicated the importance of competitive cropping systems to attain long-term
weed management (Mohler, 2001; Nazarko et al., 2005). Similar results of reduction in weed biomass
with narrow rows as obtained in this study for Nofemele and Bantubantu were reported by Blackshaw et
al. (2006). Results of this study are in conformity with findings by Johnson et al. (1998) who reported little
benefit in maize to narrow row spacings as a method for reducing herbicide inputs. Although our findings
largely showed no interaction between herbicide dosage and row spacing, research indicates that there is
good potential to reduce both herbicide use and the number of herbicide applications when they are
67
utilised within competitive cropping systems such as use of narrow rows (Blackshaw et al., 2006).
Forcella et al. (1992) and Teasedale (1995) found that weed control from RHDs in maize was increased
in narrow compared to wide rows. Weed populations are reduced over time and existing weeds are
suppressed in those systems employing good agronomic and competitive crops. Herbicide coverage,
uptake and efficacy can be greater with low weed densities (Winkie et al., 1981) and therefore, any crop
production practice that reduces weed competition over time is important to the successful use of RHDs.
Jordan et al. (1995) suggested that management aimed at increasing seed mortality can be more
effective than management aimed solely at killing weed seedlings.
Successful and sustainable long term weed management will require a shift away from simply controlling
problem weeds to systems that restrict weed reproduction, reduce weed emergence, and minimize weed
competition with crops. Research has shown that competitive crop production practices can contribute to
the development of more sustainable weed management systems (Mohler, 2001). In the context of
smallholder farmers, the RHD can be followed up by mechanical or hoe cultivation to remove the
herbicide escapes. Since weed escapes will be rendered uncompetitive to the crop by the RHD (as
shown by no yield effect in this study), before full ground cover, the timing of the following hand hoeing or
mechanical cultivation becomes less critical. This can be a potential advantage given the general
shortage of labour for hoe weeding in smallholder agriculture and specifically in the study area.
2.6.5 Conclusions
The study has demonstrated the possibility of incorporation of RHDs and narrow rows in smallholder
farming systems. However, this will depend largely on the weed spectrum in a particular locality. Planting
maize in narrower rows than the traditional 0.9 m reduced weed growth and fecundity compared to wider
rows. Integration of narrow rows with reduced herbicide dosages did not result in superior weed control
compared to the use of narrow rows or reduced herbicide dosages in isolation. The results of this study
suggest the possibility of developing a weed management system based on the use of RHDs, to slow
down or stop weed growth soon after application. This strategy will reduce the competitiveness of weeds,
without necessarily killing them, before full ground cover by the crop canopy.
68
2.7 Testing of technological options for addressing agronomic
constraints: 2. Effect of row spacing and plant population on weed
dynamics and maize (Zea mays L.) grain yield at Zanyokwe
2.7.1 Introduction
When nutrients and moisture are not limiting, successful cultivation of maize depends largely on the
efficacy of weed control. Poor weed control decreases water and nitrogen use efficiency, the two most
important inputs to achieving high yields under irrigation (Thomson et al., 2000). Most smallholder farmers
are aware of the detrimental effects of weeds, but do not have the time or the means to control them,
especially where tractor mechanisation has resulted in an increased area of land being cultivated (Steyn,
1988). The importance of weed control to performance of crops in ZIS is noted in 2.5. Many farmers in
ZIS rely on hoe weeding which is highly labour intensive, cumbersome and ineffective. Shortage of labour
is common in ZIS and as a result farmers invariably weed large proportions of their farms late, often after
the crop has already suffered significant yield damage. The inability of farmers to afford effective control
measures based on use of chemicals or mechanisation or a combination of both makes it imperative to
explore alternative weed control strategies suited to the circumstances of the smallholder farmers.
Crops can be favoured in competition against weeds by use of narrow rows and/or higher population
densities. Use of narrow rows and/or higher population densities hastens the rapidity of closure of the
canopy and enhances canopy radiation interception, thereby increasing crop growth rates and yields
(Andrade et al., 2002) and suppressing weed growth and competitiveness (Murphy et al., 1996; Zimdahl,
1999; Mashingaidze, 2004). Therefore, the use of narrow rows and/or higher population densities could
be used by smallholder irrigation farmers as a means of cultural weed control through achieving full
ground cover earlier in the season, thereby reducing the impact of weeds on maize yield. The study on
cultural weed control described in this chapter sought to further address the challenge of weed
management at ZIS observed during monitoring (2.5) and lack of resources noted by Monde et al.
(2005).The objective of the study was to determine the relationship between inter-row spacing and plant
population on weed biomass and maize yield.
2.7.2 Materials and Methods
Experimental Sites
This researcher managed experiment was carried out on three farmers’ fields at ZIS; Nofemele and
Bantubantu farms (32°45΄ S, 27°03΄ E) and Booi farm (32°45΄ S, 27°04΄ E). The trial was planted on the
16th and 17th December 2006 for Booi and Bantubantu farms, respectively. Nofemele farm was planted on
the 20th December 2007.
69
Experimental design and treatments
The experiment was laid out in a randomised complete block design with three replicates. The treatment
design was a 2 × 2 factorial with two inter-row spacings, 45 and 90 cm and two population levels, 40 000
and 60 000 plants ha-1. At 40 000 plants ha-1, in-row spacing was 56 cm for the 45 cm inter-row spacing
whilst at 90 cm, in-row spacing was 28 cm. At 60 000 plants ha-1, in-row spacing for 45 cm rows was 38
cm whilst that for the 90 cm rows was 19 cm. Gross plot size was 9.9 x 8 m and the corresponding net
plot size was 3.6 x 6 m each for green (corn on the cob) and grain yield assessments.
Non-experimental variables
Land was ploughed and disked once using a tractor-drawn plough and disc harrow, respectively, before
the plots were marked. Maize cultivar SC 701 (Seed-CO®, South Africa) was used. Three seeds were
planted per station and the crop was thinned to one plant per station at 2 weeks after emergence (WAE)
to give the desired population. Fertilizer was applied at a rate of 220 kg N ha-1 to all plots. A third of the N
was applied as a basal application at planting as compound fertilizer 2:3:4 (30) and two thirds as lime
ammonium nitrate (with 28% N) topdressing in two equal splits at 5 and 7 WAE. Weed control was done
by hand hoeing once at 3 WAE. Supplementary irrigation was done using the sprinkler system with an
average application of 6 mm of water per hour. Irrigation water was applied to meet the crop water
requirements and the amount applied varied with weather conditions and crop growth stage (Table 2.14).
Data collection
Weeds were counted in five randomly placed 30 cm × 30 cm quadrants per plot prior to weeding at 3 and
at 8 WAE. Counted weeds were cut at ground level, oven dried to a constant weight at 80oc and weighed.
At harvest, data on green cob weight, cob length and grain yield were collected for each site. Green
maize yield was evaluated by total weight and cob length. Marketable cobs were considered to have a
length equal to or above 33 cm, and showing a health grain set suitable for commercialisation.
Statistical procedures
Weed density and biomass, green and grain maize yield and yield parameters were subjected to analysis
of variance. Statistical analysis was performed using Genstat Release 7.22 DE on a per site basis and
Bartlett’s test (Gomez and Gomez, 1984) carried out to test for homogeneity of error variances before
combining across sites. Grain yield was standardised to 12.5% moisture content before statistical
analysis. Unless otherwise stated, differences referred to in the text are significant at p<0.05.
70
2.7.3 Results
Weed density
Weed density prior to weeding at 3 WAE varied among sites (Table 2.19). Cyperus esculentus was
present at low densities at all sites. Setaria pumila was present at high density at Booi but the weed was
not present at Bantubantu and Nofemele. Galinsoga parviflora, Setaria verticilata and Nichandra
physaloides were present at moderate density at Booi and at low density at Bantubantu while Nofemele
did not have any of these species (Table 2.19).
Weed biomass
There was no significant interaction among factors at 3 and 8 WAE with regard to weed biomass. Plant
population and site had no significant effects both at 3 and 8 WAE. Row spacing had a significant
(p<0.01) effect on weed biomass at 8 WAE, but not at 3 WAE. Weed biomass decreased from 312.2 to
130.7 g m-2 when 45 cm rows were used instead of 90 cm rows at 8 WAE.
Green cob weight
The site × plant population × row spacing interaction was significant. The main effect of plant population
was significant (p<0.01). Main effects of site and row spacing were not significant. The site × plant
population × row spacing interaction showed that maize grown at 40 000 plants ha-1 had similar cob
weight regardless of row spacing across the three sites (Table 2.20). However, at 60 000 plants ha-1, cob
weight obtained at Nofemele and Bantubantu was higher in 45 cm rows compared to 90 cm rows, while
there was no difference in cob weight at Booi regardless of row spacing. At 40 000 plants ha-1, Booi and
Bantubantu had similar and significantly lower yield than Nofemele when maize was grown in 90 cm
rows. At the same plant population, the cob weight obtained from Booi and Bantubantu was similar, while
cob weight at Nofemele was similar to that of Bantubantu, but significantly higher than at Booi when
maize was grown in 45 cm rows. At 60 000 plants ha-1, similar yield was obtained across the three sites
when maize was grown in 90 cm rows. At the same population, similar yield was obtained at Booi and
Bantubantu while cob weight at Nofemele was similar to that of Bantubantu, but significantly higher than
at Booi when maize was grown in 45 cm rows (Table 2.20).
Cob length
There were no significant interactions among factors with respect to cob length. The main effects of plant
population and row spacing were significant (p<0.01) while the effect of site was not significant. Cob
length decreased from 39.9 cm to 37.2 cm when plant population was increased from 40 000 to 60 000
plants ha-1. Cob length increased from 37.9 cm to 39.2 cm when row spacing was decreased from 90 cm
to 45 cm.
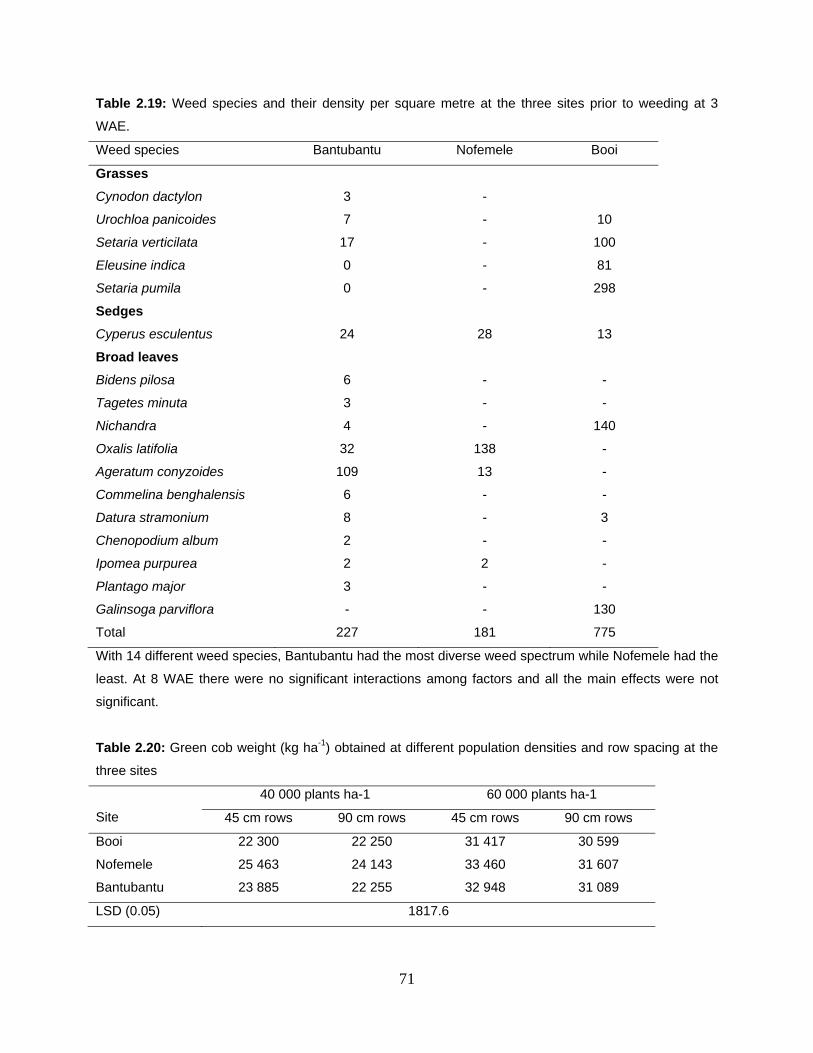
71
Table 2.19: Weed species and their density per square metre at the three sites prior to weeding at 3
WAE.
Weed species Bantubantu Nofemele Booi
Grasses
Cynodon dactylon 3 -
Urochloa panicoides 7 - 10
Setaria verticilata 17 - 100
Eleusine indica 0 - 81
Setaria pumila 0 - 298
Sedges
Cyperus esculentus 24 28 13
Broad leaves
Bidens pilosa 6 - -
Tagetes minuta 3 - -
Nichandra 4 - 140
Oxalis latifolia 32 138 -
Ageratum conyzoides 109 13 -
Commelina benghalensis 6 - -
Datura stramonium 8 - 3
Chenopodium album 2 - -
Ipomea purpurea 2 2 -
Plantago major 3 - -
Galinsoga parviflora - - 130
Total 227 181 775
With 14 different weed species, Bantubantu had the most diverse weed spectrum while Nofemele had the
least. At 8 WAE there were no significant interactions among factors and all the main effects were not
significant.
Table 2.20: Green cob weight (kg ha-1) obtained at different population densities and row spacing at the
three sites
Site
40 000 plants ha-1 60 000 plants ha-1
45 cm rows 90 cm rows 45 cm rows 90 cm rows
Booi 22 300 22 250 31 417 30 599
Nofemele 25 463 24 143 33 460 31 607
Bantubantu 23 885 22 255 32 948 31 089
LSD (0.05) 1817.6
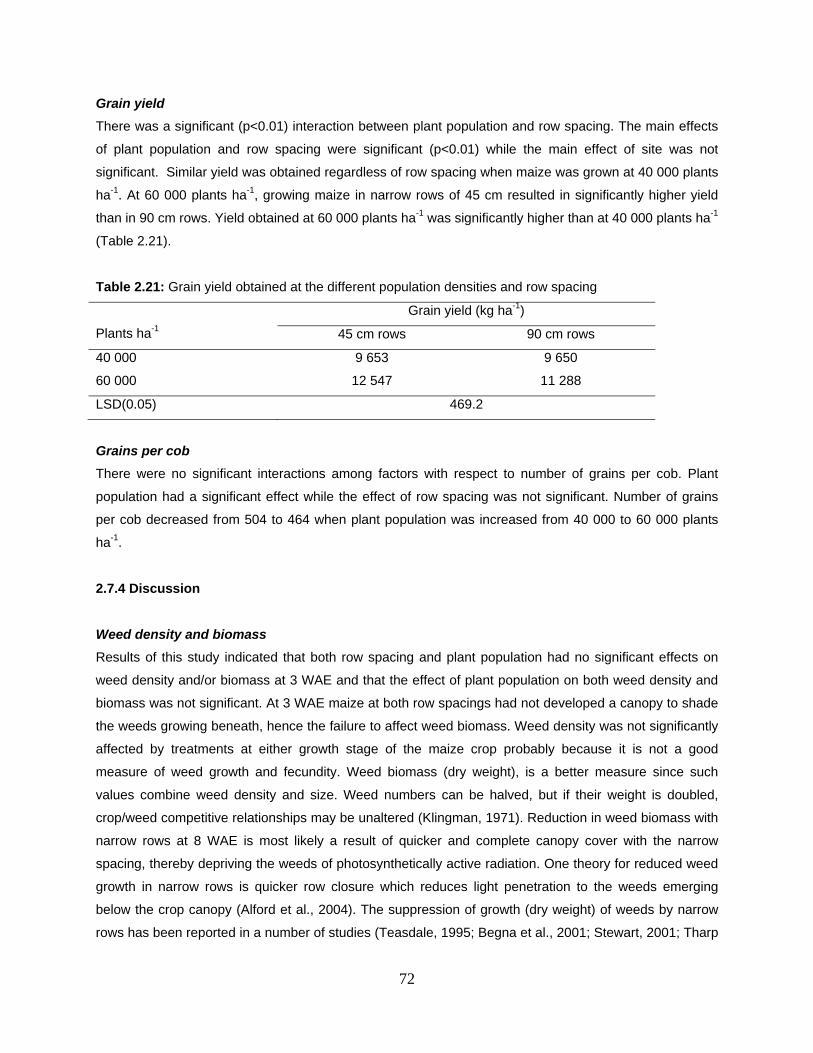
72
Grain yield
There was a significant (p<0.01) interaction between plant population and row spacing. The main effects
of plant population and row spacing were significant (p<0.01) while the main effect of site was not
significant. Similar yield was obtained regardless of row spacing when maize was grown at 40 000 plants
ha-1. At 60 000 plants ha-1, growing maize in narrow rows of 45 cm resulted in significantly higher yield
than in 90 cm rows. Yield obtained at 60 000 plants ha-1 was significantly higher than at 40 000 plants ha-1
(Table 2.21).
Table 2.21: Grain yield obtained at the different population densities and row spacing
Plants ha-1
Grain yield (kg ha-1)
45 cm rows 90 cm rows
40 000 9 653 9 650
60 000 12 547 11 288
LSD(0.05) 469.2
Grains per cob
There were no significant interactions among factors with respect to number of grains per cob. Plant
population had a significant effect while the effect of row spacing was not significant. Number of grains
per cob decreased from 504 to 464 when plant population was increased from 40 000 to 60 000 plants
ha-1.
2.7.4 Discussion
Weed density and biomass
Results of this study indicated that both row spacing and plant population had no significant effects on
weed density and/or biomass at 3 WAE and that the effect of plant population on both weed density and
biomass was not significant. At 3 WAE maize at both row spacings had not developed a canopy to shade
the weeds growing beneath, hence the failure to affect weed biomass. Weed density was not significantly
affected by treatments at either growth stage of the maize crop probably because it is not a good
measure of weed growth and fecundity. Weed biomass (dry weight), is a better measure since such
values combine weed density and size. Weed numbers can be halved, but if their weight is doubled,
crop/weed competitive relationships may be unaltered (Klingman, 1971). Reduction in weed biomass with
narrow rows at 8 WAE is most likely a result of quicker and complete canopy cover with the narrow
spacing, thereby depriving the weeds of photosynthetically active radiation. One theory for reduced weed
growth in narrow rows is quicker row closure which reduces light penetration to the weeds emerging
below the crop canopy (Alford et al., 2004). The suppression of growth (dry weight) of weeds by narrow
rows has been reported in a number of studies (Teasdale, 1995; Begna et al., 2001; Stewart, 2001; Tharp
73
and Kells, 2001; Alford et al., 2004). Weed growth suppression by narrow rows is mainly due to increased
shading of the inter-row rather than the in-row. This probably explains why plant population had no effect
on weed biomass as observed in this study. However, some studies (Mashingaidze, 2004; Singh and
Singh, 2006) have reported weed suppression with high population densities.
Maize yield
This study indicated that all green cobs obtained were marketable regardless of plant population or row
spacing, while total green cob weight and grain yield depended on row spacing and population used.
Grain yield was significantly higher at 60 000 plants ha-1 while the yield advantage from narrow rows was
only observed at the higher population but not at 40 000 plants ha-1. Maize is the agronomic grass
species that is most sensitive to variations in plant density, such that for each production system, there is
a population that maximises the utilisation of available resources, allowing the expression of maximum
attainable yield in that environment (Sangoi, 2000). Maize yield is known to increase with increased plant
population until the increase in yield attributable to the addition of plants is not greater than the decline in
mean yield per plant due to increased inter-plant competition (Mashingaidze, 2004). The results suggest
that the population of 40 000 plants ha-1 used by the Zanyokwe farmers is not high enough to optimise on
both green and grain maize production under irrigation. Farmers would obtain higher yields and profits by
increasing plant population to 60 000 plants ha-1 without necessarily having to change their row spacing,
although narrow rows would result in slightly higher yields and would help in weed suppression. In maize
production, plant population per unit area is more important than specific row width (Department of
Agriculture, 2003) and this becomes more so if production is done under irrigated conditions.
Many studies conducted to test the effect of row spacing on maize grown under rainfed conditions have
reported grain yield increases with decrease in spacing between rows (Barbieri et al., 2000; Andrade et
al., 2002 Mashingaidze, 2004). Most of the yield response of maize to reduction in row spacing was
related to improvements in radiation interception at the critical flowering stage (Bullock et al., 1988;
Andrade et al., 2002). However, Ottoman and Welch (1989) and Westgate et al. (1997) found no effects
of row spacing on PAR interception at flowering, with all row spacings having full or nearly full radiation
interception at flowering. The results of this study have shown that use of narrow rows does not result in
superior yields when maize is grown at 40 000 plants ha-1, although this plant population compromises
yield and income. The possible reason for this is that at this population there is lower intra-specific
competition for limiting resources as compared to the higher population of 60 000 plants ha-1. The spatial
arrangement and maize density that was closest to square planting geometry (45 cm x 38 cm) at 60 000
plants ha-1 had the highest green and grain yield, suggesting that it had lower intra-specific competition
compared to wider rows at the same population. The results also suggest that the greatest intra-specific
competition occurred in the plant density and spatial arrangement which resulted in the closest spacing of
74
plants within the row (90 cm x 19 cm) for the 60 000 plants ha-1 density as evidenced by the significant
difference in yield with row spacing at the higher plant population.
The study conducted by Barbieri et al. (2000) under irrigation demonstrated that the greater responses of
narrow rows to PAR interception at flowering were observed when vegetative growth was most limited in
treatments with no nitrogen (N) fertilisation. The greater radiation interception observed with the more
equidistant plant spacing treatments indicates that a decrease in row width when N is limiting partially
offsets negative effects of N deficiencies on radiation interception. In this study, N was not limiting and it
can be implied that PAR interception was not different at the two row spacings, which might explain the
similarity in grain yield regardless of row spacing at 40 000 plants ha-1. However, experiences in
Zanyokwe and literature on other smallholder irrigation schemes in SA (Machethe et al., 2004) indicate
that farmers apply low N rates, averaging 60 kg N ha-1 for Zanyokwe, which is very low for the yield
potential under irrigation. It is therefore anticipated that with current farmer practice in terms of
fertilisation, use of narrow rows would result in improved radiation interception and therefore improve on
maize yields and income by farmers.
In this study, yield increased by 11% when maize grown at 60 000 plants ha-1 and planted in 45 cm rows
rather that 90 cm rows. Results of this study are in conformity with findings by Barbieri et al. (2000) who
reported a 10% yield response to narrow rows. Because drought and/or nutrient deficiencies at vegetative
period limit leaf area expansion (Trapani and Hall, 1996; Salah and Tardieu, 1997), they would also
increase the response to narrow rows. Contrarily, narrow rows would decrease yield when crops are
subjected to progressive drought (Fanadzo et al., 2007) because enhanced early cover would increase
water use, resulting in a more severe water stress at the critical moments for grain set (Fulton, 1970).
Greater responses to decreases in row spacing are expected in those crop species whose plants are
closer together within the row (Andrade et al., 2002), such as soybean. Similarly, the response of maize
to narrow rows is low or null at low plant densities (Fulton, 1970) because the decrease in transmitted
photosynthetically active radiation (PAR) between the rows is compensated by an increase in transmitted
PAR between the plants in the row (Andrade et al., 2002). This possibly explains the similarity in yield
regardless of row spacing when maize was grown at the lower density of 40 000 plants ha-1 in this study.
2.7.5 Conclusions
Results of this study indicate that increasing plant population from farmers’ practice of 40 000 plants ha-1
to 60 000 plants ha-1 results in more marketable green cobs and an increase in grain yield by up to 30%.
Maize yield response to narrow rows can only be realised when maize is grown at a higher population (60
000 plants ha-1 in this case), but not at lower populations (40 000 plants ha-1 in this case). At the higher
population, grain yield increases of up to 11% can be realised with the use of narrow rows. Narrow rows
reduce above ground weed dry matter and hence competition through earlier canopy closure. Plant
population has no effect on effect on weed growth and development.
75
2.8 Testing of technological options for addressing agronomic
constraints: 3. Effect of pre-plant weed control, population density and
nitrogen rate on weed biomass and yield of butternut (Cucurbita moschata)
in Zanyokwe
2.8.1 Introduction
Butternut (Cucurbita moschata) is an important summer crop grown by SIS farmers in SA. Weed
management is a limiting factor in the production of the crop both in SA and elsewhere (Infante-Casella,
2003; Mossler and Nesheim, 2003; Department of Agriculture, 2005; Fanadzo, 2007). The effect of
weeds on the butternut crop is greatest early in the growing season, at which time weed management is
most critical (Mossler and Nesheim, 2003). Monitoring studies in ZIS indicated that poor weed
management led to poor crop stands and, in many cases, total abandonment of crops to weeds (2.5.1.1).
The majority of farmers did not control weeds before planting and post-emergence weed control was
inadequate, resulting in low average butternut yield of 6 t ha-1 (Fanadzo, 2007). This yield level is only 20
to 30% of potential of 20 to 30 t ha-1 attainable under irrigation, indicating the opportunity that exists to
improve yields in ZIS with good management.
Post-emergence chemical weed control options in butternut are very limited and often ineffective since
most registered selective herbicides provide annual grass weed control but do not control broadleaf
weeds (Fournier and Brown, 1999; Kemble et al., 2000; Infante-Casella, 2003; Mossler and Nesheim,
2003; Department of Agriculture, 2005). Most post-emergence herbicides registered for use in butternut
are non-selective and are applied with a shielded sprayer (Mossler and Nesheim, 2003; Hochmuth et al.,
2000). In SA, the only three post-emergence herbicides registered for butternut namely cycloxydim
(Focus Ultra), propaquizafop (Agil 100) and Haloxyfop-R methylester (Gallant Super and Verdict Super)
are for the control of grass weeds, but do not control broadleaf weeds (Department of Agriculture, 2004).
Given the limitations in post-emergence chemical weed control options, successful weed control in
butternut is possible by integrating chemical and cultural techniques (Prince Edward Island Department of
Agriculture, Fisheries and Aquaculture, 2005). Utilization of the stale seedbed technique is one viable
option for weed management in butternut (Kemble et al., 2000; Prince Edward Island Department of
Agriculture, Fisheries and Aquaculture, 2005; Bratsch, 2006; Finney and Creamer, 2008; Lanini, 2008).
This technique consists of preparing a fine seedbed, allowing weeds to emerge, and directly removing
weed seedlings via light cultivation or application of a non-selective herbicide just before planting. This
technique helps to provide an opportunity for crop emergence and growth before the next flush of weeds.
Once the butternut crop has a starting advantage over the weeds, the broad, wide leaves of a vigorous
plant can compete with and help suppress the late season weeds.
76
Utilisation of good production management practices such as establishment of higher plant populations is
very helpful in reducing weed competition in butternut (Stall, 2006). Research indicates that increasing
crop density can maximize the space occupied by the crop early in the season and put competitive
pressure on weeds (Mohler, 2001; Finney and Creamer, 2008). In SA, squashes are generally grown at
a population density of 15 000 to 25 000 plants ha-1 (Hygrotech SA, 2004), depending on vine size and
target fruit size. However, monitoring studies in Zanyokwe indicated that farmers commonly planted their
butternut at a target population of 10 000 plants ha-1 (Fanadzo, 2007). Higher populations are expected to
result in better weed control and higher yields.
As already highlighted, full and rapid stand establishment is critical in butternut production, and early and
adequate fertility can help achieve this. Optimum rates of nitrogen (N) fertiliser result in vigorously
growing plants which can out-compete weeds and produce higher yields. In SA, the N rate
recommendations for butternut vary from 80 to 120 kg ha-1 (FSSA, 2007). However, research with
Zucchini squash (Cucurbita pepo) in Florida indicated that peak yield occurred with plants fertilised at 200
kg N ha-1 (Hochmuth and Cordasco, 2003). Monitoring studies conducted in Zanyokwe from 2005 to 2008
indicated that the average fertiliser rate applied to butternut was 60 kg N ha-1.
Intensive research done on agronomic factors affecting productivity in summer squash has indicated that
weed, fertiliser and population management were the most important factors in production (Bratsch, 2006;
Mossler and Nesheim, 2003; Lanini, 2008; Stall, 2006). However, for winter squash and specifically
butternut, there has been little work examining population density, weed competition and their interaction
with N, especially in SA. The objective of this study was to investigate the relationship between pre-plant
weed control, N rate and population density on weed growth and butternut yield.
2.8.2 Materials and methods
Study sites
The researcher managed experiment was carried out at Bantubantu (32°45΄ S, 27°03΄ E) and Booi 32°
46' S, 26° 50' E) farms at ZIS in the 2006/07 and 2007/08 summer seasons, respectively. Soils at
Bantubantu consisted of dark-coloured heavy-textured soils of the Valsrivier form while those at Booi
consisted of deep alluvials of the Oakleaf form, belonging to Jozini series, according to the South African
system of soil classification (Soil Classification Working Group, 1991).
Treatments and experimental design
The trial consisted of three factors; pre-plant weed control, N rate and population density treatments laid
out as a split-split plot in a randomised complete block design. Pre-plant weed control was the main plot,
population density the sub-plot and N rate the sub sub-plot treatment. Pre-plant weed control was at two
levels; application or non application of glyphosate at a rate of 3 l ha-1 to kill the first flush of weeds before
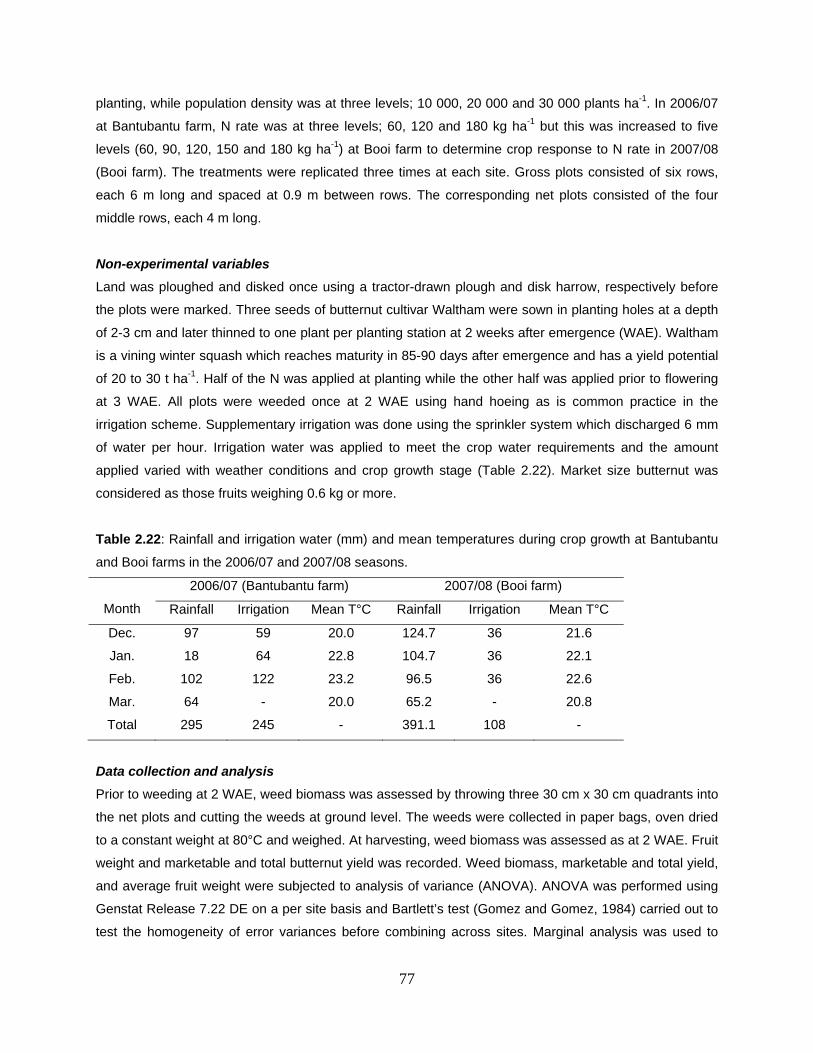
77
planting, while population density was at three levels; 10 000, 20 000 and 30 000 plants ha-1. In 2006/07
at Bantubantu farm, N rate was at three levels; 60, 120 and 180 kg ha-1 but this was increased to five
levels (60, 90, 120, 150 and 180 kg ha-1) at Booi farm to determine crop response to N rate in 2007/08
(Booi farm). The treatments were replicated three times at each site. Gross plots consisted of six rows,
each 6 m long and spaced at 0.9 m between rows. The corresponding net plots consisted of the four
middle rows, each 4 m long.
Non-experimental variables
Land was ploughed and disked once using a tractor-drawn plough and disk harrow, respectively before
the plots were marked. Three seeds of butternut cultivar Waltham were sown in planting holes at a depth
of 2-3 cm and later thinned to one plant per planting station at 2 weeks after emergence (WAE). Waltham
is a vining winter squash which reaches maturity in 85-90 days after emergence and has a yield potential
of 20 to 30 t ha-1. Half of the N was applied at planting while the other half was applied prior to flowering
at 3 WAE. All plots were weeded once at 2 WAE using hand hoeing as is common practice in the
irrigation scheme. Supplementary irrigation was done using the sprinkler system which discharged 6 mm
of water per hour. Irrigation water was applied to meet the crop water requirements and the amount
applied varied with weather conditions and crop growth stage (Table 2.22). Market size butternut was
considered as those fruits weighing 0.6 kg or more.
Table 2.22: Rainfall and irrigation water (mm) and mean temperatures during crop growth at Bantubantu
and Booi farms in the 2006/07 and 2007/08 seasons.
Month
2006/07 (Bantubantu farm) 2007/08 (Booi farm)
Rainfall Irrigation Mean T°C Rainfall Irrigation Mean T°C
Dec. 97 59 20.0 124.7 36 21.6
Jan. 18 64 22.8 104.7 36 22.1
Feb. 102 122 23.2 96.5 36 22.6
Mar. 64 - 20.0 65.2 - 20.8
Total 295 245 - 391.1 108 -
Data collection and analysis
Prior to weeding at 2 WAE, weed biomass was assessed by throwing three 30 cm x 30 cm quadrants into
the net plots and cutting the weeds at ground level. The weeds were collected in paper bags, oven dried
to a constant weight at 80°C and weighed. At harvesting, weed biomass was assessed as at 2 WAE. Fruit
weight and marketable and total butternut yield was recorded. Weed biomass, marketable and total yield,
and average fruit weight were subjected to analysis of variance (ANOVA). ANOVA was performed using
Genstat Release 7.22 DE on a per site basis and Bartlett’s test (Gomez and Gomez, 1984) carried out to
test the homogeneity of error variances before combining across sites. Marginal analysis was used to
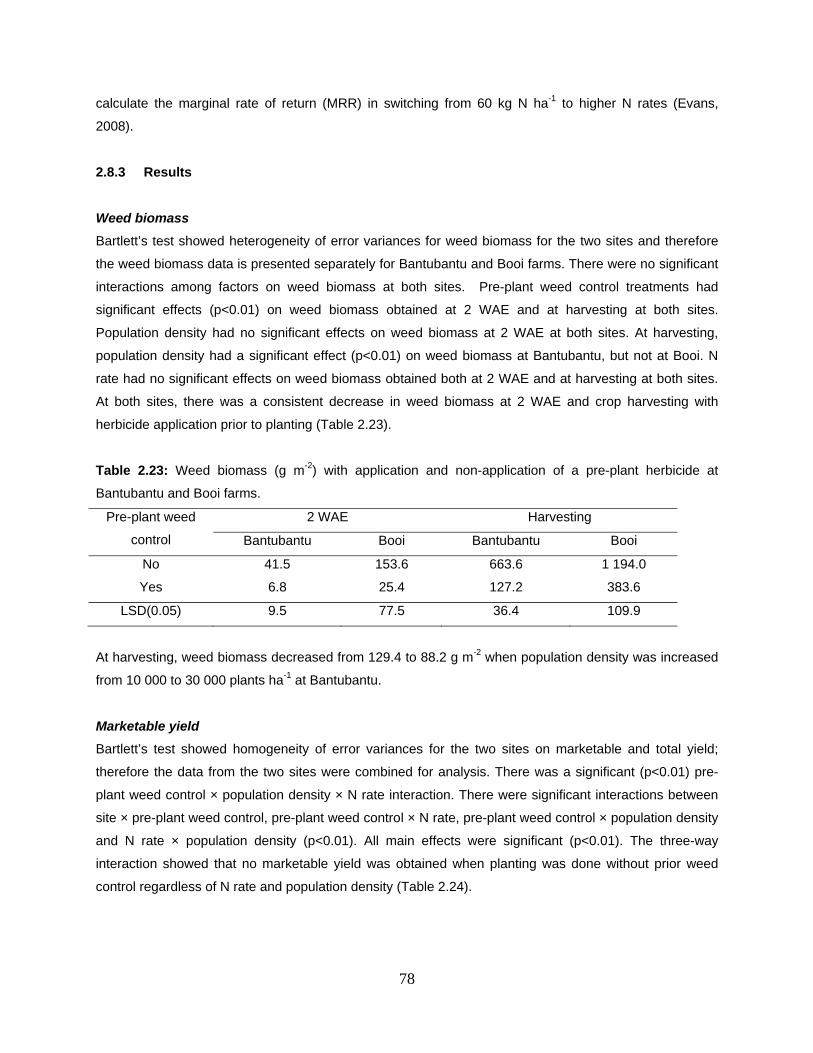
78
calculate the marginal rate of return (MRR) in switching from 60 kg N ha-1 to higher N rates (Evans,
2008).
2.8.3 Results
Weed biomass
Bartlett’s test showed heterogeneity of error variances for weed biomass for the two sites and therefore
the weed biomass data is presented separately for Bantubantu and Booi farms. There were no significant
interactions among factors on weed biomass at both sites. Pre-plant weed control treatments had
significant effects (p<0.01) on weed biomass obtained at 2 WAE and at harvesting at both sites.
Population density had no significant effects on weed biomass at 2 WAE at both sites. At harvesting,
population density had a significant effect (p<0.01) on weed biomass at Bantubantu, but not at Booi. N
rate had no significant effects on weed biomass obtained both at 2 WAE and at harvesting at both sites.
At both sites, there was a consistent decrease in weed biomass at 2 WAE and crop harvesting with
herbicide application prior to planting (Table 2.23).
Table 2.23: Weed biomass (g m-2) with application and non-application of a pre-plant herbicide at
Bantubantu and Booi farms.
Pre-plant weed
control
2 WAE Harvesting
Bantubantu Booi Bantubantu Booi
No 41.5 153.6 663.6 1 194.0
Yes 6.8 25.4 127.2 383.6
LSD(0.05) 9.5 77.5 36.4 109.9
At harvesting, weed biomass decreased from 129.4 to 88.2 g m-2 when population density was increased
from 10 000 to 30 000 plants ha-1 at Bantubantu.
Marketable yield
Bartlett’s test showed homogeneity of error variances for the two sites on marketable and total yield;
therefore the data from the two sites were combined for analysis. There was a significant (p<0.01) pre-
plant weed control × population density × N rate interaction. There were significant interactions between
site × pre-plant weed control, pre-plant weed control × N rate, pre-plant weed control × population density
and N rate × population density (p<0.01). All main effects were significant (p<0.01). The three-way
interaction showed that no marketable yield was obtained when planting was done without prior weed
control regardless of N rate and population density (Table 2.24).
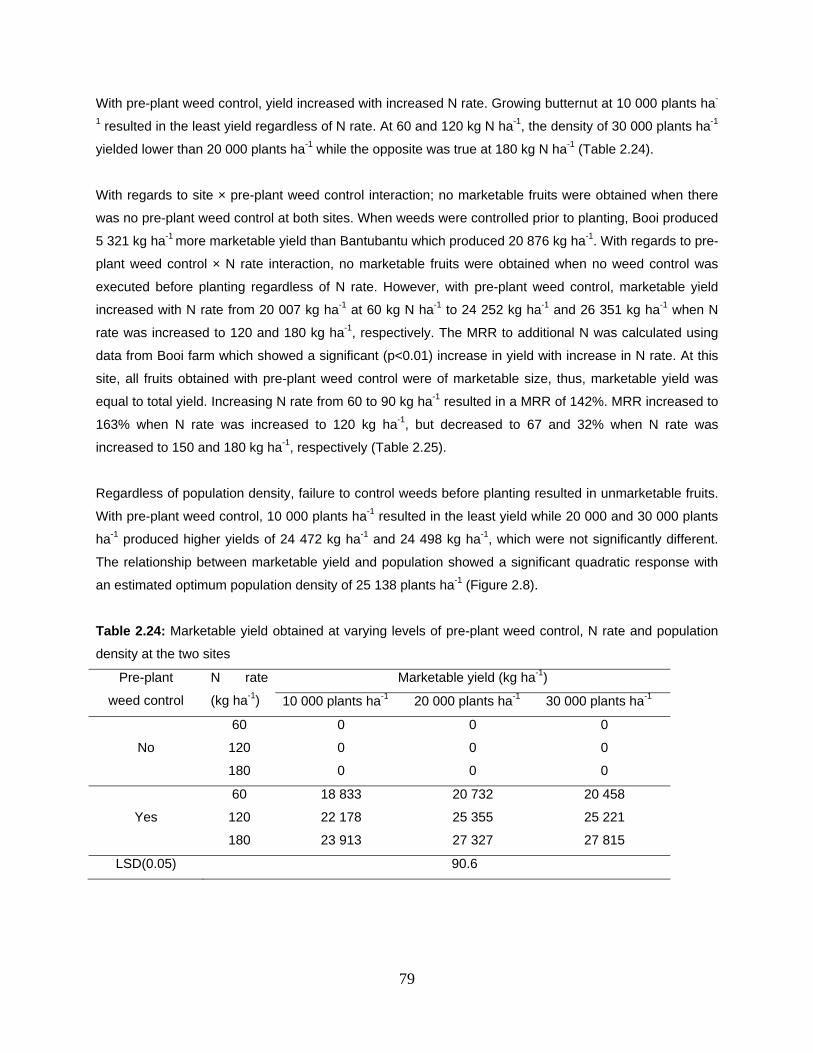
79
With pre-plant weed control, yield increased with increased N rate. Growing butternut at 10 000 plants ha-
1 resulted in the least yield regardless of N rate. At 60 and 120 kg N ha-1, the density of 30 000 plants ha-1
yielded lower than 20 000 plants ha-1 while the opposite was true at 180 kg N ha-1 (Table 2.24).
With regards to site × pre-plant weed control interaction; no marketable fruits were obtained when there
was no pre-plant weed control at both sites. When weeds were controlled prior to planting, Booi produced
5 321 kg ha-1 more marketable yield than Bantubantu which produced 20 876 kg ha-1. With regards to pre-
plant weed control × N rate interaction, no marketable fruits were obtained when no weed control was
executed before planting regardless of N rate. However, with pre-plant weed control, marketable yield
increased with N rate from 20 007 kg ha-1 at 60 kg N ha-1 to 24 252 kg ha-1 and 26 351 kg ha-1 when N
rate was increased to 120 and 180 kg ha-1, respectively. The MRR to additional N was calculated using
data from Booi farm which showed a significant (p<0.01) increase in yield with increase in N rate. At this
site, all fruits obtained with pre-plant weed control were of marketable size, thus, marketable yield was
equal to total yield. Increasing N rate from 60 to 90 kg ha-1 resulted in a MRR of 142%. MRR increased to
163% when N rate was increased to 120 kg ha-1, but decreased to 67 and 32% when N rate was
increased to 150 and 180 kg ha-1, respectively (Table 2.25).
Regardless of population density, failure to control weeds before planting resulted in unmarketable fruits.
With pre-plant weed control, 10 000 plants ha-1 resulted in the least yield while 20 000 and 30 000 plants
ha-1 produced higher yields of 24 472 kg ha-1 and 24 498 kg ha-1, which were not significantly different.
The relationship between marketable yield and population showed a significant quadratic response with
an estimated optimum population density of 25 138 plants ha-1 (Figure 2.8).
Table 2.24: Marketable yield obtained at varying levels of pre-plant weed control, N rate and population
density at the two sites
Pre-plant
weed control
N rate
(kg ha-1)
Marketable yield (kg ha-1)
10 000 plants ha-1 20 000 plants ha-1 30 000 plants ha-1
No
60 0 0 0
120 0 0 0
180 0 0 0
Yes
60 18 833 20 732 20 458
120 22 178 25 355 25 221
180 23 913 27 327 27 815
LSD(0.05) 90.6
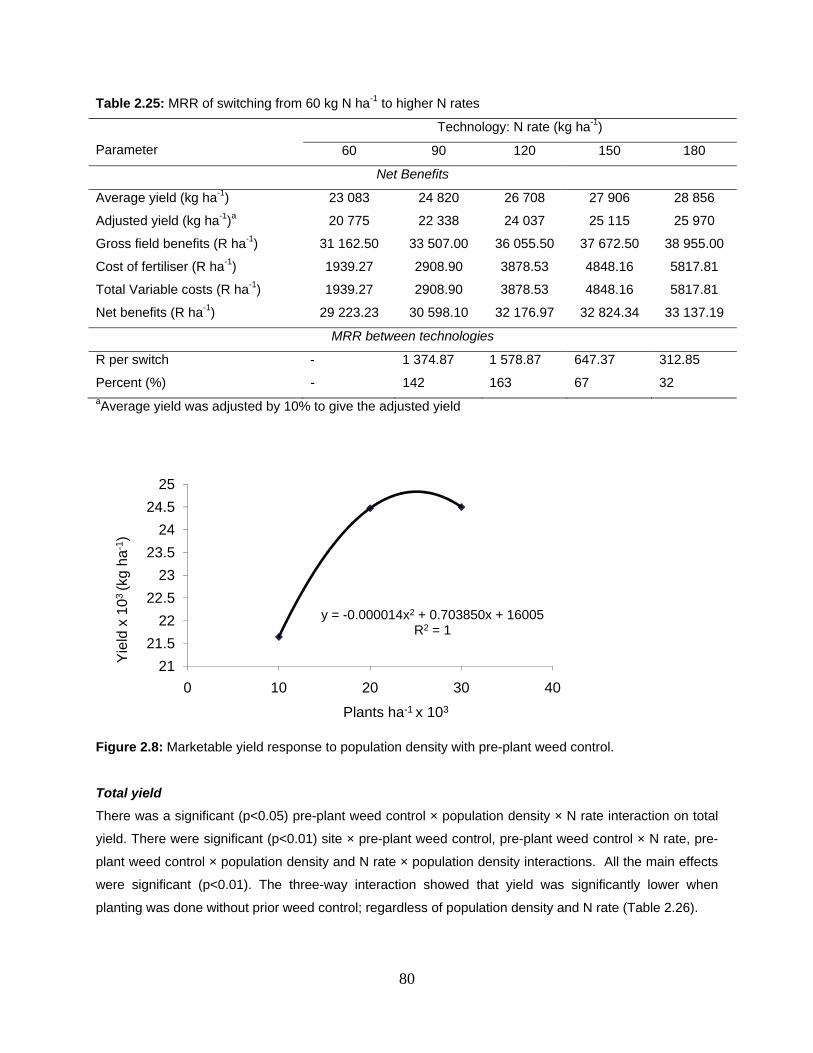
80
Table 2.25: MRR of switching from 60 kg N ha-1 to higher N rates
Parameter
Technology: N rate (kg ha-1)
60 90 120 150 180
Net Benefits
Average yield (kg ha-1) 23 083 24 820 26 708 27 906 28 856
Adjusted yield (kg ha-1)a 20 775 22 338 24 037 25 115 25 970
Gross field benefits (R ha-1) 31 162.50 33 507.00 36 055.50 37 672.50 38 955.00
Cost of fertiliser (R ha-1) 1939.27 2908.90 3878.53 4848.16 5817.81
Total Variable costs (R ha-1) 1939.27 2908.90 3878.53 4848.16 5817.81
Net benefits (R ha-1) 29 223.23 30 598.10 32 176.97 32 824.34 33 137.19
MRR between technologies
R per switch - 1 374.87 1 578.87 647.37 312.85
Percent (%) - 142 163 67 32 aAverage yield was adjusted by 10% to give the adjusted yield
Figure 2.8: Marketable yield response to population density with pre-plant weed control.
Total yield
There was a significant (p<0.05) pre-plant weed control × population density × N rate interaction on total
yield. There were significant (p<0.01) site × pre-plant weed control, pre-plant weed control × N rate, pre-
plant weed control × population density and N rate × population density interactions. All the main effects
were significant (p<0.01). The three-way interaction showed that yield was significantly lower when
planting was done without prior weed control; regardless of population density and N rate (Table 2.26).
y = -0.000014x2 + 0.703850x + 16005R2 = 1
21
21.5
22
22.5
23
23.5
24
24.5
25
0 10 20 30 40
Yie
ld x
10
3 (k
g ha
-1)
Plants ha-1 x 10³
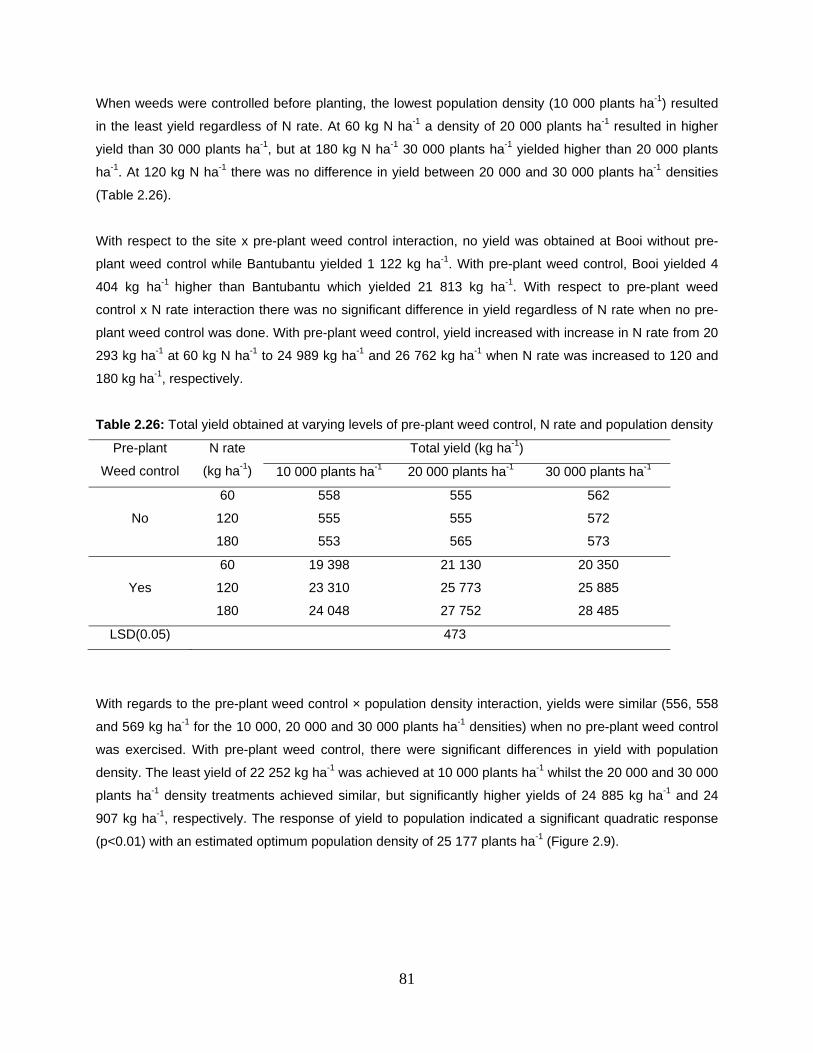
81
When weeds were controlled before planting, the lowest population density (10 000 plants ha-1) resulted
in the least yield regardless of N rate. At 60 kg N ha-1 a density of 20 000 plants ha-1 resulted in higher
yield than 30 000 plants ha-1, but at 180 kg N ha-1 30 000 plants ha-1 yielded higher than 20 000 plants
ha-1. At 120 kg N ha-1 there was no difference in yield between 20 000 and 30 000 plants ha-1 densities
(Table 2.26).
With respect to the site x pre-plant weed control interaction, no yield was obtained at Booi without pre-
plant weed control while Bantubantu yielded 1 122 kg ha-1. With pre-plant weed control, Booi yielded 4
404 kg ha-1 higher than Bantubantu which yielded 21 813 kg ha-1. With respect to pre-plant weed
control x N rate interaction there was no significant difference in yield regardless of N rate when no pre-
plant weed control was done. With pre-plant weed control, yield increased with increase in N rate from 20
293 kg ha-1 at 60 kg N ha-1 to 24 989 kg ha-1 and 26 762 kg ha-1 when N rate was increased to 120 and
180 kg ha-1, respectively.
Table 2.26: Total yield obtained at varying levels of pre-plant weed control, N rate and population density
Pre-plant
Weed control
N rate
(kg ha-1)
Total yield (kg ha-1)
10 000 plants ha-1 20 000 plants ha-1 30 000 plants ha-1
No
60 558 555 562
120 555 555 572
180 553 565 573
Yes
60 19 398 21 130 20 350
120 23 310 25 773 25 885
180 24 048 27 752 28 485
LSD(0.05) 473
With regards to the pre-plant weed control × population density interaction, yields were similar (556, 558
and 569 kg ha-1 for the 10 000, 20 000 and 30 000 plants ha-1 densities) when no pre-plant weed control
was exercised. With pre-plant weed control, there were significant differences in yield with population
density. The least yield of 22 252 kg ha-1 was achieved at 10 000 plants ha-1 whilst the 20 000 and 30 000
plants ha-1 density treatments achieved similar, but significantly higher yields of 24 885 kg ha-1 and 24
907 kg ha-1, respectively. The response of yield to population indicated a significant quadratic response
(p<0.01) with an estimated optimum population density of 25 177 plants ha-1 (Figure 2.9).
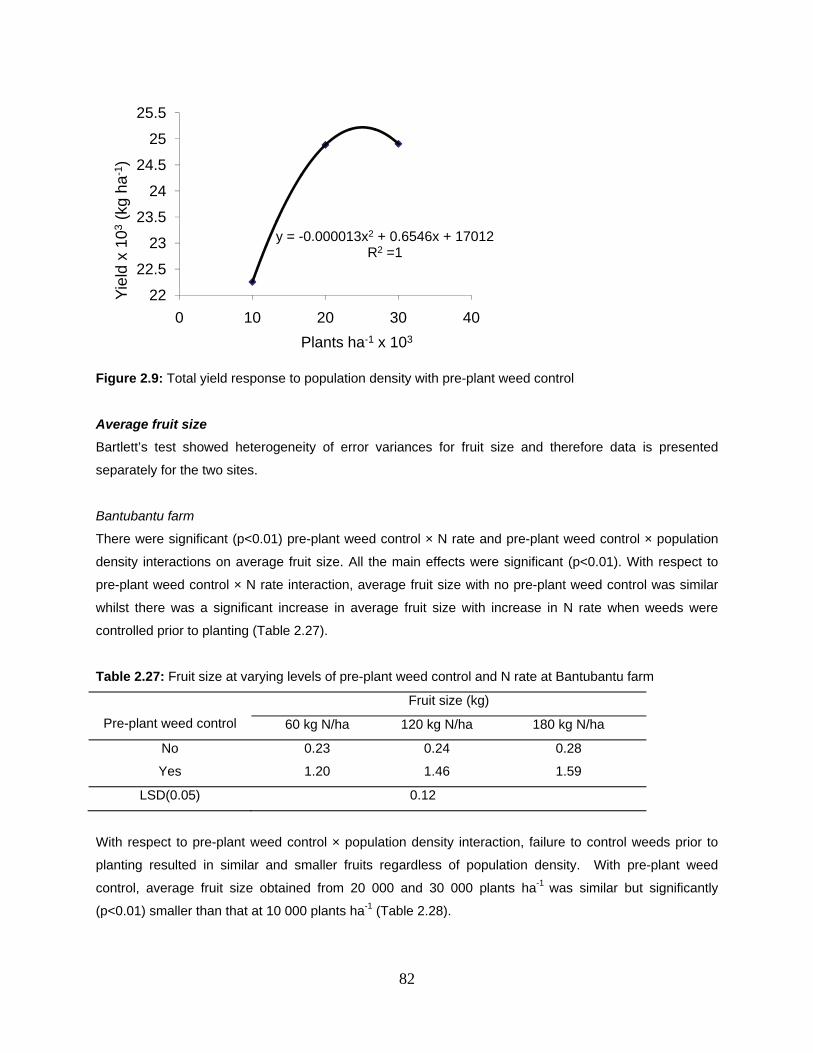
82
Figure 2.9: Total yield response to population density with pre-plant weed control
Average fruit size
Bartlett’s test showed heterogeneity of error variances for fruit size and therefore data is presented
separately for the two sites.
Bantubantu farm
There were significant (p<0.01) pre-plant weed control × N rate and pre-plant weed control × population
density interactions on average fruit size. All the main effects were significant (p<0.01). With respect to
pre-plant weed control × N rate interaction, average fruit size with no pre-plant weed control was similar
whilst there was a significant increase in average fruit size with increase in N rate when weeds were
controlled prior to planting (Table 2.27).
Table 2.27: Fruit size at varying levels of pre-plant weed control and N rate at Bantubantu farm
Pre-plant weed control
Fruit size (kg)
60 kg N/ha 120 kg N/ha 180 kg N/ha
No 0.23 0.24 0.28
Yes 1.20 1.46 1.59
LSD(0.05) 0.12
With respect to pre-plant weed control × population density interaction, failure to control weeds prior to
planting resulted in similar and smaller fruits regardless of population density. With pre-plant weed
control, average fruit size obtained from 20 000 and 30 000 plants ha-1 was similar but significantly
(p<0.01) smaller than that at 10 000 plants ha-1 (Table 2.28).
y = -0.000013x2 + 0.6546x + 17012R2 =1
22
22.5
23
23.5
24
24.5
25
25.5
0 10 20 30 40
Yie
ld x
103
(kg
ha-1
)
Plants ha-1 x 10³
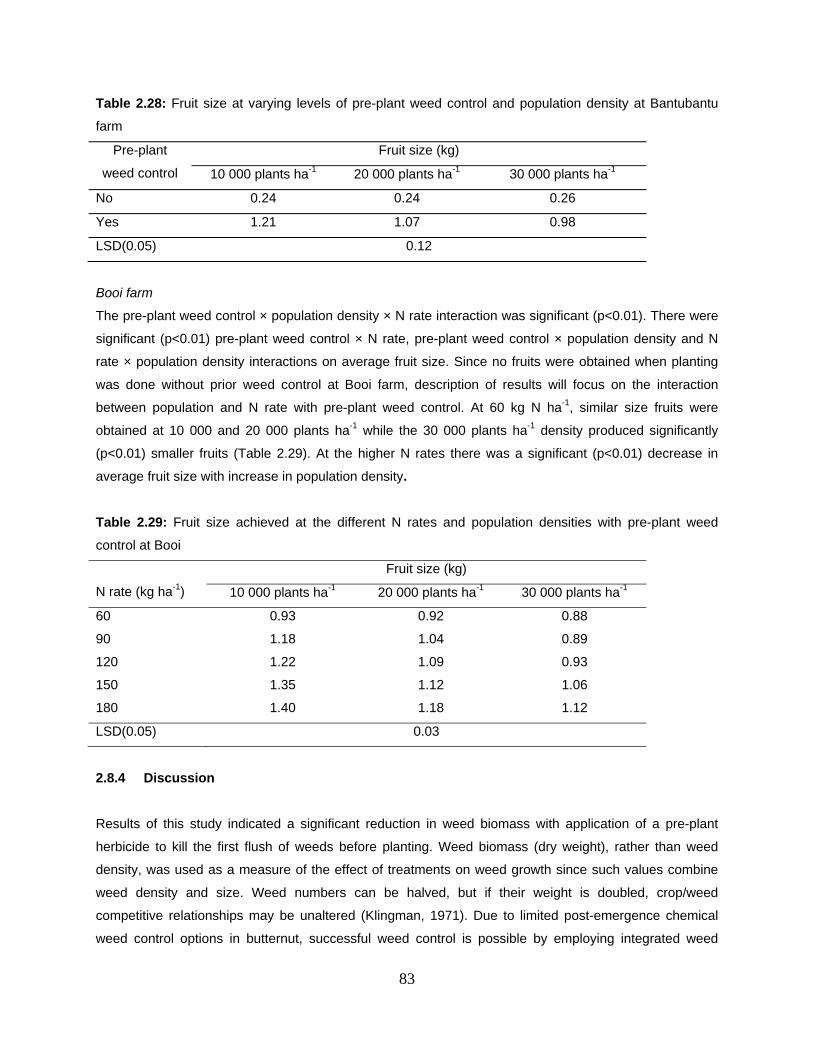
83
Table 2.28: Fruit size at varying levels of pre-plant weed control and population density at Bantubantu
farm
Pre-plant
weed control
Fruit size (kg)
10 000 plants ha-1 20 000 plants ha-1 30 000 plants ha-1
No 0.24 0.24 0.26
Yes 1.21 1.07 0.98
LSD(0.05) 0.12
Booi farm
The pre-plant weed control × population density × N rate interaction was significant (p<0.01). There were
significant (p<0.01) pre-plant weed control × N rate, pre-plant weed control × population density and N
rate × population density interactions on average fruit size. Since no fruits were obtained when planting
was done without prior weed control at Booi farm, description of results will focus on the interaction
between population and N rate with pre-plant weed control. At 60 kg N ha-1, similar size fruits were
obtained at 10 000 and 20 000 plants ha-1 while the 30 000 plants ha-1 density produced significantly
(p<0.01) smaller fruits (Table 2.29). At the higher N rates there was a significant (p<0.01) decrease in
average fruit size with increase in population density.
Table 2.29: Fruit size achieved at the different N rates and population densities with pre-plant weed
control at Booi
N rate (kg ha-1)
Fruit size (kg)
10 000 plants ha-1 20 000 plants ha-1 30 000 plants ha-1
60 0.93 0.92 0.88
90 1.18 1.04 0.89
120 1.22 1.09 0.93
150 1.35 1.12 1.06
180 1.40 1.18 1.12
LSD(0.05) 0.03
2.8.4 Discussion
Results of this study indicated a significant reduction in weed biomass with application of a pre-plant
herbicide to kill the first flush of weeds before planting. Weed biomass (dry weight), rather than weed
density, was used as a measure of the effect of treatments on weed growth since such values combine
weed density and size. Weed numbers can be halved, but if their weight is doubled, crop/weed
competitive relationships may be unaltered (Klingman, 1971). Due to limited post-emergence chemical
weed control options in butternut, successful weed control is possible by employing integrated weed
84
management techniques (Prince Edward Island Department of Agriculture, Fisheries and Aquaculture,
2005). Application of non-selective herbicide before planting is one technique that can be used by farmers
as part of integrated weed management to give the crop a competitive advantage in the early growth
stages before the plants start to produce vines.
Population density had no effect of weed biomass at 2 WAE most probably due to the fact that at 2 WAE
the vines had not started to spread. This period from emergence to the time before vine spreading is the
most critical for weed control in butternut squash. The decrease in weed biomass with increase in
population density as observed at crop harvest was a result of earlier and more complete ground cover,
which resulted in increased efficiency in smothering weeds. Full and rapid stand establishment is critical
in butternut, and early fertility and irrigation can help achieve this (Bratsch, 2006). According to Lanini
(2008), the vigorous and rapid growth of squash during the warm season makes them very competitive
with the weeds such that a single cultivation may be all that is needed for weed control. N rate had no
effect on weed biomass partly because of the banding method of application employed. Band application
of fertiliser, as opposed to broadcasting, tends to help reduce early weed growth between rows. Banding
reduces weed competition and places the fertiliser where the crop will reach it quickly (Bratsch, 2006).
Banding is the method of fertiliser application used by the Zanyokwe farmers and is encouraged from a
weed management point of view.
The reduction in both marketable and total butternut yield with non-application of pre-plant weed control
was as a result of increased weed-crop competition early in the growing season as shown by increased
weed biomass. Reduction in yield may be attributable to competition for photosynthetically active
radiation, nutrients and water (Berry et al., 2001). Reduction of marketable yield to zero might have been
caused by the fact that the effect of weed competition on the squash plant is greatest early in the season,
at which time weed management is most critical (Mossler and Nesheim, 2003). These results are in
conformity with findings by Terry et al. (1997) who reported a 100% reduction in muskmelon (Cucumis
melo L. var. reticulates) and watermelon (Citrullus lanatus L.) yield due to weeds. Terry et al. (1997)
attributed yield reductions to shading because the weed can grow quickly and shade low-growing crops.
Berry et al. (2001) reported that weeds could cause a 10% yield loss in watermelon if allowed to compete
for only 3-4 days. In this study, pre-plant weed control enabled plants to grow more vigorously and
quickly, thereby out-competing late season weeds while failure to control weeds prior to planting meant
that crop-weed competition went on unabated for the first 2 weeks after crop emergence.
The fact that 10 000 plants ha-1 yielded the least suggests that this population density, as commonly used
by the Zanyokwe farmers, is too low to optimise on yield. The optimum population to maximise yield
under the conditions of the experiments, which was estimated at about 25 000 plants ha-1, is within the
recommendation for SA of 15 000 to 25 000 plants ha-1 (Hygrotech SA, 2004). Similar findings of greater
85
squash yields at higher plant densities were reported by Reiners and Riggs (1997) and Dweikart and
Kostewicz (1989). The decrease in average fruit size with higher population densities as observed in this
study is in conformity with other findings (Sanders et al., 1999; Motsenbocker and Arancibia, 2002). The
increased number of fruit per unit area is probably the yield component mostly contributing to a greater
yield under high plant density as noted by NeSmith (1993) and Duthie et al. (1999). In this study, the
greater fruit number per hectare compensated for the smaller fruit size at higher population densities,
resulting in a significant increase in yield. The maximum yield of 28.9 t ha-1 obtained when fertilisation
was done at 180 kg N ha-1 at 20 000 or 30 000 plants ha-1 in this study is within the 20 to 30 t ha-1 yield
potential in commercial production in SA. This indicates that the conditions in the study were similar to
those experienced in commercial fields. Thus, results from this study could be directly applied to
determine yield loss due to weed competition, low crop density and low N rate in commercially grown
butternut.
Increasing the rate of N fertilisation in cucurbits has generally been reported to increase yields (Reiners
and Riggs, 1997). Increase in yield with increased rate of N fertilisation in this study was partly a result of
bigger size fruits obtained at the higher N rates. Similar findings of a positive response to butternut yield
with increased N rate were obtained by Blomgren and Bornt (2004). Dweikat and Kostewicz, 1989)
reported that yield of zucchini squash (Cucurbita pepo var. melopepo L.) increased as the N rate rose
from 67 to 202 kg ha-1, but decreased above this maximum. Similarly, high N levels significantly increased
yields of watermelons in Florida (Reiners and Riggs, 1997). Sweaider et al. (1988) reported that higher N
rates had a greater effect on yield when combined with irrigation. The average yield of about 6 t ha-1
achieved by farmers in Zanyokwe is about 21% of the optimum yield obtained in this study. From the
results of economic analysis, the best technology to use is fertilisation at 120 kg N ha-1 since this resulted
in the highest MRR of 163%. This is based on the assumption that the minimum acceptable rate of return
(MARR) is 100% (Evans, 2008). The N rate of 120 kg ha-1 is also the highest rate recommended by the
Fertiliser Society of SA (FSSA, 2007).
2.8.5 Conclusions
This study demonstrated the importance of proper agronomic practices in maximising butternut yields and
profits. Use of the stale seedbed technique through pre-plant weed control to kill early season weeds is a
prerequisite to successful butternut production. Pre-plant weed control reduces butternut-weed
competition during the early growth stages before the vines spread, resulting in higher yields. To optimise
on yield, population density should be increased from farmer practice of 10 000 plants ha-1 to 25 000
plants ha-1 while doubling N rate from farmer practice of 60 kg N ha-1 to 120 kg N ha-1 will result in
maximum returns. This study demonstrates that the low yields obtained by farmers may be attributed to
poor weed control, nutrient deficiency and low population densities. Of the three factors, pre-plant weed
control is the most important factor as it resulted in 100% marketable yield reduction when not executed.
86
2.9 Testing of technological options for addressing agronomic
constraints in Zanyokwe: 4. Comparative response of direct-seeded and
transplanted maize (Zea mays L.) to nitrogen application
2.9.1 Introduction
Agronomic research on maize in SA has largely been focused on maximising grain production, but
research aimed specifically at optimising green maize production is lacking (Van Averbeke, 2008). Birds
feeding on emerging maize seedlings were observed to be a serious problem in Zanyokwe and other
smallholder irrigation schemes in the Eastern Cape (Van Averbeke et al., 1998). Transplanting is a
strategy that is commonly used to establish crops when conditions are less favourable for direct seeding.
The practice is commonly used in rice cultivation and in the production of vegetable crops. According to
FAO (2003), maize transplanting as a method of crop establishment is probably unique to Korea and is
adopted in most areas of that country. However, there is reported use of maize seedlings in other parts of
the world, for example, North Vietnam (CIMMYT, 1989) and Northern India (Sharma et al., 1989; Khehra
et al., 1990). In SA, maize transplanting is used by some commercial farmers for production of green
maize. Transplanting can rescue farmers and save on resources that are otherwise devoted to re-planting
the maize due to very poor stand caused by bird damage. The advantages of transplanting are a reduced
mortality compared with direct seeding, scope for the selection of strong and healthy seedlings to ensure
a better plant stand and economies in the seed rate (FAO, 2003).
Use of transplants shortens the growth period in the field and, as a consequence, even late-maturing,
high yielding cultivars can be made to fit into available growing season as defined by either rainfall or
temperature (Dale and Drennan, 1997). Depending on the age of transplants, time to harvest maize was
reduced by one to three weeks in the USA and 10 to 12 days in France (Waters et al., 1990). Good crop
establishment with transplanting results in the attainment of more cobs per unit area and therefore greater
profit margins. Whilst the response to N rate of direct-seeded maize has generally been studied (FSSA,
2007), information is lacking on the response of transplanted maize. It can be hypothesised that the
fertiliser requirement of crops grown from transplants would be lower, given reduced growth period in the
field. This study was therefore carried out to determine maize yield response to N application with direct
seeding and transplanting. The hypotheses tested were: (i) maize responds to N differently with seedlings
compared to direct seeding, (ii) use of transplants result in superior crop stand compared to direct
seeding, and (iii) use of transplants shortens crop growth duration in the field.
87
2.9.2 Materials and Methods
Experimental sites
These researcher managed experiments were planted at one farm; Bantubantu during the 2006/07
season and at two farms; University of Fort Hare (UFH) and Booi in 2007/08. Bantubantu and Booi farms
are located at latitudes 32° 45' S and longitudes 27° 03' E and consisted of dark coloured heavy textured
soils of the Valsrivier form. The UFH farm is located at 32°46' S; 26° 50' E and consisted of deep and
alluvial soils of the Oakleaf form, belonging to Jozini series. Bantubantu was planted on 18th December
2006 while UFH farm and Booi were planted on the 20th and 22nd November 2007, respectively.
Experimental design and treatments
The experiment consisted of two factors; N rate and establishment method (EM) laid out as a 2 x 6
factorial in a randomised complete block design with three replicates per site. EM was at two levels, direct
seeding and transplanting whilst N rate was at six levels; 0, 60, 120, 180, 240 and 300 kg ha-1. A third of
the nitrogen was applied as a basal application at planting as compound fertilizer 2:3:4 (30) while the
remaining two thirds were applied as lime ammonium nitrate (28% N) top-dressing in two equal splits at 5
and 7 weeks after emergence (WAE) of grain seed planting. Gross plots consisted of nine rows each 6 m
long, and spaced 0.9 m between rows. The corresponding net plots consisted of three rows each 4 m
long for the green and grain yield assessments. Seedlings were transplanted when they were two weeks
old. Seedlings along with their root-balls were transplanted by hand in planting stations made by hand
hoes. Seeds were planted at the same time as direct-seeded maize in planting stations made by hand
hoes. The newly established crop received an irrigation of 18 mm soon after planting/transplanting.
Non-experimental variables
Land was ploughed and disked once using a tractor-drawn plough and disc harrow, respectively, before
the plots were marked. Maize variety SC 701 (Seed-CO®, South Africa) was used. Three seeds or one
seedling were planted at in-row spacing of 0.27 m in rows 0.9 m apart. Gap filling was done a week after
transplanting in cases of seedling mortality while seeds were thinned to one plant per station at 2 WAE of
grain seed plantings for a target population of 41 152 plants ha-1. The crop was kept weed free through a
combination of chemical and mechanical weed control methods. Atrazine was applied soon after
planting/transplanting using a knapsack sprayer calibrated to apply 200 litres of herbicide spray mixture
per hectare, while weed escapes were removed through hand pulling and hand hoeing. Supplementary
irrigation was done using the sprinkler system which discharged 6 mm of water hour-1. Irrigation water
was applied to meet the crop water requirements and the amount applied varied with weather conditions
and crop growth stage (Table 2.30).
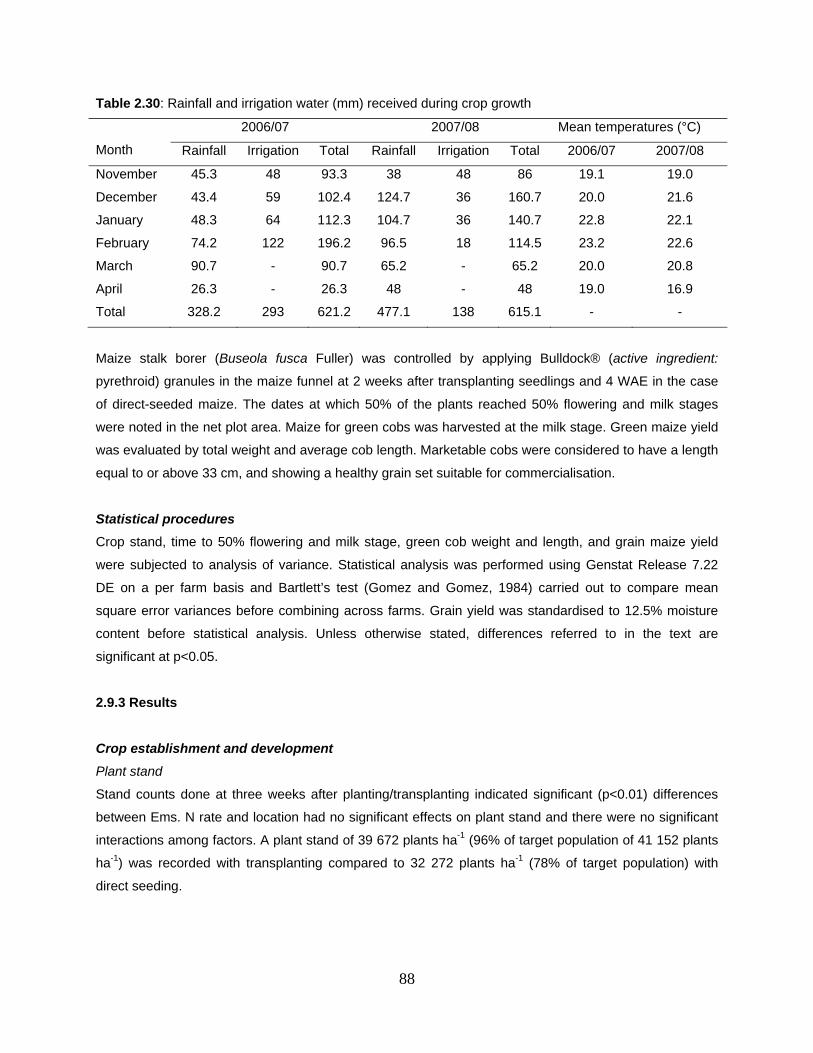
88
Table 2.30: Rainfall and irrigation water (mm) received during crop growth
Month
2006/07 2007/08 Mean temperatures (°C)
Rainfall Irrigation Total Rainfall Irrigation Total 2006/07 2007/08
November 45.3 48 93.3 38 48 86 19.1 19.0
December 43.4 59 102.4 124.7 36 160.7 20.0 21.6
January 48.3 64 112.3 104.7 36 140.7 22.8 22.1
February 74.2 122 196.2 96.5 18 114.5 23.2 22.6
March 90.7 - 90.7 65.2 - 65.2 20.0 20.8
April 26.3 - 26.3 48 - 48 19.0 16.9
Total 328.2 293 621.2 477.1 138 615.1 - -
Maize stalk borer (Buseola fusca Fuller) was controlled by applying Bulldock® (active ingredient:
pyrethroid) granules in the maize funnel at 2 weeks after transplanting seedlings and 4 WAE in the case
of direct-seeded maize. The dates at which 50% of the plants reached 50% flowering and milk stages
were noted in the net plot area. Maize for green cobs was harvested at the milk stage. Green maize yield
was evaluated by total weight and average cob length. Marketable cobs were considered to have a length
equal to or above 33 cm, and showing a healthy grain set suitable for commercialisation.
Statistical procedures
Crop stand, time to 50% flowering and milk stage, green cob weight and length, and grain maize yield
were subjected to analysis of variance. Statistical analysis was performed using Genstat Release 7.22
DE on a per farm basis and Bartlett’s test (Gomez and Gomez, 1984) carried out to compare mean
square error variances before combining across farms. Grain yield was standardised to 12.5% moisture
content before statistical analysis. Unless otherwise stated, differences referred to in the text are
significant at p<0.05.
2.9.3 Results
Crop establishment and development
Plant stand
Stand counts done at three weeks after planting/transplanting indicated significant (p<0.01) differences
between Ems. N rate and location had no significant effects on plant stand and there were no significant
interactions among factors. A plant stand of 39 672 plants ha-1 (96% of target population of 41 152 plants
ha-1) was recorded with transplanting compared to 32 272 plants ha-1 (78% of target population) with
direct seeding.
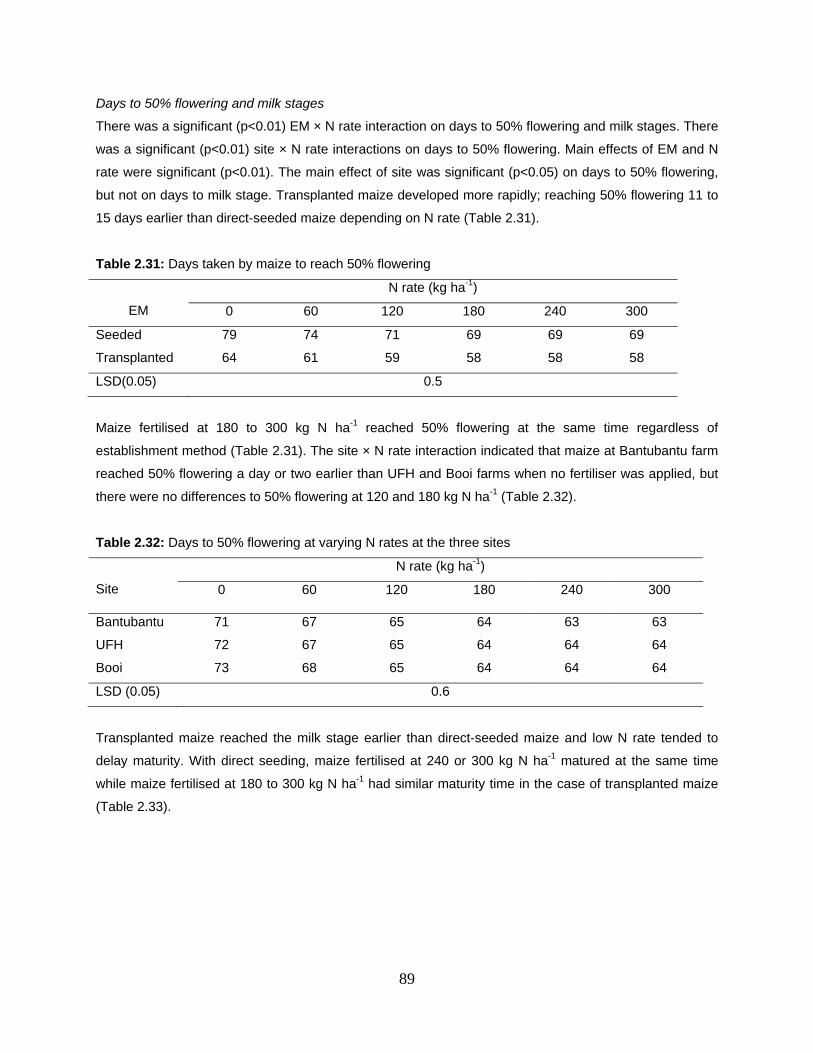
89
Days to 50% flowering and milk stages
There was a significant (p<0.01) EM × N rate interaction on days to 50% flowering and milk stages. There
was a significant (p<0.01) site × N rate interactions on days to 50% flowering. Main effects of EM and N
rate were significant (p<0.01). The main effect of site was significant (p<0.05) on days to 50% flowering,
but not on days to milk stage. Transplanted maize developed more rapidly; reaching 50% flowering 11 to
15 days earlier than direct-seeded maize depending on N rate (Table 2.31).
Table 2.31: Days taken by maize to reach 50% flowering
EM
N rate (kg ha-1)
0 60 120 180 240 300
Seeded 79 74 71 69 69 69
Transplanted 64 61 59 58 58 58
LSD(0.05) 0.5
Maize fertilised at 180 to 300 kg N ha-1 reached 50% flowering at the same time regardless of
establishment method (Table 2.31). The site × N rate interaction indicated that maize at Bantubantu farm
reached 50% flowering a day or two earlier than UFH and Booi farms when no fertiliser was applied, but
there were no differences to 50% flowering at 120 and 180 kg N ha-1 (Table 2.32).
Table 2.32: Days to 50% flowering at varying N rates at the three sites
Site
N rate (kg ha-1)
0 60 120 180 240 300
Bantubantu 71 67 65 64 63 63
UFH 72 67 65 64 64 64
Booi 73 68 65 64 64 64
LSD (0.05) 0.6
Transplanted maize reached the milk stage earlier than direct-seeded maize and low N rate tended to
delay maturity. With direct seeding, maize fertilised at 240 or 300 kg N ha-1 matured at the same time
while maize fertilised at 180 to 300 kg N ha-1 had similar maturity time in the case of transplanted maize
(Table 2.33).
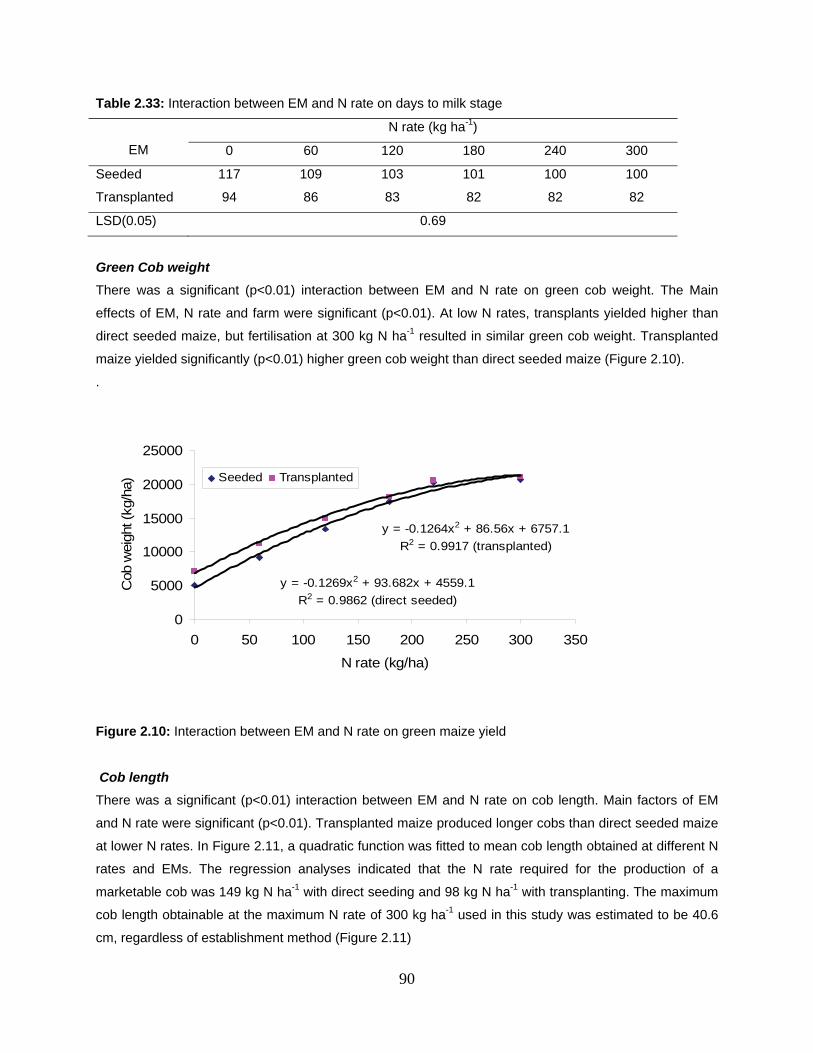
90
Table 2.33: Interaction between EM and N rate on days to milk stage
EM
N rate (kg ha-1)
0 60 120 180 240 300
Seeded 117 109 103 101 100 100
Transplanted 94 86 83 82 82 82
LSD(0.05) 0.69
Green Cob weight
There was a significant (p<0.01) interaction between EM and N rate on green cob weight. The Main
effects of EM, N rate and farm were significant (p<0.01). At low N rates, transplants yielded higher than
direct seeded maize, but fertilisation at 300 kg N ha-1 resulted in similar green cob weight. Transplanted
maize yielded significantly (p<0.01) higher green cob weight than direct seeded maize (Figure 2.10).
.
Figure 2.10: Interaction between EM and N rate on green maize yield
Cob length
There was a significant (p<0.01) interaction between EM and N rate on cob length. Main factors of EM
and N rate were significant (p<0.01). Transplanted maize produced longer cobs than direct seeded maize
at lower N rates. In Figure 2.11, a quadratic function was fitted to mean cob length obtained at different N
rates and EMs. The regression analyses indicated that the N rate required for the production of a
marketable cob was 149 kg N ha-1 with direct seeding and 98 kg N ha-1 with transplanting. The maximum
cob length obtainable at the maximum N rate of 300 kg ha-1 used in this study was estimated to be 40.6
cm, regardless of establishment method (Figure 2.11)
y = -0.1269x2 + 93.682x + 4559.1
R2 = 0.9862 (direct seeded)
y = -0.1264x2 + 86.56x + 6757.1
R2 = 0.9917 (transplanted)
0
5000
10000
15000
20000
25000
0 50 100 150 200 250 300 350
N rate (kg/ha)
Cob
wei
ght (
kg/h
a)
Seeded Transplanted
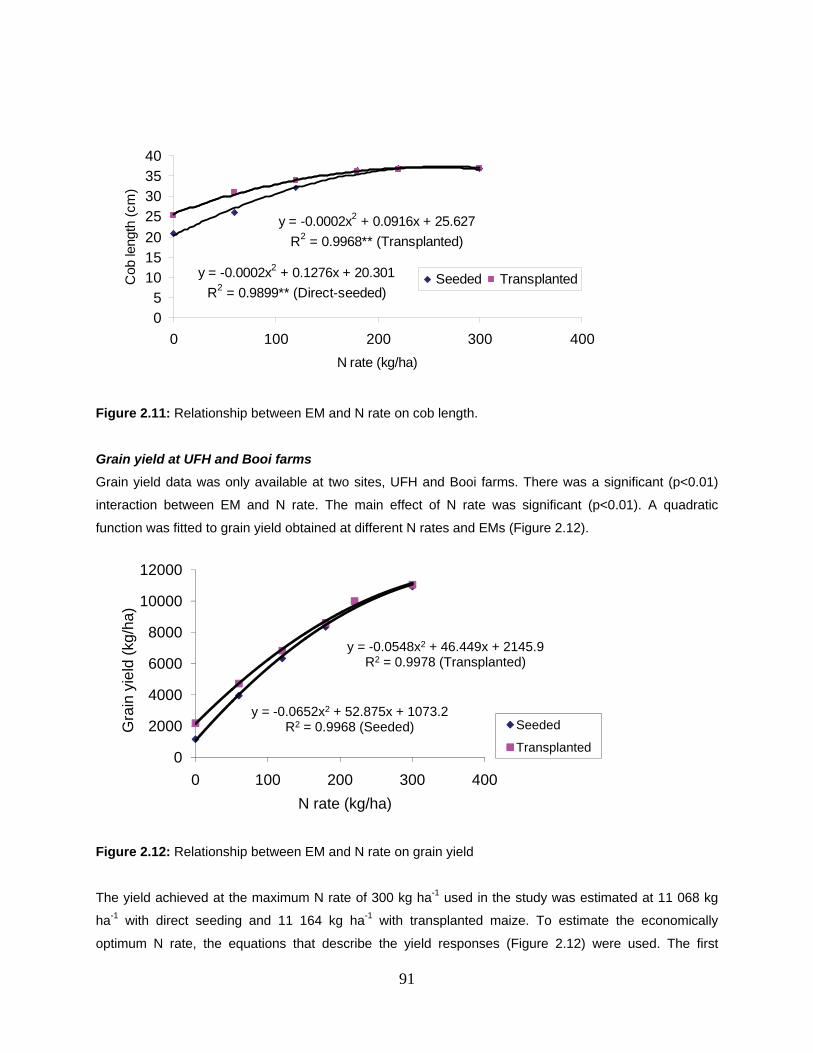
91
Figure 2.11: Relationship between EM and N rate on cob length.
Grain yield at UFH and Booi farms
Grain yield data was only available at two sites, UFH and Booi farms. There was a significant (p<0.01)
interaction between EM and N rate. The main effect of N rate was significant (p<0.01). A quadratic
function was fitted to grain yield obtained at different N rates and EMs (Figure 2.12).
Figure 2.12: Relationship between EM and N rate on grain yield
The yield achieved at the maximum N rate of 300 kg ha-1 used in the study was estimated at 11 068 kg
ha-1 with direct seeding and 11 164 kg ha-1 with transplanted maize. To estimate the economically
optimum N rate, the equations that describe the yield responses (Figure 2.12) were used. The first
y = -0.0002x2 + 0.1276x + 20.301
R2 = 0.9899** (Direct-seeded)
y = -0.0002x2 + 0.0916x + 25.627
R2 = 0.9968** (Transplanted)
05
101520
25303540
0 100 200 300 400
N rate (kg/ha)
Cob
leng
th (
cm)
Seeded Transplanted
y = -0.0652x2 + 52.875x + 1073.2R2 = 0.9968 (Seeded)
y = -0.0548x2 + 46.449x + 2145.9R2 = 0.9978 (Transplanted)
0
2000
4000
6000
8000
10000
12000
0 100 200 300 400
Gra
in y
ield
(kg
/ha)
N rate (kg/ha)
Seeded
Transplanted
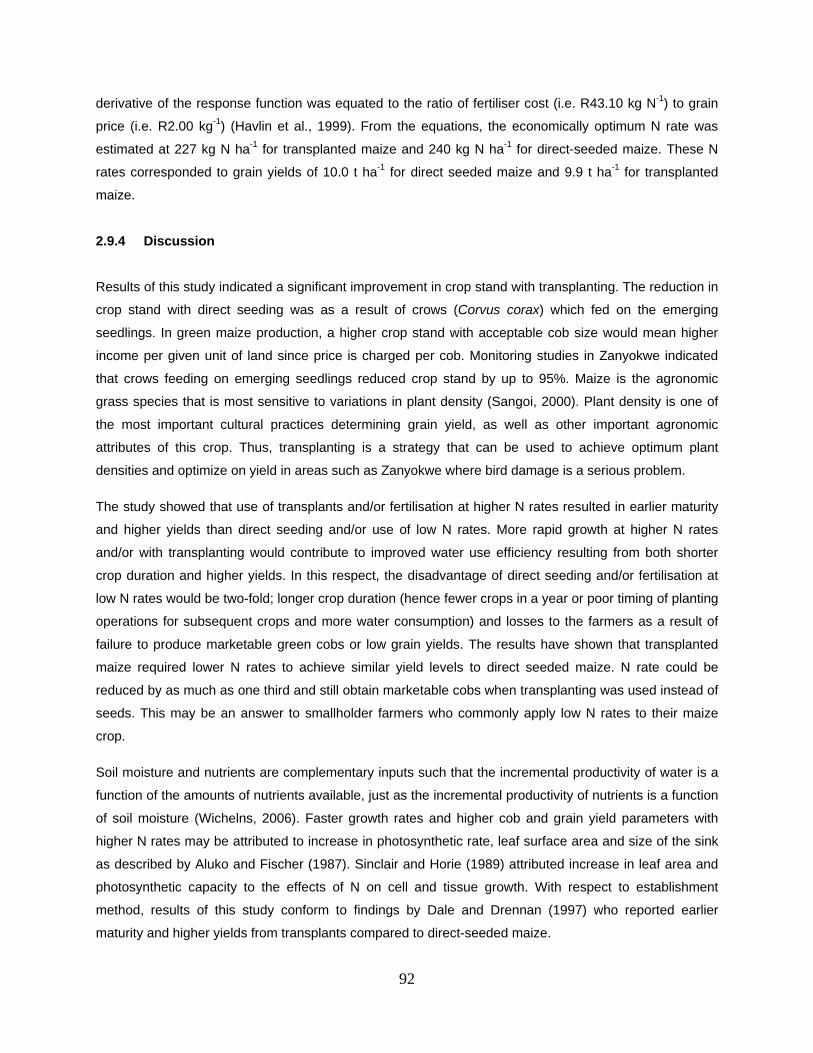
92
derivative of the response function was equated to the ratio of fertiliser cost (i.e. R43.10 kg N-1) to grain
price (i.e. R2.00 kg-1) (Havlin et al., 1999). From the equations, the economically optimum N rate was
estimated at 227 kg N ha-1 for transplanted maize and 240 kg N ha-1 for direct-seeded maize. These N
rates corresponded to grain yields of 10.0 t ha-1 for direct seeded maize and 9.9 t ha-1 for transplanted
maize.
2.9.4 Discussion
Results of this study indicated a significant improvement in crop stand with transplanting. The reduction in
crop stand with direct seeding was as a result of crows (Corvus corax) which fed on the emerging
seedlings. In green maize production, a higher crop stand with acceptable cob size would mean higher
income per given unit of land since price is charged per cob. Monitoring studies in Zanyokwe indicated
that crows feeding on emerging seedlings reduced crop stand by up to 95%. Maize is the agronomic
grass species that is most sensitive to variations in plant density (Sangoi, 2000). Plant density is one of
the most important cultural practices determining grain yield, as well as other important agronomic
attributes of this crop. Thus, transplanting is a strategy that can be used to achieve optimum plant
densities and optimize on yield in areas such as Zanyokwe where bird damage is a serious problem.
The study showed that use of transplants and/or fertilisation at higher N rates resulted in earlier maturity
and higher yields than direct seeding and/or use of low N rates. More rapid growth at higher N rates
and/or with transplanting would contribute to improved water use efficiency resulting from both shorter
crop duration and higher yields. In this respect, the disadvantage of direct seeding and/or fertilisation at
low N rates would be two-fold; longer crop duration (hence fewer crops in a year or poor timing of planting
operations for subsequent crops and more water consumption) and losses to the farmers as a result of
failure to produce marketable green cobs or low grain yields. The results have shown that transplanted
maize required lower N rates to achieve similar yield levels to direct seeded maize. N rate could be
reduced by as much as one third and still obtain marketable cobs when transplanting was used instead of
seeds. This may be an answer to smallholder farmers who commonly apply low N rates to their maize
crop.
Soil moisture and nutrients are complementary inputs such that the incremental productivity of water is a
function of the amounts of nutrients available, just as the incremental productivity of nutrients is a function
of soil moisture (Wichelns, 2006). Faster growth rates and higher cob and grain yield parameters with
higher N rates may be attributed to increase in photosynthetic rate, leaf surface area and size of the sink
as described by Aluko and Fischer (1987). Sinclair and Horie (1989) attributed increase in leaf area and
photosynthetic capacity to the effects of N on cell and tissue growth. With respect to establishment
method, results of this study conform to findings by Dale and Drennan (1997) who reported earlier
maturity and higher yields from transplants compared to direct-seeded maize.
93
For green maize to be marketable, it has to meet particular selection criteria, with ear length being most
vital (Van Averbeke, 2008). This study indicated that to obtain marketable cobs, N rate could be reduced
by as much as one third when seedlings are used instead of direct seeding. The fact that the
economically optimum N rate required to obtain marketable green cobs was lower than that required to
obtain optimum grain yields regardless of establishment method suggests that for purposes of green
maize production, lower N rates can be used as compared to grain maize production. At the maximum N
rate of 300 kg ha-1 used in the study, grain was still responsive to additional N.
The labour-intensive process of manual transplanting used for this study is of little interest for commercial
maize production. However, the present and future trends in South African agriculture emphasise the
need for land management with minimal soil disturbance to reduce soil erosion and nitrate leaching
(conservation agriculture) and minimal use of herbicides (through integrated weed management). These
may well be associated with transplanted maize as the German results suggest (Scheffer, 1984, 1987).
To provide a permanent soil cover which would reduce soil erosion and nitrate leaching, the maize would
be transplanted by machinery into the unploughed stubble of a preceding crop (Dale and Drennan, 1997).
Scheffer (1992) has also shown that the need for herbicides can be reduced, since the rapid growth of the
maize seedling transplants is more competitive with weeds than the slow establishment phase of direct-
seeded maize.
In this study, transplanting was done at the same time with direct-seeded maize after winter because the
objective was to compare maize performance with direct establishment methods and N rates. Thus,
planting could not be done earlier as the temperatures would be too low to establish a direct-seeded crop.
Future studies might need to investigate the possibility of transplanting early, towards the end of spring
but when conditions are still not conducive for direct seeding, to catch the early market in December
when demand for green maize is high.
2.9.5 Conclusions
This study demonstrated opportunities that exist in optimising green and grain maize yields through
transplanting. The results suggest that transplanting can help in achieving a good crop stand which would
translate to more green cobs and higher grain yields. Applying low N rates to maize slows crop growth,
resulting in maize taking a longer duration to reach maturity. Transplanted maize can be grown at lower N
rates to achieve similar yield levels as direct-seeded maize. Lower rates of fertiliser N can be used when
maize is grown for utilisation as green cobs than when it is grown for grain. The economically optimum N
rate required to obtain marketable cobs were 149 and 98 kg ha-1, whilst those required to achieve
optimum grain yields were 240 and 227 kg ha-1 with direct seeding and transplanting, respectively.
94
2.10 Testing of technological options for addressing agronomic constraints:
5. Comparative performance of directly seeded and transplanted green
maize under farmer management in Zanyokwe
2.10.1 Introduction
Successful production of maize in many SIS is hampered by bird damage to emerging seedlings causing
low stand establishment. In particular, crows (Corvus corax) feed on emerging maize seedlings and result
in poor stand in many parts of SA. In the Eastern Cape, bird damage was reported to be one of the major
biological constraints in six SIS, including ZIS (Van Averbeke et al., 1998). High levels of damage to
maize seedlings were also noted in ZIS (2.9) during this study indicating a persistence of the problem.
Transplanting is a strategy that is commonly used to establish crops when conditions are less favourable
for direct seeding. On-farm researcher-managed trials conducted during the 2007/08 season in ZIS
showed a significant difference in plant stand between transplanted and direct-seeded maize (2.9). In that
season, transplanting achieved a stand of 99% of target compared to 81% with direct seeding. The
reduction in crop stand with direct seeding was as a result of crows which fed on the emerging seedlings.
One advantage that can be derived from transplanting relates to savings in seed and costs of additional
labour and land preparation needed with re-planting, depending on the magnitude of damage to emerging
seedlings. Though transplanting maize seedlings offers several advantages (2.9), one question that
remained unknown was the feasibility of using the technology under farmer management with regards to
the labour requirement and returns realised in comparison to direct seeding. The latter practice is
mechanised in most SIS and requires little labour input. Studies in ZIS (2.9) showed that labour was a
constraint that compromised the management of crops in the scheme. Therefore, a farmer-managed
experiment was conducted in ZIS to: (i) compare the productivity of green maize established through
transplanting and direct seeding, and (ii) establish the economics of using transplanting in comparison to
direct seeding.
2.10.2 Materials and methods
On-farm trial
A farmer-managed trial was conducted at six farms in Burnshill in 2007/08 summer season. The trial
comprised two establishment methods as treatments; direct seeding and transplanting of maize
seedlings. SC701 was used as the test variety because of its popularity with ZIS farmers for green maize
production (2.9). Each farmer received 4 000 two-week old seedlings purchased from Loan Oak nurseries
in East London at 12 cents per seedling. For the direct-seeded plot, each farmer received 8 kg of SC701
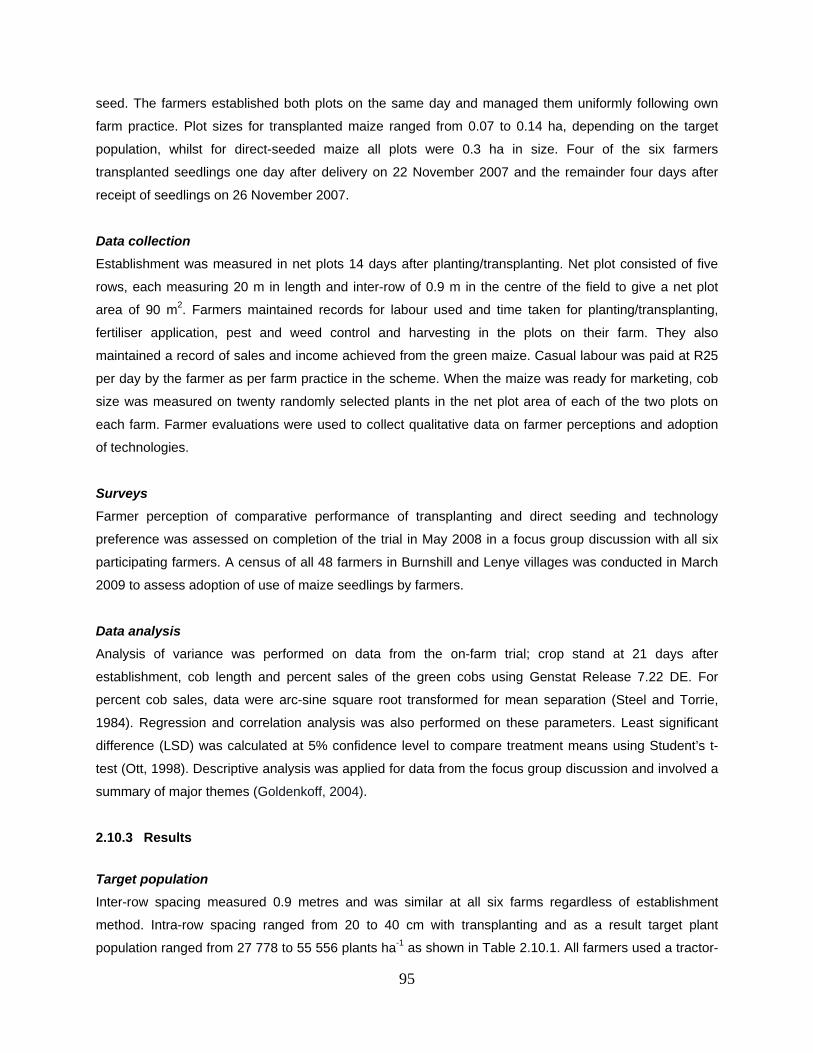
95
seed. The farmers established both plots on the same day and managed them uniformly following own
farm practice. Plot sizes for transplanted maize ranged from 0.07 to 0.14 ha, depending on the target
population, whilst for direct-seeded maize all plots were 0.3 ha in size. Four of the six farmers
transplanted seedlings one day after delivery on 22 November 2007 and the remainder four days after
receipt of seedlings on 26 November 2007.
Data collection
Establishment was measured in net plots 14 days after planting/transplanting. Net plot consisted of five
rows, each measuring 20 m in length and inter-row of 0.9 m in the centre of the field to give a net plot
area of 90 m2. Farmers maintained records for labour used and time taken for planting/transplanting,
fertiliser application, pest and weed control and harvesting in the plots on their farm. They also
maintained a record of sales and income achieved from the green maize. Casual labour was paid at R25
per day by the farmer as per farm practice in the scheme. When the maize was ready for marketing, cob
size was measured on twenty randomly selected plants in the net plot area of each of the two plots on
each farm. Farmer evaluations were used to collect qualitative data on farmer perceptions and adoption
of technologies.
Surveys
Farmer perception of comparative performance of transplanting and direct seeding and technology
preference was assessed on completion of the trial in May 2008 in a focus group discussion with all six
participating farmers. A census of all 48 farmers in Burnshill and Lenye villages was conducted in March
2009 to assess adoption of use of maize seedlings by farmers.
Data analysis
Analysis of variance was performed on data from the on-farm trial; crop stand at 21 days after
establishment, cob length and percent sales of the green cobs using Genstat Release 7.22 DE. For
percent cob sales, data were arc-sine square root transformed for mean separation (Steel and Torrie,
1984). Regression and correlation analysis was also performed on these parameters. Least significant
difference (LSD) was calculated at 5% confidence level to compare treatment means using Student’s t-
test (Ott, 1998). Descriptive analysis was applied for data from the focus group discussion and involved a
summary of major themes (Goldenkoff, 2004).
2.10.3 Results
Target population
Inter-row spacing measured 0.9 metres and was similar at all six farms regardless of establishment
method. Intra-row spacing ranged from 20 to 40 cm with transplanting and as a result target plant
population ranged from 27 778 to 55 556 plants ha-1 as shown in Table 2.10.1. All farmers used a tractor-
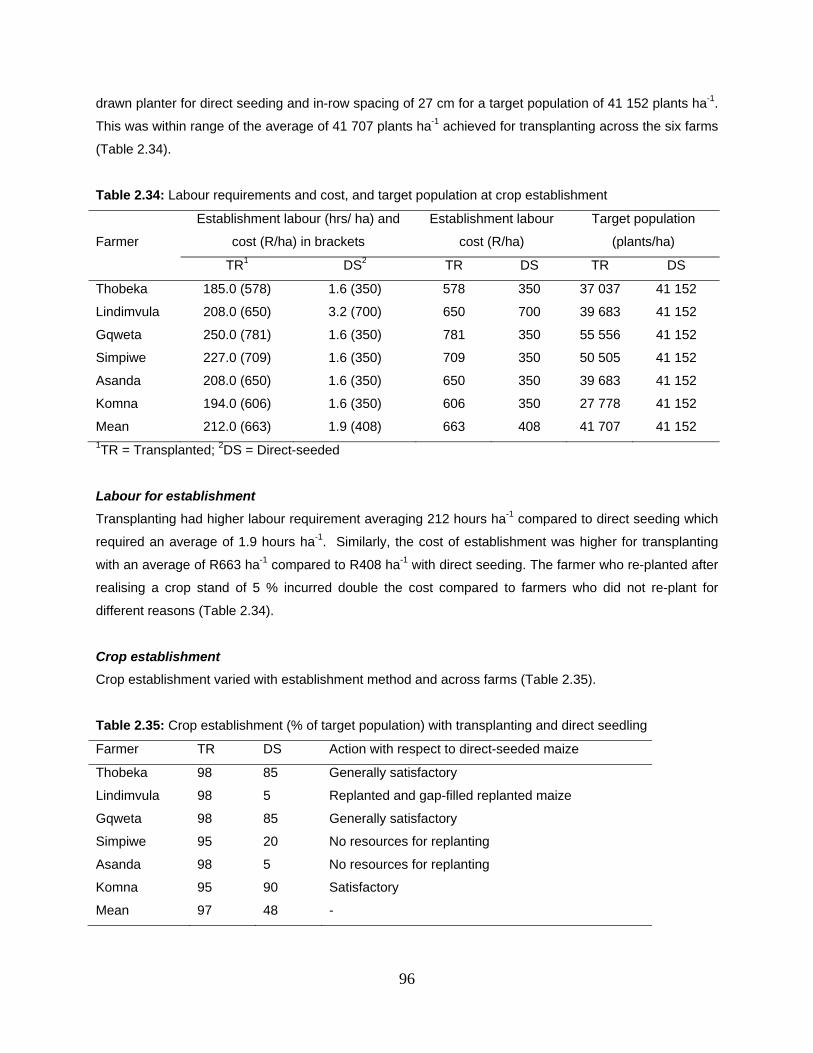
96
drawn planter for direct seeding and in-row spacing of 27 cm for a target population of 41 152 plants ha-1.
This was within range of the average of 41 707 plants ha-1 achieved for transplanting across the six farms
(Table 2.34).
Table 2.34: Labour requirements and cost, and target population at crop establishment
Farmer
Establishment labour (hrs/ ha) and
cost (R/ha) in brackets
Establishment labour
cost (R/ha)
Target population
(plants/ha)
TR1 DS2 TR DS TR DS
Thobeka 185.0 (578) 1.6 (350) 578 350 37 037 41 152
Lindimvula 208.0 (650) 3.2 (700) 650 700 39 683 41 152
Gqweta 250.0 (781) 1.6 (350) 781 350 55 556 41 152
Simpiwe 227.0 (709) 1.6 (350) 709 350 50 505 41 152
Asanda 208.0 (650) 1.6 (350) 650 350 39 683 41 152
Komna 194.0 (606) 1.6 (350) 606 350 27 778 41 152
Mean 212.0 (663) 1.9 (408) 663 408 41 707 41 152 1TR = Transplanted; 2DS = Direct-seeded
Labour for establishment
Transplanting had higher labour requirement averaging 212 hours ha-1 compared to direct seeding which
required an average of 1.9 hours ha-1. Similarly, the cost of establishment was higher for transplanting
with an average of R663 ha-1 compared to R408 ha-1 with direct seeding. The farmer who re-planted after
realising a crop stand of 5 % incurred double the cost compared to farmers who did not re-plant for
different reasons (Table 2.34).
Crop establishment
Crop establishment varied with establishment method and across farms (Table 2.35).
Table 2.35: Crop establishment (% of target population) with transplanting and direct seedling
Farmer TR DS Action with respect to direct-seeded maize
Thobeka 98 85 Generally satisfactory
Lindimvula 98 5 Replanted and gap-filled replanted maize
Gqweta 98 85 Generally satisfactory
Simpiwe 95 20 No resources for replanting
Asanda 98 5 No resources for replanting
Komna 95 90 Satisfactory
Mean 97 48 -
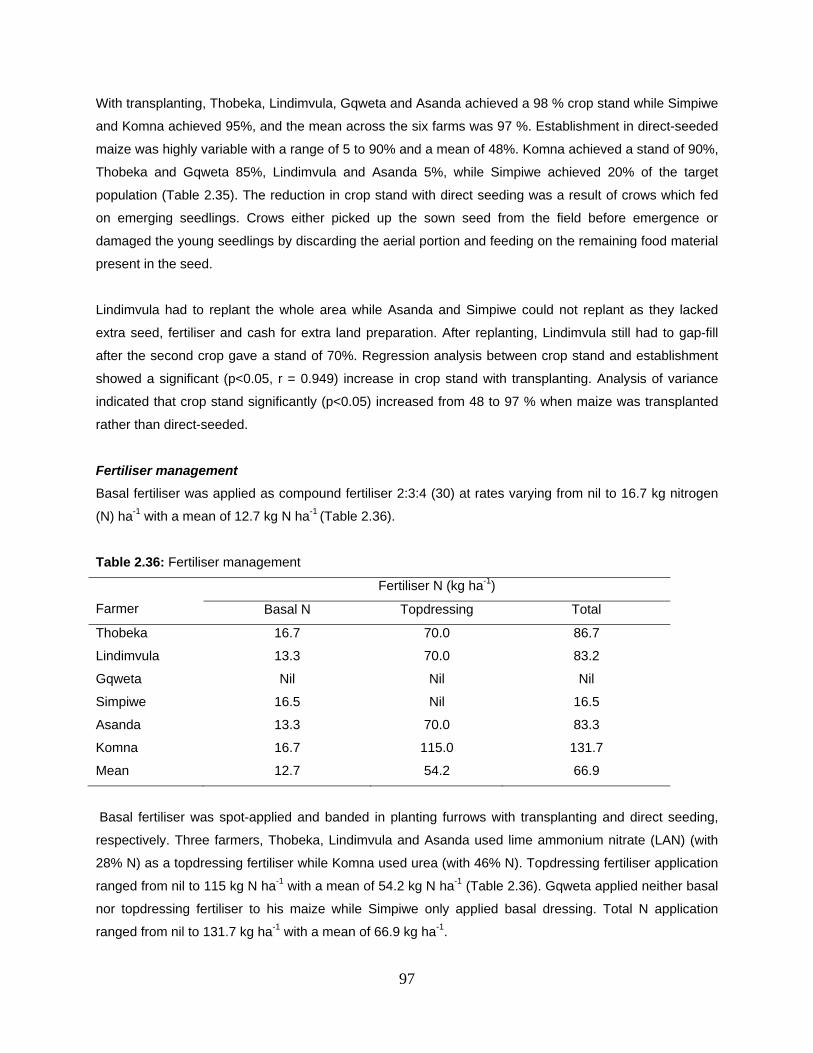
97
With transplanting, Thobeka, Lindimvula, Gqweta and Asanda achieved a 98 % crop stand while Simpiwe
and Komna achieved 95%, and the mean across the six farms was 97 %. Establishment in direct-seeded
maize was highly variable with a range of 5 to 90% and a mean of 48%. Komna achieved a stand of 90%,
Thobeka and Gqweta 85%, Lindimvula and Asanda 5%, while Simpiwe achieved 20% of the target
population (Table 2.35). The reduction in crop stand with direct seeding was a result of crows which fed
on emerging seedlings. Crows either picked up the sown seed from the field before emergence or
damaged the young seedlings by discarding the aerial portion and feeding on the remaining food material
present in the seed.
Lindimvula had to replant the whole area while Asanda and Simpiwe could not replant as they lacked
extra seed, fertiliser and cash for extra land preparation. After replanting, Lindimvula still had to gap-fill
after the second crop gave a stand of 70%. Regression analysis between crop stand and establishment
showed a significant (p<0.05, r = 0.949) increase in crop stand with transplanting. Analysis of variance
indicated that crop stand significantly (p<0.05) increased from 48 to 97 % when maize was transplanted
rather than direct-seeded.
Fertiliser management
Basal fertiliser was applied as compound fertiliser 2:3:4 (30) at rates varying from nil to 16.7 kg nitrogen
(N) ha-1 with a mean of 12.7 kg N ha-1 (Table 2.36).
Table 2.36: Fertiliser management
Farmer
Fertiliser N (kg ha-1)
Basal N Topdressing Total
Thobeka 16.7 70.0 86.7
Lindimvula 13.3 70.0 83.2
Gqweta Nil Nil Nil
Simpiwe 16.5 Nil 16.5
Asanda 13.3 70.0 83.3
Komna 16.7 115.0 131.7
Mean 12.7 54.2 66.9
Basal fertiliser was spot-applied and banded in planting furrows with transplanting and direct seeding,
respectively. Three farmers, Thobeka, Lindimvula and Asanda used lime ammonium nitrate (LAN) (with
28% N) as a topdressing fertiliser while Komna used urea (with 46% N). Topdressing fertiliser application
ranged from nil to 115 kg N ha-1 with a mean of 54.2 kg N ha-1 (Table 2.36). Gqweta applied neither basal
nor topdressing fertiliser to his maize while Simpiwe only applied basal dressing. Total N application
ranged from nil to 131.7 kg ha-1 with a mean of 66.9 kg ha-1.
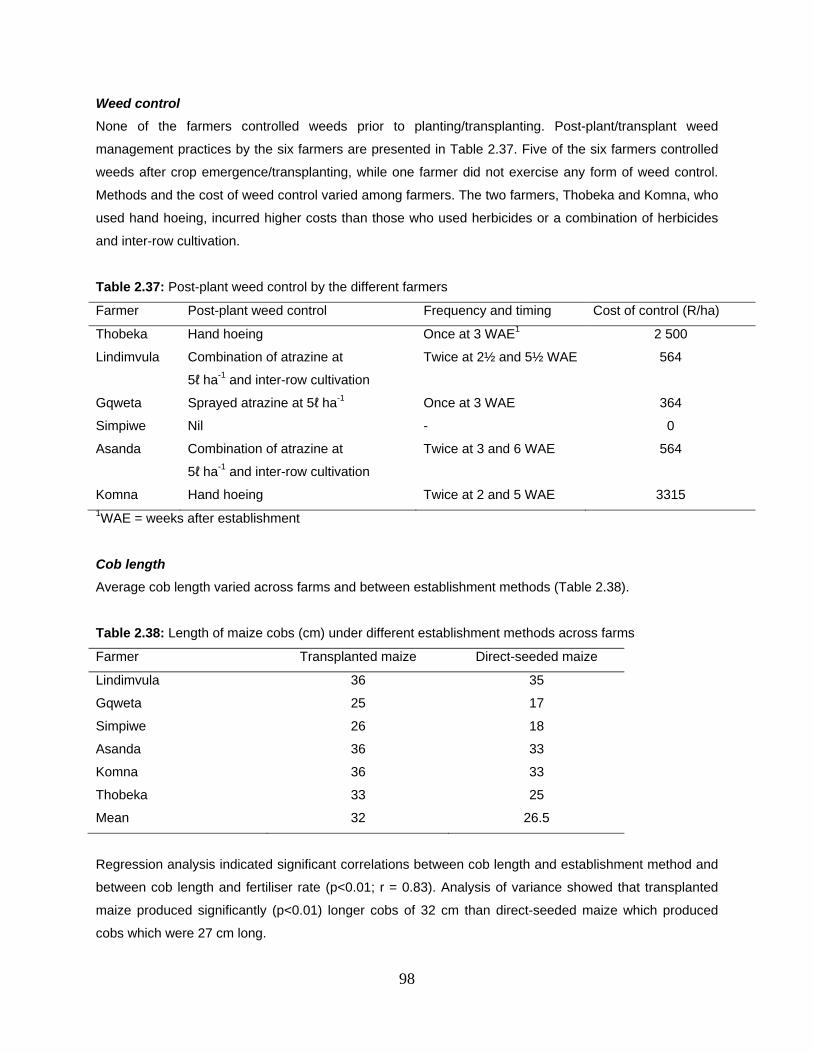
98
Weed control
None of the farmers controlled weeds prior to planting/transplanting. Post-plant/transplant weed
management practices by the six farmers are presented in Table 2.37. Five of the six farmers controlled
weeds after crop emergence/transplanting, while one farmer did not exercise any form of weed control.
Methods and the cost of weed control varied among farmers. The two farmers, Thobeka and Komna, who
used hand hoeing, incurred higher costs than those who used herbicides or a combination of herbicides
and inter-row cultivation.
Table 2.37: Post-plant weed control by the different farmers
Farmer Post-plant weed control Frequency and timing Cost of control (R/ha)
Thobeka Hand hoeing Once at 3 WAE1 2 500
Lindimvula Combination of atrazine at
5ℓ ha-1 and inter-row cultivation
Twice at 2½ and 5½ WAE 564
Gqweta Sprayed atrazine at 5ℓ ha-1 Once at 3 WAE 364
Simpiwe Nil - 0
Asanda Combination of atrazine at
5ℓ ha-1 and inter-row cultivation
Twice at 3 and 6 WAE 564
Komna Hand hoeing Twice at 2 and 5 WAE 3315 1WAE = weeks after establishment
Cob length
Average cob length varied across farms and between establishment methods (Table 2.38).
Table 2.38: Length of maize cobs (cm) under different establishment methods across farms
Farmer Transplanted maize Direct-seeded maize
Lindimvula 36 35
Gqweta 25 17
Simpiwe 26 18
Asanda 36 33
Komna 36 33
Thobeka 33 25
Mean 32 26.5
Regression analysis indicated significant correlations between cob length and establishment method and
between cob length and fertiliser rate (p<0.01; r = 0.83). Analysis of variance showed that transplanted
maize produced significantly (p<0.01) longer cobs of 32 cm than direct-seeded maize which produced
cobs which were 27 cm long.
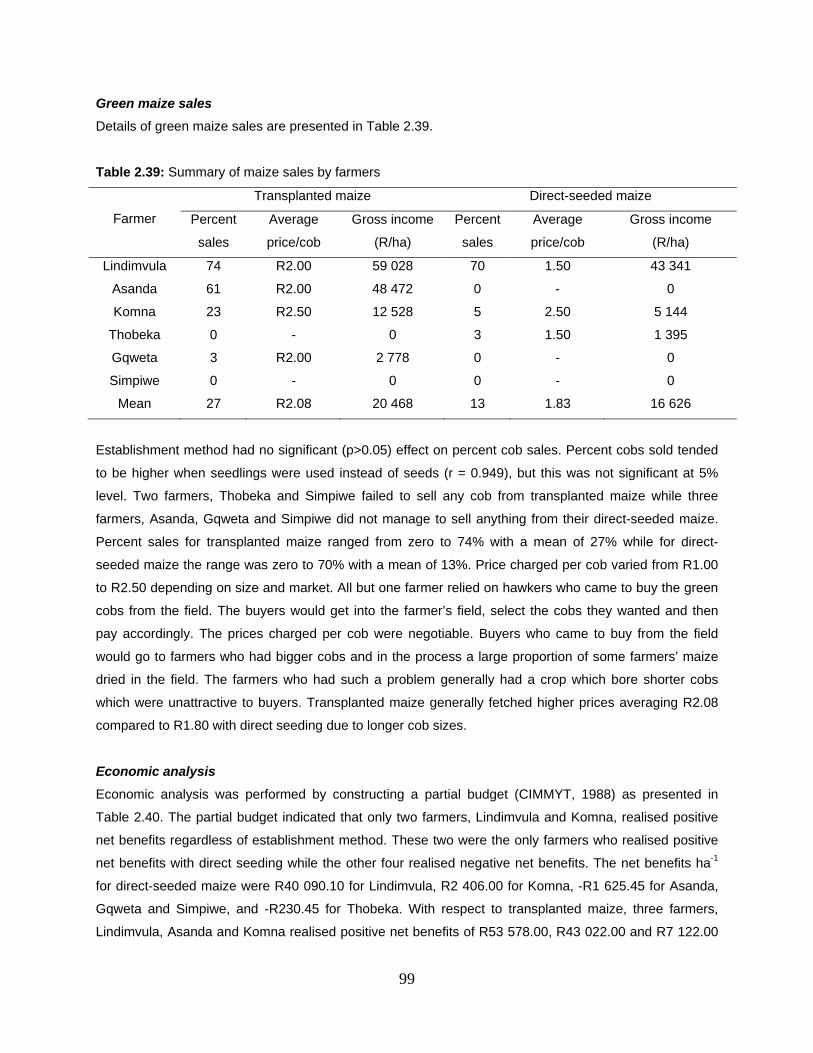
99
Green maize sales
Details of green maize sales are presented in Table 2.39.
Table 2.39: Summary of maize sales by farmers
Farmer
Transplanted maize Direct-seeded maize
Percent
sales
Average
price/cob
Gross income
(R/ha)
Percent
sales
Average
price/cob
Gross income
(R/ha)
Lindimvula 74 R2.00 59 028 70 1.50 43 341
Asanda 61 R2.00 48 472 0 - 0
Komna 23 R2.50 12 528 5 2.50 5 144
Thobeka 0 - 0 3 1.50 1 395
Gqweta 3 R2.00 2 778 0 - 0
Simpiwe 0 - 0 0 - 0
Mean 27 R2.08 20 468 13 1.83 16 626
Establishment method had no significant (p>0.05) effect on percent cob sales. Percent cobs sold tended
to be higher when seedlings were used instead of seeds (r = 0.949), but this was not significant at 5%
level. Two farmers, Thobeka and Simpiwe failed to sell any cob from transplanted maize while three
farmers, Asanda, Gqweta and Simpiwe did not manage to sell anything from their direct-seeded maize.
Percent sales for transplanted maize ranged from zero to 74% with a mean of 27% while for direct-
seeded maize the range was zero to 70% with a mean of 13%. Price charged per cob varied from R1.00
to R2.50 depending on size and market. All but one farmer relied on hawkers who came to buy the green
cobs from the field. The buyers would get into the farmer’s field, select the cobs they wanted and then
pay accordingly. The prices charged per cob were negotiable. Buyers who came to buy from the field
would go to farmers who had bigger cobs and in the process a large proportion of some farmers’ maize
dried in the field. The farmers who had such a problem generally had a crop which bore shorter cobs
which were unattractive to buyers. Transplanted maize generally fetched higher prices averaging R2.08
compared to R1.80 with direct seeding due to longer cob sizes.
Economic analysis
Economic analysis was performed by constructing a partial budget (CIMMYT, 1988) as presented in
Table 2.40. The partial budget indicated that only two farmers, Lindimvula and Komna, realised positive
net benefits regardless of establishment method. These two were the only farmers who realised positive
net benefits with direct seeding while the other four realised negative net benefits. The net benefits ha-1
for direct-seeded maize were R40 090.10 for Lindimvula, R2 406.00 for Komna, -R1 625.45 for Asanda,
Gqweta and Simpiwe, and -R230.45 for Thobeka. With respect to transplanted maize, three farmers,
Lindimvula, Asanda and Komna realised positive net benefits of R53 578.00, R43 022.00 and R7 122.00
100
ha-1, respectively. Thobeka, Gqweta and Simpiwe realised negative net benefits of -R5 378.00, -R2
803.00 and -R5 509.00 ha-1, respectively. For Lindimvula, who realised the highest net benefits
regardless of establishment method, the net benefits realised from transplanted maize were R13 487.90
higher than those realised from direct-seeded maize.
Passive evaluation of technologies
Interviews conducted during the year of the trial in the focus group discussion indicated that, regardless of
establishment method, all farmers were in favour of green as opposed to grain maize production as had
been the practice in the scheme. There were three widely noted benefits of green over grain maize
production: (1) green maize was more profitable, (2) maize grown for green cobs took a shorter duration
in the field, leaving enough time to prepare for winter planting, and (3) there was no need to invest in
labour for harvesting, processing and packaging as customers came to buy the green cobs from the field.
When the two methods of establishment were compared, all farmers were in favour of transplanting. All
farmers agreed that transplanted maize (1) produced bigger cobs relative to direct-seeded maize, (2)
grew more rapidly and matured earlier than direct-seeded maize, and (3) resulted in better crop stand due
to the absence of bird damage.
Participants commented that the absence of bird damage in transplanted maize meant savings in time,
labour, money and other resources as there was no need to replant or gap-fill, operations which would
require additional land preparation, planting and seed. It was also cited that weed management was
easier in transplanted maize because of the rapid growth of the maize, hence earlier development of
canopy to shade weeds. Commenting on the labour requirements for transplanting, farmers agreed that
this was not a major concern as they used the same strategy in cabbage and other vegetable crops, but
still realised higher profits. However, they expressed concern that that the labour intensiveness of
transplanting might limit the areas planted to the crop given the serious shortage of labour in the scheme,
particularly in summer. Another concern raised by farmers with regards to green maize production was
the need for ready transport to take the produce to market once it has ripened in cases where customers
did not immediately come to buy from the field for whatever reasons.
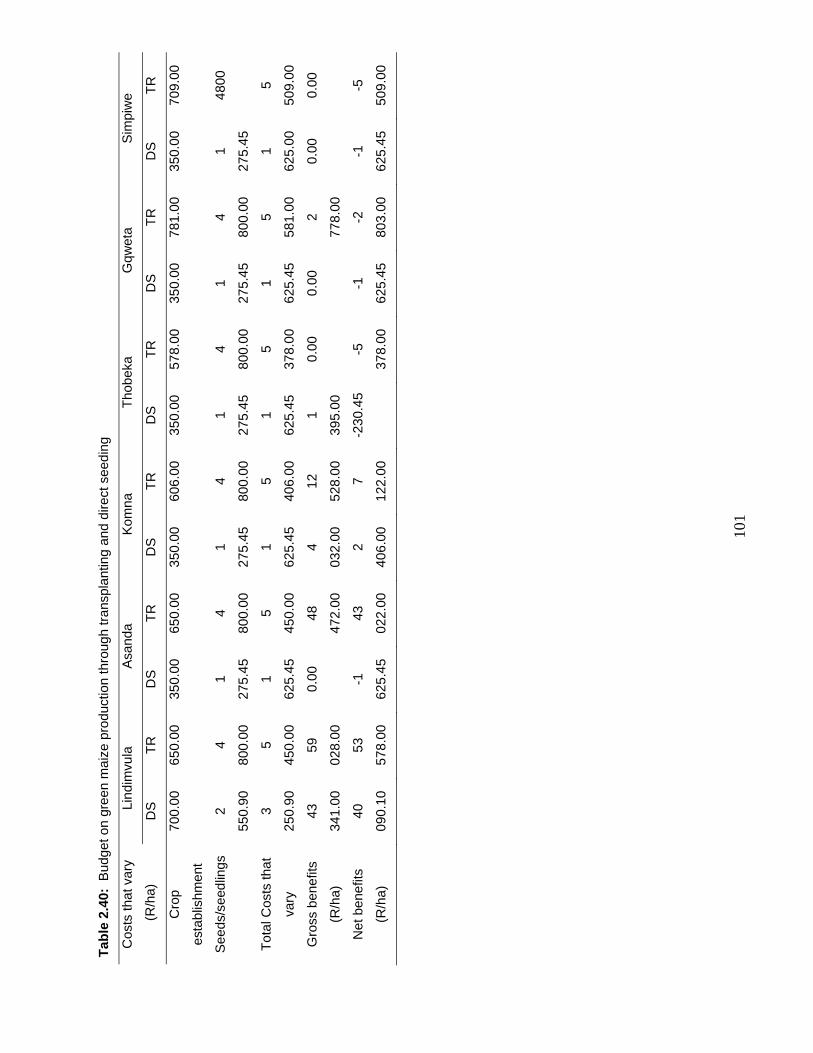
101
Tab
le 2
.40:
Bud
get o
n gr
een
mai
ze p
rodu
ctio
n th
roug
h tr
ansp
lant
ing
and
dire
ct s
eedi
ng
Cos
ts th
at v
ary
(R
/ha)
Lind
imvu
la
Asa
nda
Kom
na
Tho
beka
G
qwet
a S
impi
we
DS
T
R
DS
T
R
DS
T
R
DS
T
R
DS
T
R
DS
T
R
Cro
p
esta
blis
hmen
t
700.
00
650.
00
350.
00
650.
00
350.
00
606.
00
350.
00
578.
00
350.
00
781.
00
350.
00
709.
00
See
ds/s
eedl
ings
2
550.
90
4
800.
00
1
275.
45
4
800.
00
1
275.
45
4
800.
00
1
275.
45
4
800.
00
1
275.
45
4
800.
00
1
275.
45
4800
Tot
al C
osts
that
vary
3
250.
90
5
450.
00
1
625.
45
5
450.
00
1
625.
45
5
406.
00
1
625.
45
5
378.
00
1
625.
45
5
581.
00
1
625.
00
5
509.
00
Gro
ss b
enef
its
(R/h
a)
43
341.
00
59
028.
00
0.00
48
472.
00
4
032.
00
12
528.
00
1
395.
00
0.00
0.
00
2
778.
00
0.00
0.
00
Net
ben
efits
(R/h
a)
40
090.
10
53
578.
00
-1
625.
45
43
022.
00
2
406.
00
7
122.
00
-230
.45
-5
378.
00
-1
625.
45
-2
803.
00
-1
625.
45
-5
509.
00
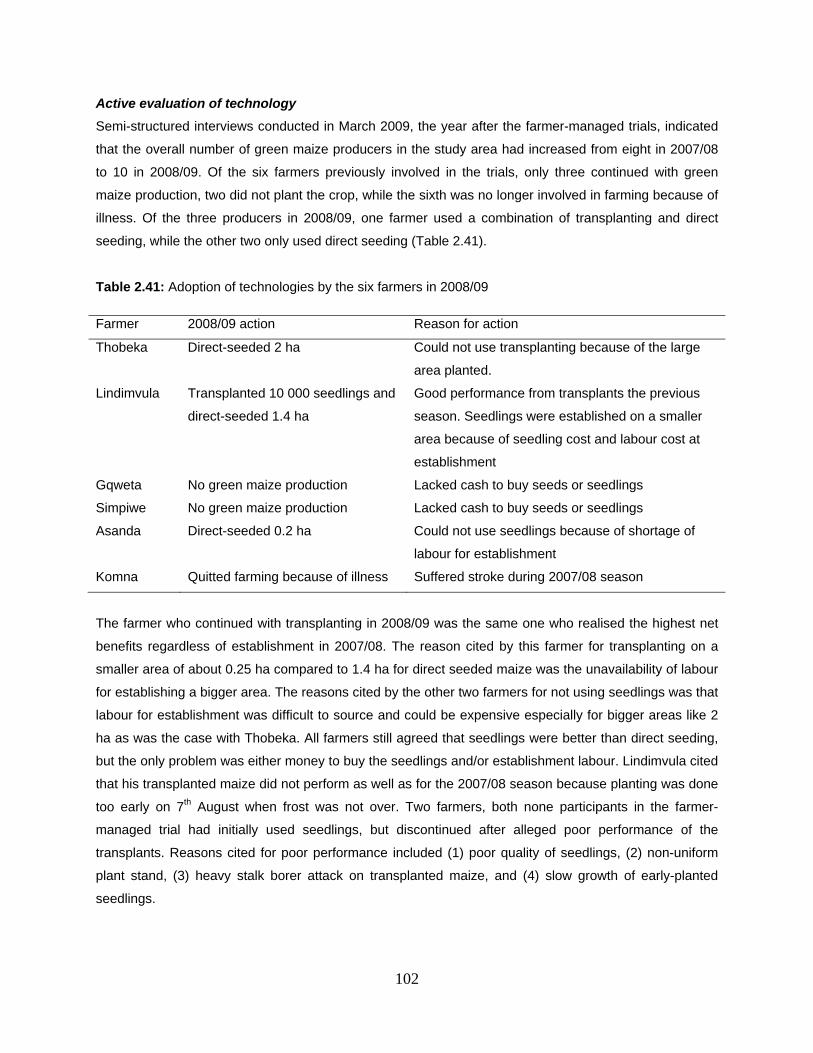
102
Active evaluation of technology
Semi-structured interviews conducted in March 2009, the year after the farmer-managed trials, indicated
that the overall number of green maize producers in the study area had increased from eight in 2007/08
to 10 in 2008/09. Of the six farmers previously involved in the trials, only three continued with green
maize production, two did not plant the crop, while the sixth was no longer involved in farming because of
illness. Of the three producers in 2008/09, one farmer used a combination of transplanting and direct
seeding, while the other two only used direct seeding (Table 2.41).
Table 2.41: Adoption of technologies by the six farmers in 2008/09
Farmer 2008/09 action Reason for action
Thobeka Direct-seeded 2 ha Could not use transplanting because of the large
area planted.
Lindimvula Transplanted 10 000 seedlings and
direct-seeded 1.4 ha
Good performance from transplants the previous
season. Seedlings were established on a smaller
area because of seedling cost and labour cost at
establishment
Gqweta No green maize production Lacked cash to buy seeds or seedlings
Simpiwe No green maize production Lacked cash to buy seeds or seedlings
Asanda Direct-seeded 0.2 ha Could not use seedlings because of shortage of
labour for establishment
Komna Quitted farming because of illness Suffered stroke during 2007/08 season
The farmer who continued with transplanting in 2008/09 was the same one who realised the highest net
benefits regardless of establishment in 2007/08. The reason cited by this farmer for transplanting on a
smaller area of about 0.25 ha compared to 1.4 ha for direct seeded maize was the unavailability of labour
for establishing a bigger area. The reasons cited by the other two farmers for not using seedlings was that
labour for establishment was difficult to source and could be expensive especially for bigger areas like 2
ha as was the case with Thobeka. All farmers still agreed that seedlings were better than direct seeding,
but the only problem was either money to buy the seedlings and/or establishment labour. Lindimvula cited
that his transplanted maize did not perform as well as for the 2007/08 season because planting was done
too early on 7th August when frost was not over. Two farmers, both none participants in the farmer-
managed trial had initially used seedlings, but discontinued after alleged poor performance of the
transplants. Reasons cited for poor performance included (1) poor quality of seedlings, (2) non-uniform
plant stand, (3) heavy stalk borer attack on transplanted maize, and (4) slow growth of early-planted
seedlings.
103
2.10.4 Discussion
The results of this study indicate that it may be viable to use seedlings for green maize production in
places where bird damage to planted seed or emerging young seedlings is a problem. In this regard, the
viability relates mainly to superior crop stand, and hence more cobs per unit area with transplanted maize
compared to direct seeded maize. Other superior attributes of transplanting include the shorter duration
taken by transplanted maize in the field and longer cobs with seedlings compared to direct seeding at
similar levels of fertilisation. Improved crop stands and bigger cobs with transplanting translate to more
marketable cobs per unit area, and hence more profit. Since transplanted maize is harvested earlier, this
may translate to higher cropping intensities as more crops can be grown at one given time on a specific
piece of land. This leaves farmers with enough time to prepare for the next crop, translating to more
timely operations. The major limitation to use of seedlings might be the high labour requirements for
establishment through transplanting amidst the dire shortage of labour in the scheme just like in many
other SIS in SA.
The study indicated a stand reduction by as much as 95 % with direct seeding due to crows which fed on
the planted seeds or emerging seedlings. In such situations, direct seeding can be very expensive
because of the need to replant, a process which would result in additional costs of inputs such as seed,
planting labour, water and additional land preparation in some cases. This would, in many cases, lead to
late operations which will affect the timely planting of the next crop, hence lower cropping intensities. In
this study, despite the fact that three farmers had achieved low crop stands of up to 20% of the target,
only one farmer managed to replant whilst the other two farmers could not re-seed due to lack of
additional resources. For the farmer who replanted, he still had to gap-fill, indicating how serious crow
damage is in the study area.
The study indicated that the population used by farmers with transplanting was highly variable and could
be as low as 27 778 plants ha-1 while with direct seeding the population was constant at 41 152 plants ha-
1. The Department of Agriculture (2003) recommends a plant population of 45 000 to 65 000 plants ha-1
for medium to late maturing cultivars under irrigation in SA. This indicates that with the exception of the
two farmers, Gqweta who targeted 55 556 plants ha-1 and Simpiwe who targeted 50 505 plants ha-1 with
transplanted maize, the rest of the farmers were using lower plant populations. With direct seeding, all
farmers used a below-optimum plant population and this was caused by the maize planter calibrated to
plant at 41 152 plants ha-1. Calibrating the maize planter operating in the scheme to plant at the
recommended population is expected to result in more cobs per unit area leading to higher gross margins
with good stand establishment and subsequent management.
The rate of N fertilisation was generally low for all farmers for the variety used. Though no fertiliser N
recommendations are available specifically for green maize production in SA, the FSSA (2007)
104
recommends 220 kg N ha-1 or more for optimum grain production under the study area conditions and for
the variety used. To obtain 100% marketable cobs using the same variety and in the same study area
(2.9) the optimum N rates required were 149 kg N ha-1 with direct seeding and 98 kg N ha-1 for
transplanted maize. This means that transplanted maize can be grown at lower fertiliser rates than direct
seeded maize. Results of the study indicate that the fertiliser rates used by all except one farmer, Komna
for transplanted maize, were low, especially for direct-seeded maize. Cob length increased with higher N
rates indicating that application of low fertiliser rates limited green maize productivity regardless of
establishment method. However, given that transplanted maize generally yielded longer cobs than direct-
seeded maize at similar rates of fertilisation, seedlings may be more favourable than direct seeding with
low fertiliser rates as commonly used by smallholder farmers.
The results indicated that the two farmers, Gqweta and Simpiwe, who transplanted their maize at the
highest population of above 50 000 plants ha-1, obtained the smallest cobs (Tables 2.34 and 2.38). The
situation was compounded by the fact that Gqweta did not apply any fertiliser to the crop, while Simpiwe
only applied 16.5 kg N basal fertiliser and did not weed his crop. Low productivity at high populations
might have been caused by increased intra-specific competition for limiting nutrients as well as weed-crop
competition in the case of Simpiwe. With such management practices of low or no fertiliser applications,
farmers would be expected to achieve higher yields by planting at lower populations to reduce
competition between plants for limiting factors. Planting at higher populations is only advantageous with
proper management of weeds, fertility, and other factors.
Monitoring studies in the study area indicated that poor weed control was one of major factors limiting
productivity of maize (Fanadzo, 2007). In this study, weed control was generally not a problem probably
because of the smaller areas planted to the crop. However, even with the small areas, one farmer never
weeded his crop and did not harvest any marketable cobs, resulting in total loss. Although not measured
in this study, the rapid development of transplanted maize relative to direct-seeded maize is expected to
result in better weed control and better water use efficiency by shortening the time the maize has to be
irrigated. This was also cited by farmers as one of the advantages of transplanting over direct seeding.
Scheffer (1992) reported that with transplanting, the need for herbicides can be reduced since the rapid
growth of the maize seedling transplants is more competitive with weeds than the slow establishment
phase of direct-seeded maize.
Being a vegetable crop, green maize has a short life span and has to be marketed as soon as possible
after it reaches maturity. The critical stage for harvesting green maize usually lasts only about four days
(National Department of Agriculture, 1998). In this regard, the results of this study demonstrate that,
regardless of establishment method, ready transport is a pre-requisite to marketing of green cobs.
Availability of transport allows farmers not only to sale the produce on time, but also to sell to competitive
105
markets. This was demonstrated by one farmer who took green cobs to a nearby town and sold part of
her green maize at a competitive price of R2.50 per cob because she owned a pick-up truck. Relying on
hawkers who came to buy the green cobs from the field forced farmers to sell some of their maize at as
low as R0.50 per cob. Since the maize was produced at the same time by the six farmers, it matured at
approximately the same time, resulting in competition among the farmers. One solution to this problem
would be to stagger plantings so that maize from different fields (or farmers) matures at different times
and reduces competition and maximise on sales. This is one of the strategies used by farmers in the
scheme for cabbage production.
It is apparent from the study that, just as for direct-seeded maize, good management of weeds, soil
fertility, and pests among other factors, is important for transplanted maize. The issue of stalk borer
control in transplants is one of the important lessons in green maize production using seedlings with
respect to timing. By the time the seedlings are transplanted, they are already at a physiologically
advanced stage of growth, meaning that stalk borer control has to be done earlier compared to direct-
seeded maize. Poor weed and fertility management were among the causes of poor performance. Early
timing of top-dress fertilisation is also critical in transplanted maize for the same reasons as cited for stalk
borer control.
Results of economic analysis showed that even though the total costs that varied were higher for
transplanted maize, producing maize from seedlings resulted in higher net benefits compared to direct
seeding for three of the six farmers. However, the results also indicate that with improper management,
farmers incurred more losses when transplanting was used rather than direct seeding, mainly because of
the higher costs that varied with transplanting. The negative net benefits incurred at some farms
regardless of establishment method were as a result of many factors: (i) failure to control weeds resulted
in unmarketable cobs as was the case with Simpiwe; (ii) stand reduction to 5% of the target population
with direct seeding due to crows which fed on the emerging seedlings, leading farmers to abandon the
fields as they could not replant due to lack of resources; (iii) Thobeka failed to sell anything from
transplanted maize not because the cobs were not marketable, but because of lack of transport to take
produce to market as all the hawkers preferred to buy from Lindimvula who had slightly bigger cobs and
the farm was more accessible, and (iv) Failure to apply any fertiliser to the crop caused Gqweta not to
obtain any marketable cobs from direct-seeded maize, while only 3% cobs from transplanted maize were
marketable.
2.10.5 Conclusions
The results of this study suggest that transplanting can help in achieving a good plant stand which would
translate to more green cobs and higher returns in areas where bird damage is a problem. Despite the
106
popularity of transplanting during the execution of the trials, active evaluation indicated that only one
farmer adopted the technology the following season, meaning that the technology might not be suitable in
situation where labour is in short supply as was the case of the study area. In this case, transplanting is
unlikely to succeed unless the labour intensiveness of manual transplanting can be solved. In spite of
this, the overall number of green maize producers in the scheme increased, indicating that farmers are
more comfortable with direct-seeded green maize production. One lesson from the study is that ready
transport is a prerequisite to green maize production so as to facilitate marketing once the maize has
matured given its short life span just like any other horticultural produce. The findings of the study suggest
that use of transplants can result in more timely operations, improved water use efficiency and higher
cropping intensities. Since transplanted maize produced longer cobs than direct-seeded maize at the
same N rate, this means that it might a better alternative to smallholder farmers who generally apply low
fertiliser rates to their maize. However, all these possible advantages of transplanting need to be
demonstrated to farmers through participatory experimentation.
2.11 Irrigation water management in Zanyokwe
2.11.1 Introduction
The water supply system was a technical constraint at ZIS with major problems being the poor state of
irrigation infrastructure and poor irrigation water management within the scheme and in the fields. In order
to address these constraints, a study was undertaken to focus specifically on the water use efficiency.
The broad objective of the study was to evaluate the water use efficiency at ZIS, from storage release to
root zone level and to introduce appropriate irrigation scheduling techniques to ensure effective use of
irrigation water. A draft plan on how the study was to be conducted was developed and presented,
discussed and agreed with project stakeholders at a workshop held on the 15 and 16 August 2005.
The most appropriate method to quantify water losses, or determine distribution efficiency, is through a
water balance study. It entails the accounting of all water volumes entering and leaving a three-
dimensional space over a period of time. In this study it was achieved through measuring flows at
selected points in the distribution system over a known period of time.
2.11.2 Water Supply at Zanyokwe
As indicated in 2.1 water is supplied to the scheme with a pipeline from the Sandile Dam. Apart from
farmers abstracting water from the pipeline, it also supplies water to the Sandile treatment works. The
volume of water released into the pipeline is measured with an ultrasonic flow meter, while the volume of
water abstracted by the Sandile water treatment works is measured with a v-notch in an open channel. It
was thus possible to determine the volume of water abstracted by farmers by subtracting the treatment
work’s meter reading from the meter reading at the dam.
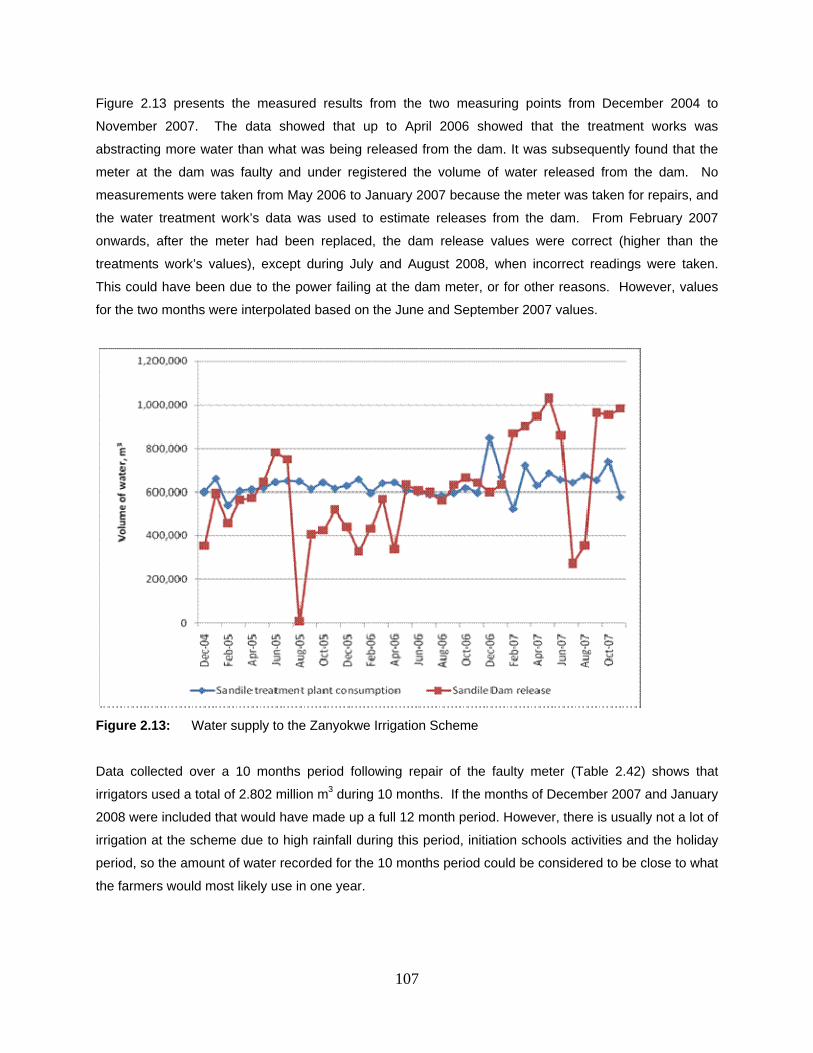
107
Figure 2.13 presents the measured results from the two measuring points from December 2004 to
November 2007. The data showed that up to April 2006 showed that the treatment works was
abstracting more water than what was being released from the dam. It was subsequently found that the
meter at the dam was faulty and under registered the volume of water released from the dam. No
measurements were taken from May 2006 to January 2007 because the meter was taken for repairs, and
the water treatment work’s data was used to estimate releases from the dam. From February 2007
onwards, after the meter had been replaced, the dam release values were correct (higher than the
treatments work’s values), except during July and August 2008, when incorrect readings were taken.
This could have been due to the power failing at the dam meter, or for other reasons. However, values
for the two months were interpolated based on the June and September 2007 values.
Figure 2.13: Water supply to the Zanyokwe Irrigation Scheme
Data collected over a 10 months period following repair of the faulty meter (Table 2.42) shows that
irrigators used a total of 2.802 million m3 during 10 months. If the months of December 2007 and January
2008 were included that would have made up a full 12 month period. However, there is usually not a lot of
irrigation at the scheme due to high rainfall during this period, initiation schools activities and the holiday
period, so the amount of water recorded for the 10 months period could be considered to be close to what
the farmers would most likely use in one year.
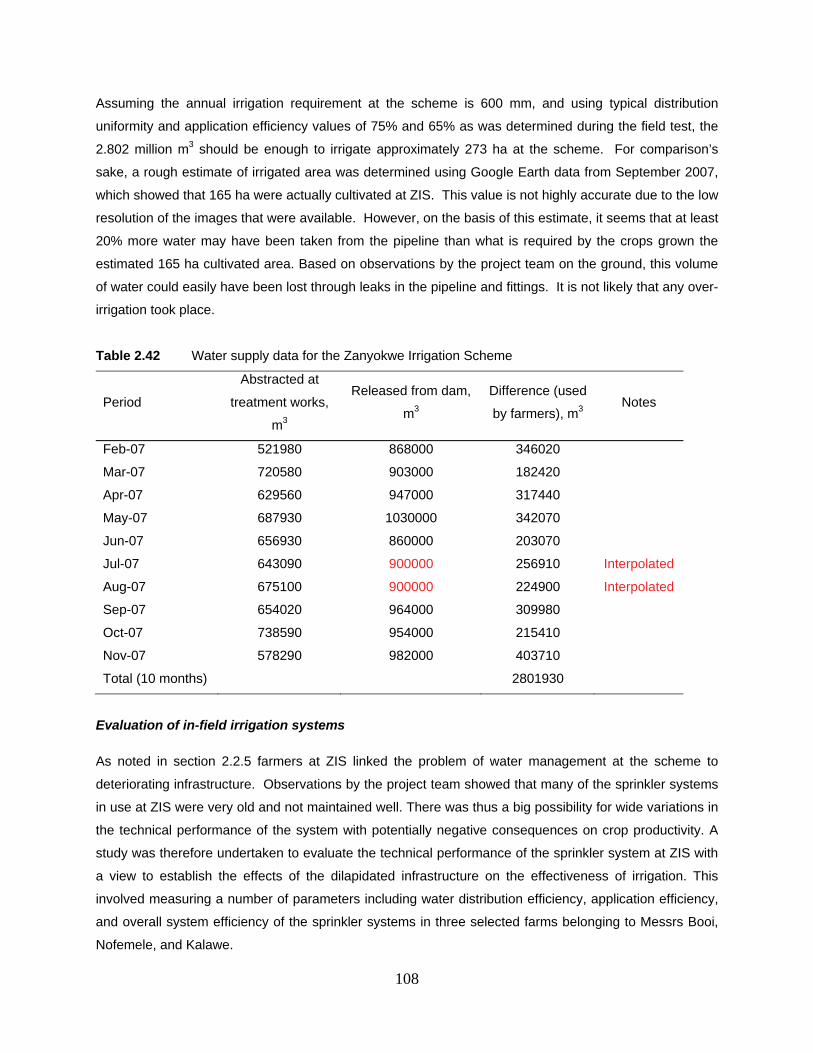
108
Assuming the annual irrigation requirement at the scheme is 600 mm, and using typical distribution
uniformity and application efficiency values of 75% and 65% as was determined during the field test, the
2.802 million m3 should be enough to irrigate approximately 273 ha at the scheme. For comparison’s
sake, a rough estimate of irrigated area was determined using Google Earth data from September 2007,
which showed that 165 ha were actually cultivated at ZIS. This value is not highly accurate due to the low
resolution of the images that were available. However, on the basis of this estimate, it seems that at least
20% more water may have been taken from the pipeline than what is required by the crops grown the
estimated 165 ha cultivated area. Based on observations by the project team on the ground, this volume
of water could easily have been lost through leaks in the pipeline and fittings. It is not likely that any over-
irrigation took place.
Table 2.42 Water supply data for the Zanyokwe Irrigation Scheme
Period
Abstracted at
treatment works,
m3
Released from dam,
m3
Difference (used
by farmers), m3 Notes
Feb-07 521980 868000 346020
Mar-07 720580 903000 182420
Apr-07 629560 947000 317440
May-07 687930 1030000 342070
Jun-07 656930 860000 203070
Jul-07 643090 900000 256910 Interpolated
Aug-07 675100 900000 224900 Interpolated
Sep-07 654020 964000 309980
Oct-07 738590 954000 215410
Nov-07 578290 982000 403710
Total (10 months) 2801930
Evaluation of in-field irrigation systems
As noted in section 2.2.5 farmers at ZIS linked the problem of water management at the scheme to
deteriorating infrastructure. Observations by the project team showed that many of the sprinkler systems
in use at ZIS were very old and not maintained well. There was thus a big possibility for wide variations in
the technical performance of the system with potentially negative consequences on crop productivity. A
study was therefore undertaken to evaluate the technical performance of the sprinkler system at ZIS with
a view to establish the effects of the dilapidated infrastructure on the effectiveness of irrigation. This
involved measuring a number of parameters including water distribution efficiency, application efficiency,
and overall system efficiency of the sprinkler systems in three selected farms belonging to Messrs Booi,
Nofemele, and Kalawe.
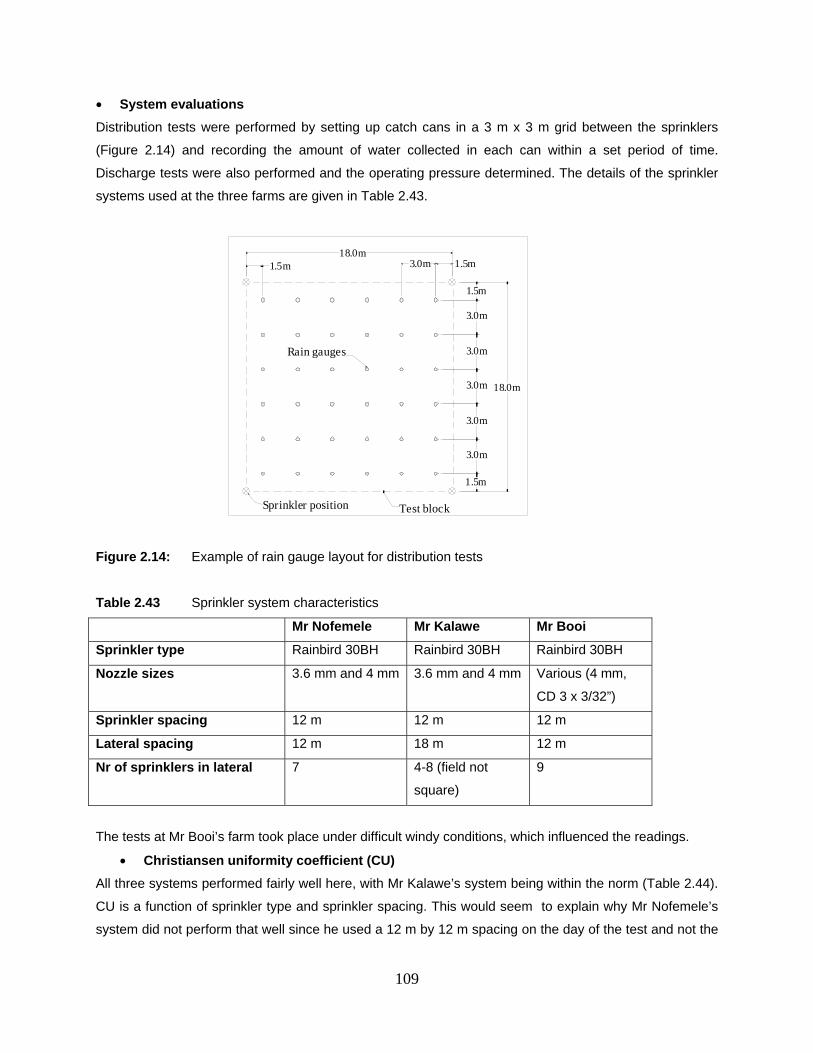
109
System evaluations
Distribution tests were performed by setting up catch cans in a 3 m x 3 m grid between the sprinklers
(Figure 2.14) and recording the amount of water collected in each can within a set period of time.
Discharge tests were also performed and the operating pressure determined. The details of the sprinkler
systems used at the three farms are given in Table 2.43.
Figure 2.14: Example of rain gauge layout for distribution tests
Table 2.43 Sprinkler system characteristics
Mr Nofemele Mr Kalawe Mr Booi
Sprinkler type Rainbird 30BH Rainbird 30BH Rainbird 30BH
Nozzle sizes 3.6 mm and 4 mm 3.6 mm and 4 mm Various (4 mm,
CD 3 x 3/32”)
Sprinkler spacing 12 m 12 m 12 m
Lateral spacing 12 m 18 m 12 m
Nr of sprinklers in lateral 7 4-8 (field not
square)
9
The tests at Mr Booi’s farm took place under difficult windy conditions, which influenced the readings.
Christiansen uniformity coefficient (CU)
All three systems performed fairly well here, with Mr Kalawe’s system being within the norm (Table 2.44).
CU is a function of sprinkler type and sprinkler spacing. This would seem to explain why Mr Nofemele’s
system did not perform that well since he used a 12 m by 12 m spacing on the day of the test and not the
1.5m
3.0m
3.0m
3.0m
3.0m
3.0m
1.5m
1.5m3.0m1.5m18.0m
18.0m
Rain gauges
Sprinkler position Test block
110
recommended 12 m by 18 m spacing. Mr Booi’s system performed poorly because it was windy when the
test was performed at his farm.
Distribution uniformity (DUlq)
Mr Nofemele’s system performed very poorly with regard to DUlq, which indicated huge variations in the
amount of water received by the plants in different sections of the field. The amount of water collected in
the catch cans varied from 3.2 to 8.9 mm, with an average application of 6.1 mm, while Mr Kalawe’s
results varied from 2.5 to 3.4 mm. Once again, the spacing could have influenced this result but system
pressure could also have played a role as discussed below. As was the case with the CU, the
performance was below the required standard due to the influence of wind.
Application efficiency (AE)
The average application is the amount of water that reaches the soil surface as measured with the catch
cans, and the gross application was a calculated value based on a volumetric measurement of the water
that left the nozzle divided by the area covered by a one sprinkler’s wetting pattern. The values used in
the calculations are shown below:
Nofemele Kalawe Booi
Average application (mm/h) 6.05 2.87 2.68
Gross application (mm/h) 10.14 5.81 7.66
Mr Kalawe’s system performance with respect to AE was bad and well below the norm. This indicated
that a considerable amount of water was lost between the sprinkler’s nozzle and the soil surface. These
losses are typically spray losses caused by evaporation of fine water particles, which in turn is formed if
the system pressure is too high. The large difference between the average and gross applications at Mr
Booi’s plot was further proof that some of the other indicators’ poor results were due to the wind that blew
away most of the irrigation water before it could reach the soil surface. This indicated that 65 % of the
water that left the sprinkler nozzle did not reach the soil surface. In this case the irrigation water could
have had a cooling effect on the micro climate surrounding the field but could not increase soil water
content in the field significantly.
System efficiency (SE)
This indicator is the product of the DUlq and the AE, and gives an indication of what percentage of the
water delivered by the sprinkler reaches the intended target. Mr Nofemele’s system did not perform as
required, possibly because of: (a) variations in system hardware, (b) incorrect sprinkler spacing, and (c)
incorrect system pressure. All of these aspects were due to incorrect system operation and maintenance,
and should be well within any farmers’ ability to make the necessary changes to his system in order to
improve performance. Mr Booi’s poor system efficiency was influenced by the wind and therefore this
value could not be taken as a true reflection of the system’s performance, but it does show and
111
underscore the effect that wind has on the efficiency of water application. It indicates that as far as
possible sprinkler irrigation should not be done on windy days.
System pressure
System pressure is the biggest contributing factor to the poor system performances. When a sprinkler is
operating at pressure above the recommendation, it’s wetting pattern changes, resulting in poor
distribution uniformity. The stream of water gets broken into very fine drops, resulting in a high
percentage of spray losses.
Each type of sprinkler has a unique wetting pattern on which recommendations for spacing and operating
pressure for acceptable performance standards are based. The wetting pattern will change if different
nozzles are used or if the operating pressure changes. If the sprinkler is not operating at the correct
pressure, or if a lateral contains different sprinklers and / or nozzles adjacent to each other, a situation is
created where parts of the field will be over irrigated while some parts of the field will be under irrigated,
even if the whole field is irrigated for the same period of time.
The characteristics of the locally manufactured equivalent of the Rainbird 30 BH sprinkler as used at
Zanyokwe are shown in Figure 2.15. The sprinkler’s ideal operating pressure is below 3 bar (300 kPa),
but in the field it was found that the pressure was in excess of 3 bar, and at Mr Nofemele’s farm the
system pressure was in excess of 4 bar, although it could not be measured accurately since the pressure
was in excess of the maximum range of the gauge used. The system pressure at Mr Booi’s farm was
measured accurately as varying between 4 and 4.4 bar, and the measured average discharge rate of
1104 l/h (at 4.2 bar) corresponds well with the theoretical discharge rates shown in Table 2.45 for a
sprinkler with a 4 mm nozzle.
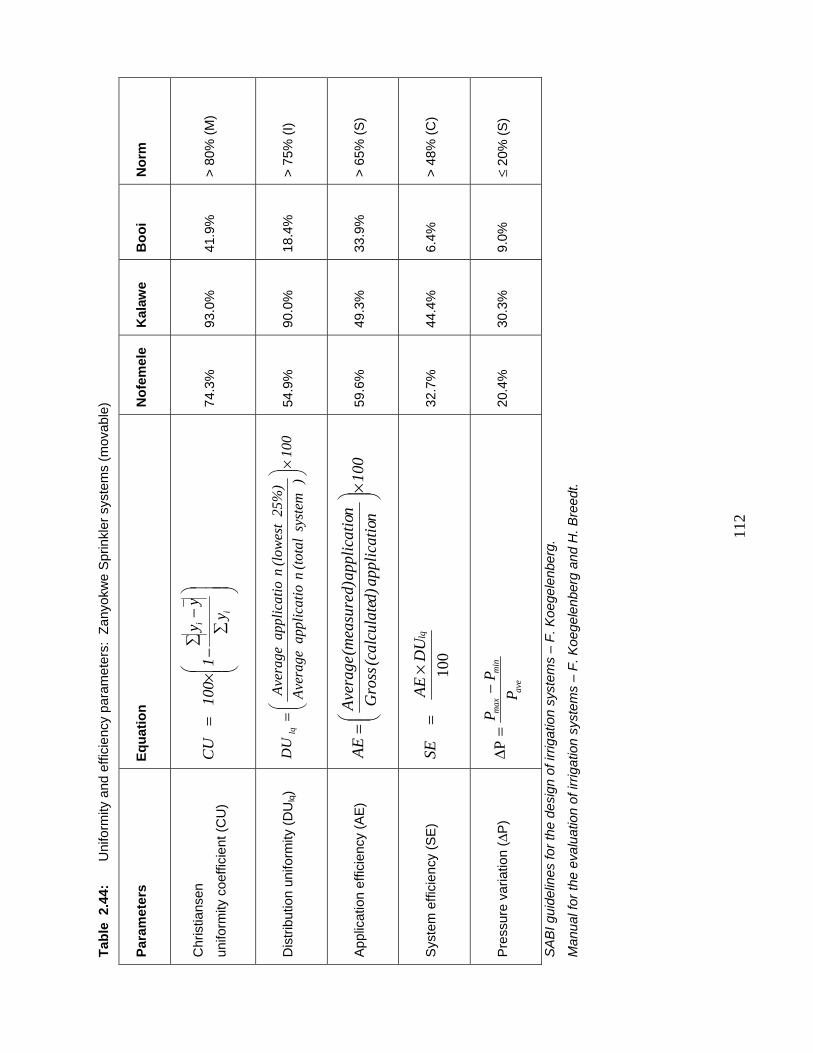
112
Tab
le 2
.44:
U
nifo
rmity
and
effi
cien
cy p
aram
eter
s: Z
anyo
kwe
Spr
inkl
er s
yste
ms
(mov
able
)
Par
amet
ers
Eq
uat
ion
N
ofe
mel
e K
alaw
e B
oo
i N
orm
Chr
istia
nsen
unifo
rmity
coe
ffici
ent (
CU
)
i
i y
yy
110
0C
U
74.3
%
93.0
%
41.9
%
> 8
0% (
M)
Dis
trib
utio
n un
iform
ity (
DU
lq)
100
) sy
stem
(tota
l n
appl
icat
io
Aver
age
25%
)
(low
est
nap
plic
atio
Av
erag
eD
Ulq
54.9
%
90.0
%
18.4
%
> 7
5% (
I)
App
licat
ion
effic
ienc
y (A
E)
100
nap
plic
atio
d)
(cal
cula
te
Gro
ss n
appl
icat
io
(mea
sure
d)
Aver
age
AE
59
.6%
49
.3%
33
.9%
>
65%
(S
)
Sys
tem
effi
cien
cy (
SE
) 10
0
lqD
UAE
SE
32.7
%
44.4
%
6.4%
>
48%
(C
)
Pre
ssur
e va
riatio
n (
P)
ave
min
max
PP
P
P
20
.4%
30
.3%
9.
0%
20
% (
S)
SA
BI g
uide
lines
for
the
desi
gn o
f irr
igat
ion
syst
ems
– F
. Koe
gele
nber
g.
Man
ual f
or th
e ev
alua
tion
of ir
rigat
ion
syst
ems
– F
. Koe
gele
nber
g an
d H
. Bre
edt.
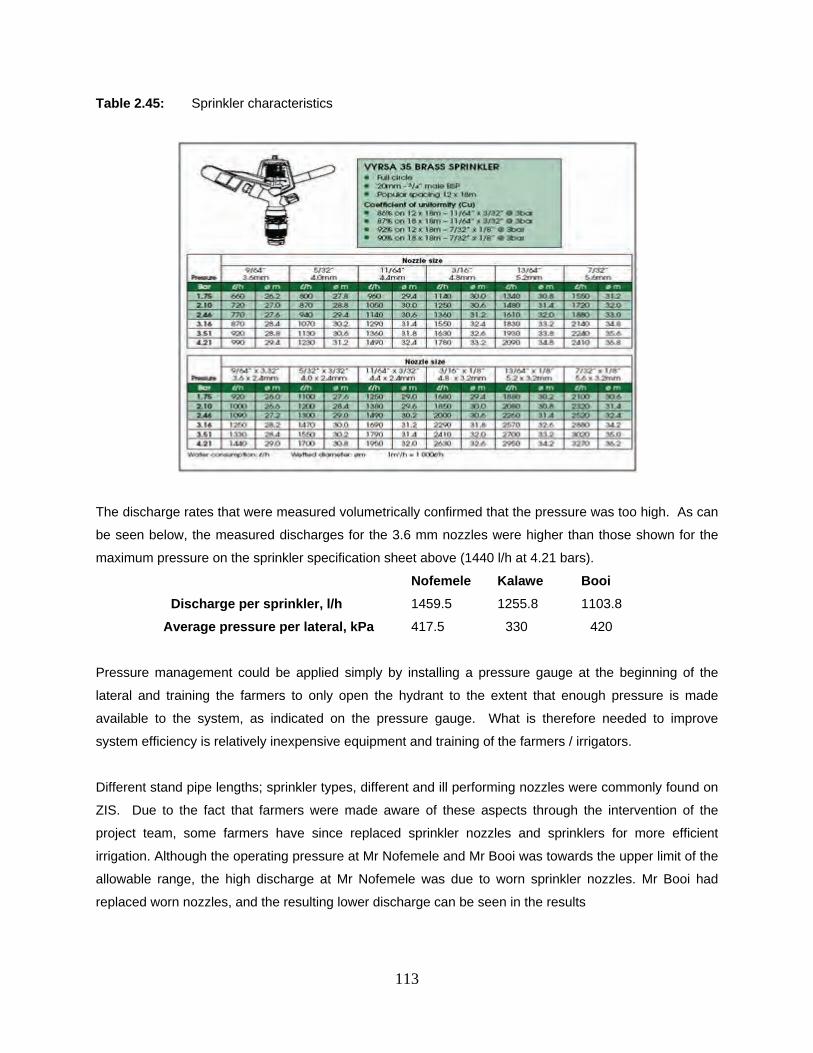
113
Table 2.45: Sprinkler characteristics
The discharge rates that were measured volumetrically confirmed that the pressure was too high. As can
be seen below, the measured discharges for the 3.6 mm nozzles were higher than those shown for the
maximum pressure on the sprinkler specification sheet above (1440 l/h at 4.21 bars).
Nofemele Kalawe Booi
Discharge per sprinkler, l/h 1459.5 1255.8 1103.8
Average pressure per lateral, kPa 417.5 330 420
Pressure management could be applied simply by installing a pressure gauge at the beginning of the
lateral and training the farmers to only open the hydrant to the extent that enough pressure is made
available to the system, as indicated on the pressure gauge. What is therefore needed to improve
system efficiency is relatively inexpensive equipment and training of the farmers / irrigators.
Different stand pipe lengths; sprinkler types, different and ill performing nozzles were commonly found on
ZIS. Due to the fact that farmers were made aware of these aspects through the intervention of the
project team, some farmers have since replaced sprinkler nozzles and sprinklers for more efficient
irrigation. Although the operating pressure at Mr Nofemele and Mr Booi was towards the upper limit of the
allowable range, the high discharge at Mr Nofemele was due to worn sprinkler nozzles. Mr Booi had
replaced worn nozzles, and the resulting lower discharge can be seen in the results
114
Farmers identified the lack of adequate number of laterals for effective irrigation of their crops as a major
constraint for efficient crop production. This problem was one of the aspects that were addressed with the
new revitalisation plan adopted by the Department of Agriculture in the Eastern Cape for ZIS.
2.11.3 Irrigation scheduling in Zanyokwe
As noted in section 2.2.5, at the start of the project decision regarding when and what amounts of water
to apply at ZIS was based on farmers’ visual judgement on the moisture status of plants and soil. There
was therefore always the possibility that crops could be over or under irrigated. In fact in the situation
analysis (Monde et al., 2005) cases of over irrigation at the scheme were observed in some sections.
Proper irrigation management at ZIS is thus essential, as both over and under-irrigation result in reduced
crop quality and yield. Whereas the effects of under-irrigation are obvious, over-irrigation can be more
damaging in the long term (Maeko, 2003). Waterlogging, rising water table (which might be saline) and
non-point pollution of groundwater resources all result from incorrect amounts and/ or timing of water
application. Implementation of irrigation scheduling technologies could play a big role in improving water
use efficiency at farm level and reducing the production costs (Annandale, Benadė, Javonovic, Steyn,
and Du Sautoy (1999) in Stevens, Düvel, Steyn and Marobane 2005).
Koegelenberg et al. (2003) state that the main purpose of irrigation scheduling is to determine the
quantity of water required by a crop per cycle during peak demand periods and how often it is to be
applied, taking practical operating practices into consideration. However, Leib, Hottendorf, Elliot, and
Matthews (2002) as cited by Stevens et al., (2005) state that despite the importance of irrigation
scheduling and the large amount of research devoted to it, the adoption of more objective irrigation
scheduling methods have been below expectations.
Shearer and Vomocil (1981) as cited by Stevens et al. (2005) indicated that behavioural patterns and
attitudes of farmers, as well as the need for continuous technical support for farmers, are some of the
major constraints that prevent farmers from applying irrigation scheduling. Koegelenberg and Lategan
(1996) as cited by Maeko (2003) suggested that scheduling methods must be simplified to match the time
constraints, training level, and income potential of the farmers. It was against this background that the
project team decided to test wetting front detectors (WFD) as possible tools that farmers could use as
simple guide for scheduling irrigation at ZIS.
Wetting front detectors are used to monitor irrigation (too little or too much) and to assist in the
management of nutrients and salt, as well as detecting water logging (CSIRO, 2004). In this study
detectors were mainly used to monitor the irrigation practices of the farmer. The detectors help the
irrigator to visualize what is happening in the root zone when the soil is irrigated as they are buried in the
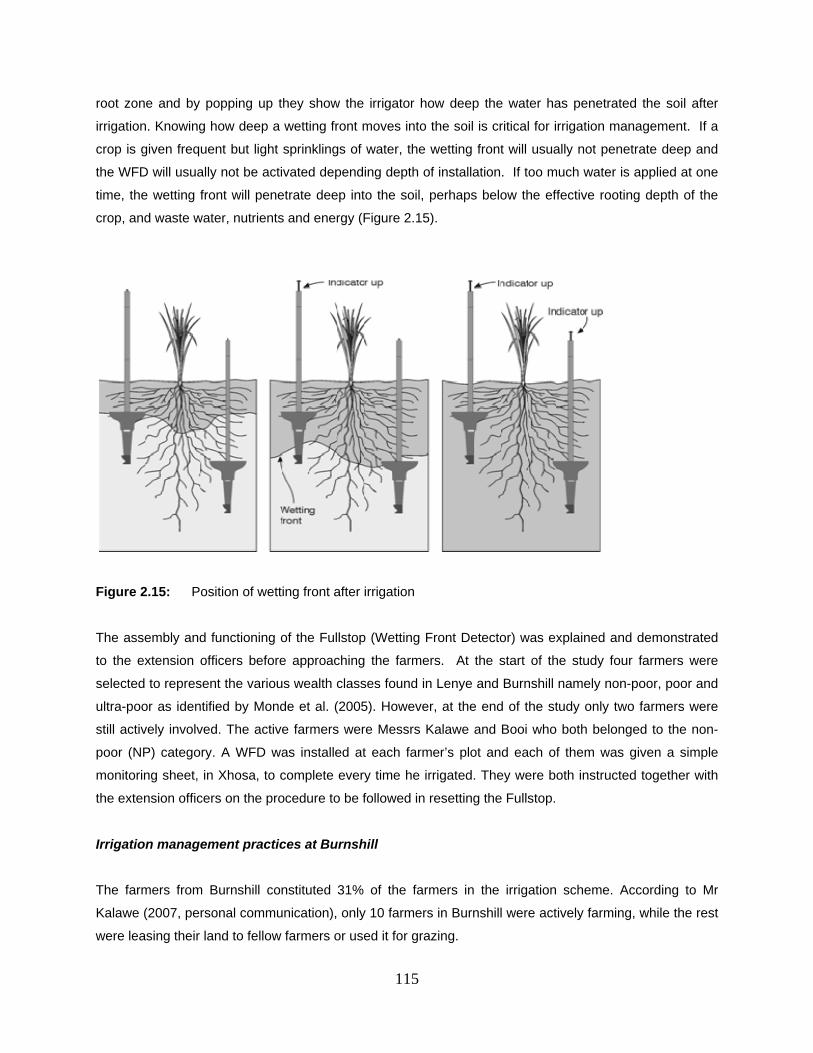
115
root zone and by popping up they show the irrigator how deep the water has penetrated the soil after
irrigation. Knowing how deep a wetting front moves into the soil is critical for irrigation management. If a
crop is given frequent but light sprinklings of water, the wetting front will usually not penetrate deep and
the WFD will usually not be activated depending depth of installation. If too much water is applied at one
time, the wetting front will penetrate deep into the soil, perhaps below the effective rooting depth of the
crop, and waste water, nutrients and energy (Figure 2.15).
Figure 2.15: Position of wetting front after irrigation
The assembly and functioning of the Fullstop (Wetting Front Detector) was explained and demonstrated
to the extension officers before approaching the farmers. At the start of the study four farmers were
selected to represent the various wealth classes found in Lenye and Burnshill namely non-poor, poor and
ultra-poor as identified by Monde et al. (2005). However, at the end of the study only two farmers were
still actively involved. The active farmers were Messrs Kalawe and Booi who both belonged to the non-
poor (NP) category. A WFD was installed at each farmer’s plot and each of them was given a simple
monitoring sheet, in Xhosa, to complete every time he irrigated. They were both instructed together with
the extension officers on the procedure to be followed in resetting the Fullstop.
Irrigation management practices at Burnshill
The farmers from Burnshill constituted 31% of the farmers in the irrigation scheme. According to Mr
Kalawe (2007, personal communication), only 10 farmers in Burnshill were actively farming, while the rest
were leasing their land to fellow farmers or used it for grazing.
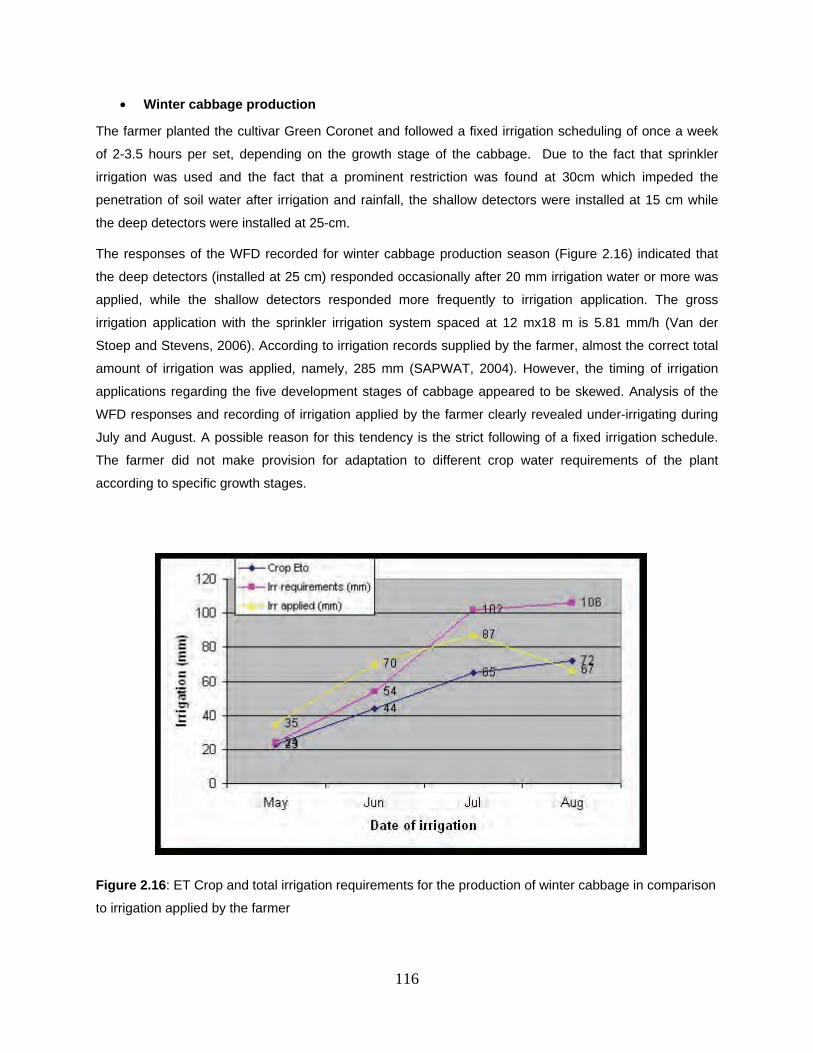
116
Winter cabbage production
The farmer planted the cultivar Green Coronet and followed a fixed irrigation scheduling of once a week
of 2-3.5 hours per set, depending on the growth stage of the cabbage. Due to the fact that sprinkler
irrigation was used and the fact that a prominent restriction was found at 30cm which impeded the
penetration of soil water after irrigation and rainfall, the shallow detectors were installed at 15 cm while
the deep detectors were installed at 25-cm.
The responses of the WFD recorded for winter cabbage production season (Figure 2.16) indicated that
the deep detectors (installed at 25 cm) responded occasionally after 20 mm irrigation water or more was
applied, while the shallow detectors responded more frequently to irrigation application. The gross
irrigation application with the sprinkler irrigation system spaced at 12 mx18 m is 5.81 mm/h (Van der
Stoep and Stevens, 2006). According to irrigation records supplied by the farmer, almost the correct total
amount of irrigation was applied, namely, 285 mm (SAPWAT, 2004). However, the timing of irrigation
applications regarding the five development stages of cabbage appeared to be skewed. Analysis of the
WFD responses and recording of irrigation applied by the farmer clearly revealed under-irrigating during
July and August. A possible reason for this tendency is the strict following of a fixed irrigation schedule.
The farmer did not make provision for adaptation to different crop water requirements of the plant
according to specific growth stages.
Figure 2.16: ET Crop and total irrigation requirements for the production of winter cabbage in comparison
to irrigation applied by the farmer
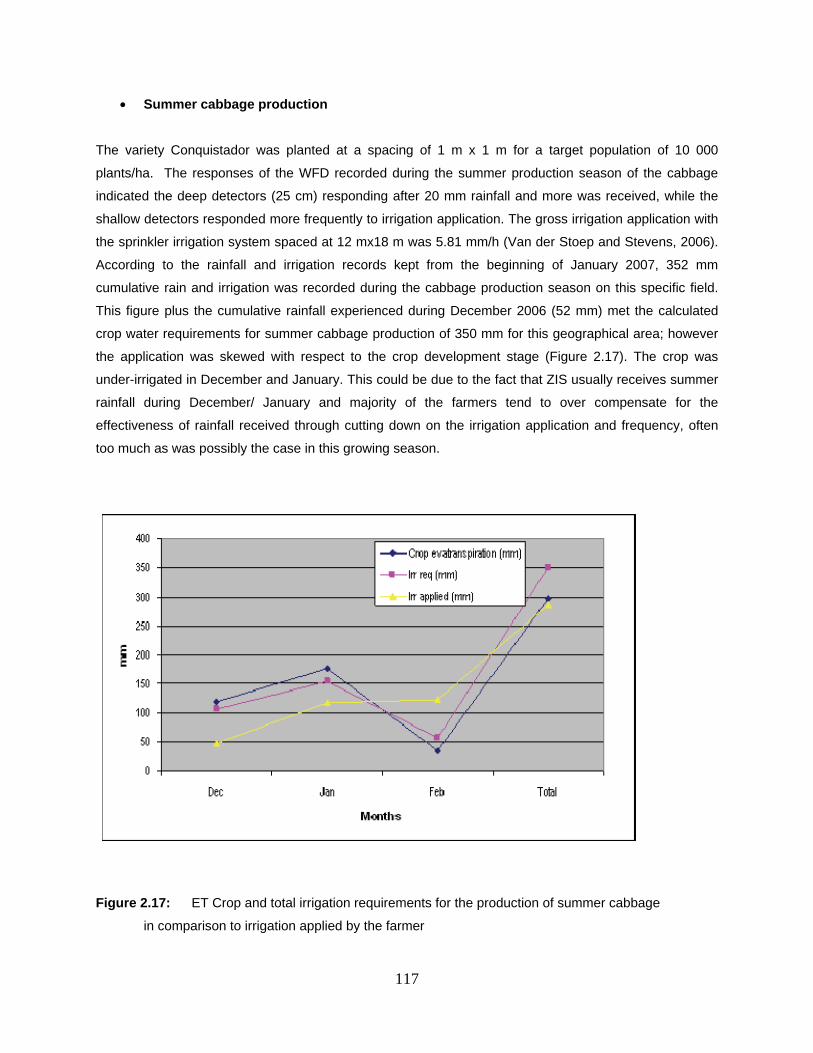
117
Summer cabbage production
The variety Conquistador was planted at a spacing of 1 m x 1 m for a target population of 10 000
plants/ha. The responses of the WFD recorded during the summer production season of the cabbage
indicated the deep detectors (25 cm) responding after 20 mm rainfall and more was received, while the
shallow detectors responded more frequently to irrigation application. The gross irrigation application with
the sprinkler irrigation system spaced at 12 mx18 m was 5.81 mm/h (Van der Stoep and Stevens, 2006).
According to the rainfall and irrigation records kept from the beginning of January 2007, 352 mm
cumulative rain and irrigation was recorded during the cabbage production season on this specific field.
This figure plus the cumulative rainfall experienced during December 2006 (52 mm) met the calculated
crop water requirements for summer cabbage production of 350 mm for this geographical area; however
the application was skewed with respect to the crop development stage (Figure 2.17). The crop was
under-irrigated in December and January. This could be due to the fact that ZIS usually receives summer
rainfall during December/ January and majority of the farmers tend to over compensate for the
effectiveness of rainfall received through cutting down on the irrigation application and frequency, often
too much as was possibly the case in this growing season.
Figure 2.17: ET Crop and total irrigation requirements for the production of summer cabbage
in comparison to irrigation applied by the farmer
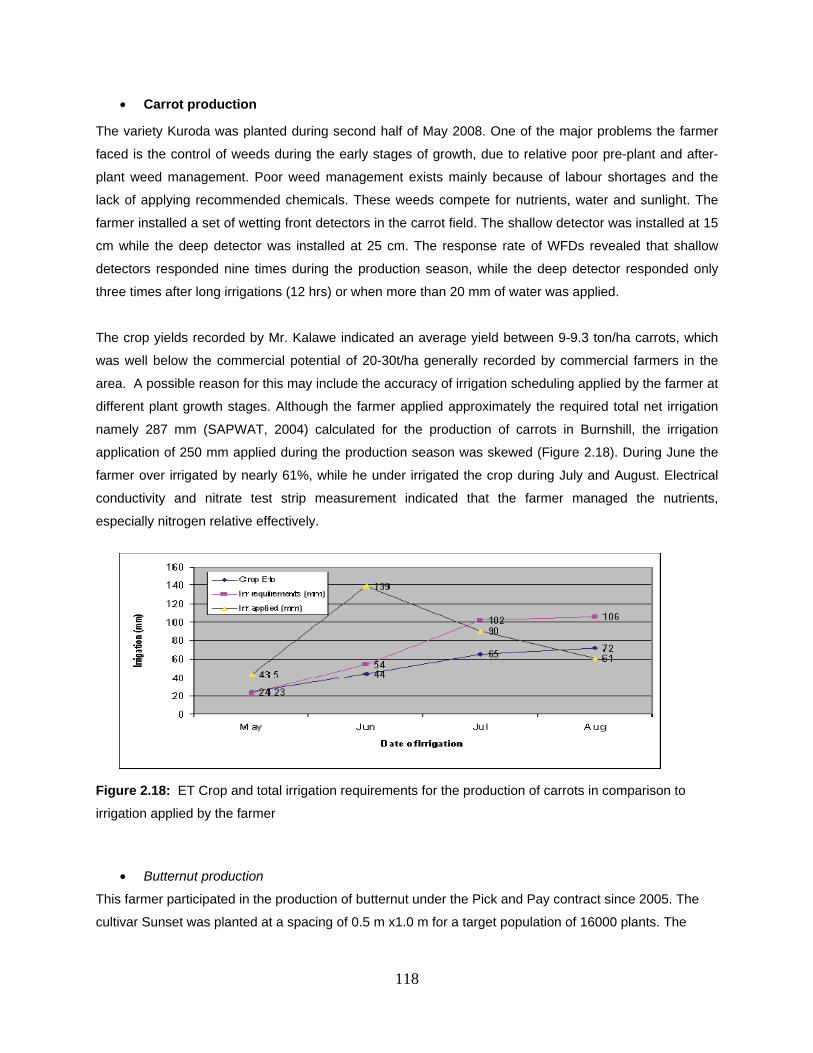
118
Carrot production
The variety Kuroda was planted during second half of May 2008. One of the major problems the farmer
faced is the control of weeds during the early stages of growth, due to relative poor pre-plant and after-
plant weed management. Poor weed management exists mainly because of labour shortages and the
lack of applying recommended chemicals. These weeds compete for nutrients, water and sunlight. The
farmer installed a set of wetting front detectors in the carrot field. The shallow detector was installed at 15
cm while the deep detector was installed at 25 cm. The response rate of WFDs revealed that shallow
detectors responded nine times during the production season, while the deep detector responded only
three times after long irrigations (12 hrs) or when more than 20 mm of water was applied.
The crop yields recorded by Mr. Kalawe indicated an average yield between 9-9.3 ton/ha carrots, which
was well below the commercial potential of 20-30t/ha generally recorded by commercial farmers in the
area. A possible reason for this may include the accuracy of irrigation scheduling applied by the farmer at
different plant growth stages. Although the farmer applied approximately the required total net irrigation
namely 287 mm (SAPWAT, 2004) calculated for the production of carrots in Burnshill, the irrigation
application of 250 mm applied during the production season was skewed (Figure 2.18). During June the
farmer over irrigated by nearly 61%, while he under irrigated the crop during July and August. Electrical
conductivity and nitrate test strip measurement indicated that the farmer managed the nutrients,
especially nitrogen relative effectively.
Figure 2.18: ET Crop and total irrigation requirements for the production of carrots in comparison to
irrigation applied by the farmer
Butternut production
This farmer participated in the production of butternut under the Pick and Pay contract since 2005. The
cultivar Sunset was planted at a spacing of 0.5 m x1.0 m for a target population of 16000 plants. The
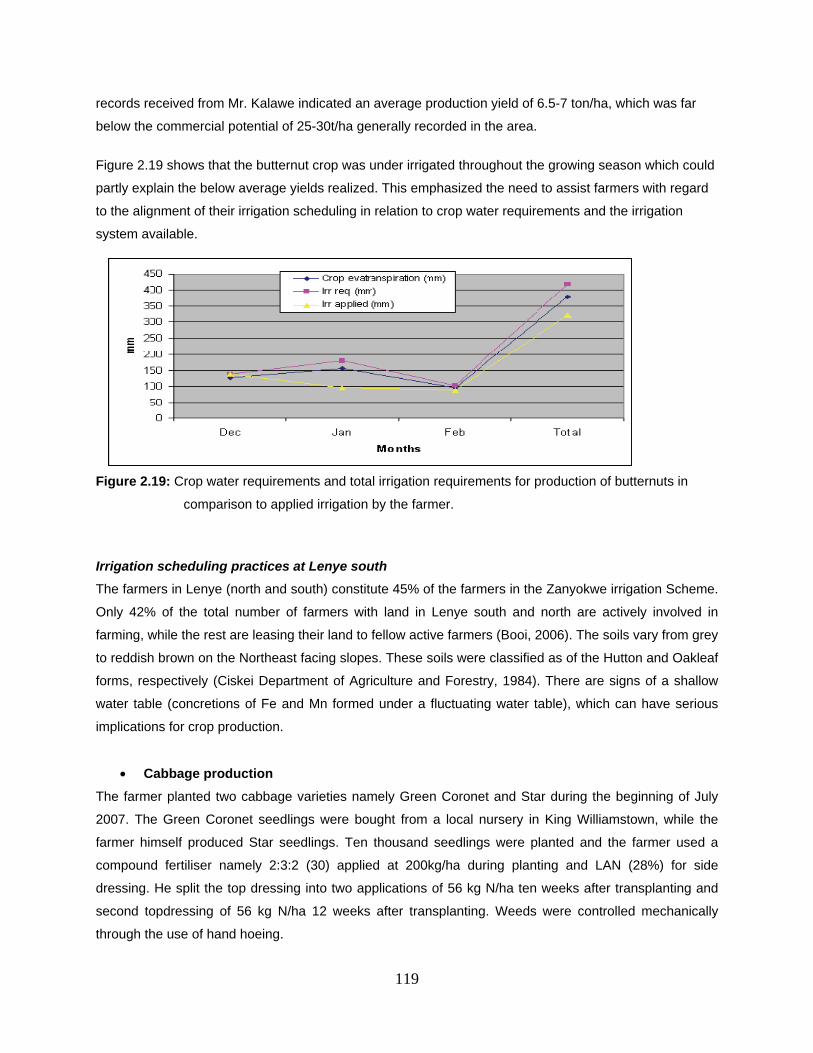
119
records received from Mr. Kalawe indicated an average production yield of 6.5-7 ton/ha, which was far
below the commercial potential of 25-30t/ha generally recorded in the area.
Figure 2.19 shows that the butternut crop was under irrigated throughout the growing season which could
partly explain the below average yields realized. This emphasized the need to assist farmers with regard
to the alignment of their irrigation scheduling in relation to crop water requirements and the irrigation
system available.
Figure 2.19: Crop water requirements and total irrigation requirements for production of butternuts in
comparison to applied irrigation by the farmer.
Irrigation scheduling practices at Lenye south
The farmers in Lenye (north and south) constitute 45% of the farmers in the Zanyokwe irrigation Scheme.
Only 42% of the total number of farmers with land in Lenye south and north are actively involved in
farming, while the rest are leasing their land to fellow active farmers (Booi, 2006). The soils vary from grey
to reddish brown on the Northeast facing slopes. These soils were classified as of the Hutton and Oakleaf
forms, respectively (Ciskei Department of Agriculture and Forestry, 1984). There are signs of a shallow
water table (concretions of Fe and Mn formed under a fluctuating water table), which can have serious
implications for crop production.
Cabbage production
The farmer planted two cabbage varieties namely Green Coronet and Star during the beginning of July
2007. The Green Coronet seedlings were bought from a local nursery in King Williamstown, while the
farmer himself produced Star seedlings. Ten thousand seedlings were planted and the farmer used a
compound fertiliser namely 2:3:2 (30) applied at 200kg/ha during planting and LAN (28%) for side
dressing. He split the top dressing into two applications of 56 kg N/ha ten weeks after transplanting and
second topdressing of 56 kg N/ha 12 weeks after transplanting. Weeds were controlled mechanically
through the use of hand hoeing.
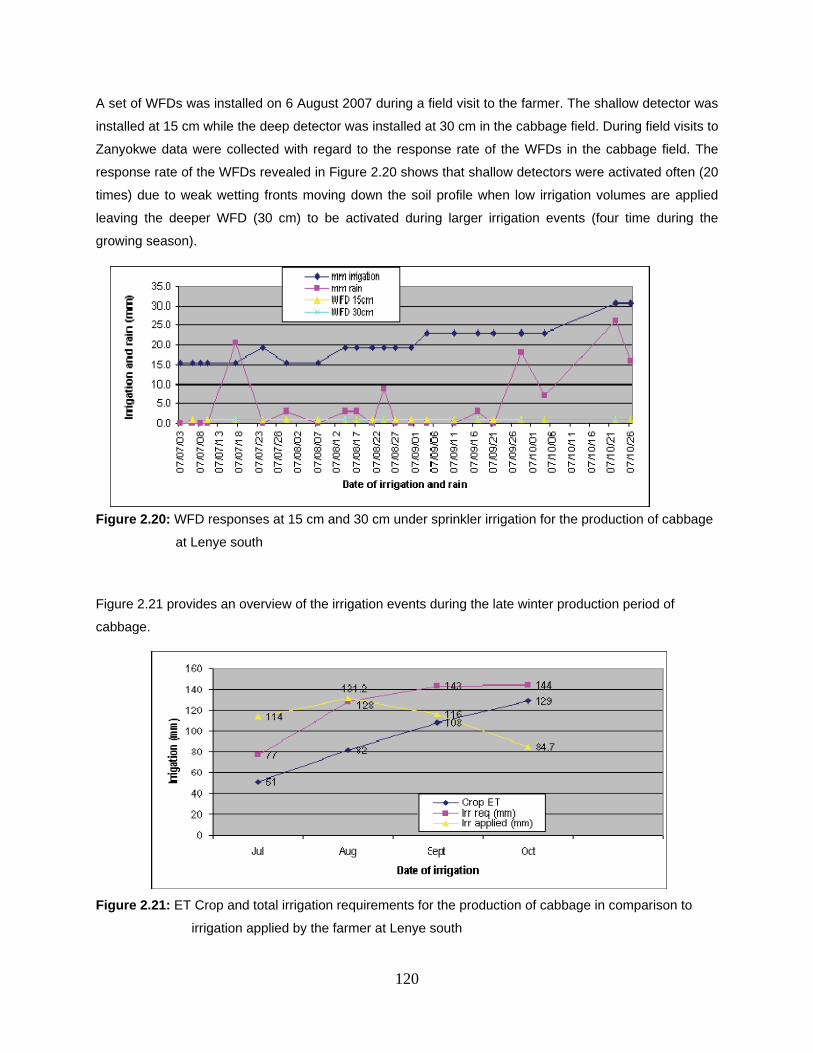
120
A set of WFDs was installed on 6 August 2007 during a field visit to the farmer. The shallow detector was
installed at 15 cm while the deep detector was installed at 30 cm in the cabbage field. During field visits to
Zanyokwe data were collected with regard to the response rate of the WFDs in the cabbage field. The
response rate of the WFDs revealed in Figure 2.20 shows that shallow detectors were activated often (20
times) due to weak wetting fronts moving down the soil profile when low irrigation volumes are applied
leaving the deeper WFD (30 cm) to be activated during larger irrigation events (four time during the
growing season).
Figure 2.20: WFD responses at 15 cm and 30 cm under sprinkler irrigation for the production of cabbage
at Lenye south
Figure 2.21 provides an overview of the irrigation events during the late winter production period of
cabbage.
Figure 2.21: ET Crop and total irrigation requirements for the production of cabbage in comparison to
irrigation applied by the farmer at Lenye south
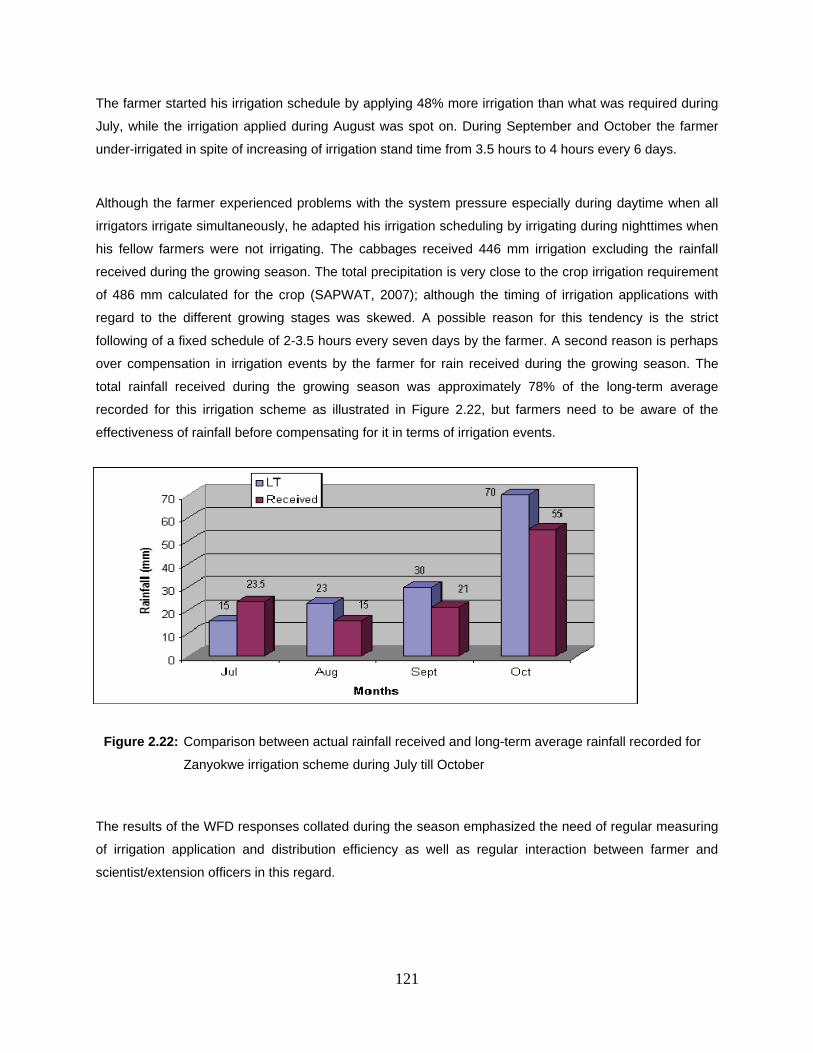
121
The farmer started his irrigation schedule by applying 48% more irrigation than what was required during
July, while the irrigation applied during August was spot on. During September and October the farmer
under-irrigated in spite of increasing of irrigation stand time from 3.5 hours to 4 hours every 6 days.
Although the farmer experienced problems with the system pressure especially during daytime when all
irrigators irrigate simultaneously, he adapted his irrigation scheduling by irrigating during nighttimes when
his fellow farmers were not irrigating. The cabbages received 446 mm irrigation excluding the rainfall
received during the growing season. The total precipitation is very close to the crop irrigation requirement
of 486 mm calculated for the crop (SAPWAT, 2007); although the timing of irrigation applications with
regard to the different growing stages was skewed. A possible reason for this tendency is the strict
following of a fixed schedule of 2-3.5 hours every seven days by the farmer. A second reason is perhaps
over compensation in irrigation events by the farmer for rain received during the growing season. The
total rainfall received during the growing season was approximately 78% of the long-term average
recorded for this irrigation scheme as illustrated in Figure 2.22, but farmers need to be aware of the
effectiveness of rainfall before compensating for it in terms of irrigation events.
Figure 2.22: Comparison between actual rainfall received and long-term average rainfall recorded for
Zanyokwe irrigation scheme during July till October
The results of the WFD responses collated during the season emphasized the need of regular measuring
of irrigation application and distribution efficiency as well as regular interaction between farmer and
scientist/extension officers in this regard.
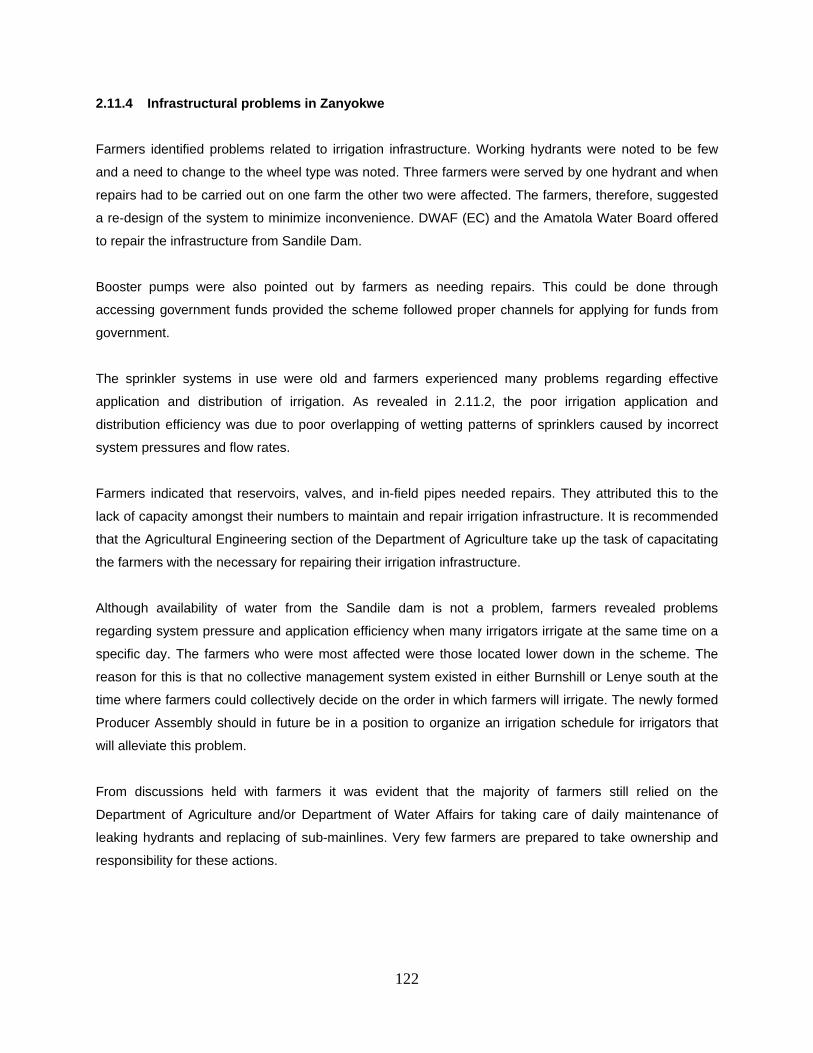
122
2.11.4 Infrastructural problems in Zanyokwe
Farmers identified problems related to irrigation infrastructure. Working hydrants were noted to be few
and a need to change to the wheel type was noted. Three farmers were served by one hydrant and when
repairs had to be carried out on one farm the other two were affected. The farmers, therefore, suggested
a re-design of the system to minimize inconvenience. DWAF (EC) and the Amatola Water Board offered
to repair the infrastructure from Sandile Dam.
Booster pumps were also pointed out by farmers as needing repairs. This could be done through
accessing government funds provided the scheme followed proper channels for applying for funds from
government.
The sprinkler systems in use were old and farmers experienced many problems regarding effective
application and distribution of irrigation. As revealed in 2.11.2, the poor irrigation application and
distribution efficiency was due to poor overlapping of wetting patterns of sprinklers caused by incorrect
system pressures and flow rates.
Farmers indicated that reservoirs, valves, and in-field pipes needed repairs. They attributed this to the
lack of capacity amongst their numbers to maintain and repair irrigation infrastructure. It is recommended
that the Agricultural Engineering section of the Department of Agriculture take up the task of capacitating
the farmers with the necessary for repairing their irrigation infrastructure.
Although availability of water from the Sandile dam is not a problem, farmers revealed problems
regarding system pressure and application efficiency when many irrigators irrigate at the same time on a
specific day. The farmers who were most affected were those located lower down in the scheme. The
reason for this is that no collective management system existed in either Burnshill or Lenye south at the
time where farmers could collectively decide on the order in which farmers will irrigate. The newly formed
Producer Assembly should in future be in a position to organize an irrigation schedule for irrigators that
will alleviate this problem.
From discussions held with farmers it was evident that the majority of farmers still relied on the
Department of Agriculture and/or Department of Water Affairs for taking care of daily maintenance of
leaking hydrants and replacing of sub-mainlines. Very few farmers are prepared to take ownership and
responsibility for these actions.
123
2.12. Project interventions and their impact at ZIS
2.12.1. Introduction
The main goal of this project was to introduce social economic interventions, management practices and
technologies that would improve agricultural productivity and livelihoods at ZIS. A situation analysis
conducted at the beginning of the project revealed four key constraints that needed attention in order to
achieve increased productivity at ZIS and TFIS. These were weak or poor institutional and organisational
arrangements, lack of stable markets, poor crop management and dysfunctional irrigation infrastructure.
Over a period of four years the project team focussed its attention on finding ways and means of
alleviating the four constraints. Interventions and technologies arrived at through a participatory process
were introduced or tested during 2006 and 2007 and are described in the previous sections. This chapter
describes the results of a survey conducted in 2007/2008 to determine the socio-economic impact of the
technologies and practices introduced by the BMP project in ZIS.
The main objectives of the study were to assess the impact of the BMP project on:
social status of the farmers
economic status of the farmers at, and
the socio-economic status of the surrounding communities
2.12.2. Methodology
Framework of analysis
The study made use of the socio-economic impact assessment (SEIA) framework developed by the
Common Wealth of Australia (2005). It is a tool that can be used to assess impacts of a wide range of
types of change, and consists of three phases, namely, scoping, profiling and assessing the impacts.
Methods of data collection
A socio-economic survey using a semi-structured questionnaire was used to collect data from farmers
who participated in the situation analysis conducted at the beginning of the project in 2005. The situation
analysis was carried amongst 68 farmers; however, only 47 of them could be interviewed in November
2007 when the impact was study conducted. The rest of the farmers had discontinued farming for a
variety of reasons by the time the project impact survey was carried out.
124
The goals and boundaries of the assessment were established by researchers together with the
beneficiaries during the scoping phase. Important activities undertaken during this phase included
identification of: (i) key impacts of interest, and (ii) groups who were impacted by the project.
During profiling stage, the researchers and project participants met to identify: (i) types of activities to be
undertaken, by whom and when, (ii) methods of contacting people, (iii) geographical location of groups
likely impacted by the project, and (iv) the proportion of the groups likely to be affected.
2.12.3 Impact of the BMP project on institutions and organisations at ZIS
According to Mjelde et al. (1990), institutional factors refer to policies of a local entity, region, state or
federal government. In the context of irrigation, institutions are laws and policies for operation and
maintenance of the irrigation system. This section of the report highlights the impact of the BMP in
strengthening organisations and institutions at ZIS. It should, however, be noted that some impacts on
organisations and institutions at ZIS were not influenced by the BMP project only. Some of these impacts
are a result of a combination of efforts from various stakeholders that have worked or are still working with
ZIS farmers. The main one among these is the Department of Agriculture in the Eastern Cape which is
spearheading the revitalization of the scheme.
Project impact on organisations and institutions at ZIS
Impact on organisations
The BMP project had a positive impact on organisations at Zanyokwe in that during the implementation of
the project three important farmer associations were formed or initiated. These are the Zanyokwe
Farmers’ Co-operative; village based primary cooperatives, and a water users association (WUA).
The Department of Agriculture played a major role in encouraging the farmers to form the co-operatives.
Four primary cooperatives were registered and two are at advanced stages of registration. Registered
cooperatives opened bank accounts, facilitating easier payment of proceeds from joint marketing
activities to members. As a result of their legal status, primary cooperatives can source funds for
members for productivity activities. However, none of the newly established cooperatives is yet to use its
legal status to negotiate any contracts on behalf of the membership.
The formation of a Water Users Association (WUA) facilitated by the Department of Water Affairs and
Forestry (DWAF) was still in progress when the impact survey was conducted. However, it already had
the impact of uniting irrigators and non-irrigators at Zanyokwe. The non-irrigators came mostly from
Zanyokwe village and their main expectation was that the WUA would facilitate the establishment of
irrigation infrastructure in their village which presently has none.
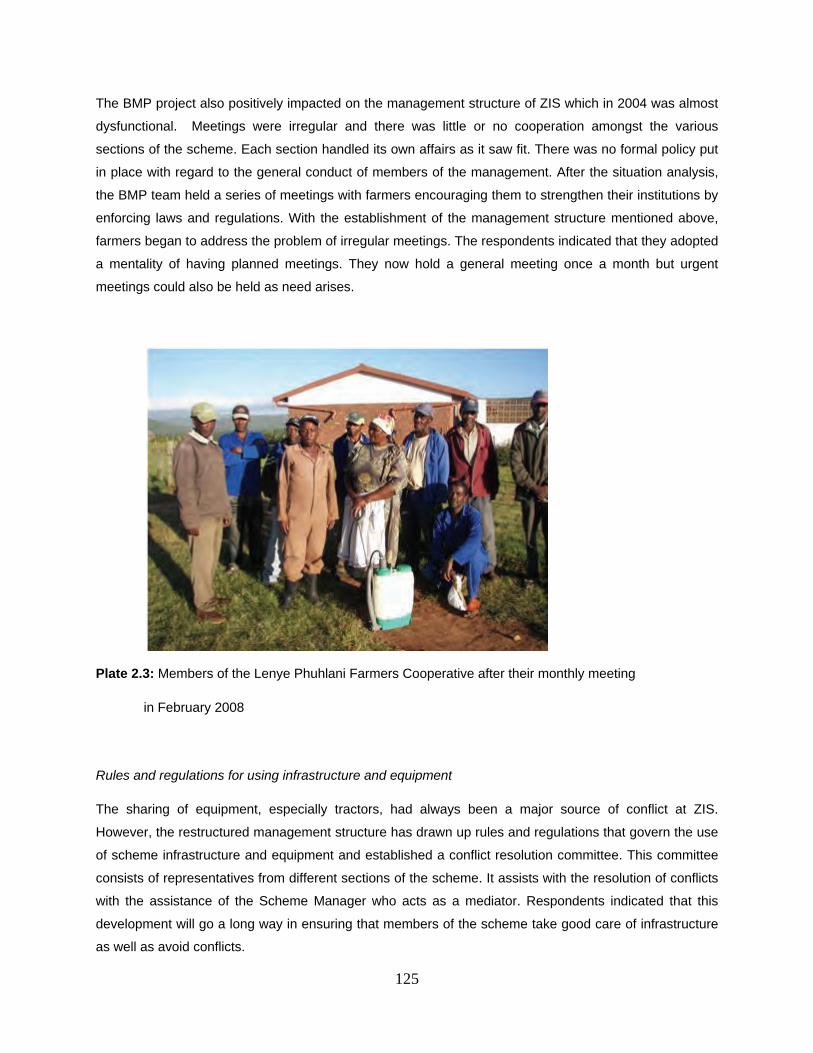
125
The BMP project also positively impacted on the management structure of ZIS which in 2004 was almost
dysfunctional. Meetings were irregular and there was little or no cooperation amongst the various
sections of the scheme. Each section handled its own affairs as it saw fit. There was no formal policy put
in place with regard to the general conduct of members of the management. After the situation analysis,
the BMP team held a series of meetings with farmers encouraging them to strengthen their institutions by
enforcing laws and regulations. With the establishment of the management structure mentioned above,
farmers began to address the problem of irregular meetings. The respondents indicated that they adopted
a mentality of having planned meetings. They now hold a general meeting once a month but urgent
meetings could also be held as need arises.
Plate 2.3: Members of the Lenye Phuhlani Farmers Cooperative after their monthly meeting
in February 2008
Rules and regulations for using infrastructure and equipment
The sharing of equipment, especially tractors, had always been a major source of conflict at ZIS.
However, the restructured management structure has drawn up rules and regulations that govern the use
of scheme infrastructure and equipment and established a conflict resolution committee. This committee
consists of representatives from different sections of the scheme. It assists with the resolution of conflicts
with the assistance of the Scheme Manager who acts as a mediator. Respondents indicated that this
development will go a long way in ensuring that members of the scheme take good care of infrastructure
as well as avoid conflicts.
126
Restructuring of the marketing system
During the situation analysis conducted in 2004, the marketing system was characterized by the lack of
collective action as well as informal contracts. The majority of farmers (67%) only used farm gate selling
as a marketing strategy and 33% took produce to buyers in neighbouring villages or urban markets.
Contract marketing was only with Pick ‘n Pay and had been used with mixed results. Achieving good
quality of butternut was a major problem for farmers contracted to Pick ‘n Pay. Various aspects of
marketing changed for the better with the implementation of the BMP. The project team made efforts to
link farmers with potential buyers. This was done by arranging visits to nearby markets with the intentions
of exposing the farmers to the formal marketing sector as well as initiating agreements between them and
buyers of products. During these visits, farmers learned how to grade and pack products. They were also
introduced to different crops sold at the market, and how they were selling. Farmers were equipped with
market information including times of the year when different products fetch higher prices at the market.
They were also introduced to different marketing agents who gave them information about the kinds of
products and quantities they need, as well packaging. As a result of this exposure, farmers’ marketing
skills have improved, especially in the marketing of butternuts. The grading of butternuts takes place at
Zanyokwe, and the packaging has improved considerably.
The performance of these marketing functions by farmers had a positive impact on the incomes realized
from the sale of butternuts. In 2007, a 10kg bag was sold at an average price of R15.00/bag compared to
only R12.00 in 2006. The change in prices was brought about mainly by performing extra marketing
functions, in effort to meet Pick’ n Pay requirements as well as perfect timing of production. The main
marketing outlet for butternuts is the Port Elizabeth Pick’ n Pay but farmers have negotiated to supply the
East London Pick’n Pay as well. The relationship between farmers and Pick’n Pay has improved.
The cropping pattern adopted has responded to the demands of the market. Initially, the Massive Food
Programme focused on maize but shifted to butternut because of farmer interest in profitability. There has
been an increase in production of green maize and interest to learn improved husbandry to improve
profits.
Rules and regulations for accessing land
The institutions that govern the use of land are still very weak with no improvement at all in the way
people access land at ZIS. The problems of land tenure, short lease periods, and expensive rentals still
prevent people from cultivating more land. The landless still access land through complicated
negotiations with landowners. The issue had been referred to the Department of Land Affairs but there
was still no solution at the time of the impact assessment.
127
Institutional arrangements for managing water
For irrigation to be viable socially, economically as well as environmentally, institutions must evolve to be
compatible with concepts of sustainability. The findings of this study at Zanyokwe revealed that such
institutions were still very weak. There was still a lot of dependency on government especially when it
comes to repairing irrigation infrastructure. The formation of a WUA that was initiated with encouragement
of the BMP project is a positive development at ZIS that will ensure that, when fully operational, people
use water wisely and the infrastructure is maintained.
Institutions for maintaining and operation of irrigation infrastructure
The Zanyokwe scheme infrastructure deteriorated due to lack of maintenance. In 2004, farmers revealed
that about 100ha of land had been taken out of production due to leakages of underground pipes that
affected all sections of the scheme. The situation gradually improved for the better as the Department of
Agriculture worked with the project team to revitalize the scheme. The Department of Agriculture in turn
started to mobilize resources to address some of the infrastructural problems at the scheme. The project
team in collaboration with farmers carried out an audit of the scheme to assess issues of operation and
maintenance as shown in Table 2.46. If the recommendations made are implemented irrigation efficiency
should be improved considerably. Since the mobilized resources were not sufficient to fully rehabilitate
the scheme farmers led by their restructured management explored other avenues. They managed to
source funding from the National Development Agency to purchase office furniture and farm machinery to
improve tillage and cultivation services.
Farmers received some training on how to operate and repair irrigation infrastructure but they still play a
very limited role in the maintenance of irrigation infrastructure. They cited absence of a workshop at the
scheme as a constraint in repairing irrigation infrastructure. There was also no readily available stock of
spares at the scheme and these have to be ordered from East London, which usually takes weeks or
months before they arrive. It also means that they had to hire transport to fetch the spares.
2.12.4. Project impact on quality of extension services
At the time of impact assessment, access to extension services by irrigators had not yet improved. In fact,
as farmers put it was worse than before. At the start of the project there were two extension officers
attached to the scheme. However, visits by extension officers were few and irregular. At the time of
impact assessment farmers at ZIS no longer had their own extension officers because the department of
agriculture introduced the ward system whereby ZIS together with a number of other villages form ward
10 and served by two extension officers. Lack of transport for extension officers continued to be the main
128
reason preventing extension officers from interacting more often with farmers. Farmers mentioned that
they met extension officers during meetings only and when they needed products for agricultural shows.
Extension services have therefore not yet impacted on neither production practices nor marketing of
products at ZIS. A Scheme Manager has, however, been appointed by the Department of Agriculture so it
is hoped that this will impact positively on extension services at ZIS. At least during the duration of the
project, farmers benefitted from extension advice on agronomic practices given by the project team. This
led to the adoption of a number of newly introduced practices whose impact at the scheme is documented
in subsequent sections of this report.
2.12.5. Technologies and practices introduced at ZIS
Table 2.47 shows the technologies and practices introduced in ZIS from 2005 to 2008 as well as the
proportion of farmers who adopted them. Most farmers adhered to correct cropping calendars and time of
planting, and also made use of certified seeds, as well as correct rates of fertilisers and herbicides.
Integrated pest management was a practice adopted by the majority (93.6%) of farmers. More than half of
respondents indicated improvement in land use intensity (Table 2.47). An improvement was noticed in the
management of water reflected by the fact that about 92% of farmers mentioned that they irrigated at the
right times since the introduction of the BMP project. Before the project, most farmers used to irrigate at
any time of the day, even when it was too hot. The BMP team discouraged this practice and the farmers
adopted the habit of irrigating in the mornings and afternoons.
However, the majority of these farmers did not have access to wetting front detectors (Table 2.47). Those
who made use of these devices said they were useful and enabled them to conserve water. Those who
did not have the wetting front detectors also wanted them but said they could not afford to buy them.
Probably they were not willing to buy the devices as the few who were in possession of these did not buy
them too. The devices were samples that were used to show the farmers during demonstrations, which
were given to the owners of the farms where demonstrations took place. The rest of the farmers were
advised to buy the devices.
A change was noticed in the area of marketing. About 83% of farmers adopted collective action marketing
strategy. This was a major change compared to only less than 20% during the situation analysis in 2004.
About 68% of respondents mentioned that they benefited from marketing exposure as the BMP team took
them to various markets in the Province. However, the farmers have not made much progress in the
drafting of formal contracts and introduction of new crops or crops that have a demand.
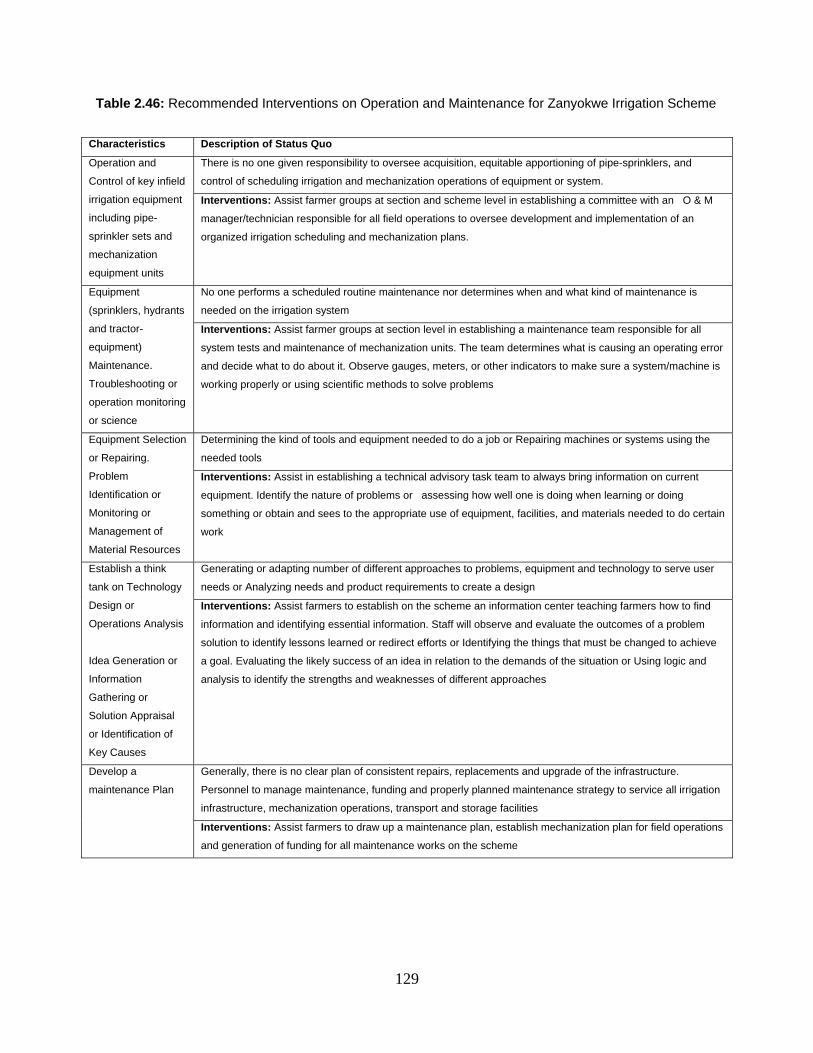
129
Table 2.46: Recommended Interventions on Operation and Maintenance for Zanyokwe Irrigation Scheme
Characteristics Description of Status Quo
Operation and
Control of key infield
irrigation equipment
including pipe-
sprinkler sets and
mechanization
equipment units
There is no one given responsibility to oversee acquisition, equitable apportioning of pipe-sprinklers, and
control of scheduling irrigation and mechanization operations of equipment or system.
Interventions: Assist farmer groups at section and scheme level in establishing a committee with an O & M
manager/technician responsible for all field operations to oversee development and implementation of an
organized irrigation scheduling and mechanization plans.
Equipment
(sprinklers, hydrants
and tractor-
equipment)
Maintenance.
Troubleshooting or
operation monitoring
or science
No one performs a scheduled routine maintenance nor determines when and what kind of maintenance is
needed on the irrigation system
Interventions: Assist farmer groups at section level in establishing a maintenance team responsible for all
system tests and maintenance of mechanization units. The team determines what is causing an operating error
and decide what to do about it. Observe gauges, meters, or other indicators to make sure a system/machine is
working properly or using scientific methods to solve problems
Equipment Selection
or Repairing.
Problem
Identification or
Monitoring or
Management of
Material Resources
Determining the kind of tools and equipment needed to do a job or Repairing machines or systems using the
needed tools
Interventions: Assist in establishing a technical advisory task team to always bring information on current
equipment. Identify the nature of problems or assessing how well one is doing when learning or doing
something or obtain and sees to the appropriate use of equipment, facilities, and materials needed to do certain
work
Establish a think
tank on Technology
Design or
Operations Analysis
Idea Generation or
Information
Gathering or
Solution Appraisal
or Identification of
Key Causes
Generating or adapting number of different approaches to problems, equipment and technology to serve user
needs or Analyzing needs and product requirements to create a design
Interventions: Assist farmers to establish on the scheme an information center teaching farmers how to find
information and identifying essential information. Staff will observe and evaluate the outcomes of a problem
solution to identify lessons learned or redirect efforts or Identifying the things that must be changed to achieve
a goal. Evaluating the likely success of an idea in relation to the demands of the situation or Using logic and
analysis to identify the strengths and weaknesses of different approaches
Develop a
maintenance Plan
Generally, there is no clear plan of consistent repairs, replacements and upgrade of the infrastructure.
Personnel to manage maintenance, funding and properly planned maintenance strategy to service all irrigation
infrastructure, mechanization operations, transport and storage facilities
Interventions: Assist farmers to draw up a maintenance plan, establish mechanization plan for field operations
and generation of funding for all maintenance works on the scheme
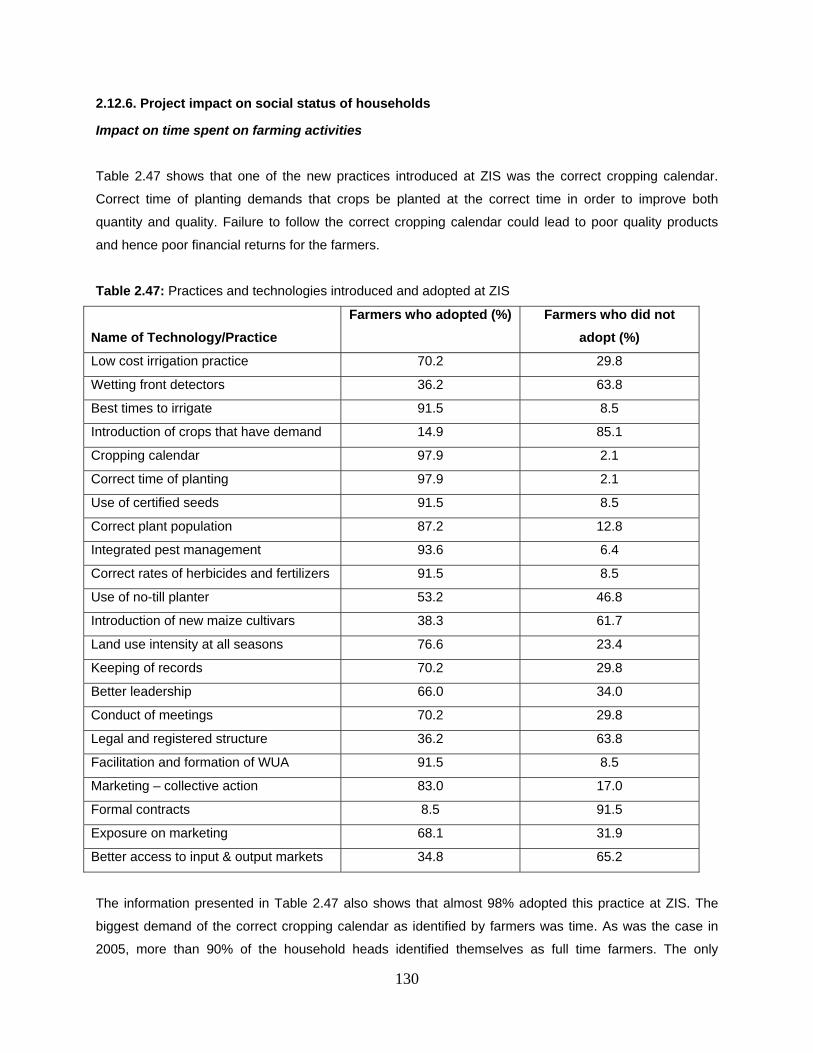
130
2.12.6. Project impact on social status of households
Impact on time spent on farming activities
Table 2.47 shows that one of the new practices introduced at ZIS was the correct cropping calendar.
Correct time of planting demands that crops be planted at the correct time in order to improve both
quantity and quality. Failure to follow the correct cropping calendar could lead to poor quality products
and hence poor financial returns for the farmers.
Table 2.47: Practices and technologies introduced and adopted at ZIS
Name of Technology/Practice
Farmers who adopted (%) Farmers who did not
adopt (%)
Low cost irrigation practice 70.2 29.8
Wetting front detectors 36.2 63.8
Best times to irrigate 91.5 8.5
Introduction of crops that have demand 14.9 85.1
Cropping calendar 97.9 2.1
Correct time of planting 97.9 2.1
Use of certified seeds 91.5 8.5
Correct plant population 87.2 12.8
Integrated pest management 93.6 6.4
Correct rates of herbicides and fertilizers 91.5 8.5
Use of no-till planter 53.2 46.8
Introduction of new maize cultivars 38.3 61.7
Land use intensity at all seasons 76.6 23.4
Keeping of records 70.2 29.8
Better leadership 66.0 34.0
Conduct of meetings 70.2 29.8
Legal and registered structure 36.2 63.8
Facilitation and formation of WUA 91.5 8.5
Marketing – collective action 83.0 17.0
Formal contracts 8.5 91.5
Exposure on marketing 68.1 31.9
Better access to input & output markets 34.8 65.2
The information presented in Table 2.47 also shows that almost 98% adopted this practice at ZIS. The
biggest demand of the correct cropping calendar as identified by farmers was time. As was the case in
2005, more than 90% of the household heads identified themselves as full time farmers. The only
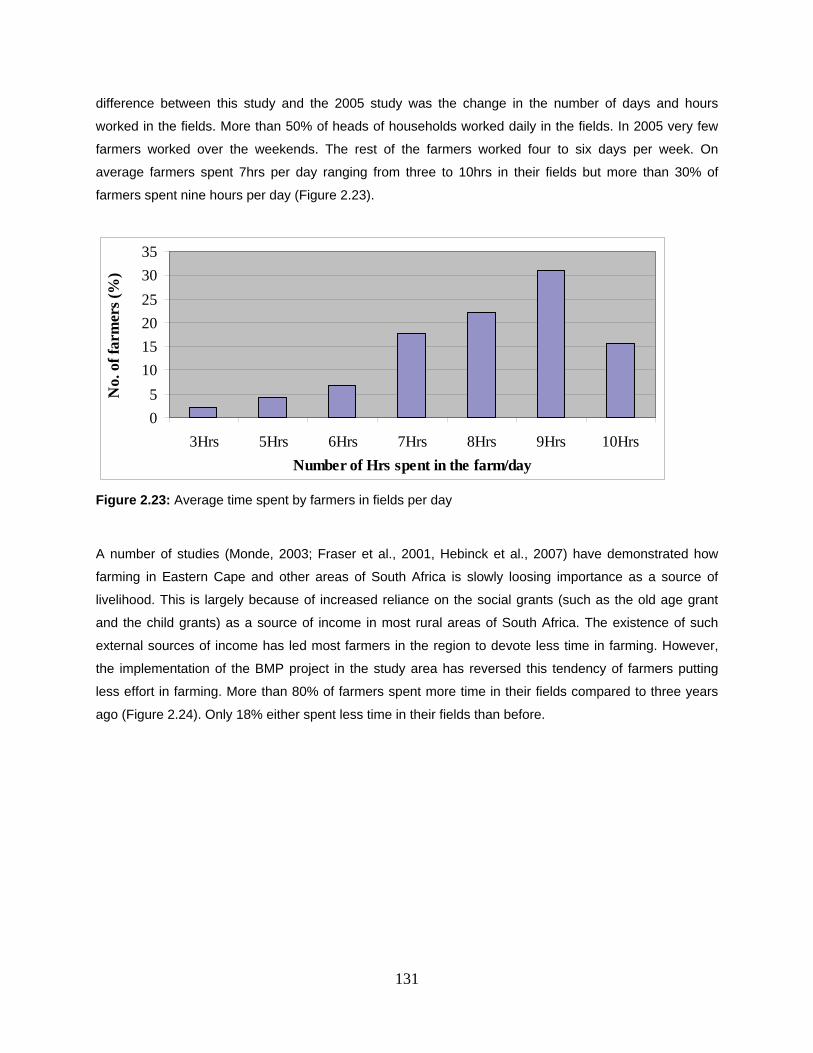
131
difference between this study and the 2005 study was the change in the number of days and hours
worked in the fields. More than 50% of heads of households worked daily in the fields. In 2005 very few
farmers worked over the weekends. The rest of the farmers worked four to six days per week. On
average farmers spent 7hrs per day ranging from three to 10hrs in their fields but more than 30% of
farmers spent nine hours per day (Figure 2.23).
Figure 2.23: Average time spent by farmers in fields per day
A number of studies (Monde, 2003; Fraser et al., 2001, Hebinck et al., 2007) have demonstrated how
farming in Eastern Cape and other areas of South Africa is slowly loosing importance as a source of
livelihood. This is largely because of increased reliance on the social grants (such as the old age grant
and the child grants) as a source of income in most rural areas of South Africa. The existence of such
external sources of income has led most farmers in the region to devote less time in farming. However,
the implementation of the BMP project in the study area has reversed this tendency of farmers putting
less effort in farming. More than 80% of farmers spent more time in their fields compared to three years
ago (Figure 2.24). Only 18% either spent less time in their fields than before.
0
5
10
15
20
25
30
35
3Hrs 5Hrs 6Hrs 7Hrs 8Hrs 9Hrs 10Hrs
Number of Hrs spent in the farm/day
No.
of
farm
ers
(%)
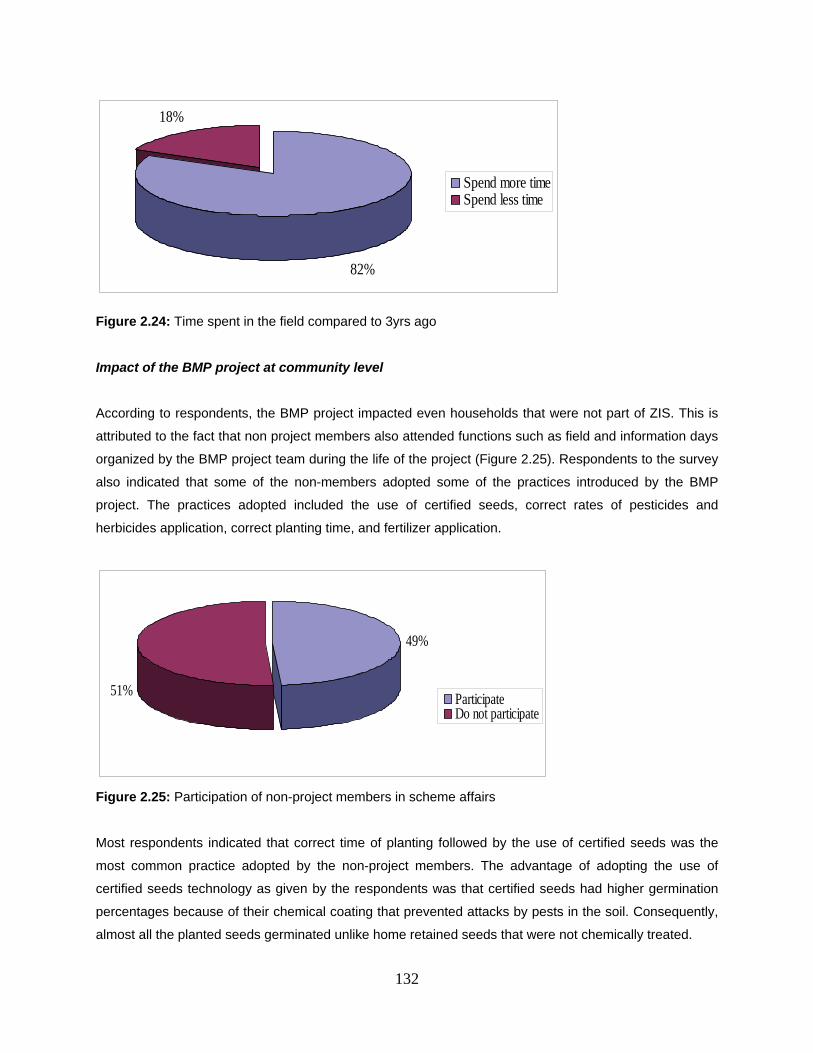
132
Figure 2.24: Time spent in the field compared to 3yrs ago
Impact of the BMP project at community level
According to respondents, the BMP project impacted even households that were not part of ZIS. This is
attributed to the fact that non project members also attended functions such as field and information days
organized by the BMP project team during the life of the project (Figure 2.25). Respondents to the survey
also indicated that some of the non-members adopted some of the practices introduced by the BMP
project. The practices adopted included the use of certified seeds, correct rates of pesticides and
herbicides application, correct planting time, and fertilizer application.
Figure 2.25: Participation of non-project members in scheme affairs
Most respondents indicated that correct time of planting followed by the use of certified seeds was the
most common practice adopted by the non-project members. The advantage of adopting the use of
certified seeds technology as given by the respondents was that certified seeds had higher germination
percentages because of their chemical coating that prevented attacks by pests in the soil. Consequently,
almost all the planted seeds germinated unlike home retained seeds that were not chemically treated.
82%
18%
Spend more timeSpend less time
49%
51%ParticipateDo not participate
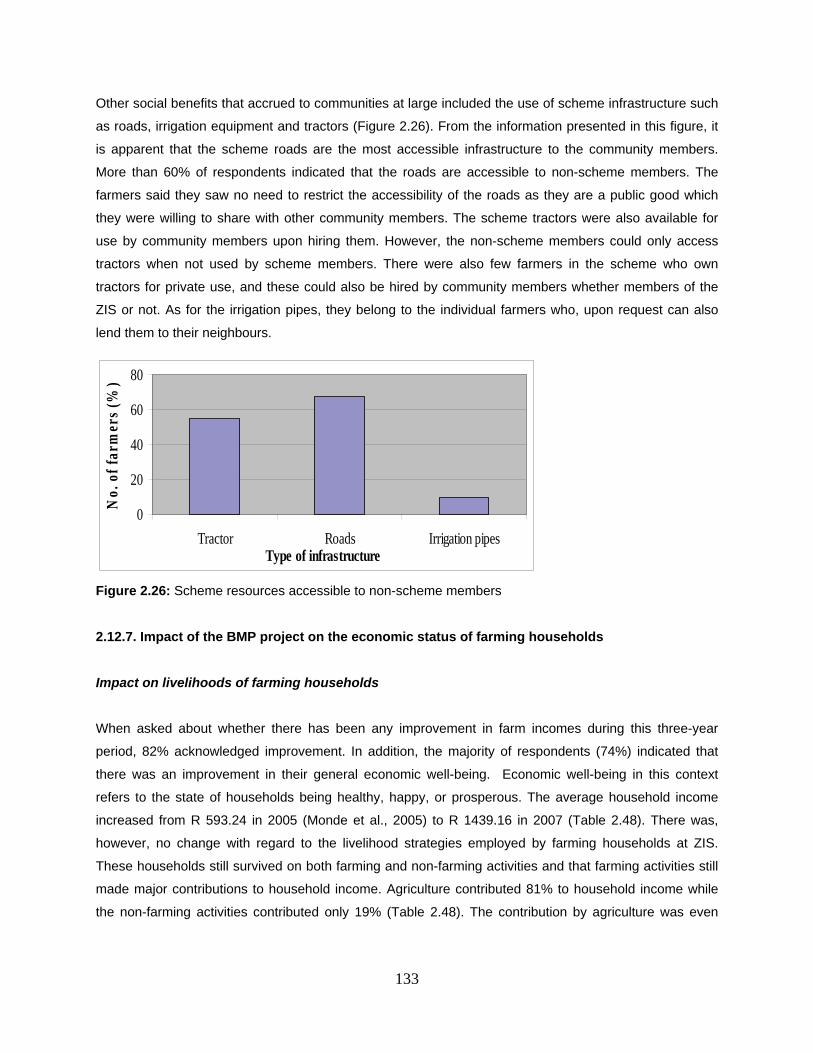
133
Other social benefits that accrued to communities at large included the use of scheme infrastructure such
as roads, irrigation equipment and tractors (Figure 2.26). From the information presented in this figure, it
is apparent that the scheme roads are the most accessible infrastructure to the community members.
More than 60% of respondents indicated that the roads are accessible to non-scheme members. The
farmers said they saw no need to restrict the accessibility of the roads as they are a public good which
they were willing to share with other community members. The scheme tractors were also available for
use by community members upon hiring them. However, the non-scheme members could only access
tractors when not used by scheme members. There were also few farmers in the scheme who own
tractors for private use, and these could also be hired by community members whether members of the
ZIS or not. As for the irrigation pipes, they belong to the individual farmers who, upon request can also
lend them to their neighbours.
Figure 2.26: Scheme resources accessible to non-scheme members
2.12.7. Impact of the BMP project on the economic status of farming households
Impact on livelihoods of farming households
When asked about whether there has been any improvement in farm incomes during this three-year
period, 82% acknowledged improvement. In addition, the majority of respondents (74%) indicated that
there was an improvement in their general economic well-being. Economic well-being in this context
refers to the state of households being healthy, happy, or prosperous. The average household income
increased from R 593.24 in 2005 (Monde et al., 2005) to R 1439.16 in 2007 (Table 2.48). There was,
however, no change with regard to the livelihood strategies employed by farming households at ZIS.
These households still survived on both farming and non-farming activities and that farming activities still
made major contributions to household income. Agriculture contributed 81% to household income while
the non-farming activities contributed only 19% (Table 2.48). The contribution by agriculture was even
0
20
40
60
80
Tractor Roads Irrigation pipesType of infrastructure
No.
of
farm
ers
(%)
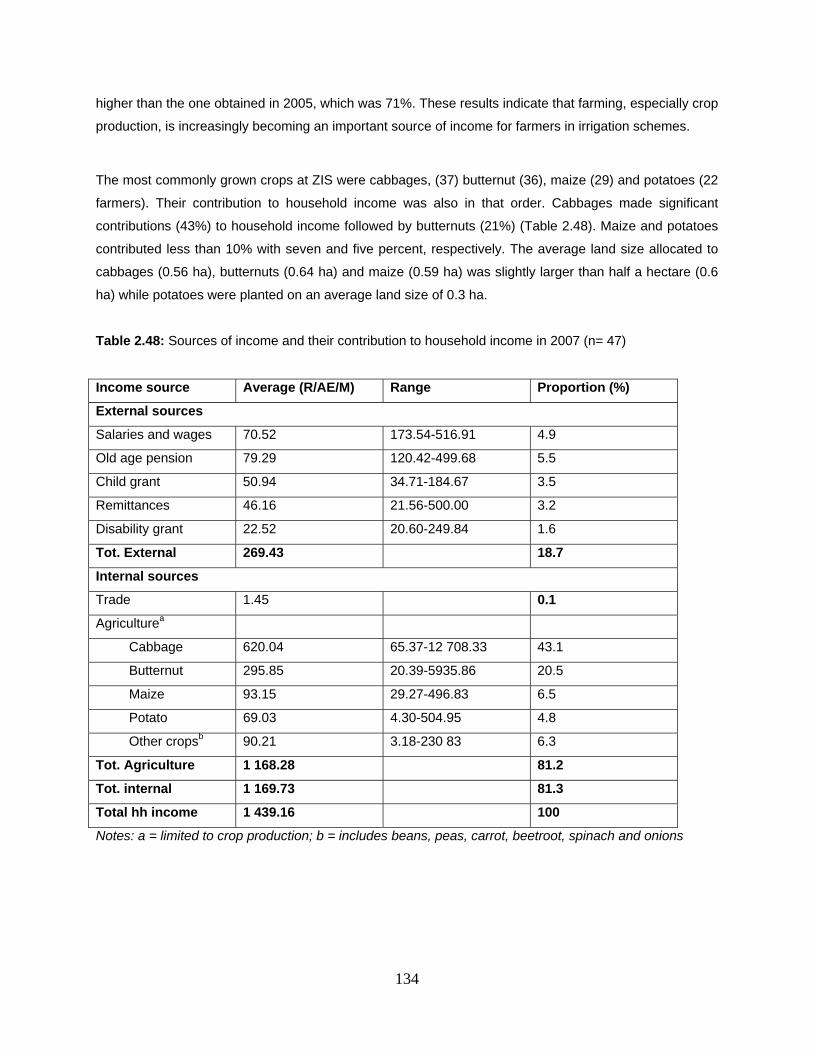
134
higher than the one obtained in 2005, which was 71%. These results indicate that farming, especially crop
production, is increasingly becoming an important source of income for farmers in irrigation schemes.
The most commonly grown crops at ZIS were cabbages, (37) butternut (36), maize (29) and potatoes (22
farmers). Their contribution to household income was also in that order. Cabbages made significant
contributions (43%) to household income followed by butternuts (21%) (Table 2.48). Maize and potatoes
contributed less than 10% with seven and five percent, respectively. The average land size allocated to
cabbages (0.56 ha), butternuts (0.64 ha) and maize (0.59 ha) was slightly larger than half a hectare (0.6
ha) while potatoes were planted on an average land size of 0.3 ha.
Table 2.48: Sources of income and their contribution to household income in 2007 (n= 47)
Income source Average (R/AE/M) Range Proportion (%)
External sources
Salaries and wages 70.52 173.54-516.91 4.9
Old age pension 79.29 120.42-499.68 5.5
Child grant 50.94 34.71-184.67 3.5
Remittances 46.16 21.56-500.00 3.2
Disability grant 22.52 20.60-249.84 1.6
Tot. External 269.43 18.7
Internal sources
Trade 1.45 0.1
Agriculturea
Cabbage 620.04 65.37-12 708.33 43.1
Butternut 295.85 20.39-5935.86 20.5
Maize 93.15 29.27-496.83 6.5
Potato 69.03 4.30-504.95 4.8
Other cropsb 90.21 3.18-230 83 6.3
Tot. Agriculture 1 168.28 81.2
Tot. internal 1 169.73 81.3
Total hh income 1 439.16 100
Notes: a = limited to crop production; b = includes beans, peas, carrot, beetroot, spinach and onions
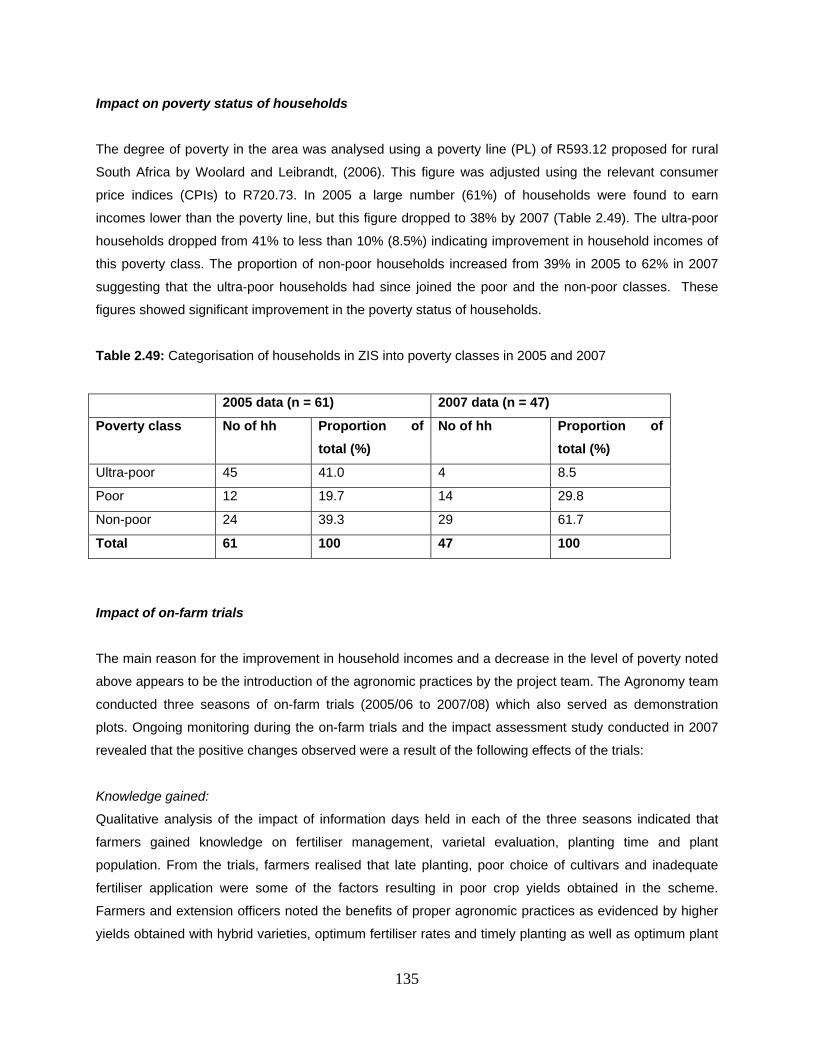
135
Impact on poverty status of households
The degree of poverty in the area was analysed using a poverty line (PL) of R593.12 proposed for rural
South Africa by Woolard and Leibrandt, (2006). This figure was adjusted using the relevant consumer
price indices (CPIs) to R720.73. In 2005 a large number (61%) of households were found to earn
incomes lower than the poverty line, but this figure dropped to 38% by 2007 (Table 2.49). The ultra-poor
households dropped from 41% to less than 10% (8.5%) indicating improvement in household incomes of
this poverty class. The proportion of non-poor households increased from 39% in 2005 to 62% in 2007
suggesting that the ultra-poor households had since joined the poor and the non-poor classes. These
figures showed significant improvement in the poverty status of households.
Table 2.49: Categorisation of households in ZIS into poverty classes in 2005 and 2007
2005 data (n = 61) 2007 data (n = 47)
Poverty class No of hh Proportion of
total (%)
No of hh Proportion of
total (%)
Ultra-poor 45 41.0 4 8.5
Poor 12 19.7 14 29.8
Non-poor 24 39.3 29 61.7
Total 61 100 47 100
Impact of on-farm trials
The main reason for the improvement in household incomes and a decrease in the level of poverty noted
above appears to be the introduction of the agronomic practices by the project team. The Agronomy team
conducted three seasons of on-farm trials (2005/06 to 2007/08) which also served as demonstration
plots. Ongoing monitoring during the on-farm trials and the impact assessment study conducted in 2007
revealed that the positive changes observed were a result of the following effects of the trials:
Knowledge gained:
Qualitative analysis of the impact of information days held in each of the three seasons indicated that
farmers gained knowledge on fertiliser management, varietal evaluation, planting time and plant
population. From the trials, farmers realised that late planting, poor choice of cultivars and inadequate
fertiliser application were some of the factors resulting in poor crop yields obtained in the scheme.
Farmers and extension officers noted the benefits of proper agronomic practices as evidenced by higher
yields obtained with hybrid varieties, optimum fertiliser rates and timely planting as well as optimum plant
136
populations. The feedback workshops at the end of each season on the findings of agronomic trials were
appreciated by farmers as they indicated better yields and higher returns with proper fertilisation, timely
planting and appropriate selection of cultivars and population densities for different varieties.
Adoption of maize hybrid varieties
The monitoring exercise on factors affecting crop production conducted during the 2005/06 summer
season revealed that open pollinated varieties Sahara and Kalahari were among the popular maize
varieties grown by farmers in the scheme. Exploratory trials were then designed to demonstrate the
superiority of hybrid varieties over OPVs under irrigated conditions. The superiority of the hybrids became
apparent and clear to the farmers during the information days held in 2006. The varietal evaluation trials
showed that the new hybrids such as DKC 61-25 could yield as high as 5 t/ha more grain yield as
compared to the OPVs. During the 2006/07 season it was noted that only one farmer still grew Sahara as
one of the grain maize varieties, while the rest of the farmers switched to hybrids, DKC 61-25 or Pannar
6480. In 2007/08 season it was noted that only three farmers still grew maize for purposes of grain and all
of them grew the variety DKC 61-25 adopted from the variety evaluation trials.
Improved maize planting time
The situation analysis conducted by Monde et al. (2005) as well as the monitoring exercise during the
2005/06 season revealed that late planting of maize was a common experience in the scheme. In that
season, the earliest planting was on the 18th December 2005 and the last on the 16th March 2006.
Reasons cited for the delay in planting included shortage of tractors and untimely supply of inputs. Trials
conducted to evaluate the effect of planting time on maize grain yield clearly demonstrated to the farmers
that this was one of the major cause of low yields obtained from maize in the scheme. There was a
remarkable improvement in timing of planting operations during the 2006/07 and 2007/08 seasons. In
both seasons all planting was completed by mid-December. Timely planting also meant that farmers were
able to prepare ahead and on time for the subsequent winter season as they could harvest their maize
earlier.
Improvement in plant population
One major problem that was observed during the 2005/06 monitoring study was the low plant stands in
maize and butternut. Maize stand increased from a mean of 23 000 in 2005/06 to a mean of 37 667 in
2007/08. During the 2005/06 butternut stands were well below 10 000 plants/ha due to the wider spacing
used, poor irrigation management and late weed control. One of the case study farmers expressed great
concern about the big size of fruits and decided to do experimentation on possible ways to reduce fruit
size while optimising on total yield. During the 2006/07 he reduced the in-row spacing from 0.7 m to 0.4 m
with great success. Fruit size was greatly reduced and he managed to sell most of his crop and had to
invest very little money to pay labour for grading.
137
Improved fertility management
The situation analysis conducted by Monde et al. (2005) revealed that poor management of fertilisers was
one of the factors contributing to the observed low yield in the scheme. In butternut, there was an
improvement in fertiliser management, with farmers applying an average of 69 kg N/ha in 2006/07
compared to 58kg N/ha in 2005/06.
Diversifying into green maize production
It was noted during the situation analysis and confirmed in the 2005/06 monitoring studies that maize
production in the scheme had been traditionally for purposes of grain. With the conduct of green maize
trials in the scheme it became apparent to farmers that this enterprise was more rewarding than grain
maize production. This saw an increase in green maize farmers from nearly zero to five during the
2006/07 season, and a further 100% increase to 10 during the 2007/08 summer season.
The traditional way of producing green maize in the scheme has been by use of direct seeding. However,
trials done in the scheme during the 2006/07 and 2007/08 seasons have indicated that seedlings can
offer superior performance if properly managed. Only one farmer adopted the strategy of using seedlings
in 2006/07 but was disappointed with the performance. The major cause of poor performance was the
inferior quality of the seedlings at transplanting, which was related to the source of seedlings. However
during the 2007/08 season, seven farmers offered to do trials (farmer-managed) on green maize,
comparing direct seeding and transplanting. All farmers preferred transplants which matured early and
required less fertiliser compared to direct seeding. The other advantage realised from seedlings was good
establishment compared to direct-seeded maize whose establishment was greatly affected by birds
feeding on emerging seedlings. While in 2006/07 some farmers used OPVs and others recycled hybrid
seed, all green maize famers in 2007/08 used hybrid maize variety SC 701 adopted from the varietal
evaluation trials.
Improved cropping intensity
The low cropping intensities observed at ZIS during the situation analysis Monde et al. (2005) were
mainly a result of very little farming carried out during winter. However, by the time of the impact study in
2007 an improvement in land use intensity was acknowledged by 67% of farmers surveyed as a direct
result of the BMP project (Figure 2.27). Almost half of the respondents indicated that they produced most
vegetables in both summer and winter cropping seasons. The majority (60.9%) of respondents revealed
that they produced cabbages in both seasons compared to only three percent (3%) in 2004 when
cabbages were treated like summer crops and grown in summer only. Similar changes were observed
with most other vegetables except peas, beans and butternut, which are either winter or summer crops.
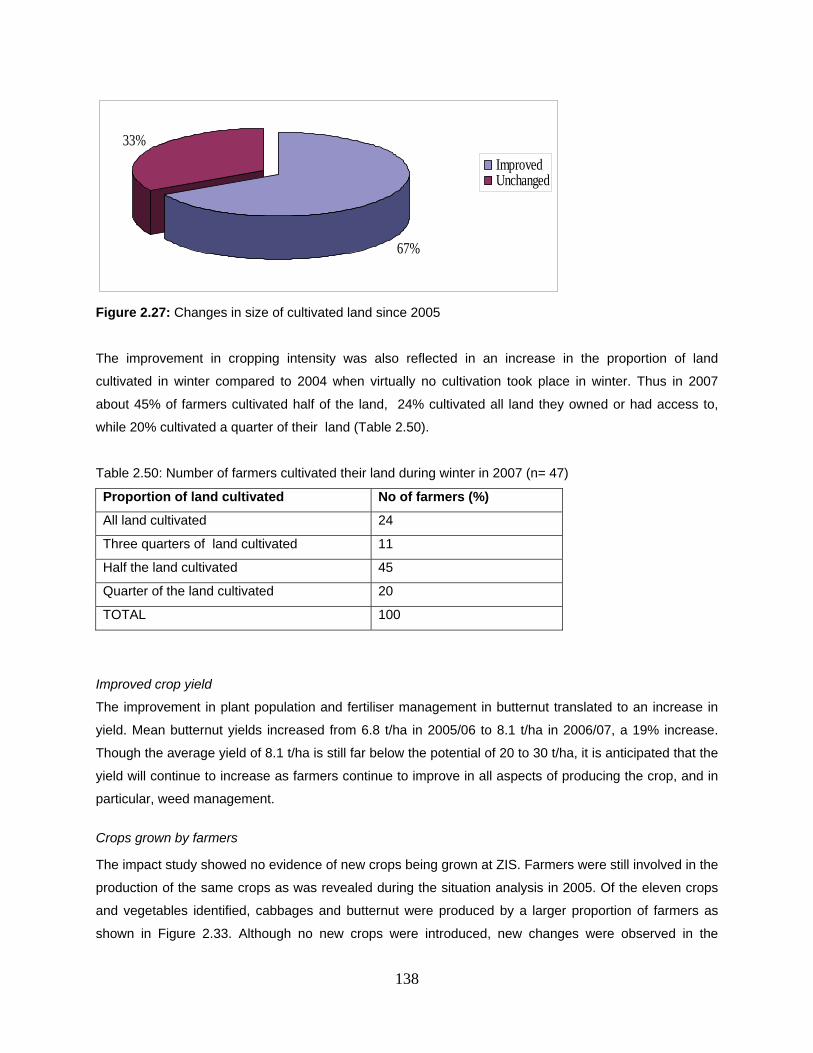
138
Figure 2.27: Changes in size of cultivated land since 2005
The improvement in cropping intensity was also reflected in an increase in the proportion of land
cultivated in winter compared to 2004 when virtually no cultivation took place in winter. Thus in 2007
about 45% of farmers cultivated half of the land, 24% cultivated all land they owned or had access to,
while 20% cultivated a quarter of their land (Table 2.50).
Table 2.50: Number of farmers cultivated their land during winter in 2007 (n= 47)
Proportion of land cultivated No of farmers (%)
All land cultivated 24
Three quarters of land cultivated 11
Half the land cultivated 45
Quarter of the land cultivated 20
TOTAL 100
Improved crop yield
The improvement in plant population and fertiliser management in butternut translated to an increase in
yield. Mean butternut yields increased from 6.8 t/ha in 2005/06 to 8.1 t/ha in 2006/07, a 19% increase.
Though the average yield of 8.1 t/ha is still far below the potential of 20 to 30 t/ha, it is anticipated that the
yield will continue to increase as farmers continue to improve in all aspects of producing the crop, and in
particular, weed management.
Crops grown by farmers
The impact study showed no evidence of new crops being grown at ZIS. Farmers were still involved in the
production of the same crops as was revealed during the situation analysis in 2005. Of the eleven crops
and vegetables identified, cabbages and butternut were produced by a larger proportion of farmers as
shown in Figure 2.33. Although no new crops were introduced, new changes were observed in the
67%
33%
ImprovedUnchanged
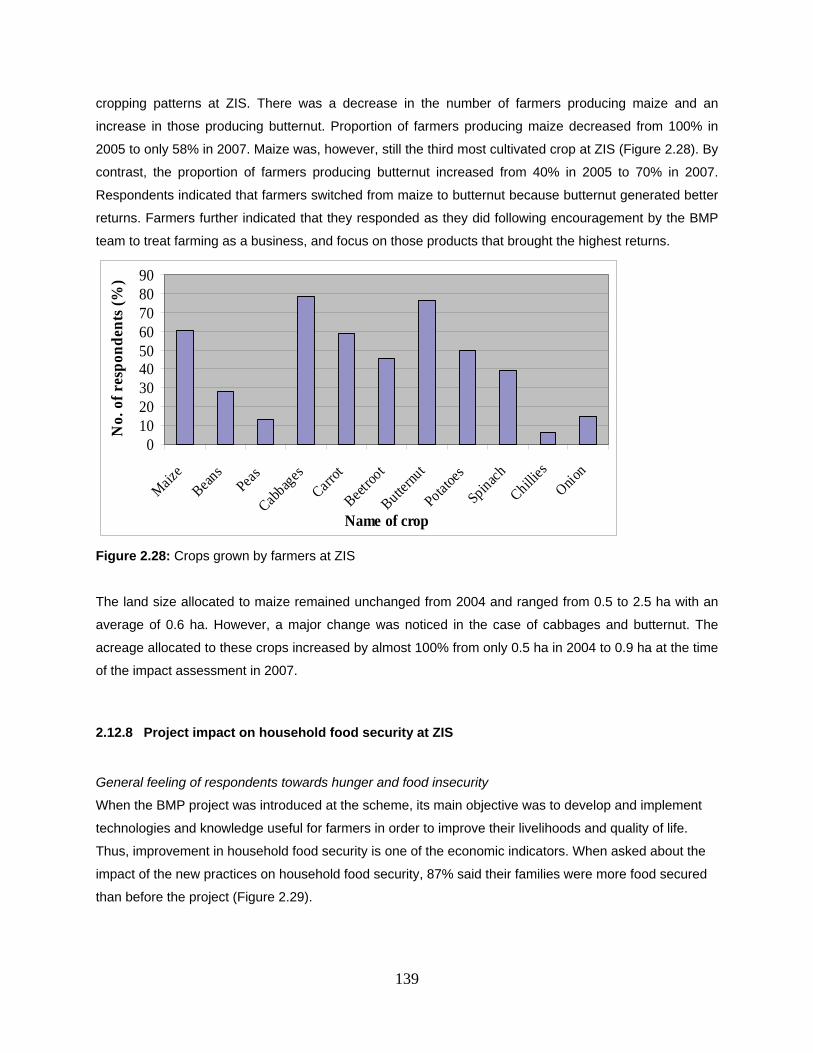
139
cropping patterns at ZIS. There was a decrease in the number of farmers producing maize and an
increase in those producing butternut. Proportion of farmers producing maize decreased from 100% in
2005 to only 58% in 2007. Maize was, however, still the third most cultivated crop at ZIS (Figure 2.28). By
contrast, the proportion of farmers producing butternut increased from 40% in 2005 to 70% in 2007.
Respondents indicated that farmers switched from maize to butternut because butternut generated better
returns. Farmers further indicated that they responded as they did following encouragement by the BMP
team to treat farming as a business, and focus on those products that brought the highest returns.
Figure 2.28: Crops grown by farmers at ZIS
The land size allocated to maize remained unchanged from 2004 and ranged from 0.5 to 2.5 ha with an
average of 0.6 ha. However, a major change was noticed in the case of cabbages and butternut. The
acreage allocated to these crops increased by almost 100% from only 0.5 ha in 2004 to 0.9 ha at the time
of the impact assessment in 2007.
2.12.8 Project impact on household food security at ZIS
General feeling of respondents towards hunger and food insecurity
When the BMP project was introduced at the scheme, its main objective was to develop and implement
technologies and knowledge useful for farmers in order to improve their livelihoods and quality of life.
Thus, improvement in household food security is one of the economic indicators. When asked about the
impact of the new practices on household food security, 87% said their families were more food secured
than before the project (Figure 2.29).
0102030405060708090
Maiz
e
Beans
Peas
Cabbag
es
Carrot
Beetro
ot
Butternu
t
Potatoe
s
Spinach
Chillies
Onion
Name of crop
No.
of
resp
ond
ents
(%
)
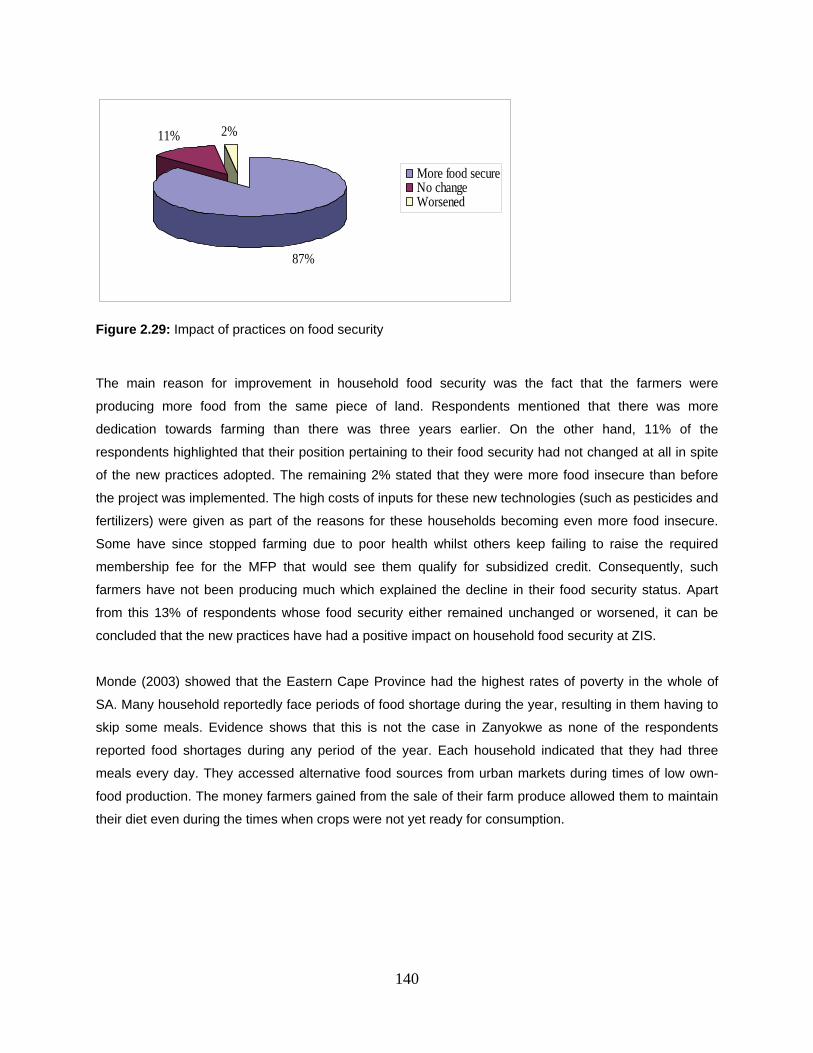
140
Figure 2.29: Impact of practices on food security
The main reason for improvement in household food security was the fact that the farmers were
producing more food from the same piece of land. Respondents mentioned that there was more
dedication towards farming than there was three years earlier. On the other hand, 11% of the
respondents highlighted that their position pertaining to their food security had not changed at all in spite
of the new practices adopted. The remaining 2% stated that they were more food insecure than before
the project was implemented. The high costs of inputs for these new technologies (such as pesticides and
fertilizers) were given as part of the reasons for these households becoming even more food insecure.
Some have since stopped farming due to poor health whilst others keep failing to raise the required
membership fee for the MFP that would see them qualify for subsidized credit. Consequently, such
farmers have not been producing much which explained the decline in their food security status. Apart
from this 13% of respondents whose food security either remained unchanged or worsened, it can be
concluded that the new practices have had a positive impact on household food security at ZIS.
Monde (2003) showed that the Eastern Cape Province had the highest rates of poverty in the whole of
SA. Many household reportedly face periods of food shortage during the year, resulting in them having to
skip some meals. Evidence shows that this is not the case in Zanyokwe as none of the respondents
reported food shortages during any period of the year. Each household indicated that they had three
meals every day. They accessed alternative food sources from urban markets during times of low own-
food production. The money farmers gained from the sale of their farm produce allowed them to maintain
their diet even during the times when crops were not yet ready for consumption.
87%
11% 2%
More food secureNo changeWorsened
141
2.12.9. Socio-economic impact of the BMP project on surrounding communities: Perspectives of
the non-project members
Economic aspects
The ZIS has traditionally been a source of employment for its surrounding communities. Therefore, the
increased land use intensity and adoption of better agronomic practices as a result of the BMP project
meant that more labour had to be hired to cater for the increased activities. On average, each farmer
employed about five regular workers who were contracted during peak periods, in addition to casual
labourers who were hired throughout the year. Therefore if the best practices introduced by the BMP
project are sustained in the scheme it will guarantee improved employment opportunities and income for
non irrigating households.
It was difficult to assess the impact of the BMP project on food security. It can, however, be assumed that
for non irrigating families, improved employment opportunities translated to more disposable income to
purchase food. The situation analysis (Monde et al., 2005) showed the biggest expenditure item on the
household budget was food purchase (36%). There was also clear evidence that non irrigators in the
three villages under study continued to benefit from the nutritious food products produced in the scheme.
They either buy produce or get it in kind after providing labour. At times the farmers give the villagers the
non-marketable (poor quality) produce for free, as is the case in Lenye. Non irrigating villagers also
acknowledged the benefit of getting fresh produce all the time as they have access as labourers to the
field where they purchase the produce. Although the farmers charge them the same price as the hawkers,
villages did not incur transport costs. They could also get the produce on credit from the scheme farmers.
Backward and forward linkages: As was noted by FAO (2001) irrigation farming has the potential to
create economic backward and forward linkages. The BMP project has had a significant impact on
developing both backward and forward economic linkages. The backward linkages came about as
farmers, through farmer organisation, collectively pool their resources and buy inputs in bulk. These
farmers produced more of the high-value crops that require purchased inputs that include seeds,
fertilisers, chemicals etc. They buy the inputs from King Williams Town and hire local transport to ferry
inputs. This has created business for local transporters.
Forward linkages occur as ZIS farmers sell their products to locals, hawkers as well as formal markets in
the surrounding towns of Alice, King Williams Town and East London. Farmers get income from the sales,
and this enables them to access other products from the market. Locals who get income from selling their
labour to ZIS farmers, spend their money on products from the market both local and surrounding towns.
Local Spaza shop owners confirmed that both farmers and local villagers spend their incomes from the
scheme purchasing non-farm products from them, although they could not confirm any improvement in
business since 2005.
142
Leadership skills: Both Burnshill and Lenye chairpersons agreed that they have benefited from the
leadership training programmes that have been extended to the farmers during the life of the BMP
project. The ZIS farmers invited their non irrigating neighbours to all the meetings held at the scheme. In
Burnshill, one of the village council members is a farmer, and his chairperson who is a non irrigator
confirmed that the village benefitted from the skills this farmer acquired from the management of the
scheme. The leadership skills that were identified by the village chairpersons included understanding the
roles of the office bearers, keeping records as well as conflict resolution.
References
ACCIARESI, H.A. & ZULUAGA, M.S., 2006. Effect of plant row spacing and herbicide use on weed
aboveground biomass and corn grain yield. Planta Daninha, Viçosa-MG 24 (2) 287-293.
ALFORD, C.M., MILLER S.D. & CECIL, J.T., 2004. Using narrow rows to increase crop competition with
weeds. Proceedings of the 4th International Crop Science Congress. Brisbane, Australia, 26 September to
1 October 2004.
AL-HASSAN, R.M., SARPOND, D.B., & MENSAH-BONSU, A., 2006. Linking smallholders to markets. A
draft report submitted to the International Food Policy Research Institute’s Ghana Strategy Support
Programme (GSSP). Background paper number GSSP 0001. [Online]. Available at
http://pdf.usaid.gov/pdf_docs/PNADL412.pdf.[Date of access:31/07/2009].
ALM, D.M., WAX, L.M. & STOLLER, E.W., 2000. Weed suppression for weed management in corn (Zea
mays) and soybean (Glycine max) production systems. Weed Technology 14: 713-717.
ALUKO, G.K. & FISCHER, K.S., 1987. The effect of changes of assimilate supply around flowering on
grain sink size and yield of maize (Zea mays L.) cultivars of tropical and temperate adaptation. Australian
Journal of Agricultural Research 38: 153-161.
ANDERSON, E.L., KAMPRATH, E.J. & MOLL, R.H., 1984. Nitrogen fertility effects on accumulation,
remobilisation, and partitioning of N and dry matter in corn genotypes differing in prolificacy. Agronomy
Journal 76: 397-403.
ANDRADE, F.H, CALVINHO, P, CIRILO, A. & BARBIERI, P., 2002. Yield responses to narrow rows
depend on increased radiation interception. Agronomy Journal 94: 975-980.
ARC., 1998. Production of green mealies. National Department of Agriculture, Pretoria, South Africa.
A T S RURAL DEVELOPMENT SERVICES., 2002. Rehabilitation of Zanyokwe Irrigation Scheme, A
report submitted to DWAF.
143
AUERBACH, R.M.B., 1993. A farming systems research evaluation of maize production practices in
Southern KwaZulu. MSc thesis, University of Natal, South Africa. 190pp.
BACKEBERG, G.R., 2006. Reform of user charges, market pricing and management of water:
problem or opportunity for irrigated agriculture. Irrigation and Drainage 55 (1): 1-12.
BACKEBERG, G.R., 2009. Improving Rural Livelihoods with Rainwater Harvesting and Conservation on
Communal Croplands in South Africa: Opportunities and Obstacles. In: R.K. Behl, W. Merbach, H.
Meliczek and C. Kaetsch (eds) Crop Science and Land Use for Food and Bioenergy. Agrobios
International, Jodhpur, India.
BALINT, B.J., FORKUTSA, I. & REIS DE FREITAS, A.C., 2002. Indicators for the measurement of
institutional performance concerning water management. Application for Uzbekistan and Ghana. Centre
for Development Research. Bonn.
BARBIERI, P.A., ROZAS, H.R.S., ANDRADE, F.H, & ECHRVERRIA, H.E., 2000. Row spacing effects at
different levels of nitrogen availability in maize. Agronomy Journal 92: 283-288.
BEGNA, S.H., HAMILTON, R.I., DYWER, L.M., STEWART, D.W., CLOUTIER, D., ASSEMAT, L.,
FOROUTAN-POUR, K. & SMITH, D.L., 2001. Weed biomass production response to plant spacing and
corn (Zea mays) hybrids differing in canopy architecture. Weed Technology 15: 647-653.
BELINDER, R.R., MILLER, A.J., MALIK, R.K., RANJIT, J.D., HOBBS, P.R., BRAR, L.S., SINGH, G.,
SINGH, S. & YADEV, A., 2002. Improving Herbicide Application Accuracy in South Asia. Weed
Technology 16 (4): 845-850
BELSITIO, A.M., 2004. Open Pollinated Corn Cultivar Trials and a Discussion of the Practical Implications
for Open Pollinated Corn in Small scale Whiskey Production. MSc Thesis. Cornell University. 44pp.
BEMBRIDGE, T.J., 1996. Small-scale farmer irrigation schemes in South Africa. In: Backeberg GR,
Bembridge TJ, Bennie ATP, Groenewald JA, Hammes PS, Pullen RA and Thompson H. Policy Proposal
for Irrigated Agriculture in South Africa. WRC Report KV96/96. Water Research Commission, Pretoria,
South Africa.
BEMBRIDGE, T.J., 2000. Guidelines for rehabilitation of smallholder farmer irrigation schemes in South
Africa. Water Research Commission Report No. 891/1/00.
144
BERRY, A., STALL, W.M., RATHINASABAPATHI, B., MACDONALD, G.E. & CHARUDATTAN, R., 2001.
Competition of smooth (Amaranthus hybridus) and livid (A. lividus) amaranth with cucumber (Cucumis
sativus). Proceedings of the Florida Sate Horticultural Society 114: 272-274.
BLACKSHAW, R.E., O’DONOVAN, J.T., HARKER, K.N., CLAYTON, G.W. & STOUGAARD, R.N., 2006.
Reduced herbicide doses in field crops: A review. Weed Biology and Management 6: 10-17.
BOYHAN, G.E., GRANBERRY, D.M. & KELLEY, T., 1999. Commercial Squash Production. Cooperative
Extension Service, the University of Georgia College of Agricultural and Environmental Sciences [Online].
Available from: http://pubs.caes.uga.edu/ caespubs/ PDF/C527.pdf [Accessed on 4/05/2007].
BRATSCH, A., 2006. Specialty Crop Profile: Pumpkins. Virginia Cooperative Extension Publication 438-
100. Agriculture and Extension Communications. Virginia Polytechnic Institute and State University.
Available online at http:// www.ext.vt.edu/pubs/vegetables/438-100/438-100.html. [Accessed 07/05/2007].
BULLOCK, D.G., NIELSEN, R.L. & NYQUIST, W.E., 1988. A growth analysis comparison of corn grown
in conventional and equidistant plant spacing. Crop Science 28: 254-258.
CANADIAN ORGANIC GROWERS FIELD CROP HANDBOOK., 1992. Weed Management [Online].
Available from http://eap.mcgill.ca/MagRack/COG/COGHandbook/COG Handbook17.htm [Accessed
29/01/2009].
CARTER, M. & MAY, J., 1999. Poverty and class in rural South Africa. World Development 27 (1): 1-20.
CATLING, D., 1996. Current status of government agricultural schemes and projects in the Eastern Cape:
Full report. Department of Agriculture and Land Affairs of the Eastern Cape, Bisho.
CHIVINGE, O.A., 1990. Weed science technological needs of the communal areas of Zimbabwe.
Zambezia xv (ii):133-143.
CIMMYT., 1988. From agronomic data to farmer recommendations: an economics training manual.
Completely revised edition. Mexico, D.F.
CIMMYT., 1989. Winter maize transplanted to rice fields. CIMMYT Informa No. 886.
COMMON WEALTH OF AUSTRALIA., 2005. Socio-economic impact assessment toolkit. Bureau of Rural
Sciences, Canberra, Australia.
145
COWARD, W., 1986. Direct or indirect alternatives for designing for irrigation investment and the creation
of property. In W.W. Easter (ed.) Irrigation investment, technology and management strategies for
development. Studies in Water.
CROSBY, C.T., DE LANGE, M., STIMIE, C.M. & VAN DER STOEP, I., 2000. A review of planning and
design procedures applicable to small-scale farmer irrigation projects. WRC Report No. 578/2/00. Water
Research Commission, Pretoria, South Africa.
DALE, A.E. & DRENNAN, S.H., 1997. Transplanted maize (Zea mays) for grain production in southern
England. I. Effects of planting date, transplant age at transplanting and cultivar on grain yield. The Journal
of Agricultural Science 128: 27-35.
DE LANGE, M., ADENDORFF, J. & CROSBY, C.T., 2000. Developing sustainable small-scale farmer
irrigation in poor rural communities: guidelines and checklists for trainers and development facilitators.
WRC Report No. 774/1/00. Water Research Commission, Pretoria, South Africa.
DENISON, J. & MANONA, S., 2007. Principles, Approaches and Guidelines for the Participatory
Revitalisation of Smallholder Irrigation Scheme. Volume 1 – a rough Guide for Irrigation Development
Practitioners. WRC Report No. TT 308/07. Water Research Commission, Pretoria, South Africa.
DEPARTMENT OF AGRICULTURE., 2003. Maize Production. National Department of Agriculture,
Private Bag X144, Pretoria, South Africa. [Online]. Available from http://www.nda.agric.za/docs/
maizeproduction.pdf [Accessed on 12/09/2007].
DEPARTMENT OF AGRICULTUE., 2004. A Guide to the Use of Herbicides. Directorate: Food Safety and
Quality Assurance. Eighteenth Edition. Republic of South Africa.
DEPARTMENT OF AGRICULTUE., 2005. Vegetable production in KwaZulu-Natal [Online]. Available
from http://agriculture.kzntl.gov.za/portal/Publications/ProductionGuidelines/VegetableProductioninKZN/
tabid/264/Default.aspx. (Accessed on 20/09/2008).
DRIMIE, S. & MINI, S., 2003. Food Security and Sustainable Development in Southern Africa. Human
Sciences Research Council. www.hsrcpress.ac.za.
DUCHENSE, R., LACHANCE, P. & LETENDRE, M., 2004. Reduced herbicide rates in Field Crops.
Lower-than-Label-Rate Working Group, Stratègie Phytosanitaire, Ministère del’Agriculture, des
Pecheries, et de I’Ailmentation, Quebec City, Canada.
146
DU PISANI, A.L., ERASMUS, J.F. & KOCK, F.G.L., 1982. The determination of suitable planting times for
maize using climatic data. Crop Production 11: 36-39.
DU PLESSIS, J.G. & BRUWER, D., 2003. Short Growing Season Cultivars. ARC-Grain Crops Institute.
Private Bag X1251. Potchefstroom 2520
DU PLESSIS, J.G. & BRUWER, D., 2004. Short Growing Season Cultivars. ARC – Grain Crops Institute.
Private Bag X1251. Potchefstroom 2520, South Africa.
DUTHIE, J.A., ROBERTS, B.W., EDELSON, J.V. & SHREFLER. J.W., 1999. Plant density-dependent
variation in density, frequency, and size of watermelon fruits. Crop Science 39: 412-417.
DWEIKAT, I.M. & KOSTEWICZ, S.R., 1989. Row arrangement, plant spacing and nitrogen rate effects on
zucchini squash yield. HortScience 24: 86-88.
EICHER, C.K., 1999. Institutions and the African Farmer. CIMMYT (International maize and Wheat
Improvement Centre
EVANS, E., 2008. Marginal Analysis: An Economic Procedure for selecting Alternative
Technologies/Practices. EDIS document FE565. Department of Food and Resource Economics, Florida
Cooperative Extension Service, Institute of Food and Agricultural Sciences, University of Florida,
Gainesville [Online]. Available from http// edis.ifas.ufl.edu. [Accessed on 10/02/2009].
EVN., 1991. Uthukela Ferry Irrigation Scheme Upgrading Proposals. Report to the KwaZulu Department
of Agriculture and Forestry, Ulundi
FACULTY OF AGRICULTURE/ARDRI., 1996. Keiskammahoek, Ncora and Qamata irrigation schemes.
Summary of report by the Commission of Enquiry appointed by the Eastern Cape Province to look for
sustainable solutions of large Eastern Cape irrigation schemes. University of Fort Hare, Alice, South
Africa.
FAO., 1980. Improvement and production of maize, sorghum and millet. FAO, Rome.
FAO., 1982. Estimation of crop area and yields in agricultural statistics. FAO Economic and Social
Development Paper 22. Rome.
FAO., 1988. Soil map of the world. World Soil Resources Report 60. FAO, Rome.
FAO., 1995. Sustainable dryland cropping in relation to soil productivity – FAO soils bulletin 72. Rome.
147
FAO., 2000. South Africa: Affordable irrigation technologies for smallholders: opportunities for technology
adaptation and capacity building. Programme formulation Report No. 6 – December 2000. IPTRID
Secretariat. Rome [Online]. Available from: http://land.pwv.gov.za/redistribution/redistribution/ south_
africa_rpt.html [Accessed on 05/11/2005].
FAO., 2001. Socio-Economic Impact of Smallholder Irrigation Development in Zimbabwe. Case studies of
ten irrigation schemes. Food and Agriculture Organization of the United Nations (FAO) Sub-Regional
Office for East and Southern Africa (SAFR) Harare.
FAO., 2003. Fertilizer Use by Crop in the Democratic People's Republic of Korea. Food and Agriculture
Organization of the United Nations, Rome. Available online at
http://www.fao.org/DOCREP/006/Y4756E/y4756e00.htm. Accessed 10 September 2008.
FANADZO, M., 2007. Weed management by small-scale irrigation farmers – the story of Zanyokwe. SA
Irrigation 29 (6): 20-24.
FANADZO, M., MASHINGAIDZE, A.B. & NYAKANDA, C., 2007. Narrow rows and high maize densities
decrease maize grain yield but suppress weeds under dryland conditions in Zimbabwe. Journal of
Agronomy 6 (4): 566-570.
FINNEY, D.M. & CREAMER, N.G., 2008. Weed management on organic farms. Centre for Environmental
farming Systems. North Carolina Cooperative Extension Service. Available online from
http://www.cefs.ncsu.edu/PDFs/ WeedMgmtJan808Accessible.pdf. [Accessed on 11/02/2009].
FORCELLA, F., WESTGATE, M.E. & WARNES, D.D., 1992. Effect of row width on herbicide and
cultivation requirements in row crops. American Journal of Alternative Agriculture 7: 161-167
FRASER, G.C.G., MONDE, N, & VAN AVERBEKE, W., 2003. Food Security in South Africa: A case
study of rural livelihoods in the Eastern Cape Province. In Lieb Nieuwoudt and Jan Groenewald (eds),
The Challenge of Change: Agriculture, Land and the South African Economy. Pietermaritzburg: University
of Natal Press. pp 171-183.
FULTON, J.M., 1970. Relationships among soil moisture stress, plant population, row spacing and yield
of corn. Canadian Journal of Plant Science 50: 31-38.
FOURNIER, A.I. & BROWN, A. (eds.) 1999. Crop Profile for Squash in Maryland. [Online]. Available from
http://www.ipmcenters.org/cropprofiles/docs/MD squash.pdf [Accessed on 16/01/2009].
148
FSSA., 2007. Fertilizer Handbook, 6th revised edition. The Fertilizer Society of South Africa. Lynnwood
Ridge.298 pp.
GARCIA-VILLA, M., LORITE, IJ., SORIANO, M.A. & FERERES, E., 2008. Management trends and
responses to water scarcity in an irrigation scheme of Southern Spain. Agricultural Water Management 95
458-468
GOLDENKOFF, R., 2004. Using focus groups. In Wholey, JS, Hatry, HP and Newcomer, K.E. (Eds),
Handbook of practical program evaluation, 2nd edition. San Francisco: Jossey-Bass.
GOMEZ, A. & GOMEZ, A.A., 1984. Statistical Procedures for Agricultural Research Second Edition. John
Wiley and Sons, 680 pp.
GREWAL, R., & DHARWADKAR, R., 2001. The role of institutional environment in marketing channels.
The Journal of Marketing 66(3): 82-97.
GRICHAR, W.J., BESLER, B.A. & BREWER, K.D., 2004. Effcet of row spacing and herbicide dose on
weed control and grain sorghum yield. Crop Protection 23: 263-267.
HASNIP N, MANDAL S, MORRISON J, PRADHAN P and SMITH L (2001). Contribution of Irrigation to
Sustaining Rural Livelihoods. KAR Project R7879. Literature Review. Report OD/TN 109 [Online].
Available from: http://www.hrwallingford.co.uk/downloads/ publications/dlreports/odtn109.pdf (Accessed
on 7/05/2006).
HEBINCK, P., VAN AVERBEKE, W., MONDE, N., SMITH, L. & BENNETT, J., 2007. Life histories and
livelihood trajectories. In Hebinck, P and Lent, P (EDS) Livelihoods and landscapes: the people of
Guquka and Koloni and their resources. BRILL Publishers.
HILL, D.E., 1999. Winter Squash Trials 1997-1998. Bulletin 960, October 1999. The Connecticut
Agricultural Experiment Station, New Haven [Online]. Available from http://www.ct.gov/caes/lib/caes/
documents/publications/bulletins/b960.pdf [Accessed on 8/05/2007].
HOCHMUTH, G. & CORDASCO, K., 2003. A Summary of N Research with Squash in Florida.
Horticultural Sciences Department, Florida Cooperative Extension Service, Institute of Agricultural
Sciences, University of Florida [Online]. Available from http://edis.ifas.ufl.edu [Accessed on 7/06/2006].
149
HOCHMUTH, G.D., MAYNARD, D.N., VAVRINA, C.S., STALL, W.M., KUCHAREK, T.A., WEBB, S.E.,
TAYLOR, T.G., SMITH, S.A. & SMAJSTRLA, A.G., 2000. Cucurbit Production in Florida. Horticultural
Sciences Department HS 725. Florida Cooperative Extension Service, Institute of Food and Agricultural
Sciences, University of Florida. Available online at http://edis..ifas.ufl.edu/CV123 [Accessed 2/05/2007].
HYGROTECH SA., 2004) Production Guidelines for Squash. Hygrotech, South Africa.
INFANTE-CASELLA, M., 2003. Crop Profile for summer and winter squash in New Jersey. Rutgers
Agricultural Research and Extension Centre. Bridgeton, New Jersey. Available online at
http://www.ipmcentres.org/cropprofiles/docs/NJ squash.html. [Accessed 10/05/2007].
JOHNSON, D.E. & ADESINA, A.A., 1993. Farmer’s perceptions of rice weeds and control methods in
Cote d’Ivoire, West Africa. Proceedings of the Brighton Crop Protection Conference (Weeds) 3: 1143-
1148.
JOHNSON, G.A., HOVERSTAD, T.R. & GREENWALD, R.E., 1998. Integrated weed management using
narrow corn row spacing, herbicides and cultivation. Agronomy Journal 90: 40-46.
JOHNSON, G.A. & HOVERSTAD, T.R., 2002. The effect of row spacing and herbicide application timing
on weed control and grain yield in corn (Zea mays). Weed Technology 16:548-553.
JORDAN N., MORTENSEN, D.A., PRENZLOU, D.M. & COX, K.C., 1995. Simulation analysis of crop
rotation effects on weed seed banks. American Journal of Botany 82: 390-398.
KEMBLE, J.M., SIKORA, E.J., ZEHNDER, G.W. & BAUSKE, E., 2000. Guide to Commercial Pumpkin
and Winter Squash Production. Alabama Cooperative Extension System. Auburn University. Available
online at http://www.aces. edu/pubs/docs/A/ANR-1041/ANR-1041.pdf. [Accessed 10/05/2007].
KHEHRA, A.S., BRAR, H.S., SHARMA, R.K., DHILLON, B.S. & MALHOTRA, V.V., 1990. Transplanting
maize during the winter in India. Agronomy Journal 82: 41-47.
KLINGMAN, D.L., 1971. Measuring Weed Density in Crops. In L. Chiarappa (ed.). Crop Loss Assessment
Methods. FAO, Rome.
KLINGMAN, G.C., 1971. Weed control as a science. John Wiley and Sons, New York
150
LANINI, W.T., 2008. Integrated Weed Management in Cucurbits. University of California Publication
3445. Available online at http://www.ipm.ucdavis.edu/ PMG/r116700111.html. [Accessed 26/04/2007].
KYABRAM, K.P., 1995. Irrigated Summer Fodder Crops 4: Maize. State of Victoria, Department of
Primary industries [Online]. Available from http://hylan.com.au/pdfsmaizeasummerfodder.pdf [Accessed
on 10/08/2006].
LAKER, M.C., 2004. Development of a general strategy for optimising the efficient use of primary water
resources for effective alleviation of rural poverty. WRC Report No. KV149/04. Water Research
Commission, Pretoria, South Africa
LENTON, R., 1988. Strategy development in IIMI: the International Irrigation Management Institute: four
years of development. ODI/IIMI Network paper No 88/1 e. Odi. London.
LOXTON, VENN AND ASSOCIATES., 1983. A master preliminary plan for Zanyokwe Irrigation Scheme.
Loxton, Venn and Associates, Bramley, South Africa.
MACHETHE, C.L., MOLLEL, N.M., AYISI, K., MASHATOLA, M.B., ANIM, F.D.K. & VANASCHE, F., 2004.
Smallholder Irrigation and Agricultural Development in the Olifants River Basin of Limpopo Province:
Management, Transfer, Productivity, Profitability and Food Security Issues. WRC Report 1050/1/04.
Water Research Commission, Pretoria, South Africa.
MANDIRINGANA, O.T., MNKENI, P.N.S., MKILE, Z., VAN AVERBEKE, W., VAN RANST, E, &
VERPLANCKE, H., 2005. Mineralogy and fertility status of selected soils of the Eastern Cape Province,
South Africa. Communication in Soil Science and Plant Analysis. 36: 2431-2446.
MANONA, S. & BAIPHETHI, M., 2008. Developing a Land Register and a Set of Rules for Application of
Infield Rainwater Harvesting in Three Villages in Thaba Nchu: A Pilot Project. WRC Report No TT 367/08.
Water Research Commission, Pretoria, South Africa.
MARAIS, J. N., 1989. The ecotope: a vehicle for agrotechnology transfer. Ciskei Journal for Rural
Development. 1st Quarter, Volume II: 2-7.
MARAIS, J.N., 1992. FSR-E Newsletter No. 4, November 1992. Southern African Association for Farming
Systems Research-Extension, Development Bank of Southern Africa, Halfway House, South Africa.
MASHINGAIDZE, A.B. & CHIVINGE, O.A., 1995. Weed control using reduced herbicide dosages: A
theoretical framework. Transactions of the Zimbabwe Scientific Association 69: 12-19.
151
MASHINGAIDZE, A.B., 2004. Improving weed management and crop productivity in maize systems in
Zimbabwe. PhD Thesis 196 pp. Wageningen University, the Netherlands.
MERREY, D., DRECHSEL, F.W.T., PENNING DE VRIES & SALLY,H., 2003. Integrating water resources
management: taking the integration paradigm to its logical next step for developing countries.
International Water Management Institute (IWMI),Africa Regional Office, Pretoria, South Africa.
MKHABELA, M.S, & PALI-SHIKHULU, J., 2001. Response of maize (Zea mays L.) Cultivars to different
levels of Nitrogen application in Swaziland. Proceedings of the Seventh Eastern and Southern Africa
Regional Maize Conference. 11th -15th February, 2001. 377-38pp.
MOHLER, C.L., 2001. Enhancing the competitive ability of crops. In: Ecological Management of
Agricultural Weeds (ed. By Liebman, M., Mohler, C.L. and Staver, C.P.). Cambridge University Press,
Cambridge, 269-322.
MONDE, N., 2003. Household food security in rural areas of central Eastern Cape: The case of Guquka
in Victoria East and Koloni in Middledrift Districts. Unpublished PhD thesis. University of Fort Hare, Alice,
South Africa.
MONDE N., CHIDUZA, C., BRUTSCH, M.O., MNKENI, P.N.S., MTSHALI, S., DLADLA, R., MODI, A.T.,
MTHEMBU, B.E., VAN DER STOEP, I. & STEVENS, J., 2005. Best management practices for
smallholder farming on two irrigation schemes and surrounding areas in the Eastern Cape and KwaZulu-
Natal through participatory adaptive research: A Situation Analysis Report on the Zanyokwe and Tugela
Ferry Irrigation Schemes. WRC Project Nr K5/1477. Deliverable number 2.
MOSSLER, M.A. & NESHEIM, O.N., 2003. Florida Crop/Pest Management Profile: Squash. Florida
Cooperative Extension Service, Institute of Food and Agricultural Sciences, University of Florida.
Available online at http://edis.ifas.ufl.edu.pdffiles/PI/PI04600.pdf [Accessed 17/09/2007].
MOTSENBOCKER, C.E. & ARANCIBIA, R.A., 2002. In-row spacing influences triploid watermelon yield
and crop value. HortTechnology 12: 437-440.
MTSHALI, S.M., 2002. Household Livelihood Security in Rural KwaZulu-Natal, South Africa. Wageningen
University, Wageningen.
152
MURPHY, S.D., YAKUBU, Y., WEISE, S.F. & SWANTON, C.J., 1996. Effect of planting patterns and
inter-row cultivation on competition between corn (Zea mays) and late emerging weeds. Weed Science
44: 856-870.
NARAYANAMOORTHY, A. & DESHPANDE, R.S., 2004. Irrigation Institutions in India with Special
Reference to Maharashtra State. Paper presented at the 18th European Conference on Modern South
Asian Studies (SASNET), Lund, SWEDEN.
NATIONAL DEPARTMENT OF AGRICULTURE., 1998. Production of green mealies. National
Department of Agriculture, Pretoria, South Africa.
NAZARKO, O.M., VAN ACKER, R.C. & ENTZ, M.H., 2005. Strategies and tactics for herbicide use
reduction in field crops in Canada: a review. Canadian Journal of Plant Science 85: 457-479.
NESMITH, D.S., 1993. Plant spacing influences watermelon yield and yield components. HortScience 28:
885-887.
NEVEN, D., READON, T. & HOPKINS, R., 2005. Case Studies of Farmer Organisations Linking to
Dynamic Markets in Southern Africa. USAID. Michigan State University.
NJOKWENI, E.N., 2004. Economic performance of smallholder irrigation schemes: A case study in
Zanyokwe, Eastern Cape, South Africa. M. Agric. Dissertation, University of Pretoria, Pretoria.
NICHOLAS J.M., 1990. Managing business and engineering projects: Concepts and Implementation.
Prentice-Hall, Inc. USA.
NOORDWIJK, M., 2002. Scaling trade-offs between crop productivity, carbon stocks and biodiversity in
shifting cultivation landscape mosaics: the fallow model. Ecological Modeling 149: 113-126.
NORTH, D.C., 1990. Institutions, institutional change, and economic performance, New York: Cambridge
University Press.
NSW DEPARTMENT OF PRIMARY INDUSTRIES, 2004. NSW Grains Report. [Online]. Available from:
http://www.agric.nsw.gov.au.reader/nsw-grains-report [Accessed on 10/05/2006].
OSTROM, E. & GARDNER, R., 1993. Coping with assymetrics in the commons: self-governing irrigation
systems can work. Journal of Economic Perspective. 7 (4):93-112.
153
O’SULLIVAN, J. & BOUW, W.J., 1993. Reduced rates for post-emergence herbicides for weed control in
sweet corn (Zea mays). Weed Technology 9: 995-1000.
OTEGUI, M.E. & BONHOMME, R., 1998. Grain yield components in maize – I. Ear growth and kernel set.
Field Crops Research 56 (3): 247-256
OTT, R.L., 1998. An introduction to statistical methods and data analysis. Belmont, California: Duxbury
Press.
OTTMAN, M.J. & WELCH, L.F., 1989. Planting pattern and radiation interception, plant nutrient
concentration, and yield in corn. Agronomy Journal 81: 167-174.
OVERSEAS DEVELOPMENT INSTITUTE., 2001. Economic Theory, Freedom and Human Rights: The
Work of Amartya Sen. Briefing paper. www.odi.org.uk.
PANNACCI, E. & COVARELLI, G., 2009. Efficacy of mesotrione used at reduced doses for post-
emergence weed control in maize (Zea mays L.). Crop Protection 28: 57-61.
PERRET, S., 2002. Water policies and smallholding irrigation schemes in South Africa: a history and
new institutional changes. Water Policy 4(3), 283-300.
PERRET, S., LAVIGNE, M., STIRER, N., YOKWE, S. & DIKGALE, S., 2003. The Thabina irrigation
scheme in a context of rehabilitation and management transfer: Prospective analysis and local
empowerment. Final Report: DWAF, CIRAD-IWMI-UP, Pretoria, South Africa.
PRINCE EDWARD ISLAND AGRICULTURE, FISHERIES AND AQUACULTURE, 2005. Pumpkins and
Squash. Atlantic Provinces vegetable crops guide to pest management [Online]. Available from:
http://www.gov.pe.ca/photos/ original/ afpumpkin.pdf (Accessed on 17/09/2007).
RAHMAN, A.M.A., MAGBOUL, E.L. & NOUR, A.E., 2001. Effects of sowing date and cultivar on the yield
and yield components of maize in Northern Sudan. Proceedings of the Seventh Eastern and Southern
Africa Regional Maize Conference. 11-15 February, 2001. 295-298pp.
REINERS, S. & RIGGS, D.I.M., 1997. Plant spacing and variety affect pumpkin yield and fruit size, but
supplemental nitrogen does not. HortScience 32 (6): 1037-1039.
154
SALAH, H.B. & TARDIEU, F., 1997. Control of leaf expansion rate of drought maize plants under
fluctuating evaporative demand. Plant Physiology 114: 893-333.
SALETH, R.M., 2006. Understanding Water Institutions: Structure, Environment and Change Process. In:
S. Perret, S. Farolfi, and Hassan, R (eds) Water Governance for Sustainable Development. Earthscan,
London.
SALONEN, J., 1992. Yield of cereals and reduced herbicide dosages. Weed Research 32: 493-499.
SANDERS, D.C., CURE, J.D. & SCHULTHEIS, J.R., 1999. Yield response of watermelon to planting
density b, planting pattern, and polyethylene mulch. HortScience 34: 1221-1223.
SANGOI, L., 2000. Understanding plant density effects on maize growth and development: an important
issue to maximise grain yield. Ciência Rural, Santa Maria 31 (1): 159-168.
SAS SYSTEM., 1999. SAS/STAT User’s Guide, Version 8, 1st printing, Volume 2. SAS Institute Inc, SAS
Campus Drive, Cary, North Carolina 27513.
SCHEFFER, K., 1984. Verhinderung von Bodenerosion durch das Maispflanzverfahren. Mitteilungen
Deutsche Bodenkundliche Gesellschaft 39: 128-132.
SCHEFFER, K., 1987. Pflanzen statt säen. Agrar Praxis 2: 68-70.
SCHEFFER, K., 1992. Brennstoff aus Biomasse – eine bedeutende Energiequelle für die Zukunft! Mais
2: 30-33.
SHARMA, R.K., BRAR, H.S., KHEHRA, A.S. & DHILLON, B.S., 1989. Gap filling through transplanting
during winter. Journal of Agronomy and Crop Science 162: 145-148.
SINCLAIR, R.K. & HORRIE, T., 1989. Leaf nitrogen, photosynthesis, and crop radiation use efficiency: A
review. Crop Science 29: 90-98
SHRESTHA, A., RAJCAN, I., CHANDLER, K. & SWANTON, C.J., 2001. An integrated weed
management strategy for glufosinate resistant corn (Zea mays). Weed Technology 15: 517-522.
155
SIBUGA, K.P., 1999. The role of women and children in weed management in smallholder farming
systems. Proceedings of the 17th East African Bi-annual Weed Science Conference, Harare, 27-29
September, pp. 85-90.
SINGH, R.P. & SINGH, R.K., 2006. Ecological approaches in weed management. National Symposium
on Conservation Agriculture and Environment, October 26-28, pp. 301-306.
SOIL CLASSIFICATION WORKING GROUP., 1991. Soil classification: A taxonomic system for South
Africa. Memoirs on the Agricultural Natural Resources of South Africa No. 15. Department of Agricultural
Development, Pretoria, South Africa.
STALL, W.M., 2006. Weed Control in Cucurbit Crops (Muskmelon, Cumber, Squash and Watermelon).
Institute of Food and Agricultural Sciences, University of Florida, Gainesville, 32611. Available online at
http://edis.ifas. ufl.edu/pdffiles/WG/WG02900.pdf. [Accessed 12/05/2007].
STALL, W.M., 2007. Weed Control in Cucurbit Crops (Muskmelon, Cucumber, Squash, and Watermelon)
[Online]. Available from http://edis.ifas.ufl.edu/ WG029 [Accessed on 16/01/2009].
STEEL, R.G.D. & TORRIE, J.H., 1984. Principles and Procedures of Statistics. Second Edition. McGraw-
Hill, New York.
STERN, P. H., 1979. Small-Scale Irrigation: a Manual of Low Cost Water Technology. London:
Intermediate Technology Publications Ltd.
STEVENS, J.B., 2007. Adoption of irrigation scheduling methods in South Africa. PhD Thesis. University
of Pretoria, South Africa. 426pp.
STEWART, G., 2001. Weed control in corn: helping the crop compete. Available online at www.gocorn.
net/Weed2.html [Accessed 13/09/2007].
STEYN, G.J., 1988. A farming systems study of two rural areas in Peddie district of Ciskei. PhD Thesis,
University of Fort Hare, Alice. South Africa.
STIVERS, L., 1999. Crop Profile in New York. Cornell Cooperative Extension. [Online]. Available from:
http://ipmwww.ncsu.edu/opmppiap/proidex.htm [Accessed on 10/10/2006].
156
SWEAIDER, J.M., SULLIVAN, J.G., GRUNAU, J.A. & FREIJI, F., 1988. Nitrate monitoring for pumpkin
production on dryland and irrigated soils. Journal of the American Society of Horticultural Science 113:
684-689.
TAFESSE, M., 2003. Small- scale irrigation for food security in sub-Saharan Africa. Report of a CTA
Study Visit, Ethiopia. CTA Working Document Number 8031 [Online]. Available from:
http://www.cta.int/pubs/wd8031.pdf [Accessed on 12/11/2005].
TANAKA, A. & HARA, T., 1974. Studies on the nutrio-physiology of maize plant: Grain yield as affected
by sowing date. Field Crops Abstracts 27: 565.
TEASEDALE, J.R., 1995. Influence of narrow row/high population corn on weed control and light
transmittance. Weed Technology 9: 113-118.
TERRY, E.R., STALL, W.M., SHILLING, D.G., BEWICK, T.A. & KOSTEWICZ, S.R., 1997. Smooth
Amaranth Interference with watermelon and muskmelon production. HortScience 32 (4): 630-632.
THARP, B.E. & KELLS, J.T., 2001. Effect of glufosinate-resistant corn (Zea mays) population and row
spacing on light interception, corn yield, and common lambsquarters (Chenopodium album) growth.
Weed Technology 15: 413-418.
THOMSON, T.L., DOERGE, T.A. & GODIN, R.E., 2000. Nitrogen and water interactions in subsurface
drip irrigated cauliflower: II. Agronomic, Economic and environmental outcomes. Soil Sci. Soc. Am. J. 64
412-418
THOMSON, T.L., DOERGE, T.A. & GODIN, R.E., 2000. Nitrogen and water interactions in subsurface
drip irrigated cauliflower: II. Agronomic, Economic and environmental outcomes. Soil Science Society of
America Journal 64: 412-418
TLOU, T., MOSAKA, D., PERRET, S., MULLINS, D., & WILLIAMS, C.J., 2006. Investigation of different
farm tenure systems and support structures for establishing small-scale irrigation in long term viable
conditions. WRC Report 1353/1/06. Water Research Commission, Pretoria, South Africa.
TRAPANI, N. & HALL, A., 1996. Effects of leaf position and nitrogen supply on the expansion of leaf of
field grown sunflower. Plant Soil 184: 331-340.
157
UPHOFF, N., 1986. Getting the process right: improving irrigation water management with farmer
organization and participation. Working Paper, Cornell University, 1986.
USDA., 2003. Irrigated Corn Increases in South Africa. Production Estimates and Crop Assessment
Division, Foreign Agricultural Service, May 27, 2003 [Online]. Available from: http://www.fas.usda.gov/
pecad2/highlights/2003/05/ south %5Fafrica/ [Accessed on 18/11/2006].
VAN AVERBEKE, W., 1989. Adapting plant density in maize to the expected available water supply as a
strategy to reduce risk. Ciskei Journal for Rural Development. 1st Quarter, Volume II: 12-17.
VAN AVERBEKE, W. & MARAIS, J.N., 1989. Production practices for potatoes for farmers and gardeners
in Ciskei. Ciskei Journal for Rural Development. 1st Quarter, Volume II: 18-24.
VAN AVERBEKE W., M’MARETE C.K., IGODAN C.O. & BELETE, A., 1998. An investigation into food
plot production at irrigation schemes in Central Eastern Cape. WRC Report No. 719/1/98, South Africa.
VAN AVERBEKE, W., 2008. Best management practices for small-scale subsistence farming on selected
irrigation schemes and surrounding areas through participatory adaptive research in Limpopo province.
Water Research Commission Report TT 344/08. Pretoria.
WATERS, L., BURROWS, R.L., BENNET, M.A. & SCHOENECKER, J., 1990. Seed moisture and
transplant management techniques influence sweet corn stand establishment, growth development and
yield. Journal of American Society of Horticultural Science 8: 60-68.
WESTGATE, M.E., FORCELLA, F., REICOSKY, D.C. & SOMSEN, J., 1997. Rapid canopy closure for
maize production in the northern US Corn Belt: Radiation use efficiency and grain yield. Field Crop
Research 49: 249-258.
WICHELNS, D., 2006. Improving Water and Fertiliser Use in Africa: Challenges, Opportunities, and Policy
Recommendations. Background Paper for the African Fertiliser Summit. June 9-13, Abuja, Nigeria.
WINKIE, M.E., LEAVITT, J.R.C. & BURNSIDE, O.C., 1981. Effect of weed density on herbicide
absorption and bioactivity. Weed Science 29: 405-409.
WHITNEY, S.P., 1999. Crop Profile for Watermelon in Delaware. University of Delaware [Online].
Available from: http://ipmwww.ncsu.edu/opmppiap/ proindex.htm [Accessed on 10/10/2006].
ZIMDAHL, R.L., 1999. Fundamentals of Weed Science. Second Edition. Academic Press, San Diego.
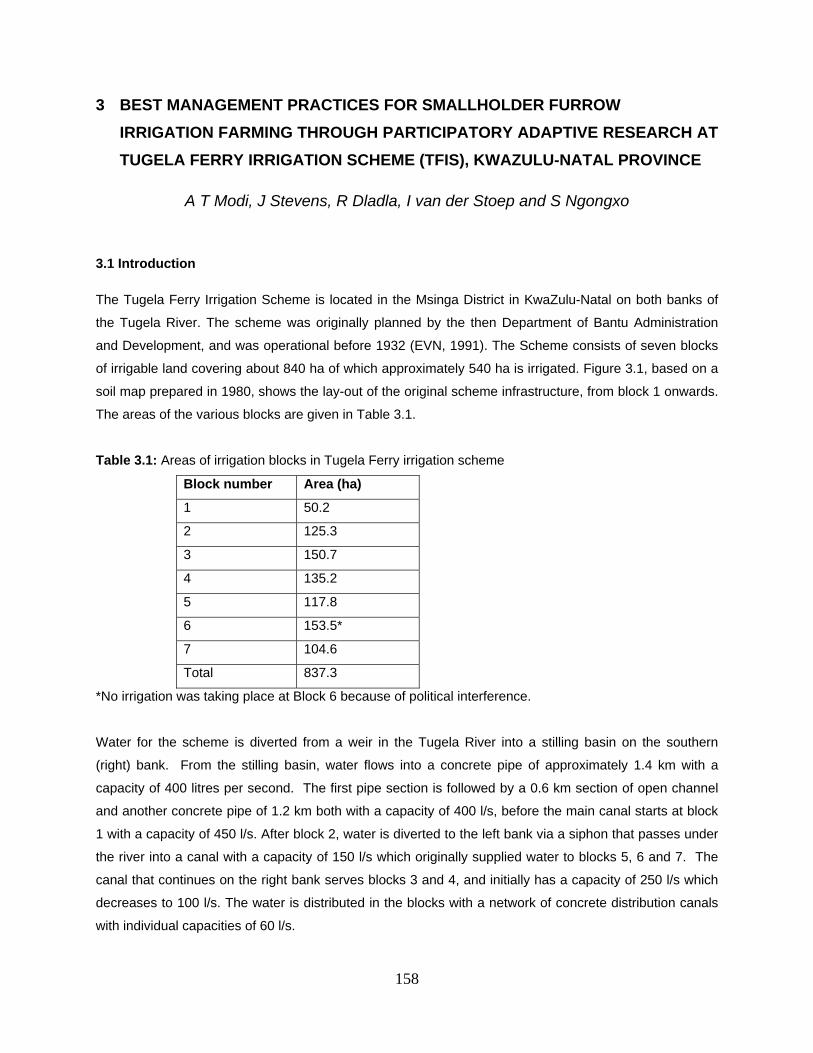
158
3 BEST MANAGEMENT PRACTICES FOR SMALLHOLDER FURROW
IRRIGATION FARMING THROUGH PARTICIPATORY ADAPTIVE RESEARCH AT
TUGELA FERRY IRRIGATION SCHEME (TFIS), KWAZULU-NATAL PROVINCE
A T Modi, J Stevens, R Dladla, I van der Stoep and S Ngongxo
3.1 Introduction
The Tugela Ferry Irrigation Scheme is located in the Msinga District in KwaZulu-Natal on both banks of
the Tugela River. The scheme was originally planned by the then Department of Bantu Administration
and Development, and was operational before 1932 (EVN, 1991). The Scheme consists of seven blocks
of irrigable land covering about 840 ha of which approximately 540 ha is irrigated. Figure 3.1, based on a
soil map prepared in 1980, shows the lay-out of the original scheme infrastructure, from block 1 onwards.
The areas of the various blocks are given in Table 3.1.
Table 3.1: Areas of irrigation blocks in Tugela Ferry irrigation scheme
Block number Area (ha)
1 50.2
2 125.3
3 150.7
4 135.2
5 117.8
6 153.5*
7 104.6
Total 837.3
*No irrigation was taking place at Block 6 because of political interference.
Water for the scheme is diverted from a weir in the Tugela River into a stilling basin on the southern
(right) bank. From the stilling basin, water flows into a concrete pipe of approximately 1.4 km with a
capacity of 400 litres per second. The first pipe section is followed by a 0.6 km section of open channel
and another concrete pipe of 1.2 km both with a capacity of 400 l/s, before the main canal starts at block
1 with a capacity of 450 l/s. After block 2, water is diverted to the left bank via a siphon that passes under
the river into a canal with a capacity of 150 l/s which originally supplied water to blocks 5, 6 and 7. The
canal that continues on the right bank serves blocks 3 and 4, and initially has a capacity of 250 l/s which
decreases to 100 l/s. The water is distributed in the blocks with a network of concrete distribution canals
with individual capacities of 60 l/s.
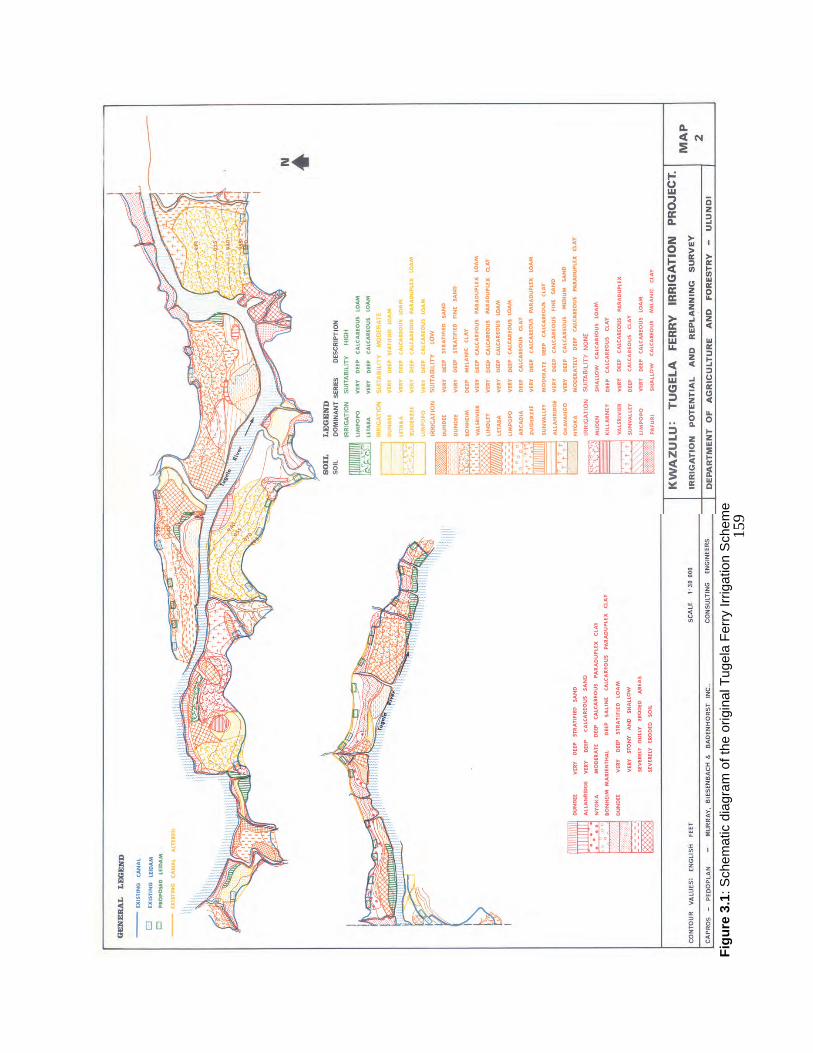
159
Fig
ure
3.1
: Sch
emat
ic d
iagr
am o
f the
orig
inal
Tug
ela
Fer
ry Ir
rigat
ion
Sch
eme
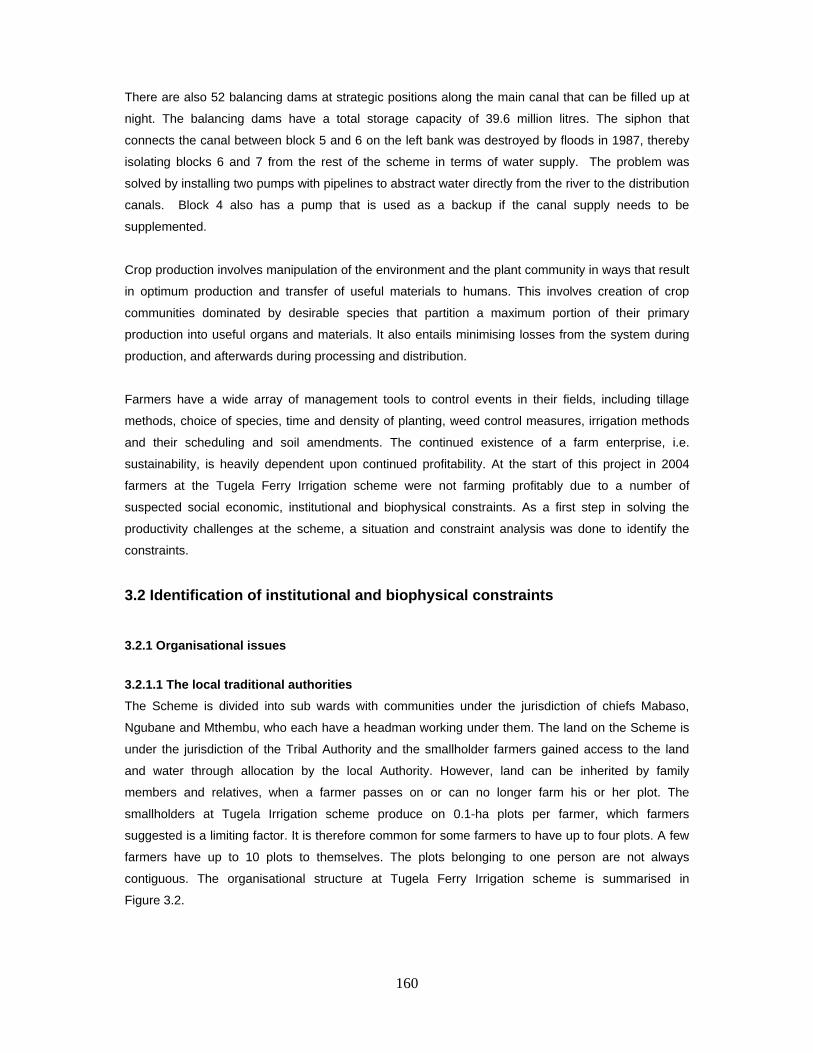
160
There are also 52 balancing dams at strategic positions along the main canal that can be filled up at
night. The balancing dams have a total storage capacity of 39.6 million litres. The siphon that
connects the canal between block 5 and 6 on the left bank was destroyed by floods in 1987, thereby
isolating blocks 6 and 7 from the rest of the scheme in terms of water supply. The problem was
solved by installing two pumps with pipelines to abstract water directly from the river to the distribution
canals. Block 4 also has a pump that is used as a backup if the canal supply needs to be
supplemented.
Crop production involves manipulation of the environment and the plant community in ways that result
in optimum production and transfer of useful materials to humans. This involves creation of crop
communities dominated by desirable species that partition a maximum portion of their primary
production into useful organs and materials. It also entails minimising losses from the system during
production, and afterwards during processing and distribution.
Farmers have a wide array of management tools to control events in their fields, including tillage
methods, choice of species, time and density of planting, weed control measures, irrigation methods
and their scheduling and soil amendments. The continued existence of a farm enterprise, i.e.
sustainability, is heavily dependent upon continued profitability. At the start of this project in 2004
farmers at the Tugela Ferry Irrigation scheme were not farming profitably due to a number of
suspected social economic, institutional and biophysical constraints. As a first step in solving the
productivity challenges at the scheme, a situation and constraint analysis was done to identify the
constraints.
3.2 Identification of institutional and biophysical constraints
3.2.1 Organisational issues
3.2.1.1 The local traditional authorities
The Scheme is divided into sub wards with communities under the jurisdiction of chiefs Mabaso,
Ngubane and Mthembu, who each have a headman working under them. The land on the Scheme is
under the jurisdiction of the Tribal Authority and the smallholder farmers gained access to the land
and water through allocation by the local Authority. However, land can be inherited by family
members and relatives, when a farmer passes on or can no longer farm his or her plot. The
smallholders at Tugela Irrigation scheme produce on 0.1-ha plots per farmer, which farmers
suggested is a limiting factor. It is therefore common for some farmers to have up to four plots. A few
farmers have up to 10 plots to themselves. The plots belonging to one person are not always
contiguous. The organisational structure at Tugela Ferry Irrigation scheme is summarised in
Figure 3.2.
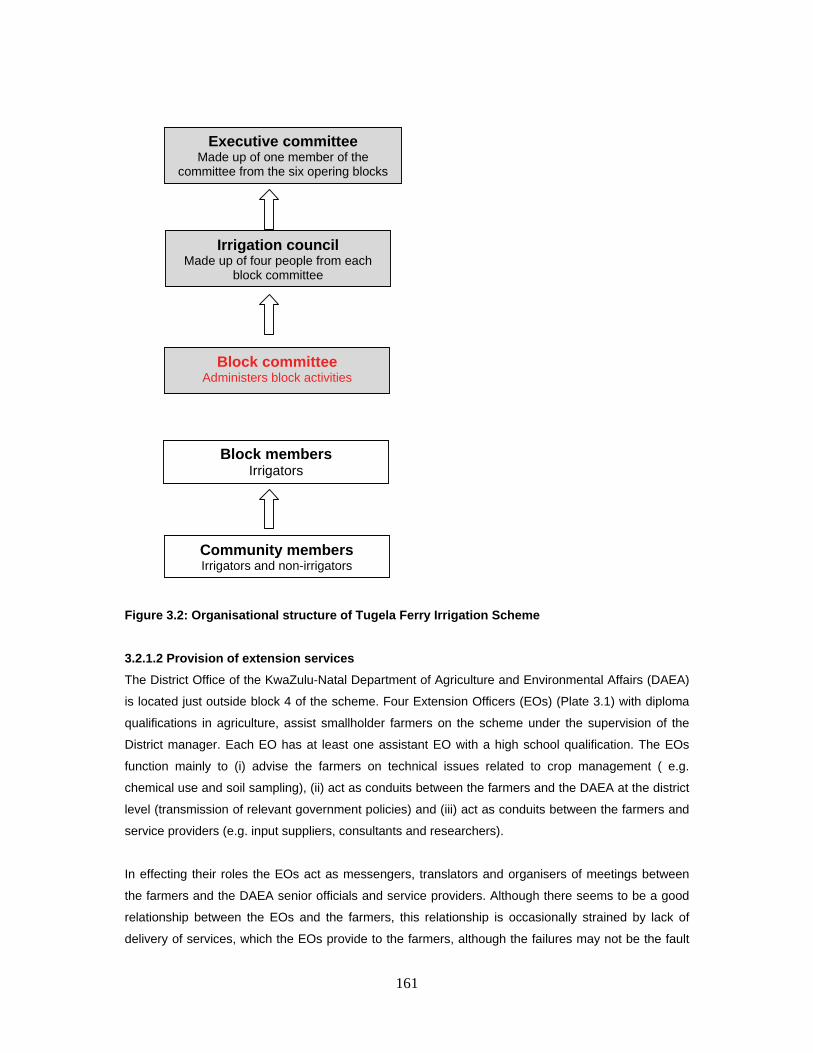
161
Figure 3.2: Organisational structure of Tugela Ferry Irrigation Scheme
3.2.1.2 Provision of extension services
The District Office of the KwaZulu-Natal Department of Agriculture and Environmental Affairs (DAEA)
is located just outside block 4 of the scheme. Four Extension Officers (EOs) (Plate 3.1) with diploma
qualifications in agriculture, assist smallholder farmers on the scheme under the supervision of the
District manager. Each EO has at least one assistant EO with a high school qualification. The EOs
function mainly to (i) advise the farmers on technical issues related to crop management ( e.g.
chemical use and soil sampling), (ii) act as conduits between the farmers and the DAEA at the district
level (transmission of relevant government policies) and (iii) act as conduits between the farmers and
service providers (e.g. input suppliers, consultants and researchers).
In effecting their roles the EOs act as messengers, translators and organisers of meetings between
the farmers and the DAEA senior officials and service providers. Although there seems to be a good
relationship between the EOs and the farmers, this relationship is occasionally strained by lack of
delivery of services, which the EOs provide to the farmers, although the failures may not be the fault
Block committee Administers block activities
Irrigation council Made up of four people from each
block committee
Executive committee Made up of one member of the
committee from the six opering blocks
Block members Irrigators
Community members Irrigators and non-irrigators
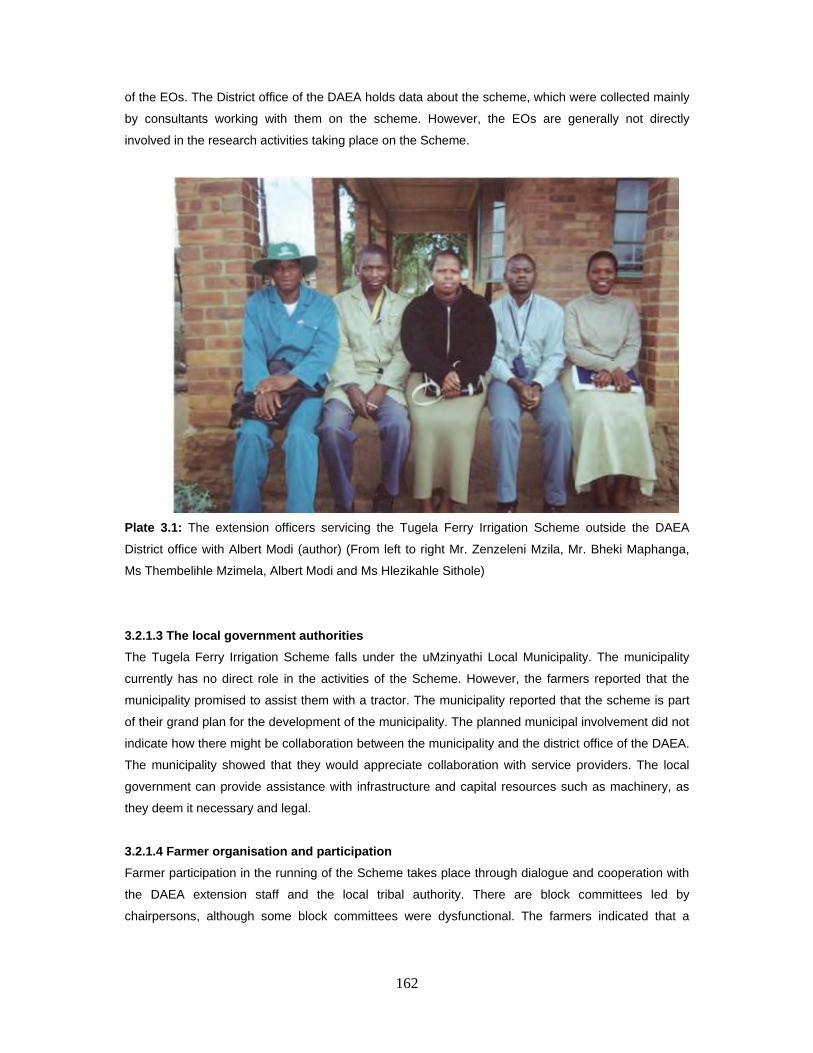
162
of the EOs. The District office of the DAEA holds data about the scheme, which were collected mainly
by consultants working with them on the scheme. However, the EOs are generally not directly
involved in the research activities taking place on the Scheme.
Plate 3.1: The extension officers servicing the Tugela Ferry Irrigation Scheme outside the DAEA
District office with Albert Modi (author) (From left to right Mr. Zenzeleni Mzila, Mr. Bheki Maphanga,
Ms Thembelihle Mzimela, Albert Modi and Ms Hlezikahle Sithole)
3.2.1.3 The local government authorities
The Tugela Ferry Irrigation Scheme falls under the uMzinyathi Local Municipality. The municipality
currently has no direct role in the activities of the Scheme. However, the farmers reported that the
municipality promised to assist them with a tractor. The municipality reported that the scheme is part
of their grand plan for the development of the municipality. The planned municipal involvement did not
indicate how there might be collaboration between the municipality and the district office of the DAEA.
The municipality showed that they would appreciate collaboration with service providers. The local
government can provide assistance with infrastructure and capital resources such as machinery, as
they deem it necessary and legal.
3.2.1.4 Farmer organisation and participation
Farmer participation in the running of the Scheme takes place through dialogue and cooperation with
the DAEA extension staff and the local tribal authority. There are block committees led by
chairpersons, although some block committees were dysfunctional. The farmers indicated that a
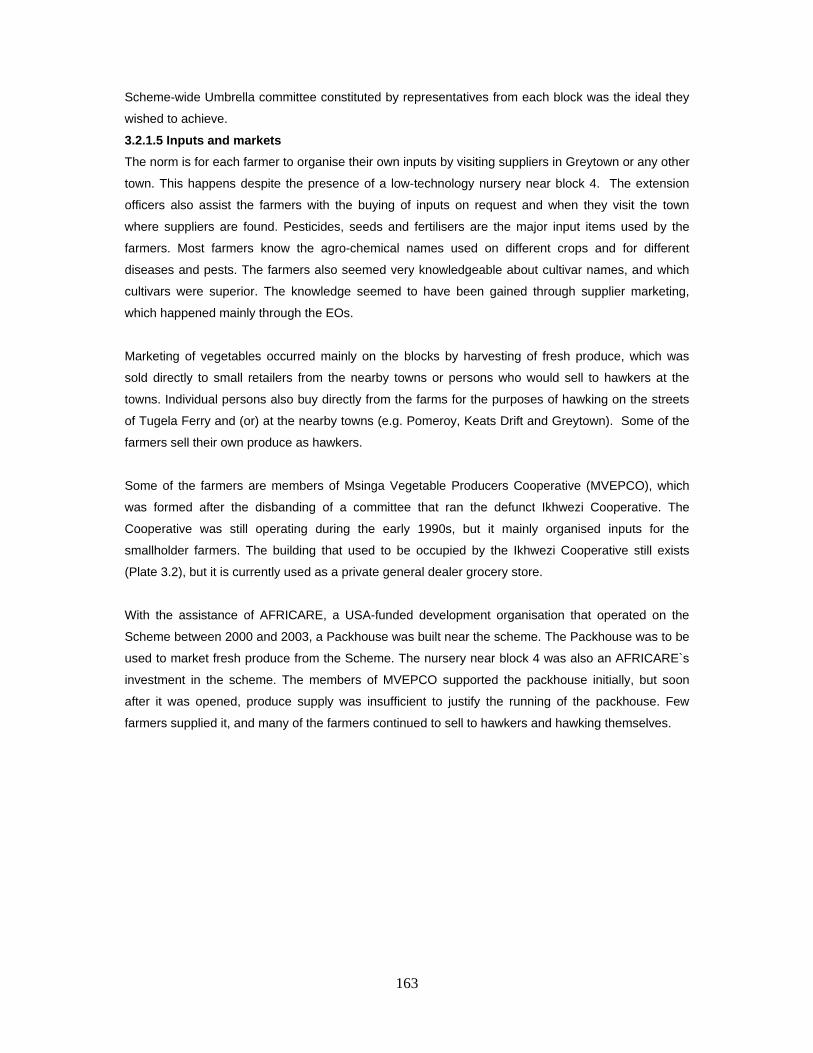
163
Scheme-wide Umbrella committee constituted by representatives from each block was the ideal they
wished to achieve.
3.2.1.5 Inputs and markets
The norm is for each farmer to organise their own inputs by visiting suppliers in Greytown or any other
town. This happens despite the presence of a low-technology nursery near block 4. The extension
officers also assist the farmers with the buying of inputs on request and when they visit the town
where suppliers are found. Pesticides, seeds and fertilisers are the major input items used by the
farmers. Most farmers know the agro-chemical names used on different crops and for different
diseases and pests. The farmers also seemed very knowledgeable about cultivar names, and which
cultivars were superior. The knowledge seemed to have been gained through supplier marketing,
which happened mainly through the EOs.
Marketing of vegetables occurred mainly on the blocks by harvesting of fresh produce, which was
sold directly to small retailers from the nearby towns or persons who would sell to hawkers at the
towns. Individual persons also buy directly from the farms for the purposes of hawking on the streets
of Tugela Ferry and (or) at the nearby towns (e.g. Pomeroy, Keats Drift and Greytown). Some of the
farmers sell their own produce as hawkers.
Some of the farmers are members of Msinga Vegetable Producers Cooperative (MVEPCO), which
was formed after the disbanding of a committee that ran the defunct Ikhwezi Cooperative. The
Cooperative was still operating during the early 1990s, but it mainly organised inputs for the
smallholder farmers. The building that used to be occupied by the Ikhwezi Cooperative still exists
(Plate 3.2), but it is currently used as a private general dealer grocery store.
With the assistance of AFRICARE, a USA-funded development organisation that operated on the
Scheme between 2000 and 2003, a Packhouse was built near the scheme. The Packhouse was to be
used to market fresh produce from the Scheme. The nursery near block 4 was also an AFRICARE`s
investment in the scheme. The members of MVEPCO supported the packhouse initially, but soon
after it was opened, produce supply was insufficient to justify the running of the packhouse. Few
farmers supplied it, and many of the farmers continued to sell to hawkers and hawking themselves.
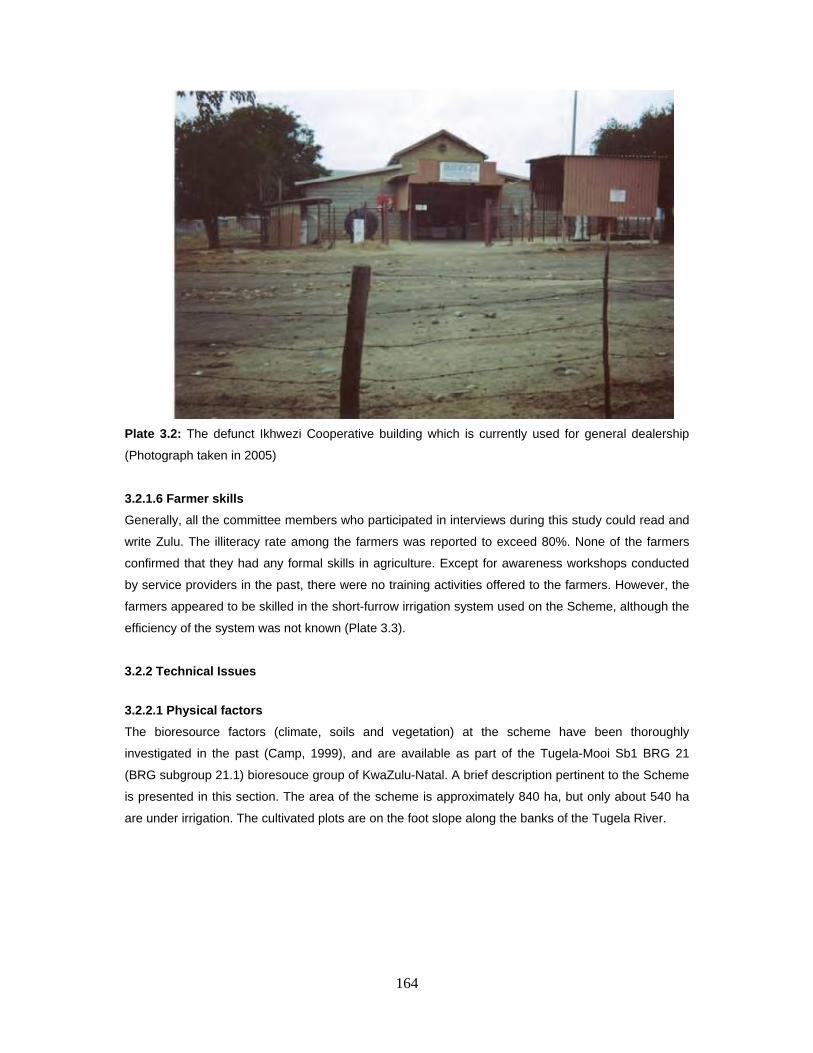
164
Plate 3.2: The defunct Ikhwezi Cooperative building which is currently used for general dealership
(Photograph taken in 2005)
3.2.1.6 Farmer skills
Generally, all the committee members who participated in interviews during this study could read and
write Zulu. The illiteracy rate among the farmers was reported to exceed 80%. None of the farmers
confirmed that they had any formal skills in agriculture. Except for awareness workshops conducted
by service providers in the past, there were no training activities offered to the farmers. However, the
farmers appeared to be skilled in the short-furrow irrigation system used on the Scheme, although the
efficiency of the system was not known (Plate 3.3).
3.2.2 Technical Issues
3.2.2.1 Physical factors
The bioresource factors (climate, soils and vegetation) at the scheme have been thoroughly
investigated in the past (Camp, 1999), and are available as part of the Tugela-Mooi Sb1 BRG 21
(BRG subgroup 21.1) bioresouce group of KwaZulu-Natal. A brief description pertinent to the Scheme
is presented in this section. The area of the scheme is approximately 840 ha, but only about 540 ha
are under irrigation. The cultivated plots are on the foot slope along the banks of the Tugela River.
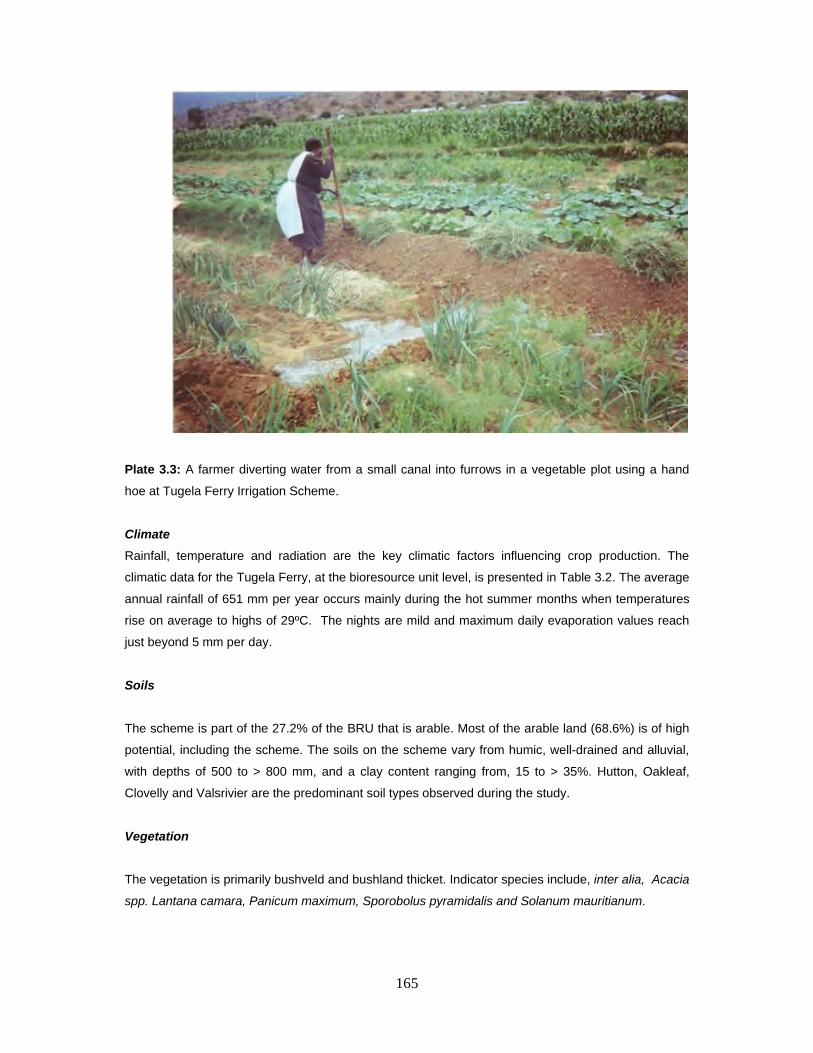
165
Plate 3.3: A farmer diverting water from a small canal into furrows in a vegetable plot using a hand
hoe at Tugela Ferry Irrigation Scheme.
Climate
Rainfall, temperature and radiation are the key climatic factors influencing crop production. The
climatic data for the Tugela Ferry, at the bioresource unit level, is presented in Table 3.2. The average
annual rainfall of 651 mm per year occurs mainly during the hot summer months when temperatures
rise on average to highs of 29ºC. The nights are mild and maximum daily evaporation values reach
just beyond 5 mm per day.
Soils
The scheme is part of the 27.2% of the BRU that is arable. Most of the arable land (68.6%) is of high
potential, including the scheme. The soils on the scheme vary from humic, well-drained and alluvial,
with depths of 500 to > 800 mm, and a clay content ranging from, 15 to > 35%. Hutton, Oakleaf,
Clovelly and Valsrivier are the predominant soil types observed during the study.
Vegetation
The vegetation is primarily bushveld and bushland thicket. Indicator species include, inter alia, Acacia
spp. Lantana camara, Panicum maximum, Sporobolus pyramidalis and Solanum mauritianum.
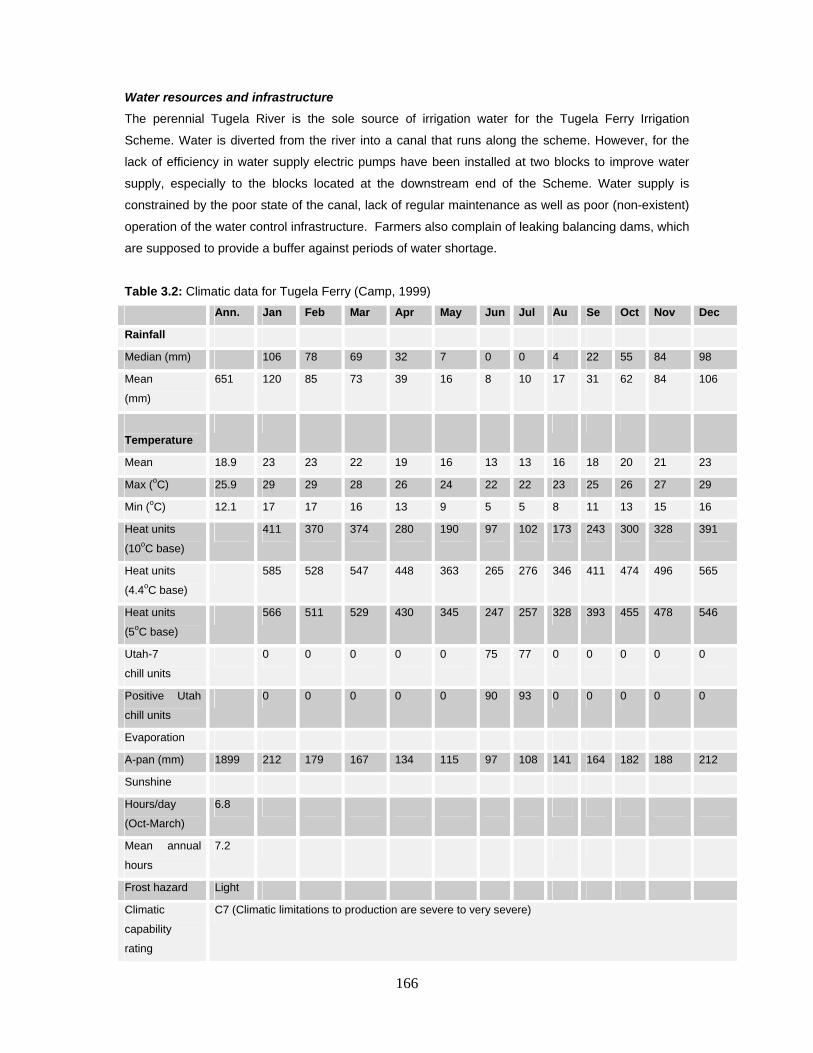
166
Water resources and infrastructure
The perennial Tugela River is the sole source of irrigation water for the Tugela Ferry Irrigation
Scheme. Water is diverted from the river into a canal that runs along the scheme. However, for the
lack of efficiency in water supply electric pumps have been installed at two blocks to improve water
supply, especially to the blocks located at the downstream end of the Scheme. Water supply is
constrained by the poor state of the canal, lack of regular maintenance as well as poor (non-existent)
operation of the water control infrastructure. Farmers also complain of leaking balancing dams, which
are supposed to provide a buffer against periods of water shortage.
Table 3.2: Climatic data for Tugela Ferry (Camp, 1999)
Ann. Jan Feb Mar Apr May Jun Jul Au Se Oct Nov Dec
Rainfall
Median (mm) 106 78 69 32 7 0 0 4 22 55 84 98
Mean
(mm)
651 120 85 73 39 16 8 10 17 31 62 84 106
Temperature
Mean 18.9 23 23 22 19 16 13 13 16 18 20 21 23
Max (oC) 25.9 29 29 28 26 24 22 22 23 25 26 27 29
Min (oC) 12.1 17 17 16 13 9 5 5 8 11 13 15 16
Heat units
(10oC base)
411 370 374 280 190 97 102 173 243 300 328 391
Heat units
(4.4oC base)
585 528 547 448 363 265 276 346 411 474 496 565
Heat units
(5oC base)
566 511 529 430 345 247 257 328 393 455 478 546
Utah-7
chill units
0 0 0 0 0 75 77 0 0 0 0 0
Positive Utah
chill units
0 0 0 0 0 90 93 0 0 0 0 0
Evaporation
A-pan (mm) 1899 212 179 167 134 115 97 108 141 164 182 188 212
Sunshine
Hours/day
(Oct-March)
6.8
Mean annual
hours
7.2
Frost hazard Light
Climatic
capability
rating
C7 (Climatic limitations to production are severe to very severe)
167
Farmers in blocks 4 and 7 had to pay electricity bills for operating the pumps at these blocks and this
added an additional financial burden on them (which the rest of the Scheme’s farmers do not have).
There are also no standby pumps in case of breakdowns.
Farmers seemed to have little understanding of the concept of scheduling, which suggested that if
better scheduling practices could be implemented it would reduce the pressure on the water supply
system and possibly also improve yields.
3.2.2.2 Crop production potential
Crop production potential (Box 1) for the Scheme is on the medium to the higher end of the scale for
the Sb1 BRU. Selected crops and alternative crops that can be considered are shown in Table 3.3.
The list is a first approximation according to the KZN-DAEA bioresource data. It is important to note
that the yields data shown in Table 3.3 are also an approximation of attainable yield. Therefore, the
management aptitude of the farmers is critical in determining what can be actually achieved.
Box 1: Actual, Attainable, and Potential yields
There are very few examples in the world where production per unit land is maximised, and the current yields of an agroecosystem are usually a poor indicator of potential performance. Observed yields may fall anywhere on a continuum between crop failure and potential yield. The Food and Agriculture Organisation of the United Nations (FAO/IIASA, 1991) aptly describes this continuum as follows: (i) Actual yield is the average yield of a district, which represents the current state of
soils and climate, average skill of the farmers and their average use of available technology.
(ii) Attainable yield corresponds to the best yields achieved through skilful use of the best available technology, and it is usually reported by experiment stations and the best growers.
(iii) Potential yield is what might be obtained for a particular plant species when not limited by technology, i.e. when the best cultivars, fertiliser, machinery and labour, including knowledge, are all available and applied in the best possible ways. Where water supply is a limiting resource and the opportunity for irrigation exists, knowledge of potential yields with and without supplemental irrigation is useful. Potential yield is commonly assessed by theoretical models as restrained by climate and by physiological and morphological attributes of the plant species. In practice, potential yield models must be validated against reality with record yields (highest observed yields) serving as one standard. The concepts of actual, attainable, record and potential yields assist in assessments of farming systems and help to identify opportunities for improvement. They also help to define the intensity of farming. Where actual yields are close to the attainable yields agriculture may be described as intensive. In South Africa agriculture ranges from intensive to frequent crop failure associated with low inputs and poor management. Small-holder irrigation schemes, such as the Tugela Ferry Irrigation scheme, are characterised by conditions intensive cultivation, but poor management practices often limit attainment of potential yield (Van Averbeke, 2008).
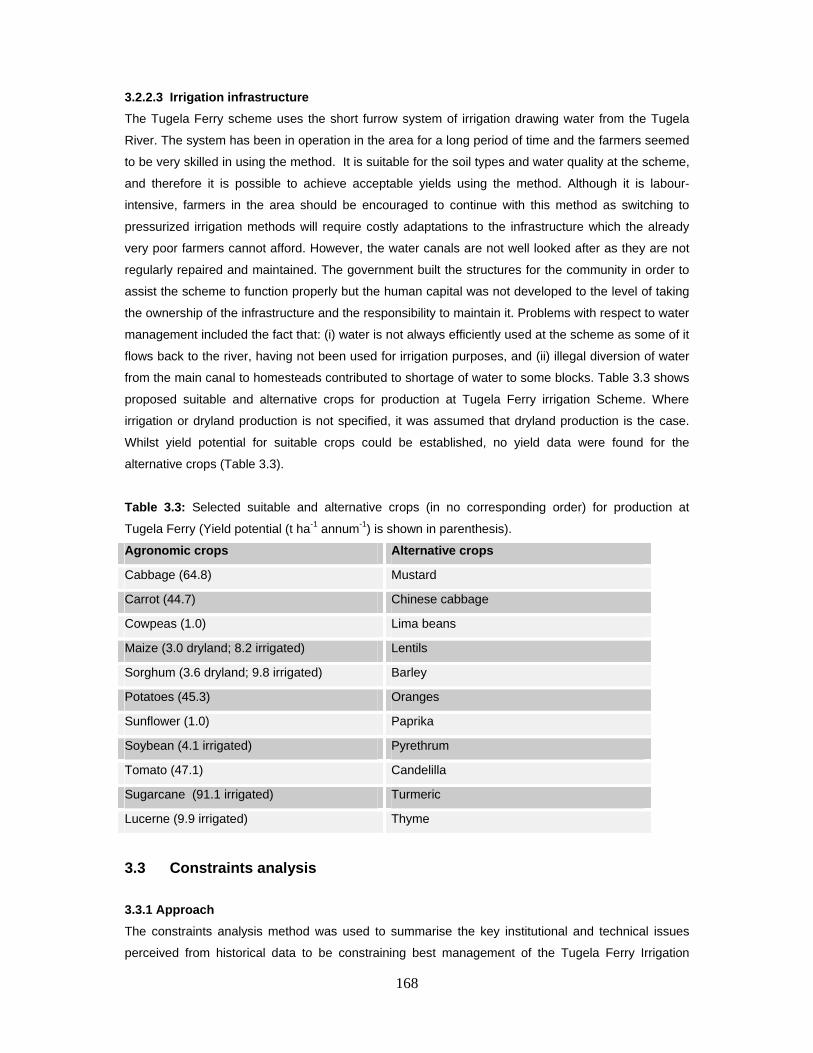
168
3.2.2.3 Irrigation infrastructure
The Tugela Ferry scheme uses the short furrow system of irrigation drawing water from the Tugela
River. The system has been in operation in the area for a long period of time and the farmers seemed
to be very skilled in using the method. It is suitable for the soil types and water quality at the scheme,
and therefore it is possible to achieve acceptable yields using the method. Although it is labour-
intensive, farmers in the area should be encouraged to continue with this method as switching to
pressurized irrigation methods will require costly adaptations to the infrastructure which the already
very poor farmers cannot afford. However, the water canals are not well looked after as they are not
regularly repaired and maintained. The government built the structures for the community in order to
assist the scheme to function properly but the human capital was not developed to the level of taking
the ownership of the infrastructure and the responsibility to maintain it. Problems with respect to water
management included the fact that: (i) water is not always efficiently used at the scheme as some of it
flows back to the river, having not been used for irrigation purposes, and (ii) illegal diversion of water
from the main canal to homesteads contributed to shortage of water to some blocks. Table 3.3 shows
proposed suitable and alternative crops for production at Tugela Ferry irrigation Scheme. Where
irrigation or dryland production is not specified, it was assumed that dryland production is the case.
Whilst yield potential for suitable crops could be established, no yield data were found for the
alternative crops (Table 3.3).
Table 3.3: Selected suitable and alternative crops (in no corresponding order) for production at
Tugela Ferry (Yield potential (t ha-1 annum-1) is shown in parenthesis).
Agronomic crops Alternative crops
Cabbage (64.8) Mustard
Carrot (44.7) Chinese cabbage
Cowpeas (1.0) Lima beans
Maize (3.0 dryland; 8.2 irrigated) Lentils
Sorghum (3.6 dryland; 9.8 irrigated) Barley
Potatoes (45.3) Oranges
Sunflower (1.0) Paprika
Soybean (4.1 irrigated) Pyrethrum
Tomato (47.1) Candelilla
Sugarcane (91.1 irrigated) Turmeric
Lucerne (9.9 irrigated) Thyme
3.3 Constraints analysis
3.3.1 Approach
The constraints analysis method was used to summarise the key institutional and technical issues
perceived from historical data to be constraining best management of the Tugela Ferry Irrigation
169
Scheme. The summary presented in this section focused on issues that affect the scheme as an
agroecosystem; hence, the general socio-economic and technical issues that are not related to
agriculture are not discussed. Nine issues that have a negative impact on the management of the
Tugela Irrigation scheme were identified (Figure 3.2). The issues included the institutional and
technical aspects. A cascading effect was chosen to illustrate the hierarchical relationship the issues
in each set (cascades 1, 2 and 3) have, and how their combination leads to deterioration of the
institutional and technical arrangements. The consequence of poor institutional and technical system
is a compromise or loss of key agroecosystem attributes: sustainability, stability, equitability and
autonomy. Each issue (one box in a cascade) can be analysed to identify key relevant aspects. These
aspects are discussed in the context of important attributes of agroecosystems (Box 2) for best
management as they pertain to the Tugela Ferry irrigation scheme.
Box 2: Attributes of an agroecosystem for best management
(a) Productivity is the quantitative measure of the rate and amount of production per unit of land or input. In ecological terms, production refers to the amount of yield or end product, and it is also the process of achieving that end product (Pardey and Wright, 2003). In evaluating small farm production, it is sometimes forgotten that most farmers place a higher value on reducing risk than on maximising production. Small farmers are usually more interested in optimising productivity of scarce resources than increasing labour productivity. Small farmers also choose a particular technology based on decisions made for the entire farming system, not for a particular crop (Harwood, 1979). A commercial agricultural system typically exhibits input: output ratios of 3:1, whereas traditional farming systems exhibit ratios of 10:1. (b) Sustainability refers to the ability of an agroecosystem to maintain production through time, in the face of long term ecological constraints and socioeconomic pressures (Altieri, 1998). An important feature of sustainability is the capacity of the agroecosystem to maintain a non-declining yield over time, with a broad range of conditions. Stability is the constancy of production under a given set of environmental, economic and management conditions (Conway, 1985). Some ecological pressures, like weather, are rigid constraints in the sense that the farmer virtually cannot modify them. In other cases, the farmer can improve the biological stability of the system by choosing more suitable crops, or developing methods of cultivation that improve yields. The land can be irrigated, mulched, manured and rotated, or crops can be grown in mixtures to improve the resilience of the system. The farmer can supplement family labour with either animals or machines, or by employing other people’s labour. Thus, the exact response depends on social factors as well as the environment. For this reason, the concept of stability must be expanded to embrace the socioeconomic and management considerations. In this regard, Harwood (1979) defined three other sources of stability: Management stability is derived from choosing the set of technologies best adapted to the farmers’ needs and resources. Initially, industrial technology usually increases yield, as less and less land is left fallow, and soil, water and biotic limitations are bypassed. However, there is always an element of instability associated with the new technologies. The farmers are keenly aware of this, and their resistance to change often has an ecological basis. Economic stability is associated with the farmer’s ability to predict market prices of inputs and products, and to sustain farm income. Depending on the sophistication of this knowledge, the farmer will make tradeoffs between production and stability. Cultural stability depends on the maintenance of the socio-cultural organisation and context that has nurtured the agroecosystem through generations. Rural development cannot be achieved when isolated from the social context, and it must be anchored to local traditions. (d) Equitability is a measure of how evenly the products of the agroecosystem are distributed among the local producers and consumers (Conway, 1985). However, equity is much more than simply a matter of an adequate income, good nutrition or satisfactory amount of leisure (Bayliss-Smith, 1982). To some, equity is reached when an agroecosystem meets reasonable demands for food without increases the social cost of production. To others, equity is reached when the distribution of opportunities or incomes within production communities improves (Douglass, 1984). (e) Autonomy is the degree that agriculture is independent of the larger society. It is important in social and economic analysis. Subsistence farmers have a high degree of autonomy, but they contribute little to urban economies.
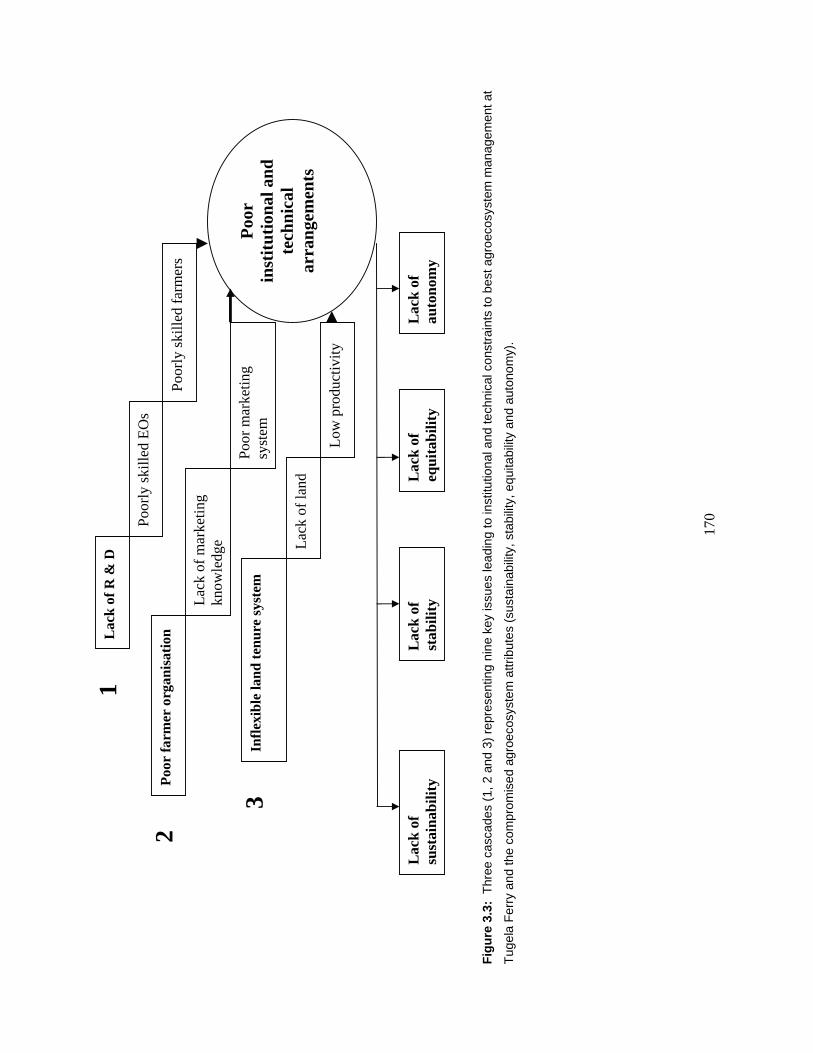
170
F
igu
re 3
.3:
Thr
ee c
asca
des
(1, 2
and
3)
repr
esen
ting
nin
e ke
y is
sue
s le
adi
ng
to in
stitu
tion
al a
nd te
chni
cal c
onst
rain
ts to
bes
t agr
oec
osys
tem
man
agem
ent a
t
Tug
ela
Fe
rry
and
the
com
prom
ised
ag
roec
osys
tem
attr
ibut
es (
sust
aina
bilit
y, s
tabi
lity,
equ
itabi
lity
and
auto
nom
y).
1
2
3 P
oor
inst
itu
tion
al a
nd
te
chn
ical
ar
ran
gem
ents
Lac
k of
R &
D
Poo
rly
skil
led
EO
s
Poor
ly s
kill
ed f
arm
ers
Poo
r fa
rmer
org
anis
atio
n
Lac
k of
mar
keti
ng
know
ledg
e
Poo
r m
arke
ting
sy
stem
In
flex
ible
lan
d t
enu
re s
yste
m
Lac
k of
land
Low
pro
duct
ivit
y
Lac
k o
f su
stai
nab
ility
L
ack
of
stab
ility
L
ack
of
eq
uit
abili
ty
Lac
k o
f au
ton
omy
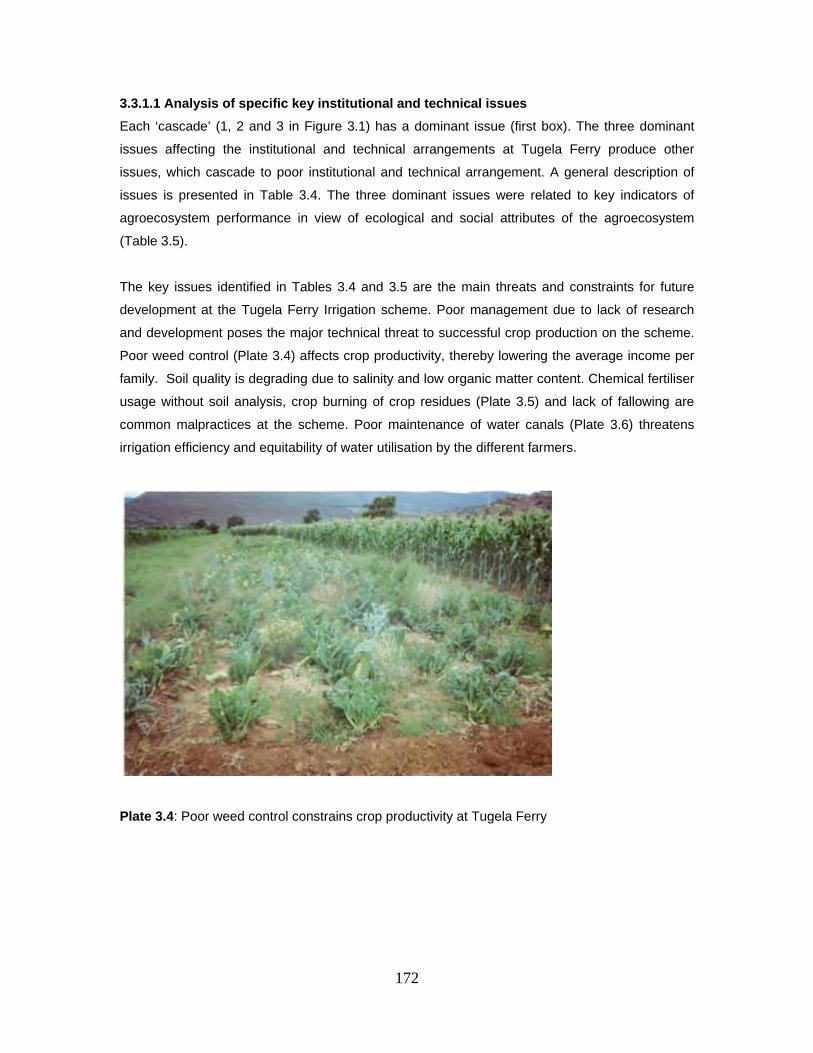
172
3.3.1.1 Analysis of specific key institutional and technical issues
Each ‘cascade’ (1, 2 and 3 in Figure 3.1) has a dominant issue (first box). The three dominant
issues affecting the institutional and technical arrangements at Tugela Ferry produce other
issues, which cascade to poor institutional and technical arrangement. A general description of
issues is presented in Table 3.4. The three dominant issues were related to key indicators of
agroecosystem performance in view of ecological and social attributes of the agroecosystem
(Table 3.5).
The key issues identified in Tables 3.4 and 3.5 are the main threats and constraints for future
development at the Tugela Ferry Irrigation scheme. Poor management due to lack of research
and development poses the major technical threat to successful crop production on the scheme.
Poor weed control (Plate 3.4) affects crop productivity, thereby lowering the average income per
family. Soil quality is degrading due to salinity and low organic matter content. Chemical fertiliser
usage without soil analysis, crop burning of crop residues (Plate 3.5) and lack of fallowing are
common malpractices at the scheme. Poor maintenance of water canals (Plate 3.6) threatens
irrigation efficiency and equitability of water utilisation by the different farmers.
Plate 3.4: Poor weed control constrains crop productivity at Tugela Ferry
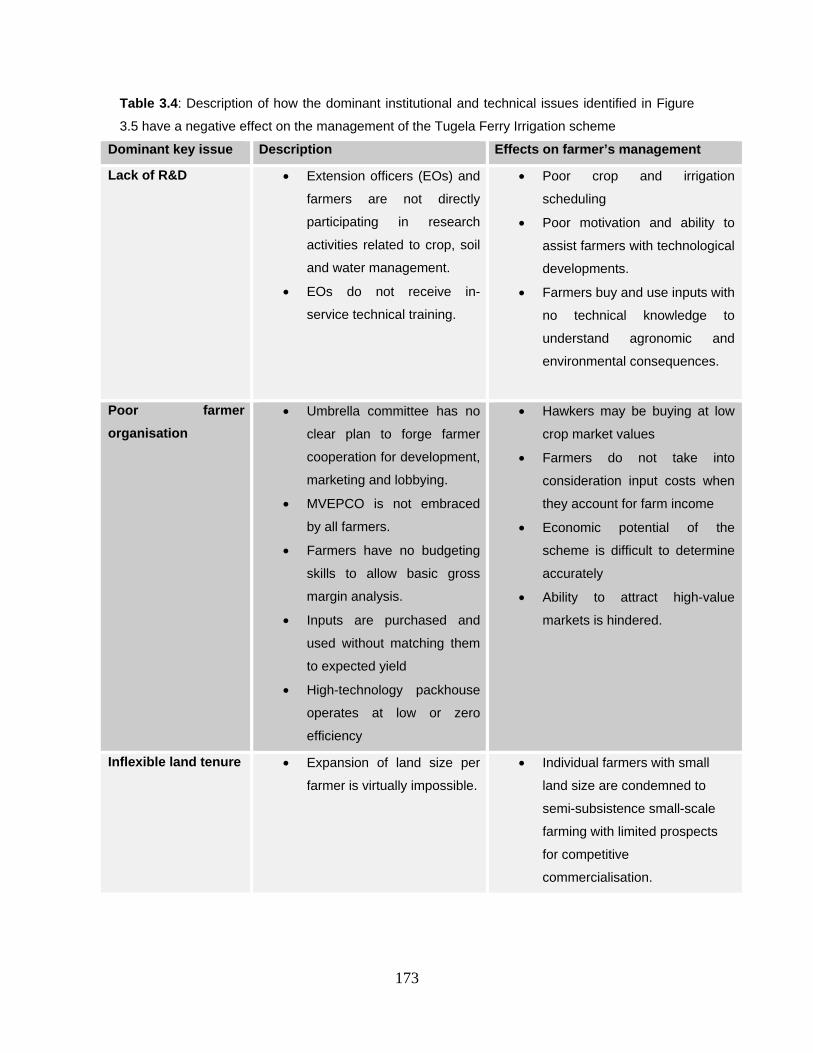
173
Table 3.4: Description of how the dominant institutional and technical issues identified in Figure
3.5 have a negative effect on the management of the Tugela Ferry Irrigation scheme
Dominant key issue Description Effects on farmer’s management
Lack of R&D Extension officers (EOs) and
farmers are not directly
participating in research
activities related to crop, soil
and water management.
EOs do not receive in-
service technical training.
Poor crop and irrigation
scheduling
Poor motivation and ability to
assist farmers with technological
developments.
Farmers buy and use inputs with
no technical knowledge to
understand agronomic and
environmental consequences.
Poor farmer
organisation
Umbrella committee has no
clear plan to forge farmer
cooperation for development,
marketing and lobbying.
MVEPCO is not embraced
by all farmers.
Farmers have no budgeting
skills to allow basic gross
margin analysis.
Inputs are purchased and
used without matching them
to expected yield
High-technology packhouse
operates at low or zero
efficiency
Hawkers may be buying at low
crop market values
Farmers do not take into
consideration input costs when
they account for farm income
Economic potential of the
scheme is difficult to determine
accurately
Ability to attract high-value
markets is hindered.
Inflexible land tenure Expansion of land size per
farmer is virtually impossible.
Individual farmers with small
land size are condemned to
semi-subsistence small-scale
farming with limited prospects
for competitive
commercialisation.
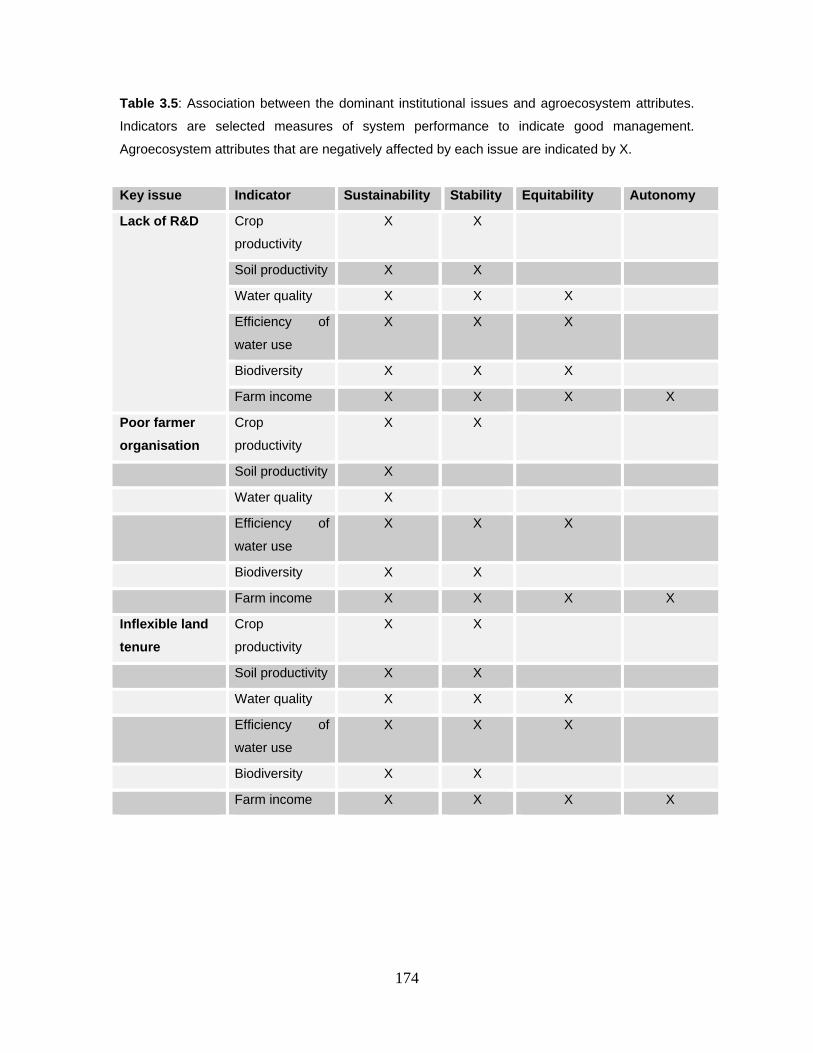
174
Table 3.5: Association between the dominant institutional issues and agroecosystem attributes.
Indicators are selected measures of system performance to indicate good management.
Agroecosystem attributes that are negatively affected by each issue are indicated by X.
Key issue Indicator Sustainability Stability Equitability Autonomy
Lack of R&D Crop
productivity
X X
Soil productivity X X
Water quality X X X
Efficiency of
water use
X X X
Biodiversity X X X
Farm income X X X X
Poor farmer
organisation
Crop
productivity
X X
Soil productivity X
Water quality X
Efficiency of
water use
X X X
Biodiversity X X
Farm income X X X X
Inflexible land
tenure
Crop
productivity
X X
Soil productivity X X
Water quality X X X
Efficiency of
water use
X X X
Biodiversity X X
Farm income X X X X
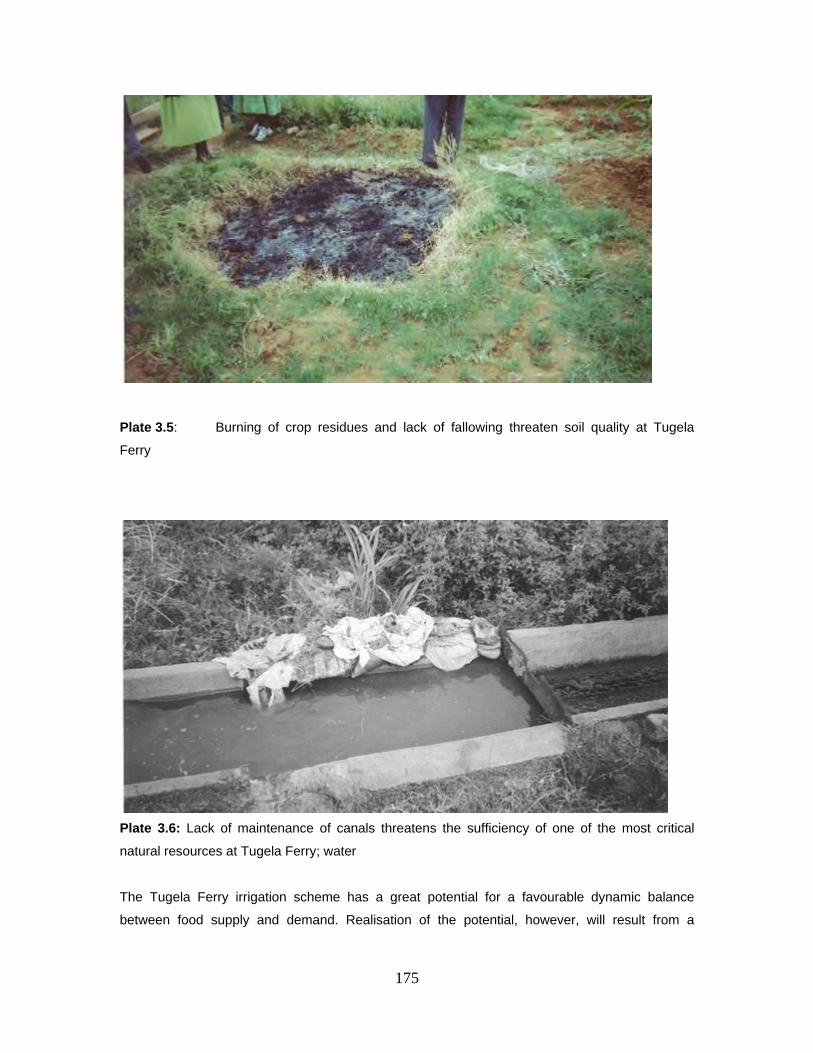
175
Plate 3.5: Burning of crop residues and lack of fallowing threaten soil quality at Tugela
Ferry
Plate 3.6: Lack of maintenance of canals threatens the sufficiency of one of the most critical
natural resources at Tugela Ferry; water
The Tugela Ferry irrigation scheme has a great potential for a favourable dynamic balance
between food supply and demand. Realisation of the potential, however, will result from a
176
successful interaction among farmers, input suppliers, and an overwhelmingly public supported
research and extension system that furnishes innovations and relevant knowledge for farmers.
In addition to innovations derived from R&D and extension services, organisation of farmers in
orientation to market requirements and improvement of the land tenure system are key to the
creation of enabling conditions for the development of Tugela Ferry farmers. Indeed NEPAD
(2003) suggested that to alleviate Africa’s problem of inadequate and inefficient agricultural
systems coupled with weak institutional support, improved farmer organisation, focussed
participatory R&D, improved market skills for farmers and government intervention are needed.
3.4 Participatory implementation of solutions to socioeconomic and
organizational constraints at Tugela Ferry
3.4.1 Background and objectives
Research undertaken in Tugela Ferry in 2005 and 2006 showed that farmers’ knowledge of crop
management was adequate for the purposes of smallholder production, but they lacked record
keeping skills for farm management. Farmers were therefore subsequently subjected to short
training sessions on basic principles of farm management with a focus on partial budgeting.
Socio-economic research focussed on investigating the potential role of dysfunctional institutions,
Msinga Vegetable Producers Cooperative (MVEPCO) and the Msinga Packhouse for
strengthening of institutional arrangements (rules of cooperation among the farmers in the
management of the scheme from the individual plot level through to the whole scheme’s
operation of production and marketing related activities, including collaborations with relevant
external bodies). In addition, a plan to establish a Water Users Association was developed for the
Tugela Ferry Irrigation Scheme and the surrounding dryland (rainfed) areas. In this chapter,
socioeconomic research activities are presented.
3.4.2 An approach to link implementation of organizational arrangements, marketing and
crop production plans at Tugela Ferry
This study was aimed at identification of interventions to address some of the key constraints to
best management practices at Tugela Ferry. It focused on deliberations among the project
researchers, farmers, extension officers and key stakeholders about co-ordinately producing a
strategy to research and/or extension activities on a crop production plan that is linked to a
marketing strategy through successful institutional arrangements at all levels of the Tugela
Irrigation Scheme by the end of 2007.
177
3.4.2.1 Strategy conceptualisation
Project researchers responsible for production, marketing and social (institutional) aspects of the
research held a workshop to produce a conceptual framework to coordinate their efforts towards
best management practices on the Tugela Ferry Irrigation Scheme (Figure 3.3). This framework
was presented and discussed at a workshop where the farmers from the Tugela Ferry Irrigation
Scheme, the local Department of Agriculture, the local Municipality and representatives from the
Department of Water Affairs were present. From the concept map, three objectives of the strategy
can be identified:
(a) Establishment of goal-oriented organizational arrangements
It was established that only six of the seven blocks at the time were actively involved in crop
production: blocks 1, 2, 3, 4, 5 and 7. All blocks, except block 2 had executive committees and
constitutions, but the committees were not working efficiently. Furthermore, there was no
scheme-wide umbrella committee.
(b) Establishment of a Water Users Association
A proposal was made to establish a Water Users Association (WUA) that would encompass the
Tugela Irrigation Scheme and the surrounding dryland areas. The proposal to establish an
encompassing WUA was debated by the project researchers, DWAF officials, extension officers
and farmers. The merits and demerits of that approach compared with the establishment of a
WUA for the scheme only were debated, and the views of the farmers are summarised in
Table 3.6.
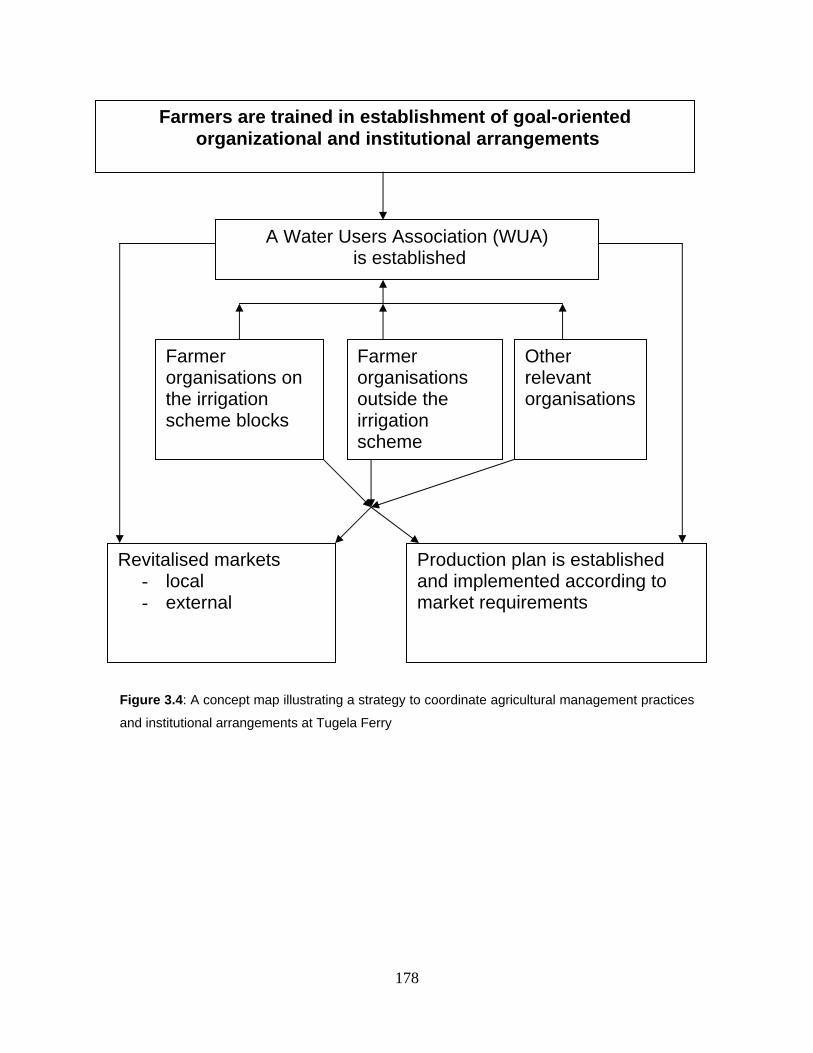
178
Figure 3.4: A concept map illustrating a strategy to coordinate agricultural management practices
and institutional arrangements at Tugela Ferry
Farmers are trained in establishment of goal-oriented organizational and institutional arrangements
A Water Users Association (WUA) is established
Farmer organisations on the irrigation scheme blocks
Farmer organisations outside the irrigation scheme
Other relevant organisations
Revitalised markets - local - external
Production plan is established and implemented according to market requirements
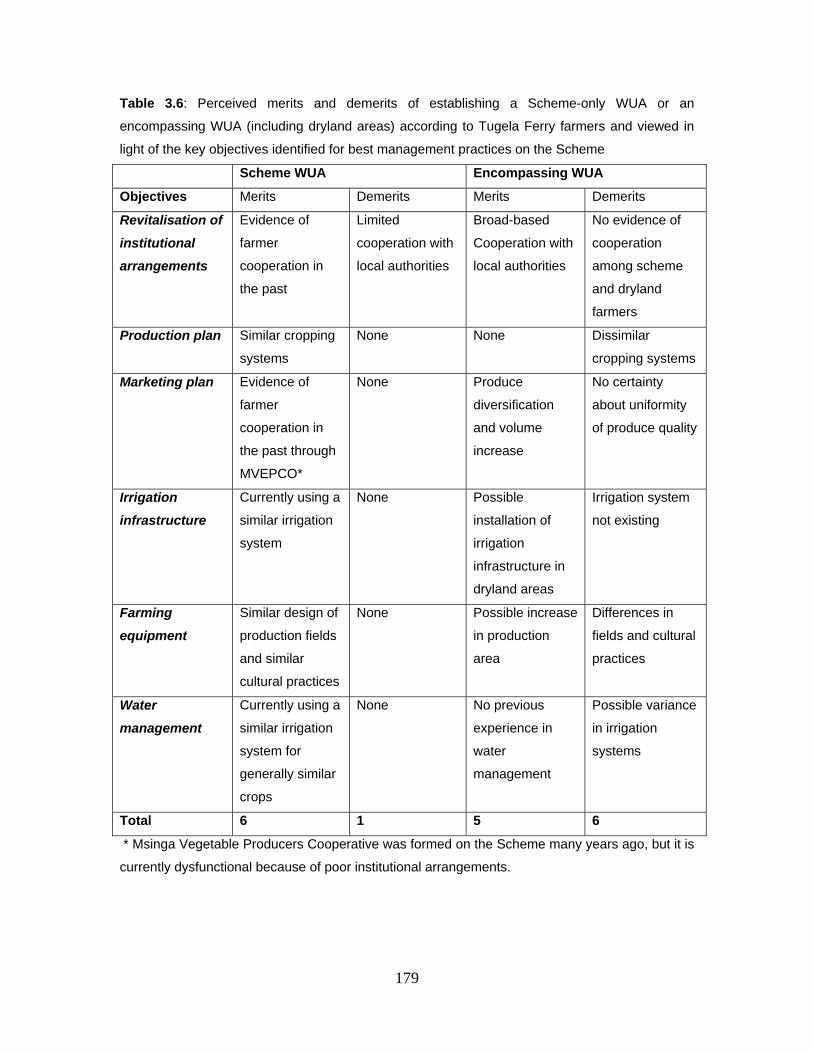
179
Table 3.6: Perceived merits and demerits of establishing a Scheme-only WUA or an
encompassing WUA (including dryland areas) according to Tugela Ferry farmers and viewed in
light of the key objectives identified for best management practices on the Scheme
Scheme WUA Encompassing WUA
Objectives Merits Demerits Merits Demerits
Revitalisation of
institutional
arrangements
Evidence of
farmer
cooperation in
the past
Limited
cooperation with
local authorities
Broad-based
Cooperation with
local authorities
No evidence of
cooperation
among scheme
and dryland
farmers
Production plan Similar cropping
systems
None None Dissimilar
cropping systems
Marketing plan Evidence of
farmer
cooperation in
the past through
MVEPCO*
None Produce
diversification
and volume
increase
No certainty
about uniformity
of produce quality
Irrigation
infrastructure
Currently using a
similar irrigation
system
None Possible
installation of
irrigation
infrastructure in
dryland areas
Irrigation system
not existing
Farming
equipment
Similar design of
production fields
and similar
cultural practices
None Possible increase
in production
area
Differences in
fields and cultural
practices
Water
management
Currently using a
similar irrigation
system for
generally similar
crops
None No previous
experience in
water
management
Possible variance
in irrigation
systems
Total 6 1 5 6
* Msinga Vegetable Producers Cooperative was formed on the Scheme many years ago, but it is
currently dysfunctional because of poor institutional arrangements.
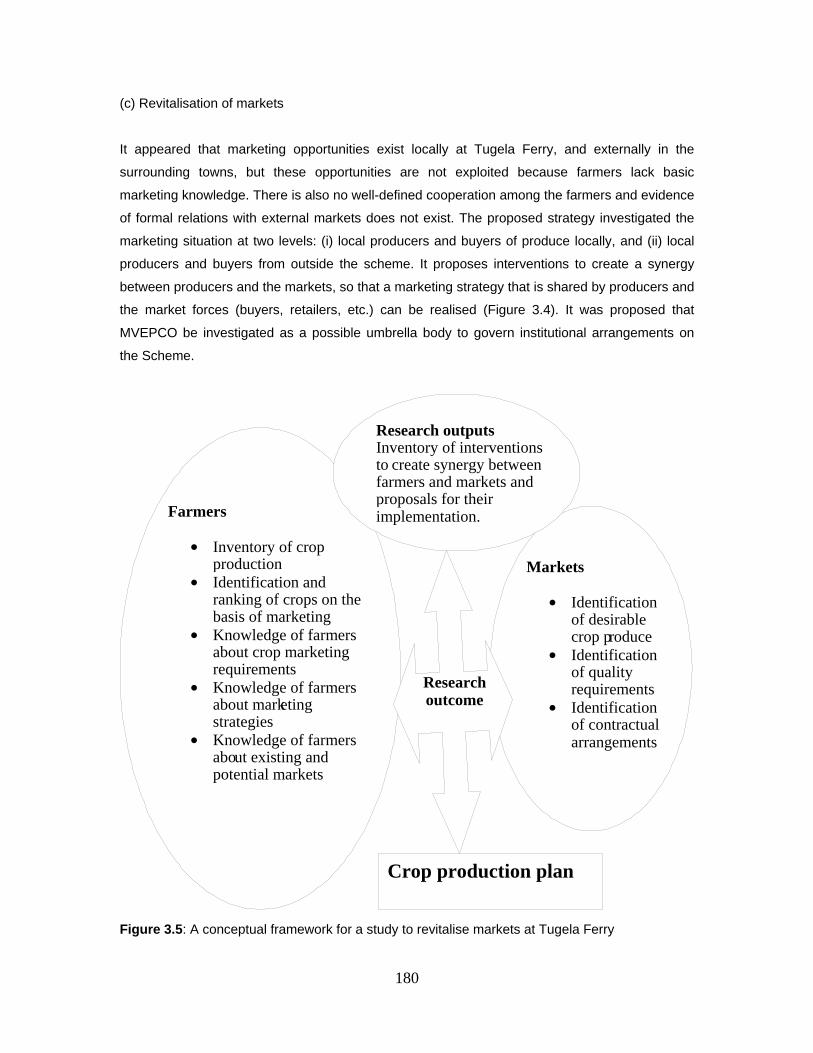
180
(c) Revitalisation of markets
It appeared that marketing opportunities exist locally at Tugela Ferry, and externally in the
surrounding towns, but these opportunities are not exploited because farmers lack basic
marketing knowledge. There is also no well-defined cooperation among the farmers and evidence
of formal relations with external markets does not exist. The proposed strategy investigated the
marketing situation at two levels: (i) local producers and buyers of produce locally, and (ii) local
producers and buyers from outside the scheme. It proposes interventions to create a synergy
between producers and the markets, so that a marketing strategy that is shared by producers and
the market forces (buyers, retailers, etc.) can be realised (Figure 3.4). It was proposed that
MVEPCO be investigated as a possible umbrella body to govern institutional arrangements on
the Scheme.
Figure 3.5: A conceptual framework for a study to revitalise markets at Tugela Ferry
Farmers
Inventory of cropproduction
Identification andranking of crops on thebasis of marketing
Knowledge of farmers about crop marketingrequirements
Knowledge of farmers about marketing strategies
Knowledge of farmersabout existing andpotential markets
Markets
Identification of desirable crop p roduce
Identification of quality requirements
Identification of contractual arrangements
Research outputs Inventory of interventions to create synergy between farmers and markets and proposals for their implementation.
Crop production plan
Research outcome
181
(d) Establishment of a production plan
Based on the participatory technology development (PTD) approach (Conroy et al., 2002; Horne
and Stur, 2005), it was agreed that, henceforth, the project researchers, farmers and extension
officers would engage in trials to test the ability of farmers to coordinate production of selected
crops on the whole scheme. Crop performance indicators (quality during development, economic
yield and post-harvest quality) would be established and used to monitor and evaluate farmer
performance. Training workshops on partial budgeting and recording of cultural practices, inter
alia, were undertaken and evaluated as part of crop production management studies.
3.4.2.2 Establishment of organizational structures for marketing strategy
Methodology
A Water User’s Association (WUA), which would be established under the auspices or with the
assistance of the Department of Water Affairs and Forestry (DWAF) and Msinga Vegetable
Producers Cooperative (MVEPCO), an existing, but dysfunctional cooperative that was
established to serve the marketing needs of the farmers on the scheme were proposed as
possible umbrella bodies for governance on the scheme. Whereas the farmers generally favoured
the creation of a WUA, there was no consensus on revitalisation of MVEPCO, so that it played a
role of governing institutional and marketing arrangements. Hence, farmers resolved that the
project researchers should investigate the possibility of using MVEPCO as an umbrella body. It
was felt that, initially, the views of the general population of farmers and those of MVEPCO office-
bearers should be determined. Another aspect that was proposed to take place concurrently with
an investigation into MVEPCO’s possible role and revitalisation was the training of the extension
officers of the Department of Agriculture and Environmental Affairs.
Determination of a possible role for MVEPCO: To produce a comprehensive resolution about
the role of MVEPCO as an umbrella body of the Tugela Ferry irrigation scheme, questionnaires
were designed and used to investigate the following key issues:
(i) The historical background of MVEPCO
(ii) Capacity of MVEPCO to act as a possible umbrella body
(iii) MVEPCO’s management of the dysfunctional pack house
(iv) Views of key informants outside, but relevant to MVEPCO
Farmers from each block were randomly selected for interviews. The interviews began on the 14th
of August 2006. Since most respondents spoke only one language (Zulu), the questionnaires
were mainly administered in Zulu except to the few who understood English. All the responses
182
from the respondents were recorded in either English or Zulu. The key informants were mainly
the extension officers, because of their erstwhile role in providing technical advice to MVEPCO.
Both qualitative and quantitative data were collected and data were analysed to understand the
following broader issues:
(i) Whether MVEPCO enjoyed support from the farmers and their associations,
(ii) What institutional arrangements were in place during the operation of MVEPCO,
(iii) How MVEPCO was formed and how farmers were represented in MVEPCO,
(iv) What were the functions of MVEPCO from the farmers perspective,
(v) What were the reasons for non-functioning of MVEPCO,
(vi) Whether farmers would support the use of MVEPCO as an umbrella body (if its
members are trained on management and business skills).
(vii) If farmers support the use of MVEPCO, what changes would farmers like to see, so
that MVEPCO could operate effectively,
(viii) Who should be a member of MVEPCO committee and whether these people need to
be elected or appointed,
(ix) Whether farmers participated in the running of the pack house,
(x) What needs to be done to get the pack house operational again, and
(xi) What institutional arrangement structure should be put in place to get the pack house
efficiently operational?
Workshop to determine the training needs of extension officers: Extension officers were
given an opportunity to discuss the tasks they perceived to be relevant to the institutional
arrangements of the project. Thereafter, they decided which skills they required to meet the
needs of the farmer organisations at block and scheme levels. The objectives of the workshop
were to:
(i) Understand the training needs of the extension workers in relation to their
contribution to the WRC Project,
(ii) Identify existing gaps in knowledge and skills in agricultural extension approaches,
(iii) Identify training needs of extension staff so that they are able to address institutional
challenges of farmers’ organization, and
(iv) Determine priorities in training needs to fill gaps in order to overcome key farmer
organizational constraints.
Establishment of a Water Users Association: On 29 August 2006, officials from the
Department of Water Affairs (DWAF), KwaZulu-Natal Department of Agriculture and
Environmental Affairs KZN-DAEA, Skills Development Consultants and Project Researchers
participated with community members and traditional authorities of Tugela Ferry to discuss the
183
establishment of a WUA. DWAF officials explained the purpose of the meeting and gave a brief
background on how the notion of establishing the WUA started. It was explained that DWAF
received two requests from Msinga to establish Water Users Associations: one from farmers from
the Tugela Ferry Irrigation Scheme and the other from the community of surrounding dryland
areas. DWAF mentioned that the department considered it imperative to attend to the requests,
but farmers were encouraged to jointly form one WUA. The farmers agreed to the joint notion and
committed themselves to the process.
A brief overview of the National Water Act revealed a provision for farmers to form structures to
maintain, conserve and protect water in their localities. These regulations provide opportunities
for water equity, efficiency and sustainability for all. Processes and procedures for establishing a
WUA were presented. Farmers were then provided with time to ask questions. Regulations
around the protection of water raised a number of questions from the farmers. The key issues
debated were financial implications for engaging in a WUA, government support systems and
involvement of other water users such domestic users.
The task team to drive the process of WUA formation and to represent farmers was elected. The
task team was required to develop a constitution, which would provide guidelines as to what the
WUA structure will do. Farmers decided to have two representatives elected according to
traditional boundaries rather than water sources as per DWAF requirements. Traditional leaders
represented were chiefs Mthembu, Mabaso, Zondi, Ngubane, Mchunu and Majozi. Twelve task
team members were elected and they would be joined by additional members representing
government departments and other local structures such as DWAF, DAEA, Traditional Authority,
Municipality, MPDC (Msinga Peace and Development Cooperation), and NAFU (National
Agricultural Farmers Union). The first meeting of the task team was proposed to be the 27th of
September 2006. Regular meetings were held to develop the WUA, and one student from the
WRC project worked closely with DWAF on the establishment of WUA for her Masters
dissertation. Hence, data on the establishment of the WUA are published in that dissertation
(Monatisa, 2008).
Marketing arrangements: To understand the marketing strategy of the scheme, a market survey
was conducted among the producers (farmers on the Scheme), informal market (hawkers) and
potential formal market (trading stores at Tugela Ferry, Pomoroy and Greytown). Tugela Ferry,
Pomoroy and Greytown, are 1 km to 10 km, 30 km to 40 km and 35 to 45 km from the scheme,
respectively, depending on where one is on the Scheme. Whereas the interviews went well in all
the towns, the farmers and the hawkers were not easily able to provide accurate figures, because
they do not keep accurate records. However, the objective of the study was generally achieved.
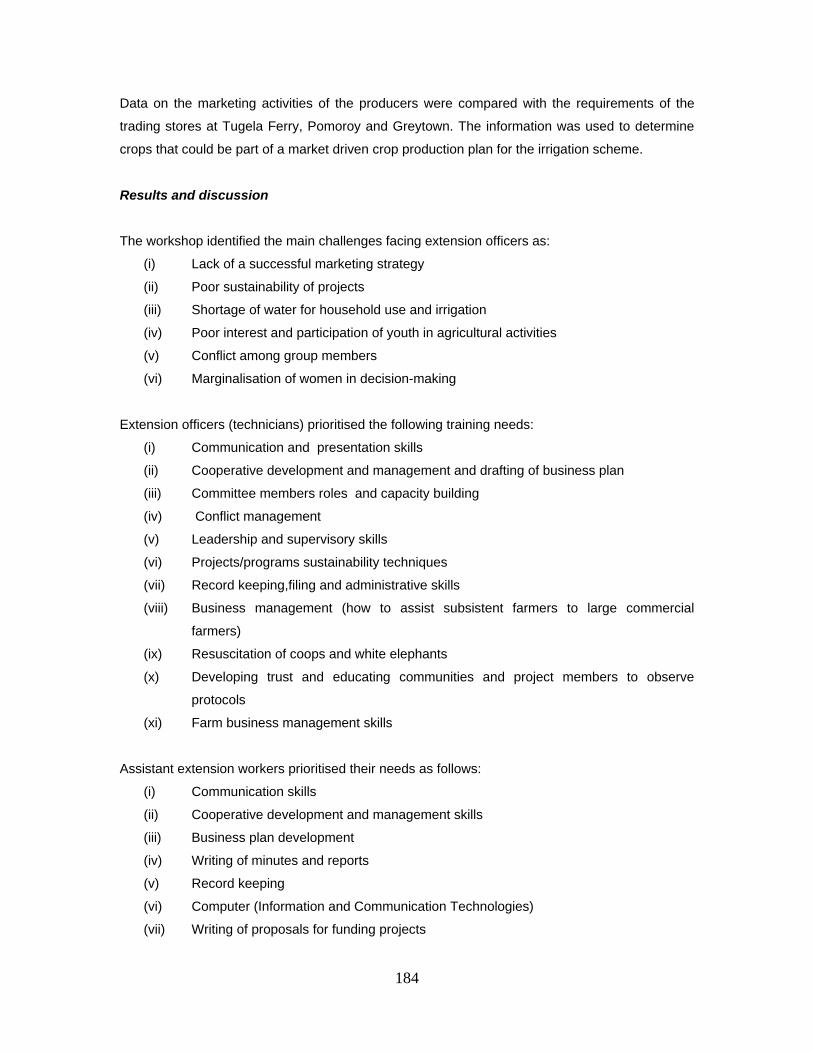
184
Data on the marketing activities of the producers were compared with the requirements of the
trading stores at Tugela Ferry, Pomoroy and Greytown. The information was used to determine
crops that could be part of a market driven crop production plan for the irrigation scheme.
Results and discussion
The workshop identified the main challenges facing extension officers as:
(i) Lack of a successful marketing strategy
(ii) Poor sustainability of projects
(iii) Shortage of water for household use and irrigation
(iv) Poor interest and participation of youth in agricultural activities
(v) Conflict among group members
(vi) Marginalisation of women in decision-making
Extension officers (technicians) prioritised the following training needs:
(i) Communication and presentation skills
(ii) Cooperative development and management and drafting of business plan
(iii) Committee members roles and capacity building
(iv) Conflict management
(v) Leadership and supervisory skills
(vi) Projects/programs sustainability techniques
(vii) Record keeping,filing and administrative skills
(viii) Business management (how to assist subsistent farmers to large commercial
farmers)
(ix) Resuscitation of coops and white elephants
(x) Developing trust and educating communities and project members to observe
protocols
(xi) Farm business management skills
Assistant extension workers prioritised their needs as follows:
(i) Communication skills
(ii) Cooperative development and management skills
(iii) Business plan development
(iv) Writing of minutes and reports
(v) Record keeping
(vi) Computer (Information and Communication Technologies)
(vii) Writing of proposals for funding projects
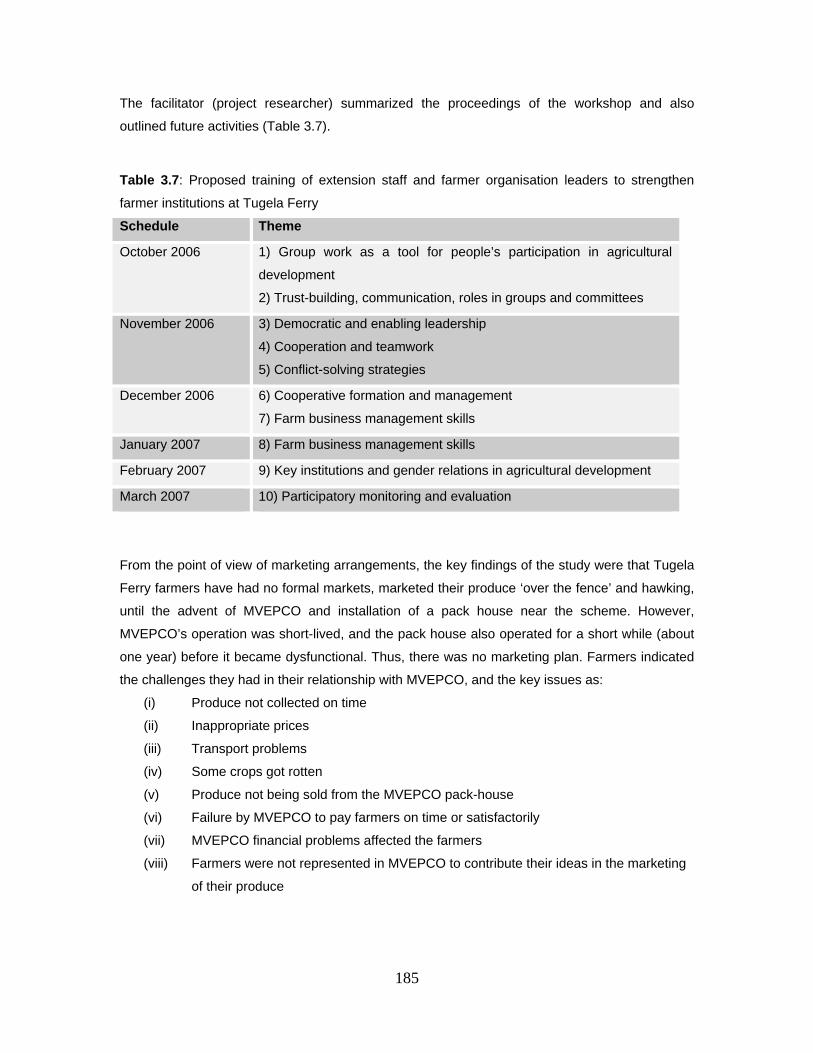
185
The facilitator (project researcher) summarized the proceedings of the workshop and also
outlined future activities (Table 3.7).
Table 3.7: Proposed training of extension staff and farmer organisation leaders to strengthen
farmer institutions at Tugela Ferry
Schedule Theme
October 2006 1) Group work as a tool for people’s participation in agricultural
development
2) Trust-building, communication, roles in groups and committees
November 2006 3) Democratic and enabling leadership
4) Cooperation and teamwork
5) Conflict-solving strategies
December 2006 6) Cooperative formation and management
7) Farm business management skills
January 2007 8) Farm business management skills
February 2007 9) Key institutions and gender relations in agricultural development
March 2007 10) Participatory monitoring and evaluation
From the point of view of marketing arrangements, the key findings of the study were that Tugela
Ferry farmers have had no formal markets, marketed their produce ‘over the fence’ and hawking,
until the advent of MVEPCO and installation of a pack house near the scheme. However,
MVEPCO’s operation was short-lived, and the pack house also operated for a short while (about
one year) before it became dysfunctional. Thus, there was no marketing plan. Farmers indicated
the challenges they had in their relationship with MVEPCO, and the key issues as:
(i) Produce not collected on time
(ii) Inappropriate prices
(iii) Transport problems
(iv) Some crops got rotten
(v) Produce not being sold from the MVEPCO pack-house
(vi) Failure by MVEPCO to pay farmers on time or satisfactorily
(vii) MVEPCO financial problems affected the farmers
(viii) Farmers were not represented in MVEPCO to contribute their ideas in the marketing
of their produce
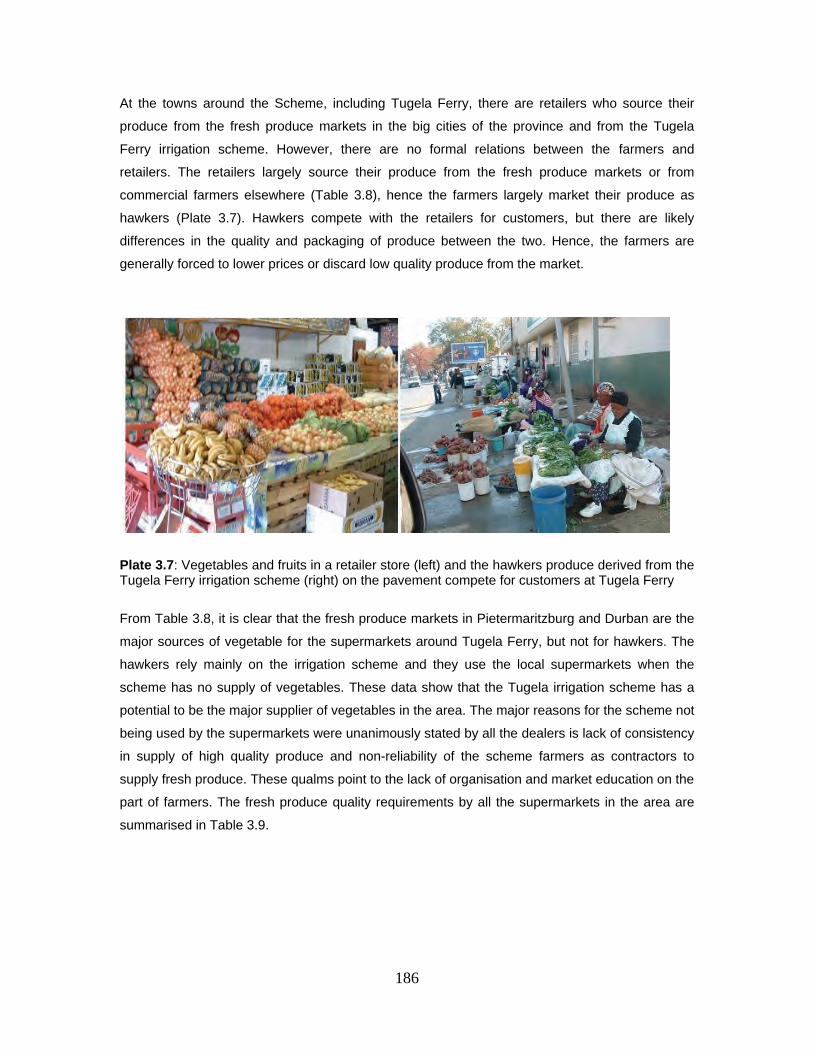
186
At the towns around the Scheme, including Tugela Ferry, there are retailers who source their
produce from the fresh produce markets in the big cities of the province and from the Tugela
Ferry irrigation scheme. However, there are no formal relations between the farmers and
retailers. The retailers largely source their produce from the fresh produce markets or from
commercial farmers elsewhere (Table 3.8), hence the farmers largely market their produce as
hawkers (Plate 3.7). Hawkers compete with the retailers for customers, but there are likely
differences in the quality and packaging of produce between the two. Hence, the farmers are
generally forced to lower prices or discard low quality produce from the market.
Plate 3.7: Vegetables and fruits in a retailer store (left) and the hawkers produce derived from the Tugela Ferry irrigation scheme (right) on the pavement compete for customers at Tugela Ferry
From Table 3.8, it is clear that the fresh produce markets in Pietermaritzburg and Durban are the
major sources of vegetable for the supermarkets around Tugela Ferry, but not for hawkers. The
hawkers rely mainly on the irrigation scheme and they use the local supermarkets when the
scheme has no supply of vegetables. These data show that the Tugela irrigation scheme has a
potential to be the major supplier of vegetables in the area. The major reasons for the scheme not
being used by the supermarkets were unanimously stated by all the dealers is lack of consistency
in supply of high quality produce and non-reliability of the scheme farmers as contractors to
supply fresh produce. These qualms point to the lack of organisation and market education on the
part of farmers. The fresh produce quality requirements by all the supermarkets in the area are
summarised in Table 3.9.
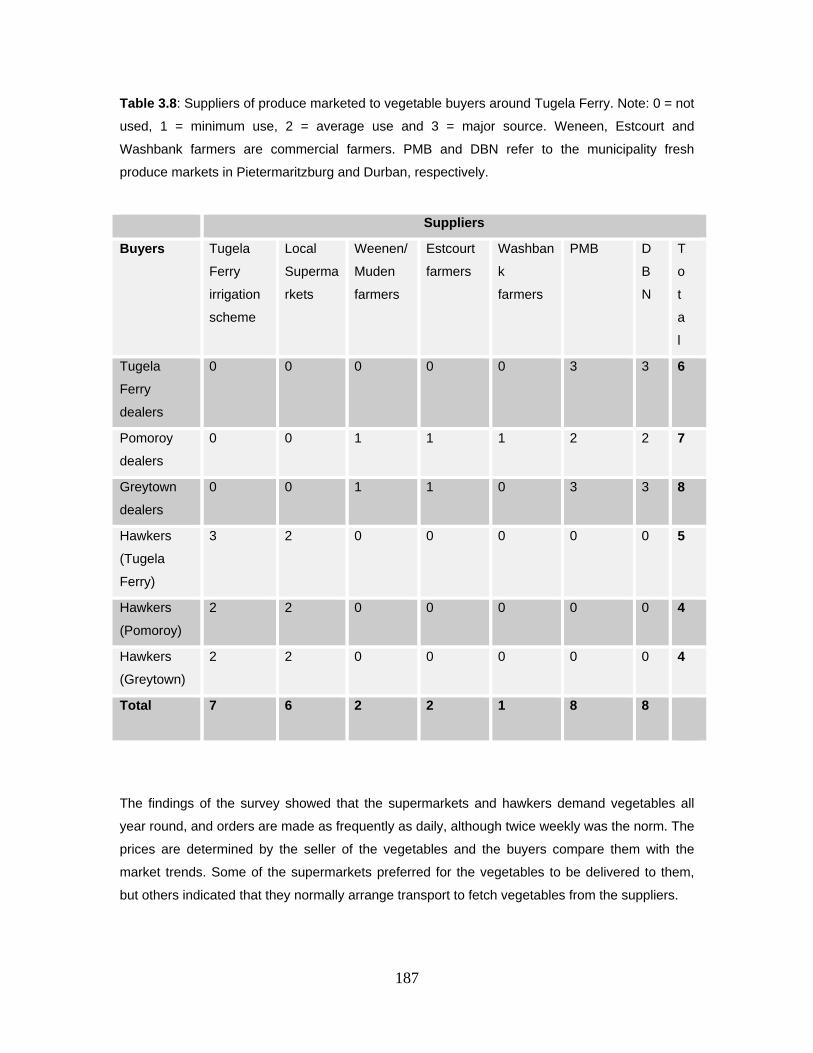
187
Table 3.8: Suppliers of produce marketed to vegetable buyers around Tugela Ferry. Note: 0 = not
used, 1 = minimum use, 2 = average use and 3 = major source. Weneen, Estcourt and
Washbank farmers are commercial farmers. PMB and DBN refer to the municipality fresh
produce markets in Pietermaritzburg and Durban, respectively.
Suppliers
Buyers Tugela
Ferry
irrigation
scheme
Local
Superma
rkets
Weenen/
Muden
farmers
Estcourt
farmers
Washban
k
farmers
PMB D
B
N
T
o
t
a
l
Tugela
Ferry
dealers
0 0 0 0 0 3 3 6
Pomoroy
dealers
0 0 1 1 1 2 2 7
Greytown
dealers
0 0 1 1 0 3 3 8
Hawkers
(Tugela
Ferry)
3 2 0 0 0 0 0 5
Hawkers
(Pomoroy)
2 2 0 0 0 0 0 4
Hawkers
(Greytown)
2 2 0 0 0 0 0 4
Total 7 6 2 2 1 8 8
The findings of the survey showed that the supermarkets and hawkers demand vegetables all
year round, and orders are made as frequently as daily, although twice weekly was the norm. The
prices are determined by the seller of the vegetables and the buyers compare them with the
market trends. Some of the supermarkets preferred for the vegetables to be delivered to them,
but others indicated that they normally arrange transport to fetch vegetables from the suppliers.
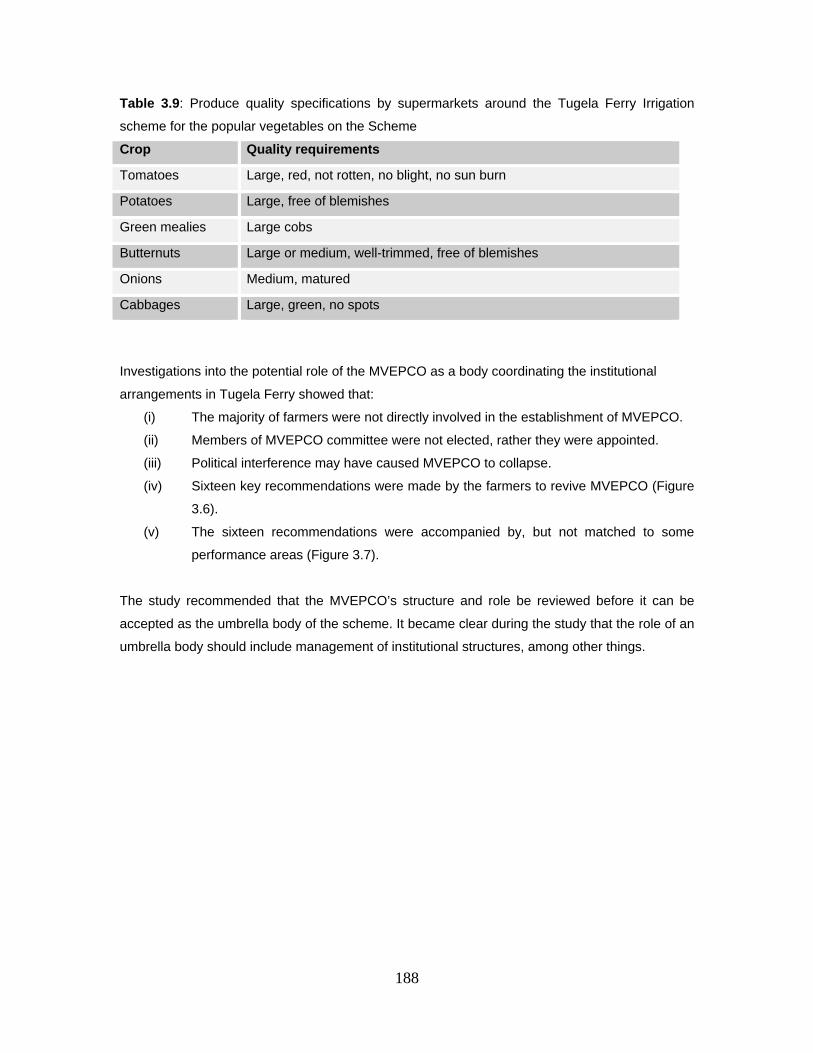
188
Table 3.9: Produce quality specifications by supermarkets around the Tugela Ferry Irrigation
scheme for the popular vegetables on the Scheme
Crop Quality requirements
Tomatoes Large, red, not rotten, no blight, no sun burn
Potatoes Large, free of blemishes
Green mealies Large cobs
Butternuts Large or medium, well-trimmed, free of blemishes
Onions Medium, matured
Cabbages Large, green, no spots
Investigations into the potential role of the MVEPCO as a body coordinating the institutional
arrangements in Tugela Ferry showed that:
(i) The majority of farmers were not directly involved in the establishment of MVEPCO.
(ii) Members of MVEPCO committee were not elected, rather they were appointed.
(iii) Political interference may have caused MVEPCO to collapse.
(iv) Sixteen key recommendations were made by the farmers to revive MVEPCO (Figure
3.6).
(v) The sixteen recommendations were accompanied by, but not matched to some
performance areas (Figure 3.7).
The study recommended that the MVEPCO’s structure and role be reviewed before it can be
accepted as the umbrella body of the scheme. It became clear during the study that the role of an
umbrella body should include management of institutional structures, among other things.
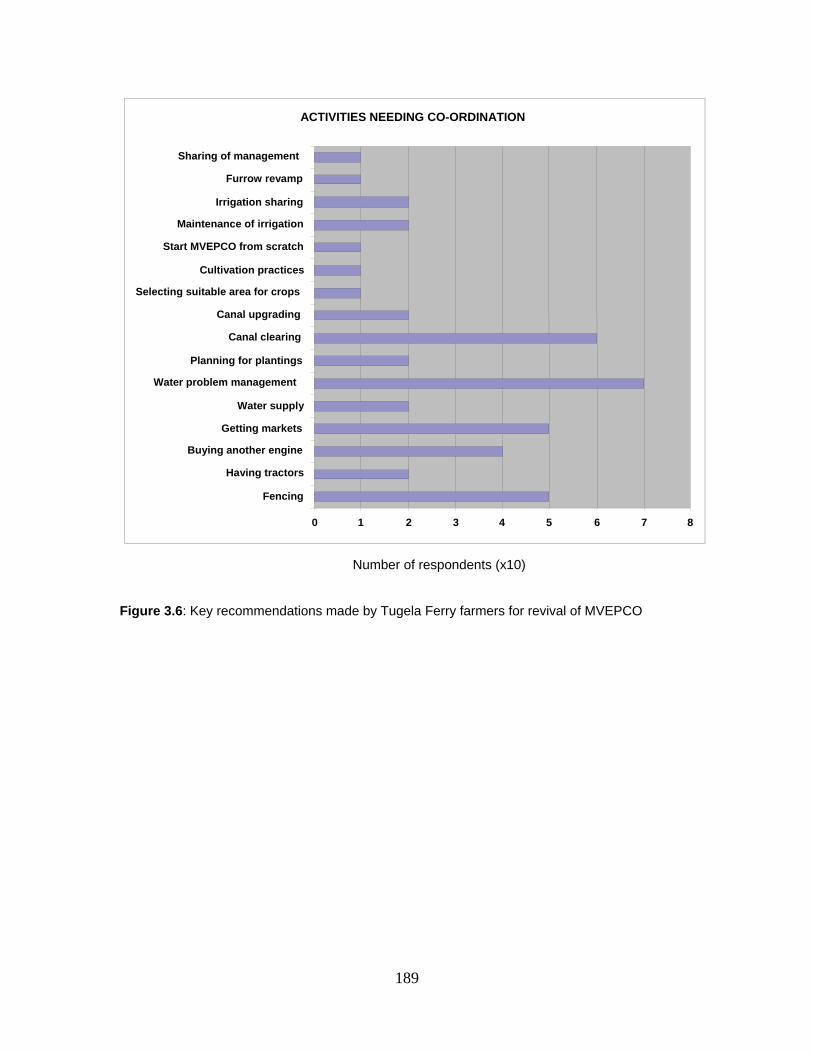
189
Figure 3.6: Key recommendations made by Tugela Ferry farmers for revival of MVEPCO
ACTIVITIES NEEDING CO-ORDINATION
0 1 2 3 4 5 6 7 8
Fencing
Having tractors
Buying another engine
Getting markets
Water supply
Water problem management Planning for plantings
Canal clearing
Canal upgrading
Selecting suitable area for crops Cultivation practices
Start MVEPCO from scratch
Maintenance of irrigation
Irrigation sharing
Furrow revamp
Sharing of management
Number of respondents (x10)
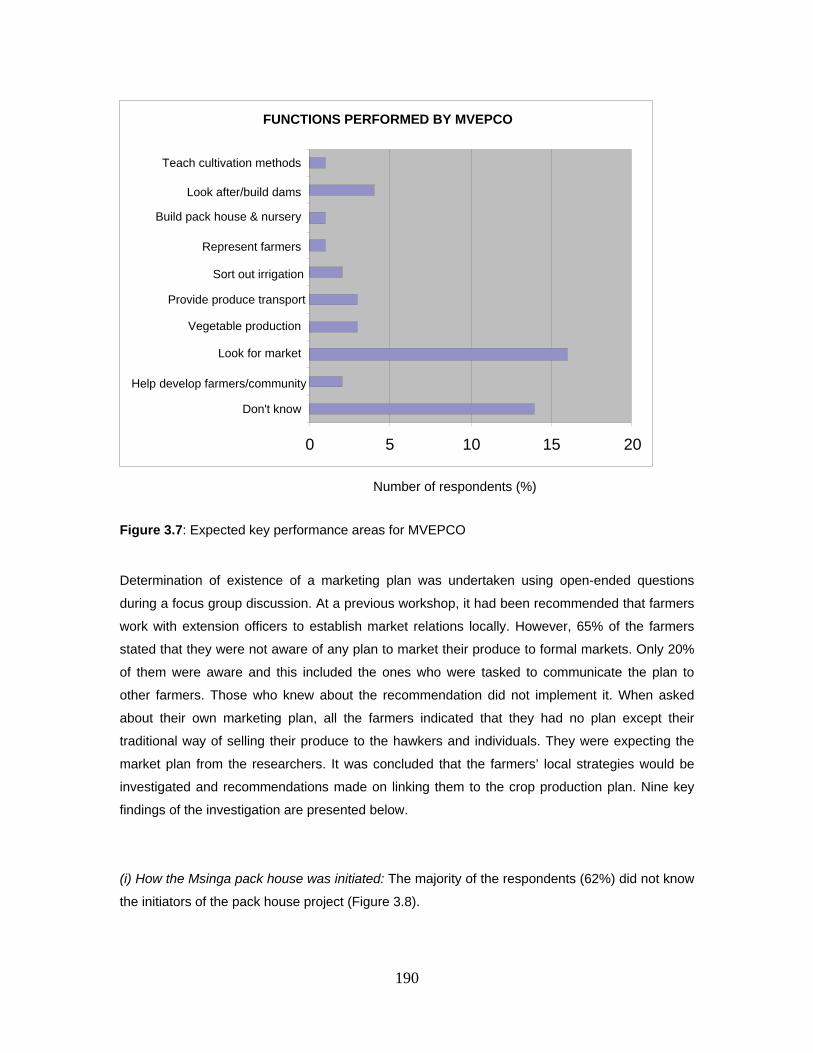
190
Figure 3.7: Expected key performance areas for MVEPCO
Determination of existence of a marketing plan was undertaken using open-ended questions
during a focus group discussion. At a previous workshop, it had been recommended that farmers
work with extension officers to establish market relations locally. However, 65% of the farmers
stated that they were not aware of any plan to market their produce to formal markets. Only 20%
of them were aware and this included the ones who were tasked to communicate the plan to
other farmers. Those who knew about the recommendation did not implement it. When asked
about their own marketing plan, all the farmers indicated that they had no plan except their
traditional way of selling their produce to the hawkers and individuals. They were expecting the
market plan from the researchers. It was concluded that the farmers’ local strategies would be
investigated and recommendations made on linking them to the crop production plan. Nine key
findings of the investigation are presented below.
(i) How the Msinga pack house was initiated: The majority of the respondents (62%) did not know
the initiators of the pack house project (Figure 3.8).
FUNCTIONS PERFORMED BY MVEPCO
0 5 10 15 20
Don't know
Help develop farmers/community
Look for market
Vegetable production
Provide produce transport
Sort out irrigation
Represent farmers
Build pack house & nursery
Look after/build dams
Teach cultivation methods
Number of respondents (%)
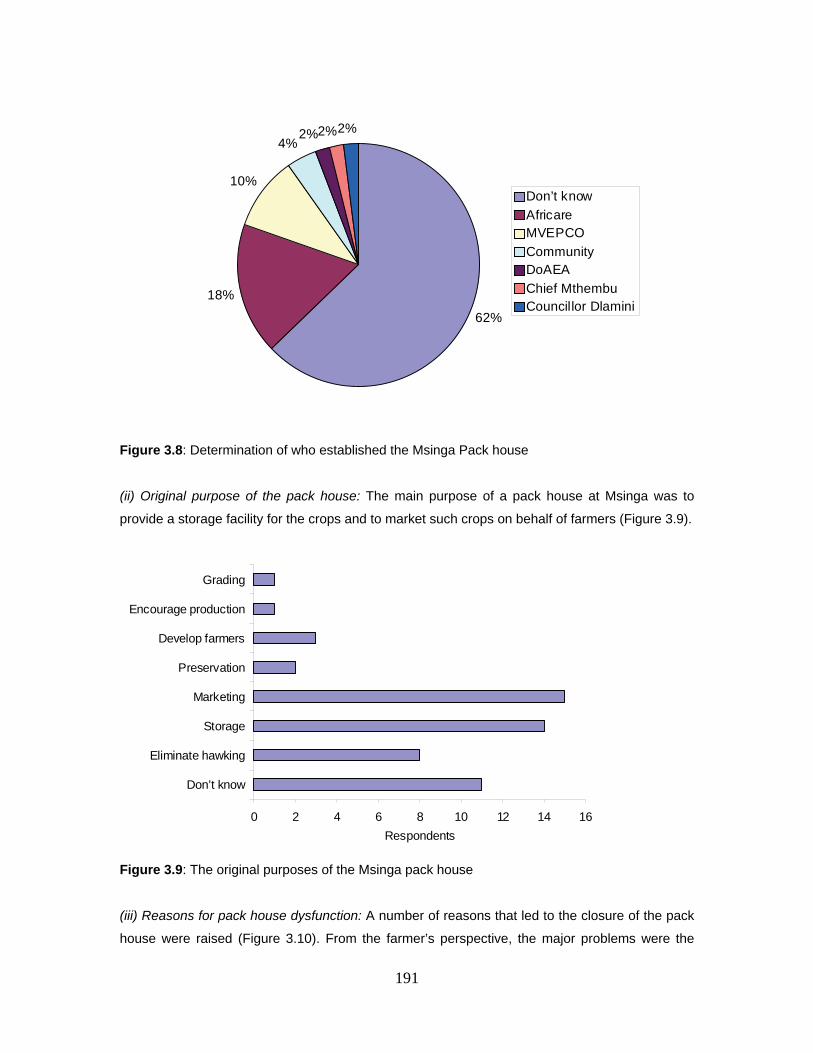
191
Figure 3.8: Determination of who established the Msinga Pack house
(ii) Original purpose of the pack house: The main purpose of a pack house at Msinga was to
provide a storage facility for the crops and to market such crops on behalf of farmers (Figure 3.9).
Figure 3.9: The original purposes of the Msinga pack house
(iii) Reasons for pack house dysfunction: A number of reasons that led to the closure of the pack
house were raised (Figure 3.10). From the farmer’s perspective, the major problems were the
62%
18%
10%
4%2%2%2%
Don’t know
AfricareMVEPCO
CommunityDoAEA
Chief MthembuCouncillor Dlamini
0 2 4 6 8 10 12 14 16
Don’t know
Eliminate hawking
Storage
Marketing
Preservation
Develop farmers
Encourage production
Grading
Respondents
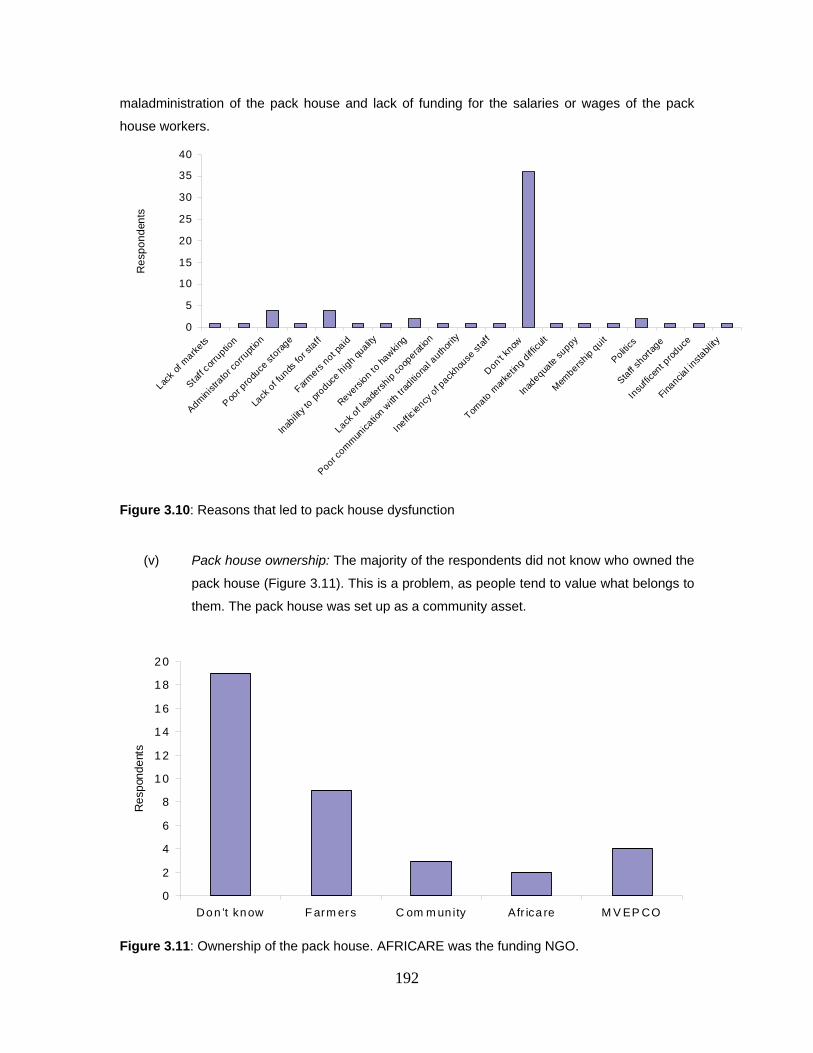
192
maladministration of the pack house and lack of funding for the salaries or wages of the pack
house workers.
Figure 3.10: Reasons that led to pack house dysfunction
(v) Pack house ownership: The majority of the respondents did not know who owned the
pack house (Figure 3.11). This is a problem, as people tend to value what belongs to
them. The pack house was set up as a community asset.
Figure 3.11: Ownership of the pack house. AFRICARE was the funding NGO.
0
5
10
15
20
25
30
35
40
Lack
of m
arkets
Staff
corru
ption
Administ
rato
r corru
ption
Poor p
rodu
ce st
orage
Lack
of f
unds fo
r sta
ff
Farm
ers n
ot paid
Inab
ility t
o pro
duce h
igh
quality
Revers
ion to h
awking
Lack o
f lea
ders
hip co
opera
tion
Poor com
mun
icatio
n with
trad
itiona
l auth
ority
Ineffic
iency o
f pack
house
staf
f
Don’t know
Tomato
mar
ketin
g diffi
cult
Inad
equate
suppy
Mem
bership q
uit
Politics
Staff
shor
tage
Insu
ffice
nt pro
duce
Financia
l insta
bility
Re
spo
nd
ents
0
2
4
6
8
1 0
1 2
1 4
1 6
1 8
2 0
Don ’t know F arm ers C om m un ity Afr ica re M V EP CO
Re
spon
de
nts
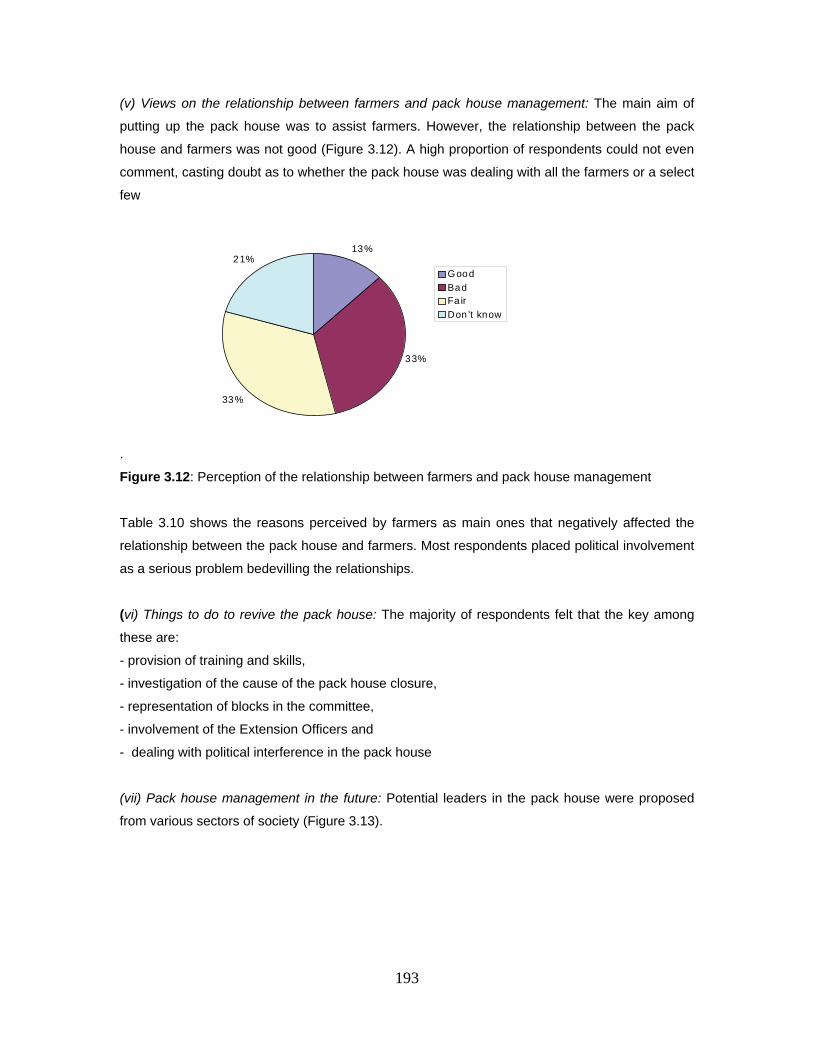
193
(v) Views on the relationship between farmers and pack house management: The main aim of
putting up the pack house was to assist farmers. However, the relationship between the pack
house and farmers was not good (Figure 3.12). A high proportion of respondents could not even
comment, casting doubt as to whether the pack house was dealing with all the farmers or a select
few
.
Figure 3.12: Perception of the relationship between farmers and pack house management
Table 3.10 shows the reasons perceived by farmers as main ones that negatively affected the
relationship between the pack house and farmers. Most respondents placed political involvement
as a serious problem bedevilling the relationships.
(vi) Things to do to revive the pack house: The majority of respondents felt that the key among
these are:
- provision of training and skills,
- investigation of the cause of the pack house closure,
- representation of blocks in the committee,
- involvement of the Extension Officers and
- dealing with political interference in the pack house
(vii) Pack house management in the future: Potential leaders in the pack house were proposed
from various sectors of society (Figure 3.13).
13%
33%
33%
21%
Good
BadFa ir
Don ’t know
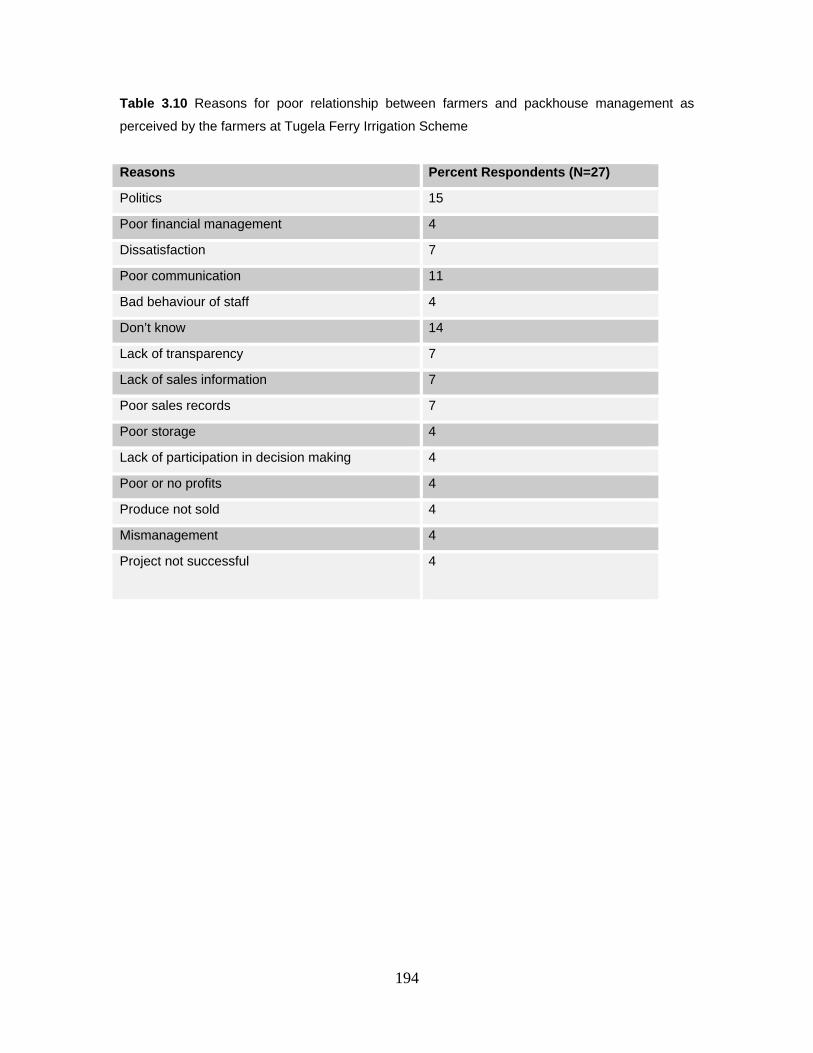
194
Table 3.10 Reasons for poor relationship between farmers and packhouse management as
perceived by the farmers at Tugela Ferry Irrigation Scheme
Reasons Percent Respondents (N=27)
Politics 15
Poor financial management 4
Dissatisfaction 7
Poor communication 11
Bad behaviour of staff 4
Don’t know 14
Lack of transparency 7
Lack of sales information 7
Poor sales records 7
Poor storage 4
Lack of participation in decision making 4
Poor or no profits 4
Produce not sold 4
Mismanagement 4
Project not successful 4
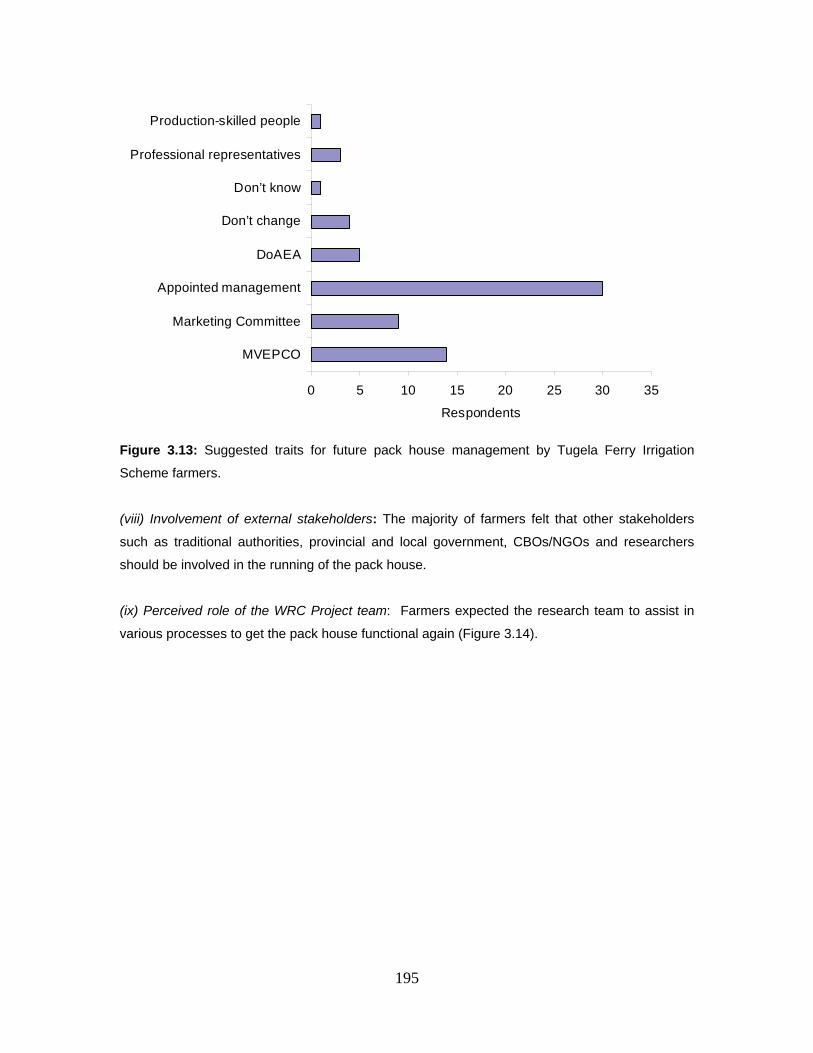
195
Figure 3.13: Suggested traits for future pack house management by Tugela Ferry Irrigation
Scheme farmers.
(viii) Involvement of external stakeholders: The majority of farmers felt that other stakeholders
such as traditional authorities, provincial and local government, CBOs/NGOs and researchers
should be involved in the running of the pack house.
(ix) Perceived role of the WRC Project team: Farmers expected the research team to assist in
various processes to get the pack house functional again (Figure 3.14).
0 5 10 15 20 25 30 35
MVEPCO
Marketing Committee
Appointed management
DoAEA
Don’t change
Don’t know
Professional representatives
Production-skilled people
Respondents
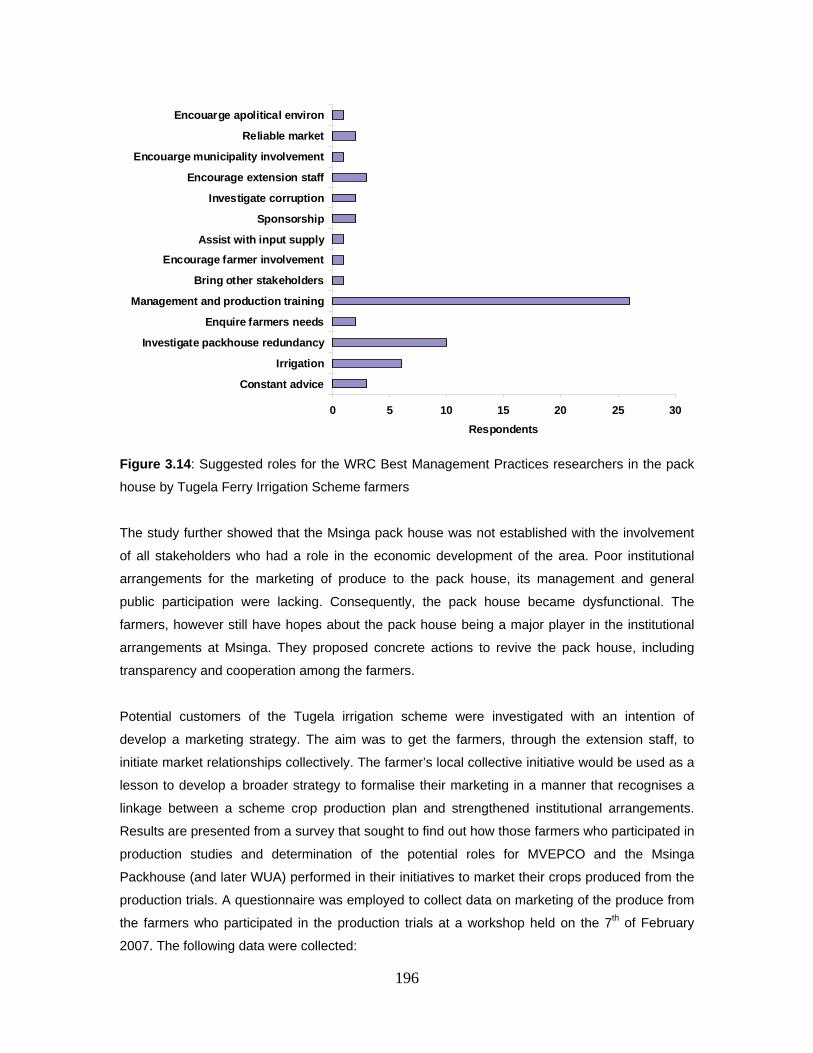
196
Figure 3.14: Suggested roles for the WRC Best Management Practices researchers in the pack
house by Tugela Ferry Irrigation Scheme farmers
The study further showed that the Msinga pack house was not established with the involvement
of all stakeholders who had a role in the economic development of the area. Poor institutional
arrangements for the marketing of produce to the pack house, its management and general
public participation were lacking. Consequently, the pack house became dysfunctional. The
farmers, however still have hopes about the pack house being a major player in the institutional
arrangements at Msinga. They proposed concrete actions to revive the pack house, including
transparency and cooperation among the farmers.
Potential customers of the Tugela irrigation scheme were investigated with an intention of
develop a marketing strategy. The aim was to get the farmers, through the extension staff, to
initiate market relationships collectively. The farmer’s local collective initiative would be used as a
lesson to develop a broader strategy to formalise their marketing in a manner that recognises a
linkage between a scheme crop production plan and strengthened institutional arrangements.
Results are presented from a survey that sought to find out how those farmers who participated in
production studies and determination of the potential roles for MVEPCO and the Msinga
Packhouse (and later WUA) performed in their initiatives to market their crops produced from the
production trials. A questionnaire was employed to collect data on marketing of the produce from
the farmers who participated in the production trials at a workshop held on the 7th of February
2007. The following data were collected:
0 5 10 15 20 25 30
Constant advice
Irrigation
Investigate packhouse redundancy
Enquire farmers needs
Management and production training
Bring other stakeholders
Encourage farmer involvement
Assist with input supply
Sponsorship
Investigate corruption
Encourage extension staff
Encouarge municipality involvement
Reliable market
Encouarge apolitical environ
Respondents
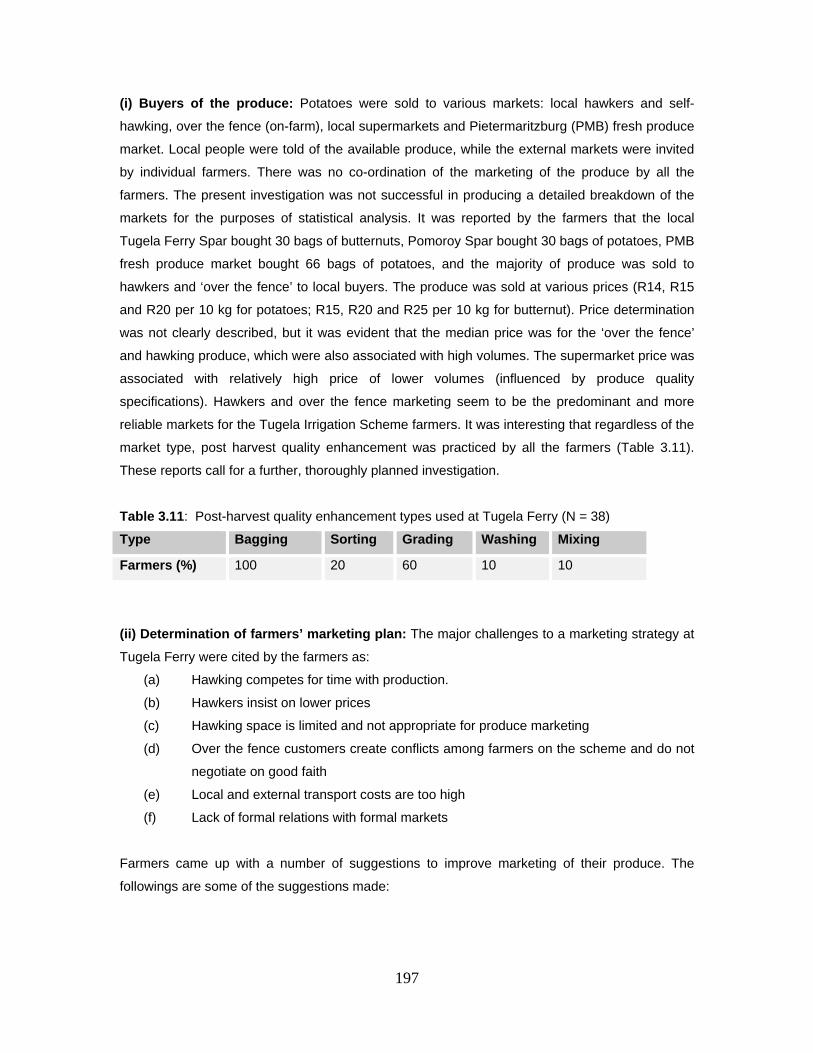
197
(i) Buyers of the produce: Potatoes were sold to various markets: local hawkers and self-
hawking, over the fence (on-farm), local supermarkets and Pietermaritzburg (PMB) fresh produce
market. Local people were told of the available produce, while the external markets were invited
by individual farmers. There was no co-ordination of the marketing of the produce by all the
farmers. The present investigation was not successful in producing a detailed breakdown of the
markets for the purposes of statistical analysis. It was reported by the farmers that the local
Tugela Ferry Spar bought 30 bags of butternuts, Pomoroy Spar bought 30 bags of potatoes, PMB
fresh produce market bought 66 bags of potatoes, and the majority of produce was sold to
hawkers and ‘over the fence’ to local buyers. The produce was sold at various prices (R14, R15
and R20 per 10 kg for potatoes; R15, R20 and R25 per 10 kg for butternut). Price determination
was not clearly described, but it was evident that the median price was for the ‘over the fence’
and hawking produce, which were also associated with high volumes. The supermarket price was
associated with relatively high price of lower volumes (influenced by produce quality
specifications). Hawkers and over the fence marketing seem to be the predominant and more
reliable markets for the Tugela Irrigation Scheme farmers. It was interesting that regardless of the
market type, post harvest quality enhancement was practiced by all the farmers (Table 3.11).
These reports call for a further, thoroughly planned investigation.
Table 3.11: Post-harvest quality enhancement types used at Tugela Ferry (N = 38)
Type Bagging Sorting Grading Washing Mixing
Farmers (%) 100 20 60 10 10
(ii) Determination of farmers’ marketing plan: The major challenges to a marketing strategy at
Tugela Ferry were cited by the farmers as:
(a) Hawking competes for time with production.
(b) Hawkers insist on lower prices
(c) Hawking space is limited and not appropriate for produce marketing
(d) Over the fence customers create conflicts among farmers on the scheme and do not
negotiate on good faith
(e) Local and external transport costs are too high
(f) Lack of formal relations with formal markets
Farmers came up with a number of suggestions to improve marketing of their produce. The
followings are some of the suggestions made:
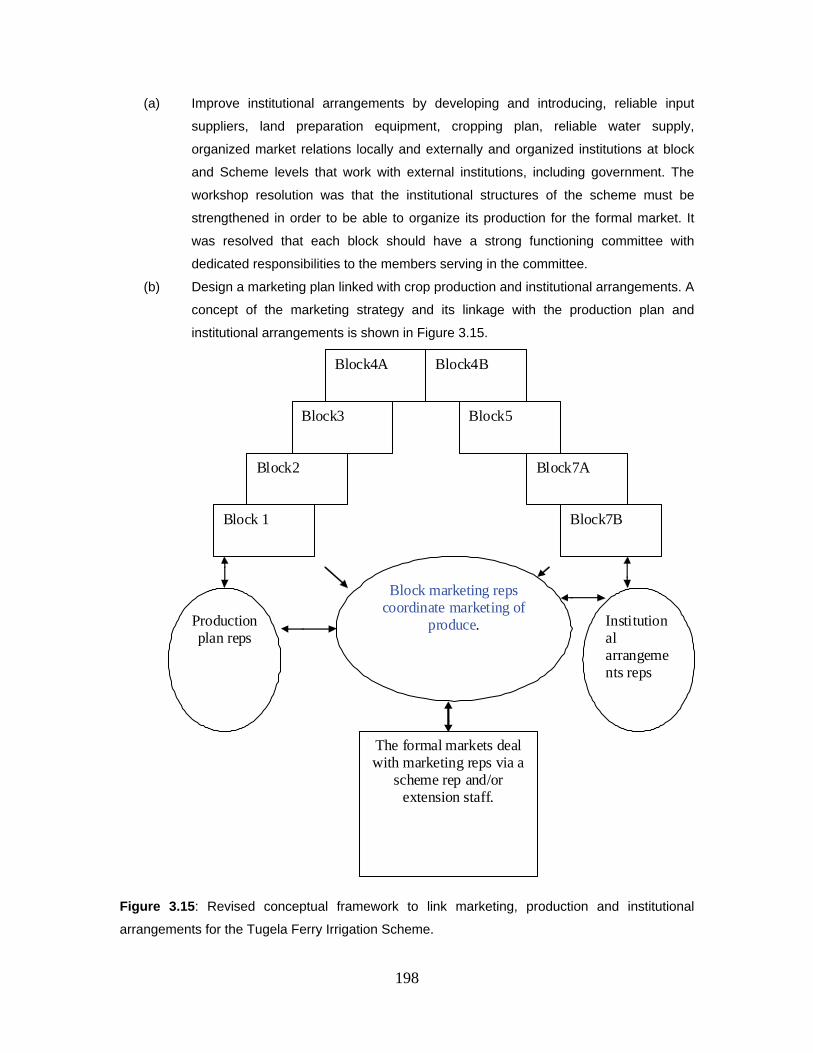
198
(a) Improve institutional arrangements by developing and introducing, reliable input
suppliers, land preparation equipment, cropping plan, reliable water supply,
organized market relations locally and externally and organized institutions at block
and Scheme levels that work with external institutions, including government. The
workshop resolution was that the institutional structures of the scheme must be
strengthened in order to be able to organize its production for the formal market. It
was resolved that each block should have a strong functioning committee with
dedicated responsibilities to the members serving in the committee.
(b) Design a marketing plan linked with crop production and institutional arrangements. A
concept of the marketing strategy and its linkage with the production plan and
institutional arrangements is shown in Figure 3.15.
Figure 3.15: Revised conceptual framework to link marketing, production and institutional
arrangements for the Tugela Ferry Irrigation Scheme.
Block2
Block7B
Block3
Block 1
Block4A Block4B
Block5
Block7A
Block marketing reps coordinate marketing of
produce.
The formal markets deal with marketing reps via a
scheme rep and/or extension staff.
Production plan reps
Institutional arrangements reps
199
The farmers suggested that cabbage, butternut, potatoes, tomatoes, garlic, onion, sweet potatoes
and green mealies form the major crops on the scheme and should considered in the production
and marketing plans. In the 2006/07 summer cropping season, butternut and potatoes were
investigated in the production trials while cabbage and onion were tested in winter 2007.
3.5 Participatory testing of technological options for addressing biophysical constraints
3.5.1 Background and objectives
The search for a self-sustaining, diversified agricultural system should be a major concern of
researchers, farmers and policymakers (NEPAD, 2003). Hence, in designing a successful farming
system, ecological stability and sustainability need to be considered together with sound
production economics (Meyer et al., 1992). The first step in designing a farming system is to
conceptualise it, so that it is clear why the system is being established; where the system begins
and ends; what the external environment in which the system operates is, what the main system
components are; what the relationship between the components is; what the items used by the
system that come from outside are; what the elements in the system that that are used in its
functioning are; what the primary desired outputs are; and what the useful, but incidental outputs
are.
Some of the factors favouring success in a farming system were summarised by Thorne and
Thorne (1979), and they are still applicable to date. Among these were size of the farm, climate,
soil, water, specialised labour, capital investment (machinery, buildings), pest control and use of
crop rotations. These factors vary dependent upon whether the farming system is based on field
or horticultural (vegetables, fruits or other special crops) crops. At the Tugela Ferry irrigation
scheme, farming is largely a vegetable production system with tomatoes, cabbage, onions and
green mealies dominating the system, whereas Swiss chard peppers and potatoes are also
important crops. Butternut is favoured, but its popularity was only starting to increase at the time
of the study. Crop popularity is related to a long history of successful production and availability of
a local market (hawkers). The area is in a bioclimatic zone where there are few limitations to crop
adaptation (Camp, 1999).
In section 3.3, it was suggested that the farmers and extension officers from the Tugela Ferry
irrigation scheme would engage in trials to test the ability of farmers to coordinate production of
selected crops on the whole scheme. Crop performance indicators (quality during development,
economic yield and post-harvest quality) would be established and used to monitor and evaluate
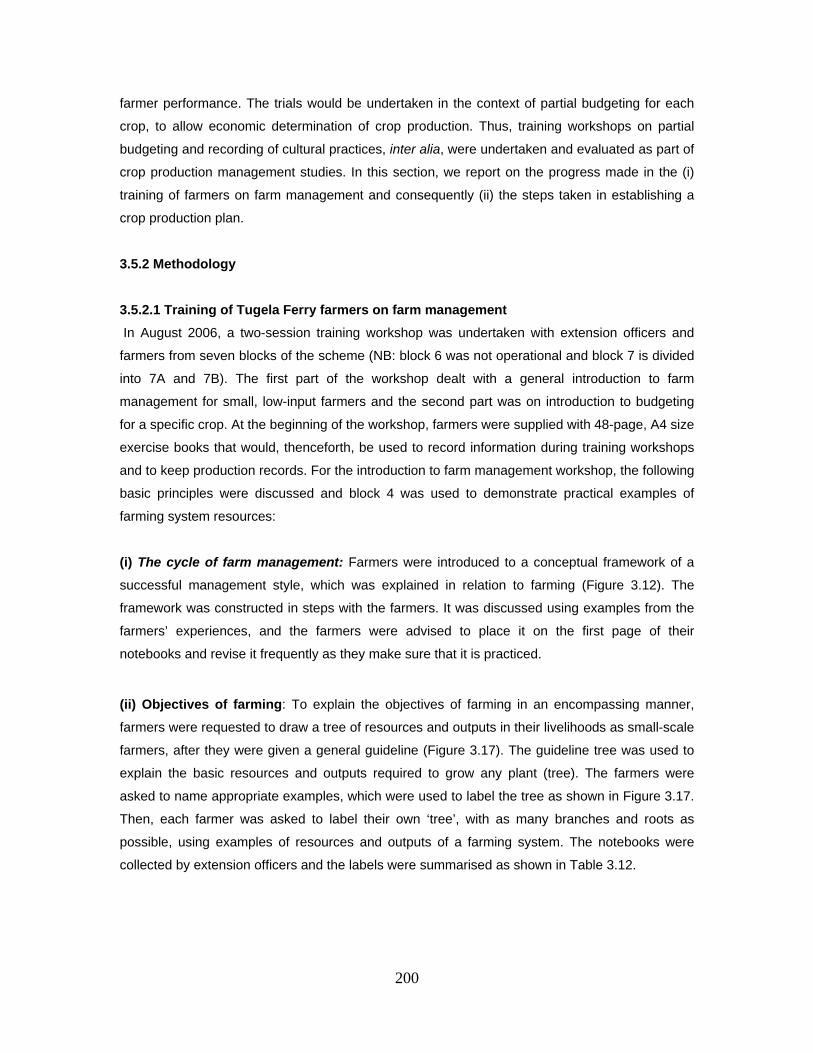
200
farmer performance. The trials would be undertaken in the context of partial budgeting for each
crop, to allow economic determination of crop production. Thus, training workshops on partial
budgeting and recording of cultural practices, inter alia, were undertaken and evaluated as part of
crop production management studies. In this section, we report on the progress made in the (i)
training of farmers on farm management and consequently (ii) the steps taken in establishing a
crop production plan.
3.5.2 Methodology
3.5.2.1 Training of Tugela Ferry farmers on farm management
In August 2006, a two-session training workshop was undertaken with extension officers and
farmers from seven blocks of the scheme (NB: block 6 was not operational and block 7 is divided
into 7A and 7B). The first part of the workshop dealt with a general introduction to farm
management for small, low-input farmers and the second part was on introduction to budgeting
for a specific crop. At the beginning of the workshop, farmers were supplied with 48-page, A4 size
exercise books that would, thenceforth, be used to record information during training workshops
and to keep production records. For the introduction to farm management workshop, the following
basic principles were discussed and block 4 was used to demonstrate practical examples of
farming system resources:
(i) The cycle of farm management: Farmers were introduced to a conceptual framework of a
successful management style, which was explained in relation to farming (Figure 3.12). The
framework was constructed in steps with the farmers. It was discussed using examples from the
farmers’ experiences, and the farmers were advised to place it on the first page of their
notebooks and revise it frequently as they make sure that it is practiced.
(ii) Objectives of farming: To explain the objectives of farming in an encompassing manner,
farmers were requested to draw a tree of resources and outputs in their livelihoods as small-scale
farmers, after they were given a general guideline (Figure 3.17). The guideline tree was used to
explain the basic resources and outputs required to grow any plant (tree). The farmers were
asked to name appropriate examples, which were used to label the tree as shown in Figure 3.17.
Then, each farmer was asked to label their own ‘tree’, with as many branches and roots as
possible, using examples of resources and outputs of a farming system. The notebooks were
collected by extension officers and the labels were summarised as shown in Table 3.12.
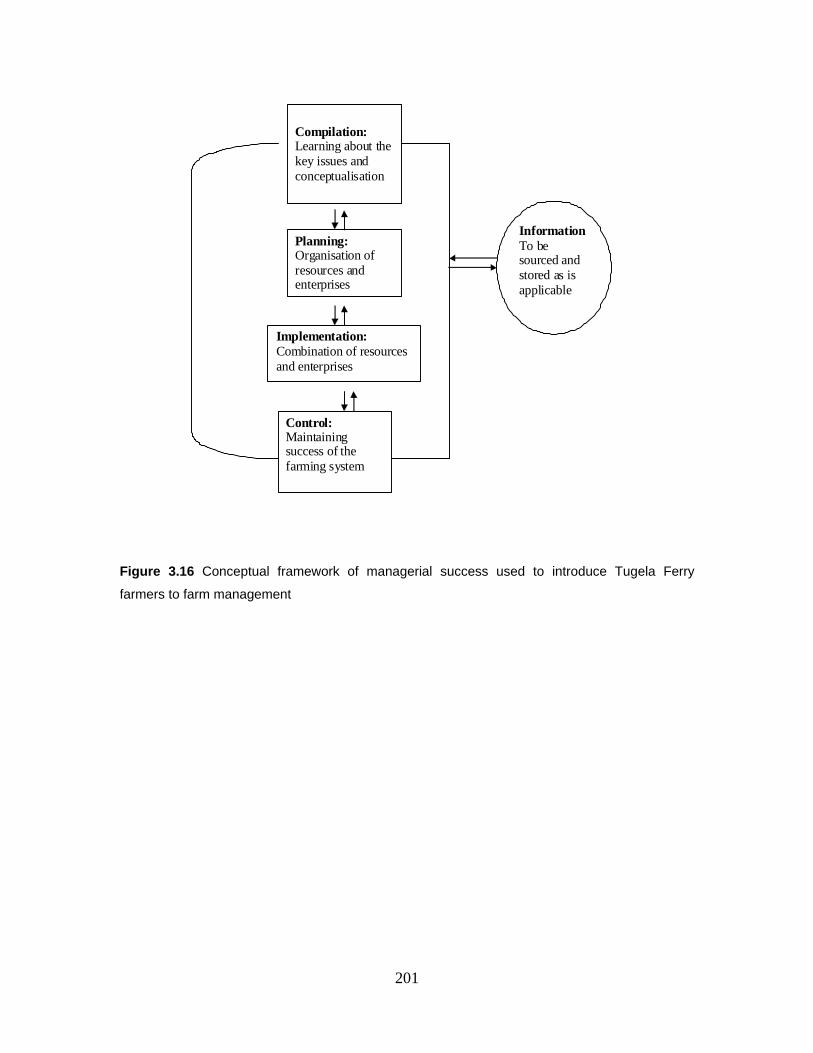
201
Figure 3.16 Conceptual framework of managerial success used to introduce Tugela Ferry
farmers to farm management
Compilation: Learning about the key issues and conceptualisation
Implementation:Combination of resources and enterprises
Planning:Organisation of resources and enterprises
Information To be sourced and stored as is applicable
Control: Maintaining success of the farming system
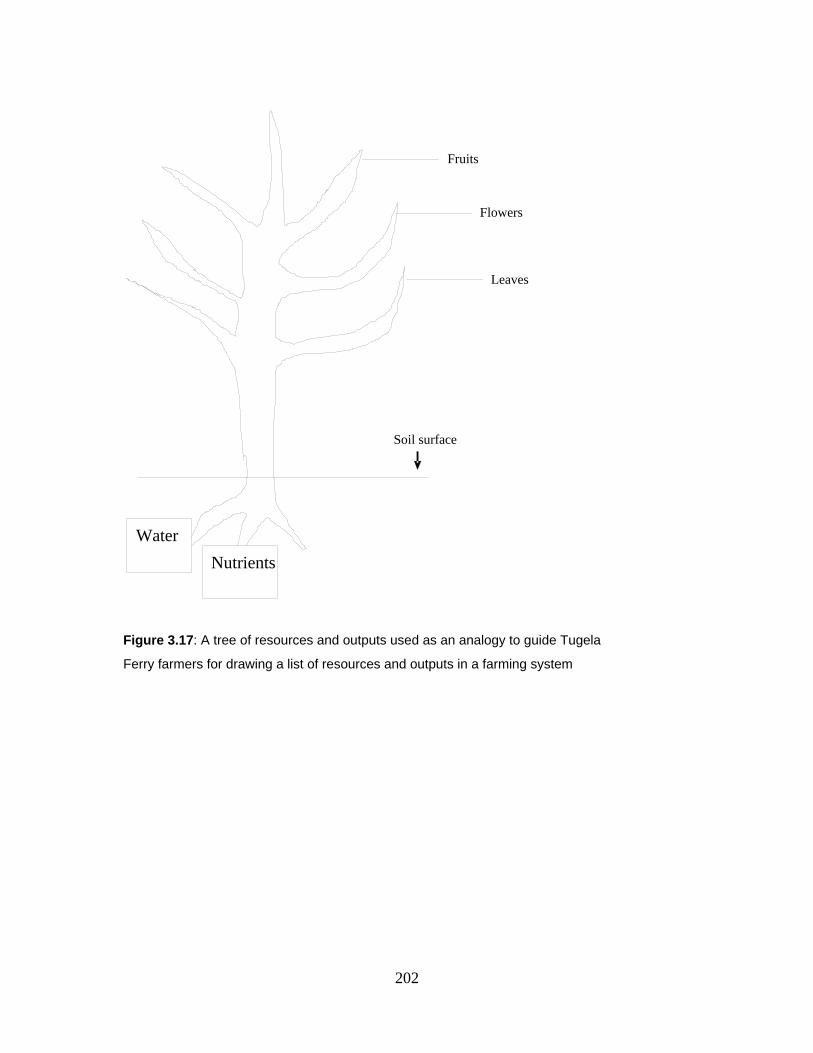
202
Water
Nutrients
Fruits
Flowers
Leaves
Soil surface
Figure 3.17: A tree of resources and outputs used as an analogy to guide Tugela
Ferry farmers for drawing a list of resources and outputs in a farming system
203
Table 3.12: A summary of farming system resources and outputs according to the Tugela Ferry
farmers (N = 31)
Resources Number of
farmers citing
Outputs Number of farmers
citing
Water 31 Yield 31
Fertiliser 31 Markets 20
Land 28 Income 31
Implements 25 Household food 18
Tractor 31 Children’s education 11
Animal power 3 Clothing 5
Labour 15 Social status 2
Extension 7
Other farmers 2
Finance 21
Family 4
Friends 2
Climate 1
Seeds 29
Seedlings 31
Pesticides 31
The results shown in Table 3.12 were discussed with the farmers. It was clear from Table 3.12
that the farmers understood the objectives of farming to be ecological, economic and social in
nature. These objectives were further discussed in relation to the cycle of farm management
(Figure 3.16). The farmers were requested to complete their ‘trees’ at home, with assistance from
family and friends, if possible.
(iii) Attributes of an agricultural system: Using the data shown in Table 3.12 farmers were
introduced to the attributes of an agricultural (farming) system as being ecological (efficiency,
productivity, sustainability and stability), and social (equitability and autonomy).
(iv) Determinants of an agricultural system: Using the examples provided by the farmers
(Table 3.12) it was shown that agricultural systems are determined by physical (e.g. radiation,
temperature, water, soil and land), biological (diseases, pests, vegetation and cropping system),
socioeconomic (e.g. population density, social organisation, prices, markets, capital, credit,
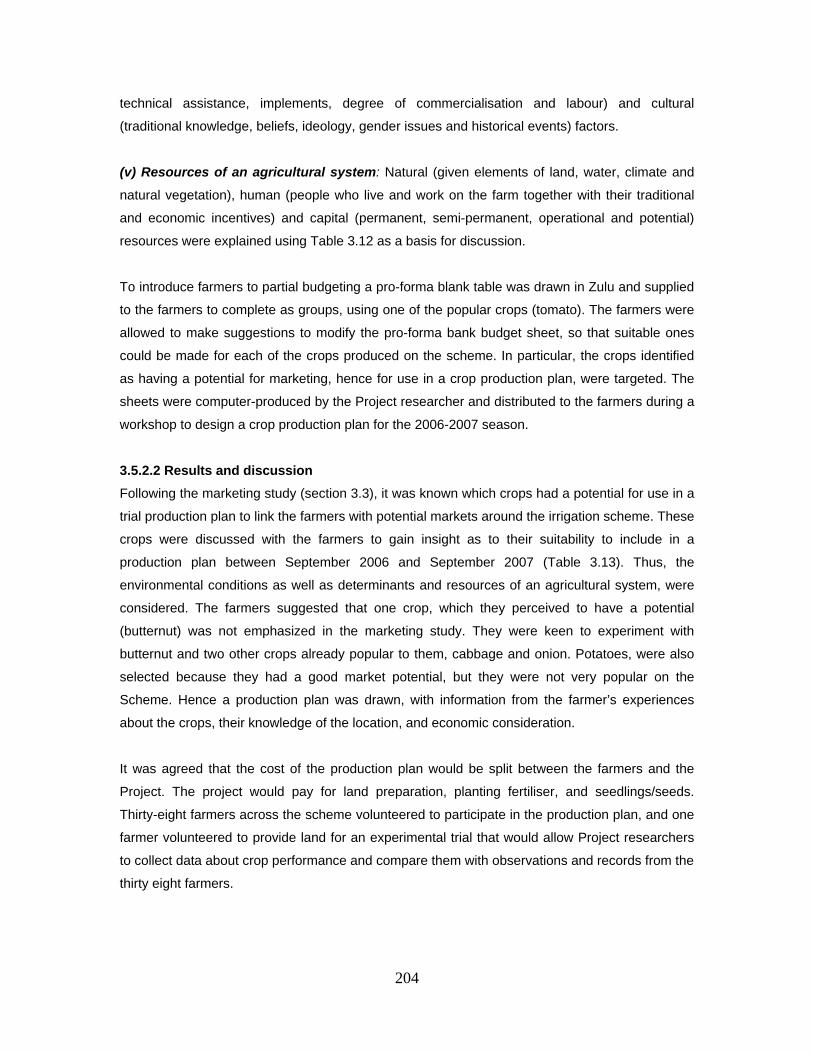
204
technical assistance, implements, degree of commercialisation and labour) and cultural
(traditional knowledge, beliefs, ideology, gender issues and historical events) factors.
(v) Resources of an agricultural system: Natural (given elements of land, water, climate and
natural vegetation), human (people who live and work on the farm together with their traditional
and economic incentives) and capital (permanent, semi-permanent, operational and potential)
resources were explained using Table 3.12 as a basis for discussion.
To introduce farmers to partial budgeting a pro-forma blank table was drawn in Zulu and supplied
to the farmers to complete as groups, using one of the popular crops (tomato). The farmers were
allowed to make suggestions to modify the pro-forma bank budget sheet, so that suitable ones
could be made for each of the crops produced on the scheme. In particular, the crops identified
as having a potential for marketing, hence for use in a crop production plan, were targeted. The
sheets were computer-produced by the Project researcher and distributed to the farmers during a
workshop to design a crop production plan for the 2006-2007 season.
3.5.2.2 Results and discussion
Following the marketing study (section 3.3), it was known which crops had a potential for use in a
trial production plan to link the farmers with potential markets around the irrigation scheme. These
crops were discussed with the farmers to gain insight as to their suitability to include in a
production plan between September 2006 and September 2007 (Table 3.13). Thus, the
environmental conditions as well as determinants and resources of an agricultural system, were
considered. The farmers suggested that one crop, which they perceived to have a potential
(butternut) was not emphasized in the marketing study. They were keen to experiment with
butternut and two other crops already popular to them, cabbage and onion. Potatoes, were also
selected because they had a good market potential, but they were not very popular on the
Scheme. Hence a production plan was drawn, with information from the farmer’s experiences
about the crops, their knowledge of the location, and economic consideration.
It was agreed that the cost of the production plan would be split between the farmers and the
Project. The project would pay for land preparation, planting fertiliser, and seedlings/seeds.
Thirty-eight farmers across the scheme volunteered to participate in the production plan, and one
farmer volunteered to provide land for an experimental trial that would allow Project researchers
to collect data about crop performance and compare them with observations and records from the
thirty eight farmers.
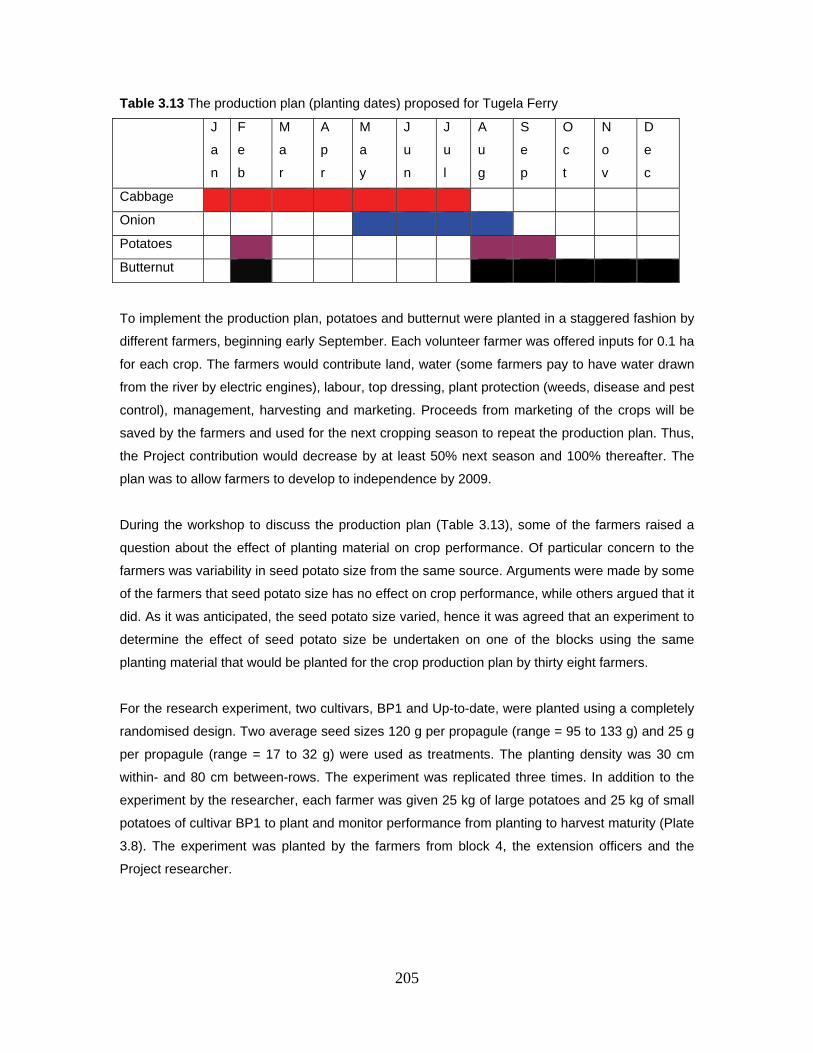
205
Table 3.13 The production plan (planting dates) proposed for Tugela Ferry
J
a
n
F
e
b
M
a
r
A
p
r
M
a
y
J
u
n
J
u
l
A
u
g
S
e
p
O
c
t
N
o
v
D
e
c
Cabbage
Onion
Potatoes
Butternut
To implement the production plan, potatoes and butternut were planted in a staggered fashion by
different farmers, beginning early September. Each volunteer farmer was offered inputs for 0.1 ha
for each crop. The farmers would contribute land, water (some farmers pay to have water drawn
from the river by electric engines), labour, top dressing, plant protection (weeds, disease and pest
control), management, harvesting and marketing. Proceeds from marketing of the crops will be
saved by the farmers and used for the next cropping season to repeat the production plan. Thus,
the Project contribution would decrease by at least 50% next season and 100% thereafter. The
plan was to allow farmers to develop to independence by 2009.
During the workshop to discuss the production plan (Table 3.13), some of the farmers raised a
question about the effect of planting material on crop performance. Of particular concern to the
farmers was variability in seed potato size from the same source. Arguments were made by some
of the farmers that seed potato size has no effect on crop performance, while others argued that it
did. As it was anticipated, the seed potato size varied, hence it was agreed that an experiment to
determine the effect of seed potato size be undertaken on one of the blocks using the same
planting material that would be planted for the crop production plan by thirty eight farmers.
For the research experiment, two cultivars, BP1 and Up-to-date, were planted using a completely
randomised design. Two average seed sizes 120 g per propagule (range = 95 to 133 g) and 25 g
per propagule (range = 17 to 32 g) were used as treatments. The planting density was 30 cm
within- and 80 cm between-rows. The experiment was replicated three times. In addition to the
experiment by the researcher, each farmer was given 25 kg of large potatoes and 25 kg of small
potatoes of cultivar BP1 to plant and monitor performance from planting to harvest maturity (Plate
3.8). The experiment was planted by the farmers from block 4, the extension officers and the
Project researcher.
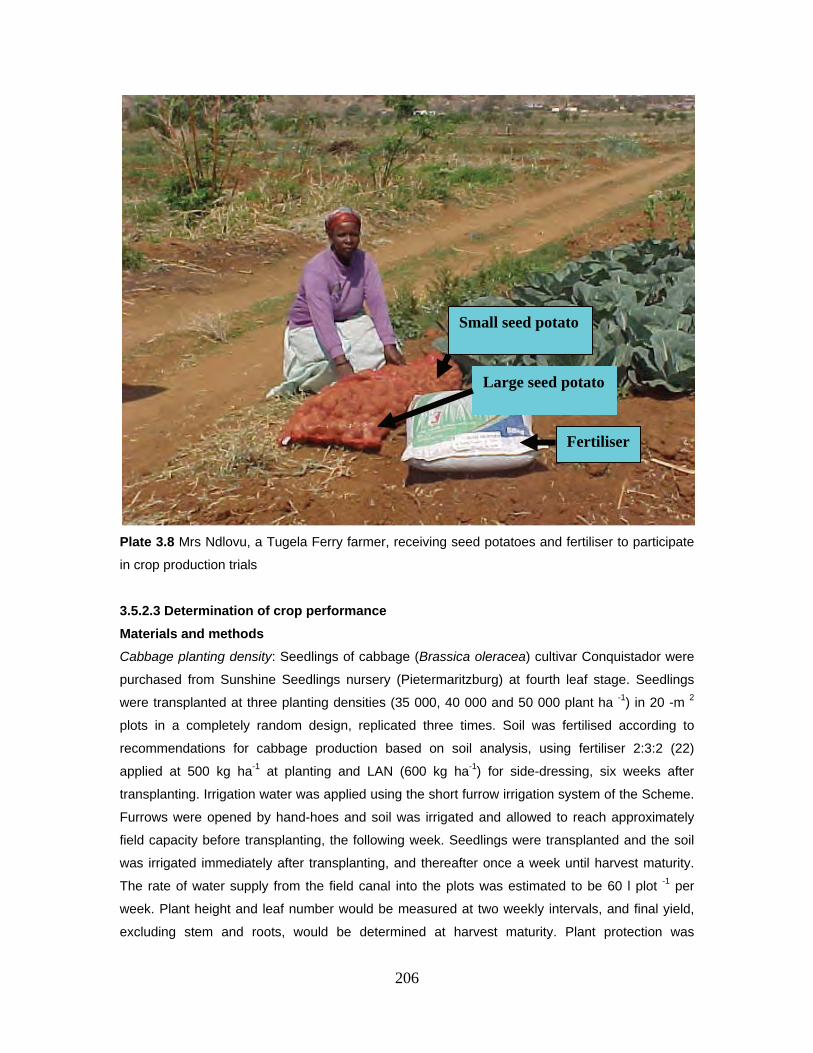
206
Plate 3.8 Mrs Ndlovu, a Tugela Ferry farmer, receiving seed potatoes and fertiliser to participate
in crop production trials
3.5.2.3 Determination of crop performance
Materials and methods
Cabbage planting density: Seedlings of cabbage (Brassica oleracea) cultivar Conquistador were
purchased from Sunshine Seedlings nursery (Pietermaritzburg) at fourth leaf stage. Seedlings
were transplanted at three planting densities (35 000, 40 000 and 50 000 plant ha -1) in 20 -m 2
plots in a completely random design, replicated three times. Soil was fertilised according to
recommendations for cabbage production based on soil analysis, using fertiliser 2:3:2 (22)
applied at 500 kg ha-1 at planting and LAN (600 kg ha-1) for side-dressing, six weeks after
transplanting. Irrigation water was applied using the short furrow irrigation system of the Scheme.
Furrows were opened by hand-hoes and soil was irrigated and allowed to reach approximately
field capacity before transplanting, the following week. Seedlings were transplanted and the soil
was irrigated immediately after transplanting, and thereafter once a week until harvest maturity.
The rate of water supply from the field canal into the plots was estimated to be 60 l plot -1 per
week. Plant height and leaf number would be measured at two weekly intervals, and final yield,
excluding stem and roots, would be determined at harvest maturity. Plant protection was
Small seed potato
Large seed potato
Fertiliser
207
performed using Bulldock (active ingredient: pyrethroid) at 16 ml 20 ℓ -1 water, applied by hand
spraying at planting. Tamaron (methamidophos 195 g a.i. ℓ-1). (20 ml 20 ℓ -1 water) was used to
control diamond back month and aphids, applied by hand spraying every two weeks after
transplanting, twice during the growing season. Weeds were removed mechanically, by hand-
hoe.
Onion seedling size experiment: Seeds of onion (Allium cepa) cultivar Texas Grano were
purchased from MacDonald Seed Co. (Pietermaritzburg) and sown in 3 m-2 seed beds at 100 g
per bed, 10 mm deep in furrows 250 mm apart. Seedling emergence and establishment was
allowed to occur for one month, before determination of transplant size and planting. Seedlings
were planted in a completely random design with three replications of 20 m-2 plots. Three
seedling sizes [8 ( 2.5) cm (one true leaf), 15( 1.5) cm (two true leaves), and 20 ( 2) cm (three
true leaves)], planted at 125 000 plants ha-1, were compared for growth and final yield. Soil was
fertilised according to recommendations for cabbage production based on soil analysis, using
fertiliser 2:3:2 (22) applied at 500 kg ha -1 at planting and LAN (300 kg ha -1) for side-dressing, six
weeks after transplanting. Irrigation was similar to that for cabbage. For plant protection, cutworm
was controlled as was explained for cabbage and metasystox (16 ml 20ℓ -1) was used for aphid
control. Weed control was by hand-hoeing.
Farmer trials: At each block 38 farmers planted cabbage and onion according to the local cultural
practices. The farmers’ cultural practices for planting density and seedling establishment were
determined during site visits and compared with those used for the experimental sites, and they
generally varied within the plant population and seedling size ranges explained for cabbage and
onion, above.
Potatoes and butternut experiment: Planting of potatoes and butternuts took place in August and
September 2006. The planting was staggered in plots belonging to 38 farmers throughout the
scheme, so that the potato crop was planted in batches (~ 1/3 of the farmers) throughout the
month of September and the same pattern was used for the butternuts in October. Farmers were
requested to keep records of planting densities and input for the purposes of partial budgeting
and to allow their crops’ performance to be compared with that of the experimental crop, where
necessary. The experimental crop on the effect of seed potato size on stand establishment and
yield was planted on the 8th of September 2006. On the same day, it was established that on
each block (of blocks 1, 2, 3, 4A, 4B, 5, 7A and 7B), at least one farmer also planted potatoes. It
is important to note that for the experiment two cultivars (BP1 and Up-to-date), each represented
by small (25 g) and large (120 g) propagules were planted in a density of 80 cm between rows
and 30 cm within rows. Fertiliser [2:3:2 (22)] was applied at a rate of 500 kg ha -1. Irrigation water
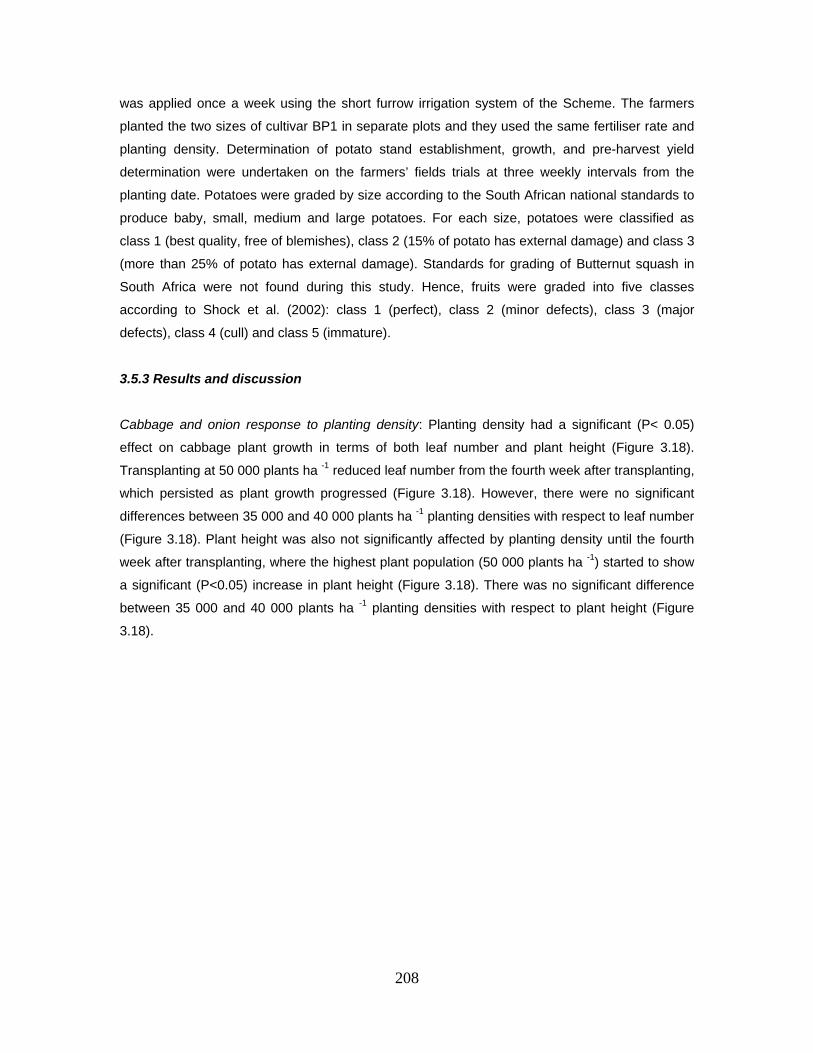
208
was applied once a week using the short furrow irrigation system of the Scheme. The farmers
planted the two sizes of cultivar BP1 in separate plots and they used the same fertiliser rate and
planting density. Determination of potato stand establishment, growth, and pre-harvest yield
determination were undertaken on the farmers’ fields trials at three weekly intervals from the
planting date. Potatoes were graded by size according to the South African national standards to
produce baby, small, medium and large potatoes. For each size, potatoes were classified as
class 1 (best quality, free of blemishes), class 2 (15% of potato has external damage) and class 3
(more than 25% of potato has external damage). Standards for grading of Butternut squash in
South Africa were not found during this study. Hence, fruits were graded into five classes
according to Shock et al. (2002): class 1 (perfect), class 2 (minor defects), class 3 (major
defects), class 4 (cull) and class 5 (immature).
3.5.3 Results and discussion
Cabbage and onion response to planting density: Planting density had a significant (P< 0.05)
effect on cabbage plant growth in terms of both leaf number and plant height (Figure 3.18).
Transplanting at 50 000 plants ha -1 reduced leaf number from the fourth week after transplanting,
which persisted as plant growth progressed (Figure 3.18). However, there were no significant
differences between 35 000 and 40 000 plants ha -1 planting densities with respect to leaf number
(Figure 3.18). Plant height was also not significantly affected by planting density until the fourth
week after transplanting, where the highest plant population (50 000 plants ha -1) started to show
a significant (P<0.05) increase in plant height (Figure 3.18). There was no significant difference
between 35 000 and 40 000 plants ha -1 planting densities with respect to plant height (Figure
3.18).
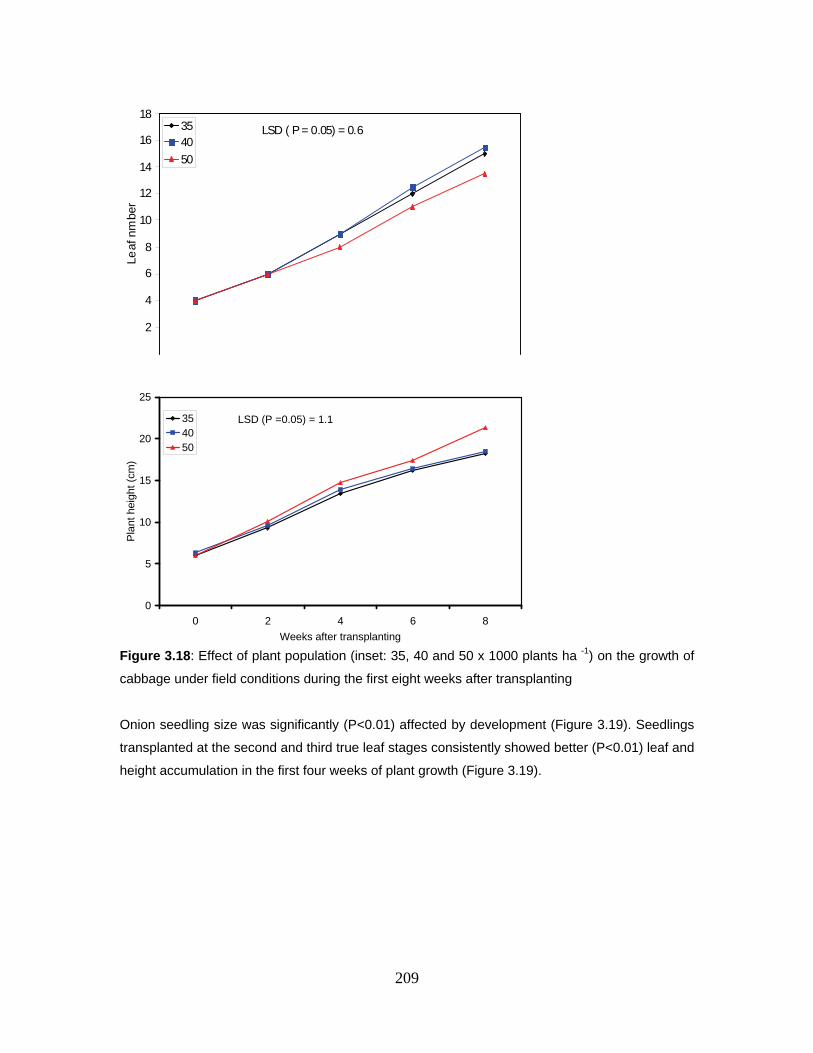
209
Figure 3.18: Effect of plant population (inset: 35, 40 and 50 x 1000 plants ha -1) on the growth of
cabbage under field conditions during the first eight weeks after transplanting
Onion seedling size was significantly (P<0.01) affected by development (Figure 3.19). Seedlings
transplanted at the second and third true leaf stages consistently showed better (P<0.01) leaf and
height accumulation in the first four weeks of plant growth (Figure 3.19).
0
2
4
6
8
10
12
14
16
18
Leaf
nm
ber
3540
50
LSD ( P = 0.05) = 0.6
0
5
10
15
20
25
0 2 4 6 8
Weeks after transplanting
Pla
nt h
eigh
t (c
m)
354050
LSD (P =0.05) = 1.1
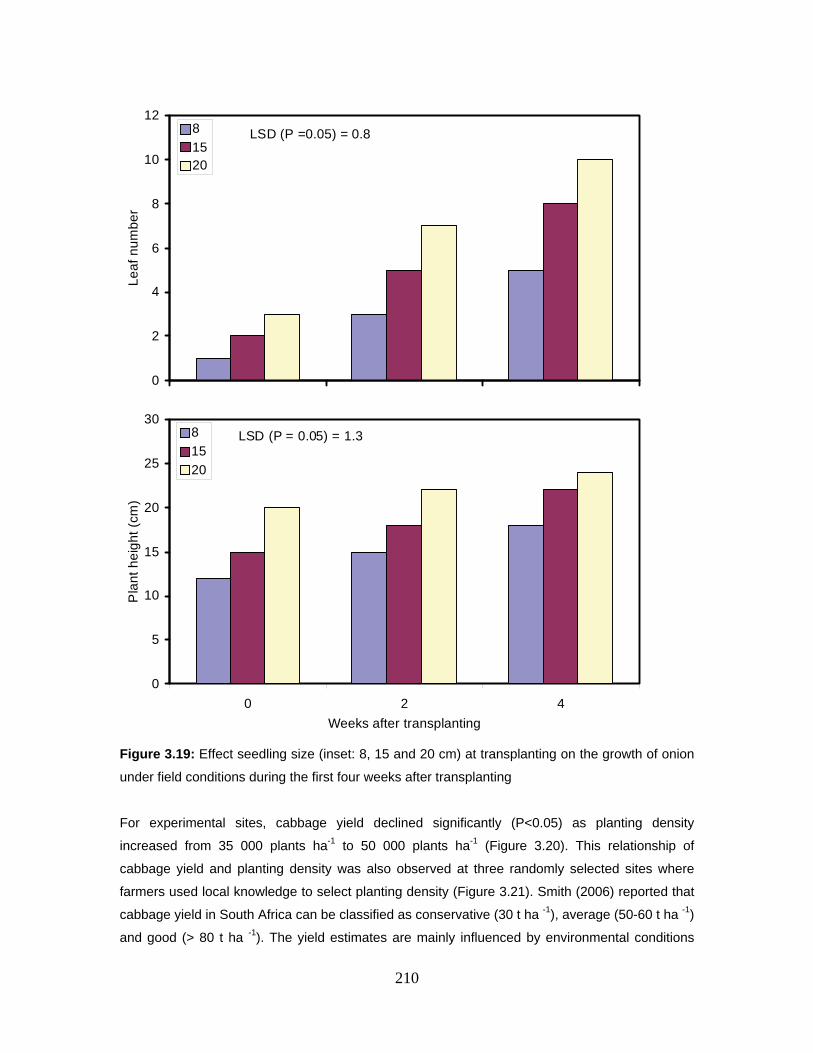
210
Figure 3.19: Effect seedling size (inset: 8, 15 and 20 cm) at transplanting on the growth of onion
under field conditions during the first four weeks after transplanting
For experimental sites, cabbage yield declined significantly (P<0.05) as planting density
increased from 35 000 plants ha-1 to 50 000 plants ha-1 (Figure 3.20). This relationship of
cabbage yield and planting density was also observed at three randomly selected sites where
farmers used local knowledge to select planting density (Figure 3.21). Smith (2006) reported that
cabbage yield in South Africa can be classified as conservative (30 t ha -1), average (50-60 t ha -1)
and good (> 80 t ha -1). The yield estimates are mainly influenced by environmental conditions
0
2
4
6
8
10
12L
ea
f n
um
be
r8
1520
LSD (P =0.05) = 0.8
0
5
10
15
20
25
30
0 2 4
Weeks after transplanting
Pla
nt
he
igh
t (c
m)
8
15
20
LSD (P = 0.05) = 1.3
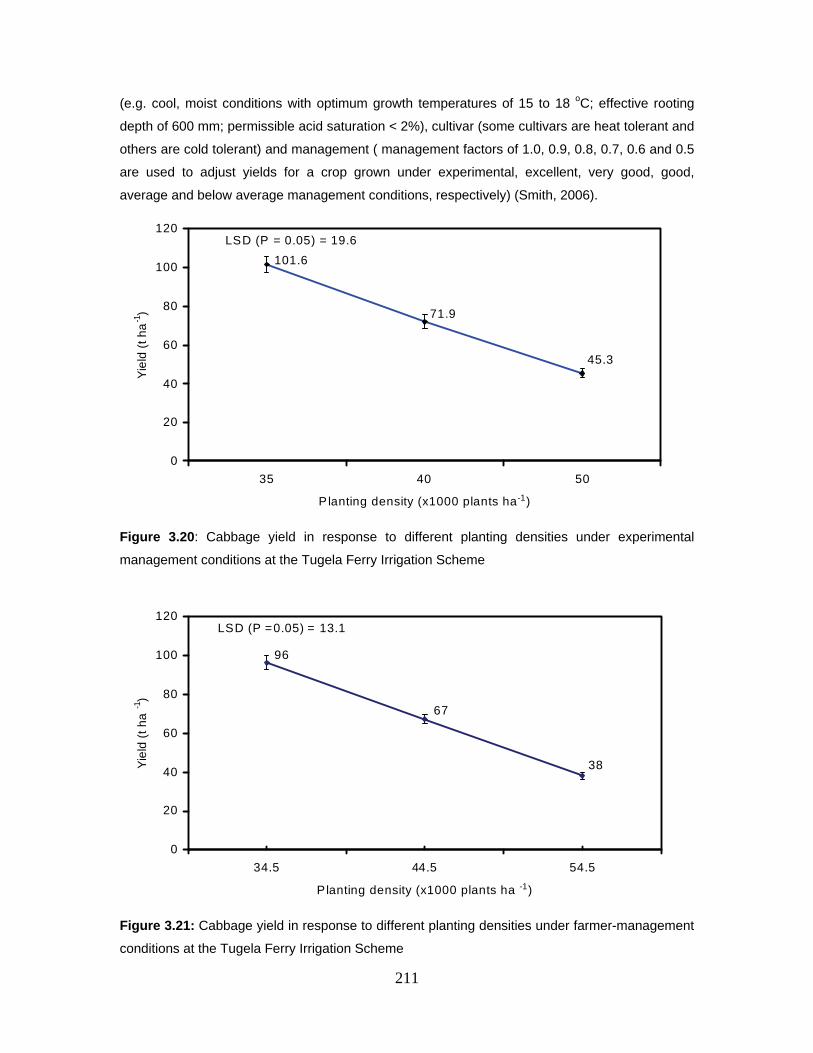
211
(e.g. cool, moist conditions with optimum growth temperatures of 15 to 18 oC; effective rooting
depth of 600 mm; permissible acid saturation < 2%), cultivar (some cultivars are heat tolerant and
others are cold tolerant) and management ( management factors of 1.0, 0.9, 0.8, 0.7, 0.6 and 0.5
are used to adjust yields for a crop grown under experimental, excellent, very good, good,
average and below average management conditions, respectively) (Smith, 2006).
Figure 3.20: Cabbage yield in response to different planting densities under experimental
management conditions at the Tugela Ferry Irrigation Scheme
Figure 3.21: Cabbage yield in response to different planting densities under farmer-management
conditions at the Tugela Ferry Irrigation Scheme
45.3
71.9
101.6
0
20
40
60
80
100
120
35 40 50
Planting density (x1000 plants ha-1)
Yie
ld (
t h
a-1
)
LSD (P = 0.05) = 19.6
38
67
96
0
20
40
60
80
100
120
34.5 44.5 54.5
Planting density (x1000 plants ha -1)
Yie
ld (
t h
a -1
)
LSD (P =0.05) = 13.1
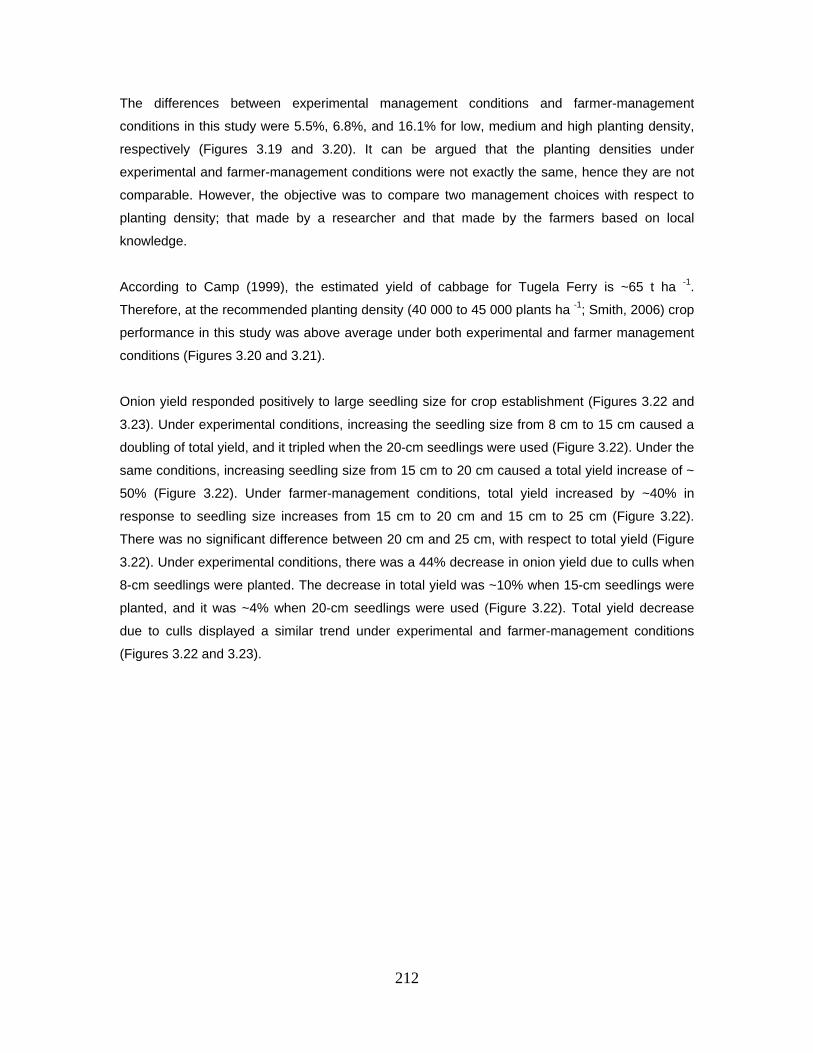
212
The differences between experimental management conditions and farmer-management
conditions in this study were 5.5%, 6.8%, and 16.1% for low, medium and high planting density,
respectively (Figures 3.19 and 3.20). It can be argued that the planting densities under
experimental and farmer-management conditions were not exactly the same, hence they are not
comparable. However, the objective was to compare two management choices with respect to
planting density; that made by a researcher and that made by the farmers based on local
knowledge.
According to Camp (1999), the estimated yield of cabbage for Tugela Ferry is ~65 t ha -1.
Therefore, at the recommended planting density (40 000 to 45 000 plants ha -1; Smith, 2006) crop
performance in this study was above average under both experimental and farmer management
conditions (Figures 3.20 and 3.21).
Onion yield responded positively to large seedling size for crop establishment (Figures 3.22 and
3.23). Under experimental conditions, increasing the seedling size from 8 cm to 15 cm caused a
doubling of total yield, and it tripled when the 20-cm seedlings were used (Figure 3.22). Under the
same conditions, increasing seedling size from 15 cm to 20 cm caused a total yield increase of ~
50% (Figure 3.22). Under farmer-management conditions, total yield increased by ~40% in
response to seedling size increases from 15 cm to 20 cm and 15 cm to 25 cm (Figure 3.22).
There was no significant difference between 20 cm and 25 cm, with respect to total yield (Figure
3.22). Under experimental conditions, there was a 44% decrease in onion yield due to culls when
8-cm seedlings were planted. The decrease in total yield was ~10% when 15-cm seedlings were
planted, and it was ~4% when 20-cm seedlings were used (Figure 3.22). Total yield decrease
due to culls displayed a similar trend under experimental and farmer-management conditions
(Figures 3.22 and 3.23).
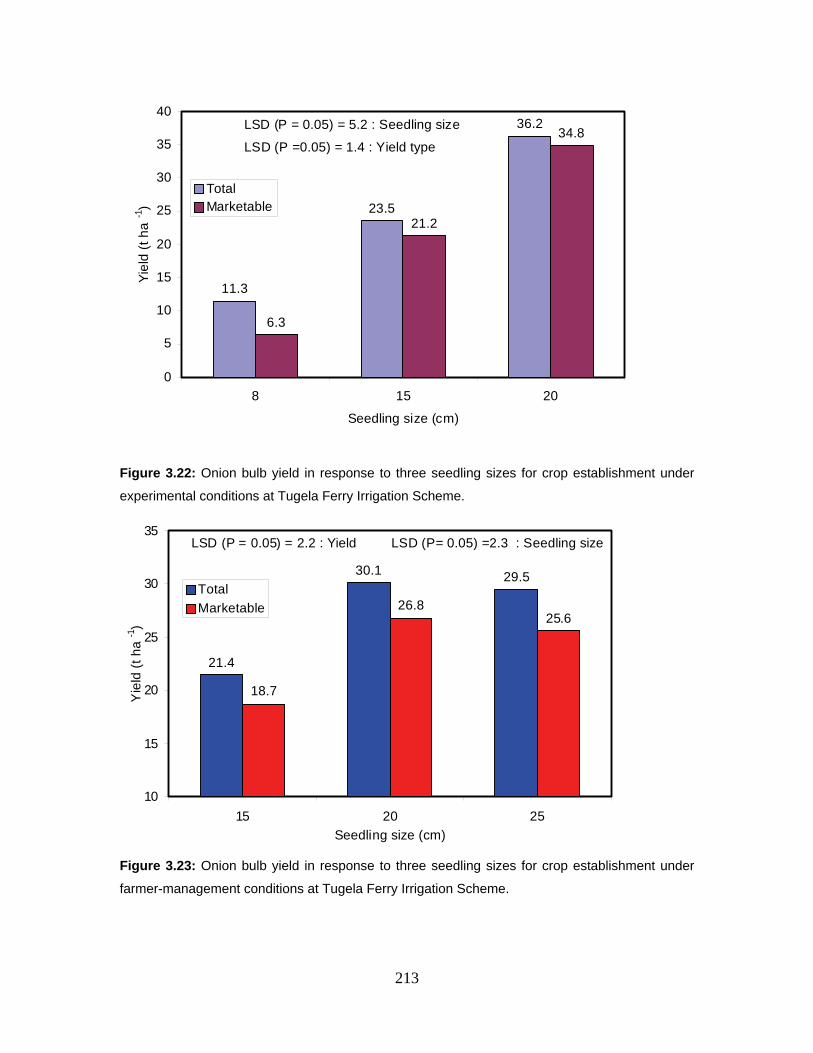
213
Figure 3.22: Onion bulb yield in response to three seedling sizes for crop establishment under
experimental conditions at Tugela Ferry Irrigation Scheme.
Figure 3.23: Onion bulb yield in response to three seedling sizes for crop establishment under
farmer-management conditions at Tugela Ferry Irrigation Scheme.
11.3
23.5
36.2
6.3
21.2
34.8
0
5
10
15
20
25
30
35
40
8 15 20
Seedling size (cm)
Yie
ld (
t h
a -1
)
TotalMarketable
LSD (P =0.05) = 1.4 : Yield type
LSD (P = 0.05) = 5.2 : Seedling size
21.4
30.1 29.5
18.7
26.825.6
10
15
20
25
30
35
15 20 25
Seedling size (cm)
Yie
ld (
t h
a -1
)
Total
Marketable
LSD (P = 0.05) = 2.2 : Yield LSD (P= 0.05) =2.3 : Seedling size
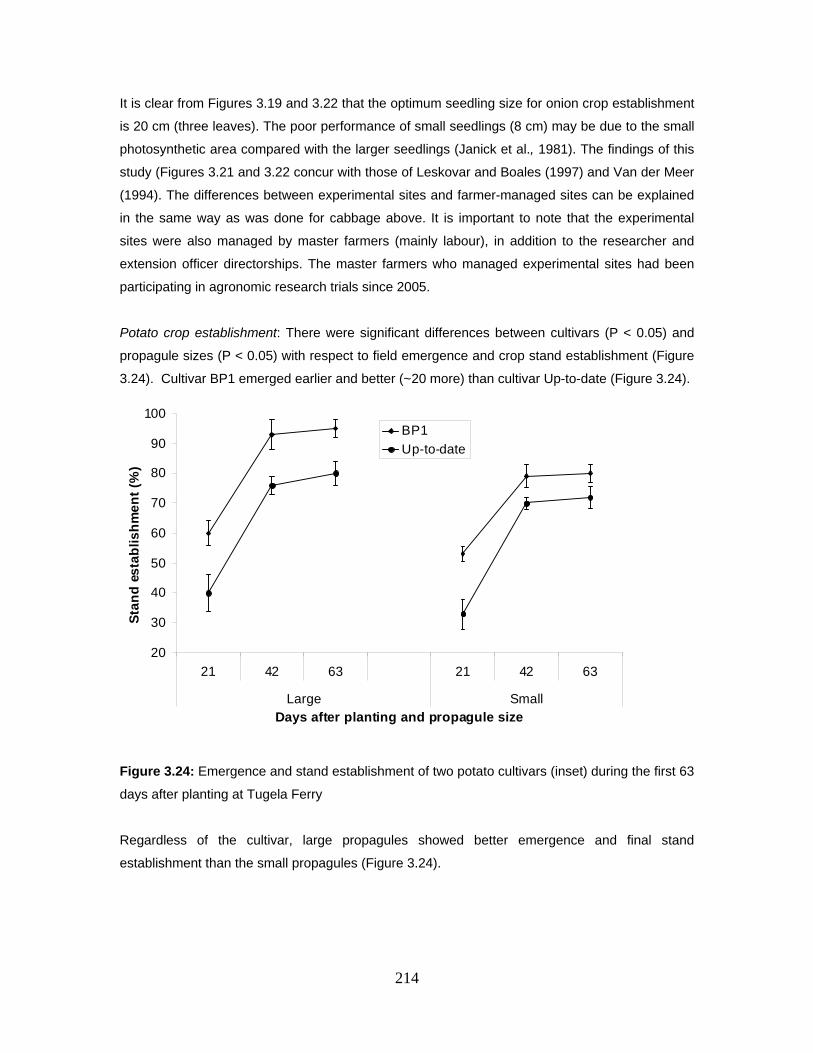
214
It is clear from Figures 3.19 and 3.22 that the optimum seedling size for onion crop establishment
is 20 cm (three leaves). The poor performance of small seedlings (8 cm) may be due to the small
photosynthetic area compared with the larger seedlings (Janick et al., 1981). The findings of this
study (Figures 3.21 and 3.22 concur with those of Leskovar and Boales (1997) and Van der Meer
(1994). The differences between experimental sites and farmer-managed sites can be explained
in the same way as was done for cabbage above. It is important to note that the experimental
sites were also managed by master farmers (mainly labour), in addition to the researcher and
extension officer directorships. The master farmers who managed experimental sites had been
participating in agronomic research trials since 2005.
Potato crop establishment: There were significant differences between cultivars (P < 0.05) and
propagule sizes (P < 0.05) with respect to field emergence and crop stand establishment (Figure
3.24). Cultivar BP1 emerged earlier and better (~20 more) than cultivar Up-to-date (Figure 3.24).
Figure 3.24: Emergence and stand establishment of two potato cultivars (inset) during the first 63
days after planting at Tugela Ferry
Regardless of the cultivar, large propagules showed better emergence and final stand
establishment than the small propagules (Figure 3.24).
20
30
40
50
60
70
80
90
100
21 42 63 21 42 63
Large SmallDays after planting and propagule size
Sta
nd
es
tab
lis
hm
en
t (%
)
BP1
Up-to-date
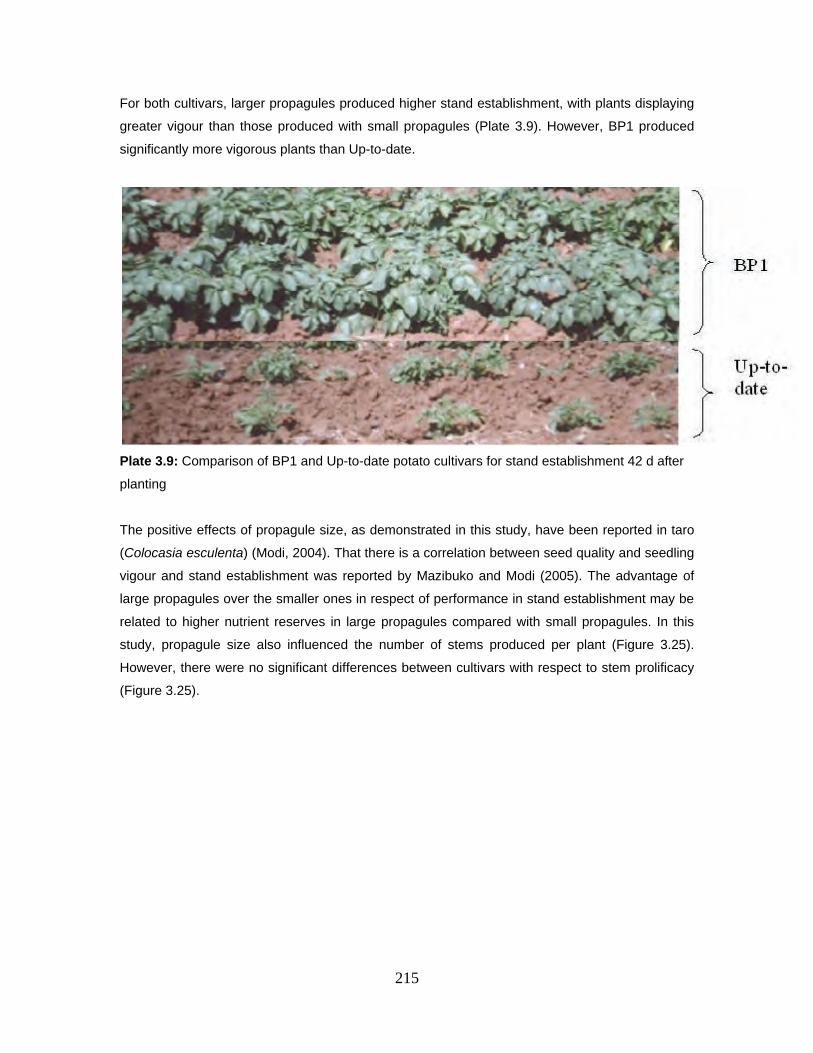
215
For both cultivars, larger propagules produced higher stand establishment, with plants displaying
greater vigour than those produced with small propagules (Plate 3.9). However, BP1 produced
significantly more vigorous plants than Up-to-date.
Plate 3.9: Comparison of BP1 and Up-to-date potato cultivars for stand establishment 42 d after
planting
The positive effects of propagule size, as demonstrated in this study, have been reported in taro
(Colocasia esculenta) (Modi, 2004). That there is a correlation between seed quality and seedling
vigour and stand establishment was reported by Mazibuko and Modi (2005). The advantage of
large propagules over the smaller ones in respect of performance in stand establishment may be
related to higher nutrient reserves in large propagules compared with small propagules. In this
study, propagule size also influenced the number of stems produced per plant (Figure 3.25).
However, there were no significant differences between cultivars with respect to stem prolificacy
(Figure 3.25).
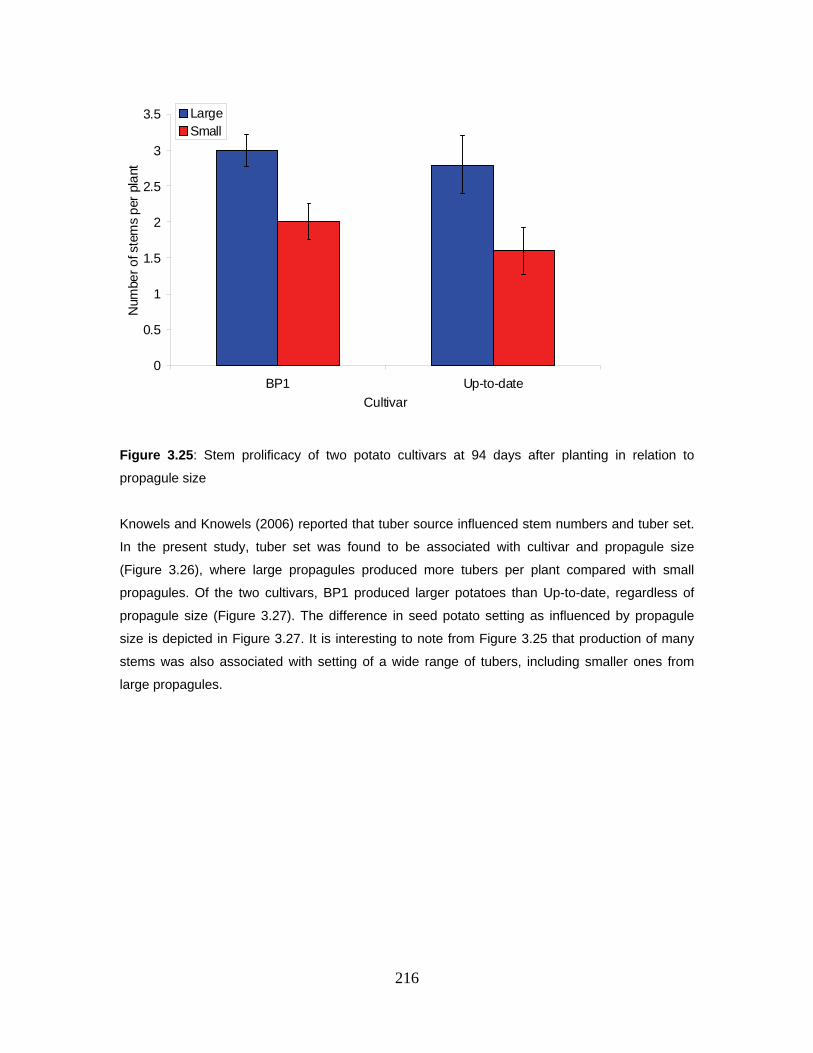
216
Figure 3.25: Stem prolificacy of two potato cultivars at 94 days after planting in relation to
propagule size
Knowels and Knowels (2006) reported that tuber source influenced stem numbers and tuber set.
In the present study, tuber set was found to be associated with cultivar and propagule size
(Figure 3.26), where large propagules produced more tubers per plant compared with small
propagules. Of the two cultivars, BP1 produced larger potatoes than Up-to-date, regardless of
propagule size (Figure 3.27). The difference in seed potato setting as influenced by propagule
size is depicted in Figure 3.27. It is interesting to note from Figure 3.25 that production of many
stems was also associated with setting of a wide range of tubers, including smaller ones from
large propagules.
0
0.5
1
1.5
2
2.5
3
3.5
BP1 Up-to-date
Cultivar
Num
ber
of s
tem
s p
er p
lant
LargeSmall
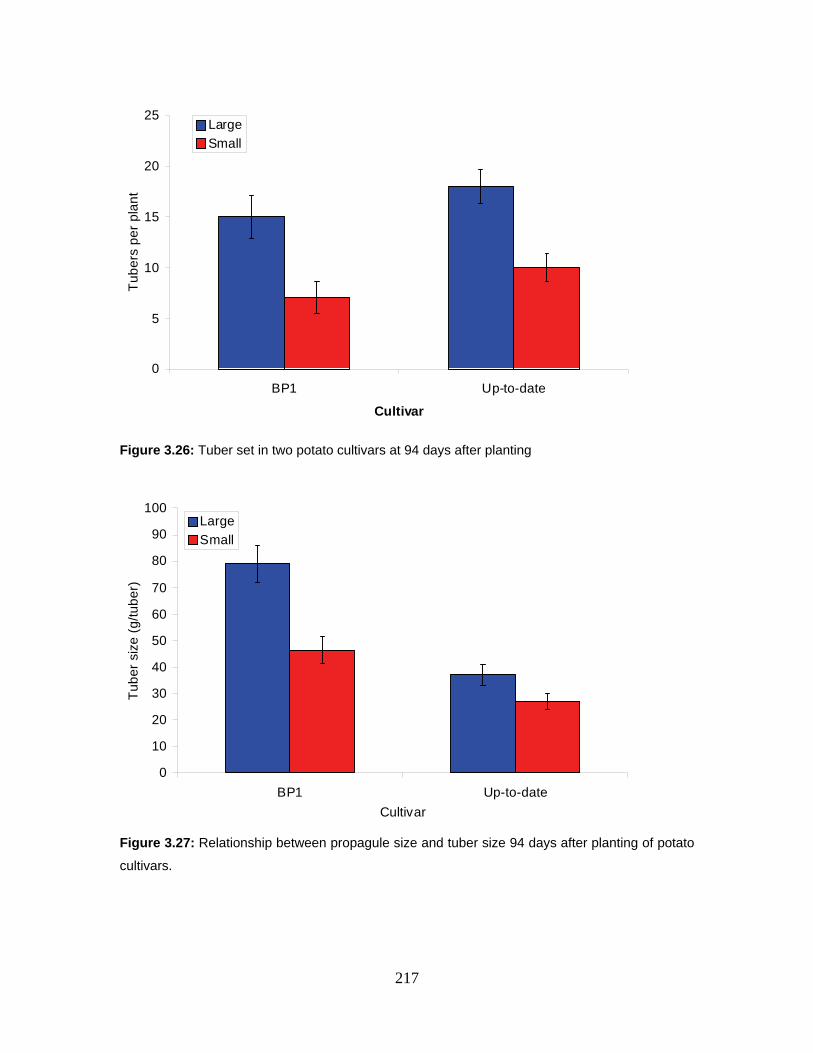
217
Figure 3.26: Tuber set in two potato cultivars at 94 days after planting
Figure 3.27: Relationship between propagule size and tuber size 94 days after planting of potato
cultivars.
0
5
10
15
20
25
BP1 Up-to-date
Cultivar
Tu
be
rs p
er
pla
nt
Large
Small
0
10
20
30
40
50
60
70
80
90
100
BP1 Up-to-date
Cultivar
Tu
be
r si
ze (
g/t
ub
er)
Large
Small
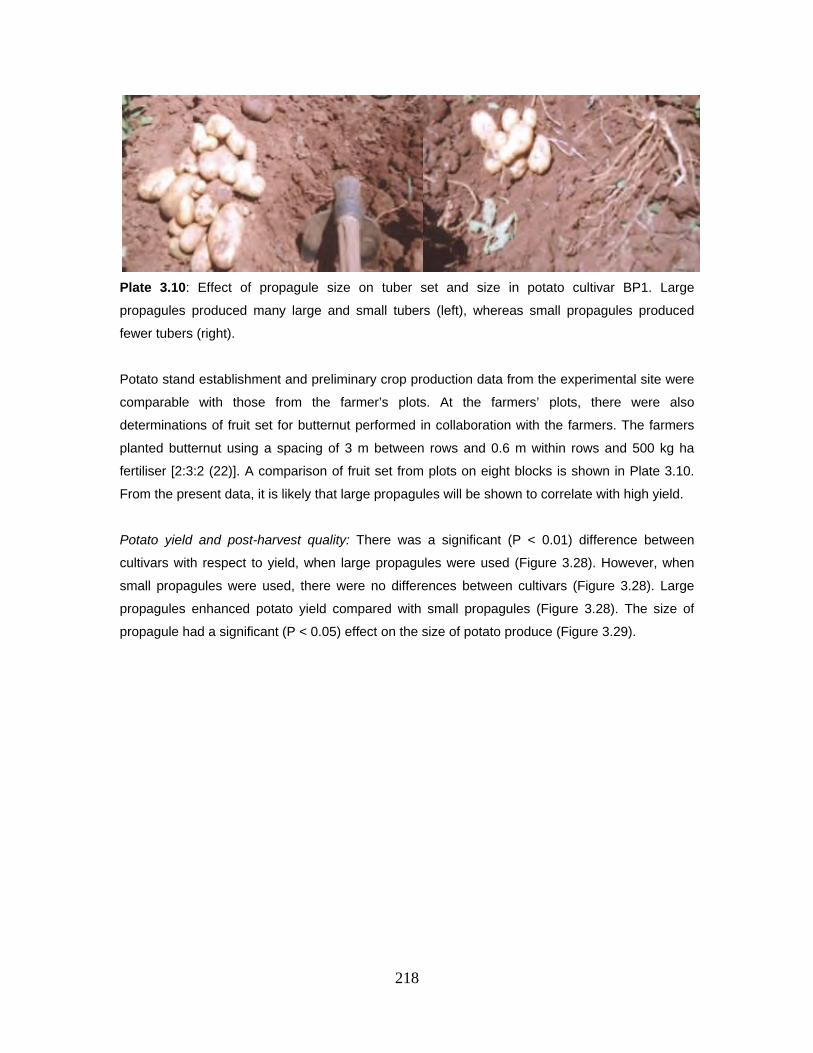
218
Plate 3.10: Effect of propagule size on tuber set and size in potato cultivar BP1. Large
propagules produced many large and small tubers (left), whereas small propagules produced
fewer tubers (right).
Potato stand establishment and preliminary crop production data from the experimental site were
comparable with those from the farmer’s plots. At the farmers’ plots, there were also
determinations of fruit set for butternut performed in collaboration with the farmers. The farmers
planted butternut using a spacing of 3 m between rows and 0.6 m within rows and 500 kg ha
fertiliser [2:3:2 (22)]. A comparison of fruit set from plots on eight blocks is shown in Plate 3.10.
From the present data, it is likely that large propagules will be shown to correlate with high yield.
Potato yield and post-harvest quality: There was a significant (P < 0.01) difference between
cultivars with respect to yield, when large propagules were used (Figure 3.28). However, when
small propagules were used, there were no differences between cultivars (Figure 3.28). Large
propagules enhanced potato yield compared with small propagules (Figure 3.28). The size of
propagule had a significant (P < 0.05) effect on the size of potato produce (Figure 3.29).
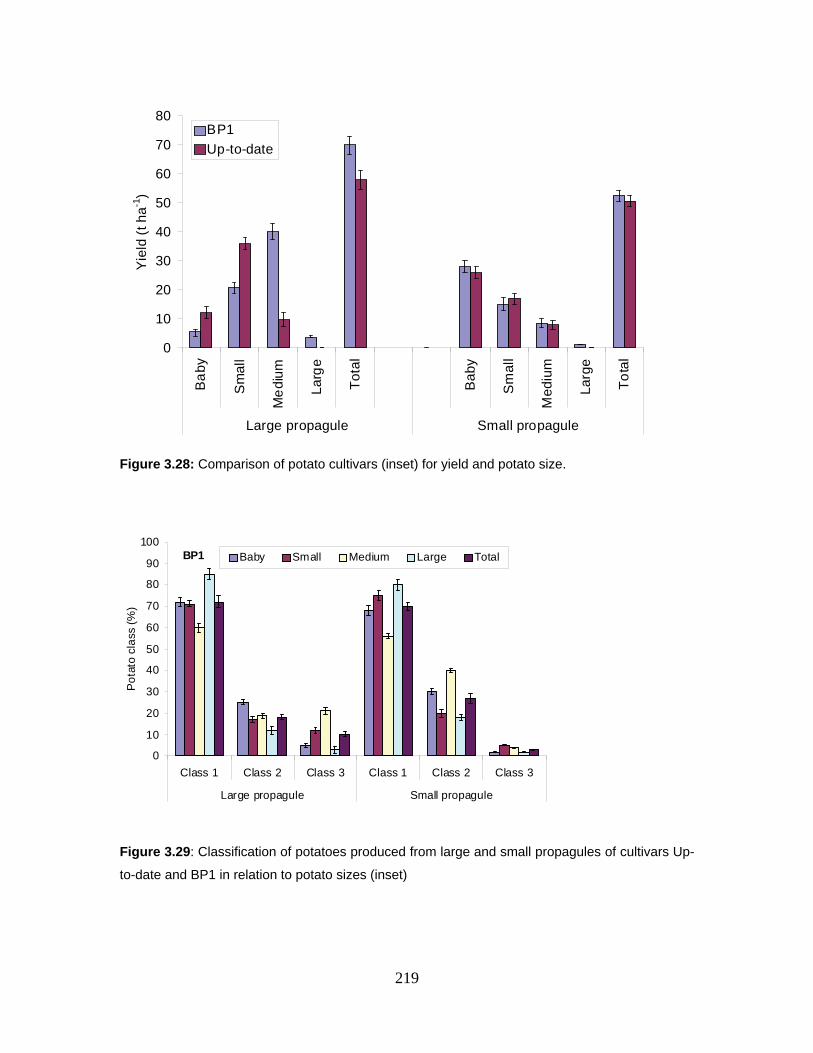
219
Figure 3.28: Comparison of potato cultivars (inset) for yield and potato size.
Figure 3.29: Classification of potatoes produced from large and small propagules of cultivars Up-
to-date and BP1 in relation to potato sizes (inset)
0
10
20
30
40
50
60
70
80
Ba
by
Sm
all
Me
diu
m
La
rge
To
tal
Ba
by
Sm
all
Me
diu
m
La
rge
To
tal
Large propagule Small propagule
Yie
ld (
t h
a-1
)BP1
Up-to-date
0
10
20
30
40
50
60
70
80
90
100
Class 1 Class 2 Class 3 Class 1 Class 2 Class 3
Large propagule Small propagule
Po
tato
cla
ss (
%)
Baby Small Medium Large TotalBP1
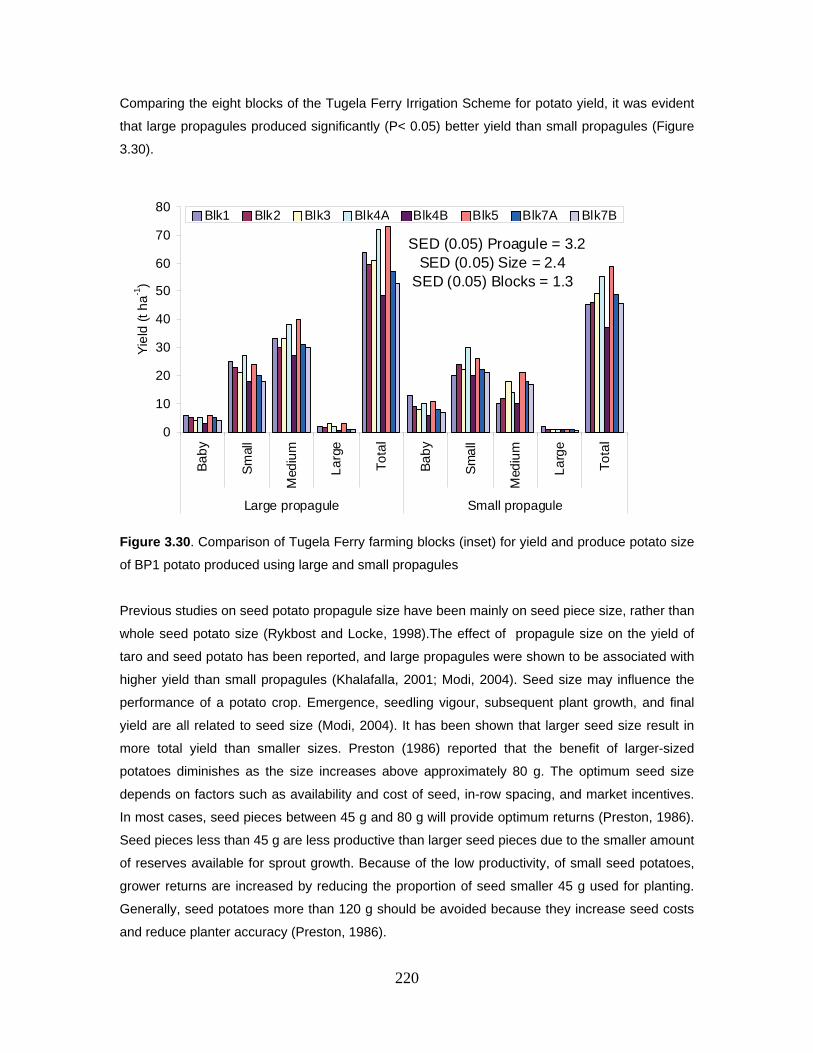
220
Comparing the eight blocks of the Tugela Ferry Irrigation Scheme for potato yield, it was evident
that large propagules produced significantly (P< 0.05) better yield than small propagules (Figure
3.30).
Figure 3.30. Comparison of Tugela Ferry farming blocks (inset) for yield and produce potato size
of BP1 potato produced using large and small propagules
Previous studies on seed potato propagule size have been mainly on seed piece size, rather than
whole seed potato size (Rykbost and Locke, 1998).The effect of propagule size on the yield of
taro and seed potato has been reported, and large propagules were shown to be associated with
higher yield than small propagules (Khalafalla, 2001; Modi, 2004). Seed size may influence the
performance of a potato crop. Emergence, seedling vigour, subsequent plant growth, and final
yield are all related to seed size (Modi, 2004). It has been shown that larger seed size result in
more total yield than smaller sizes. Preston (1986) reported that the benefit of larger-sized
potatoes diminishes as the size increases above approximately 80 g. The optimum seed size
depends on factors such as availability and cost of seed, in-row spacing, and market incentives.
In most cases, seed pieces between 45 g and 80 g will provide optimum returns (Preston, 1986).
Seed pieces less than 45 g are less productive than larger seed pieces due to the smaller amount
of reserves available for sprout growth. Because of the low productivity, of small seed potatoes,
grower returns are increased by reducing the proportion of seed smaller 45 g used for planting.
Generally, seed potatoes more than 120 g should be avoided because they increase seed costs
and reduce planter accuracy (Preston, 1986).
0
10
20
30
40
50
60
70
80B
ab
y
Sm
all
Med
ium
La
rge
To
tal
Ba
by
Sm
all
Med
ium
La
rge
To
tal
Large propagule Small propagule
Yie
ld (
t h
a-1
)
Blk1 Blk2 Blk3 Blk4A Blk4B Blk5 Blk7A Blk7B
SED (0.05) Proagule = 3.2SED (0.05) Size = 2.4
SED (0.05) Blocks = 1.3
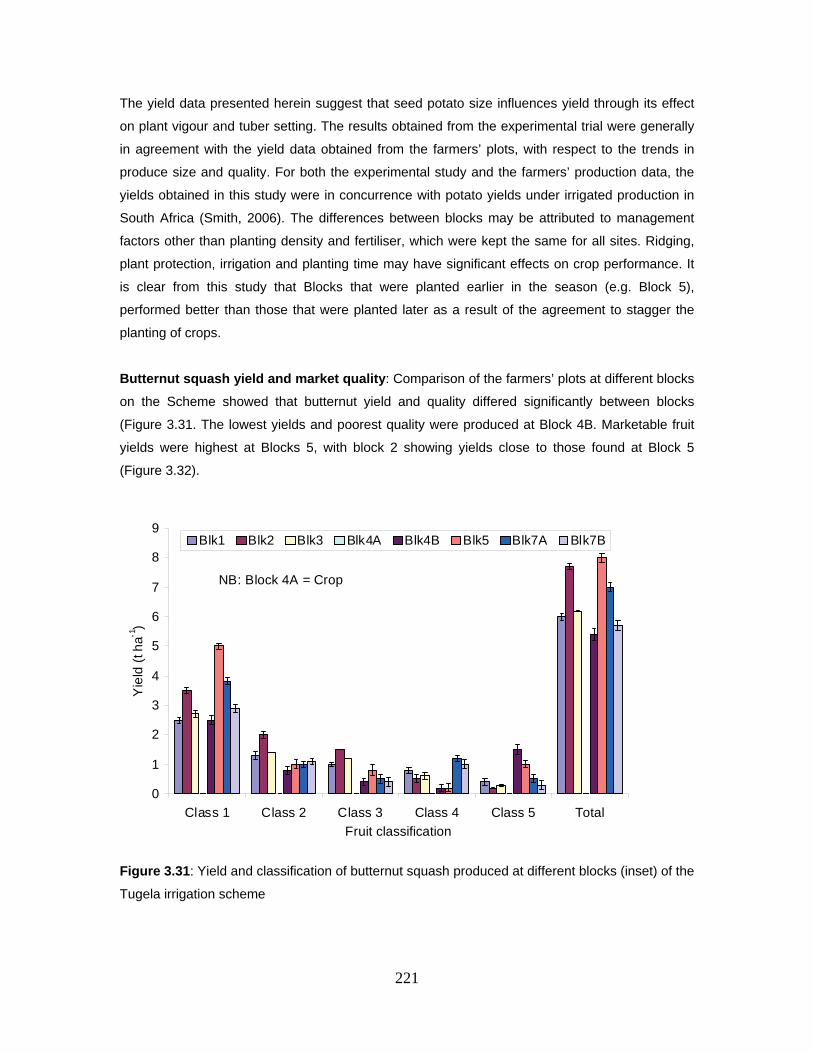
221
The yield data presented herein suggest that seed potato size influences yield through its effect
on plant vigour and tuber setting. The results obtained from the experimental trial were generally
in agreement with the yield data obtained from the farmers’ plots, with respect to the trends in
produce size and quality. For both the experimental study and the farmers’ production data, the
yields obtained in this study were in concurrence with potato yields under irrigated production in
South Africa (Smith, 2006). The differences between blocks may be attributed to management
factors other than planting density and fertiliser, which were kept the same for all sites. Ridging,
plant protection, irrigation and planting time may have significant effects on crop performance. It
is clear from this study that Blocks that were planted earlier in the season (e.g. Block 5),
performed better than those that were planted later as a result of the agreement to stagger the
planting of crops.
Butternut squash yield and market quality: Comparison of the farmers’ plots at different blocks
on the Scheme showed that butternut yield and quality differed significantly between blocks
(Figure 3.31. The lowest yields and poorest quality were produced at Block 4B. Marketable fruit
yields were highest at Blocks 5, with block 2 showing yields close to those found at Block 5
(Figure 3.32).
Figure 3.31: Yield and classification of butternut squash produced at different blocks (inset) of the
Tugela irrigation scheme
0
1
2
3
4
5
6
7
8
9
Class 1 Class 2 Class 3 Class 4 Class 5 Total
Fruit classification
Yie
ld (
t ha-1
)
Blk1 Blk2 Blk3 Blk4A Blk4B Blk5 Blk7A Blk7B
NB: Block 4A = Crop
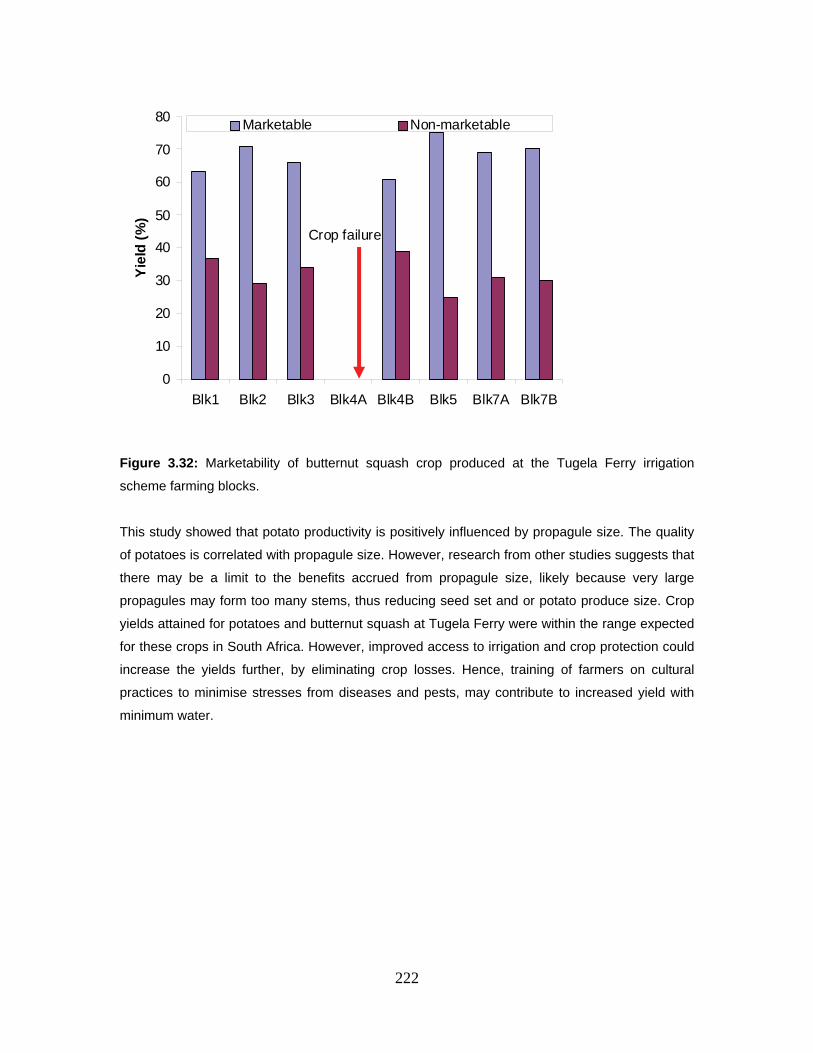
222
Figure 3.32: Marketability of butternut squash crop produced at the Tugela Ferry irrigation
scheme farming blocks.
This study showed that potato productivity is positively influenced by propagule size. The quality
of potatoes is correlated with propagule size. However, research from other studies suggests that
there may be a limit to the benefits accrued from propagule size, likely because very large
propagules may form too many stems, thus reducing seed set and or potato produce size. Crop
yields attained for potatoes and butternut squash at Tugela Ferry were within the range expected
for these crops in South Africa. However, improved access to irrigation and crop protection could
increase the yields further, by eliminating crop losses. Hence, training of farmers on cultural
practices to minimise stresses from diseases and pests, may contribute to increased yield with
minimum water.
0
10
20
30
40
50
60
70
80
Blk1 Blk2 Blk3 Blk4A Blk4B Blk5 Blk7A Blk7B
Yie
ld (
%)
Marketable Non-marketable
Crop failure
223
3.6 Irrigation Water management in Tugela Ferry Irrigation Scheme (TFIS) 3.6.1 Introduction
As noted elsewhere, the perennial Tugela River is the sole source of irrigation water for the
Tugela Ferry Irrigation Scheme (section 3.2.2.1). Water is diverted from the river into a canal that
runs along the scheme. However, due to lack of efficiency in water supply electric pumps had to
be installed to improve water supply at two blocks located at the downstream end of the scheme.
Nevertheless, water supply at the Scheme continued to be constrained by the poor state of the
canal, lack of regular maintenance as well as poor (non-existent) operation of the water control
infrastructure. Farmers also complained of leaking balancing dams, which were supposed to
provide a buffer against periods of water shortage. They also experienced water distribution
problems as competition for water has increased. Upstream farmers block pipes and waterways
that serve lower portions of the scheme and in some cases water has been diverted to areas not
originally planned as part of the command area as new farmers on dry land compete for what is
perceived as common property resource. To compound the problem, farmers seemed to have
little understanding of the concept of irrigation scheduling suggesting the possibility for under- or
over irrigation.
The pumps that are used in blocks 4 and 7 were also not without problems in that farmers in
these blocks have to pay the electricity bills for operating the pumps adding a financial burden on
them, which the rest of the scheme’s farmers do not have. In addition, there were also no standby
pumps in case of breakdowns.
In order to address some of the irrigation management constraints identified the project research
team agreed that a study be undertaken that would focus specifically on factors that determined
on-farm water use. Therefore, the study reported herein was conducted from April 2007 to March
2008 and its main objective was to evaluate the water use efficiency at Tugela Ferry irrigation
scheme from storage release to root zone level. It was guided by the following specific objectives:
To identify and assess current in-field irrigation practices at TFIS
To identify non-beneficial water consumption elements in the water distribution system at
the scheme
To propose strategic interventions for improving in-field irrigation practices and water
availability at scheme level
To implement selected interventions for trial periods and/or at trial sites
To monitor and evaluate the effect of the strategic interventions
To develop best management practices for in-field and scheme level water management,
based on the lessons learnt from the fieldwork.
A schematic outline of the study activities is shown in Figure 3.33.
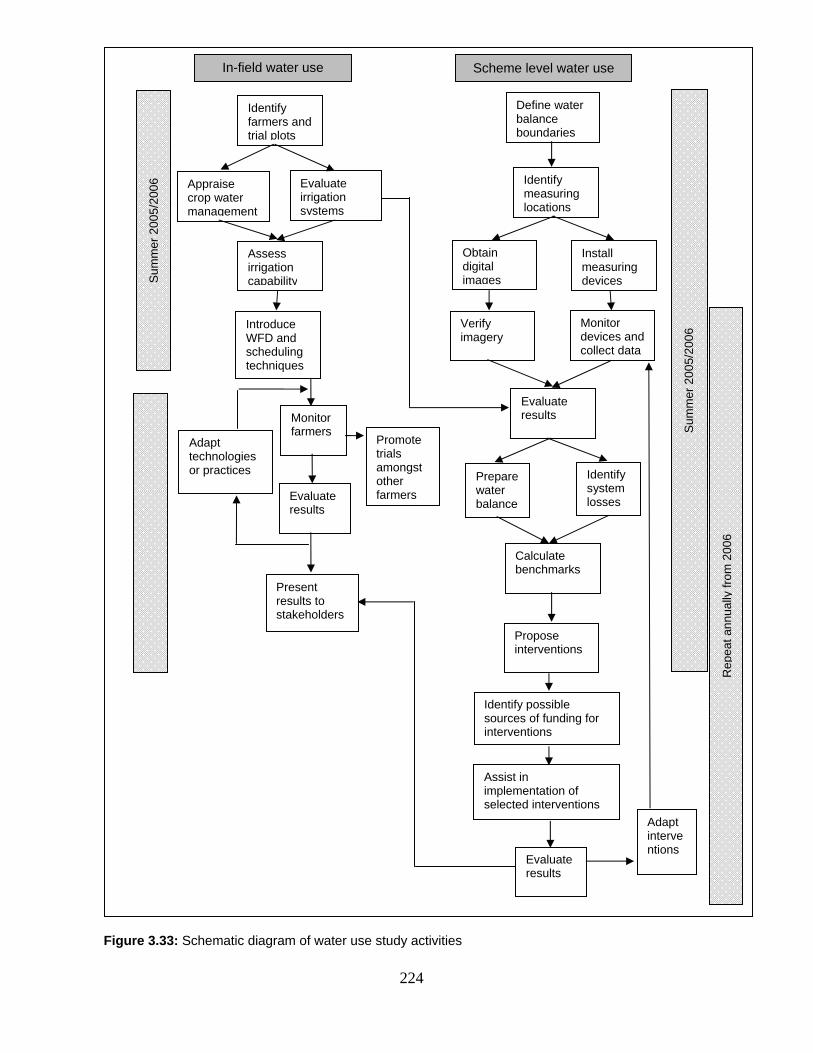
224
Figure 3.33: Schematic diagram of water use study activities
Identify farmers and trial plots
Evaluate irrigation systems
Appraise crop water management
Assess irrigation capability
Introduce WFD and scheduling techniques
Adapt technologies or practices
Monitor farmers
Promote trials amongst other farmersEvaluate
results
Present results to stakeholders
Define water balance boundaries
Identify measuring locations
Obtain digital images
Propose interventions
Calculate benchmarks
Monitor devices and collect data
Verify imagery
Install measuring devices
Evaluate results
Prepare water balance
Identify system losses
Adapt interventions
Identify possible sources of funding for interventions
Assist in implementation of selected interventions
Evaluate results
Sum
mer
20
05/2
006
Sum
mer
20
05/2
006
Rep
eat a
nnu
ally
from
200
6
In-field water use Scheme level water use
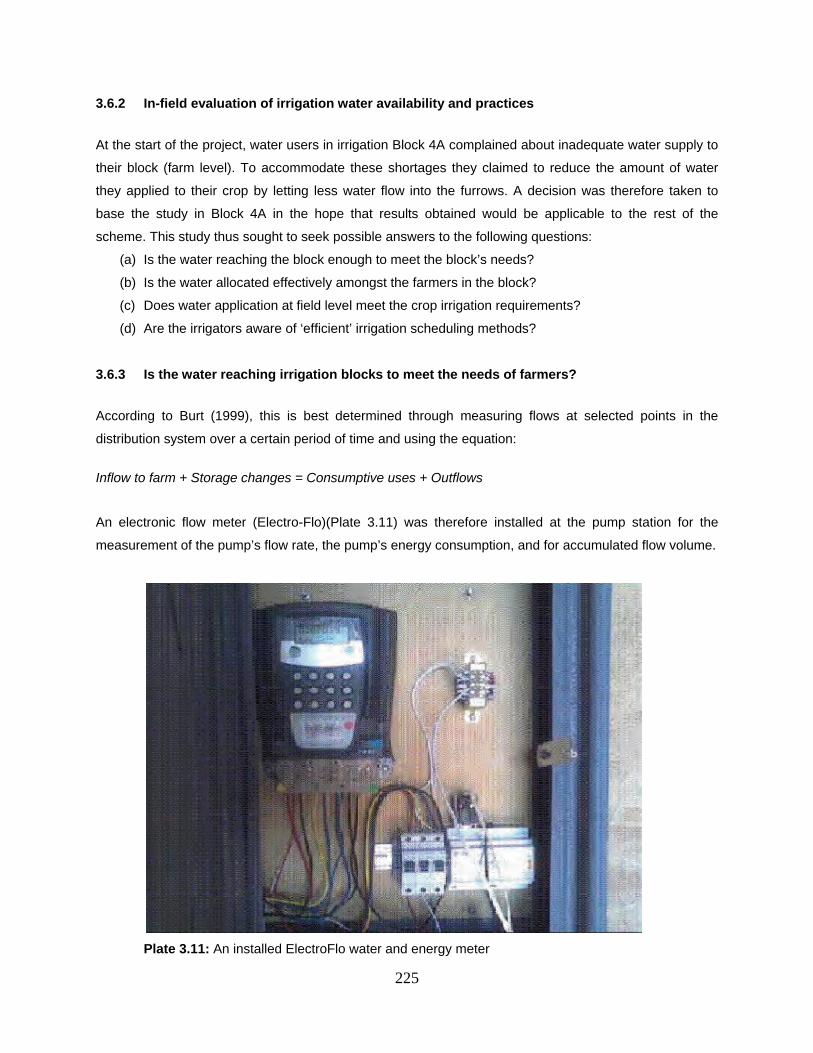
225
3.6.2 In-field evaluation of irrigation water availability and practices
At the start of the project, water users in irrigation Block 4A complained about inadequate water supply to
their block (farm level). To accommodate these shortages they claimed to reduce the amount of water
they applied to their crop by letting less water flow into the furrows. A decision was therefore taken to
base the study in Block 4A in the hope that results obtained would be applicable to the rest of the
scheme. This study thus sought to seek possible answers to the following questions:
(a) Is the water reaching the block enough to meet the block’s needs?
(b) Is the water allocated effectively amongst the farmers in the block?
(c) Does water application at field level meet the crop irrigation requirements?
(d) Are the irrigators aware of ‘efficient’ irrigation scheduling methods?
3.6.3 Is the water reaching irrigation blocks to meet the needs of farmers?
According to Burt (1999), this is best determined through measuring flows at selected points in the
distribution system over a certain period of time and using the equation:
Inflow to farm + Storage changes = Consumptive uses + Outflows
An electronic flow meter (Electro-Flo)(Plate 3.11) was therefore installed at the pump station for the
measurement of the pump’s flow rate, the pump’s energy consumption, and for accumulated flow volume.
Plate 3.11: An installed ElectroFlo water and energy meter
226
Flow rate and energy measurements were determined as a once off measurement, whilst accumulated
flow volume was monitored. Visual observations of water use and management practices on the entire
block were conducted with more emphasis on the section under sub-canal 2. The area (served by sub-
canal 2) was mapped and crop water demand was determined (through a SAPWAT model) for a growing
season between August 30 and September 28. Furthermore, a pressure transducer was installed at the
inlet of sub-canal 2 and the accumulated water volume running down sub-canal 2 was determined and
compared against the crop demand. Conveyance efficiency was computed from the flow rate reading at
the pump (Electro-Flo) and a once off flow rate measurement from a current flow meter (Flow Tracker),
which was set before the first off-take on the block. Visual observation from pump station, along canal
until the storage dam was used to monitor the condition of the supply system (canal, sub-canals and
pipes), as well as activities along the system.
The following observations were made:
The pump in use was the APS DL150-400, working at a rated speed of 1480rpm. A 55kW electric
motor was used to drive the pump. From the Electro Flo measurements, the pump was found to
be operating at 72.5kW. This showed that the size of the motor was not suitable for the
application; hence, the frequent breakdown of the motor might have been linked to its smaller
size. According to Koegelenberg and Breedt (2003), if a motor is too small for an application, the
motor’s windings burn out. This was true to the motor at the block as the servicing company
mentioned that the windings of the motor kept burning.
The electrical connections in the pump house were not up to standard as wires, some not even
insulated, were hanging out of the box (which did not even have a cover).
After the survey was completed, a new pump and motor of the same size were installed during May 2007
in Block 4A and the electro Flowmeter was recalibrated for accuracy by the project team.
3.6.4 Is water allocated effectively amongst the farmers in the block?
A current flow meter (portable Flow Tracker) was set before the first off-take (sub-canal1) on the block
(discharge side of the siphon) and also at the beginning of the second sub-canal, and flow rate was
determined. The average flow from the pump was found to be 0.095 m3/s. At the edge of the block the
average flow rate was 0.081 m3 s-1 as shown in Table 3.14 below;
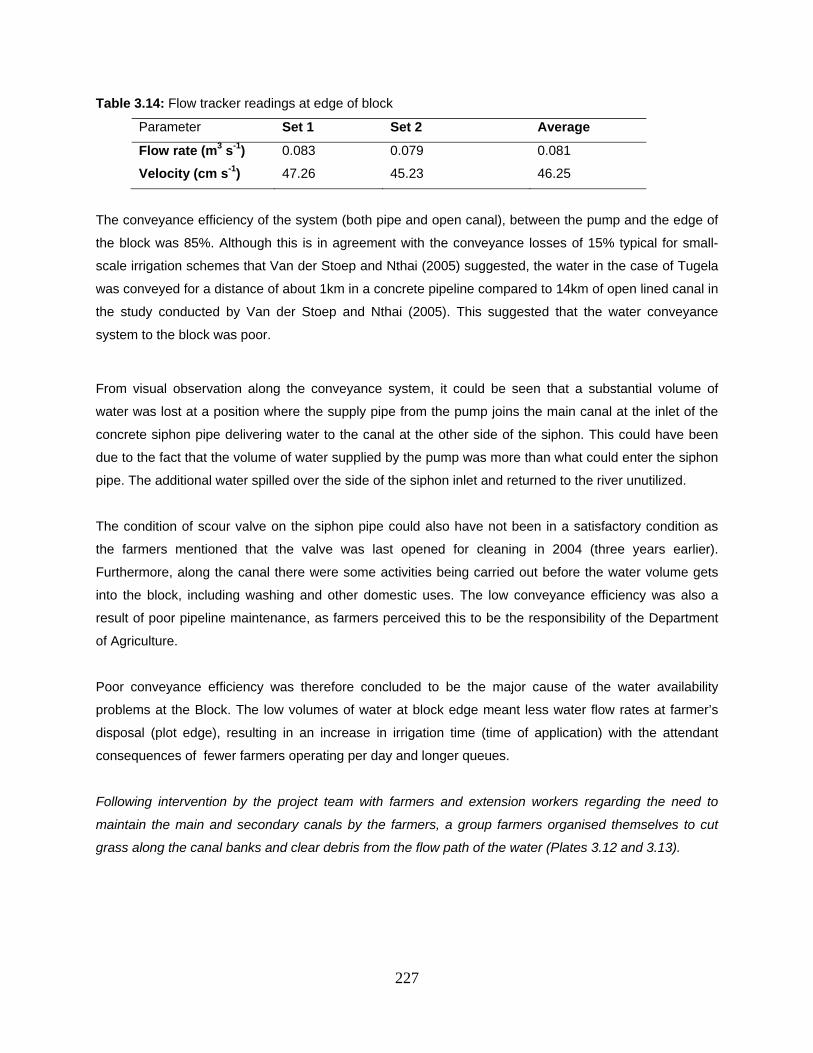
227
Table 3.14: Flow tracker readings at edge of block
Parameter Set 1 Set 2 Average
Flow rate (m3 s-1) 0.083 0.079 0.081
Velocity (cm s-1) 47.26 45.23 46.25
The conveyance efficiency of the system (both pipe and open canal), between the pump and the edge of
the block was 85%. Although this is in agreement with the conveyance losses of 15% typical for small-
scale irrigation schemes that Van der Stoep and Nthai (2005) suggested, the water in the case of Tugela
was conveyed for a distance of about 1km in a concrete pipeline compared to 14km of open lined canal in
the study conducted by Van der Stoep and Nthai (2005). This suggested that the water conveyance
system to the block was poor.
From visual observation along the conveyance system, it could be seen that a substantial volume of
water was lost at a position where the supply pipe from the pump joins the main canal at the inlet of the
concrete siphon pipe delivering water to the canal at the other side of the siphon. This could have been
due to the fact that the volume of water supplied by the pump was more than what could enter the siphon
pipe. The additional water spilled over the side of the siphon inlet and returned to the river unutilized.
The condition of scour valve on the siphon pipe could also have not been in a satisfactory condition as
the farmers mentioned that the valve was last opened for cleaning in 2004 (three years earlier).
Furthermore, along the canal there were some activities being carried out before the water volume gets
into the block, including washing and other domestic uses. The low conveyance efficiency was also a
result of poor pipeline maintenance, as farmers perceived this to be the responsibility of the Department
of Agriculture.
Poor conveyance efficiency was therefore concluded to be the major cause of the water availability
problems at the Block. The low volumes of water at block edge meant less water flow rates at farmer’s
disposal (plot edge), resulting in an increase in irrigation time (time of application) with the attendant
consequences of fewer farmers operating per day and longer queues.
Following intervention by the project team with farmers and extension workers regarding the need to
maintain the main and secondary canals by the farmers, a group farmers organised themselves to cut
grass along the canal banks and clear debris from the flow path of the water (Plates 3.12 and 3.13).
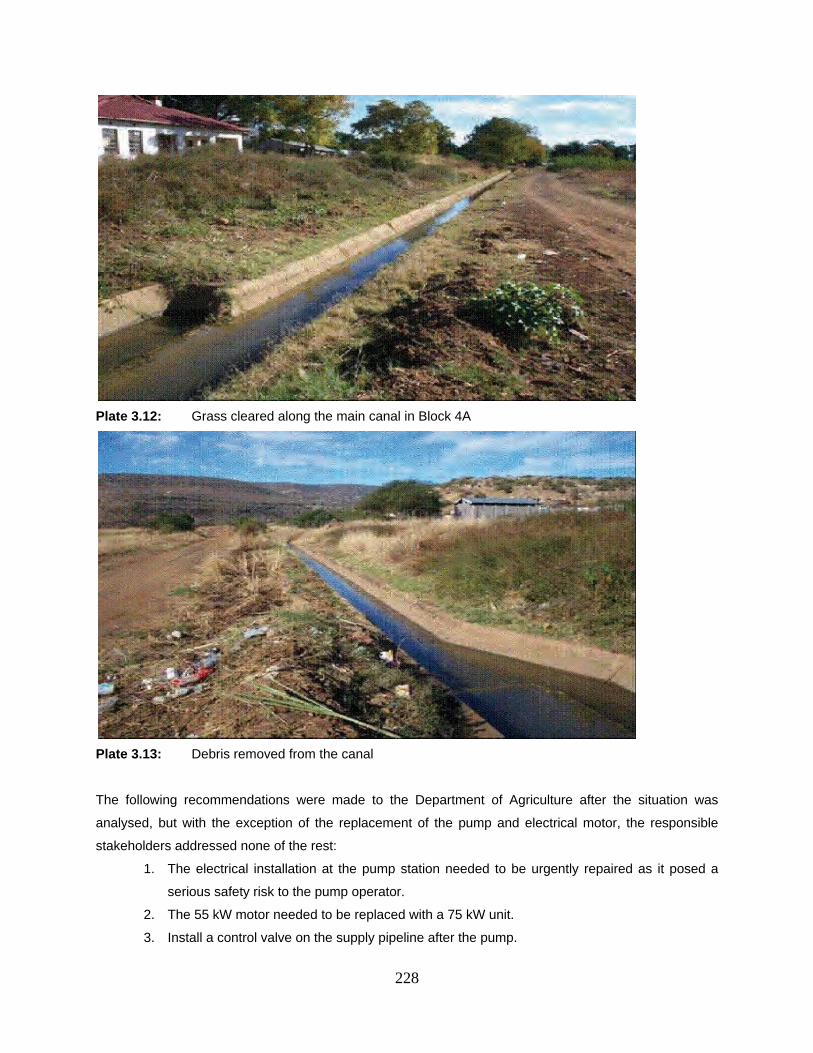
228
Plate 3.12: Grass cleared along the main canal in Block 4A
Plate 3.13: Debris removed from the canal
The following recommendations were made to the Department of Agriculture after the situation was
analysed, but with the exception of the replacement of the pump and electrical motor, the responsible
stakeholders addressed none of the rest:
1. The electrical installation at the pump station needed to be urgently repaired as it posed a
serious safety risk to the pump operator.
2. The 55 kW motor needed to be replaced with a 75 kW unit.
3. Install a control valve on the supply pipeline after the pump.
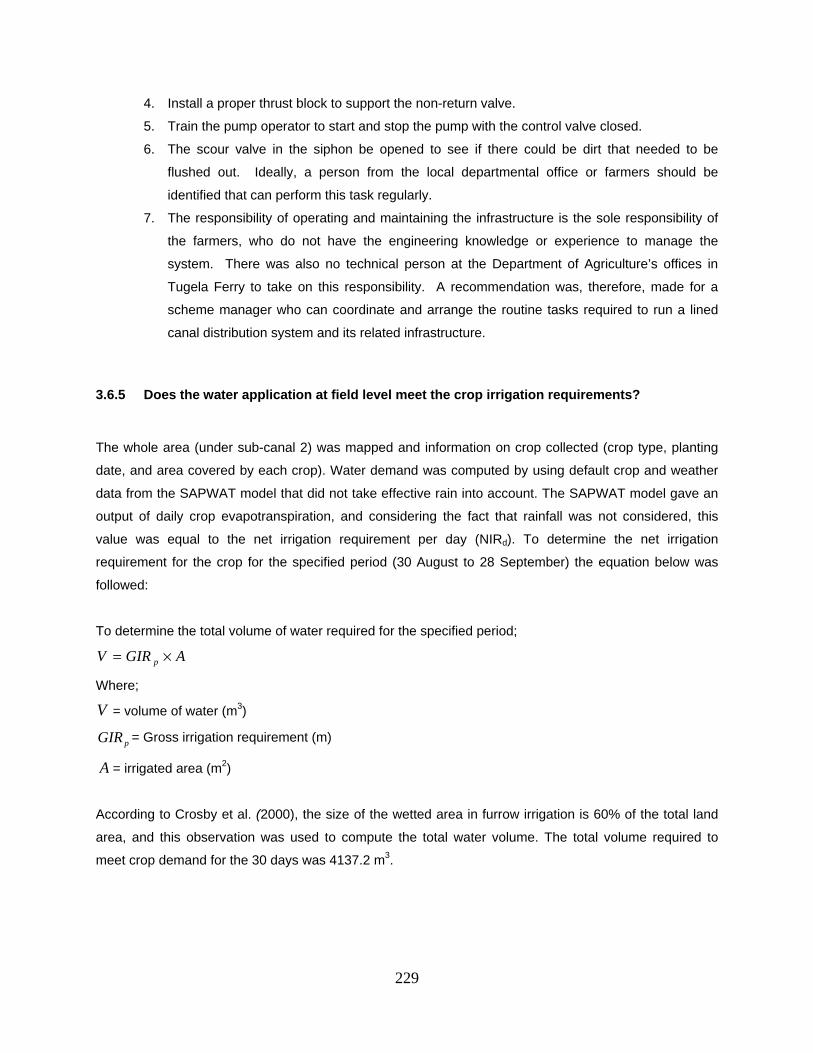
229
4. Install a proper thrust block to support the non-return valve.
5. Train the pump operator to start and stop the pump with the control valve closed.
6. The scour valve in the siphon be opened to see if there could be dirt that needed to be
flushed out. Ideally, a person from the local departmental office or farmers should be
identified that can perform this task regularly.
7. The responsibility of operating and maintaining the infrastructure is the sole responsibility of
the farmers, who do not have the engineering knowledge or experience to manage the
system. There was also no technical person at the Department of Agriculture’s offices in
Tugela Ferry to take on this responsibility. A recommendation was, therefore, made for a
scheme manager who can coordinate and arrange the routine tasks required to run a lined
canal distribution system and its related infrastructure.
3.6.5 Does the water application at field level meet the crop irrigation requirements?
The whole area (under sub-canal 2) was mapped and information on crop collected (crop type, planting
date, and area covered by each crop). Water demand was computed by using default crop and weather
data from the SAPWAT model that did not take effective rain into account. The SAPWAT model gave an
output of daily crop evapotranspiration, and considering the fact that rainfall was not considered, this
value was equal to the net irrigation requirement per day (NIRd). To determine the net irrigation
requirement for the crop for the specified period (30 August to 28 September) the equation below was
followed:
To determine the total volume of water required for the specified period;
AGIRV p
Where;
V = volume of water (m3)
pGIR = Gross irrigation requirement (m)
A = irrigated area (m2)
According to Crosby et al. (2000), the size of the wetted area in furrow irrigation is 60% of the total land
area, and this observation was used to compute the total water volume. The total volume required to
meet crop demand for the 30 days was 4137.2 m3.
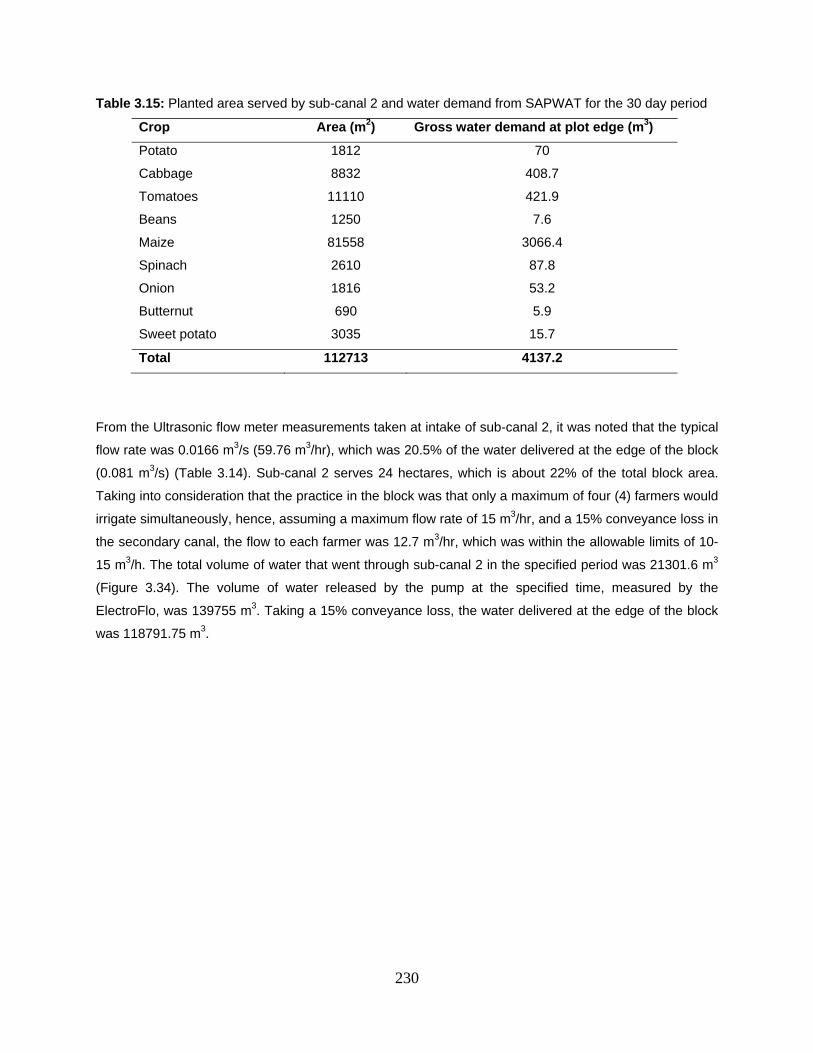
230
Table 3.15: Planted area served by sub-canal 2 and water demand from SAPWAT for the 30 day period
Crop Area (m2) Gross water demand at plot edge (m3)
Potato 1812 70
Cabbage 8832 408.7
Tomatoes 11110 421.9
Beans 1250 7.6
Maize 81558 3066.4
Spinach 2610 87.8
Onion 1816 53.2
Butternut 690 5.9
Sweet potato 3035 15.7
Total 112713 4137.2
From the Ultrasonic flow meter measurements taken at intake of sub-canal 2, it was noted that the typical
flow rate was 0.0166 m3/s (59.76 m3/hr), which was 20.5% of the water delivered at the edge of the block
(0.081 m3/s) (Table 3.14). Sub-canal 2 serves 24 hectares, which is about 22% of the total block area.
Taking into consideration that the practice in the block was that only a maximum of four (4) farmers would
irrigate simultaneously, hence, assuming a maximum flow rate of 15 m3/hr, and a 15% conveyance loss in
the secondary canal, the flow to each farmer was 12.7 m3/hr, which was within the allowable limits of 10-
15 m3/h. The total volume of water that went through sub-canal 2 in the specified period was 21301.6 m3
(Figure 3.34). The volume of water released by the pump at the specified time, measured by the
ElectroFlo, was 139755 m3. Taking a 15% conveyance loss, the water delivered at the edge of the block
was 118791.75 m3.
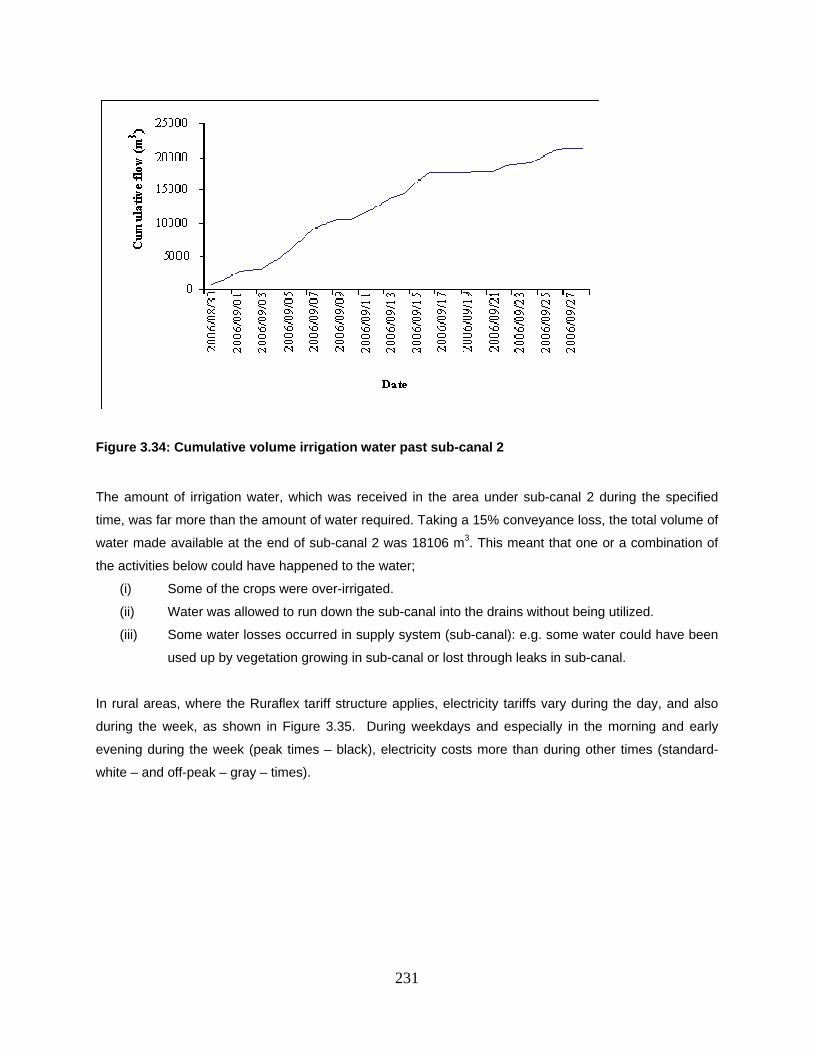
231
Figure 3.34: Cumulative volume irrigation water past sub-canal 2
The amount of irrigation water, which was received in the area under sub-canal 2 during the specified
time, was far more than the amount of water required. Taking a 15% conveyance loss, the total volume of
water made available at the end of sub-canal 2 was 18106 m3. This meant that one or a combination of
the activities below could have happened to the water;
(i) Some of the crops were over-irrigated.
(ii) Water was allowed to run down the sub-canal into the drains without being utilized.
(iii) Some water losses occurred in supply system (sub-canal): e.g. some water could have been
used up by vegetation growing in sub-canal or lost through leaks in sub-canal.
In rural areas, where the Ruraflex tariff structure applies, electricity tariffs vary during the day, and also
during the week, as shown in Figure 3.35. During weekdays and especially in the morning and early
evening during the week (peak times – black), electricity costs more than during other times (standard-
white – and off-peak – gray – times).
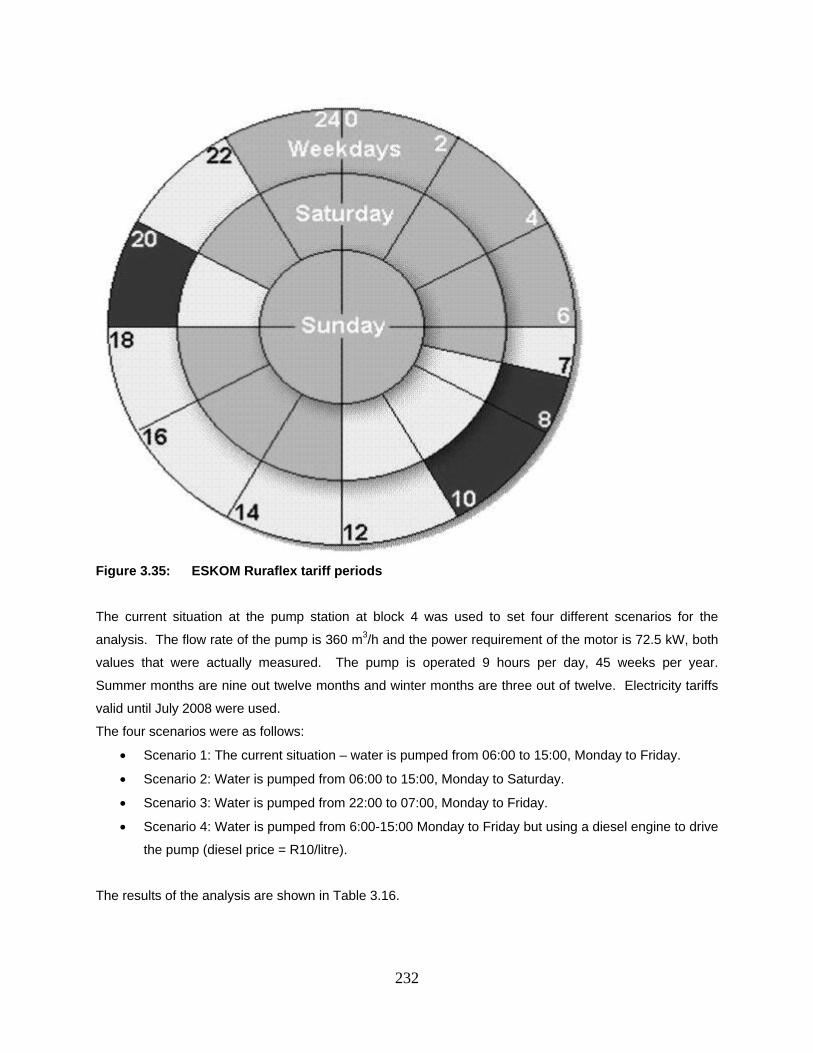
232
Figure 3.35: ESKOM Ruraflex tariff periods
The current situation at the pump station at block 4 was used to set four different scenarios for the
analysis. The flow rate of the pump is 360 m3/h and the power requirement of the motor is 72.5 kW, both
values that were actually measured. The pump is operated 9 hours per day, 45 weeks per year.
Summer months are nine out twelve months and winter months are three out of twelve. Electricity tariffs
valid until July 2008 were used.
The four scenarios were as follows:
Scenario 1: The current situation – water is pumped from 06:00 to 15:00, Monday to Friday.
Scenario 2: Water is pumped from 06:00 to 15:00, Monday to Saturday.
Scenario 3: Water is pumped from 22:00 to 07:00, Monday to Friday.
Scenario 4: Water is pumped from 6:00-15:00 Monday to Friday but using a diesel engine to drive
the pump (diesel price = R10/litre).
The results of the analysis are shown in Table 3.16.
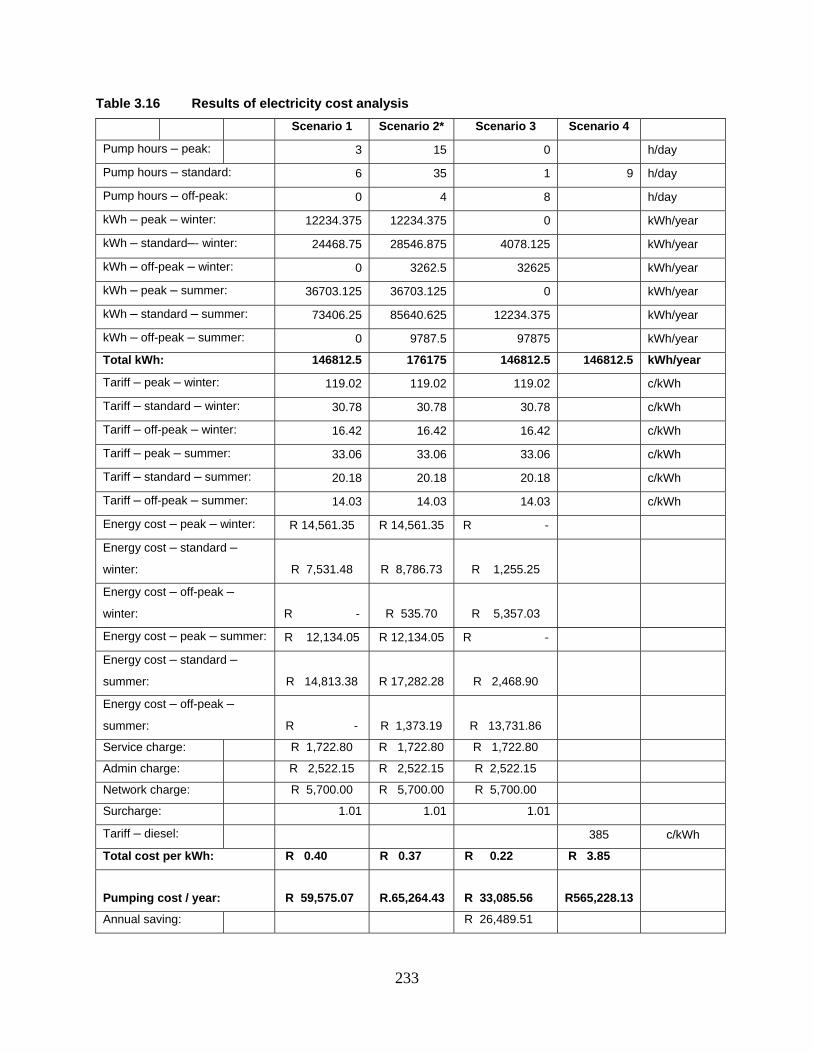
233
Table 3.16 Results of electricity cost analysis
Scenario 1 Scenario 2* Scenario 3 Scenario 4
Pump hours – peak: 3 15 0 h/day
Pump hours – standard: 6 35 1 9 h/day
Pump hours – off-peak: 0 4 8 h/day
kWh – peak – winter: 12234.375 12234.375 0 kWh/year
kWh – standard–- winter: 24468.75 28546.875 4078.125 kWh/year
kWh – off-peak – winter: 0 3262.5 32625 kWh/year
kWh – peak – summer: 36703.125 36703.125 0 kWh/year
kWh – standard – summer: 73406.25 85640.625 12234.375 kWh/year
kWh – off-peak – summer: 0 9787.5 97875 kWh/year
Total kWh: 146812.5 176175 146812.5 146812.5 kWh/year
Tariff – peak – winter: 119.02 119.02 119.02 c/kWh
Tariff – standard – winter: 30.78 30.78 30.78 c/kWh
Tariff – off-peak – winter: 16.42 16.42 16.42 c/kWh
Tariff – peak – summer: 33.06 33.06 33.06 c/kWh
Tariff – standard – summer: 20.18 20.18 20.18 c/kWh
Tariff – off-peak – summer: 14.03 14.03 14.03 c/kWh
Energy cost – peak – winter: R 14,561.35 R 14,561.35 R -
Energy cost – standard –
winter: R 7,531.48 R 8,786.73 R 1,255.25
Energy cost – off-peak –
winter: R - R 535.70 R 5,357.03
Energy cost – peak – summer: R 12,134.05 R 12,134.05 R -
Energy cost – standard –
summer: R 14,813.38 R 17,282.28 R 2,468.90
Energy cost – off-peak –
summer: R - R 1,373.19 R 13,731.86
Service charge: R 1,722.80 R 1,722.80 R 1,722.80
Admin charge: R 2,522.15 R 2,522.15 R 2,522.15
Network charge: R 5,700.00 R 5,700.00 R 5,700.00
Surcharge: 1.01 1.01 1.01
Tariff – diesel: 385 c/kWh
Total cost per kWh: R 0.40 R 0.37 R 0.22 R 3.85
Pumping cost / year: R 59,575.07 R.65,264.43 R 33,085.56
R565,228.13
Annual saving: R 26,489.51
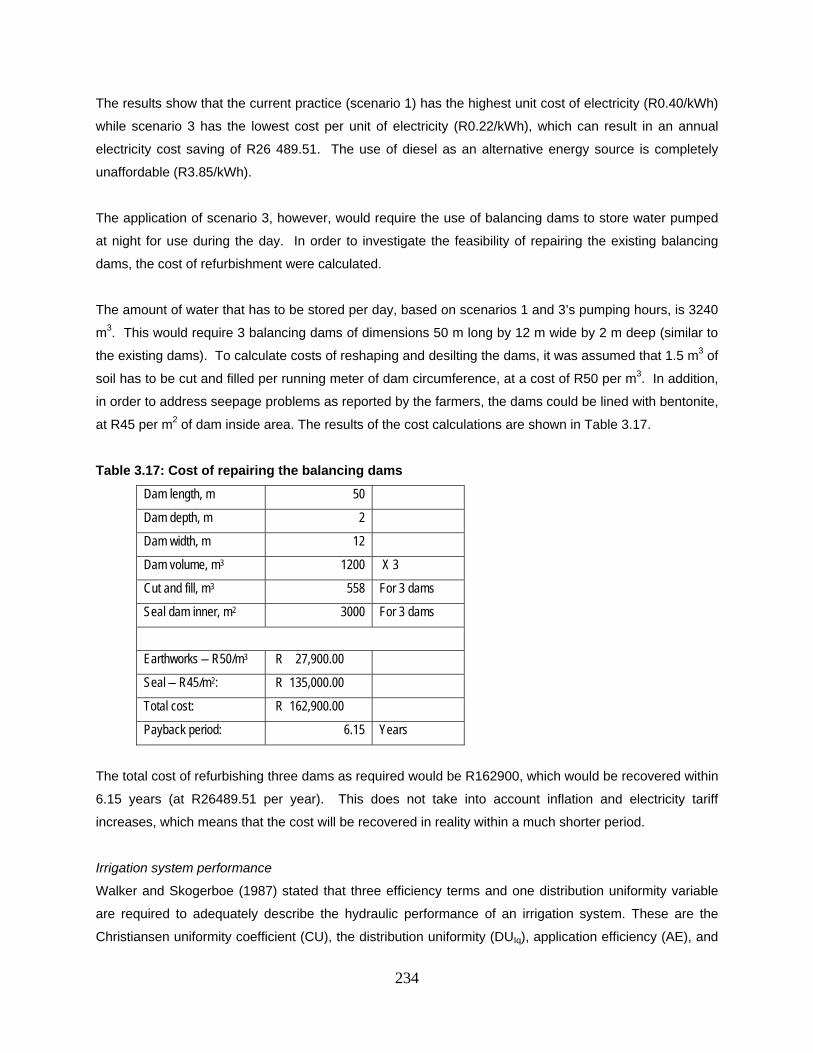
234
The results show that the current practice (scenario 1) has the highest unit cost of electricity (R0.40/kWh)
while scenario 3 has the lowest cost per unit of electricity (R0.22/kWh), which can result in an annual
electricity cost saving of R26 489.51. The use of diesel as an alternative energy source is completely
unaffordable (R3.85/kWh).
The application of scenario 3, however, would require the use of balancing dams to store water pumped
at night for use during the day. In order to investigate the feasibility of repairing the existing balancing
dams, the cost of refurbishment were calculated.
The amount of water that has to be stored per day, based on scenarios 1 and 3’s pumping hours, is 3240
m3. This would require 3 balancing dams of dimensions 50 m long by 12 m wide by 2 m deep (similar to
the existing dams). To calculate costs of reshaping and desilting the dams, it was assumed that 1.5 m3 of
soil has to be cut and filled per running meter of dam circumference, at a cost of R50 per m3. In addition,
in order to address seepage problems as reported by the farmers, the dams could be lined with bentonite,
at R45 per m2 of dam inside area. The results of the cost calculations are shown in Table 3.17.
Table 3.17: Cost of repairing the balancing dams
Dam length, m 50
Dam depth, m 2
Dam width, m 12
Dam volume, m3 1200 X 3
Cut and fill, m3 558 For 3 dams
Seal dam inner, m2 3000 For 3 dams
Earthworks – R50/m3 R 27,900.00
Seal – R45/m2: R 135,000.00
Total cost: R 162,900.00
Payback period: 6.15 Years
The total cost of refurbishing three dams as required would be R162900, which would be recovered within
6.15 years (at R26489.51 per year). This does not take into account inflation and electricity tariff
increases, which means that the cost will be recovered in reality within a much shorter period.
Irrigation system performance
Walker and Skogerboe (1987) stated that three efficiency terms and one distribution uniformity variable
are required to adequately describe the hydraulic performance of an irrigation system. These are the
Christiansen uniformity coefficient (CU), the distribution uniformity (DUIq), application efficiency (AE), and
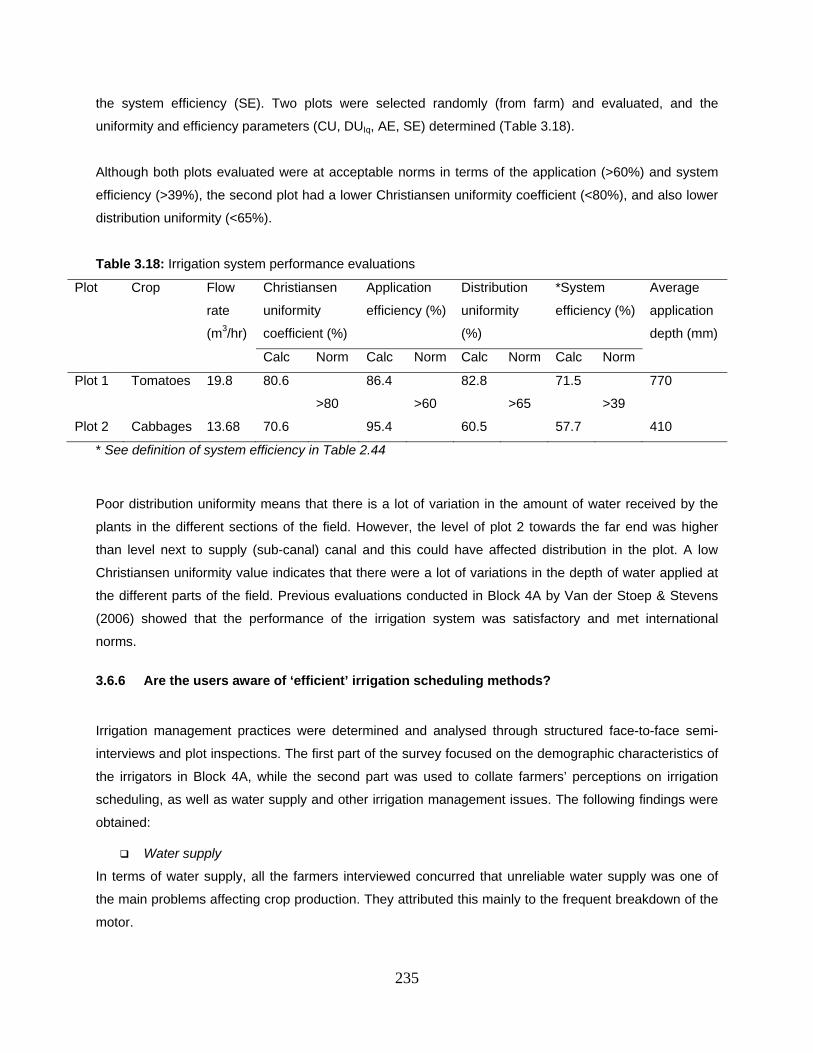
235
the system efficiency (SE). Two plots were selected randomly (from farm) and evaluated, and the
uniformity and efficiency parameters (CU, DUIq, AE, SE) determined (Table 3.18).
Although both plots evaluated were at acceptable norms in terms of the application (>60%) and system
efficiency (>39%), the second plot had a lower Christiansen uniformity coefficient (<80%), and also lower
distribution uniformity (<65%).
Table 3.18: Irrigation system performance evaluations
Plot Crop Flow
rate
(m3/hr)
Christiansen
uniformity
coefficient (%)
Application
efficiency (%)
Distribution
uniformity
(%)
*System
efficiency (%)
Average
application
depth (mm)
Calc Norm Calc Norm Calc Norm Calc Norm
Plot 1 Tomatoes 19.8 80.6 86.4 82.8 71.5 770
>80 >60 >65 >39
Plot 2 Cabbages 13.68 70.6 95.4 60.5 57.7 410
* See definition of system efficiency in Table 2.44
Poor distribution uniformity means that there is a lot of variation in the amount of water received by the
plants in the different sections of the field. However, the level of plot 2 towards the far end was higher
than level next to supply (sub-canal) canal and this could have affected distribution in the plot. A low
Christiansen uniformity value indicates that there were a lot of variations in the depth of water applied at
the different parts of the field. Previous evaluations conducted in Block 4A by Van der Stoep & Stevens
(2006) showed that the performance of the irrigation system was satisfactory and met international
norms.
3.6.6 Are the users aware of ‘efficient’ irrigation scheduling methods?
Irrigation management practices were determined and analysed through structured face-to-face semi-
interviews and plot inspections. The first part of the survey focused on the demographic characteristics of
the irrigators in Block 4A, while the second part was used to collate farmers’ perceptions on irrigation
scheduling, as well as water supply and other irrigation management issues. The following findings were
obtained:
Water supply
In terms of water supply, all the farmers interviewed concurred that unreliable water supply was one of
the main problems affecting crop production. They attributed this mainly to the frequent breakdown of the
motor.
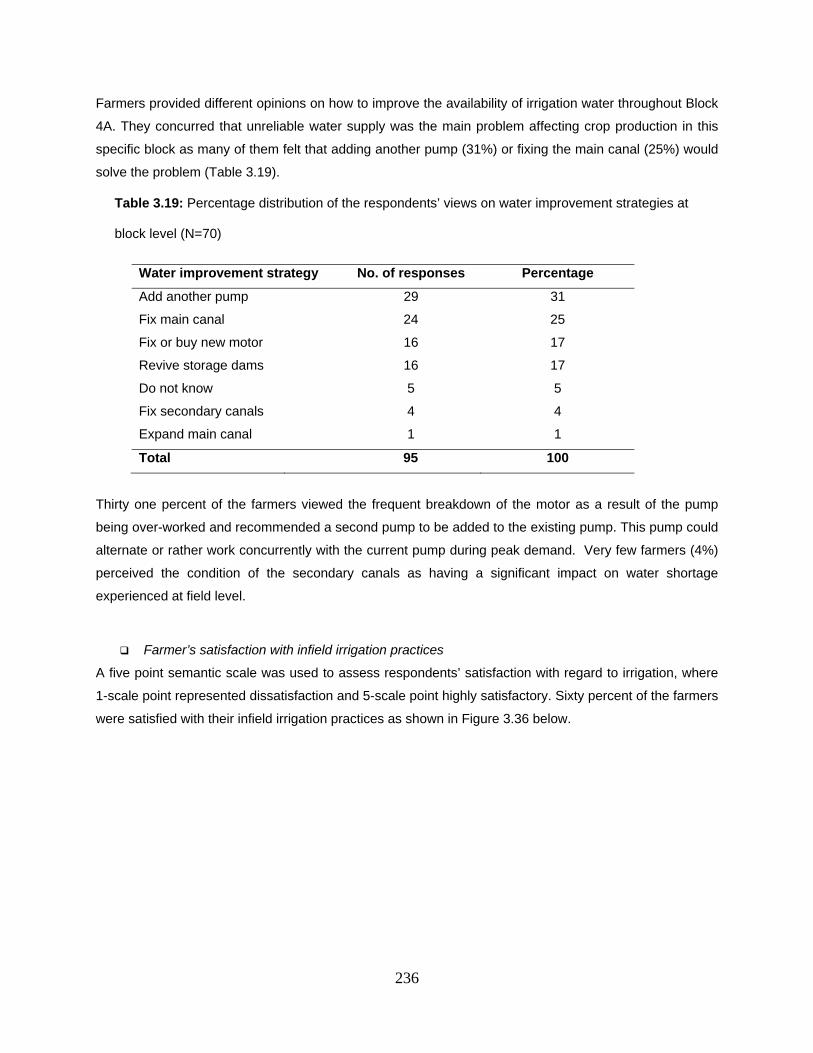
236
Farmers provided different opinions on how to improve the availability of irrigation water throughout Block
4A. They concurred that unreliable water supply was the main problem affecting crop production in this
specific block as many of them felt that adding another pump (31%) or fixing the main canal (25%) would
solve the problem (Table 3.19).
Table 3.19: Percentage distribution of the respondents’ views on water improvement strategies at
block level (N=70)
Water improvement strategy No. of responses Percentage
Add another pump 29 31
Fix main canal 24 25
Fix or buy new motor 16 17
Revive storage dams 16 17
Do not know 5 5
Fix secondary canals 4 4
Expand main canal 1 1
Total 95 100
Thirty one percent of the farmers viewed the frequent breakdown of the motor as a result of the pump
being over-worked and recommended a second pump to be added to the existing pump. This pump could
alternate or rather work concurrently with the current pump during peak demand. Very few farmers (4%)
perceived the condition of the secondary canals as having a significant impact on water shortage
experienced at field level.
Farmer’s satisfaction with infield irrigation practices
A five point semantic scale was used to assess respondents’ satisfaction with regard to irrigation, where
1-scale point represented dissatisfaction and 5-scale point highly satisfactory. Sixty percent of the farmers
were satisfied with their infield irrigation practices as shown in Figure 3.36 below.
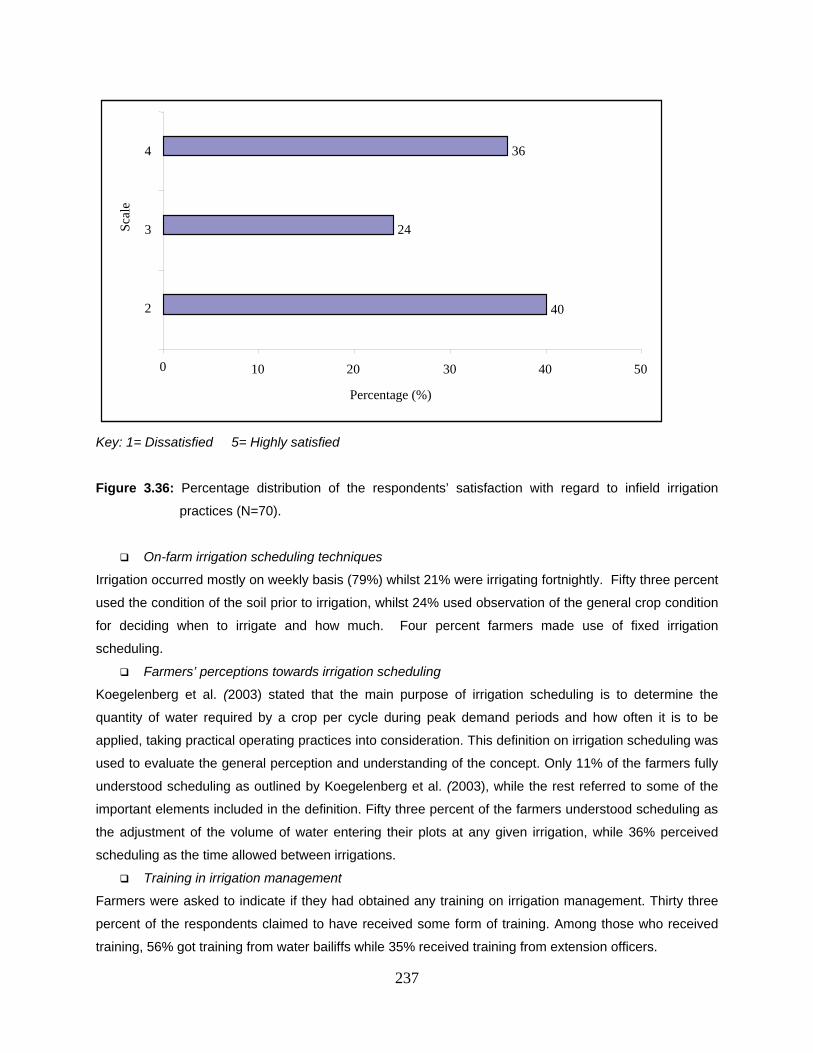
237
Key: 1= Dissatisfied 5= Highly satisfied
Figure 3.36: Percentage distribution of the respondents’ satisfaction with regard to infield irrigation
practices (N=70).
On-farm irrigation scheduling techniques
Irrigation occurred mostly on weekly basis (79%) whilst 21% were irrigating fortnightly. Fifty three percent
used the condition of the soil prior to irrigation, whilst 24% used observation of the general crop condition
for deciding when to irrigate and how much. Four percent farmers made use of fixed irrigation
scheduling.
Farmers’ perceptions towards irrigation scheduling
Koegelenberg et al. (2003) stated that the main purpose of irrigation scheduling is to determine the
quantity of water required by a crop per cycle during peak demand periods and how often it is to be
applied, taking practical operating practices into consideration. This definition on irrigation scheduling was
used to evaluate the general perception and understanding of the concept. Only 11% of the farmers fully
understood scheduling as outlined by Koegelenberg et al. (2003), while the rest referred to some of the
important elements included in the definition. Fifty three percent of the farmers understood scheduling as
the adjustment of the volume of water entering their plots at any given irrigation, while 36% perceived
scheduling as the time allowed between irrigations.
Training in irrigation management
Farmers were asked to indicate if they had obtained any training on irrigation management. Thirty three
percent of the respondents claimed to have received some form of training. Among those who received
training, 56% got training from water bailiffs while 35% received training from extension officers.
40
24
36
0 10 20 30 40 50
2
3
4
Sca
le
Percentage (%)
238
3.6.7 Lessons learned and way forward
These research findings and general perceptions of the project team were used to intervene with farmers
and extension officers of the area. The following key persons need to be appointed on the scheme to
ensure effective and sustainable irrigation management:
A responsible person from the local departmental office or farmers should be identified that can
see that the scour valve in the siphon is regularly opened to flush out any dirt that may have
accumulated.
A technical person located at the Department of Agriculture’s offices should see that the supply
system is managed in a proper way. At a later stage when a Water user Association is formed, a
scheme manager who can coordinate and arrange the standard actions will be required to run the
lined canal distribution system and its related infrastructure.
As far as the in-field situation is concerned, irrigation practices needed urgent attention. Extension officers
needed to become more involved with irrigation management at field level. However, lack of technical
knowledge and skills and an attitude of servicing farmers in this regard prevented effective intervention
with farmers.
Two sets of detectors were installed at 30 cm during the summer production season by the UKZN team.
Unfortunately it was installed relatively late during the season and was only used for monitoring the effect
of mulching on water retention for maize and butternut trials at Block 2. The findings of this study are
presented in the next section.
3.6.8 Water conservation techniques for best management of green mealies and butternut
squash
Background and objectives
Falkenmark (1995) introduced the concepts of “green water” and “blue water” to refer to water loss from
cropping lands to the atmosphere and river runoff, respectively. While “green water” supports rainfed
agriculture, “blue water” diversions support irrigated agriculture. Falkenmark (1995) argued that too much
emphasis has been placed on blue water, while there is a need to consider the potential to harness the
“green water” to meet food security needs. The variability and quantity of rainfall in South Africa are not
conducive to stable rainfed agriculture. Hence, the resource-poor farmers, who have no adequate access
to irrigation infrastructure in the country, are afflicted by food insecurity. Whereas governments and
development agencies have given extensive consideration to the technological aspects of irrigation
projects, they have virtually ignored the all-important “human” dimension (Overseas Development
Institute, 1985). Due to its very nature, irrigation development is particularly prone to human problems.
For the purpose of improving water supply to agricultural lands, several steps should be taken to develop
239
water-conserving farming systems even in "normal" years, including both policy and management actions.
These include:
improving water conservation and storage measures,
providing incentives for selection of drought-tolerant crop species,
using reduced-volume irrigation systems,
managing crops to reduce water loss,
alternate tillage practices to conserve water,
low-cost technologies such as treadle pumps and
water harvesting structures that provide access to water for the poor.
However, Molden et al. (2002) warned that the cost and benefit of low-cost technologies and
management approaches compared to large conventional irrigation systems are not known.
Diversified farms are usually more economically and ecologically resilient. While monoculture farming has
advantages in terms of efficiency and ease of management, the loss of the crop in any one year could put
a farm out of business and/or seriously disrupt the stability of a community dependent on that crop. By
growing a variety of crops, farmers spread economic risk and are less susceptible to the radical price
fluctuations associated with changes in supply and demand. Properly managed diversity can also buffer a
farm in a biological sense. For example, in annual cropping systems, crop rotation can be used to
suppress weeds, pathogens and insect pests. In addition, cover crops can have stabilizing effects on the
agro-ecosystem by holding soil and nutrients in place, conserving soil moisture with mowed or standing
dead mulches, and by increasing the water infiltration rate and soil water holding capacity. Cover crops in
orchards and vineyards can buffer the system against pest infestations by increasing beneficial arthropod
populations and can therefore reduce the need for chemical inputs. Using a variety of cover crops is also
important in order to protect against the failure of a particular species to grow and to attract and sustain a
wide range of beneficial arthropods. Intercropping can increase water use efficiency, thus optimising land
use (Tsubo et al., 2003).
At the Tugela Ferry irrigation scheme, there are no apparent water conservation strategies for crop
production. Due to insufficient land area available to individual farmers, crop production occurs in rapid
crop rotations of vegetables, and there is little time for fallowing. This approach creates a challenge of
maintaining high production with optimum water.
The amount of water required to produce a kilogram of dry mass, and to sustain a plant throughout a
growing season is determined by many factors (Hall, 2001; Huang, 2006). Obviously, xerophytes,
mesophytes and hydrophytes require different amounts of water. In addition, within any of these groups,
species differ markedly in their water requirements. Climate, greatly affects the amount of water
240
transpired by a plant. Water transpiration is high under hot, windy and dry conditions, whereas it is low
under cool, calm and moist conditions.
Plant water use (conversion to dry matter) is related to cultural practices (Saxena, 2003). When adequate
moisture is available, yields increase with the application of appropriate fertilisers. Water-use efficiency is
determined by the relation of yield to the amount of soil moisture used. The amount of available moisture
present in the soil affects water use efficiency. Generally, the closer the soil is to field capacity, the more
water a plant will use. Plants use less energy in extracting water under moisture-sufficient conditions
compared with moisture-stress conditions. The saved energy is used to increase dry mass production or
yield.
Mulches have been shown to have a positive effect on the soil environment in two major ways:
temperature and water control. Mulches shield the soil from incoming solar radiation, thereby reducing
evaporation. The higher moisture conditions caused by reduced evaporation result in higher thermal
capacity near the soil surface (Huang, 2006). Mulching techniques have become common agricultural
practices to prevent erosion, control weeds and conserve moisture.
Many studies of water management in crop production systems in South Africa have been done under
research station conditions, where resources are generally not limiting. Participatory agronomic studies of
water-stress management have not been reported in South Africa. The objective of the present study was
to determine the effect of mulch on maize and butternut squash production in a semi-arid area of
KwaZulu-Natal, Tugela Ferry. The study was conducted as a demonstration trial to determine whether
mulching had any effect on soil moisture, weed occurrence, plant growth and economic yield.
Materials and methods
Plant material
During a workshop to discuss field trials and production plan, it was established that the popular green
mealies cultivars at Tugela Ferry were CG 4141 and SC 701. The former was described as having a short
season and lower yields (smaller cobs and nonprolific), and the latter was described as being a long
season maize with large cobs and some prolificacy. Cultivar SC 701 was recommended by the farmers as
a popular cultivar to the green mealies customers. Cultivar SR 52, which is also a long season cultivar,
was recommended by Professor Modi as an alternative green mealies cultivar to the popular SC 701.
Hence seed of maize (Zea mays L.) cultivars SR 52 and SC 701 were purchased from McDonald Seed
Co. (Pietermaritzburg). Seed of butternut squash (cultivar Watham) were also purchased from McDonald
Seed Co. (Pietermaritzburg). Laboratory tests were performed (ISTA, 1999), and it was confirmed that
seed germination capacity and vigour were high (100% germination and no abnormal seedlings).
241
Experimental sites
The research trials for maize and butternut squash were conducted at block 2 of the Tugela irrigation
scheme. In addition, master farmers from each of the other blocks (1, 3, 4A, 4B, 5 [two farmers] and 7A)
volunteered to plant one demonstration trial each of maize and butternut squash within the same week as
the planting of the experimental trials. The seven trials planted outside of block 2 would be used as
demonstration trials to allow interactions with farmers from all the active blocks of the irrigation scheme on
the performance of maize and butternut squash, with respect to crop performance during growth and
economic yield. Soil analysis was performed to determine fertiliser application at all the sites, and the
farmers were advised accordingly. At block 2 (experimental site) the trials were planted on an Oakleaf
Buchuberg soil (Soil Classification Working Group, 1991). Maize was planted at 50 000 plants ha-1.
Fertiliser application was 140 kg ha-1 N (90 kg ha-1 band placed and 50 kg ha-1 applied as a side dressing,
four weeks after planting), 105 kg ha-1 P and 100 kg ha-1 K. Butternut squash was planted at 10 000
plants ha-1 and fertilised with 80 kg ha-1 N, 60 kg ha-1 P and 80 kg ha-1 K.
Experimental designs
The maize and butternut squash experiments were completely randomised designs with two treatments:
mulch (with or without), weeding (weeding or no weeding) (Table 3.20). For maize, seven rows (5 m long)
were planted per plot, and the three middle rows were used for sampling (excluding the outermost plants
in each row as part of the borders). For butternut squash, three rows were planted, and the middle row
was used for sampling. Mowed dry grass straw was used as mulch treatment four weeks after planting
immediately after the first hand-weeding and after application of N side dressing for maize. The straw was
derived from 0.35 m3 bales and it was applied as a layer of ~3 cm of compressed straw to ensure
complete soil cover (one bale m -2) around the plants and between rows. After the application of mulch,
weeding (hand-hoeing) occurred once a week until 11 weeks after planting for some of the plots without
mulch and weeds were hand-pulled from some of the mulched plots. There was no further weeding for
the remainder of non-mulched and mulched plots, which were used as controls. The maize experiment
was replicated three times and the butternut squash experiment was replicated six times (Tables 3.20
and 3.21). Flood irrigation occurred once a fortnight at the rate of approximately 140 litres per plot.
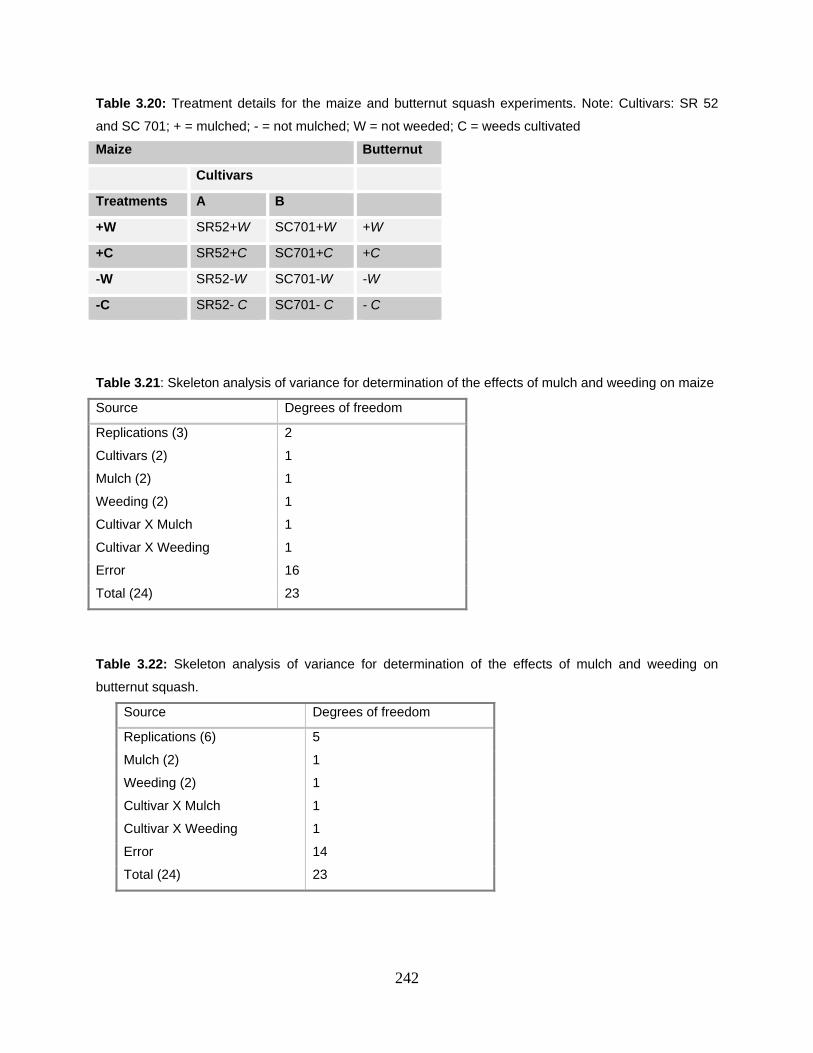
242
Table 3.20: Treatment details for the maize and butternut squash experiments. Note: Cultivars: SR 52
and SC 701; + = mulched; - = not mulched; W = not weeded; C = weeds cultivated
Maize Butternut
Cultivars
Treatments A B
+W SR52+W SC701+W +W
+C SR52+C SC701+C +C
-W SR52-W SC701-W -W
-C SR52- C SC701- C - C
Table 3.21: Skeleton analysis of variance for determination of the effects of mulch and weeding on maize
Source Degrees of freedom
Replications (3) 2
Cultivars (2) 1
Mulch (2) 1
Weeding (2) 1
Cultivar X Mulch 1
Cultivar X Weeding 1
Error 16
Total (24) 23
Table 3.22: Skeleton analysis of variance for determination of the effects of mulch and weeding on
butternut squash.
Source Degrees of freedom
Replications (6) 5
Mulch (2) 1
Weeding (2) 1
Cultivar X Mulch 1
Cultivar X Weeding 1
Error 14
Total (24) 23
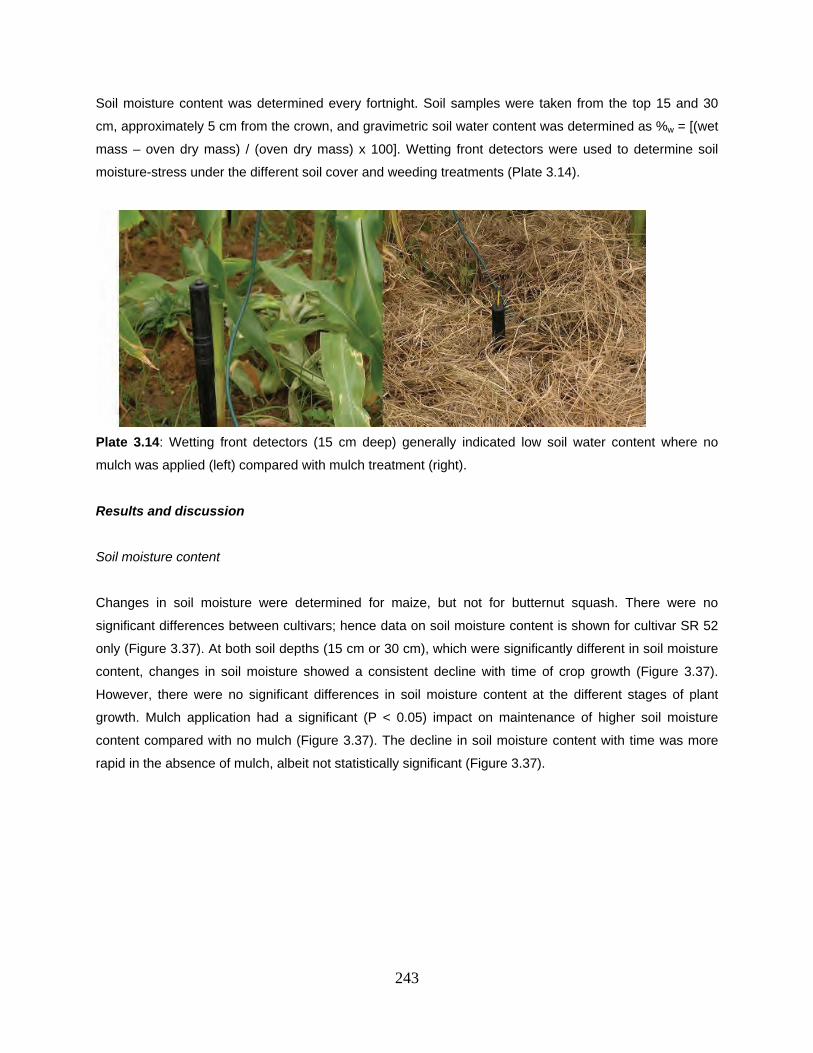
243
Soil moisture content was determined every fortnight. Soil samples were taken from the top 15 and 30
cm, approximately 5 cm from the crown, and gravimetric soil water content was determined as %w = [(wet
mass – oven dry mass) / (oven dry mass) x 100]. Wetting front detectors were used to determine soil
moisture-stress under the different soil cover and weeding treatments (Plate 3.14).
Plate 3.14: Wetting front detectors (15 cm deep) generally indicated low soil water content where no
mulch was applied (left) compared with mulch treatment (right).
Results and discussion
Soil moisture content
Changes in soil moisture were determined for maize, but not for butternut squash. There were no
significant differences between cultivars; hence data on soil moisture content is shown for cultivar SR 52
only (Figure 3.37). At both soil depths (15 cm or 30 cm), which were significantly different in soil moisture
content, changes in soil moisture showed a consistent decline with time of crop growth (Figure 3.37).
However, there were no significant differences in soil moisture content at the different stages of plant
growth. Mulch application had a significant (P < 0.05) impact on maintenance of higher soil moisture
content compared with no mulch (Figure 3.37). The decline in soil moisture content with time was more
rapid in the absence of mulch, albeit not statistically significant (Figure 3.37).
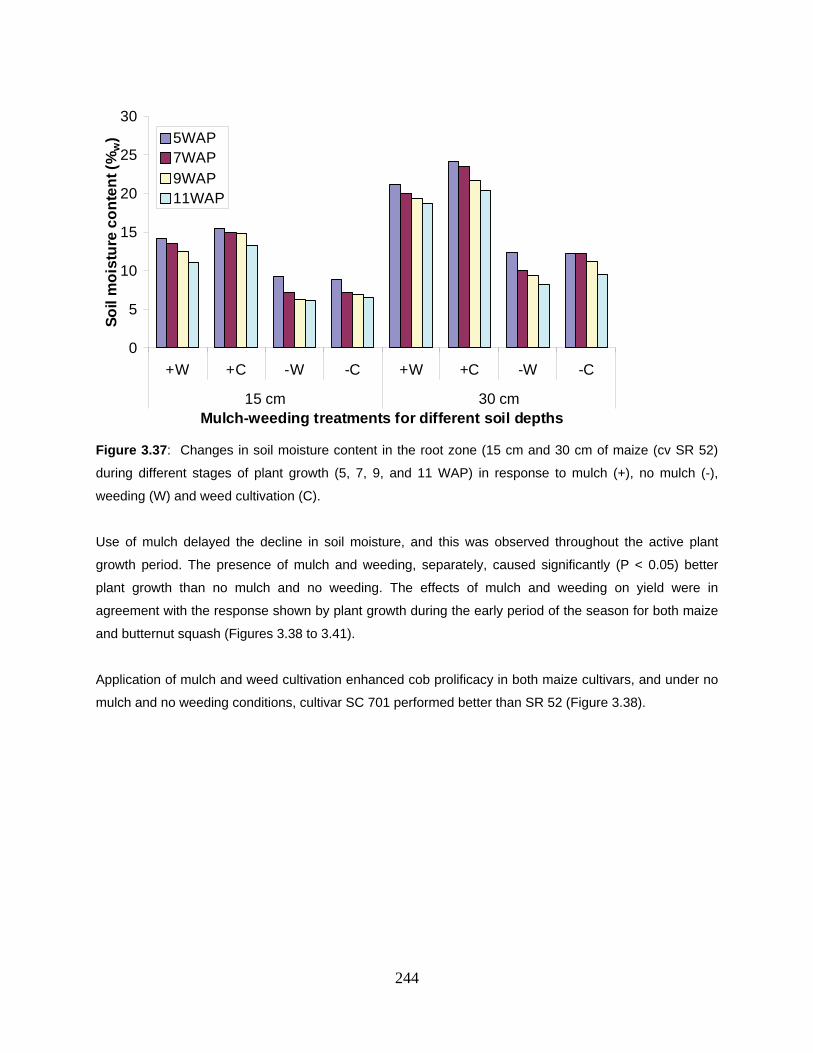
244
Figure 3.37: Changes in soil moisture content in the root zone (15 cm and 30 cm of maize (cv SR 52)
during different stages of plant growth (5, 7, 9, and 11 WAP) in response to mulch (+), no mulch (-),
weeding (W) and weed cultivation (C).
Use of mulch delayed the decline in soil moisture, and this was observed throughout the active plant
growth period. The presence of mulch and weeding, separately, caused significantly (P < 0.05) better
plant growth than no mulch and no weeding. The effects of mulch and weeding on yield were in
agreement with the response shown by plant growth during the early period of the season for both maize
and butternut squash (Figures 3.38 to 3.41).
Application of mulch and weed cultivation enhanced cob prolificacy in both maize cultivars, and under no
mulch and no weeding conditions, cultivar SC 701 performed better than SR 52 (Figure 3.38).
0
5
10
15
20
25
30
+W +C -W -C +W +C -W -C
15 cm 30 cmMulch-weeding treatments for different soil depths
So
il m
ois
ture
co
nte
nt
(%w
) 5WAP7WAP9WAP11WAP
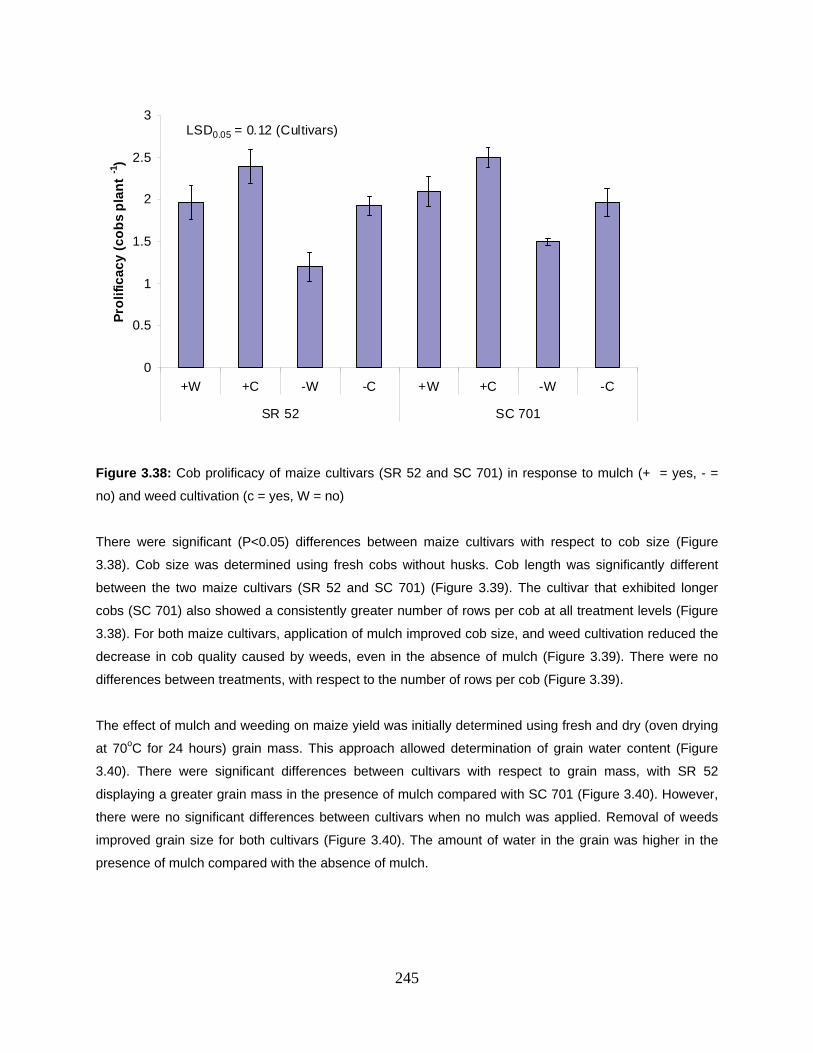
245
Figure 3.38: Cob prolificacy of maize cultivars (SR 52 and SC 701) in response to mulch (+ = yes, - =
no) and weed cultivation (c = yes, W = no)
There were significant (P<0.05) differences between maize cultivars with respect to cob size (Figure
3.38). Cob size was determined using fresh cobs without husks. Cob length was significantly different
between the two maize cultivars (SR 52 and SC 701) (Figure 3.39). The cultivar that exhibited longer
cobs (SC 701) also showed a consistently greater number of rows per cob at all treatment levels (Figure
3.38). For both maize cultivars, application of mulch improved cob size, and weed cultivation reduced the
decrease in cob quality caused by weeds, even in the absence of mulch (Figure 3.39). There were no
differences between treatments, with respect to the number of rows per cob (Figure 3.39).
The effect of mulch and weeding on maize yield was initially determined using fresh and dry (oven drying
at 70oC for 24 hours) grain mass. This approach allowed determination of grain water content (Figure
3.40). There were significant differences between cultivars with respect to grain mass, with SR 52
displaying a greater grain mass in the presence of mulch compared with SC 701 (Figure 3.40). However,
there were no significant differences between cultivars when no mulch was applied. Removal of weeds
improved grain size for both cultivars (Figure 3.40). The amount of water in the grain was higher in the
presence of mulch compared with the absence of mulch.
0
0.5
1
1.5
2
2.5
3
+W +C -W -C +W +C -W -C
SR 52 SC 701
Pro
lifi
ca
cy
(c
ob
s p
lan
t -1
)LSD0.05 = 0.12 (Cultivars)
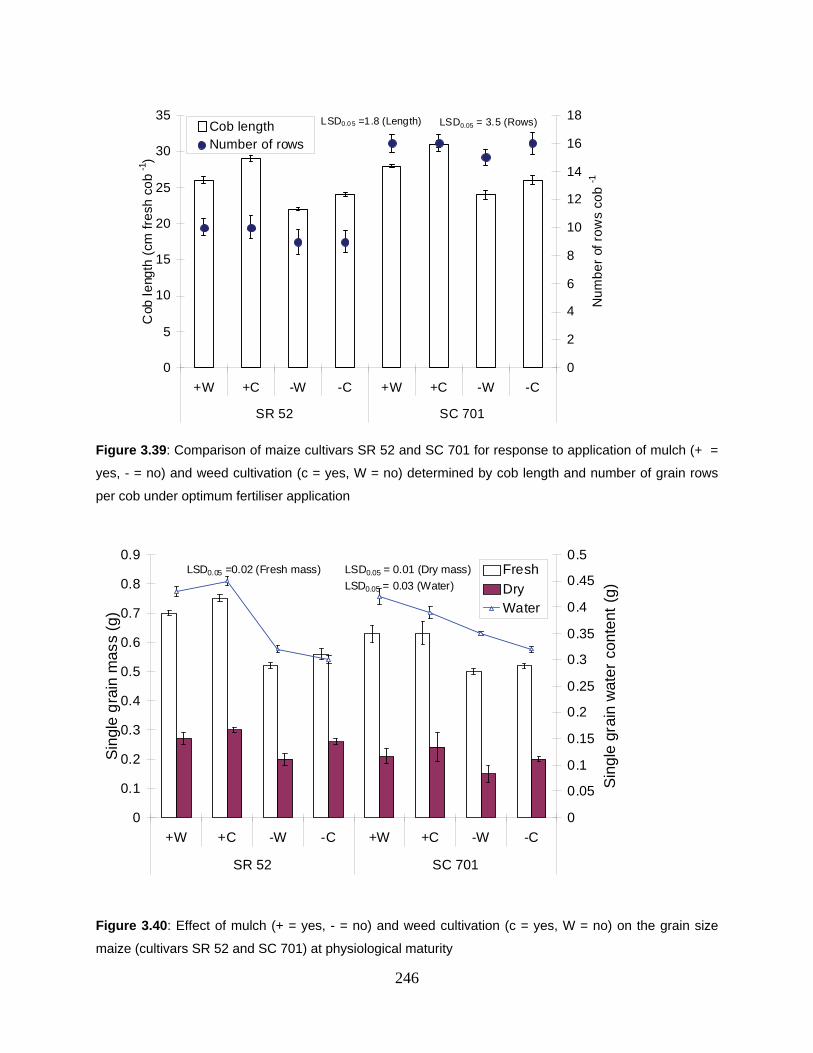
246
Figure 3.39: Comparison of maize cultivars SR 52 and SC 701 for response to application of mulch (+ =
yes, - = no) and weed cultivation (c = yes, W = no) determined by cob length and number of grain rows
per cob under optimum fertiliser application
Figure 3.40: Effect of mulch (+ = yes, - = no) and weed cultivation (c = yes, W = no) on the grain size
maize (cultivars SR 52 and SC 701) at physiological maturity
0
5
10
15
20
25
30
35
+W +C -W -C +W +C -W -C
SR 52 SC 701
Cob
le
ngth
(cm
fre
sh c
ob
-1 )
0
2
4
6
8
10
12
14
16
18
Nu
mb
er
of r
ow
s co
b -1
Cob lengthNumber of rows
LSD0.0 5 =1.8 (Length) LSD0.05 = 3.5 (Rows)
0
0.1
0.2
0.3
0.4
0.5
0.6
0.7
0.8
0.9
+W +C -W -C +W +C -W -C
SR 52 SC 701
Sin
gle
gra
in m
ass
(g)
0
0.05
0.1
0.15
0.2
0.25
0.3
0.35
0.4
0.45
0.5
Sin
gle
grai
n w
ater
con
tent
(g)
Fresh
DryWater
LSD0.05 =0.02 (Fresh mass) LSD0.05 = 0.01 (Dry mass)
LSD0.05 = 0.03 (Water)
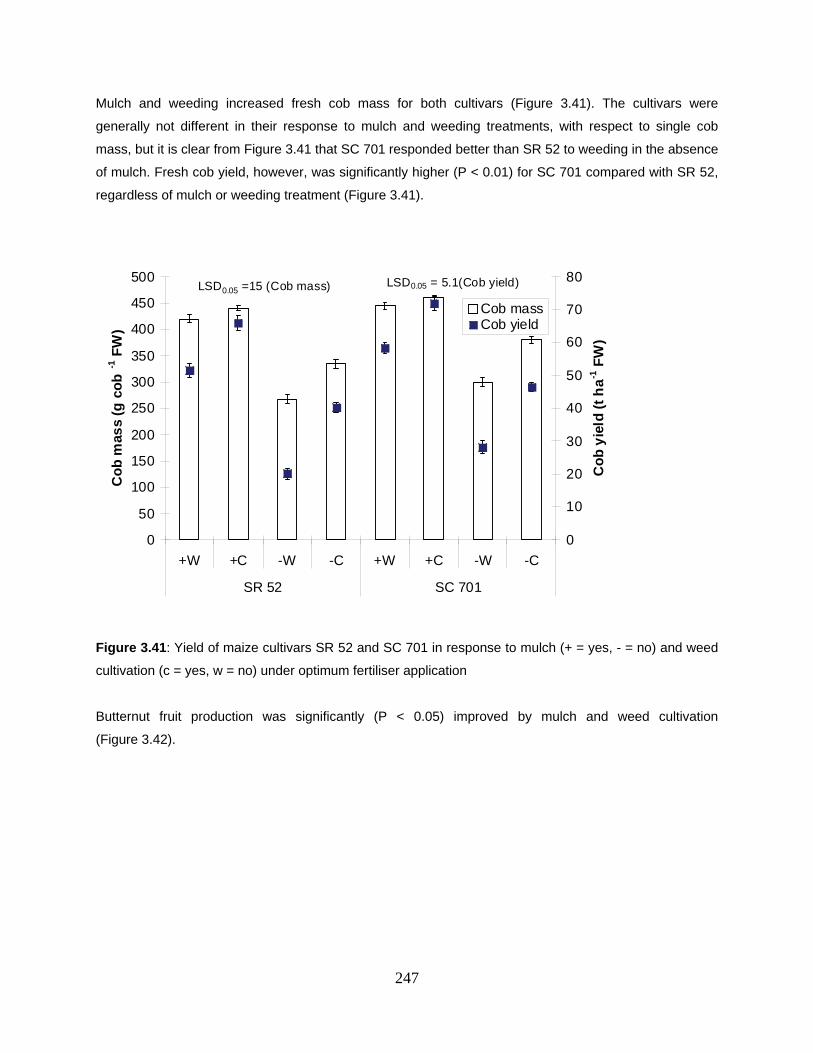
247
Mulch and weeding increased fresh cob mass for both cultivars (Figure 3.41). The cultivars were
generally not different in their response to mulch and weeding treatments, with respect to single cob
mass, but it is clear from Figure 3.41 that SC 701 responded better than SR 52 to weeding in the absence
of mulch. Fresh cob yield, however, was significantly higher (P < 0.01) for SC 701 compared with SR 52,
regardless of mulch or weeding treatment (Figure 3.41).
Figure 3.41: Yield of maize cultivars SR 52 and SC 701 in response to mulch (+ = yes, - = no) and weed
cultivation (c = yes, w = no) under optimum fertiliser application
Butternut fruit production was significantly (P < 0.05) improved by mulch and weed cultivation
(Figure 3.42).
0
50
100
150
200
250
300
350
400
450
500
+W +C -W -C +W +C -W -C
SR 52 SC 701
Co
b m
ass
(g c
ob
-1 F
W)
0
10
20
30
40
50
60
70
80
Co
b y
ield
(t
ha
-1 F
W)
Cob massCob yield
LSD0.05 =15 (Cob mass) LSD0.05 = 5.1(Cob yield)
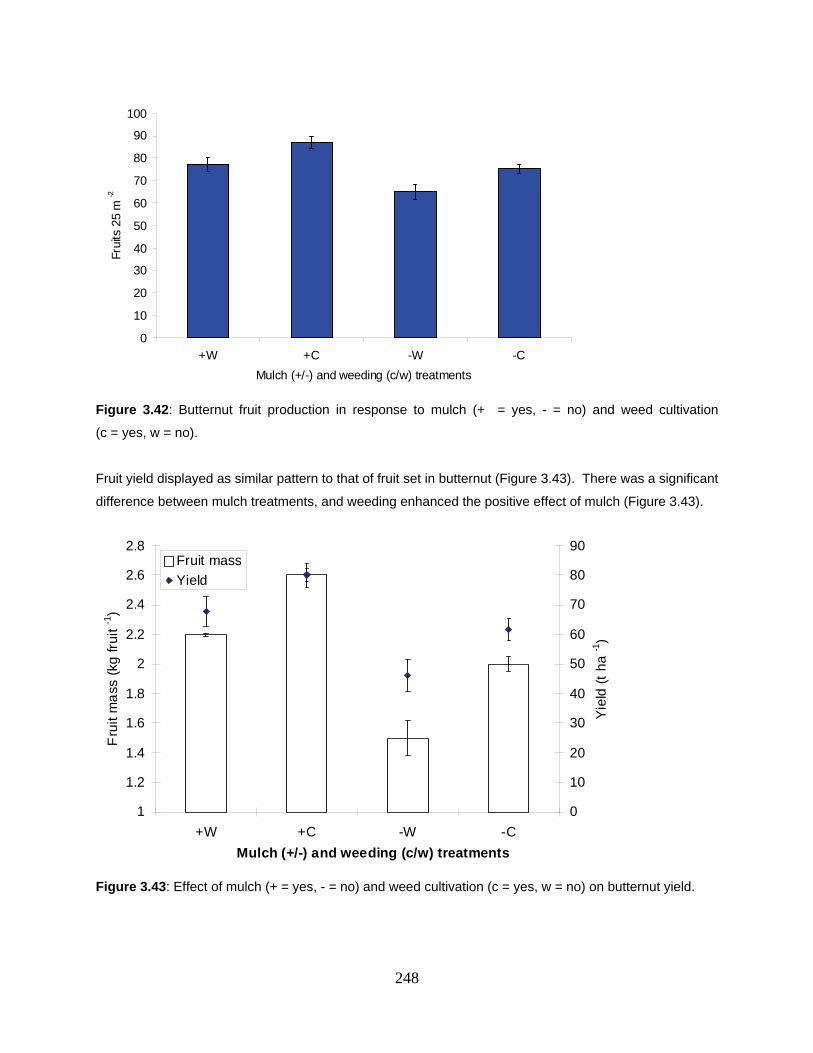
248
Figure 3.42: Butternut fruit production in response to mulch (+ = yes, - = no) and weed cultivation
(c = yes, w = no).
Fruit yield displayed as similar pattern to that of fruit set in butternut (Figure 3.43). There was a significant
difference between mulch treatments, and weeding enhanced the positive effect of mulch (Figure 3.43).
Figure 3.43: Effect of mulch (+ = yes, - = no) and weed cultivation (c = yes, w = no) on butternut yield.
0
10
20
30
40
50
60
70
80
90
100
+W +C -W -C
Mulch (+/-) and weeding (c/w) treatments
Frui
ts 2
5 m
-2
1
1.2
1.4
1.6
1.8
2
2.2
2.4
2.6
2.8
+W +C -W -C
Fru
it m
ass
(kg
fru
it -1
)
0
10
20
30
40
50
60
70
80
90
Mulch (+/-) and weeding (c/w) treatments
Yie
ld (
t h
a -1
)
Fruit mass
Yield
249
The study deliberately did not compare maize and butternut for the obvious reason that the two
genotypes represent different species, with different photosynthetic types. Maize, being a C4 species has
a better water-use-efficiency than butternut squash, a C3 species. However, it is clear that for both
species, mulch application improves prolificacy and yield. Maize is marketed as a vegetable (green
mealies), rather than grain, by the smallholder farmers in Tugela Ferry. Hence, maize yield determination
was performed using fresh maize cobs. This study showed that cultivar SR 52 has a larger grain size than
SC 701, but the latter has longer cobs with more rows per cob compared with SR 52. Consequently, SC
701 displayed a better yield than SR 52. This study was conducted for demonstration purposes at other
blocks of the Tugela Ferry Irrigation scheme, to allow farmers to determine differences between the two
cultivars on their own. Farmers were prepared to accept SR 52 as new green mealies product, in addition
to SC 701. It was encouraging to note that butternut squash also responded positively to mulching. Both
maize and butternut squash are important cash crops at Tugela Ferry, and they are less expensive to
produce than the popular (to customers) tomato.
3.7 Impact of the project at Tugela Ferry Irrigation Scheme (TFIS)
The project impact can be viewed from different perspectives. In the context of this study, the most
important aspects for determination of the project impact are (i) Capacity building for farmers who
participated in the project (ii) Capacity building for extension officers of the local Department of Agriculture
and Environmental Affairs (iii) Impact of project activities on the community living in the area surrounding
the Tugela irrigation scheme and (iv) Research capacity building.
3.7.1 Capacity building for farmers and extension officers: a general account
From the beginning of the project, farmers were allowed to participate in the situation analysis through
workshops to confirm historical data and to identify current constraints to best management practices on
the irrigation scheme (section 3.2). During that exercise, farmers were exposed to the basic tools for
identification and description of their farming environment, as well as opportunities around the irrigation
scheme that might have an impact on their operations. Farmers learned how to participate in social
investigations by facilitating discussion groups and raising their views democratically for analysis
(Plate 3.15 and 3.16).
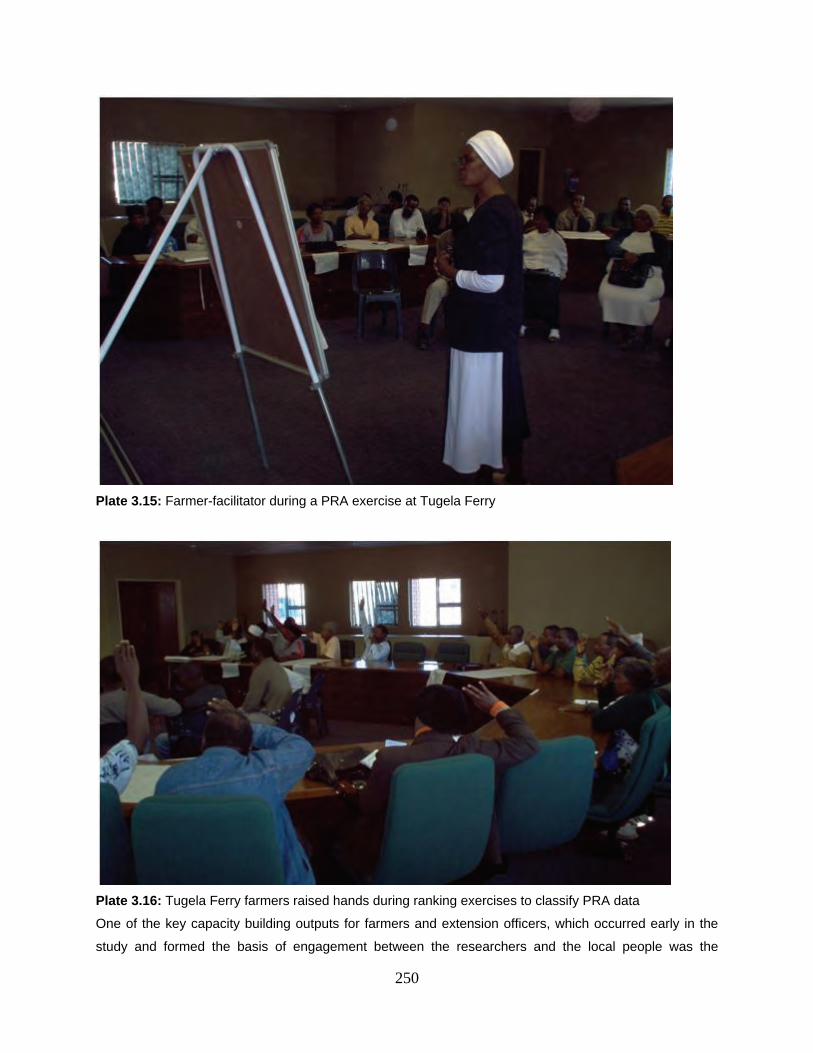
250
Plate 3.15: Farmer-facilitator during a PRA exercise at Tugela Ferry
Plate 3.16: Tugela Ferry farmers raised hands during ranking exercises to classify PRA data
One of the key capacity building outputs for farmers and extension officers, which occurred early in the
study and formed the basis of engagement between the researchers and the local people was the
251
conceptual framework for farmer-extension officer-researcher cooperation (Figure 3.44), which led to the
joint development of criteria to assess the performance of farmers and extension officers in best
management practices (Table 3.23). Consequently, all the farmers who participated in the project were
involved in the development of a Zulu partial budgeting plan (Table 3.24), which they used for best
management practices pertinent to their situation on the irrigation scheme.
Allowing farmers to participate built their confidence in interacting with researchers and extension officers
to the extent that it was they who selected locally preferred crop cultivars for inclusion in participatory
agronomic trials. For example, maize cultivar SC 701 was the farmer’s choice for research and
demonstration trials to compare maize performance during water management. The farmers now carry
notebooks for keeping of their farm activities.
During agronomic trials farmers learned how to take soil samples, do mulching and use the wetting front
detectors. They also learned how to determine crop stand establishment, and grade potatoes and
butternut squash during yield determination.
As a result of a healthy relationship between all stakeholders in the project, it was easy for the farmers to
participate in alleviating their institutional constraints. Key among these was the formation of an
overarching structure to facilitate cooperation of the farmers on the irrigation scheme, across all the
blocks, and to involve surrounding communities in it. A structure that was initially set as an “umbrella
body”, by the farmers, became an important vehicle for the establishment of a Water Users Association
(WUA), which involved communities operating on the irrigation scheme as well as those who were in the
greater Tugela Ferry location. Details about the Tugela Ferry WUA are contained in a study conducted as
part of this project by Monatisa (2008).
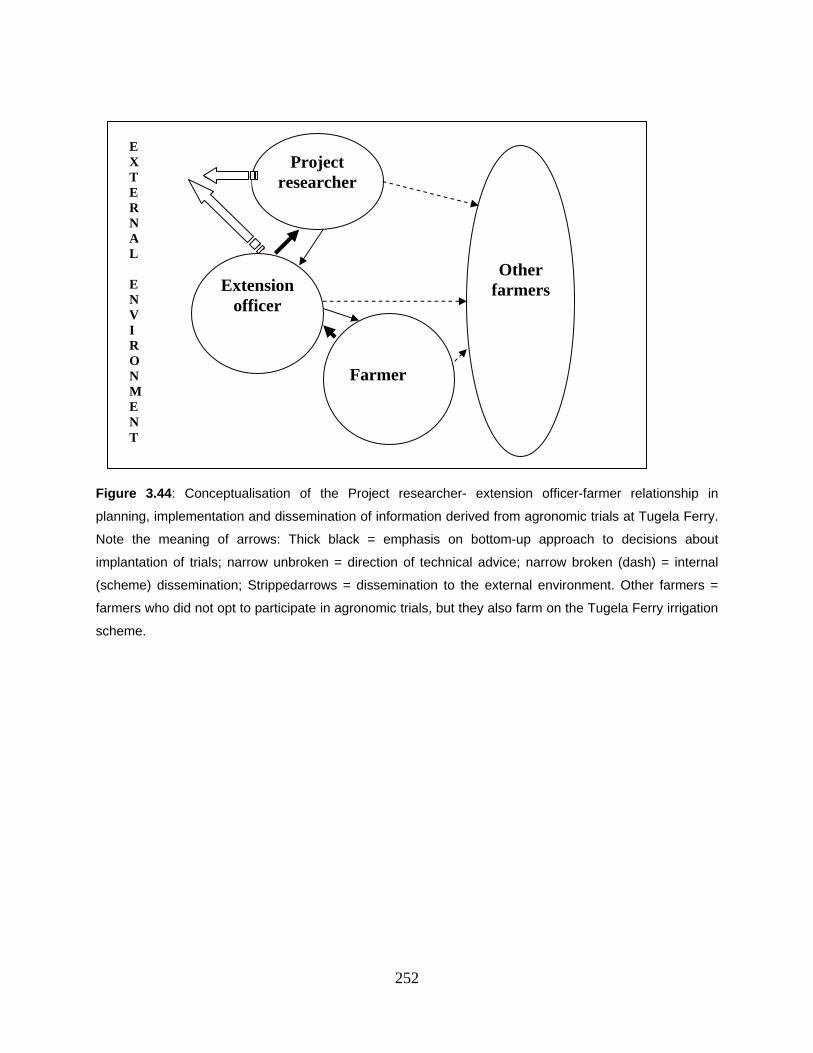
252
Figure 3.44: Conceptualisation of the Project researcher- extension officer-farmer relationship in
planning, implementation and dissemination of information derived from agronomic trials at Tugela Ferry.
Note the meaning of arrows: Thick black = emphasis on bottom-up approach to decisions about
implantation of trials; narrow unbroken = direction of technical advice; narrow broken (dash) = internal
(scheme) dissemination; Strippedarrows = dissemination to the external environment. Other farmers =
farmers who did not opt to participate in agronomic trials, but they also farm on the Tugela Ferry irrigation
scheme.
Project
researcher
Extension officer
Farmer
Other farmers
E X T E R N A L E N VI RO N M E N T
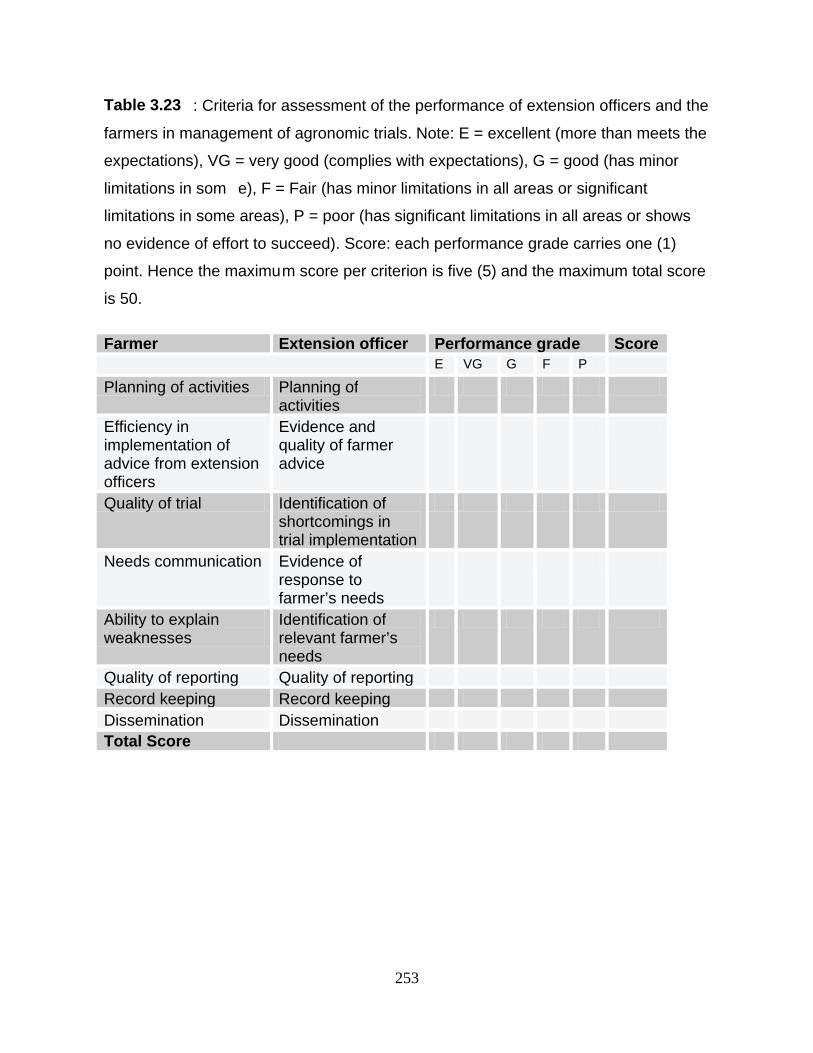
253
Table 3.23 : Criteria for assessment of the performance of extension officers and the
farmers in management of agronomic trials. Note: E = excellent (more than meets the
expectations), VG = very good (complies with expectations), G = good (has minor
limitations in som e), F = Fair (has minor limitations in all areas or significant
limitations in some areas), P = poor (has significant limitations in all areas or shows
no evidence of effort to succeed). Score: each performance grade carries one (1)
point. Hence the maximum score per criterion is five (5) and the maximum total score
is 50.
Farmer Extension officer Performance grad e S core E VG G F P Planning of activities Planning of
activities
Efficiency in implementation of advice from extension officers
Evide nce and quality of farmeradvice
Quality of trial Identification ofshortcomings in trial implementation
Needs communication Evidence ofresponse to farmer’s needs
Ability to explain weaknesses
Identification ofrelevant farmer’s needs
Quality of reporting Quality of reporting Record keeping Record keeping Dissemination Dissemination Total Score
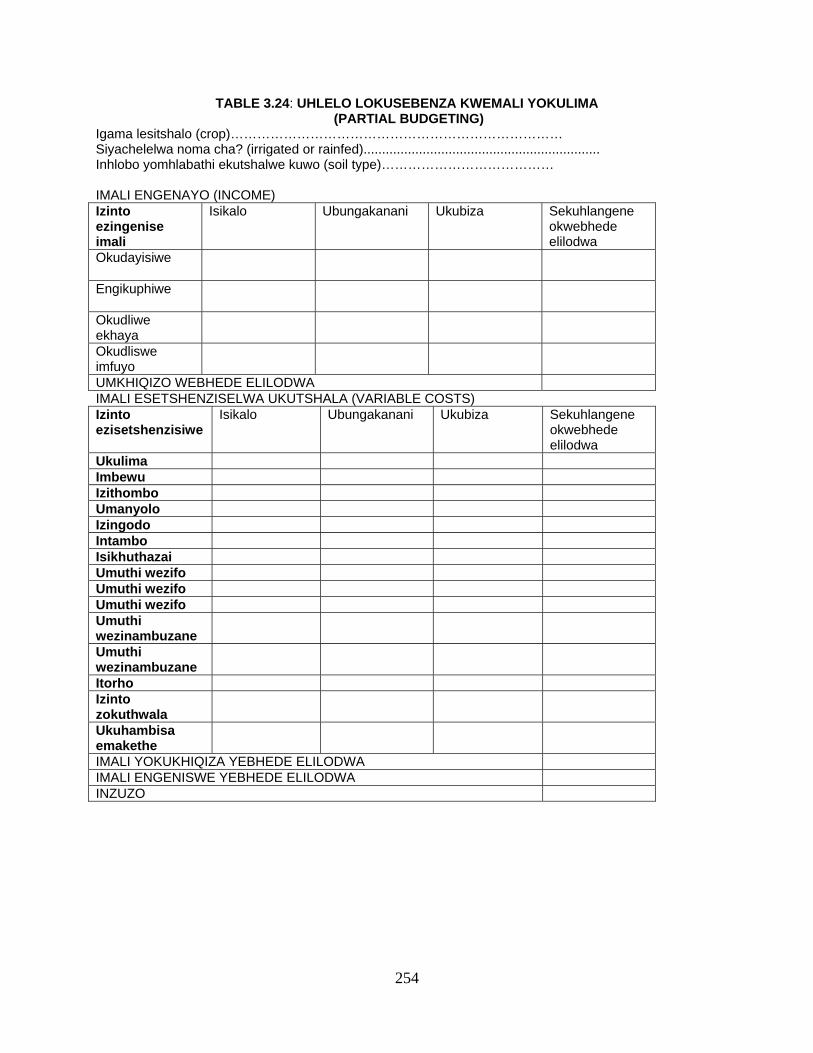
254
TABLE 3.24: UHLELO LOKUSEBENZA KWEMALI YOKULIMA (PARTIAL BUDGETING)
Igama lesitshalo (crop)………………………………………………………………… Siyachelelwa noma cha? (irrigated or rainfed)................................................................ Inhlobo yomhlabathi ekutshalwe kuwo (soil type)………………………………… IMALI ENGENAYO (INCOME) Izinto ezingenise imali
Isikalo Ubungakanani Ukubiza Sekuhlangene okwebhede elilodwa
Okudayisiwe
Engikuphiwe
Okudliwe ekhaya
Okudliswe imfuyo
UMKHIQIZO WEBHEDE ELILODWA IMALI ESETSHENZISELWA UKUTSHALA (VARIABLE COSTS) Izinto ezisetshenzisiwe
Isikalo Ubungakanani Ukubiza Sekuhlangene okwebhede elilodwa
Ukulima Imbewu Izithombo Umanyolo Izingodo Intambo Isikhuthazai Umuthi wezifo Umuthi wezifo Umuthi wezifo Umuthi wezinambuzane
Umuthi wezinambuzane
Itorho Izinto zokuthwala
Ukuhambisa emakethe
IMALI YOKUKHIQIZA YEBHEDE ELILODWA IMALI ENGENISWE YEBHEDE ELILODWA INZUZO
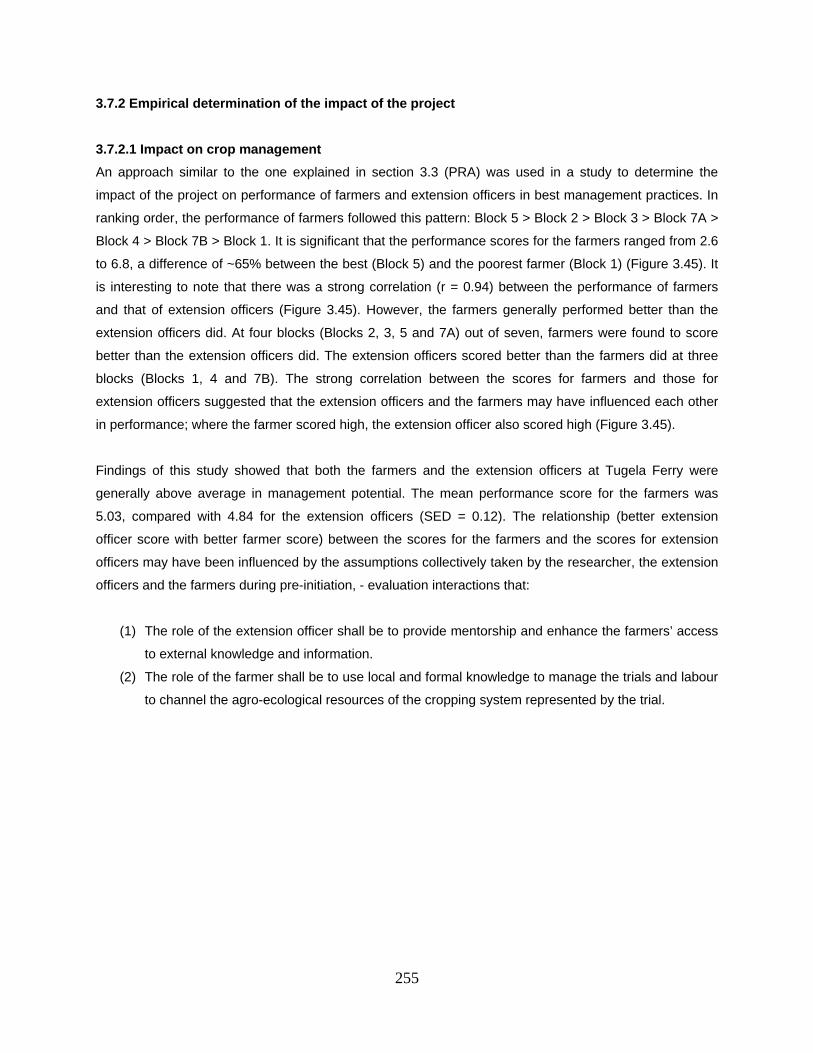
255
3.7.2 Empirical determination of the impact of the project
3.7.2.1 Impact on crop management
An approach similar to the one explained in section 3.3 (PRA) was used in a study to determine the
impact of the project on performance of farmers and extension officers in best management practices. In
ranking order, the performance of farmers followed this pattern: Block 5 > Block 2 > Block 3 > Block 7A >
Block 4 > Block 7B > Block 1. It is significant that the performance scores for the farmers ranged from 2.6
to 6.8, a difference of ~65% between the best (Block 5) and the poorest farmer (Block 1) (Figure 3.45). It
is interesting to note that there was a strong correlation (r = 0.94) between the performance of farmers
and that of extension officers (Figure 3.45). However, the farmers generally performed better than the
extension officers did. At four blocks (Blocks 2, 3, 5 and 7A) out of seven, farmers were found to score
better than the extension officers did. The extension officers scored better than the farmers did at three
blocks (Blocks 1, 4 and 7B). The strong correlation between the scores for farmers and those for
extension officers suggested that the extension officers and the farmers may have influenced each other
in performance; where the farmer scored high, the extension officer also scored high (Figure 3.45).
Findings of this study showed that both the farmers and the extension officers at Tugela Ferry were
generally above average in management potential. The mean performance score for the farmers was
5.03, compared with 4.84 for the extension officers (SED = 0.12). The relationship (better extension
officer score with better farmer score) between the scores for the farmers and the scores for extension
officers may have been influenced by the assumptions collectively taken by the researcher, the extension
officers and the farmers during pre-initiation, - evaluation interactions that:
(1) The role of the extension officer shall be to provide mentorship and enhance the farmers’ access
to external knowledge and information.
(2) The role of the farmer shall be to use local and formal knowledge to manage the trials and labour
to channel the agro-ecological resources of the cropping system represented by the trial.
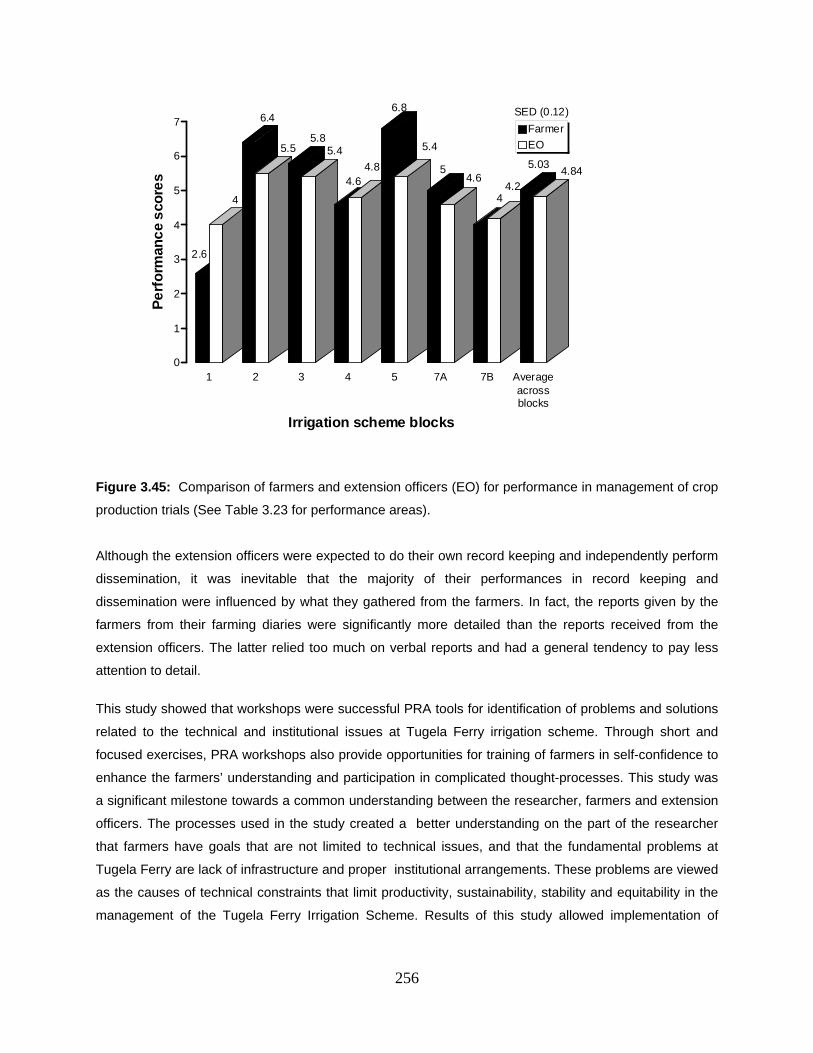
256
Figure 3.45: Comparison of farmers and extension officers (EO) for performance in management of crop
production trials (See Table 3.23 for performance areas).
Although the extension officers were expected to do their own record keeping and independently perform
dissemination, it was inevitable that the majority of their performances in record keeping and
dissemination were influenced by what they gathered from the farmers. In fact, the reports given by the
farmers from their farming diaries were significantly more detailed than the reports received from the
extension officers. The latter relied too much on verbal reports and had a general tendency to pay less
attention to detail.
This study showed that workshops were successful PRA tools for identification of problems and solutions
related to the technical and institutional issues at Tugela Ferry irrigation scheme. Through short and
focused exercises, PRA workshops also provide opportunities for training of farmers in self-confidence to
enhance the farmers’ understanding and participation in complicated thought-processes. This study was
a significant milestone towards a common understanding between the researcher, farmers and extension
officers. The processes used in the study created a better understanding on the part of the researcher
that farmers have goals that are not limited to technical issues, and that the fundamental problems at
Tugela Ferry are lack of infrastructure and proper institutional arrangements. These problems are viewed
as the causes of technical constraints that limit productivity, sustainability, stability and equitability in the
management of the Tugela Ferry Irrigation Scheme. Results of this study allowed implementation of
2.6
4
6.4
5.55.8
5.4
4.64.8
6.8
5.4
54.6
44.2
5.034.84
0
1
2
3
4
5
6
7
Pe
rfo
rman
ce
sco
res
1 2 3 4 5 7A 7B Averageacrossblocks
Irrigation scheme blocks
Farmer
EO
SED (0.12)
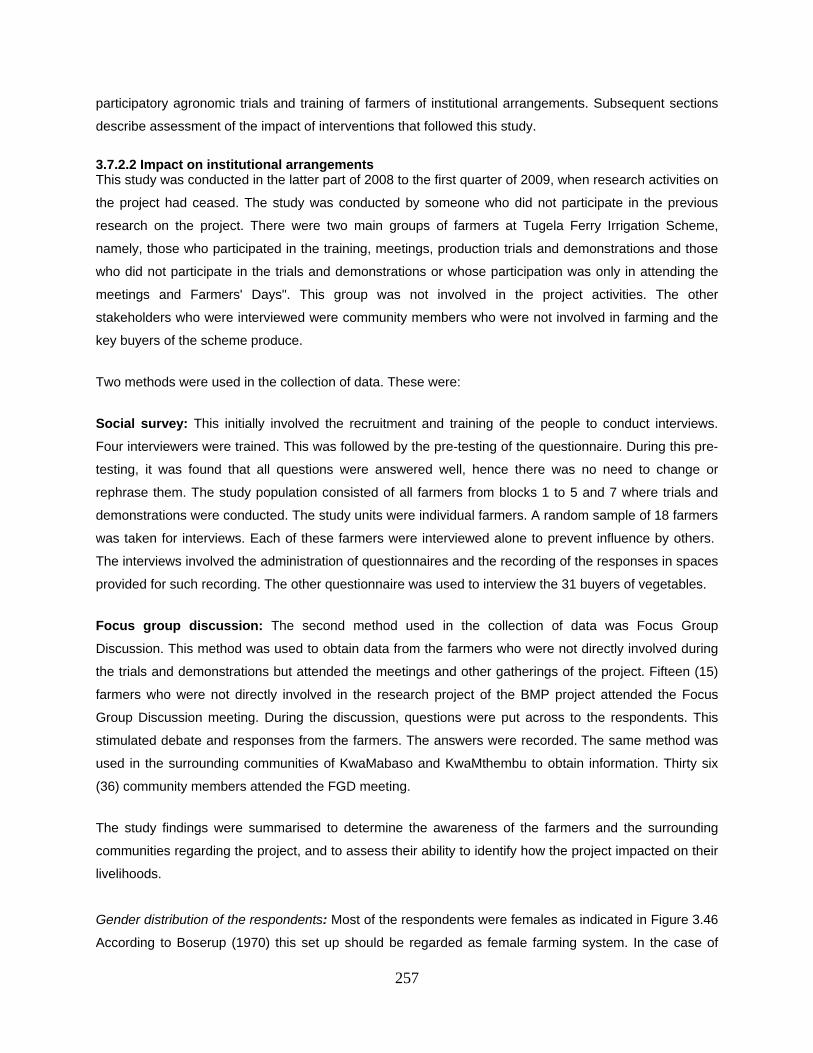
257
participatory agronomic trials and training of farmers of institutional arrangements. Subsequent sections
describe assessment of the impact of interventions that followed this study.
3.7.2.2 Impact on institutional arrangements This study was conducted in the latter part of 2008 to the first quarter of 2009, when research activities on
the project had ceased. The study was conducted by someone who did not participate in the previous
research on the project. There were two main groups of farmers at Tugela Ferry Irrigation Scheme,
namely, those who participated in the training, meetings, production trials and demonstrations and those
who did not participate in the trials and demonstrations or whose participation was only in attending the
meetings and Farmers' Days". This group was not involved in the project activities. The other
stakeholders who were interviewed were community members who were not involved in farming and the
key buyers of the scheme produce.
Two methods were used in the collection of data. These were:
Social survey: This initially involved the recruitment and training of the people to conduct interviews.
Four interviewers were trained. This was followed by the pre-testing of the questionnaire. During this pre-
testing, it was found that all questions were answered well, hence there was no need to change or
rephrase them. The study population consisted of all farmers from blocks 1 to 5 and 7 where trials and
demonstrations were conducted. The study units were individual farmers. A random sample of 18 farmers
was taken for interviews. Each of these farmers were interviewed alone to prevent influence by others.
The interviews involved the administration of questionnaires and the recording of the responses in spaces
provided for such recording. The other questionnaire was used to interview the 31 buyers of vegetables.
Focus group discussion: The second method used in the collection of data was Focus Group
Discussion. This method was used to obtain data from the farmers who were not directly involved during
the trials and demonstrations but attended the meetings and other gatherings of the project. Fifteen (15)
farmers who were not directly involved in the research project of the BMP project attended the Focus
Group Discussion meeting. During the discussion, questions were put across to the respondents. This
stimulated debate and responses from the farmers. The answers were recorded. The same method was
used in the surrounding communities of KwaMabaso and KwaMthembu to obtain information. Thirty six
(36) community members attended the FGD meeting.
The study findings were summarised to determine the awareness of the farmers and the surrounding
communities regarding the project, and to assess their ability to identify how the project impacted on their
livelihoods.
Gender distribution of the respondents: Most of the respondents were females as indicated in Figure 3.46
According to Boserup (1970) this set up should be regarded as female farming system. In the case of
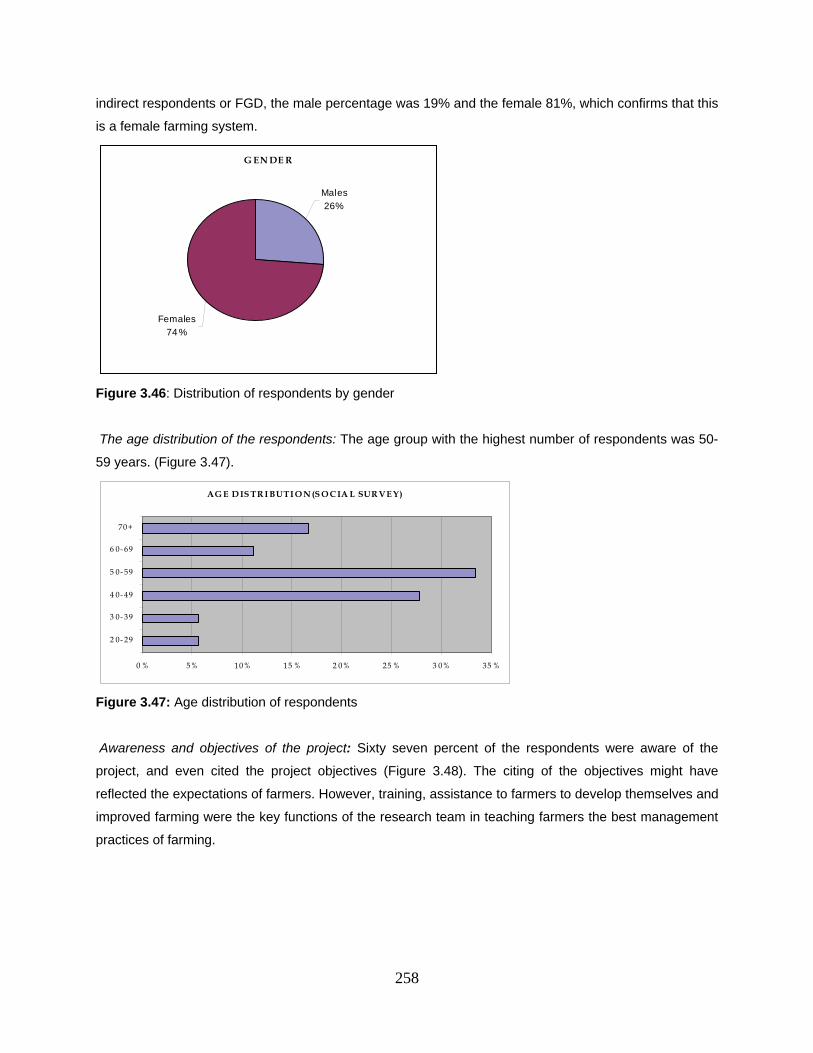
258
indirect respondents or FGD, the male percentage was 19% and the female 81%, which confirms that this
is a female farming system.
Figure 3.46: Distribution of respondents by gender
The age distribution of the respondents: The age group with the highest number of respondents was 50-
59 years. (Figure 3.47).
Figure 3.47: Age distribution of respondents
Awareness and objectives of the project: Sixty seven percent of the respondents were aware of the
project, and even cited the project objectives (Figure 3.48). The citing of the objectives might have
reflected the expectations of farmers. However, training, assistance to farmers to develop themselves and
improved farming were the key functions of the research team in teaching farmers the best management
practices of farming.
G EN DE R
Females
74 %
Males
26%
AG E D IS TR I BUTI O N (S O C IA L SUR VE Y)
0 % 5% 10% 15 % 2 0% 25 % 3 0% 35 %
2 0- 29
3 0- 39
4 0- 49
5 0- 59
6 0- 69
70+
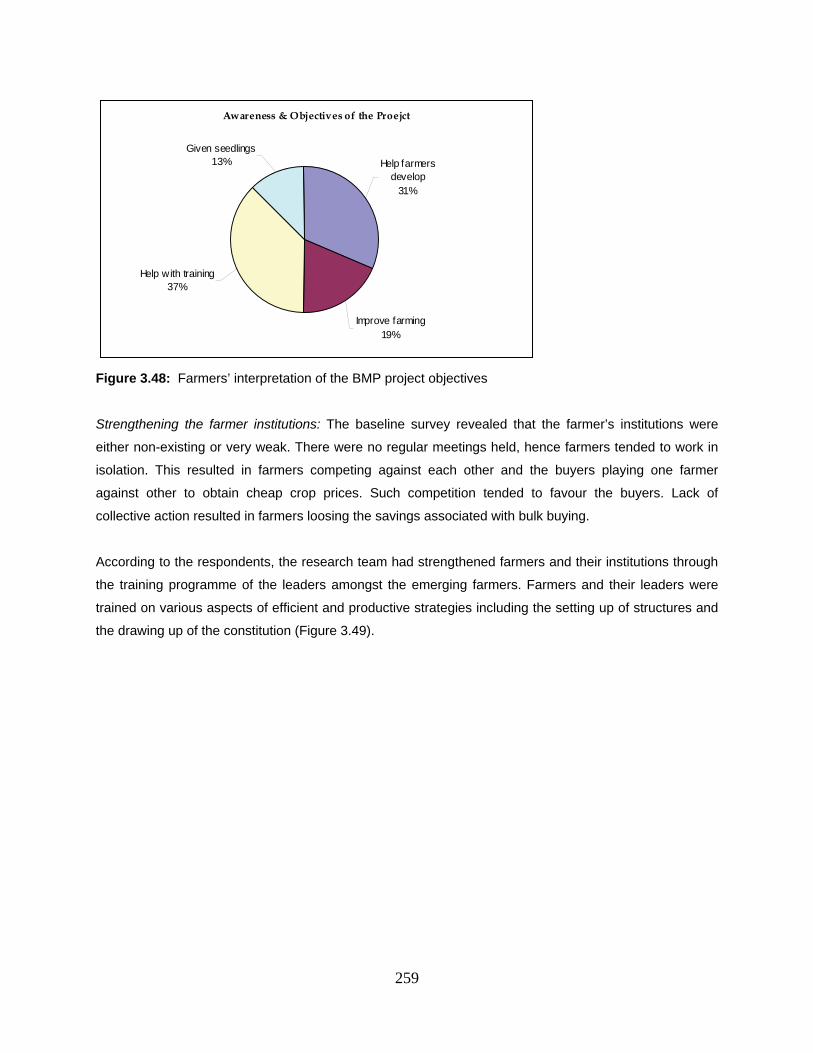
259
Figure 3.48: Farmers’ interpretation of the BMP project objectives
Strengthening the farmer institutions: The baseline survey revealed that the farmer’s institutions were
either non-existing or very weak. There were no regular meetings held, hence farmers tended to work in
isolation. This resulted in farmers competing against each other and the buyers playing one farmer
against other to obtain cheap crop prices. Such competition tended to favour the buyers. Lack of
collective action resulted in farmers loosing the savings associated with bulk buying.
According to the respondents, the research team had strengthened farmers and their institutions through
the training programme of the leaders amongst the emerging farmers. Farmers and their leaders were
trained on various aspects of efficient and productive strategies including the setting up of structures and
the drawing up of the constitution (Figure 3.49).
Awareness & Objectives of the Proejct
Given seedlings13%
Help with training37%
Improve farming19%
Help farmers develop
31%
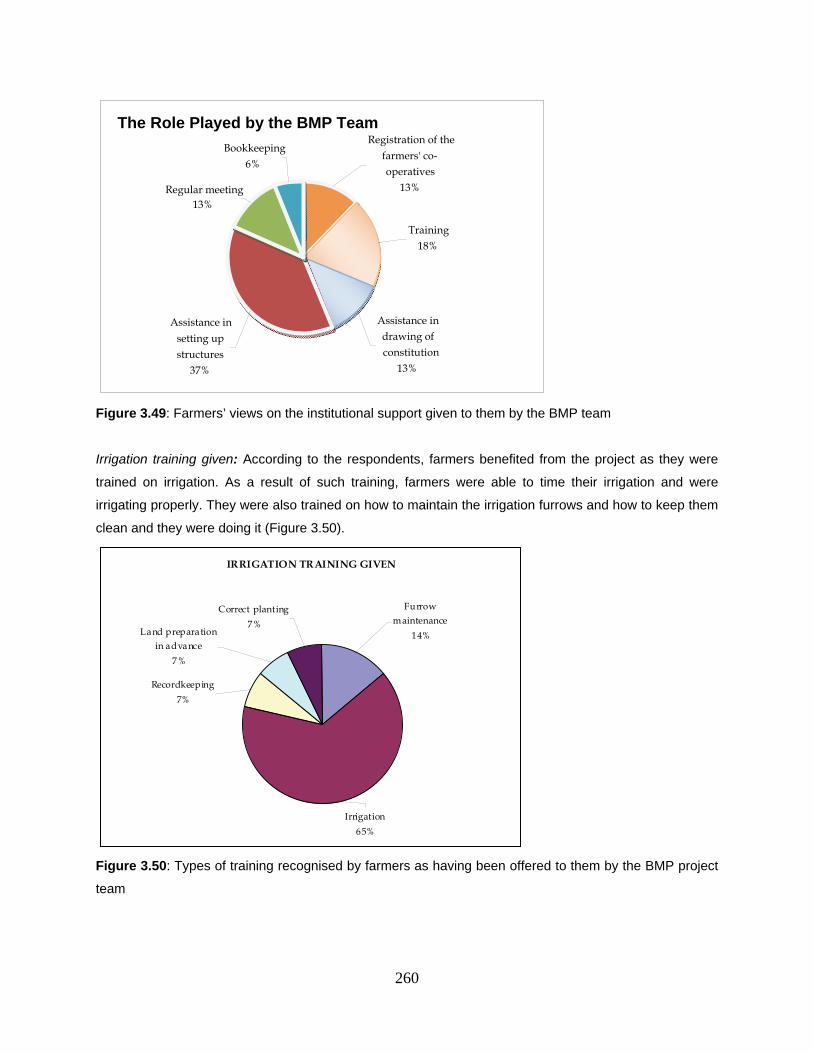
260
Figure 3.49: Farmers’ views on the institutional support given to them by the BMP team
Irrigation training given: According to the respondents, farmers benefited from the project as they were
trained on irrigation. As a result of such training, farmers were able to time their irrigation and were
irrigating properly. They were also trained on how to maintain the irrigation furrows and how to keep them
clean and they were doing it (Figure 3.50).
Figure 3.50: Types of training recognised by farmers as having been offered to them by the BMP project
team
IRRIGATION TRAINING GIVEN
Irrigation
65%
Furrow
maintenance
14%
Correct planting
7%Land preparation
in advance
7%
Recordkeeping
7%
The Role Played by the BMP Team
Regular meeting 13%
Bookkeeping6%
Assistance in
setting up
structures 37%
Assistance in drawing of constitution
13%
Training18%
Registration of the
farmers' co-operatives
13%
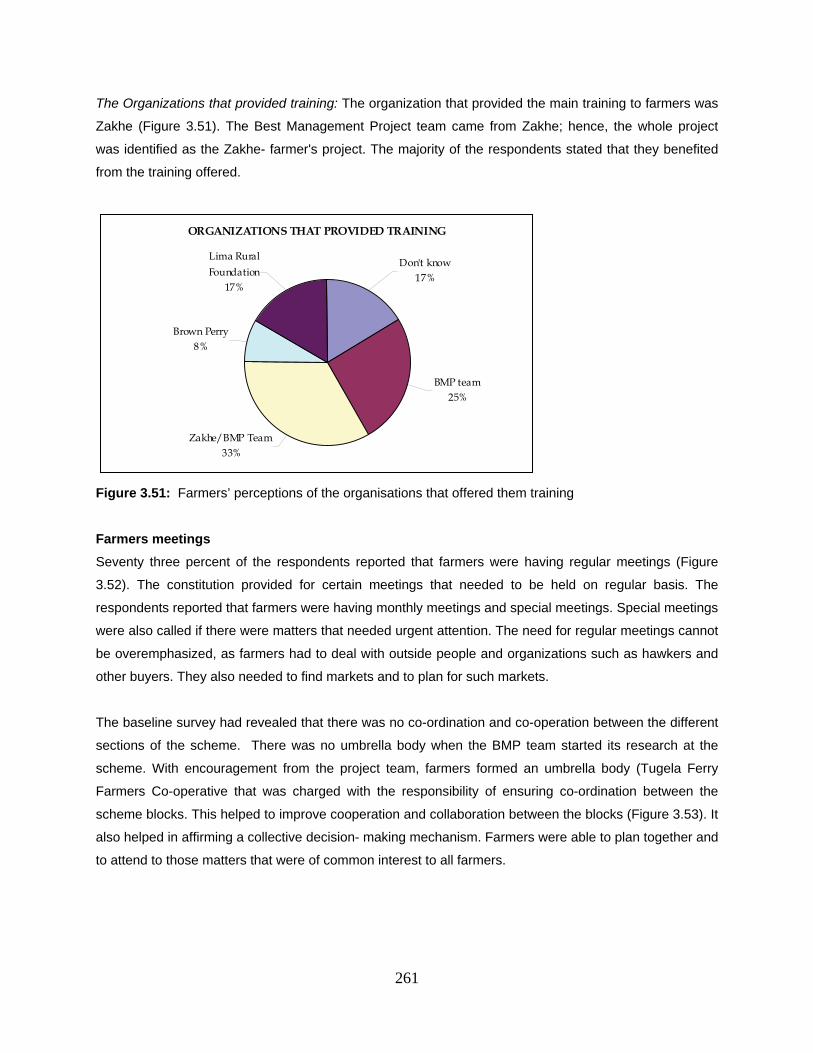
261
The Organizations that provided training: The organization that provided the main training to farmers was
Zakhe (Figure 3.51). The Best Management Project team came from Zakhe; hence, the whole project
was identified as the Zakhe- farmer's project. The majority of the respondents stated that they benefited
from the training offered.
Figure 3.51: Farmers’ perceptions of the organisations that offered them training
Farmers meetings
Seventy three percent of the respondents reported that farmers were having regular meetings (Figure
3.52). The constitution provided for certain meetings that needed to be held on regular basis. The
respondents reported that farmers were having monthly meetings and special meetings. Special meetings
were also called if there were matters that needed urgent attention. The need for regular meetings cannot
be overemphasized, as farmers had to deal with outside people and organizations such as hawkers and
other buyers. They also needed to find markets and to plan for such markets.
The baseline survey had revealed that there was no co-ordination and co-operation between the different
sections of the scheme. There was no umbrella body when the BMP team started its research at the
scheme. With encouragement from the project team, farmers formed an umbrella body (Tugela Ferry
Farmers Co-operative that was charged with the responsibility of ensuring co-ordination between the
scheme blocks. This helped to improve cooperation and collaboration between the blocks (Figure 3.53). It
also helped in affirming a collective decision- making mechanism. Farmers were able to plan together and
to attend to those matters that were of common interest to all farmers.
ORGANIZATIONS THAT PROVIDED TRAINING
Brown Perry8%
Zakhe/BMP Team33%
BMP team25%
Don't know17%
Lima Rural
Foundation17%
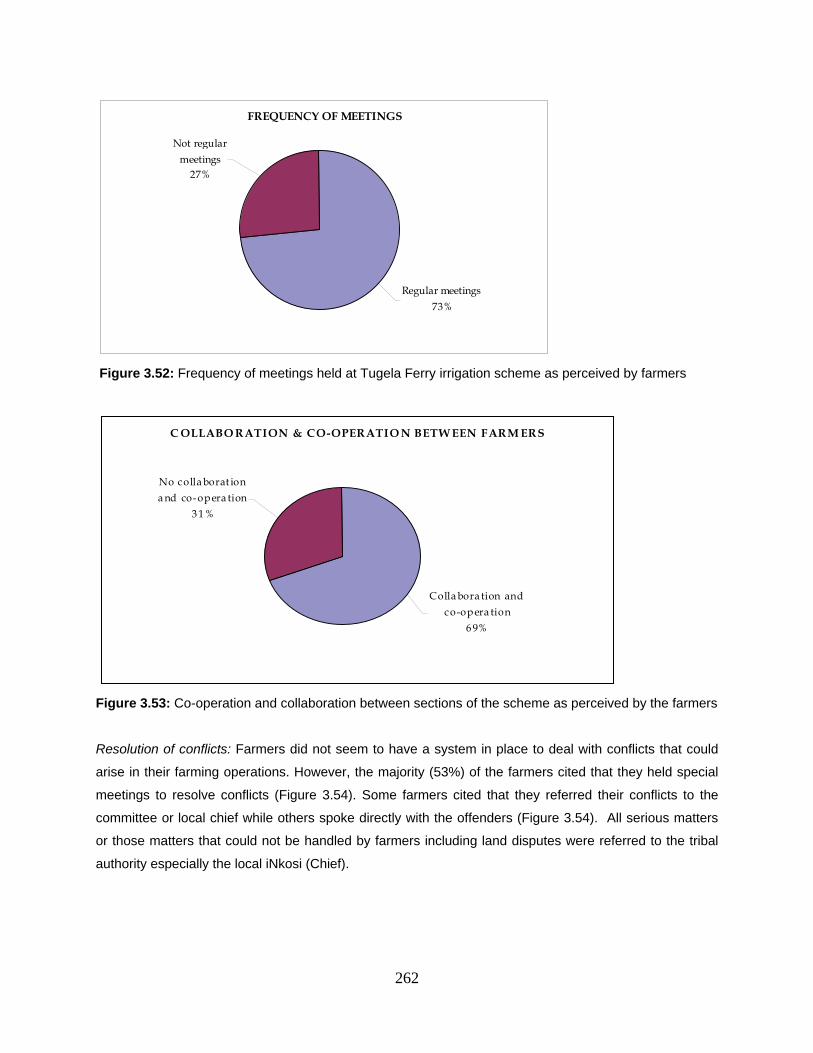
262
Figure 3.52: Frequency of meetings held at Tugela Ferry irrigation scheme as perceived by farmers
Figure 3.53: Co-operation and collaboration between sections of the scheme as perceived by the farmers
Resolution of conflicts: Farmers did not seem to have a system in place to deal with conflicts that could
arise in their farming operations. However, the majority (53%) of the farmers cited that they held special
meetings to resolve conflicts (Figure 3.54). Some farmers cited that they referred their conflicts to the
committee or local chief while others spoke directly with the offenders (Figure 3.54). All serious matters
or those matters that could not be handled by farmers including land disputes were referred to the tribal
authority especially the local iNkosi (Chief).
FREQUENCY OF MEETINGS
Regular meetings
73%
Not regular
meetings27%
C OLLABO RATION & CO-OPERATIO N BETW EEN FARM ERS
No colla borat ion
a nd co-opera tion
3 1 %
Colla bora tion and
co-opera tion
6 9%
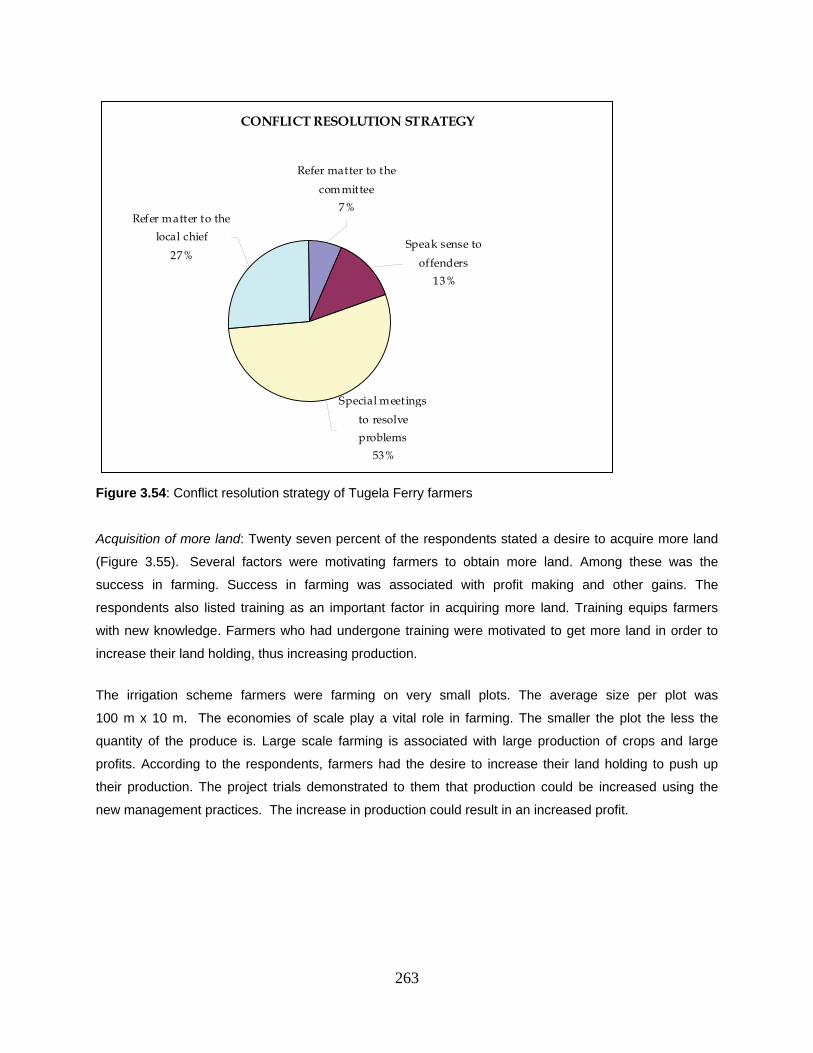
263
Figure 3.54: Conflict resolution strategy of Tugela Ferry farmers
Acquisition of more land: Twenty seven percent of the respondents stated a desire to acquire more land
(Figure 3.55). Several factors were motivating farmers to obtain more land. Among these was the
success in farming. Success in farming was associated with profit making and other gains. The
respondents also listed training as an important factor in acquiring more land. Training equips farmers
with new knowledge. Farmers who had undergone training were motivated to get more land in order to
increase their land holding, thus increasing production.
The irrigation scheme farmers were farming on very small plots. The average size per plot was
100 m x 10 m. The economies of scale play a vital role in farming. The smaller the plot the less the
quantity of the produce is. Large scale farming is associated with large production of crops and large
profits. According to the respondents, farmers had the desire to increase their land holding to push up
their production. The project trials demonstrated to them that production could be increased using the
new management practices. The increase in production could result in an increased profit.
CONFLICT RESOLUTION STRATEGY
Special meetings
to resolve
problems
53%
Refer matter to the
local chief
27%
Refer matter to the
committee
7%
Speak sense to
offenders
13%
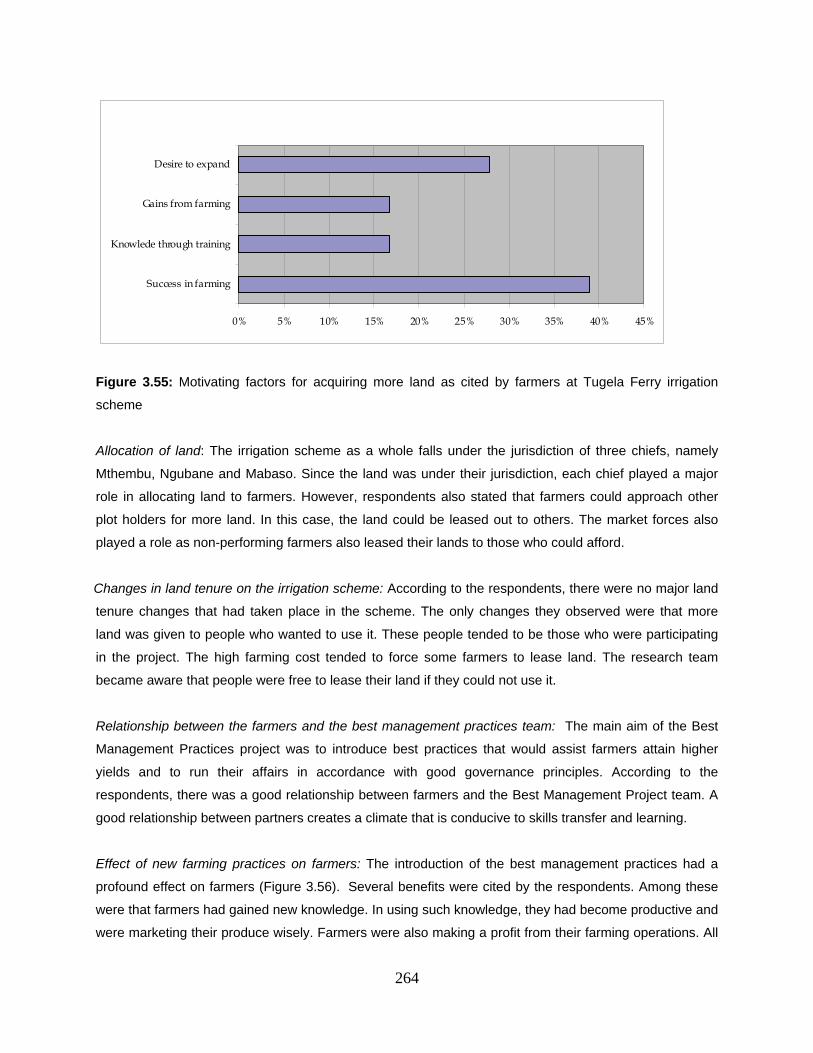
264
Figure 3.55: Motivating factors for acquiring more land as cited by farmers at Tugela Ferry irrigation
scheme
Allocation of land: The irrigation scheme as a whole falls under the jurisdiction of three chiefs, namely
Mthembu, Ngubane and Mabaso. Since the land was under their jurisdiction, each chief played a major
role in allocating land to farmers. However, respondents also stated that farmers could approach other
plot holders for more land. In this case, the land could be leased out to others. The market forces also
played a role as non-performing farmers also leased their lands to those who could afford.
Changes in land tenure on the irrigation scheme: According to the respondents, there were no major land
tenure changes that had taken place in the scheme. The only changes they observed were that more
land was given to people who wanted to use it. These people tended to be those who were participating
in the project. The high farming cost tended to force some farmers to lease land. The research team
became aware that people were free to lease their land if they could not use it.
Relationship between the farmers and the best management practices team: The main aim of the Best
Management Practices project was to introduce best practices that would assist farmers attain higher
yields and to run their affairs in accordance with good governance principles. According to the
respondents, there was a good relationship between farmers and the Best Management Project team. A
good relationship between partners creates a climate that is conducive to skills transfer and learning.
Effect of new farming practices on farmers: The introduction of the best management practices had a
profound effect on farmers (Figure 3.56). Several benefits were cited by the respondents. Among these
were that farmers had gained new knowledge. In using such knowledge, they had become productive and
were marketing their produce wisely. Farmers were also making a profit from their farming operations. All
MOTIVATION FACTORS FOR ACQUIRE MORE LAND
0% 5% 10% 15% 20% 25% 30% 35% 40% 45%
Success in farming
Knowlede through training
Gains from farming
Desire to expand
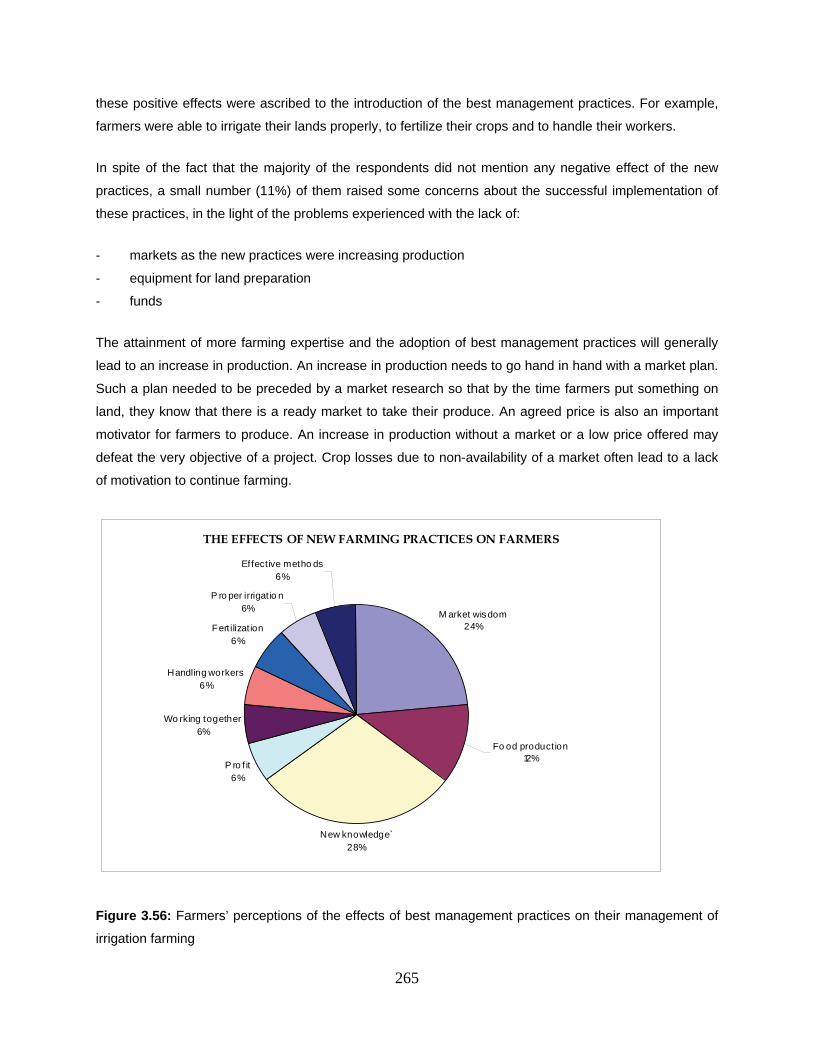
265
these positive effects were ascribed to the introduction of the best management practices. For example,
farmers were able to irrigate their lands properly, to fertilize their crops and to handle their workers.
In spite of the fact that the majority of the respondents did not mention any negative effect of the new
practices, a small number (11%) of them raised some concerns about the successful implementation of
these practices, in the light of the problems experienced with the lack of:
- markets as the new practices were increasing production
- equipment for land preparation
- funds
The attainment of more farming expertise and the adoption of best management practices will generally
lead to an increase in production. An increase in production needs to go hand in hand with a market plan.
Such a plan needed to be preceded by a market research so that by the time farmers put something on
land, they know that there is a ready market to take their produce. An agreed price is also an important
motivator for farmers to produce. An increase in production without a market or a low price offered may
defeat the very objective of a project. Crop losses due to non-availability of a market often lead to a lack
of motivation to continue farming.
Figure 3.56: Farmers’ perceptions of the effects of best management practices on their management of
irrigation farming
THE EFFECTS OF NEW FARMING PRACTICES ON FARMERS
New knowledge`28%
P ro f it6%
Wo rking together6%
Handling workers6%
Fert ilizat ion6%
P ro per irrigatio n6%
Effective metho ds6%
Fo od production12%
M arket wis dom24%
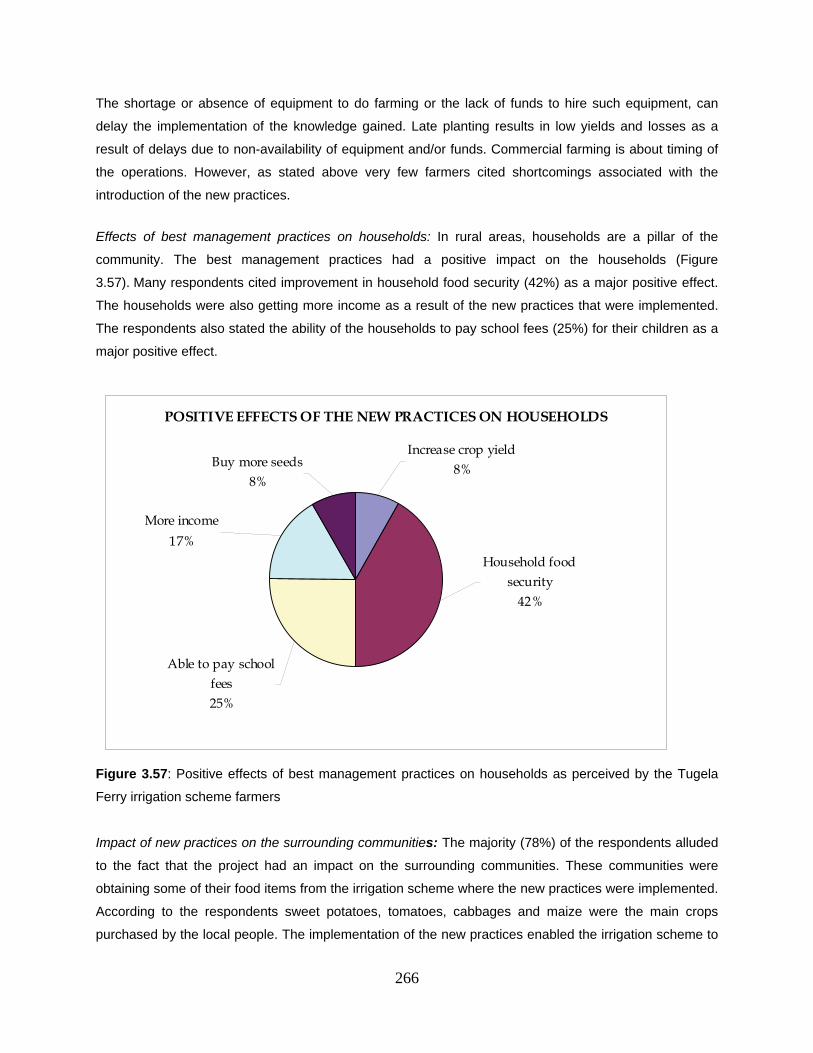
266
The shortage or absence of equipment to do farming or the lack of funds to hire such equipment, can
delay the implementation of the knowledge gained. Late planting results in low yields and losses as a
result of delays due to non-availability of equipment and/or funds. Commercial farming is about timing of
the operations. However, as stated above very few farmers cited shortcomings associated with the
introduction of the new practices.
Effects of best management practices on households: In rural areas, households are a pillar of the
community. The best management practices had a positive impact on the households (Figure
3.57). Many respondents cited improvement in household food security (42%) as a major positive effect.
The households were also getting more income as a result of the new practices that were implemented.
The respondents also stated the ability of the households to pay school fees (25%) for their children as a
major positive effect.
Figure 3.57: Positive effects of best management practices on households as perceived by the Tugela
Ferry irrigation scheme farmers
Impact of new practices on the surrounding communities: The majority (78%) of the respondents alluded
to the fact that the project had an impact on the surrounding communities. These communities were
obtaining some of their food items from the irrigation scheme where the new practices were implemented.
According to the respondents sweet potatoes, tomatoes, cabbages and maize were the main crops
purchased by the local people. The implementation of the new practices enabled the irrigation scheme to
POSITIVE EFFECTS OF THE NEW PRACTICES ON HOUSEHOLDS
Household food security
42%
Increase crop yield8%Buy more seeds
8%
More income
17%
Able to pay school fees25%
267
produce a variety of vegetables. These were usually bought by the surrounding communities. This
practice of buying locally had an impact on saving, as there was no need to spend funds for travelling to
faraway places to buy and collect products. Local production makes possible the availability of fresh
products to the surrounding communities.
Creation of employment opportunities: It is common knowledge that employment opportunities are very
scarce in rural areas as earlier mentioned in the introduction; hence the influx of job seekers to towns.
Sixty six percent (66%) of the respondents confirmed that the project was creating an employment base
for the local people. They also stated that an average of one person per plot holder was permanently
employed in the irrigation scheme. The irrigation scheme had an estimated total of 1500 plot holders. If
this figure is used as a base, it can thus be postulated that an average of 1500 people were permanently
employed in the irrigation scheme. There were also a high number of seasonal workers. Acquiring more
skills leads to increased production. One of the objectives of the project was to equip farmers with skills
and knowledge. Such skills transfer led to increased productivity. Productive farmers expanded their
operations leading to the employment of more people.
Access by non-farming communities to the scheme infrastructure: The respondents stated that the non-
farming communities had access to irrigation water, which they used for their domestic chores at no cost.
The other infrastructure that was used by the local community was the irrigation scheme roads.
Participation by non-farming communities: Sixty one percent (61%) of the respondents stated that the
non-farming communities were not involved in trials and demonstrations. However, these communities
sometimes participated in scheme meetings and Farmers’ Days. It was further noted that although the
non-farming communities were not part of the trials and demonstrations, they adopted some of the best
management practices introduced in neighbouring blocks. According to the majority of the respondents
(72 %), these communities were using the new planting practices and they were growing new and
different crops introduced by the project in the other blocks. Although they did not attend the trials and
demonstrations, the knowledge and practices demonstrated filtered through to most blocks. Block 7 was
a typical example of the diffusion of knowledge. Although there were few members of this block who
participated in the trials and demonstrations, the field observations and the Focus Group Discussions
held with members from this block revealed the implementation of a number of the new practices. Such
diffusion might be through observations or interactions with the members of other blocks that participated
in trials and demonstrations.
Other communities who benefited from the irrigation scheme: The scheme benefited many communities.
A number of hawkers, shop-owners and other buyers came from various places. These people benefited
directly from the scheme (Figure 3.58). Seventy three percent of respondents observed that the other
communities were getting food (fresh produce) from their irrigation scheme. There were also a number
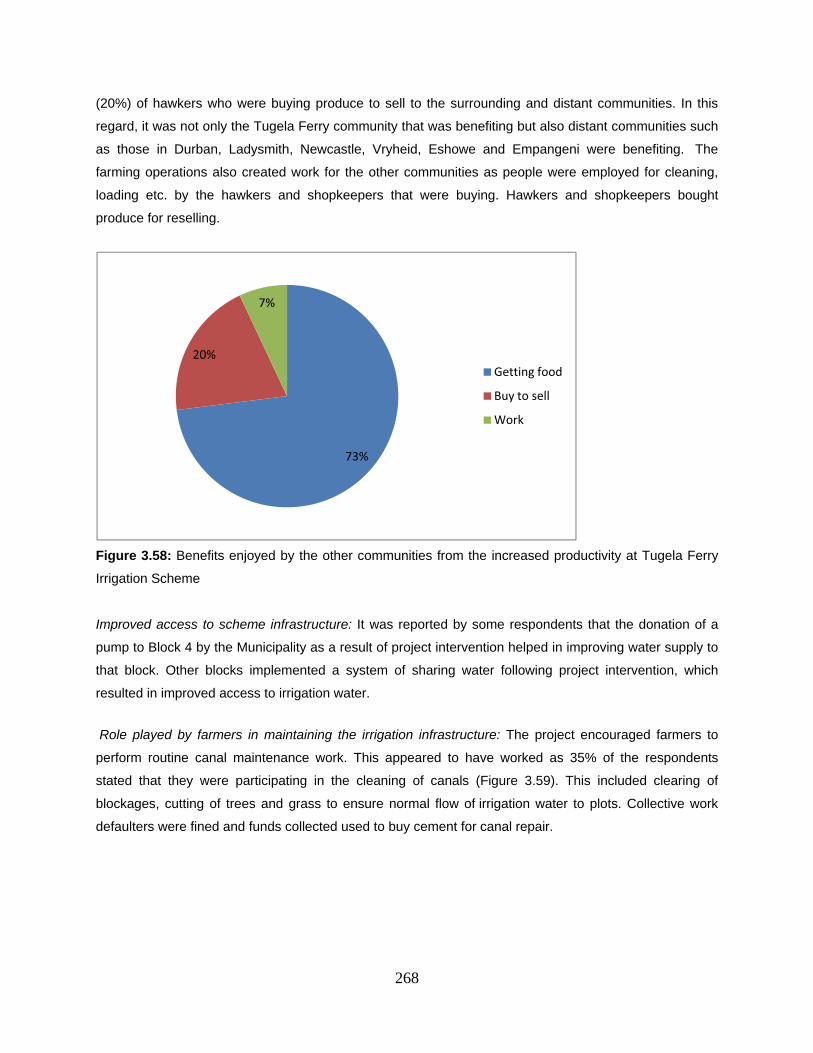
268
(20%) of hawkers who were buying produce to sell to the surrounding and distant communities. In this
regard, it was not only the Tugela Ferry community that was benefiting but also distant communities such
as those in Durban, Ladysmith, Newcastle, Vryheid, Eshowe and Empangeni were benefiting. The
farming operations also created work for the other communities as people were employed for cleaning,
loading etc. by the hawkers and shopkeepers that were buying. Hawkers and shopkeepers bought
produce for reselling.
Figure 3.58: Benefits enjoyed by the other communities from the increased productivity at Tugela Ferry
Irrigation Scheme
Improved access to scheme infrastructure: It was reported by some respondents that the donation of a
pump to Block 4 by the Municipality as a result of project intervention helped in improving water supply to
that block. Other blocks implemented a system of sharing water following project intervention, which
resulted in improved access to irrigation water.
Role played by farmers in maintaining the irrigation infrastructure: The project encouraged farmers to
perform routine canal maintenance work. This appeared to have worked as 35% of the respondents
stated that they were participating in the cleaning of canals (Figure 3.59). This included clearing of
blockages, cutting of trees and grass to ensure normal flow of irrigation water to plots. Collective work
defaulters were fined and funds collected used to buy cement for canal repair.
73%
20%
7%
Getting food
Buy to sell
Work
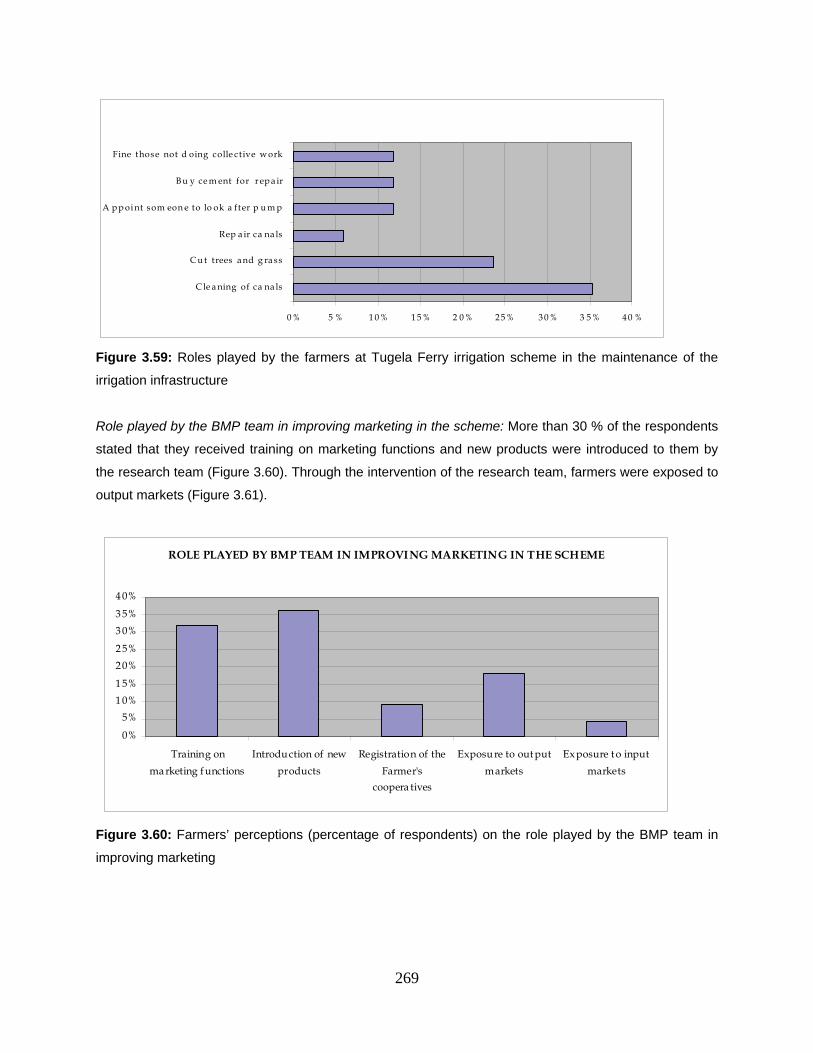
269
Figure 3.59: Roles played by the farmers at Tugela Ferry irrigation scheme in the maintenance of the
irrigation infrastructure
Role played by the BMP team in improving marketing in the scheme: More than 30 % of the respondents
stated that they received training on marketing functions and new products were introduced to them by
the research team (Figure 3.60). Through the intervention of the research team, farmers were exposed to
output markets (Figure 3.61).
Figure 3.60: Farmers’ perceptions (percentage of respondents) on the role played by the BMP team in
improving marketing
M A IN T AIN AN C E O F TH E IR R IG A TIN G IN F R A STR UC T UR E BY F AR M ER S
0 % 5 % 1 0 % 1 5 % 2 0 % 2 5 % 3 0 % 3 5 % 4 0 %
C le a ning of ca na ls
C u t trees a nd g ra ss
Rep a ir ca na ls
A p p oi nt som eon e to lo ok a fter p u m p
B u y ce m ent for r ep a ir
Fine those not d oing colle ctive work
ROLE PLAYED BY BMP TEAM IN IMPROVING MARKETING IN THE SCHEME
0%
5%
1 0%
1 5%
2 0%
2 5%
3 0%
3 5%
4 0%
Training on
ma rketing functions
Introduction of new
products
Registration of the
Farmer's
coopera tives
Exposu re to out put
markets
Exposure t o input
markets
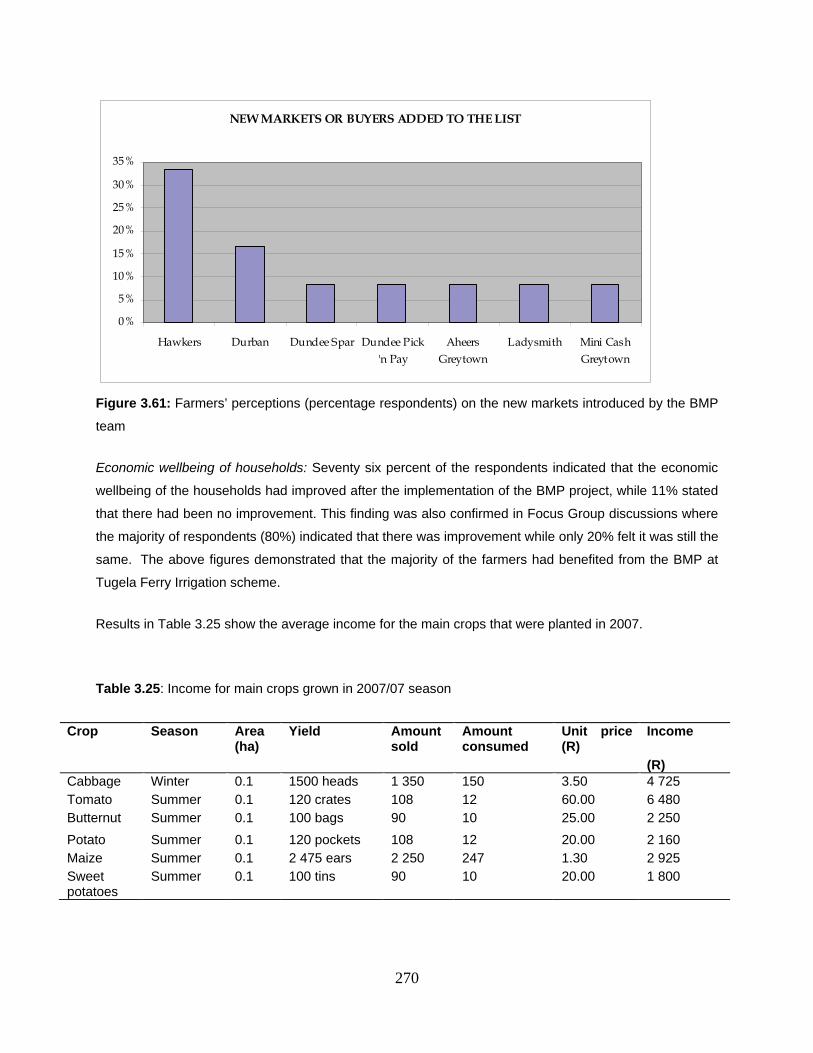
270
Figure 3.61: Farmers’ perceptions (percentage respondents) on the new markets introduced by the BMP
team
Economic wellbeing of households: Seventy six percent of the respondents indicated that the economic
wellbeing of the households had improved after the implementation of the BMP project, while 11% stated
that there had been no improvement. This finding was also confirmed in Focus Group discussions where
the majority of respondents (80%) indicated that there was improvement while only 20% felt it was still the
same. The above figures demonstrated that the majority of the farmers had benefited from the BMP at
Tugela Ferry Irrigation scheme.
Results in Table 3.25 show the average income for the main crops that were planted in 2007.
Table 3.25: Income for main crops grown in 2007/07 season
Crop Season
Area (ha)
Yield Amount sold
Amount consumed
Unit price (R)
Income
(R) Cabbage Winter 0.1 1500 heads 1 350 150 3.50 4 725 Tomato Summer 0.1 120 crates 108 12 60.00 6 480 Butternut Summer 0.1 100 bags 90 10 25.00 2 250
Potato Summer 0.1 120 pockets 108 12 20.00 2 160 Maize Summer 0.1 2 475 ears 2 250 247 1.30 2 925 Sweet potatoes
Summer 0.1 100 tins 90 10 20.00 1 800
NEW MARKETS OR BUYERS ADDED TO THE LIST
0%
5%
10%
15%
20%
25%
30%
35%
Hawkers Durban Dundee Spar Dundee Pick'n Pay
AheersGreytown
Ladysmith Mini CashGreytown
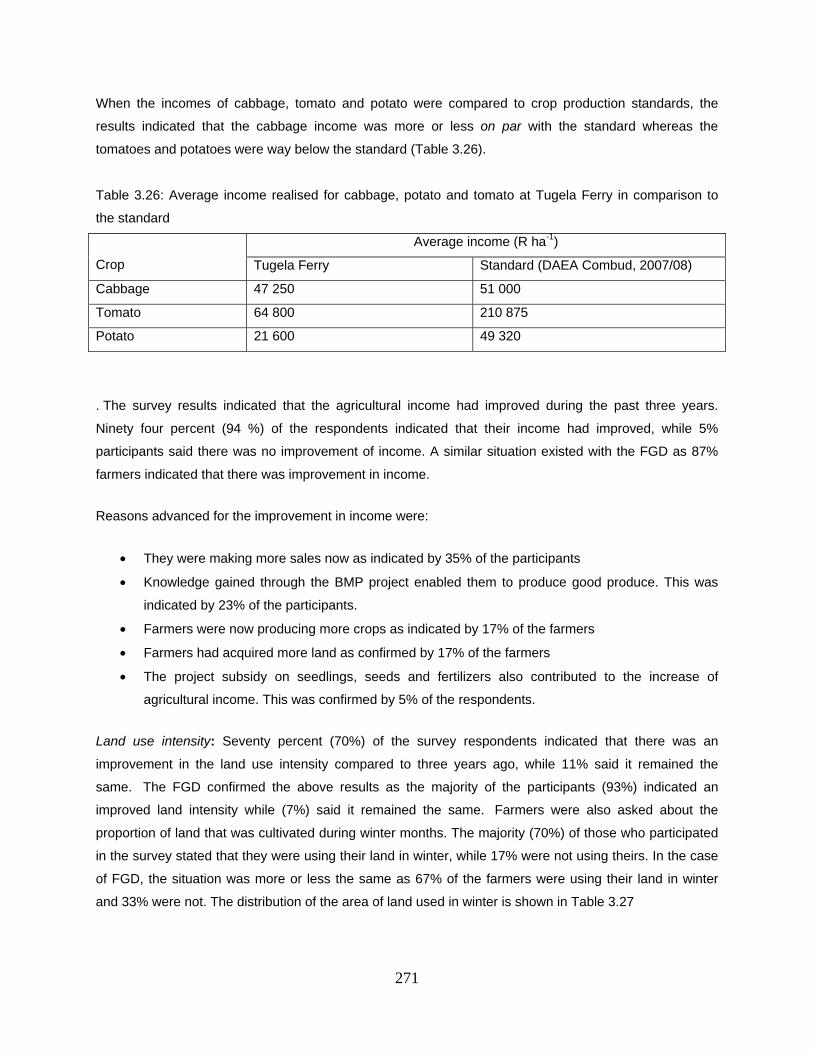
271
When the incomes of cabbage, tomato and potato were compared to crop production standards, the
results indicated that the cabbage income was more or less on par with the standard whereas the
tomatoes and potatoes were way below the standard (Table 3.26).
Table 3.26: Average income realised for cabbage, potato and tomato at Tugela Ferry in comparison to
the standard
Crop
Average income (R ha-1)
Tugela Ferry Standard (DAEA Combud, 2007/08)
Cabbage 47 250 51 000
Tomato 64 800 210 875
Potato 21 600 49 320
. The survey results indicated that the agricultural income had improved during the past three years.
Ninety four percent (94 %) of the respondents indicated that their income had improved, while 5%
participants said there was no improvement of income. A similar situation existed with the FGD as 87%
farmers indicated that there was improvement in income.
Reasons advanced for the improvement in income were:
They were making more sales now as indicated by 35% of the participants
Knowledge gained through the BMP project enabled them to produce good produce. This was
indicated by 23% of the participants.
Farmers were now producing more crops as indicated by 17% of the farmers
Farmers had acquired more land as confirmed by 17% of the farmers
The project subsidy on seedlings, seeds and fertilizers also contributed to the increase of
agricultural income. This was confirmed by 5% of the respondents.
Land use intensity: Seventy percent (70%) of the survey respondents indicated that there was an
improvement in the land use intensity compared to three years ago, while 11% said it remained the
same. The FGD confirmed the above results as the majority of the participants (93%) indicated an
improved land intensity while (7%) said it remained the same. Farmers were also asked about the
proportion of land that was cultivated during winter months. The majority (70%) of those who participated
in the survey stated that they were using their land in winter, while 17% were not using theirs. In the case
of FGD, the situation was more or less the same as 67% of the farmers were using their land in winter
and 33% were not. The distribution of the area of land used in winter is shown in Table 3.27
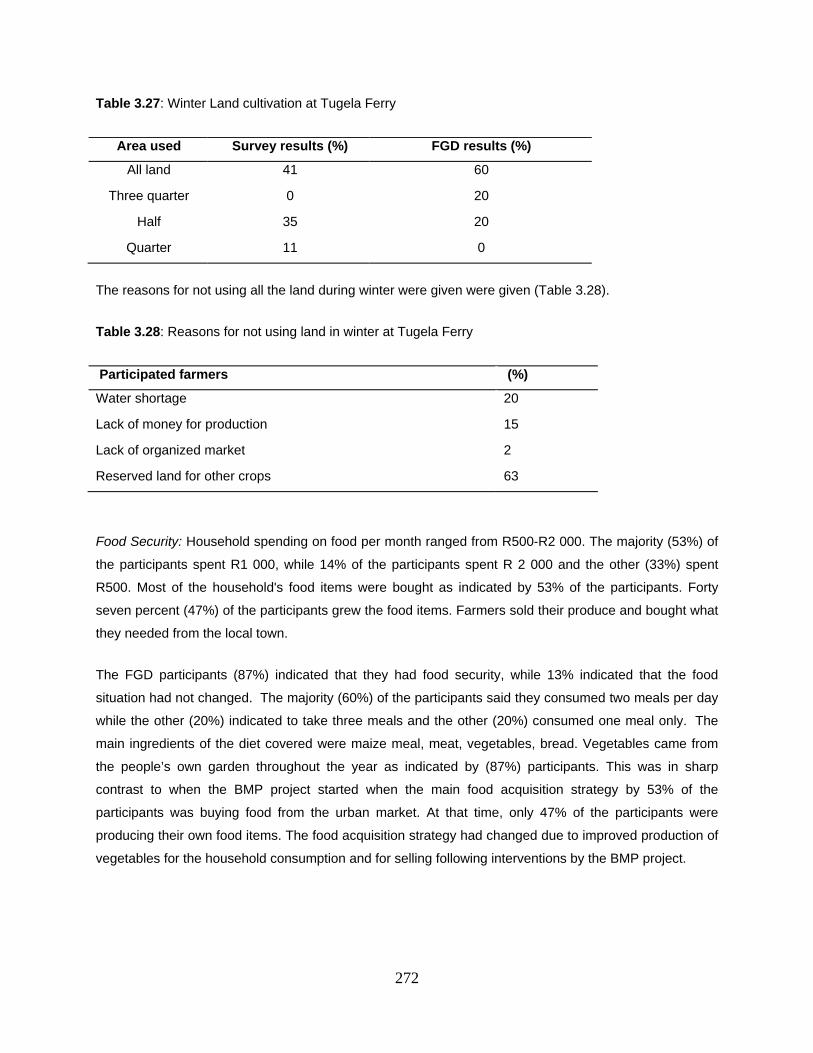
272
Table 3.27: Winter Land cultivation at Tugela Ferry
Area used Survey results (%) FGD results (%)
All land 41 60
Three quarter 0 20
Half 35 20
Quarter 11 0
The reasons for not using all the land during winter were given were given (Table 3.28).
Table 3.28: Reasons for not using land in winter at Tugela Ferry
Participated farmers (%)
Water shortage 20
Lack of money for production 15
Lack of organized market 2
Reserved land for other crops 63
Food Security: Household spending on food per month ranged from R500-R2 000. The majority (53%) of
the participants spent R1 000, while 14% of the participants spent R 2 000 and the other (33%) spent
R500. Most of the household's food items were bought as indicated by 53% of the participants. Forty
seven percent (47%) of the participants grew the food items. Farmers sold their produce and bought what
they needed from the local town.
The FGD participants (87%) indicated that they had food security, while 13% indicated that the food
situation had not changed. The majority (60%) of the participants said they consumed two meals per day
while the other (20%) indicated to take three meals and the other (20%) consumed one meal only. The
main ingredients of the diet covered were maize meal, meat, vegetables, bread. Vegetables came from
the people’s own garden throughout the year as indicated by (87%) participants. This was in sharp
contrast to when the BMP project started when the main food acquisition strategy by 53% of the
participants was buying food from the urban market. At that time, only 47% of the participants were
producing their own food items. The food acquisition strategy had changed due to improved production of
vegetables for the household consumption and for selling following interventions by the BMP project.
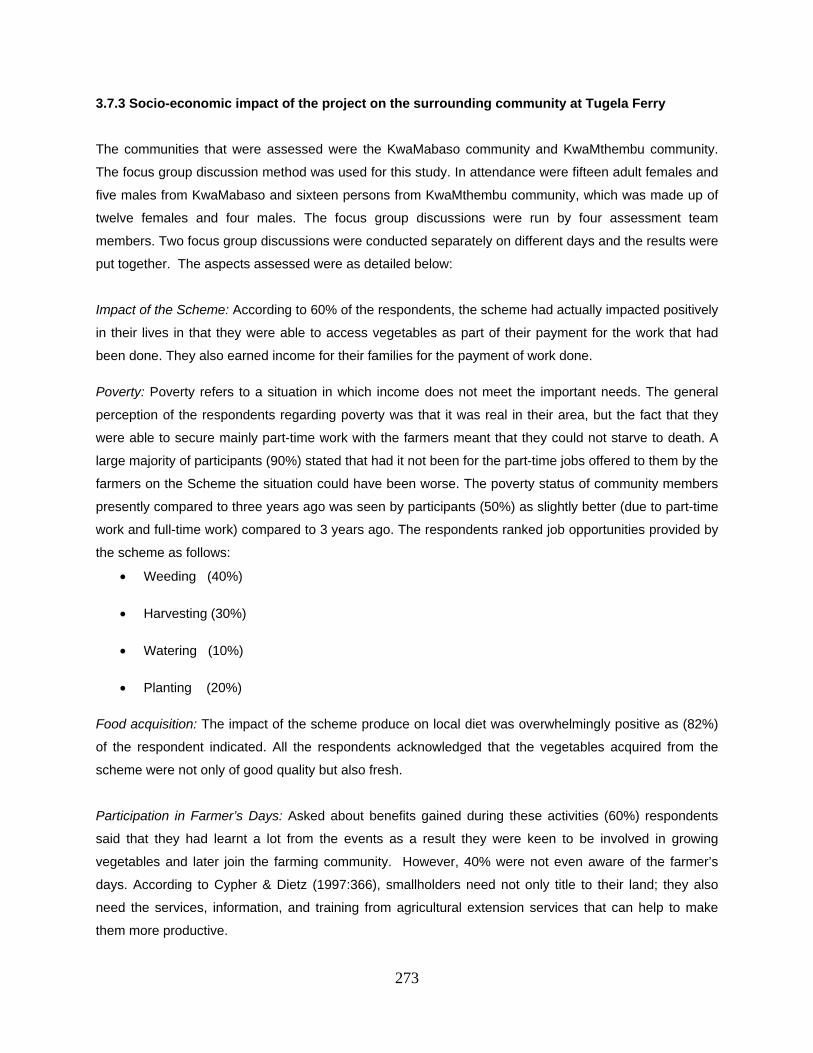
273
3.7.3 Socio-economic impact of the project on the surrounding community at Tugela Ferry
The communities that were assessed were the KwaMabaso community and KwaMthembu community.
The focus group discussion method was used for this study. In attendance were fifteen adult females and
five males from KwaMabaso and sixteen persons from KwaMthembu community, which was made up of
twelve females and four males. The focus group discussions were run by four assessment team
members. Two focus group discussions were conducted separately on different days and the results were
put together. The aspects assessed were as detailed below:
Impact of the Scheme: According to 60% of the respondents, the scheme had actually impacted positively
in their lives in that they were able to access vegetables as part of their payment for the work that had
been done. They also earned income for their families for the payment of work done.
Poverty: Poverty refers to a situation in which income does not meet the important needs. The general
perception of the respondents regarding poverty was that it was real in their area, but the fact that they
were able to secure mainly part-time work with the farmers meant that they could not starve to death. A
large majority of participants (90%) stated that had it not been for the part-time jobs offered to them by the
farmers on the Scheme the situation could have been worse. The poverty status of community members
presently compared to three years ago was seen by participants (50%) as slightly better (due to part-time
work and full-time work) compared to 3 years ago. The respondents ranked job opportunities provided by
the scheme as follows:
Weeding (40%)
Harvesting (30%)
Watering (10%)
Planting (20%)
Food acquisition: The impact of the scheme produce on local diet was overwhelmingly positive as (82%)
of the respondent indicated. All the respondents acknowledged that the vegetables acquired from the
scheme were not only of good quality but also fresh.
Participation in Farmer’s Days: Asked about benefits gained during these activities (60%) respondents
said that they had learnt a lot from the events as a result they were keen to be involved in growing
vegetables and later join the farming community. However, 40% were not even aware of the farmer’s
days. According to Cypher & Dietz (1997:366), smallholders need not only title to their land; they also
need the services, information, and training from agricultural extension services that can help to make
them more productive.
274
3.7.4 Socio-economic impact of the Tugela Ferry Irrigation project to the key buyers of vegetables
Farmers were asked who the main buyers of their vegetables were. The research team undertook the
task of carrying out interviews with key buyers (markets and hawkers). The focus of the interviews was
on produce that they are buying from the scheme, the benefits and institutional arrangements that exist
between the buyers and the farmers of the scheme. The key interviewed buyers were from the following
towns Tugela Ferry town, Greytown and Pomoroy. These buyers included the chain stores – namely
Spar, Aheers, Mini market and hawkers. The investigation focused on the following issues:
products bought,
quantities
quality issues (any improvement)
find out if buyers are happy(in terms of quality, prices, time of harvest, delays),
areas that needed improvement
what needs to be done in future,
institutional arrangements
The majority (23) of local hawkers or respondents were interviewed face to face while outside
respondents (4 hawkers) were telephoned. The five vegetable supermarkets in the surrounding areas
were also interviewed in person. The hawkers who bought vegetables from the scheme were divided into
two groups. There were outside hawkers who came with vehicles to buy vegetables and the local ones
who sold vegetables along the road and at Tugela Ferry town.
Supermarkets: The research team held interviews with the following supermarkets or chain stores:
Spar and Keats Drift Trading in Tugela Ferry
M & H Trading in Pomeroy, and
Aheers and Mini market in Greytown.
It was pleasing to note that five of the local stores had started to have marketing interactions with the
chain stores. The five supermarkets confirmed their desire to support the Tugela Ferry farmers by buying
their produce but they stated the following problems which they had encountered with the Tugela Ferry
farmers: Tugela Ferry farmers are very insignificant to them as they buy from them when they bring their
produce on certain days. The stores had no formal relationship with the farmers. They could not
remember even the quantities that they had bought from them, as it was always occasional. Farmers
charged very high prices for their vegetables or produce
Products: Table 3.29 shows the crops that were generally bought from the farmers producing on the Tugela Ferry irrigation scheme.
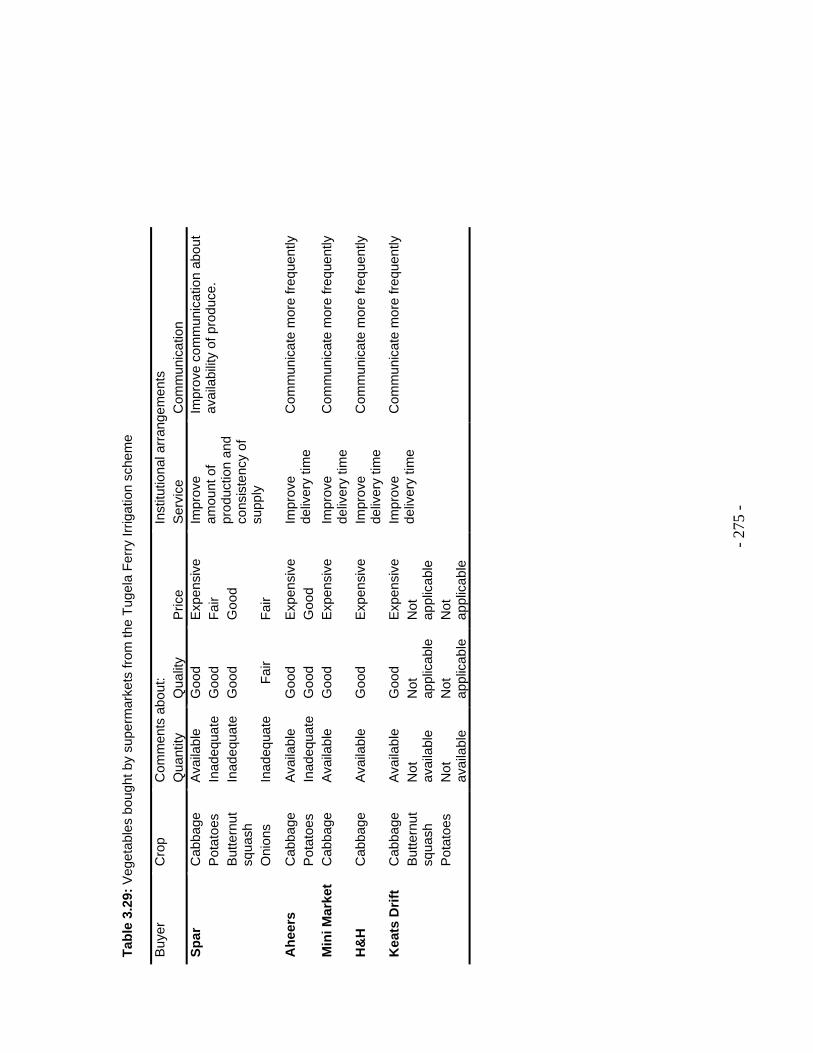
- 27
5 -
Tab
le 3
.29:
Veg
etab
les
boug
ht b
y su
perm
arke
ts fr
om th
e T
ugel
a F
erry
Irrig
atio
n sc
hem
e B
uyer
C
rop
Com
men
ts a
bout
: In
stitu
tiona
l arr
ange
men
ts
Qua
ntity
Q
ualit
y P
rice
Ser
vice
C
omm
unic
atio
n S
par
C
abba
ge
Ava
ilabl
e G
ood
Exp
ensi
ve
Impr
ove
amou
nt o
f pr
oduc
tion
and
cons
iste
ncy
of
supp
ly
Impr
ove
com
mun
icat
ion
abou
t av
aila
bilit
y of
pro
duce
.
P
otat
oes
Inad
equa
te
Goo
d F
air
B
utte
rnut
sq
uash
In
adeq
uate
G
ood
Goo
d
O
nion
s In
adeq
uate
Fai
r F
air
Ah
eers
C
abba
ge
Ava
ilabl
e G
ood
Exp
ensi
ve
Impr
ove
deliv
ery
time
Com
mun
icat
e m
ore
freq
uent
ly
Pot
atoe
s In
adeq
uate
G
ood
Goo
d M
ini M
arke
t C
abba
ge
Ava
ilabl
e G
ood
Exp
ensi
ve
Impr
ove
deliv
ery
time
Com
mun
icat
e m
ore
freq
uent
ly
H&
H
Cab
bage
A
vaila
ble
Goo
d E
xpen
sive
Im
prov
e de
liver
y tim
e C
omm
unic
ate
mor
e fr
eque
ntly
Kea
ts D
rift
C
abba
ge
Ava
ilabl
e G
ood
Exp
ensi
ve
Impr
ove
deliv
ery
time
Com
mun
icat
e m
ore
freq
uent
ly
B
utte
rnut
sq
uash
N
ot
avai
labl
e N
ot
appl
icab
le
Not
ap
plic
able
Pot
atoe
s N
ot
avai
labl
e N
ot
appl
icab
le
Not
ap
plic
able
276
One of the buyers indicated his experience with the Tugela Ferry farmers as very difficult to handle as he
specifically pointed out that the farmers had been selling cabbage at R4.00 per head, which for him was
very expensive because he would end up selling it at R4.50 to the consumers which in his view was
unfair considering the fact that population in the area were dependent on monthly grants from the
government. As a result, he opted to buy the cabbage from Muden irrigation scheme, which was fair at
R2.00 and in turn sold at R3.50.
The Hawkers: The main buyers of vegetables at Tugela Ferry irrigation scheme were the hawkers. The
hawkers (90%) indicated that the scheme had managed to supply them with a variety of vegetables which
were sold to the public. When it came to quality, 80% of the respondents indicated that they were happy
with quality of vegetables while the other 20% said the quality was not good as some of the produce
which they bought was not of standard in terms of size and freshness. They, however, complained that
the vegetables were often overpriced.
3.7.5 Conclusions and recommendations
It is concluded that the project had a positive impact on the community of Tugela Ferry and the Msinga
location in general. Investigations into the constraints related to institutional arrangements, socio-
economic factors and crop management factors were successful and resulted in certain improvements,
such as (i) the capacity of farmers and extension officers in identification of problems and solutions, (ii)
ability of farmers to plan and execute crop trials from which lessons were learnt, improvement of record
keeping capacity for farmers and (iv) development of a Water Users Association to address major
institutional arrangements on the irrigation scheme and the surrounding areas.
However, there is still a lot of work to be done to make sure that the effect of this project is felt for a long
time. Some of the key recommendations are listed below.
3.7.5.1 Water management
An in-depth description of water management at both Tugela Ferry is presented in section 3.5 of this
report. From the social perspective, the emphasis was on training farmers to improve institutional
arrangements for water management.
The following aspects are key for success:
Maintenance of irrigation furrows: Efficient movement of water from block to block, field to field,
plot to plot and within a plot, from row to row is dependent on clean furrows that are free of
impediments. Water movement can be impeded by soil/mud, weeds or other objects left in the
furrows. During regular meetings and training on institutional arrangements, it emerged that the
277
best solution to maintenance of furrows was direct participation by farmers in cleaning the furrows
at regular intervals.
Land preparation: Under any crop production system, it is important to make the most of available
water for crop growth and ultimate yield production. Tugela Ferry farmers had to be taught the
importance of preparing land so that weeds do not compete with crops for water.
Correct planting: Planting density influences the amount of water required per unit cropping land
area. Farmers were taught spacing of their crops to achieve optimum yield under suboptimal
water availability conditions.
Irrigation scheduling: To make the most of available water, farmers were taught to schedule
irrigation so that most irrigation occurs when there is less evaporation (early in the morning or
evening). Reducing the number of farmers applying water at the same time means that water flow
in the furrows will be faster, minimizing the risks of seepage and evaporation.
3.7.5.2 Crop production
A key strategy in designing sustainable agricultural systems is to restore crop diversity and optimize
resource utilisation. At the start of this project, situation analysis revealed that although Tugela Ferry
farmers used different crops, there was a strong tendency to monoculture and less diversification in time
and space. Diversity can be enhanced in time through crop rotations and sequences in time and space in
the form of cover crops, intercropping, and where livestock are part of the system, agroforestry
crop/livestock mixtures are also important. Crop diversification also achieves pest regulation and less
dependence on external outputs. That approach to production is referred to as sustainable agriculture. It
requires a balance of productivity, economics and ecological stability.

278
References
ALTIERI, M.A. 1998. Agroecology: The science of sustainable agriculture, 2nd edition. Intermediate Technology Publications, London, UK. BAYLISS-SMITH, T.P. 1982. The ecology of agricultural sytems. Cambridge University Press, London, UK. BEMBRIDGE, T.J. 1986. Problems and lessons from irrigation projects in less developed countries of Africa. Development Southern Africa 3(4):600-618.
BEWICK, T.A. 1994. Squashes: Uses and production. Horticultural Sciences Department Fact Sheet HS-
721. Florida Cooperative Extension Service, Institute of Food and Agricultural Sciences, University of
Florida.
CAMP, K. G.T. 1999. The Bioresource units of KwaZulu-Natal. Cedara Report
N/A/95/32. KwaZulu-Natal Department of Agriculture and Environmental Affairs, Pietermaritzburg.
CARNEY, D. 1998. Implementing the sustainable rural livelihood approach. In: D. Carney (eds.)
Sustainable Rural Livelihoods: What Contribution Can We Make? Department for International
Development: London
CARTER, M.R. & MAY J. 1997, Poverty, livelihood and class in rural South Africa. Department of
Agricultural & Applied Economics, University of Wisconsin, Madison, WI, U.S.A. Staff Paper Series, No.
408: 32 pp.
CHAMBERS, R. & CONWAY G. 1992. Sustainable rural livelihoods: Practical concepts for the 21st
Century. IDS Discussion Paper, No. 269. Sussex: Institute of Development Studies.
CONROY, C., THAKUR, Y. & VADHER, M. 2002. The efficacy of participatory development of
technologies: experiences with resource-poor goat- keepers in India. Livestock Research for Rural
Development. 14 (3).
CONWAY, G.R. & BARBIER, E.B. 1990. After the Green Revolution: Sustainable Agriculture for
Development. London, Earthscan Publications.
CYPHER, J.M. & DIETZ, J.L. 1997. The process of economic development. Routledge, London and New York.
279
EASTIN, J.D. & SULLIVAN, C.Y. 1984. Environmental stress influences on plant persistence, physiology
and production, pp. 201-233. In M.B. Tesar (ed.) Physiological basis of crop growth and development.
American Society of Agronomy, Crop Science Society of America: Madison, WI, USA.
ELDIS PARTICIPATION RESOURCE GUIDE: Participatory Monitoring and Evaluation
http://www.eldis.org/participation/pme/ (13 March 2006).
ELLIS, F. 1999. Rural livelihood diversity in developing countries: Evidence and policy implications. ODI
Natural Perspectives, No. 40. London: The Oveseas Development Institute.
ELLIS, F. 2000. Livelihoods and Diversity in Developing Countries. Oxford:
Oxford University Press: London
FALKENMARK, M. 1995. Land-water linkages: a synopsis. In: FAO Land and Water Bulletin 1. Land and
water integration and river basin management: Rome, Italy.
FAO/IIASA, 1991. Agro-Ecological Land Resources Assessment for Agricultural Development Planning:
A Case Study of Kenya: Resources Database and Land Productivity. Main Report and 8 Technical
Annexes, Vol. 9. pp. 1150. AGL-FAO: Rome.
FARRINGTON, J., D. CARNEY, C. ASHLEY & TURTON C.1999. Sustainable livelihoods in practice:
early application of concepts in rural areas. ODI Natural Resource Perspectives. No. 42. London: The
Overseas Development Institute.
GOLDSMITH, E. B. 1996. Resource Management for Individuals and Families. West Publishing
Company: New York.
HAGGETT, P. 1979. Geography: a modern synthesis. Harper & Row: New York, USA. HARWOOD, R.R. 1979. Small farm development: understsnading and improving farming systems in the humid tropics. Westview Press,: Boulder.
HALL, A.E. 2001. Crop responses to environment. CRC Press: New York, USA.
HORNE, P. & STUR, W. 2005. Participatory technology development (PTD). Food and Fertiliser
Technology Centre, Taipei.
HUANG, B. 2006. Plant-environment interactions. Taylor & Francis: Fl, USA.
280
ISTA (International Seed Testing Association), 1999. International rules for seed testing. Seed Science
and Technology 27: 27-31.
KHALLAFALA, A.M. 2001. Effect of Plant Density and Seed Size on Growth and Yield of Solanum Potato
in Khartoum State, Sudan. African Crop Science Journal 9: 77-82.
KNOWELS, N.R. & KNOWELS L.O. 2006. Manipulating stem number, tuber set, and yield relationships
for Northern- and Southern-grown potato seed lots. Crop Science 46:284-296.
KOEGELENBERG, F. H., BURGER, J. H., HEYNS, P. J., KLEYNHANS, E. P., LATEGAN, M. T.,
MULDER, D. J., SMAL, H. S., STIMIE, C. M., VAN DER MERVE, F.P., & VILJOEN, P. D. 2003. Irrigation
design manual. ARC-ILI, Silverton.
LEIMAR-PRICE, L. 1997. Wild plant food in agricultural environments: A study of occurrence,
management, and gathering rights in Northeast Thailand. Human Organisation, Vol. 56, No. 2: Pp. 209-
221.
LOOMIS, R.S. and CONNOR, D.J. 1996. Crop ecology: productivity and management in agricultural systems. Cambridge University Press, Cambridge, UK.
MAY, J., CARTER M. & POSEL. D. 1995. The Composition and Persistence of Poverty in Rural South
Africa: An Entitlement Approach. A research paper commissioned by the Land and Agriculture Policy
Centre undertaken by Data Research Africa. (Unpublished paper).
MAZIBUKO T.G. & MODI A.T. 2005. Comparison of osmopriming and seed coating with calcium salts for
green bean performance under field conditions. I. Cotyledonal cracking. South African Journal of Plant
and Soil 22:9-15.
MEYER, J.R., CAMPBELL, C.L., MOSER, T.J., HESS, G.R., RAWLINGS, J.O., PECK, S. & HECK, W.W.
1992. Indicators of the agroecological status of agroecosystems. In: McKenzie, DH., D.E. Hyatty, and V.J.
McDonald (eds), Ecological indicators Vol. I. Elseview Applied Science, London, U.K.
MODI A.T. 2004. Short term preservation of maize landrace and taro propagules using indigenous
storage methods. South African Journal of Botany 70:16-23.
MOLDEN, D., AMARASINGHE, U., BHATTARAI, M., WANG, J., & MAKIN, I. 2002. Water and food
security: background paper for the World Water Development Report. Comprehensive Assessment of
Water Management in Agriculture 2, (Draft): Colombo, Sri Lanka.
281
MONATISA, M.P. 2008. An integrated approach towards achieving efficient, effective and best
management practices in water use and optimum crop production through a water users’ association.
Masters Dissertation, University of the Free State: Bloemfontein.
MTSHALI, S.M. 2002. Household Livelihood Security in Rural KwaZulu-Natal, South Africa. PhD Thesis.
Wageningen: Wageningen University.
NEPAD (New Partnership for Africa’s development), 2003. Comprehensive Africa agriculture
development programme, African Union and NEPAD. ISBN 0-620-30700-5.
NARAYAN, D., PATEL, J. SCHAFFT, J. RADEMACHER A. &. KOCH-SCHUTTE S. 1999. Can Anyone
Hear Us? Voices from 47 Countries.Voices of the Poor, Volume 1. Washington D.C.
NIEHOF, A. & PRICE L. 2001. Rural Livelihood Systems: A Conceptual Framework. Wageningen: WU-
UPWARD Series on Rural Livelihoods, No. 1.
OVERSEAS DEVELOPMENT INSTITUTE.1985: Twenty five years in development, ODI, London, UK.
PATTON,M. 1990. Qualitative Evaluation Methods, (2nd ed,. 1990, p. 129. Newbury Park, CA: Sage
PRESTON, D.A. 1986. Potato Seed Piece Size and Spacing Survey in
the Red River Valley. Proceedings of the Washington State
Potato Conference 25: 9 -13.
RUTHENBERG, H.1980. Farming systems in the tropics. Clarendon Press: Oxford, UK.
RYKBOST, K.A. & LCKE, K.A. 1998. Effect of seed piece size on performance of three varieties.
Klamanth Experimental Station, Newsletter, Oregon State University Agricultural Research, USA.
SAXENA, N.P. 2003. Management of agricultural drought: agronomic and genetic options. Science
Publishers: Plymouth, UK.
SHOCK, M.P., SHOCK, C.C. & SHOCK, C.A. 2002. The effect of simulated hail on yield and quality of
pumpkins and two squash varieties. Information for Sustainable Agriculture. Oregon State University,
Ontario, USA.
SMITH, B. 2007. The Farming Handbook. University of KwaZulu-Natal Press: Pietermaritzburg.
282
SPEDDING C.R.W. 1975. The Biology of Agricultural Systems. Academic Press: London.
STRAUGHAN, B. 1999. Four Stages and Fours Challenges of organisational Development. In
http://www.icl.org/articles/four-stages.php (Accessed 13 March 2006).
SWIFT, J. 1989. Why are rural people vulnerable to famine? IDS Bulletin, Vol. 20, No. 2: pp. 8-15.
THORNE, D.W. & THORNE, M.D. 1979. Soil, Water and Crop Production. AVI Pub. Co., Westport.
TSUBO, M., MUKHALA, E., OGINDO, H.O.& WALKER, S. 2003. Productivity of maize-bean intercropping
in semi-arid region of South Africa. Water South Africa 29, 381-388.
VAN AVERBEKE, W. 2008. Best management practices for small-scale subsistence farming on
selected irrigation schemes and surrounding areas through participatory adaptive research in Limpopo
Province. WRC Report No TT 344/08. Water Research Commission.: Gezina.
VAN DER MEER, Q.P. 1994. Onion hybrids: Evaluation, prospects, limitations, and methods, p. 243-247.
Acta Hort. 358. Intl. Soc. Hort. Sci., The Hague: Belgium.
VAN DER STOEP, I., & NTHAI, M. M. 2005. Evaluation of the water distribution system at Dzindi
irrigation scheme. WRC Report K5/1464
VAN DER STOEP, I. & STEVENS, J.B. 2006. Best management practices for smallholder farming on two
irrigation schemes and surrounding areas in Eastern Cape and KwaZulu-Natal through participatory
adaptive research. Deliverable 6(c).WRC Report K5/1477//4.
VAN KOPPEN, C.S.A. 2000. Resource, arcadia, life world, nature concepts in
Environmental Sociology, Sociologia Ruralis, Vol. 40, No. 3: pp. 300-318.
WALKER, W.R. & SKOGERBOE, GAYLORD V.1987. Surface irrigation: Theory and practice. Prentice-Hall, Englewood Cliffs, N.J., USA.
WINROCK INTERNATIONAL 2006. Multiple uses of water: A synopsis of the literature. Margaret
McCauley and Mary Renwick
WOLF, D. L. 1991. Does father know best? A feminist critique of household strategy research. In: D.C.
Clay and H.K. Schwarzweller (eds) Research in Rural Sociology and Development: Research Annual. pp.
29-43. London: J.A. I. Press Inc.
283
4 LESSONS LEARNT FROM IMPLEMENTATION OF THE PROJECT IN
ZANYOKWE AND TUGELA FERRY IRRIGATION SCHEMES
4.1 Introduction
Small-scale irrigation schemes such as Zanyokwe and Tugela Ferry were established in South Africa with
the goal of improving and sustaining rural livelihoods by increasing crop production. Findings from studies
by Bembridge (1996, 2000) and Van Averbeke et al. (1998) show that small-scale irrigation has failed to
realize the intended goals in South Africa. According to Backeberg & Groenewald (1995), the economic
history of irrigation development in South Africa shows that success or failure of irrigation development is
related to marketing potential of agricultural products and the level of profitability of farming. However,
Shah & Van Koppen (1999) state that economic success has never been the clear and unique objective
underlying development policies for small-scale irrigation. Indeed, for many of the current farmers in
Zanyokwe, allocation of food plots at initiation of the scheme targeted subsistence food production with
the core estate farm expected to play the economic role.
Whilst it is important to understand causes of failure, it is also more important to identify and understand
success stories in small-scale irrigation at scheme and farm level and to learn from them on how best to
move small-scale irrigation forward. For example, Vaughan (1997) noted the relative success of many of
the white settlement schemes could, in part, at least, be attributed to comprehensive support and
subsidies made available to the farmers. One lesson that cuts across many studies is that successful
small-scale irrigation development should be founded on farmer management, and on participative
planning. However, reported success stories of small-scale irrigation schemes in KwaZulu-Natal were not
necessarily due to farmer control and participative planning. Vaughan (1997) noted that a feature of the
successful small-scale irrigation schemes in KwaZulu-Natal sugar industry has been a significant degree
of reliance and dependence for scheme operation and maintenance on the millers.
In this chapter, we reflect on lessons learned in implementing the BMP in Zanyokwe and Tugela Ferry
from 2005 to 2008. The lessons should benefit organisations that fund research for rural development,
researchers who do the work, government departments involved with rural development, Extension
officers, and last but not least the farmers and rural communities who are the target of development
efforts.
4.2 Lessons Learnt
4.2.1 Participatory Involvement of Stakeholders in the project
The participatory nature of the project allowed the multidisciplinary project team to work with farmers at
both schemes and other stakeholders such as the Department of Agriculture, Forestry and Fisheries
284
(DAFF) and Department of Water Affairs (DWA) in the Eastern Cape and KwaZulu-Natal in addressing
the project objectives. Collaboration with staff of the Department of Agriculture at both schemes was
instrumental in facilitating the onsite implementation of the project. Collaboration with DWA in the process
of establishing water users’ associations permitted the research teams at ZIS and TFIS to reach out to
the surrounding areas in Zanyokwe and Tugela Ferry irrigation schemes that were not involved in
irrigated farming. The lesson to be underscored here is that stakeholder participation is crucial for the
success of projects such as this one.
The research team learned that PRA and focus groups are very useful tools in studies such as these that
involve groups of farmers, regardless of the homogeneity or non-homogeneity of the groups.
4.2.2 Socio-economic lessons
Farmer organization: In 1995/96 Van Averbeke et al. (1998) identified farmer organization as a
weakness in ZIS. Ten years down the line, farmer organization has continued to be a weakness in the
management of ZIS. At the start of the project, the Zanyokwe Agricultural Development Trust (ZADT) was
the most important organisational structure at scheme level and had been established to manage the
irrigation infrastructure (Monde et al., 2005). It was made up of 12 members (trustees), two from each
village. However, it was generally ineffective in the view of most farmers.
In Tugela Ferry farmers were found largely working as individuals, but some blocks (e.g. block 4) had
block committees. Organisation of farmers occurred through the extension officers from the local district
of the Department of Agriculture and Environmental Affairs. However, farmers in both irrigation schemes
demonstrated a high capability of identifying the sociological issues relevant to their organisational and
institutional arrangements during their participatory interaction with the research team. Their inputs
contributed significantly to the organisational and institutional arrangements that have now been put in
place in the schemes following their interaction with the research team and other stakeholders. They
however, need consistent training through workshops to sharpen and apply their knowledge about
organisational and institutional arrangements.
Farmer skills: In TFIS many farmers who participated in interviews at the start of the research could read
and write Zulu. In Zanyokwe most farmers could read and write IsiXhosa and quite a number had working
knowledge of English. Literacy was not quantified in Zanyokwe but in TFIS the illiteracy rate among the
farmers was reported to exceed 80%. None of the farmers in TFIS had any formal skills in agriculture
except general awareness gained in workshops conducted by service providers in the past. However, the
farmers appeared to be reasonably skilled in the short-furrow irrigation system used on the scheme.
Farmers in Zanyokwe also had no formal training in agriculture but were reasonably skilled in the sprinkler
irrigation system used on the scheme through experience gained when most of them served as labourers
during the estate phase of the scheme.
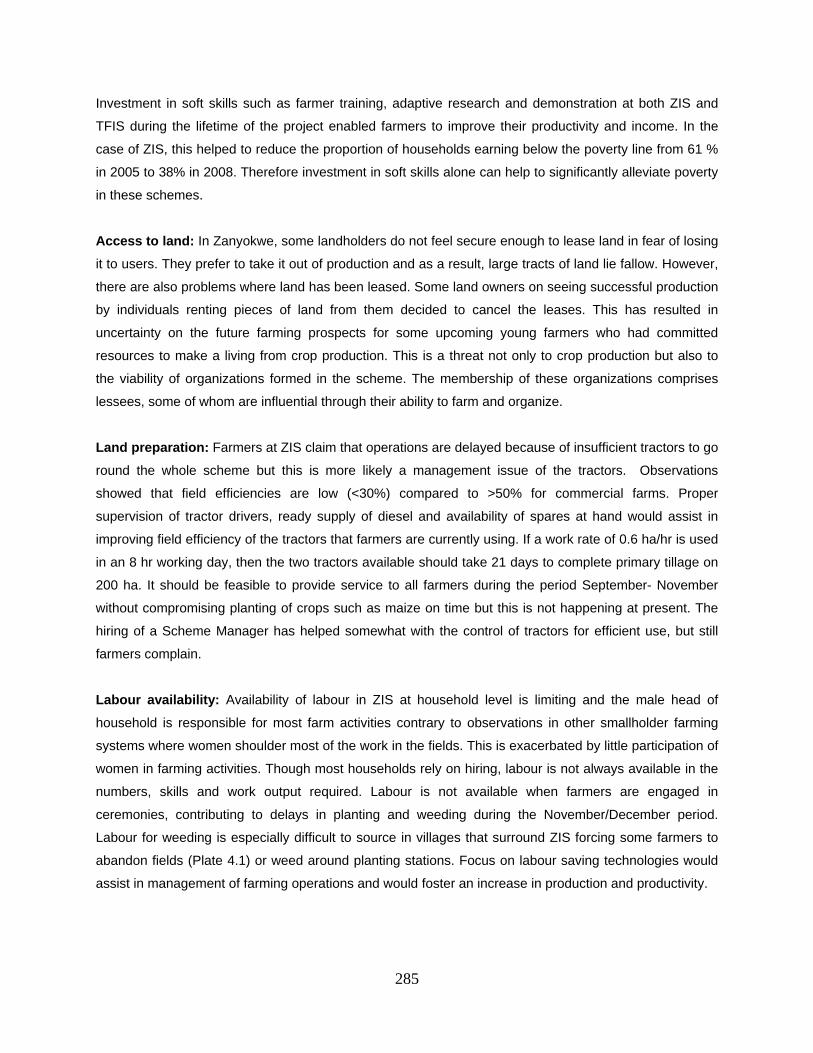
285
Investment in soft skills such as farmer training, adaptive research and demonstration at both ZIS and
TFIS during the lifetime of the project enabled farmers to improve their productivity and income. In the
case of ZIS, this helped to reduce the proportion of households earning below the poverty line from 61 %
in 2005 to 38% in 2008. Therefore investment in soft skills alone can help to significantly alleviate poverty
in these schemes.
Access to land: In Zanyokwe, some landholders do not feel secure enough to lease land in fear of losing
it to users. They prefer to take it out of production and as a result, large tracts of land lie fallow. However,
there are also problems where land has been leased. Some land owners on seeing successful production
by individuals renting pieces of land from them decided to cancel the leases. This has resulted in
uncertainty on the future farming prospects for some upcoming young farmers who had committed
resources to make a living from crop production. This is a threat not only to crop production but also to
the viability of organizations formed in the scheme. The membership of these organizations comprises
lessees, some of whom are influential through their ability to farm and organize.
Land preparation: Farmers at ZIS claim that operations are delayed because of insufficient tractors to go
round the whole scheme but this is more likely a management issue of the tractors. Observations
showed that field efficiencies are low (<30%) compared to >50% for commercial farms. Proper
supervision of tractor drivers, ready supply of diesel and availability of spares at hand would assist in
improving field efficiency of the tractors that farmers are currently using. If a work rate of 0.6 ha/hr is used
in an 8 hr working day, then the two tractors available should take 21 days to complete primary tillage on
200 ha. It should be feasible to provide service to all farmers during the period September- November
without compromising planting of crops such as maize on time but this is not happening at present. The
hiring of a Scheme Manager has helped somewhat with the control of tractors for efficient use, but still
farmers complain.
Labour availability: Availability of labour in ZIS at household level is limiting and the male head of
household is responsible for most farm activities contrary to observations in other smallholder farming
systems where women shoulder most of the work in the fields. This is exacerbated by little participation of
women in farming activities. Though most households rely on hiring, labour is not always available in the
numbers, skills and work output required. Labour is not available when farmers are engaged in
ceremonies, contributing to delays in planting and weeding during the November/December period.
Labour for weeding is especially difficult to source in villages that surround ZIS forcing some farmers to
abandon fields (Plate 4.1) or weed around planting stations. Focus on labour saving technologies would
assist in management of farming operations and would foster an increase in production and productivity.
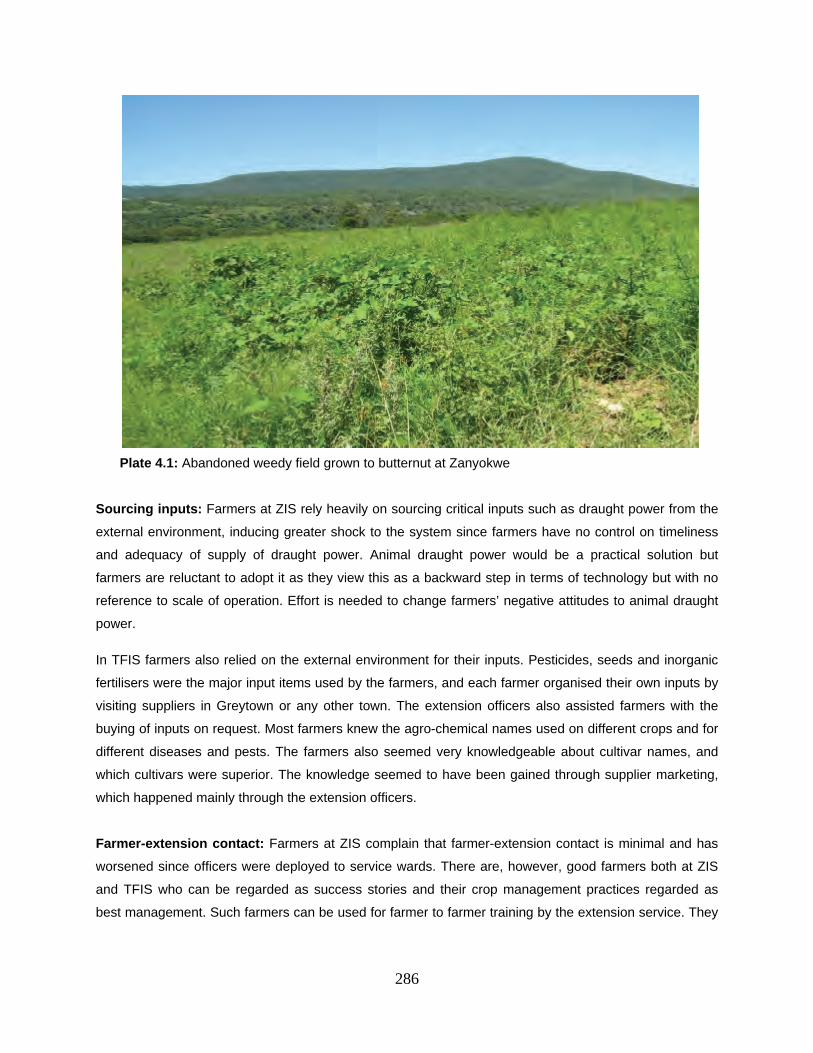
286
Plate 4.1: Abandoned weedy field grown to butternut at Zanyokwe
Sourcing inputs: Farmers at ZIS rely heavily on sourcing critical inputs such as draught power from the
external environment, inducing greater shock to the system since farmers have no control on timeliness
and adequacy of supply of draught power. Animal draught power would be a practical solution but
farmers are reluctant to adopt it as they view this as a backward step in terms of technology but with no
reference to scale of operation. Effort is needed to change farmers’ negative attitudes to animal draught
power.
In TFIS farmers also relied on the external environment for their inputs. Pesticides, seeds and inorganic
fertilisers were the major input items used by the farmers, and each farmer organised their own inputs by
visiting suppliers in Greytown or any other town. The extension officers also assisted farmers with the
buying of inputs on request. Most farmers knew the agro-chemical names used on different crops and for
different diseases and pests. The farmers also seemed very knowledgeable about cultivar names, and
which cultivars were superior. The knowledge seemed to have been gained through supplier marketing,
which happened mainly through the extension officers.
Farmer-extension contact: Farmers at ZIS complain that farmer-extension contact is minimal and has
worsened since officers were deployed to service wards. There are, however, good farmers both at ZIS
and TFIS who can be regarded as success stories and their crop management practices regarded as
best management. Such farmers can be used for farmer to farmer training by the extension service. They
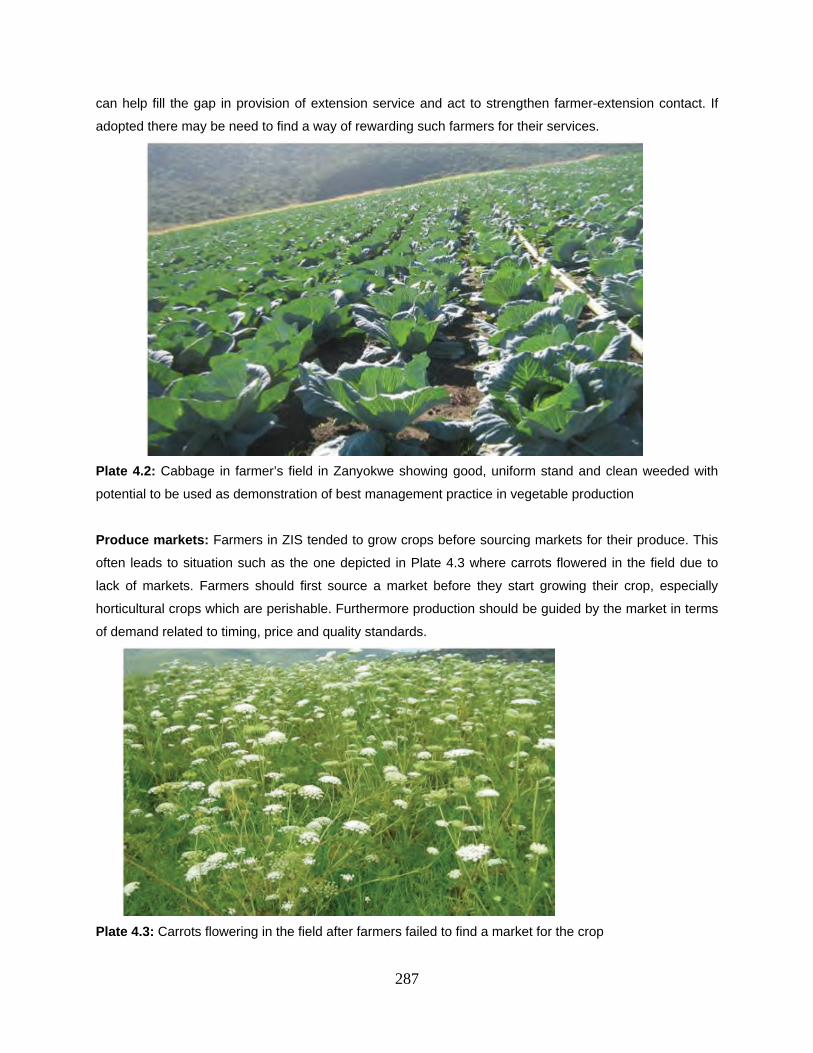
287
can help fill the gap in provision of extension service and act to strengthen farmer-extension contact. If
adopted there may be need to find a way of rewarding such farmers for their services.
Plate 4.2: Cabbage in farmer’s field in Zanyokwe showing good, uniform stand and clean weeded with
potential to be used as demonstration of best management practice in vegetable production
Produce markets: Farmers in ZIS tended to grow crops before sourcing markets for their produce. This
often leads to situation such as the one depicted in Plate 4.3 where carrots flowered in the field due to
lack of markets. Farmers should first source a market before they start growing their crop, especially
horticultural crops which are perishable. Furthermore production should be guided by the market in terms
of demand related to timing, price and quality standards.
Plate 4.3: Carrots flowering in the field after farmers failed to find a market for the crop
288
Farmers in TFIS also had problems marketing their produce. Marketing of vegetables was done mostly
‘over the fence’ whereby fresh produce was sold directly to small retailers from the nearby towns.
Individual persons also bought directly from the farms for the purposes of hawking on the streets of
Tugela Ferry and (or) at the nearby towns (e.g. Pomeroy, Keats Drift and Greytown). Some of the
farmers sold their own produce as hawkers. The farmers, however, failed to exploit the marketing
opportunities fully because they lacked basic marketing knowledge. There was also no well-defined
cooperation among the farmers and evidence of formal relations with external markets did not exist.
Collective marketing: Experience in ZIS revealed that group marketing significantly reduced transaction
costs for wholesalers and supermarkets making it possible to sustain the market linkages established with
these customers. Thus with proper training on the value chain of agricultural commodities, farmers at both
schemes can access lucrative markets that have stringent quality standards. However, only committed
farmers must be formed into groups for marketing to ensure success. Membership fees could be levied to
eliminate farmers who are not serious with farming projects.
In TFIS marketing opportunities appeared to exist locally at Tugela Ferry, and externally in the
surrounding towns, but these opportunities were not optimally exploited because farmers lacked basic
marketing knowledge. There was also no well-defined cooperation among the farmers and evidence of
formal relations with external markets did not exist. This necessitated an investigation on a marketing
strategy that allowed synergy between producers and the markets.
Rewarding excellence in small scale irrigated farming: South Africa is known for its excellent system
of rewarding excellence in performance in various spheres of life including sports, research, farming etc.
There is, however, no system of rewarding farmer performance in farming at ZIS and TFIS. Introducing
such a system (e.g. best farmer, best female farmer, best young farmer etc) at these schemes may
encourage excellence in farming and improve productivity.
4.2.3 Technical lessons (cropping and water management)
Crop production
Crop production data: Crop production data is not readily available at the farm level, making it difficult to
assess performance and establish constraints within the cropping system. Farmers should be
encouraged and assisted to maintain records as a means to assess own production to maximise returns.
Vegetable production
Misguided cultivar selection: Cultivar selection is important for good yield and quality of vegetables
produced by farmers. Cabbage is the main vegetable grown at ZIS and there are different varieties
recommended for summer and winter. Some farmers achieved poor quality by planting wrong varieties in
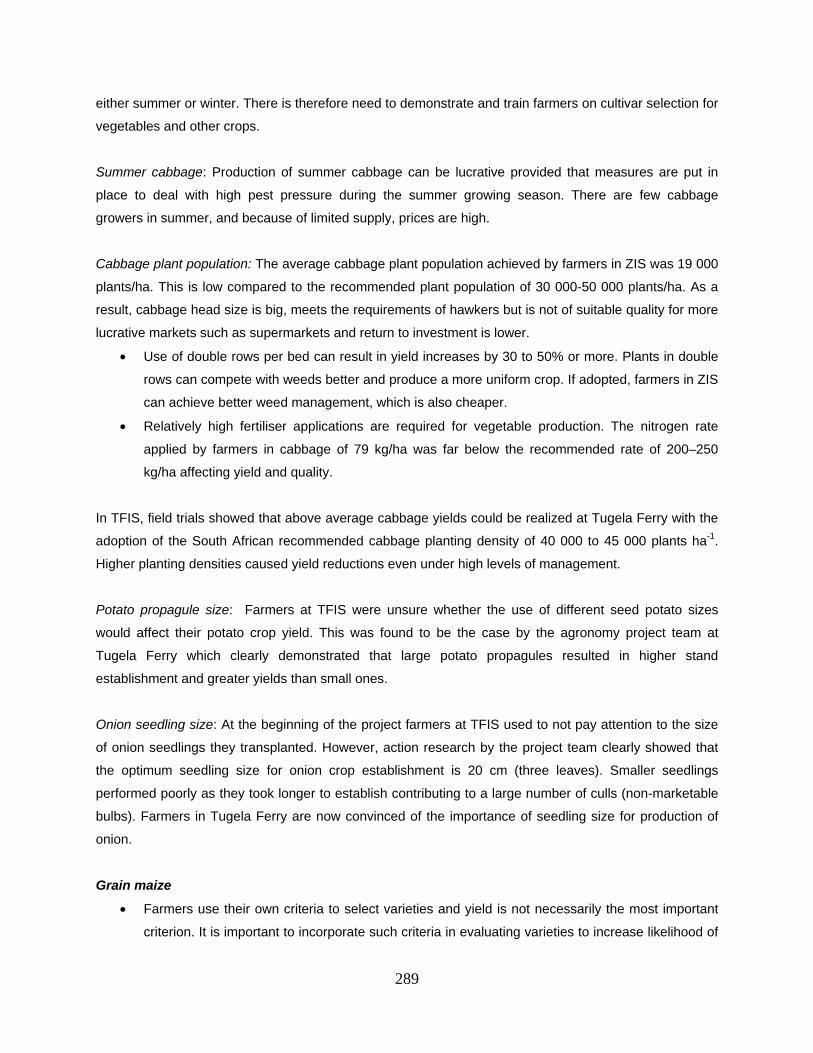
289
either summer or winter. There is therefore need to demonstrate and train farmers on cultivar selection for
vegetables and other crops.
Summer cabbage: Production of summer cabbage can be lucrative provided that measures are put in
place to deal with high pest pressure during the summer growing season. There are few cabbage
growers in summer, and because of limited supply, prices are high.
Cabbage plant population: The average cabbage plant population achieved by farmers in ZIS was 19 000
plants/ha. This is low compared to the recommended plant population of 30 000-50 000 plants/ha. As a
result, cabbage head size is big, meets the requirements of hawkers but is not of suitable quality for more
lucrative markets such as supermarkets and return to investment is lower.
Use of double rows per bed can result in yield increases by 30 to 50% or more. Plants in double
rows can compete with weeds better and produce a more uniform crop. If adopted, farmers in ZIS
can achieve better weed management, which is also cheaper.
Relatively high fertiliser applications are required for vegetable production. The nitrogen rate
applied by farmers in cabbage of 79 kg/ha was far below the recommended rate of 200–250
kg/ha affecting yield and quality.
In TFIS, field trials showed that above average cabbage yields could be realized at Tugela Ferry with the
adoption of the South African recommended cabbage planting density of 40 000 to 45 000 plants ha-1.
Higher planting densities caused yield reductions even under high levels of management.
Potato propagule size: Farmers at TFIS were unsure whether the use of different seed potato sizes
would affect their potato crop yield. This was found to be the case by the agronomy project team at
Tugela Ferry which clearly demonstrated that large potato propagules resulted in higher stand
establishment and greater yields than small ones.
Onion seedling size: At the beginning of the project farmers at TFIS used to not pay attention to the size
of onion seedlings they transplanted. However, action research by the project team clearly showed that
the optimum seedling size for onion crop establishment is 20 cm (three leaves). Smaller seedlings
performed poorly as they took longer to establish contributing to a large number of culls (non-marketable
bulbs). Farmers in Tugela Ferry are now convinced of the importance of seedling size for production of
onion.
Grain maize
Farmers use their own criteria to select varieties and yield is not necessarily the most important
criterion. It is important to incorporate such criteria in evaluating varieties to increase likelihood of
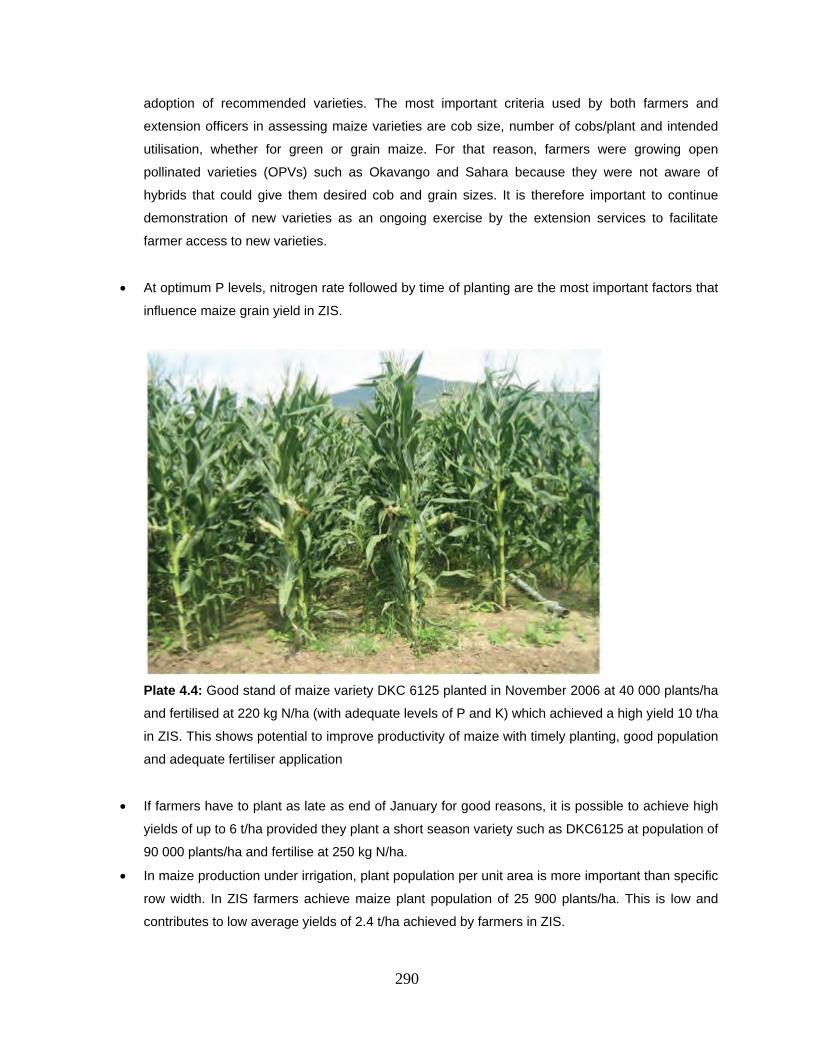
290
adoption of recommended varieties. The most important criteria used by both farmers and
extension officers in assessing maize varieties are cob size, number of cobs/plant and intended
utilisation, whether for green or grain maize. For that reason, farmers were growing open
pollinated varieties (OPVs) such as Okavango and Sahara because they were not aware of
hybrids that could give them desired cob and grain sizes. It is therefore important to continue
demonstration of new varieties as an ongoing exercise by the extension services to facilitate
farmer access to new varieties.
At optimum P levels, nitrogen rate followed by time of planting are the most important factors that
influence maize grain yield in ZIS.
Plate 4.4: Good stand of maize variety DKC 6125 planted in November 2006 at 40 000 plants/ha
and fertilised at 220 kg N/ha (with adequate levels of P and K) which achieved a high yield 10 t/ha
in ZIS. This shows potential to improve productivity of maize with timely planting, good population
and adequate fertiliser application
If farmers have to plant as late as end of January for good reasons, it is possible to achieve high
yields of up to 6 t/ha provided they plant a short season variety such as DKC6125 at population of
90 000 plants/ha and fertilise at 250 kg N/ha.
In maize production under irrigation, plant population per unit area is more important than specific
row width. In ZIS farmers achieve maize plant population of 25 900 plants/ha. This is low and
contributes to low average yields of 2.4 t/ha achieved by farmers in ZIS.
291
Late season maize varieties can be planted at high maize plant population of 60 000 plants/ha
with early planting. This population should not be considered with late planting as 40 000
plants/ha performs better. However, short season varieties can be planted at 90 000 plants/ha
regardless of planting time.
The response of maize to narrow rows is low or none at low plant densities because the decrease
in transmitted photosynthetically active radiation (PAR) between the rows is compensated by an
increase in transmitted PAR between the plants in the row. Narrow rows can only result in
increased maize yields when maize is grown at a higher population of 60 000 plants/ha or more
but not at 40 000 plants/ha or lower.
Farmers would obtain higher yields and returns by increasing population density to 60 000
plants/ha without necessarily having to change their row spacing, although narrow rows would
result in slightly higher yields and would help in weed suppression.
When maize is grown at a higher population it requires more nutrients due to increased
competition for the limited nutrients and this is irrespective of variety. DKC 6125 planted at 90 000
plants/ha achieved average yield of 5.2 t/ha when fertilised at 60 kg N/ha but yield increased to 9
t/ha with 250 kg N/ha.
Varieties differ in their response to fertiliser. If farmers want to use high rates of nitrogen it is
important to identify the most responsive varieties. PAN 6777 performed significantly better than
DKC6125 when rate of 250 kg N/ha was applied. PAN6777, a long season variety achieved
highest yield of 11 t/ha and whilst, DKC6125, a short season variety achieved 10 t/ha.
Green maize production
While the Eastern Cape Department of Agriculture has been promoting grain maize production
through the Massive Food Program, farmers prefer to grow green maize because of higher
returns achieved.
For green maize production, consumers prefer white maize varieties over yellow ones.
Crows (Corvus corax) feeding on emerging maize seedlings are a serious problem in Zanyokwe.
Under these circumstances, the use of seedlings results in better stand establishment compared
to direct seeding.
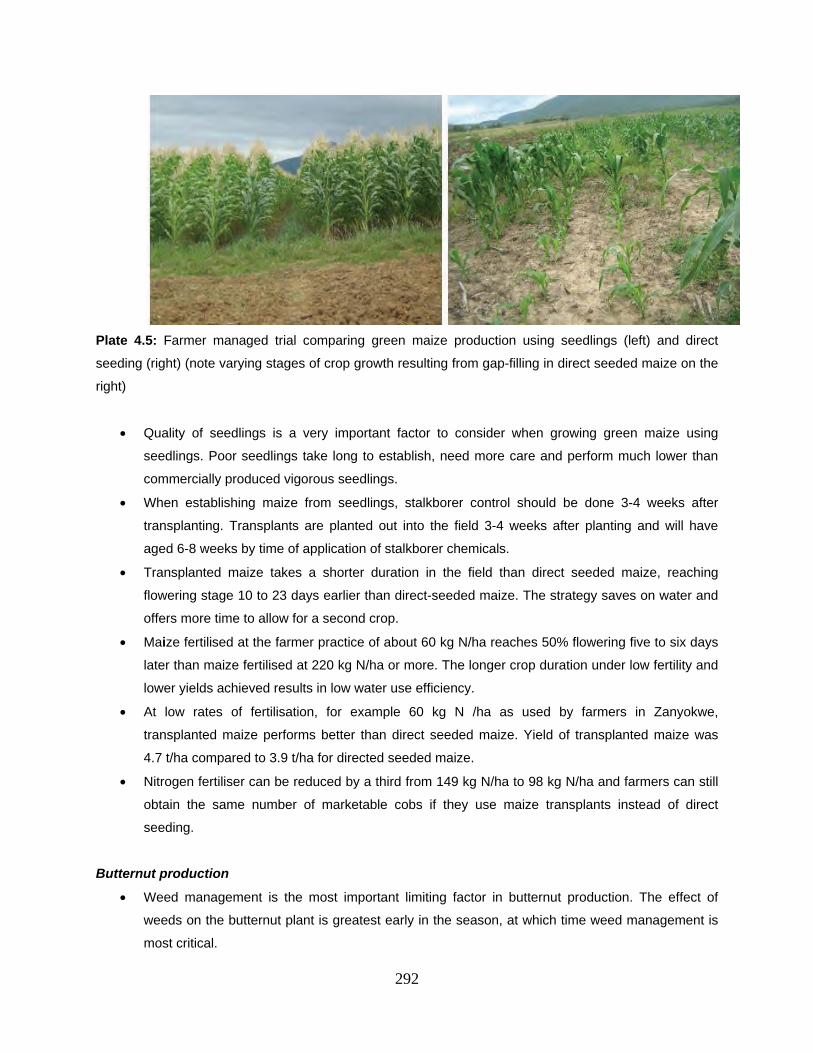
292
Plate 4.5: Farmer managed trial comparing green maize production using seedlings (left) and direct
seeding (right) (note varying stages of crop growth resulting from gap-filling in direct seeded maize on the
right)
Quality of seedlings is a very important factor to consider when growing green maize using
seedlings. Poor seedlings take long to establish, need more care and perform much lower than
commercially produced vigorous seedlings.
When establishing maize from seedlings, stalkborer control should be done 3-4 weeks after
transplanting. Transplants are planted out into the field 3-4 weeks after planting and will have
aged 6-8 weeks by time of application of stalkborer chemicals.
Transplanted maize takes a shorter duration in the field than direct seeded maize, reaching
flowering stage 10 to 23 days earlier than direct-seeded maize. The strategy saves on water and
offers more time to allow for a second crop.
Maize fertilised at the farmer practice of about 60 kg N/ha reaches 50% flowering five to six days
later than maize fertilised at 220 kg N/ha or more. The longer crop duration under low fertility and
lower yields achieved results in low water use efficiency.
At low rates of fertilisation, for example 60 kg N /ha as used by farmers in Zanyokwe,
transplanted maize performs better than direct seeded maize. Yield of transplanted maize was
4.7 t/ha compared to 3.9 t/ha for directed seeded maize.
Nitrogen fertiliser can be reduced by a third from 149 kg N/ha to 98 kg N/ha and farmers can still
obtain the same number of marketable cobs if they use maize transplants instead of direct
seeding.
Butternut production
Weed management is the most important limiting factor in butternut production. The effect of
weeds on the butternut plant is greatest early in the season, at which time weed management is
most critical.
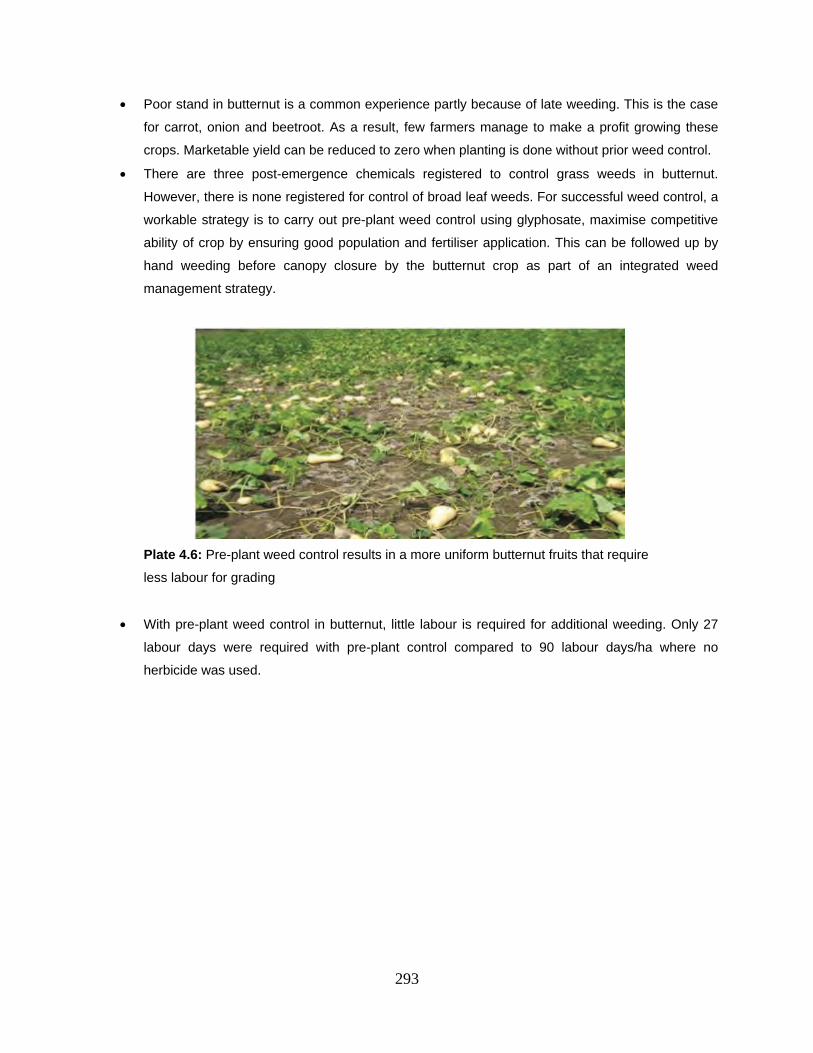
293
Poor stand in butternut is a common experience partly because of late weeding. This is the case
for carrot, onion and beetroot. As a result, few farmers manage to make a profit growing these
crops. Marketable yield can be reduced to zero when planting is done without prior weed control.
There are three post-emergence chemicals registered to control grass weeds in butternut.
However, there is none registered for control of broad leaf weeds. For successful weed control, a
workable strategy is to carry out pre-plant weed control using glyphosate, maximise competitive
ability of crop by ensuring good population and fertiliser application. This can be followed up by
hand weeding before canopy closure by the butternut crop as part of an integrated weed
management strategy.
Plate 4.6: Pre-plant weed control results in a more uniform butternut fruits that require
less labour for grading
With pre-plant weed control in butternut, little labour is required for additional weeding. Only 27
labour days were required with pre-plant control compared to 90 labour days/ha where no
herbicide was used.
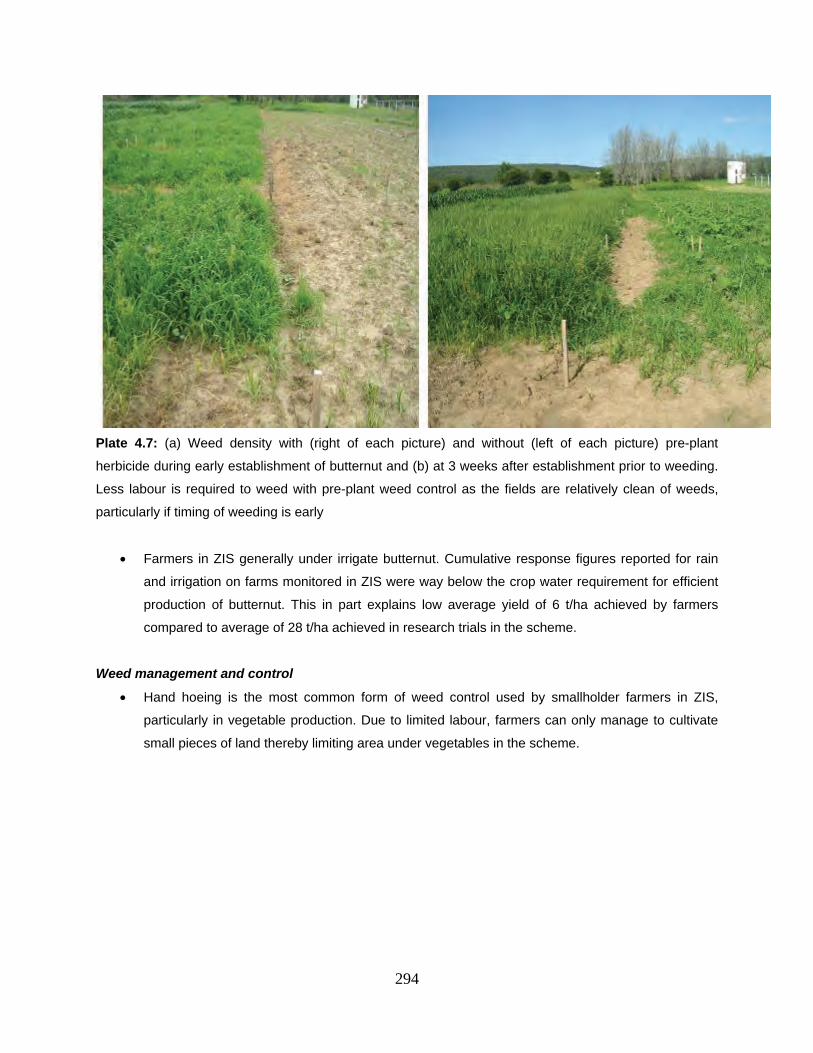
294
Plate 4.7: (a) Weed density with (right of each picture) and without (left of each picture) pre-plant
herbicide during early establishment of butternut and (b) at 3 weeks after establishment prior to weeding.
Less labour is required to weed with pre-plant weed control as the fields are relatively clean of weeds,
particularly if timing of weeding is early
Farmers in ZIS generally under irrigate butternut. Cumulative response figures reported for rain
and irrigation on farms monitored in ZIS were way below the crop water requirement for efficient
production of butternut. This in part explains low average yield of 6 t/ha achieved by farmers
compared to average of 28 t/ha achieved in research trials in the scheme.
Weed management and control
Hand hoeing is the most common form of weed control used by smallholder farmers in ZIS,
particularly in vegetable production. Due to limited labour, farmers can only manage to cultivate
small pieces of land thereby limiting area under vegetables in the scheme.
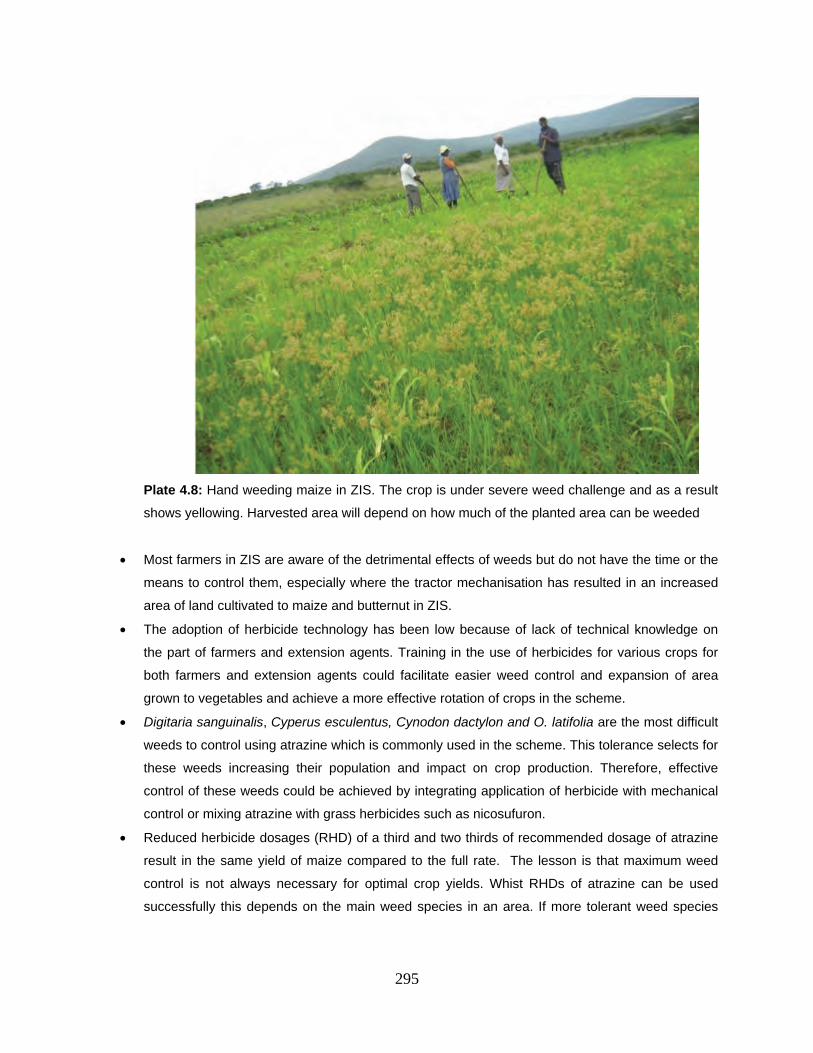
295
Plate 4.8: Hand weeding maize in ZIS. The crop is under severe weed challenge and as a result
shows yellowing. Harvested area will depend on how much of the planted area can be weeded
Most farmers in ZIS are aware of the detrimental effects of weeds but do not have the time or the
means to control them, especially where the tractor mechanisation has resulted in an increased
area of land cultivated to maize and butternut in ZIS.
The adoption of herbicide technology has been low because of lack of technical knowledge on
the part of farmers and extension agents. Training in the use of herbicides for various crops for
both farmers and extension agents could facilitate easier weed control and expansion of area
grown to vegetables and achieve a more effective rotation of crops in the scheme.
Digitaria sanguinalis, Cyperus esculentus, Cynodon dactylon and O. latifolia are the most difficult
weeds to control using atrazine which is commonly used in the scheme. This tolerance selects for
these weeds increasing their population and impact on crop production. Therefore, effective
control of these weeds could be achieved by integrating application of herbicide with mechanical
control or mixing atrazine with grass herbicides such as nicosufuron.
Reduced herbicide dosages (RHD) of a third and two thirds of recommended dosage of atrazine
result in the same yield of maize compared to the full rate. The lesson is that maximum weed
control is not always necessary for optimal crop yields. Whist RHDs of atrazine can be used
successfully this depends on the main weed species in an area. If more tolerant weed species
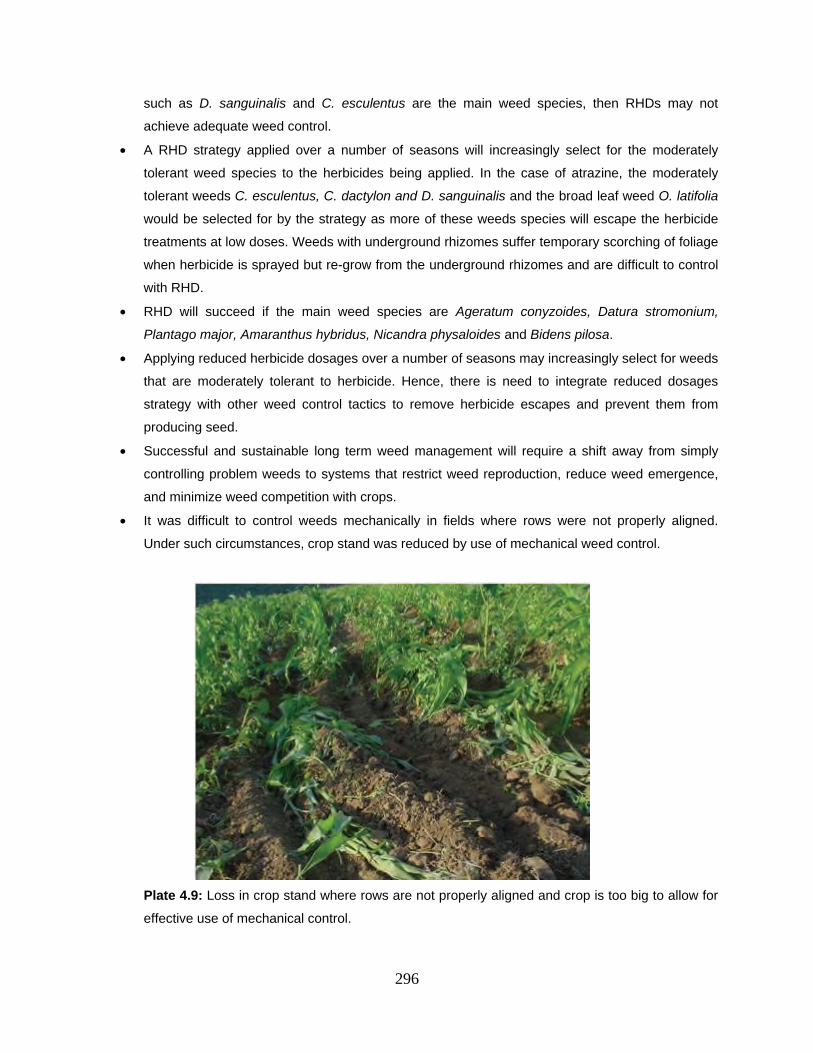
296
such as D. sanguinalis and C. esculentus are the main weed species, then RHDs may not
achieve adequate weed control.
A RHD strategy applied over a number of seasons will increasingly select for the moderately
tolerant weed species to the herbicides being applied. In the case of atrazine, the moderately
tolerant weeds C. esculentus, C. dactylon and D. sanguinalis and the broad leaf weed O. latifolia
would be selected for by the strategy as more of these weeds species will escape the herbicide
treatments at low doses. Weeds with underground rhizomes suffer temporary scorching of foliage
when herbicide is sprayed but re-grow from the underground rhizomes and are difficult to control
with RHD.
RHD will succeed if the main weed species are Ageratum conyzoides, Datura stromonium,
Plantago major, Amaranthus hybridus, Nicandra physaloides and Bidens pilosa.
Applying reduced herbicide dosages over a number of seasons may increasingly select for weeds
that are moderately tolerant to herbicide. Hence, there is need to integrate reduced dosages
strategy with other weed control tactics to remove herbicide escapes and prevent them from
producing seed.
Successful and sustainable long term weed management will require a shift away from simply
controlling problem weeds to systems that restrict weed reproduction, reduce weed emergence,
and minimize weed competition with crops.
It was difficult to control weeds mechanically in fields where rows were not properly aligned.
Under such circumstances, crop stand was reduced by use of mechanical weed control.
Plate 4.9: Loss in crop stand where rows are not properly aligned and crop is too big to allow for
effective use of mechanical control.
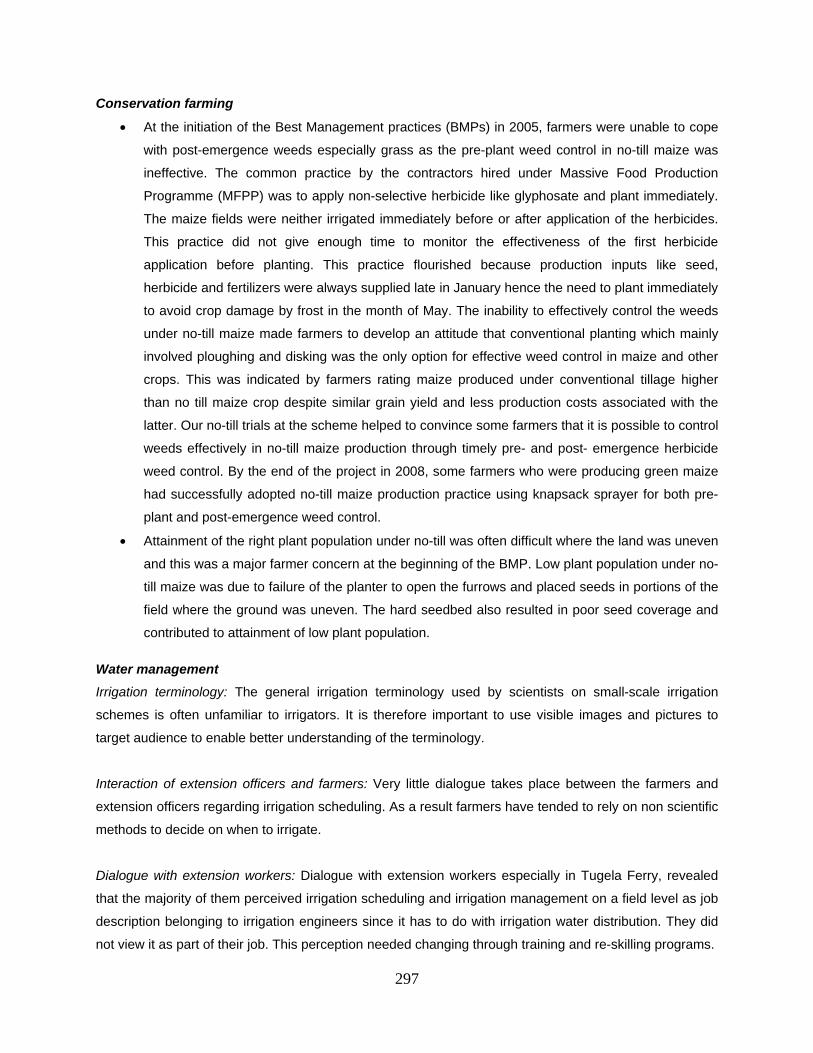
297
Conservation farming
At the initiation of the Best Management practices (BMPs) in 2005, farmers were unable to cope
with post-emergence weeds especially grass as the pre-plant weed control in no-till maize was
ineffective. The common practice by the contractors hired under Massive Food Production
Programme (MFPP) was to apply non-selective herbicide like glyphosate and plant immediately.
The maize fields were neither irrigated immediately before or after application of the herbicides.
This practice did not give enough time to monitor the effectiveness of the first herbicide
application before planting. This practice flourished because production inputs like seed,
herbicide and fertilizers were always supplied late in January hence the need to plant immediately
to avoid crop damage by frost in the month of May. The inability to effectively control the weeds
under no-till maize made farmers to develop an attitude that conventional planting which mainly
involved ploughing and disking was the only option for effective weed control in maize and other
crops. This was indicated by farmers rating maize produced under conventional tillage higher
than no till maize crop despite similar grain yield and less production costs associated with the
latter. Our no-till trials at the scheme helped to convince some farmers that it is possible to control
weeds effectively in no-till maize production through timely pre- and post- emergence herbicide
weed control. By the end of the project in 2008, some farmers who were producing green maize
had successfully adopted no-till maize production practice using knapsack sprayer for both pre-
plant and post-emergence weed control.
Attainment of the right plant population under no-till was often difficult where the land was uneven
and this was a major farmer concern at the beginning of the BMP. Low plant population under no-
till maize was due to failure of the planter to open the furrows and placed seeds in portions of the
field where the ground was uneven. The hard seedbed also resulted in poor seed coverage and
contributed to attainment of low plant population.
Water management
Irrigation terminology: The general irrigation terminology used by scientists on small-scale irrigation
schemes is often unfamiliar to irrigators. It is therefore important to use visible images and pictures to
target audience to enable better understanding of the terminology.
Interaction of extension officers and farmers: Very little dialogue takes place between the farmers and
extension officers regarding irrigation scheduling. As a result farmers have tended to rely on non scientific
methods to decide on when to irrigate.
Dialogue with extension workers: Dialogue with extension workers especially in Tugela Ferry, revealed
that the majority of them perceived irrigation scheduling and irrigation management on a field level as job
description belonging to irrigation engineers since it has to do with irrigation water distribution. They did
not view it as part of their job. This perception needed changing through training and re-skilling programs.
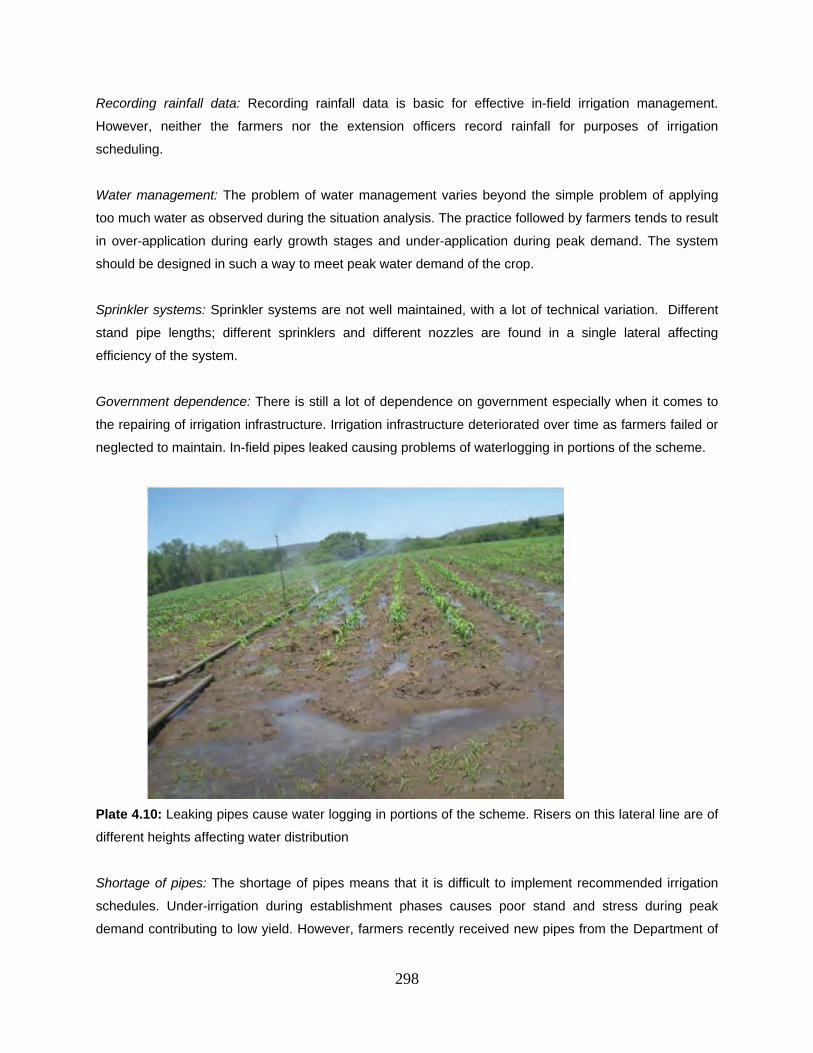
298
Recording rainfall data: Recording rainfall data is basic for effective in-field irrigation management.
However, neither the farmers nor the extension officers record rainfall for purposes of irrigation
scheduling.
Water management: The problem of water management varies beyond the simple problem of applying
too much water as observed during the situation analysis. The practice followed by farmers tends to result
in over-application during early growth stages and under-application during peak demand. The system
should be designed in such a way to meet peak water demand of the crop.
Sprinkler systems: Sprinkler systems are not well maintained, with a lot of technical variation. Different
stand pipe lengths; different sprinklers and different nozzles are found in a single lateral affecting
efficiency of the system.
Government dependence: There is still a lot of dependence on government especially when it comes to
the repairing of irrigation infrastructure. Irrigation infrastructure deteriorated over time as farmers failed or
neglected to maintain. In-field pipes leaked causing problems of waterlogging in portions of the scheme.
Plate 4.10: Leaking pipes cause water logging in portions of the scheme. Risers on this lateral line are of
different heights affecting water distribution
Shortage of pipes: The shortage of pipes means that it is difficult to implement recommended irrigation
schedules. Under-irrigation during establishment phases causes poor stand and stress during peak
demand contributing to low yield. However, farmers recently received new pipes from the Department of
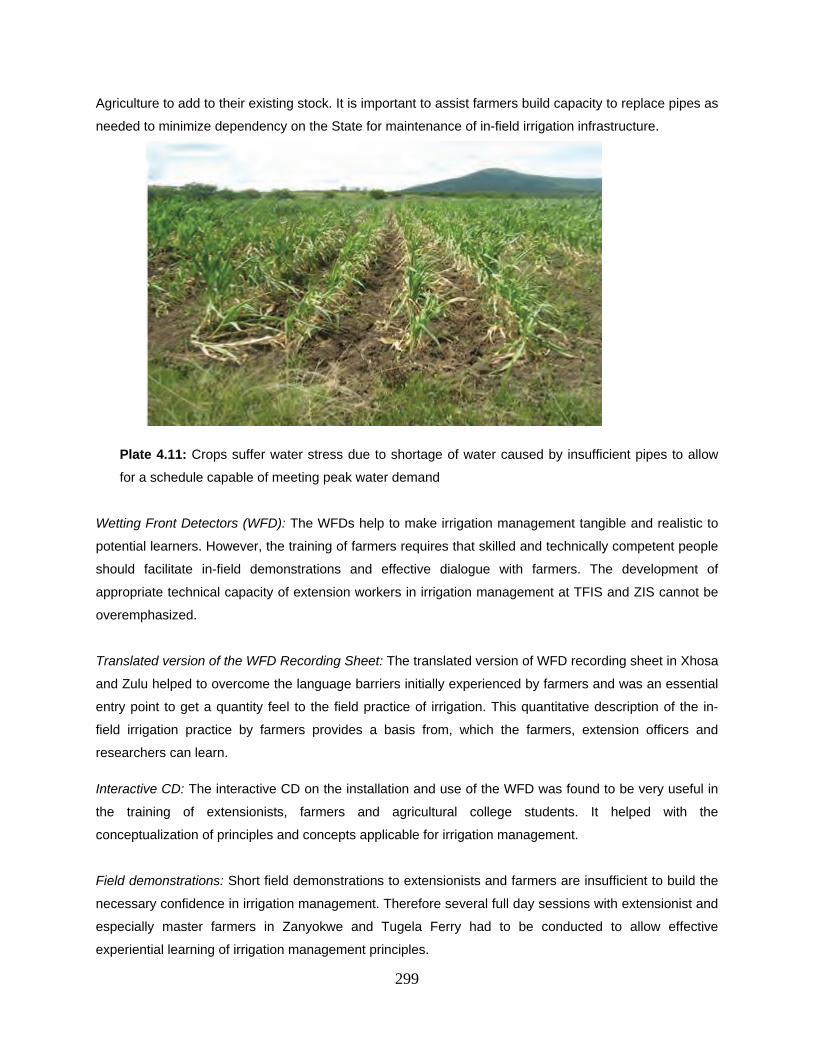
299
Agriculture to add to their existing stock. It is important to assist farmers build capacity to replace pipes as
needed to minimize dependency on the State for maintenance of in-field irrigation infrastructure.
Plate 4.11: Crops suffer water stress due to shortage of water caused by insufficient pipes to allow
for a schedule capable of meeting peak water demand
Wetting Front Detectors (WFD): The WFDs help to make irrigation management tangible and realistic to
potential learners. However, the training of farmers requires that skilled and technically competent people
should facilitate in-field demonstrations and effective dialogue with farmers. The development of
appropriate technical capacity of extension workers in irrigation management at TFIS and ZIS cannot be
overemphasized.
Translated version of the WFD Recording Sheet: The translated version of WFD recording sheet in Xhosa
and Zulu helped to overcome the language barriers initially experienced by farmers and was an essential
entry point to get a quantity feel to the field practice of irrigation. This quantitative description of the in-
field irrigation practice by farmers provides a basis from, which the farmers, extension officers and
researchers can learn.
Interactive CD: The interactive CD on the installation and use of the WFD was found to be very useful in
the training of extensionists, farmers and agricultural college students. It helped with the
conceptualization of principles and concepts applicable for irrigation management.
Field demonstrations: Short field demonstrations to extensionists and farmers are insufficient to build the
necessary confidence in irrigation management. Therefore several full day sessions with extensionist and
especially master farmers in Zanyokwe and Tugela Ferry had to be conducted to allow effective
experiential learning of irrigation management principles.

300
Master farmers important role in dissemination of technology: Early adopters play an important role to
help understand the socio-economic and practical challenges small-scale irrigators’ experience. The
master farmers in this research project proved the important role they play in field data collection,
interpretation of data and dissemination to fellow farmers. They also played a critical role in the feedback
from using scientific scheduling tools like the WFD and the implementation of new practices.
Availability of an irrigation “service pack”: Farmers using the WFD often found it difficult or impossible to
replace broken parts. The availability of a “service pack” by the manufacturers is still lacking and is
detrimental for the broad adoption of this scheduling technique.
Irrigation calendars: The development of irrigation calendars for small sale irrigators for specific crops and
irrigation areas can help with the application of the correct volume of water when the crop requires it
most. However, this must not be seen as a “blueprint model” which farmers must apply without proper
consultation with researchers and extensionists and a thorough understanding of the agricultural
conditions that apply.
Partnerships between public and private sector: Regular intervention by agents from public and private
sector is essential for the building of capacity of small-scale irrigators. Important partnerships between the
various stakeholders are critical for sustainable agriculture development.
Participatory action research: The participatory nature of this project allowed us to appreciate the fact that
small-scale irrigators have vast experiences in agriculture; the challenge for the research team was to
learn from farmers through regular interaction and research in the field. For the research team the most
challenging part was to capture what farmers are doing – logging when farmers irrigate and how much
they irrigate?
Collective management: Irrigators require urgent support with the building of capacity regarding collective
management of an irrigation scheme like Zanyokwe. At Tugela Ferry substantial improvement in this
regard was reported by the KZN team.
Basic irrigation principles: More emphasis should be placed on the training of basic crop production
aspects and irrigation principles before it could be expected from farmers to fine tune irrigation scheduling
with the help of more sophisticated irrigation-scheduling tools – even if it is simple and easy like the WFD.
4.2.4 Capacity building
In the BMP project, capacity building was at the level of training postgraduate students, farmers and
extension officers. Inadequate technical know-how and capacity on the part of the beneficiaries as well as
government assigned extension staff is often cited as contributory factors to under-performance of small-
scale irrigation schemes in South Africa.
301
Graduate student training lessons:
Experience with some students showed that part-time students had problems honouring their
commitment to the agreed research programmes. A better arrangement is to recruit full-time students and
build their work programme around a full-time post-doctoral fellow for timely outputs. Part-time students
should only be recruited if they work for a research facility interested in the same line of enquiry as the
project being funded.
Farmer level lessons:
Farmers tend to articulate problems with emphasis on those which they have no control. Many of
the crucial farming activities over which they have control tend to be simplified to a level where
little or no decision making is required. However, farmer decision making has a very big impact
on productivity. It is therefore important to engage farmers in a learning process that allows them
to question their decision making and to probe for underlying causes of their problems.
Exposure visits allowed farmers to learn about new markets and organize better for group
marketing and meet standards required in the market place.
Plate 4.12: ZIS farmers visited the Municipal market, Proveg, Pick ‘n’ Pay and Woolworths in
East London and got exposed to market requirements for vegetable quality, grading and
packaging
Training in grading, cleaning and packaging has gone a long way in improving relationships
between farmers and contractors, as they are more able to meet quality standards. Buyers such
as Pick ‘n’ Pay noted improvement in quality of butternut. Improved quality resulted in higher
income earned by farmers.
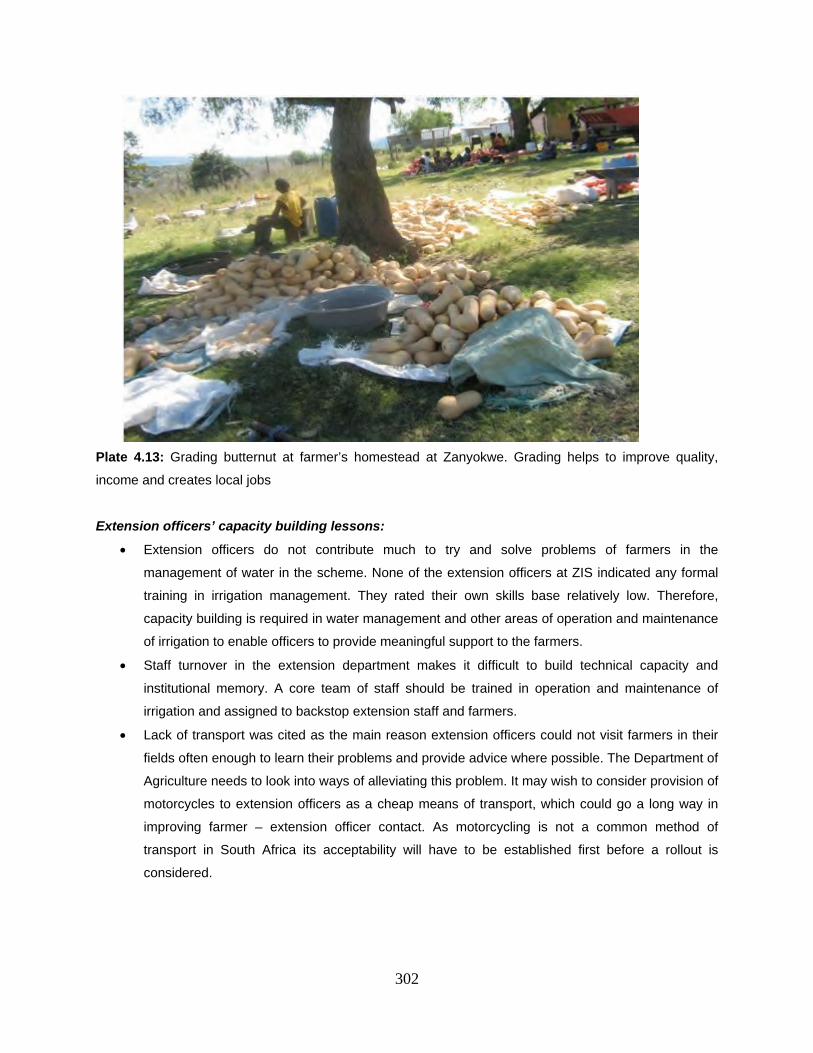
302
Plate 4.13: Grading butternut at farmer’s homestead at Zanyokwe. Grading helps to improve quality,
income and creates local jobs
Extension officers’ capacity building lessons:
Extension officers do not contribute much to try and solve problems of farmers in the
management of water in the scheme. None of the extension officers at ZIS indicated any formal
training in irrigation management. They rated their own skills base relatively low. Therefore,
capacity building is required in water management and other areas of operation and maintenance
of irrigation to enable officers to provide meaningful support to the farmers.
Staff turnover in the extension department makes it difficult to build technical capacity and
institutional memory. A core team of staff should be trained in operation and maintenance of
irrigation and assigned to backstop extension staff and farmers.
Lack of transport was cited as the main reason extension officers could not visit farmers in their
fields often enough to learn their problems and provide advice where possible. The Department of
Agriculture needs to look into ways of alleviating this problem. It may wish to consider provision of
motorcycles to extension officers as a cheap means of transport, which could go a long way in
improving farmer – extension officer contact. As motorcycling is not a common method of
transport in South Africa its acceptability will have to be established first before a rollout is
considered.

303
5 GUIDELINES ON BEST MANAGEMENT PRACTICES IN ZANYOKWE AND
TUGELA FERRY IRRIGATION SCHEMES
5.1 Introduction
As pointed out in the general introduction, this project was commissioned with a view to develop and
implement appropriate technologies and knowledge useful for farmers in order to improve their
livelihoods. An appropriate technology is one, which, if implemented correctly, provides the farmer with an
opportunity to manage his/her farming enterprise successfully. It is, however, important to distinguish
between merely an appropriate technology and the most suitable technology for a specific set of
circumstances. The latter is the concept of best management practice (BMP). A BMP is one that will give
the best results within a specific context of a wide range of factors (Laker, 2004). It relates to the full
range of decision-making in farming and includes cultural practices such as crop selection, cultivar
selection, planting dates, planting densities, tillage methods, pest management, soil fertility management,
and irrigation scheduling. The ultimate goal of this project was to package the appropriate technologies
adapted or developed and knowledge generated in the form of Best Management Practices, which if
followed by farmers would result in improved yields and incomes for the farmers.
Different strategies were used by the research teams at ZIS and TFIS to address the constraints to
productivity at the two schemes. This involved among others the training sessions, demonstrations,
production trials, workshops and Farmers' Days. In this chapter we report what we consider to be the
“best management practices” for the two schemes where the studies were conducted based on the
results and knowledge gathered during the lifespan of this project. While the team could not find ways of
eliminating all identified constraints, it is nevertheless, hoped that the guidelines presented herein if
implemented will go a long way in improving crop productivity, incomes, and livelihoods at the two
schemes and possibly other smallholder irrigation schemes that face similar challenges.
5.2 Socio-economic issues
5.2.1 Scheme Management and Leadership
Selection of committed and available leaders: Good management and leadership is crucial to the
success of any organization including irrigation schemes. When the BMP project started in Zanyokwe, the
chairperson of the main farmers’ organisation, the Trust was a part-time farmer who was involved in full-
time employment in another city. This made it very difficult to manage and co-ordinate the day-to-day
running of the scheme. In Tugela Ferry, farmer's institutions at the start of the project were either non-
existent or very weak. There were no regular meetings held, hence farmers tended to work in silos. This
situation resulted in farmers competing against each other. Lack of collective action resulted in income
304
losses, because farmers were unable to do bulk buying/selling to obtain discounts or bargain for better
prices for their produce. Following the project team’s interactions with farmers and other stakeholders
new scheme managements and institutional arrangements have been put in place in the two schemes as
described in sections 2.4.3.1.2 and 3.4.2.1. This has had a positive impact on issues of scheme
management and co-ordination of meetings and other activities.
5.2.2 Land tenure
As discussed in Chapter 2, farmers in ZIS access land through various ways but mostly through owning
(freehold) or leasing. Interaction with farmers during the conduct of the study revealed that some
landowners became envious when farmers renting their land were getting good harvests from the rented
land, and cancelled their leases. This created uncertainty on the mostly young farmers who would have
committed resources to make a living from the practice of irrigation. Insecurity of land tenure is a negative
factor in fostering farmer investment in smallholder schemes in terms of infrastructure, skills and farmer
organization. There is therefore an urgent need to develop policy on land tenure that would favour those
interested and capable of farming so as to improve on productivity and hence general scheme
performance.
5.2.3 Training
Farmers need to be empowered through training for transformation. Empowering farmers with skills other
than farming is certainly a best management practice. Farmers should be good managers. They not only
manage their farming activities but also people they work with as well as those who work for them
(employees). This means that they have to possess leadership skills. After receiving training, the
management at ZIS improved. They formed a management structure, which was eventually registered.
They also formed secondary cooperatives at section level. This made it easy for them to run scheme
affairs effectively and efficiently. The conduct of meetings improved considerably, meetings were regular
and minutes were captured and produced.
5.2.4 Marketing
Crop production should be market driven: Before the implementation of the BMP project, only one
third of farmers were involved in the production of butternut at ZIS. As farmers began to access more
formal markets, the proportion of farmers producing butternuts increased. Butternut was one of the
products demanded by these markets, and farmers complied with the market requirements. The numbers
of farmers producing maize as grain decreased. Maize grain was the main product produced at ZIS but
price and demand in formal markets declined. Hence farmers switched to butternuts. This change
impacted positively on farmer’s economic wellbeing. Butternut was the second crop (after cabbages) to
bring highest returns.
305
Expose farmers to markets and quality requirements to improve crop management and adding
value through grading: Before the BMP farmers struggled to meet quality standards required by
markets such as Pick ‘n’ Pay. This changed when farmers were exposed to quality standards through
look and learn visits to top chain fresh produce outlets in urban areas. They learnt how to grade and
adopted this as a marketing function, especially for butternut. The grading of butternut had a positive
impact on income achieved by farmers in ZIS. The confidence of buyers in the farmers improved
facilitating an increase in market outlets for farmer produce.
Collective action: Collective action in acquiring inputs and selling products improved marketing of
agricultural products at ZIS. About 83% of farmers adopted the collective action marketing strategy. This
practice had a positive impact on transaction costs. High transport cost was one of the major constraints
at ZIS discouraging farmers in accessing formal markets. The adoption of the collective action strategy
resulted in reduction in transportation costs and increase in household incomes. The marketing system at
ZIS was more organized as farmers began to address and strengthen marketing institutions (rules and
regulations) with the help of the BMP team. Group marketing significantly reduced transaction costs for
contractors, encouraging access to lucrative markets.
5.3 Water Management
The primary objective of water management is to apply the right amount of water at the right time while
maintaining the higher yields attributable to irrigation. Proper irrigation scheduling can result in significant
savings in irrigation time, labor, energy and water. By carefully managing the amount of water applied,
leaching of nutrients and erosion can be reduced. Attention should also be given to how the water needs
of the crop vary depending upon the stage of growth. For example, maize is not as susceptible to
moisture stress during its early vegetative stage as it is during tasseling and silking. Nighttime irrigation
can result in substantially higher irrigation efficiencies due to reduced evaporation. Although plant wilting
has been used extensively for irrigation scheduling in the past, it has been shown that potential yields
may have already been reduced before reaching this point.
5.3.1 Guidelines on best management practices for irrigating crops at ZIS
Scheme level
Control bush fires to reduce damage to irrigation infrastructure: Farmers should ensure that incidences of
bush fire are reduced within the scheme as these cause considerable damage to the irrigation
infrastructure. In addition, fire consumes all organic residues in croplands which are essential in
improving the soil condition under both no-till and conventional crop production practices.
306
Field level
Install a pressure gauge at the beginning of the lateral and only open the hydrant to the extent that
enough pressure is made available to the system as indicated on the pressure gauge.
Operate sprinklers at the recommended pressure level: System pressure was the biggest factor to the
poor performance of sprinkler system in ZIS. The sprinklers were operated at pressures above the
recommended. The ideal operating pressure for Rainbird 30BH sprinklers used in ZIS is below 3 bar (300
kPa) but farmers used pressure in excess of 4 bar.
Use standpipes that are of the same length, same sprinklers and nozzles on all lateral lines on the
same field when irrigating: The sprinkler system in ZIS was not well maintained, with a lot of technical
variation. Different stand pipe lengths; different sprinklers and different nozzles were found in a single
lateral line thereby affecting efficiency of the system.
Planted area to match pipes and sprinklers: Shortage of pipes and sprinklers has been cited as one of
the major constraints to crop production at ZIS. Farmers should plan their planting activities to suit the
amount of irrigation equipment they have. It is unwise to plant a large area when one has insufficient
sprinklers because this will only result in yield loss due to water shortage.
Use objective monitoring tools to schedule irrigation: All the irrigation farmers at ZIS followed a fixed
irrigation schedule in ZIS where fixed amounts of water are applied on a fixed cycle. The general
approach of irrigating used by farmers tended to supply more water than required in early growth phases
and less than required during peak demand thereby stressing crops during critical growth phases and
reducing yield. Table 5.1 indicates the periods of crop growth when adequate supply of irrigation is critical
for high quality vegetables. On some farms poor irrigation reduced crop establishment and reduced yield
of crops such as maize. The wetting front detector is a tool that can help farmers to visualise the depth
that water is moving rather than to try and think in terms of volumetric water content or matric suction. The
introduction of this tool helped farmers to determine how well their last irrigation filled the profile and
helped them to make decisions about timing and duration of the next irrigation. Farmers were encouraged
to keep records of how much water was applied and how deep it penetrated based on the response of the
detector. In general the use of WFD by pilot farmers helped to make irrigation management tangible and
realistic. It is therefore recommended as a best practice.
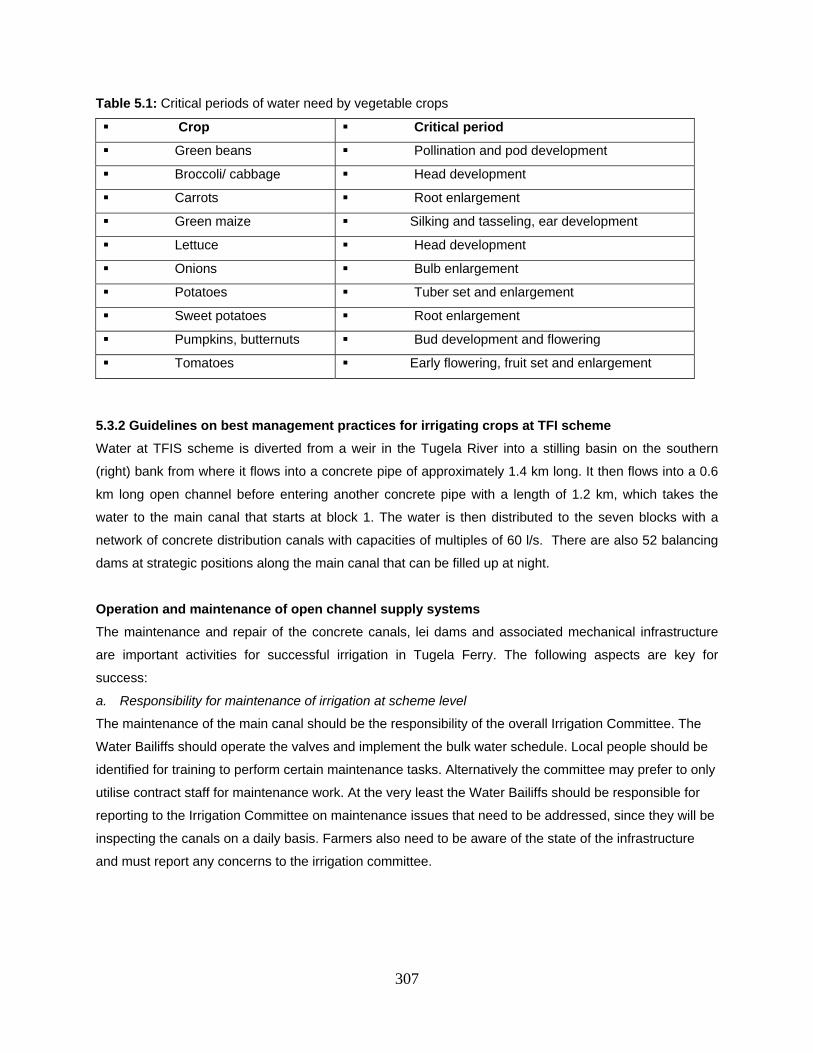
307
Table 5.1: Critical periods of water need by vegetable crops
Crop Critical period
Green beans Pollination and pod development
Broccoli/ cabbage Head development
Carrots Root enlargement
Green maize Silking and tasseling, ear development
Lettuce Head development
Onions Bulb enlargement
Potatoes Tuber set and enlargement
Sweet potatoes Root enlargement
Pumpkins, butternuts Bud development and flowering
Tomatoes Early flowering, fruit set and enlargement
5.3.2 Guidelines on best management practices for irrigating crops at TFI scheme
Water at TFIS scheme is diverted from a weir in the Tugela River into a stilling basin on the southern
(right) bank from where it flows into a concrete pipe of approximately 1.4 km long. It then flows into a 0.6
km long open channel before entering another concrete pipe with a length of 1.2 km, which takes the
water to the main canal that starts at block 1. The water is then distributed to the seven blocks with a
network of concrete distribution canals with capacities of multiples of 60 l/s. There are also 52 balancing
dams at strategic positions along the main canal that can be filled up at night.
Operation and maintenance of open channel supply systems
The maintenance and repair of the concrete canals, lei dams and associated mechanical infrastructure
are important activities for successful irrigation in Tugela Ferry. The following aspects are key for
success:
a. Responsibility for maintenance of irrigation at scheme level
The maintenance of the main canal should be the responsibility of the overall Irrigation Committee. The
Water Bailiffs should operate the valves and implement the bulk water schedule. Local people should be
identified for training to perform certain maintenance tasks. Alternatively the committee may prefer to only
utilise contract staff for maintenance work. At the very least the Water Bailiffs should be responsible for
reporting to the Irrigation Committee on maintenance issues that need to be addressed, since they will be
inspecting the canals on a daily basis. Farmers also need to be aware of the state of the infrastructure
and must report any concerns to the irrigation committee.
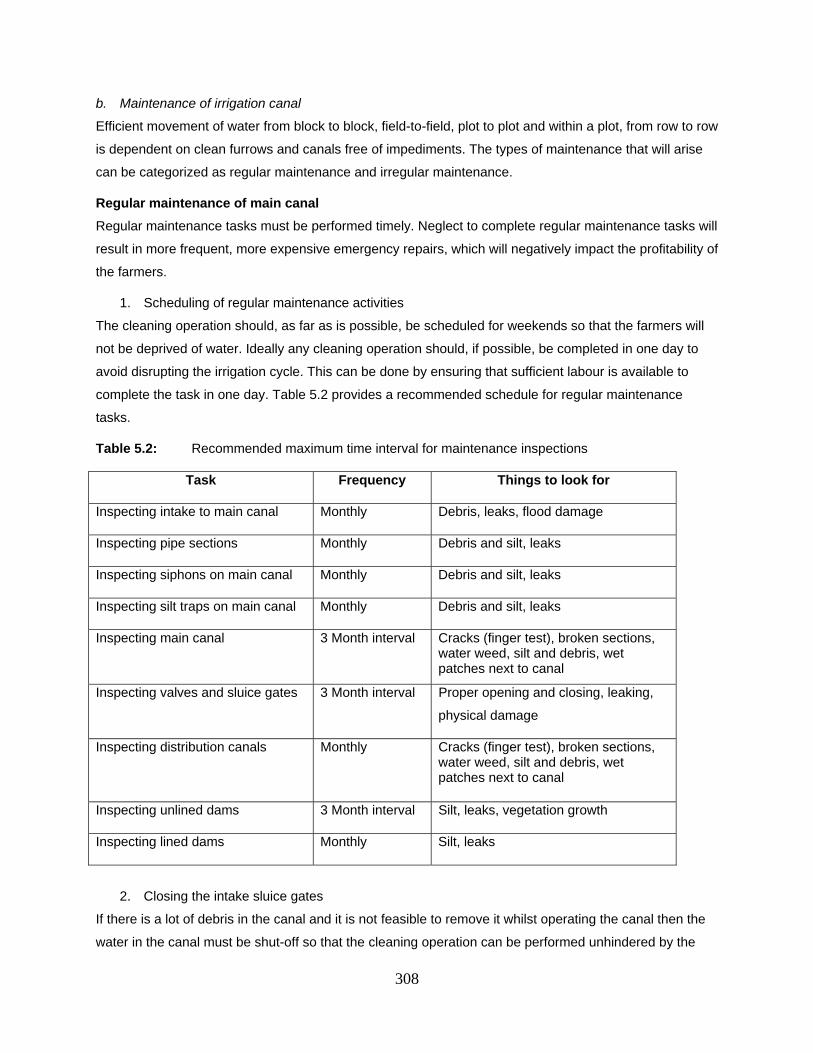
308
b. Maintenance of irrigation canal
Efficient movement of water from block to block, field-to-field, plot to plot and within a plot, from row to row
is dependent on clean furrows and canals free of impediments. The types of maintenance that will arise
can be categorized as regular maintenance and irregular maintenance.
Regular maintenance of main canal
Regular maintenance tasks must be performed timely. Neglect to complete regular maintenance tasks will
result in more frequent, more expensive emergency repairs, which will negatively impact the profitability of
the farmers.
1. Scheduling of regular maintenance activities
The cleaning operation should, as far as is possible, be scheduled for weekends so that the farmers will
not be deprived of water. Ideally any cleaning operation should, if possible, be completed in one day to
avoid disrupting the irrigation cycle. This can be done by ensuring that sufficient labour is available to
complete the task in one day. Table 5.2 provides a recommended schedule for regular maintenance
tasks.
Table 5.2: Recommended maximum time interval for maintenance inspections
Task Frequency Things to look for
Inspecting intake to main canal Monthly Debris, leaks, flood damage
Inspecting pipe sections Monthly Debris and silt, leaks
Inspecting siphons on main canal Monthly Debris and silt, leaks
Inspecting silt traps on main canal Monthly Debris and silt, leaks
Inspecting main canal 3 Month interval Cracks (finger test), broken sections, water weed, silt and debris, wet patches next to canal
Inspecting valves and sluice gates 3 Month interval Proper opening and closing, leaking,
physical damage
Inspecting distribution canals Monthly Cracks (finger test), broken sections, water weed, silt and debris, wet patches next to canal
Inspecting unlined dams 3 Month interval Silt, leaks, vegetation growth
Inspecting lined dams Monthly Silt, leaks
2. Closing the intake sluice gates
If there is a lot of debris in the canal and it is not feasible to remove it whilst operating the canal then the
water in the canal must be shut-off so that the cleaning operation can be performed unhindered by the
309
presence of water. The inlet gates should be closed on the Saturday afternoon after the day’s irrigation
cycle is complete. This will allow the canal to empty completely during the night.
3. Canal inspection
Once a month the entire length of canal must be inspected and all rocks and trash must be removed from
the canal. Trash includes waterweed and any other foreign matter. The water level in the canal is less
than waist deep and so the people performing the cleaning operation can stand in the canal when it has
water in it. Boulders of a manageable size can be removed by hand in this manner. Likewise, any other
small debris can also be removed by hand.
The inspection must also include identifying cracks and breaches in the canal that are leaking water. It is
the nature of concrete canals to crack over time and there may be many small cracks visible, but which
do not contribute any significant loss of water. Cracks of 5 mm width or more (if the tip of a small finger
can fit into the crack) should be repaired.
4. Cleaning the canal
Silt, waterweed and small stones should be removed with spades or shovels. If the waterweed is attached
to the side of the canal it should be scraped away with the aid of a spade. This should be done while the
water is shut off. Materials cleaned from the canal should be removed well away from the canal to
prevent them from falling back into the canal later.
5. Scouring the silt traps
Once a month the silt traps on the canal must be scoured. The silt traps are equipped with scour gates,
which when opened, allows the water to discharge from the canal. Under normal silt conditions (when the
traps are scoured regularly) the rushing water should stir up the silt and the traps will self clean through
the scour gate. If there is an unusually large amount of silt in the trap then three or four labourers can
stand in the trap and stir up the sand with spades. Care must be taken by the labourers not to fall and so
be trapped against the opening by the force of the water rushing through. A single person for this reason
should never attempt this job. When the sand has been completely removed the scour gate should be
closed and the canal will return to normal operation.
6. Monitoring and adjusting the water level
The water level in the canal must be monitored and if the canal is not flowing full over the initial length the
sluice gates on the intake works must be adjusted accordingly. The inlet gates should only be adjusted
once a day. This function should be appointed to the water ranger responsible for block 1 nearest the
intake sluice gates. If the canal is flowing full upon entering block 1 the gates are adjusted at the right
level.
7. Cleaning the intake sieve
The intake sieves on the weir and the siphons must be cleaned of debris as litter and pieces of vegetation
tend to accumulate on the sieves. There is no need to shut the water off in the canal and the trash can
310
easily be removed by hand with the aid of a steel rake. Care must be taken by anyone undertaking this
operation not to fall into the intake works, as the force of water may trap the person against the intake
sieve. Two people should work on this operation together for safety sake. The second person will be
there to help the first person in the case of an accident. Litter and trash must be removed away from the
canal and buried to prevent it from being knocked back into the canal.
8. Preventing root intrusion
All trees and shrubs alongside the canals must be removed. If the trees are not removed the roots will
eventually disturb the concrete canals. The presence of trees and shrubs is particularly prevalent where
two sections of canal run parallel to each other. This thin strip of land in between is not cultivated and so
no one has assumed responsibility for it. The block committee must ensure that all areas next to the
canals are kept clear of trees and shrubs. This vegetation should be removed with bush knives and the
stumps of any trees that remain must be poisoned with a stump poison. Once the initial vegetation has
been removed the re-growth can subsequently be controlled by spraying with a broad-spectrum herbicide
like Round-up.
9. Cleaning the distribution canals
The maintenance of the in-field distribution canals is the responsibility of the Block Committees. The
canals may accumulate silt and this must be removed. Silt will tend to accumulate in the distribution
canals where there is a change in slope in the canal. The silt is best removed using a round-nose shovel
when there is no water flowing in the canal. It should not be necessary to shut-off the water in the main
canal as the cleaning operation can be scheduled for the day after the adjoining plots have received their
water. Plots receive their water once a week and thus there will be six days available before water is
scheduled to re-enter that distribution canal.
Irregular maintenance of main canal
Irregular maintenance items are those, which do not have any kind of predictability to their occurrence.
For example canals damaged by tractors, valve parts becoming worn out, etc.
1. Repair of valves and sluice gates
When the valves and sluice gates present problems these need to be repaired by an experienced
contractor. Depending on the nature of the fault with the mechanical part it may be possible to
repair/replace the component with water present in the canal. More serious damage may necessitate the
closing down of the canal to remove the valve or sluice gate. The contractor appointed by the Irrigation
Committee should be consulted in this regard.
2. Repair of canal
If the canal is breached or if there is evidence of the canal leaking then appropriate repair action needs to
be taken. A breach or leak in the canal should be repaired with concrete. This will require that there is no
311
water in the canal while the repair work is under way and for one week after the repair to allow the
concrete to cure.
3. Removing dead livestock from the canal
If any livestock die and fall into the canal they must be removed. This type of problem must be tackled
promptly while the carcass is still fresh. The carcass is best removed by fastening a chain around the
head and pulling the carcass out with a tractor or by hand. The carcass must be buried away from any
homes or public buildings such as schools.
Maintenance of lei dams (Night Storage Dams)
The maintenance of the lei dams is the responsibility of the Block Committees. All dams should be fenced
to keep livestock out. The dams must be kept clear of vegetation and any other foreign matter. Dams
need to inspected regularly (suggest every three months) for silt build up and excess vegetation growth.
The lined dams have a higher maintenance requirement and need to be inspected monthly. The lining is
a relatively thin layer of plastic material and can be easily damaged. If the lining is damaged the dam will
leak, and if left unattended could cause structural damage to the dam wall. A good time to inspect the
dams is at the end of the day, after the dams have been drained for irrigation, just prior to opening the
inlet valve for the night. Alternatively the dams will have to be drained for a thorough inspection.
Repair of valves and sluice gates: The dams have been equipped with outlet valves and sluice
gates similar to the main canal. These devises also need to be inspected regularly and repaired
periodically.
Repair of lining: Some dams have a plastic lining to prevent leaking. This lining has a higher
maintenance requirement than the earth dams and must be regularly inspected (monthly). Things
to look for include, round puncture holes, cracks or tears and lifting of the seams. If this lining is
punctured at any time it must be properly patched. This can be done by an experienced
contractor or by members of the scheme who worked on these dams and have some experience
working with the lining. The size and nature of the leak will determine which route the committee
will follow.
Clearing silt and vegetation
If the main canal is properly operated and maintained as described above there should be very little silt
build up in the dams and consequently little vegetation growth in the dams. If, however, the need arises
that a dam should be cleaned of silt this is best achieved by hiring a machine such as a front-end loader
or TLB. The dam must be drained and the machine can clean out the silt and vegetation and deposit the
silt onto nearby lands.
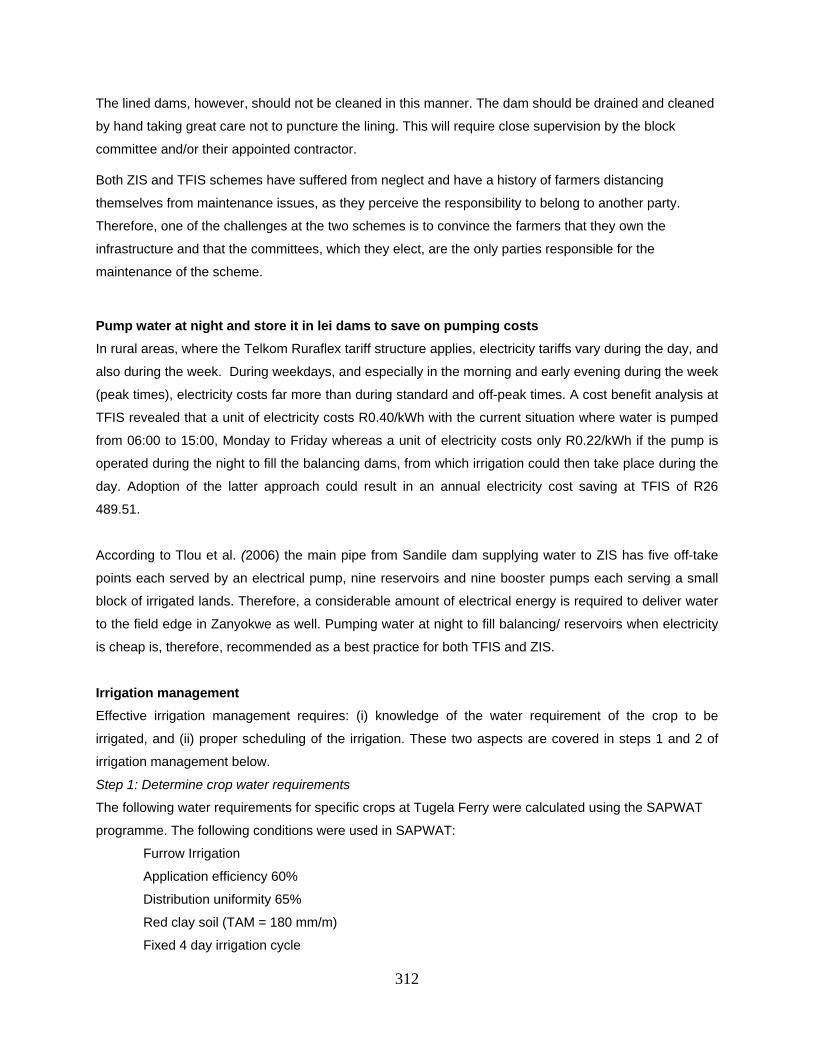
312
The lined dams, however, should not be cleaned in this manner. The dam should be drained and cleaned
by hand taking great care not to puncture the lining. This will require close supervision by the block
committee and/or their appointed contractor.
Both ZIS and TFIS schemes have suffered from neglect and have a history of farmers distancing
themselves from maintenance issues, as they perceive the responsibility to belong to another party.
Therefore, one of the challenges at the two schemes is to convince the farmers that they own the
infrastructure and that the committees, which they elect, are the only parties responsible for the
maintenance of the scheme.
Pump water at night and store it in lei dams to save on pumping costs
In rural areas, where the Telkom Ruraflex tariff structure applies, electricity tariffs vary during the day, and
also during the week. During weekdays, and especially in the morning and early evening during the week
(peak times), electricity costs far more than during standard and off-peak times. A cost benefit analysis at
TFIS revealed that a unit of electricity costs R0.40/kWh with the current situation where water is pumped
from 06:00 to 15:00, Monday to Friday whereas a unit of electricity costs only R0.22/kWh if the pump is
operated during the night to fill the balancing dams, from which irrigation could then take place during the
day. Adoption of the latter approach could result in an annual electricity cost saving at TFIS of R26
489.51.
According to Tlou et al. (2006) the main pipe from Sandile dam supplying water to ZIS has five off-take
points each served by an electrical pump, nine reservoirs and nine booster pumps each serving a small
block of irrigated lands. Therefore, a considerable amount of electrical energy is required to deliver water
to the field edge in Zanyokwe as well. Pumping water at night to fill balancing/ reservoirs when electricity
is cheap is, therefore, recommended as a best practice for both TFIS and ZIS.
Irrigation management
Effective irrigation management requires: (i) knowledge of the water requirement of the crop to be
irrigated, and (ii) proper scheduling of the irrigation. These two aspects are covered in steps 1 and 2 of
irrigation management below.
Step 1: Determine crop water requirements
The following water requirements for specific crops at Tugela Ferry were calculated using the SAPWAT
programme. The following conditions were used in SAPWAT:
� Furrow Irrigation
� Application efficiency 60%
� Distribution uniformity 65%
� Red clay soil (TAM = 180 mm/m)
� Fixed 4 day irrigation cycle
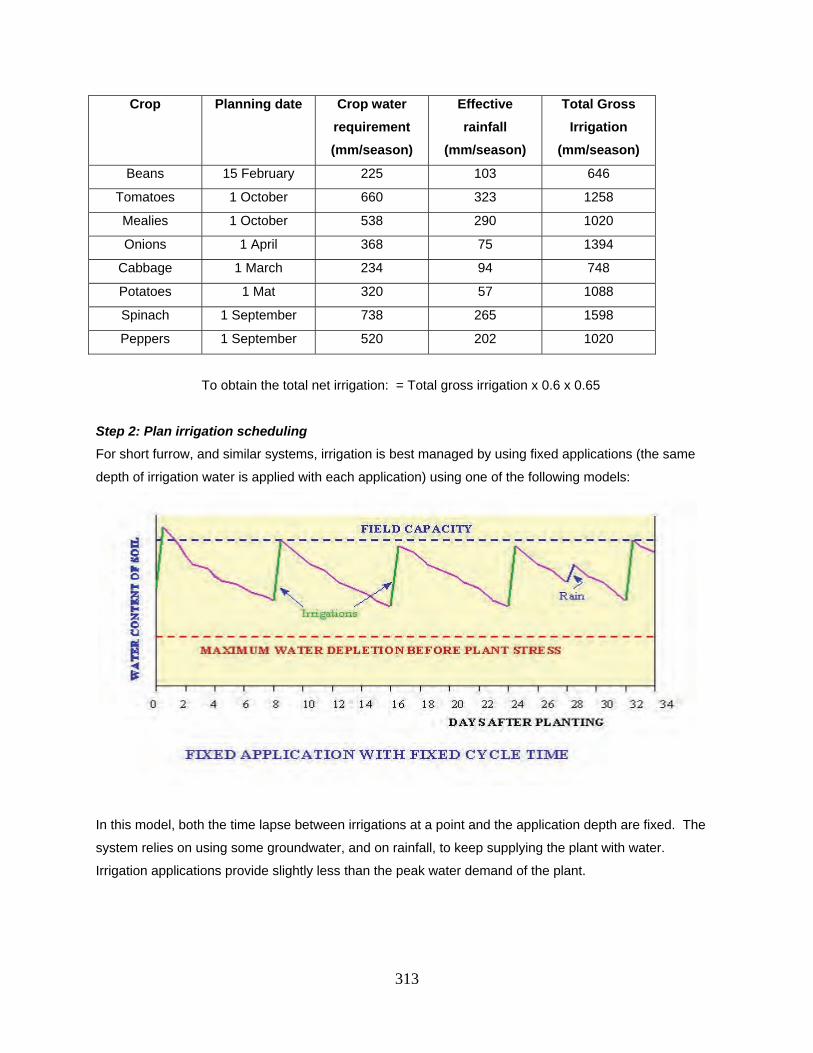
313
Crop Planning date Crop water
requirement
(mm/season)
Effective
rainfall
(mm/season)
Total Gross
Irrigation
(mm/season)
Beans 15 February 225 103 646
Tomatoes 1 October 660 323 1258
Mealies 1 October 538 290 1020
Onions 1 April 368 75 1394
Cabbage 1 March 234 94 748
Potatoes 1 Mat 320 57 1088
Spinach 1 September 738 265 1598
Peppers 1 September 520 202 1020
To obtain the total net irrigation: = Total gross irrigation x 0.6 x 0.65
Step 2: Plan irrigation scheduling
For short furrow, and similar systems, irrigation is best managed by using fixed applications (the same
depth of irrigation water is applied with each application) using one of the following models:
In this model, both the time lapse between irrigations at a point and the application depth are fixed. The
system relies on using some groundwater, and on rainfall, to keep supplying the plant with water.
Irrigation applications provide slightly less than the peak water demand of the plant.
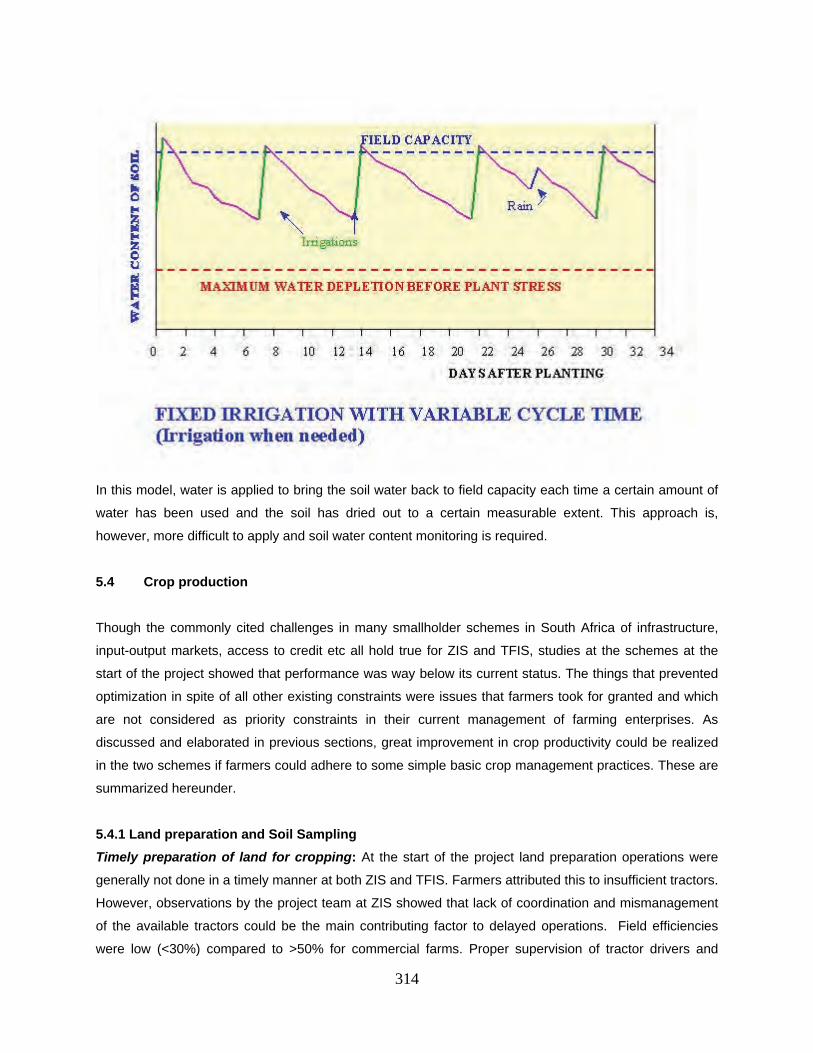
314
In this model, water is applied to bring the soil water back to field capacity each time a certain amount of
water has been used and the soil has dried out to a certain measurable extent. This approach is,
however, more difficult to apply and soil water content monitoring is required.
5.4 Crop production
Though the commonly cited challenges in many smallholder schemes in South Africa of infrastructure,
input-output markets, access to credit etc all hold true for ZIS and TFIS, studies at the schemes at the
start of the project showed that performance was way below its current status. The things that prevented
optimization in spite of all other existing constraints were issues that farmers took for granted and which
are not considered as priority constraints in their current management of farming enterprises. As
discussed and elaborated in previous sections, great improvement in crop productivity could be realized
in the two schemes if farmers could adhere to some simple basic crop management practices. These are
summarized hereunder.
5.4.1 Land preparation and Soil Sampling
Timely preparation of land for cropping: At the start of the project land preparation operations were
generally not done in a timely manner at both ZIS and TFIS. Farmers attributed this to insufficient tractors.
However, observations by the project team at ZIS showed that lack of coordination and mismanagement
of the available tractors could be the main contributing factor to delayed operations. Field efficiencies
were low (<30%) compared to >50% for commercial farms. Proper supervision of tractor drivers and
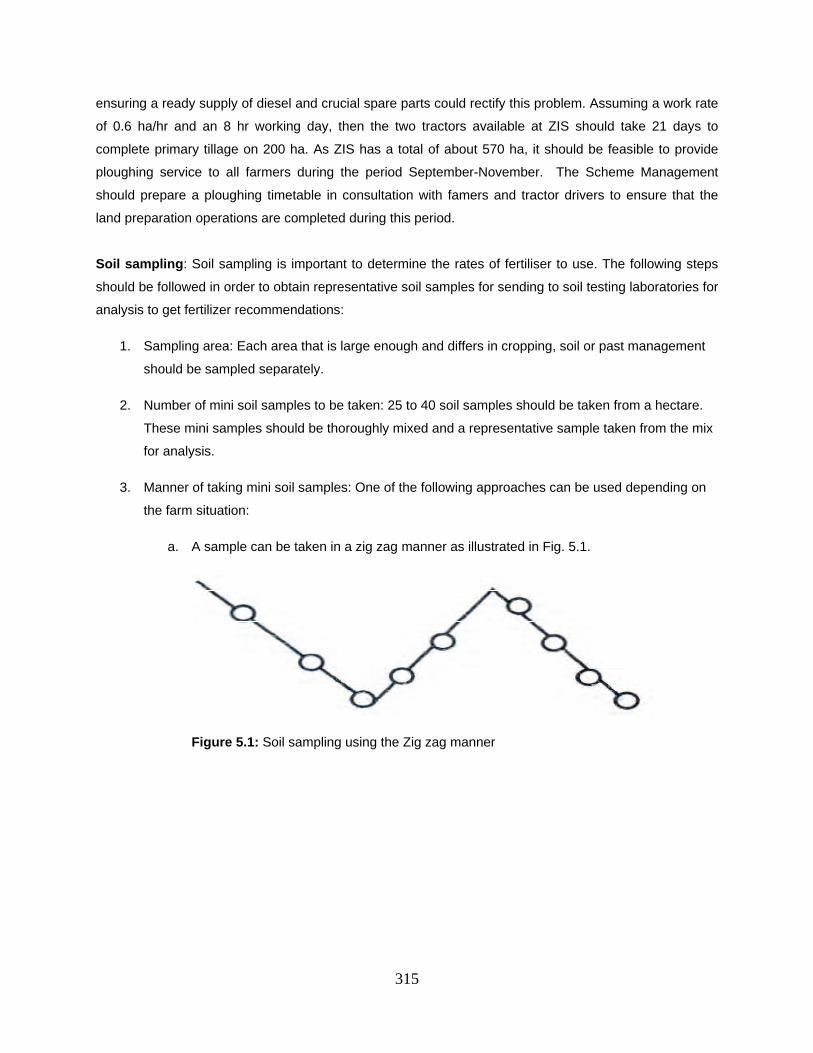
315
ensuring a ready supply of diesel and crucial spare parts could rectify this problem. Assuming a work rate
of 0.6 ha/hr and an 8 hr working day, then the two tractors available at ZIS should take 21 days to
complete primary tillage on 200 ha. As ZIS has a total of about 570 ha, it should be feasible to provide
ploughing service to all farmers during the period September-November. The Scheme Management
should prepare a ploughing timetable in consultation with famers and tractor drivers to ensure that the
land preparation operations are completed during this period.
Soil sampling: Soil sampling is important to determine the rates of fertiliser to use. The following steps
should be followed in order to obtain representative soil samples for sending to soil testing laboratories for
analysis to get fertilizer recommendations:
1. Sampling area: Each area that is large enough and differs in cropping, soil or past management
should be sampled separately.
2. Number of mini soil samples to be taken: 25 to 40 soil samples should be taken from a hectare.
These mini samples should be thoroughly mixed and a representative sample taken from the mix
for analysis.
3. Manner of taking mini soil samples: One of the following approaches can be used depending on
the farm situation:
a. A sample can be taken in a zig zag manner as illustrated in Fig. 5.1.
Figure 5.1: Soil sampling using the Zig zag manner
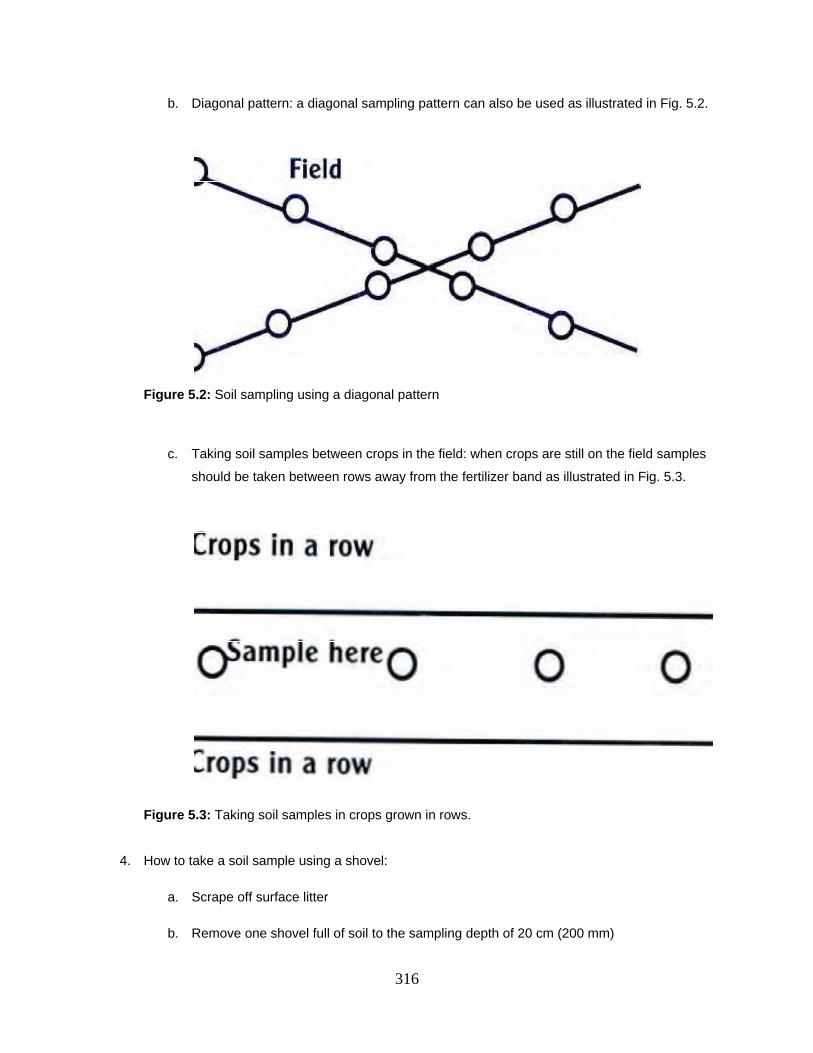
316
b. Diagonal pattern: a diagonal sampling pattern can also be used as illustrated in Fig. 5.2.
Figure 5.2: Soil sampling using a diagonal pattern
c. Taking soil samples between crops in the field: when crops are still on the field samples
should be taken between rows away from the fertilizer band as illustrated in Fig. 5.3.
Figure 5.3: Taking soil samples in crops grown in rows.
4. How to take a soil sample using a shovel:
a. Scrape off surface litter
b. Remove one shovel full of soil to the sampling depth of 20 cm (200 mm)
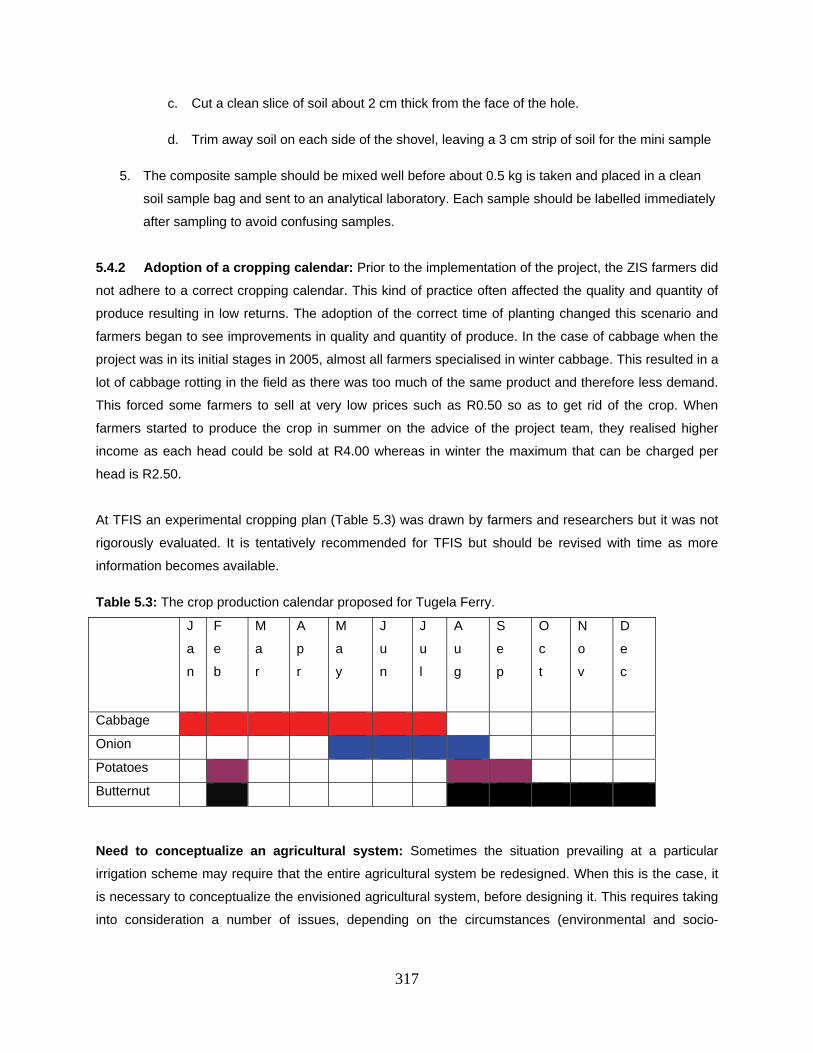
317
c. Cut a clean slice of soil about 2 cm thick from the face of the hole.
d. Trim away soil on each side of the shovel, leaving a 3 cm strip of soil for the mini sample
5. The composite sample should be mixed well before about 0.5 kg is taken and placed in a clean
soil sample bag and sent to an analytical laboratory. Each sample should be labelled immediately
after sampling to avoid confusing samples.
5.4.2 Adoption of a cropping calendar: Prior to the implementation of the project, the ZIS farmers did
not adhere to a correct cropping calendar. This kind of practice often affected the quality and quantity of
produce resulting in low returns. The adoption of the correct time of planting changed this scenario and
farmers began to see improvements in quality and quantity of produce. In the case of cabbage when the
project was in its initial stages in 2005, almost all farmers specialised in winter cabbage. This resulted in a
lot of cabbage rotting in the field as there was too much of the same product and therefore less demand.
This forced some farmers to sell at very low prices such as R0.50 so as to get rid of the crop. When
farmers started to produce the crop in summer on the advice of the project team, they realised higher
income as each head could be sold at R4.00 whereas in winter the maximum that can be charged per
head is R2.50.
At TFIS an experimental cropping plan (Table 5.3) was drawn by farmers and researchers but it was not
rigorously evaluated. It is tentatively recommended for TFIS but should be revised with time as more
information becomes available.
Table 5.3: The crop production calendar proposed for Tugela Ferry.
J
a
n
F
e
b
M
a
r
A
p
r
M
a
y
J
u
n
J
u
l
A
u
g
S
e
p
O
c
t
N
o
v
D
e
c
Cabbage
Onion
Potatoes
Butternut
Need to conceptualize an agricultural system: Sometimes the situation prevailing at a particular
irrigation scheme may require that the entire agricultural system be redesigned. When this is the case, it
is necessary to conceptualize the envisioned agricultural system, before designing it. This requires taking
into consideration a number of issues, depending on the circumstances (environmental and socio-
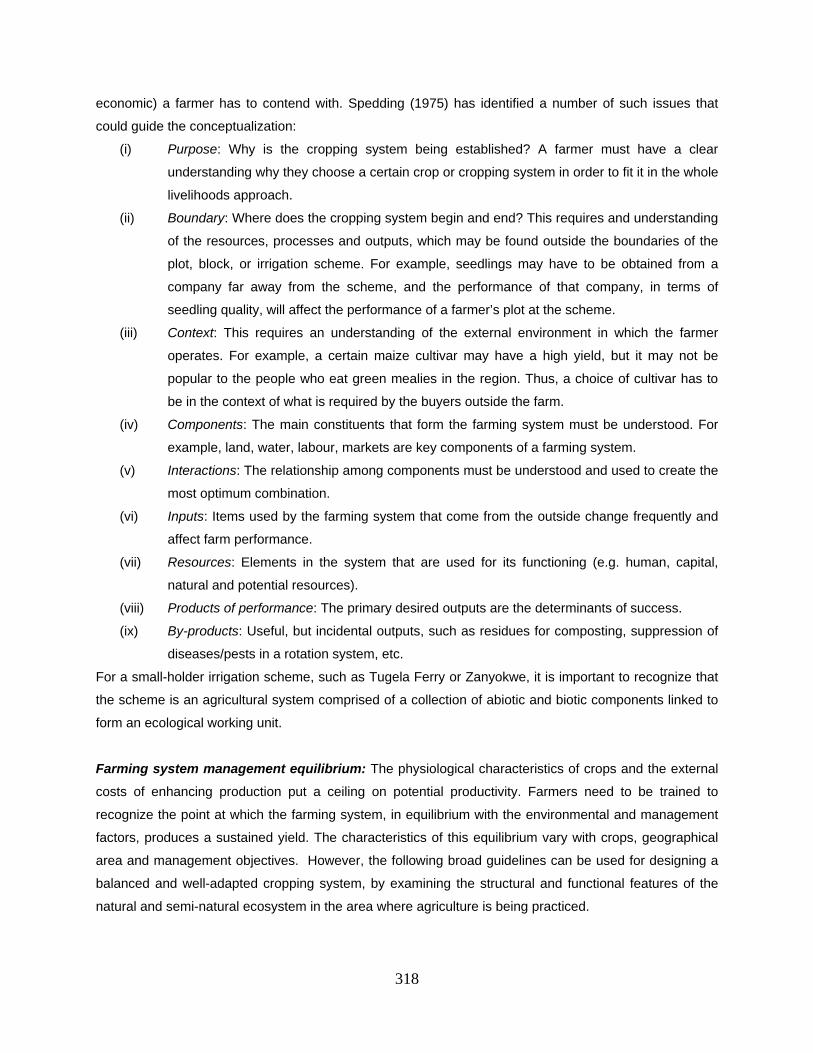
318
economic) a farmer has to contend with. Spedding (1975) has identified a number of such issues that
could guide the conceptualization:
(i) Purpose: Why is the cropping system being established? A farmer must have a clear
understanding why they choose a certain crop or cropping system in order to fit it in the whole
livelihoods approach.
(ii) Boundary: Where does the cropping system begin and end? This requires and understanding
of the resources, processes and outputs, which may be found outside the boundaries of the
plot, block, or irrigation scheme. For example, seedlings may have to be obtained from a
company far away from the scheme, and the performance of that company, in terms of
seedling quality, will affect the performance of a farmer’s plot at the scheme.
(iii) Context: This requires an understanding of the external environment in which the farmer
operates. For example, a certain maize cultivar may have a high yield, but it may not be
popular to the people who eat green mealies in the region. Thus, a choice of cultivar has to
be in the context of what is required by the buyers outside the farm.
(iv) Components: The main constituents that form the farming system must be understood. For
example, land, water, labour, markets are key components of a farming system.
(v) Interactions: The relationship among components must be understood and used to create the
most optimum combination.
(vi) Inputs: Items used by the farming system that come from the outside change frequently and
affect farm performance.
(vii) Resources: Elements in the system that are used for its functioning (e.g. human, capital,
natural and potential resources).
(viii) Products of performance: The primary desired outputs are the determinants of success.
(ix) By-products: Useful, but incidental outputs, such as residues for composting, suppression of
diseases/pests in a rotation system, etc.
For a small-holder irrigation scheme, such as Tugela Ferry or Zanyokwe, it is important to recognize that
the scheme is an agricultural system comprised of a collection of abiotic and biotic components linked to
form an ecological working unit.
Farming system management equilibrium: The physiological characteristics of crops and the external
costs of enhancing production put a ceiling on potential productivity. Farmers need to be trained to
recognize the point at which the farming system, in equilibrium with the environmental and management
factors, produces a sustained yield. The characteristics of this equilibrium vary with crops, geographical
area and management objectives. However, the following broad guidelines can be used for designing a
balanced and well-adapted cropping system, by examining the structural and functional features of the
natural and semi-natural ecosystem in the area where agriculture is being practiced.
319
(i) Primary production: Depending on the climatic and edaphic factors, each geographical area
is characterized by a type of vegetation with a specific production capacity. This natural
capacity can be reliably used as a guideline for selecting a crop that will be suitable in the
area. That is, natural grassland can be easily transformed into cereal crop (e.g. maize)
production rather than an orchard. The reverse will be too demanding on the environment
and resources, and it will not be sustainable in the long run.
(ii) Land use capability: Soils can be classified into eight land use capability groups, each
determined by physiochemical factors, such as slope or water availability. The quality and
suitability of soil for cropping diminishes from class I to VIII. Soil classification is a technical
exercise requiring expertise in soil science. Therefore, the role of (well-trained) extension
officers cannot be overemphasized in this context. However, the experience of a farmer is
invaluable in determining sustainable land use capability. Practice makes perfect, in this
regard.
(iii) Vegetational patterns: Natural vegetation can be used as architectural and botanical model
for designing and structuring an agricultural system to replace it.
(iv) Knowledge of local farming practices: In most rural areas, farmers have been cultivating for
generations. Hence, the farmers have accumulated a wealth of traditional knowledge
characterized by important elements of sustainability: adaptation to environment, reliance on
local resources, small-scale and decentralized, and conserve natural resources.
Biological and agronomic characteristics: Biological and agronomic characteristics are important in
selecting a crop for any situation and determining the appropriate management practices. These
characteristics can be taught to farmers or are known through traditional experience. Four guidelines in
this regard are important:
(i) Growing period: The number of days taken by a crop from emergence of seedlings to
harvest-maturity is important in determining the climatic zone for producing the crop and/or
fitting a particular crop/cultivar in the prevailing cropping system of a particular farm.
(ii) Photoperiodism: For many crops, the length of the night (darkness) is important to initiate
flowering, tillering or dormancy. Short-day plants require long nights to flower effectively. It is
important that a farmer knows the flowering response of his/her crops (if any) so that yield
and crop maturity can be predicted.
(iii) Growth habits: The ability of a crop to grow tall and continue to produce fruits or to be dwarf
and produce flowers and fruits over a short period is an important factor when spacing, length
of land occupation, length of harvesting period and uniformity of crop produce considered.
(iv) Root systems: The majority of crop roots are in the top 30 cm of soil. Deep rooted plants use
their tap roots to bring soluble and insoluble nutrients to the top, whereas fibrous roots hold
320
the soil against erosion. The depth of intensive rooting is affected by soil moisture, texture,
compaction, aeration and nutrient availability.
5.4.3 Best practices for different crops
Time of planting: When the project started, late planting was a common experience among farmers in
ZIS with grain maize planted until as late as mid-March. Exploratory trials indicated that maize grain yield
increased by up to 46% when planting was done before mid-December. Therefore grain maize planting in
ZIS should be done well before mid-December to avoid maize yields reductions. Green maize, on the
other hand, should be planted as soon as possible after the possibility of frost is over (usually at the
beginning of September) so that the crop can mature early when demand is high around the
Christmas/New year holidays. Use of seedlings can offer a better option over direct seeding if planting is
to be done as early as possible.
Cultivar choice
The correct selection of cultivar is of paramount importance, because the yield and quality of individual
cultivars are influenced by planting times and prevailing climatic conditions. One specific cultivar may
yield well during cooler weather but perform poorly during warmer conditions, while another, of the same
kind of crop, may produce the opposite result. Cultivars may also differ greatly in the length of their
growing season, in tolerance to specific diseases or pests which are known to occur in the cropping area,
as well as several other important aspects. For instance, an exposed field in a windy situation should not
be planted to tall long-season maize cultivars as they are more susceptible to lodging.
Plant breeders are continually producing new cultivars with different characteristics, and local seed
producers are constantly introducing promising new cultivars, which they hope would supersede the
established ones. The following is a list of some of the most popular and recommended cultivars:
Maize: Certified hybrid seed should be used under irrigation, and farmers should avoid use of retained
seed or OPVs. Even with the hybrid cultivars, ultimate choice should depend on factors such as planting
time and fertiliser rate used. Short season cultivars such as DKC 61-25 should be used when planting is
done after mid-December while medium to long season cultivars such as PAN 6777 should be used when
planting is done before mid-December. The importance of selecting appropriate cultivars is more critical in
green than grain maize production because of consumer preferences for green maize. For green maize
production, farmers should choose from among the cultivars recommended by the National Department
of Agriculture (1998) and some other more recent hybrids that can be used (Van Averbeke, 2008). These
include hybrid cultivars SC701, SR52, HL 19, PAN6549, PAN93, SNK2665 and SNK2147. So far SC701
is the most common and popular green maize cultivar at both ZIS and TFIS.
321
Butternut: Waltham is the most popular cultivar used as it produces good fruit size and higher yields.
There are other hybrids available, but the cost of seed is very high and they produce very big fruits which
are unpopular in the market. Such examples include Sunset and Carnesi.
Cabbage: For summer cabbage, cultivars include Star 3301, Star 3304, Hercules, Green Star, Centauro
and Beverly Hills. Tenacity is another cultivar suited for summer production and it is highly resistant to
black rot, an important summer disease. Green Coronet, Conquistador, Green Crown, Grand Slam and
Star 3306 are the most popular cultivars for winter production. Cultivars suited for all-year production
include Megaton and Star 3316. Megaton produces very large heads but is not resistant to black rot.
Carrot: There is a small niche market for round (spherical) carrots, such as those produced by the Paris
Market type, and a slightly larger requirement for conical baby carrots (Red Core Chantenay gives an
ideal product). There is also a growing market for longer, more cylindrical, fine baby carrots. However, the
main requirement on the fresh market is for larger roots. The following cultivars, usually with a cylindrical
to longish, tapered root, are commonly grown: Cape Market, Chantenay Karoo, Chantenay Royal,
Flacora, Ithaca, Kuroda, Senior, Star 3006 and Sugar Snax.
Beetroot: Standard cultivars include Detroit Dark Red and Crimson Globe. Other alternatives are Star
1102 and Star 1105 and the seed for these cultivars is relatively cheap. Red ace is a very expensive
cultivar, but does not develop white rings or get stringy with age, as do standard cultivars.
Use of certified seeds: Before 2004, farmers had a tendency of keeping seed from the previous harvest,
a practice that affected yields in a negative way. After the implementation of the BMP project, they
adopted a habit of using certified seed. This practice led to quality improvement, which increased the
quantity of produce that could be marketed. By the close of the project in 2008, all grain maize farmers
used certified hybrid seed.
Crop establishment: An onion trial at TFIS revealed that the optimum seedling size for onion crop
establishment is 20 cm (three leaves). Smaller seedlings (8 cm) performed poorly due to their relatively
smaller photosynthetic area compared to larger seedlings. A study evaluating the effect of propagule size
on potato establishment and yield at TFIS revealed that regardless of the cultivar, large propagules (120
g) showed better emergence, final stand establishment, and yield than small propagules (25 g). The
better performance was attributed to higher nutrient reserves in large propagules compared with small
propagules. Use of larger propagules is, therefore, recommended as a best practice for TFIS and
elsewhere where potatoes are grown.
Planting population: Experience at ZIS showed that short season maize cultivars should be planted at
higher densities of up to 90 000 plants ha-1 while medium and long season cultivars could be planted at
40 000-60 000 plants ha-1. Planting population should also be chosen to suit market requirements,

322
especially in the case of vegetable crops. Butternut should be grown at a population of 15 000 to 25 000
plants ha-1, depending on market requirements. Where the market demands fruits of smaller size, a plant
population 25 000 plants ha-1 should be used to maximise on marketable yield but when the market
demands bigger fruits, a lower population should be used. Above average cabbage yields could be
realized at TFIS with the adoption of the recommended cabbage planting density of 40 000 to 45 000
plants ha-1. Higher planting densities caused yield reduction even under high levels of management.
Time of harvest: This is often critical. The product must be harvested at the correct stage of
development/maturity/ripeness, particularly where it still has to be marketed. The closer one is to the
market, and/or the more favourable the transport / storage conditions, the fresher the produce will be
when it reaches the consumer. This is particularly important where, for example, carrots or beetroots are
sold in bunches (with leaves attached), or with fresh leafy vegetables such as spinach and lettuce.
Harvesting should be done in the cooler, late afternoon than during the morning or midday heat as the
fresh produce will be less affected by the heat until moved to a cooler environment.
Handling/grading, packing and marketing: Most vegetable produce bruises easily so must be handled
carefully. Very often the damage is first noticed at the market or retailer, and the producer cannot then
expect to get a good price. Vegetable produce is highly perishable and must be marketed without delay
and in the right packaging to make sure it remains fresh until it is sold. This is particularly important for
produce such as lettuce and leafy bunched vegetables that rapidly deteriorate in condition / appearance.
Soil fertility management
The correct use of fertilisers in terms of rates and timing are of paramount importance to crop production
under both rain-fed and irrigated conditions. The first step in deciding a fertilizer management programme
is to determine the yield potential/target of the farm. This should be done with the help of Extension
Officers by taking into consideration such factors as the production area, soil, planting date, cultivar and
availability of irrigation water and equipment. Next farmers should send soil samples to Soil Testing lab
near them well ahead of the planting season. This activity should be coordinated by the Scheme
Management to ensure that soil samples are taken on time such that recommendations are received by
farmers before planting commences. When soil samples are sent for analysis, the results often come
back with requested fertilizer recommendations for different crops. However, the guidelines given in
Tables 5.4 and 5.5 can be used to estimate fertilizer recommendations for the commonly grown crops at
ZIS and TIF.
Based on the study conducted at ZIS, for green maize produced by transplanting, fertiliser should be
applied at 98 kg N ha-1 or more, but if maize is direct-seeded, fertiliser rate should be increased to 149 kg
N ha-1 to obtain marketable cobs at 40 000 plants ha-1 as used at ZIS. In butternut production, growers
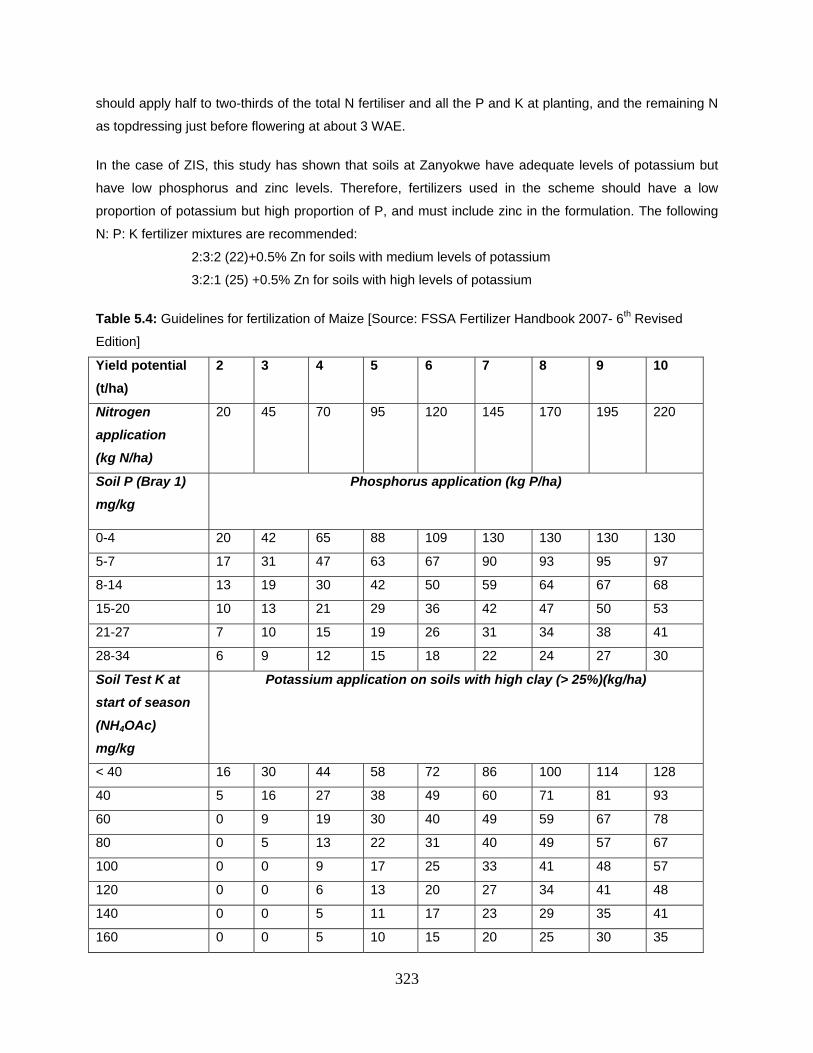
323
should apply half to two-thirds of the total N fertiliser and all the P and K at planting, and the remaining N
as topdressing just before flowering at about 3 WAE.
In the case of ZIS, this study has shown that soils at Zanyokwe have adequate levels of potassium but
have low phosphorus and zinc levels. Therefore, fertilizers used in the scheme should have a low
proportion of potassium but high proportion of P, and must include zinc in the formulation. The following
N: P: K fertilizer mixtures are recommended:
� 2:3:2 (22)+0.5% Zn for soils with medium levels of potassium
� 3:2:1 (25) +0.5% Zn for soils with high levels of potassium
Table 5.4: Guidelines for fertilization of Maize [Source: FSSA Fertilizer Handbook 2007- 6th Revised
Edition]
Yield potential
(t/ha)
2 3 4 5 6 7 8 9 10
Nitrogen
application
(kg N/ha)
20 45 70 95 120 145 170 195 220
Soil P (Bray 1)
mg/kg
Phosphorus application (kg P/ha)
0-4 20 42 65 88 109 130 130 130 130
5-7 17 31 47 63 67 90 93 95 97
8-14 13 19 30 42 50 59 64 67 68
15-20 10 13 21 29 36 42 47 50 53
21-27 7 10 15 19 26 31 34 38 41
28-34 6 9 12 15 18 22 24 27 30
Soil Test K at
start of season
(NH4OAc)
mg/kg
Potassium application on soils with high clay (> 25%)(kg/ha)
< 40 16 30 44 58 72 86 100 114 128
40 5 16 27 38 49 60 71 81 93
60 0 9 19 30 40 49 59 67 78
80 0 5 13 22 31 40 49 57 67
100 0 0 9 17 25 33 41 48 57
120 0 0 6 13 20 27 34 41 48
140 0 0 5 11 17 23 29 35 41
160 0 0 5 10 15 20 25 30 35
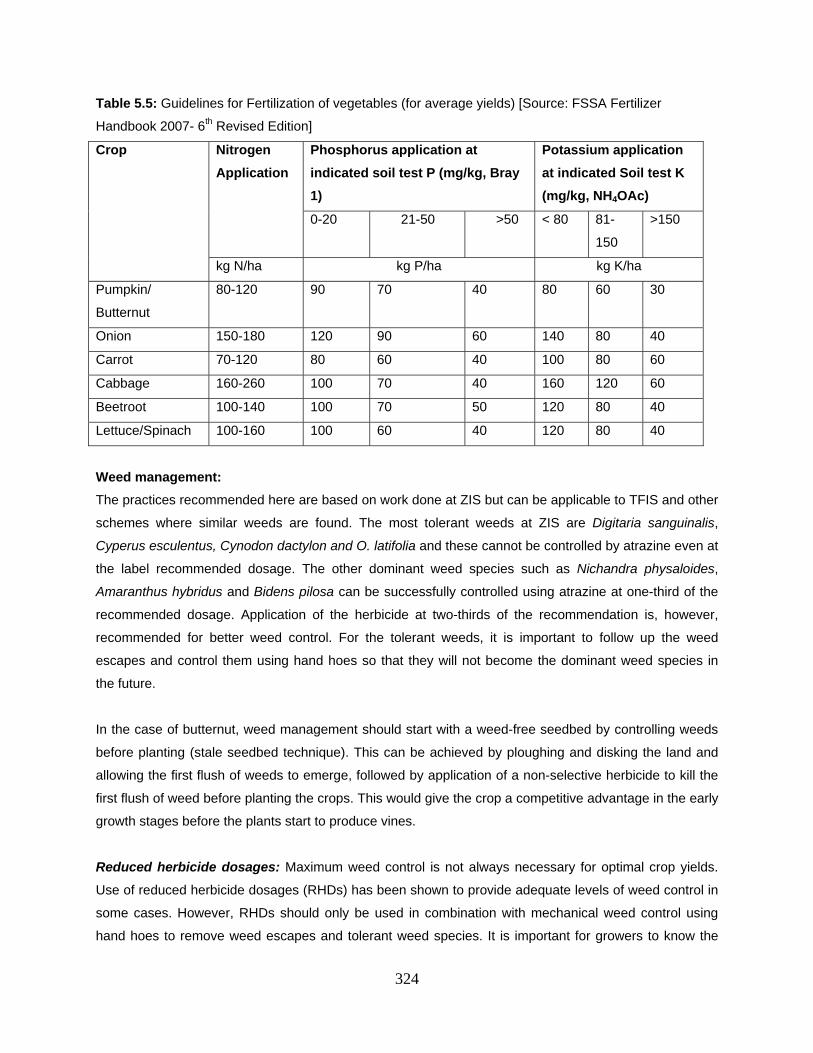
324
Table 5.5: Guidelines for Fertilization of vegetables (for average yields) [Source: FSSA Fertilizer
Handbook 2007- 6th Revised Edition]
Crop Nitrogen
Application
Phosphorus application at
indicated soil test P (mg/kg, Bray
1)
Potassium application
at indicated Soil test K
(mg/kg, NH4OAc)
0-20 21-50 >50 < 80 81-
150
>150
kg N/ha kg P/ha kg K/ha
Pumpkin/
Butternut
80-120 90 70 40 80 60 30
Onion 150-180 120 90 60 140 80 40
Carrot 70-120 80 60 40 100 80 60
Cabbage 160-260 100 70 40 160 120 60
Beetroot 100-140 100 70 50 120 80 40
Lettuce/Spinach 100-160 100 60 40 120 80 40
Weed management:
The practices recommended here are based on work done at ZIS but can be applicable to TFIS and other
schemes where similar weeds are found. The most tolerant weeds at ZIS are Digitaria sanguinalis,
Cyperus esculentus, Cynodon dactylon and O. latifolia and these cannot be controlled by atrazine even at
the label recommended dosage. The other dominant weed species such as Nichandra physaloides,
Amaranthus hybridus and Bidens pilosa can be successfully controlled using atrazine at one-third of the
recommended dosage. Application of the herbicide at two-thirds of the recommendation is, however,
recommended for better weed control. For the tolerant weeds, it is important to follow up the weed
escapes and control them using hand hoes so that they will not become the dominant weed species in
the future.
In the case of butternut, weed management should start with a weed-free seedbed by controlling weeds
before planting (stale seedbed technique). This can be achieved by ploughing and disking the land and
allowing the first flush of weeds to emerge, followed by application of a non-selective herbicide to kill the
first flush of weed before planting the crops. This would give the crop a competitive advantage in the early
growth stages before the plants start to produce vines.
Reduced herbicide dosages: Maximum weed control is not always necessary for optimal crop yields.
Use of reduced herbicide dosages (RHDs) has been shown to provide adequate levels of weed control in
some cases. However, RHDs should only be used in combination with mechanical weed control using
hand hoes to remove weed escapes and tolerant weed species. It is important for growers to know the
325
spectrum of weeds in their crop land before they select which herbicide to use. They can then select a
herbicide program that is appropriate for the spectrum of weeds in the field, i.e. the herbicide that will
control the most troublesome and/or majority of weeds.
In ZIS, mixing reduced dosages of atrazine (which controls mainly broadleaf weeds) and nicosulfuron
(which mainly controls grass weeds) will provide better weeds control compared to similar or higher doses
of each individual herbicide. In addition, mixing two complementary herbicides will reduce the need to
follow up application of reduced dosages with weed control tillage to remove weed escapes. Combining
RHDs with competitive cropping systems such as optimum plant populations and narrow rows could be
more effective and sustainable in the long run.
Plant maize in straight rows for successful mechanical weed control: One of the most common
methods of pre-emergence weed control in maize is through inter-row cultivation using a tractor-drawn
cultivator. It was noticed that the practice resulted in significant crop loss in maize and this was caused by
the rows, which were not straight. Straight rows are a pre-requisite if inter-row cultivation is to be used for
weed control.
Weed control under conservation agriculture: In no-till maize production the weed management
strategy should start with a weed free seedbed and especially grass weeds. For best weed control, a pre-
plant weed control strategy using a mixture of grass and broadleaf herbicides like glyphosate and atrazine
should be applied early in the season in fields irrigated for at least 3 hours prior to herbicide application.
The herbicide should be given adequate time to kill the weeds before planting the crop. A second
herbicide application should be done where the first spray did not achieve a satisfactory weed kill. In
cases where non-grass weeds grow tall during the fallow season, a bush cutter should be used to clear
the tall bushes before planting the no-till maize crop. Early control of broad leaved weeds should follow
preferably 4 weeks after crop emergence.
Pre-plant herbicide application: Generally, pre-plant foliar-applied non-selective herbicides such as
glyphosate should be applied when the weeds are still small and are in their tender growth stages. For
improved efficacy, farmers should first irrigate their fields or wait for the first rain so that the first flush of
weeds emerges. Pre-plant or pre-emergence soil-applied herbicides such as atrazine should be applied
when there is sufficient soil moisture. Application to dry soil leads to loss of herbicide through
volatilisation, resulting in compromised control of weeds, particularly those that would not have emerged.
Farmers need to first irrigate their fields before applying soil herbicides so that the herbicide solution can
form a seal deep enough to reach a depth where the majority of weeds are located in the seed bank.
326
6 GENERAL DISCUSSION, CONCLUSIONS AND RECOMMENDATIONS
6.1 General Discussion
6.1.1 Introduction
As noted in the general introduction, this project addressed four key constraints at Zanyokwe and Tugela
Ferry Irrigation schemes that were identified as critical to achieving increased productivity at the schemes.
These were weak/poor institutional and organizational arrangements, lack of stable markets,
dysfunctional irrigation infrastructure, and poor crop management. These constraints informed the
research agenda of this project whose goal, objectives, and expected outcomes are shown in Fig. 1.1.
These socio-economic, institutional and biophysical constraints to productivity, options for addressing
them, results of tested technological options for addressing the constraints, and the socioeconomic
impact of the tested interventions are addressed separately for each scheme in Chapters 2 and 3. This
section presents an integrated discussion of some key findings as a prelude to the general conclusions
and recommendations.
6.1.2 Weak institutional and organisational arrangements
The situation analysis conducted at the beginning of this project (Monde at al., 2005) revealed that many
of the problems at ZIS and TFIS were institutional and related to governance of the schemes, land tenure
and the sharing of water. Land tenure is a particularly serious problem at Zanyokwe where insecure land
tenure arrangements are limiting access to land and undermining interest and commitment to farming.
According to Van Averbeke et al. (1998) and as noted elsewhere in this report, Zanyokwe has at least 3
types of tenure systems: freehold (landowners), quitrent (pay rent to magistrate) and right to occupy
(communal under traditional leadership). Farmers on quitrent and ‘right to occupy’ land tenure
arrangements have no sense of ownership and hardly invest in new technologies. While the project team
tried to address the problem during the lifespan of the project, no headway was made in solving it by the
time project activities were terminated. The urgent need to develop policy on land tenure that would
favour those interested and capable of farming so as to improve on productivity and overall scheme
performance cannot be overemphasized. The newly formed stronger and more representative farmer
organizations at the schemes should continue to address this problem in collaboration with the
Departments of Agriculture as well as Water Affairs in the two provinces. Among options which could be
considered are the land consolidation approaches suggested by Denison and Manona (2007a). The
‘plotholder to farmer lease arrangement’ is one option that may have some relevance to the Zanyokwe
and Tugela Ferry situations. In this arrangement, plotholders with land-rights but not using their land for
one or other reason can retain the right to the land (typically a Permission to Occupy) but allow relatively
secure access to a lessee for a set time period through a legally binding arrangement. This
according to Denison and Manona (2007a) will allow the more successful farmers on the scheme to
expand their operations and operate more profitably. The chances for success are high as the
327
arrangement provides security to both the lessor and lessee. Denison and Manona (2007a) provide a
step-by-step description of a land leasing methodology that could be used for implementing it. This
arrangement needs to be given a chance along with any other promising options.
Good leadership and institutional arrangements are crucial to the success of any organization. Both
Zanyokwe and Tugela Ferry Irrigation schemes had very weak organisational and institutional
arrangements in 2004 as articulated in sections 2.2.4 and 3.3.1.1. Therefore, the revitalization of the
schemes hinged first and foremost on the strengthening of farmer organizations at both schemes. The
organisational structure at ZIS was the Zanyokwe Agricultural Development Trust (ZADT) while at TFIS
farmers in each of the seven blocks were organized into farmer’s association affiliated to a scheme-wide
umbrella committee (Monde et al., 2005). The main responsibilities of ZADT and the umbrella committee
at TFIS were to address the water, land, and infrastructural issues as well as farming related activities like
mechanization, procurement of inputs and lobbying for produce markets. However, as discussed earlier,
both organizations were largely ineffective and did not ably discharge their responsibilities with negative
consequences on productivity and overall performance of the two schemes.
The project addressed the issue of organizational arrangements at the schemes in cooperation with other
key stakeholders, which included the Departments of Agriculture in the two provinces, Department of
Water Affairs (DWA) and Traditional leaders. This was guided by suggestions by Chancellor (2001) to the
effect that for better effectiveness, farming related activities needed to be managed separately from
irrigation and infrastructure functions. This approach is also supported by Denison and Manona (2007a)
who further stressed that the two elements needed equal attention as they were equally important for
successful management of scheme activities. The project team embraced this approach and worked with
DWAF to form Water Users’ Associations (WUA) at both schemes to specifically deal with the
management of water and infrastructure functions. The formation of the WUAs was ongoing when project
activities terminated but it is hoped that these processes will in due course be completed.
With regard to management of farming related activities, four primary cooperatives were registered and
two were at advanced stages of registration at the termination of the project at ZIS. In addition, a central
Farmers’ Cooperative for ZIS was established to take the place of ZADT that was disbanded due to its
ineffectiveness. In Tugela Ferry, a decision was taken to revive the defunct Msinga Vegetable Producers
Cooperative (MVEPCO), as an umbrella body to manage the farming related functions. The main
responsibilities of the central co-op in ZIS and MVEPCO in TFIS are to organize markets for various
products, purchasing inputs as well as to solve problems experienced by primary co-operatives. As these
organizational structures were in formative stages at the time project activities terminated, the
Departments of Agriculture at the two schemes will need to work closely with farmers in collaboration with
other stakeholders so as to take these processes to their logical conclusions. One task that will need the
328
immediate attention of the scheme management structures is the need to manage the expressed fear of
farmers with respect to the establishment of WUAs which most of them felt would make them pay for
water. Ongoing training and education of farmers will be necessary to give farmers the understanding and
confidence they need on the long term benefits of WUAs so that they can fully embrace WUAs as
indispensable to the smooth functioning of scheme activities.
6.1.3 Socio-economic constraints
Lack of capital and stable markets were two socio-economic problems prioritised highly by farmers in ZIS
and TFIS. Lack of stable markets was singled out as significantly contributing to the poor performance
and therefore an important leverage point in improving performance of the scheme. The two constraints
are dealt with separately hereunder.
Access to Credit facilities
Most households in Zanyokwe and Tugela Ferry earn incomes below the poverty line and thus have
limited capacity to invest in their farming enterprises. To compound the problem they also have limited or
no access to credit because credit facilities tend to be available from big and well-structured financial
institutions that do not cater for small time producers allegedly because of the prohibitive cost of
managing many small loans. In addition, small-scale irrigators lack the security and collateral required by
these financial institutions. This means that farmers cannot invest in necessary farming inputs or hire
labour which inevitably affects their productivity. The newly formed farmer organizations will need to
address the problem of access to credit at both schemes. One avenue, which could be considered, is
accessing credit facilities through micro-finance institutions that are equipped to serve clientele without
the security and collateral required by bigger financial institutions. The Zanyokwe scheme at one time got
credit facilities (soft loan) from a bank via an arrangement with the Department of Agriculture, whereby
the borrowed funds would become a revolving fund when paid back. The arrangement, however, failed
because the payback was not as good as planned, possibly because farmers did not make good incomes
due to agronomic and marketing constraints. Some of these constraints have, however, been addressed
through this project so if the credit arrangement could be given another chance it may have better
outcomes than when first tried.
Access to markets
The situation analysis revealed that the marketing of crops and vegetables to be a problem at Zanyokwe
and Tugela Ferry irrigation schemes (Monde et al. 2005). As discussed elsewhere in this report, the
underlying causes included poorly organized markets, unsatisfactory marketing services provided by
329
middlemen, informal marketing contracts, lack of pricing standards and poor state of infrastructure related
to marketing (roads, storage facilities, etc.). Elsewhere in South Africa, the same problems have been
identified (Van Averbeke and Khosa, 2004). The project’s intervention in this problem was informed by
knowledge of the fact that marketing is a process that involves many elements including: gathering of
information about consumer preferences, securing markets for produce, planning and scheduling
production, managing production, harvesting, grading, packaging, transporting and selling.
Analysis of the different weaknesses in the marketing process articulated elsewhere in this report led to
the participatory adoption of a two-pronged strategy for addressing the marketing problems. This involved
addressing immediately problems whose causes were known followed by a study to unravel the less
understood causes. One action that was immediately taken was the strengthening of management
structures of both schemes as articulated in section 6.1.2 and elsewhere in the report. The strengthening
of farmer organizations and their management structures is a major project milestone towards successful
marketing at the schemes as it gave the farmers the collective strength they needed to influence markets
to their advantage. This intervention has started to bear fruit as revealed by the socio-economic impact
assessment reported in section 2.12 which indicated a change in the area of marketing whereby the
number of farmers involved in collective action marketing in Zanyokwe improved from less that 20% in
2005 to 83% in 2008. This was an improvement from the 67% of farmers who relied solely on farm gate
selling when this study was initiated in 2005.
The marketing study revealed that production at both schemes was not informed by demand and quality
standards were not adhered to. The project intervened by conducting capacity building workshops at both
schemes which coupled with a number of ‘look and see’ visits to different market outlets helped farmers
appreciate the importance of: (i) market-linked crop production planning; (ii) careful planning of production
to ensure regular supplies and avoid surpluses; (iii) grading and good produce quality in achieving good
prices and regular sales; (iv) knowledge of alternative marketing channels; and (v) market information
including times of the year when different products fetch higher prices at the market. In response to these
interventions, farmers have started adopting cropping patterns that reflect market demands and their
production is now generally profit driven. In the case of ZIS, farmers have shifted emphasis from grain
maize to more butternut and green maize production because these products fetch higher prices. They
also perform extra marketing functions such as grading of butternut which is earning them higher prices.
A secondary benefit is that as a result of the profit drive sparked by better and profitable marketing
arrangements there is increasing interest among farmers to learn improved crop husbandry practices so
as to produce more and improve profits. This response adds credence to the finding by Al-Hassan et al.
(2006) that better market access can result in expanded production and adoption of productivity-
enhancing technologies.
330
Al-Hassan et al. (2006) correctly state that smallholders are motivated by the certainty of market access,
reduction in price uncertainty, and better access to inputs at reduced costs. This could be best achieved
through sustainable partnership between the farmers and market outlets. The ZIS farmers have been
involved in contract farming for Pick ‘n’ Pay but this has not evolved into a sustainable linkage mainly due
to lack of capacity building through farmer training and monitoring the production of crops which resulted
in low quantity and poor quality produce. The newly established farmer organisation at the scheme needs
to continue addressing this weakness in collaboration with the extension staff in the Department of
Agriculture. The Tugela ferry farmers have thus far not been involved in contract marketing but may wish
to explore this avenue as well because of its obvious benefits. The farmer organizations at the schemes
will need to be capacitated on contract negotiations through ongoing training in order to be effective
channels for two-way communications between farmers and their marketing outlets. If properly done this
may lead to successful and sustainable farmer-marketing outlet linkages, as the interests of both parties
will be taken care of. The farmers will have the market access guarantees they need and the marketing
outlets will be assured of quality produce and regularity of supplies.
6.1.4 Infrastructural constraints
The situation analysis revealed that both ZIS and TFIS were experiencing a number of infrastructural
problems, which farmers ranked as priority constraints (Monde et al., 2005). Problems at the Zanyokwe
scheme, which uses a sprinkler system of irrigation with water drawn from the Sandile dam, included
missing hydrant pipes, leaking sub-main pipes, uneven stand pipes and malfunctioning valves in certain
parts of the scheme. Farmers also lacked skills to do system trouble shooting as well as basic equipment
and system maintenance. The Tugela Ferry scheme, which uses the short furrow system of irrigation
drawing water from the Tugela River, had problems with the water canals, which were not regularly
repaired and maintained. Both schemes were built by the government with the good intention of
improving the livelihoods of the communities but the human capital was not developed to the level of
taking the ownership of the infrastructure and the responsibility to maintain it.
Lankford (2001) attributes the lack of ownership generally observed in smallholder irrigation schemes to
the fact that they were built and paid for by somebody else. However, Denison and Manona (2007a)
argue that a key element in ownership is not simply sweat or cash involvement but participatory
involvement of beneficiaries in making decisions about the content of the development. Therefore, to
ensure that ownership is entrenched in a development initiative, beneficiaries must be involved in all
stages of the process. This is the approach the project team took at the two schemes and as a result by
the time project activities were terminated farmers at both schemes had started getting involved in the
maintenance of their irrigation infrastructures where it was within their ability to do so. Guidelines on how
best to do this are given in chapter 5 of this report.
331
The ZIS required major rehabilitation so in 2007, the ECDA appointed a scheme manager to co-ordinate
the revitalisation activities in the scheme. The revitalization focussed mainly on infrastructural investments
that included renovation and purchase of new irrigation equipment. A total of R9.25 million is believed to
have been spent on infrastructural development at ZIS between 2006 and 2008 (Mpengesi1, 2009,
personal communication). This revitalisation effort did not, however, pay attention to other constraining
factors cited in previous studies, such as land tenure (Tlou et al., 2006), for example. Its main focus was
on hardware issues to the exclusion of the soft skills aspects, which are equally important in revitalization
of irrigation schemes. This revitalization effort failed to take into account views expressed by Denison
and Manona (2007a) that “infrastructure development alone as a dominant part of the intervention
(revitalisation) is highly unlikely to succeed. Farmers in smallholder schemes need support that go far
beyond just the irrigation system if they are to improve their livelihood significantly. Narrow sectorally
isolated engineering and infrastructure driven programmes have substantially increased risk of failure.
The interventions that are based on comprehensive strategies addressing the complex of activities that
make up the irrigation enterprise are most likely to succeed. These include …and crop production
information.” These views have been vindicated by the findings of this project as will be shown in the next
section.
6.1.5 Agronomic constraints
As noted elsewhere in this report, poor smallholder irrigation scheme performance is believed to be a
result of a number of causes as including infrastructure deficiencies emanating from inappropriate design,
management and maintenance, both beneficiaries and government assigned extension officers lacking
technical expertise and ability, absence of people involvement and participation, inadequate institutional
structures, inappropriate land tenure arrangements, local political power games, a history of dependency
and subsistence orientation, low land productivity and high cash costs (Bembridge, 2000; Crosby et al,
2000; Oosthuizen, 2002; Perret et al., 2003; Denison and Manona, 2007a, b; Van Averbeke, 2008).
However, Crosby et al. (2000) cited low yield levels as probably the main reason for the failure of many
small-scale irrigation schemes in South Africa suggesting that farmer practice may be constraining
performance in spite of the state of irrigation infrastructure and other institutional factors. Among other
things, this project sought to answer the question whether an improvement in agronomic management of
crops would result in higher productivity levels despite the state of irrigation infrastructure and other
constraints. The findings reported in chapters 2 and 3 showed that high levels of productivity could be
enhanced through improving agronomic management of crops. The studies indicated that whilst crop
yields under rain-fed cropping are most often limited by factors beyond the control of the farmer, such as
rainfall or cool temperatures, yields under irrigation are most often limited by one or more of the factors
that farmers can control. Major agronomic factors identified as constraining productivity were basic
management practices such as weed, water, fertiliser and plant population management, late planting,
1 Mpengesi (Mr.) was the Zanyokwe irrigation scheme manager
332
and choice of cultivars. All these factors were within the farmers’ abilities to control and when they were
addressed by the project team yields improved substantially and the results obtained formed the basis of
the guidelines on best management practices given in chapter 5 of this report. What the results and the
guidelines developed there indicate is that improving performance at the two schemes largely calls for a
‘going back to crop husbandry basics’, among other things. This implies that smallholder irrigation
scheme revitalization programs should include giving farmers “back to basics” training on basic
management skills for irrigated crop production along with necessary financial support to invest in the
implementation of the skills learnt. Such an intervention will go a long way in improving crop productivity
and incomes in the schemes, which may make farmers more receptive to requirements such as paying
for water when WUAs become operational.
6.1.6 Access to support services
Irrigated farming systems, like other farming systems, cannot succeed as viable business entities without
some essential support services. Denison and Manona (2007a) identified some critical gaps in
smallholder irrigation support services in the areas of finance, input supplies, crop production knowledge,
farm management, marketing and post harvesting processing. All these gaps apply to ZIS and TFIS as
well, and some have been addressed by this project namely, aspects of finance, input supplies, and
product markets (sections 6.1.2 and 6.1.3). The aspects of irrigation and crop production knowledge, and
farm management skills fall within the mandate of extension support services provided by the
Departments of Agriculture in the two provinces. However, these services were not provided at optimum
levels at the time project activities were terminated. The reasons for less than optimal extension services
varied between ZIS and TFIS. Farmers at ZIS no longer had their own extension officers, unlike when the
project started, because the Department of Agriculture introduced the ward system whereby ZIS together
with a number of other villages form ward 10 and served by two extension officers. In addition, lack of
transport for extension officers continued to prevent extension officers from interacting more often with
farmers. Access to extension services is much better in Tugela Ferry because the District office of the
Department of Agriculture is located just about 5 km from the scheme and has four technicians dedicated
to the scheme. Denison and Manona (2007a) have suggested hiring extension assistants and master
farmers as means of increasing extension services to farmers.
Another reason for the limited impact of extension services on farming operations at both schemes is that
extension officers lacked basic technical skills on crop husbandry and irrigation management. This lack of
skills is worse with irrigation knowledge as none of the extension officers at the two schemes has had any
formal training in irrigation management, and do not consider its transmission to farmers to be part of their
mandate. Therefore, capacity building is required in crop husbandry, water management and other areas
of operation and maintenance of irrigation to enable extension officers to provide meaningful support to
the farmers.
333
6.1.7 Academic institutions partnerships
The impact that this project had at the two schemes can be attributed to its direct involvement as well as
its catalytic role at the schemes. The knowledge generated through the action research programs
implemented at the schemes was quickly adopted by farmers due to the participatory nature of the
project. The extension officers also gained valuable practical experiential knowledge during the lifespan of
the project. It is hoped that with the termination of project activities and withdrawal of the project teams
from the schemes the momentum achieved will not slow down and the benefits gained slowly but surely
lost. Lasting academic partnerships between the academic institutions involved and the relevant irrigation
schemes are needed. The WRC, which has funded action research in irrigation schemes in South Africa
for many years, can play a facilitating role in the establishment of these partnerships. It could do so by
supporting research chairs in irrigated farming systems in academic institutions located near these
irrigation schemes. The Chairs would be responsible for strengthening teaching, research, and outreach
in irrigation at the institutions they are based in whilst maintaining active research programs at the
schemes.
6.2 Conclusions
The main objective of this project was to develop and implement technologies and knowledge useful for
farmers in order to improve rural livelihoods in Zanyokwe and Tugela Ferry irrigation schemes. Scheme
specific conclusions are given in chapters 2 and 3. Generally, the project findings clearly indicate that the
underperformance of the two schemes and hence lack of impact on the livelihoods of the communities
that depend on them, was largely a result of weak institutional and organizational arrangements, lack of
stable markets, dysfunctional irrigation infrastructure, and poor crop management. Of the four constraints,
weak institutional and organizational arrangements and poor crop management practices contributed the
most to the underperformance of the schemes. Weak institutional/organizational arrangements and lack
of strong decisive leadership impacted negatively on every aspect of the irrigated cropping systems while
poor crop husbandry practices such as weed, fertiliser and water management, late planting, low plant
populations, cultivar choice and low cropping intensities contributed to the low productivity levels
observed in the schemes. The action research agronomic studies conducted demonstrated that it is
possible to achieve potential or near-potential yields as attained in commercial farms by simply improving
the crop husbandry practices. The findings unequivocally suggest that smallholder irrigation scheme
revitalization programs should place capacity building in basic crop and irrigation management practices
prominently in their revitalization agendas in any efforts to improve on the performance of these schemes
in South Africa.
334
6.3 Recommendations
1. The farmer organizational and management structures that were put in place at the schemes
should be strengthened and sustained so as to ensure that the schemes are properly managed
and administered.
2. The process of forming water users associations started at the schemes during the lifespan of the
project should be finalized. The new farmer management structures at the schemes need to
cooperate with DWA and the provincial departments of agriculture to finalize this exercise.
3. There are many well meaning organizations that get involved in the schemes on different
occasions but whose activities are not coordinated and at times end up being counterproductive.
This could be addressed through the establishment of stake holder committees at the schemes
which would ensure that the synergies of all organizations active in the schemes are optimally
exploited for increased productivity at the schemes. This task could ideally be spearheaded by
the provincial department of agriculture in each province as it is the most active organization in
each scheme.
4. There is urgent need to develop land tenure policies in the schemes that would allow increase of
access to arable land to those interested and capable of farming. This will increase land utilization
and improve productivity and overall scheme performance. The urgency for action in this regard
is greater for ZIS than it is for TFIS.
5. Revitalization programs should not focus on hardware issues only but rather on all constraining
factors including the soft aspects such as capacitating farmers in basic crop husbandry and
irrigation management skills.
6. Farmers at both schemes need to receive regular training in basic crop husbandry, irrigation
management, record keeping, financial management, and leadership skills. Empowering the
farmers with non-farming skills will empower them to be good managers for their farming
activities, the people they work with as well as those who work for them.
7. Poor maintenance of irrigation infrastructure at both schemes seems to be a result of the fact that
farmers do not view the scheme infrastructure as their property. To ensure that ownership is
entrenched in the minds of the irrigators, all revitalization and development initiatives at the
schemes should involve the irrigators in a participatory way at all stages of the processes.
8. Access to support services such as credit, market information and intelligence, extension services
should be strengthened. It is recommended that the Departments of Agriculture assign and train
extension officers dedicated to servicing the irrigation schemes.
9. Crop planning in the schemes should be market driven as informed by market information and
intelligence.
10. Both schemes need to explore alternative cropping systems that would ensure viability in the face
of limitations of labour and skills. One labour-saving technology that warrants investigation is the
335
practice of conservation agriculture. Adoption of conservation farming practices would (1) reduce
labour requirements especially in peak operations of land preparation and weeding, (2) increase
food security by making more efficient use of irrigation water, and by increasing soil fertility
through the introduction of N-fixing cover crops, and (3) improve pest regulation and reduce
dependence on external inputs.
11. Levels of productivity were much higher in TFIS than ZIS. There are, therefore, lessons that
farmers in ZIS can learn from those in Tugela Ferry. It is recommended that exchange visits be
organized for the two schemes so that irrigators can learn from each other.
12. Academic institution partnerships can play important roles in the generation of knowledge, testing
of technologies and adoption of the same by farmers in the schemes. It is recommended that
such partnerships be institutionalized through the establishment of research chairs on irrigated
cropping systems at selected key institutions located in areas where there are many irrigation
schemes in the vicinity of the institutions. This could be implemented on a pilot basis to begin
with.
336
References
AL-HASSAN, R.M., SARPOND, D.B. & MENSAH-BONSU, A., 2006. Linking smallholders to markets. A
draft report submitted to the International Food Policy Research Institute’s Ghana Strategy Support
Program (GSSP). Background paper number GSSP 0001. [Online]. Available at
http://pdf.usaid.gov/pdf_docs/PNADL412.pdf. [Date of access: 31/07/2009].
BACKEBERG, G.R. & GROENEWALD, J.A., 1995. Lessons from the economic history of irrigation
development for smallholder settlement in South Africa. Agrekon, 34(4):167-171.
BEMBRIDGE, T.J., 1996. Small-scale farmer irrigation schemes in South Africa. In Backeberg et al.,
Policy proposal for irrigated agriculture in South Africa. WRC Report, Pretoria, SA.
BEMBRIDGE, T.J., 2000. Guidelines for rehabilitation of small-scale farmer irrigation schemes in South
Africa. WRC Report num. 891/1/00, Pretoria, SA.
CAMP, K. G.T. 1999. The Bioresource units of KwaZulu-Natal. Cedara ReportN/A/95/32. KwaZulu-Natal
Department of Agriculture and Environmental Affairs, Pietermaritzburg.
CARNEY, D. 1998. Implementing the sustainable rural livelihood approach. In: D. Carney (eds.)
Sustainable Rural Livelihoods: What Contribution Can We Make? Pp. 3-23. London: Department for
International Development.
CARTER, M.R. & MAY J. 1997. Poverty, livelihood and class in rural South Africa. Department of
Agricultural & Applied Economics, University of Wisconsin, Madison, WI, U.S.A. Staff Paper Series, No.
408: 32 pp.
CHAMBERS, R. & CONWAY G. 1992. Sustainable rural livelihoods: Practical concepts for the 21st
Century. IDS Discussion Paper, No. 269. Sussex: Institute of Development Studies.
ELDIS PARTICIPATION RESOURCE Guide: Participatory Monitoring and Evaluation
http://www.eldis.org/participation/pme/ (13 March 2006)
CHANCELLOR, F. 2001. Creating Sustainable Smallholder Irrigated Farm Businesses. Proceedings of a
workshop held at Hoedspruit, Northern Province, South Africa. June 25 to 29, 2001. HR Wallingford/DFID
Document No. OD/TN108 September 2008.
337
CONROY, C., THAKUR, Y. & VADHER, M. 2002. The efficacy of participatory development of
technologies: experiences with resource-poor goat-keepers in India. Livestock Research for Rural
Development. 14 (3).
CROSBY, C.T., DE LANGE, M., STIMIE, C.M. & VAN DER STOEP, I., 2000. A review of planning and
design procedures applicable to small-scale farmer irrigation projects. WRC report 578/2/00. Water
Research Commission, Pretoria, South Africa.
DENISON, J. & MANONA, S., 2007a. Principles, Approaches and Guidelines for the Participatory
Revitalisation of Smallholder Irrigation Scheme. Volume 1 – A Rough Guide for Irrigation Development
Practitioners. WRC Report TT 308/07. Water Research Commission, Pretoria, South Africa.
DENISON, J. & MANONA, S., 2007b. Principles, Approaches and Guidelines for the Participatory
Revitalisation of Smallholder Irrigation Scheme. Volume 2 – Concepts and Cases. WRC Report TT
309/07. Water Research Commission, Pretoria, South Africa.
ELLIS, F. (1999), Rural livelihood diversity in developing countries: Evidence and policy implications. ODI
Natural Perspectives, No. 40. London: The Oveseas Development Institute.
ELLIS, F. (2000). Livelihoods and Diversity in Developing Countries. Oxford:
Oxford University Press.
FARRINGTON, J., D. CARNEY, C. ASHLEY & C. TURTON (1999), Sustainable livelihoods in practice:
early application of concepts in rural areas. ODI Natural Resource Perspectives. No. 42. London: The
Overseas Development Institute.
GOLDSMITH, E. B. (1996), Resource Management for Individuals and Families. New York: West
Publishing Company.
HORNE, P. & STUR, W. 2005. Participatory technology development (PTD). Food and Fertiliser
Technology Centre, Taipei.
LANKFORD, B.A. & GILLINGHAM, P. 2001. The impacts of Irrigation Improvement Programmes. In,
Proceedings of the 1st National Irrigation Conference, Morogoro, Tanzania, 20th to 22nd March 2001.
Funded by DANIDA/JICA. Department of Irrigation, Ministry of Agriculture, Dar es Salaam, Tanzania.
338
LEIMAR-PRICE, L. (1997), Wild plant food in agricultural environments: A study of occurrence,
management, and gathering rights in Northeast Thailand. Human Organisation, Vol. 56, No. 2: Pp. 209-
221.
MAY, J., M. CARTER AND D. POSEL (1995). The Composition and Persistence of Poverty in Rural
South Africa: An Entitlement Approach. A research paper commissioned by the Land and
Agriculture Policy Centre undertaken by Data Research Africa. (Unpublished paper).
MONDE, N., MTSHALI, S., MNKENI, P.N.S., CHIDUZA, C., MODI, A.T., BRUTSCH M.O., DLADLA,
R. & MTHEMBU, B.E., 2005. A situation Analysis report on
the Zanyokwe and Tugela Ferry irrigation schemes. WRC Project K5/1477 Deliverable 2 Report.
Water Research Commission, Pretoria, South Africa.
MTSHALI, S.M. (2002). Household Livelihood Security in Rural KwaZulu-Natal,South Africa. PhD Thesis.
Wageningen: Wageningen University.
NARAYAN, D., J. PATEL, J. SCHAFFT, A. RADEMACHER & S. KOCH-SCHUTTE (1999). Can
Anyone Hear Us? Voices from 47 Countries. Voices of the Poor, Volume 1. Washington D.C.
NEPAD (New Partnership for Africa’s development). 2003. Comprehensive Africa
agriculture development programme, African Union and NEPAD. ISBN 0-620-30700-5.
NIEHOF, A. & L. PRICE (2001), Rural Livelihood Systems: A Conceptual Framework. Wageningen: WU-
UPWARD Series on Rural Livelihoods, No. 1.
OOSTHUIZEN, L.K., 2002. Land and water resources management in South Africa. Paper presented at
the working group on international land and water resources management. 18th ICID Congress, Montreal,
Canada, July 21-28, 2002. [Online]. Available at: http://afeid.montpellier. cemagref.fr/ILWRM/ Sacase.pdf.
[Date of access: 24/04/2006].
PATTON, M. 1990. Qualitative Evaluation Methods, (2nd ed,. 1990, p. 129. Newbury Park, CA:
Sage
PERRET, S.R., 2001. New water policy, irrigation management transfer and smallholding irrigation
schemes in South Africa: institutional challenges. Working paper: 2001-15. Department of Agricultural
Economics, Extension and Rural Development, University of Pretoria, SA.
339
PERRET, S., LAVIGNE, M., STIRER, N., YOKWE, S. & DIKGALE, S., 2003. The Thabina irrigation
scheme in a context of rehabilitation and management transfer: Prospective analysis and local
empowerment. Final report: DWAF, CIRAD-IWMI-UP, Pretoria, South Africa.
RUTHENBERG, H.1980. Farming systems in the tropics. Clarendon Press, Oxford, UK.
SHAH, T. & VAN KOPPEN, B., 1999. Water management research issues in Northern Province, South
Africa: field notes from arable irrigation scheme in Olifants river. IWMI report, Pretoria, SA. 20 pp.
SPEDDING C.R.W. (1975). The Biology of Agricultural Systems. Academic Press, London.
STRAUGHAN, B. 1999. Four Stages and Fours Challenges of organisational Development. In
http://www.icl.org/articles/four-stages.php (Accessed 13 March 2006).
SUSTAINABLE LIVELIHOOD FRAMEWORK. http://www.deliveri.org/deliveri/progress/livelihoods_1.htm
(accessed on 13.03.09)
SWIFT, J. (1989), Why are rural people vulnerable to famine? IDS Bulletin, Vol. 20, No. 2: pp. 8-15.
TLOU, T., MOSAKA, D., PERRET, S., MULLINS, D., & WILLIAMS, C.J., 2006. Investigation of different
farm tenure systems and support structures for establishing small-scale irrigation in long term viable
conditions. WRC Report 1353/1/06. Water Research Commission, Pretoria, South Africa.
VAN AVERBEKE, W., M’MARETE, C.K., IGODAN, C.O. & BELETE, A., 1998. An investigation into food-
plot production at irrigated schemes in central Eastern Cape. WRC Report num. 719/98. Pretoria, SA.
VAN AVERBEKE, W. & KHOSA, T.B. 2004. The triple-A framework for the analysis of smallholder food
community gardens. 3rd International Conference on Entrepreneurship: Sustainable Globalization, 3-4
November, Pretoria. Tswane University of Technology. Proceedings. [CD ROM]. Pretoria: 292-299.
VAN AVERBEKE, W., 2008. Best management practices for small-scale subsistence farming on selected
irrigation schemes and surrounding areas through participatory adaptive research in Limpopo Province.
WRC report TT 344/08. Water Research Commission, Pretoria, South Africa.
VAN KOPPEN, C.S.A. (2000). Resource, arcadia, life world, nature concepts in Environmental Sociology,
Sociologia Ruralis, Vol. 40, No. 3: pp. 300-318.
340
VAUGHAN, A. 1997. Irrigation development. Current realities, new policies, and future possibilities for
positive impacts on rural poverty. Institute for Social and Economic Research, a Poverty and Inequality
Study report, Pretoria, SA.
WINROCK INTERNATIONAL (2006). Multiple uses of water: A synopsis of the literature. Margaret
McCauley and Mary Renwick
WOLF, D. L. (1991). Does father know best? A feminist critique of household strategy research. In: D.C.
CLAY & H.K. SCHWARZWELLER (eds) Research in Rural Sociology and Development: Research
Annual. pp. 29-43. London: J.A. I. Press Inc.
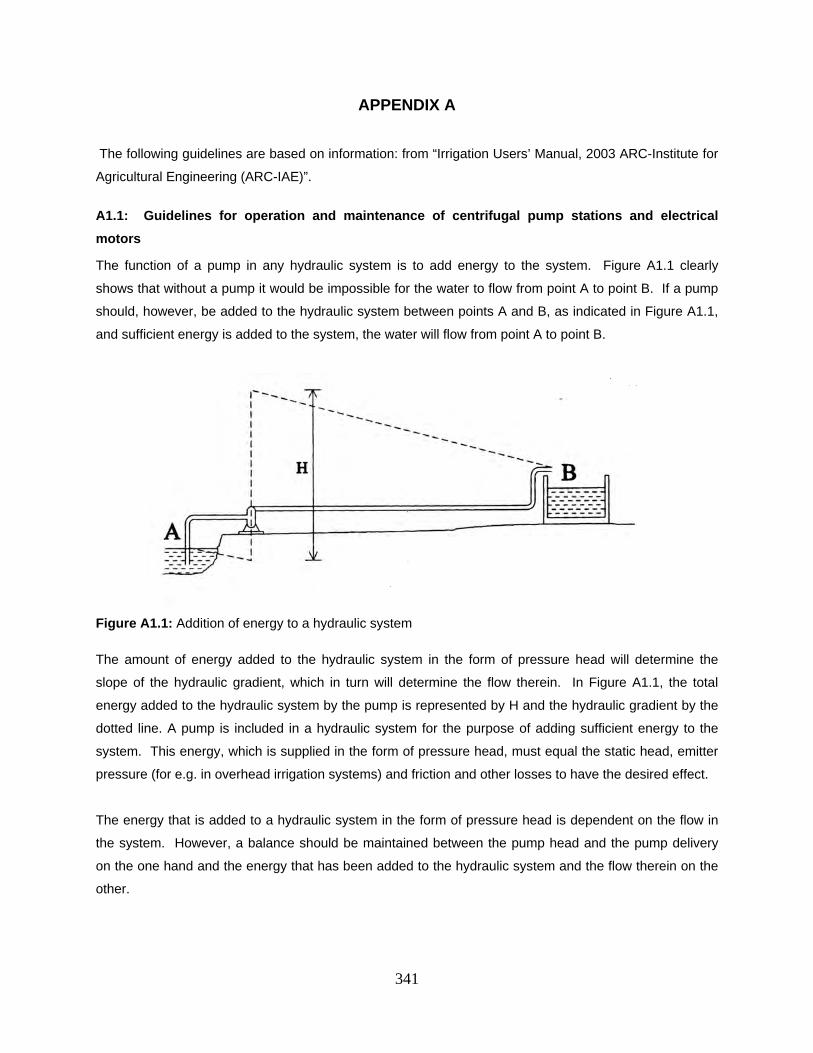
341
APPENDIX A
The following guidelines are based on information: from “Irrigation Users’ Manual, 2003 ARC-Institute for
Agricultural Engineering (ARC-IAE)”.
A1.1: Guidelines for operation and maintenance of centrifugal pump stations and electrical
motors
The function of a pump in any hydraulic system is to add energy to the system. Figure A1.1 clearly
shows that without a pump it would be impossible for the water to flow from point A to point B. If a pump
should, however, be added to the hydraulic system between points A and B, as indicated in Figure A1.1,
and sufficient energy is added to the system, the water will flow from point A to point B.
Figure A1.1: Addition of energy to a hydraulic system
The amount of energy added to the hydraulic system in the form of pressure head will determine the
slope of the hydraulic gradient, which in turn will determine the flow therein. In Figure A1.1, the total
energy added to the hydraulic system by the pump is represented by H and the hydraulic gradient by the
dotted line. A pump is included in a hydraulic system for the purpose of adding sufficient energy to the
system. This energy, which is supplied in the form of pressure head, must equal the static head, emitter
pressure (for e.g. in overhead irrigation systems) and friction and other losses to have the desired effect.
The energy that is added to a hydraulic system in the form of pressure head is dependent on the flow in
the system. However, a balance should be maintained between the pump head and the pump delivery
on the one hand and the energy that has been added to the hydraulic system and the flow therein on the
other.
342
Operation of pumps
De-aeration (“priming”): In order for a centrifugal pump to work, all air must be removed from the pump
casing and suction side pipe work before starting the pump, by filling the pump casing and suction pipe
with water before the pump is switched on. De-aeration can be done in four different ways:
Starting up: First check the alignment before starting up the pump. Ensure that all the rotating parts are
free by turning them manually. During commencement of operation, note the quantity of water leaking at
the pump gland. If excessive leaking occurs, the gland nuts must be tightened slowly and evenly on both
sides until the water just drips slowly. Ensure however that the pump gland is not tightened too much,
because it can lead to heat build-up that can damage the pump shaft. Ensure that the pump runs in the
right direction during use, by switching it on at closed valve for a while. Look at the rotation direction of
the pump shaft and compare it with the direction of the arrow as indicated on the pump.
Check the oil levels in oil-filled pumps. Greased pumps must be checked for excessive grease. Fill the
pump casing and suction pipe with water before switching on the pump. The reason therefore is that
when the pump is not switched on at closed valve, it then pumps at a low pump head, causing a high
pump-delivery that can lead to overloading and even damage to the motor. If ESCOM power is used, it
will also keep the kVA demand low. Open the cooling water on the mechanical seals and bearings if they
are part of the unit. Switch on the pump. As soon as the pump runs on full speed and the required pump
head is reached, the sluice valve can be opened slowly. Check the reading on the ampere meter to
ensure that the permissible value is not exceeded.
The pump must not be allowed to operate at closed valve for too long, since overheating can occur. If the
pump has been provided with an axial flow impeller, the drive requirement and downstream pressure will
drop if the delivery increases. A stop valve is therefore not necessary. Where a number of pumps are
served from one transformer, it is also important to switch on the pumps in order of large to small. It also
keeps the kPa demand peak low.
Switching off: It is advisable to close the sluice valve on the delivery side of the pump just before
switching off the pump, because it combats water hammer and will also keep water in the pipes that can
possibly be used for the next de-aeration of the pump. Also close the small valve that closes off the
vacuum meter on the suction side before the pump is switched off.
Pump maintenance: The pump manufacturer usually provides a maintenance schedule that indicates the
maintenance to be done. As with any type of equipment, it is very important that the necessary
maintenance is done regularly to ensure that the installation can function efficiently and that the life span
of the installation is prolonged. The pump must always run smoothly without any vibrations. The water
depth on the suction side as well as the power consumption must also be regularly monitored.
Over and above the manufacturer’s schedule, the following can serve as directives for the maintenance of
the centrifugal pumps:
343
Check the alignment every six months
Replace the oil every six months if applicable. If the oil level drops, new oil must be added
Check and clean the bearings every 1 000 operating hours
Inspect all wearing parts regularly and do a hydraulic test. A simpler test can also be done by
just closing the sluice valve and taking a reading on the pressure meter that is installed
upstream of the sluice valve. If the pressure drops in relation to when the pump was initially
installed, it indicates excessive wear. This test should be sufficient for maintenance purposes. If
there is a suspicion that the installation does not function correctly, the complete test can be
done. By monitoring the ampere reading, it can be determined whether the pump’s service point
changes with time.
Inspect the gland leakage regularly. It must leak slightly, because it is lubricated by water. Also
feel the pump for excessive vibrations.
It is also worthwhile to dismantle the pump sometimes and to concentrate on the following:
Impeller clearance at collar – skim the impeller neck to give clearance and mount the correct
wear rings.
Inspect the pump shaft for damage
Replace casings f necessary
Clean surfaces of impellers, pump casing, etc., paint if necessary
Replace gaskets and O-rings and bearings
Check all adapter parts.
Electrical motors: The types of power sources being considered for irrigation mainly include electric
motors and to a lesser extent internal combustion engines. The choice between these two main types of
drive systems is usually based on economic considerations. The cost of electricity in proportion to that of
fuel for an internal combustion engine is such that electricity is usually preferred, except where the cost of
supplying electricity at a specific point is very high. Electric motors are consequently usually preferred to
internal combustion engines and internal combustion engines are normally only used where three-phase
power is unavailable, variable speed is required (which is very unlikely), or where the pump has to be
portable. It is, however, also possible to make use of an electric motor for portable pumps, but then
every pump station has to be provided with a three-phase power point.
The rotor speed of electric motors is determined by the synchronous speed of the motor and the torque
the motor has to produce. The synchronous speed of the motor is determined by the number of poles of
the motor and the frequency of the electric supply current. The number of poles is 2, 4, 6, or 8 (in pairs of
2) with 2 and 4 being the most common for the driving of pumps.
The rotor speed itself is slightly lower than the synchronous speed, depending on the torque the electric
motor has to produce. The difference between the synchronous speed and the rotor speed is called the
344
slip speed. The synchronous speed of a four pole motor is thus 1 500 r/min and the rotor speed will thus
vary to approximately 1 450 r/min, according to the load on the motor. In the USA the standard supply
frequency is 60 Hz, i.e. there the synchronous speed of a four pole motor will be 1 800 r/min and the
power rating of the motor will be approximately 15% higher for a two pole motor and 20% for a 4, 6, or 8
pole motor than in the RSA. A 60 Hz motor will initially run on the 50 Hz supply, but will overheat after a
while and can thus not be used.
The standard direction of rotation of the shaft of an electric motor is clockwise if you look at the driving-
shaft side of an electric motor. It concurs with the desired direction of rotation for centrifugal pumps. It
is, however, possible to change the direction of rotation by changing the connection of the supply current.
This must, however, be entrusted to a qualified electrician.
Cooling: Although heat loss also means a loss of energy, the motor has to be cooled to prevent it from
overheating and thus being damaged. The IC code in accordance with SABS 948 (revised), IEC 34-6
and BS 4999/21 indicate the method of cooling. Of these, the TEFC motor (totally enclosed fan cooled) is
the most well known. The most common methods are the following:
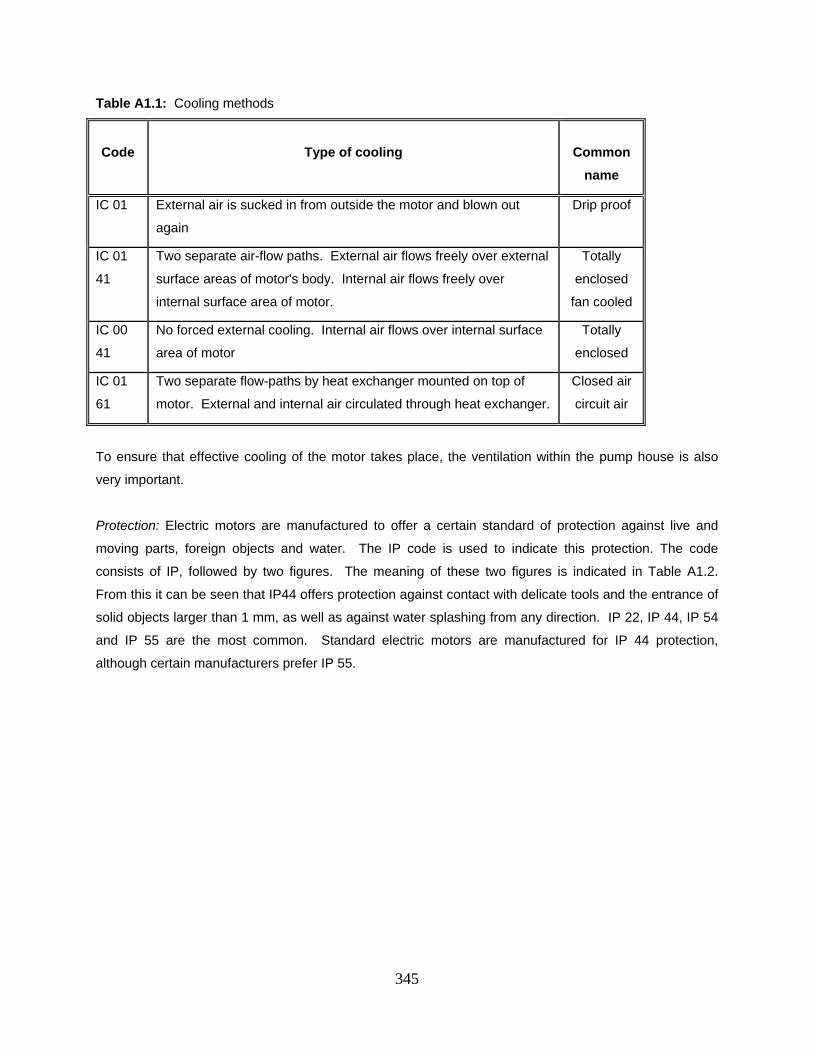
345
Table A1.1: Cooling methods
Code
Type of cooling
Common
name
IC 01 External air is sucked in from outside the motor and blown out
again
Drip proof
IC 01
41
Two separate air-flow paths. External air flows freely over external
surface areas of motor's body. Internal air flows freely over
internal surface area of motor.
Totally
enclosed
fan cooled
IC 00
41
No forced external cooling. Internal air flows over internal surface
area of motor
Totally
enclosed
IC 01
61
Two separate flow-paths by heat exchanger mounted on top of
motor. External and internal air circulated through heat exchanger.
Closed air
circuit air
To ensure that effective cooling of the motor takes place, the ventilation within the pump house is also
very important.
Protection: Electric motors are manufactured to offer a certain standard of protection against live and
moving parts, foreign objects and water. The IP code is used to indicate this protection. The code
consists of IP, followed by two figures. The meaning of these two figures is indicated in Table A1.2.
From this it can be seen that IP44 offers protection against contact with delicate tools and the entrance of
solid objects larger than 1 mm, as well as against water splashing from any direction. IP 22, IP 44, IP 54
and IP 55 are the most common. Standard electric motors are manufactured for IP 44 protection,
although certain manufacturers prefer IP 55.
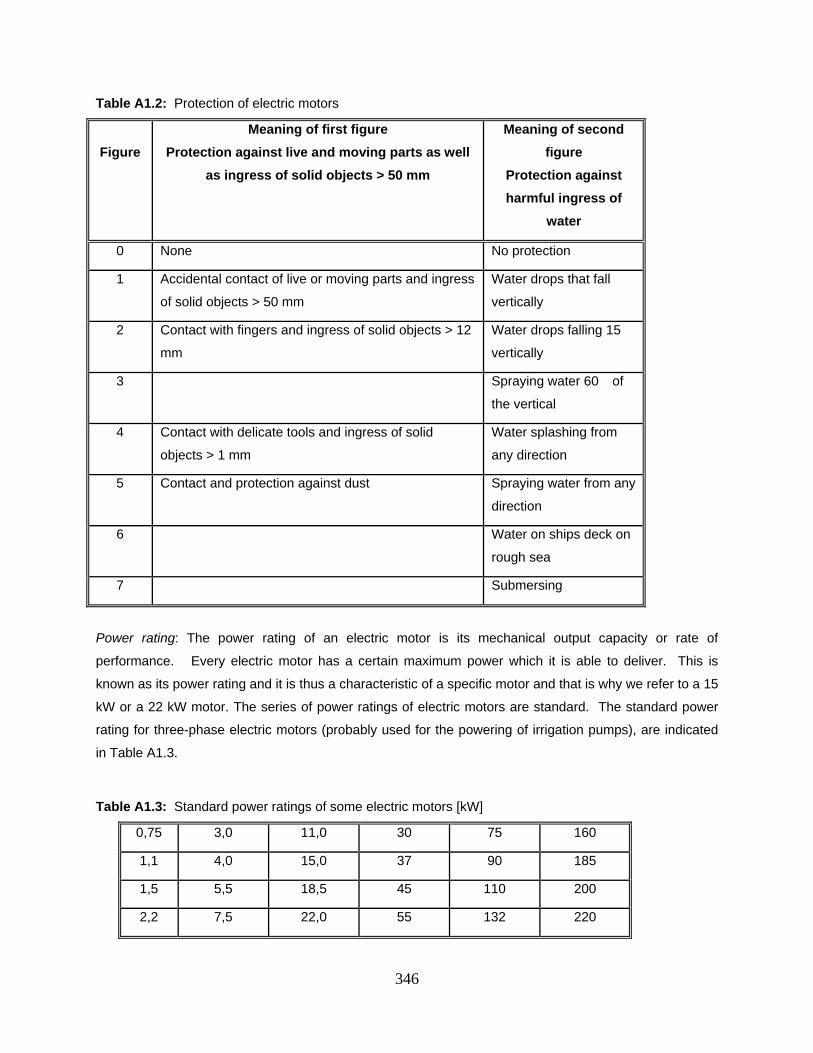
346
Table A1.2: Protection of electric motors
Figure
Meaning of first figure
Protection against live and moving parts as well
as ingress of solid objects > 50 mm
Meaning of second
figure
Protection against
harmful ingress of
water
0 None No protection
1 Accidental contact of live or moving parts and ingress
of solid objects > 50 mm
Water drops that fall
vertically
2 Contact with fingers and ingress of solid objects > 12
mm
Water drops falling 15�
vertically
3 Spraying water 60� of
the vertical
4 Contact with delicate tools and ingress of solid
objects > 1 mm
Water splashing from
any direction
5 Contact and protection against dust Spraying water from any
direction
6 Water on ships deck on
rough sea
7 Submersing
Power rating: The power rating of an electric motor is its mechanical output capacity or rate of
performance. Every electric motor has a certain maximum power which it is able to deliver. This is
known as its power rating and it is thus a characteristic of a specific motor and that is why we refer to a 15
kW or a 22 kW motor. The series of power ratings of electric motors are standard. The standard power
rating for three-phase electric motors (probably used for the powering of irrigation pumps), are indicated
in Table A1.3.
Table A1.3: Standard power ratings of some electric motors [kW]
0,75 3,0 11,0 30 75 160
1,1 4,0 15,0 37 90 185
1,5 5,5 18,5 45 110 200
2,2 7,5 22,0 55 132 220
347
The power rating of an electric motor is also influenced by the ambient temperature and the height above
sea level, and has to be corrected during design.
Supply cables: Cable designs are usually executed to conform to SABS 0142-1981, Regulation 4.3.4.
This regulation dictates that the maximum voltage drop under full-load conditions may not exceed 5%. It
boils down to 19 V between phase and phase and 11 V between phase and neutral if the voltage is 380
V. The cable size must, however, be based on the voltage drop [V] of 5% maximum between phase and
neutral, i.e. 5% of 220 V = 11 V.
Couplings: If the cable size is too small, the voltage [V] decreases and this causes the electric motor to
draw a higher current. The motor may thus overheat sooner than expected and the energy loss will also
increase. It is thus very important not to use cables that are too small.
The type of coupling, direct or belt and pulley, is mainly determined by the speed of the driver vs. the
speed at which the pump must run. If it is equal, direct coupling will probably be the proper method to
follow. If not, belt and pulley coupling should be used.
Energy costs: Energy costs play a very important role in the economic viability of a pump installation. In
many areas, ESKOM is the only supplier of electricity, while diesel engines are normally used where
electricity is unavailable. Pumping water with diesel power is however up to 10 times as expensive as
using electricity. For rural users ESKOM has tree tariff options for the supply of electricity. These are
NIGHTSAVE Rural, RURAFLEX, and LANDRATE, and more information on the most appropriate tariff
should be obtained from ESKOM.
Pipelines
Steel pipes and fittings: The information contained in this section is limited to steel pipes for irrigation
pumping stations. Compared to other pipes, steel pipes are relatively costly for smaller diameters but
work out more economically for large diameters. The high costs and scope of projects where large steel
pipes are used, usually require the expertise of a professional engineer who carries full responsibility for
the design.
Corrosion protection is of great importance with steel pipes. The following methods of protection are
generally used:
Galvanizing
Epoxy
Bitumen
Protective wrapping, especially at joints
Electrolytic protection
While galvanized pipes are generally rust-proof, problems sometimes occur with soft water. Bacteria
which attack the galvanizing are also present in some soils. Epoxy coating generally provides good
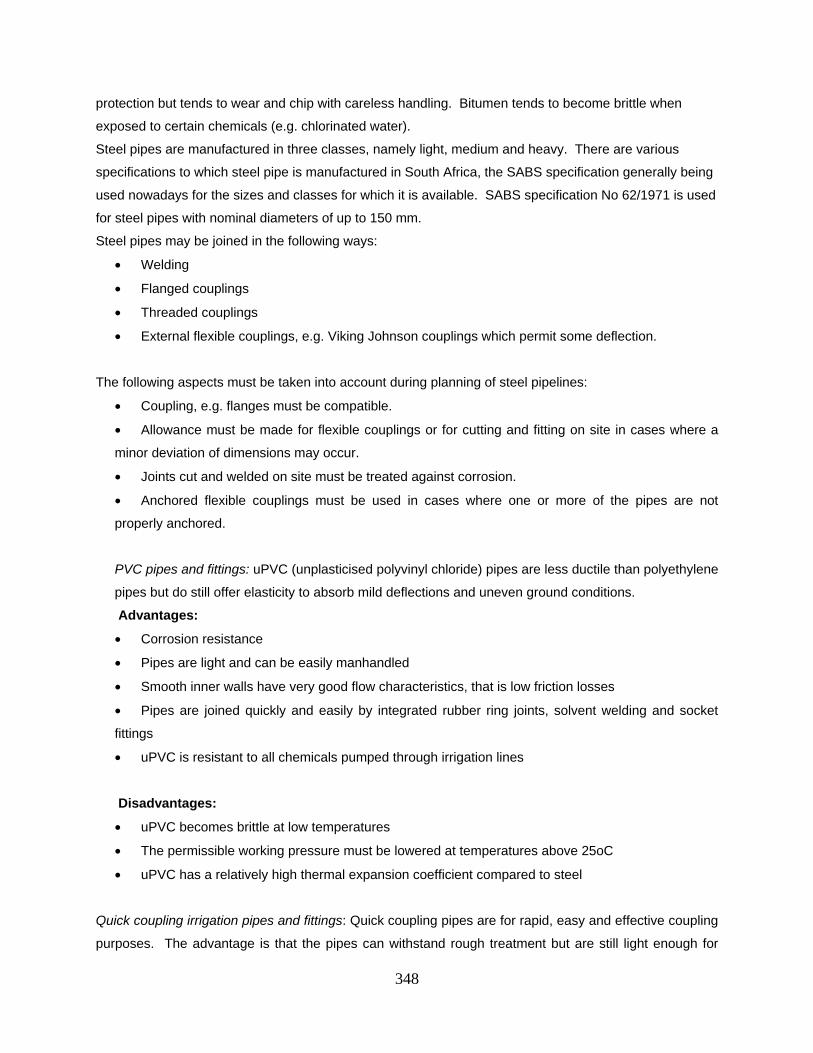
348
protection but tends to wear and chip with careless handling. Bitumen tends to become brittle when
exposed to certain chemicals (e.g. chlorinated water).
Steel pipes are manufactured in three classes, namely light, medium and heavy. There are various
specifications to which steel pipe is manufactured in South Africa, the SABS specification generally being
used nowadays for the sizes and classes for which it is available. SABS specification No 62/1971 is used
for steel pipes with nominal diameters of up to 150 mm.
Steel pipes may be joined in the following ways:
Welding
Flanged couplings
Threaded couplings
External flexible couplings, e.g. Viking Johnson couplings which permit some deflection.
The following aspects must be taken into account during planning of steel pipelines:
Coupling, e.g. flanges must be compatible.
Allowance must be made for flexible couplings or for cutting and fitting on site in cases where a
minor deviation of dimensions may occur.
Joints cut and welded on site must be treated against corrosion.
Anchored flexible couplings must be used in cases where one or more of the pipes are not
properly anchored.
PVC pipes and fittings: uPVC (unplasticised polyvinyl chloride) pipes are less ductile than polyethylene
pipes but do still offer elasticity to absorb mild deflections and uneven ground conditions.
Advantages:
Corrosion resistance
Pipes are light and can be easily manhandled
Smooth inner walls have very good flow characteristics, that is low friction losses
Pipes are joined quickly and easily by integrated rubber ring joints, solvent welding and socket
fittings
uPVC is resistant to all chemicals pumped through irrigation lines
Disadvantages:
uPVC becomes brittle at low temperatures
The permissible working pressure must be lowered at temperatures above 25oC
uPVC has a relatively high thermal expansion coefficient compared to steel
Quick coupling irrigation pipes and fittings: Quick coupling pipes are for rapid, easy and effective coupling
purposes. The advantage is that the pipes can withstand rough treatment but are still light enough for
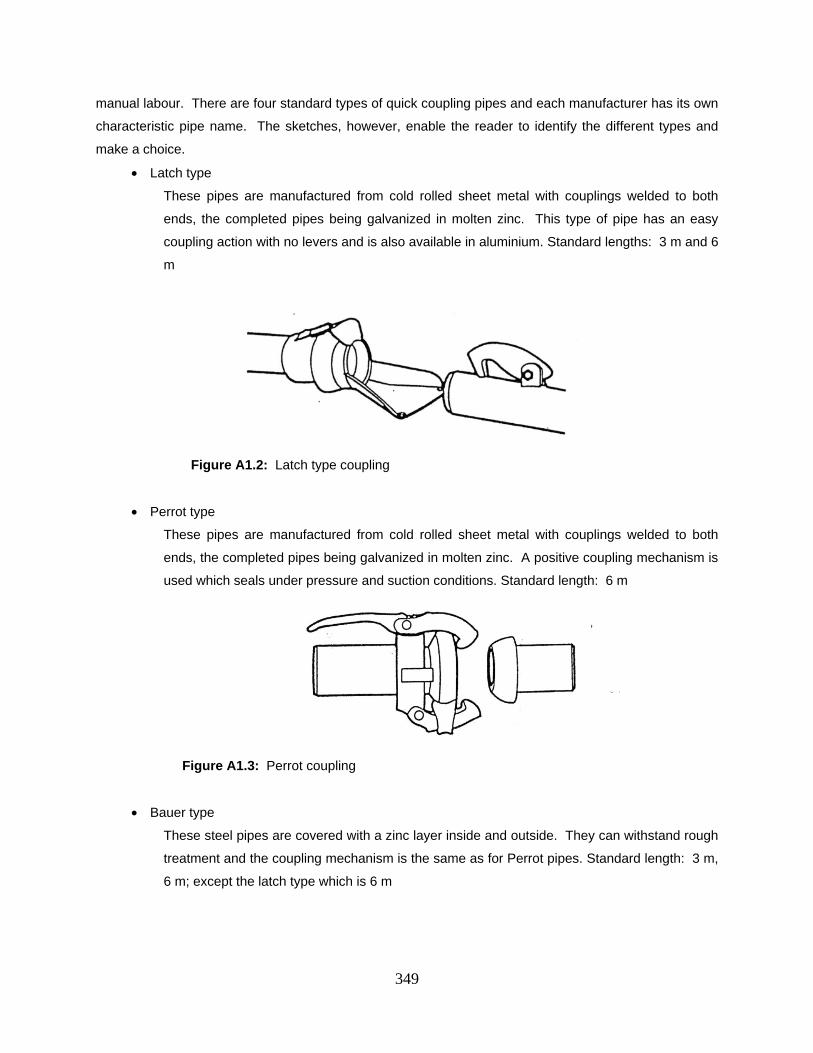
349
manual labour. There are four standard types of quick coupling pipes and each manufacturer has its own
characteristic pipe name. The sketches, however, enable the reader to identify the different types and
make a choice.
Latch type
These pipes are manufactured from cold rolled sheet metal with couplings welded to both
ends, the completed pipes being galvanized in molten zinc. This type of pipe has an easy
coupling action with no levers and is also available in aluminium. Standard lengths: 3 m and 6
m
Figure A1.2: Latch type coupling
Perrot type
These pipes are manufactured from cold rolled sheet metal with couplings welded to both
ends, the completed pipes being galvanized in molten zinc. A positive coupling mechanism is
used which seals under pressure and suction conditions. Standard length: 6 m
Figure A1.3: Perrot coupling
Bauer type
These steel pipes are covered with a zinc layer inside and outside. They can withstand rough
treatment and the coupling mechanism is the same as for Perrot pipes. Standard length: 3 m,
6 m; except the latch type which is 6 m
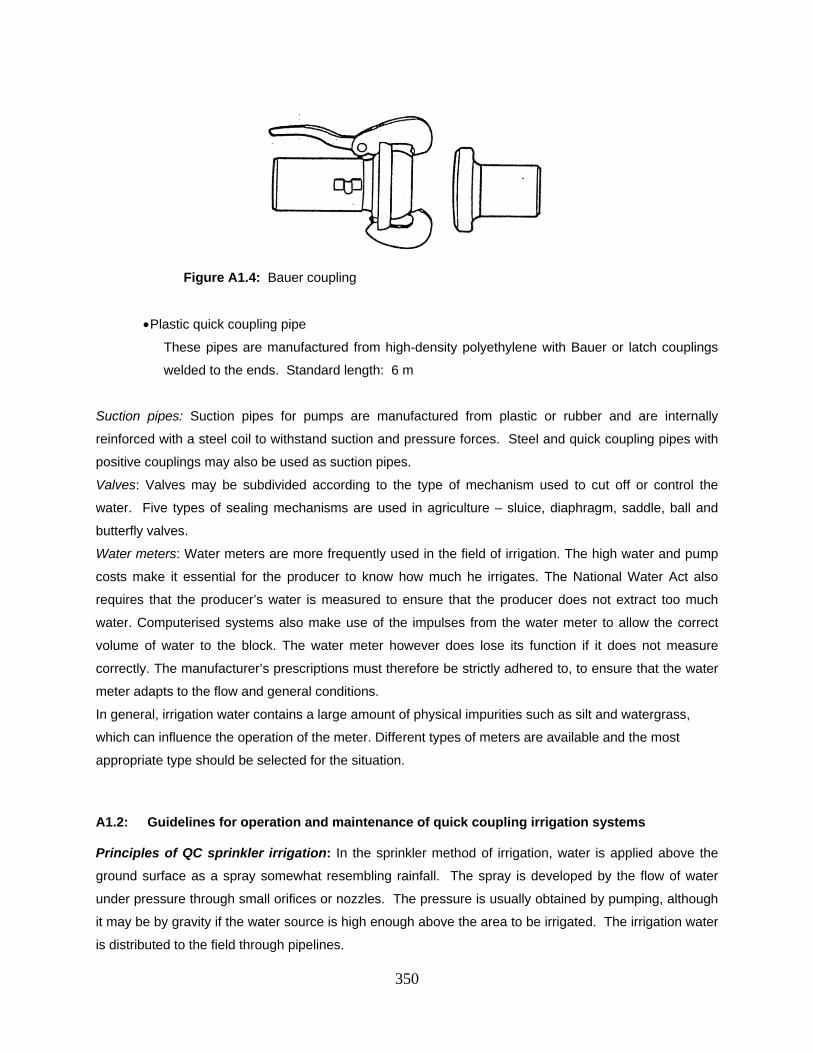
350
Figure A1.4: Bauer coupling
Plastic quick coupling pipe
These pipes are manufactured from high-density polyethylene with Bauer or latch couplings
welded to the ends. Standard length: 6 m
Suction pipes: Suction pipes for pumps are manufactured from plastic or rubber and are internally
reinforced with a steel coil to withstand suction and pressure forces. Steel and quick coupling pipes with
positive couplings may also be used as suction pipes.
Valves: Valves may be subdivided according to the type of mechanism used to cut off or control the
water. Five types of sealing mechanisms are used in agriculture – sluice, diaphragm, saddle, ball and
butterfly valves.
Water meters: Water meters are more frequently used in the field of irrigation. The high water and pump
costs make it essential for the producer to know how much he irrigates. The National Water Act also
requires that the producer’s water is measured to ensure that the producer does not extract too much
water. Computerised systems also make use of the impulses from the water meter to allow the correct
volume of water to the block. The water meter however does lose its function if it does not measure
correctly. The manufacturer’s prescriptions must therefore be strictly adhered to, to ensure that the water
meter adapts to the flow and general conditions.
In general, irrigation water contains a large amount of physical impurities such as silt and watergrass,
which can influence the operation of the meter. Different types of meters are available and the most
appropriate type should be selected for the situation.
A1.2: Guidelines for operation and maintenance of quick coupling irrigation systems
Principles of QC sprinkler irrigation: In the sprinkler method of irrigation, water is applied above the
ground surface as a spray somewhat resembling rainfall. The spray is developed by the flow of water
under pressure through small orifices or nozzles. The pressure is usually obtained by pumping, although
it may be by gravity if the water source is high enough above the area to be irrigated. The irrigation water
is distributed to the field through pipelines.
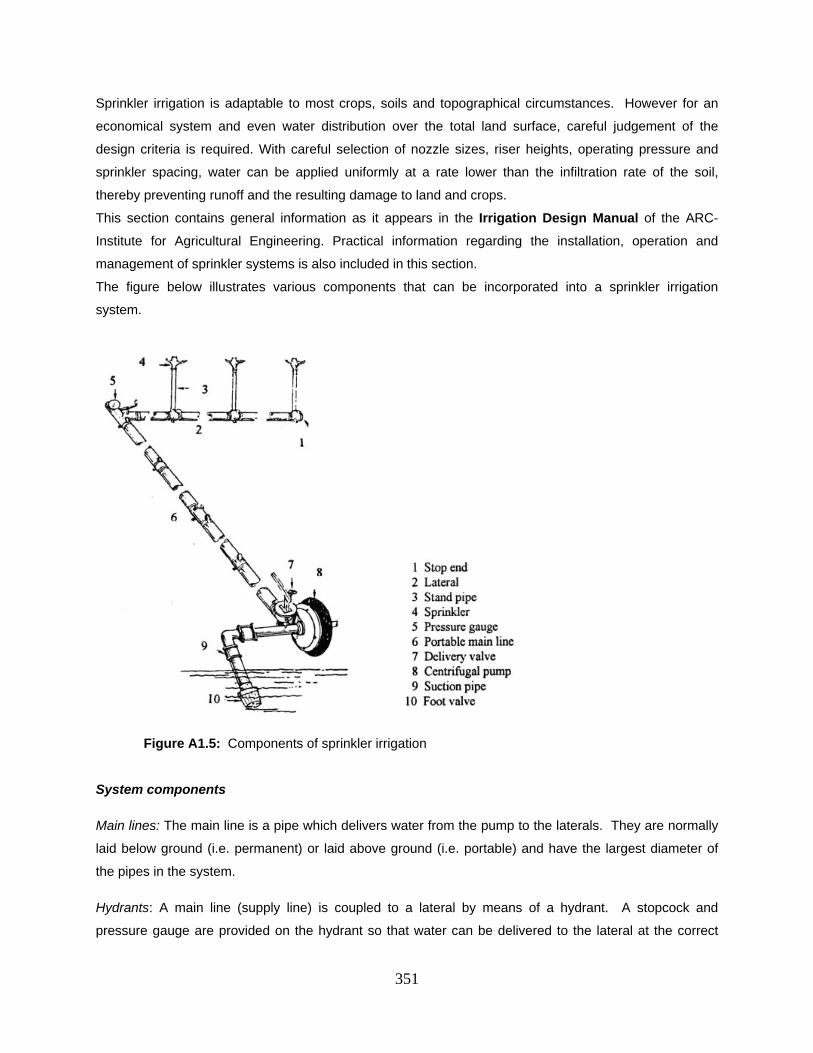
351
Sprinkler irrigation is adaptable to most crops, soils and topographical circumstances. However for an
economical system and even water distribution over the total land surface, careful judgement of the
design criteria is required. With careful selection of nozzle sizes, riser heights, operating pressure and
sprinkler spacing, water can be applied uniformly at a rate lower than the infiltration rate of the soil,
thereby preventing runoff and the resulting damage to land and crops.
This section contains general information as it appears in the Irrigation Design Manual of the ARC-
Institute for Agricultural Engineering. Practical information regarding the installation, operation and
management of sprinkler systems is also included in this section.
The figure below illustrates various components that can be incorporated into a sprinkler irrigation
system.
Figure A1.5: Components of sprinkler irrigation
System components
Main lines: The main line is a pipe which delivers water from the pump to the laterals. They are normally
laid below ground (i.e. permanent) or laid above ground (i.e. portable) and have the largest diameter of
the pipes in the system.
Hydrants: A main line (supply line) is coupled to a lateral by means of a hydrant. A stopcock and
pressure gauge are provided on the hydrant so that water can be delivered to the lateral at the correct
352
pressure. Quick couplings are provided at the hydrant valves so the water can be turned off from the
lateral, which can be disconnected and reconnected at a new location without stopping the pump. With
permanent underground laterals, hydromatic valves are located at each sprinkler position.
The sprinkler pipe is usually coupled to the nearest hydrant, to avoid unnecessarily long connection pipes
between the hydrant and sprinkler pipe. It is essential to determine whether at any stage two laterals are
operating simultaneously from one specific hydrant. If this is the case, a T-Piece instead of an elbow joint
must be used.
Laterals: The lateral is a pipe which delivers water from the main line to the sprinkler. It can either be
portable or permanent, and is usually smaller in diameter if compared to the main line. Portable laterals
are either aluminium or light steel pipe with plain coupling or lever-type coupling respectively. The
different types of quick couple couplings are described in Chapter 7: Irrigation equipment of the
Irrigation Users Manual of the ARC-IAE. It is advisable to use more than one type of quick-coupling
types in a system. One method of moving laterals is by hand, where the pipe is uncoupled, moved a
length at a time and re-coupled. Permanent laterals are either polyethylene or uPVC pipe with draglines
attached. For the sake of convenience, most farmers prefer lateral lines of a single pipe size. Some
farmers prefer to use two pipe sizes which can result in a reduction in initial costs. Laterals containing
more than two pipe sizes are not recommended.
Pressure-reducing valves are used in laterals where the topography is undulating or too steep to restrict
pressure variation in the line to within the 20% limit by the selection of practical pipe sizes or by means of
hydrant valves.
Stand pipes: Stand pipes are smaller diameter pipes which connect the sprinkler to the lateral or dragline
hose. In a portable or semi-permanent system mainly galvanised steel stand pipes are used, while in a
permanent system use is made of uPVC or polyethylene stand pipes. Stand pipes must be provided in
order to remove the turbulence when the direction of flow is changed by diverting a part of the flow to an
individual sprinkler. If not removed, this turbulence will carry through the nozzle and cause a premature
stream break-up and a reduced diameter of coverage and thereby a poorer distribution pattern. The
length of pipe needed to remove turbulence varies with sprinkler discharge.
The sprinkler should be placed at least 0, 6 m above the crop. Stand pipes are normally available in the
following lengths: 0,2 m; 0,5 m; 1,0 m; 1,2 m; 1,5 m; 2 m and 3 m (they can also be customised) with
diameters ranging from 20 to 25 mm. The sprinkler system in ZIS was not well maintained, with a lot of
technical variation. Different stand pipe lengths, different sprinklers and different nozzles were found in a
single lateral line thereby affecting efficiency of the system.
Sprinklers: Many sprinklers on the market are sold together with technical documentation. When choosing
a sprinkler the following must be taken into account:
Uniformity of water application.
353
Precipitation rate: Function of discharge, wetted diameter and sprinkler spacing.
Drop size distribution: Function of nozzle diameter, pressure and pressure variation.
The cost.
Back-up service
Four general types of sprinklers are used:
Rotating sprinklers – agriculture
Floppy sprinklers – agriculture
Fixed nozzles attached to the pipe – horticulture.
Perforated pipe – nursery and gardens.
The impact-drive rotating sprinkler is the most popular. The impact drive has a weighted spring-loaded
drive arm to provide the force to rotate the nozzle assembly. The sprinkling stream deflects the arm
sideways and the spring pulls the arm back to the nozzle assembly and into the path of the stream. As
the drive arm completes each swing cycle it impacts against the nozzle assembly rotating it slightly. The
advantage of the rotating sprinkler is its ability to apply water at a slower rate while using relatively large
nozzle openings.
Operating pressure and distribution uniformity: System pressure was the biggest factor to the poor
performance of sprinkler system in ZIS. The sprinklers were operated at pressures above the
recommended. The ideal operating pressure for Rainbird 30BH sprinklers used in ZIS is below 3 bar (300
kPa) but farmers used pressure in excess of 4 bar. The system must be irrigated at the design pressure
else there will be an uneven distribution of water. A too low sprinkler pressure does not break up the
waterjet thoroughly and the so-called doughnut effect with a poor distribution is obtained. With a too high
pressure the waterjet is broken up too fine with a mist effect that can cause great losses. It was found in
practice that the optimal operating pressure (kPa) of the sprinkler is between 60 and 70 times the nozzle
diameter (mm). This is applicable to nozzles of 3 to 7 mm diameter. When the wind speed reaches more
than 16 km/h, the effectiveness of the system becomes inefficient and it is better to stop irrigating. Water
that sprays too high into the air is more affected by wind. A nozzle that sprays 32° from the horizontal
obtains the maximum sprinkler distance.
Night irrigation is much more effective than daytime irrigation because of evaporation. If it suits the soil
and the crop, it is best to have set-ups of 11 hours with 1 hour moving time, i.e. sprinklers are only moved
mornings and evenings.
The water distribution on the field should be tested once a year by setting up rain meters according to the
procedure prescribed in the Irrigation Evaluation Manual of the ARC-Institute for Agricultural Engineering.
System capacity and pressure must also be determined once a year.
System maintenance: Observation of wear on sprinkler nozzles is measured with a specially machined
apparatus (Figure A1.6). The measurement shows the amount of wear (mm) on the sprinkler nozzle. If
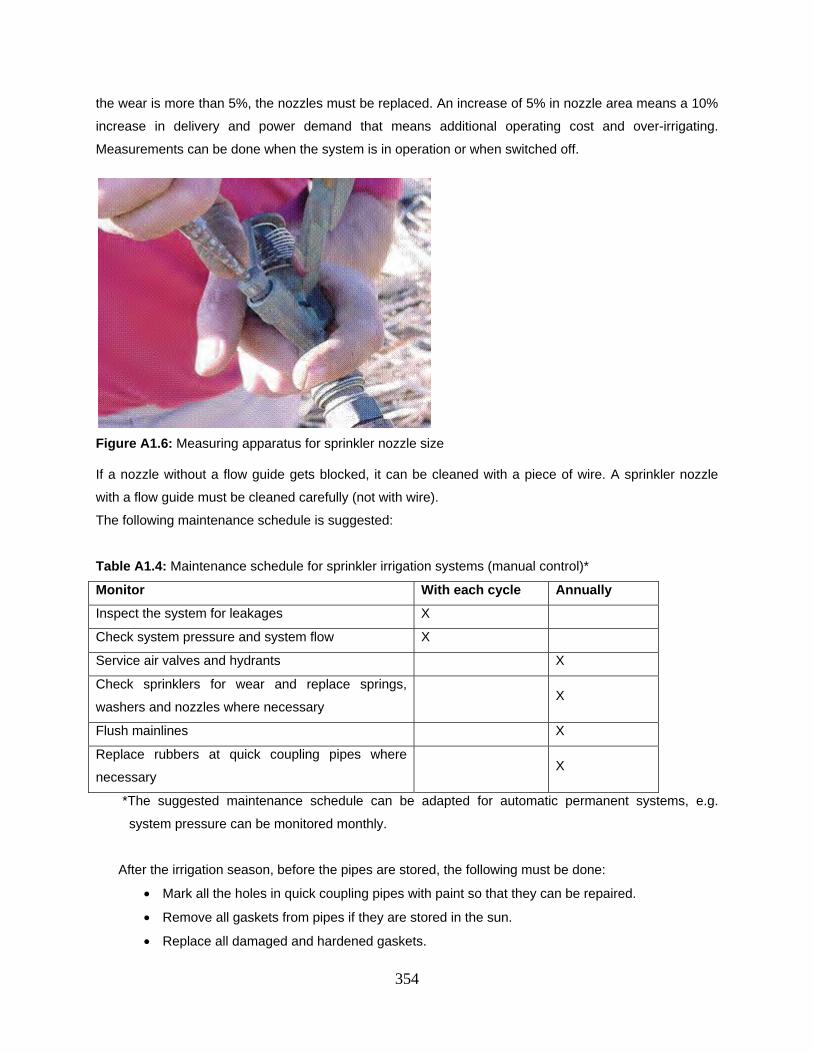
354
the wear is more than 5%, the nozzles must be replaced. An increase of 5% in nozzle area means a 10%
increase in delivery and power demand that means additional operating cost and over-irrigating.
Measurements can be done when the system is in operation or when switched off.
Figure A1.6: Measuring apparatus for sprinkler nozzle size
If a nozzle without a flow guide gets blocked, it can be cleaned with a piece of wire. A sprinkler nozzle
with a flow guide must be cleaned carefully (not with wire).
The following maintenance schedule is suggested:
Table A1.4: Maintenance schedule for sprinkler irrigation systems (manual control)*
Monitor With each cycle Annually
Inspect the system for leakages X
Check system pressure and system flow X
Service air valves and hydrants X
Check sprinklers for wear and replace springs,
washers and nozzles where necessary X
Flush mainlines X
Replace rubbers at quick coupling pipes where
necessary X
*The suggested maintenance schedule can be adapted for automatic permanent systems, e.g.
system pressure can be monitored monthly.
After the irrigation season, before the pipes are stored, the following must be done:
Mark all the holes in quick coupling pipes with paint so that they can be repaired.
Remove all gaskets from pipes if they are stored in the sun.
Replace all damaged and hardened gaskets.
355
Replace all worn male and female pipe fittings.
Replace all dragline pipes that have more than three joints.
Check standing pipes for corrosion and replace if necessary.
Ensure that all standing pipes are the same length and straight.
Appendix A1.3: Operation and maintenance of centrifugal pumps and electrical motors
The function of a pump in any hydraulic system is to add energy to the system.
a. Operation of pumps
i) De-aeration (“priming”)
In order for a centrifugal pump to work, all air must be removed from the pump casing and suction
side pipe work before starting the pump, by filling the pump casing and suction pipe with water
before the pump is switched on. De-aeration can be done in four different ways:
Vacuum pump
A manual pump is installed on the pump casing, which pumps out all the air each time the
pump is to be used.
Foot valves
It is a one-way valve installed on the inlet of the suction pipe which prevents the water from
the pump from draining out of the suction pipe as soon as the pump is switched off. However,
foot valves clog easily, with consequent high friction losses, and they are seldom totally
dependable.
Priming from supply pipe
A pipe is installed in the supply pipe on the downstream side of the valve and it is attached to
the pump casing. The pipe line is also provided with a valve and the pump is then primed by
opening this valve to displace the air in the pump casing and suction pipe with the water in the
supply pipe.
Positive suction head
The pump is installed in the pump sump at a lower level than the water level, which ensures
that there will always be water in the pump casing and suction pipe. This is the ideal, but not
always possible. Problems with NPSH are also ruled out in this way.
Ii) Starting up
Before starting the pump, first check the alignment. Ensure that all the rotating parts are free by
turning them manually. During commencement of operation, note the quantity of water leaking at
the pump gland. If excessive leaking occurs, the gland nuts must be tightened slowly and evenly
on both sides until the water just drips slowly. Ensure however that the pump gland is not
tightened too much, because it can lead to heat build-up that can damage the pump shaft. Ensure
that the pump runs in the right direction during use, by switching it on at closed valve for a while.
356
Look at the rotation direction of the pump shaft and compare it with the direction of the arrow as
indicated on the pump.
Check the oil levels in oil-filled pumps. Greased pumps must be checked for excessive grease.
Fill the pump casing and suction pipe with water before switching on the pump. The reason
therefore is that when the pump is not switched on at closed valve, it then pumps at a low pump
head, causing a high pump-delivery that can lead to overloading and even damage to the motor.
If ESCOM power is used, it will also keep the kVA demand low. Open the cooling water on the
mechanical seals and bearings if they are part of the unit. Switch on the pump. As soon as the
pump runs on full speed and the required pump head is reached, the sluice valve can be opened
slowly. Check the reading on the ampere meter to ensure that the permissible value is not
exceeded.
The pump must not be allowed to operate at closed valve for too long, since overheating can
occur. If the pump has been provided with an axial flow impeller, the drive requirement and
downstream pressure will drop if the delivery increases. A stop valve is therefore not necessary.
Where a number of pumps are served from one transformer, it is also important to switch on the
pumps in order of large to small. It also keeps the kPa demand peak low.
ii) Switching off
It is advisable to close the sluice valve on the delivery side of the pump just before switching off
the pump, because it combats water hammer and will also keep water in the pipes that can
possibly be used for the next de-aeration of the pump. Also close the small valve that closes off
the vacuum meter on the suction side before the pump is switched off.
iii) Pump maintenance
The pump manufacturer usually provides a maintenance schedule that indicates the maintenance
to be done. As with any type of equipment, it is very important that the necessary maintenance is
done regularly to ensure that the installation can function efficiently and that the life span of the
installation is prolonged. The pump must always run smoothly without any vibrations. The water
depth on the suction side as well as the power consumption must also be regularly monitored.
Over and above the manufacturer’s schedule, the following can serve as directives for the
maintenance of the centrifugal pumps:
Check the alignment every six months
Replace the oil every six months if applicable. If the oil level drops, new oil must be added
Check and clean the bearings every 1 000 operating hours
Inspect all wearing parts regularly and do a hydraulic test. A simpler test can also be done by
just closing the sluice valve and taking a reading on the pressure meter that is installed
upstream of the sluice valve. If the pressure drops in relation to when the pump was initially
installed, it indicates excessive wear. This test should be sufficient for maintenance purposes.
357
If there is a suspicion that the installation does not function correctly, the complete test can be
done. By monitoring the ampere reading, it can be determined whether the pump’s service
point changes with time.
Inspect the gland leakage regularly. It must leak slightly, because it is lubricated by water.
Also feel the pump for excessive vibrations.
It is also worthwhile to dismantle the pump sometimes and to concentrate on the following:
Impeller clearance at collar – skim the impeller neck to give clearance and mount the correct
wear rings.
Inspect the pump shaft for damage
Replace casings f necessary
Clean surfaces of impellers, pump casing, etc., paint if necessary
Replace gaskets and O-rings and bearings
Check all adapter parts.
b. Operation of electrical motors
The power sources being considered for irrigation mainly includes electric motors and to a lesser extent
internal combustion engines. The choice between these two main types of drive systems is usually
based on economic considerations. The cost of electricity in proportion to that of fuel for an internal
combustion engine is such that electricity is usually preferred, except where the cost of supplying
electricity at a specific point is very high.
Electric motors are consequently usually preferred to internal combustion engines and internal
combustion engines are normally only used where three-phase power is unavailable, variable speed is
required (which is very unlikely), or where the pump has to be portable. It is, however, also possible to
make use of an electric motor for portable pumps, but then every pump station has to be provided with a
three-phase power point.
358
APPENDIX B
Research products that arose from the project
B1 Theses and Dissertations
1. SHONGWE, M. 2007. The development of a problem-solving strategy for water
management at block level at Tugela Ferry, MSc dissertation, University of
Pretoria.
2. MONATISA, M.P. 2008. An integrated approach towards achieving efficient, effective and
best management practices in water use and optimum crop production through a water
users’ association. MSc dissertation, University of the Free State, Bloemfontein.
3. TSHUMA, M. 2009. A Socio-Economic Impact Assessment of the Best Management
practices (BMP) project of the Zanyokwe Irrigation Scheme at farm level. MSc
dissertation, University of Fort Hare, Alice.
4. MANYEVERE, A. 2010. Soil fertility mapping of Zanyokwe Irrigation Scheme, Eastern
Cape Province, South Africa. MSc dissertation, University of Fort Hare, Alice.
5. FANADZO, M. 2010. Improving the productivity of maize-based small-scale irrigation
cropping systems: A case study of Zanyokwe irrigation scheme, Eastern Cape, South
Africa. PhD thesis, University of Fort Hare, Alice, South Africa.
B2 Journal publications
1. FANADZO, M., CHIDUZA, C., & MNKENI, P.N.S., 2010. Pre-plant weed control and
optimum N rate and plant densities increase butternut (Cucurbita moschata) yield under
smallholder irrigated conditions in the Eastern Cape Province of South Africa. African
Journal of Agricultural Research (accepted)
2. FANADZO, M., CHIDUZA, C., & MNKENI, P.N.S., 2010. Reduced dosages of atrazine
and narrow rows can provide adequate weed control in smallholder irrigated maize (Zea
mays L.) production in South Africa. African Journal of Biotechnology 9: In press
3. FANADZO, M., CHIDUZA, C., & MNKENI, P.N.S., 2010. Comparative response of direct
seeded and transplanting green maize under farmer management in small scale
irrigation: a case study of Zanyokwe irrigation scheme, Eastern Cape, South Africa.
African Journal of Agricultural Research 5(7):524-531.
4. FANADZO, M., CHIDUZA, C., & MNKENI, P.N.S., 2010. Effect of inter-row spacing and
plant population on weed dynamics and maize (Zea mays L.) yield at Zanyokwe irrigation
359
scheme, Eastern Cape, South Africa. African Journal of Agricultural Research 5(7):518-
523.
5. FANADZO, M., CHIDUZA, C., MNKENI, P.N.S., VAN DER STOEP & STEVENS, J.,
2010. Crop production management practices as a cause of low water productivity at
Zanyokwe irrigation scheme, Water SA 36(1):27-36.
6. FANADZO, M., CHIDUZA, C., & MNKENI, P.N.S., 2009. Comparative response of direct
seeded and transplanted maize (Zea mays L.) to nitrogen fertilization at Zanyokwe
irrigation scheme, Eastern Cape, South Africa. African Journal of Agricultural Research
4(8):689-694.
7. FANADZO, M., CHIDUZA, C., & MNKENI, P.N.S., 2009. Investigation of agronomic
factors constraining productivity of grain maize (Zea mays L.) at Zanyokwe irrigation
scheme, Eastern Cape, South Africa. Journal of Applied Biosciences 17:948-958.
8. MODI, A.T. 2010. Appraisal of extension officers and small-holder farmers for crop
management at the Tugela Ferry irrigation scheme, KwaZulu-Natal. Development SA (In
press)
9. FANADZO, M., CHIDUZA, C., & MNKENI, P.N.S., 2010. Overview of smallholder
schemes in South Africa: relationship between farmer crop management practices and
performance. African Journal of Agricultural Research (Accepted).
Related Documents