The INL is a U.S. Department of Energy National Laboratory operated by Battelle Energy Alliance INL/EXT-07-13575 Commercial Scale Performance Predictions for High-Temperature Electrolysis Plants Coupled to Three Advanced Reactor Types M. G. McKellar J. E. O’Brien J. S. Herring September 2007

Welcome message from author
This document is posted to help you gain knowledge. Please leave a comment to let me know what you think about it! Share it to your friends and learn new things together.
Transcript

The INL is a U.S. Department of Energy National Laboratory operated by Battelle Energy Alliance
INL/EXT-07-13575
Commercial-Scale Performance Predictions for High-Temperature Electrolysis Plants Coupled to Three Advanced Reactor Types
M. G. McKellar J. E. O’Brien J. S. Herring
September 2007
INL/EXT-07-13575
Commercial-Scale Performance Predictions for High-Temperature Electrolysis Plants Coupled to Three
Advanced Test Reactor Types
M. G. McKellar J. E. O’Brien J. S. Herring
September 2007
Idaho National Laboratory Idaho Falls, Idaho 83415
Prepared for the U.S. Department of Energy Office of Nuclear Energy
Under DOE Idaho Operations Office Contract DE-AC07-05ID14517

iii
ABSTRACT
This report presents results of system analyses that have been developed to assess the hydrogen-production performance of commercial-scale high-temperature electrolysis (HTE) plants driven by three different advanced reactor – power-cycle combinations: a high-temperature helium-cooled reactor coupled to a direct Brayton power cycle, a supercritical CO2-cooled reactor coupled to a direct recompression cycle, and a sodium-cooled fast reactor coupled to a Rankine cycle. The system analyses were performed using UniSim software. The work described in this report represents a refinement of previous analyses in that the process flow diagrams include realistic representations of the three advanced reactors directly coupled to the power cycles and integrated with the high-temperature electrolysis process loops. In addition, this report includes parametric studies in which the performance of each HTE concept is determined over a wide range of operating conditions. Results of the study indicate that overall thermal-to-hydrogen production efficiencies (based on the low heating value of the produced hydrogen) in the 45 - 50% range can be achieved at reasonable production rates with the high-temperature helium-cooled reactor concept, 42 - 44% with the supercritical CO2-cooled reactor and about 33 - 34% with the sodium-cooled reactor.

iv
TABLE OF CONTENTS
ABSTRACT................................................................................................................................... iii TABLE OF CONTENTS............................................................................................................... iv FIGURES........................................................................................................................................ v TABLES ....................................................................................................................................... vii 1. INTRODUCTION .................................................................................................................. 1 2. POWER CYCLE PROCESS MODELS................................................................................. 1
2.1. Direct Helium Recuperated Brayton Cycle .................................................................... 2 2.2. Supercritical CO2 Recompression Cycle ........................................................................ 3 2.3. Sodium-cooled fast reactor / Rankine cycle ................................................................... 4
3. HTE PLANT PROCESS MODELS ....................................................................................... 5 3.1. HTE Plant with Direct Helium Recuperated Brayton Cycle .......................................... 5 3.2. HTE Plant with Supercritical CO2 Recompression Cycle .............................................. 8 3.3. HTE Plant with Sodium-cooled fast reactor / Rankine cycle ....................................... 10
4. RESULTS OF PARAMETRIC STUDIES........................................................................... 12 4.1. HTE Plant with Direct Helium Recuperated Brayton Cycle ........................................ 14 4.2. HTE Plant with Supercritical CO2 Recompression Cycle ............................................ 16 4.3. HTE Plant with Sodium-cooled fast reactor / Rankine cycle ....................................... 17
5. USE OF WASTE REFINERY GASES AS A SUPPLEMENTAL HEAT SOURCE ......... 18 6. DEMONSTRATION NEEDS FOR COMMERCIAL APPLICATIONS............................ 20 7. CONCLUSIONS................................................................................................................... 22 8. REFERENCES ..................................................................................................................... 24 9. APPENDIX A – PROCESS PROPERTIES BY STATE POINT FOR REPRESENTATIVE CASES ............................................................................................................................................ 1

v
FIGURES
Figure 1. UniSim process flow diagram for helium recuperated direct Brayton cycle................ 3
Figure 2. UniSim process flow diagram for supercritical CO2 recompression cycle.................. 4
Figure 3. UniSim process flow diagram for sodium-cooled fast reactor coupled to a Rankine cycle. ............................................................................................................................. 5
Figure 4. Process flow diagram for the helium-cooled reactor / direct Brayton / HTE system with air sweep. .............................................................................................................. 6
Figure 5. Process flow diagram for the helium-cooled reactor/direct Brayton/HTE system with no sweep gas. ................................................................................................................ 7
Figure 6. Process flow diagram for the HTE plant with a supercritical CO2 recompression cycle, air sweep............................................................................................................. 9
Figure 7. Process flow diagram for the HTE plant with a supercritical CO2 recompression cycle, no sweep. .......................................................................................................... 10
Figure 8. Process flow diagram for the sodium-cooled reactor / Rankine / HTE system, air sweep........................................................................................................................... 11
Figure 9. Process flow diagram for the sodium-cooled reactor / Rankine / HTE system , no sweep........................................................................................................................... 12
Figure 10. Overall hydrogen production efficiencies for HTE coupled to a direct helium recuperated Brayton cycle, air sweep; (a) plotted against current density, (b) plotted against per-cell operating voltage. .............................................................................. 14
Figure 11. (a) Electrolyzer outlet temperatures for adiabatic operation with air sweep; (b) electrolyzer heat requirement for isothermal operation with air sweep, as a function of per-cell operating voltage. .......................................................................................... 15
Figure 12. Overall hydrogen production efficiencies for HTE coupled to a direct helium recuperated Brayton cycle, no sweep gas; (a) plotted against current density, (b) plotted against per-cell operating voltage. .................................................................. 16
Figure 13. Overall hydrogen production efficiencies for HTE coupled to a supercritical CO2 recompression cycle; (a) plotted against current density, (b) plotted against per-cell operating voltage......................................................................................................... 17
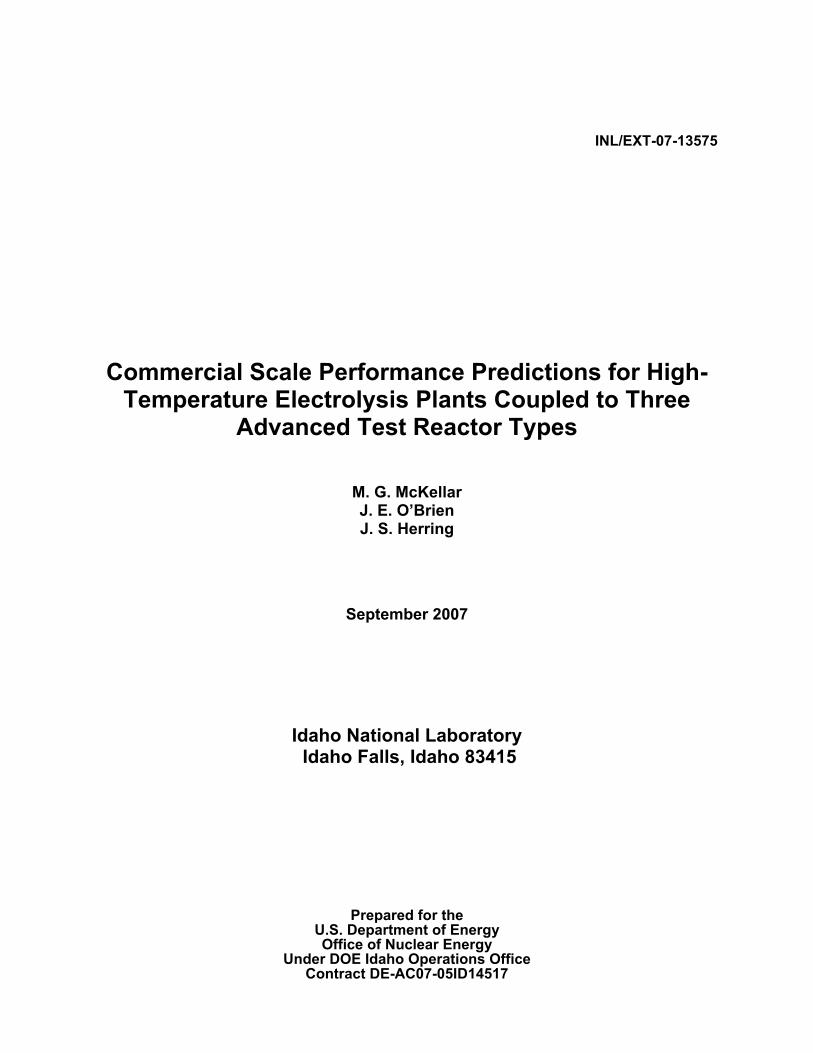
Figure 14. Overall hydrogen production efficiencies for HTE coupled to a sodium-cooled fast reactor / Rankine cycle; (a) plotted against current density, (b) plotted against per-cell operating voltage......................................................................................................... 18
Figure 15. Overall hydrogen production efficiencies for HTE with no sweep and using process heat, coupled to a sodium-cooled fast reactor / Rankine cycle; (a) plotted against current density, (b) plotted against per-cell operating voltage ................................... 19
Figure 16. Process heat produced as a function of air molar flow rate for 1 kgmole/hr flow of waste refinery gas at various combustion temperatures. ............................................ 19

vi
Figure 17. Waste refinery gas fuel to hydrogen product mass flow rate ratio as a function of current density............................................................................................................. 20

vii
TABLES
Table 1. Test objectives for various scales of high-temperature electrolysis facilities.......... 21
Table A-1. Temperature, pressure, and mass flow rate data for the very high temperature helium-cooled reactor coupled with the direct Brayton cycle and the HTE plant; thermal neutral operating voltage, ASR = 1.25 Ohm·cm2, air sweep.................... A-1
Table A-2. Molar composition data for the very high temperature helium-cooled reactor coupled with the direct Brayton cycle and the HTE plant; thermal neutral operating voltage, ASR = 1.25 Ohm·cm2, air sweep ............................................................. A-2
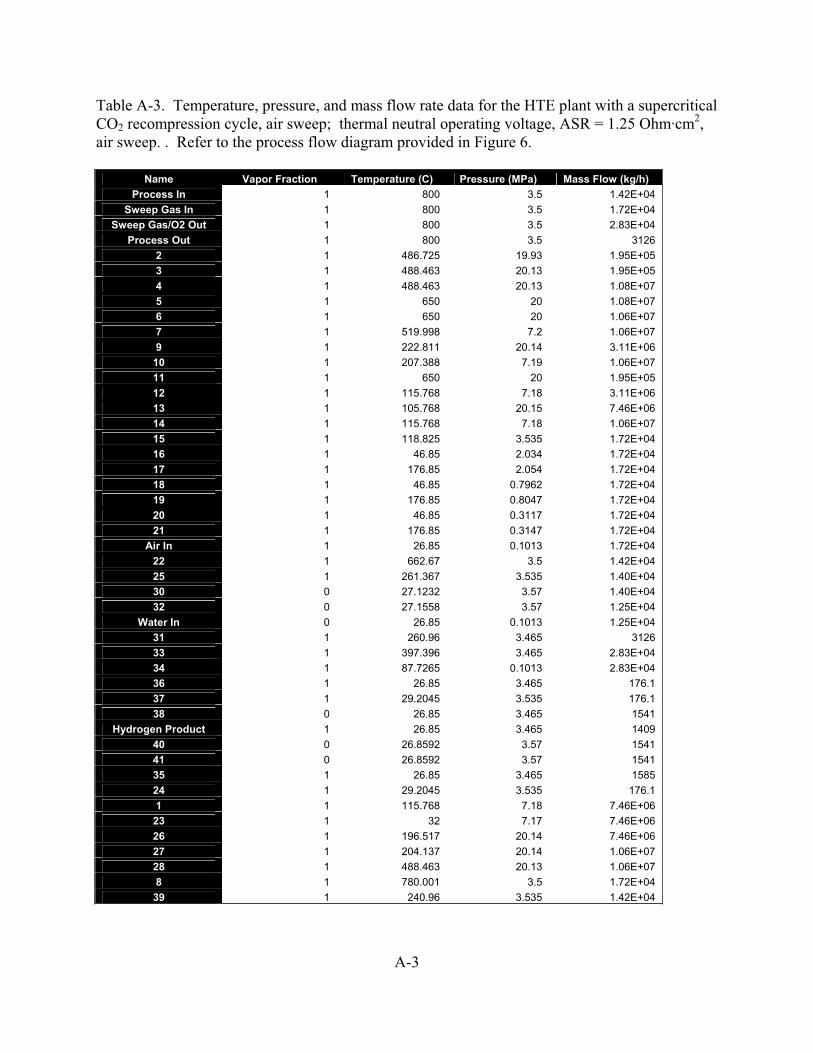
Table A-3. Temperature, pressure, and mass flow rate data for the HTE plant with a supercritical CO2 recompression cycle, air sweep; thermal neutral operating voltage, ASR = 1.25 Ohm·cm2, air sweep ............................................................. A-3
Table A-4. Molar composition data for the HTE plant with a supercritical CO2 recompression cycle, air sweep; thermal neutral operating voltage, ASR = 1.25 Ohm·cm2, air sweep...................................................................................................................... A-4
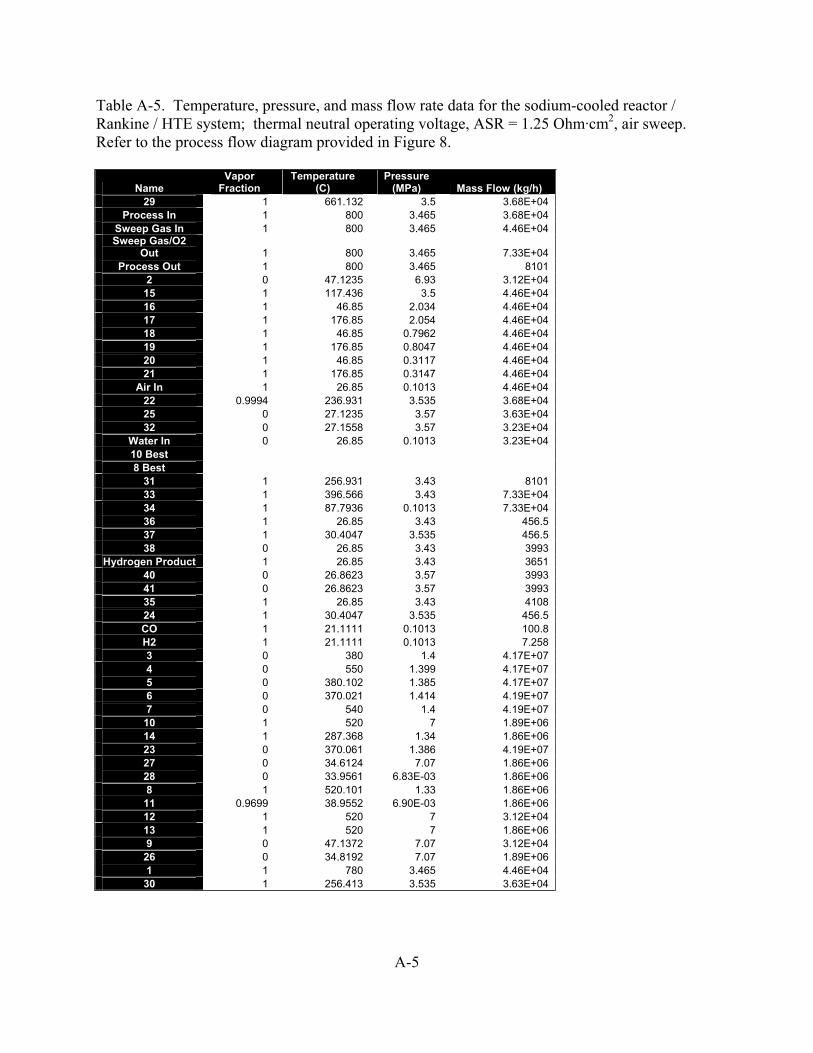
Table A-5. Temperature, pressure, and mass flow rate data for the sodium-cooled reactor / Rankine / HTE system; thermal neutral operating voltage, ASR = 1.25 Ohm·cm2,air sweep ................................................................................................................ A-5
Table A-6. Molar composition data for the sodium-cooled reactor / Rankine / HTE system; thermal neutral operating voltage, ASR = 1.25 Ohm·cm2, air sweep.................... A-6

1
1. INTRODUCTION
This report describes system analyses performed to evaluate the overall efficiency of commercial-scale nuclear-powered dedicated hydrogen production plants based on high temperature electrolysis (HTE). The primary advantage of high temperature electrolysis over conventional electrolysis, which is a well established technology, is that considerably higher overall efficiencies can be achieved. The improved performance of HTE versus conventional low-temperature (alkaline or PEM) electrolysis is due to both the improved power-cycle efficiencies and electrolyzer efficiencies associated with high-temperature operation. Higher reactor outlet temperatures yield higher power cycle efficiencies in accordance with the Carnot principle. For example, power conversion thermal efficiencies in excess of 50% can be achieved with the high-temperature gas-cooled reactor coupled to the direct Brayton cycle [1]. The electrolyzer itself benefits from high-temperature operation for reasons related to both thermodynamics and kinetics. From thermodynamics, the electrical energy requirement for water or steam electrolysis decreases with increasing temperature, while the thermal energy requirement increases. Consequently, at higher temperatures, a larger fraction of the total electrolysis energy input can be supplied in the form of heat, increasing the overall process efficiency. In terms of kinetics, activation and ohmic electrochemical overpotentials also decrease dramatically with temperature.
UniSim process analysis software was used to evaluate the performance of commercial-scale hydrogen production plants coupled to three advanced-reactor/power cycle concepts. UniSim software is a derivative of the HYSYS process analysis software. UniSim inherently ensures mass and energy balances across all components and it includes thermodynamic data for all chemical species. The work described in this report represents a refinement of previous analyses in that the process flow diagrams include realistic representations of the three advanced reactors directly coupled to the power cycles and integrated with the high-temperature electrolysis process loops. In addition, this report includes parametric studies in which the performance of each HTE concept is determined over a wide range of operating conditions. As with previous HTE system analyses performed at the INL, a custom one-dimensional electrolyzer model was incorporated into the overall process flow sheet. This electrolyzer model allows for the determination of the average Nernst potential, cell operating voltage, gas outlet temperatures, and electrolyzer efficiency for any specified inlet steam, hydrogen, and sweep-gas flow rates, current density, cell active area, and external heat loss or gain. The one-dimensional electrolyzer model has been validated by comparison with results obtained from a fully 3-D computational fluid dynamics model and by comparison with experimental results. These comparisons may be found in reference [2].
2. POWER CYCLE PROCESS MODELS
The three advanced reactor – power cycle combinations analyzed in this report include: a high-temperature helium-cooled reactor coupled to a direct helium recuperated Brayton cycle, a

2
supercritical CO2-cooled reactor coupled to a direct supercritical CO2 recompression cycle, and a sodium-cooled fast reactor coupled to a tertiary steam Rankine cycle. The two gas-cooled reactor concepts are candidate high-temperature reactors under consideration for future development under the DOE Next-Generation Nuclear Plant (NGNP) program. The sodium-cooled fast reactor is under consideration for future development under the DOE Global Nuclear Energy Program (GNEP). Reactor outlet temperatures assumed in the analyses are 900°C, 650°C and 550°C, for the helium-cooled, supercritical CO2-cooled, and sodium-cooled reactors, respectively.
Process models for the three reactor-coupled power cycles were developed for this study. The three reactor power cycles selected were based on advanced reactor concepts capable of operating with reactor outlet temperatures in the range of 550°C to 900°C. These high temperatures result in higher power cycle efficiencies (45 to 55%) for these advanced reactor concepts than can be achieved with current generation reactors (30 to 35%). In addition, the high temperature process heat available from these advanced high temperature reactors can further enhance hydrogen production efficiencies when the reactor is coupled to a HTE hydrogen production plant. The three power cycles and the corresponding UniSim representations developed for this study are described in the following sections.
2.1. Direct Helium Recuperated Brayton Cycle
A process flow diagram for the high-temperature helium-cooled reactor coupled to the direct helium recuperated Brayton cycle is presented in Figure 1. This power-cycle UniSim model was initially described in [3]. The primary helium coolant exits the reactor at 900°C. This helium flow is split at T1, with more than 90% of the flow directed toward the power cycle and the remainder directed to the intermediate heat exchanger to provide process heat to the HTE loop.Within the power-cycle loop, helium flows through the power turbine where the gas is expanded to produce electric power. The helium, at a reduced pressure and temperature, then passes through a recuperator and precooler where it is further cooled before entering the low-pressure compressor. To improve compression efficiencies, the helium is again cooled in an intercooler heat exchanger before entering the high-pressure compressor. The helium exits the high-pressure compressor at a pressure that is slightly higher than the reactor operating pressure of 7 MPa. The coolant then circulates back through the recuperator where the recovered heat raises its temperature to the reactor inlet temperature of 540°C, completing the cycle.
Process heat for the HTE hydrogen production plant is provided by splitting the reactor coolant outlet flow into two streams, and allowing a fraction (typically less than 10%) of the flow to pass through an intermediate heat exchanger where heat is extracted for use in the hydrogen production process. The cooler helium leaving the intermediate heat exchanger (stream 3 in Figure 1) is then returned through a circulator to the reactor inlet pressure and mixed with the primary coolant returning to the reactor.
The reactor thermal power assumed for the high-temperature helium-cooled reactor was 600 MWt. The UniSim-calculated power cycle thermal efficiency for the system represented in Figure 1 is approximately 53 %.

3
Figure 1. UniSim process flow diagram for helium recuperated direct Brayton cycle.
2.2. Supercritical CO2 Recompression Cycle
The supercritical CO2 recompression cycle [4, 5] was developed as a means of improving the efficiency of the simpler supercritical CO2 recuperation cycle by overcoming the pinch point problem caused by large irreversibilities in the recuperator. This direct cycle, shown in Figure 2, operates at a reactor coolant inlet pressure of approximately 20 MPa. For this particular case, the coolant enters the reactor at a temperature of approximately 488°C and leaves the reactor at 650°C. The majority of the primary coolant flow enters the power conversion portion of the cycle where it is expanded through a turbine to produce electric power. The coolant, at a lower temperature and pressure then passes through high-temperature and low-temperature regenerators, where it is further cooled. The coolant flow is then split into two streams (bottom of Figure 2). One stream passes through a precooler that provides additional cooling to the working fluid before it enters the Main Compressor. The Main Compressor provides the driving force to circulate the fluid back through the two regenerators where heat is recovered before the working fluid is returned to the reactor inlet to complete the cycle. The second split stream at the bottom of Figure 2 passes directly to Recomp Compressor without any additional cooling, where it is compressed and joined with the first split stream before passing through the high-temperature recuperator and returning to the reactor inlet to complete the cycle.

4
Figure 2. UniSim process flow diagram for supercritical CO2 recompression cycle
To provide process heat for the hydrogen production process, a portion of the reactor coolant outlet flow (88% or more, depending on the HTE hydrogen production rate) is again split from the main coolant flow (stream 7) and routed through the intermediate heat exchanger (not shown). After the process heat is rejected through the intermediate heat exchanger, the return bypass flow (stream 3) is compressed and mixed with the primary coolant flow at the reactor inlet.
The reactor power in this case was again 600 MWt. The UniSim-calculated power cycle thermal efficiency for the supercritical CO2 recompression cycle represented in Fig. 2 is 49.4 %.
2.3. Sodium-cooled fast reactor / Rankine cycle
A process flow diagram for the sodium-cooled fast reactor coupled to a steam Rankine cycle is presented in Figure 3. Sodium coolant exits the reactor at 550°C. For safety reasons, the primary sodium loop is isolated from the steam power-cycle working fluid by means of a secondary sodium loop. Heat transfer between the primary and secondary loops occurs via the sodium heat exchanger. Sodium circulation pumps are installed on both sodium loops. The secondary sodium loop serves as the thermal energy source for the Rankine cycle steam generator. The Rankine power cycle incorporates a high-pressure turbine and a low-pressure turbine with intermediate reheat. Reheat is accomplished by rerouting the outlet of the high-pressure turbine through the steam generator. Downstream of the low-pressure turbine, heat is rejected at the condenser. Liquid water is returned to the steam generator by means of a circulation pump. Process heat for the HTE loop is split off of the high-temperature steam line at T1 and returned at M1.

5
Figure 3. UniSim process flow diagram for sodium-cooled fast reactor coupled to a Rankine cycle.
Reactor thermal power for the sodium-cooled fast reactor was assumed to be 2000 MWt. The UniSim-calculated power cycle thermal efficiency for the Rankine cycle represented in Figure 3 is approximately 38 %.
3. HTE PLANT PROCESS MODELS
3.1. HTE Plant with Direct Helium Recuperated Brayton Cycle
The overall process flow diagram for the very high-temperature helium-cooled reactor coupled to the direct helium Brayton power cycle and the HTE plant with air sweep is presented in Figure 4.The liquid water feedstock enters at the left in the diagram. The water is compressed to the HTE process pressure of 3.5 MPa in the liquid phase using a pump. The HTE process is operated at elevated pressure for two reasons. Elevated pressure supports higher mass flow rates for the same size components. Furthermore, the gaseous hydrogen product will ultimately be delivered at elevated pressure either for storage or pipeline. Therefore, from the standpoint of overall process efficiency, it is logical to compress the liquid water feedstock at the process inlet since liquid-phase compression work is very small compared to compression of the gaseous product.
Downstream of the pump, condensate from the water knockout tank is recycled back into the inlet stream at M3. The water stream is then vaporized and pre-heated in the electrolysis recuperator, which recovers heat from the post-electrolyzer process and sweep-gas outlet streams. Downstream of the recuperator, at M2, the steam is mixed with recycled hydrogen product gas. A fraction of the product gas is recycled in this way in order to assure that reducing conditions are maintained on the steam/hydrogen electrode. Downstream of the mixer, the process gas mixture enters the intermediate heat exchanger (IHX), where final heating to the electrolysis operating temperature occurs, using high-temperature process heat from the nuclear reactor. The process stream then enters the electrolyzer, where oxygen is electrolytically removed from the steam, producing hydrogen and oxygen. The custom electrolyzer module

6
developed at INL for direct incorporation into the UniSim system analysis code has been described in detail previously [2].
Downstream of the electrolyzer, the hydrogen – rich product stream flows through the electrolysis recuperator where the product stream is cooled and the inlet process stream is preheated. The cooled product stream is split at T2 and a fraction of the product gas is recycled into the inlet process stream, as discussed previously. A recirculating blower is required to repressurize the recycle stream to the upstream pressure at M2. The remainder of the product stream is cooled further at the water knockout tank, where the majority of any residual steam is condensed and separated, yielding dry hydrogen product.
The process flow diagram shows air in use as a sweep gas, to remove the excess oxygen that is evolved on the anode side of the electrolyzer. For the air-sweep cases, inlet air is compressed to the system operating pressure of 3.5 MPa in a four-stage compressor with intercooling. The final compression stage is not followed by a cooler, so the air enters the IHX at about 105°C. The sweep gas is heated to the electrolyzer operating temperature of 800°C via the IHX which supplies high-temperature nuclear process heat directly to the system. The sweep gas then enters the electrolyzer, where it is combined with product oxygen. Finally, it passes through the electrolysis recuperator to help preheat the incoming process gas. Some of the sweep gas compression work is recovered using a sweep-gas turbine located at the sweep-gas exit.
Figure 4. Process flow diagram for the helium-cooled reactor / direct Brayton / HTE system with air sweep.

7
Figure 5. Process flow diagram for the helium-cooled reactor/direct Brayton/HTE system with no sweep gas.
In order to avoid the work requirement associated with compression of the sweep gas, it is possible to operate with no sweep gas, and to allow the system to produce pure oxygen, which could potentially be supplied to another collocated process such as an oxygen-blown gasifier. The overall process flow diagram for the very high-temperature helium-cooled reactor coupled to the direct helium Brayton power cycle and the HTE plant with no sweep is presented in Figure 5.For this mode of operation, the four-stage air compressor would not be included in the process flow diagram and there would be no air flow through the intermediate heat exchanger. Air preheat at the IHX is no longer needed. Oxygen would simply be evolved from the anode side of the electrolyzer at the electrolysis operating pressure and temperature. It would flow through the electrolysis heat recuperator and the outlet turbine. The results of the system analysis will show that this concept is desirable from the standpoint of overall process efficiency, but there are significant technical issues associated with handling high-temperature pure oxygen that would have to be addressed.
The methodology and constraints used in running the UniSim simulations in order to maximize hydrogen production efficiencies for the very high-temperature helium-cooled reactor coupled to the direct helium Brayton power cycle and the HTE plant was as follows:

8
1. Specify desired current density, inlet and outlet compositions of steam and hydrogen, cell area and total number of cells. We have specified 90% steam, 10% hydrogen at the inlet and 10% steam, 90% hydrogen at the outlet for all cases. This corresponds to a steam utilization of 88.9%.
2. Determine the required mass flow rate of process steam based on the specified current density (and corresponding hydrogen production rate) and inlet and outlet compositions.
3. Adjust the flow split at T2 to achieve the desired inlet composition (10% hydrogen, 90% steam)
4. For air sweep cases, the mass flow of the air is automatically adjusted to produce an outlet stream that is 50% oxygen (the remainder is nitrogen).
5. Adjust the outlet pressure of the low-pressure compressor to achieve maximum power-cycle efficiency.
6. Adjust the power cycle/HTE process heat split at T1 to maximize hydrogen production efficiency until the minimum approach temperature of the electrolysis heat recuperator is just below 50°C.
7. Assume power cycle turbine adiabatic efficiency is 90%. Power cycle compressor efficiencies are 88%. All other compressor, turbine and pump efficiencies are 75%
3.2. HTE Plant with Supercritical CO2 Recompression Cycle
The overall process flow diagram for the supercritical CO2 (SCO2)-cooled reactor coupled to the recompression power cycle and the HTE plant is presented in Figure 6 for the air-sweep case. The HTE plant for this case is similar to the HTE plant used with the helium-cooled reactor / Brayton cycle. However, since the reactor outlet temperature for the CO2 reactor is only 650°C, the HTE loop for this reactor/power cycle combination includes two auxiliary high-temperature process heaters. These heaters are required to boost the temperature of the steam/hydrogen process stream and the air sweep stream to the HTE operating temperature of 800°C. The heaters have been modeled here as electrical resistance heaters, so the thermal energy required to heat these streams is penalized by the thermal efficiency of the power cycle, reducing the overall hydrogen production efficiency. Alternately, this heat requirement could be supplied by some kind of combustion heater. The use of waste refinery gases as a fuel for combustion-based versions of these auxiliary heaters will be discussed briefly in a later section.
Liquid water feedstock enters from the upper left of the process flow diagram. It is compressed to the process operating pressure of 3.5 MPa using a pump. The feedstock is mixed with recycled condensate at M3. In this HTE process loop, the water then enters the intermediate heat exchanger where it is vaporized and superheated. Downstream of the IHX, the steam is mixed with recycled hydrogen that also flowed through the IHX. The steam/hydrogen mixture passes through the electrolysis heat recuperator and the high-temperature process (electrical resistance or combustion-based) heater to bring the stream to the electrolyzer operating temperature of 800°C. Downstream of the electrolyzer, the hydrogen-rich stream flows through the hot side of the electrolysis heat recuperator and the water separator. At T2, the flow is split into the hydrogen product and hydrogen recycle streams. On the sweep-gas side, air is compressed in a four-stage compressor with intercoolers to the 3.5 MPa HTE process pressure. The air stream is heated to the electrolyzer temperature via the sweep-gas recuperator and the auxiliary high-temperature sweep-gas heater. After passing through the electrolyzer, the air flows through the

9
Figure 6. Process flow diagram for the HTE plant with a supercritical CO2 recompression cycle, air sweep.
hot side of the sweep-gas recuperator and through a turbo-expander where some of the compression work is recovered.
The overall process flow diagram for the supercritical CO2-cooled reactor coupled to the recompression power cycle and the HTE plant is presented in Figure 7 for the no-sweep case.For this case, comparing to Figure 6, the four-stage compression process is eliminated and the sweep-gas recuperated is no longer needed. Oxygen produced in the electrolyzer passes through the electrolysis heat recuperator instead of through the sweep-gas recuperator. Otherwise, the air-sweep and no-sweep processes are similar.
The methodology and constraints used in running the UniSim simulations in order to maximize hydrogen production efficiencies for the supercritical CO2 (SCO2)-cooled reactor coupled to the recompression power cycle and the HTE plant were similar to the previous reactor/power cycle combination with the following exceptions:
1. Sweep gas and electrolysis heat recuperators were set to 20°C minimum approach temperatures.

10
Figure 7. Process flow diagram for the HTE plant with a supercritical CO2 recompression cycle, no sweep.
2. Power cycle turbine and compressor efficiencies were set to 90%. All other turbo-machinery efficiencies were set at 75%.
3. The power cycle efficiency was set by adjusting the temperature inlet into the reactor and by adjusting the pressure at the outlet of the turbine. The split at T3 automatically adjusts to ensure that the recompression compressor has an efficiency of 90%.
3.3. HTE Plant with Sodium-cooled fast reactor / Rankine cycle
The overall process flow diagram for the sodium-cooled reactor coupled to the Rankine power cycle and the HTE plant is presented in Figure 8 for the air-sweep case. The HTE steam/hydrogen and air process loops for this concept are identical to those of the air-sweep SCO2 plant, so an additional detailed description is not needed. The corresponding no-sweep process diagram is presented in Figure 9. For the no-sweep case, the four-stage compression process, the sweep-gas recuperator, and the high-temperature sweep-gas heater are all eliminated. Oxygen produced in the electrolyzer passes through the electrolysis heat recuperator instead of through the sweep-gas recuperator. Otherwise, the air-sweep and no-sweep processes are similar.

11
The methodology and constraints used in running the UniSim simulations in order to maximize hydrogen production efficiencies for the sodium-cooled reactor coupled to the Rankine power cycle and the HTE plant were similar to the previous reactor/power cycle combination with the following exceptions:
1. The minimum approach temperature of the Sodium HX is set at 10°C. 2. The steam generator minimum approach temperature is set to 20°C by adjusting the
pressure at the exit of the high-pressure turbine. 3. The temperature of the water stream entering the intermediate heat exchanger is set to be
20°C greater than that of the stream entering the HTE process heat pump. 4. Minimum approach temperatures of 20°C are set for the electrolysis heat and sweep gas
recuperators.
Figure 8. Process flow diagram for the sodium-cooled reactor / Rankine / HTE system, air sweep.

12
Figure 9. Process flow diagram for the sodium-cooled reactor / Rankine / HTE system , no sweep.
4. RESULTS OF PARAMETRIC STUDIES
For these simulations, the per-cell active area for electrolysis was assumed to be 225 cm2. This cell size is well within the limits of current technology for planar cells. The total number of cells used in the process simulations was determined by specifying a maximum current density for each ASR value considered that was large enough to ensure that the operating voltage would just exceed the thermal neutral voltage. For the higher nominal ASR value of 1.25 Ohm·cm2, the maximum current density was set at 0.25 A/cm2 and an adiabatic thermal boundary condition was assumed. The total number of cells for this base case was adjusted until the total remaining power was zero. In other words, the full power cycle output at this operating point is dedicated to electrolysis. This procedure resulted in 1.615 × 10⁶ cells required. At lower current densities, the power cycle output exceeds the value required for electrolysis and this excess power would be supplied to the grid. For the case of ASR = 0.25 Ohm·cm2, the maximum current density was set at 1.0 A/cm2. A much higher maximum current density was required for the lower ASR case, again in order to assure that the thermal neutral voltage was just exceeded. Detailed process flow rates, fluid properties, and compositions are tabulated by state point for three representative cases in Appendix A.
The ASR value used in the electrolyzer module is temperature- dependent per the following Arrhenius equation:

13
)(10300exp10973.3463.0)( 5
1100 KTASRTASR K
(11)
where ASR1100K represents the user-specified cell ASR at the temperature 1100 K (e.g., 0.25 or 1.25). This constant allows one to shift the entire ASR curve to higher or lower ASR values, to mimic lower or higher performing cells, respectively. This equation for ASR(T) is based on empirical data obtained from an actual operating stack, modified to allow user specification of the ASR value at 1100 K. In order to show the trends that can be expected with higher or lower ASR, two values of ASR1100K have been included in this study. The ASR1100K value of 1.25 represents a stack-average ASR value at 1100 K that should be achievable in the short term with existing technology. The ASR1100K value of 0.25 is an optimistic value that has been observed in button cells, but will be difficult to achieve in a stack in the short term. The temperature dependence of the ASR is important for the adiabatic cases (since the outlet temperature in these cases is generally different than the inlet temperature) and for evaluating the effect of electrolyzer inlet temperature on overall process efficiency.
For the isothermal cases, heat from the reactor was directly supplied to the electrolysis process to maintain isothermal conditions. For the adiabatic cases, the direct electrolyzer heater was not used.
To allow for comparisons between the performances of the HTE process to alternate hydrogen production techniques, we have adopted a general efficiency definition that can be applied to any thermal water-splitting process, including HTE, low-temperature electrolysis (LTE), and thermochemical processes. Since the primary energy input to the thermochemical processes is in the form of heat, the appropriate general efficiency definition to be applied to all of the techniques is the overall thermal-to-hydrogen efficiency, H. This efficiency is defined as the heating value of the produced hydrogen divided by the total thermal input required to produce it.In this report, the lower heating value, LHV, of the produced hydrogen has been used:
ii
H QLHV
(1)
The denominator in this efficiency definition quantifies all of the net thermal energy that is consumed in the process. For a thermochemical process, this summation includes the direct nuclear process heat as well as the thermal equivalent of any electrically driven components such as pumps, compressors, etc. The thermal equivalent of any electrical power consumed in the process is the power divided by the thermal efficiency of the power cycle. The power-cycle thermal efficiency for the three concepts examined in this study ranged from 52.6% for the helium-cooled direct Brayton cycle, to 49.4% for the SCO2 concept, to 37.8% for the sodium-cooled reactor concept. For an electrolysis process, the summation in the denominator of Eqn. (1) includes the thermal equivalent of the primary electrical energy input to the electrolyzer and the secondary contributions from smaller components such as pumps and compressors. In additional, any direct thermal inputs are also included. Direct thermal inputs include any net (not recuperated) heat required to heat the process streams up to the electrolyzer operating temperature and any direct heating of the electrolyzer itself required for isothermal operation. Finally, for the lower-reactor-outlet-temperature concepts, the thermal equivalent of the auxiliary heater inputs must be included. If these heaters use electrical resistance heat, the heat input is penalized by the power cycle thermal efficiency. If the heaters are combustion-based, only the direct heat amount is included.

14
4.1. HTE Plant with Direct Helium Recuperated Brayton Cycle
The system simulations for the HTE plant coupled to a direct helium recuperated Brayton cycle examined the overall hydrogen production efficiency variation as a function of current density for two ASR values and for both isothermal and adiabatic electrolyzer operation, with and without air sweep. Overall hydrogen production efficiency results for this concept are presented in Figure 10 for the air-sweep case. Most of the cases were run with an HTE process pressure of 3.5 MPa. One case was run at 7.0 MPa HTE process pressure. In Figure 10 (a), overall process efficiencies are plotted as a function of current density. In Figure 10 (b), the results are plotted against per-cell operating voltage. Results of five cases are presented: low and high ASR,adiabatic and isothermal electrolyzer operation, plus one elevated-pressure case. The predicted overall thermal-to-hydrogen efficiency values are generally within 8 percentage points of the power-cycle efficiency of 52.6%, depending on current density. Electrolyzer efficiency is inversely proportional to operating voltage. Higher current densities and correspondingly higher hydrogen production rates require higher operating voltages. Therefore, overall efficiencies decrease with increasing current density, and hydrogen production performance is a tradeoff between efficiency and production rate. For a specified target production rate, higher production efficiency comes with a higher capital cost, since more cells would be required to achieve the target production rate. In general, a good tradeoff between production rate and efficiency occurs for operating voltages near the thermal neutral value, around 1.29 V. This operating voltage is also desirable from the standpoint that the electrolysis stack operates nearly isothermally at this voltage.
The adiabatic cases show a nonlinear decrease in overall efficiency with increasing current density, as a result of the temperature-dependent ASR used in the simulation. For isothermal cases, the ASR is constant and the overall efficiencies decrease linearly with current density. For a specified current density (and hydrogen production rate), the isothermal cases produce higher efficiencies, at operating voltages below thermal neutral and lower efficiencies at operating voltages above thermal neutral. The highest overall efficiencies occur for low-current-
0.44
0.45
0.46
0.47
0.48
0.49
0.5
0.51
0 0.2 0.4 0.6 0.8 1current density, A/cm^2
over
all H
2 pr
oduc
tion
effic
ienc
y
adiabatic, ASR 0.25
adiabatic, ASR 1.25
isothermal ASR 0.25
isothermal ASR 1.25
adiabatic, ASR 1.25, 7.0 MPa
0.44
0.45
0.46
0.47
0.48
0.49
0.5
0.51
1 1.05 1.1 1.15 1.2 1.25 1.3 1.35 1.4
per-cell operating voltage, V
over
all H
2 pr
oduc
tion
effic
ienc
y
adiabatic ASR 0.25
adiabatic ASR 1.25
isothermal ASR 0.25
isothermal ASR 1.25
adiabatic, ASR 1.25, 7.0 MPa
(a) (b) Figure 10. Overall hydrogen production efficiencies for HTE coupled to a direct helium recuperated Brayton cycle, air sweep; (a) plotted against current density, (b) plotted against per-cell operating voltage.

15
550
600
650
700
750
800
850
900
950
1.18 1.2 1.22 1.24 1.26 1.28 1.3 1.32 1.34
per-cell operating voltage, V
elec
trol
yzer
out
let t
emep
ratu
re (C
)
adiabatic, ASR 0.25
adiabatic, ASR 1.25
-20
-15
-10
-5
0
5
10
15
1.05 1.1 1.15 1.2 1.25 1.3 1.35 1.4
per-cell operating voltage, V
per-
cell
elec
trol
yzer
hea
t req
uire
men
t, W
isothermal, ASR 0.25
isothermal, ASR 1.25
(a) (b) Figure 11. (a) Electrolyzer outlet temperatures for adiabatic operation with air sweep; (b) electrolyzer heat requirement for isothermal operation with air sweep, as a function of per-cell operating voltage.
density isothermal cases for which the highest fraction of total electrolyzer energy is added as heat rather than as electricity. Elevated HTE process pressure results indicate slightly lower overall hydrogen production efficiencies. Interestingly, the overall process efficiencies all collapse onto a single line when plotted as a function of per-cell operating voltage, regardless of the electrolyzer mode of operation (adiabatic or isothermal). Note that the highest operating voltages shown are just above the thermal neutral voltage of 1.29 V. Note also that the highest overall efficiency plotted in Figure 10 (for ASR = 0.25, isothermal, i = 0.0625 A/cm2) exceeds 50%.
Electrolyzer outlet temperatures for adiabatic operation are plotted in Figure 11 (a) as a function of per-cell operating voltage. The assumption of adiabatic electrolyzer operation produces a wide range of outlet temperatures. At low operating voltage, below the thermal neutral voltage (1.287 V at 800°C), the electrolyzer endothermic heat requirement dominates and outlet temperatures are below inlet temperatures. Above the thermal neutral voltage, ohmic heating dominates and outlet temperatures exceed inlet temperatures. The electrolyzer heat requirement for isothermal operation is plotted in Figure 11(b). A positive value for heat requirement indicates that heat addition is needed to maintain isothermal operation. This is the case for operating voltages below thermal neutral. Above thermal neutral, the isothermal heat requirement is negative, indicating that heat rejection is required to maintain isothermal operation. Highest overall hydrogen-production efficiencies occur for isothermal operation below the thermal neutral voltage. For low-ASR cases, reasonable current densities (0.25 A/cm2)can be achieved with operating voltages well below the thermal neutral voltage. Of course, these two thermal operating modes presented here represent two extremes. In general, electrolyzer operation will be neither adiabatic nor isothermal, but somewhere in between.
Overall hydrogen production efficiency results for the HTE plant coupled to a direct helium recuperated Brayton cycle with no electrolyzer sweep gas are presented in Figure 12. In Figure 12 (a), overall process efficiencies are plotted as a function of current density. In Figure 12 (b),the results are plotted against per-cell operating voltage. Results of four cases are presented: low and high ASR, adiabatic and isothermal electrolyzer operation. The predicted overall thermal-to-

16
0.45
0.46
0.47
0.48
0.49
0.5
0.51
0.52
0 0.1 0.2 0.3 0.4 0.5 0.6 0.7 0.8 0.9 1
current density, A/cm^2
over
all h
ydro
gen
prod
uctio
n ef
ficie
ncy
adiabatic, ASR 0.25
adiabatic, ASR 1.25
isothermal, ASR 0.25
isothemal, ASR 1.25
0.45
0.46
0.47
0.48
0.49
0.5
0.51
0.52
1 1.05 1.1 1.15 1.2 1.25 1.3 1.35 1.4
per-cell operating voltage, V
over
all h
ydro
gen
prod
uctio
n ef
ficie
ncy
adiabatic, ASR 0.25
adiabatic, ASR 1.25
isothermal, ASR 0.25
isothermal, ASR 1.25
(a) (b) Figure 12. Overall hydrogen production efficiencies for HTE coupled to a direct helium recuperated Brayton cycle, no sweep gas; (a) plotted against current density, (b) plotted against per-cell operating voltage.
hydrogen efficiency values for the no-sweep cases show very similar trends to the air-sweep cases, but are generally 1.0 – 1.5 percentage points higher than the corresponding air-sweep cases. Some of the low-current-density results show overall hydrogen production efficiencies greater than 50%.
4.2. HTE Plant with Supercritical CO2 Recompression Cycle Results of system simulations for the HTE plant coupled to a supercritical CO2-cooled reactor / direct recompression cycle are presented in Figure 13 for adiabatic electrolyzer operation with two ASR values for both air-sweep and no-sweep cases. Isothermal electrolyzer operation was also not considered for this case since there would be no high-temperature process heat available to maintain isothermal electrolyzer conditions below the thermal neutral voltage. Recall that the reactor outlet temperature for this case is only 650°C, well below the 800°C electrolyzer operating temperature. Figure 13 (a) shows the overall hydrogen production efficiencies plotted against current density (proportional to hydrogen production rate). Figure 13 (b) shows the overall hydrogen production efficiencies plotted against per-cell operating voltage. The predicted power cycle thermal efficiency for this concept worked out to be 49.4%, which is consistent with values reported in the literature [4, 5] for this reactor/power cycle concept. Overall hydrogen-production efficiencies were about 7.2% lower than the corresponding power-cycle efficiencies with air sweep and about 5.5% lower than the corresponding power cycle efficiencies for the no - sweep case. Predicted overall hydrogen production efficiencies decrease slightly with increasing current density. When plotted as a function of operating voltage, overall production efficiencies collapsed onto single curves, as shown in Figure 13 (b). The rate of decrease in overall efficiency is steeper for operating voltages above the thermal neutral voltage. For these operating voltages, the electrolyzer outlet temperature exceeds the inlet temperature and full recuperation of this excess heat is not feasible with the constraints used for the heat exchangers in this analysis.

17
0.415
0.42
0.425
0.43
0.435
0.44
0.445
0 0.1 0.2 0.3 0.4 0.5 0.6 0.7 0.8 0.9 1
current density, A/cm^2
over
all h
ydro
gen
prod
uctio
n ef
ficie
ncy
air sw p, ASR 0.25
air sw p, ASR 1.25
no sw p, ASR 0.25
no sw p, ASR 1.25
0.415
0.42
0.425
0.43
0.435
0.44
0.445
1.18 1.2 1.22 1.24 1.26 1.28 1.3 1.32 1.34
per-cell operating voltage, V
over
all h
ydro
gen
prod
uctio
n ef
ficie
ncy
adiabatic, air sw p, ASR 0.25
adiabatic, air sw p, ASR 1.25
adiabatic, no sw p, ASR 0.25
adiabatic, no sw p, ASR 1.25
(a) (b) Figure 13. Overall hydrogen production efficiencies for HTE coupled to a supercritical CO2 recompression cycle; (a) plotted against current density, (b) plotted against per-cell operating voltage.
4.3. HTE Plant with Sodium-cooled fast reactor / Rankine cycle
Results of system simulations for the HTE plant coupled to a sodium-cooled fast reactor / Rankine cycle are presented in Figure 14 for two ASR values and for adiabatic electrolyzer operation. Isothermal electrolyzer operation was also considered for this case with auxiliary heat addition supplied from a combustion source such as waste refinery gases. Those results will be discussed in Section 5. Recall that the reactor outlet temperature for this case is only 550°C, well below the 800°C electrolyzer operating temperature. Figure 14 (a) shows the overall hydrogen production efficiencies plotted against current density (proportional to hydrogen production rate). Figure 14 (b) shows the overall hydrogen production efficiencies plotted against per-cell operating voltage. Power cycle efficiencies, also shown in the figure, for this concept increased slightly with electrolyzer current density, ranging from 37.7% at the lowest current density (0.0625 A/cm2) to 38.2% at 1.0 A/cm2. Overall hydrogen production efficiencies were about 5.2% lower than the corresponding power cycle efficiencies with air sweep and about 3.9% lower than the corresponding power cycle efficiencies with no electrolyzer sweep gas.Overall production efficiencies were not strongly dependent on current density or operating voltage for these cases.
18
0.32
0.33
0.34
0.35
0.36
0.37
0.38
0.39
0 0.2 0.4 0.6 0.8 1
current density, A/cm^2
over
all h
ydro
gen
prod
uctio
n ef
ficie
ncy
adiabatic, air sw p, ASR 0.25
adiabatic, air sw p, ASR 0.25
adiabatic, no sw p, ASR 0.25
adiabatic, no sw p, ASR 1.25
Pow er cycle eff iciency
0.322
0.324
0.326
0.328
0.33
0.332
0.334
0.336
0.338
0.34
0.342
1.18 1.2 1.22 1.24 1.26 1.28 1.3 1.32 1.34
per-cell operating voltage
over
all h
ydro
gen
prod
uctio
n ef
ficie
ncy
adiabatic air sw p, ASR 0.25
adiabatic air sw p, ASR 1.25
adiabatic no sw p, ASR 0.25
adiabatic no sw p, ASR 1.25
(a) (b) Figure 14. Overall hydrogen production efficiencies for HTE coupled to a sodium-cooled fast reactor / Rankine cycle; (a) plotted against current density, (b) plotted against per-cell operating voltage.
5. USE OF WASTE REFINERY GASES AS A SUPPLEMENTAL HEAT SOURCE
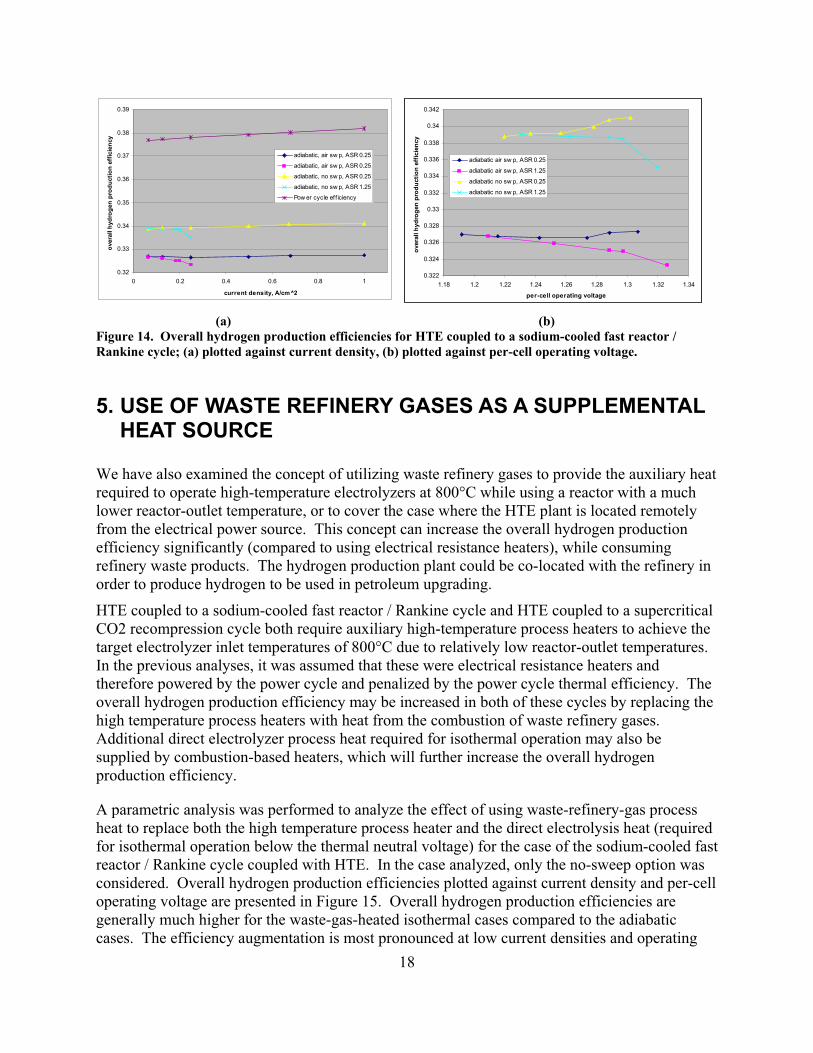
We have also examined the concept of utilizing waste refinery gases to provide the auxiliary heat required to operate high-temperature electrolyzers at 800°C while using a reactor with a much lower reactor-outlet temperature, or to cover the case where the HTE plant is located remotely from the electrical power source. This concept can increase the overall hydrogen production efficiency significantly (compared to using electrical resistance heaters), while consuming refinery waste products. The hydrogen production plant could be co-located with the refinery in order to produce hydrogen to be used in petroleum upgrading.
HTE coupled to a sodium-cooled fast reactor / Rankine cycle and HTE coupled to a supercritical CO2 recompression cycle both require auxiliary high-temperature process heaters to achieve the target electrolyzer inlet temperatures of 800°C due to relatively low reactor-outlet temperatures.In the previous analyses, it was assumed that these were electrical resistance heaters and therefore powered by the power cycle and penalized by the power cycle thermal efficiency. The overall hydrogen production efficiency may be increased in both of these cycles by replacing the high temperature process heaters with heat from the combustion of waste refinery gases. Additional direct electrolyzer process heat required for isothermal operation may also be supplied by combustion-based heaters, which will further increase the overall hydrogen production efficiency.
A parametric analysis was performed to analyze the effect of using waste-refinery-gas process heat to replace both the high temperature process heater and the direct electrolysis heat (required for isothermal operation below the thermal neutral voltage) for the case of the sodium-cooled fast reactor / Rankine cycle coupled with HTE. In the case analyzed, only the no-sweep option was considered. Overall hydrogen production efficiencies plotted against current density and per-cell operating voltage are presented in Figure 15. Overall hydrogen production efficiencies are generally much higher for the waste-gas-heated isothermal cases compared to the adiabatic cases. The efficiency augmentation is most pronounced at low current densities and operating

19
0.33
0.34
0.35
0.36
0.37
0.38
0 0.2 0.4 0.6 0.8 1
current density, A/cm^2
over
all H
2 pr
oduc
tion
effic
ienc
y isothermal, ASR 0.25isothermal, ASR 1.25adiabatic, ASR 0.25adiabatic, ASR 0.25
0.33
0.34
0.35
0.36
0.37
0.38
1 1.1 1.2 1.3 1.4per-cell operating volatage, V
over
all H
2 pr
oduc
tion
effic
ienc
y
isothermal, ASR 0.25isothermal, ASR 1.25adiabatic, ASR 0.25adiabatic, ASR 1.25
(a) (b) Figure 15. Overall hydrogen production efficiencies for HTE with no sweep and using process heat, coupled to a sodium-cooled fast reactor / Rankine cycle; (a) plotted against current density, (b) plotted against per-cell operating voltage
voltages, where an augmentation of 3 – 4% is achieved. At the thermal neutral voltage, the efficiencies for the isothermal waste-gas heated cases are only slightly higher than the corresponding adiabatic cases because at this operating point, no direct heating of the electrolyzer is required to maintain isothermal operation. The waste-gas heating for the thermal neutral cases is only required to boost the electrolyzer-inlet process gas stream up to 800°C, and this heat requirement is relatively small.
For this analysis, the waste refinery gases were assumed to have the properties of methane. To determine the optimal air-flow to fuel-flow ratio, a parametric analysis of the air/methane combustion process was performed by allowing the air flow rate and the combustion temperature to vary for a constant methane flow rate of 1 kgmole/hr. Figure 16 presents the results of this
-160
-140
-120
-100
-80
-60
-40
-20
0
20
40
0 2 4 6 8 10 12 14 16
Air Molar Flow Rate (kgmole/hr)
Hea
t (kW
)
850 C900 C950 C1000 C1050 C
Figure 16. Process heat produced as a function of air molar flow rate for 1 kgmole/hr flow of waste refinery gas at various combustion temperatures.
20
-
0.10
0.20
0.30
0.40
0.50
0.60
0.70
0.80
0 0.2 0.4 0.6 0.8
current density, A/cm^2
fuel
to H
2 m
ass
flow
ratio
isothermal, ASR 0.25
isothermal, ASR 1.25
Figure 17. Waste refinery gas fuel to hydrogen product mass flow rate ratio as a function of current density.
analysis. As the combustion temperature increases, more process heat is available. For all combustion temperatures, an air flow rate of 9.54 kgmole/hr provides the most process heat. This corresponds to an air-to-fuel ratio of 17.2, on a mass basis. Assuming the combustion temperature is 900°C, Figure 17 presents a plot of required waste-refinery-gas fuel-to-hydrogen product mass flow ratio as a function of electrolyzer current density. The plot indicates that, for lower current densities, more fuel would be needed per kilogram of hydrogen produced because more process heat would be required. Thermal neutral points are located at the lowest waste-gas fuel-to-hydrogen production ratio. At lower ASR values, more fuel would also be needed.
6. DEMONSTRATION NEEDS FOR COMMERCIAL APPLICATIONS
In order to address the fundamental and engineering challenges associated with High-Temperature Electrolysis (HTE) for hydrogen production, testing must be performed at various scales. The research plan for HTE as spelled out in the NHI 10-year plan [6] adopts this philosophy. Small-scale tests are useful for identifying the most promising materials, cell geometries, and basic stack configurations. Large-scale tests address issues of gas manifolding, gas heating, heat recuperation, power conditioning, and product purification. The HTE program plan at INL is following a logical progression of research and testing objectives, proceeding from small-scale bench testing to a large-scale demonstration. Test objectives for various scales of SOEC facilities are listed in Table 1, originally presented in reference [7]. The analyses presented in this report were designed to predict the performance of integrated commercial-scale systems. But several intermediate scales of testing must be accomplished before proceeding to actual commercial scale facility construction. In particular, the engineering demonstration scale at 5 MW would have to be completed prior to commercial-scale construction. A 5 MWth HTE

21
plant with a 50% thermal-to-hydrogen efficiency would be capable of producing 75 kg/hr of hydrogen.
There are several commercial applications that are now being developed which will require bulk hydrogen to demonstration their technical feasibility. These facilities are generally processes for the upgrading of heavy petroleum or for the production of synthetic natural gas or synthetic liquid fuels from coal.
The DOE Office of Fossil Energy is funding a demonstration plant in conjunction with Arizona Public Service in the 2009-2010 timeframe for the production of synthetic natural gas from coal at the APS facilities 50 miles west of Phoenix [8]. This demonstration would require 1500 kg of H2 per day to produce 400,000 std cu ft of synthetic natural gas (methane) per day. That level of hydrogen production would require 0.7% of the output of a 600-MWth NGNP.
The largest single-unit conventional electrolyzer manufactured by Norsk Hydro has an output of 1040 kg H2 per day. By comparison, the HTE Integrated Laboratory Scale experiment is designed to produce 10.7 kg H2 per day when operating with three modules, each module containing 240 10x10-cm cells. The HTE Pilot-Scale experiment, currently planned for a 200
Table 1. Test objectives for various scales of high-temperature electrolysis facilities.Stack Facility Button
(1.5 W) Bench
(0.1-3 kW) Integrated Lab
(15 kW) Pilot
(200 kW) Engineering Demonstration
(1-5 MW)
Electrode / Electrolyte Materials x
Electrolyte performance x x Basic cell design x x Stack performance x x Stack seals x x Stack conductive interface layer materials x x
Manifolding x x x Electrical configuration x x Instrumentation Development x x x x x
High-temperature oxygen handling x x
High-temperature hydrogen handling x x
Stack lifetime x x x Hydrogen purification x x System startup and control x x x System maintenance x x High-pressure operation x x Hydrogen storage x Demonstration of large-scale hydrogen production x

22
kWe input, would produce about 143 kg H2 per day.
DOE-FE has also operated several pilot plants for the production of liquid fuels through the solvent refining of coal. These plants have each consumed about 50 tons per day of coal and required the input of about 1100 kg H2 per day for the production of 5,000 gallons per day of liquid products and 30 tons per day of solid product, from which most of the sulfur and ash has been removed. Demonstration plants for the solvent refining process foresaw the use of about 5000 tons per day of coal and would require about 110 tons H2/day [9]. That quantity would require about 55% of the output of an NGNP reactor.
Demonstration plants for more recent designs for coal and biomass-to-liquids plants [10] foresee the use of 4500 tons of coal and 500 dry tons of biomass to produce 7500 barrels per day of finished product in the diesel/jet fuel boiling range and 3500 Bbl/day of paraffinic naphtha.Depending on the degree of CO2 emissions reduction, such a plant would require 40 to 76 tons per day of hydrogen.
7. CONCLUSIONS
This report presents results of system analyses that have been developed to assess the hydrogen-production performance of commercial-scale high-temperature electrolysis (HTE) plants driven by three different advanced reactor – power-cycle combinations: a high-temperature helium-cooled reactor coupled to a direct Brayton power cycle, a supercritical CO2-cooled reactor coupled to a direct recompression cycle, and a sodium-cooled fast reactor coupled to a tertiary steam Rankine cycle. The two gas-cooled reactor concepts are candidate high-temperature reactors under consideration for future development under the DOE Next-Generation Nuclear Plant (NGNP) program. The sodium-cooled fast reactor is under consideration for future development under the DOE Global Nuclear Energy Program (GNEP). Reactor outlet temperatures assumed in the analyses are 900°C, 650°C and 550°C, for the helium-cooled, supercritical CO2-cooled, and sodium-cooled reactors, respectively. The system analyses were performed using UniSim software. The work described in this report represents a refinement of previous analyses in that the process flow diagrams include realistic representations of the three advanced reactors directly coupled to the power cycles and integrated with the high-temperature electrolysis process loops. In addition, this report includes parametric studies in which the performance of each HTE concept is determined over a wide range of operating conditions.
High-temperature electrolysis overall plant simulations were performed over a range of electrolyzer current densities and corresponding hydrogen production rates. Two temperature-dependent electrolysis cell area-specific resistance values were assumed: 0.25 and 1.25 Ohm·cm2
at 1100 K. The ASR1100K value of 1.25 represents a stack-average ASR value at 1100 K that should be achievable in the short term with existing technology. The ASR1100K value of 0.25 is an optimistic value that has been observed in button cells, but will be difficult to achieve in a stack in the short term. The simulations were also performed for both adiabatic and isothermal electrolyzer operation. These two conditions represent extremes in terms of thermal boundary condition. On the oxygen side of the electrolyzer, both air-sweep and no-sweep cases were considered.

23
Simulations for the HTE plant coupled to the helium recuperated Brayton cycle indicated a power-cycle thermal efficiency of 52.6% and overall hydrogen production efficiencies in the 45 - 50% range. The adiabatic cases showed a nonlinear decrease in overall efficiency with increasing current density, as a result of the temperature-dependent ASR used in the simulation.For isothermal cases, the ASR is constant and the overall efficiencies decreased linearly with current density. Highest overall efficiencies occurred for low-current-density isothermal cases for which the highest fraction of total electrolyzer energy was added as heat rather than as electricity. Overall process efficiencies collapse onto a single line when plotted as a function of per-cell operating voltage, regardless of the electrolyzer mode of operation (adiabatic or isothermal). The highest overall hydrogen production efficiency (for ASR = 0.25, isothermal, i = 0.0625 A/cm2, air sweep) exceeded 50%. . Predicted overall thermal-to-hydrogen efficiency values for the no-sweep cases showed very similar trends to the air-sweep cases, but were generally 1.0 – 1.5 percentage points higher than the corresponding air-sweep cases.
Results for the HTE plant coupled to a supercritical CO2 direct recompression cycle predicted a power-cycle thermal efficiency of 49.4%. Overall hydrogen production efficiencies were about 7.2% lower than the corresponding power-cycle efficiencies with air sweep and about 5.5% lower than the corresponding power cycle efficiencies for the no - sweep case.
Results of system simulations for the HTE plant coupled to a sodium-cooled fast reactor / Rankine cycle yielded power cycle efficiencies that increased slightly with electrolyzer current density, ranging from 37.7% at the lowest current density (0.0625 A/cm2) to 38.2% at 1.0 A/cm2.Overall hydrogen production efficiencies were about 5.2% lower than the corresponding power cycle efficiencies with air sweep and about 3.9% lower than the corresponding power cycle efficiencies with no electrolyzer sweep gas. Overall production efficiencies were not strongly dependent on current density or operating voltage for these cases.
This report also examined the concept of utilizing waste refinery gases to provide the auxiliary heat required to operate high-temperature electrolyzers at 800°C while using a reactor with a much lower reactor-outlet temperature. This concept increases the overall hydrogen production efficiency significantly (compared to using electrical resistance heaters), while consuming refinery waste products. The hydrogen production plant could be co-located with the refinery in order to produce hydrogen to be used in petroleum upgrading.
The final section of this report discusses demonstration needs for commercial HTE applications. Our program development plan for HTE, as defined in the NHI ten-year plan, if fully implemented, should provide appropriately scaled technology demonstrations for ultimate commercial-scale development.

24
8. REFERENCES
1. Herranz, L. E., Linares, J. I., and Moratilla, B. Y., “Assessment of regenerative reheating in direct Brayton power cycles for high-temperature gas-cooled reactors,” Nuclear Technology, v 159, n 1, July, 2007, pp. 15-24.
2. O’Brien, J. E., Stoots, C. M., and Hawkes, G. L., “Comparison of a One-Dimensional Model of a High-Temperature Solid-Oxide Electrolysis Stack with CFD and Experimental Results,” Proceedings, 2005 ASME International Mechanical Engineering Congress and Exposition, Nov. 5 – 11, Orlando.
3. Harvego, E. A., McKellar, M. G., O’Brien, J. E., and Herring, J. S., “Summary of Reactor-Coupled HTE Modeling Sensitivity Studies,” DOE Milestone Report, October 26, 2006.
4. Dostal, V., Driscoll, M. J., Hejzlar, P., “A Supercritical Carbon Dioxide Cycle for Next Generation Nuclear Reactors”, MIT-ANP-TR-100, MIT, Department of Nuclear Engineering, 2004.
5. Dostal, V., Hejzlar, P., Driscoll, M. J., “High-performance supercritical carbon dioxide cycle for next-generation nuclear reactors,” Nuclear Technology, v 154, n 3, June, 2006, pp. 265-282.
6. Office of Advanced Nuclear Research, DOE Office of Nuclear Energy, Science and Technology, “Nuclear Hydrogen Initiative Ten Year Program Plan,” March 2005.
7. J. E. O’Brien, C. M. Stoots, and J. S. Herring, “High Temperature Electrolysis Scaling Demonstration Experiments,” July 30, 2004.
8. Anderson, M. R., E-mail reporting on visit to Arizona Public Service, 08/29/2007.
9. Probstein, R. F. and R. Edwin Hicks, Synthetic Fuels, Dover Publications, Inc., Mineola, NY, p. 296, 1982 and 2006.
10. NETL, “Increasing Security and Reducing Carbon Emissions of the U. S. Transportation Sector: A Transformational Role for Coal with Biomass,” DOE/NETL-2007/1298, August 24, 2007.


Related Documents


