558 The skill of ECMWF precipitation and temperature predictions in the Danube basin as forcings of hydrological models Florian Pappenberger and Roberto Buizza Research Department December 2008 Submitted to Weather and Forecasting

Welcome message from author
This document is posted to help you gain knowledge. Please leave a comment to let me know what you think about it! Share it to your friends and learn new things together.
Transcript
558
The skill of ECMWF precipitation
and temperature predictions in the Danube basin as forcings of
hydrological models
Florian Pappenberger and Roberto Buizza
Research Department
December 2008
Submitted to Weather and Forecasting

Series: ECMWF Technical Memoranda A full list of ECMWF Publications can be found on our web site under: http://www.ecmwf.int/publications/ Contact: [email protected] © Copyright 2008 European Centre for Medium Range Weather Forecasts Shinfield Park, Reading, Berkshire RG2 9AX, England Literary and scientific copyrights belong to ECMWF and are reserved in all countries. This publication is not to be reprinted or translated in whole or in part without the written permission of the Director. Appropriate non-commercial use will normally be granted under the condition that reference is made to ECMWF. The information within this publication is given in good faith and considered to be true, but ECMWF accepts no liability for error, omission and for loss or damage arising from its use.

The skill of ECMWF precipitation and temperature predictions…
Technical Memorandum No.558 1
ABSTRACT
In this paper the suitability of ECMWF forecasts for hydrological applications is evaluated. This study focuses on three spatial scales: the upper Danube (which is upstream of Bratislava), the entire Danube catchment and the whole of Europe. Two variables, 2-meter temperature and total precipitation, are analyzed. The analysis shows that precipitation forecasts follow largely in pattern the observations. The timing of peaks between forecasted and observed precipitation and temperature is good although precipitation amounts are often underestimated. Catchment scale influences the skill scores significantly. Small catchments exhibit a larger variance as well as larger extremes. The analysis of the performance of ensemble forecasts show a positive trend of skill scores for the probabilistic prediction of moderate precipitation amounts can be observed towards the end of 2006, following the increase of the ensemble resolution and the implementation of a new convection scheme. A water balance analysis suggests a 10% underestimation by the ensemble mean and an overestimation by the high resolution forecast over the last years. Precipitation and Temperature predictions are skillful up to day 5-7. Forecasts accumulated over a longer time are largely more skillful than forecasts accumulated over short time periods.
1. Introduction Increasingly, meteorological and hydrological ensemble forecasts have been used by decision-makers to judge whether or not to take an action to protect against a possible loss. These ensemble forecasts allow users to estimate the probability distribution function of forecasts states, or, in other words, to compute the probability of occurrence of events. The increase use of these new, mainly probabilistic, forecasts, have increased the demand for information on their quality. Assessing the quality of ensemble forecasts is rather complex and involves the use of assessment metrics that are different from the ones normally used to assess single forecasts. The reader is referred to, e.g., Wilks (1995), for a comprehensive discussion of the issue of the evaluation of the accuracy of probabilistic forecasts.
Ensemble forecasts have been used in hydrological applications within the PREVIEW project (Prevention, Information and Early Warning, http://www.preview-risk.com, EC FP7). Within this project, Buizza et al (2007) have discussed issues linked to the validation of the overall forecast value of probabilistic meteorological and hydrological forecasts, and have introduced a general framework that can be used to assess both their technical and functional qualities. Pappenberger et al. (2007a) have made some specific recommendations on verification methods that are more relevant for hydrological applications, so that the information can be easily interpreted by hydrologists who use meteorological data to drive hydrological models.
This paper applies some of the ideas of Pappenberger et al (2007a) to ECMWF ensemble forecasts of meteorological variables relevant for hydrological applications for the river Danube. Forecasts for two variables, 2-meter temperature and total precipitation, are verified on three spatial scales: the upper Danube (which is upstream of Bratislava), the entire Danube catchment and the whole of Europe. The seasonality of the forecast performance is also discussed. In the first part of this paper, the characteristics of the Danube catchment are described, and the skill scores and performance measures used are introduced. This is followed first by an analysis first of a 3 month period, and then of a longer, 5.5 year period. Finally, the average model performance over lead time will be discussed, and some conclusions will be drawn.

The skill of ECMWF precipitation and temperature predictions…
2 Technical Memorandum No.558
1.1. Catchment description
In this study we focus on three spatial scales (figure1, table1): the upper Danube (which is upstream of Bratislava), the entire Danube catchment and the whole of Europe. The Danube catchment was selected because it is part of the PREVIEW project (http://www.preview-risk.com) which investigates the performance of flood forecasting using the July & August 2002 floods in the Danube catchment as an example. This reflects the need to perform catchment-based evaluation for hydrologists, and to encompass an area with enough observations to perform a robust analysis. In table 1 the area, number of ECMWF Ensemble Prediction System (EPS) grid points and the number of observations in each catchment is listed. The table shows that even the Danube, which is the largest European catchments, is still small compared to the continental scale on which meteorological verification is performed traditionally.
Figure 1: Outline of study region. The extent of the European window, the Danube catchment and the upper Danube is shown.
Table 1: Description of the catchment/area characteristics used in this study
Catchment / Area Number of Obs. Stations
Number of EPS Grid Points
Area (103km2)
Upper Danube 33 56 132 Danube 123 338 817 Europe (Lat: 35°-70°, Long: -15°-35°) 541 5554 10.180
2. Description of skill measures and variables Two variables (2m Temperature and Precipitation) will be analysed in this study. The evaluation of the forecasts will be performed with three methods: eye-ball verification, the Nash-Sutcliffe measure and the Brier Skill Score. Moreover, the water balance of water years will be computed as it is of hydrological interest.
The skill of ECMWF precipitation and temperature predictions…
Technical Memorandum No.558 3
Eye-ball verification is often used as a standard verification tool for meteorological forecasts (Mariani et al., 2005) and tests for consistency between numerical value and forecasters’ experience and opinion. Cloke and Pappenberger (2007) have used this method to gain additional understanding in the behaviour of more traditional skill measures. In this paper, it will be used to evaluate time series of precipitation and temperature (for example by analysing peak behaviour) and support the findings of all other scores.
The Nash-Sutcliffe (Nash and Sutcliffe, 1970) is traditionally used in many hydrological applications (for a discussion see Pappenberger and Beven, 2004; Schaefli and Gupta, 2007). Nash Sutcliffe can be seen as a deterministic, threshold free and continuous form of the Brier Skill Score. A perfect forecast would have a Nash-Sutcliffe of 1. A value of 0 equals to a prediction consisting of the mean of the observations. A Nash Sutcliffe of below 0.6 is commonly used to classify predictions as non skillful (Freer et al., 2004).
( )
( )
2
12
1
1
Tt t
O MtT
t tO O
t
P PL
P P
=
=
−= −
−
∑
∑ (1)
L: Nash-Sutcliffe
O: observed
M: modelled
Pt: Precipitation at time or location t
The Nash-Sutcliffe will be used to compare accumulation periods of precipitation over 24hrs as well as over the entire lead time throughout the document.
The Brier Skill Score (Wilks, 1995) is traditionally applied to measure the skill of probabilistic meteorological forecasts and requires the specification of thresholds. It can be applied to probabilistic forecasts.
( )
( )
2
1
2
1
1
T
t ttT
t tt
p oBSS
o o
=
=
−= −
−
∑
∑ (2)
p: probability of occurrence of precipitation above/below a threshold at time/location t
o: observation of occurrence of precipitation above/below a threshold at time/location t
In this paper, all Brier Skill Scores will be computed on precipitation accumulated over 24 hrs. We have refrained from calculating scores which use precipitations accumulated over entire lead times as this would require an assumption about the threshold distribution. For example, one could assume a threshold of 5mm for the first 24hrs, of 10mm for a lead time of 48hrs and of 15mm for a lead time of 72hrs. However, this cannot be justified by the non-linear nature of the score.
Brier Skill Score and Nash Sutcliffe Efficiency show similar trends and allow for identical interpretations. Therefore, results are displayed with only one of the two scores to keep this document to a reasonable length, although, all analysis includes both scores.

The skill of ECMWF precipitation and temperature predictions…
4 Technical Memorandum No.558
Closing the water balance is an important aspect in hydrological modelling and an essential hydrological property (Beven, 2006). Therefore, it is of interest for hydrological applications to evaluate the bias of the ECMWF forecasts in predicting the water balance. The bias is computed by accumulating precipitation amounts of a given lead time over a water year (October to September) and dividing it by the observed amounts. A value of 1 indicates that the forecast predicted the same amount of water as the observations. A value below 1 indicates that the forecast predicts less water than actually falls and a value above one vice versa. The observations of each water year are compared to a long term average of observations in a similar fashion to indicate whether it was a dry (fraction is below 1) or wet year (fraction is above 1)
3. ECMWF model description The past two decades have seen an expanding use of ensemble systems in numerical weather prediction. These systems provide forecastes an estimate of the probability distribution of forecast states, which can be used not only to identify the most likely outcome, as was done in the past using single, high-resolution forecasts, but also to assess the probability of occurrence of weather event of interest (see, e.g., Buizza 2008). More recently, hydrological ensemble prediction models have been developed either to use directly global meteorological ensemble forecasts as input, or to use dynamically-downscaled meteorological ensemble forecasts (Thielen et al 2008).
The European Centre for Medium-Range Weather Forecasts (ECMWF) has been one of the first two centres, together with the National Centre for Environmental Prediction of Washington, to include an ensemble prediction system as part of its operational suite in 1992. The rainfall and temperature forecasts used in this study are based on the latest version of the ECMWF ensemble forecasts (known as the Ensemble Prediction System or EPS). These provide 51 realisations for a 15 day lead time (in this paper we use only 10 as the results are shown over a longer time period). The ECMWF EPS simulates the effect of uncertainties in the initial conditions by starting the 50 perturbed forecasts from initial conditions generated by adding to the control (unperturbed) analysis perturbations generated using singular vectors, and it simulates the effect of model uncertainties using a stochastic physics scheme. A detailed description of the ECMWF Numerical Weather Prediction model can be found in a number of references (e.g. Buizza et al 2007; Buizza et al 1999; Molteni et al., 1996). The forecasts have been run with spectrail triangular truncation T399 with linear grid (which is equivalent to approximately 50 km resolution at mid latitudes) and 40 vertical levels, ) with initial time 12UTC.
4. Results of the evaluation of ECMWF forecasts for hydrological applications
The evaluation of the results will be split into three parts. In the first part the predicted and observed values for a time period of three month in 2002 will be analysed. This is followed by an investigation of the performance of ECMWF forecasts over a longer time (for the period between January 2002 and June 2007). Finally, in the third part, the evaluation will focus on different lead times. We will compare the 3 spatial scales in the first half of this research paper and concentrate only on the Danube in the latter as this reflects the general trends.
The skill of ECMWF precipitation and temperature predictions…
Technical Memorandum No.558 5
4.1. Model performance over 3 months (April to June 2002)
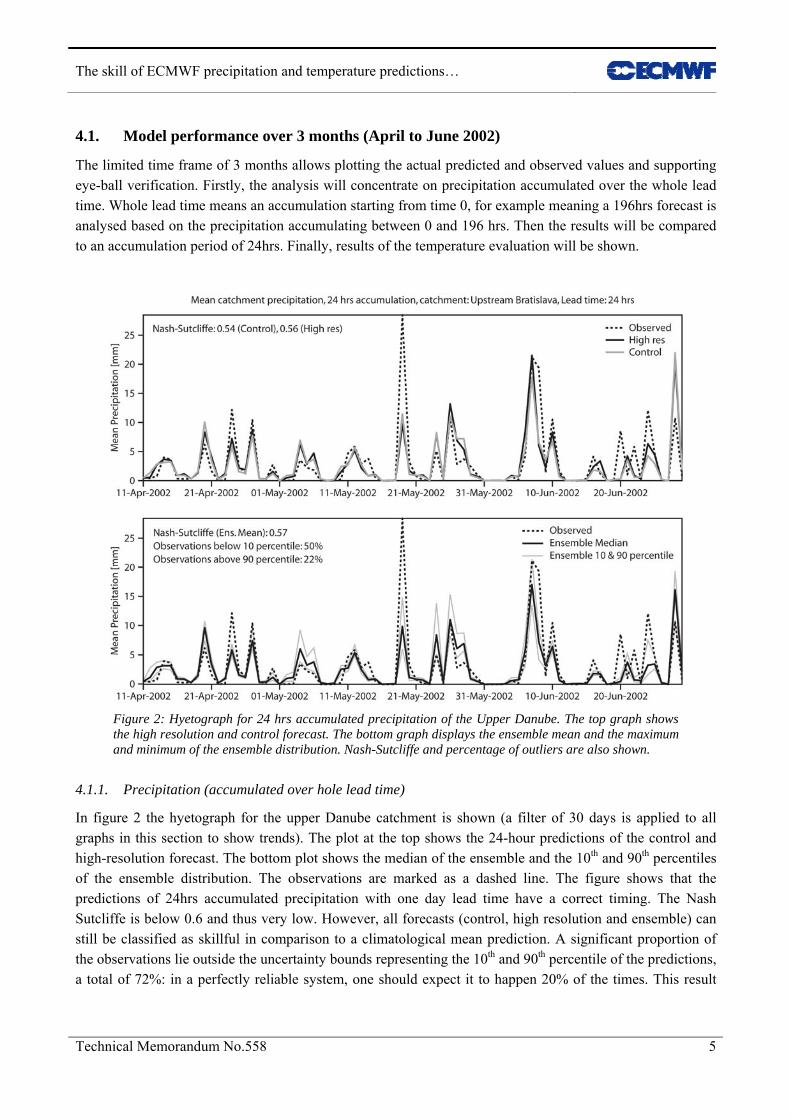
The limited time frame of 3 months allows plotting the actual predicted and observed values and supporting eye-ball verification. Firstly, the analysis will concentrate on precipitation accumulated over the whole lead time. Whole lead time means an accumulation starting from time 0, for example meaning a 196hrs forecast is analysed based on the precipitation accumulating between 0 and 196 hrs. Then the results will be compared to an accumulation period of 24hrs. Finally, results of the temperature evaluation will be shown.
Figure 2: Hyetograph for 24 hrs accumulated precipitation of the Upper Danube. The top graph shows the high resolution and control forecast. The bottom graph displays the ensemble mean and the maximum and minimum of the ensemble distribution. Nash-Sutcliffe and percentage of outliers are also shown.
4.1.1. Precipitation (accumulated over hole lead time)
In figure 2 the hyetograph for the upper Danube catchment is shown (a filter of 30 days is applied to all graphs in this section to show trends). The plot at the top shows the 24-hour predictions of the control and high-resolution forecast. The bottom plot shows the median of the ensemble and the 10th and 90th percentiles of the ensemble distribution. The observations are marked as a dashed line. The figure shows that the predictions of 24hrs accumulated precipitation with one day lead time have a correct timing. The Nash Sutcliffe is below 0.6 and thus very low. However, all forecasts (control, high resolution and ensemble) can still be classified as skillful in comparison to a climatological mean prediction. A significant proportion of the observations lie outside the uncertainty bounds representing the 10th and 90th percentile of the predictions, a total of 72%: in a perfectly reliable system, one should expect it to happen 20% of the times. This result
The skill of ECMWF precipitation and temperature predictions…
6 Technical Memorandum No.558
indicates that for 24-hour precipitation over this region and during this verification period, the ensemble spread is too narrow. Furthermore, the highest peaks of precipitation are often underestimated.
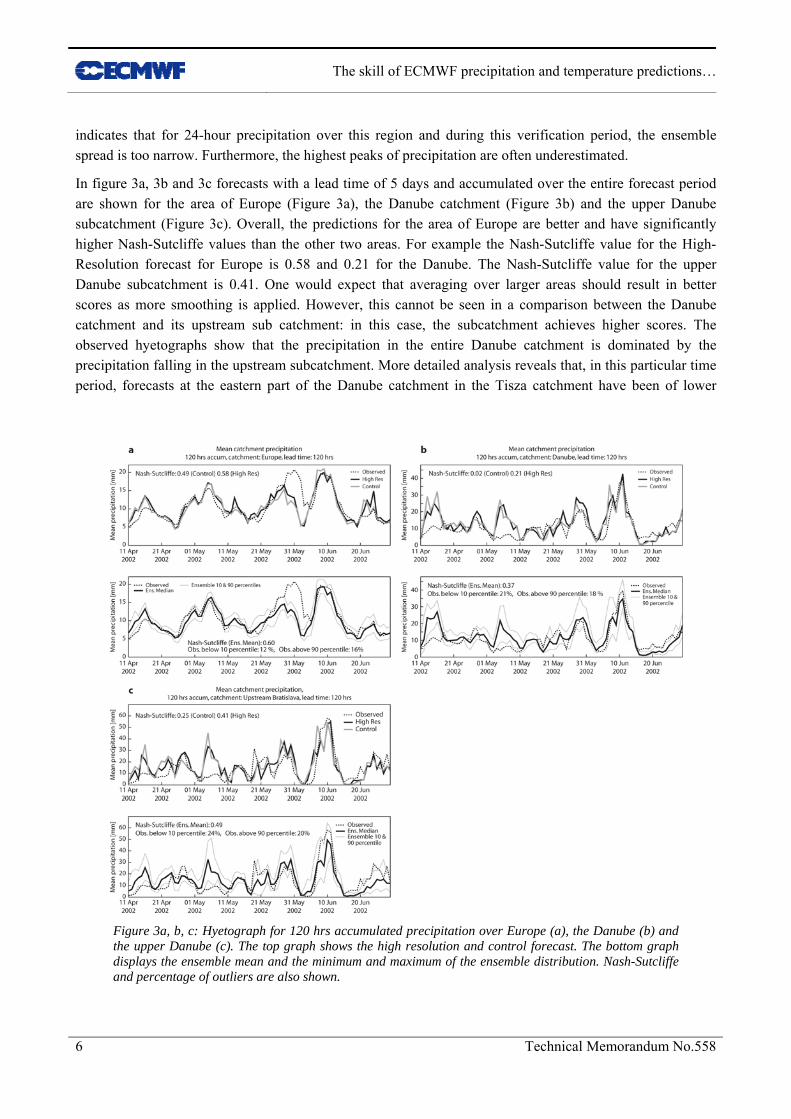
In figure 3a, 3b and 3c forecasts with a lead time of 5 days and accumulated over the entire forecast period are shown for the area of Europe (Figure 3a), the Danube catchment (Figure 3b) and the upper Danube subcatchment (Figure 3c). Overall, the predictions for the area of Europe are better and have significantly higher Nash-Sutcliffe values than the other two areas. For example the Nash-Sutcliffe value for the High-Resolution forecast for Europe is 0.58 and 0.21 for the Danube. The Nash-Sutcliffe value for the upper Danube subcatchment is 0.41. One would expect that averaging over larger areas should result in better scores as more smoothing is applied. However, this cannot be seen in a comparison between the Danube catchment and its upstream sub catchment: in this case, the subcatchment achieves higher scores. The observed hyetographs show that the precipitation in the entire Danube catchment is dominated by the precipitation falling in the upstream subcatchment. More detailed analysis reveals that, in this particular time period, forecasts at the eastern part of the Danube catchment in the Tisza catchment have been of lower
Figure 3a, b, c: Hyetograph for 120 hrs accumulated precipitation over Europe (a), the Danube (b) and the upper Danube (c). The top graph shows the high resolution and control forecast. The bottom graph displays the ensemble mean and the minimum and maximum of the ensemble distribution. Nash-Sutcliffe and percentage of outliers are also shown.

The skill of ECMWF precipitation and temperature predictions…
Technical Memorandum No.558 7
quality. The percentage of simulations above and below the 10th and 90th percentile over Europe is significant lower, only 28% for the entire of Europe compared to 39% and 44% for the Danube and its upstream catchment respectively. A smaller area will naturally exhibit a higher variance in any response variable and thus produce a larger number of outliers. Unfortunately neither the Danube catchment nor its sub-catchment upstream Bratislava exhibits much skill. Nevertheless, the timing between predicted and forecasted peaks is excellent and individual peaks are predicted very well. For example the high precipitation amounts on the 10th of June are well predicted, although the storm around the 5th of May has been missed.
4.1.2. Precipitation (accumulated over 24hrs)
Traditionally, precipitation forecasts are verified with 24 hr accumulated values. However, this is only hydrologically useful if the catchment memory is 24 hrs. In figure 4, the 24 hr accumulated precipitation for a lead time of 5 days is shown for the upstream Danube subcatchment (the other domains follow a similar pattern). This 24hr accumulated forecast shows a lower performance than figure 3c, with worse Nash-Sutcliffe values. The width of the ensemble distribution (lower plot in figure 3c) is considerably larger for the forecast accumulated over the entire lead time in comparison to the forecast accumulated only over 24hrs. There is no significant bias in peak predictions for the forecast accumulated over the longer time period. The timing of the forecasts with respect to the observations has considerably deteriorated for the 24hr accumulated precipitation.
Figure 4: Hyetograph for 24 hr accumulated precipitation at a lead time of 5 days for the upper Danube catchment. The top graph shows the high resolution and control forecast. The bottom graph displays the ensemble mean and the minimum and maximum of the ensemble distribution. Nash-Sutcliffe and percentage of outliers are also shown.
The skill of ECMWF precipitation and temperature predictions…
8 Technical Memorandum No.558
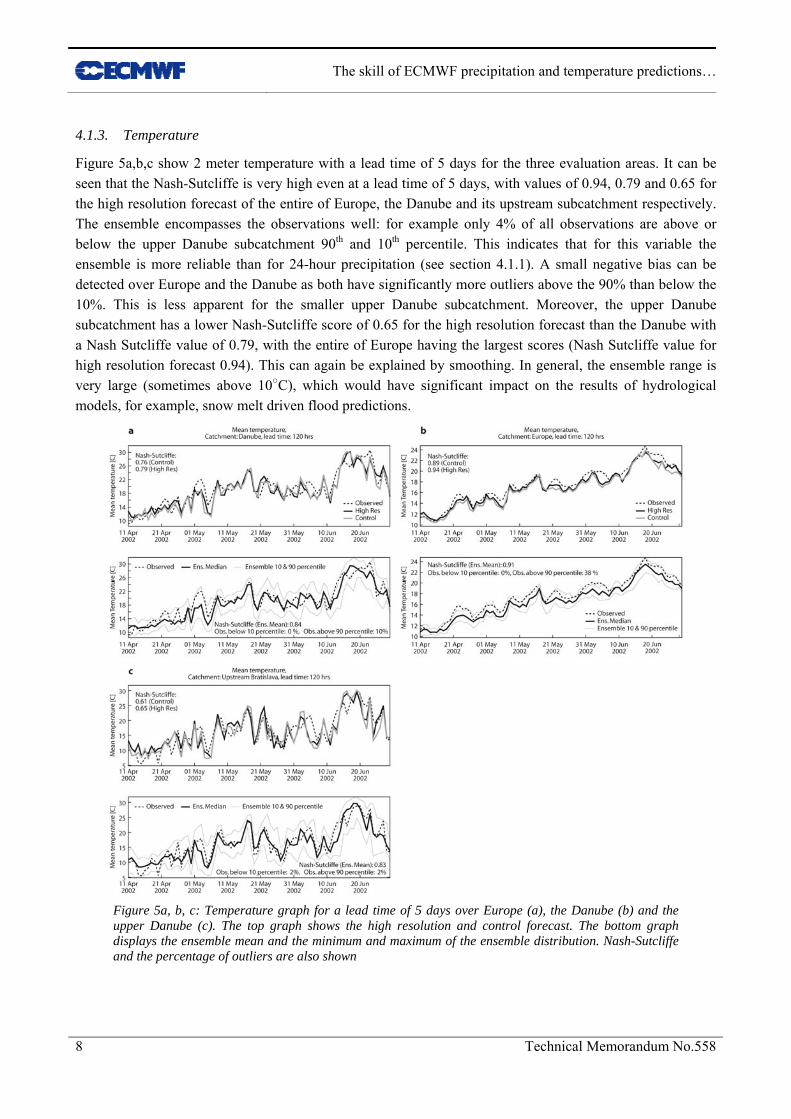
4.1.3. Temperature
Figure 5a,b,c show 2 meter temperature with a lead time of 5 days for the three evaluation areas. It can be seen that the Nash-Sutcliffe is very high even at a lead time of 5 days, with values of 0.94, 0.79 and 0.65 for the high resolution forecast of the entire of Europe, the Danube and its upstream subcatchment respectively. The ensemble encompasses the observations well: for example only 4% of all observations are above or below the upper Danube subcatchment 90th and 10th percentile. This indicates that for this variable the ensemble is more reliable than for 24-hour precipitation (see section 4.1.1). A small negative bias can be detected over Europe and the Danube as both have significantly more outliers above the 90% than below the 10%. This is less apparent for the smaller upper Danube subcatchment. Moreover, the upper Danube subcatchment has a lower Nash-Sutcliffe score of 0.65 for the high resolution forecast than the Danube with a Nash Sutcliffe value of 0.79, with the entire of Europe having the largest scores (Nash Sutcliffe value for high resolution forecast 0.94). This can again be explained by smoothing. In general, the ensemble range is very large (sometimes above 10○C), which would have significant impact on the results of hydrological models, for example, snow melt driven flood predictions.
Figure 5a, b, c: Temperature graph for a lead time of 5 days over Europe (a), the Danube (b) and the upper Danube (c). The top graph shows the high resolution and control forecast. The bottom graph displays the ensemble mean and the minimum and maximum of the ensemble distribution. Nash-Sutcliffe and the percentage of outliers are also shown
The skill of ECMWF precipitation and temperature predictions…
Technical Memorandum No.558 9
In summary, the analysis of the 3 month period shows that precipitation forecasts follow qualitatively the pattern of the observations, but underestimates its peaks. A large proportion of observations fall outside the 10th and 90th percentile given by the Ensemble prediction system. Although the timing of peaks between forecasted and observed precipitation and temperature is good, the observed values often lay outside the ensemble forecast range. Performance over Europe is in general better than the performance over smaller sub-catchments. The Nash-Sutcliffe of the high resolution forecast, the control and the median of the ensembles values for precipitation are very low even for a one day forecast. Accumulation over lead time improves the skill score in comparison to a short accumulation period such as 24hr. In contrast temperature forecast is very good even with a 5 day lead time.
4.2. Model performance over 5.5 years (January 2002 to June 2007)
In this section the trends of a 5.5 year period will be investigated with the Brier Skill Score using the Ensemble Prediction system. Conclusions can be replicated with the Nash-Sutcliffe score. The sensitivity of the forecast quality to the catchment size will be discussed in the first part of this section. This is followed by analysis of the time series of the Brier Skill Score with 4 different thresholds for the 5.5 years. Afterwards, the trend in skill for 3 different lead times over the Danube catchment will be analysed. Finally, the evaluation of the water balances concludes this section.
4.2.1. Catchment Comparison (precipitation)
Catchment scale has a significant influence on the performance values of weather forecasts. Figure 6 shows that forecasts in the Danube area and upper Danube subcatchment are on average less skillful in Winter, have a higher variance and significantly larger peaks and troughs in comparison to the continent scale. Effects as the ones observed in figure 6 are explained by the smaller climatic range over which a catchment usually spans. Additionally, the size of the catchment (and thus the size of the verification domain) plays an important role as larger catchments usually have a larger density of data and more of a smoothing effect. Moreover, the resolution of the weather forecast model is often too coarse to resolve the small catchment scale. The larger a catchment or verification area, the more climatologically regions are covered and the more data are available to build reliable averages. Kann and Haiden (2005) observed a reduction in Mean Absolute Error with increasing verification area. The total and main sensitivity of discharge predictions will depend on the spatial co-variance structure of the variables and the non-linear transformation through the hydrological model. For example, in the case of precipitation, the sensitivity of the river flow hydrograph towards the uncertainty in precipitation on catchment response decreases with catchment scale (Rodriguez-Iturbe and Mejia, 1974; Segond, 2006)
Other thresholds indicate a similar picture, although, the absolute values of the Brier Skill Score are lower. In what follows the analysis will concentrate on the entire Danube catchment and omit further comparisons with the continental or sub-catchment scale as similar conclusions can be drawn from the different scales.

The skill of ECMWF precipitation and temperature predictions…
10 Technical Memorandum No.558
Figure 6: Comparison of the verification areas of Europe and the Danube catchment and its subcatchment by a Brier Skill Score of precipitation with a threshold of >1mm/24hrs and 5 days lead time (after (Pappenberger et al., 2007b)).
Figure 7: Comparison of different precipitation thresholds with the Brier Skill Score for a lead time of 1 day between January 2002 and June 2007 in the Danube catchment.

The skill of ECMWF precipitation and temperature predictions…
Technical Memorandum No.558 11
4.2.2. Comparison of Brier Skill score for 4 thresholds (precipitation)
Figure 7 illustrates a long term picture (January 2001 to June 2007) for the Brier Skill Score of the Ensemble forecasts with four threshold for 1 day lead time and 24hrs accumulation period over the Danube catchment. The skill is computed in comparison to climatologically averages based on a 20 year period of observations (for details see Rodwell, 2005). In general, skill deteriorates with increasing thresholds, but there are notable exceptions, such as spring 2003, which can be mainly explained by event frequency (there was a very draught in the Danube basins and therefore the skill score of large thresholds have rarely been exceeded). Figure 7 shows that forecasts above 1 mm/24hrs and 5 mm/24hrs are largely skillful over the entire forecast period. Predictions above 10 mm/24hrs and 20mm/24hrs can be skillful, especially in winter. In this figure, the precipitation skill seems to have no long term (e.g. 5 yearly) trend (despite changing forecast models).
A small positive trend can be detected in winter 2006/07 for small thresholds: this improvement can be linked to the implementation of the higher-resolution T399L62 ensemble in March 2006 and of VAREPS in September 2006 (Buizza et al., 2007), and the introduction of the new model cycle 31r1 in September 2006 (Untch et al 2007), although one cannot rule out the possible influence of seasonal variations. The new model cycle 31r1 included a substantial revision of the cloud scheme (numerics, transport of momentum, treatment of ice supersaturation, see e.g. Bechtold et al 2008) and of the orographic form drag scheme. A similar trend in skill can be detected in the routine analysis of the probabilistic prediction of moderate precipitation thresholds (1, 2 or 5 mm/d), but it is worth to point out that more positive trends have been detected in routine evaluations of the ECMWF operational, high-resolution forecasts of more extreme precipitation thresholds. As Richardson et al (2008) has documented, 12-month running average equitable threat scores of operational, high-resolution forecasts over Europe verified against synop station data have been continuosly improving, especially for the prediction of 5 and 10mm/d thresholds.
The Brier Skill Score is not only influenced by the choice of threshold, but also by the length of the lead time, as is discussed in the next section.
4.2.3. Comparison of Brier Skill score for 3 lead times (precipitation)
In figure 8 the skill score of predications above 1 mm/24hrs for 3 different lead times is shown over the Danube catchment. Overall, it is not surprising that forecasts with a shorter lead time show a higher skill score than forecasts with a longer lead time. However, notable exceptions exist (for example summer 2006). This is more likely to happen for an underperforming forecast (indicated by very low skill scores), but can also be observed for forecasts with a high quality (see for example study by Grazzini, 2007; and discussion in Pappenberger et al., 2007a). This is on the one hand a property of the formulation of the Brier Skill Score and on the other hand simply due to the fact that for individual forecasts long term predictions can outperform short term predictions (especially when the forecast is accumulated over a longer time period). Figure 7 shows (as figure 6) no clear upward trend in skill score from 2001 till the end of 2007, and a small evidence of improvement after December 2007. The skill for one and five days lead time is mostly positive, although prolonged periods of negative skill can be observed. The 10 day lead time is sometimes positive in this catchment.

The skill of ECMWF precipitation and temperature predictions…
12 Technical Memorandum No.558
Figure 8: Comparison of different lead times with the Brier Skill Score for a threshold of 1mm /24 hrs between January 2002 and June 2007 over the Danube catchment.
4.2.4. Bias
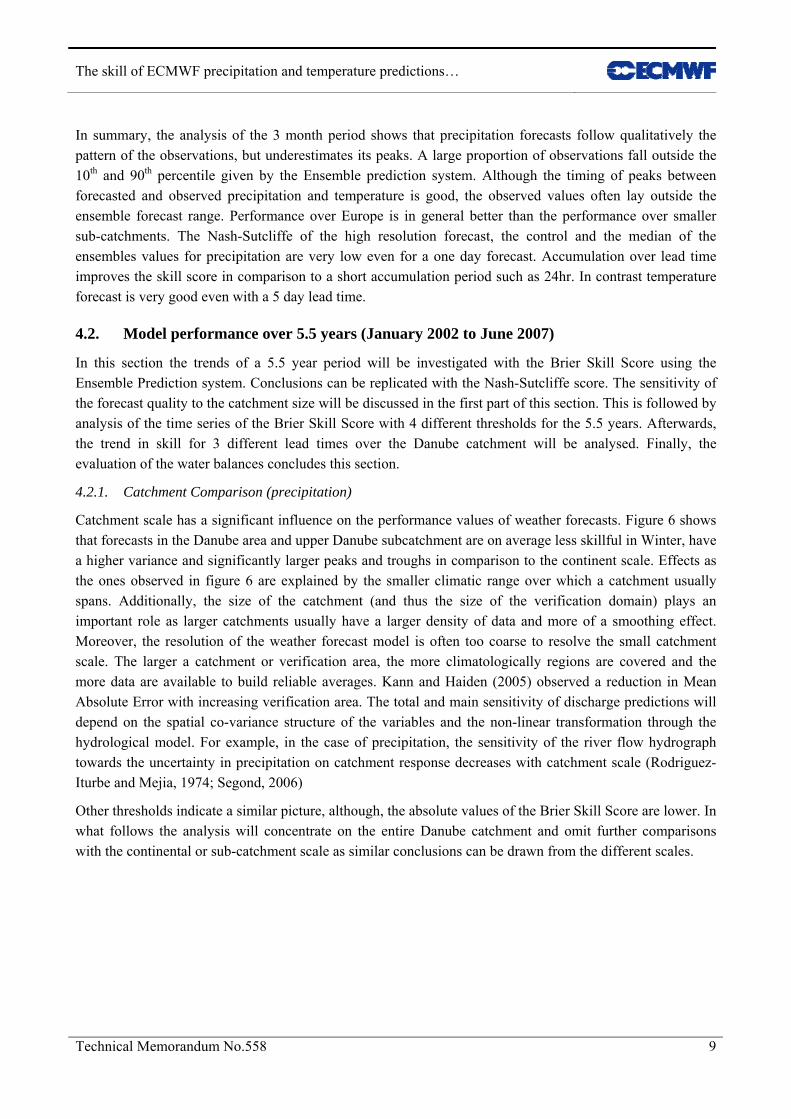
Figure 6, 7 and 8 showed time series of performances continuously from January 2002 to June 2007. However, for hydrological applications, verification of meteorological forecasts of precipitation has to be extended to the water year (staring in October and finishing in September) because it allows for an evaluation based on the annual cycle that is associated with the natural progression of the hydrologic seasons. In Figure 9 the mass balances (equivalent to a model bias) of precipitation amounts are computed for each water year computed monthly for a year-to-date. A value of 1 indicates that the forecast for this particular lead time predicted the same amount of water as the observations. A value below 1 indicates that the forecast predicts less water than actually falls and a value above one vice versa. The observations of each water year are compared to a long term average in a similar fashion to indicate whether it was a dry (fraction is below 1) or wet year (fraction is above 1).
No relationship between bias and precipitation amount could be established. In more detail, Figure 9 shows that the ensembles tend to under predict the total amount of precipitation falling in the Danube catchment. The underestimation ranges between 5%-10% for the precipitation accumulated over 10 days. On average the High resolution forecast and the ensemble mean also underestimate the precipitation amounts. However, during the last water years the high resolution forecast overestimates the water volume. The relationship between wet and dry years and the over or underestimation is weak. The last water year seem to have been particularly well predicted.
The skill of ECMWF precipitation and temperature predictions…
Technical Memorandum No.558 13
Figure 9: Bias precipitation over the entire lead time for each water year within the evaluation period
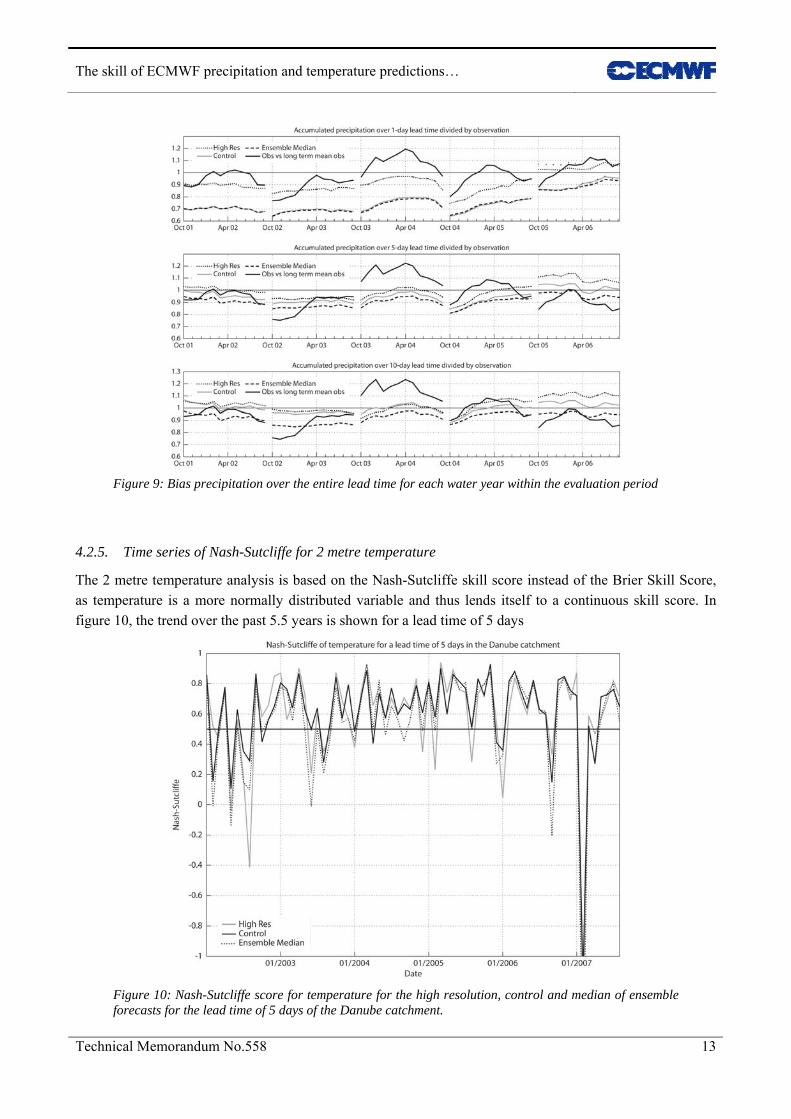
4.2.5. Time series of Nash-Sutcliffe for 2 metre temperature
The 2 metre temperature analysis is based on the Nash-Sutcliffe skill score instead of the Brier Skill Score, as temperature is a more normally distributed variable and thus lends itself to a continuous skill score. In figure 10, the trend over the past 5.5 years is shown for a lead time of 5 days
Figure 10: Nash-Sutcliffe score for temperature for the high resolution, control and median of ensemble forecasts for the lead time of 5 days of the Danube catchment.
The skill of ECMWF precipitation and temperature predictions…
14 Technical Memorandum No.558
The three different forecasts perform very similar and as for the precipitation no long term trend can be observed. The Nash-Sutcliffe is above 0.5 in a majority of cases and thus better than a climatological mean. However, a large proportion of forecasts is below the Nash-Sutcliffe value of 0.6, which means that they have to be classified as non skillful. No clear seasonal signal as in the precipitation forecasts can be observed.
4.2.6. Summary of 5.5 Year Model Performance
The analysis of ECMWF forecasts over 5.5 years has shown that catchment scale has a large influence on the variance as well as extremes on the calculations of a skill score through time. the smaller a catchment the larger is the variance. The analysis of the Brier Skill Score for 4 thresholds and 3 lead times suggests no trend in skill between 2002 and end of 2006. An improvement seems to materialize for all lead times and small thresholds from end of 2006 onwards. The water balance analysis suggest a 10% underestimation by the ensemble mean and a overestimation by the high resolution forecast over the last year. Temperature shows no trend in skill in the years between 2002 and mid of 2007.
4.3. Average model performance over lead times
The analysis of the previous section concentrated on the evolution of scores for a 24- and a 120-hour forecast lead time only. However, it is also important to see the development of scores over increasing lead times. This analysis will first be performed for 2 meter temperature. This is followed by an evaluation of 24hrs accumulated precipitation and precipitation predictions accumulated over the entire lead time. Finally, the percentage of simulations above or below the 10th and 90th percentile, the spread and mean error will be analysed in respect to increasing lead time.
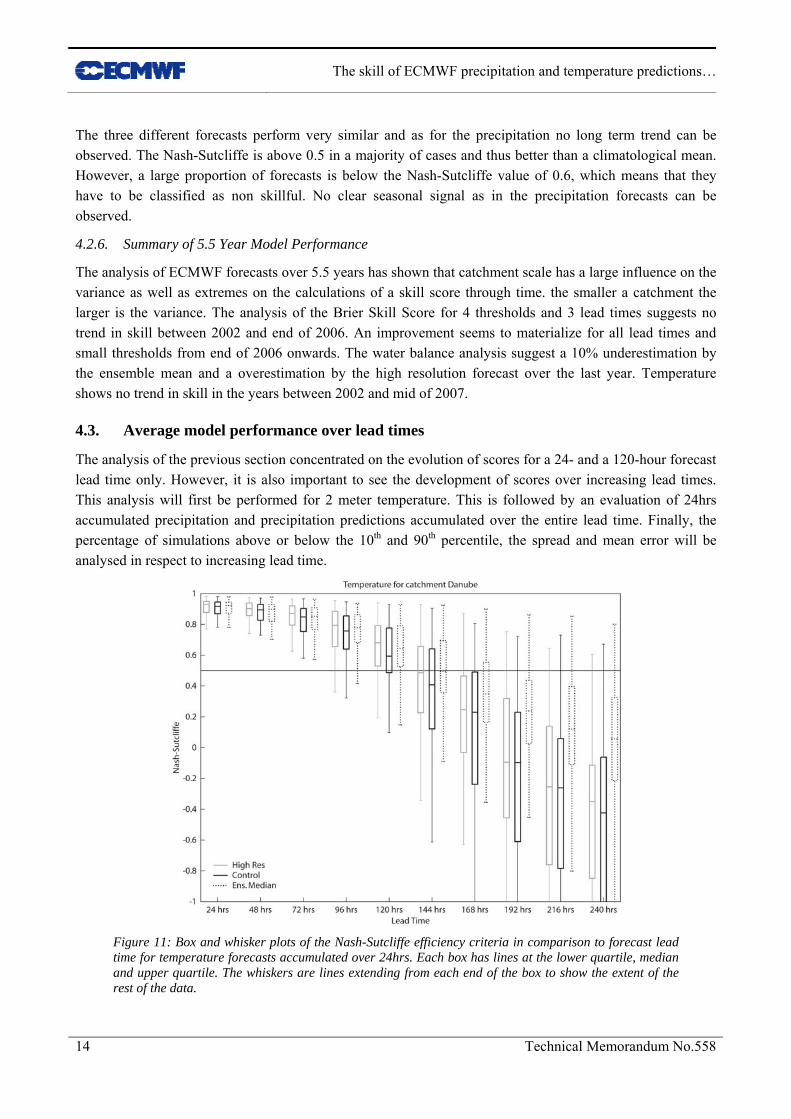
Figure 11: Box and whisker plots of the Nash-Sutcliffe efficiency criteria in comparison to forecast lead time for temperature forecasts accumulated over 24hrs. Each box has lines at the lower quartile, median and upper quartile. The whiskers are lines extending from each end of the box to show the extent of the rest of the data.

The skill of ECMWF precipitation and temperature predictions…
Technical Memorandum No.558 15
4.3.1. Temperature
In figure 11, the Nash Sutcliffe score for the Danube catchment is plotted against the lead time in the form of box and whisker plots. Each box has lines at the lower quartile, median and upper quartile. The whiskers are lines extending from each end of the box to show the extent of the rest of the data. A majority of forecasts are skillful up to day 5, with a large proportion of forecasts still achieving a Nash-Sutcliffe value above 0.5 at 6 days. The figure shows large uncertainty bounds.
4.3.2. Precipitation (accumulated over 24hr)
The Brier skill score as well as the Nash-Sutcliffe criteria will illustrate the performance of precipitation forecasts accumulated over 24hr.
Brier Skill Score
Figure 12 shows the Brier Skill Score over the Danube catchment for exceeding 1mm/24hr for the entire year and split into a summer (Jun/Jul/Aug) and winter (Nov/Dec/Jan) season. This figure deliberately focuses only on a threshold of 1 mm/ 24hr as the behaviour for higher thresholds can be seen later in the analysis of the Nash-Sutcliffe criteria. Forecasts in winter are significantly more skillful with a positive mean Brier Skill Score up to day 7. In summer, this mean positive score can only be achieved up to day 6. The performance over the entire year also allows skillful forecasts only up to day 6. The large uncertainty ranges in figure 11 indicate significant variance in the data (as seen previously already in figure 6). The uncertainty bounds show that a large proportion of forecasts is still skillful up to day 10. However, this also means that many forecasts are not skillful even when the mean Brier Skill Score for this particular lead time is positive.
Figure 12: Brier Skill Score of exceeding 1mm / 24hr for different lead time for the Danube catchment. The performance over the entire year, for the winter months (Nov/Dec/Jan) and for the summer months (Jun/Jul/Aug) is shown.

The skill of ECMWF precipitation and temperature predictions…
16 Technical Memorandum No.558
Nash-Sutcliffe
In figure 12 the Nash-Sutcliffe criteria is plotted against the lead time in the form of box and whisker plots. Precipitation accumulated over 24hrs is shown in figure 13. In figure 13 the median of the Nash-Sutcliffe criteria is above 0.5 for forecasts with up to a lead time of 72 hours. The Nash-Sutcliffe criteria indicates less days of skillful forecast than the Brier Skill Score (figure 12). This is due to the numerical formulation of the two scores. The Brier Skill Score is probabilistic and in figure 12 only a threshold of 1mm /24hr is shown (effectively a rain/non rain event). The Brier Skill Score and the Nash-Sutcliffe efficiency criteria achieve a similar skillful lead time when the Brier Skill Score is computer with a threshold of 5-10 mm / 24hr, which is a value closer to the mean precipitation of the catchment and thus similar to the Nash-Sutcliffe. Figure 13 also contains subplots, which split the year into summer (Jun/Jul/Aug) and winter (Nov/Dec/Jan). On average the winter scores are better than the summer scores (see also Brier Skill score figures above), with larger uncertainties sin the winter months, which is linked to the summer/winter precipitation variations observed in the Danube catchment.
The previous analysis only concentrates on precipitation accumulated over 24hr. In what follows the accumulation over thee entire lead time is analysed.
Figure 13: Box and whisker plots of the Nash-Sutcliffe efficiency criteria in comparison to forecast lead time for precipitation forecasts accumulated over 24hrs. Each box has lines at the lower quartile, median and upper quartile. The whiskers are lines extending from each end of the box to show the extent of the rest of the data. The top plot shows the performance over an entire year, the plot in the middle illustrates the performance over winter and the figure at the bottom shows the range of Nash-Sutcliffe values over summer.

The skill of ECMWF precipitation and temperature predictions…
Technical Memorandum No.558 17
4.3.3. Precipitation (accumulated over leads time)
Figure 14 shows the Nash-Sutcliffe for precipitation accumulated over the entire lead time and the skillful predictions stretch up day four/five. The forecasts accumulated over a longer time are largely more skillful than forecasts accumulated over short time periods (see figure 13). The usage of accumulated predictions is important as, for example, large error at the beginning of a forecast may trigger the hydrological process of saturation excess overland flow at a lead time of 120 hrs, whereas the forecast on day four alone (ignoring antecedent conditions) may lead to precipitation to infiltrate rather than flow overland. Figure 13 indicates that on average a successful forecast will be possible with a lead time of four/five days. The figures show clearly that skillful forecasts can exist for the entire forecast range.
Figure 14: Box and whisker plots of the Nash-Sutcliffe efficiency criteria in comparison to forecast lead time for precipitation forecasts accumulated over the entire lead time. Each box has lines at the lower quartile, median and upper quartile. The whiskers are lines extending from each end of the box to show the extent of the rest of the data. The top plot shows the performance over an entire year, the plot in the middle illustrates the performance over winter and the figure at the bottom shows the range of Nash-Sutcliffe values over summer.
The Nash-Sutcliffe criteria only analyses the mean or median of an ensemble distribution. However, any probabilistic forecast also includes spread and a percentage of simulations beyond for example a predicted 10th and 90th percentile.
4.3.4. Ensemble Spread and percentage of outliers
Ensemble spread and percentage of outliers are also important quantities to make a meteorological forecast useful for hydrological predictions. Percentage of outliers is classified as the proportion of observations outside the 10th and 90th percentile. Meteorological skill scores exist to evaluate this property. However, many hydrologists will be unfamiliar with those and therefore in figure 15 the spread, the percentage of outliers and the error of the mean for the ensemble precipitation forecasts in the catchment are plotted against
The skill of ECMWF precipitation and temperature predictions…
18 Technical Memorandum No.558
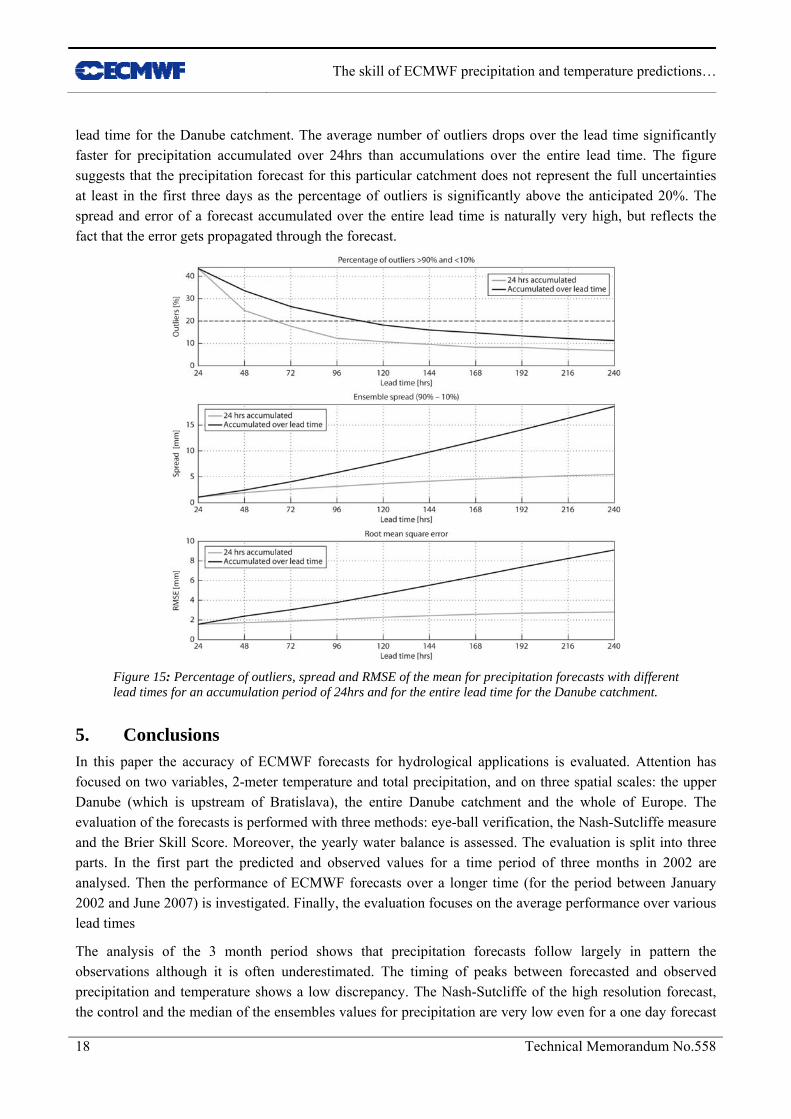
lead time for the Danube catchment. The average number of outliers drops over the lead time significantly faster for precipitation accumulated over 24hrs than accumulations over the entire lead time. The figure suggests that the precipitation forecast for this particular catchment does not represent the full uncertainties at least in the first three days as the percentage of outliers is significantly above the anticipated 20%. The spread and error of a forecast accumulated over the entire lead time is naturally very high, but reflects the fact that the error gets propagated through the forecast.
Figure 15: Percentage of outliers, spread and RMSE of the mean for precipitation forecasts with different lead times for an accumulation period of 24hrs and for the entire lead time for the Danube catchment.
5. Conclusions In this paper the accuracy of ECMWF forecasts for hydrological applications is evaluated. Attention has focused on two variables, 2-meter temperature and total precipitation, and on three spatial scales: the upper Danube (which is upstream of Bratislava), the entire Danube catchment and the whole of Europe. The evaluation of the forecasts is performed with three methods: eye-ball verification, the Nash-Sutcliffe measure and the Brier Skill Score. Moreover, the yearly water balance is assessed. The evaluation is split into three parts. In the first part the predicted and observed values for a time period of three months in 2002 are analysed. Then the performance of ECMWF forecasts over a longer time (for the period between January 2002 and June 2007) is investigated. Finally, the evaluation focuses on the average performance over various lead times
The analysis of the 3 month period shows that precipitation forecasts follow largely in pattern the observations although it is often underestimated. The timing of peaks between forecasted and observed precipitation and temperature shows a low discrepancy. The Nash-Sutcliffe of the high resolution forecast, the control and the median of the ensembles values for precipitation are very low even for a one day forecast

The skill of ECMWF precipitation and temperature predictions…
Technical Memorandum No.558 19
(the reader is reminded that scores above 0.6 are usually seen as acceptable - see discussion above) . A large proportion of observations fall outside the 10th and 90th percentile given by the Ensemble prediction system. Accumulation over lead time improves the skill score in comparison to a short accumulation period such as 24hr. Compared to total precipitation, 2-meter temperature forecast is very good even with a 5 day lead time.
The analysis of ECMWF forecasts over 5.5 years has shown that catchment scale has a large influence on the variance as well as extremes on the calculations of a skill score through time. Results indicate that the smaller a catchment the larger is the variance of the scores. Whilst operational scoring techniques of the ECMWF deterministic high-resolution forecasts display a regular improvement over recent years, the present analysis of the Brier Skill Score for 4 thresholds and 3 lead times suggests no trend in skill between 2002 and end of 2006 in the ensemble prediction system. An improvement can however be detected for all lead times and small thresholds from end of 2006 onwards, linked to the increase in resolution and to a substantial revision of the cloud scheme (Bechtold et al 2008), a result in line with routine monitoring of the ensemble forecasts of weather surface parameter (Richardson et al 2008). The water balance analysis suggest a 10% underestimation by the ensemble mean and a overestimation by the high resolution forecast over the last year. Temperature predictions are skillful up to day 6, with no trend in skill shown in the years between 2002 and mid of 2007. Precipitation predictions are skillful up to day 7 if measured with a Brier Skill Score (exceeding 1mm /24hrs). The Nash-Sutcliffe criteria indicates skillful predictions up to day four/five. Forecasts accumulated over a longer time are largely more skillful than forecasts accumulated over short time periods. The percentage of outliers for the subcatchment of the Danube is very high, which suggests that the ensemble does not encompass the full uncertainty of observed rainfall fields. It should be noted that the analysis in this paper ignores the uncertainty in the observations, which can have a significant influence on model performance and will need to be incorporated into future analysis (see Pappenberger et al., 2007a for discussion).
Acknowledgements
The work of this paper has been funded by the PREVIEW project. We thank Hannah Cloke (King’s College London), Martyn Clark (NIWA NZ), John Schaake (NOAA) for their comments which greatly improved the quality of this manuscript.
References
Bechtold, P., M. , M. Koehler, T. Jung, F. Doblas-Reyes, M. Leutbecher, M. J. Rodwell, F. Vitart and G. Balsamo, 2008: Advances in simulating atmospheric variability with the ECMWF model: from synoptic to decadal time-scales, pp. 24. ECMWF RD Technical memorandum n. 556, available from ECMWF, Shinfield Park, Reading, RG2-9AX, UK (see also www.ecmwf.int/publications/library/).
Beven, K., 2006. Searching for the Holy Grail of scientific hydrology: Q(t) = H((S)under-left-arrow, (R)under-left-arrow, Delta t)A as closure. Hydrology and Earth System Sciences, 10(5): 609-618.
Buizza, R., 2008: The Value of Probabilistic Prediction. Atmos. Sci. Lett., 9, 36-42 (DOI: 10.1002/asl.170).
Buizza, R., Miller, M., & Palmer, T. N., 1999: Stochastic representation of model uncertainties in the ECMWF Ensemble Prediction System. Q. J. R. Meteorol. Soc., 125, 2887-2908.
The skill of ECMWF precipitation and temperature predictions…
20 Technical Memorandum No.558
Buizza, R. et al., 2007. The new ECMWF VAREPS (Variable Resolution Ensemble Prediction System). Quarterly Journal of the Royal Meteorological Society, 133: 681-695.
Buizza, R., Asensio, H., Balint, G., Bartholmes, J., Bliefernicht, J., Bogner, K., Chavaux, F., de Roo, A., Donnadille, J., Ducrocq, V., Edlund, C., Kotroni, V., Krahe, P., Kunz, M., Lacire, K., Lelay, M., Marsigli, C., Milelli, M., Montani, A., Pappenberger, F., Rabufetti, D., Ramos, M.-H., Ritter, B., Schipper, J. W., Steiner, P., Thielen-Del Pozzo, J., and Vincendon, B., 2007: EURORISK/PREVIEW report on the technical quality, functional quality and forecast value of meteorological and hydrological forecasts. ECMWF Research Department Technical Memorandum n. 516, ECMWF, Shinfield Park, Reading RG2-9AX, UK.
Cloke, H.L. and Pappenberger, F., 2007. A framework for screening performance measures to evaluate extreme events for hydrological applications. Meterological Applications(accepted).
Freer, J.E., McMillan, H., McDonnell, J.J. and Beven, K.J., 2004. Constraining dynamic TOPMODEL responses for imprecise water table information using fuzzy rule based performance measures. Journal of Hydrology, 291(3-4): 254-277.
Grazzini, F., 2007. Predictability of a large-scale flow conducive to extreme precipitation over the western Alps. Meteorology and Atmospheric Physics, 95(3-4): 123-138.
Kann, A. and Haiden, T., 2005. The August 2002 flood in Austria: sensitivity of precipitation forecast skill to areal and temporal averaging. Meteorologische Zeitschrift, 14(3): 369-377.
Mariani, S. et al., 2005. A limited area model intercomparison on the "Montserrat-2000" flash-flood event using statistical and deterministic methods. Natural Hazards and Earth System Sciences, 5(4): 565-581.
Nash, J.E. and Sutcliffe, J.V., 1970. River flow forecasting through conceptual models, Part 1: A discussion of principles. Journal of Hydrology, 10: 282-290.
Pappenberger, F. and Beven, K., 2004. Functional Classification and Evaluation of Hydrographs based on Multicomponent Mapping. International Journal of River Basin Management, 2(2): 89-100.
Pappenberger, F., Buizza, R., Bodis, K. and Ghelli, A., 2007a. The skill of probabilistic forecasts under observational uncertainties within the Generalized Likelihood Uncertainty Estimation framework for hydrological applications. accepted.
Pappenberger, F., Scipal, K. and Buizza, R., 2007b. Hydrological aspects of meteorological verification. Atmospheric Science Letters(accepted).
Richardson, D.S., J. Bidlot, L. Ferranti, A. Ghelli, M. Janousek, M. Leutbecher, F. Prates, F. Vitart and E. Zsoter, 2008: Verification statistics and evaluations of ECMWF forecasts in 2007-2008, pp. 47. ECMWF RD Technical memorandum n. 578, available from ECMWF, Shinfield Park, Reading, RG2-9AX, UK (see also www.ecmwf.int/publications/library/).
Rodriguez-Iturbe, I. and Mejia, J.M., 1974. The design of rainfall network in time and space. Water Resources Research, 10: 713-728.
Rodwell, M.J., 2005. Comparing and combining deterministic and ensemble forecasts: How to predict rainfall occurrence better. ECMWF Newsletter, 1006: 1-6.
Schaefli, B. and Gupta, H., 2007. Do Nash values have value? Hydrological Processes, 21(2075-2080): 2075-2080.

The skill of ECMWF precipitation and temperature predictions…
Technical Memorandum No.558 21
Segond, M.-L., 2006. Stochastic modelling of space-time rainfall and the significance of spatial data for flood runoff generation. PhD Thesis, Imperial College London, London, 222 pp.
Thielen, J., Schaake, J., Hartman, R., & Buizza, R., 2008: Aims, Challenges and Progress of the Hydrological Ensemble Prediction Experiment (HEPEX) \x{2013} a summary of the 3rd HEPEX workshop held in Stresa 27-29 th June 2007. Atmos. Sci. Lett., 9, 29-35 (DOI:10.1002/asl.168).
Untch, A., Miller, M., Hortal, M., Buizza, R., and Janssen P., 2006: Towards a global meso-scale model: the high-resolution system TL799L91 & TL399L62 EPS. Newsletter n. 108, ECMWF, Shinfield Park, Reading RG2-9AX, UK, pg 6-13.
Wilks, D.S., 1995. Statistical Methods in the Atmospheric Sciences-An Introduction. International Geophysics Series, Vol. 59.
Related Documents