Commercial Policy Review Stage 1 Commercial Analysis and Background Report November 2017 Submitted By: Macaulay Shiomi Howson Ltd In Association With: Tate Economic Research Brook McIlroy Inc 0110010 2017 01100102017

Welcome message from author
This document is posted to help you gain knowledge. Please leave a comment to let me know what you think about it! Share it to your friends and learn new things together.
Transcript
Commercial Policy Review Stage 1 Commercial Analysis and Background Report November 2017
Submitted By: Macaulay Shiomi Howson Ltd In Association With: Tate Economic Research Brook McIlroy Inc
0110010 2017 01100102017
vlaur
Typewritten Text
ATTACHMENT 1
vlaur
Typewritten Text
vlaur
Typewritten Text
City of Guelph Commercial Policy Review Stage 1 Commercial Analysis and Background Report
Macaulay Shiomi Howson Ltd Tate Economic Research Inc.
Brook McIlroy Inc.
Table of Contents Executive Summary .............................................................................................................. i
1 Introduction ................................................................................................................. 1
1.1 Study Context and Background ............................................................................ 1
1.2 Study Purpose and Objectives ............................................................................. 2
1.3 Study Process ....................................................................................................... 4
2 Commercial Policy Framework .................................................................................... 5
2.1 The History of Commercial Policy Planning ......................................................... 5
2.1.1 Ontario Municipal Board Influences ............................................................. 6
2.2 Provincial Policy .................................................................................................... 8
2.2.1 Provincial Policy Statement .......................................................................... 8
2.2.2 Growth Plan for the Greater Golden Horseshoe ........................................ 11
2.3 City of Guelph Official Plan................................................................................. 13
2.3.1 Official Plan (2014 Consolidation and OPA 48) ........................................... 14
2.3.2 Secondary Plans .......................................................................................... 24
2.3.3 Official Plan Summary ................................................................................. 27
2.4 Other Municipal Commercial Policy Approaches .............................................. 27
3 Retail Trends .............................................................................................................. 31
3.1 Planning Policy ................................................................................................... 31
3.2 Consumer Preferences ....................................................................................... 31
3.3 Evolution of Retail Formats ................................................................................ 32
3.3.1 Mixed-Use ................................................................................................... 32
3.3.2 Urban Retail Intensification ........................................................................ 33
3.4 Retailer Initiatives .............................................................................................. 34
3.5 E-Commerce ....................................................................................................... 36
4 Stakeholder Input and Consumer Research .............................................................. 38
4.1 Stakeholder Input ............................................................................................... 38
4.2 Customer Draw Survey Results .......................................................................... 39
4.3 In-Home Consumer Telephone Survey .............................................................. 40
City of Guelph Commercial Policy Review Stage 1 Commercial Analysis and Background Report
Macaulay Shiomi Howson Ltd Tate Economic Research Inc.
Brook McIlroy Inc.
5 Commercial Inventory ............................................................................................... 42
5.1 Retail Tenant Typology ....................................................................................... 42
5.2 Guelph Existing Commercial Space .................................................................... 43
5.3 Summary of Commercial Space: City of Guelph Retail Nodes ........................... 43
5.4 Comparison with Previous TER Inventories ....................................................... 52
5.5 Summary of Commercial Space in Guelph ......................................................... 53
6 Commercial Land Needs Analysis .............................................................................. 54
6.1 Basic Assumptions .............................................................................................. 54
6.2 Work Plan ........................................................................................................... 54
6.3 Supply Analysis ................................................................................................... 55
6.3.1 Vacant Commercial Land and Intensification Sites .................................... 55
6.3.2 Active Commercial Developments .............................................................. 58
6.4 Demand Analysis ................................................................................................ 59
6.4.1 Population Growth ...................................................................................... 59
6.4.2 Expenditure Growth .................................................................................... 59
6.4.3 Warranted Retail Space .............................................................................. 60
6.4.4 Commercial Land Needs 2016 – 2041 ........................................................ 61
6.5 Commercial Land Needs Summary .................................................................... 64
7 Recommendations ..................................................................................................... 65
7.1 Future Land Requirement .................................................................................. 66
Appendix A – Other Municipal Policy Approaches ........................................................... 69
Appendix B – Summary of Stakeholder Interviews .......................................................... 77
Appendix C – Licence Plate Survey Results ....................................................................... 85
Appendix D – Guelph In-Home Consumer Survey Results ............................................... 95
Appendix E – Inventory of Competitive Retail Space ..................................................... 104
Appendix F – Analysis Tables .......................................................................................... 108
Appendix G – Definition of Terms & Assumptions ......................................................... 126
i
City of Guelph Commercial Policy Review Stage 1 Commercial Analysis and Background Report
i
Macaulay Shiomi Howson Ltd Tate Economic Research Inc.
Brook McIlroy Inc.
Executive Summary The City of Guelph is undertaking a comprehensive Commercial Policy Review in order to develop an updated commercial policy framework for the City that provides refreshed planning objectives, a contemporary commercial and mixed-use structure and land use designations, updated policies and sufficient amounts of appropriately designated lands, to direct future commercial development within the City. The City’s last commercial policy framework update occurred in 2006 and since then, the retail marketplace has continued to evolve, provincial policy has been amended with an increasing focus on complete communities and new population and employment growth forecasts have been established for Guelph resulting in the need for a comprehensive review of the City’s commercial policy framework. This Commercial Policy Review is being conducted in three phases:
• Stage 1: Commercial Analysis and Background Report • Stage 2: Policy Review and Development • Stage 3: Official Plan Amendment and Zoning By-Law
This report summarizes the findings of the Stage 1 analysis. The Provincial Policy Framework encourages a compact built form with a range of land uses that support a complete community. The planning system in Ontario is hierarchical and policy documents must meet the requirements of the policies above them. In Guelph that means that the City’s Official Plan must be consistent with the Provincial Policy Statement (PPS) and conform to the Growth Plan for the Greater Golden Horseshoe (Growth Plan).
• The focus of the PPS is on building strong communities, protecting the environment, resources, and public health and safety, and supporting a strong economy. It promotes a compact form with range of land uses which includes commercial development, and a structure of nodes and corridors. Intensification should be facilitated and densities should efficiently use land, resources, infrastructure and public services; support active transportation and be transit supportive. The PPS identifies the need to maintain the well-being of downtowns and main streets.
• The Growth Plan provides growth management policy directions in the Greater Golden Horseshoe (GGH) in promoting economic prosperity and complete communities. Commercial development is intrinsically
ii
City of Guelph Commercial Policy Review Stage 1 Commercial Analysis and Background Report
ii
Macaulay Shiomi Howson Ltd Tate Economic Research Inc.
Brook McIlroy Inc.
recognized as important for the creation of complete communities and as a significant component of vibrant, mixed-use Growth Centres. Commercial goods and services should be supported by compact development and intensification and located in areas that encourage active transportation and are served by transit to support the achievement of complete communities. The latest Growth Plan requires a transition to higher densities and greater levels of intensification. Mixed-use nodes and corridors will be an important component in achieving the desired built form and densities.
The City of Guelph Official Plan framework recognizes the Growth Plan directions dealing with the Downtown Urban Growth Centre and Mixed-use Nodes and Corridors.
• In 2009, the City initiated a five-year review of the Official Plan to bring it into conformity with the Growth Plan, and provincial legislation and plans. OPA 48, which is the final of the 3 update amendments, was approved by the Ontario Municipal Board in October 2017 with the exception of site specific appeals that do not impact commercial space.
• The Official Plan structure includes a focus on mixed-use nodes and corridors that are intended to contribute to the creation of complete communities and to have a compact built form which is transit supportive and creates a comfortable and attractive pedestrian environment. The policies recognize that the evolution to achieve the desired built form will occur over the life of the Official Plan and beyond and has provided guidance for that evolution.
The Commercial and Mixed-use designations in the Official Plan should meet the needs of daily living, be dispersed throughout the City and evolve to include main street experiences.
• The Official Plan establishes Commercial and Mixed-use designations that are intended to provide a range of uses to meet the needs of daily living. The policies support the dispersal of commercial uses throughout the City.
• There are five major land use categories within the commercial and mixed development designations and they are defined by their size and planning function. They include: • Community Mixed-use Centre • Mixed-use Corridor • Neighbourhood Commercial Centre • Service Commercial • Mixed Office/ Commercial
• The urban design policies of the Official Plan support the growth and development of the City. Policies address a wide range of issues
ii
City of Guelph Commercial Policy Review Stage 1 Commercial Analysis and Background Report
iii
Macaulay Shiomi Howson Ltd Tate Economic Research Inc.
Brook McIlroy Inc.
including building design, public art, public views, parking, vehicle-oriented uses (including drive-throughs), signage, accessibility, lighting, and gateway areas and work towards articulating the desired built form vision.
Secondary Plans apply to the Downtown and the Guelph Innovation District.
• The City has adopted the Downtown Secondary Plan that applies to the
Downtown Urban Growth Centre and which is a focus for intensification. It is intended to reinforce and expand the role of Downtown as a retail, dining and entertainment destination. On key streets, active frontages are reinforced and require retail or service uses on the ground floor.
• The Guelph Innovation District Secondary Plan (GID) is planned to be a compact, mixed-use community that includes an urban village. The urban village will be pedestrian oriented, with street-related built form that supports a mix of medium and high density commercial, residential and employment uses.
Several background research tasks were completed as part of this Stage 1 report. Interviews were held with key stakeholders to determine their views on commercial development trends and policies in the City.
• Interviews were held with key stakeholders to determine their views on current and future commercial development trends in the City, and their implications with respect to policy and regulatory directions.
• In terms of retail development, the stakeholders indicate opportunity in the east end of the City.
• E-commerce is affecting retail demand overall and particularly limiting the development of big-box retail centres. There are opportunities in Guelph for retail concepts that are not directly impacted by E-commerce, such as restaurants and health and wellness.
• Stakeholders commented on the challenges of making mixed-use development economically viable, and noted that there were mixed-use opportunities in the Downtown.
Customer location research was undertaken at 5 locations throughout Guelph, involving the recording of licence plates from 2,250 vehicles.
• The results of the licence plate surveys were used as a proxy of the customer draw of the various retail nodes in the City.
iv
City of Guelph Commercial Policy Review Stage 1 Commercial Analysis and Background Report
iv
Macaulay Shiomi Howson Ltd Tate Economic Research Inc.
Brook McIlroy Inc.
• The results of the licence plate survey illustrate that the selected retail nodes in Guelph have a strong customer draw from beyond the municipal boundary. On average, 42.7% of the licence plates collected at the five locations originated from outside of Guelph.
Customer research of 400 randomly selected households in Guelph was conducted to establish the distribution of expenditures which was used as input into the commercial land needs analysis.
• Except for the Furniture, Home Furnishing & Electronics category, Guelph residents spend 80% or more of their retail dollars at stores in Guelph.
• The overall high capture rate is an indication that the retail offering in Guelph is comprehensive and reflects the relative attractiveness of Guelph as a shopping destination. Comparison of these results with previous research conducted in Guelph indicates the City’s attractiveness as a retail destination has not diminished as new retail nodes developed in surrounding municipalities, such as Kitchener / Waterloo and Milton.
A complete inventory of retail, service and vacant space was conducted.
• Currently, the City of Guelph contains approximately 8.5 million square feet of commercial space in a variety of built forms. The largest concentration of commercial space, approximately 1.6 million square feet, is located within the Downtown.
• There is approximately 632,300 square feet of vacant space city-wide, which represents a vacancy rate of 7.5%. This vacancy level is considered to be at the upper end of normal ranges for a balanced market, which is between 5.0% and 7.5%.
• Overall, the amount of retail commercial space within the City of Guelph has increased from 6,286,700 square feet in 2008 to 7,153,000 square feet in 2012 and 8,451,000 square feet in 2017.
• On a per capita basis, the total space (retail, service, vacant) per capita has increased from 51.8 square feet per capita in 2008 to 64.1 square feet per capita in 2017.
The preceding information was incorporated into a commercial land needs analysis which quantified the demand for future retail and service space and the adequacy of the current supply to accommodate the demand. The commercial land needs analysis was conducted in three steps: 1) supply analysis; 2) residual demand analysis; and, 3) land needs analysis.
v
City of Guelph Commercial Policy Review Stage 1 Commercial Analysis and Background Report
v
Macaulay Shiomi Howson Ltd Tate Economic Research Inc.
Brook McIlroy Inc.
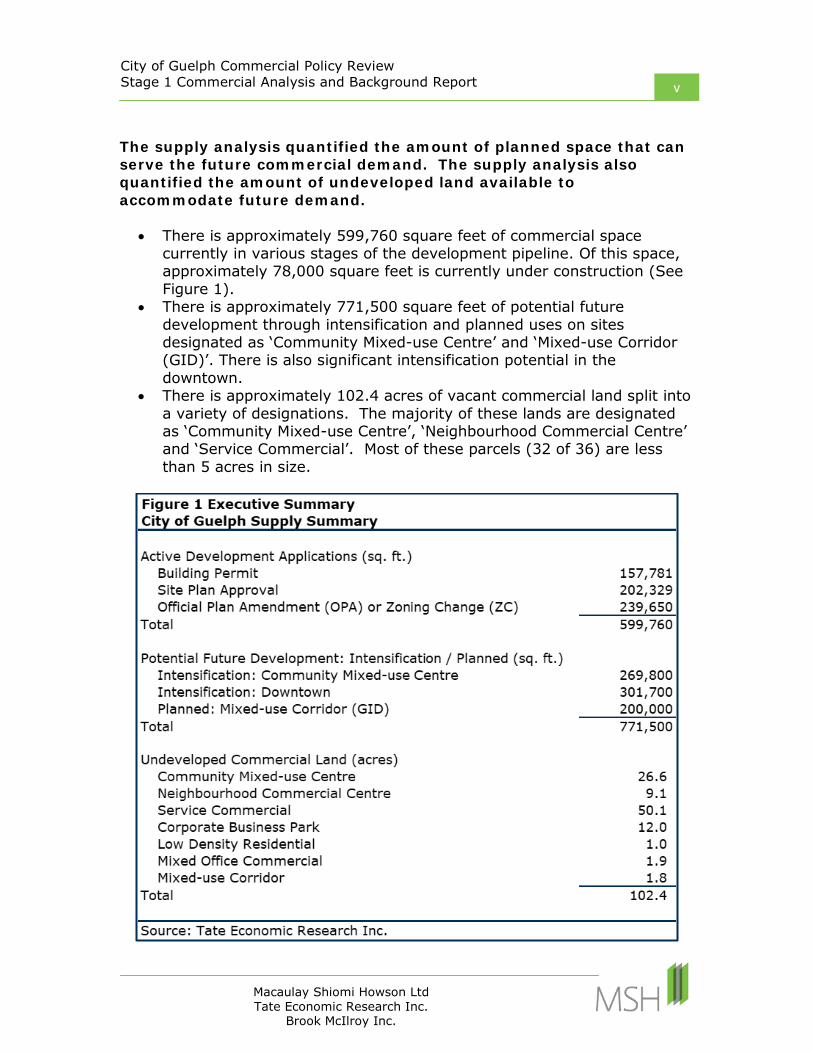
The supply analysis quantified the amount of planned space that can serve the future commercial demand. The supply analysis also quantified the amount of undeveloped land available to accommodate future demand.
• There is approximately 599,760 square feet of commercial space currently in various stages of the development pipeline. Of this space, approximately 78,000 square feet is currently under construction (See Figure 1).
• There is approximately 771,500 square feet of potential future development through intensification and planned uses on sites designated as ‘Community Mixed-use Centre’ and ‘Mixed-use Corridor (GID)’. There is also significant intensification potential in the downtown.
• There is approximately 102.4 acres of vacant commercial land split into a variety of designations. The majority of these lands are designated as ‘Community Mixed-use Centre’, ‘Neighbourhood Commercial Centre’ and ‘Service Commercial’. Most of these parcels (32 of 36) are less than 5 acres in size.
vi
City of Guelph Commercial Policy Review Stage 1 Commercial Analysis and Background Report
vi
Macaulay Shiomi Howson Ltd Tate Economic Research Inc.
Brook McIlroy Inc.
The residual demand analysis quantified the amount and type of commercial space warranted in Guelph from 2016 to 2041. • Market demand for new commercial space is strongly influenced by
population growth and expenditure levels. • Overall the City of Guelph population is forecast to increase by 55,000
persons to 191,000 persons between 2016 – 2041. This growth represents a 40% increase over the current 2016 population of 136,000.
• Retail expenditure forecasts are provided for the Beer, Wine & Liquor (BWL), Food Oriented Retail (FOR) and Non-Food Oriented Retail (NFOR) store categories. o Annual BWL expenditure potential is forecast to increase from $84.2
million in 2016 to $158.1 million in 2041. o Annual FOR expenditures are forecast to increase from $326.4
million in 2016 to $484.0 million in 2041. o Annual NFOR expenditures are forecast to increase from $857.1
million in 2016 to $1,466.9 million by 2041 • These figures represent all expenditures made in stores located in
Guelph and beyond. This growth in expenditures will represent market demand for additional retail space.
• It is forecast that each new Guelph resident will support approximately 26.3 square feet of service space in the City.
• By 2021, there will be demand for 936,700 square feet of new commercial space (retail and service) increasing to 2,986,100 square feet of new commercial space by 2041 (See Figure 2).
Figure 2 Executive SummaryWarranted Commercial Space 2021 - 2041
Source: Tate Economic Research Inc.
936,700
1,598,400
2,138,700
2,616,300
2,986,100
-
500,000
1,000,000
1,500,000
2,000,000
2,500,000
3,000,000
3,500,000
2021 2026 2031 2036 2041
vi
City of Guelph Commercial Policy Review Stage 1 Commercial Analysis and Background Report
vii
Macaulay Shiomi Howson Ltd Tate Economic Research Inc.
Brook McIlroy Inc.
• This analysis uses a residual demand methodology where demand for future warranted space is estimated based on current base year sales performance levels of existing retailers operating in Guelph, without any future transfers from existing retailers. As a result, this analysis is assumed to not impact the sales performance of existing retailers.
The land needs analysis assessed the adequacy of the current supply of commercial land to accommodate the future demand. The analysis examined the commercial land needs by 5 year periods and makes assumptions regarding the corresponding supply in each period.
• The commercial land needs assessment presented in Figure 3 is based
on the following assumptions: o The City of Guelph population forecasts are realized; o The forecast demand inputs such as e-commerce adjustments, real
growth expenditure forecasts and the general state of the retail environment remain in line with current forecasts;
o The City of Guelph assumptions behind the estimates of intensification potential and future planned supply remain unchanged; and
o All of the current undeveloped commercial land is developed for commercial uses and the forecast land coverage factors utilized in the analysis are realized.
vi
City of Guelph Commercial Policy Review Stage 1 Commercial Analysis and Background Report
viii
Macaulay Shiomi Howson Ltd Tate Economic Research Inc.
Brook McIlroy Inc.
The current and potential supply of commercial space and land is sufficient to accommodate the demand for new commercial space to 2031 on a macro level.
• The challenge with the current supply of undeveloped commercial land is that there are not enough sufficiently sized parcels to accommodate traditional larger neighborhood and community functioning retail developments, that typically require 7+ acres.
• There are 4 parcels of undeveloped land larger than 5 acres in size in the City. Furthermore, not all commercial uses are permitted on all of these parcels.
It is forecast that there will be unmet demand of approximately 387,850 square feet of commercial space by 2041.
• If this space were to be accommodated on undeveloped commercial land it would equate to a requirement for an additional 22.9 acres at an average land coverage of 38.8%.
• Conversely, this unmet commercial demand could be accommodated through new intensification opportunities.
1
City of Guelph Commercial Policy Review Stage 1 Commercial Analysis and Background Report
1
Macaulay Shiomi Howson Ltd Tate Economic Research Inc.
Brook McIlroy Inc.
1 Introduction
1.1 Study Context and Background The City of Guelph is undertaking a comprehensive Commercial Policy Review in order to develop an updated commercial policy framework for the City. The Study will result in updated Official Plan policies and Zoning By-law provisions to guide commercial development. The Official Plan policies will address the horizon years of 2031 and 2041 in order to align with the latest Official Plan update, Official Plan Amendment 48 (OPA 48), which deals with the 2031 horizon and the next Official Plan update addressing development to 2041. The City’s last commercial policy framework update occurred in 2006 and was incorporated into the City’s 2001 Official Plan. The results of the previous review were implemented through Official Plan Amendment Number 29 (OPA 29). Prior to OPA 29, the City’s commercial policy framework was based on a commercial hierarchy that included the Central Business District (Downtown), Regional, Community and Neighbourhood Commercial Centres and Service Commercial designations. OPA 29 moved the policies away from a strict hierarchy of commercial centres towards a structure of mixed-use nodes and intensification areas. The new structure was intended to ensure an appropriate distribution of commercial areas throughout the City and emphasize the role of the downtown as a multi-functional district. Mixed-use nodes were created that centred on major commercial concentrations, and neighbourhood commercial centres and service commercial policies were revised. Urban design policies for commercial mixed-use areas were also incorporated into the Official Plan. Since the last commercial policy review, the Guelph retail scene has changed with such developments as:
• The introduction of Costco; • Announcement of Lowes; • Announcement of Sears closure; • Continued expansion of Paisley / Imperial Node; • Inactivity at Watson Parkway / Starwood Node; • Development of Gordon / Clair Node; • Introduction of the Silvercreek Junction Node; • Willow West Mall renovation;
2
City of Guelph Commercial Policy Review Stage 1 Commercial Analysis and Background Report
2
Macaulay Shiomi Howson Ltd Tate Economic Research Inc.
Brook McIlroy Inc.
• SmartCentres Guelph development and Walmart expansion at Woodlawn/Woolwich Node;
• Downtown residential intensification; • Conversion of Zellers to Target and subsequent closure of
Target; • Walmart in former Target space on Stone Road; and • Expansion and renovations at Stone Road Mall.
There has also been interest expressed in developing standalone high density residential in the commercial designations, and the potential removal of these lands from the commercial inventory.
In addition, the retail marketplace has continued to evolve as new formats and marketing forces continue to be introduced, and this on-going transformation means that the retail policy framework must be evaluated to ensure that it is flexible enough to accommodate existing and future trends and needs. In addition, provincial policies have been amended with an increasing focus on the creation of complete communities and intensification. These factors, together with the latest population and employment growth forecasts for Guelph result in the need for comprehensive review of the City’s Official Plan commercial policy framework.
1.2 Study Purpose and Objectives The purpose of the Commercial Policy Review is to develop an updated commercial policy framework for the City that provides refreshed planning objectives, a contemporary commercial structure and land use designations, updated policies and sufficient amounts of appropriately designated lands, to direct future commercial development within the City. The Commercial Policy Review is intended to:
i. Ensure the amount of recommended designated commercial land is sufficient to meet 2041 planning horizon needs within the City’s current settlement area boundary;
ii. Determine the amount, location and type of designated commercial land needed for a 2031 planning horizon and a 2041 planning horizon in accordance with the Growth Plan population and employment forecasts;
3
City of Guelph Commercial Policy Review Stage 1 Commercial Analysis and Background Report
3
Macaulay Shiomi Howson Ltd Tate Economic Research Inc.
Brook McIlroy Inc.
iii. Update the commercial policy structure and identify potential commercial / mixed-use designation categories and locations for those designations;
iv. Establish phasing of commercial lands in consideration of OPA 48’s 2031 planning horizon and the 2041 planning horizon of the next Official Plan update;
v. Identify significant changes in the retail market trends nationally, provincially and locally, e.g. E-commerce;
vi. Recognize and clarify the role, function and amount of commercial space within the Growth Centre (Downtown), Community Mixed-Use Nodes (e.g. Silvercreek, Starwood/Watson Parkway), Intensification Corridors (e.g. York Road) and Service Commercial designations in the context of updated commercial policies;
vii. Consider the feasibility of second floor commercial and mixed-use buildings to support the pedestrian friendly urban visions for the Growth Centre (Downtown), GID urban village, Community Mixed-Use Nodes and Intensification Corridors;
viii. Consider non-residential uses in residential areas, including small scale / neighbourhood scale and mixed-use developments that include a commercial component;
ix. Consider the connectivity of the proposed commercial policy framework with existing developed or planned commercial development areas of the City;
x. Recognize patterns of land use, land use designations and density, and associated population and employment densities contained within OPA 48;
xi. Recognize the City’s urban design directions included in OPA 48 and the Urban Design Action Plan;
xii. Recognize transportation approaches including transit, pedestrian and bicycle connections contained within OPA 48; and
xiii. Update the Official Plan and Zoning By-law on the basis of the findings of the Study.

4
City of Guelph Commercial Policy Review Stage 1 Commercial Analysis and Background Report
4
Macaulay Shiomi Howson Ltd Tate Economic Research Inc.
Brook McIlroy Inc.
1.3 Study Process The Study is being undertaken in three stages. Stage 1 involves gathering and analyzing background information and includes an analysis of the existing policy framework, retail trends, stakeholder input, consumer research, commercial inventory, and commercial land needs analysis. This will form the framework for subsequent phases of policy update and development. Stage 2 will begin with a visioning exercise and will then explore policy alternatives and options and provide recommendations on the preferred approach. Stage 3 will be led by City staff and will involve the development and adoption of the actual Official Plan policy amendments and accompanying updates to the Zoning By-law.
5
City of Guelph Commercial Policy Review Stage 1 Commercial Analysis and Background Report
5
Macaulay Shiomi Howson Ltd Tate Economic Research Inc.
Brook McIlroy Inc.
2 Commercial Policy Framework This section provides an overview of the provincial and local policy framework influencing commercial (retail and service) development in the City and a review of other municipal approaches to commercial policy.
2.1 The History of Commercial Policy Planning In the latter part of the twentieth century, commercial areas were often focused on a hierarchy of uses that generally included downtown or retail main street areas, regional shopping centres, community level malls and plazas, and local convenience commercial uses. Official Plan policies typically recognized this hierarchy and the role that commercial development should play in the community. The Province’s 1975 policy document “Guidelines for Shopping Centre Development” initiated certain concepts such as recognizing the role of the historic downtown areas and evaluating the market impacts of new shopping centres. The reasons for establishing policies that intervened in the marketplace were to address matters of public interest. The matters of public interest that were most commonly addressed through the evaluation of retail development included: Avoiding blight caused by vacant or abandoned commercial areas
that provided a specific planned function; Providing a range of goods and services in accessible locations to
ensure that all areas of a municipality were well served; and Efficiently utilizing municipal infrastructure such as water,
wastewater and public transit. In addition to applying policy guidance to address matters of public interest, the Province recognized that there was a need to support downtowns and older commercial areas. As a result, it created several incentive programs including: The amendment to the Municipal Act in 1970 to allow for the
creation of Business Improvement Areas; The creation of the Ontario Downtown Renewal Program (ODRP) in
1976; and
6
City of Guelph Commercial Policy Review Stage 1 Commercial Analysis and Background Report
6
Macaulay Shiomi Howson Ltd Tate Economic Research Inc.
Brook McIlroy Inc.
Programs for Renewal, Improvement, Development and Economic Revitalization (PRIDE) in 1986.
In the City of Guelph, the ODRP was used to create the Eaton’s Centre in the downtown to address the migration of major stores form the downtown to suburban shopping centres. In the 1990s, changes in the traditional retail hierarchy emerged with the creation of large format / big box stores and power centres. These uses were typically built in automotive focused formats and a number of them gravitated towards employment areas where large site areas with good highway exposure were available. This evolution of retail formats had particular impact on the downtowns and led to the need for downtowns to re-evaluate their role. In response to these pressures, many downtowns have sought to expand their focus to include a wider range of uses such as cultural, institutional, office, and niche retail uses. In Guelph, the City opened the River Run Centre on Woolwich Street in 1997 to provide a performing arts venue and the Eaton’s Centre was redeveloped in 1999 as the Guelph Sports and Entertainment Centre (currently known as the Sleeman Centre) and the Old Quebec Street Mall. Since that time, retail has continued to evolve with additional forms of commercial development such as Lifestyle Centres and Outlet Malls also emerging. The latest trends in retail development are discussed in more detail in section 3 of this report.
2.1.1 Ontario Municipal Board Influences Ontario Municipal Board (OMB) decisions have also helped to shape the planning policy framework of commercial development. Although OMB decisions are not intended to set precedent, they have influenced the policy language in local Official Plans with the use of terms such as “planned function” and “harmful or deleterious impacts.” The OMB considered the market impacts of new retail development in keeping with the 1975 Guidelines for Shopping Centre Development. However, by “1987 the OMB abandoned its reliance on market studies and had focused on the impact of the proposed commercial development on the planned commercial structure of municipalities. There appears to have been two reasons for this: a disillusionment

7
City of Guelph Commercial Policy Review Stage 1 Commercial Analysis and Background Report
7
Macaulay Shiomi Howson Ltd Tate Economic Research Inc.
Brook McIlroy Inc.
with market studies and an increasing awareness that the nature and location of commercial land uses should be treated as an important aspect of public policy rather than primarily a marketing exercise.”1 In the early 1990’s, OMB decisions also began to make it clear that the tests for intervention into the marketplace were very high. An important OMB decision occurred in 1993 in Brampton with the Costco hearing where the Board stated that:
“When considering impact, the Board accepts that any change in the commercial structure, however large or small, will cause impact. By itself this is not justification for intervention. The Board intervenes only when the impact is “deleterious or harmful” to existing facilities to the extent that the development would “jeopardize” or, as the Board has said elsewhere, “undermine or destroy” the proper planned function of existing land uses and the planned commercial structure of the community…” (pg. 9) “…identifying and protecting an appropriate level of service from overstoring must be weighed against the benefits in price, service, and so on, to be derived from the introduction of new competitors or new ways of doing business. The planned commercial structure and the policies designed to protect it cannot be so rigid as to thwart commercial competition or inhibit retail innovation that is beneficial ultimately to the consuming public. In summary, the Board’s practice, as it has evolved over the years in hearing of this kind, is not to intervene in markets except gingerly, with great trepidation and only when warranted by significant and demonstrable levels of impact in the form of blight and/or service reduction that are clearly harmful or are deleterious to the overall commercial structure of a community and thus to the public interest.” (pg. 10) “The test the Board has adopted is a stringent one. It is not enough that stores will close, as tragic as this may be to
1 “A Law unto Itself: How the Ontario Municipal Board has developed and applied Land Use Policy” by John George Chipman, 2002, University of Toronto Press

8
City of Guelph Commercial Policy Review Stage 1 Commercial Analysis and Background Report
8
Macaulay Shiomi Howson Ltd Tate Economic Research Inc.
Brook McIlroy Inc.
owners, workers and patrons. The test in planning terms is a public interest test based on whether there will be a deleterious impact on planned function, such as a significant diminution of service or potential for blight.” (pg. 78) “The commercial structure of a community is a service to its citizens; it is not an impregnable fortress designed to protect the comfortable positions of the commercial interests who now occupy it.” (pg. 82)2
Board decisions such as this one were important in shaping the approach used in planning for commercial development in the Province. There is still a concern with market impacts as seen in both Board decisions and official plan policies, but the high tests set by the Board related to market intervention appears to have contributed to the decrease in the focus on market impacts as a reason for refusing new retail development.
2.2 Provincial Policy The provincial government has established a series of provincial policy documents that guide the land use planning process in the province. The City of Guelph Official Plan (OP) is required to be consistent with the Provincial Policy Statement and conform to the other Provincial policies. As a result, in considering the City’s planning framework for retail development, it is important to understand the directions that are established in these policies.
2.2.1 Provincial Policy Statement The first Provincial Policy Statement (PPS) was adopted in 1996, and it has subsequently been revised in 2005 and 2014. All decisions made under the Planning Act are required to be consistent with the PPS. The focus of the PPS is on building strong communities, protecting the environment, resources, and public health and safety, and supporting a strong economy. It provides a planning framework for municipal land use decision making as it relates to managing and directing land 2 Ontario Municipal Board Reports 30, 1994, City of Brampton Official Plan Amendment 208
9
City of Guelph Commercial Policy Review Stage 1 Commercial Analysis and Background Report
9
Macaulay Shiomi Howson Ltd Tate Economic Research Inc.
Brook McIlroy Inc.
use to achieve efficient development and land use patterns that focus growth and development within Settlement Areas. The relevant key directions are summed up in the title of Section 1 – “Building Strong Healthy Communities” and of Section 1.1 – “Managing and Directing Land Use to Achieve Efficient and Resilient Development and Land Use Patterns.” More specifically, the policies indicate in Section 1.1.1 that healthy, livable and safe communities are sustained by, among other matters: “a) promoting efficient development and land use patterns which
sustain the financial well-being of the Province and municipalities over the long term;
b) accommodating an appropriate range and mix of residential…, employment (including industrial and commercial), institutional…. recreation, park and open space, and other uses to meet long-term needs;
e) promoting cost-effective development patterns and standards to minimize land consumption and servicing costs.”
Section 1.1.2 states that: “Sufficient land shall be made available to accommodate an appropriate range and mix of land uses to meet projected needs for a time horizon of up to 20 years… Within settlement areas, sufficient land shall be made available through intensification and redevelopment, and, if necessary designated growth areas.” In addition, Section 1.1.3 Settlement Areas, indicates that while settlement areas, development pressures and land use change will vary across the province, “it is in the interest of all communities to use land and resources wisely, to promote efficient development patterns…ensure effective use of infrastructure and public service facilities and minimize unnecessary public expenditures.” The policies of Section 1.1.3.2 are focused on densities and a mix of land uses which: 1. efficiently use land and resources 2. efficiently use infrastructure and public services 3. support active transportation 4. are transit supportive and on a range of uses and opportunities for intensification and redevelopment.
10
City of Guelph Commercial Policy Review Stage 1 Commercial Analysis and Background Report
10
Macaulay Shiomi Howson Ltd Tate Economic Research Inc.
Brook McIlroy Inc.
New development “shall have a compact form, mix of uses and densities that allow for the efficient use of land, infrastructure and public service facilities.”(Section 1.1.3.6) These directions are reinforced in Section 1.8 Energy Conservation, Air Quality and Climate Change, which in Section 1.8.1 supports land use and development patterns which: “a) promote compact form and a structure of nodes and corridors; b) promote the use of active transportation and transit in and
between residential, employment (including commercial and industrial) and institutional uses and other areas;
c) focus major employment, commercial and other travel-intensive land uses on sites which are well served by transit where this exists or is to be developed, or designing these to facilitate the establishment of transit in the future;…”
Other policies which are relevant include: Section 1.3.1. dealing with employment indicates that economic
development and competitiveness will be promoted by among other matters “encouraging compact, mixed-use development that incorporates compatible employment uses to support livable and resilient communities.”
Section 1.3.2 states that conversion of land within employment areas to non-employment uses may be permitted through a comprehensive review “only where it has been demonstrated that the land is not required for employment purposes over the long term and that there is a need for the conversion.”
Section 1.7, Long-Term Economic Prosperity indicates that it should be supported by among other matters “supporting opportunities for economic development and community – investment readiness” and “maintaining and, where possible, enhancing the vitality and viability of downtowns and main streets.”
Section 6, Definitions, defines employment areas as “those areas designated in an official plan for clusters of business and economic activities including, but not limited to, manufacturing, warehousing, offices, and associated retail and ancillary facilities.”
No definitions are provided for commercial development, or related terms.
11
City of Guelph Commercial Policy Review Stage 1 Commercial Analysis and Background Report
11
Macaulay Shiomi Howson Ltd Tate Economic Research Inc.
Brook McIlroy Inc.
In summary, the PPS provides general directions but limited specific requirements as to how those directions should be achieved. This allows for different approaches across the Province to reflect local circumstances and needs. The PPS makes no specific reference to how commercial development should be provided or to protection of the planned function of any commercial centres or hierarchies other than the need to maintain the well-being of downtowns and main streets.
2.2.2 Growth Plan for the Greater Golden Horseshoe The Growth Plan of the Greater Golden Horseshoe (Growth Plan) was prepared under the Places to Grow Act, 2005, and came into force and effect on June 16, 2006. The Growth Plan was amended in 2012 and 2013. A new Growth Plan that is substantially different from the former Plan came into effect on July 1, 2017. The Growth Plan builds on other government initiatives such as the PPS to provide growth management policy direction in the Greater Golden Horseshoe (GGH). In doing so, it provides clear directions to municipal governments on a wide range of issues in the interest of promoting economic prosperity and complete communities. The Growth Plan addresses matters relating to transportation, infrastructure, land-use planning and intensification, urban form and growth centres, housing, natural heritage, cultural heritage, resource protection, and climate change and resiliency. Section 2.1 of the Growth Plan dealing with context states that: “This Plan is about accommodating forecasted growth in complete communities. These are communities that are well designed to meet people’s needs for daily living throughout an entire lifetime by providing convenient access to an appropriate mix of jobs, local services, public service facilities, and a full range of housing to accommodate a range of incomes and household sizes. Complete communities support quality of life and human health by encouraging the use of active transportation and providing high quality public open space, adequate parkland, opportunities for recreation, and access to local and healthy food. They provide for a balance of jobs and housing in communities across the GGH to reduce the need for long distance commuting. They also support climate change mitigation by increasing
12
City of Guelph Commercial Policy Review Stage 1 Commercial Analysis and Background Report
12
Macaulay Shiomi Howson Ltd Tate Economic Research Inc.
Brook McIlroy Inc.
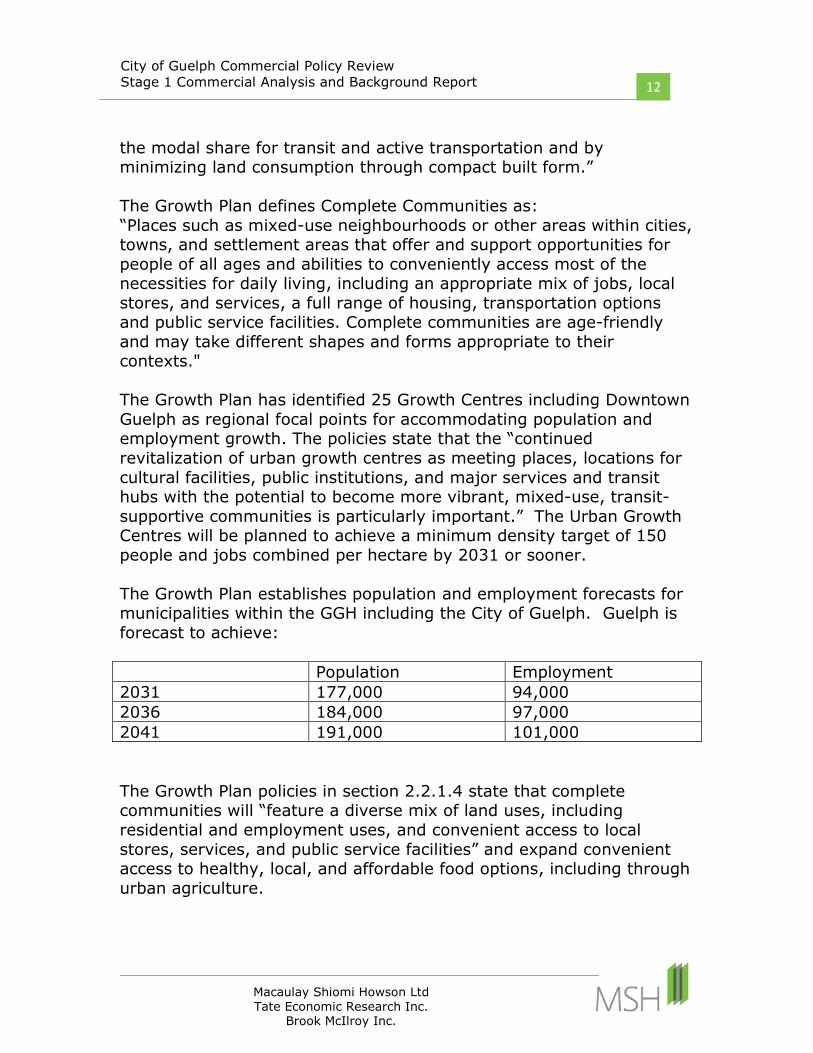
the modal share for transit and active transportation and by minimizing land consumption through compact built form.” The Growth Plan defines Complete Communities as: “Places such as mixed-use neighbourhoods or other areas within cities, towns, and settlement areas that offer and support opportunities for people of all ages and abilities to conveniently access most of the necessities for daily living, including an appropriate mix of jobs, local stores, and services, a full range of housing, transportation options and public service facilities. Complete communities are age-friendly and may take different shapes and forms appropriate to their contexts." The Growth Plan has identified 25 Growth Centres including Downtown Guelph as regional focal points for accommodating population and employment growth. The policies state that the “continued revitalization of urban growth centres as meeting places, locations for cultural facilities, public institutions, and major services and transit hubs with the potential to become more vibrant, mixed-use, transit-supportive communities is particularly important.” The Urban Growth Centres will be planned to achieve a minimum density target of 150 people and jobs combined per hectare by 2031 or sooner. The Growth Plan establishes population and employment forecasts for municipalities within the GGH including the City of Guelph. Guelph is forecast to achieve: Population Employment 2031 177,000 94,000 2036 184,000 97,000 2041 191,000 101,000 The Growth Plan policies in section 2.2.1.4 state that complete communities will “feature a diverse mix of land uses, including residential and employment uses, and convenient access to local stores, services, and public service facilities” and expand convenient access to healthy, local, and affordable food options, including through urban agriculture.
13
City of Guelph Commercial Policy Review Stage 1 Commercial Analysis and Background Report
13
Macaulay Shiomi Howson Ltd Tate Economic Research Inc.
Brook McIlroy Inc.
Policies in section 2.2.5 dealing with employment states that retail and office uses will be directed to locations that support active transportation and have existing or planned transit. Major retail uses are prohibited in employment areas, and retail and office uses that are not associated with or ancillary to the employment uses will be prohibited in prime employment areas. Section 2.2.5.12 states that the “retail sector will be supported by promoting compact built form and intensification of retail and service uses and areas and encouraging the integration of those uses with other land uses to support the achievement of complete communities.” The policies also state that transit will be the first priority for transportation infrastructure and transit should be expanded to areas that have a mix of uses including areas that have achieved, or will be planned to achieve, transit-supportive densities and provide a mix of residential, office, institutional, and commercial development, wherever possible. Public service facilities and public services should be co-located in community hubs. This is consistent with the overall thrust to support the integration of uses that serve the community. In summary, commercial development is intrinsically recognized as important for the creation of complete communities and as significant components of vibrant, mixed-use Growth Centres. Commercial goods and services should be supported by compact development and intensification and located in areas that encourage active transportation and are served by transit.
2.3 City of Guelph Official Plan The Official Plan is a future oriented document that identifies the desired form of development in Guelph to 2031. The City of Guelph Official Plan was adopted in 2001 and has been amended numerous times since then. As noted above, OPA 29 was the result of the last major review of the commercial policies. In 2009 the City initiated a five-year review of the Official Plan (as required by the Planning Act) that was carried out in three phases. The review resulted in the adoption of Official Plan Amendments (OPAs) 39, 42 and 48. OPA 39 brought the Official Plan into
vlaur
Typewritten Text
vlaur
Typewritten Text
!
!
!
!
!
!
!
!
!
!
!
!
!
!
!
!
!
!
!
!
!
!
!
!
!
!
!
!
!
!
!
!
!
!
!
!
!
!
!
!
!
!
!
!
!
!!
!
!
!
!
!
!!
!
!
!
!
!
!
!
!
!
!!
!
!
!
!
!
!
!
!
!
!
!
!
!
!
!
!
!
!
!
!
!!
!
!
!
!
!
!
!
!
!
!
!
!
!
!
!
!
!
!
!
!
!
!
!
!
!
!
!
!
!
!
!
!
!
!
!
!
!
!
!
!
!
!
!
!
!
!
!
!
!
!
!
!
!
!
!
!
!
!
!
!
!
!
!
!
!
!
!
!
!
!
!
!
!
!
!
!
!
!
!
!
!
!
!
!
!
!
!
!
!
!
!
!
!
!
!
!
!
!
!
!
!
!
!
!
!
!
!
!
!
!
!
!
!
!
!
!
!
!
!
!
!
!
!
!
!
!
!
!
!
!
!
!
!
!
!
!
!
!
!
!
!
!
!
!
!
!
!
!
!
!
!
!
!
!
!
!
!
!
!
!
!
!
!
!
!
!
!!
!
!
!
!
!
!
!
!!
!
!
!
!
!
!
!
!
!
!
!
!
!
!
!
!
!
!
!
!
!
!
!
!
!
!
!
!
!
!
!
!
!
!
!
!
!
!
!
!
!
!
!
!
!
!
!
!
!
!
!
!
!
!
!
!
!
!
!
!
!
!
!
!
!
!
!
!
!
!
!
!
!
!
!
!
!
!
!
!
!
!
!
!
!
!
!
!
!
!
!
!
!
!
!
!
!
!
!
!
!
!
!
!
!
!
!
!
!
!
!
!
!
!
!
!
!
!
!
!
!
!!
!
!!
!
!
!
!!
!
!
!
!
!
!
!
!
!
!
!
!
!
!
!
!
!
!
!
!
!
!
!
!
!
!
!
!
!
!
!
!
!
!
!
!
!
!
!
!
!!
!
!
!
!
!
!
!
!
!
!
!!
!
!
!!
!
!
!
!
!
!
!
!
!
!
!
!
!
!
!
!
!
!
!
!
!
!
!
!
!
!
!
!
!
!
!
!
!
!
!
!
!
!
!
!
!
!
!
!
!
!
!
!
!
!
!
!
!
!
!
!
!
!
!
!
!
!
!
!
!
!
!
!
!
!
!
!
!
!
!
!
!
!
!
!
!
!
!
!
!
!
!
!
!
!
!
!
!
!
!
!
!
!
!
!
!
!
!
!
!
!
!
!
!
!
!
!
!
!
!
!
!
!
!
!
!
!
!
!
!
!
!
!
!
!
!
!
!
!
!
!
!
!
!
!
!
!
!
!
!
!
!
!
!
!
!
!
!
!
!
!
!
!
!
!
!
!
!
!
!
!
!
!
!
!
!
!
!
!
!
!
!
!
!
!
!
!
!
!
!
!
!
!
!
!
!
!
!
!
!
!
!
!
!
!
!
!
!
!
!
!
!
!
!
!
!
!
!
!
!
!
!
!
!
!
!
!
!
!
!
!
!
!
!
!
!
!
!
!
!
!
!
!
!
!
!
!
!
!
!
!
!
!
!
!
!
!
!
!
!
!
!
!
!
!
!
!
!
!
!
!
!
!
!
!
!
!
!
!
!
!
!
!
!
!
!
!
!
!
!
!
!
!
!
!
!
!
!
!
!
!
!
!
!
!
!
!
!
!
!
!
!
!
!
!
!
!
!
!
!
!
!
!
!
!
!
!
!
!
!
!
!
!
!
!
!
!
!
!
!
!
!
!
!
!
!
!
!
!
!
!
!
!
!
!
!
!
!
!
!
!
!
!
!
!
!
!
!
!
!
!
!
!
!
!
!
!
!
!
!
!
!
!
!
!
!
!
!
!
!
!
!
!
!
!
!
!
!
!
!
!
!
!
!
!
!
!
!
!
!
!
!
!
!
!
!
!
!
!
!
!
!
!
!
!
!
!
!
!
!
!
!
!
!
!
!
!
!
!
!
!
!
!
!
!
!
!
!
!
!
!
!
!
!
!
!
!
!
!
!
!
!
!
!
!
!
!
!
!
!
!
!
!
!
!
!
!
!
!
!
!
!
!
!
!
!
!
!
!
!
!
!
!
!
!
!
!
!
!
!
!
!
!
!
!
!
!
!
!
!
!
!
!
!
!
!
!
!
!
!
!
!
!
!
!
!
!
!
!
!
!
!
!
!
!
!
!
!
!
!
!
!
!
!
!
!
!
!
!
!
!
!
!
!
!
!
!
!
!
!
!
!
!
!
!
!
!
!
!
!
!
!
!
!
!
!
!
!
!
!
!
!
!
!
!
!
!
!
!
!
!
!
!
!
!
!
!
!
!
!
!
!
!
!
!
!
!
!
!
!
!
!
!
!
!
!
!
!
!
!
!
!
!
!
!
!
!
!
!
!
!
!
!
!
!
!
!
!
!
!
!
!
!
!
!
!
!
!
!
!
!
!
!
!
!
!
!
!
!
!
!
!
!
!
!
!
!
!
!
!
!
!
!
!
!
!
!
!
!
!
!
!
!
!
!
!
!
!
!
!
!
!
!
!
!
!
!
!
!
!
!
!
!
!
!
!
!
!
!
!
!
!
!
!
!
!
!
!
!
!
!
!
!
!
!
!
!
!
!
!
!
!
!
!
!
!
!
!
!
!
!
!
!
!
!
!
!
!
!
!
!
!
!
!
!
!
!
!
!
!
!
!
!
!
!
!
!
!
!
!
!
!
!
!
!
!
!
!
!
!
!
!
!
!
!
!
!
!
!
!
!
!
!
!
!
!
!
!
!
!
!
!
!
!
!
!
!
!
!
!
!
!
!
!
!
!
!
!
!
!
!
!
!
!
!
!
!
!
!
!
!
!
!
!
!
!
!
!
!
!
!
!
!
!
!
!
!
!
!
!
!
!
!
!
!
!
!
!
!
!
!
!
!
!
!
!
!
!
!
!
!
!
!
!
!
!
!
!
!
!
!
!
!
!
!
!
!
!
!
!
!
!
!
!
!
!
!
!
!
!
!
!
!
!
!
!
!
!
!
!
!
!
!
!
!
!
!
!
!
!
!
!
!
!
!
!
!
!
!
!
!
!
!
!
!
!
!
!
!
!
!
!
!
!!
!
!
!
!
!
!
!
!
!
!
!
!
!
!
!
!
!
!
!
!
!
!
Township of Guelph-Eramosa
Township of PuslinchTownship of
Guelph-Eramosa
Township of Puslinch
G uel p
hL
ak
e
C.N.R.
C.N.R.
G.J.R.
G.J.R.
C.N.R.
C.N
.R.
FORESTELL RD
SO
UT
HG
ATE
DR
TEAL DR
K O R T R I G H T R D E
FLEMING RD
TOVE LL DR
WO
OD
LAND
GL EN DR
CIT
YV
IEW
DR
N
GO
SL I
NG
GDNS
INV
ER
NE
SS
DR
COUNTRY CLUB DR
PINE RIDGE DR
WILLOW
RD
JENSON BLVD
POP
PYD
R
BE
A VE
RM
EA
DO
WD
R
EASTVIEW RD
DE
LHI S
T
IMPERIA
L RD N
MALTBY RD W MALTBY RD E
DAW
SO
N R
D
ME
TCA
LFE
ST
NISKA RD
RI
CK
SO
NA
VE
IMPERIALRD
S
STARWOOD
DR
AUD
EN R
D
SCO
TTSD
ALED
R
GRANGE ST
WESTW
OO
DR
D
DEAN AVE
WATER ST
WH
ITE
LAW
RD
HAD
ATI RD
WAVERLEY DR
ALM
A S
T N
CLAIR RD W
WE
STM
OU
NT
RD
LONDON RD W
SUFFOLK ST W
HARVARD RD
BRAN T AVE
WAT
SON
RD
S
CO
LL
EGE AVE W
EMMA ST
ELIZABETH ST
WATERLOO AVE
CO
LON
IAL
DR
NEEVE ST
CLAIRFIELDS DR W
SUM
M E RFIELD DR
YOR
KS
HIR
E S
T N
PTARMIGAN
DR
NIC
KLI
N R
D
FA
RL
EY
DR
JAN
EFI
ELD
AV
E
IRO
N W O O D
RD
S TEPH
ANIE
DR
RIV
ERVI
EWDR
CLAIRFIELDS DR E
MUNICIPAL ST
MU
SKO
KA
DR
KATH
LEE
N S
T
WIN
DS
OR
ST
BAILEY AVE
ARTHUR ST N
GO
RD
ON
ST
YORK RD
VIC
TOR
IA R
D S
STONE RD E
EDIN
BU
RG
H R
D S
WOODLAWN RD W
PAISLEY RD
SPEEDVALE AVE W
WILLOW RD
WO
OLW
ICH
ST
DOW
NEY
RDERAMOSA RD
ELM
IRA
RD
N
STONE RD W
WAT
SON
PK
Y N
EDIN
BU
RG
H R
D N
CLAIR RD E
GRANGE RD
WELLINGTON ST W
SILV
ER
CR
EE
K P
KY N
WOODLAWN RD E
ELM
IRA
RD
S
FIFE RD
ARKELL RD
STE
VE
NS
ON
ST
N
COLLEGE AVE E
WATSO
N PKY S
KORTRIGHT RD W
COLLEGE AVE W
LAIRD RD
SPEEDVALE AVE E
VIC
TOR
IA R
D N
CLAIR RD W
ELIZABETH ST
PAISLEY ST
WATERLOO AVE
STE
VE
NS
ON
ST
S
WAT
SON
RD
S
VIC
TOR
IA R
D S
SO
UT
HG
ATE
DR
LA IR D RD
SILV
ER
CR
EE
K P
KY S
IRONWOOD RD
GO
RD
ON
ST
WY
ND
HA
M S
T N
NO
RFO
LK S
T
WELLINGTON ST E
MACDONELL ST
HANL
ON
EXP
YHA
NLO
N E
XPY
HANLON CREEK BLVD
(!(!
(!
WAT
SON
RD
S
CONCESSION 4
MALTBY RD E
LAIRD RD W
CAR
TER
RD
SIDE
ROAD
10
N
WEL
LING
TON
RD 3
5
WELLINGTON RD 37
FIFE RD
WELLINGTON RD 124
SIDE
ROAD
20
N
FORESTELL RD
WE
LLIN
GTO
N R
D 4
1
HUME RD
COOK'S MILL RD
WE
LLIN
GTO
N R
D 3
9
WE
LLIN
GTO
N R
D 8
6
FARNHAM RD
WH
ITE
LAW
RD
SIDE
ROAD
12
WELLINGTON RD 31
STONE RD E
SPEEDVALE AVE E
BO
REH
AM
DR
WELLINGTON RD 124
1 0 10.5KM
Projection: UTM 17N NAD83Produced by the City of GuelphPlanning ServicesSeptember 2017 Consolidation
±
SCHEDULE 2:
CITY OF GUELPHOFFICIAL PLAN
LAND USE PLANI:\gis_staging\Planning\OFFICIAL PLAN MAPPING NEW\Schedule2\OPSchedule2-Landuse.mxd
This Schedule is to be read in conjunction with the other Schedules and the text of The Official Plan
Produced by the City of Guelph with Data supplied under Licence by Members of the Ontario Geospatial Data Exchange.
The City of Guelph, its employees and agents, do notundertake to guarantee the validity of the contents of thedigital or hardcopy map files, and will not be liable for any claims for damages or loss arising from their application orinterpretation, by any party. It is not intended to replace a survey or be used for legal description. This map may notbe re-produced without the permission of the City of Guelph. Please contact the City of Guelph's GIS group foradditional information at 519-822-1260.
Produced using information under License with the Grand River Conservation Authority © Grand River Conservation Authority, 2009 [2009].
Refer to Guelph Innovation District
Secondary Plan
Refer to DowntownSecondary
Plan
Legend
City Street
Future City Street
County Road
Railway
Watercourse
Waterbody
Corporate Boundary
Future Highway Interchange(!
Land Use Designations
Open Space and Park
Major Utility
Mixed Business! ! ! ! ! !
! ! ! ! ! !
! ! ! ! ! !
Institutional / Research Park
Corporate Business Park
Industrial
Mixed Office / Commercial
Approved Secondary Plans
High Density Residential
Medium Density Residential
Low Density Greenfield Residential
Service Commercial
Neighbourhood Commercial Centre
Mixed-Use Corridors
Major Institutional
Special Study Area
Low Density Residential
! ! ! ! ! ! ! !
! ! ! ! ! ! ! !
! ! ! ! ! ! ! !
! ! ! ! ! ! ! !
! ! ! ! ! ! ! !
Community Mixed-Use Centre
Potential School Siten
Secondary Planning Area
Reserve Lands! ! ! !
! ! ! !
Significant Natural Areas & Natural Areas
Natural Areas Overlay
Secondary Plans
Note: Official Plan Amendment no. 48 remains under appeal for the lands
indicated, known municipally as0 Niska Road.

14
City of Guelph Commercial Policy Review Stage 1 Commercial Analysis and Background Report
14
Macaulay Shiomi Howson Ltd Tate Economic Research Inc.
Brook McIlroy Inc.
conformity with the Growth Plan and OPA 42 updated the Natural Heritage Strategy. OPA 48 brought the remaining sections of the Official Plan into conformity with provincial legislation and plans and ensured consistency with the Provincial Policy Statement. Amendments 39 and 42 are in full force and effect. OPA 48 was appealed to the Ontario Municipal Board (OMB) in its entirety and approved with some modifications on October 5, 2017 with some minor exceptions for items that remain under appeal on a site specific basis. These appeals will be addressed through future OMB hearings and do not impact the City’s commercial policies. The OMB approved OPA 48 should be read in conjunction with the 2014 Office Consolidation of the Official Plan which is highlighted below.
2.3.1 Official Plan (2014 Consolidation and OPA 48) The Vision in the Official Plan (OP) states that “the integration of energy, transportation and land use planning will make a difference in the environmental sustainability, cultural vibrancy, economic prosperity and social well-being of Guelph.” The OP is based on 8 SmartGuelph Principles which include reference to “a city with a strong and diverse economy, a wealth of employment opportunities, robust manufacturing, a thriving retail sector…”. The Strategic Goals refer to
• ensuring “an appropriate range and mix of employment opportunities, local services, community infrastructure, housing including affordable housing and other land uses are provided to meet current and projected needs to the year 2031”;
• building “a compact, mixed-use and transit-supportive community”; and
• strengthening “the role of the Downtown as a major area for investment, employment and residential uses such that it functions as a vibrant focus of the City”.
Urban Structure and Growth Management
The OP establishes a Growth Management Strategy that includes a number of objectives towards creating a compact, vibrant and
15
City of Guelph Commercial Policy Review Stage 1 Commercial Analysis and Background Report
15
Macaulay Shiomi Howson Ltd Tate Economic Research Inc.
Brook McIlroy Inc.
complete community although it is noted that none of them specifically reference commercial uses or development. The policies address various elements of the Growth Management Strategy as illustrated on Schedule 1 and establish an overall urban structure for the City which includes:
• Urban Growth Centre (downtown); • Major Transit Station Area; • Intensification Corridors; • Community Mixed-use Nodes; • Built Up Areas; and • Greenfield Areas.
It is noted that these elements are not land use designations but establish a framework for growth. Each of the areas listed above are intended to allow for commercial development in some form. Community Mixed-use Nodes These areas will be planned for higher density mixed-uses including residential and employment uses, as well as a wide range of retail, service, entertainment, recreational and commercial uses that serve the local and wider community. The policies states that Community Mixed-use Nodes are intended to realize, in the long term, an urban village concept through a mix of uses in a compact urban form with a Main Street area and attractive private and public open spaces, such as urban squares. New major development will be required to demonstrate through concept plans how they meet the policies and objectives of the OP and the concept plan will include:
i) linkages between properties, buildings and uses of land both within and adjacent to the Node;
ii) identification of an appropriate location for a Main Street area;
iii) locations of new public and/or private streets and laneways;
iv) locations of open space on the site such as urban squares; iv) general massing and location of buildings that establish a
transition to the surrounding community; v) pedestrian, cycling and transit facilities; and vi) heritage attributes to be retained, conserved and/or
rehabilitated.
vlaur
Typewritten Text
16
City of Guelph Commercial Policy Review Stage 1 Commercial Analysis and Background Report
16
Macaulay Shiomi Howson Ltd Tate Economic Research Inc.
Brook McIlroy Inc.
Community Mixed-use Nodes will evolve over the Official Plan horizon and beyond through intensification and redevelopment to provide a compact built form and a mix of land uses in appropriate locations including shopping. Commercial and Mixed-Use Designations
“The Commercial and Mixed-use designations are intended to provide a range of uses to meet the needs of daily living.” The policies support the dispersal of commercial uses throughout the City and discourage strip development. “The Community Mixed-use Centres and Mixed-use Corridors are intended to develop over time into distinct areas with centralized public spaces that provide a range of uses including, retail and office uses, live/work opportunities and medium to high density residential uses.” (sec 9.4) There are five major land use categories within the commercial and mixed development designations and they are defined by their size and planning function. These designations are shown on Schedule 2 and include:
• Community Mixed-use Centre • Mixed-use Corridor • Neighbourhood Commercial Centre • Service Commercial • Mixed Office/ Commercial
Community Mixed-use Centre “The intent of the Community Mixed-use Centre designation is to create a well-defined focal point and to efficiently use the land base by grouping complementary uses in close proximity to one another providing the opportunity to satisfy several shopping and service needs at one location.” Development will be comprehensively plan and integrated with the overall Community Mixed-Use Node and in accordance with any applicable concept plans or urban design studies listed in Commercial Mixed-Use Nodes policies. The policies state that Community Mixed-use Centres are strongly encouraged to incorporate Main Street type development in strategic locations. Main Street areas, as identified through concept plans listed
17
City of Guelph Commercial Policy Review Stage 1 Commercial Analysis and Background Report
17
Macaulay Shiomi Howson Ltd Tate Economic Research Inc.
Brook McIlroy Inc.
in Commercial Mixed-Use to be planned and designed to reflect the following:
i) multi-storey buildings fronting onto the main street; ii) ground floor retail and service uses are strongly
encouraged; iii) office uses at ground floor should be limited; iv) residential uses should be provided primarily above
commercial uses in addition to some free-standing residential buildings;
v) rhythm and spacing of building entrances and appropriately sized storefronts to encourage pedestrian activity;
vi) urban squares, where appropriate; and vii) on-street parking.
Permitted uses include:
• commercial, retail and service uses; • live/work uses; • small-scale professional and medically related offices; • entertainment and recreational commercial uses; • community services and facilities; • cultural, educational and institutional uses; • hotels; • multiple unit residential; and • urban squares and open space.
Permitted uses can be mixed vertically within a building or horizontally within multiple-unit buildings or may be provided in free-standing individual buildings. Where an individual development incorporates a single use building in excess of 5,575 sq m (60,000 sq. ft.) of gross floor area there should also be opportunities for smaller scale stores that comprise at least 10 % of the total gross floor area and should create a Main Street-type environment or locate on peripheral sites within the designation, which are directly linked to the Main Street. No individual Community Mixed-use Centre will have more than 4 freestanding individual retail uses exceeding 5,575 sq m (60,000 sq. ft.) of gross floor area. Retail development will be limited to the following total gross floor area cumulatively of all buildings within the designation:
• Gordon/Clair 48,500 sq m
18
City of Guelph Commercial Policy Review Stage 1 Commercial Analysis and Background Report
18
Macaulay Shiomi Howson Ltd Tate Economic Research Inc.
Brook McIlroy Inc.
• Woodlawn/Woolwich 56,000 sq m • Paisley/Imperial 57,000 sq m • Watson Parkway/Starwood 28,000 sq m • Silvercreek Junction 22,760 sq m
The maximum height is 10 storeys. Mixed-use Corridor The intent of Mixed-use Corridor designation is to serve both the needs of residents living and working on-site, in nearby neighbourhoods and employment districts and the wider City as a whole. The designation promotes intensification and revitalization of existing well-defined commercial corridors. Where new development occurs within the corridor, adjacent lands will be integrated with one another. Development will address the adjacent arterial or collector road and will be planned and designed to:
• front multi-storey buildings onto arterial or collector roads; • provide for ground floor retail and service uses; and • provide for a rhythm and spacing of building entrances and
appropriately sized store fronts to encourage pedestrian activity.
The following Mixed-use Corridors are designated in the OP:
• Silvercreek Parkway Mixed-use Corridor; • Eramosa Mixed-use Corridor; and, • Stone Road Mixed-use Corridor.
Permitted Uses include:
• commercial, retail and service uses; • office; • entertainment and recreational commercial uses; • cultural and educational uses; • institutional uses; • hotels; • live/work; • medium and high density multiple unit residential buildings
and apartments; and • urban squares and open space.
The maximum height is 6 storeys although additional height and density may be permitted through bonus provisions.
19
City of Guelph Commercial Policy Review Stage 1 Commercial Analysis and Background Report
19
Macaulay Shiomi Howson Ltd Tate Economic Research Inc.
Brook McIlroy Inc.
The permitted uses can be mixed vertically within a building or horizontally within multiple-unit mall buildings or may be provided in free-standing individual buildings. Where an individual development incorporates a single use building in excess of 5,575 sq m (60,000 sq. ft.) of gross floor area, the site shall also be designed to provide the opportunity for smaller buildings amenable to the provision of local goods and services to be located near intersections and immediately adjacent to the street line near transit facilities. These smaller buildings shall comprise a minimum of 10% of the total gross floor area within the overall development.
Neighbourhood Commercial Centres Neighbourhood Commercial Centres are intended to primarily serve the shopping needs of residents living and working in nearby neighbourhoods and employment districts. There is a requirement that Neighbourhood Commercial Centres have a minimum distance separation from one another of 500 metres prevent the creation of "strip commercial" development comprising a series of Neighbourhood Commercial Centres. Neighbourhood Centres will not be extended or enlarged to provide more than 4,650 sq m (50,000 sq. ft.) of gross leasable floor area. Existing ‘Neighbourhood Commercial Centres’ listed below will be permitted to provide a maximum of 10,000 sq m (108,000 sq. ft.) of gross leasable floor area:
• Speedvale Avenue at Stevenson Street • Victoria Road at Grange Avenue • Victoria Road at York Street • Kortright Road at Edinburgh Road • Harvard Road at Gordon Street • Kortright Road at Gordon Street • Wellington Road at Imperial Drive
Individual retail uses are limited to a maximum gross leasable floor area of 3,250 sq m (35,000 sq. ft.) except the existing Neighbourhood Commercial Centre located at Kortright Road and Edinburgh Road will be permitted to provide an individual retail use of a maximum of 5,200 sq m (55,000 sq. ft.). New development within a Neighbourhood Commercial Centre will be integrated in terms of internal access roads,
20
City of Guelph Commercial Policy Review Stage 1 Commercial Analysis and Background Report
20
Macaulay Shiomi Howson Ltd Tate Economic Research Inc.
Brook McIlroy Inc.
entrances from public streets, access to common parking areas, open space, urban squares, grading and stormwater management systems. Applications to establish or expand a Neighbourhood Commercial Centre designation will require an OPA, will be required to:
• Have direct access to an arterial or collector road, preferably at an intersection;
• Contribute to the creation of a compact, well-defined node oriented to a major intersection;
• Be compatible with the building design and use of surrounding properties;
• Minimize the impact of traffic, noise, signs and lighting on adjacent residential areas;
• Provide for adequate parking, loading and all other required facilities; and,
• Provide adequate landscaping, screening and buffering of surrounding properties.
Permitted uses include:
• commercial, retail and service uses; • small-scale offices; • community services and facilities; • live/work; • multiple unit residential within mixed-use buildings; and • urban squares.
Vehicle sales and vehicle repair uses are not permitted. The maximum height is 6 storeys although additional height and density may be permitted through bonus provisions. Service Commercial Areas The Service Commercial Areas provide a location for highway-oriented and service commercial uses that do not normally locate within Downtown because of site area or highway exposure needs and which may include commercial uses of an intensive nature that can conflict with residential land uses. It is intended to limit the range of retail commercial uses in order to preserve the functions of the Downtown and other Commercial and Mixed –use designations. Integration between adjacent service commercial uses in terms of entrances to public streets, internal access roads etc will be
21
City of Guelph Commercial Policy Review Stage 1 Commercial Analysis and Background Report
21
Macaulay Shiomi Howson Ltd Tate Economic Research Inc.
Brook McIlroy Inc.
encouraged and development will conform to the Urban Design policies. The City promotes the retention of existing Service Commercial areas by discouraging the further establishment of new commercial strips and the conversion of lands located outside of the designated Service Commercial areas to commercial use and promoting the retention of Service Commercial designations along only one side of arterial roads in the City. Permitted Uses include:
• service commercial uses; • complementary uses such as small-scale offices, convenience
uses, institutional and commercial recreation or entertainment uses.
Complementary uses may be permitted if they do not interfere with the overall form, function and development of the specific area for service commercial purposes. Mixed Office/Commercial The designation recognizes and promotes the continued use and revitalization of areas, peripheral to the downtown, where historically a variety of small-scale commercial operations or mixed commercial-residential uses have located. New commercial, office or mixed-use development within the Mixed Office/Commercial designation will be subject to the following criteria:
• building design should have a street orientation, promote continuity in the streetscape and adhere to the Urban Design policies of this Plan;
• building, property and ancillary structures are designed to be compatible with surrounding properties in terms of form, massing, appearance and orientation;
• adequate parking, loading and access are provided; and • adequate municipal services are provided.
Permitted uses include:
• convenience commercial and small-scale retail commercial; • small-scale office; • personal service; and • detached, semi-detached, townhouses and apartments.
22
City of Guelph Commercial Policy Review Stage 1 Commercial Analysis and Background Report
22
Macaulay Shiomi Howson Ltd Tate Economic Research Inc.
Brook McIlroy Inc.
The maximum height is 4 storeys although additional height and density may be permitted through bonus provisions.
Market Impact Studies Market impact studies will be required for:
• establishing or expanding a Community Mixed-use Centre or Mixed-use Corridor beyond the designation limit boundaries;
• exceeding the retail floor area limitations within a Community mixed-use Centre or the number of large retail uses; and
• to extend or enlarge a Neighbourhood Commercial Centre to provide more than 10,000 square metres of gross floor area.
The Market Impact Study will demonstrate:
o no detriment to the overall function or economic vitality of the Downtown or key components of its overall vitality;
o achievement of the City’s Strategic, Urban Design policies and Commercial and Mixed-Use policy objectives will not be compromised;
o the ability of existing designated commercial or mixed-use lands to achieve their planned function will not be compromised.
o an assessment of the implications of the proposal relative to the City’s approved Commercial Policy Review Study and the objectives and implementing policies of the OP.
Residential Areas Convenience commercial uses up to a maximum of 300 sq m (3,200 sq. ft.) may be permitted in Residential Areas and will be encouraged to locate at neighbourhood nodes. Mixed-Use Business Permits a limited range of retail commercial uses that will be defined the Zoning By-law that do not compete with retail activities in the downtown or other planned commercial centres. Employment Designations
23
City of Guelph Commercial Policy Review Stage 1 Commercial Analysis and Background Report
23
Macaulay Shiomi Howson Ltd Tate Economic Research Inc.
Brook McIlroy Inc.
The Industrial designation permits a range of complementary uses such as corporate offices, open space and recreation facilities, restaurants, financial institutions, child care centres, public and institutional uses. The Corporate Business Park designation may include complementary uses such as restaurants, financial institutions, medical services, fitness centres, open space and recreation facilities and child care centres. Urban Design The urban design section addresses the City’s Urban Design Action Plan and provides support for growth and development of the City. Policies address public art, public views, parking, vehicle-oriented uses (including drive-throughs), signage, accessibility, lighting, and gateway areas. Policies have been included for commercial development. Parking Polices indicate that off-street parking areas and facilities will be provided through zoning and site plan requirements and cash-in-lieu of required parking may be considered. Reduced parking requirements may be considered as part of a Parking Study, particularly within Downtown, Community Mixed-Use Nodes and Intensification Corridors, or where high levels of transit exist or are planned. The City may develop zoning regulations for shared parking arrangements between multiple facilities to optimize the staggered demand for parking. The City may encourage managing the supply of parking as a Transportation Demand Management measure and may also establish maximum parking requirements in the Zoning By-law, where appropriate.
It is noted that numerical provisions in the OP are approximate, except where they refer to minimum setbacks from the Natural Heritage System. Minor variations from other numerical figures do not require an amendment to the OP where it is demonstrated that the objectives of the OP will be met.
24
City of Guelph Commercial Policy Review Stage 1 Commercial Analysis and Background Report
24
Macaulay Shiomi Howson Ltd Tate Economic Research Inc.
Brook McIlroy Inc.
2.3.2 Secondary Plans The City’s Official Plan has also been amended to incorporate two secondary plans. OPA 43 incorporated the Downtown Secondary Plan into the Official Plan to replace the land use and Central Business District policies in the Official Plan with new policies that apply to the Downtown Urban Growth Centre. OPA 54 incorporated the Guelph Innovation District Secondary Plan into the Official Plan. OPA 43 and OPA 54 are both in full force and effect.
Downtown Secondary Plan (OPA 43)
The City undertook a Downtown Secondary Plan that was adopted by Council in May 2012. It was appealed and came into full force and effect in November 2015. The new Secondary Plan was created to replace the land use and Central Business District policies in the OP with new policies that apply to the Downtown Urban Growth Centre. The Urban Growth Centre was identified in the OP as a focus for intensification and the achievement of a minimum density target of 150 people and jobs combined per hectare by 2031. The vision for Downtown Guelph is of “a distinct and vital urban centre nestled against the Speed River, comprised of beautiful buildings and public spaces, and surrounded by leafy neighbourhoods, where people live, work, shop, dine, play and celebrate.” The Plan establishes a series of principles and subsequent objectives for the downtown that include reinforcing and expanding the role of Downtown as a retail, dining and entertainment destination. The land use designations in the Downtown which permit commercial uses include: Mixed-Use 1 Areas
• Are intended to accommodate a broad range of uses in a mix of highly compact development forms.
• Permitted uses include a variety of uses and may include retail and service uses, including restaurants and personal service uses, and entertainment and commercial recreation uses.
• Certain streets are identified as active street frontage areas where retail and service uses, including restaurants and personal
25
City of Guelph Commercial Policy Review Stage 1 Commercial Analysis and Background Report
25
Macaulay Shiomi Howson Ltd Tate Economic Research Inc.
Brook McIlroy Inc.
service uses, or entertainment uses are generally required on the ground floors at the street edge.
• The width of stores and restaurants may be limited through the Zoning By-law to ensure a rhythm of commercial entrances and avoid long distances between commercial entrances.
Mixed-Use 2 Areas
• Those areas of downtown that were historically mostly residential with a mixture of housing styles but have evolved to accommodate a range of uses, many in partially or fully converted houses.
• Permitted uses include small-scale retail uses and convenience commercial; personal service uses; and live/work uses.
Residential 2 Areas
• Permits convenience commercial uses with a gross floor area not greater than 500 square metres; artisan studios; small-scale offices with a gross floor area not greater than 500 square metres including medically related uses; and live/work uses.
Drive-through facilities are discouraged from locating Downtown.
Guelph Innovation District Secondary Plan (OPA 54)
The Guelph Innovation District Secondary Plan was adopted by Council in May 2014 and came into full force and effect in August 2017. One of the objectives of this study is to consider the feasibility of second floor commercial and mixed-use buildings to support the pedestrian friendly urban visions in various locations including the Guelph Innovation District. The Guelph Innovation District (GID) is planned to be a compact, mixed-use community that straddles the Eramosa River in the City's east end. The GID will serve predominately as the home of innovative, sustainable employment uses with an adjacent urban village connecting residential and compatible employment uses. The urban village is meant to be an identifiable, pedestrian oriented space, with
26
City of Guelph Commercial Policy Review Stage 1 Commercial Analysis and Background Report
26
Macaulay Shiomi Howson Ltd Tate Economic Research Inc.
Brook McIlroy Inc.
street-related built form that supports a mix of medium and high density commercial, residential and employment uses.
• Large-format, stand-alone retail commercial uses are not permitted within the GID. Small and medium-scale retail commercial uses are encouraged within the mixed-use designations of the site to contribute to a Main Street type environment.
• Mixed-use Corridor (GID) areas include areas comprised primarily of vacant or under-used lands that are targeted for significant growth. These areas will consist of a mix of residential, commercial, live/work, institutional, office and educational uses within a highly compact form of development that will contribute to the creation of focal points and transition areas.
• Permitted commercial uses within the Mixed-use Corridor (GID) designation include: Commercial, retail and service uses; Office; Entertainment and recreational commercial uses; Cultural and educational uses; Institutional uses; Hotels; Live/work; and Medium and high density multiple unit residential buildings and apartments.
• Development within the nodes and along College Avenue East within the identified Main Street area will be compact and mixed-use with a continuous built form edge. Retail and service uses, including restaurants and personal service uses, entertainment uses or professional offices and community or social services, will generally be required on the ground floors of all buildings at the street edge.
• A Neighbourhood Commercial Centre designation is located at the southeast corner of York Road and Victoria Road South and is subject to the Neighbourhood Commercial Centre policies of the Official Plan.
• Block Plans will be developed for each of the identified Block Plan areas to specifically implement the policies of the GID Secondary Plan. The Block Plan process will establish a pattern of development consistent with land use designations and policies of the City’s Official Plan including the GID Secondary Plan.
27
City of Guelph Commercial Policy Review Stage 1 Commercial Analysis and Background Report
27
Macaulay Shiomi Howson Ltd Tate Economic Research Inc.
Brook McIlroy Inc.
2.3.3 Official Plan Summary In summary, Guelph’s Official Plan policies as they relate to commercial development have evolved to focus on mixed-use nodes and corridors that include main street experiences. The policies recognize that the evolution to achieve the desired built form will occur over the life of the Official Plan and beyond and has provided guidance for that evolution. The policies also recognize the importance of the Downtown as a multi-purpose Growth Centre that is a retail, dining and entertainment destination.
2.4 Other Municipal Commercial Policy Approaches
As noted above, all Official Plans are required to be consistent with the PPS and within the Greater Golden Horseshoe (GGH) they must conform with the Growth Plan. As a result, all municipalities have addressed the move towards mixed-use, transit supportive development that is focused on nodes and corridors to various degrees. It is being recognized that the postwar patterns of suburban development with segregated land uses that are auto-dominant have led to unhealthy living habits. An evolution towards greater transit utilization and active transportation modes will be better for the environment and improve the citizen’s health. The evolution from the traditional retail centres, which are often single storey buildings with large expanses of surface parking, towards mixed-use centres or corridors also allows for higher density development that assists with meeting the provincially required intensification and density targets in the Growth Plan. Centres and corridors also help to create a more pedestrian friendly and transit supportive streetscape. Policies and approaches in a number of municipalities in the GGH have therefore been reviewed to examine how they have addressed the current provincial policy context. The municipalities reviewed included Richmond Hill, Vaughan, Markham, Mississauga, and Hamilton3. A
3 It is noted that Markham’s new Official Plan has been approved by the Region but appealed to the OMB. Parts of it have been approved by the OMB but is not yet fully in effect.
28
City of Guelph Commercial Policy Review Stage 1 Commercial Analysis and Background Report
28
Macaulay Shiomi Howson Ltd Tate Economic Research Inc.
Brook McIlroy Inc.
more detailed discussion of policies from each of these municipalities is found in Appendix A. The municipalities that were reviewed vary in their approach to retail development. Richmond Hill, Vaughan, Markham and Mississauga have removed the traditional retail hierarchies where the retail centres are identified by their size and function. Hamilton has eliminated its retail hierarchy but still recognizes regional centres with large anchors providing higher order goods serving a large catchment area and Markham has retained one commercial designation to recognize existing or approved large-format retail development in employment areas. Richmond Hill, Vaughan and Markham have adopted a mixed-use approach, which includes ground floor retail either in older main street areas or as part of new stand-alone buildings. They also encourage the intensification of traditional retail centres with new buildings located in close proximity to the street that provide additional functions such as office or residential. In Richmond Hill, new major retail development is only permitted where it can be demonstrated that the use is to be integrated into the base of buildings as part of mixed-use, transit-oriented development and in Markham no additional lands will be designated Commercial. Richmond Hill, Vaughan, and Markham incorporate small neighbourhood or convenience uses that provide daily and weekly needs into mixed-use or local central areas that are pedestrian friendly. Retail uses are an important component of complete communities, and particularly in greenfield circumstances Vaughan has identified the need to have local commercial uses within walking distance of most residents. Just like Guelph does, Hamilton and Richmond Hill permit small scale retail and service commercial uses within neighbourhood designations that serve the residential area. While creating complete communities is an important goal, it is important to ensure that the local serving retail uses have a sufficient consumer base to ensure their long term success. Small scale retail space that does not have sufficient pass by traffic can result in either high turnover rates or the establishment of retail that is limited to convenience and personal services uses.
29
City of Guelph Commercial Policy Review Stage 1 Commercial Analysis and Background Report
29
Macaulay Shiomi Howson Ltd Tate Economic Research Inc.
Brook McIlroy Inc.
The size of the stores can also impact the walkability and attractiveness of commercial areas and this is particularly true in mixed-uses areas. Some municipalities such as Markham, Vaughan and Hamilton are limiting the size of the retail store floor plates within mixed-use areas to encourage a more human scale. Others such as Richmond Hill and Vaughan have limited the number of free standing buildings on a site or require that smaller scale uses represent a certain proportion of the site development. Again, Guelph has already incorporated these approaches into their policies. Major retail uses were not permitted within the employment area in any of the municipalities that were reviewed although most permitted ancillary retail uses that serve the employment area subject to restrictions on size. Municipalities such as Mississauga and Vaughan are restricting or discouraging drive-through uses in centres and mixed-use areas in order to facilitate more pedestrian friendly streetscapes. Guelph examined the issue of drive through uses as part of OPA 48 and does not prohibit them but has added urban design policies to address them and discourages them in the Downtown. Lessons for Guelph All of the municipalities that were reviewed have changed the majority of their land use designation nomenclature dealing with retail. This is consistent with the approach that Guelph has taken and facilitates a different mindset in addressing retail development. The advantage of a mixed-use policy framework is that it clearly identifies the type of built form character and the function that the City wants to achieve. Rather than being a stand-alone use, commercial uses become an important component of sustainable complete communities built on an urban structure of nodes and corridors that are transit supportive and pedestrian friendly. Markham recognizes that it will take time for lands that are now designated mixed-use to transform from a strictly retail form of development to a truly mixed-use node. The policies state that transformation will take place gradually in phases over a number of years and will be based on a set of guiding principles in order to create neighbourhoods where people can shop, live and work with close
30
City of Guelph Commercial Policy Review Stage 1 Commercial Analysis and Background Report
30
Macaulay Shiomi Howson Ltd Tate Economic Research Inc.
Brook McIlroy Inc.
proximity relying on active transportation. Guelph’s OPA 48 has added a requirement for a concept plan to be prepared for Community Mixed-Use Centres which will assist in addressing how the uses can be phased or evolve over time to provide flexibility to the development of the site. Both Markham and Vaughan’s Official Plans contain a series of mixed-use categories that include: Mixed-Use Low Rise, Mixed-Use Mid Rise, and Mixed-Use High Rise. Markham also adds Mixed-Use Office Priority and Mixed-Use Heritage Main Street categories and Vaughan has Community Commercial Mixed-use and Employment Area Mixed-Use. These categories reflect the scale of development that is permitted by addressing both the amount of non-residential space allowed and the height of the building which is similar to the approach used in Guelph. Although Guelph has transitioned to Mixed-Use Centres and Corridors, it has retained the Neighbourhood Commercial Centre and Service Commercial designations. This is similar to some of the municipalities reviewed that have developed mixed-use categories but retained certain retail categories. The Neighbourhood Commercial Centre designation permits residential uses but does not require them over the long term as is the case for Mixed-use Nodes and Corridors. Given the smaller size of these sites (one retail use may have a maximum of 3250 sq m) and their function to serve more local areas, which often includes grocery stores, maintaining the current policy framework for these size of centres may continue to be appropriate but including them within the mixed-use hierarchy should also be considered during Stage 2 of the study.
31
City of Guelph Commercial Policy Review Stage 1 Commercial Analysis and Background Report
31
Macaulay Shiomi Howson Ltd Tate Economic Research Inc.
Brook McIlroy Inc.
3 Retail Trends The retail sector is dynamic and constantly changing in response to the marketplace. From a demand perspective, E-commerce, including changes in the way consumers are shopping and where they are shopping, socio-economic conditions, diversifying lifestyle patterns and evolving population and household demographics are some of the many factors that are influencing Canadian retailing. From a supply perspective, Provincial policies and the tightening of land supply is resulting in a significant change to retail built form. This section of the report addresses general retail trends and their implications for retail development in Guelph.
3.1 Planning Policy As discussed in section 2, provincial and municipal policies have been evolving and are beginning to significantly impact the retail environment. Smart growth principles, coupled with the market realities of a decreasing supply of developable land and increasing infrastructure costs are resulting in more compact urban and suburban communities. Policies reflecting smart growth principles such as mixed land uses, the creation of walkable communities, the provision of alternative transportation options and increased densities are resulting in changes to the retail built form in terms of more compact retail developments. One of the results of the public policy is a levelling or flattening of the retail hierarchy. Most of the retail nodes perform a mixed convenience / specialty function. This flattening of the retail hierarchy is due in part by the blurring of retail channels as well as the move towards mixed-use developments. As an example, several regional malls are including more local serving uses such as supermarkets which traditionally have been found in neighbourhood and community serving centres. 3.2 Consumer Preferences In terms of consumer preferences, there are many key trends that influence retailing and the retail real estate development industry. In a city as diverse as Guelph, many of these consumer preferences conflict with each other: Price and convenience: Consumers are becoming more price conscious. More households are placing a greater emphasis on value retailing. The price of the product or service is often noted as the most important determinant of where people shopped.
32
City of Guelph Commercial Policy Review Stage 1 Commercial Analysis and Background Report
32
Macaulay Shiomi Howson Ltd Tate Economic Research Inc.
Brook McIlroy Inc.
Quality and service: There is a divergent trend relating to shopper preferences. Consumers do not necessarily want more selection / choice or one-stop shopping; they want a curated and solution-oriented choice of retailers to suit their needs. On the other hand, time pressed consumers are often seeking one-stop shopping for convenience oriented merchandise such as grocery and health products. Experiential retail / services: E-commerce, while only a small part of the overall retail economy, plays a significant role in consumers’ shopping patterns. Transactional shopping purchases are being made on-line, when it’s convenient to the shopper. Therefore, when a consumer goes shopping, the expectation is for an “experience” that cannot be replicated on-line. This experience may be fulfilled through unique offerings at retailers or through the physical design of centres. Increased services: Consumers are buying more services compared to retail merchandise goods, including food services. Many retailers offer services as part of their complete package.
3.3 Evolution of Retail Formats The majority of retail development in Canada over the past 25 years has either been in the form of grocery-anchored neighbourhood centres or power centres. Both forms of developments have typically been single storey developments with a building to land coverage of approximately 25%. This development format reflected the supply of commercial designated land, which in the past has typically been abundant. In urban centres, where commercial supply is diminishing and denser residential development is occurring, there has been a gradual shift towards urban intensification and compact mixed-use commercial developments. This shift is a result of the tightening of land supply and has forced developers to examine different concepts. Some of these development options are outlined below.
3.3.1 Mixed-Use Mixed-Use developments are at the forefront of urban development. At its most basic description, mixed-use developments comprise different land uses within a vertical or horizontal plan. As an example, a vertical mixed-use building could include retail on the ground level and office, hotel or residential uses in the floors above. Vertical mixed-use is typically located in urban centres and around transit nodes.
33
City of Guelph Commercial Policy Review Stage 1 Commercial Analysis and Background Report
33
Macaulay Shiomi Howson Ltd Tate Economic Research Inc.
Brook McIlroy Inc.
From a retailer perspective, there are several challenges associated with vertical mixed-use formats such as potential second floor locations, multi-floor retail units, parking and loading restrictions as well as accessibility considerations. Generally, Canadian retailers have yet to fully embrace the challenges. Horizontal mixed-use typically refers to the mix of uses on a master planned site versus in individual buildings. It should be noted that mixed-use developments may not be appropriate in all areas. There are several issues relating to this type of development, including conflict between residential and commercial units, physical format issues and accessibility. Furthermore, successful mixed-use developments typically require high levels of pedestrian traffic and therefore can be a challenge in suburban locations.
3.3.2 Urban Retail Intensification Although the City of Guelph has undeveloped commercial land options, most of the sites are less than four acres in size and therefore future development could be restricted to smaller local convenience plazas or single use developments. In dense urban environments, a constrained supply of undeveloped commercial land would most likely result in intensification; however, in Guelph, the current population density may not be sufficient to support intensification opportunities in all locations. The underlying principle of retail development, “location, location, location” continues as the primary factor behind urban retail intensification. The success of shopping centres / retail nodes is driven by location and therefore, consumer accessibility. Existing retail locations that offer the best access, visibility and exposure characteristics, remain the most valuable for shopping centres / retail nodes in general, and for intensification opportunities in particular. As population densities increase and Transportation Demand Management (TDM) initiatives including public transit infrastructure are realized, the emphasis on catering to the automobile-oriented customer will be diminished for some shopping formats. The potential for intensification is related to accessibility in the form of roads, transit or nearby residential / employment populations. Ultimately, intensification is a direct result of land economics. Increased customer accessibility leads to the potential to achieve greater investment returns through more efficient land uses. Accessibility, in the forms outlined above, provides incentive for intensification of shopping centre sites and other sites within retail nodes. It should be noted that urban intensification can also lead to the reduction of retail space as retail space is replaced with high density residential. This
34
City of Guelph Commercial Policy Review Stage 1 Commercial Analysis and Background Report
34
Macaulay Shiomi Howson Ltd Tate Economic Research Inc.
Brook McIlroy Inc.
reduction is particularly evident in the redevelopment of older retail strip plazas.
3.4 Retailer Initiatives There are several retail trends that have implications on the tenanting of retail developments. Some of these trends are briefly discussed below. Blurring of Retail Channels In the past, most retailers tended to concentrate on one line of merchandise. For example, grocery stores focused on food and drug stores focused on health-related products. Recent changes in retailing have resulted in a tendency to create a 'one-stop’ shopping experience to increase market share. Many retailers, which previously offered specific product lines, now offer a much wider range of merchandise. These retailers include Shoppers Drug Mart, Walmart Supercentre, Canadian Tire and Winners, as well as many others. The impact in terms of retail development is that there are fewer retail tenants available to anchor these centres. Consolidation Many major Canadian chains have increased their scale through acquisitions. Examples include:
• Canadian Tire Limited $0.8 billion acquisition of the Forzani Group; • Sobeys Inc. $5.8 billion purchase of Canada Safeway Inc.; • Leons Furniture Ltd. $0.7 billion purchase of The Brick Ltd.; • Loblaw Companies Limited $12.4 billion purchase of Shoppers Drug
Mart Corporation; and, • Lowe’s Companies Inc. $3.2 billion purchase of Rona Inc.
The Centre for the Study of Commercial Activity (CSCA) at Ryerson University has noted that the top three retail organizations account for more than 25% of all retail sales in Canada. These acquisitions, which have resulted in such large retail companies, may result in limited demand for new retail locations, as retailers may choose to serve a broader market from fewer locations offering a wider range of merchandise. Category Killers Commentary regarding store closures in chains such as Best Buy / Future Shop and Staples has indicated that closures are due, at least partially, to the influence of e-commerce. However, it is noted that, in many cases,

35
City of Guelph Commercial Policy Review Stage 1 Commercial Analysis and Background Report
35
Macaulay Shiomi Howson Ltd Tate Economic Research Inc.
Brook McIlroy Inc.
these closures are instead indicative of the evolutionary process of streamlining these business models. These types of mid-box retailers will continue to operate in the Canadian marketplace. The best retailing locations in the largest markets will continue to be served by larger format retailing venues providing greater product selection, more customization options, showrooming, on-site pick up and interactive service. Foreign Retailers in Canada The Canadian marketplace has a long history of 'foreign' retailers operating in Canada, particularly from the United States. The relative stability of the Canadian marketplace in recent years has made Canada one of the more attractive locations for the expansion plans of various major international retailers including Marshall's, Lowe's, Zara, H&M, J. Crew, Muji, Uniqlo, Restoration Hardware and Crate & Barrel. The CSCA identified that approximately 150 new retail chains have opened in Canada since 2005. The expansion of these retailers continues to drive demand for retail space. High Fashion / Department Stores There have been several new entrants in the high fashion / department store arena. Nordstrom has opened stores in Calgary, Ottawa and Toronto. In addition, Nordstrom has announced it plans to open 12 to 15 of its discount chain stores, Nordstrom Rack, in Canada. In July 2013, HBC purchased Saks Inc. Two Saks Fifth Avenue locations have opened in Toronto. In addition, HBC has also committed to several Saks Off Fifth outlets in Canada. In terms of Canadian stores, Simons, Holt Renfrew and Harry Rosen continue to expand and renovate stores. Other US department store chains that have shown interest in the Canadian market include JC Penny, Kohl's and Bloomingdales. However, given Target’s exit from Canada in 2015, and the recent announcement of Sears closing, these department stores may no longer be as aggressive with their Canadian expansion plans. Experiential Retail Perhaps the most influential trend shaping physical tenancies is experiential retail. Retailers and service providers are recognizing that transactional shopping is moving on-line and therefore there is a shift to provide a more interactive shopping experience in physical stores. This has resulted in
36
City of Guelph Commercial Policy Review Stage 1 Commercial Analysis and Background Report
36
Macaulay Shiomi Howson Ltd Tate Economic Research Inc.
Brook McIlroy Inc.
brands opening their own stores. Examples include Microsoft, Samsung, Dyson and Breitling. There is also a marked shift towards health and wellness retail and service tenants. Micro fitness boutiques such as Orange Theory Fitness, Soul Cycle and Barry’s Bootcamp are all opening multiple locations in Canada.
3.5 E-Commerce In the retail real estate environment, the impact of E-commerce (on-line shopping) on existing retail nodes and the future demand for retail space is perhaps the most discussed topic. The impact of E-commerce is also often overstated, in part due to the lack of reliable data available in Canada. Recent changes at Statistics Canada has resulted in the timely release of accurate data relating to the Canadian market. The purpose of this section is to provide an overview of the magnitude of e-commerce, the direction of the industry and its potential impacts on the demand for future retail space. E-commerce includes the following three areas:
1) Pure Play – These are E-commerce operations that do not have physical stores, examples include eBay and Wayfair.
2) Multi-Channel – This is the precursor to Omni-Channel retailing. Multi-Channel retailing is where retailers sell goods through their physical stores, through separate E-commerce sites and other avenues such as pop-up stores. Each channel operates as a single entity with little to no coordination between the channels often affecting the customer experience with the overall brand.
3) Omni-Channel – This is the evolution of multi-channel retail where retail stores are integrated into the E-commerce experience. This experience is best described as:
“With an omni-channel retail platform, online or e-commerce sales are no longer viewed as a threat to physical stores. However, there must be recognition that the role of the store has now changed. It is no longer just a point of sale but also a fulfillment centre, a showroom for experiencing the products, and a strong branding mechanism. In
37
City of Guelph Commercial Policy Review Stage 1 Commercial Analysis and Background Report
37
Macaulay Shiomi Howson Ltd Tate Economic Research Inc.
Brook McIlroy Inc.
addition, a well-presented store provides a difficult to quantify “halo” effect that enhances the image of the retailer in its trade area.”4 “The term “omni-channel” recognizes that online and store consumers are not separate cohorts, that consumers shop symbiotically across all channels. Omni-channel retail is focused on the customer—one customer—whose needs must be met in the right way, at the right time, with the right offer at the right price, in the right place. Omni-channel has liberated time and place for the consumer—and the right approach varies not only with different consumers, but also with time, mood and consumption purpose. It is more complex now, because the consumer has more control. The liberation of time and place also extends the consumer shopping journey pre- and post-visit to a store. The transaction no longer must take place in the store, but that does not necessarily diminish the role that the store plays in crafting sales. Indeed, its role as a point of differentiation—be that ambience, staging or great customer service—has increased. The multi-faceted role of the store is not new.”5
With the realization that the customer wants the omni-channel experience, pure play internet retailers are recognizing the importance of physical stores (clicks-to-bricks). Examples of pure play internet retailers opening physical stores include Warby Parker (optical) and clothing stores such as Frank + Oak and Indochino. In addition to omni-channel benefits, technology is also being used to enhance the physical store experience. Amazon announced the physical grocery store known as Amazon Go. Using “just walk out” technology, shoppers can simply pick up items and walk out of the store with no requirement for check-outs and automatic billing through their Amazon account. Amazon is planning up to 2,000 Amazon Go stores. It is unclear if there are plans to open these stores in Canada. In Canada, on-line shopping still represents a small share of overall retail trade, E-commerce accounts for approximately 2.0% of all retail trade in 2015 up from 1.4% in 2011. This figure includes pure play, multi-channel and omni-channel sales.
4 ICSC Retail Property Insights Vol. 23, No.1, 2016, “Liberation of Time and Place” for the Consumer: Recent Omni-Channel Trends. 5 Op. Cit.
38
City of Guelph Commercial Policy Review Stage 1 Commercial Analysis and Background Report
38
Macaulay Shiomi Howson Ltd Tate Economic Research Inc.
Brook McIlroy Inc.
4 Stakeholder Input and Consumer Research
Several background research tasks were completed as part of this Stage 1 report. These research tasks are detailed below:
• Stakeholder input – interviews were held with key stakeholders to determine their views on commercial development trends and policies in the City.
• Customer draw survey results – surveys were undertaken at 5 locations throughout Guelph, involving the recording of licence plates from 2,250 vehicles. The results of the licence plate surveys were used as a proxy of the customer draw of the various retail nodes in the City.
• In-home consumer telephone survey – a telephone survey of 400 randomly selected households in the City of Guelph was conducted to establish the distribution of expenditures which was used as input into the commercial land needs analysis.
The following sections summarize the findings of each individual research tasks.
4.1 Stakeholder Input Interviews were held with key stakeholders to determine their views on current and future commercial development trends in the City, their experience with commercial development in Guelph and implications with respect to policy and regulatory directions. The interviews were conducted on the basis of anonymity for all respondents and the respondents included landowners, developers and representatives of the Downtown Business Improvement Area. The interviews were guided by a list of questions prepared by the consulting team with input from City staff. The questions were provided to the respondents in advance. The following points summarize the major themes of the stakeholder interviews. Greater detail, including the questions provided to the respondents, is included in Appendix B. East End Development Opportunity – The consensus seemed to be that there is demand for additional retail development, particularly grocery related retail, in eastern Guelph. There is interest from more than one supermarket chain to be operating a store in east Guelph, however, there are some concerns relating to the suitability of the designated site at Watson / Starwood as the most appropriate location for retail or mixed-use
39
City of Guelph Commercial Policy Review Stage 1 Commercial Analysis and Background Report
39
Macaulay Shiomi Howson Ltd Tate Economic Research Inc.
Brook McIlroy Inc.
development. Stakeholders suggested that York Road may be a better location for development planned at a more intense scale. Limited Development Opportunities Available – Stakeholders noted that, aside from the Paisley / Imperial Mixed-use Node (Armel), the Silvercreek Junction Mixed-use Node (Silvercreek) and the Starwood / Watson Mixed-use Node (Loblaws/Choice REIT), there are few, if any, sites suitable for midsized or larger commercial developments. There are limited opportunities for additional grocery anchored retail centres in Guelph. E-Commerce Impacts – All stakeholders commented on the influence of e-commerce on retailers and the development industry. In particular, its impact on big-box development was noted, in that there are few opportunities for big-box retail development in Guelph, or elsewhere. Stakeholders noted the changes in the retail industry that are occurring as a result of e-commerce such as less demand for retail space overall, a decline in mid price fashion and a change in formats to reflect smaller individual stores. Opportunities – In a general sense, it was noted that there are greater opportunities for retail development in the areas not directly impacted by e-commerce. These include restaurants, fitness, health and wellness. Specifically, in Guelph, there are opportunities for grocery, home improvement and furniture. Planning Department –The stakeholder group raised concerns with the planning department’s understanding of economic viability and tenant requirements. Overall, if the City wants to encourage retail development, it must ensure flexibility in development requirements and the right mix of land supply. Economic Challenge of Mixed-Use – The challenge of attracting tenants to mixed-use projects was noted. It was stated that mixed-use development will not be successful everywhere in Guelph. However, generally, it was stated that there may be an opportunity for mixed-use development in the downtown.
4.2 Customer Draw Survey Results Licence plate surveys are commonly employed to determine the customer draw of a single retail location, retail shopping plaza/centre, or community. Typically, the results are used as one of the inputs into the delineation of a Study Area as well as to provide estimates of the portion of customers who reside beyond the Study Area, known as inflow.
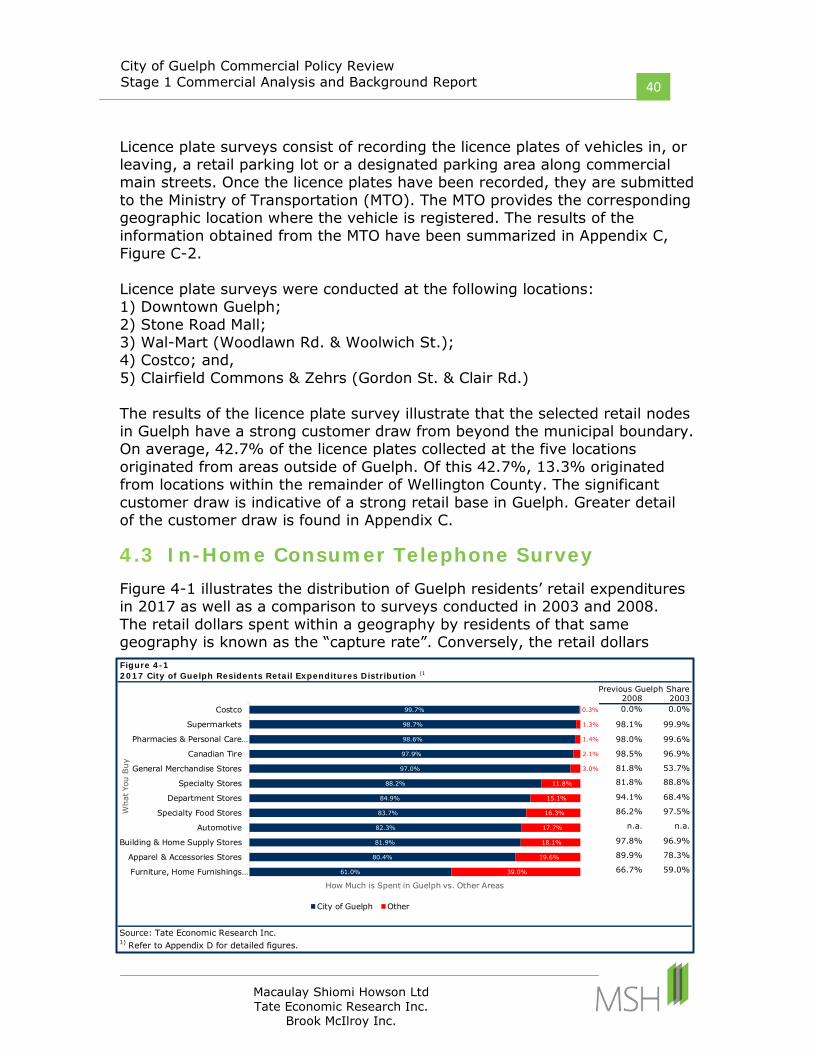
40
City of Guelph Commercial Policy Review Stage 1 Commercial Analysis and Background Report
40
Macaulay Shiomi Howson Ltd Tate Economic Research Inc.
Brook McIlroy Inc.
Licence plate surveys consist of recording the licence plates of vehicles in, or leaving, a retail parking lot or a designated parking area along commercial main streets. Once the licence plates have been recorded, they are submitted to the Ministry of Transportation (MTO). The MTO provides the corresponding geographic location where the vehicle is registered. The results of the information obtained from the MTO have been summarized in Appendix C, Figure C-2. Licence plate surveys were conducted at the following locations: 1) Downtown Guelph; 2) Stone Road Mall; 3) Wal-Mart (Woodlawn Rd. & Woolwich St.); 4) Costco; and, 5) Clairfield Commons & Zehrs (Gordon St. & Clair Rd.) The results of the licence plate survey illustrate that the selected retail nodes in Guelph have a strong customer draw from beyond the municipal boundary. On average, 42.7% of the licence plates collected at the five locations originated from areas outside of Guelph. Of this 42.7%, 13.3% originated from locations within the remainder of Wellington County. The significant customer draw is indicative of a strong retail base in Guelph. Greater detail of the customer draw is found in Appendix C.
4.3 In-Home Consumer Telephone Survey Figure 4-1 illustrates the distribution of Guelph residents’ retail expenditures in 2017 as well as a comparison to surveys conducted in 2003 and 2008. The retail dollars spent within a geography by residents of that same geography is known as the “capture rate”. Conversely, the retail dollars Figure 4-12017 City of Guelph Residents Retail Expenditures Distribution (1
2008 20030.0% 0.0%
98.1% 99.9%
98.0% 99.6%
98.5% 96.9%
81.8% 53.7%
81.8% 88.8%
94.1% 68.4%
86.2% 97.5%
n.a. n.a.
97.8% 96.9%
89.9% 78.3%
66.7% 59.0%
Source: Tate Economic Research Inc.1) Refer to Appendix D for detailed figures.
Previous Guelph Share
61.0%
80.4%
81.9%
82.3%
83.7%
84.9%
88.2%
97.0%
97.9%
98.6%
98.7%
99.7%
39.0%
19.6%
18.1%
17.7%
16.3%
15.1%
11.8%
3.0%
2.1%
1.4%
1.3%
0.3%
Furniture, Home Furnishings…
Apparel & Accessories Stores
Building & Home Supply Stores
Automotive
Specialty Food Stores
Department Stores
Specialty Stores
General Merchandise Stores
Canadian Tire
Pharmacies & Personal Care…
Supermarkets
Costco
How Much is Spent in Guelph vs. Other Areas
Wha
t You
Buy
City of Guelph Other
41
City of Guelph Commercial Policy Review Stage 1 Commercial Analysis and Background Report
41
Macaulay Shiomi Howson Ltd Tate Economic Research Inc.
Brook McIlroy Inc.
spent at locations outside the geographic boundary is known as “leakage”. Except for the Furniture, Home Furnishing & Electronics category, Guelph residents spend 80% or more of their retail dollars at stores in Guelph. The high capture rate is reflected in the telephone survey results from 2003 and 2008. The leakage of expenditures to surrounding municipalities is typical based on expenditures made while traveling or working outside of the municipality. The low capture rate for the Furniture, Furniture, Home Furnishing & Electronics category is also typical, given that many of these expenditures are “big ticket” items such as appliances, and shoppers tend to comparison shop across a wide range of retailers in the surrounding municipalities. The overall high capture rate is an indication that the retail offering in Guelph is comprehensive and the relative attractiveness of Guelph as a shopping destination has not diminished as new retail nodes are developed in surrounding municipalities, such as Kitchener / Waterloo and Milton.
42
City of Guelph Commercial Policy Review Stage 1 Commercial Analysis and Background Report
42
Macaulay Shiomi Howson Ltd Tate Economic Research Inc.
Brook McIlroy Inc.
5 Commercial Inventory The demand for retail and service space in Guelph will be influenced by the demand produced by the City and surrounding region residents, as well as the current and proposed supply of retail and service space. This section of the report examines the existing and planned supply of retail space. Section 6 of this report assesses the demand generated by the existing and projected population.
5.1 Retail Tenant Typology Retail developments or nodes typically contain two types of tenants: 1) Specialty / Destination retailers; and, 2) Convenience / Local retailers. Each type of tenant, and the goods and services provided by them, have a different function within the market. Specialty / Destination Retailers and Service Providers • Destination retailers provide “higher order” goods and services. These
goods and services are typically purchased infrequently. These retailers draw shoppers from a larger trade area or, conversely, shoppers are willing to travel longer distances to shop at these stores. Specialty / destination retailers are often located in regional centres, which are smaller in number and spaced further apart.
• Generally, destination retailers sell comparison goods, which are products that consumers often compare prices and other attributes on before making their purchase decision (i.e. appliances, cars and clothing). Typically, retailers of comparison goods tend to locate near one another such as shopping malls and / or factory outlet centres for clothing or automotive parks for cars.
• Destination services such as doctors, travel agents, etc. are similar in
function to destination retailers. Restaurants, depending on the type, can also act as destination services and attract customers from a wide area.
Convenience / Local Retailers and Service Providers • Convenience retailers provide “lower order” goods and services. These
goods and services are typically purchased frequently and are more
43
City of Guelph Commercial Policy Review Stage 1 Commercial Analysis and Background Report
43
Macaulay Shiomi Howson Ltd Tate Economic Research Inc.
Brook McIlroy Inc.
common in nature. Generally, from a retail supply perspective, convenience / local retailers are in neighbourhood and community sized centres, are more common in number and are near residential population for ease of access.
• Supermarkets and pharmacies are typically considered convenience retailers. There are many services, such as fast food or sit-down restaurants, hair dressers and banks, that are also considered convenience services. These retailers and services typically have local trade areas and serve the local population on a frequent basis.
5.2 Guelph Existing Commercial Space The inventory of retail space within the City of Guelph is based on fieldwork carried out by Tate Economic Research Inc. (TER) in June and July 2017. TER identified 13 commercial nodes within Guelph. These nodes are based on City of Guelph Official Plan land-use designations (Schedule 2), as well as previous work completed by TER. The 13 nodes are indicated in Figure 5-1 on the following page and summarized in Figure 5-2.
5.3 Summary of Commercial Space: City of Guelph Retail Nodes
The following section provides a brief description of the 13 commercial nodes outlined by TER. Node 1: Downtown Guelph Downtown Guelph is the largest commercial area within the City of Guelph. This node includes 1.6 million square feet (18.5%) of all commercial space within the City.
• Commercial activity within Downtown Guelph is predominantly located in the ground floor of mixed-use buildings on main streets such as Wyndham Street North and Macdonell Street;
• In addition to ground floor commercial units, a significant portion of commercial space is contained in the Old Quebec Street Mall, a two-storey enclosed shopping mall on Wyndham Street North;
• Most of the commercial space on the periphery of Downtown, along Wellington Street East, is in the form of one storey free standing buildings and strip plazas;
• Excluding vacancy, Downtown Guelph is composed of approximately 79.8% service space, and 22.2% retail space;
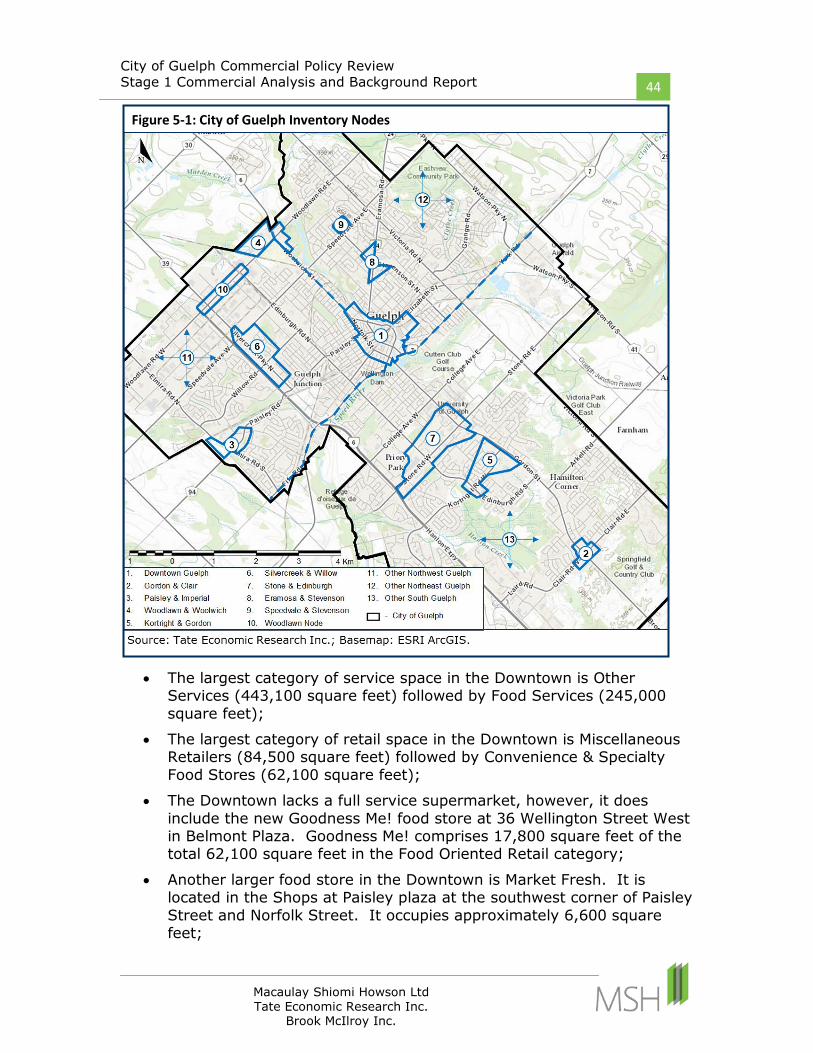
44
City of Guelph Commercial Policy Review Stage 1 Commercial Analysis and Background Report
44
Macaulay Shiomi Howson Ltd Tate Economic Research Inc.
Brook McIlroy Inc.
• The largest category of service space in the Downtown is Other Services (443,100 square feet) followed by Food Services (245,000 square feet);
• The largest category of retail space in the Downtown is Miscellaneous Retailers (84,500 square feet) followed by Convenience & Specialty Food Stores (62,100 square feet);
• The Downtown lacks a full service supermarket, however, it does include the new Goodness Me! food store at 36 Wellington Street West in Belmont Plaza. Goodness Me! comprises 17,800 square feet of the total 62,100 square feet in the Food Oriented Retail category;
• Another larger food store in the Downtown is Market Fresh. It is located in the Shops at Paisley plaza at the southwest corner of Paisley Street and Norfolk Street. It occupies approximately 6,600 square feet;
Figure 5-1: City of Guelph Inventory Nodes
45
City of Guelph Commercial Policy Review Stage 1 Commercial Analysis and Background Report
45
Figure 5-2
Downtown Guelph
Gordon & Clair
Paisley & Imperial
Woodlawn & Woolwich
Kortright & Gordon
Silvercreek & Willow
Stone & Edinburgh
Eramosa & Stevenson
Speedvale & Stevenson
Woodlawn Node
Other Northwest
Guelph
Other Northeast
GuelphOther South
GuelphTOTAL
CITY OF GUELPHPercent
DistributionNodes 1 2 3 4 5 6 7 8 9 10 11 12 13 1-13
Retail Food Oriented Retail (FOR)
Supermarkets 0 75,700 100,000 0 58,500 76,300 77,300 107,900 32,100 0 0 0 0 527,800 6.2%Convenience & Specialty Food Stores 62,100 7,200 4,300 6,100 13,400 22,300 16,100 1,800 7,000 3,800 49,100 44,300 18,400 255,900 3.0%
Subtotal Food Oriented Retail (FOR) 62,100 82,900 104,300 6,100 71,900 98,600 93,400 109,700 39,100 3,800 49,100 44,300 18,400 783,700 9.3%
Non Food Oriented Retail (NFOR)Department Stores 0 0 0 173,000 0 0 237,700 0 0 0 0 0 0 410,700 4.9%General Merchandise 0 9,600 153,000 66,000 6,500 36,900 102,000 7,800 10,200 0 5,500 7,600 45,000 450,100 5.3%Clothing, Shoes & Accessories 51,400 0 2,100 38,000 2,700 47,400 192,300 0 0 0 11,500 8,100 0 353,500 4.2%Furniture, Home Furnishings & Electronics 33,800 22,500 0 44,900 1,400 96,800 61,800 0 0 56,500 133,200 47,200 56,900 555,000 6.6%Pharmacies & Personal Care Stores 30,500 25,300 1,400 4,300 5,200 23,900 49,100 33,200 4,200 1,500 21,700 7,600 19,400 227,300 2.7%Building & Outdoor Home Supplies 0 800 0 90,100 11,300 3,900 4,200 0 0 29,500 163,000 20,600 41,100 364,500 4.3%Miscellaneous Retailers 84,500 6,000 4,100 59,300 9,000 76,000 113,300 5,400 1,600 14,400 98,800 31,600 59,400 563,400 6.7%Automotive 5,200 0 0 0 0 6,000 0 600 0 0 21,300 17,500 0 50,600 0.6%
Subtotal Non Food Oriented Retail (NFOR) 205,400 64,200 160,600 475,600 36,100 290,900 760,400 47,000 16,000 101,900 455,000 140,200 221,800 2,975,100 35.2%
Other RetailBeer, Wine & Liquor 10,100 17,200 11,000 0 0 5,400 13,000 0 11,900 0 16,900 3,100 6,000 94,600 1.1%
Subtotal Retail Space 277,600 164,300 275,900 481,700 108,000 394,900 866,800 156,700 67,000 105,700 521,000 187,600 246,200 3,853,400 45.6%
Service SpaceFood Services 245,000 63,100 9,100 29,900 20,800 30,100 121,200 15,100 10,100 45,300 105,100 52,200 78,800 825,800 9.8%Personal Services 66,900 11,300 3,900 5,700 11,800 10,500 17,100 8,400 5,100 0 33,300 21,900 18,700 214,600 2.5%Financial & Real Estate Services 103,200 32,400 16,000 22,200 18,000 14,000 32,400 7,700 6,200 10,500 102,500 35,700 52,800 453,600 5.4%Medical, Dental, Health & Legal Services 241,500 60,500 3,200 9,800 25,700 31,300 104,800 32,500 10,200 6,800 246,400 143,800 157,700 1,074,200 12.7%Other Services 443,100 46,400 2,300 9,700 8,700 34,900 46,300 24,000 5,000 105,900 358,200 130,800 181,800 1,397,100 16.5%
Subtotal Service Space 1,099,700 213,700 34,500 77,300 85,000 120,800 321,800 87,700 36,600 168,500 845,500 384,400 489,800 3,965,300 46.9%Total Occupied Commercial Space 1,377,300 378,000 310,400 559,000 193,000 515,700 1,188,600 244,400 103,600 274,200 1,366,500 572,000 736,000 7,818,700 92.5%
Vacant 187,800 7,600 17,500 6,400 6,900 61,800 88,200 0 12,300 26,800 134,500 33,700 48,800 632,300 7.5%Vacancy Rate (%) 12.0% 2.0% 5.3% 1.1% 3.5% 10.7% 6.9% 0.0% 10.6% 8.9% 9.0% 5.6% 6.2% 7.5%Total Commercial Space 1,565,100 385,600 327,900 565,400 199,900 577,500 1,276,800 244,400 115,900 301,000 1,501,000 605,700 784,800 8,451,000 100.0%
Percent Distribution 18.5% 4.6% 3.9% 6.7% 2.4% 6.8% 15.1% 2.9% 1.4% 3.6% 17.8% 7.2% 9.3% 100.0%
Source: Tate Economic Research Inc.1) Based on inventory and site inspections completed by TER in June / July 2017. Rounded to the nearest 100 square feet.
Summary of Commercial (Retail and Service Space) in the City of Guelph (1
Macaulay Shiomi Howson Ltd Tate Economic Research Inc.
Brook McIlroy Inc.
46
City of Guelph Commercial Policy Review Stage 1 Commercial Analysis and Background Report
46
Macaulay Shiomi Howson Ltd Tate Economic Research Inc.
Brook McIlroy Inc.
• There is approximately 187,800 square feet of vacant commercial space in Downtown Guelph. This vacant space represents 12.0% of all the space in the node, which is above the normal level in a balanced market of 5.0% to 7.5%; and
• A significant portion of this vacancy can be attributed to large units in the Downtown. Examples of large vacant spaces in the Downtown include the former Acker Furniture Store6, Budd’s Clothing Store, Ontario Conservatory of Music, and the Ministry of Family & Community. Combined, these four vacant units represent approximately 50,000 square feet (26.4%) of the 187,800 square feet of vacant space in the Downtown.
Node 2: Gordon & Clair The Gordon & Clair node is located southern Guelph. This node includes commercial space on the northeast, northwest and southeast quadrants of the intersection, with commercial space under construction on the lands located at the southwest corner. Commercial space in this node consists of a variety of free-standing stores and traditional power centre formats.
• Major tenants in this node include: Zehrs, Food Basics, Shoppers Drug Mart, LCBO, JYSK, Cineplex & Goodlife Fitness;
• Excluding vacant units, approximately 164,300 square feet (43.5%) is retail space and 213,700 square feet (56.5%) is service space;
• The largest category of retail space in the node is Supermarkets (75,700 square feet). The amount of supermarket space will increase in 2017, given the construction of the 46,500 square foot Longo’s on the southwest quadrant of Gordon Street and Clair Road; and
• There is approximately 7,600 square feet of vacant space within the Gordon & Clair node. This represents a vacancy rate of 2.0% which is below the normal level of a balanced market.
Node 3: Paisley & Imperial The Paisley & Imperial node is located in the northwest region of Guelph. The majority of commercial space within the node is comprised of the West Hills Shopping Plaza and Costco. Much of the space is represented in a traditional power centre format, in addition to free-standing stores.
• Major tenants in this node include: Zehrs, Costco and LCBO;
6 At the time of this report, the former Acker’s Furniture building is in the process of being occupied, but is considered vacant for the purposes of the inventory.
47
City of Guelph Commercial Policy Review Stage 1 Commercial Analysis and Background Report
47
Macaulay Shiomi Howson Ltd Tate Economic Research Inc.
Brook McIlroy Inc.
• Excluding vacant space, the node is comprised of approximately 275,900 square feet (88.9%) of retail space, and 34,500 square feet (11.1%) of service space;
• The two largest categories of retail space within the node are General Merchandise (153,000 square feet) and Supermarkets (100,000 square feet). This distribution is influenced by the presence of the Costco and Zehrs stores;
• There is approximately 17,500 square feet of vacant space within the node. This amounts to a vacancy rate of 5.3%, within the healthy range of 5% to 7.5%; and
• Finally, the node also has significant portions of vacant commercial land, including lands planned for a Lowe’s home improvement centre on Elmira Road North, and the land surrounding the West Hills Plaza.
Node 4: Woodlawn & Woolwich The Woodlawn & Woolwich node is located north of the Downtown. It includes the Guelph SmartCentre, Home Depot, surrounding retail strips, and the commercial centres on the northeast, and southeast of Woodlawn Road and Woolwich Street. The majority of the space within this node is in a traditional power centre format.
• Major tenants within the node include Walmart, Home Depot, Canadian Tire, Staples, HomeSense and Michael’s;
• Excluding vacant space, the node is comprised of approximately 481,700 square feet (86.2%) retail space, and 77,300 square feet (13.8%) service space; and
• There is approximately 6,400 square feet of vacant space within the node. This amounts to a vacancy rate of 1.1% which is below the normal level in a balanced market.
Node 5: Kortright & Gordon The Kortright & Gordon node is located south of Downtown, and north of the Gordon & Clair node (Node 2). The node includes the commercial plazas at Gordon Street and Kortright Road West, the Hartsland Market Square Shopping Centre, and surrounding plazas.
• The majority of commercial space within this node is in large strip plazas such as Hartsland Market Square and University Square;
48
City of Guelph Commercial Policy Review Stage 1 Commercial Analysis and Background Report
48
Macaulay Shiomi Howson Ltd Tate Economic Research Inc.
Brook McIlroy Inc.
• The Hartsland Market Square is the largest shopping centre within the node at approximately 102,000 square feet. This shopping centre is anchored by a Zehrs supermarket;
• Occupied space within the node comprises approximately 108,000 square feet (56.0%) of retail space, and 85,000 (44.0%) square feet of service space; and
• Vacant space within the node comprises approximately 6,900 square feet. This figure represents a vacancy rate of 3.5% which is below the normal level in a balanced market.
Node 6: Silvercreek & Willow The Silvercreek & Willow node is located west of the Downtown in the Northwest region of Guelph. The node encompasses the commercial centres along Silvercreek Parkway North, and is generally bound by rail tracks to the north, the Hanlon Expressway to the west, Westwood Road to the south, and Kenwood Crescent / Applewood Crescent to the east.
• Willow West Mall is the largest retail centre in the node. It is an older mall that was renovated to an open concept centre anchored by No Frills and Leons;
• Other notable tenants within the node include: Giant Tiger, Winners, The Brick, Food Basics, PetSmart and Value Village;
• The node contains a variety of built forms. Free standing commercial buildings, strip plazas, and larger shopping centres are all incorporated within this node;
• Excluding vacancy, the node is comprised of approximately 394,900 square feet (76.6%) of retail space, and 120,800 square feet (23.4%) of service space; and
• There is approximately 61,800 square feet of vacant space in the node, representing a vacancy rate of 10.7% which is above the normal level in a balanced market.
Node 7: Stone & Edinburgh The Stone & Edinburgh node is located south of Downtown, and north of the Kortright and Gordon node. This node includes Stone Road Mall, the largest shopping centre in Guelph, and the commercial uses that surround it, primarily located along Stone Road West.
• Stone Road Mall is the dominant regional shopping centre in Guelph. It is an enclosed centre with a partial second floor. The centre is
49
City of Guelph Commercial Policy Review Stage 1 Commercial Analysis and Background Report
49
Macaulay Shiomi Howson Ltd Tate Economic Research Inc.
Brook McIlroy Inc.
approximately 550,700 square feet, and is anchored by a 116,700 square foot Sears store, which is slated for closure. The mall has been recently renovated and expanded. Redevelopment plans for the Sears space are not known at this time. Other major tenants include Sportchek, Marshall’s, Indigo and H&M;
• The node has the largest share of retail space in Guelph among the nodes at approximately 866,800 square feet. The node also has 321,800 square feet of occupied service space;
• The Stone & Edinburgh node has the largest amount of Clothing, Shoes & Accessories space within the City of Guelph at 192,300 square feet. This concentration reflects the presence of many fashion oriented tenants within Stone Road Mall;
• In addition to Stone Road Mall, there are a number of major retailers surrounding the mall. These retailers include Walmart, Canadian Tire, Best Buy, Metro, Staples and No Frills; and
• This node includes approximately 88,200 square feet of vacant space, which represents a vacancy rate of 6.9%, within the healthy range of 5.0% to 7.5%.
Node 8: Eramosa & Stevenson The Eramosa & Stevenson node is the second smallest commercial node within the City of Guelph at 244,400 square feet. The node includes Bullfrog Mall, and the commercial plazas to the east and west of Eramosa Road and Stevenson Street North.
• The commercial space in this node is primarily located in strip plazas;
• Major tenants include Zehrs, Food Basics, Shoppers Drug Mart and Goodlife Fitness;
• The Zehrs store expanded from approximately 42,000 square feet to 77,300 square feet in 2013. It expanded into space previously occupied by a Zellers department store;
• Excluding vacant space, there is approximately 156,700 square feet (64.1%) of occupied retail space and 87,700 square feet (35.9%) of occupied service space; and
• The Eramosa & Stevenson node has a vacancy rate of 0.0%. It is the only node in the City with no vacancies. This lack of vacant space may be indicative of unserved demand for additional commercial space.
50
City of Guelph Commercial Policy Review Stage 1 Commercial Analysis and Background Report
50
Macaulay Shiomi Howson Ltd Tate Economic Research Inc.
Brook McIlroy Inc.
Node 9: Speedvale & Stevenson The Speedvale & Stevenson node is the smallest commercial node within Guelph at 115,900 square feet. The node encompasses the Speedvale Centre shopping plaza on Speedvale Avenue East.
• The Speedvale Centre is a one storey, open-air strip plaza. Notable tenants include FreshCo, LCBO and Dollar Tree;
• Excluding vacancy, the node has approximately 67,000 square feet (64.7%) of retail space and 36,600 square feet (35.3%) of service space; and
• Vacancy within the node is approximately 10.6% or 12,300 square feet, which is above the normal level in a balanced market. Much of this vacancy is attributed to the closure of the Fabricland store within the Speedvale Centre, which encompasses 9,400 square feet.
Node 10: Woodlawn Node The Woodlawn Node is located in the northwest portion of Guelph, and is west of the Woodlawn & Woolwich node. The node is centered on Woodlawn Road West, and is bounded by the Hanlon Expressway and approximately Nicklin Road to the east.
• The Woodlawn Node is mainly comprised of a mix of one-storey free standing buildings, and one to two-storey industrial strip plazas;
• Excluding vacancy, the node comprises approximately 105,700 square feet (38.5%) of retail space and 168,500 square feet (61.5%) of service space;
• Furniture, Home Furnishings & Electronics is the largest type of retail space within the node at 56,500 square feet. The largest type of service space is Other Services at 105,900 square feet. This concentration of services can be attributed to the prevalence of government offices and services within the node; and
• The vacancy rate within the node is approximately 8.9%, representing 26,800 square feet, which is above the normal level in a balanced market.
Node 11: Other Northwest Guelph The Other Northwest Guelph node is the second largest node in terms of overall commercial space at 1.5 million square feet. The node is bounded by Woolwich Street in the east, Wellington Street West to the south, and the Guelph municipal boundary to the west and north.
51
City of Guelph Commercial Policy Review Stage 1 Commercial Analysis and Background Report
51
Macaulay Shiomi Howson Ltd Tate Economic Research Inc.
Brook McIlroy Inc.
• In regard to built form, the Other Northwest Guelph node is mostly comprised of one storey free standing buildings and industrial strip plazas;
• The node contains approximately 521,000 (32.1%) square feet of occupied retail space and 845,500 square feet (62.9%) of occupied service space; and
• There is approximately 134,500 square feet of vacant space within the node. This figure results in a vacancy level of 9.0%, which is above the normal level in a balanced market.
Node 12: Other Northeast Guelph The Other Northeast Guelph node is bounded by Woolwich Street in the west, York Road to the south, and the Guelph municipal boundary to the east and north.
• This node is primarily comprised of industrial and residential uses and contains a total of 605,700 square feet of commercial space;
• Excluding vacancy, the node is comprised of approximately 187,600 square feet (32.8%) of retail space and 384,400 square feet (67.2%) of service space; and
• There is approximately 33,700 square feet of vacant space within the node. This establishes a vacant rate of 5.6%, which is within the healthy range of 5.0% to 7.5%.
Node 13: Other South Guelph The Other South Guelph node is bounded by Wellington Street West & York Road to the north, and the Guelph municipal boundary to the west, east and south. South Guelph is the largest node by geographic area.
• The Other South Guelph node is comprised of predominantly one storey strip plazas, and one to two storey free standing buildings;
• The Other South Guelph node includes the University of Guelph, which contains a variety of commercial services oriented towards students;
• The Other South Guelph node is comprised of approximately 246,200 square feet (33.5%) of occupied retail space, and 489,800 square feet (66.5%) of occupied service space; and
• The vacancy rate within the node is approximately 6.2%, within the healthy range of 5% to 7.5% and which represents approximately 48,800 square feet of vacant space.
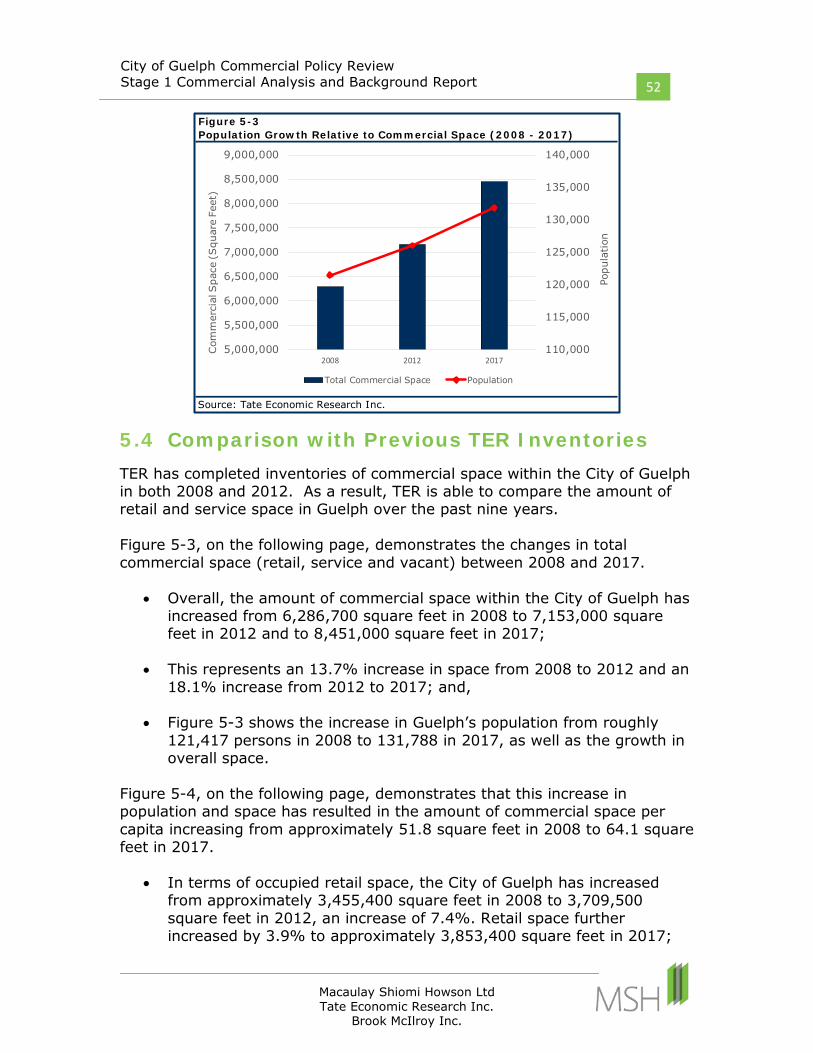
52
City of Guelph Commercial Policy Review Stage 1 Commercial Analysis and Background Report
52
Macaulay Shiomi Howson Ltd Tate Economic Research Inc.
Brook McIlroy Inc.
5.4 Comparison with Previous TER Inventories TER has completed inventories of commercial space within the City of Guelph in both 2008 and 2012. As a result, TER is able to compare the amount of retail and service space in Guelph over the past nine years. Figure 5-3, on the following page, demonstrates the changes in total commercial space (retail, service and vacant) between 2008 and 2017.
• Overall, the amount of commercial space within the City of Guelph has increased from 6,286,700 square feet in 2008 to 7,153,000 square feet in 2012 and to 8,451,000 square feet in 2017;
• This represents an 13.7% increase in space from 2008 to 2012 and an 18.1% increase from 2012 to 2017; and,
• Figure 5-3 shows the increase in Guelph’s population from roughly 121,417 persons in 2008 to 131,788 in 2017, as well as the growth in overall space.
Figure 5-4, on the following page, demonstrates that this increase in population and space has resulted in the amount of commercial space per capita increasing from approximately 51.8 square feet in 2008 to 64.1 square feet in 2017.
• In terms of occupied retail space, the City of Guelph has increased
from approximately 3,455,400 square feet in 2008 to 3,709,500 square feet in 2012, an increase of 7.4%. Retail space further increased by 3.9% to approximately 3,853,400 square feet in 2017;
Figure 5-3Population Growth Relative to Commercial Space (2008 - 2017)
Source: Tate Economic Research Inc.
110,000
115,000
120,000
125,000
130,000
135,000
140,000
5,000,000
5,500,000
6,000,000
6,500,000
7,000,000
7,500,000
8,000,000
8,500,000
9,000,000
2008 2012 2017
Popu
lati
on
Com
mer
cial
Spa
ce (
Squ
are
Feet
)
Total Commercial Space Population
53
City of Guelph Commercial Policy Review Stage 1 Commercial Analysis and Background Report
53
Macaulay Shiomi Howson Ltd Tate Economic Research Inc.
Brook McIlroy Inc.
• Service space in Guelph increased from approximately 2,527,600
square feet in 2008 to 3,016,000 square feet in 2012, an increase of 19.3%. Additionally, service space increased by 31.5% from 2012 to 3,965,300 square feet in 2017; and
• Vacancy rates in Guelph have also increased along with the amount of
commercial space. In 2008 there was a vacancy rate of approximately 4.8%, in 2012 there was a vacancy rate of approximately 6.0% and in 2017 there is a vacancy rate of approximately 7.5%.
5.5 Summary of Commercial Space in Guelph Currently, the City of Guelph contains approximately 8.5 million square feet of commercial space in a variety of built forms. The largest concentration of commercial space, approximately 1.6 million square feet, is located within the Downtown. There is approximately 632,300 square feet of vacant space city-wide, which represents a vacancy rate of 7.5%. This vacancy level is at the upper end of normal ranges for a balanced market, which is between 5.0% and 7.5%. Our analysis over time has indicated that commercial space within the City of Guelph has increased along with population. There is more commercial space per capita than in the past.
Figure 5-4Retail, Service and Vacant Space Comparison 2008 - 2017
Source: Tate Economic Research Inc.
51.8
56.8
64.1
35
40
45
50
55
60
65
70
0
500,000
1,000,000
1,500,000
2,000,000
2,500,000
3,000,000
3,500,000
4,000,000
4,500,000
2008 2012 2017 Com
mer
cial
Spa
ce p
er C
apita
(Sq
uare
Fee
t)
Com
mer
cial
Spa
ce (
Squa
re F
eet)
Total Retail Space Total Service Space Vacant Space Space per Capita
54
City of Guelph Commercial Policy Review Stage 1 Commercial Analysis and Background Report
54
Macaulay Shiomi Howson Ltd Tate Economic Research Inc.
Brook McIlroy Inc.
6 Commercial Land Needs Analysis This section of the report examines the future demand for commercial space. Commercial space includes both retail and service space. This section of the report also addresses the adequacy of the current supply of commercial lands to accommodate that future demand.
6.1 Basic Assumptions We understand the challenges associated with making forecasts and recognize that deviations from historic patterns are likely to occur. Nonetheless, it is our opinion that basic assumptions are necessary to conduct commercial/retail demand studies such as this one in Guelph. These basic assumptions are outlined below.
• The development and corresponding population forecasts are presumed to be accurate. If these forecasts prove to diverge significantly from the population levels realized, the conclusions of this analysis may require revision.
• The development application, intensification opportunities, and undeveloped commercial land data provided by the City of Guelph are considered to be accurate and current. If any changes to this data occur, the conclusions of this analysis may require revision.
• Additional assumptions that relate to coverage ratios and phasing have been indicated, where appropriate, in the report.
This analysis and its conclusions should be reviewed in light of these basic assumptions.
6.2 Work Plan The commercial land needs analysis includes two components. A supply analysis and demand analysis. Supply Analysis The supply analysis quantifies the amount of potential future intensification and planned development that can serve the future retail demand. The supply analysis also quantified the amount of undeveloped commercial land available to accommodate future demand. Demand Analysis
55
City of Guelph Commercial Policy Review Stage 1 Commercial Analysis and Background Report
55
Macaulay Shiomi Howson Ltd Tate Economic Research Inc.
Brook McIlroy Inc.
The following points outline the work plan for the demand analysis, which is summarized in this report.
1. Population projections. As part of the demand analysis, the population forecasts for Guelph were summarized.
2. Conduct commercial market demand analysis. A residual retail market demand analysis was conducted that quantified the amount and type of retail space warranted in Guelph over the 2016 to 2041 time period. A per capita approach was incorporated to forecast demand for service space.
3. Commercial land needs analysis. TER compared the demand for
commercial space against the current and proposed supply of commercial space. This analysis resulted in forecasts regarding the absorption of commercial space and the adequacy of the existing supply.
6.3 Supply Analysis
6.3.1 Vacant Commercial Land and Intensification Sites TER’s analysis included an examination of vacant commercial sites and active developments within the City of Guelph. This section of the report provides a summary and description of potential vacant sites and active developments that may accommodate new commercial space that is forecast in Guelph in the future. Figure 6-1, on the following page, summarizes the vacant commercial sites located within Guelph by their designation and type. Figure 6-1 also summarizes the potential future development through intensification on existing built up nodes, the intensification potential in the downtown, and the planned commercial potential in the Guelph Innovation District (GID). There is approximately 102.4 acres of vacant commercial land. This vacant land includes a variety of designations. The majority of these lands are designated as ‘Community Mixed-use Centre’, ‘Corporate Business Park’ and ‘Service Commercial’. Only 4 of the 36 parcels are greater than 5 acres in size. There is approximately 771,500 square feet of potential future development though intensification on downtown sites and lands designated as ‘Community Mixed-use Centre’ as well as planned development in the ‘Mixed-use Corridor (GID)’.

56
City of Guelph Commercial Policy Review Stage 1 Commercial Analysis and Background Report
56
Macaulay Shiomi Howson Ltd Tate Economic Research Inc.
Brook McIlroy Inc.
The location of these sites is illustrated in Figure 6-1 on the following page. The background table of the undeveloped and intensification sites is found in Appendix F.
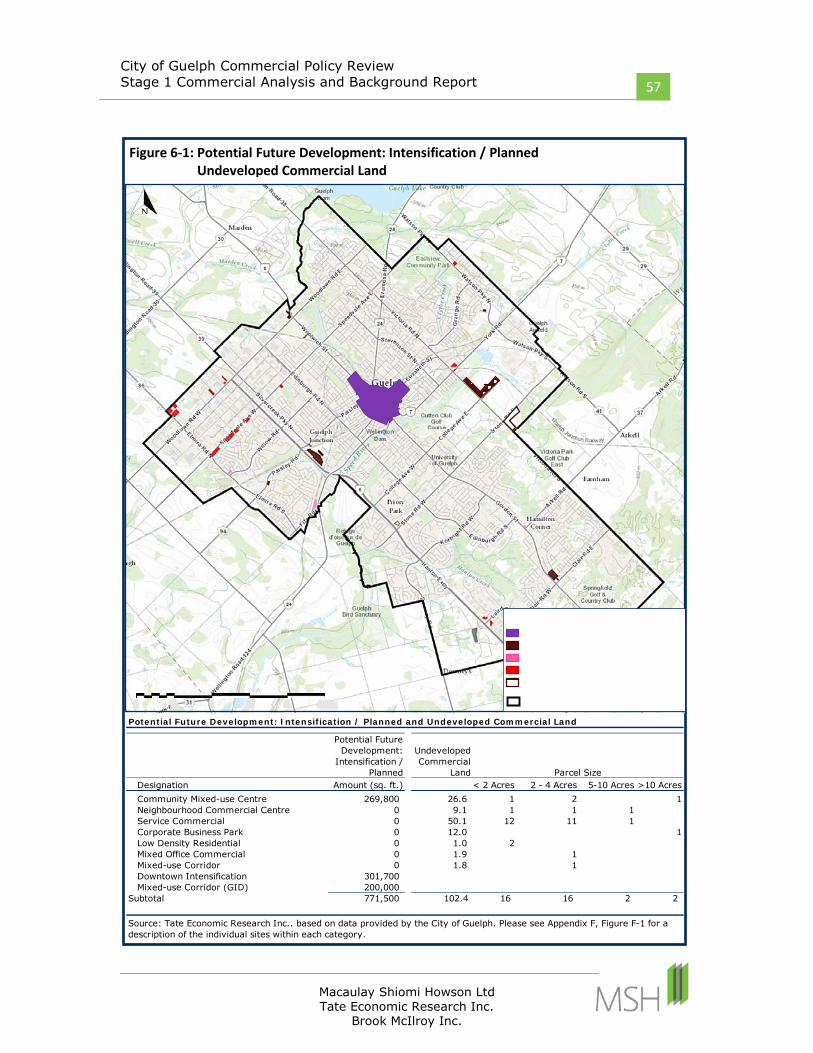
57
City of Guelph Commercial Policy Review Stage 1 Commercial Analysis and Background Report
57
Macaulay Shiomi Howson Ltd Tate Economic Research Inc.
Brook McIlroy Inc.
Figure 6-1: Potential Future Development: Intensification / Planned Undeveloped Commercial Land
Potential Future Development:
Intensification / Planned
Undeveloped Commercial
LandDesignation Amount (sq. ft.) < 2 Acres 2 - 4 Acres 5-10 Acres >10 AcresCommunity Mixed-use Centre 269,800 26.6 1 2 1Neighbourhood Commercial Centre 0 9.1 1 1 1Service Commercial 0 50.1 12 11 1Corporate Business Park 0 12.0 1Low Density Residential 0 1.0 2Mixed Office Commercial 0 1.9 1Mixed-use Corridor 0 1.8 1Downtown Intensification 301,700 Mixed-use Corridor (GID) 200,000
Subtotal 771,500 102.4 16 16 2 2
Potential Future Development: Intensification / Planned and Undeveloped Commercial Land
Parcel Size
Source: Tate Economic Research Inc.. based on data provided by the City of Guelph. Please see Appendix F, Figure F-1 for a description of the individual sites within each category.
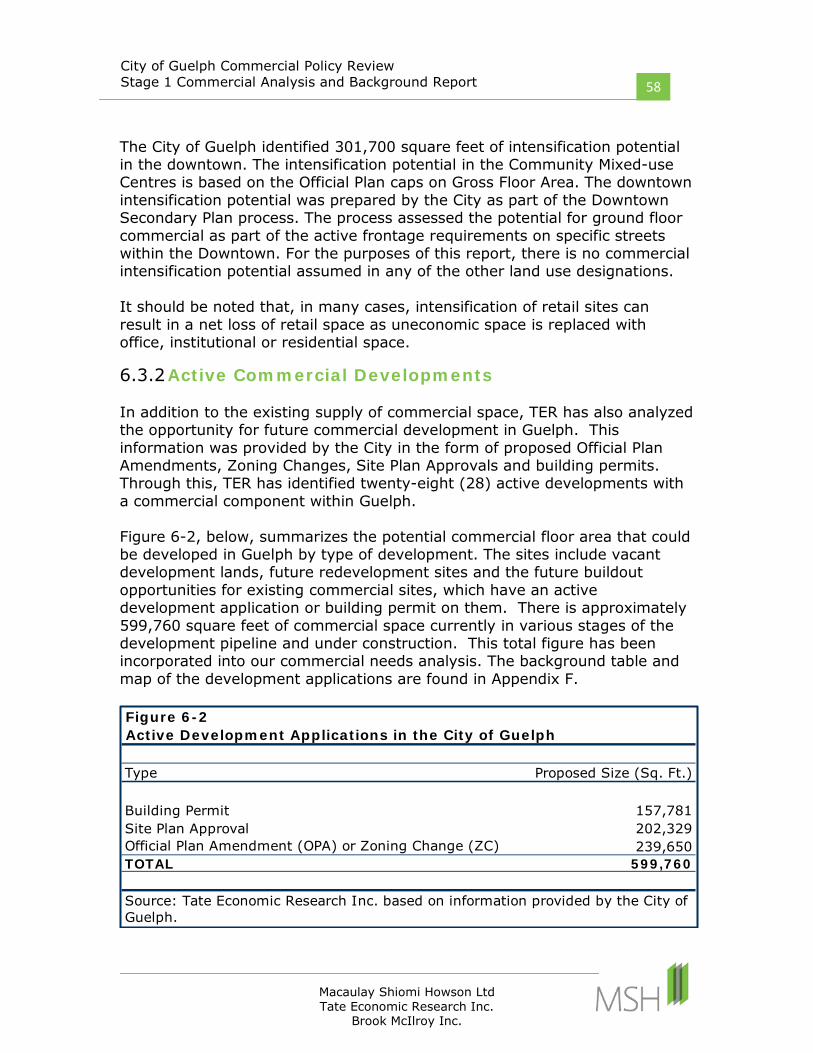
58
City of Guelph Commercial Policy Review Stage 1 Commercial Analysis and Background Report
58
Macaulay Shiomi Howson Ltd Tate Economic Research Inc.
Brook McIlroy Inc.
The City of Guelph identified 301,700 square feet of intensification potential in the downtown. The intensification potential in the Community Mixed-use Centres is based on the Official Plan caps on Gross Floor Area. The downtown intensification potential was prepared by the City as part of the Downtown Secondary Plan process. The process assessed the potential for ground floor commercial as part of the active frontage requirements on specific streets within the Downtown. For the purposes of this report, there is no commercial intensification potential assumed in any of the other land use designations. It should be noted that, in many cases, intensification of retail sites can result in a net loss of retail space as uneconomic space is replaced with office, institutional or residential space.
6.3.2 Active Commercial Developments In addition to the existing supply of commercial space, TER has also analyzed the opportunity for future commercial development in Guelph. This information was provided by the City in the form of proposed Official Plan Amendments, Zoning Changes, Site Plan Approvals and building permits. Through this, TER has identified twenty-eight (28) active developments with a commercial component within Guelph. Figure 6-2, below, summarizes the potential commercial floor area that could be developed in Guelph by type of development. The sites include vacant development lands, future redevelopment sites and the future buildout opportunities for existing commercial sites, which have an active development application or building permit on them. There is approximately 599,760 square feet of commercial space currently in various stages of the development pipeline and under construction. This total figure has been incorporated into our commercial needs analysis. The background table and map of the development applications are found in Appendix F.
Figure 6-2Active Development Applications in the City of Guelph
Type Proposed Size (Sq. Ft.)
Building Permit 157,781Site Plan Approval 202,329Official Plan Amendment (OPA) or Zoning Change (ZC) 239,650TOTAL 599,760
Source: Tate Economic Research Inc. based on information provided by the City of Guelph.
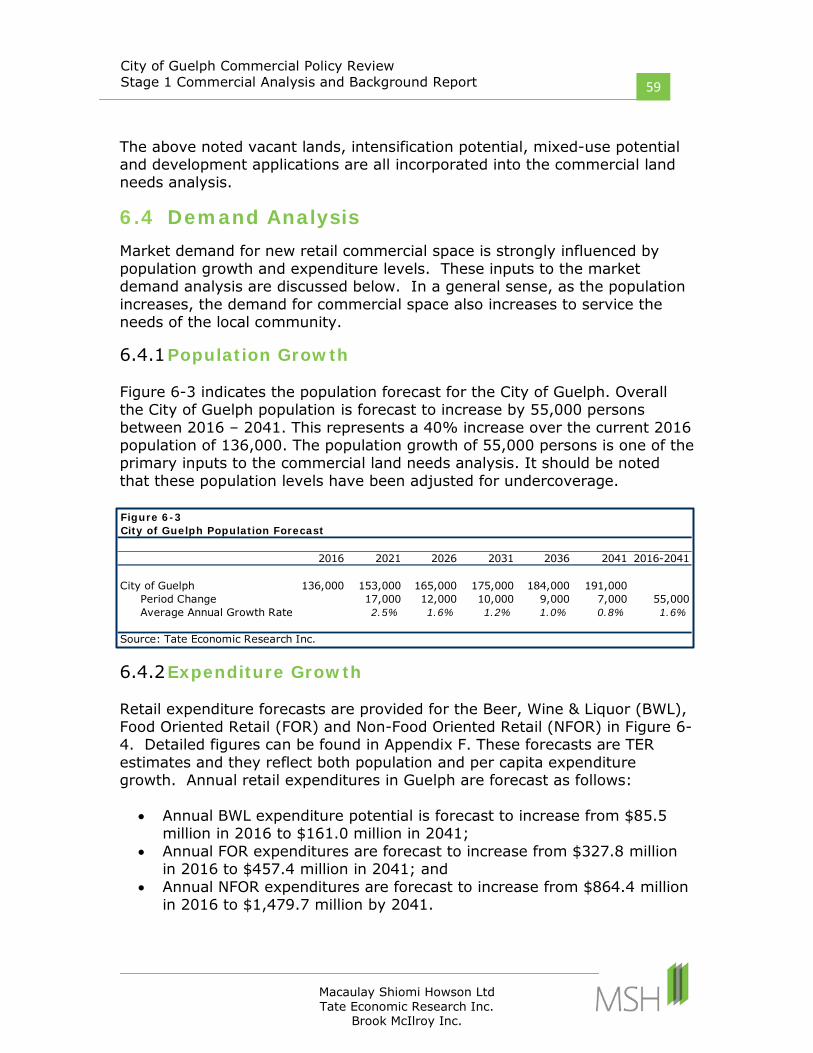
59
City of Guelph Commercial Policy Review Stage 1 Commercial Analysis and Background Report
59
Macaulay Shiomi Howson Ltd Tate Economic Research Inc.
Brook McIlroy Inc.
The above noted vacant lands, intensification potential, mixed-use potential and development applications are all incorporated into the commercial land needs analysis.
6.4 Demand Analysis Market demand for new retail commercial space is strongly influenced by population growth and expenditure levels. These inputs to the market demand analysis are discussed below. In a general sense, as the population increases, the demand for commercial space also increases to service the needs of the local community.
6.4.1 Population Growth Figure 6-3 indicates the population forecast for the City of Guelph. Overall the City of Guelph population is forecast to increase by 55,000 persons between 2016 – 2041. This represents a 40% increase over the current 2016 population of 136,000. The population growth of 55,000 persons is one of the primary inputs to the commercial land needs analysis. It should be noted that these population levels have been adjusted for undercoverage.
6.4.2 Expenditure Growth Retail expenditure forecasts are provided for the Beer, Wine & Liquor (BWL), Food Oriented Retail (FOR) and Non-Food Oriented Retail (NFOR) in Figure 6-4. Detailed figures can be found in Appendix F. These forecasts are TER estimates and they reflect both population and per capita expenditure growth. Annual retail expenditures in Guelph are forecast as follows:
• Annual BWL expenditure potential is forecast to increase from $85.5 million in 2016 to $161.0 million in 2041;
• Annual FOR expenditures are forecast to increase from $327.8 million in 2016 to $457.4 million in 2041; and
• Annual NFOR expenditures are forecast to increase from $864.4 million in 2016 to $1,479.7 million by 2041.
Figure 6-3City of Guelph Population Forecast
2016 2021 2026 2031 2036 2041 2016-2041
City of Guelph 136,000 153,000 165,000 175,000 184,000 191,000Period Change 17,000 12,000 10,000 9,000 7,000 55,000Average Annual Growth Rate 2.5% 1.6% 1.2% 1.0% 0.8% 1.6%
Source: Tate Economic Research Inc.
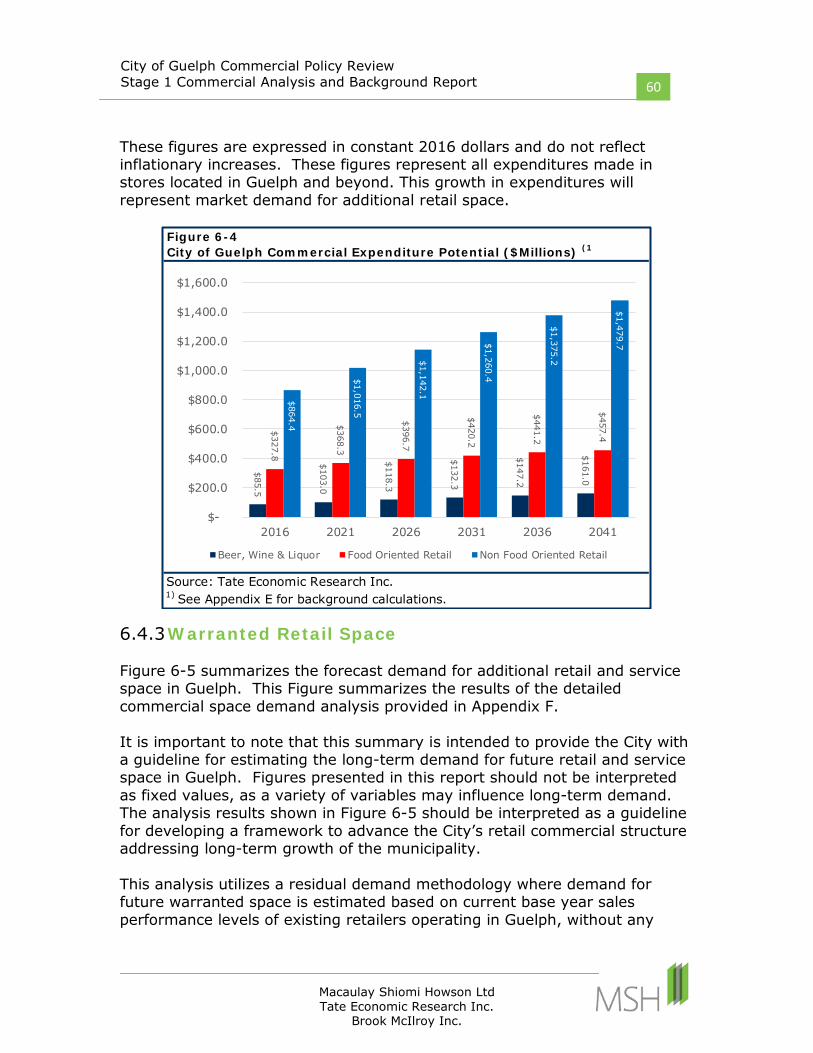
60
City of Guelph Commercial Policy Review Stage 1 Commercial Analysis and Background Report
60
Macaulay Shiomi Howson Ltd Tate Economic Research Inc.
Brook McIlroy Inc.
These figures are expressed in constant 2016 dollars and do not reflect inflationary increases. These figures represent all expenditures made in stores located in Guelph and beyond. This growth in expenditures will represent market demand for additional retail space.
6.4.3 Warranted Retail Space Figure 6-5 summarizes the forecast demand for additional retail and service space in Guelph. This Figure summarizes the results of the detailed commercial space demand analysis provided in Appendix F. It is important to note that this summary is intended to provide the City with a guideline for estimating the long-term demand for future retail and service space in Guelph. Figures presented in this report should not be interpreted as fixed values, as a variety of variables may influence long-term demand. The analysis results shown in Figure 6-5 should be interpreted as a guideline for developing a framework to advance the City’s retail commercial structure addressing long-term growth of the municipality. This analysis utilizes a residual demand methodology where demand for future warranted space is estimated based on current base year sales performance levels of existing retailers operating in Guelph, without any
Figure 6-4City of Guelph Commercial Expenditure Potential ($Millions) (1
Source: Tate Economic Research Inc.1) See Appendix E for background calculations.
$85.5
$103.0
$118.3
$132.3
$147.2
$161.0
$327.8
$368.3
$396.7
$420.2
$441.2
$457.4
$864.4
$1,016.5
$1,142.1
$1,260.4
$1,375.2
$1,479.7
$-
$200.0
$400.0
$600.0
$800.0
$1,000.0
$1,200.0
$1,400.0
$1,600.0
2016 2021 2026 2031 2036 2041
Beer, Wine & Liquor Food Oriented Retail Non Food Oriented Retail
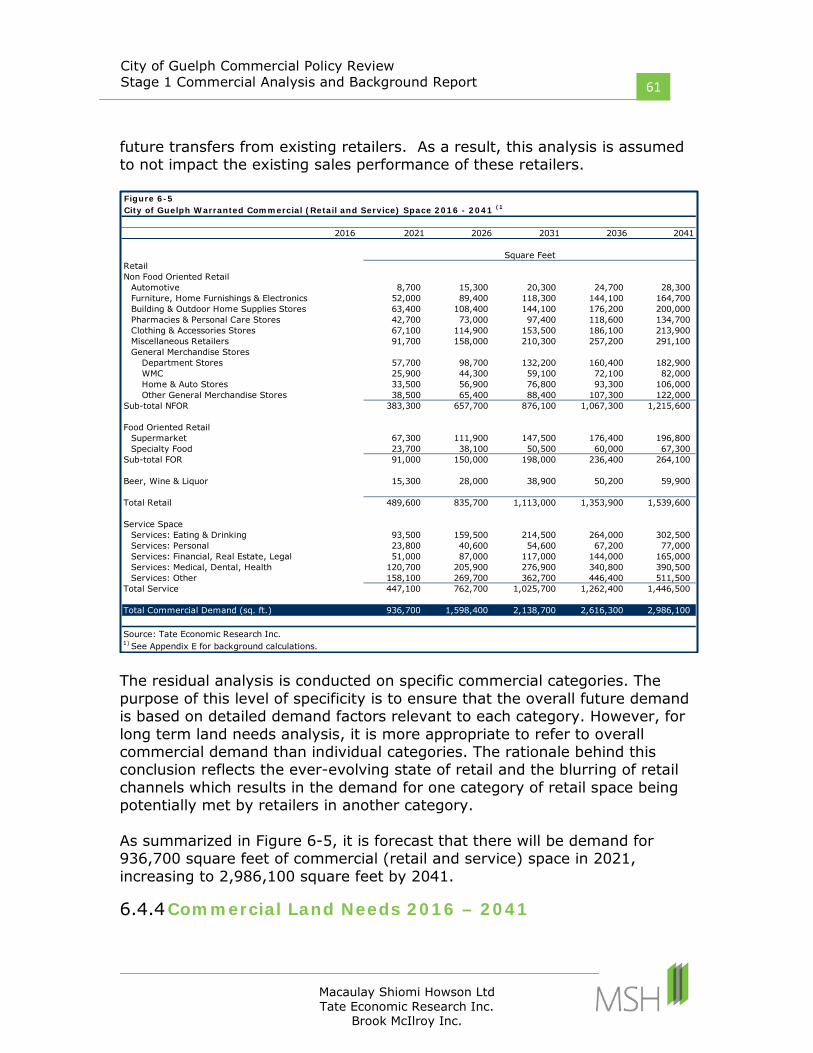
61
City of Guelph Commercial Policy Review Stage 1 Commercial Analysis and Background Report
61
Macaulay Shiomi Howson Ltd Tate Economic Research Inc.
Brook McIlroy Inc.
future transfers from existing retailers. As a result, this analysis is assumed to not impact the existing sales performance of these retailers.
The residual analysis is conducted on specific commercial categories. The purpose of this level of specificity is to ensure that the overall future demand is based on detailed demand factors relevant to each category. However, for long term land needs analysis, it is more appropriate to refer to overall commercial demand than individual categories. The rationale behind this conclusion reflects the ever-evolving state of retail and the blurring of retail channels which results in the demand for one category of retail space being potentially met by retailers in another category. As summarized in Figure 6-5, it is forecast that there will be demand for 936,700 square feet of commercial (retail and service) space in 2021, increasing to 2,986,100 square feet by 2041.
6.4.4 Commercial Land Needs 2016 – 2041
Figure 6-5City of Guelph Warranted Commercial (Retail and Service) Space 2016 - 2041 (1
2016 2021 2026 2031 2036 2041
RetailNon Food Oriented Retail
Automotive 8,700 15,300 20,300 24,700 28,300 Furniture, Home Furnishings & Electronics 52,000 89,400 118,300 144,100 164,700 Building & Outdoor Home Supplies Stores 63,400 108,400 144,100 176,200 200,000 Pharmacies & Personal Care Stores 42,700 73,000 97,400 118,600 134,700 Clothing & Accessories Stores 67,100 114,900 153,500 186,100 213,900 Miscellaneous Retailers 91,700 158,000 210,300 257,200 291,100 General Merchandise Stores
Department Stores 57,700 98,700 132,200 160,400 182,900 WMC 25,900 44,300 59,100 72,100 82,000 Home & Auto Stores 33,500 56,900 76,800 93,300 106,000 Other General Merchandise Stores 38,500 65,400 88,400 107,300 122,000
Sub-total NFOR 383,300 657,700 876,100 1,067,300 1,215,600
Food Oriented RetailSupermarket 67,300 111,900 147,500 176,400 196,800 Specialty Food 23,700 38,100 50,500 60,000 67,300
Sub-total FOR 91,000 150,000 198,000 236,400 264,100
Beer, Wine & Liquor 15,300 28,000 38,900 50,200 59,900
Total Retail 489,600 835,700 1,113,000 1,353,900 1,539,600
Service SpaceServices: Eating & Drinking 93,500 159,500 214,500 264,000 302,500 Services: Personal 23,800 40,600 54,600 67,200 77,000 Services: Financial, Real Estate, Legal 51,000 87,000 117,000 144,000 165,000 Services: Medical, Dental, Health 120,700 205,900 276,900 340,800 390,500 Services: Other 158,100 269,700 362,700 446,400 511,500
Total Service 447,100 762,700 1,025,700 1,262,400 1,446,500
Total Commercial Demand (sq. ft.) 936,700 1,598,400 2,138,700 2,616,300 2,986,100
Source: Tate Economic Research Inc.1) See Appendix E for background calculations.
Square Feet
62
City of Guelph Commercial Policy Review Stage 1 Commercial Analysis and Background Report
62
Macaulay Shiomi Howson Ltd Tate Economic Research Inc.
Brook McIlroy Inc.
Figure 6-6, below, summarizes the commercial land needs requirements based on the supply and demand analyses in the previous sections.
The analysis examined the commercial land needs by five (5) year periods and makes assumptions regarding the corresponding supply in each period. The following observations are made with respect to the commercial land needs analysis in Figure 6-6:
• There is warranted demand for 936,700 square feet of commercial space between 2016 and 2021. TER has assumed that the 599,800 square feet of development applications (rounded from 599,760 square feet in Figure 6-2) will be entirely developed and will therefore address a portion of this demand. After accounting for the existing 599,800 square feet of development applications, there would still be unmet demand for 336,900 square feet of additional commercial space. It is the opinion of TER that there would likely not be sufficient population density to result in full build out of the intensification potential in the near to mid-term. Therefore, TER has forecast that the 336,900 square feet of unmet demand will be addressed entirely through development on undeveloped commercial land. Applying a 25% coverage ratio results in a land requirement of 30.9 acres. This requirement can be entirely satisfied within the current undeveloped commercial land inventory of 102.4 acres (referenced from Figure 6-1).
63
City of Guelph Commercial Policy Review Stage 1 Commercial Analysis and Background Report
63
Macaulay Shiomi Howson Ltd Tate Economic Research Inc.
Brook McIlroy Inc.
• A similar exercise was conducted for the 2021-2026 period. The demand analysis indicates 661,700 square feet of warranted new commercial space in this period. In this period, TER has assumed the intensification at the existing community mixed-use centres will address a portion of the warranted demand. TER has assumed that 269,800 square feet of the 661,700 square feet of demand will be addressed through intensification. Therefore, approximately 391,900 square feet of unmet demand for commercial space will be addressed through absorption of the undeveloped commercial land inventory. Incorporating a 25% coverage ratio results in the requirement of 36.0 acres which is within the inventory of 71.5 acres (as of the end of the 2021 period).
• The demand analysis indicates 540,300 square feet of warranted new commercial space for the 2026 – 2031 period. To address this demand, TER has assumed a portion of the downtown intensification (180,000 sq. ft.) as well as 100,000 square feet of new commercial space within the Guelph Innovation District will be absorbed. This intensification and new development will address a portion of the warranted demand of 540,300 square feet. There is approximately 260,300 square feet of unmet demand under these assumptions. This 260,300 square feet will be addressed through absorption of the undeveloped commercial land inventory at 30% coverage. This coverage results in a requirement of 19.9 acres of commercial land. This 19.9 acres is within the 2026 period end undeveloped commercial land inventory of 35.5 acres. An increase in the land coverage is assumed as parking requirements decrease and mixed-use developments become more viable.
• For the 2031 – 2036 period, there is forecast demand for 477,600 square feet of warranted new commercial space. TER has assumed the remaining planned commercial within the GID (100,000 sq. ft.) and a portion of the downtown intensification (60,850 sq. ft.) will address a portion of the warranted demand of 477,600 square feet. The resulting shortfall is a requirement of 316,750 square feet of unmet demand. This 316,750 square feet, at 35% coverage7, results in a requirement of 20.8 acres of commercial land. This requirement exceeds the 2031 period end undeveloped commercial land inventory of 15.6 acres. Therefore, additional commercial land or new intensification opportunities will be required prior to the end of the 2036 period.
7 The increase in land coverage from 30% to 35% in the 2031-2036 period and from 35% to 40% in the 2036-2041 period is based on the same factors as the increase from 25% to 30%.
64
City of Guelph Commercial Policy Review Stage 1 Commercial Analysis and Background Report
64
Macaulay Shiomi Howson Ltd Tate Economic Research Inc.
Brook McIlroy Inc.
• For the 2036 – 2041 period, TER has assumed the remaining downtown intensification (60,850 sq. ft.) will address a portion of the warranted demand of 369,800 square feet. There will be unmet demand of approximately 308,950 square feet. This 369,800 square feet, at 40% coverage8 results in a requirement of 18.3 acres. Under the assumptions of this analysis, by 2036, there is no existing commercial land available for development. Therefore, the analysis indicates demand for an additional 17.7 acres of commercial land by the end of 2041 or new intensification opportunities to accommodate the shortfall in supply.
• It is important to note that, where applicable, the maximum allowable commercial Gross Floor Areas (GFA) is assumed for areas designated Community Mixed-use Centre. If these lands don’t meet their estimated commercial potential and are developed instead for other purposes, additional commercial lands or intensification opportunities will be required.
6.5 Commercial Land Needs Summary Based on the assumptions noted above the City of Guelph has sufficient intensification opportunities, planned development and undeveloped commercial land to accommodate commercial demand up to 2031. By 2041, after accounting for intensification opportunities in the downtown and planned commercial development within the GID, it is forecast that there will be unmet commercial demand of approximately 387,850 square feet. If this space were to be accommodated on undeveloped commercial land, it would equate to a requirement for an additional 22.9 acres at an average land coverage of 38.8%. Conversely, this unmet commercial demand could be accommodated through new intensification opportunities.
65
City of Guelph Commercial Policy Review Stage 1 Commercial Analysis and Background Report
65
Macaulay Shiomi Howson Ltd Tate Economic Research Inc.
Brook McIlroy Inc.
7 Recommendations The ongoing evolution of the retail environment poses significant challenges when quantifying the land requirements to accommodate future demand. The commercial land needs analysis in the previous section indicated that the City of Guelph has sufficient intensification opportunities, planned commercial space and undeveloped commercial land to accommodate commercial demand up to 2031. After 2031, either additional undeveloped commercial land or new intensification opportunities will be required. However, the Commercial Land Use Needs Analysis has been undertaken at a macro level. Many factors that influence the development potential of a commercial site have not been incorporated into this macro analysis. These factors include site locational characteristics and parcel size. It may be important to examine the development potential of commercial sites on an individual basis in order to assess their ability to meet demand. This examination may be undertaken by future applicants. This section examines the implications of market changes on future land requirements. Generally, there are two areas which are evolving and require broader assumptions:
1) Consumer Demand – Consumer demand is changing based on generational consumer shopping habits as well as the manner in which goods and services are purchased and experienced. TER has accounted for this change through an e-commerce adjustment to retail and service demand which has led to a reduction in the amount of physical retail space that will be required in future years.
2) Built Form Supply – Typical commercial development in Guelph has been single story with a coverage ratio of approximately 25%. It is assumed that this development pattern will gradually shift to denser developments as experienced in some other urban municipalities. This shift is based on various factors: a) The tightening of commercial land supply along with reduced parking requirements has led to multi-story denser commercial developments, with coverage ratios exceeding the previous industry standard of 25%. b) The implementation of smart growth policies is resulting in higher density residential neighbourhoods which have the population densities to support successful mixed-use developments. It should be noted that
66
City of Guelph Commercial Policy Review Stage 1 Commercial Analysis and Background Report
66
Macaulay Shiomi Howson Ltd Tate Economic Research Inc.
Brook McIlroy Inc.
in addition to sufficient residential density, successful commercial space in mixed-use developments require pedestrian traffic and available transit options. Furthermore, there are numerous challenges associated with commercial in mixed-use developments as outlined in Section 3.3.1. Coverage ratios in vertical mixed-use developments could typically range from 50% up to 90%, with commercial space occupying the ground floor. c) Changes in consumer shopping behavior is resulting in a reduced demand for large floorplate retailers which in turn influences the built form through a decreased requirement for space extensive developments.
TER has accounted for a shift in built form by assuming an increase in coverage ratios over the study period. In the short to medium term, the increase in coverage ratios will likely occur through the development of more efficient small to medium scale single or multi-story commercial developments as well as the infill/intensification of existing retail centres. The resulting coverage ratios are typically between 25% to 35%. Over the longer term, higher coverage ratios may be achieved through vertical mixed-use developments.
7.1 Future Land Requirement Figure 7-1 indicates how the future commercial demand up to 2041 will be accommodated based on the current supply environment as well as the unmet demand of 387,850 square feet.
Figure 7-1Distribution of Commercial Demand 2016 - 2041
Source: Tate Economic Research Inc.
Active Development Applications , 599,800
, 20%
Intensification: Community Mixed-use Centre, 269,800 , 9%
Intensification: Downtown , 301,700 ,
10%
Planned: Mixed-use Corridor (GID), 200,000 , 7%
Undeveloped Commercial Land, 1,226,950 , 41%
Unmet Demand, 387,850 , 13%
67
City of Guelph Commercial Policy Review Stage 1 Commercial Analysis and Background Report
67
Macaulay Shiomi Howson Ltd Tate Economic Research Inc.
Brook McIlroy Inc.
The analysis in Figure 6-6 indicated that there is sufficient undeveloped land to accommodate demand up to 2031. However, this analysis does not consider the appropriateness of those lands for various forms of commercial development. Figure 7-2 illustrates the distribution of the undeveloped properties by parcel size. As indicated in Figure 7-2, there are only 4 parcels larger than 5 acres in size. The challenge with the current supply of undeveloped land is that there are not enough sufficiently sized parcels to allow for larger traditional neighborhood and community functioning commercial developments, that typically require 7+ acres.
As an example, TER has forecast demand for 67,300 square feet of supermarket space by 2021, increasing to 196,000 square feet by 2041. This square footage would equate to approximately 4 new supermarkets, assuming the average current size in Guelph of 47,000 square feet. Some of this demand will be accommodated through the new Longo’s at Gordon & Clair and is expected to be accommodated by Loblaws in the Watson Parkway and Starwood node. However, in the short to medium term there is a lack of sufficiently sized undeveloped commercial sites large enough to accommodate the future supermarket requirements. Furthermore, it is unlikely that the success factors required for vertical mixed-use
Figure 7-2Distribution of Undeveloped Commercial Sites by Parcel Size
Source: Tate Economic Research inc.
1644%
1644%
26%
26%
< 2 Acres
2-4 Acres
5-10 Acres
>10 Acres
68
City of Guelph Commercial Policy Review Stage 1 Commercial Analysis and Background Report
68
Macaulay Shiomi Howson Ltd Tate Economic Research Inc.
Brook McIlroy Inc.
developments will be present in the medium term to accommodate supermarkets within such developments. Similarly, there may be mid-box stores, such as Mountain Equipment Co-op (MEC), that typically locate as stand-alone stores, that may be interested in operating in Guelph. Under the current supply circumstances any such mid-box stores would have difficulty finding an appropriately sized undeveloped site.

69
City of Guelph Commercial Policy Review Stage 1 Commercial Analysis and Background Report
69
Macaulay Shiomi Howson Ltd Tate Economic Research Inc.
Brook McIlroy Inc.
Appendix A – Other Municipal Policy Approaches
70
City of Guelph Commercial Policy Review Stage 1 Commercial Analysis and Background Report
70
Macaulay Shiomi Howson Ltd Tate Economic Research Inc.
Brook McIlroy Inc.
Other Municipal Commercial Policy Approaches City of Markham The Official Plan was adopted December 2013, approved by the Region of York with modifications May 2014, and appealed in its entirety July 2014. On April 21, 2017 the Ontario Municipal Board issued a Partial Approval Order bringing parts of the Plan in force. Commercial
The Official Plan policies place limits on development by type and size. In addition, a Retail and Service Needs Study is required to support a development application where “redevelopment of an existing retail and service site within a ‘Mixed-Use’ designation is proposed,” to among other matters, “identify how the proposed development will accommodate identified retail and service needs and function.” The policies also go beyond the requirements of a traditional market study by requiring that such a Study also examine “how the design, size, layout, and configuration of the development will create a flexible commercial space that will ensure its viability to perform the planned retail and service delivery function over the long term.” (Section 5.1.7.8)
Large-scale Commercial The OP establishes a Commercial designation to recognize existing or approved large-format retail development. However, the intent is to “provide for the evolution of ‘Commercial’ lands to more intensive building forms and office, retail and service uses”. In addition, future large-scale retail is to be located in Mixed-Use designations and the intent is to “no longer accommodate large-format retail development (single-use retail complexes surrounded by large surface parking lots)” so no additional lands will be designated Commercial.
Mixed-Use Development The policies direct new retail and service commercial uses to a mixed-use designation. The Mixed-Use designations are primarily located in centres and corridors which are well served by transit. The policies state that “the emphasis will be to move away from large format retail development (single-use retail complexes surrounded by large surface parking lots) towards more compact, mixed-use developments that incorporate retail services, based on an urban form that features buildings aligned along streets with attractive pedestrian environments.” (Section 5.1.7) The Mixed-Use designations include a range of built form types including Low Rise, Mid Rise, High Rise, Office Priority, Health Care Campus, and
71
City of Guelph Commercial Policy Review Stage 1 Commercial Analysis and Background Report
71
Macaulay Shiomi Howson Ltd Tate Economic Research Inc.
Brook McIlroy Inc.
Heritage Main Street. The Policies recognize that the transformation may take place slowly in some areas and that in some Mixed-Use designations there will be a minimum height of 3 storeys.
Specific Land Uses Special policies are provided in Section 8.13 for convenience retail and personal service, drive-through service facilities, motor vehicle service stations and outdoor display or outdoor storage and, in Section 8.7, for non-residential uses in hamlets. Implementation policies provide for a menu of implementation tools including secondary plans, precinct plans, comprehensive block plans, zoning including conditional zoning and development permit bylaws, and community improvement plans. Retail and service needs study and retail impact study can be required as part of a complete application. There are a number of definitions related to commercial development such as commercial fitness centre, convenience retail and personal service and major retail, but no general definition of retail and/or service commercial.
City of Vaughan The Official Plan was adopted in 2010 but appealed to the Ontario Municipal Board. It has received numerous partial approvals by the OMB between July 2013 and June 2017. Retail Sector
The Official Plan (OP) recognizes that Vaughan’s “existing retail sector is a large and important component of the overall Urban Structure and local economy.” In addition, the OP recognizes that there are numerous “stand-alone retail uses” as well as several existing main street and mixed-use retail areas. The OP permits existing shopping centres to transform into mixed-use buildings and districts, while the primary location for new retail will be within Intensification areas where it will be developed as part of mixed-use centres and corridors, will be transit-oriented and will be integrated with their surrounding communities. Section 5.2.3.4 provides specific direction with respect to the form of retail development such as being sited and oriented to support walking, cycling and transit use, providing sunlight penetration to pedestrian areas, encouraging a mix of retail uses including large format and small scale uses, accommodating large food stores and providing on-street parking where possible.
Intensification Areas
72
City of Guelph Commercial Policy Review Stage 1 Commercial Analysis and Background Report
72
Macaulay Shiomi Howson Ltd Tate Economic Research Inc.
Brook McIlroy Inc.
The policies establish a hierarchy of Intensification Areas (Section 2.2.1.1), which also reflects a hierarchy of retail uses. Major retail uses (over 10,000 square metres on a single lot) are to be located in the Vaughan Metropolitan Centre and Primary Centres. They are also permitted in certain other centres subject to specific criteria. In addition to the Intensification Areas, local-servicing commercial uses are permitted in Community Areas which are “not intended to experience significant physical change.” (Section 2.2.3.2)
New Community Areas The policies require development of these greenfield areas as complete communities. Local Centres will include a mix of uses including retail, office and community facilities to allow residents to meet daily activities to where they live and work. Pedestrian oriented places with good urban design, fine grained streets suitable for pedestrians and cyclists, and an intensity of development appropriate for supporting transit service.
Specific Land Uses Specific policies are provided for gas stations (Section 9.2.2 Land Use Designations and Section 9.2.3.9) and drive-through uses (Section 5.2.3.8). Drive-through uses are only permitted where they will not conflict with intensification, pedestrianization, attractive streetscapes, and transit supportiveness. They are only permitted by a site specific Official Plan amendment in the Vaughan Metropolitan Area and only by site specific zoning in primary centres, local centres and regional intensification corridors. New gas stations are not permitted in the Vaughan Metropolitan Area, primary and local centres adjacent to Highway 7, and regional intensification corridors. Implementation policies provide for a menu of implementation tools including secondary plans, block plans, zoning, and community improvement plans. It does not provide for development permit bylaws. A Market Impact Study and a Commercial Impact Statement can be required as part of a complete application. Definitions include definitions of some specific retail and commercial uses including ancillary retail and major retail. It also contains a definition of retail – “Retail shall mean retail, restaurant and service commercial uses.”
Town of Richmond Hill The Official Plan adopted by the Town in 2010, was endorsed and modified by Region in May 2011 and partially approved by the OMB in 2014 and 2017.
73
City of Guelph Commercial Policy Review Stage 1 Commercial Analysis and Background Report
73
Macaulay Shiomi Howson Ltd Tate Economic Research Inc.
Brook McIlroy Inc.
Intensification Areas The Official Plan (OP) recognizes that as the Town’s settlement area is nearly built out, most future development will occur through intensification. Centres and corridors are to accommodate the majority of new growth and will have a mix of uses including retail, office and commercial. (Sections 3.1.3, 3.1.4, 3.1.6 and 3.3.3.2) These are established as a hierarchy with Richmond Hill Centre part of the Richmond Hill/Langstaff Gateway Urban Growth Centre “containing the greatest height and densities.” The hierarchy of commercial development is implicit including some limitations on the size of retail development established in the land use policies in Section 4.1 (e.g., retail development limited to a maximum gross floor area of 5,000 square metres in the Oak Ridges Local Centre).
Mixed-Use Development The policies require mixed-use development in centres and corridors and also as part of neighbourhood commercial sites. This includes specific direction with respect to design related to retail development in Sections 3.3.3.2.4–3.3.3.2.8 including the following: “New retail including major retail is to be designed to be pedestrian-friendly, transit-oriented and integrated into communities and pedestrian and cycling networks, and designed to achieve high quality urban design.” In addition, Section 3.3.3.3 provides direction with respect to neighbourhood commercial centres and Section 3.4 provides detailed policies on place-making. The land use policies in Section 4 also provide direction with respect to permitted uses and design (e.g., Section 4.2.1.5 for the Richmond Hill Centre) and the long-term objective “that intensification of major retail uses occur through redevelopment into a more compact built form.”(Section 4.2.1.6)
Specific Land Uses Specific policies are provided with respect to automotive service commercial facilities (Sections 3.4.1.47 and 4.11.1). In addition, small-scale commercial uses in accordance with the Oak Ridges Moraine Conservation Plan are only permitted in the Hamlet of Gormley.
Implementation policies provide for a menu of implementation tools including secondary plans, tertiary plans/concept plans, zoning including conditional zoning and development permit bylaws, and community improvement plans. Retail Market Study and Commercial Needs Study can be required as part of a complete application.
74
City of Guelph Commercial Policy Review Stage 1 Commercial Analysis and Background Report
74
Macaulay Shiomi Howson Ltd Tate Economic Research Inc.
Brook McIlroy Inc.
There are a number of definitions related to commercial development such as automotive service commercial and major retail. There is also a definition of the terms “commercial” and “retail” as follows: “Commercial means the use of land, buildings or structures for the purpose of buying or selling commodities and supplying services, including personal service uses provided to the public (such as florists, dry cleaners, tailors, hair salons, and financial institutions such as banks) or where entertainment is offered for gain or profit (such as motion picture or other theatre, public hall, billiard or pool rooms, an establishment offering three or more electronic games for public use, bowling alley, ice or roller-skating rink, miniature golf course and all other similar places of amusement).” “Retail means a use conducted in a building or structure or part thereof in which goods, merchandise, substances, or items are displayed, rented or sold directly to the general public.”
City of Mississauga The Official Plan was adopted September 29, 2010, and was partially approved September 2011 and appealed in its entirety but most of the Plan was approved by the Board in 2012. City Structure
The Official Plan recognizes a City Structure consisting of a series of Nodes and Corridors as well as Neighbourhoods and Employment areas.
Retail “Retail means the sale, lease and/or rental of goods to the public. Retail is often combined with other uses such as personal service establishments, offices, financial institutions, restaurants, and overnight accommodations. The primary locations for retail uses will be the Downtown, Major Nodes and Community Nodes. Retail uses within these locations will be encouraged to contribute to a vibrant, mixed-use environment and be developed in combination with residential and office uses. Within Corporate Centres, retail uses in conjunction with office developments will be encouraged in order to provide services to local businesses and employees. New free standing retail uses will not be permitted.
75
City of Guelph Commercial Policy Review Stage 1 Commercial Analysis and Background Report
75
Macaulay Shiomi Howson Ltd Tate Economic Research Inc.
Brook McIlroy Inc.
Within Neighbourhoods, further retail commercial will be directed to lands designated Mixed-Use. Retail uses will be encouraged to develop in combination with residential and office uses. While Employment Areas have a number of existing retail areas, they are not the preferred location for this type of use. Existing designated retail areas will be recognized by this Plan and further development of retail uses within the limits of land designated Mixed-Use is permitted; however, their expansion and the establishment of new major retail areas will not be allowed. Existing retail areas will be encouraged to redevelop to appropriate non-retail employment uses.” (Section 10.4)
City of Hamilton The Official Plan for Urban Areas was adopted July 9, 2009, and approved March 16, 2011. Mixed-Use Areas
The City Structure in the Official Plan is based on Nodes and Corridors which are the focus of reurbanization efforts, activity points for local communities, higher mixed-use densities, and vibrant pedestrian environments. The Nodes have a broad range and mix of uses that include retail and service functions. Corridors have a mixed-use function and provide retail stores and commercial services that cater to the weekly and daily needs of residents in surrounding areas. The land use designations identify a series of mixed-use designations that include Medium Density, High Density and Downtown. The majority of retail and service commercial will be directed to the mixed-use designations in the Nodes and Corridors. High Density mixed-use is intended to serve both a regional function as well as provide day to day needs of residents. Medium Density mixed-use is intended to recognize traditional main streets as well as other large commercial areas which are intended to evolve and intensify into mixed-use, pedestrian oriented areas.
Retail Areas The land use policies establish District and Arterial Commercial designations. District Commercial provide retail and service commercial uses to the immediate neighbourhood, may permit offices and residential above the first storey and are restricted to 25,000 m2 of retail and service commercial floor space with a maximum of 10,000 m2 for a single use. Retail and service application above 25,000 m2 will require an amendment to the urban structure to create a new node or extend an existing corridor. Arterial Commercial caters to the travelling public or drive-by traffic as well as land extensive retail stores that require outdoor storage or sales. Department and food stores, residential uses and stores selling
76
City of Guelph Commercial Policy Review Stage 1 Commercial Analysis and Background Report
76
Macaulay Shiomi Howson Ltd Tate Economic Research Inc.
Brook McIlroy Inc.
apparel, housewares, electronics, sporting good or general merchandise are not permitted in the Arterial Commercial designation.
Specific Land Uses
Local commercial uses catering to residents’ weekly and daily needs may be permitted in the Neighbourhoods designation in a variety of forms including single use buildings, plazas, main street configuration, and multi-storey buildings with ground floor commercial. Size is restricted to a maximum of 4 hectares and 10,000 m2 per site.

77
City of Guelph Commercial Policy Review Stage 1 Commercial Analysis and Background Report
77
Macaulay Shiomi Howson Ltd Tate Economic Research Inc.
Brook McIlroy Inc.
Appendix B – Summary of Stakeholder Interviews
City of Guelph Commercial Policy Review Stage 1 Commercial Analysis and Background Report
78
Macaulay Shiomi Howson Ltd Tate Economic Research Inc.
Brook McIlroy Inc.
Summary of Stakeholder Interviews Interviews were held with key stakeholders to determine their views on current and f uture commercial development trends in the City, and their implications with respect to policy and regulatory directions. The interviews were conducted on the basis of anonymity for all respondents. The respondents included landowners, developers and representatives of the Downtown Business Improvement Area. The City determined the stakeholders to be contacted by the study team. The interviews were guided by a list of questions prepared by the consulting team with input from City staff. The questions were provided to the respondents in advance. The interviews were conducted over the telephone and in person. Interviews were conducted from June to August 2017. The interviews were conducted with the following organizations:
• Armel Corporation • Belmont Equity Partners • Choice Properties Real Estate Investment Trust • Downtown Business Improvement Area (BIA) • Fieldgate Commercial Properties • First Capital Realty Inc. • Primaris Management Inc. • University of Guelph
Summary of Stakeholder Responses
1. What are the strengths, weaknesses, opportunities and challenges facing developers in the City of Guelph with respect to commercial development?
Strengths: • There actually is an articulated policy. Policies are clear and
developers understand them • The market is well positioned geographically, its growing and
desirable, there is a quality of life, university and education opportunities, a good strong workforce, attractive to employers, in a growing market place, with good disposable incomes
• Retailers are generally doing well • In the past, there has been very strong interest in Guelph • Not a lot of turnover in retail centres
Weaknesses: • E-commerce has resulted in a weakness in the market
City of Guelph Commercial Policy Review Stage 1 Commercial Analysis and Background Report
79
Macaulay Shiomi Howson Ltd Tate Economic Research Inc.
Brook McIlroy Inc.
• Tenants are vacating, downsizing, with people leaving the market
• Bricks and mortar are under pressure and the department store industry is in trouble (Target, now Sears)
• Large formats are going to smaller footprints, which is not particular to Guelph
• No obvious places to develop
Opportunities: • Nobody knows how much retail space per capita people need • E-commerce, other tenants going south/sideways. There are
opportunities for other retail/uses to backfill
Challenges: • There is not a lot of sites / options. For example, Costco does
not serve its population correctly from the west end, but it had no other options. Guelph is supposed to be “green, environmentally friendly”, and yet Costco is on the far west end of City
• Retail prospects are not as promising as when the last CPR was done
• Stone Road Mall is in a dominant position. However, secondary positions in the market are more challenging
• Risk is more retail coming to south end of City • Infrastructure risks in the downtown: electricity, gas, water,
sanitary and storm water infrastructure is old and re quires major updates
• Shared public parking supply in the downtown is a chronic problem with a permit waiting list in excess of 400, despite some partial relief coming
• Mixed-use is always a challenge. Planners and politicians want mixed-use, but the re is no market for ground floor retail with residential above it
• Mixed-use in a location such as Clair and Gordon does not make sense. Nobody wants to live with a big parking lot in front of their condo
• Limited parking in downtown • Lack of opportunities / properties • Delays in the planning process – perception of difficult to deal
with staff • Staff do not understand market realities / economics
2. Are you aware of the City’s Official Plan commercial policy
structure? How do you feel it is working?
City of Guelph Commercial Policy Review Stage 1 Commercial Analysis and Background Report
80
Macaulay Shiomi Howson Ltd Tate Economic Research Inc.
Brook McIlroy Inc.
• Allocated the retail space to the 4 corners in the south node (Clair and Gordon), and each corner is not large enough to get more than a food store site, as it limits larger stores
• No one big consolidated site that is large enough for development
• Costco is serving the entire City, but is located on the fringe. People travel across the City to get to Costco. It should have been more centralized
• City is lucky with Target leaving on Stone Road. If Target didn’t leave, there would be no location for Walmart as it couldn’t fit at Clair and Gordon
• There is no new City wide regional retail centre. Eventually as the City grows it can add another one
• Is there as much retail opportunity as planned for? • Planners dream of everyone walking, but everyone drives.
Guelph remains a suburban market • There are two (2) retail nodes that hav e not developed –
Silvercreek and Starwood / Watson
3. What are the current trends in retail development? (e.g. business trends, land development trends, etc.)
• E-commerce - the online dominance by Amazon • Finding high quality non-generic retailers is harder than ever • The relationship between land and construction costs and what
retailers can afford to pay and remain viable is a s erious conundrum
• Formats are typically becoming smaller for goods, even Walmart is getting smaller
• A lot of focus is on food and entertainment • Limited growth in bricks and mortar. There are fewer larger
boxes and not as many participants, particularly in the fashion category
• Smaller, shorter buildings that have a pedestrian scale. Smaller stores, don’t have an overbearing presence, and customers can relate to it – 1,500 or 1,200 square feet. Dropping the height to 12 – 13 feet makes it feel more quaint and not like a warehouse
• Supermarkets and discount retailers are growing • Grocery stores, quick service restaurants (QSR), medical space,
dollar stores and LCBO are expanding • Trend towards lifestyle centres. Live/Work/Play employment
lands, retirement homes • On-line shopping fulfillment spaces/ pickup centres such as
Penguin Pickup and Loblaws Click & Collect • Lots of Service Commercial
City of Guelph Commercial Policy Review Stage 1 Commercial Analysis and Background Report
81
Macaulay Shiomi Howson Ltd Tate Economic Research Inc.
Brook McIlroy Inc.
• Big Box is dying • Restaurants are evolving as event space • Land prices increasing, rental rates are not. Retail projects are
no longer viable • Need a broader definition of retail space
4. What types of stores, services or retail formats are
underrepresented in the Guelph marketplace?
• Almost over retailed. There are some good assets but some are struggling
• Variations on quick service restaurants, where customers can sit down, similar concept to Kelsey’s
• Nobody is doing fashion • West end – drug stores, restaurants • Home improvement in the west or south • Furniture – lack of quality furniture stores
5. What is the impact of E-commerce on retail demand?
• Fashion is not being built • Smaller store footprints • Consciously pursue a tenant mix that is more resilient. Such as
daily needs, daycares, doctors, gyms, those in turn bring in customers to grocery stores, etc.
• More focus on restaurants – can’t eat on-line, opportunity for food is expanding. Shift in the way society approaches food
• Difficult to define actual impact. Figures indicates 10% or 15% of total retail sales go to online retailers. How does that affect mall sales – mall sales are up year to year, continuing pattern. Retail sales not declining in stores
• Online grocery will impact traditional grocery stores. Amazon buying Whole Foods, still waiting to see the reaction
• Tends to be tenant category specific. Channels are very crowded, thousands of E-commerce sites, need a store front presence
• Impact of E-commerce tends to be levelling off and degree of increase is declining. E-commerce may actually be going down
• Can accomplish same sales out of smaller store with E-commerce. Ship from cheap warehouse stores. Stores like Best Buy are now showrooms, not stores in the traditional sense
6. What are your comments on recent retail growth in the City within the Nodes and Corridors (Paisley and Imperial, Clair and
City of Guelph Commercial Policy Review Stage 1 Commercial Analysis and Background Report
82
Macaulay Shiomi Howson Ltd Tate Economic Research Inc.
Brook McIlroy Inc.
Gordon, etc.) or within the downtown? Has development met market demand?
• Generally, yes in the south, west and north • In Clair and Gordon there is more retail than is required. Choice
has more to build out • South west corner is being built out quickly
7. What opportunities exist for Downtown? What should its role
and function be within the City’s commercial structure?
• Downtown is well done. More and more reasons for people to go there
• Downtowns – differentiation there is key. C ommercial is only one element. To be successful, it would have to be even more differentiated
• Office uses downtown – concentrated downtown, by putting second floor downtown. The City should also look at increased residential in the downtown. M ultipurpose - Cultural and institutional uses, core and hub of City
• Guelph Downtown needs improvement • Opportunity to improve. Make it more colourful, more active • Traditional old downtown, beauty of buildings, revamping
buildings, strengths are to rely on it being historic and quaint • Educational institutions, the YMCA, and others to pull together a
mixed-use (commercial/institutional/residential) project which features the City of Guelph Library
• Demand will grow in the 5-year horizon. Downtown will be underserved with retail in the future
• Downtown, residential 10-15 stories, getting lots of opposition • Strip malls provide mixed-use centre opportunity • No major food store serving downtown, - there is enough
population to support it and population is increasing • Success of Bread Bar/LCBO/Goodness Me! plaza in the
downtown area demonstrates the appetite for central commercial development when high quality tenants, in desirable locations, with adequate parking and o ther infrastructure is available
• High activation area at street level supported by mixed daytime and nighttime draws
• Unique retailers, can’t or don’t want to be in malls, not a national, local flavour, unique. Get a mix of compelling reasons
• Zones and permissions to allow more uses • Attract more, daytime life is lacking. Lu nch / brunch. G ive
downtown more vibrancy
City of Guelph Commercial Policy Review Stage 1 Commercial Analysis and Background Report
83
Macaulay Shiomi Howson Ltd Tate Economic Research Inc.
Brook McIlroy Inc.
• More residential density is required • Clean up the south end of the Downtown and add mixed-use
8. In your opinion, why has there been limited commercial
development in the East node at Watson Parkway North and Starwood Drive?
• Loblaws owns the site. It’s a business decision • Loblaws serves the market from its expanded Eramosa Road
store. A new store would not provide a net gain to Loblaws • Not a great node location. It should be located on Highway 7.
On Highway 7, it would be accessible /visible beyond the locals. Limited traffic on Watson
• Its too big for the neighbourhood / the neighbourhood is too small to support it
• No reason to go to Watson and Starwood. You would have to live there to ever go there. T he neighbourhood is not a destination. No reason to go east
• Many other Zehrs (Loblaws) stores, no reason to go there • A review of aerial imagery indicates it is surrounded by natural
areas. T herefore, it is a 1 or 2-sided market. S outh is industrial, east is agricultural and will be for a long time. Housing to the north and west
• Daily needs of local residents are served by retail to the north • Hard time attracting anyone beyond a f ood store. N o small
retailers will go there on their own • Locational challenges, close to urban boundary, “outboard vs
inboard” between natural flows of expenditures • Initial review of market potential has indicated not a l ot of
future growth in area. If it hasn’t happened yet, is there an upswing that will make it viable
• Poorly master planned • Market opportunity exists for certain uses. For example, there
is no place for lunch in the east end • Supermarket anchor is the key consideration
9. What expansion opportunities are there for existing retailers to
provide new locations in underserved parts of Guelph, or the opportunity for retailers who are not in Guelph to open a location there? Are there retail categories that are underrepresented in Guelph?
• There is a shortage of high quality independent retailers
everywhere • Not many need a 2nd location. Everybody else is good
City of Guelph Commercial Policy Review Stage 1 Commercial Analysis and Background Report
84
Macaulay Shiomi Howson Ltd Tate Economic Research Inc.
Brook McIlroy Inc.
• Near Clair and Gordon, there is still enough vacant land. The challenge is to find a retailer that isn’t already in the node
• Lowe’s • Stone Road Mall can currently serve the south. In 10 -15 years,
Pergola Site may be another opportunity • Grocery store interest in the east end. T here may be
commercial sites that c an be created from the industrial lands on York
10. What are and where are the near term (five years) retail opportunities in Guelph? Long term (twenty years)?
5 years: • Downtown, focus residential growth there, opportunity for
commercial growth • Opportunity for new retailers. Fashion/ Apparel • Sears – redevelopment option. Potentially a mixed-use,
restaurant experience • Grocery
20 years: • Need another node, along Hanlon in the south, maybe at Clair.
Need another Regional serving centre, as Stone Road Mall is space limited
• In 10 plus years, ability to do some mixed-use on retail sites. Adding rental residential, or retirement home if market warrants. Ability to move some tenants around
• Longer term urban boundary expansion
11. Is there enough vacant commercial land designated to meet future supply? Is it adequately located, appropriately sized?
• Yes, well saturated with current nodes • No more land is needed for another 10 years. There will be
more demand for more retail land after that • The City is well anchored with four (4) nodes. Silvercreek is still
vacant. Lots of supply. The City is still growing, Clair Maltby, expanding development boundary. Future opportunities exist for smaller neighbourhood commercial
• Need more commercial land in the east • No suitable sized sites are available for development
12. Can you provide an example of any Guelph policies or
regulations that limit the feasibility of developing a retail project or mixed-use project with retail uses?
City of Guelph Commercial Policy Review Stage 1 Commercial Analysis and Background Report
85
Macaulay Shiomi Howson Ltd Tate Economic Research Inc.
Brook McIlroy Inc.
• Caps are problematic. 4 8,500 square metres at Clair and Gordon is going to be an i ssue. I f City wants to encourage retailers, they have to ensure right mix and flexibility
• The maximum size of retail units at 50,000 square feet is restrictive
• Parking ratios are a concern • Uses – There should be a full range of complementary uses for
shopping centres - for example day cares as a permitted use • Retail can mean anything, daycare or educational spaces, as
well as a lot of permitted uses that don’t exist anymore (e.g. carnival). Can’t keep up with their definition of retail, as it keeps changing
• Minimum building heights are an issue • Flexibility is required – the policies requiring doors and windows
facing the street is a problem especially for smaller retailers who can’t accommodate two sets of doors
• Watson / Starwood an example of poor planning
13. What policy regulations or incentives, if any, would make retail or retail / mixed-use developments more feasible?
• Location factors are the most important, not the policies • Mixed-use in the Downtown may work • Nowhere else in the City (aside from downtown) will mixed-use
work in next 15-20 years. For a vertical integrated project, the only viable location is downtown. Nobody in Clair and Gordon wants to live in a condo. If they do, they don’t want to live in a retail centre
• Development Charge credits for mixed-use, especially for demolition of existing buildings. Anything that makes financial sense to relocate tenants or demolish
• Development Charges, off sites costs, are problems for developers. The challenge is that the City wants more in addition to what developers do on-site. Rent is the base line. Its what they can pay. The City should be mindful of how much things cost
• Streamline policies from an urban design point of view. Simplify the process
• Need more permissive policies for drive thru restaurants
14. What are your comments on the economic viability of vertical mixed-use development in the City?
• Not viable
City of Guelph Commercial Policy Review Stage 1 Commercial Analysis and Background Report
86
Macaulay Shiomi Howson Ltd Tate Economic Research Inc.
Brook McIlroy Inc.
• There is no market for second storey outside of the downtown. The City is always looking for it
• There is no market for 2nd storey space in the east. Offi ces should go downtown
• There could be a future opportunity for it but at this stage, no. Perhaps 20 years from now, 40 years from now
• Opportunities exist in the Downtown or perhaps near Stone Road Mall, but not on a large scale
• There are many issues for retail space in a mixed-use context – ceilings heights, loading, garbage, interaction between residential and retail, patios, encroachment agreements. There should be incentives for the right kind of retail, as the developer may have to sit on vacant retail space
• 2nd storey office might work, but 2 nd storey residential doesn’t work Construction economies don’t work. T here are no cost savings in wood construction
• Storage might work on 3 to 4 floors • Retailers tend to dislike condo developments. Need condo
board approval for uses, signages, etc. • The financial return is not there in a 2 storey to 8 storey
building. Not economically viable until 9 to 15 storeys
15. What are your firm’s future plans with respect to commercial development in Guelph?
• Enough designated retail land. Not enough demand or tenants to fill it
• Trying to redesignate land to residential • Will do small retail. City is requiring a mix of uses • Not expanding ownership in Guelph • Guelph is stable, good assets, but not looking to expand in
Guelph • Lowes still interested in Guelph • Renovations planned for Stone Road Mall
16. Are there any additional insights into commercial development
in Guelph that you would like to provide?
• There is an opportunity to re-evaluate parking ratios. We don’t need as much parking as we did 10 years ago
• Urban design requirements from the City do not make operational sense – for example requirements for glazing, shelving against wall, entrances on street. Tenants cannot afford them

85
City of Guelph Commercial Policy Review Stage 1 Commercial Analysis and Background Report
85
Macaulay Shiomi Howson Ltd Tate Economic Research Inc.
Brook McIlroy Inc.
Appendix C – Licence Plate Survey Results
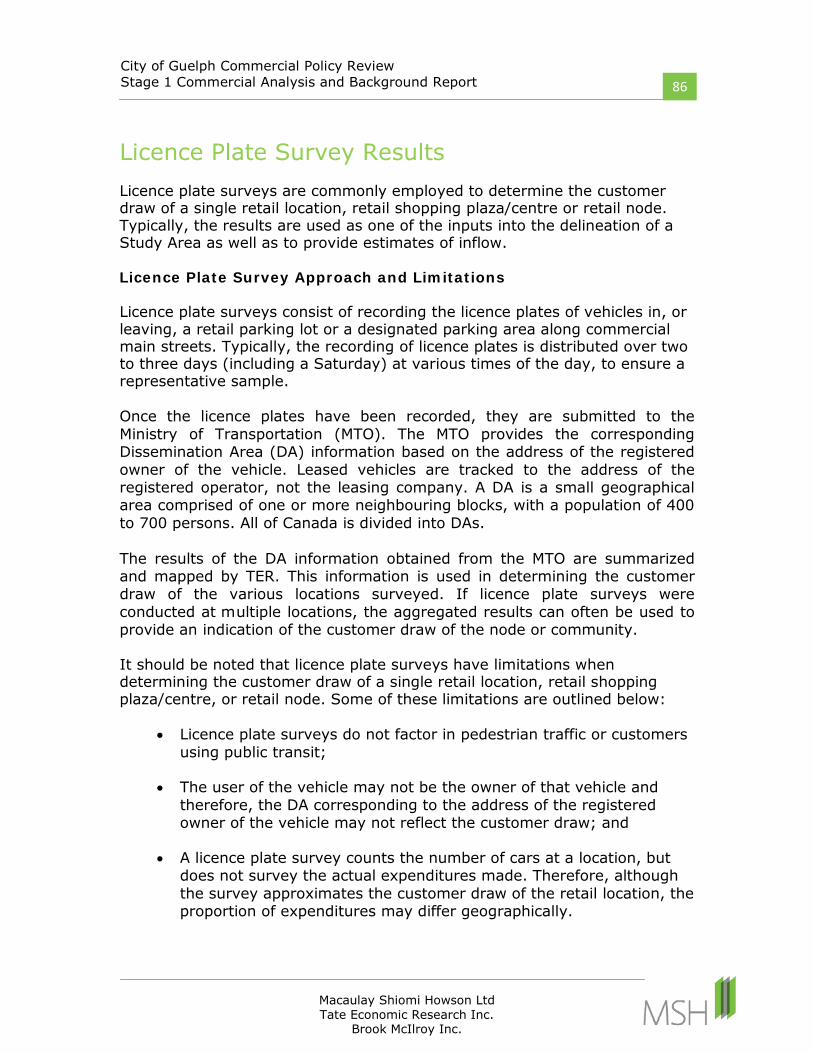
City of Guelph Commercial Policy Review Stage 1 Commercial Analysis and Background Report
86
Macaulay Shiomi Howson Ltd Tate Economic Research Inc.
Brook McIlroy Inc.
Licence Plate Survey Results Licence plate surveys are commonly employed to determine the customer draw of a single retail location, retail shopping plaza/centre or retail node. Typically, the results are used as one of the inputs into the delineation of a Study Area as well as to provide estimates of inflow.
Licence Plate Survey Approach and Limitations
Licence plate surveys consist of recording the licence plates of vehicles in, or leaving, a retail parking lot or a designated parking area along commercial main streets. Typically, the recording of licence plates is distributed over two to three days (including a Saturday) at various times of the day, to ensure a representative sample.
Once the licence plates have been recorded, they are submitted to the Ministry of Transportation (MTO). The MTO provides the corresponding Dissemination Area (DA) information based on the address of the registered owner of the vehicle. Leased vehicles are tracked to the address of the registered operator, not the leasing company. A DA is a small geographical area comprised of one or more neighbouring blocks, with a population of 400 to 700 persons. All of Canada is divided into DAs. The results of the DA information obtained from the MTO are summarized and mapped by TER. This information is used in determining the customer draw of the various locations surveyed. If licence plate surveys were conducted at multiple locations, the aggregated results can often be used to provide an indication of the customer draw of the node or community. It should be noted that licence plate surveys have limitations when determining the customer draw of a single retail location, retail shopping plaza/centre, or retail node. Some of these limitations are outlined below:
• Licence plate surveys do not factor in pedestrian traffic or customers using public transit;
• The user of the vehicle may not be the owner of that vehicle and therefore, the DA corresponding to the address of the registered owner of the vehicle may not reflect the customer draw; and
• A licence plate survey counts the number of cars at a location, but does not survey the actual expenditures made. Therefore, although the survey approximates the customer draw of the retail location, the proportion of expenditures may differ geographically.
City of Guelph Commercial Policy Review Stage 1 Commercial Analysis and Background Report
87
Macaulay Shiomi Howson Ltd Tate Economic Research Inc.
Brook McIlroy Inc.
Despite these limitations, a licence plate survey is a valuable tool when determining the customer draw of a single retail location, retail shopping plaza/centre, retail node or municipality.
Licence Plate Survey
TER conducted licence plate surveys at the following locations:
• Downtown Guelph;
• Stone Road Mall;
• Woodlawn Rd. & Woolwich St. (Walmart);
• Paisley Rd. & Imperial Rd. (Costco); and
• Gordon St. & Clair Rd. (Clairfield Commons & Zehrs).
The survey distribution for each of the above five locations is illustrated in Figure C-1. The time periods, distributions and locations of the sampling areas were determined by TER. The survey was conducted by TER over three days: Thursday June 8th, Friday June 9th, and Saturday June 10th, 2017. In total, 2,250 licence plate surveys were recorded. Overall in the sample, TER identified 16 non-Ontario licence plates and 5 American plates which were removed from the sample submitted to the MTO. As a result, a total of 2,229 licence plate surveys were submitted to the MTO and 2,131 were returned as DA codes. The 16 non-Ontario plates and 5 American plates were inserted back in the sample and were considered as inflow in this analysis which resulted in a total of 2,152 plates being analyzed in Figure C-2.
List of Figures
Figure C-1: Vehicle Licence Plate Survey Sampling Distribution Figure C-2: Vehicle Licence Plate Survey Results by Location Figure C-3: Downtown Licence LP Survey Results Figure C-4: Stone Road Mall LP Survey Results Figure C-5: Woodlawn Rd. & Woolwich St. (Walmart) LP Survey Results Figure C-6: Paisley Rd. & Imperial Rd. (Costco) LP Survey Results Figure C-7: Gordon St. & Clair Rd. (Clairfield Commons & Zehrs) LP Survey Results
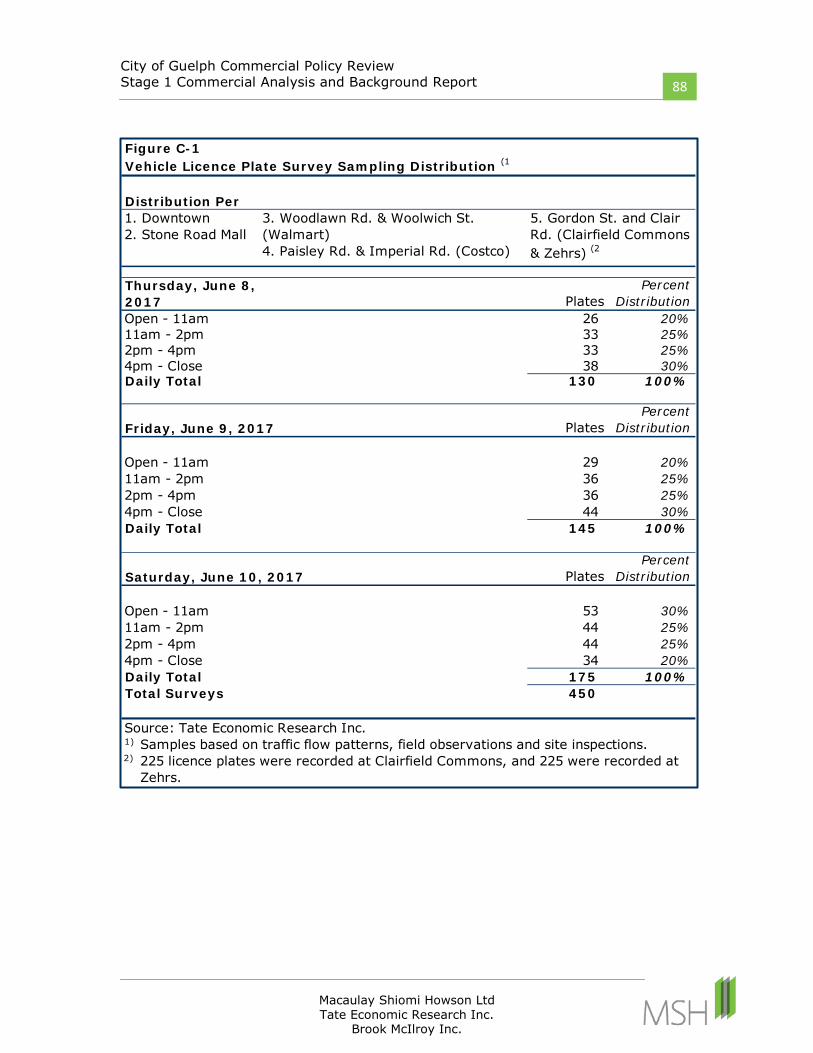
City of Guelph Commercial Policy Review Stage 1 Commercial Analysis and Background Report
88
Macaulay Shiomi Howson Ltd Tate Economic Research Inc.
Brook McIlroy Inc.
Figure C-1Vehicle Licence Plate Survey Sampling Distribution (1
PlatesPercent
DistributionOpen - 11am 26 20%11am - 2pm 33 25%2pm - 4pm 33 25%4pm - Close 38 30%
130 100%
Friday, June 9, 2017 PlatesPercent
Distribution
Open - 11am 29 20%11am - 2pm 36 25%2pm - 4pm 36 25%4pm - Close 44 30%Daily Total 145 100%
Saturday, June 10, 2017 PlatesPercent
Distribution
Open - 11am 53 30%11am - 2pm 44 25%2pm - 4pm 44 25%4pm - Close 34 20%Daily Total 175 100%Total Surveys 450
Source: Tate Economic Research Inc. 1)
2) 225 licence plates were recorded at Clairfield Commons, and 225 were recorded at Zehrs.
Samples based on traffic flow patterns, field observations and site inspections.
Daily Total
Distribution Per 1. Downtown 2. Stone Road Mall
5. Gordon St. and Clair Rd. (Clairfield Commons & Zehrs) (2
Thursday, June 8, 2017
3. Woodlawn Rd. & Woolwich St. (Walmart)4. Paisley Rd. & Imperial Rd. (Costco)
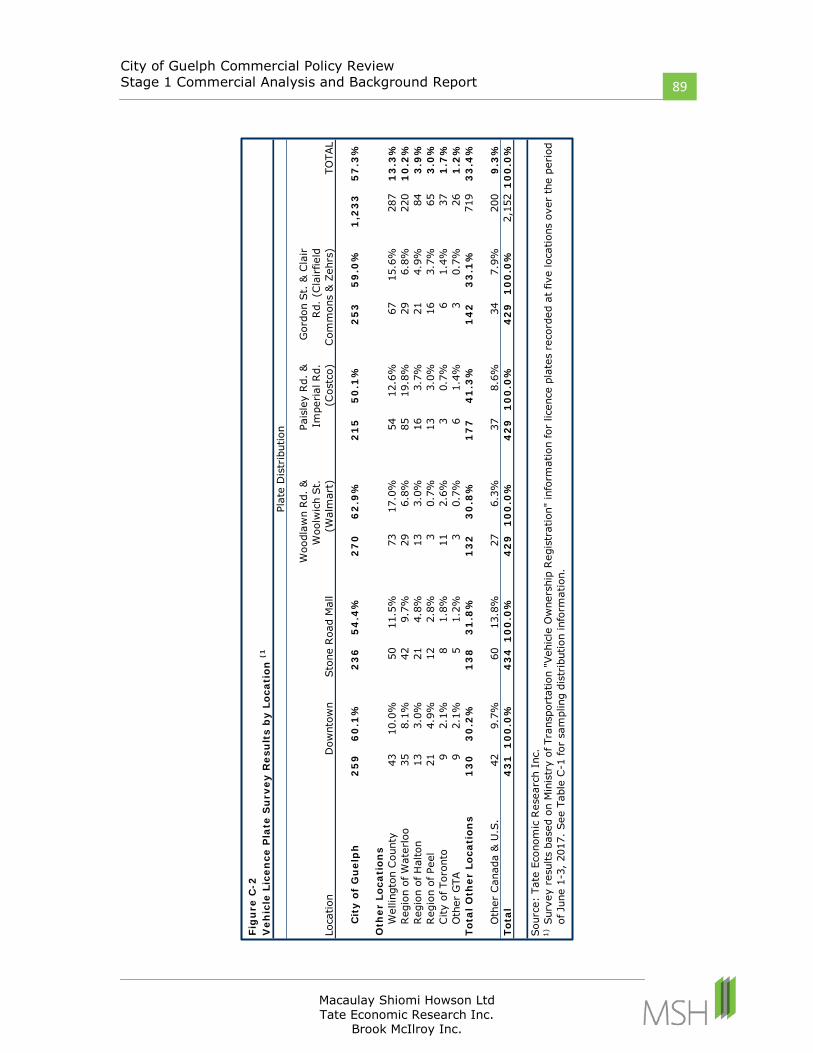
City of Guelph Commercial Policy Review Stage 1 Commercial Analysis and Background Report
89
Macaulay Shiomi Howson Ltd Tate Economic Research Inc.
Brook McIlroy Inc.
Fig
ure
C-2
Veh
icle
Lic
ence
Pla
te S
urv
ey R
esu
lts
by
Loca
tion
(1
Loca
tion
Cit
y of
Gu
elp
h2
59
60
.1%
23
65
4.4
%2
70
62
.9%
21
55
0.1
%2
53
59
.0%
1,2
33
57
.3%
Oth
er L
ocat
ion
sW
ellin
gton
Cou
nty
4310
.0%
5011
.5%
7317
.0%
5412
.6%
6715
.6%
287
13
.3%
Reg
ion
of W
ater
loo
358.
1%42
9.7%
296.
8%85
19.8
%29
6.8%
220
10
.2%
Reg
ion
of H
alto
n13
3.0%
214.
8%13
3.0%
163.
7%21
4.9%
843
.9%
Reg
ion
of P
eel
214.
9%12
2.8%
30.
7%13
3.0%
163.
7%65
3.0
%C
ity o
f Tor
onto
92.
1%8
1.8%
112.
6%3
0.7%
61.
4%37
1.7
%O
ther
GTA
92.
1%5
1.2%
30.
7%6
1.4%
30.
7%26
1.2
%To
tal O
ther
Loc
atio
ns
13
03
0.2
%1
38
31
.8%
13
23
0.8
%1
77
41
.3%
14
23
3.1
%71
93
3.4
%
Oth
er C
anad
a &
U.S
.42
9.7%
6013
.8%
276.
3%37
8.6%
347.
9%20
09
.3%
Tota
l 4
31
10
0.0
%4
34
10
0.0
%4
29
10
0.0
%4
29
10
0.0
%4
29
10
0.0
%2,
152
10
0.0
%
Sour
ce:
Tate
Eco
nom
ic R
esea
rch
Inc.
1)
TOTA
L
Plat
e D
istr
ibut
ion
Surv
ey r
esul
ts b
ased
on
Min
istr
y of
Tra
nspo
rtat
ion
"Veh
icle
Ow
ners
hip
Reg
istr
atio
n" in
form
atio
n fo
r lic
ence
pla
tes
reco
rded
at
five
loca
tions
ove
r th
e pe
riod
of
Jun
e 1-
3, 2
017.
See
Tab
le C
-1 fo
r sa
mpl
ing
dist
ribu
tion
info
rmat
ion.
Dow
ntow
nSt
one
Roa
d M
all
Gor
don
St.
& C
lair
R
d. (
Cla
irfie
ld
Com
mon
s &
Zeh
rs)
Woo
dlaw
n R
d. &
W
oolw
ich
St.
(Wal
mar
t)
Pais
ley
Rd.
&
Impe
rial
Rd.
(C
ostc
o)
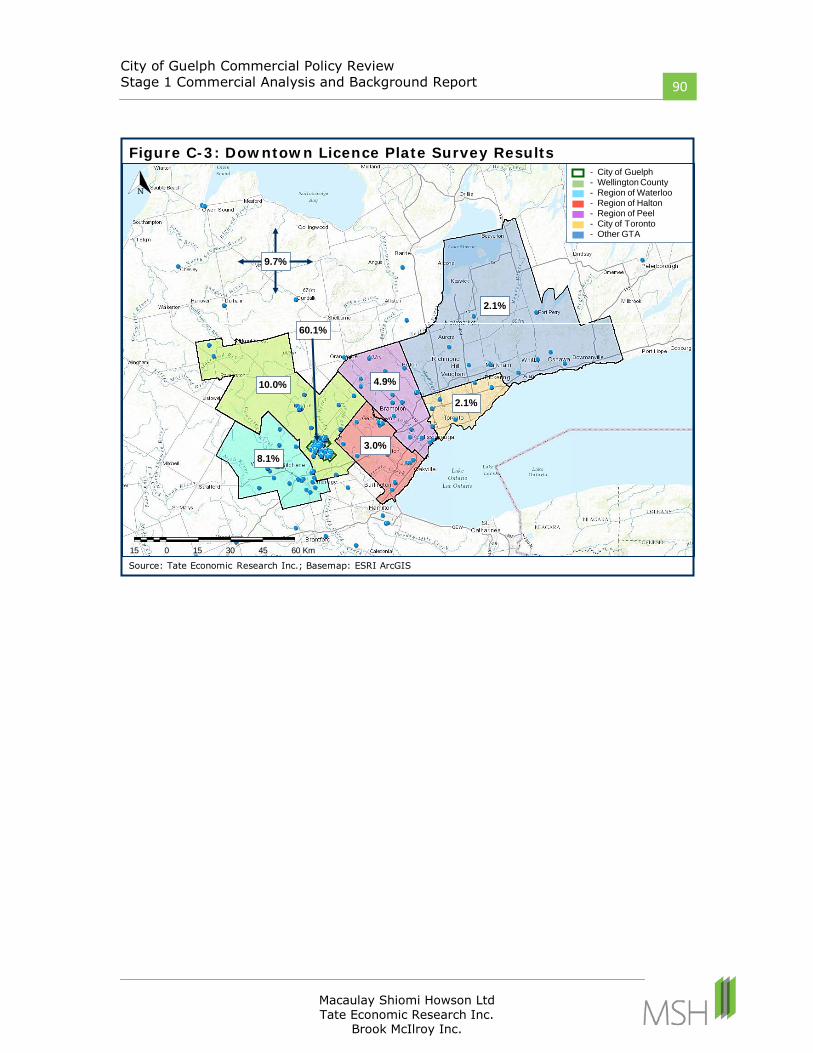
City of Guelph Commercial Policy Review Stage 1 Commercial Analysis and Background Report
90
Macaulay Shiomi Howson Ltd Tate Economic Research Inc.
Brook McIlroy Inc.
Figure C-3: Downtown Licence Plate Survey Results - City of Guelph- Wellington County- Region of Waterloo- Region of Halton- Region of Peel- City of Toronto- Other GTA
60 Km453015015
2.1%
2.1%
4.9%
3.0%8.1%
10.0%
60.1%
9.7%
Source: Tate Economic Research Inc.; Basemap: ESRI ArcGIS
City of Guelph Commercial Policy Review Stage 1 Commercial Analysis and Background Report
91
Macaulay Shiomi Howson Ltd Tate Economic Research Inc.
Brook McIlroy Inc.
Figure C-4: Stone Road Mall Licence Plate Survey Results - City of Guelph- Wellington County- Region of Waterloo- Region of Halton- Region of Peel- City of Toronto- Other GTA
60 Km453015015
1.2%
1.8%
2.8%
4.8%9.7%
11.5%
54.4%
13.8%
Source: Tate Economic Research Inc.; Basemap: ESRI ArcGIS
City of Guelph Commercial Policy Review Stage 1 Commercial Analysis and Background Report
92
Macaulay Shiomi Howson Ltd Tate Economic Research Inc.
Brook McIlroy Inc.
Figure C-5: Woodlawn Rd. & Woolwich St. (Walmart) Licence Plate Survey Results
- City of Guelph- Wellington County- Region of Waterloo- Region of Halton- Region of Peel- City of Toronto- Other GTA
60 Km453015015
0.7%
2.6%
0.7%
3.0%6.8%
17.0%
62.9%
6.3%
Source: Tate Economic Research Inc.; Basemap: ESRI ArcGIS
City of Guelph Commercial Policy Review Stage 1 Commercial Analysis and Background Report
93
Macaulay Shiomi Howson Ltd Tate Economic Research Inc.
Brook McIlroy Inc.
- City of Guelph- Wellington County- Region of Waterloo- Region of Halton- Region of Peel- City of Toronto- Other GTA
60 Km453015015
1.4%
0.7%
3.0%
3.7%19.8%
12.6%
50.1%
8.6%
Source: Tate Economic Research Inc.; Basemap: ESRI ArcGIS
Figure C-6: Paisley Rd. & Imperial Rd. (Costco) Licence Plate Survey Results
City of Guelph Commercial Policy Review Stage 1 Commercial Analysis and Background Report
94
Macaulay Shiomi Howson Ltd Tate Economic Research Inc.
Brook McIlroy Inc.
Figure C-7: Gordon St. & Clair Rd. (Clairfield Commons & Zehrs Licence Plate Survey Results)
- City of Guelph- Wellington County- Region of Waterloo- Region of Halton- Region of Peel- City of Toronto- Other GTA
60 Km453015015
0.7%
1.4%
3.7%
4.9%6.8%
15.6%
59.0%
7.9%
Source: Tate Economic Research Inc.; Basemap: ESRI ArcGIS
95
City of Guelph Commercial Policy Review Stage 1 Commercial Analysis and Background Report
95
Macaulay Shiomi Howson Ltd Tate Economic Research Inc.
Brook McIlroy Inc.
Appendix D – Guelph In-Home Consumer Survey Results
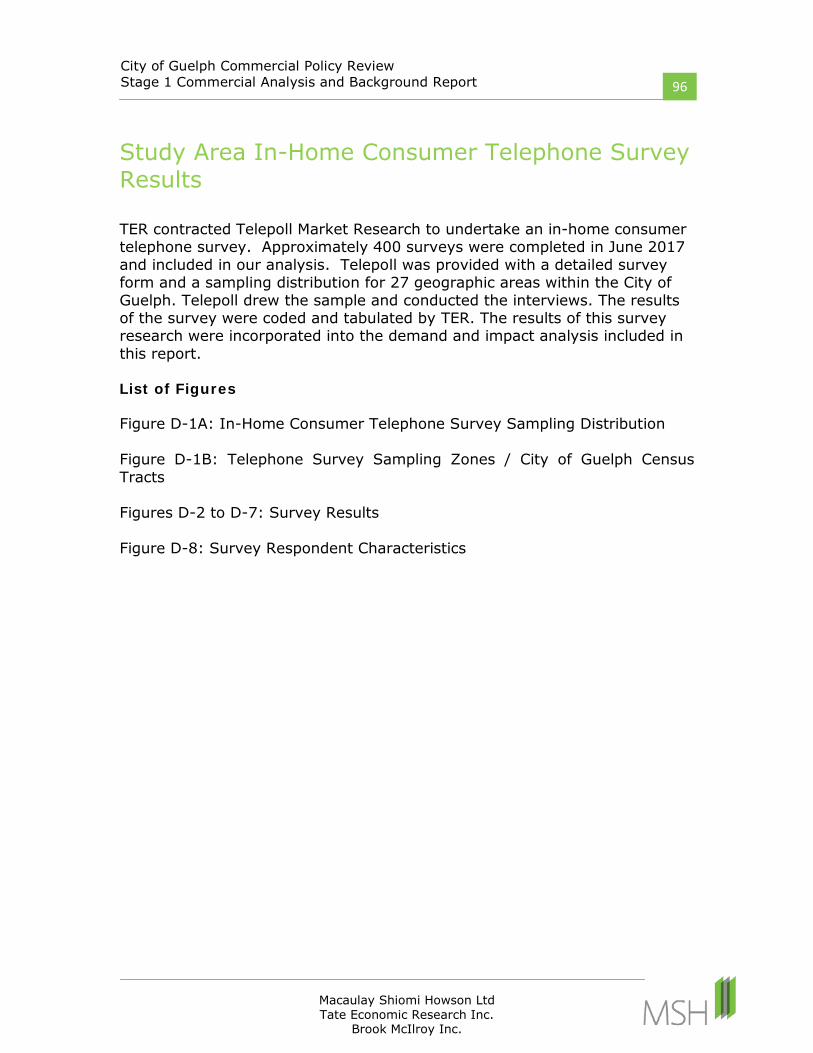
City of Guelph Commercial Policy Review Stage 1 Commercial Analysis and Background Report
96
Macaulay Shiomi Howson Ltd Tate Economic Research Inc.
Brook McIlroy Inc.
Study Area In-Home Consumer Telephone Survey Results TER contracted Telepoll Market Research to undertake an in-home consumer telephone survey. Approximately 400 surveys were completed in June 2017 and included in our analysis. Telepoll was provided with a detailed survey form and a sampling distribution for 27 geographic areas within the City of Guelph. Telepoll drew the sample and conducted the interviews. The results of the survey were coded and tabulated by TER. The results of this survey research were incorporated into the demand and impact analysis included in this report.
List of Figures
Figure D-1A: In-Home Consumer Telephone Survey Sampling Distribution Figure D-1B: Telephone Survey Sampling Zones / City of Guelph Census Tracts Figures D-2 to D-7: Survey Results Figure D-8: Survey Respondent Characteristics
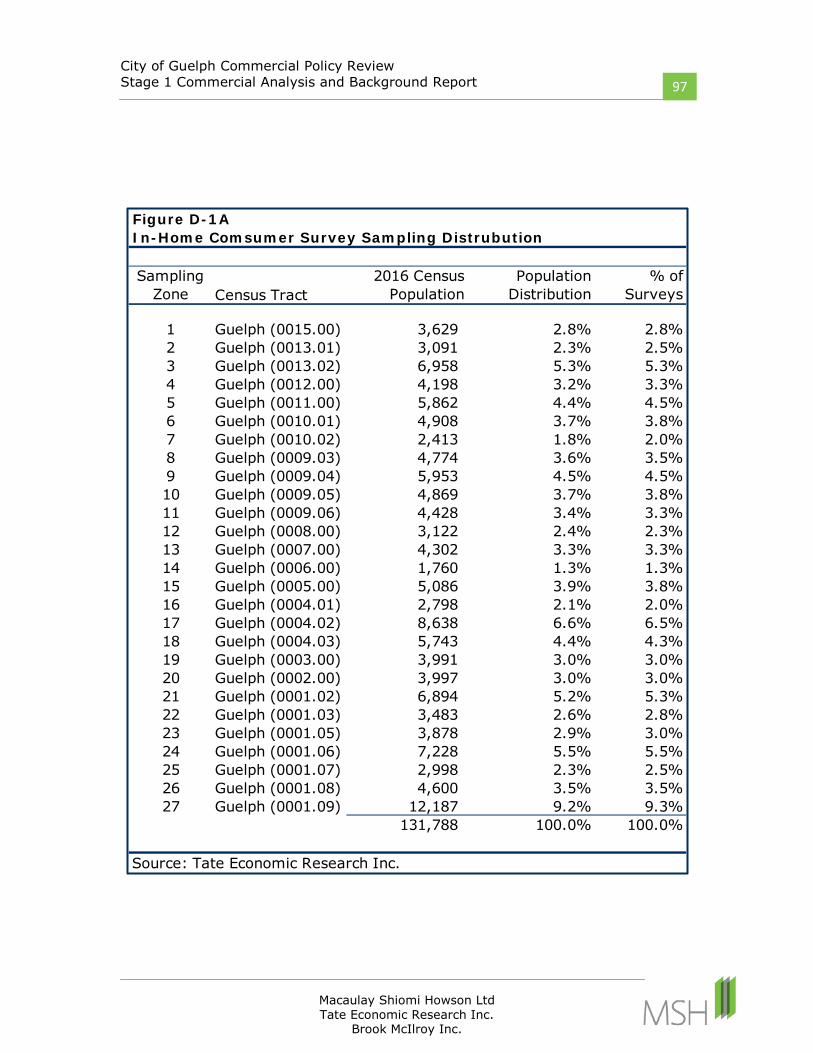
City of Guelph Commercial Policy Review Stage 1 Commercial Analysis and Background Report
97
Macaulay Shiomi Howson Ltd Tate Economic Research Inc.
Brook McIlroy Inc.
Figure D-1AIn-Home Comsumer Survey Sampling Distrubution
Sampling Zone Census Tract
2016 Census Population
Population Distribution
% of Surveys
1 Guelph (0015.00) 3,629 2.8% 2.8%2 Guelph (0013.01) 3,091 2.3% 2.5%3 Guelph (0013.02) 6,958 5.3% 5.3%4 Guelph (0012.00) 4,198 3.2% 3.3%5 Guelph (0011.00) 5,862 4.4% 4.5%6 Guelph (0010.01) 4,908 3.7% 3.8%7 Guelph (0010.02) 2,413 1.8% 2.0%8 Guelph (0009.03) 4,774 3.6% 3.5%9 Guelph (0009.04) 5,953 4.5% 4.5%10 Guelph (0009.05) 4,869 3.7% 3.8%11 Guelph (0009.06) 4,428 3.4% 3.3%12 Guelph (0008.00) 3,122 2.4% 2.3%13 Guelph (0007.00) 4,302 3.3% 3.3%14 Guelph (0006.00) 1,760 1.3% 1.3%15 Guelph (0005.00) 5,086 3.9% 3.8%16 Guelph (0004.01) 2,798 2.1% 2.0%17 Guelph (0004.02) 8,638 6.6% 6.5%18 Guelph (0004.03) 5,743 4.4% 4.3%19 Guelph (0003.00) 3,991 3.0% 3.0%20 Guelph (0002.00) 3,997 3.0% 3.0%21 Guelph (0001.02) 6,894 5.2% 5.3%22 Guelph (0001.03) 3,483 2.6% 2.8%23 Guelph (0001.05) 3,878 2.9% 3.0%24 Guelph (0001.06) 7,228 5.5% 5.5%25 Guelph (0001.07) 2,998 2.3% 2.5%26 Guelph (0001.08) 4,600 3.5% 3.5%27 Guelph (0001.09) 12,187 9.2% 9.3%
131,788 100.0% 100.0%
Source: Tate Economic Research Inc.
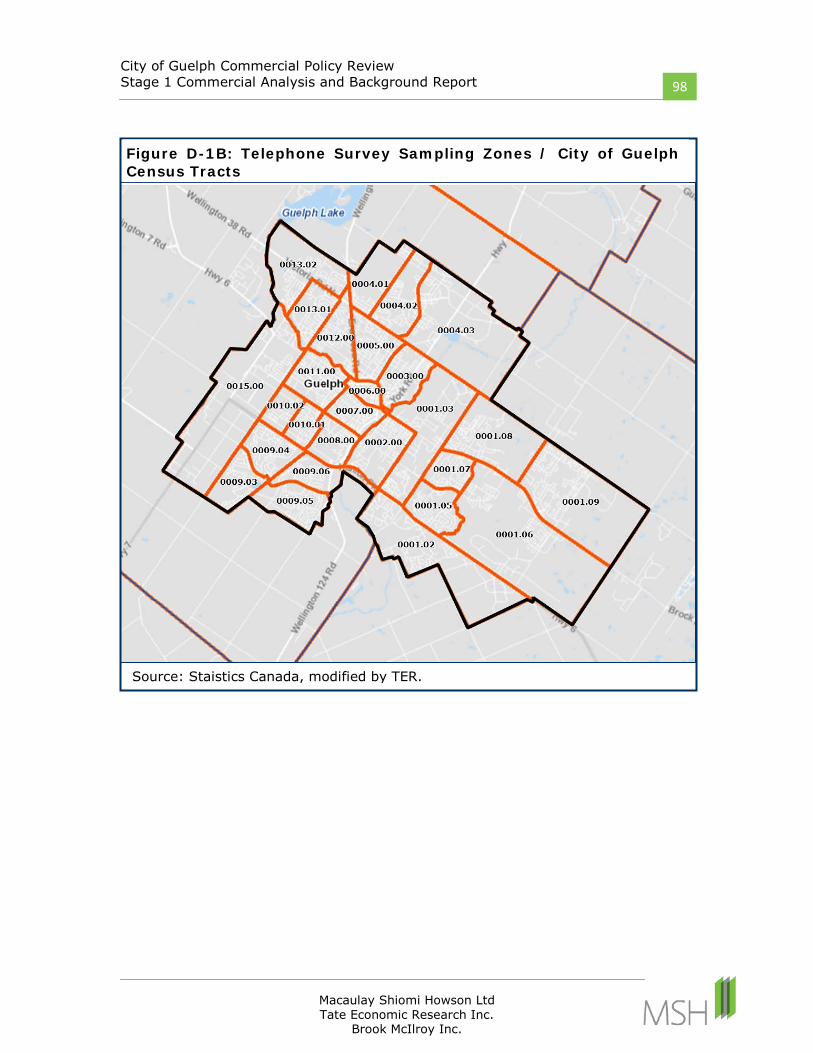
City of Guelph Commercial Policy Review Stage 1 Commercial Analysis and Background Report
98
Macaulay Shiomi Howson Ltd Tate Economic Research Inc.
Brook McIlroy Inc.
Figure D-1B: Telephone Survey Sampling Zones / City of Guelph Census Tracts
Source: Staistics Canada, modified by TER.
City of Guelph Commercial Policy Review Stage 1 Commercial Analysis and Background Report
99
Macaulay Shiomi Howson Ltd Tate Economic Research Inc.
Brook McIlroy Inc.
Figure D-2
Guelph
GuelphWalmart - 175 Stone Road West - Guelph 17.4%Walmart - 11 Woodlawn Road West - Guelph 40.8%Sears - Stone Road Mall - Guelph 26.7%Subtotal Guelph 84.9%
Other Hudson's BayHudson's Bay - Cambridge 4.6%Hudson's Bay - Kitchener 2.0%Hudson's Bay - Waterloo 1.6%Hudson's Bay - Toronto 1.8%Hudson's Bay - Other Ontario 1.4%Subtotal The Bay 11.4%
Other Department Stores OntarioWalmart - Other Ontario 0.8%Sears - Other Ontario 0.7%Nordstrom - Toronto 1.1%Subtotal Other Department Stores Ontario 2.6%
USANordstrom - USA 0.5%Macys - USA 0.3%Target - USA 0.3%Subtotal USA 1.1%
Total 100.0%
Source: Tate Economic Research Inc.
Question 1 - Summary of City of Guelph Residents Department Store Expenditures by Location (past 3 months)
Note: Expenditures are based on the results of the in-home consumer telephone survey completed on behalf of TER in June 2017. These results have not been adjusted or calibrated. Subtotals may not add due to rounding. Margin of Error is +/- 6.9% 19 times out of 20.
City of Guelph Commercial Policy Review Stage 1 Commercial Analysis and Background Report
100
Macaulay Shiomi Howson Ltd Tate Economic Research Inc.
Brook McIlroy Inc.
Figure D-3
Guelph
Costco - Guelph 99.7%Costco - Kitchener 0.2%Costco - Other Ontario 0.1%
Total 100.0%
Source: Tate Economic Research Inc.
Question 2 - Summary of City of Guelph Residents Warehouse Membership Club Expenditures (past 3 months)
Note: Expenditures are based on the results of the in-home consumer telephone survey completed on behalf of TER in June 2017. These results have not been adjusted or calibrated. Subtotals may not add due to rounding. Margin of Error is +/- 6.9% 19 times out of 20.
Figure D-4
Guelph
GuelphCanadian Tire - 127 Stone Road West - Guelph 57.3%Canadian Tire - 20 Woodlawn Road East - Guelph 40.5%Subtotal Guelph 97.9%
OtherCanadian Tire - Other Ontario 2.1%Subtotal Other 2.1%
Total 100.0%
Source: Tate Economic Research Inc.Note: Expenditures are based on the results of the in-home consumer telephone survey completed on behalf of TER in June 2017. These results have not been adjusted or calibrated. Subtotals may not add due to rounding. Margin of Error is +/- 6.9% 19 times out of 20.
Question 3 - Summary of City of Guelph Residents Canadian Tire Expenditures (past 3 months)
City of Guelph Commercial Policy Review Stage 1 Commercial Analysis and Background Report
101
Macaulay Shiomi Howson Ltd Tate Economic Research Inc.
Brook McIlroy Inc.
Fig
ure
D-5
Map
Key
Gue
lph
1D
ownt
own
Gue
lph
0.0%
0.0%
7.8%
7.7%
0.0%
0.8%
12.0
%2
Gor
don
& C
lair
0.0%
5.9%
0.0%
1.2%
0.4%
0.3%
12.0
%3
Pais
ley
& I
mpe
rial
0.0%
0.0%
0.8%
1.1%
0.0%
0.0%
1.2%
4W
oodl
awn
& W
oolw
ich
0.0%
7.4%
13.7
%10
.5%
52.0
%3.
8%0.
2%5
Kort
righ
t &
Gor
don
0.0%
3.8%
1.0%
0.0%
1.9%
0.0%
2.7%
6Si
lver
cree
k &
Will
ow0.
0%45
.7%
15.9
%12
.4%
0.6%
11.1
%12
.8%
7St
one
& E
dinb
urgh
0.0%
10.5
%40
.1%
35.9
%0.
2%10
.7%
18.8
%8
Eram
osa
& S
teve
nson
9.6%
9.6%
0.0%
2.0%
0.0%
0.0%
19.8
%9
Spee
dval
e &
Ste
vens
on0.
0%4.
3%0.
0%0.
2%0.
0%0.
0%0.
9%10
Woo
dlaw
n N
ode
0.0%
0.0%
0.0%
0.0%
0.7%
6.9%
0.0%
11N
orth
wes
t G
uelp
h30
.4%
0.3%
0.0%
9.8%
21.2
%17
.7%
12.2
%12
Nor
thea
st G
uelp
h42
.3%
9.2%
1.1%
6.0%
3.4%
6.0%
0.1%
13So
uth
Gue
lph
0.0%
0.1%
0.0%
1.4%
1.5%
3.5%
5.9%
Subt
otal
Gue
lph
82.3
%97
.0%
80.4
%88
.2%
81.9
%61
.0%
98.6
%
Oth
er C
anad
aKi
tche
ner
2.3%
0.2%
2.7%
2.2%
0.2%
18.1
%0.
2%C
ambr
idge
6.6%
0.7%
1.8%
2.0%
9.7%
3.8%
0.3%
Rem
aini
ng W
ellin
gton
Cou
nty
0.0%
1.1%
3.3%
2.3%
1.7%
2.1%
0.3%
Burl
ingt
on0.
0%0.
0%0.
9%0.
1%0.
1%5.
3%0.
0%To
ront
o0.
0%0.
0%1.
7%1.
1%0.
1%0.
2%0.
0%O
ther
Ont
ario
8.8%
1.0%
8.3%
3.9%
6.3%
7.7%
0.4%
Oth
er C
anad
a0.
0%0.
0%0.
4%0.
1%0.
0%1.
9%0.
0%Su
btot
al O
ther
Can
ada
17.7
%3.
0%19
.1%
11.6
%18
.1%
39.0
%1.
2%
USA
USA
0.0%
0.0%
0.5%
0.1%
0.0%
0.0%
0.1%
Subt
otal
USA
0.0%
0.0%
0.5%
0.1%
0.0%
0.0%
0.1%
Tota
l1
00
.0%
10
0.0
%1
00
.0%
10
0.0
%1
00
.0%
10
0.0
%1
00
.0%
Sour
ce:
Tate
Eco
nom
ic R
esea
rch
Inc.
Su
mm
ary
of S
tud
y A
rea
Res
iden
ts E
xpen
dit
ure
s -
Qu
esti
on 4
to
Qu
esti
on 1
0
Not
e: E
xpen
ditu
res
are
base
d on
the
res
ults
of t
he in
-hom
e co
nsum
er t
elep
hone
sur
vey
com
plet
ed o
n be
half
of T
ER in
Jun
e 20
17.
Bui
ldin
g &
Hom
e Su
pply
Sto
re
Expe
nditu
res
have
bee
n ad
just
ed fo
r se
ason
ality
, w
hile
the
rem
aini
ng r
esul
ts h
ave
not
been
adj
uste
d or
cal
ibra
ted.
Sub
tota
ls m
ay n
ot a
dd d
ue t
o ro
undi
ng.
Mar
gin
of E
rror
is +
/- 6
.9%
19
times
out
of 2
0.
Q4.
Aut
omot
ive
Expe
nditu
res
(pas
t 3
mon
ths)
Q5.
Gen
eral
M
erch
andi
se
Expe
nditu
res
(pas
t 3
mon
ths)
Q6.
App
arel
&
Acce
ssor
ies
Expe
nditu
res
(pas
t 3
mon
ths)
Q7.
Spe
cial
ty
Stor
es
Expe
nditu
res
(pas
t 3
mon
ths)
Q8.
Bui
ldin
g &
H
ome
Supp
ly
Stor
e Ex
pend
iture
s (p
ast
3 m
onth
s)
Q9.
Fur
nitu
re,
Hom
e Fu
rnis
hing
s &
El
ectr
onic
s St
ore
Expe
nditu
res
Q10
. Ph
arm
acie
s &
Pe
rson
al C
are
Stor
e Ex
pend
iture
s
City of Guelph Commercial Policy Review Stage 1 Commercial Analysis and Background Report
102
Macaulay Shiomi Howson Ltd Tate Economic Research Inc.
Brook McIlroy Inc.
Figure D-6
Guelph
GuelphFood Basics - 3 Clair Road West - Guelph 5.5%Food Basics - 222 Silvercreek Parkway - Guelph 5.7%Food Basics - 380 Eramosa Road - Guelph 7.1%FreshCo - 330 Speedvale Avenue East - Guelph 5.2%Metro - 492 Edinburgh Road South - Guelph 8.3%No Frills - 33 Harvard Road - Guelph 7.3%No Frills - 191 Silvercreek Parkway - Guelph 10.3%Zehrs - 124 Clair Road East - Guelph 6.7%Zehrs - 160 Kortright Road West - Guelph 14.6%Zehrs - 1045 Paisley Road - Guelph 13.0%Zehrs - 297 Eramosa Road - Guelph 14.9%Subtotal Guelph 98.7%
FergusZehrs - Fergus 0.5%Subtotal Fergus 0.5%
OtherIndependent - Other Ontario 0.0%Foodland - Other Ontario 0.2%FreshCo - Other Ontario 0.0%Fortinos - Other Ontario 0.3%No Frills - Other Ontario 0.1%Real Canadian Superstore - Other Ontario 0.0%Sobeys - Other Ontario 0.1%Zehrs - Other Ontario 0.1%Subtotal Other 0.8%
Total 100.0%
Source: Tate Economic Research Inc.
Question 11 - Summary of City of Guelph Residents Supermarket Expenditures (past month)
Note: Expenditures are based on the results of the in-home consumer telephone survey completed on behalf of TER in June 2017. These results have not been adjusted or calibrated. Subtotals may not add due to rounding. Margin of Error is +/- 6.9% 19 times out of 20.
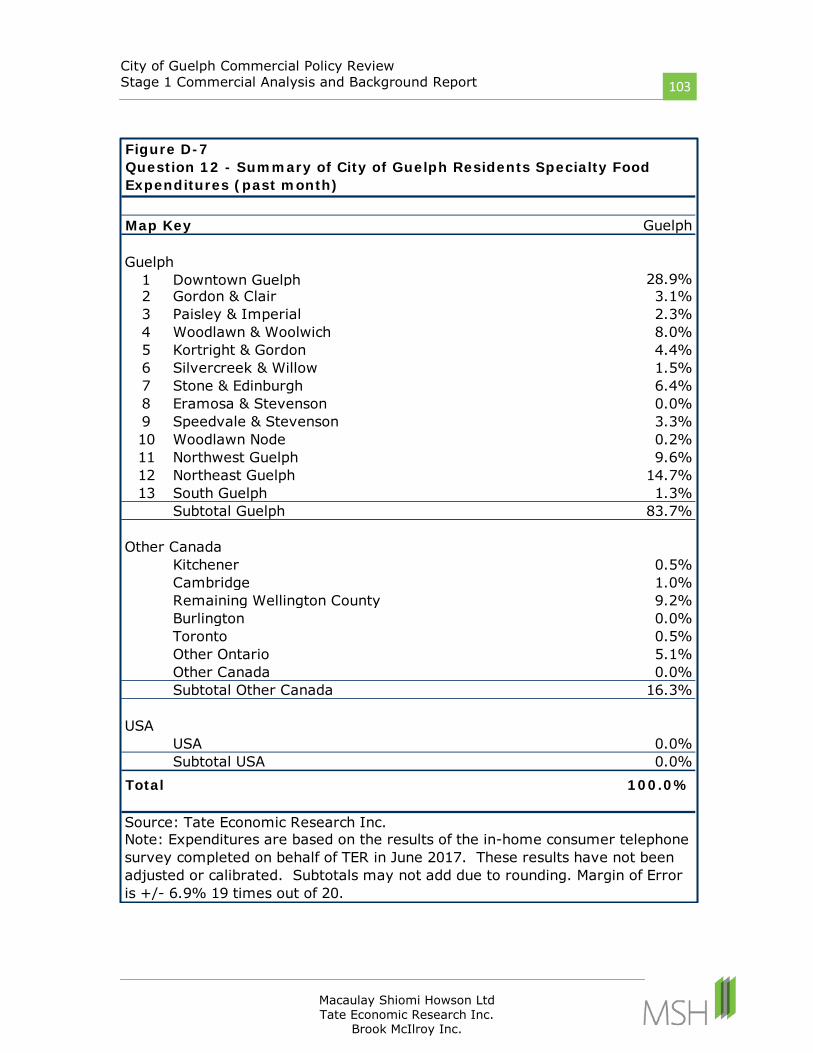
City of Guelph Commercial Policy Review Stage 1 Commercial Analysis and Background Report
103
Macaulay Shiomi Howson Ltd Tate Economic Research Inc.
Brook McIlroy Inc.
Figure D-7
Map Key Guelph
Guelph1 Downtown Guelph 28.9%2 Gordon & Clair 3.1%3 Paisley & Imperial 2.3%4 Woodlawn & Woolwich 8.0%5 Kortright & Gordon 4.4%6 Silvercreek & Willow 1.5%7 Stone & Edinburgh 6.4%8 Eramosa & Stevenson 0.0%9 Speedvale & Stevenson 3.3%10 Woodlawn Node 0.2%11 Northwest Guelph 9.6%12 Northeast Guelph 14.7%13 South Guelph 1.3%
Subtotal Guelph 83.7%
Other CanadaKitchener 0.5%Cambridge 1.0%Remaining Wellington County 9.2%Burlington 0.0%Toronto 0.5%Other Ontario 5.1%Other Canada 0.0%Subtotal Other Canada 16.3%
USAUSA 0.0%Subtotal USA 0.0%
Total 100.0%
Source: Tate Economic Research Inc.Note: Expenditures are based on the results of the in-home consumer telephone survey completed on behalf of TER in June 2017. These results have not been adjusted or calibrated. Subtotals may not add due to rounding. Margin of Error is +/- 6.9% 19 times out of 20.
Question 12 - Summary of City of Guelph Residents Specialty Food Expenditures (past month)
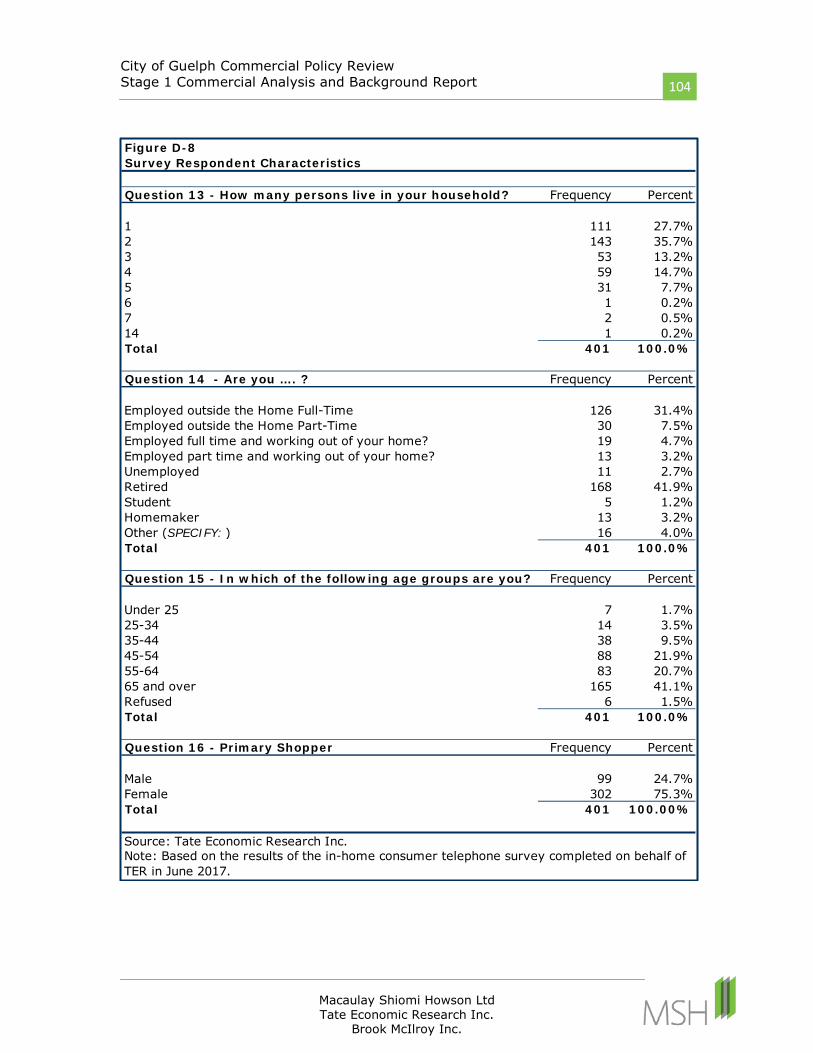
City of Guelph Commercial Policy Review Stage 1 Commercial Analysis and Background Report
104
Macaulay Shiomi Howson Ltd Tate Economic Research Inc.
Brook McIlroy Inc.
Figure D-8Survey Respondent Characteristics
Question 13 - How many persons live in your household? Frequency Percent
1 111 27.7%2 143 35.7%3 53 13.2%4 59 14.7%5 31 7.7%6 1 0.2%7 2 0.5%14 1 0.2%Total 401 100.0%
Question 14 - Are you …. ? Frequency Percent
Employed outside the Home Full-Time 126 31.4%Employed outside the Home Part-Time 30 7.5%Employed full time and working out of your home? 19 4.7%Employed part time and working out of your home? 13 3.2%Unemployed 11 2.7%Retired 168 41.9%Student 5 1.2%Homemaker 13 3.2%Other (SPECIFY: ) 16 4.0%Total 401 100.0%
Question 15 - In which of the following age groups are you? Frequency Percent
Under 25 7 1.7%25-34 14 3.5%35-44 38 9.5%45-54 88 21.9%55-64 83 20.7%65 and over 165 41.1%Refused 6 1.5%Total 401 100.0%
Question 16 - Primary Shopper Frequency Percent
Male 99 24.7%Female 302 75.3%Total 401 100.00%
Source: Tate Economic Research Inc.Note: Based on the results of the in-home consumer telephone survey completed on behalf of TER in June 2017.
10
City of Guelph Commercial Policy Review Stage 1 Commercial Analysis and Background Report
104
Macaulay Shiomi Howson Ltd Tate Economic Research Inc.
Brook McIlroy Inc.
Appendix E – Inventory of Competitive Retail Space
City of Guelph Commercial Policy Review Stage 1 Commercial Analysis and Background Report
106
Macaulay Shiomi Howson Ltd Tate Economic Research Inc.
Brook McIlroy Inc.
Inventory of Competitive Retail Space An inventory of commercial retail and service space in The City of Guelph was undertaken by TER in June / July 2017. This appendix contains a summary of the inventory and corresponding mapping.
List of Figures
Figure E-1: Summary of Retail and Service Space Inventoried in the City of Guelph
Figure E-2: Map of City of Guelph Inventory Nodes
City of Guelph Commercial Policy Review Stage 1 Commercial Analysis and Background Report
107
Macaulay Shiomi Howson Ltd Tate Economic Research Inc.
Brook McIlroy Inc.
Figure 5-2
Downtown Guelph
Gordon & Clair
Paisley & Imperial
Woodlawn & Woolwich
Kortright & Gordon
Silvercreek & Willow
Stone & Edinburgh
Eramosa & Stevenson
Speedvale & Stevenson
Woodlawn Node
Ot e Northwest
Guelph
Ot e Northeast
GuelphOther South
GuelphTOTAL
CITY OF GUELPHPercent
DistributionNodes 1 2 3 4 5 6 7 8 9 10 11 12 13 1-13
Retail Food Oriented Retail (FOR)
Supermarkets 0 75,700 100,000 0 58,500 76,300 77,300 107,900 32,100 0 0 0 0 527,800 6.2%Convenience & Specialty Food Stores 62,100 7,200 4,300 6,100 13,400 22,300 16,100 1,800 7,000 3,800 49,100 44,300 18,400 255,900 3.0%
Subtotal Food Oriented Retail (FOR) 62,100 82,900 104,300 6,100 71,900 98,600 93,400 109,700 39,100 3,800 49,100 44,300 18,400 783,700 9.3%
Non Food Oriented Retail (NFOR)Department Stores 0 0 0 173,000 0 0 237,700 0 0 0 0 0 0 410,700 4.9%General Merchandise 0 9,600 153,000 66,000 6,500 36,900 102,000 7,800 10,200 0 5,500 7,600 45,000 450,100 5.3%Clothing, Shoes & Accessories 51,400 0 2,100 38,000 2,700 47,400 192,300 0 0 0 11,500 8,100 0 353,500 4.2%Furniture, Home Furnishings & Electronics 33,800 22,500 0 44,900 1,400 96,800 61,800 0 0 56,500 133,200 47,200 56,900 555,000 6.6%Pharmacies & Personal Care Stores 30,500 25,300 1,400 4,300 5,200 23,900 49,100 33,200 4,200 1,500 21,700 7,600 19,400 227,300 2.7%Building & Outdoor Home Supplies 0 800 0 90,100 11,300 3,900 4,200 0 0 29,500 163,000 20,600 41,100 364,500 4.3%Miscellaneous Retailers 84,500 6,000 4,100 59,300 9,000 76,000 113,300 5,400 1,600 14,400 98,800 31,600 59,400 563,400 6.7%Automotive 5,200 0 0 0 0 6,000 0 600 0 0 21,300 17,500 0 50,600 0.6%
Subtotal Non Food Oriented Retail (NFOR) 205,400 64,200 160,600 475,600 36,100 290,900 760,400 47,000 16,000 101,900 455,000 140,200 221,800 2,975,100 35.2%
Other RetailBeer, Wine & Liquor 10,100 17,200 11,000 0 0 5,400 13,000 0 11,900 0 16,900 3,100 6,000 94,600 1.1%
Subtotal Retail Space 277,600 164,300 275,900 481,700 108,000 394,900 866,800 156,700 67,000 105,700 521,000 187,600 246,200 3,853,400 45.6%
Service SpaceFood Services 245,000 63,100 9,100 29,900 20,800 30,100 121,200 15,100 10,100 45,300 105,100 52,200 78,800 825,800 9.8%Personal Services 66,900 11,300 3,900 5,700 11,800 10,500 17,100 8,400 5,100 0 33,300 21,900 18,700 214,600 2.5%Financial & Real Estate Services 103,200 32,400 16,000 22,200 18,000 14,000 32,400 7,700 6,200 10,500 102,500 35,700 52,800 453,600 5.4%Medical, Dental, Health & Legal Services 241,500 60,500 3,200 9,800 25,700 31,300 104,800 32,500 10,200 6,800 246,400 143,800 157,700 1,074,200 12.7%Other Services 443,100 46,400 2,300 9,700 8,700 34,900 46,300 24,000 5,000 105,900 358,200 130,800 181,800 1,397,100 16.5%
Subtotal Service Space 1,099,700 213,700 34,500 77,300 85,000 120,800 321,800 87,700 36,600 168,500 845,500 384,400 489,800 3,965,300 46.9%Total Occupied Commercial Space 1,377,300 378,000 310,400 559,000 193,000 515,700 1,188,600 244,400 103,600 274,200 1,366,500 572,000 736,000 7,818,700 92.5%
Vacant 187,800 7,600 17,500 6,400 6,900 61,800 88,200 0 12,300 26,800 134,500 33,700 48,800 632,300 7.5%Vacancy Rate (%) 12.0% 2.0% 5.3% 1.1% 3.5% 10.7% 6.9% 0.0% 10.6% 8.9% 9.0% 5.6% 6.2% 7.5%Total Commercial Space 1,565,100 385,600 327,900 565,400 199,900 577,500 1,276,800 244,400 115,900 301,000 1,501,000 605,700 784,800 8,451,000 100.0%
Percent Distribution 18.5% 4.6% 3.9% 6.7% 2.4% 6.8% 15.1% 2.9% 1.4% 3.6% 17.8% 7.2% 9.3% 100.0%
Source: Tate Economic Research Inc.1) Based on inventory and site inspections completed by TER in June / July 2017. Rounded to the nearest 100 square feet.
Summary of Commercial (Retail and Service Space) in the City of Guelph (1
City of Guelph Commercial Policy Review Stage 1 Commercial Analysis and Background Report
108
Macaulay Shiomi Howson Ltd Tate Economic Research Inc.
Brook McIlroy Inc.
Figure E-2: City of Guelph Inventory Nodes
1
2
3
4
5
6
7
8
9
10
11
13
12
1. Downtown Guelph 6. Silvercreek & Willow 11. Other Northwest Guelph2. Gordon & Clair 7. Stone & Edinburgh 12. Other Northeast Guelph3. Paisley & Imperial 8. Eramosa & Stevenson 13. Other South Guelph4. Woodlawn & Woolwich 9. Speedvale & Stevenson5. Kortright & Gordon 10. Woodlawn Node
- City of Guelph
Source: Tate Economic Research Inc.; Basemap: ESRI ArcGIS.
10
City of Guelph Commercial Policy Review Stage 1 Commercial Analysis and Background Report
108
Macaulay Shiomi Howson Ltd Tate Economic Research Inc.
Brook McIlroy Inc.
Appendix F – Analysis Tables
110 City of Guelph Commercial Policy Review Stage 1 Commercial Analysis and Background Report 110
Macaulay Shiomi Howson Ltd Tate Economic Research Inc.
Brook McIlroy Inc.
Analysis Tables This appendix contains the analysis tables referenced in the main report.
List of Figures
Figure F-1: Vacant Commercial Land, Intensification / Mixed-Use Potential within the City of Guelph Figure F-2: Vacant Commercial Land, Intensification / Mixed-Use Potential Map Figure F-3: Active Developments within the City of Guelph Figure F-4: Map of Active Developments within the City of Guelph Figure F-5: City of Guelph Non Food Oriented (NFOR) Expenditure Potential Figure F-6: Automotive Warranted Demand Figure F-7: Furniture, Home Furnishings and Electronics Warranted Demand Figure F-8: Building and Outdoor Home Supplies Stores (BOHS) Warranted Demand Figure F-9: Pharmacies and Personal Care Stores Warranted Demand Figure F-10: Clothing and Accessories Stores Warranted Demand Figure F-11: Other General Merchandise Stores Warranted Demand Figure F-12: Miscellaneous Retailers Warranted Demand Figure F-13: Warehouse Membership Clubs (WMC) Warranted Demand Figure F-14: Home and Automotive Supply (HAAS) Warranted Demand Figure F-15: Department Stores Warranted Demand Figure E-16: City of Guelph Food Oriented (FOR) Expenditure Potential Figure F-17: Supermarket and Grocery Store Warranted Demand Figure F-18: Specialty Food Store Warranted Demand
111 City of Guelph Commercial Policy Review Stage 1 Commercial Analysis and Background Report 111
Macaulay Shiomi Howson Ltd Tate Economic Research Inc.
Brook McIlroy Inc.
Figure F-19: City of Guelph Beer, Wine and Liquor Retail Expenditure Potential Figure F-20: Beer, Wine and Liquor Store Warranted Demand Figure F-21: Service Space Warranted Space
112 City of Guelph Commercial Policy Review Stage 1 Commercial Analysis and Background Report 112
Macaulay Shiomi Howson Ltd Tate Economic Research Inc.
Brook McIlroy Inc.
Figure F-1
Designation Zoning Address
Intensification Potential (Sq. Ft.)
Parcel Size (Ac.)
Community Mixed-use CentreCommunity Shopping Centre 3 Woodlawn Road West 12,000 n.a.Community Shopping Centre 1750 Gordon Street 22,800 n.a.Community Shopping Centre 98 Farley Drive n.a. 2.2Community Shopping Centre 804 Woolwich Street 8,400 n.a.Community Shopping Centre 40 Silvercreek Parkway South n.a. 20.3Community Shopping Centre 963-1045, Paisley Road / 129 Elmira Road South 224,800 n.a.
Subtotal Community Shopping Centre 268,000 22.5Neighbourhood Shopping Centre 950 Paisley Drive 13,600 n.a.Neighbourhood Shopping Centre 85 Starwood Drive n.a. 1.4
Subtotal Neighbourhood Shopping Centre 1.4
Commercial-Residential 111 Starwood Drive 1,800 n.a.Service Commercial 40 Silvercreek Parkway South n.a. 2.6
Subtotal Other Community Mixed Use Centre 1,800 2.6Total Community Mixed-use Centre 269,800 26.6
Mixed-use CorridorService Commercial 601 Scottsdale Drive n.a. 1.8University of Guelph and Guelph Correctional Centre / Puslinch GID Secondary Plan Area 200,000 n.a
Total Mixed-use Corridor 200,000 1.8
Neighbourhood Commercial CentreCommunity Shopping Centre Wellington Street West (at Imperial Road South) n.a. 6.0Convenience Commercial 1340 Gordon Street n.a. 0.7Neighbourhood Shopping Centre 105 Elmira Road North n.a. 2.4
Total Neighbourhood Commercial Centre n.a. 9.1
Note: Totals may not add due to rounding.
Potential Future Development: Intensification / Planned and Undeveloped Commercial Land
Source: Tate Economic Research Inc. based on information provided by the City of Guelph. The intensification potential in the Community Mixed Use Centres is based on the Official Plan caps. The 200,000 square feet of future potential in the GID is a TER assumption based on the City of Guelph's population estimate of 6,650 persons in the GID as well as the GID commercial policies encouraging small and medium scale commercial uses. The undeveloped commercial land figures are supplied by the City of Guelph.
113 City of Guelph Commercial Policy Review Stage 1 Commercial Analysis and Background Report 113
Macaulay Shiomi Howson Ltd Tate Economic Research Inc.
Brook McIlroy Inc.
Figure F-1 (Continued)Potential Future Development: Intensification / Planned and Undeveloped Commercial Land
Designation Zoning Address
Intensification Potential (Sq.
Ft.)Parcel Size
(Ac.)
Service Commercial Highway Service Commercial 383 Woodlawn Road West n.a. 3.4Highway Service Commercial 30 Wilbert Street n.a. 3.2Highway Service Commercial 309 Woodlawn Road West n.a. 2.2Highway Service Commercial 40 Wilbert Street n.a. 2.9Highway Service Commercial 523 York Road n.a. 0.6Highway Service Commercial 540 York Road n.a. 3.0Highway Service Commercial 1 Wilbert Street n.a. 4.1Highway Service Commercial 25 Wilbert Street n.a. 2.1
Subtotal Highway Service Commercial 21.4Service Commercial 327 Woodlawn Road West n.a. 0.8Service Commercial 218 Speedvale Avenue West n.a. 1.6Service Commercial 453 Imperial Road North n.a. 3.0Service Commercial 404 Speedvale Avenue West n.a. 2.7Service Commercial 456 Imperial Road North n.a. 0.7Service Commercial 580 Speedvale Avenue West n.a. 0.9Service Commercial 301 Elmira Road North n.a. 7.0Service Commercial 596 Speedvale Avenue West n.a. 0.7Service Commercial 556 Speedvale Avenue West n.a. 3.1Service Commercial 604 Speedvale Avenue West n.a. 0.7Service Commercial 588 Speedvale Avenue West n.a. 0.8Service Commercial 455 Watson Parkway North n.a. 2.5Service Commercial 21 Corporate Court n.a. 1.7Service Commercial 40 Cowan Place n.a. 0.6Service Commercial 50 Cowan Place n.a. 1.3
Subtotal Service Commercial n.a. 28.2Convenience Commercial 580 Paisley Road n.a. 0.6
Subtotal Other Service Commercial n.a. 0.6Total Service Commercial n.a. 50.1
Note: Totals may not add due to rounding.
Source: Tate Economic Research Inc. based on information provided by the City of Guelph. The intensification potential in the Community Mixed Use Centres is based on the Official Plan caps. The 200,000 square feet of future potential in the GID is a TER assumption based on the City of Guelph's population estimate of 6,650 persons in the GID as well as the GID commercial policies encouraging small and medium scale commercial uses. The undeveloped commercial land figures are supplied by the City of Guelph.
Figure F-1 (Continued)Vacant Commercial Land, Intensification / Mixed-use Potential in the City of Guelph
Designation Zoning Address
Intensification Potential (Sq.
Ft.)Parcel Size
(Ac.)
Other DesignationsCorporate Business Park
Corporate Business Park 65 Hanlon Creek Boulevard n.a 12.0Low Density Residential
Convenience Commercial 36 Willow Road n.a 0.4Convenience Commercial 23 Silvercreek Parkway North n.a 0.6
Mixed Office Commercial Service Commercial 700 Woolwich Street n.a 1.9
Total Other Designations 0 14.9
Downtown Intensification Potential 301,700 n.a
Grand Total 771,500 102.4
Note: Totals may not add due to rounding.
Source: Tate Economic Research Inc. based on information provided by the City of Guelph. The intensification potential in the Community Mixed Use Centres is based on the Official Plan caps. The 200,000 square feet of future potential in the GID is a TER assumption based on the City of Guelph's population estimate of 6,650 persons in the GID as well as the GID commercial policies encouraging small and medium scale commercial uses. The undeveloped commercial land figures are supplied by the City of Guelph.
114 City of Guelph Commercial Policy Review Stage 1 Commercial Analysis and Background Report 114
Macaulay Shiomi Howson Ltd Tate Economic Research Inc.
Brook McIlroy Inc.
Figure F-2: Vacant Commercial Land, Intensification / Mixed-Use Potential
Source: Tate Economic Research Inc.; Basemap: ESRI ArcGIS.
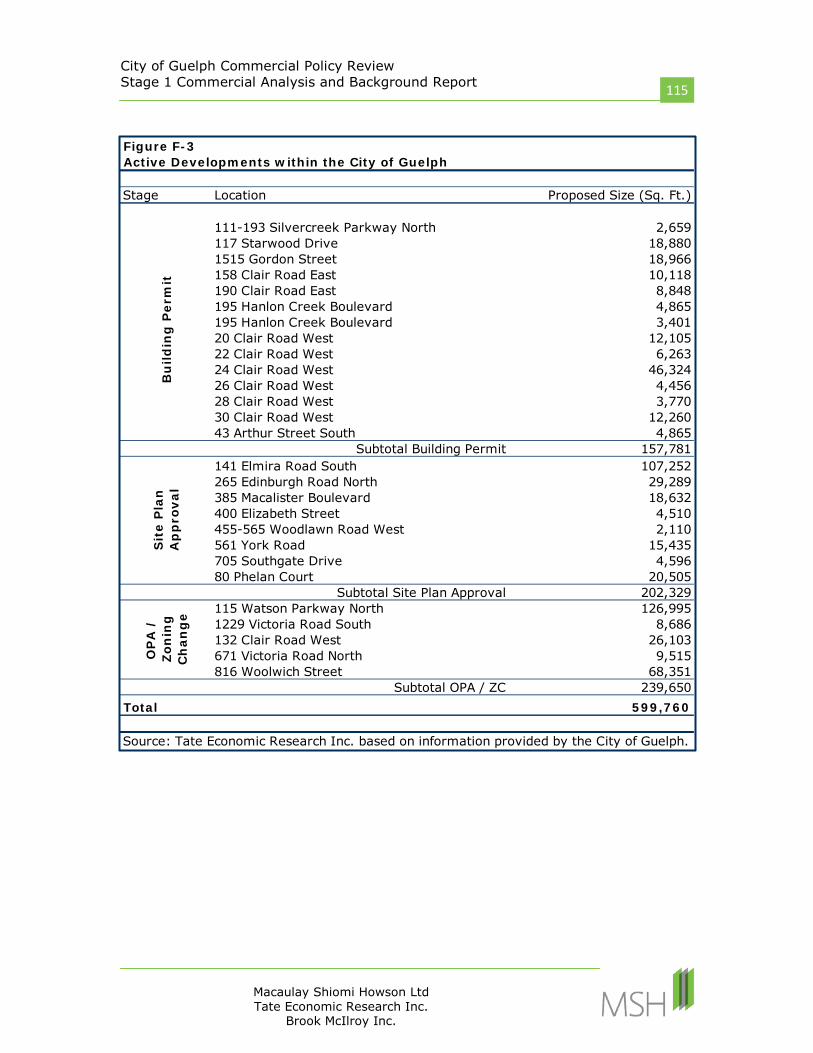
115 City of Guelph Commercial Policy Review Stage 1 Commercial Analysis and Background Report 115
Macaulay Shiomi Howson Ltd Tate Economic Research Inc.
Brook McIlroy Inc.
Figure F-3Active Developments within the City of Guelph
Stage Location Proposed Size (Sq. Ft.)
111-193 Silvercreek Parkway North 2,659117 Starwood Drive 18,8801515 Gordon Street 18,966158 Clair Road East 10,118190 Clair Road East 8,848195 Hanlon Creek Boulevard 4,865195 Hanlon Creek Boulevard 3,40120 Clair Road West 12,10522 Clair Road West 6,26324 Clair Road West 46,32426 Clair Road West 4,45628 Clair Road West 3,77030 Clair Road West 12,26043 Arthur Street South 4,865
Subtotal Building Permit 157,781141 Elmira Road South 107,252265 Edinburgh Road North 29,289385 Macalister Boulevard 18,632400 Elizabeth Street 4,510455-565 Woodlawn Road West 2,110561 York Road 15,435705 Southgate Drive 4,59680 Phelan Court 20,505
Subtotal Site Plan Approval 202,329115 Watson Parkway North 126,9951229 Victoria Road South 8,686132 Clair Road West 26,103671 Victoria Road North 9,515816 Woolwich Street 68,351
Subtotal OPA / ZC 239,650Total 599,760
Source: Tate Economic Research Inc. based on information provided by the City of Guelph.
Bu
ildin
g P
erm
itS
ite
Pla
n
Ap
pro
val
OP
A /
Zo
nin
g
Ch
ang
e
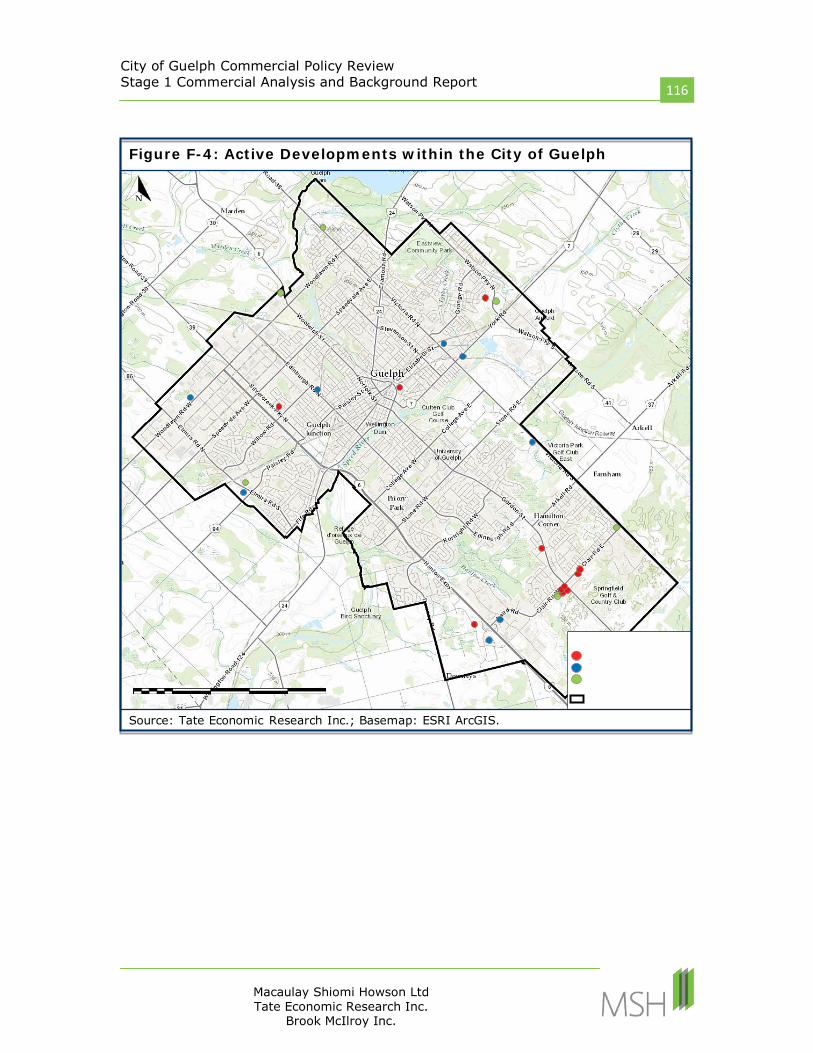
116 City of Guelph Commercial Policy Review Stage 1 Commercial Analysis and Background Report 116
Macaulay Shiomi Howson Ltd Tate Economic Research Inc.
Brook McIlroy Inc.
Figure F-4: Active Developments within the City of Guelph
Source: Tate Economic Research Inc.; Basemap: ESRI ArcGIS.
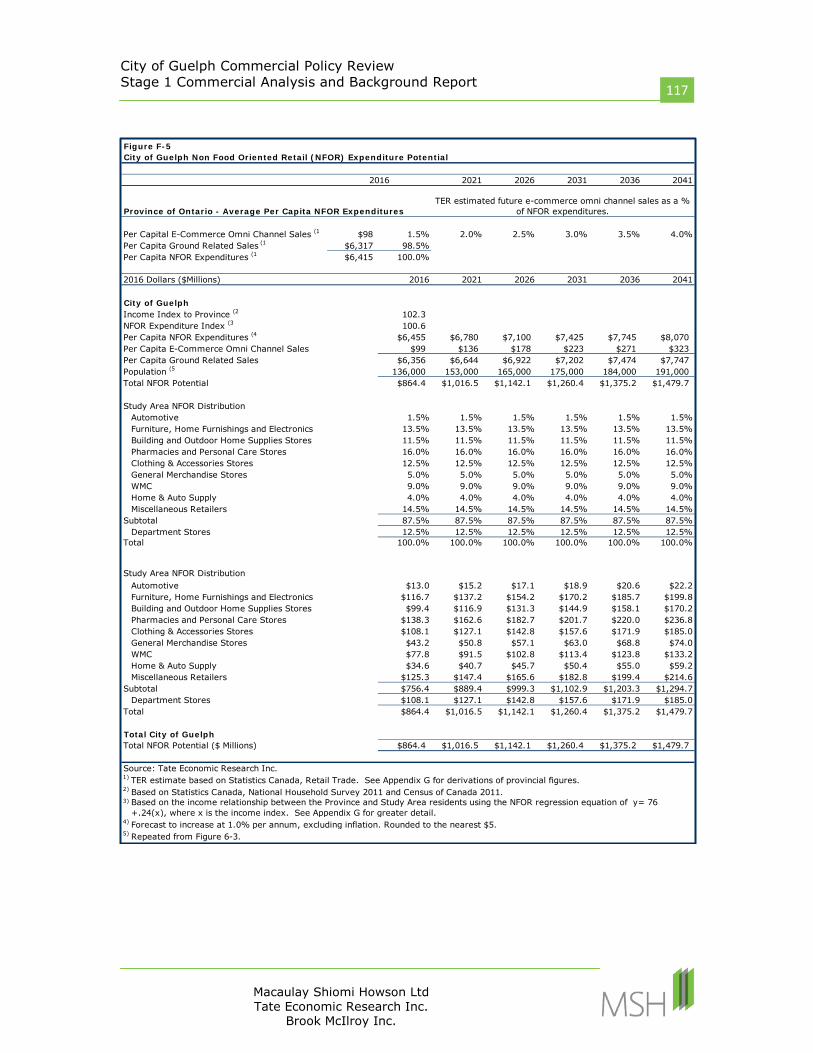
117 City of Guelph Commercial Policy Review Stage 1 Commercial Analysis and Background Report 117
Macaulay Shiomi Howson Ltd Tate Economic Research Inc.
Brook McIlroy Inc.
Figure F-5
2021 2026 2031 2036 2041
Province of Ontario - Average Per Capita NFOR Expenditures
Per Capital E-Commerce Omni Channel Sales (1 $98 1.5% 2.0% 2.5% 3.0% 3.5% 4.0%Per Capita Ground Related Sales (1 $6,317 98.5%Per Capita NFOR Expenditures (1 $6,415 100.0%
2016 Dollars ($Millions) 2016 2021 2026 2031 2036 2041
City of GuelphIncome Index to Province (2 102.3 NFOR Expenditure Index (3 100.6 Per Capita NFOR Expenditures (4 $6,455 $6,780 $7,100 $7,425 $7,745 $8,070Per Capita E-Commerce Omni Channel Sales $99 $136 $178 $223 $271 $323Per Capita Ground Related Sales $6,356 $6,644 $6,922 $7,202 $7,474 $7,747Population (5 136,000 153,000 165,000 175,000 184,000 191,000 Total NFOR Potential $864.4 $1,016.5 $1,142.1 $1,260.4 $1,375.2 $1,479.7
Study Area NFOR DistributionAutomotive 1.5% 1.5% 1.5% 1.5% 1.5% 1.5%Furniture, Home Furnishings and Electronics 13.5% 13.5% 13.5% 13.5% 13.5% 13.5%Building and Outdoor Home Supplies Stores 11.5% 11.5% 11.5% 11.5% 11.5% 11.5%Pharmacies and Personal Care Stores 16.0% 16.0% 16.0% 16.0% 16.0% 16.0%Clothing & Accessories Stores 12.5% 12.5% 12.5% 12.5% 12.5% 12.5%General Merchandise Stores 5.0% 5.0% 5.0% 5.0% 5.0% 5.0%WMC 9.0% 9.0% 9.0% 9.0% 9.0% 9.0%Home & Auto Supply 4.0% 4.0% 4.0% 4.0% 4.0% 4.0%Miscellaneous Retailers 14.5% 14.5% 14.5% 14.5% 14.5% 14.5%
Subtotal 87.5% 87.5% 87.5% 87.5% 87.5% 87.5%Department Stores 12.5% 12.5% 12.5% 12.5% 12.5% 12.5%
Total 100.0% 100.0% 100.0% 100.0% 100.0% 100.0%
Study Area NFOR DistributionAutomotive $13.0 $15.2 $17.1 $18.9 $20.6 $22.2 Furniture, Home Furnishings and Electronics $116.7 $137.2 $154.2 $170.2 $185.7 $199.8 Building and Outdoor Home Supplies Stores $99.4 $116.9 $131.3 $144.9 $158.1 $170.2 Pharmacies and Personal Care Stores $138.3 $162.6 $182.7 $201.7 $220.0 $236.8 Clothing & Accessories Stores $108.1 $127.1 $142.8 $157.6 $171.9 $185.0 General Merchandise Stores $43.2 $50.8 $57.1 $63.0 $68.8 $74.0 WMC $77.8 $91.5 $102.8 $113.4 $123.8 $133.2 Home & Auto Supply $34.6 $40.7 $45.7 $50.4 $55.0 $59.2 Miscellaneous Retailers $125.3 $147.4 $165.6 $182.8 $199.4 $214.6
Subtotal $756.4 $889.4 $999.3 $1,102.9 $1,203.3 $1,294.7 Department Stores $108.1 $127.1 $142.8 $157.6 $171.9 $185.0
Total $864.4 $1,016.5 $1,142.1 $1,260.4 $1,375.2 $1,479.7
Total City of GuelphTotal NFOR Potential ($ Millions) $864.4 $1,016.5 $1,142.1 $1,260.4 $1,375.2 $1,479.7
Source: Tate Economic Research Inc.1)
2) Based on Statistics Canada, National Household Survey 2011 and Census of Canada 2011.3)
4)
5) Repeated from Figure 6-3.
City of Guelph Non Food Oriented Retail (NFOR) Expenditure Potential
Forecast to increase at 1.0% per annum, excluding inflation. Rounded to the nearest $5.
TER estimate based on Statistics Canada, Retail Trade. See Appendix G for derivations of provincial figures.
Based on the income relationship between the Province and Study Area residents using the NFOR regression equation of y= 76 +.24(x), where x is the income index. See Appendix G for greater detail.
2016
TER estimated future e-commerce omni channel sales as a % of NFOR expenditures.
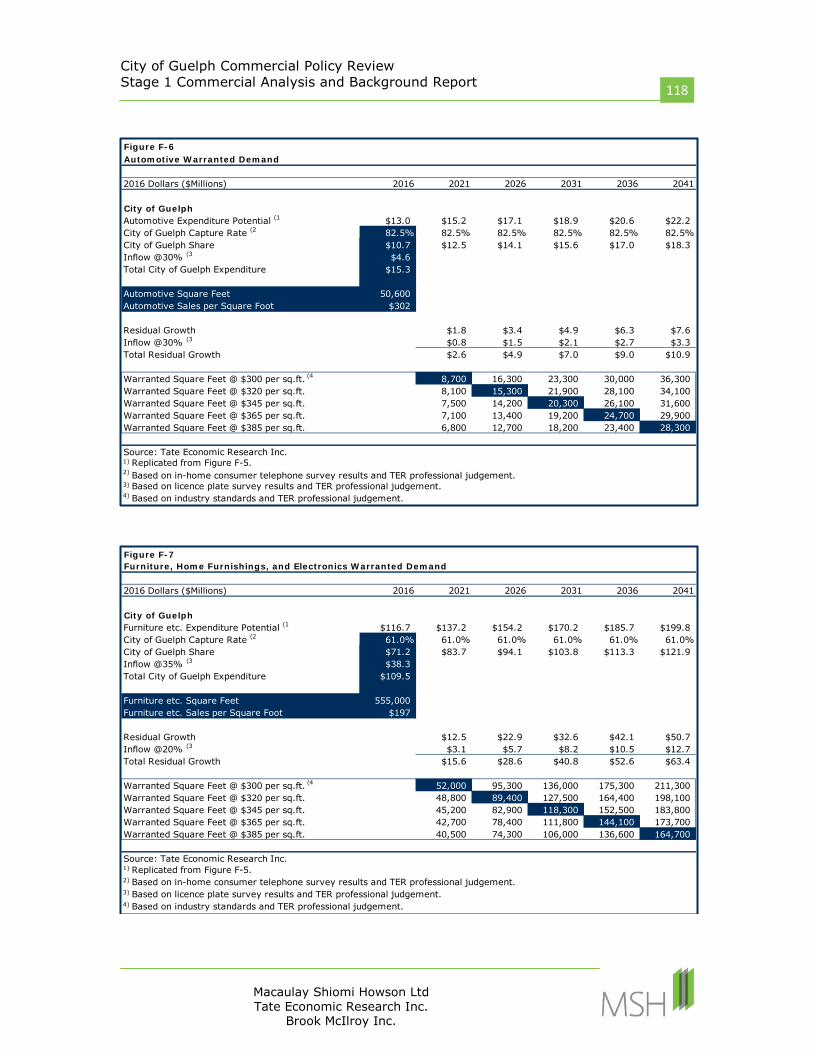
118 City of Guelph Commercial Policy Review Stage 1 Commercial Analysis and Background Report 118
Macaulay Shiomi Howson Ltd Tate Economic Research Inc.
Brook McIlroy Inc.
Figure F-6Automotive Warranted Demand
2016 Dollars ($Millions) 2016 2021 2026 2031 2036 2041
City of GuelphAutomotive Expenditure Potential (1 $13.0 $15.2 $17.1 $18.9 $20.6 $22.2City of Guelph Capture Rate (2 82.5% 82.5% 82.5% 82.5% 82.5% 82.5%City of Guelph Share $10.7 $12.5 $14.1 $15.6 $17.0 $18.3Inflow @30% (3 $4.6Total City of Guelph Expenditure $15.3
Automotive Square Feet 50,600 Automotive Sales per Square Foot $302
Residual Growth $1.8 $3.4 $4.9 $6.3 $7.6Inflow @30% (3 $0.8 $1.5 $2.1 $2.7 $3.3Total Residual Growth $2.6 $4.9 $7.0 $9.0 $10.9
Warranted Square Feet @ $300 per sq.ft. (4 8,700 16,300 23,300 30,000 36,300 Warranted Square Feet @ $320 per sq.ft. 8,100 15,300 21,900 28,100 34,100 Warranted Square Feet @ $345 per sq.ft. 7,500 14,200 20,300 26,100 31,600 Warranted Square Feet @ $365 per sq.ft. 7,100 13,400 19,200 24,700 29,900 Warranted Square Feet @ $385 per sq.ft. 6,800 12,700 18,200 23,400 28,300
Source: Tate Economic Research Inc.1) Replicated from Figure F-5.2) Based on in-home consumer telephone survey results and TER professional judgement.3) Based on licence plate survey results and TER professional judgement.4) Based on industry standards and TER professional judgement.
Figure F-7Furniture, Home Furnishings, and Electronics Warranted Demand
2016 Dollars ($Millions) 2016 2021 2026 2031 2036 2041
City of GuelphFurniture etc. Expenditure Potential (1 $116.7 $137.2 $154.2 $170.2 $185.7 $199.8City of Guelph Capture Rate (2 61.0% 61.0% 61.0% 61.0% 61.0% 61.0%City of Guelph Share $71.2 $83.7 $94.1 $103.8 $113.3 $121.9Inflow @35% (3 $38.3Total City of Guelph Expenditure $109.5
Furniture etc. Square Feet 555,000 Furniture etc. Sales per Square Foot $197
Residual Growth $12.5 $22.9 $32.6 $42.1 $50.7Inflow @20% (3 $3.1 $5.7 $8.2 $10.5 $12.7Total Residual Growth $15.6 $28.6 $40.8 $52.6 $63.4
Warranted Square Feet @ $300 per sq.ft. (4 52,000 95,300 136,000 175,300 211,300 Warranted Square Feet @ $320 per sq.ft. 48,800 89,400 127,500 164,400 198,100 Warranted Square Feet @ $345 per sq.ft. 45,200 82,900 118,300 152,500 183,800 Warranted Square Feet @ $365 per sq.ft. 42,700 78,400 111,800 144,100 173,700 Warranted Square Feet @ $385 per sq.ft. 40,500 74,300 106,000 136,600 164,700
Source: Tate Economic Research Inc.1) Replicated from Figure F-5.2) Based on in-home consumer telephone survey results and TER professional judgement.3) Based on licence plate survey results and TER professional judgement.4) Based on industry standards and TER professional judgement.
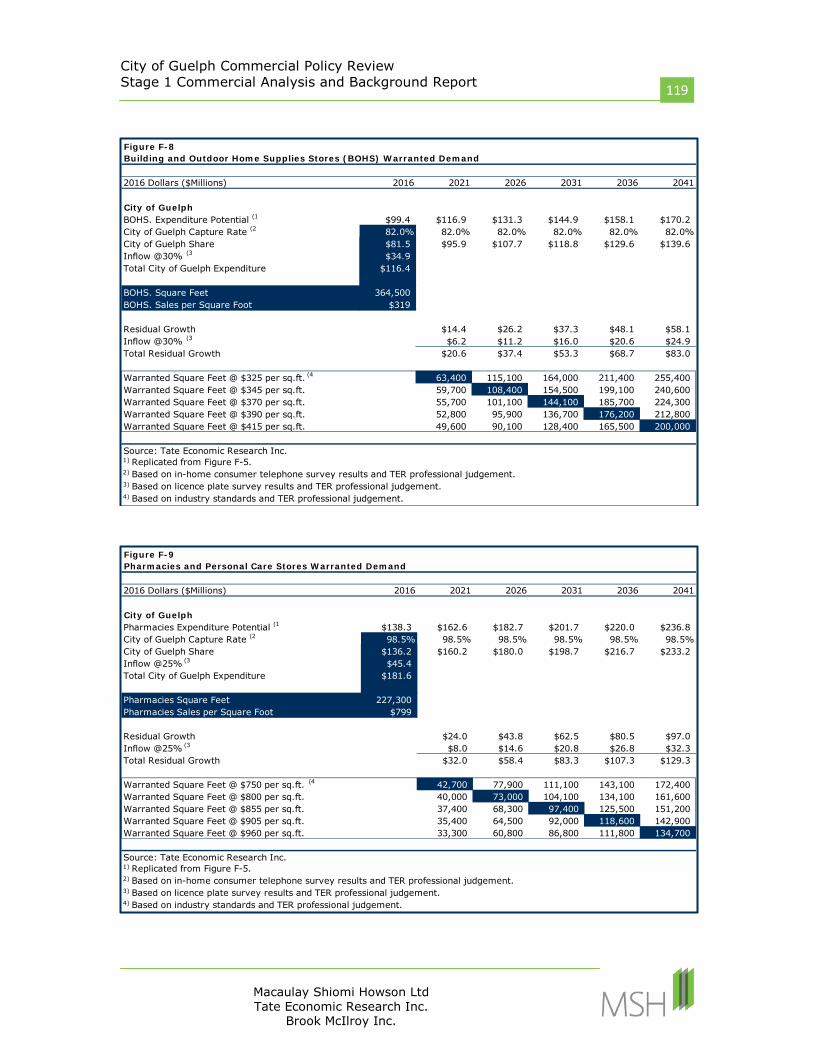
119 City of Guelph Commercial Policy Review Stage 1 Commercial Analysis and Background Report 119
Macaulay Shiomi Howson Ltd Tate Economic Research Inc.
Brook McIlroy Inc.
Figure F-8Building and Outdoor Home Supplies Stores (BOHS) Warranted Demand
2016 Dollars ($Millions) 2016 2021 2026 2031 2036 2041
City of GuelphBOHS. Expenditure Potential (1 $99.4 $116.9 $131.3 $144.9 $158.1 $170.2City of Guelph Capture Rate (2 82.0% 82.0% 82.0% 82.0% 82.0% 82.0%City of Guelph Share $81.5 $95.9 $107.7 $118.8 $129.6 $139.6Inflow @30% (3 $34.9Total City of Guelph Expenditure $116.4
BOHS. Square Feet 364,500 BOHS. Sales per Square Foot $319
Residual Growth $14.4 $26.2 $37.3 $48.1 $58.1Inflow @30% (3 $6.2 $11.2 $16.0 $20.6 $24.9Total Residual Growth $20.6 $37.4 $53.3 $68.7 $83.0
Warranted Square Feet @ $325 per sq.ft. (4 63,400 115,100 164,000 211,400 255,400 Warranted Square Feet @ $345 per sq.ft. 59,700 108,400 154,500 199,100 240,600 Warranted Square Feet @ $370 per sq.ft. 55,700 101,100 144,100 185,700 224,300 Warranted Square Feet @ $390 per sq.ft. 52,800 95,900 136,700 176,200 212,800 Warranted Square Feet @ $415 per sq.ft. 49,600 90,100 128,400 165,500 200,000
Source: Tate Economic Research Inc.1) Replicated from Figure F-5.2) Based on in-home consumer telephone survey results and TER professional judgement.3) Based on licence plate survey results and TER professional judgement.4) Based on industry standards and TER professional judgement.
Figure F-9Pharmacies and Personal Care Stores Warranted Demand
2016 Dollars ($Millions) 2016 2021 2026 2031 2036 2041
City of GuelphPharmacies Expenditure Potential (1 $138.3 $162.6 $182.7 $201.7 $220.0 $236.8City of Guelph Capture Rate (2 98.5% 98.5% 98.5% 98.5% 98.5% 98.5%City of Guelph Share $136.2 $160.2 $180.0 $198.7 $216.7 $233.2Inflow @25% (3 $45.4Total City of Guelph Expenditure $181.6
Pharmacies Square Feet 227,300 Pharmacies Sales per Square Foot $799
Residual Growth $24.0 $43.8 $62.5 $80.5 $97.0Inflow @25% (3 $8.0 $14.6 $20.8 $26.8 $32.3Total Residual Growth $32.0 $58.4 $83.3 $107.3 $129.3
Warranted Square Feet @ $750 per sq.ft. (4 42,700 77,900 111,100 143,100 172,400 Warranted Square Feet @ $800 per sq.ft. 40,000 73,000 104,100 134,100 161,600 Warranted Square Feet @ $855 per sq.ft. 37,400 68,300 97,400 125,500 151,200 Warranted Square Feet @ $905 per sq.ft. 35,400 64,500 92,000 118,600 142,900 Warranted Square Feet @ $960 per sq.ft. 33,300 60,800 86,800 111,800 134,700
Source: Tate Economic Research Inc.1) Replicated from Figure F-5.2) Based on in-home consumer telephone survey results and TER professional judgement.3) Based on licence plate survey results and TER professional judgement.4) Based on industry standards and TER professional judgement.
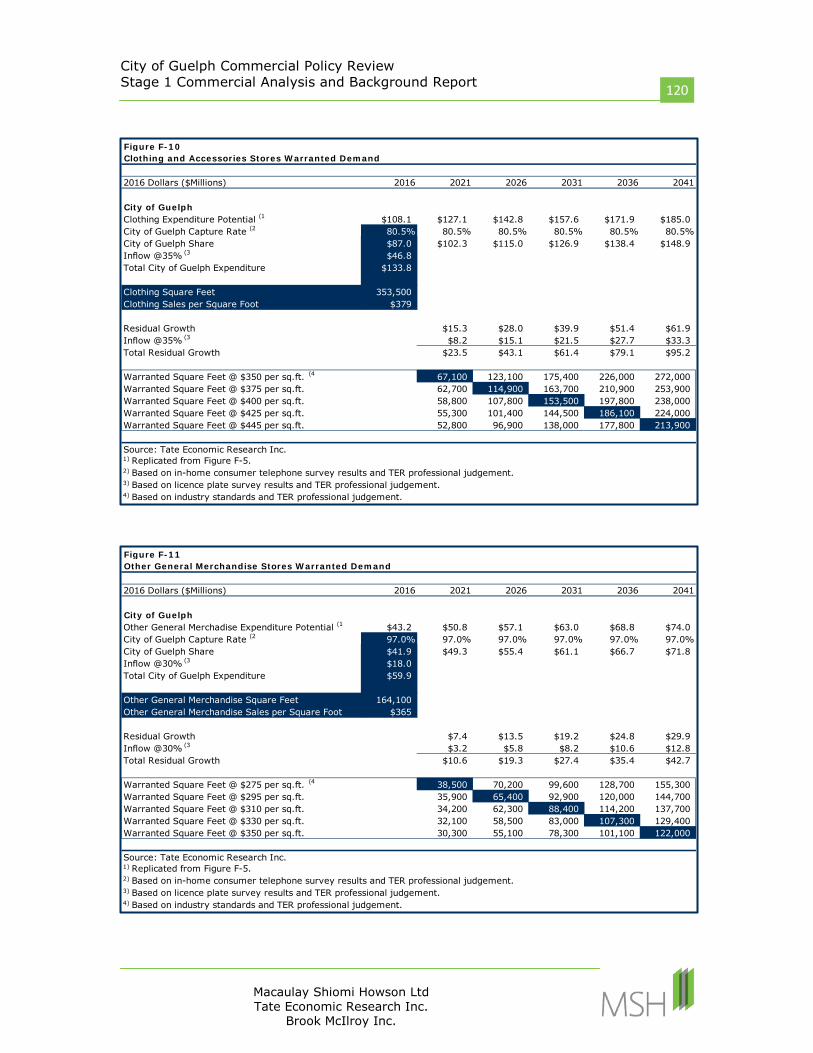
120 City of Guelph Commercial Policy Review Stage 1 Commercial Analysis and Background Report 120
Macaulay Shiomi Howson Ltd Tate Economic Research Inc.
Brook McIlroy Inc.
Figure F-10Clothing and Accessories Stores Warranted Demand
2016 Dollars ($Millions) 2016 2021 2026 2031 2036 2041
City of GuelphClothing Expenditure Potential (1 $108.1 $127.1 $142.8 $157.6 $171.9 $185.0City of Guelph Capture Rate (2 80.5% 80.5% 80.5% 80.5% 80.5% 80.5%City of Guelph Share $87.0 $102.3 $115.0 $126.9 $138.4 $148.9Inflow @35% (3 $46.8Total City of Guelph Expenditure $133.8
Clothing Square Feet 353,500 Clothing Sales per Square Foot $379
Residual Growth $15.3 $28.0 $39.9 $51.4 $61.9Inflow @35% (3 $8.2 $15.1 $21.5 $27.7 $33.3Total Residual Growth $23.5 $43.1 $61.4 $79.1 $95.2
Warranted Square Feet @ $350 per sq.ft. (4 67,100 123,100 175,400 226,000 272,000 Warranted Square Feet @ $375 per sq.ft. 62,700 114,900 163,700 210,900 253,900 Warranted Square Feet @ $400 per sq.ft. 58,800 107,800 153,500 197,800 238,000 Warranted Square Feet @ $425 per sq.ft. 55,300 101,400 144,500 186,100 224,000 Warranted Square Feet @ $445 per sq.ft. 52,800 96,900 138,000 177,800 213,900
Source: Tate Economic Research Inc.1) Replicated from Figure F-5.2) Based on in-home consumer telephone survey results and TER professional judgement.3) Based on licence plate survey results and TER professional judgement.4) Based on industry standards and TER professional judgement.
Figure F-11Other General Merchandise Stores Warranted Demand
2016 Dollars ($Millions) 2016 2021 2026 2031 2036 2041
City of GuelphOther General Merchadise Expenditure Potential (1 $43.2 $50.8 $57.1 $63.0 $68.8 $74.0City of Guelph Capture Rate (2 97.0% 97.0% 97.0% 97.0% 97.0% 97.0%City of Guelph Share $41.9 $49.3 $55.4 $61.1 $66.7 $71.8Inflow @30% (3 $18.0Total City of Guelph Expenditure $59.9
Other General Merchandise Square Feet 164,100 Other General Merchandise Sales per Square Foot $365
Residual Growth $7.4 $13.5 $19.2 $24.8 $29.9Inflow @30% (3 $3.2 $5.8 $8.2 $10.6 $12.8Total Residual Growth $10.6 $19.3 $27.4 $35.4 $42.7
Warranted Square Feet @ $275 per sq.ft. (4 38,500 70,200 99,600 128,700 155,300 Warranted Square Feet @ $295 per sq.ft. 35,900 65,400 92,900 120,000 144,700 Warranted Square Feet @ $310 per sq.ft. 34,200 62,300 88,400 114,200 137,700 Warranted Square Feet @ $330 per sq.ft. 32,100 58,500 83,000 107,300 129,400 Warranted Square Feet @ $350 per sq.ft. 30,300 55,100 78,300 101,100 122,000
Source: Tate Economic Research Inc.1) Replicated from Figure F-5.2) Based on in-home consumer telephone survey results and TER professional judgement.3) Based on licence plate survey results and TER professional judgement.4) Based on industry standards and TER professional judgement.
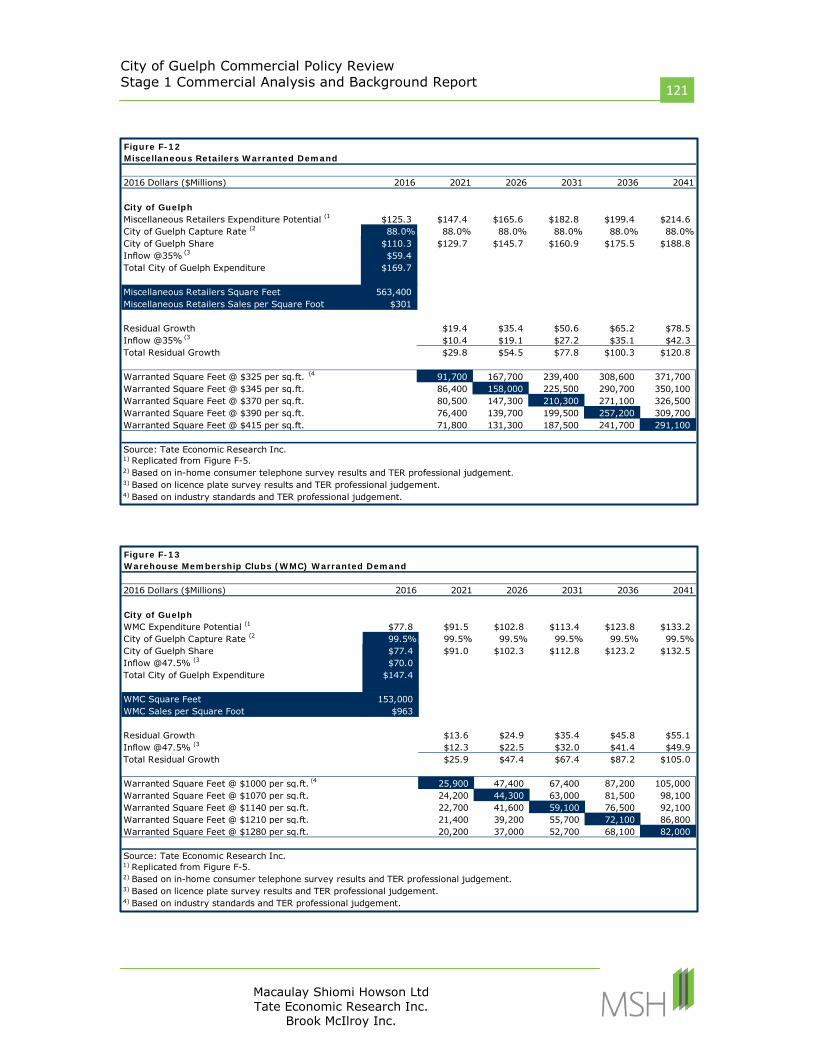
121 City of Guelph Commercial Policy Review Stage 1 Commercial Analysis and Background Report 121
Macaulay Shiomi Howson Ltd Tate Economic Research Inc.
Brook McIlroy Inc.
Figure F-12Miscellaneous Retailers Warranted Demand
2016 Dollars ($Millions) 2016 2021 2026 2031 2036 2041
City of GuelphMiscellaneous Retailers Expenditure Potential (1 $125.3 $147.4 $165.6 $182.8 $199.4 $214.6City of Guelph Capture Rate (2 88.0% 88.0% 88.0% 88.0% 88.0% 88.0%City of Guelph Share $110.3 $129.7 $145.7 $160.9 $175.5 $188.8Inflow @35% (3 $59.4Total City of Guelph Expenditure $169.7
Miscellaneous Retailers Square Feet 563,400 Miscellaneous Retailers Sales per Square Foot $301
Residual Growth $19.4 $35.4 $50.6 $65.2 $78.5Inflow @35% (3 $10.4 $19.1 $27.2 $35.1 $42.3Total Residual Growth $29.8 $54.5 $77.8 $100.3 $120.8
Warranted Square Feet @ $325 per sq.ft. (4 91,700 167,700 239,400 308,600 371,700 Warranted Square Feet @ $345 per sq.ft. 86,400 158,000 225,500 290,700 350,100 Warranted Square Feet @ $370 per sq.ft. 80,500 147,300 210,300 271,100 326,500 Warranted Square Feet @ $390 per sq.ft. 76,400 139,700 199,500 257,200 309,700 Warranted Square Feet @ $415 per sq.ft. 71,800 131,300 187,500 241,700 291,100
Source: Tate Economic Research Inc.1) Replicated from Figure F-5.2) Based on in-home consumer telephone survey results and TER professional judgement.3) Based on licence plate survey results and TER professional judgement.4) Based on industry standards and TER professional judgement.
Figure F-13Warehouse Membership Clubs (WMC) Warranted Demand
2016 Dollars ($Millions) 2016 2021 2026 2031 2036 2041
City of GuelphWMC Expenditure Potential (1 $77.8 $91.5 $102.8 $113.4 $123.8 $133.2City of Guelph Capture Rate (2 99.5% 99.5% 99.5% 99.5% 99.5% 99.5%City of Guelph Share $77.4 $91.0 $102.3 $112.8 $123.2 $132.5Inflow @47.5% (3 $70.0Total City of Guelph Expenditure $147.4
WMC Square Feet 153,000 WMC Sales per Square Foot $963
Residual Growth $13.6 $24.9 $35.4 $45.8 $55.1Inflow @47.5% (3 $12.3 $22.5 $32.0 $41.4 $49.9Total Residual Growth $25.9 $47.4 $67.4 $87.2 $105.0
Warranted Square Feet @ $1000 per sq.ft. (4 25,900 47,400 67,400 87,200 105,000 Warranted Square Feet @ $1070 per sq.ft. 24,200 44,300 63,000 81,500 98,100 Warranted Square Feet @ $1140 per sq.ft. 22,700 41,600 59,100 76,500 92,100 Warranted Square Feet @ $1210 per sq.ft. 21,400 39,200 55,700 72,100 86,800 Warranted Square Feet @ $1280 per sq.ft. 20,200 37,000 52,700 68,100 82,000
Source: Tate Economic Research Inc.1) Replicated from Figure F-5.2) Based on in-home consumer telephone survey results and TER professional judgement.3) Based on licence plate survey results and TER professional judgement.4) Based on industry standards and TER professional judgement.

122 City of Guelph Commercial Policy Review Stage 1 Commercial Analysis and Background Report 122
Macaulay Shiomi Howson Ltd Tate Economic Research Inc.
Brook McIlroy Inc.
Figure F-14Home and Automotive Supply (HAAS) Warranted Demand
2016 Dollars ($Millions) 2016 2021 2026 2031 2036 2041
City of GuelphHASS Expenditure Potential (1 $34.6 $40.7 $45.7 $50.4 $55.0 $59.2City of Guelph Capture Rate (2 98.0% 98.0% 98.0% 98.0% 98.0% 98.0%City of Guelph Share $33.9 $39.9 $44.8 $49.4 $53.9 $58.0Inflow @35% (3 $18.3Total City of Guelph Expenditure $52.2
HAAS Square Feet 133,000 HAAS Sales per Square Foot $392
Residual Growth $6.0 $10.9 $15.5 $20.0 $24.1Inflow @35% (3 $3.2 $5.9 $8.3 $10.8 $13.0Total Residual Growth $9.2 $16.8 $23.8 $30.8 $37.1
Warranted Square Feet @ $275 per sq.ft. (4 33,500 61,100 86,500 112,000 134,900 Warranted Square Feet @ $295 per sq.ft. 31,200 56,900 80,700 104,400 125,800 Warranted Square Feet @ $310 per sq.ft. 29,700 54,200 76,800 99,400 119,700 Warranted Square Feet @ $330 per sq.ft. 27,900 50,900 72,100 93,300 112,400 Warranted Square Feet @ $350 per sq.ft. 26,300 48,000 68,000 88,000 106,000
Source: Tate Economic Research Inc.1) Replicated from Figure F-5.2) Based on in-home consumer telephone survey results and TER professional judgement.3) Based on licence plate survey results and TER professional judgement.4) Based on industry standards and TER professional judgement.
Figure F-15Department Stores Warranted Demand
2016 Dollars ($Millions) 2016 2021 2026 2031 2036 2041
City of GuelphDepartment Stores Expenditure Potential (1 $108.1 $127.1 $142.8 $157.6 $171.9 $185.0City of Guelph Capture Rate (2 85.0% 85.0% 85.0% 85.0% 85.0% 85.0%City of Guelph Share $91.9 $108.0 $121.4 $134.0 $146.1 $157.3Inflow @35% (3 $49.5Total City of Guelph Expenditure $141.4
Department Store Square Feet 410,700 Department Sales per Square Foot $344
Residual Growth $16.1 $29.5 $42.1 $54.2 $65.4Inflow @35% (3 $8.7 $15.9 $22.7 $29.2 $35.2Total Residual Growth $24.8 $45.4 $64.8 $83.4 $100.6
Warranted Square Feet @ $430 per sq.ft. (4 57,700 105,600 150,700 194,000 234,000 Warranted Square Feet @ $460 per sq.ft. 53,900 98,700 140,900 181,300 218,700 Warranted Square Feet @ $490 per sq.ft. 50,600 92,700 132,200 170,200 205,300 Warranted Square Feet @ $520 per sq.ft. 47,700 87,300 124,600 160,400 193,500 Warranted Square Feet @ $550 per sq.ft. 45,100 82,500 117,800 151,600 182,900
Source: Tate Economic Research Inc.1) Replicated from Figure F-5.2) Based on in-home consumer telephone survey results and TER professional judgement.3) Based on licence plate survey results and TER professional judgement.4) Based on industry standards and TER professional judgement.
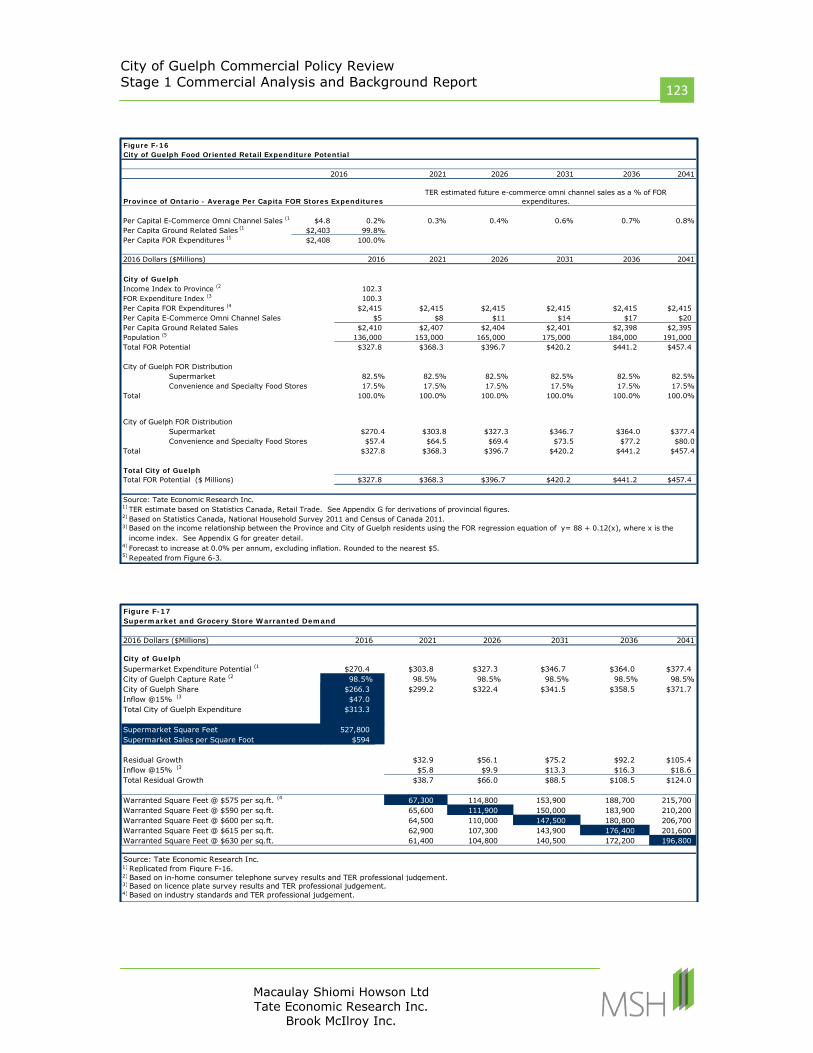
123 City of Guelph Commercial Policy Review Stage 1 Commercial Analysis and Background Report 123
Macaulay Shiomi Howson Ltd Tate Economic Research Inc.
Brook McIlroy Inc.
Figure F-16
2021 2026 2031 2036 2041
Province of Ontario - Average Per Capita FOR Stores Expenditures
Per Capital E-Commerce Omni Channel Sales (1 $4.8 0.2% 0.3% 0.4% 0.6% 0.7% 0.8%Per Capita Ground Related Sales (1 $2,403 99.8%Per Capita FOR Expenditures (1 $2,408 100.0%
2016 Dollars ($Millions) 2016 2021 2026 2031 2036 2041
City of GuelphIncome Index to Province (2 102.3 FOR Expenditure Index (3 100.3 Per Capita FOR Expenditures (4 $2,415 $2,415 $2,415 $2,415 $2,415 $2,415Per Capita E-Commerce Omni Channel Sales $5 $8 $11 $14 $17 $20Per Capita Ground Related Sales $2,410 $2,407 $2,404 $2,401 $2,398 $2,395Population (5 136,000 153,000 165,000 175,000 184,000 191,000 Total FOR Potential $327.8 $368.3 $396.7 $420.2 $441.2 $457.4
City of Guelph FOR DistributionSupermarket 82.5% 82.5% 82.5% 82.5% 82.5% 82.5%Convenience and Specialty Food Stores 17.5% 17.5% 17.5% 17.5% 17.5% 17.5%
Total 100.0% 100.0% 100.0% 100.0% 100.0% 100.0%
City of Guelph FOR DistributionSupermarket $270.4 $303.8 $327.3 $346.7 $364.0 $377.4 Convenience and Specialty Food Stores $57.4 $64.5 $69.4 $73.5 $77.2 $80.0
Total $327.8 $368.3 $396.7 $420.2 $441.2 $457.4
Total City of GuelphTotal FOR Potential ($ Millions) $327.8 $368.3 $396.7 $420.2 $441.2 $457.4
Source: Tate Economic Research Inc.1)
2)
3)
4)
5) Repeated from Figure 6-3.
City of Guelph Food Oriented Retail Expenditure Potential
2016
TER estimated future e-commerce omni channel sales as a % of FOR expenditures.
Based on the income relationship between the Province and City of Guelph residents using the FOR regression equation of y= 88 + 0.12(x), where x is the income index. See Appendix G for greater detail.
TER estimate based on Statistics Canada, Retail Trade. See Appendix G for derivations of provincial figures.Based on Statistics Canada, National Household Survey 2011 and Census of Canada 2011.
Forecast to increase at 0.0% per annum, excluding inflation. Rounded to the nearest $5.
Figure F-17Supermarket and Grocery Store Warranted Demand
2016 Dollars ($Millions) 2016 2021 2026 2031 2036 2041
City of GuelphSupermarket Expenditure Potential (1 $270.4 $303.8 $327.3 $346.7 $364.0 $377.4City of Guelph Capture Rate (2 98.5% 98.5% 98.5% 98.5% 98.5% 98.5%City of Guelph Share $266.3 $299.2 $322.4 $341.5 $358.5 $371.7Inflow @15% (3 $47.0Total City of Guelph Expenditure $313.3
Supermarket Square Feet 527,800 Supermarket Sales per Square Foot $594
Residual Growth $32.9 $56.1 $75.2 $92.2 $105.4Inflow @15% (3 $5.8 $9.9 $13.3 $16.3 $18.6Total Residual Growth $38.7 $66.0 $88.5 $108.5 $124.0
Warranted Square Feet @ $575 per sq.ft. (4 67,300 114,800 153,900 188,700 215,700 Warranted Square Feet @ $590 per sq.ft. 65,600 111,900 150,000 183,900 210,200 Warranted Square Feet @ $600 per sq.ft. 64,500 110,000 147,500 180,800 206,700 Warranted Square Feet @ $615 per sq.ft. 62,900 107,300 143,900 176,400 201,600 Warranted Square Feet @ $630 per sq.ft. 61,400 104,800 140,500 172,200 196,800
Source: Tate Economic Research Inc.1) Replicated from Figure F-16.2) Based on in-home consumer telephone survey results and TER professional judgement.3) Based on licence plate survey results and TER professional judgement.4) Based on industry standards and TER professional judgement.
124 City of Guelph Commercial Policy Review Stage 1 Commercial Analysis and Background Report 124
Macaulay Shiomi Howson Ltd Tate Economic Research Inc.
Brook McIlroy Inc.
Figure F-18Specialty Food Store Warranted Demand
2016 Dollars ($Millions) 2016 2021 2026 2031 2036 2041
City of GuelphSpecialty Food Expenditure Potential (1 $57.4 $64.5 $69.4 $73.5 $77.2 $80.0City of Guelph Capture Rate (2 83.5% 83.5% 83.5% 83.5% 83.5% 83.5%City of Guelph Share $47.9 $53.9 $57.9 $61.4 $64.5 $66.8Inflow @15% (3 $8.5Total City of Guelph Expenditure $56.4
Specialty Food Square Feet 255,900 Specialty Food Sales per Square Foot $220
Residual Growth $6.0 $10.0 $13.5 $16.6 $18.9Inflow @15% (3 $1.1 $1.8 $2.4 $2.9 $3.3Total Residual Growth $7.1 $11.8 $15.9 $19.5 $22.2
Warranted Square Feet @ $300 per sq.ft. (4 23,700 39,300 53,000 65,000 74,000 Warranted Square Feet @ $310 per sq.ft. 22,900 38,100 51,300 62,900 71,600 Warranted Square Feet @ $315 per sq.ft. 22,500 37,500 50,500 61,900 70,500 Warranted Square Feet @ $325 per sq.ft. 21,800 36,300 48,900 60,000 68,300 Warranted Square Feet @ $330 per sq.ft. 21,500 35,800 48,200 59,100 67,300
Source: Tate Economic Research Inc.1) Replicated from Figure F-16.2) Based on in-home consumer telephone survey results and TER professional judgement.3) Based on licence plate survey results and TER professional judgement.4) Based on industry standards and TER professional judgement.
Figure F-19
2021 2026 2031 2036 2041
Province of Ontario - Average Per Capita BWL Stores Expenditures
Per Capital E-Commerce Omni Channel Sales (1 $1.0 0.2% 0.3% 0.4% 0.5% 0.7% 0.8%Per Capita Ground Related Sales (1 $621 99.8%Per Capita BWL Expenditures (1 $622 100.0%
2016 Dollars ($Millions) 2016 2021 2026 2031 2036 2041
City of GuelphIncome Index to Province (2 102.3 BWL Expenditure Index (3 101.6 Per Capita BWL Expenditures (4 $630 $675 $720 $760 $805 $850Per Capita E-Commerce Omni Channel Sales $1 $2 $3 $4 $5 $7Per Capita Ground Related Sales $629 $673 $717 $756 $800 $843Population (5 136,000 153,000 165,000 175,000 184,000 191,000 Total BWL Potential $85.5 $103.0 $118.3 $132.3 $147.2 $161.0
TOTAL CITY OF GUELPHTotal BWL Potential ($ Millions) $85.5 $103.0 $118.3 $132.3 $147.2 $161.0
Source: Tate Economic Research Inc.1)
2) Based on Statistics Canada, National Household Survey 2011 and Census of Canada 2011.3)
4)
5) Repeated from Figure 6-3.Forecast to increase at 1.4% per annum, excluding inflation. Rounded to the nearest $5.
City of Guelph Beer, Wine and Liquor Retail Expenditure Potential
2016
TER estimated future e-commerce omni channel sales as a % of BWL expenditures.
TER estimate based on Statistics Canada, Retail Trade. See Appendix G BWL derivations of provincial figures.
Based on the income relationship between the Province and City of Guelph residents using the BWL regression equation of y= 29 + 0.71(x), where x is the income index. See Appendix G for greater detail.
125 City of Guelph Commercial Policy Review Stage 1 Commercial Analysis and Background Report 125
Macaulay Shiomi Howson Ltd Tate Economic Research Inc.
Brook McIlroy Inc.
Figure F-20Beer, Wine and Liquor Warranted Demand
2016 Dollars ($Millions) 2016 2021 2026 2031 2036 2041
City of GuelphBWL Expenditure Potential (1 $85.5 $103.0 $118.3 $132.3 $147.2 $161.0City of Guelph Capture Rate (2 96.0% 96.0% 96.0% 96.0% 96.0% 96.0%City of Guelph Share $82.1 $98.9 $113.6 $127.0 $141.3 $154.6Inflow @12% (3 $11.2Total City of Guelph Expenditure $93.3
BWL Square Feet 94,600 BWL Sales per Square Foot $986
Residual Growth $16.8 $31.5 $44.9 $59.2 $72.5Inflow @12% (3 $2.3 $4.3 $6.1 $8.1 $9.9Total Residual Growth $19.1 $35.8 $51.0 $67.3 $82.4
Warranted Square Feet @ $1250 per sq.ft. (4 15,300 28,600 40,800 53,800 65,900 Warranted Square Feet @ $1280 per sq.ft. 14,900 28,000 39,800 52,600 64,400 Warranted Square Feet @ $1310 per sq.ft. 14,600 27,300 38,900 51,400 62,900 Warranted Square Feet @ $1340 per sq.ft. 14,300 26,700 38,100 50,200 61,500 Warranted Square Feet @ $1375 per sq.ft. 13,900 26,000 37,100 48,900 59,900
Source: Tate Economic Research Inc.1) Replicated from Figure E-20.2) Based on in-home consumer telephone survey results and TER professional judgement.3) Based on licence plate survey results and TER professional judgement.4) Based on industry standards and TER professional judgement.
Figure F-21Service Space Warranted Space
2016 Per Capita Sq.
Ft. (1
Adjusted to Account for Decreased
Demand 2021 2026 2031 2036 2041
Cumulative Growth 17,000 29,000 39,000 48,000 55,000
Services: Eating & Drinking 825,800 6.1 5.5 93,500 159,500 214,500 264,000 302,500 Services: Personal 214,600 1.6 1.4 23,800 40,600 54,600 67,200 77,000 Services: Financial, Real Estate, 453,600 3.3 3.0 51,000 87,000 117,000 144,000 165,000 Services: Medical, Dental, Healt 1,074,200 7.9 7.1 120,700 205,900 276,900 340,800 390,500 Services: Other 1,397,100 10.3 9.3 158,100 269,700 362,700 446,400 511,500 TOTAL SERVICES 3,965,300 29.2 26.3 447,100 762,700 1,025,700 1,262,400 1,446,500
Source: Tate Economic Research Inc.1) Calculated based on 2016 population and inventory levels in the City of Guelph

12
City of Guelph Commercial Policy Review Stage 1 Commercial Analysis and Background Report
126
Macaulay Shiomi Howson Ltd Tate Economic Research Inc.
Brook McIlroy Inc.
Appendix G – Definition of Terms & Assumptions
127 City of Guelph Commercial Policy Review Stage 1 Commercial Analysis and Background Report 127
Macaulay Shiomi Howson Ltd Tate Economic Research Inc.
Brook McIlroy Inc.
Definition of Terms & Assumptions
Commercial
Commercial refers to retail and service spaces.
Retail
Retail refers to a business that sells physical commodities directly to a public consumer in exchange for currency (e.g. A supermarket where a variety of food products are publicly for sale).
Service
Service refers to a business that offers assistance using a specific skillset in exchange for currency. In contrast to retail, services typically do not sell a physical product, but offer their skills as a paid service to the customer. An example of a service would be a hair salon, where the business is using their skills cutting hair to make money.
Gross Leasable Area (GLA)
Gross leasable area (GLA) is the total floor area designed for tenant occupancy and exclusive use, including basements, upper floors and mezzanines. It is expressed in square feet, and measured from the centre line of joint partitions and from outside wall faces. GLA is the area on which tenants pay rent, and which produces income for a tenant. Since it lends itself readily to measurement and comparison, GLA has been adopted by the shopping centre industry as its standard for statistical comparison.
In undertaking the inventory of competitive space in the Study Area, TER included only ground floor retail and storage space where appropriate. Mezzanines, upper floors and basement space were only included when the entire facility was in an upper or lower level of a building.
Net Undercoverage
Statistics Canada describes net undercoverage as: “The census attempts to count every person residing in Canada on Census Day. However, two types of errors can occur. Some people who should be enumerated can be missed (undercoverage), while some other persons can be enumerated more than once (overcoverage). The difference between these two coverage errors is called net undercoverage.”
Per Capita Income
128 City of Guelph Commercial Policy Review Stage 1 Commercial Analysis and Background Report 128
Macaulay Shiomi Howson Ltd Tate Economic Research Inc.
Brook McIlroy Inc.
Per capita income represents average total personal income before tax, as defined by Statistics Canada. The Study Area income indices are based on the results of the 2011 Census of Canada. The detailed calculations that were used in the determination of the Study Area resident’s per capita income levels by Study Area zone have been summarized in Figure F-1 that follows.
Per Capita NFOR, FOR & BWL Expenditures
TER’s calculation of per capita NFOR, FOR & BWL expenditures for the Province of Ontario in 2016 are based on full year Retail Trade data and are included in Figures F2, F3 and F-4.
Study Area Residents’ NFOR & FOR Expenditure Potential
Expenditure potential is the total annual expenditures made by Study Area residents. This includes purchases made both inside and outside the Study Area. It is calculated by multiplying the average per capita expenditure indices by the total population of a Study Area.
Real Growth
Real growth refers to the amount that sales volumes or expenditures would increase in future years with inflation eliminated. T herefore, references to the Canadian dollar, dealing with both the present and future period, reflect its 2016 value in this report. For the purposes of our study, a real growth rate of 1.0% per year for NFOR expenditures and 0.25% for FOR expenditures. TER Retail and Service Classification System TER has used the North American Industrial Classification System (NAICS) for classification of retail space. NAICS retail definitions are included as Figures F-5 and F-6. The Inventory Classification system used by TER is indicated in Figure F-7 it is based on NAICS codes to correspond with the most recently published Statistics Canada Retail Trade data. List of Figures
Figure G-1: 2016 Study Area Per Capita Income Indices Figure G-2: Per Capita NFOR Expenditure Estimates 2016 Figure G-3: Per Capita FOR Expenditure Estimates 2016 Figure G-4: Per Capita BWL Store Expenditure Estimates 2016
129 City of Guelph Commercial Policy Review Stage 1 Commercial Analysis and Background Report 129
Macaulay Shiomi Howson Ltd Tate Economic Research Inc.
Brook McIlroy Inc.
Figure G-5: NAICS Definitions of NFOR Items Figure G-6: NAICS Definitions of FOR Items Figure G-7: Retail and Service Inventory Classification Codes
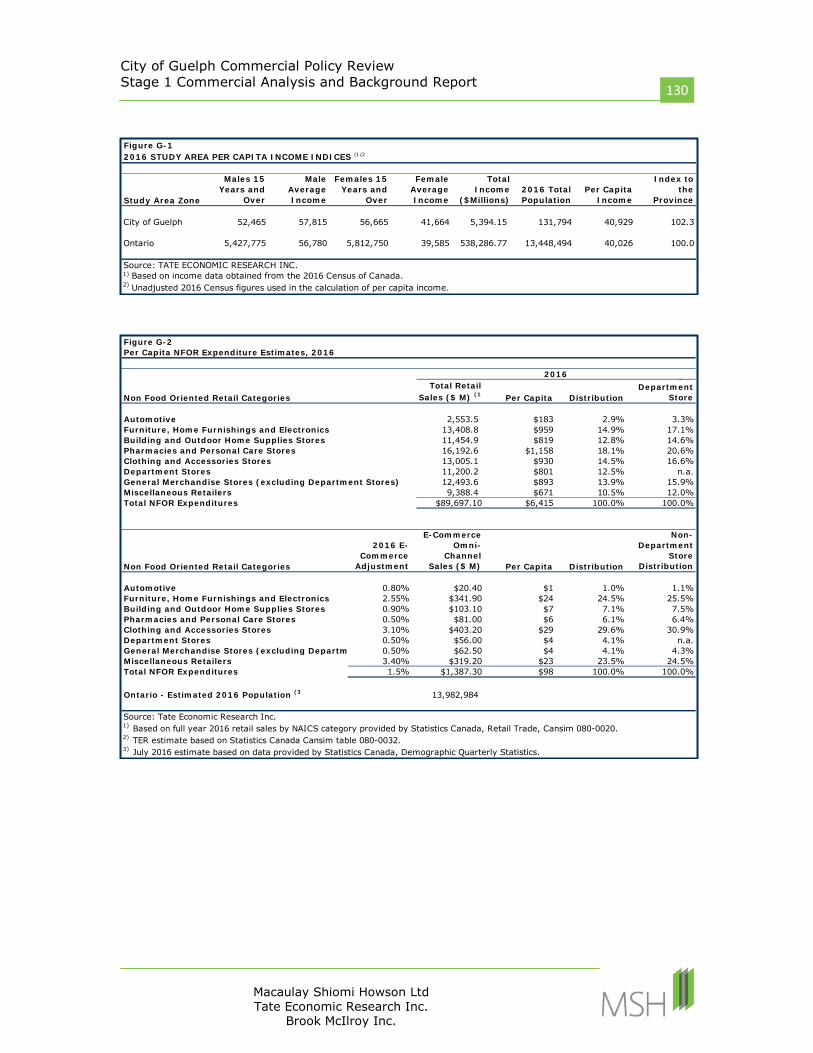
130 City of Guelph Commercial Policy Review Stage 1 Commercial Analysis and Background Report 130
Macaulay Shiomi Howson Ltd Tate Economic Research Inc.
Brook McIlroy Inc.
Figure G-12016 STUDY AREA PER CAPITA INCOME INDICES (1 (2
Study Area Zone
Males 15 Years and
Over
Male Average Income
Females 15 Years and
Over
Female Average Income
Total Income
($Millions)2016 Total Population
Per Capita Income
Index to the
Province
City of Guelph 52,465 57,815 56,665 41,664 5,394.15 131,794 40,929 102.3
Ontario 5,427,775 56,780 5,812,750 39,585 538,286.77 13,448,494 40,026 100.0
Source: TATE ECONOMIC RESEARCH INC.1)
2) Unadjusted 2016 Census figures used in the calculation of per capita income.Based on income data obtained from the 2016 Census of Canada.
Figure G-2Per Capita NFOR Expenditure Estimates, 2016
Non Food Oriented Retail CategoriesTotal Retail
Sales ($ M) (1 Per Capita Distribution
oDepartment
Store
Automotive 2,553.5 $183 2.9% 3.3%Furniture, Home Furnishings and Electronics 13,408.8 $959 14.9% 17.1%Building and Outdoor Home Supplies Stores 11,454.9 $819 12.8% 14.6%Pharmacies and Personal Care Stores 16,192.6 $1,158 18.1% 20.6%Clothing and Accessories Stores 13,005.1 $930 14.5% 16.6%Department Stores 11,200.2 $801 12.5% n.a.General Merchandise Stores (excluding Department Stores) 12,493.6 $893 13.9% 15.9%Miscellaneous Retailers 9,388.4 $671 10.5% 12.0%Total NFOR Expenditures $89,697.10 $6,415 100.0% 100.0%
Non Food Oriented Retail Categories
2016 E-Commerce
Adjustment
E-Commerce Omni-
Channel Sales ($ M) Per Capita Distribution
Non-Department
Store Distribution
Automotive 0.80% $20.40 $1 1.0% 1.1%Furniture, Home Furnishings and Electronics 2.55% $341.90 $24 24.5% 25.5%Building and Outdoor Home Supplies Stores 0.90% $103.10 $7 7.1% 7.5%Pharmacies and Personal Care Stores 0.50% $81.00 $6 6.1% 6.4%Clothing and Accessories Stores 3.10% $403.20 $29 29.6% 30.9%Department Stores 0.50% $56.00 $4 4.1% n.a.General Merchandise Stores (excluding Departm 0.50% $62.50 $4 4.1% 4.3%Miscellaneous Retailers 3.40% $319.20 $23 23.5% 24.5%Total NFOR Expenditures 1.5% $1,387.30 $98 100.0% 100.0%
Ontario - Estimated 2016 Population (3 13,982,984
Source: Tate Economic Research Inc.1) Based on full year 2016 retail sales by NAICS category provided by Statistics Canada, Retail Trade, Cansim 080-0020.2) TER estimate based on Statistics Canada Cansim table 080-0032.3) July 2016 estimate based on data provided by Statistics Canada, Demographic Quarterly Statistics.
2016
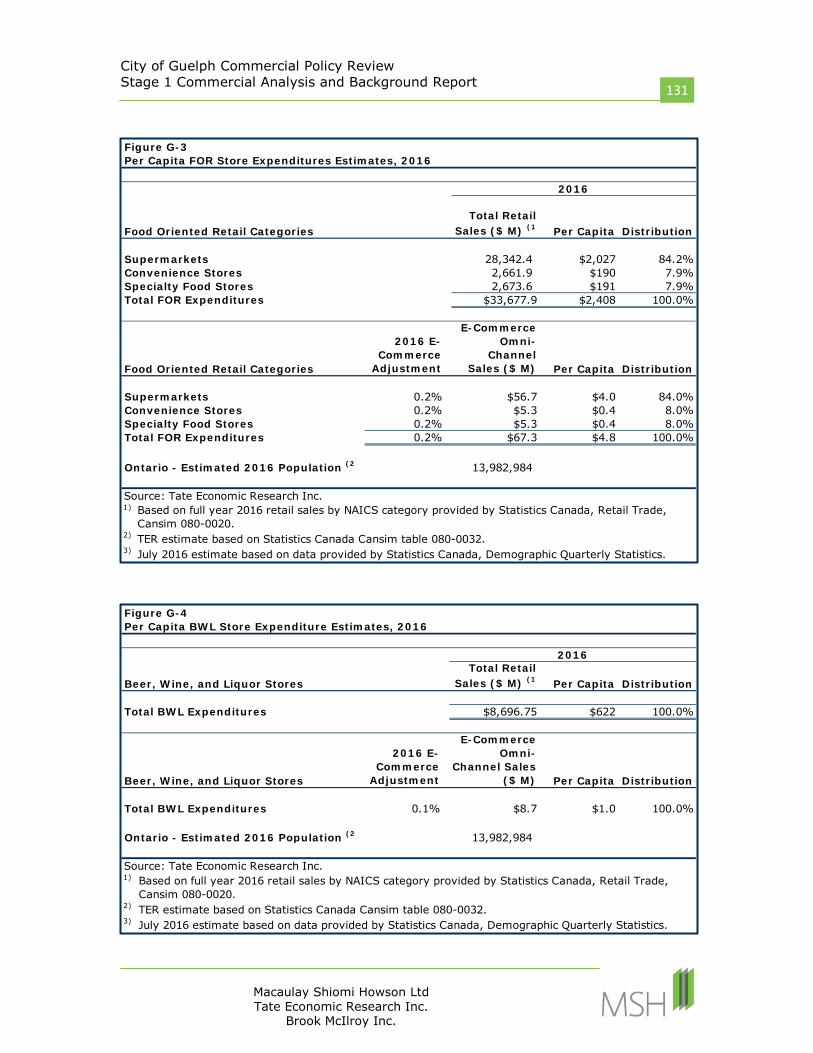
131 City of Guelph Commercial Policy Review Stage 1 Commercial Analysis and Background Report 131
Macaulay Shiomi Howson Ltd Tate Economic Research Inc.
Brook McIlroy Inc.
Figure G-3Per Capita FOR Store Expenditures Estimates, 2016
Food Oriented Retail CategoriesTotal Retail
Sales ($ M) (1 Per Capita Distribution
Supermarkets 28,342.4 $2,027 84.2%Convenience Stores 2,661.9 $190 7.9%Specialty Food Stores 2,673.6 $191 7.9%Total FOR Expenditures $33,677.9 $2,408 100.0%
Food Oriented Retail Categories
2016 E-Commerce
Adjustment
E-Commerce Omni-
Channel Sales ($ M) Per Capita Distribution
Supermarkets 0.2% $56.7 $4.0 84.0%Convenience Stores 0.2% $5.3 $0.4 8.0%Specialty Food Stores 0.2% $5.3 $0.4 8.0%Total FOR Expenditures 0.2% $67.3 $4.8 100.0%
Ontario - Estimated 2016 Population (2 13,982,984
Source: Tate Economic Research Inc.1)
2) TER estimate based on Statistics Canada Cansim table 080-0032.3) July 2016 estimate based on data provided by Statistics Canada, Demographic Quarterly Statistics.
2016
Based on full year 2016 retail sales by NAICS category provided by Statistics Canada, Retail Trade, Cansim 080-0020.
Figure G-4Per Capita BWL Store Expenditure Estimates, 2016
Beer, Wine, and Liquor StoresTotal Retail
Sales ($ M) (1 Per Capita Distribution
Total BWL Expenditures $8,696.75 $622 100.0%
Beer, Wine, and Liquor Stores
2016 E-Commerce
Adjustment
E-Commerce Omni-
Channel Sales ($ M) Per Capita Distribution
Total BWL Expenditures 0.1% $8.7 $1.0 100.0%
Ontario - Estimated 2016 Population (2 13,982,984
Source: Tate Economic Research Inc.1)
2) TER estimate based on Statistics Canada Cansim table 080-0032.3) July 2016 estimate based on data provided by Statistics Canada, Demographic Quarterly Statistics.
2016
Based on full year 2016 retail sales by NAICS category provided by Statistics Canada, Retail Trade, Cansim 080-0020.
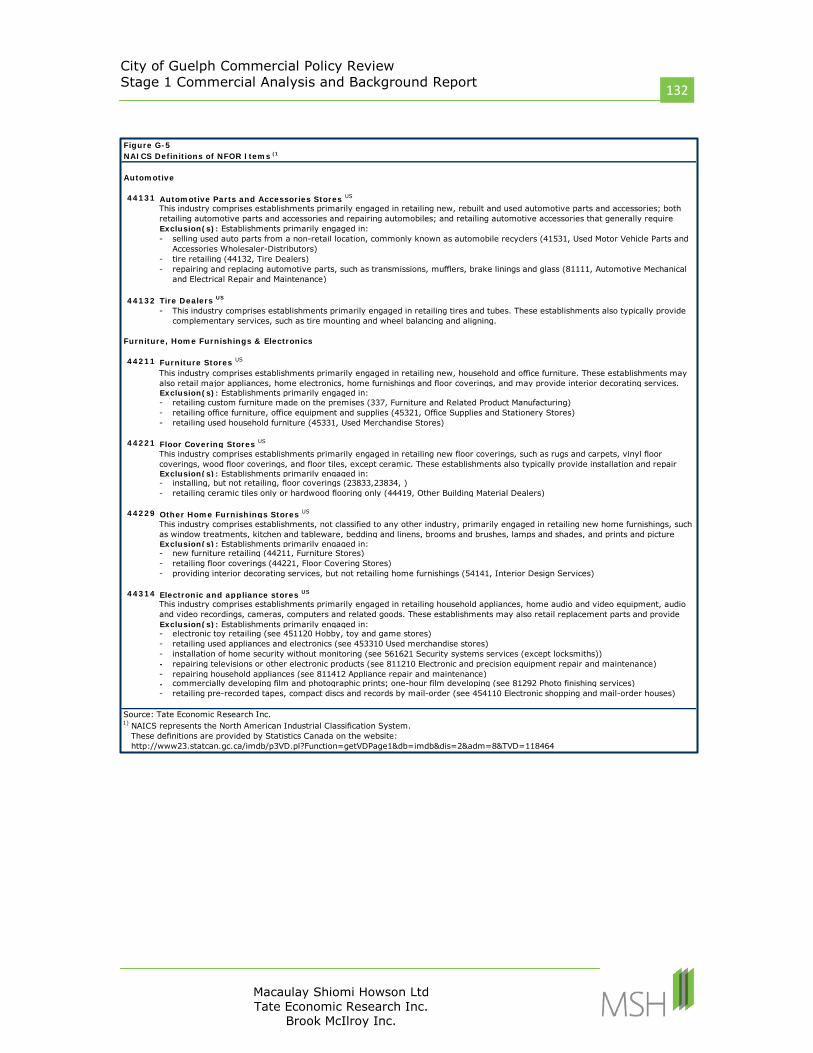
132 City of Guelph Commercial Policy Review Stage 1 Commercial Analysis and Background Report 132
Macaulay Shiomi Howson Ltd Tate Economic Research Inc.
Brook McIlroy Inc.
Figure G-5NAICS Definitions of NFOR Items (1
Automotive
44131
Exclusion(s): Establishments primarily engaged in:- selling used auto parts from a non-retail location, commonly known as automobile recyclers (41531, Used Motor Vehicle Parts and
Accessories Wholesaler-Distributors)- tire retailing (44132, Tire Dealers)- repairing and replacing automotive parts, such as transmissions, mufflers, brake linings and glass (81111, Automotive Mechanical
and Electrical Repair and Maintenance)
44132 Tire Dealers US
- This industry comprises establishments primarily engaged in retailing tires and tubes. These establishments also typically provide complementary services, such as tire mounting and wheel balancing and aligning.
Furniture, Home Furnishings & Electronics
44211
- retailing custom furniture made on the premises (337, Furniture and Related Product Manufacturing)- retailing office furniture, office equipment and supplies (45321, Office Supplies and Stationery Stores)- retailing used household furniture (45331, Used Merchandise Stores)
44221
- installing, but not retailing, floor coverings (23833,23834, )- retailing ceramic tiles only or hardwood flooring only (44419, Other Building Material Dealers)
44229
- new furniture retailing (44211, Furniture Stores)- retailing floor coverings (44221, Floor Covering Stores)- providing interior decorating services, but not retailing home furnishings (54141, Interior Design Services)
44314 Electronic and appliance stores US
- electronic toy retailing (see 451120 Hobby, toy and game stores)- retailing used appliances and electronics (see 453310 Used merchandise stores)- installation of home security without monitoring (see 561621 Security systems services (except locksmiths))- repairing televisions or other electronic products (see 811210 Electronic and precision equipment repair and maintenance)- repairing household appliances (see 811412 Appliance repair and maintenance)- commercially developing film and photographic prints; one-hour film developing (see 81292 Photo finishing services)- retailing pre-recorded tapes, compact discs and records by mail-order (see 454110 Electronic shopping and mail-order houses)
Source: Tate Economic Research Inc.1) NAICS represents the North American Industrial Classification System. These definitions are provided by Statistics Canada on the website: http://www23.statcan.gc.ca/imdb/p3VD.pl?Function=getVDPage1&db=imdb&dis=2&adm=8&TVD=118464
Automotive Parts and Accessories Stores US
This industry comprises establishments primarily engaged in retailing new, rebuilt and used automotive parts and accessories; both retailing automotive parts and accessories and repairing automobiles; and retailing automotive accessories that generally require
This industry comprises establishments primarily engaged in retailing new floor coverings, such as rugs and carpets, vinyl floor coverings, wood floor coverings, and floor tiles, except ceramic. These establishments also typically provide installation and repair Exclusion(s): Establishments primarily engaged in:
Other Home Furnishings Stores US
This industry comprises establishments, not classified to any other industry, primarily engaged in retailing new home furnishings, such as window treatments, kitchen and tableware, bedding and linens, brooms and brushes, lamps and shades, and prints and picture
Furniture Stores US
This industry comprises establishments primarily engaged in retailing new, household and office furniture. These establishments may also retail major appliances, home electronics, home furnishings and floor coverings, and may provide interior decorating services.Exclusion(s): Establishments primarily engaged in:
Floor Covering Stores US
Exclusion(s): Establishments primarily engaged in:
This industry comprises establishments primarily engaged in retailing household appliances, home audio and video equipment, audio and video recordings, cameras, computers and related goods. These establishments may also retail replacement parts and provide Exclusion(s): Establishments primarily engaged in:
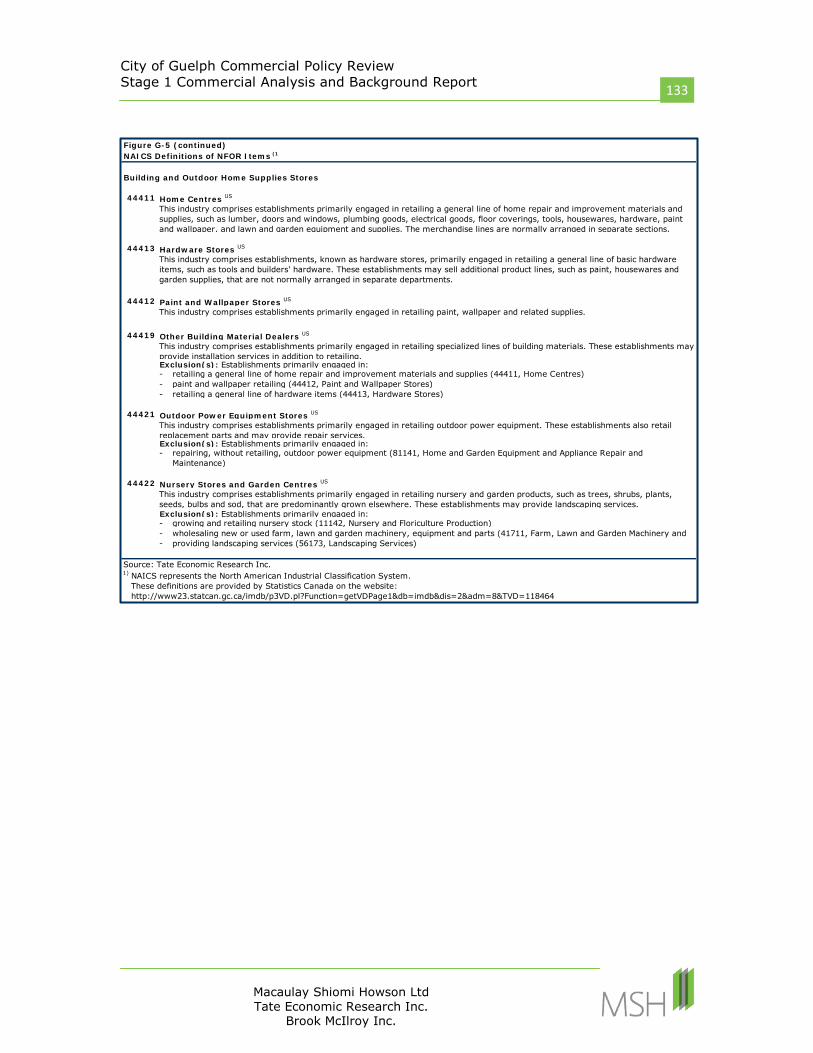
133 City of Guelph Commercial Policy Review Stage 1 Commercial Analysis and Background Report 133
Macaulay Shiomi Howson Ltd Tate Economic Research Inc.
Brook McIlroy Inc.
Figure G-5 (continued)NAICS Definitions of NFOR Items (1
Building and Outdoor Home Supplies Stores
44411
44413
44412
44419
- retailing a general line of home repair and improvement materials and supplies (44411, Home Centres)- paint and wallpaper retailing (44412, Paint and Wallpaper Stores)- retailing a general line of hardware items (44413, Hardware Stores)
44421
- repairing, without retailing, outdoor power equipment (81141, Home and Garden Equipment and Appliance Repair and Maintenance)
44422
- growing and retailing nursery stock (11142, Nursery and Floriculture Production)- wholesaling new or used farm, lawn and garden machinery, equipment and parts (41711, Farm, Lawn and Garden Machinery and - providing landscaping services (56173, Landscaping Services)
Source: Tate Economic Research Inc.1) NAICS represents the North American Industrial Classification System. These definitions are provided by Statistics Canada on the website: http://www23.statcan.gc.ca/imdb/p3VD.pl?Function=getVDPage1&db=imdb&dis=2&adm=8&TVD=118464
This industry comprises establishments primarily engaged in retailing paint, wallpaper and related supplies.
Home Centres US
This industry comprises establishments primarily engaged in retailing a general line of home repair and improvement materials and supplies, such as lumber, doors and windows, plumbing goods, electrical goods, floor coverings, tools, housewares, hardware, paint and wallpaper, and lawn and garden equipment and supplies. The merchandise lines are normally arranged in separate sections.
This industry comprises establishments primarily engaged in retailing outdoor power equipment. These establishments also retail replacement parts and may provide repair services.Exclusion(s): Establishments primarily engaged in:
Nursery Stores and Garden Centres US
Hardware Stores US
This industry comprises establishments, known as hardware stores, primarily engaged in retailing a general line of basic hardware items, such as tools and builders' hardware. These establishments may sell additional product lines, such as paint, housewares and garden supplies, that are not normally arranged in separate departments.
Paint and Wallpaper Stores US
Exclusion(s): Establishments primarily engaged in:
This industry comprises establishments primarily engaged in retailing nursery and garden products, such as trees, shrubs, plants, seeds, bulbs and sod, that are predominantly grown elsewhere. These establishments may provide landscaping services.
Other Building Material Dealers US
This industry comprises establishments primarily engaged in retailing specialized lines of building materials. These establishments may provide installation services in addition to retailing.Exclusion(s): Establishments primarily engaged in:
Outdoor Power Equipment Stores US

134 City of Guelph Commercial Policy Review Stage 1 Commercial Analysis and Background Report 134
Macaulay Shiomi Howson Ltd Tate Economic Research Inc.
Brook McIlroy Inc.
Figure G-5 (continued)NAICS Definitions of NFOR Items (1
Pharmacies and Personal Care Stores
44611
- retailing food supplement products, such as vitamins, nutrition supplements and body enhancing supplements (44619, Other Health
44612
44613
- lens grinding without retailing (33911, Medical Equipment and Supplies Manufacturing)- operating a private or group practice of optometry (62132, Offices of Optometrists)
44619
Source: Tate Economic Research Inc.1) NAICS represents the North American Industrial Classification System. These definitions are provided by Statistics Canada on the website: http://www23.statcan.gc.ca/imdb/p3VD.pl?Function=getVDPage1&db=imdb&dis=2&adm=8&TVD=118464
Cosmetics, Beauty Supplies and Perfume Stores US
Pharmacies and Drug Stores US
This industry comprises establishments, known as pharmacies and drug stores, primarily engaged in retailing prescription or non-prescription drugs and medicines. These establishments also typically retail snacks, cosmetics, personal hygiene products, greeting cards and stationery, and health aids, and may also retail confectionery, tobacco products, novelties and giftware, and cameras and Exclusion(s): Establishments primarily engaged in:
Exclusion(s): Establishments primarily engaged in:
Other Health and Personal Care Stores US
This industry comprises establishments, not classified to any other industry, primarily engaged in retailing health and personal care items. Establishments primarily engaged in retailing health and personal care items, such as vitamin supplements, hearing aids, and
This industry comprises establishments primarily engaged in retailing cosmetics, perfumes, toiletries and personal grooming products.
Optical Goods Stores US
This industry comprises establishments primarily engaged in retailing and fitting prescription eyeglasses and contact lenses. These establishments may or may not grind lenses to order on the premises. Establishments primarily engaged in retailing non-prescription
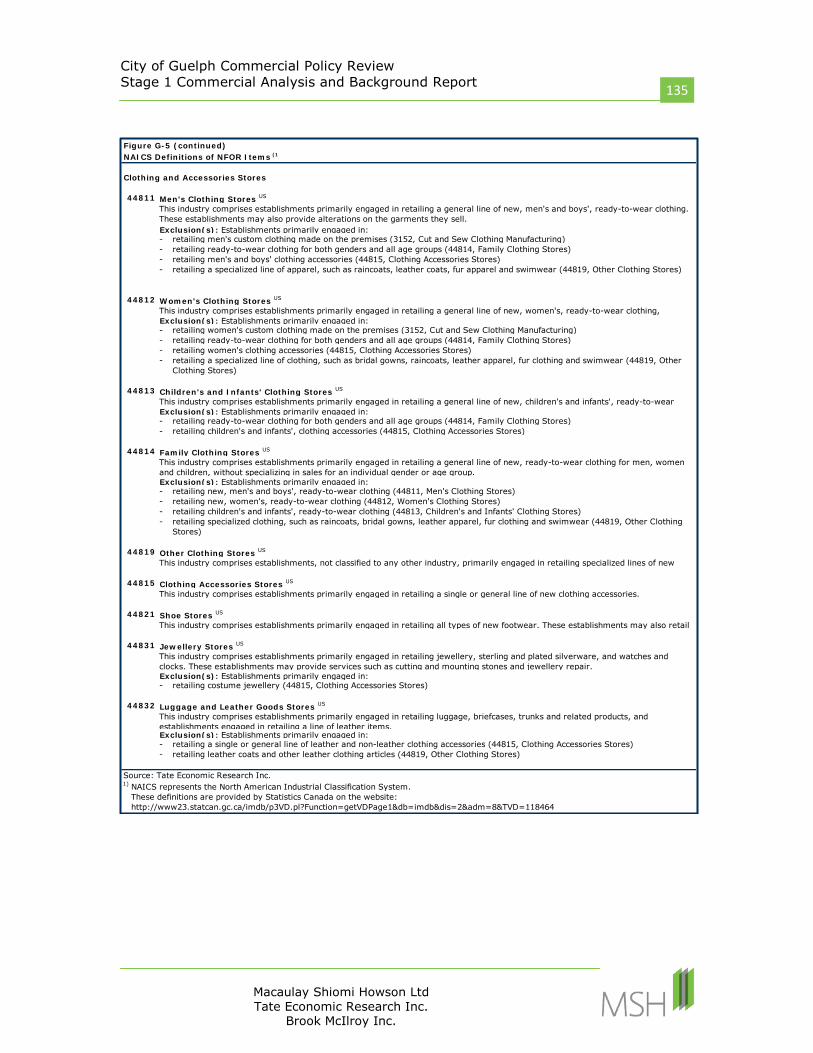
135 City of Guelph Commercial Policy Review Stage 1 Commercial Analysis and Background Report 135
Macaulay Shiomi Howson Ltd Tate Economic Research Inc.
Brook McIlroy Inc.
Figure G-5 (continued)NAICS Definitions of NFOR Items (1
Clothing and Accessories Stores
44811
- retailing men's custom clothing made on the premises (3152, Cut and Sew Clothing Manufacturing)- retailing ready-to-wear clothing for both genders and all age groups (44814, Family Clothing Stores)- retailing men's and boys' clothing accessories (44815, Clothing Accessories Stores)- retailing a specialized line of apparel, such as raincoats, leather coats, fur apparel and swimwear (44819, Other Clothing Stores)
44812
- retailing women's custom clothing made on the premises (3152, Cut and Sew Clothing Manufacturing)- retailing ready-to-wear clothing for both genders and all age groups (44814, Family Clothing Stores)- retailing women's clothing accessories (44815, Clothing Accessories Stores)- retailing a specialized line of clothing, such as bridal gowns, raincoats, leather apparel, fur clothing and swimwear (44819, Other
Clothing Stores)
44813
- retailing ready-to-wear clothing for both genders and all age groups (44814, Family Clothing Stores)- retailing children's and infants', clothing accessories (44815, Clothing Accessories Stores)
44814
- retailing new, men's and boys', ready-to-wear clothing (44811, Men's Clothing Stores)- retailing new, women's, ready-to-wear clothing (44812, Women's Clothing Stores)- retailing children's and infants', ready-to-wear clothing (44813, Children's and Infants' Clothing Stores)- retailing specialized clothing, such as raincoats, bridal gowns, leather apparel, fur clothing and swimwear (44819, Other Clothing
Stores)
44819
44815
44821
44831
- retailing costume jewellery (44815, Clothing Accessories Stores)
44832
- retailing a single or general line of leather and non-leather clothing accessories (44815, Clothing Accessories Stores)- retailing leather coats and other leather clothing articles (44819, Other Clothing Stores)
Source: Tate Economic Research Inc.1) NAICS represents the North American Industrial Classification System. These definitions are provided by Statistics Canada on the website: http://www23.statcan.gc.ca/imdb/p3VD.pl?Function=getVDPage1&db=imdb&dis=2&adm=8&TVD=118464
This industry comprises establishments primarily engaged in retailing a general line of new, men's and boys', ready-to-wear clothing. These establishments may also provide alterations on the garments they sell.Exclusion(s): Establishments primarily engaged in:
Women's Clothing Stores US
This industry comprises establishments primarily engaged in retailing a general line of new, women's, ready-to-wear clothing,
Men's Clothing Stores US
This industry comprises establishments, not classified to any other industry, primarily engaged in retailing specialized lines of new
Clothing Accessories Stores US
This industry comprises establishments primarily engaged in retailing a single or general line of new clothing accessories.
Shoe Stores US
Family Clothing Stores US
This industry comprises establishments primarily engaged in retailing a general line of new, ready-to-wear clothing for men, women and children, without specializing in sales for an individual gender or age group.Exclusion(s): Establishments primarily engaged in:
Other Clothing Stores US
Exclusion(s): Establishments primarily engaged in:
Children's and Infants' Clothing Stores US
This industry comprises establishments primarily engaged in retailing a general line of new, children's and infants', ready-to-wear Exclusion(s): Establishments primarily engaged in:
Exclusion(s): Establishments primarily engaged in:
Luggage and Leather Goods Stores US
This industry comprises establishments primarily engaged in retailing luggage, briefcases, trunks and related products, and establishments engaged in retailing a line of leather items.Exclusion(s): Establishments primarily engaged in:
This industry comprises establishments primarily engaged in retailing all types of new footwear. These establishments may also retail
Jewellery Stores US
This industry comprises establishments primarily engaged in retailing jewellery, sterling and plated silverware, and watches and clocks. These establishments may provide services such as cutting and mounting stones and jewellery repair.

136 City of Guelph Commercial Policy Review Stage 1 Commercial Analysis and Background Report 136
Macaulay Shiomi Howson Ltd Tate Economic Research Inc.
Brook McIlroy Inc.
Figure G-5 (continued)NAICS Definitions of NFOR Items (1
General Merchandise Stores
45211
- warehouse-style stores engaged in retailing a general line of grocery items in combination with a general line of non-grocery items (45291, Warehouse Clubs and Superstores)
45291
- retailing a general line of grocery items (44511, Supermarkets and Other Grocery (except Convenience) Stores)- retailing a general line of merchandise in department stores (45211, Department Stores)
45299
- automotive parts retailing (44131, Automotive Parts and Accessories Stores)- retailing merchandise in catalogue showrooms, without stock (45411, Electronic Shopping and Mail-Order Houses)
Source: Tate Economic Research Inc.1) NAICS represents the North American Industrial Classification System. These definitions are provided by Statistics Canada on the website: http://www23.statcan.gc.ca/imdb/p3VD.pl?Function=getVDPage1&db=imdb&dis=2&adm=8&TVD=118464
Department Stores US
This industry comprises establishments, known as department stores, primarily engaged in retailing a wide range of products, with each merchandise line constituting a separate department within the store. Selected departments may be operated by separate Exclusion(s):
Warehouse Clubs and Superstores US
Exclusion(s): Establishments primarily engaged in:
This industry comprises establishments, known as warehouse clubs, superstores or supercentres, primarily engaged in retailing a general line of grocery items in combination with a general line of non-grocery items, and typically selling grocery items in larger Exclusion(s): Establishments primarily engaged in:
All Other General Merchandise Stores US
This industry comprises establishments, not classified to any other industry, primarily engaged in retailing a general line of new merchandise. Establishments known as home and auto supplies stores, catalogue showrooms, agricultural co-op stores, variety stores
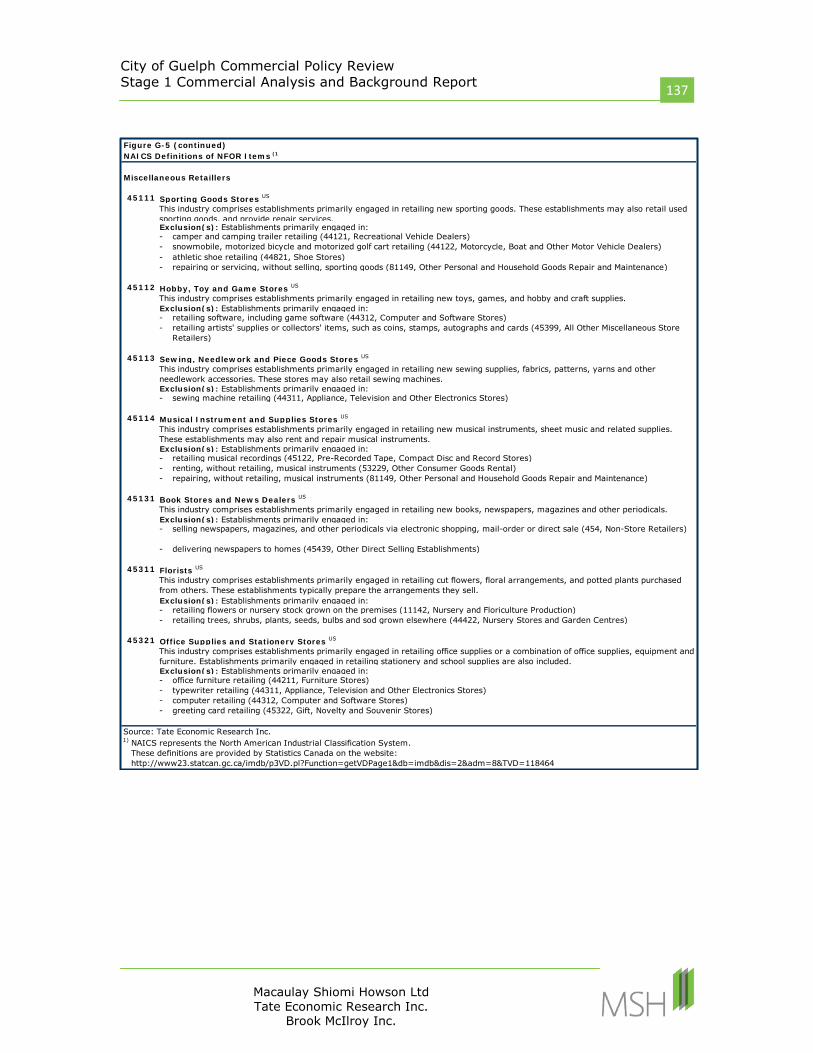
137 City of Guelph Commercial Policy Review Stage 1 Commercial Analysis and Background Report 137
Macaulay Shiomi Howson Ltd Tate Economic Research Inc.
Brook McIlroy Inc.
Figure G-5 (continued)NAICS Definitions of NFOR Items (1
Miscellaneous Retaillers
45111
- camper and camping trailer retailing (44121, Recreational Vehicle Dealers)- snowmobile, motorized bicycle and motorized golf cart retailing (44122, Motorcycle, Boat and Other Motor Vehicle Dealers)- athletic shoe retailing (44821, Shoe Stores)- repairing or servicing, without selling, sporting goods (81149, Other Personal and Household Goods Repair and Maintenance)
45112
- retailing software, including game software (44312, Computer and Software Stores)- retailing artists' supplies or collectors' items, such as coins, stamps, autographs and cards (45399, All Other Miscellaneous Store
Retailers)
45113
- sewing machine retailing (44311, Appliance, Television and Other Electronics Stores)
45114
- retailing musical recordings (45122, Pre-Recorded Tape, Compact Disc and Record Stores)- renting, without retailing, musical instruments (53229, Other Consumer Goods Rental)- repairing, without retailing, musical instruments (81149, Other Personal and Household Goods Repair and Maintenance)
45131
- selling newspapers, magazines, and other periodicals via electronic shopping, mail-order or direct sale (454, Non-Store Retailers)
- delivering newspapers to homes (45439, Other Direct Selling Establishments)
45311
- retailing flowers or nursery stock grown on the premises (11142, Nursery and Floriculture Production)- retailing trees, shrubs, plants, seeds, bulbs and sod grown elsewhere (44422, Nursery Stores and Garden Centres)
45321
- office furniture retailing (44211, Furniture Stores)- typewriter retailing (44311, Appliance, Television and Other Electronics Stores)- computer retailing (44312, Computer and Software Stores)- greeting card retailing (45322, Gift, Novelty and Souvenir Stores)
Source: Tate Economic Research Inc.1) NAICS represents the North American Industrial Classification System. These definitions are provided by Statistics Canada on the website: http://www23.statcan.gc.ca/imdb/p3VD.pl?Function=getVDPage1&db=imdb&dis=2&adm=8&TVD=118464
Hobby, Toy and Game Stores US
This industry comprises establishments primarily engaged in retailing new toys, games, and hobby and craft supplies.Exclusion(s): Establishments primarily engaged in:
Sewing, Needlework and Piece Goods Stores US
Sporting Goods Stores US
This industry comprises establishments primarily engaged in retailing new sporting goods. These establishments may also retail used sporting goods, and provide repair services.Exclusion(s): Establishments primarily engaged in:
Florists US
Exclusion(s): Establishments primarily engaged in:
Book Stores and News Dealers US
This industry comprises establishments primarily engaged in retailing new books, newspapers, magazines and other periodicals.Exclusion(s): Establishments primarily engaged in:
Exclusion(s): Establishments primarily engaged in:
This industry comprises establishments primarily engaged in retailing new sewing supplies, fabrics, patterns, yarns and other needlework accessories. These stores may also retail sewing machines.Exclusion(s): Establishments primarily engaged in:
Musical Instrument and Supplies Stores US
This industry comprises establishments primarily engaged in retailing new musical instruments, sheet music and related supplies. These establishments may also rent and repair musical instruments.
This industry comprises establishments primarily engaged in retailing cut flowers, floral arrangements, and potted plants purchased from others. These establishments typically prepare the arrangements they sell.Exclusion(s): Establishments primarily engaged in:
Office Supplies and Stationery Stores US
This industry comprises establishments primarily engaged in retailing office supplies or a combination of office supplies, equipment and furniture. Establishments primarily engaged in retailing stationery and school supplies are also included.
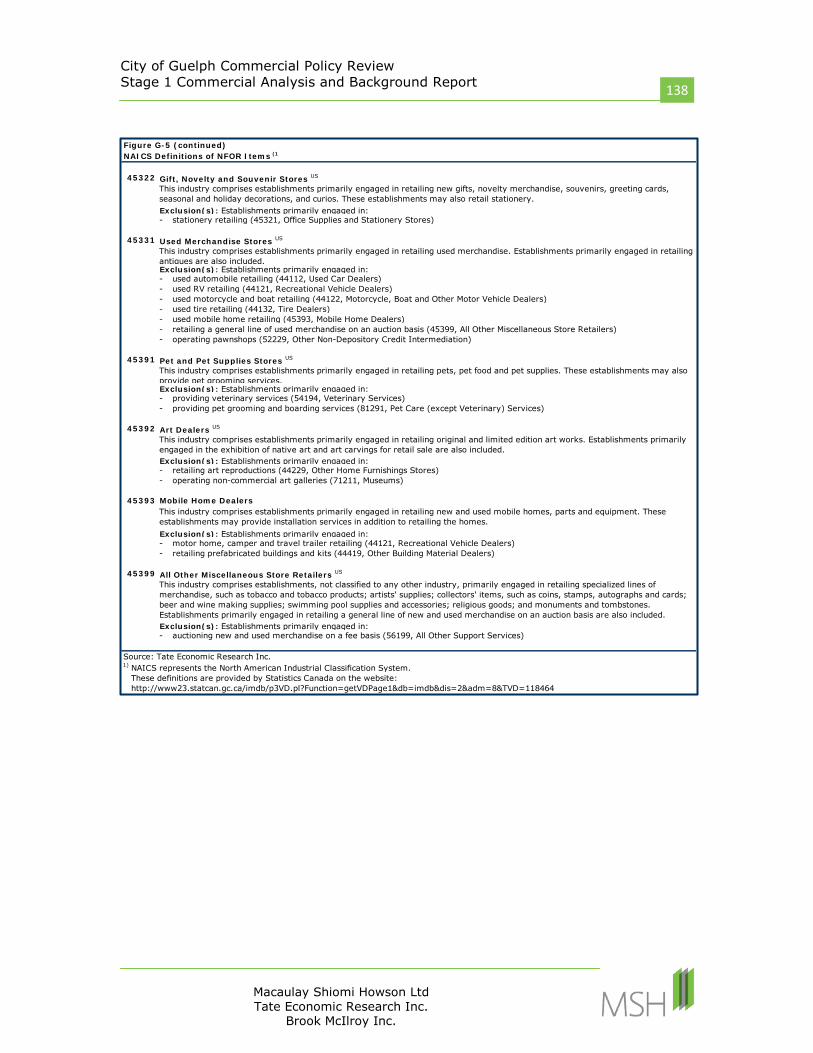
138 City of Guelph Commercial Policy Review Stage 1 Commercial Analysis and Background Report 138
Macaulay Shiomi Howson Ltd Tate Economic Research Inc.
Brook McIlroy Inc.
Figure G-5 (continued)NAICS Definitions of NFOR Items (1
45322
- stationery retailing (45321, Office Supplies and Stationery Stores)
45331
- used automobile retailing (44112, Used Car Dealers)- used RV retailing (44121, Recreational Vehicle Dealers)- used motorcycle and boat retailing (44122, Motorcycle, Boat and Other Motor Vehicle Dealers)- used tire retailing (44132, Tire Dealers)- used mobile home retailing (45393, Mobile Home Dealers)- retailing a general line of used merchandise on an auction basis (45399, All Other Miscellaneous Store Retailers)- operating pawnshops (52229, Other Non-Depository Credit Intermediation)
45391
- providing veterinary services (54194, Veterinary Services)- providing pet grooming and boarding services (81291, Pet Care (except Veterinary) Services)
45392
- retailing art reproductions (44229, Other Home Furnishings Stores)- operating non-commercial art galleries (71211, Museums)
45393
- motor home, camper and travel trailer retailing (44121, Recreational Vehicle Dealers)- retailing prefabricated buildings and kits (44419, Other Building Material Dealers)
45399
- auctioning new and used merchandise on a fee basis (56199, All Other Support Services)
Source: Tate Economic Research Inc.1) NAICS represents the North American Industrial Classification System. These definitions are provided by Statistics Canada on the website: http://www23.statcan.gc.ca/imdb/p3VD.pl?Function=getVDPage1&db=imdb&dis=2&adm=8&TVD=118464
Used Merchandise Stores US
This industry comprises establishments primarily engaged in retailing used merchandise. Establishments primarily engaged in retailing antiques are also included.Exclusion(s): Establishments primarily engaged in:
Pet and Pet Supplies Stores US
Gift, Novelty and Souvenir Stores US
This industry comprises establishments primarily engaged in retailing new gifts, novelty merchandise, souvenirs, greeting cards, seasonal and holiday decorations, and curios. These establishments may also retail stationery.Exclusion(s): Establishments primarily engaged in:
All Other Miscellaneous Store Retailers US
This industry comprises establishments, not classified to any other industry, primarily engaged in retailing specialized lines of merchandise, such as tobacco and tobacco products; artists' supplies; collectors' items, such as coins, stamps, autographs and cards; beer and wine making supplies; swimming pool supplies and accessories; religious goods; and monuments and tombstones. Establishments primarily engaged in retailing a general line of new and used merchandise on an auction basis are also included.Exclusion(s): Establishments primarily engaged in:
Exclusion(s): Establishments primarily engaged in:
Mobile Home Dealers This industry comprises establishments primarily engaged in retailing new and used mobile homes, parts and equipment. These establishments may provide installation services in addition to retailing the homes.Exclusion(s): Establishments primarily engaged in:
This industry comprises establishments primarily engaged in retailing pets, pet food and pet supplies. These establishments may also provide pet grooming services.Exclusion(s): Establishments primarily engaged in:
Art Dealers US
This industry comprises establishments primarily engaged in retailing original and limited edition art works. Establishments primarily engaged in the exhibition of native art and art carvings for retail sale are also included.
139 City of Guelph Commercial Policy Review Stage 1 Commercial Analysis and Background Report 139
Macaulay Shiomi Howson Ltd Tate Economic Research Inc.
Brook McIlroy Inc.
Figure G-6NAICS Definitions for FOR Items (1
44511 Supermarkets and Other Grocery (except Convenience) Stores
Exclusion(s): Establishments primarily engaged in:- retailing a limited line of food and convenience items (44512, Convenience Stores)--
44512 Convenience Stores
Exclusion(s): - convenience stores that sell gasoline (44711, Gasoline Stations with Convenience Stores)
44521 Meat Markets
44522 Fish and Seafood Markets
44523 Fruit and Vegetable Markets This industry comprises establishments primarily engaged in retailing fresh fruits and vegetables.Exclusion(s): Establishments primarily engaged in:- growing vegetables and fruits and selling them at roadside stands (11121,1113)
44529 Other Specialty Food Stores
Exclusion(s): Establishments primarily engaged in:-
-
-
Source: Tate Economic Research Inc.1) NAICS represents the North American Industrial Classification System. These definitions are provided by Statistics Canada on the website: http://www23.statcan.gc.ca/imdb/p3VD.pl?Function=getVDPage1&db=imdb&dis=2&adm=8&TVD=118464
retailing food for immediate consumption (e.g., donut and bagel shops) (722, Food Services
This industry comprises establishments, known as supermarkets and grocery stores, primarily engaged in retailing a general line of food, such as canned, dry and frozen foods; fresh fruits and vegetables; fresh and prepared meats, fish, poultry, dairy products, baked products and snack foods. These establishments also typically retail a range of non-food household products, such as household paper products, toiletries and non-prescription drugs.
g p p g p , ( , Drug Stores)retailing a general line of food products as well as a general line of non-food products (45291, Warehouse Clubs and Superstores)
This industry comprises establishments, known as convenience stores, primarily engaged in retailing a limited line of convenience items that generally includes milk, bread, soft drinks, snacks, tobacco products, newspapers and magazines. These establishments may retail a limited line of canned goods, dairy products, household paper and cleaning products, as well as alcoholic beverages, and provide related services, such as lottery ticket sales and video rental. Exclusion(s): - convenience stores that sell gasoline (44711, Gasoline Stations with Convenience
retailing goods baked on the premises, not for immediate consumption (31181, Bread and Bakery Product Manufacturing)
This industry comprises establishments primarily engaged in retailing fresh, frozen, or cured meats and poultry. Delicatessens primarily engaged in retailing fresh meat are included.
This industry comprises establishments primarily engaged in retailing fresh, frozen, or cured fish and seafood products.
This industry comprises establishments, not classified to any other industry, primarily engaged in retailing specialty foods. Dairy product stores, baked goods stores, and candy, nut and
retailing candy and confectionery products made on premises, not for immediate consumption (3113, Sugar and Confectionery Product Manufacturing)
140 City of Guelph Commercial Policy Review Stage 1 Commercial Analysis and Background Report 140
Macaulay Shiomi Howson Ltd Tate Economic Research Inc.
Brook McIlroy Inc.
Figure G-7Retail and Service Inventory Classification Codes
Retail / Service Categories NAICS Code TER Codes NAICS Code TER Codes
Food & Beverage Miscellaneous RetaillersSupermarket 44511 11 Sporting Goods 45111 70Superstores 44511 11 Toy/Hobby 45112 71Jug Milk 44512 12 Fabric/Wool 45113 72Meat Market 44521 13 Musical Instruments 45114 73Fish & Seafood 44522 14 Florist 45311 76Green Grocer 44523 15 Stationery and Office Supplies 45321 77Bakery 44529 16 Gift/Novelty/Souvenir 45322 78Candy/Nut 44529 16 Second-Hand Stores 45331 79Cheese 44529 16 Pet & Pet Supply 45391 80Delicatessen 44529 16 Art Gallery & Artists' Supply 45392 81Other Food 44529 16 Book Store & News Dealers 45131 82
Antiques 45331 83General Merchandise Sewing Machines 45113 84
Discount Department Store 45211 21 Wine Making 45399 85Traditional Department Stores 45211 21 Coin / Stamp 45112 86Warehouse Membership Clubs (e.g. Costco, Sam's Club) 45291 22 Tobacco 45399 87General Merchandise (e.g. Assortment of Dollar Stores) 45299 23 Greeting Cards 45322 88General Store 45299 23 Bicycle 45111 89Mail Order (e.g., Sears) 45299 23 Other Miscellaneous Retailers 45399 90Variety 45299 23Home and Auto Supply Stores (eg Canadian Tire) 45299 24 Automotive
Automotive Parts and Accessories Stores 44131 91Clothing & Accessories Tire Dealers 44132 92
Mens/Boys Wear 44811 31Ladies Wear 44812 32Childrens Wear 44813 33 Beer, Wine & Liquor Family Wear 44814 34 Liquor 44531 95Bridal 44819 35 Beer 44531 96Furrier 44819 35 Wine 44531 97Hosiery 44819 35Lingerie 44819 35 Services: Eating and DrinkingMaternity 44819 35 Restaurants (Licenced) 100Millinery 44819 35 Restaurants (Not Licenced) 101Unisex Wear 44819 35 Fast Food 102Accessories/Other Apparel (e.g., Ties) 44815 36 Donuts/Cookies/Muffins 103Childrens Shoes 44821 37 Ice Cream/Yogurt 104Family Shoes 44821 37 Cafeterias 105Ladies Shoes 44821 37 Specialty Coffee 106Mens Shoes 44821 37Jewellery 44831 38 Services: Personal Luggage/Leather Goods 44832 39 Beauty/Hair 110
Barber 111Furniture, Home Furnishings & Electronics Dry Cleaning (Plant) 112
Furniture/Appliance 44211 40 Dry Cleaning (Pickup) 113Floor Coverings 44221 41 Laundry 114China/Glassware/Kitchenware 44229 42 Shoe Repair 115Drapery/Blinds 44229 42 Travel Agent 116Lamps & Lighting Fixtures 44229 42 Photographer 117Linen/Bath 44229 42Other Household Furnishings (e.g. picture frames, etc.) 44229 42 Services: Financial and Real EstateFireplace Accessories 44229 42 Bank/Trust/Credit Union 120Vacuums 44229 42 Real Estate 127Appliance 44314 43 Insurance 128TV/Radio/Stereo 44314 43 Brokerage 130Computer and related incl. software 44314 44 Accounting 131Camera/Photo Supply 44314 45Audio & Video Recordings 44314 46
Services: OtherPharmacies & Personal Care Video Tape Rental 121
Drug Stores 44611 50 Health/Tanning Salon 122Cosmetics 44612 51 Movie Theatre/Cinema 123Optician 44613 52 Amusement Arcade 124Other Health & Personal Care Stores 44619 53 Bowling/Billiards 125
Medical/Dental 126Building and Outdoor Home Supply Stores Legal 129
Home Improvement Centres 44411 60 Post Office 132Hardware/Electrical Supply 44413 61 Library 133Paint/Glass/Wallpaper 44412 62 Other Service 134Electrical wiring supplies & equipment 44419 63Plumbing, heating, and a/c eq. & supplies 44419 63MISC. Home Supplies (e.g. windows/doors/plumbing/etc.) 64 Vacant 160Lawn & Garden Centre 44422 65Outdoor Power Equipment 44421 66
Source: Tate Economic Research Inc.1) Based on TER's interpretation of 2012 NAICS retail trade and service category classifications
Retail / Service Categories
Related Documents