COMMENTS OF THE INSTITUTE ON METROPOLITAN OPPORTUNITY ON THE MINNEAPOLIS DRAFT 2040 PLAN The City of Minneapolis professes to want to use the comprehensive planning process to attack long- standing patterns of racial and economic exclusion and inequality within its borders. If so, the city’s challenge is threefold: • Improve access to exclusive, prosperous neighborhoods, ensuring that their opportunities are not only available to the white and affluent. • Protect diverse neighborhoods, preserving their racial and economic integration and preventing any decline towards poverty and segregation. • Revitalize segregated neighborhoods, finding ways to increase neighborhood investment, and eliminating discriminatory policies that continue to concentrate poverty in those areas. The following comments on the Draft 2040 Plan are offered to assist the city towards that end. They consist of three broad sections. In the first, we review the legal fair housing obligations faced by the city – obligations that bind Minneapolis even during this planning process. In the second, we offer support for the most integrative and forward-thinking component of the Draft 2040 Plan: the proposal to allow up to four housing units on all residentially zoned lots. In the third, we discuss the plan’s greatest deficiency, which is its failure to directly discuss or confront the absolutely critical issue of concentration of poverty. Following the comments is an appendix, which includes a number of tables showing the ways in which Minneapolis residents and housing types are currently segregated by race and income. Although some of these tables are referenced periodically throughout the comments, the full set is included as a reference. They are also included as a reminder: whatever happens during the community comment process, these undeniable geographic disparities remain. They will continue to remain, until the city finally, fully, and forthrightly confronts them. I. MINNEAPOLIS’S FAIR HOUSING OBLIGATIONS Minneapolis is subject to several legal fair housing obligations. These must govern its policymaking choices, including choices made during the comprehensive planning process. Those obligations include: • Commitments made during the resolution of a HUD fair housing complaint against the city. • The duty, under the Fair Housing Act, not to “perpetuate segregation” or “otherwise make available” housing in fashion that creates a disparate impact on a protected class, including racial groups. • The duty, under the Fair Housing Act, to “affirmatively further fair housing,” by taking proactive steps to overcome Following is a more complete description of those obligations. HISTORY OF THE HUD FAIR HOUSING COMPLAINT AND VOLUNTARY COMPLIANCE AGREEMENTS In 2014, neighborhood organizations and a local fair housing group filed a HUD fair housing complaint was filed against Minneapolis, Saint Paul, and the Minneapolis/Saint Paul Housing Finance Board. The 1

Welcome message from author
This document is posted to help you gain knowledge. Please leave a comment to let me know what you think about it! Share it to your friends and learn new things together.
Transcript

COMMENTS OF THE INSTITUTE ON METROPOLITAN OPPORTUNITY
ON THE MINNEAPOLIS DRAFT 2040 PLAN
The City of Minneapolis professes to want to use the comprehensive planning process to attack long-
standing patterns of racial and economic exclusion and inequality within its borders.
If so, the city’s challenge is threefold:
• Improve access to exclusive, prosperous neighborhoods, ensuring that their opportunities are not only available to the white and affluent.
• Protect diverse neighborhoods, preserving their racial and economic integration and preventing any decline towards poverty and segregation.
• Revitalize segregated neighborhoods, finding ways to increase neighborhood investment, and eliminating discriminatory policies that continue to concentrate poverty in those areas.
The following comments on the Draft 2040 Plan are offered to assist the city towards that end. They
consist of three broad sections. In the first, we review the legal fair housing obligations faced by the city
– obligations that bind Minneapolis even during this planning process. In the second, we offer support
for the most integrative and forward-thinking component of the Draft 2040 Plan: the proposal to allow
up to four housing units on all residentially zoned lots. In the third, we discuss the plan’s greatest
deficiency, which is its failure to directly discuss or confront the absolutely critical issue of concentration
of poverty.
Following the comments is an appendix, which includes a number of tables showing the ways in which
Minneapolis residents and housing types are currently segregated by race and income. Although some
of these tables are referenced periodically throughout the comments, the full set is included as a
reference. They are also included as a reminder: whatever happens during the community comment
process, these undeniable geographic disparities remain. They will continue to remain, until the city
finally, fully, and forthrightly confronts them.
I. MINNEAPOLIS’S FAIR HOUSING OBLIGATIONS
Minneapolis is subject to several legal fair housing obligations. These must govern its policymaking
choices, including choices made during the comprehensive planning process. Those obligations include:
• Commitments made during the resolution of a HUD fair housing complaint against the city.
• The duty, under the Fair Housing Act, not to “perpetuate segregation” or “otherwise make
available” housing in fashion that creates a disparate impact on a protected class, including
racial groups.
• The duty, under the Fair Housing Act, to “affirmatively further fair housing,” by taking proactive
steps to overcome
Following is a more complete description of those obligations.
HISTORY OF THE HUD FAIR HOUSING COMPLAINT AND VOLUNTARY COMPLIANCE AGREEMENTS
In 2014, neighborhood organizations and a local fair housing group filed a HUD fair housing complaint
was filed against Minneapolis, Saint Paul, and the Minneapolis/Saint Paul Housing Finance Board. The
1

complaint alleged in part that the cities’ policies had concentrated affordable housing in low-income and
segregated areas, in violation of various federal civil rights obligations. The complaint took special note
of the concentration of Low-Income Housing Tax Credit (LIHTC) units in segregated areas.
The complaint ended with both cities entering a compliance agreement with HUD, in which they
committed to revise an important civil rights document called an Analysis of Impediments to Fair
Housing. This document, developed on a regional basis by the Fair Housing Implementation Committee,
describes fair housing problems in the region and makes recommendations to address those problems.
The previous submission had been deeply deficient, completely ignoring the problem of segregation and
poverty concentration, and admitting no government role in these (or any other) problems.
In the agreement with HUD, the cities promised major revisions – effectively, a redo of the entire
document – which would “focus on integration and segregation in the region.” The new document
would specifically address “the extent to which . . . housing-related activities and policies affecting
affordable housing reinforces racial or ethnic concentrations of poverty or perpetuates racial or ethnic
segregation.” It would also address “[t]he extent to which the recipient’s administration of its Low
Income Housing Tax Credit (LIHTC) allocations reinforces existing racial or ethnic concentrations or
perpetuates racial or ethnic segregation.”
In the binding compliance agreement, the cities agreed to “undertak[e] actions necessary to overcome
the impediments identified in the analysis.”
FAIR HOUSING ISSUES IDENTIFIED IN THE REGIONAL ANALYSIS OF IMPEDIMENTS
The revised Analysis of Impediments was lengthy – 230 pages and incorporating a 1600-page appendix –
and identified a number of fair housing issues across the region. The reworked analysis made a number
of findings related to the scope of the voluntary compliance agreement. These include:
• “Residing in a high poverty community can have negative effects on physical and mental health
and often leads to poorer educational outcomes . . . Over generations, these sorts of
educational disparities reduce income potential and impede economic mobility.”1
• “Along with poorer school quality, living in a ACP50 tract [a racially concentrated area of
poverty] also tends to increase exposure of residents to crime.”2
• “There is a need for expanded distribution of affordable housing across the region.”3
• “Regulations, policies, and funding availability impact levels of publicly-subsidized and private-
market affordable housing development across the region.”4
The Analysis of Impediments also made specific findings related to the share of tax credit subsidized
units created or preserved in racially concentrated areas of poverty. Overall, 56 percent of Minneapolis
tax credit units were in concentrated areas.5 This compared to a total of 11.9 percent of units created in
concentrated areas by the state housing finance agency.6
1 FAIR HOUSING IMPLEMENTATION COUNCIL, ADDENDUM TO THE 2014 REGIONAL AI 205 (2016). 2 Id. 3 Id. at 211. 4 Id. at 212. 5 Id. at 152. 6 Id.
2

The first broad recommendation made by the revised Analysis of Impediments was as follows:
Investment in construction of new affordable housing should prioritize expanding
affordability regionally and within jurisdictions, including in areas with access to
opportunity, as defined through a community engagement process, that may include,
but are not limited to, quality schools, transportation, economic opportunity, and other
public resources. Construction of new units in areas of concentrated poverty, and
particularly in areas of concentrated poverty where 50% or more of the residents are
people of color, should be considered only as part of a comprehensive community
investment strategy to address targeted community housing needs. Preservation of
existing affordable housing in these areas should be prioritized over new construction.7
The Analysis of Impediments also includes specific policy goals and recommendations. Notably, these
include:
Goal #6: Expand Locations of Affordable Housing
When affordable housing is limited to some communities and lacking in others, the effect
is decreased housing choice for residents of the region.
. . .
6B Amend zoning maps as appropriate to rezone large-lot single-family zones to higher
density/lower minimum lot area standards and allow for infill development or conversion
of large single-family dwellings to two-family and triplex units to allow more density on
the same footprint or minimum lot size.
. . .
6D Consider development incentives such as density bonuses and expedited permitting
processes or fee waivers for voluntary inclusion of affordable units or mandatory set
asides . . .8
In other words, as a result of the HUD complaint process, one impediment to fair housing recognized by
Minneapolis was the lack of affordable housing in areas of high opportunity. In addition, the same
analysis identified a historic tendency of Minneapolis to concentrate low-income units in segregated and
low-income areas. Increasing density, including in single-family zones, is repeatedly cited as a policy the
city could undertake to expand the location of affordable housing. Whichever recommendations the city
implements, it has committed to reducing and overcoming the impediments to fair housing recognized
as a result of the complaint.
OTHER CIVIL RIGHTS OBLIGATIONS
Beyond the obligations created by the HUD fair housing complaint and its resolution, Minneapolis and
Saint Paul face standing civil rights obligations rooted in federal law, and particularly, in the
requirements of the Fair Housing Act.
7 Id. at 221. 8 Id. at 227-28.
3

First, §3604 of the Fair Housing Act forbids practices that “otherwise make [housing] unavailable” on the
basis of race.9 This phrase has a lengthy statutory history and has been held to forbid practices that
perpetuate racially segregated living patterns.10 This component of the law, known as the “perpetuation
of segregation” cause of action, has been reaffirmed by federal appellate courts.11 In 2013, this cause of
action was standardized in federal regulation, in a rule adopted by the Department of Housing and
Urban Development.12
Importantly, the perpetuation of segregation cause of action and other §3604 claims do not require a
showing of intent by plaintiffs. Instead, the Supreme Court has held they are only require a showing that
the offending policy has a racially disparate impact, or a disparate impact on another protected class.13
The other major requirement in the Fair Housing Act is §3608, which contains what has long been
known as the Fair Housing Act's “affirmatively furthering” requirements.14 This provision obligates
federal agencies, particularly HUD, to conduct their program activities in a way that promote fair
housing. In part because prior civil rights laws had already implemented antidiscrimination standards for
federal agencies, the Fair Housing Act's provision is understood to require that agencies affirmatively
pursue greater racial integration.15 Although these provisions are focused on the federal government,
they also require HUD to operate its various local funding programs in a way that “affirmatively
furthers” fair housing. Thus, this civil rights requirement is effectively passed down to local agencies
receiving federal housing funding. Minneapolis is one such entitlement jurisdiction.
A federal district court has held that a local entitlement jurisdiction’s failure to satisfy the “affirmatively
furthering” requirements of §3608 is sufficient to withhold federal HUD funding from the jurisdiction.16
And HUD itself has issued regulations formalizing the imputation of these requirements on state and
local governments receiving federal funding.17
9 42 U.S.C. § 3406(a). 10 See, e.g., Texas Dep’t of Hous. and Cmty. Affairs v. Inclusive Communities Project, 576 U.S. ___ (2015), slip op. at 18; Avenue 6E Invs. V. City of Yuma, 818 F.3d 493, 503 (9th Cir. 2016); Graoch Assocs. #33, L.P. v. Louisville/Jefferson Cnty. Metro Human Relations Comm’n, 508 F.3d 355, 378 (6th Cir. 2007); Huntington Branch, NAACP v. Town of Huntington, 844 F.2d 926, 937 (2d Cir. 1988); Metro. Hous. Dev. Corp. v. Vill. of Arlington Heights, 558 F.2d 1283, 1290 (7th Cir. 1977). 11 Id. 12 24 CFR §100.500; see also Implementation of the Fair Housing Act’s Discriminatory Effects Standard, 78 Fed. Reg. 11459 (2013). 13 Texas Dep’t of Hous. and Cmty. Affairs v. Inclusive Communities Project, 576 U.S. ___ (2015) (“The Court holds that disparate-impact claims are cognizable under the Fair Housing Act . . . .”). 14 42 U.S.C. § 3608. 15 See, e.g., NAACP, Boston Chapter v. Sec’y of Hous. and Urban Dev., 817 F.2d 149, 154 (1st Cir. 1987) (“[T]he history of Title VIII suggests that its framers meant to do more than simply restate HUD's existing legal obligations.”); Shannon v. U.S. Dep’t of Hous. and Urban Dev., 436 F.2d 809, 817 (3d Cir. 1970) (“Read together, the Housing Act of 1949 and the Civil Rights Acts of 1964 and 1968 show a progression in the thinking of Congress as to what factors significantly contributed to urban blight and what steps must be taken to reverse the trend or to prevent the recurrence of such blight.”). 16 United States of America ex rel. Anti-Discrimination Center v. Westchester County, 668 F.Supp 548 (2009). 17 Affirmatively Furthering Fair Housing, 80 Fed. Reg. 42272 (2014).
4

II. THE FOURPLEX PLAN SHOULD BE ADOPTED
The most publicly remarked and controversial component of the 2040 Plan is also its single best
innovation: the proposal to allow up to four dwelling units on all residential lots.
This proposal, referred to below by its popular moniker the “fourplex plan,” has the potential to be a
tremendous step forward for fair housing and residential integration in Minneapolis. Reasons include:
• The fourplex plan is a simple way to leverage the market to provide greater housing
affordability, particularly for an income segment where public subsidy is insufficient.
• The fourplex plan erodes one of the major barriers to greater racial and economic integration in
Minneapolis.
• The most common community objections to the fourplex are rooted in an erroneous
understanding of the interactions of housing development and housing costs.
• Reducing the fourplex plan may raise legal fair housing questions.
Extended comments in favor of the fourplex plan follow.
SUBSIDY PROGRAMS ARE INSUFFICIENT TO MEET MINNEAPOLIS HOUSING DEMAND
When it comes to housing supply, Minneapolis has a “missing middle.” While the city has the region’s
largest number of housing units by a substantial margin, much of that housing comes at the two ends of
the income spectrum. At the high end, Minneapolis has a large number of expensive homes and housing
units only affordable to those making more than 80 percent of median income (and often, substantially
more). These are concentrated in the city’s whitest and most affluent neighborhoods.
At the other end of the spectrum, Minneapolis has a hugely disproportionate share of the region’s
lowest-income housing. Because much of this housing is subsidized and income-restricted, it is
inaccessible to those in the middle class. Moreover, many of the lowest-income units are in very poor
and segregated neighborhoods, where demand for new housing is extremely low. Forced to choose
between an affordable unit in a segregated neighborhood with limited amenities and inadequate
neighborhood schools, many families will opt to seek out a similarly affordable unit in a Twin Cities
suburb.
Minneapolis contains approximately 13.5 percent of regional population, and about 15 percent of
regional housing units. But it contains 23 percent of the region’s housing affordable at 30 percent of
area median income or less, and 33.5 percent of the region’s subsidized affordable housing units.
However, when it comes to housing affordable at working-class incomes, Minneapolis’s regional
overshare vanishes. It only contains 19 percent of regional housing affordable at 30-50 percent of area
median income, and 15 percent of housing affordable at 50-80 percent of area median income.
Moreover, because middle and working-class people vastly outnumber families in extreme poverty, a
shortfall of middle-income housing represents a far larger number of absolute units. For instance, while
Minneapolis’s approximately 20,000 very-low-income units represent a regional surplus, its
approximately 70,000 workforce units represent a shortfall compared to the rest of the region. In other
words, to fill this “missing middle,” Minneapolis would need to produce thousands or tens of thousands
of new units, affordable at lower-middle incomes.
5
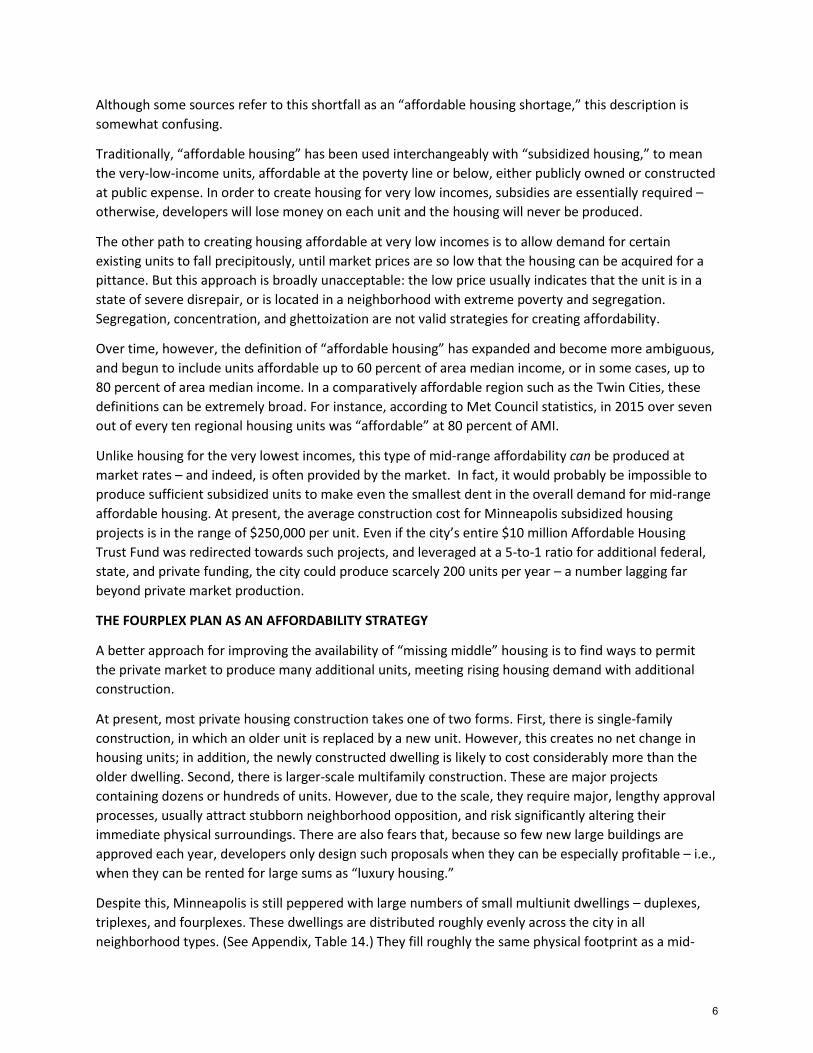
Although some sources refer to this shortfall as an “affordable housing shortage,” this description is
somewhat confusing.
Traditionally, “affordable housing” has been used interchangeably with “subsidized housing,” to mean
the very-low-income units, affordable at the poverty line or below, either publicly owned or constructed
at public expense. In order to create housing for very low incomes, subsidies are essentially required –
otherwise, developers will lose money on each unit and the housing will never be produced.
The other path to creating housing affordable at very low incomes is to allow demand for certain
existing units to fall precipitously, until market prices are so low that the housing can be acquired for a
pittance. But this approach is broadly unacceptable: the low price usually indicates that the unit is in a
state of severe disrepair, or is located in a neighborhood with extreme poverty and segregation.
Segregation, concentration, and ghettoization are not valid strategies for creating affordability.
Over time, however, the definition of “affordable housing” has expanded and become more ambiguous,
and begun to include units affordable up to 60 percent of area median income, or in some cases, up to
80 percent of area median income. In a comparatively affordable region such as the Twin Cities, these
definitions can be extremely broad. For instance, according to Met Council statistics, in 2015 over seven
out of every ten regional housing units was “affordable” at 80 percent of AMI.
Unlike housing for the very lowest incomes, this type of mid-range affordability can be produced at
market rates – and indeed, is often provided by the market. In fact, it would probably be impossible to
produce sufficient subsidized units to make even the smallest dent in the overall demand for mid-range
affordable housing. At present, the average construction cost for Minneapolis subsidized housing
projects is in the range of $250,000 per unit. Even if the city’s entire $10 million Affordable Housing
Trust Fund was redirected towards such projects, and leveraged at a 5-to-1 ratio for additional federal,
state, and private funding, the city could produce scarcely 200 units per year – a number lagging far
beyond private market production.
THE FOURPLEX PLAN AS AN AFFORDABILITY STRATEGY
A better approach for improving the availability of “missing middle” housing is to find ways to permit
the private market to produce many additional units, meeting rising housing demand with additional
construction.
At present, most private housing construction takes one of two forms. First, there is single-family
construction, in which an older unit is replaced by a new unit. However, this creates no net change in
housing units; in addition, the newly constructed dwelling is likely to cost considerably more than the
older dwelling. Second, there is larger-scale multifamily construction. These are major projects
containing dozens or hundreds of units. However, due to the scale, they require major, lengthy approval
processes, usually attract stubborn neighborhood opposition, and risk significantly altering their
immediate physical surroundings. There are also fears that, because so few new large buildings are
approved each year, developers only design such proposals when they can be especially profitable – i.e.,
when they can be rented for large sums as “luxury housing.”
Despite this, Minneapolis is still peppered with large numbers of small multiunit dwellings – duplexes,
triplexes, and fourplexes. These dwellings are distributed roughly evenly across the city in all
neighborhood types. (See Appendix, Table 14.) They fill roughly the same physical footprint as a mid-
6

sized or large single-family home, and many were originally single-family homes that were eventually
converted to multiple units. When created by converting preexisting dwellings, these units also
represent a small-scale construction project, that can be undertaken by an owner and occupant or
landlord at relatively minor expense and in response to short-term increases in demand.
The 2040 Plan takes advantage of these dynamics by proposing to allow up to four units in all
residentially zoned lots. As preexisting patterns of duplex, triplex, and fourplex construction illustrate,
the result of such a change is unlikely to be the sudden conversion of whole swathes of the city to
multiunit housing. Instead, multiunit dwellings are likely to emerge invisibly, in places where demand is
high and existing owners see an economic opportunity in renting out more units.
Fourplexes will also very likely place downwards pressure on rents and home values compared to
existing trends. More units on the market mean more price competition between sellers and landlords,
and mean more housing demand can be met within the same geographic area. Beyond that, by renting
more units in a single building, a landlord is able to earn the same amount while charging everyone less,
making it easier to cover costs. Although residents are sometimes fearful that large-scale development
will increase housing costs by transforming an area into a high-amenity hub, restricting the proposal to
fourplexes avoids this issue – the addition of a handful of new neighbors is unlikely to have a noticeable
effect on an area’s overall demographic or economic characteristics.
The fourplex plan is not a panacea – there are areas of Minneapolis where it is unlikely to have any
effect at all. Most notably, in low-income and segregated areas where neighborhood housing demand is
already very low, the ability to place more units on a single site will likely have limited effect. The effects
of the plan are, instead, primarily likely to be concentrated in high-income areas where demand is high.
In this sense, the fourplex plan can be conceptualized as a “fair share” plan – it relies on the dynamics of
housing markets to ensure that the city’s wealthiest neighborhoods provide for their share of housing,
while doing little to disrupt lower-income neighborhoods.
THE FOURPLEX PLAN AS A FAIR HOUSING STRATEGY
Questions of housing affordability have a geographic dimension. Overall, Minneapolis is one of the
nation’s most affordable metropolitan areas. But that affordability is not evenly distributed. In the city’s
highest-opportunity neighborhoods, affordable units are hard to come by. As a consequence, low-
income residents have a difficult time accessing those neighborhoods, their amenities, and their high-
quality educational and economic opportunities.
The following tables illustrate this dynamic. Each table is a grid, with each square representing all the
city’s neighborhoods within a certain demographic range. The horizontal axis shows economic
demographics, while the vertical axis shows racial demographics. The percentages within the squares,
and the color coding of those squares, show the share of housing units located in neighborhoods with
the corresponding demographics. In general, the further towards the top left a square is, the whiter and
more affluent it is; the further towards the bottom right, the less white and less affluent.
Tables 1 and 2, below, show the distribution of single family detached housing units and family rental
housing with rent below $1,000. (In this instance, “family rental” is defined as housing with 2 or more
bedrooms.) As can be seen, the distribution of these two types of housing are dramatically different.
Over a third of single-family housing is in neighborhoods less than 20 percent nonwhite and 20 percent
7

low-income. Nearly two-thirds is in neighborhoods less than 40 percent nonwhite and low-income.
Meanwhile, 55 percent of cheap family rental housing is in neighborhoods more than 40 percent
nonwhite and low-income.
These statistics suggest that predominantly white and affluent areas in Minneapolis suffer a severe lack
of affordable rental units. Because lower-income renters are disproportionately families of color, this
contributes to the high degree of racial segregation in the city. Lack of affordability effectively
constitutes a fence around certain areas of the city. (See the Appendix for more tables illustrating how
the city’s residents are concentrated geographically.)
The result of this affordability “fence” can be seen in Table 3, below, which shows the population share
of Minneapolis racial groups living in census tracts above and below the city’s median income. As can be
seen, a large majority of all nonwhite racial groups living in poorer-than-average tracts. This trend is
particularly severe for the city’s black residents – less than one person in four lives in a wealthier-than-
average area.
By contrast, over 60 percent of white city residents live in a tract that is above median income. For white
residents, Minneapolis is predominantly a city of prosperity; for nonwhite residents, it is predominantly
a lower-income city.
8
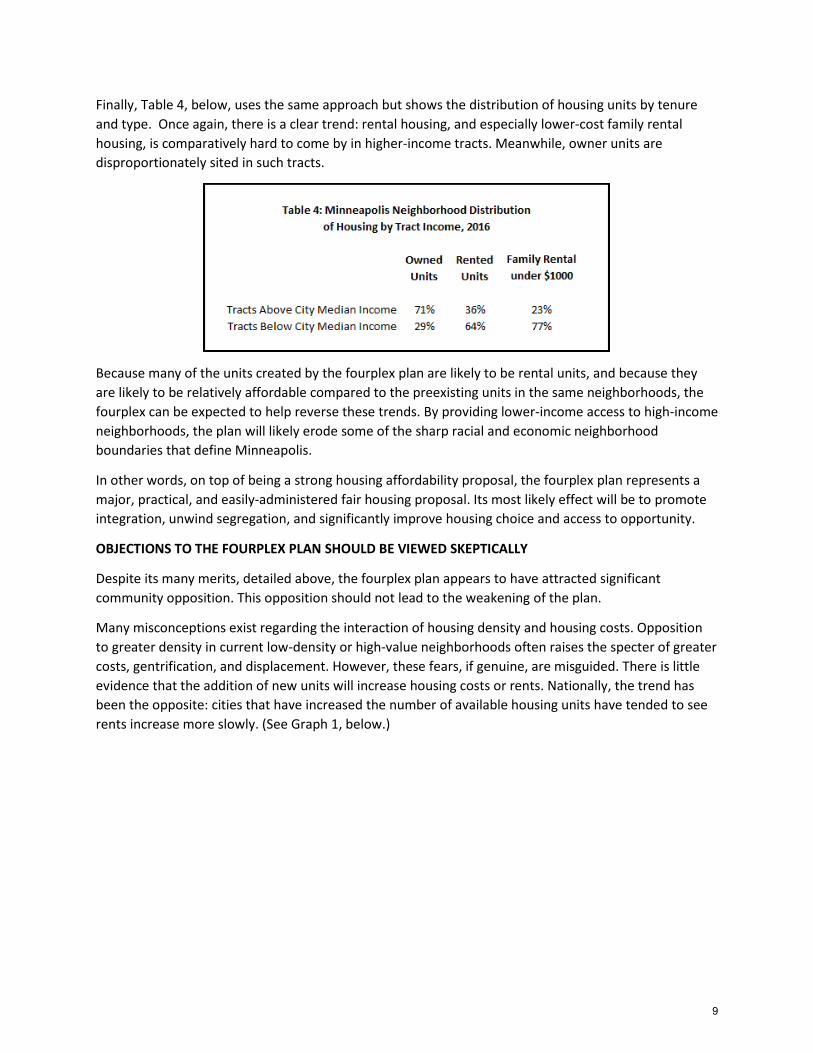
Finally, Table 4, below, uses the same approach but shows the distribution of housing units by tenure
and type. Once again, there is a clear trend: rental housing, and especially lower-cost family rental
housing, is comparatively hard to come by in higher-income tracts. Meanwhile, owner units are
disproportionately sited in such tracts.
Because many of the units created by the fourplex plan are likely to be rental units, and because they
are likely to be relatively affordable compared to the preexisting units in the same neighborhoods, the
fourplex can be expected to help reverse these trends. By providing lower-income access to high-income
neighborhoods, the plan will likely erode some of the sharp racial and economic neighborhood
boundaries that define Minneapolis.
In other words, on top of being a strong housing affordability proposal, the fourplex plan represents a
major, practical, and easily-administered fair housing proposal. Its most likely effect will be to promote
integration, unwind segregation, and significantly improve housing choice and access to opportunity.
OBJECTIONS TO THE FOURPLEX PLAN SHOULD BE VIEWED SKEPTICALLY
Despite its many merits, detailed above, the fourplex plan appears to have attracted significant
community opposition. This opposition should not lead to the weakening of the plan.
Many misconceptions exist regarding the interaction of housing density and housing costs. Opposition
to greater density in current low-density or high-value neighborhoods often raises the specter of greater
costs, gentrification, and displacement. However, these fears, if genuine, are misguided. There is little
evidence that the addition of new units will increase housing costs or rents. Nationally, the trend has
been the opposite: cities that have increased the number of available housing units have tended to see
rents increase more slowly. (See Graph 1, below.)
9

Local evidence points in the same direction. An examination of changing housing values in Minneapolis,
conducted by the Institute on Metropolitan Opportunity in 2016, showed that the highest median
housing values, by a very significant margin, were found in the Southwest and Calhoun-Isles areas, both
of which are residential areas that are fully built out and practically devoid of new development.18 In
fact, not only were the home values highest in these neighborhoods, they were growing faster than the
home values anywhere else in the city. (See Graph 2, below.)
This trend likely reflects two factors: high demand for housing in affluent, high-opportunity
neighborhoods served by high-performing schools, combined with an extremely scarce and unchanging
housing supply in these areas.
18 INSTITUTE ON METROPOLITAN OPPORTUNITY, ARE MINNEAPOLIS AND SAINT PAUL GENTRIFYING? DEBUNKING MYTHS ABOUT
NEIGHBORHOOD CHANGE IN THE TWIN CITIES 31 (2016), available at https://www.law.umn.edu/sites/law.umn.edu/files/imo_gentrification_study_final_january_2016.pdf.
MInneapolis
0
1
2
3
4
5
6
7
8
9
10
-30% -20% -10% 0% 10% 20% 30% 40%Cit
y C
han
ge in
Med
ian
Gro
ss R
ent
as P
erce
nga
te o
f In
com
e
Change in Number of Housing Units in City
Graph 1: Rental Costs and Housing Unit Growth, 2000-2016
(U.S. Central Cities, Top 50 Metros)
10
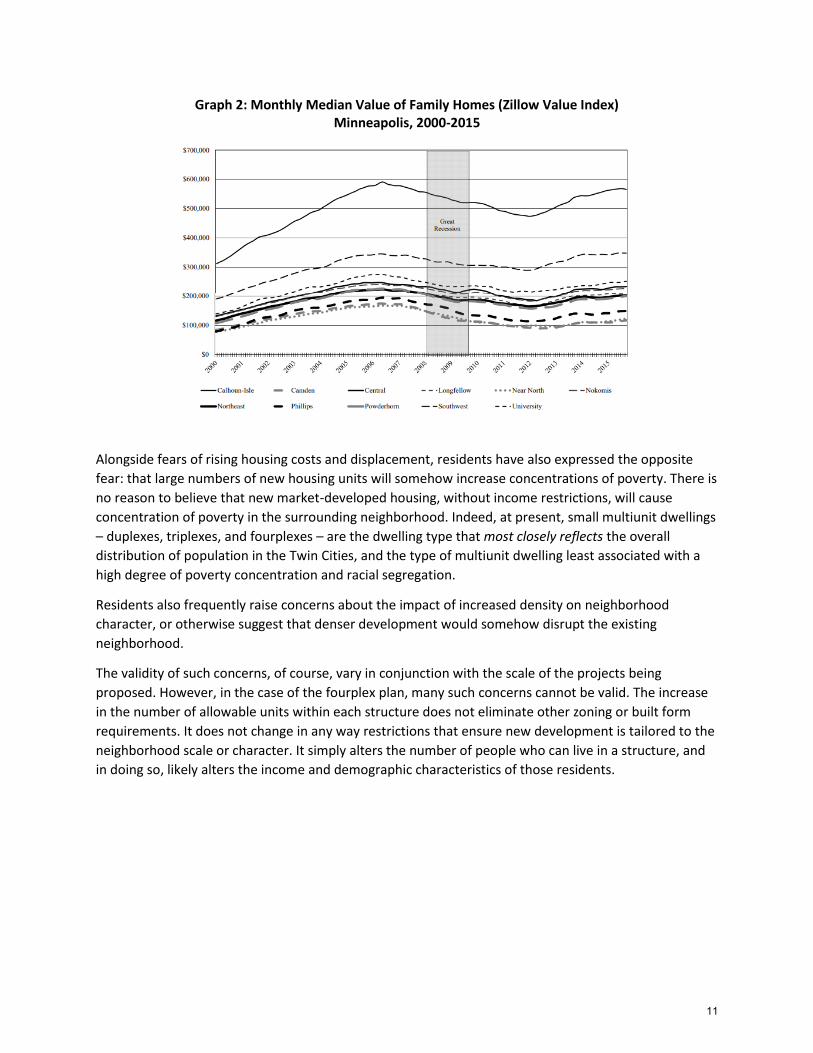
Graph 2: Monthly Median Value of Family Homes (Zillow Value Index) Minneapolis, 2000-2015
Alongside fears of rising housing costs and displacement, residents have also expressed the opposite
fear: that large numbers of new housing units will somehow increase concentrations of poverty. There is
no reason to believe that new market-developed housing, without income restrictions, will cause
concentration of poverty in the surrounding neighborhood. Indeed, at present, small multiunit dwellings
– duplexes, triplexes, and fourplexes – are the dwelling type that most closely reflects the overall
distribution of population in the Twin Cities, and the type of multiunit dwelling least associated with a
high degree of poverty concentration and racial segregation.
Residents also frequently raise concerns about the impact of increased density on neighborhood
character, or otherwise suggest that denser development would somehow disrupt the existing
neighborhood.
The validity of such concerns, of course, vary in conjunction with the scale of the projects being
proposed. However, in the case of the fourplex plan, many such concerns cannot be valid. The increase
in the number of allowable units within each structure does not eliminate other zoning or built form
requirements. It does not change in any way restrictions that ensure new development is tailored to the
neighborhood scale or character. It simply alters the number of people who can live in a structure, and
in doing so, likely alters the income and demographic characteristics of those residents.
11

III. THE FINAL PLAN SHOULD ADDRESS POVERTY CONCENTRATION
A defining feature of racial and economic inequality in Minneapolis is the city’s long history of
concentrating poor and low-income residents. The Draft 2040 Plan does not adequately address this
history. Omissions include:
• A failure to recognize that racial exclusion has historically paired with policies that confine
residents of color to a restricted set of low-opportunity neighborhoods.
• The absence of any acknowledgement of the costs to economic, educational, and physical
wellbeing, created by living in segregated areas of concentrated poverty.
• The absence of any discussion of present-day policies that have created or contributed to
concentrated poverty and segregation.
• Any attempt to weigh present day-gentrification or displacement against present-day
concentration of poverty.
Extended comments on the role of poverty concentration follow.
CONCENTRATION OF POVERTY AND RACIAL EXCLUSION ARE INTERTWINED
The Draft 2040 Plan repeatedly acknowledges Minneapolis’s legacy of segregation. The first paragraph
of the Plan’s preamble notes that “not everyone” has benefited from the city’s historic growth, and the
plan is “one opportunity to undo barriers and overcome inequities created by a history of policies in our
city that have prevented equitable access to housing, jobs, and investments.”
Unfortunately, the Plan adopts a somewhat blinkered view of racial segregation. It focuses almost
entirely on Minneapolis’s history of exclusion, but never on its history of concentration and
confinement. But the two go hand-and-hand. Indeed, in a region that has historically been
predominantly white, the primary purpose of segregation was not to preserve enclaves of affluence for
a select few, but to keep a relatively small nonwhite population confined to restricted geographic
quarters. While those areas have gone by many names over the years – racial ghettos, areas of
concentrated poverty, ACP50s or RCAPs –they persist to the present day and cannot be overlooked.
Poverty and segregation are still growing in Minneapolis, a trend that endangers the long-term stability
of many neighborhoods and puts the wellbeing of tens of thousands of residents at risk. In fact, poverty
concentration is an unusually severe problem in Minneapolis (and the Twin Cities region generally)
compared to many cities across the country.
CONCENTRATION OF POVERTY HAS NEGATIVE EFFECTS ON NEIGHBORHOOD RESIDENTS
Researchers and activists have long suspected that neighborhood characteristics have a strong impact
on the life trajectory of neighborhood residents, especially high poverty and racial segregation. This
observation was supported by anecdotal experience and eventually research data, and particularly by
positive outcomes associated with Chicago’s Gautreaux housing mobility program.
These outcomes led to large-scale, very statistically rigorous efforts to investigate neighborhood effects
and neighborhood mobility benefits. The most robust of these was the Moving to Opportunity (MTO)
experiment, conducted in five major cities in the mid-1990s. Although initial results seemed mixed,
contemporary evaluations of the experimental outcomes have revealed that young children who stayed
12

in higher-poverty areas experienced significantly lower college attendance and adult earnings.19 As
adults, these children were also more likely to become single parents, and were less likely themselves to
live in more affluent neighborhoods.20
MTO families that moved to lower-poverty areas experienced major impacts on health and wellbeing,
particularly for women.21 These included reductions in diabetes and obesity by nearly 50 percent.22
Families also reported a much higher sense of personal wellbeing and physical safety, leading
researchers to speculate many of the improved health outcomes were related to significant reduction in
stress.23
Many of the benefits of housing mobility arise from the fact that neighborhoods have major effects on
income and wellbeing.24 For instance, Raj Chetty, Nathaniel Hendren, and Lawrence Katz have produced
robust research into these neighborhood effects, showing that adult income increases every year a child
is located in a “better” neighborhood during his or her youth. These studies identify the key predictors
of neighborhood quality as segregation, school quality, a larger share of two-parent families, income
inequality, and crimes rates.
Although the link between school and neighborhood integration is complex, in general, integrated
neighborhoods produce better-integrated schools. This is an important outcome, because a bevy of
research shows that school segregation has significant negative effects on children. Compared to
children in integrated schools, students in segregrated schools are less likely to score well on
standardized tests, less likely to graduate high school and college, have reduced access to social and
professional networks of opportunity, are less likely to avoid the juvenile or adult justice system.25
THE DRAFT PLAN’S VIEW OF PUBLIC POLICY’S SEGREGATIVE ROLE IS LIMITED
The Draft Plan clearly begins with the assumption that public policy has contributed to or caused
segregation in Minneapolis, and prevented many groups in the city from accessing opportunity.
19 Raj Chetty, Nathaniel Hendren and Lawrence Katz, The Effects of Exposure to Better Neighborhoods on Children: New Evidence from the Moving to Opportunity Project, 106 AM. ECON. REV. 855 (2016). 20 Id. 21 See, e.g., Jens Ludwig, Greg J. Duncan, Lisa A. Gennetian, Lawrence F. Katz, Ronald C. Kessler, Jeffrey R. Kling, and Lisa Sanbonmatsu, Long-Term Neighborhood Effects on Low-Income Families: Evidence from Moving to Opportunity, 103 AM. ECON. REV. 226 (2013). 22 Id. 23 See, e.g., Jens Ludwig, Greg J. Duncan, Lisa A. Gennetian, Lawrence F. Katz, Ronald C. Kessler, Jeffrey R. Kling, and Lisa Sanbonmatsu, Neighborhood Effects on the Long-Term Well-Being of Low-Income Adults, 337 SCI. 1509 (2012). 24 Raj Chetty and Nathaniel Hendren, The Impacts of Neighborhoods on Intergenerational Mobility: Childhood Exposure Effects and County-Level Estimates (Harvard University and Nat’l Bureau of Econ. Research, Working Paper, 2015). 25 See, e.g., Eric Hanushek et al., New Evidence About Brown v. Board of Education: The Complex Effects of School Racial Composition on Achievement, 27 J. LAB. ECON. 349, 351 (2009); Roslyn Arlin Mickelson & Martha Bottia, Integrated Education and Mathematics Outcomes: A Synthesis of Social Science Research, 88 N.C. L. REV. 993, 1043 (2010); Orley Ashenfelter, William J. Collins, and Albert Yoon, Evaluating the Role of Brown v. Board of Education in School Equalization, Desegregation, and the Income of African Americans, 8 AMERICAN LAW AND ECONOMICS REV. 213 (2006); Michael A. Boozer et al., Race and School Quality Since Brown v. Board of Education, BROOKINGS PAPERS ON
ECONOMIC ACTIVITY: MICROECONOMICS 269 (1992).
13

However, its discussion of these public policies is extremely limited, and focused on two long-concluded
policies, both dating to the 1940s. The first of these are the Federal Housing Administration’s racial
redlining maps. These maps do reflect many present-day trends. In particular, a number of the areas
redlined as “Most Hazardous” were demolished for highway construction in the 1950s; the highest
income areas of the city from that period, in Southwest around the Chain of Lakes, are still are the
highest-income areas today; and many of the lower designations have become poorer and more
segregated since. However, the redlining maps alone are certainly not sufficient to explain present-day
trends, because the demographics of Minneapolis have changed dramatically. For instance, the
nonwhite population of the city in 1940 constituted about 3,000 people out of 492,000. Today, the
nonwhite population is 143,000 out of 405,000.
The second historic policy cited is the use of racially restrictive covenants to prevent people of color
from purchasing property in affluent neighborhoods. But racially restrictive covenants are, again,
insufficient to explain modern-day patterns of segregation. The use of such covenants was banned by
the Supreme Court 70 years ago, in the 1948 decision Shelley v. Kraemer.26 In addition, the best available
study of restrictive covenants in Minneapolis, the well-regarded Mapping Prejudice project conducted
by the University of Minnesota Department of Geography, has only discovered such restrictions in a
relatively limited number of affluent areas in the southwest and southeast of the city – a terrible legacy,
but again insufficient to explain modern-day segregation.
Understanding Minneapolis’s history of segregation requires looking at a broader range of policies,
including policies that persist until the present day, and policies that tend to confine low-income and
nonwhite residents as well as exclude them.
MODERN-DAY POLICIES HAVE CAUSED SEGREGATION AND CONCENTRATION OF POVERTY
Minneapolis has a long history of concentrating affordable housing, public housing, and subsidized
housing in segregated neighborhoods, ensuring that low-income residents have little choice but to seek
lodging in segregated areas. Because a disproportionate share of low-income residents are families of
color, these policies tend to create and perpetuate racial segregation.
According to data from HousingLink, Minneapolis contains slightly over a third of all the region’s current
subsidized housing. The city’s share of public housing is larger: over 49 percent of the regional total.
Since 1985, public housing construction has slowed nationally, and subsidized housing creation has
shifted towards publicly-funded, privately managed programs like the low-income housing tax credit.
City housing agencies have faced civil rights scrutiny for concentration of both public housing and tax
credit housing. In 1995, the Minneapolis Public Housing Authority settled the Hollman v. Cisneros
lawsuit, filed against the agency for concentrating public housing in high-poverty areas in North
Minneapolis. The settlement committed the agency to demolish certain housing projects and replace
them with a mobility program and new units in higher-opportunity area. The consensus view is that the
Hollman settlement was never satisfactorily resolved, in part due to the failure to ever create adequate
replacement units.
In 2014, the city again faced civil rights advocates in the legal arena, this time in the form of a HUD fair
housing complaint alleging that, among other things, it had disproportionately sited low-income housing
26 Shelley v. Kraemer, 334 U.S. 1 (1948).
14
tax credit projects in low-income neighborhoods, creating and perpetuating racial segregation. As
discussed above, that complaint ended in the city entering a voluntary compliance agreement with HUD.
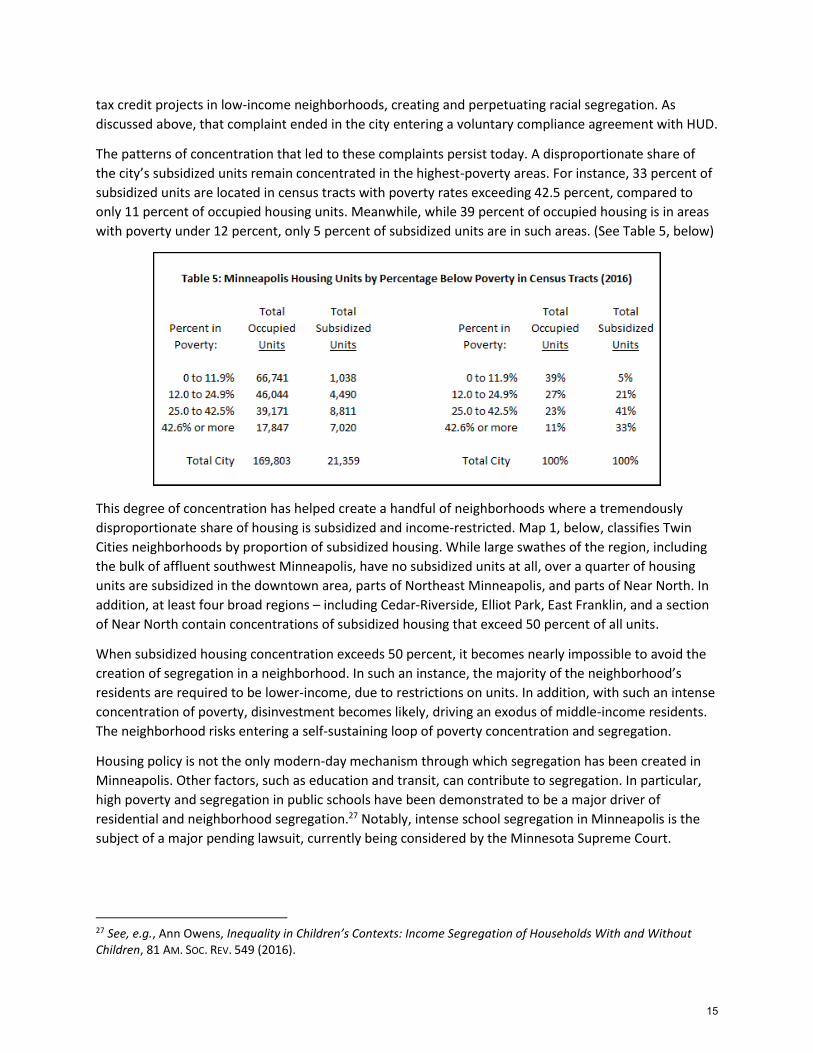
The patterns of concentration that led to these complaints persist today. A disproportionate share of
the city’s subsidized units remain concentrated in the highest-poverty areas. For instance, 33 percent of
subsidized units are located in census tracts with poverty rates exceeding 42.5 percent, compared to
only 11 percent of occupied housing units. Meanwhile, while 39 percent of occupied housing is in areas
with poverty under 12 percent, only 5 percent of subsidized units are in such areas. (See Table 5, below)
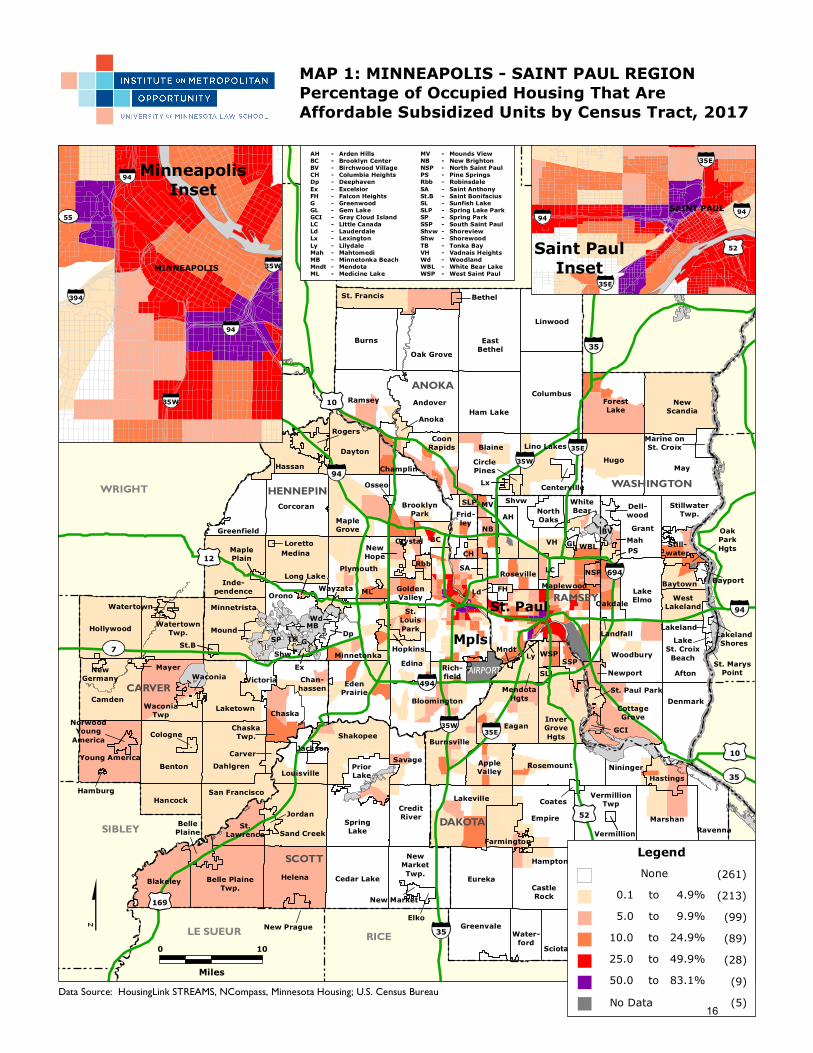
This degree of concentration has helped create a handful of neighborhoods where a tremendously
disproportionate share of housing is subsidized and income-restricted. Map 1, below, classifies Twin
Cities neighborhoods by proportion of subsidized housing. While large swathes of the region, including
the bulk of affluent southwest Minneapolis, have no subsidized units at all, over a quarter of housing
units are subsidized in the downtown area, parts of Northeast Minneapolis, and parts of Near North. In
addition, at least four broad regions – including Cedar-Riverside, Elliot Park, East Franklin, and a section
of Near North contain concentrations of subsidized housing that exceed 50 percent of all units.
When subsidized housing concentration exceeds 50 percent, it becomes nearly impossible to avoid the
creation of segregation in a neighborhood. In such an instance, the majority of the neighborhood’s
residents are required to be lower-income, due to restrictions on units. In addition, with such an intense
concentration of poverty, disinvestment becomes likely, driving an exodus of middle-income residents.
The neighborhood risks entering a self-sustaining loop of poverty concentration and segregation.
Housing policy is not the only modern-day mechanism through which segregation has been created in
Minneapolis. Other factors, such as education and transit, can contribute to segregation. In particular,
high poverty and segregation in public schools have been demonstrated to be a major driver of
residential and neighborhood segregation.27 Notably, intense school segregation in Minneapolis is the
subject of a major pending lawsuit, currently being considered by the Minnesota Supreme Court.
27 See, e.g., Ann Owens, Inequality in Children’s Contexts: Income Segregation of Households With and Without Children, 81 AM. SOC. REV. 549 (2016).
15
May
St. Paul
Hugo
Burns
Blaine
Eagan
Eureka
Benton
Helena
Mpls
Columbus
Afton
Empire
Grant
Douglas
Orono
Camden
EastBethel
Linwood
Lakeville
Andover
WaconiaTwp
Marshan
Corcoran
Dahlgren
HamptonTwp.
Medina
Ramsey
Plymouth
Hassan
Ham Lake
Dayton
Woodbury
Hollywood
VermillionTwp
Oak Grove
Lino Lakes
Denmark
Belle PlaineTwp.
Cedar Lake
WatertownTwp.
Blakeley
Laketown
Rosemount
NewScandia
CastleRock
ForestLake
Bloomington
NewMarketTwp.
Greenvale
Shakopee
Sand Creek
Edina
EdenPrairie
MapleGrove
Minnetrista
SpringLake
Burnsville
Sciota
Savage
St. Francis
Hancock
Nininger
Chaska
StillwaterTwp.
San Francisco
Louisville
Roseville
RandolphTwp.
CottageGrove
Ravenna
Inde-pendence
Minnetonka
LakeElmo
Young America
Greenfield
CreditRiver
Chan-hassen
CoonRapids
BrooklynPark Frid-
ley
Maplewood
PriorLake
InverGroveHgts
Water-ford
AppleValley
Oakdale
Hastings
Shvw
Shw
Anoka
St.Lawrence
Victoria
Farmington
Baytown
Champlin
Jackson
AH
WestLakeland
WhiteBear
Crystal
Rich-field
St.LouisPark
NorthOaks
Still-water
GoldenValley
Mound
Rogers
Carver
MendotaHgts
WBL
NBBC
NewHope
VH
Hopkins
Mah
NewportSSP
ChaskaTwp.
Jordan
WSP
Wayzata
BellePlaine
LC
Waconia
Lakeland
Elko
MV Dell-wood
BayportRbb
Centerville
New Prague
Marine onSt. Croix
Dp
NSP
GCI
Coates
CH
Miesville
SA
St. Paul Park
OakParkHgts
CirclePines
Mayer
FH
Watertown
Hampton
Bethel
Osseo
SL
SLP
Ly
Randolph
Cologne
Vermillion
MaplePlain
TB
Long Lake
St.B
NorwoodYoung
America
Wd
New Market
LakeSt. Croix
BeachNew
Germany
LakelandShores
Loretto
St. MarysPoint
ML
Hamburg
Mndt
New Trier
Landfall
Ld
Lx
GLPS
SPMB
G
Ex
BV
WRIGHT
ISANTI
DAKOTA
SCOTT
ANOKA
HENNEPIN
CARVER
SHERBURNE
WASHINGTON
RAMSEY
SIBLEY
LE SUEUR RICE GOODHUE
AIRPORT
94
35
35
494
35W35E
35E
694
35W
94
52
169
10
12
10
7
35
Data Source: HousingLink STREAMS, NCompass, Minnesota Housing; U.S. Census BureauMiles
0 10
MVNBNSPPSRbbSASt.BSLSLPSPSSPShvwShwTBVHWdWBLWSP
Mounds ViewNew BrightonNorth Saint PaulPine SpringsRobinsdaleSaint AnthonySaint BonifaciusSunfish LakeSpring Lake ParkSpring ParkSouth Saint PaulShoreviewShorewoodTonka BayVadnais HeightsWoodlandWhite Bear LakeWest Saint Paul
------------------
Arden HillsBrooklyn CenterBirchwood VillageColumbia HeightsDeephavenExcelsiorFalcon HeightsGreenwoodGem LakeGray Cloud IslandLittle CanadaLauderdaleLexingtonLilydaleMahtomediMinnetonka BeachMendotaMedicine Lake
AHBCBVCHDpExFHGGLGCILCLdLxLyMahMBMndtML
------------------
MAP 1: MINNEAPOLIS - SAINT PAUL REGION Percentage of Occupied Housing That Are Affordable Subsidized Units by Census Tract, 2017
94
35E
35E
94
52
SAINT PAUL
Saint PaulInset
35W
394
94
35W
94
55
MINNEAPOLIS
MinneapolisInset
LegendNone
No Data
0.1 to5.0 to
10.0 to25.0 to50.0 to
4.9%9.9%
24.9%49.9%
(261)(213)(99)(89)(28)(9)(5)
83.1%
16

CONCENTRATED POVERTY IS NOT DIRECTLY ADDRESSED IN THE 2040 PLAN
Despite the role it plays in Minneapolis’s historic development, and its centrality to many of the
challenges the city currently faces, poverty concentration is not directly addressed by the 2040 Plan.
At the broadest level, none of the Draft Plan’s fourteen “2040 Goals,” eleven “2040 Topics,” or ninety-
seven “Plan Policies” directly address the subject of poverty concentration, concentrated
neighborhoods, or nonwhite segregation.
The plan approaches the concept of concentration of poverty delicately, only raising the issue directly a
handful of times:
• Action Step E in Policy 44 (“Comprehensive Investment”) states that the city will “[e]nsure that
housing investments in areas with concentrated poverty are part of a comprehensive
community investment strategy to benefit existing residents and improve opportunity.”28
• Action Step E in Policy 48 (“Data-Driven Decisions”) states that the city will “[r]eview capital
improvement planning models to ensure the process is guide by data on concentrated
poverty.”29
• The preamble of Policy 63 (“Food Access”) notes that “[m]any . . . food access priority areas are
also areas of concentrated poverty,” and provides a definition for “areas of concentrated
poverty.”30
• The Planning Process section notes that maps of concentrated poverty were provided for
“facilitated discussions” with residents, alongside other resources such as the 1930s FHA
redlining maps.31
These mentions, though brief, indicate that the drafters of the Draft 2040 Plan are well aware of the
significant concentrations of poverty in Minneapolis, and are aware how those concentrations impact
the other issues addressed in the Draft Plan. This, in turn, makes the omission of any direct discussion or
treatment of concentrated areas all the more glaring.
As discussed above, the Draft 2040 Plan’s proposals to reduce exclusion, and open up access to the city
for all, are an admirable and significant step. But it without any proposals to reduce racial and economic
concentration, or indeed, without any acknowledge of this problem, the Plan’s treatment of
Minneapolis’s historic inequality is, at best, half-baked.
CONCENTRATION OF POVERTY IS A MORE SEVERE ISSUE FOR MINNEAPOLIS THAN DISPLACEMENT
Although concentration of poverty is mostly avoided as a subject for the Draft 2040 Plan, its opposite,
housing displacement, is frequently mentioned, and is the subject of a dedicated policy (Policy 43,
“Housing Displacement”).
Displacement and concentration are logically paired. When displacement occurs, low-income residents
are forced to leave a neighborhood in which incomes are rising, and to which middle-income or higher-
income residents are returning. When concentration occurs, low-income residents are redirected to
28 Draft 2040 Plan at 157. 29 Id. at 161. 30 Id. at 176. 31 Id. at 236.
17

neighborhoods in which incomes are declining, and from which middle-income or higher-income
residents are departing.
Both trends are occurring within Minneapolis. However, virtually all available statistical evidence shows
that concentration of poverty is occurring far more frequently than displacement, across a broader
geographic range, and affecting far more individuals. Moreover, while displacement can be ameliorated
by building more housing in areas with rising incomes, it is exceptionally difficult to ameliorate poverty
concentration, once it has begun. Low demand for housing within a declining neighborhood means the
process of attracting middle-income residents once again is lengthy and uncertain, and likely entails a
great deal of public and private investment.
Nonetheless, displacement frequently attracts disproportionate attention from policymakers, because a
change in neighborhood economic trajectory is often more noticeable than an accelerating downward
trend. This appears to be the case in the Draft 2040 Plan.
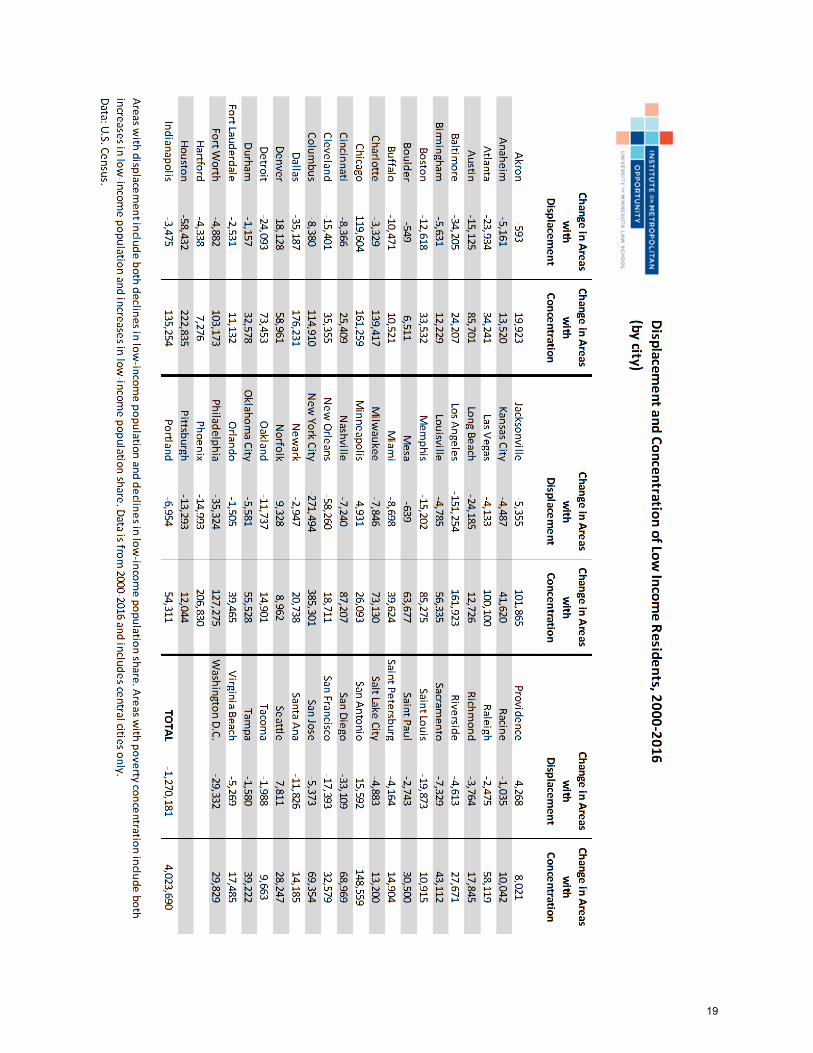
The following table compares the prevalence of displacement and poverty concentration from 2000 to
2016 in central cities from the 50 largest metropolitan areas. A tract is defined as experiencing
displacement if it has experienced both a low-income population decline and a decline in the share of
low-income population. A tract is defined as experiencing concentration if it has experienced both a low-
income population increase and an increase in the share of low-income population. Although this is not
a fullproof measure of displacement or concentration, it is a reasonable approximation of the upper
bound of each trend.
Minneapolis has a notably low share of displacement compared to concentration. While a number of
central cities show displacement and concentration occurring at approximately the same rate, only
about 5,000 low-income Minneapolis residents left tracts on an upward economic trajectory. By
comparison, over 26,000 low-income Minneapolis residents entered a tract with a downward economic
trajectory.
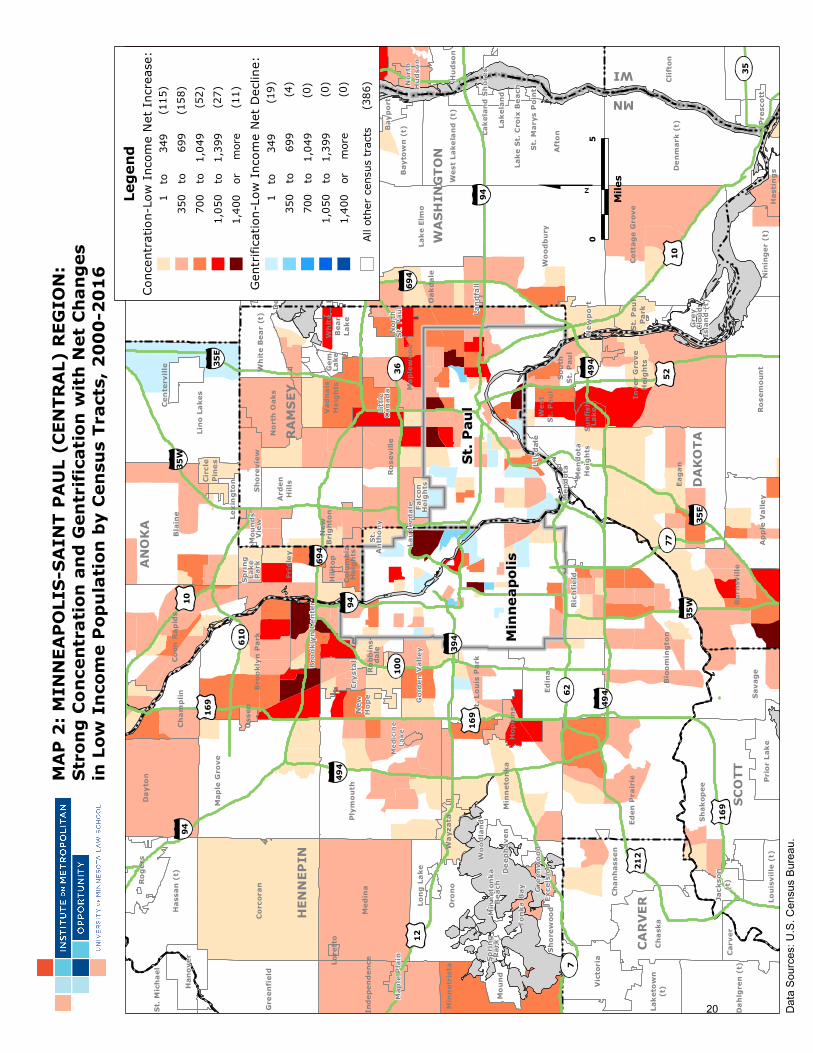
Finally, Map 2, below, visualizes these trends on a regional level. It uses a somewhat modified
measures, which omits tracts in which the scale of population change is small enough to represent
sampling error or statistical noise. The map shows that poverty concentration is by far the predominant
trend in the Twin Cities region, and while several pockets of displacement may exist in Minneapolis,
they are nonetheless less frequent and less severe than major concentrations of poverty.
18
19
St. P
aul
Hugo
Blai
ne
Eaga
nCl
ifton
Som
erse
t
May
(t)
Minn
eapo
lis
Afto
n
Gran
t
Oron
o
Corc
oran
Medi
naPl
ymou
th
Dayt
on
Woo
dbur
y
Lino
Lak
es
St. J
osep
h
St. M
ichae
l
Rose
mou
nt
Bloo
min
gton
Shak
opee
Eden
Pra
irie
Edin
a
Dahl
gren
(t)
Mapl
e Gr
ove
Minn
etris
ta
Burn
svill
e
Cotta
ge G
rove
Chas
ka
Denm
ark
(t)
Inde
pend
ence
Minn
eton
ka
Lake
Elm
o
Sava
ge
Lake
tow
n(t
)
Gree
nfie
ld
Chan
hass
en
Coon
Rap
ids
Broo
klyn
Par
k
Prio
r Lak
e
Hass
an (t
)
Frid
ley
Mapl
ewoo
d
Rose
ville
Inve
r Gro
veHe
ight
s
Nini
nger
(t)
Appl
e Va
lley
Oakd
ale
Hast
ings
Vict
oria
Still
wat
er (t
)Sh
orev
iew
Shor
ewoo
d
Loui
svill
e (t
)
Roge
rs
Huds
on
Cham
plin
Still
wat
erCr
ysta
l
Rich
field
Bayt
own
(t)
St. L
ouis
Park
Gold
en V
alle
y
North
Oak
s
Moun
d
Wes
t Lak
elan
d (t
)
Whi
te B
ear (
t)
Carv
er
Hano
ver
Mend
ota
Heig
hts
Vadn
ais
Heig
hts
Hopk
ins
Way
zata
Arde
nHi
lls
Jack
son
(t)
Maht
omed
iW
hite
Bear
Lake
Broo
klyn
Cen
ter
New
Brig
hton
New
Hope
New
port
Sout
hSt
. Pau
l
Wes
tSt
. Pau
l
Pres
cott
Little
Cana
da
Lake
land
Moun
dsVi
ewDe
llwoo
d
St. P
aul
Park
Robb
ins-
dale
Cent
ervi
lle
Bayp
ort
Marin
e on
St.
Croi
x
Deep
have
n
North
St. P
aul
Colu
mbi
aHe
ight
s
St.
Anth
ony
Oak
Park
Hei
ghts
North
Huds
on
Circ
lePi
nes
Falco
nHe
ight
s
Sunf
ishLa
ke
Grey
Clou
dIs
land
(t)
Osse
oSp
ring
Lake
Park
Gem
Lake
Lily
dale
Mapl
e Pl
ain
Tonk
a Ba
y
Long
Lak
e
Pine
Spr
ings
Exce
lsior
Lexi
ngto
n
Woo
dlan
d
Gree
nwoo
d
Sprin
gPa
rk
Lake
St.
Croi
x Be
ach
Lake
land
Sho
res
Lore
tto
Laud
erda
le
Mend
ota
St. M
arys
Poi
nt
Minn
eton
kaBe
ach
Medi
cine
Lake
Birc
hwoo
d Vi
llage
Hillt
op
Will
erni
e
Land
fall
Data
Sourc
es: U
.S. C
ensu
s Bure
au.
MNWI
HENN
EPIN
RAMS
EY
ANOK
A
WAS
HING
TON
DAKO
TA
CARV
ER
SCOT
T
94
94
94
494
494
694
694
35E
35E
35W
35W
394
212
10
12
1052
16916
9
7
35
494
Mile
s
05
169
77
62
3610
0
610
MA
P 2
: MI
NNEA
POLI
S-SA
INT
PAUL
(CEN
TRAL
) REG
ION:
Stro
ng C
once
ntra
tion
and
Gent
rifica
tion
with
Net
Cha
nges
in
Low
Inco
me
Popu
latio
n by
Cen
sus T
ract
s, 20
00-2
016
Lege
ndCo
ncen
tratio
n-Lo
w In
com
e Net
Incre
ase:
All ot
her c
ensu
s tra
cts
Gent
rifica
tion-
Low
Inco
me N
et D
eclin
e:
(386
)
1,400
or
more
1,050
to
1,399
700
to1,0
4935
0 t
o69
91
to34
9
1,400
or
more
1,050
to
1,399
700
to1,0
4935
0 t
o69
91
to34
9
(0)
(0)
(0)(4)
(19)
(11)
(27)
(52)
(158
)(1
15)
20

APPENDIX: POPULATION DISTRIBUTION GRIDS
The following tables divide Minneapolis census tracts into a grid of 25 categories, determined by the
low-income population share and nonwhite population share of each tract. (Low-income is defined as
individuals in families below 200 percent of the poverty line.) Each table shows the share of that
population group living in each of the 25 categories, and is also color-coded to depict those
distributions. The tables were generated using data from the 2016 American Community Survey,
conducted by the U.S. Census.
A number of trends are obvious in these tables. First, Minneapolis’s white population and non-poor
families are concentrated in the top left corner of the grid – neighborhoods that are less than 20 percent
low-income and nonwhite. College graduates are especially likely to live in whiter and higher-income
areas.
By comparison, most nonwhite racial groups and lower-income groups are spread across a much
broader range of neighborhoods, and particularly concentrated in areas that are over 60 percent
nonwhite and 40 percent low-income. Two groups are particularly concentrated: families in poverty
with children, and black residents. For both groups, well over half the Minneapolis population is
concentrated in areas more than 60 percent nonwhite and 40 percent low-income.
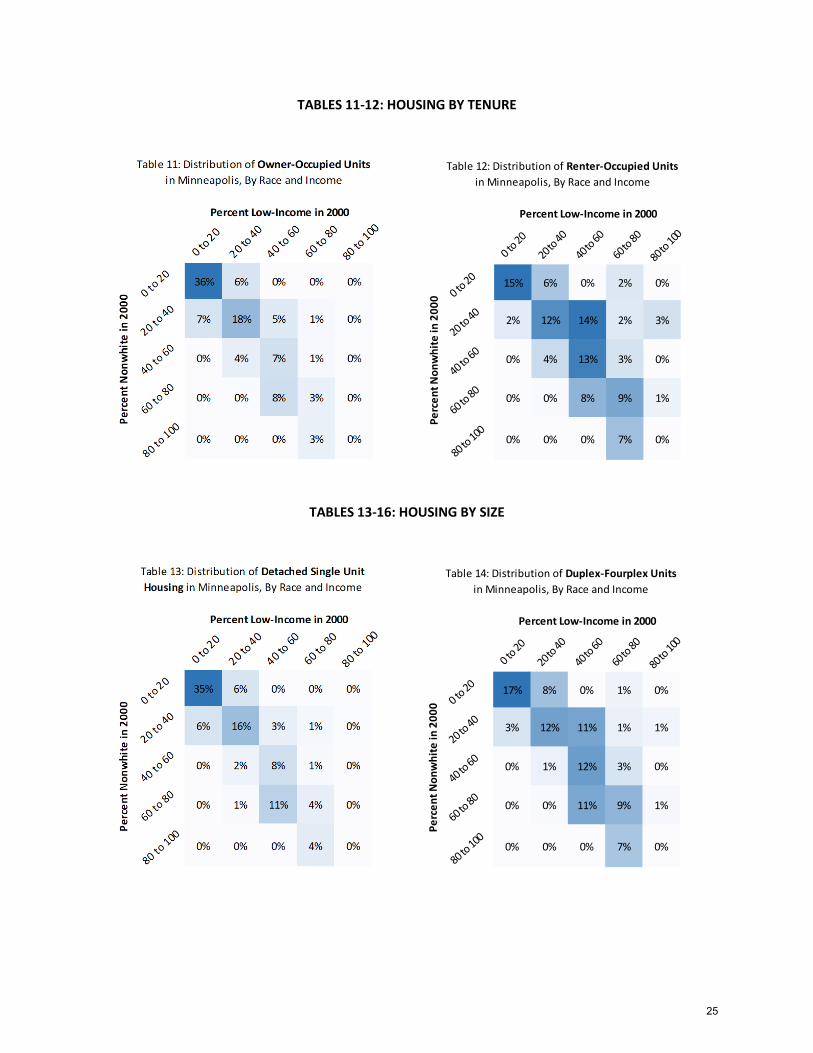
Tables 11-16 break down the distribution of housing units in the city. The distribution of owner-occupied
housing and single-family detached housing closely tracks the distribution of white residents and college
graduates. By comparison, rental units appear in a wider variety of neighborhoods.
A somewhat more complex trend appears when examining housing by size of structure. While single-
family units are intensely concentrated in white and affluent areas, multifamily housing is spread across
a wide range of neighborhood types, with a respectable share in white and affluent areas but the largest
share in diverse, middle-income areas. Finally, there are small, multiple-unit dwellings like duplexes,
triplexes, and fourplexes – these are at present evenly distributed throughout the city, closely reflecting
overall population.
Overall Population Distribution in Minneapolis,
By Race and Income
Percent Low-Income in 2000
0 to 2
0
20 to
40
40 to
60
60 to
80
80 to
100
0 to 20 23% 5% 0% 1% 0%
20 to 40
4% 13% 8% 2% 3%
40 to 60
0% 3% 10% 2% 0%
60 to 80
0% 0% 10% 7% 1%
80 to 100 0% 0% 0% 6% 0%
Pe
rce
nt
No
nw
hit
e in
20
00
21

TABLES 1-5: RACE
Table 1: Distribution of American Indian
Population in Minneapolis, By Race and Income
Percent Low-Income in 2000
0 to 2
0
20 to
40
40 to
60
60 to
80
80 to
100
0 to 20 14% 4% 0% 0% 0%
20 to 40
2% 9% 8% 2% 2%
40 to 60
0% 5% 8% 4% 0%
60 to 80
0% 0% 20% 4% 2%
80 to 100 0% 0% 0% 16% 0%
Pe
rce
nt
No
nw
hit
e in
20
00
Table 2: Distribution of Asian Population in
Minneapolis, By Race and Income
Percent Low-Income in 2000
0 to 2
0
20 to
40
40 to
60
60 to
80
80 to
100
0 to 20 10% 3% 0% 2% 0%
20 to 40
3% 8% 7% 4% 9%
40 to 60
0% 4% 6% 1% 0%
60 to 80
0% 0% 14% 14% 0%
80 to 100 0% 0% 0% 15% 0%
Pe
rce
nt
No
nw
hit
e in
20
00
Table 3: Distribution of Black Population in
Minneapolis, By Race and Income
Percent Low-Income in 2000
0 to 2
0
20 to
40
40 to
60
60 to
80
80 to
100
0 to 20 5% 1% 0% 0% 0%
20 to 40
1% 9% 6% 2% 2%
40 to 60
0% 3% 12% 3% 0%
60 to 80
0% 1% 19% 18% 2%
80 to 100 0% 0% 0% 17% 0%
Pe
rce
nt
No
nw
hit
e in
20
00
Table 4: Distribution of Hispanic Population in
Minneapolis, By Race and Income
Percent Low-Income in 2000
0 to 2
0
20 to
40
40 to
60
60 to
80
80 to
100
0 to 20 7% 3% 0% 0% 0%
20 to 40
2% 11% 7% 1% 1%
40 to 60
0% 3% 17% 3% 0%
60 to 80
0% 1% 20% 9% 2%
80 to 100 0% 0% 0% 12% 0%
Pe
rce
nt
No
nw
hit
e in
20
00
22

TABLES 6-8: INCOME AND FAMILY STATUS
Table 5: Distribution of White Population in
Minneapolis, By Race and Income
Percent Low-Income in 2000
0 to 2
0
20 to
40
40 to
60
60 to
80
80 to
100
0 to 20
33% 7% 0% 2% 0%
20 to 40
5% 15% 9% 2% 4%
40 to 60
0% 3% 8% 1% 0%
60 to 80
0% 0% 5% 3% 0%
80 to 100 0% 0% 0% 1% 0%
Pe
rce
nt
No
nw
hit
e in
20
00
Table 6: Distribution of Population in Poverty in
Minneapolis, By Race and Income
Percent Low-Income in 2000
0 to 2
0
20 to
40
40 to
60
60 to
80
80 to
100
0 to 20 6% 2% 0% 3% 0%
20 to 40
1% 10% 9% 4% 7%
40 to 60
0% 2% 11% 3% 0%
60 to 80
0% 0% 13% 14% 2%
80 to 100 0% 0% 0% 12% 0%
Pe
rce
nt
No
nw
hit
e in
20
00
Table 7: Distribution of Families in Poverty with
Children in Minneapolis, By Race and Income
Percent Low-Income in 2000
0 to 2
0
20 to
40
40 to
60
60 to
80
80 to
100
0 to 20 3% 1% 0% 0% 0%
20 to 40
1% 12% 6% 2% 2%
40 to 60
0% 3% 12% 4% 0%
60 to 80
0% 1% 16% 18% 2%
80 to 100 0% 0% 0% 17% 0%
Pe
rce
nt
No
nw
hit
e in
20
00
23

TABLES 9-11: SPECIAL POPULATIONS
Table 9: Distribution of College Graduate
Population in Minneapolis, By Race and Income
Percent Low-Income in 2000
0 to 2
0
20 to
40
40 to
60
60 to
80
80 to
100
0 to 20 37% 8% 0% 1% 0%
20 to 40
5% 16% 8% 2% 1%
40 to 60
0% 4% 8% 1% 0%
60 to 80
0% 0% 4% 3% 0%
80 to 100 0% 0% 0% 2% 0%
Pe
rce
nt
No
nw
hit
e in
20
00
Table 10: Distribution of Immigrant Population
in Minneapolis, By Race and Income
Percent Low-Income in 2000
0 to 2
0
20 to
40
40 to
60
60 to
80
80 to
100
0 to 20 9% 2% 0% 1% 0%
20 to 40
2% 11% 8% 2% 4%
40 to 60
0% 4% 12% 3% 0%
60 to 80
0% 0% 14% 15% 2%
80 to 100 0% 0% 0% 11% 0%
Pe
rce
nt
No
nw
hit
e in
20
00
24
TABLES 11-12: HOUSING BY TENURE
TABLES 13-16: HOUSING BY SIZE
Table 12: Distribution of Renter-Occupied Units
in Minneapolis, By Race and Income
Percent Low-Income in 2000
0 to 2
0
20 to
40
40 to
60
60 to
80
80 to
100
0 to 20 15% 6% 0% 2% 0%
20 to 40
2% 12% 14% 2% 3%
40 to 60
0% 4% 13% 3% 0%
60 to 80
0% 0% 8% 9% 1%
80 to 100 0% 0% 0% 7% 0%
Pe
rce
nt
No
nw
hit
e in
20
00
Table 14: Distribution of Duplex-Fourplex Units
in Minneapolis, By Race and Income
Percent Low-Income in 2000
0 to 2
0
20 to
40
40 to
60
60 to
80
80 to
100
0 to 20 17% 8% 0% 1% 0%
20 to 40
3% 12% 11% 1% 1%
40 to 60
0% 1% 12% 3% 0%
60 to 80
0% 0% 11% 9% 1%
80 to 100 0% 0% 0% 7% 0%
Pe
rce
nt
No
nw
hit
e in
20
00
25
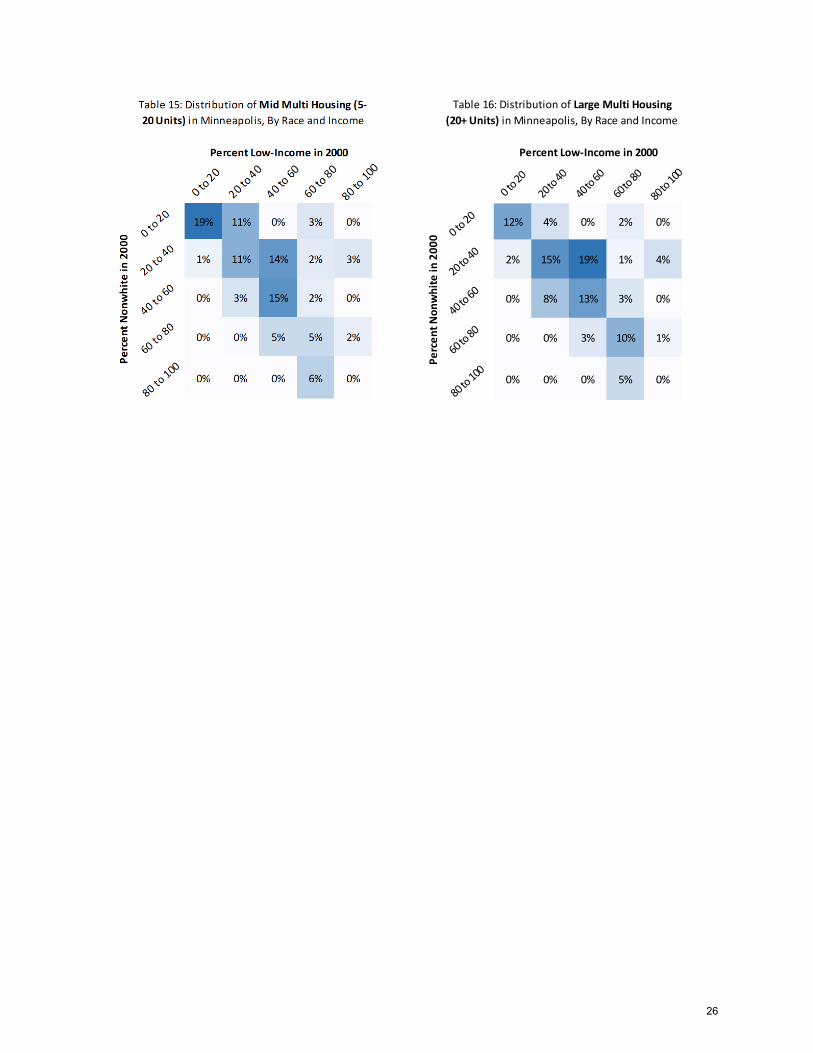
Table 16: Distribution of Large Multi Housing
(20+ Units) in Minneapolis, By Race and Income
Percent Low-Income in 2000
0 to 2
0
20 to
40
40 to
60
60 to
80
80 to
100
0 to 20 12% 4% 0% 2% 0%
20 to 40
2% 15% 19% 1% 4%
40 to 60
0% 8% 13% 3% 0%
60 to 80
0% 0% 3% 10% 1%
80 to 100 0% 0% 0% 5% 0%
Pe
rce
nt
No
nw
hit
e in
20
00
26
Related Documents