1 Lessons from International Experience on Fiscal Decentralization for Regional Governments Volume II: Overview and Case Studies: Colombia, Indonesia, Poland and Spain prepared under the World Bank Partnership RAS for Chile 1 1 The Overview Chapter was written by Ewa Korczyc and Natalia Campora under the supervision of Jorge Martinez-Vazquez. Case studies were authored by country experts: Colombia - Juan Gonzalo Zapata; Indonesia - Gabriele (Gabe) Ferrazzi; Poland- Pawel Swianiewicz; and Spain - Santiago Lago-Peñas. The work benefitted from comments by Pedro L. Rodriguez. Public Disclosure Authorized Public Disclosure Authorized Public Disclosure Authorized Public Disclosure Authorized

Welcome message from author
This document is posted to help you gain knowledge. Please leave a comment to let me know what you think about it! Share it to your friends and learn new things together.
Transcript
1
Lessons from International Experience on
Fiscal Decentralization for Regional
Governments
Volume II: Overview and Case Studies:
Colombia, Indonesia, Poland and Spain
prepared under the World Bank Partnership RAS for Chile1
1 The Overview Chapter was written by Ewa Korczyc and Natalia Campora under the supervision of Jorge Martinez-Vazquez.
Case studies were authored by country experts: Colombia - Juan Gonzalo Zapata; Indonesia - Gabriele (Gabe) Ferrazzi; Poland-
Pawel Swianiewicz; and Spain - Santiago Lago-Peñas. The work benefitted from comments by Pedro L. Rodriguez.
Pub
lic D
iscl
osur
e A
utho
rized
Pub
lic D
iscl
osur
e A
utho
rized
Pub
lic D
iscl
osur
e A
utho
rized
Pub
lic D
iscl
osur
e A
utho
rized
2
Foreword:
The World Bank has been requested to accompany the Chilean government in conducting a comprehensive
analysis of international experience with fiscal decentralization processes for regional level of subnational
governments. Such analysis will provide lessons and recommendations that can assist the Ministry of
Finance in designing and implementing the fiscal decentralization framework for regional governments in
Chile.
This work is aligned with the Government’s decentralization strategy which places the regionalization
process, in particular democratically elected self-governing regions with resources and responsibilities, at
the center of the reform effort.
This work is very timely, as Chile - confronted with social unrest towards the end of 2019 - will hold a
referendum regarding the current constitution and is embarking on a national debate to redefine the
fundamental principles of state organization.
The study is comprised of two volumes.
Volume I provides a systematic review of the relevant international experience in fiscal decentralization for
the mid-level of government. The work focuses primarily on the aspects of fiscal decentralization from the
fiscal discretion angle, specifically expenditure responsibilities, revenue assignments, transfers and
subnational borrowing. This work is supplemented with a brief overview of selected aspects of fiscal
accountability related to the budget process, audit and control; as well as transparency and citizen
engagement.
Volume II includes in-depth case studies with descriptions and analyses of decentralization processes in
four selected countries: Colombia, Indonesia, Poland and Spain. This volume is prefaced by an overview
that summarizes the main issues and draws relevant lessons from the experience of these four countries.
The case studies for the report were selected jointly with the Government of Chile. The following criteria
were applied in selecting the case study countries:
• “unitary constitution” (rather than a federal structure);
• income per capita similar to that of Chile;
• decentralization experiences and insights are relevant and interesting in terms of both achievements
and failures; and
• existence of relevant “in-house” experience at the World Bank.
All case studies follow a similar structure – they provide a brief history of the decentralization process in
the respective country and describe major adjustments to the decentralization model. Next, they provide a
detailed analysis of the expenditure assignments and sources of funding (revenue assignments) for the
intermediate level of subnational governments. Each report also includes a discussion about subnational
borrowing and fiscal rules. A separate section is dedicated to issues related to accountability, budget process
and control mechanism. Each report ends with a summary of the key lessons and their applicability to Chile.
3
Overview
Decentralization process and its drivers
The case studies show that the process of decentralization is closely linked to specific circumstances
of the individual countries. The decentralization process in Indonesia is known in the literature as “big
bang”, as most of the decentralization reforms were completed within a short period of two years. In 1998,
the effects of the Asian Financial Crisis and the ensuing political turmoil provided Indonesia with the fertile
ground for decentralization reforms, which were generally driven by long-standing grievances regarding
limited democracy, concentration of wealth and political centralization. Without the benefit of a longer
period of preparation, Indonesia enacted several laws and the central government suddenly transferred
political authorities, responsibilities and financial resources to the districts and villages, but much less so
to the intermediate level, the provinces. In contrast, the process of decentralization in Colombia has been
evolving for decades. The early decentralization efforts in Colombia date back to the mid-19th century but
it was only in the 1980s that Colombia finally achieved fiscal, political and administrative decentralization
by assigning fiscal resources to the municipalities, allowing the election of mayors, and by transferring
functions from the central government to the subnational governments. For Colombia, in contrast to the
case of Indonesia, the decentralization process was gradual and comprehensive, as the policies were
oriented simultaneously to decentralize functions, resources and political responsibilities.
Similarly, the drivers behind the decentralization process varied considerably among the four
countries. In the case of Poland, the process of fiscal decentralization was part of a broader reform package,
as the country moved from a central planning system to a market economy. The prospect of the European
Union accession and the important role of subnational governments in other European Union countries
were important factors supporting decentralization reforms in Poland. In fact, Poland -as well as Colombia-
has had a long history of decentralization, but it was not until the 1990s, when comprehensive
decentralization reforms were launched. Political events also prompted decentralization in Spain, where a
phase of transition towards democracy coincided with death of General Franco in 1975. By 1977, the first
Autonomous Communities (Regional Governments) were established, and the decentralization process was
officially launched. The new Constitution of 1978 incorporated three governmental levels: Central
Administration; the regions called Autonomous Communities; and the Local Corporations, which include
the municipalities and the provincial councils.
Expenditure assignments
The experiences of case study countries show that most sectoral competencies are overlapping,
although central government tends to play a leading role in regulatory framework, while
implementation is devolved to subnational governments. For example, in Colombia, the 1991
Constitution granted the central government responsibilities related to the design of sectoral policies, while
their implementation was delegated to the subnational level. Initially the financing of these policies was
provided with resources from the National Budget; however, the system evolved with the introduction of a
system of intergovernmental transfer systems and the strengthening of own revenue sources for subnational
governments. In Poland, regional governments have just a few specific service delivery functions that are
related to sectoral competencies, and their primary role is with regards to the programming of regional
development policies, especially in the context of the significant European Union structural funds. Regional
governments also play a much more pronounced role in public investment than other layers of subnational
governments, which helps to exploit existing economies of scale. The case of Spain shows much more
emphasis on delegating functions to the intermediate level of subnational governments. Regional
governments in Spain share many regulatory functions with the central government, especially with respect
to territorial management, culture, environment, R & D policy, transport infrastructure, etc. And there some
4
hierarchical relationship in the sense that regional governments can decide on the organization of
municipalities and provinces within their regional territory.
Among case studies, there are examples of both uniform and asymmetric decentralization models.
For example, in the three-tier structure of subnational governments in Poland, each tier has its specific
functions defined in the legal framework. All subnational governments belonging to the same subnational
tier, have the same set of responsibilities, hence there is no asymmetric decentralization. In contrast, in
Indonesia, Colombia and Spain, the process of decentralization was asymmetric with regards to political,
fiscal and administrative/management function. For example, 5 regions in Indonesia are granted a stronger
role in selected aspects of management or economic policy. In Colombia, political asymmetry in
decentralization is present through the special rights of indigenous peoples to manage their own territory or
special metropolitan status of Bogota. Special administrative and management functions have also been
granted to six other metropolitan areas. Finally, in Spain, at the regional level, decentralization is
asymmetric, with two distinct regimes: the common regime (15 ACs) and the “foral” regime (Basque
Country and Navarra), with this latter characterized by an almost complete spending and revenue autonomy.
In addition, ACs of the common regime each have their specific statute, allowing for some distinctive
features, especially since the 2000s (several statutes have been reformed case by case).
In some of the countries the decentralized subnational governments coexist with the deconcentrated
central government units. Poland’s case is interesting as at the regional level there are two parallel
structures operating to a large extent independently of each other: the regional governor/administrator
(wojewoda) who is appointed by the Prime Minister and who is the head of the state administration in the
region; and the elected regional government, headed by the Regional Marshal (marszalek). While at the
beginning of such dual system there were some conflicts over competencies, the model has been
successfully implemented over last twenty years and currently there are no conflicts between the two
structures even when the subnational authorities represent different political views than the central
administration holding office. However, in the case of Indonesia, the dual role of provincial governor as a
regional head and a representative of the Central Government for the purpose of supervising the district/city
governments, has not been well understood or fully utilized leading to complications with public
accountability. In the case of Spain, there are territorialized agencies of the central administration and a
“delegate” of the central government in each region, but the regional administrations (CAs) function
entirely in a separate and autonomous way.
Revenue sources
In most cases analyzed subnational tax autonomy is rather limited. The subnational regional
governments in Poland have virtually no own revenues, except for small revenues from fees and property
constituting less than 5 percent of regional budgets. Even though the legislation in Spain allows that the
Autonomous Communities create their own taxes within the regional borders, in practice there are many
impediments and as a result the role of own taxes in the revenue structure of regional governments at 2
percent is rather insignificant. However, the so called “ceded” central taxes, including 50 percent of the
central personal income tax and others, and for which regional governments can select rates and tax base,
provide much higher levels of revenue autonomy. In the case of the Basque Country and Navarra e
autonomy is still much higher, as these regional governments benefit from all taxes except import duties,
payroll taxes, VAT and excise duties. In Colombia, the central government retained the main sources of
public revenues including the income tax, the value-added tax and taxes on international trade, and
subnational governments have limited taxing autonomy and little discretion over tax rates and bases.
Several taxes are earmarked for specific use defined by the law. Taxes represent around 20 percent of
revenues for departments and include receipts from the excise taxes (beer, tobacco, liquor), vehicle tax,
register tax and gasoline tax.
5
Regional governments seem to receive quite substantial resources from tax sharing arrangements
with the central government. While there are different types of tax sharing arrangements, it seems that
regional governments in Spain have somewhat larger fiscal leeway whereby they participate in sharing of
major taxes (PIT, VAT, excise) and also have autonomy over the wealth tax, inheritance and gift tax, tax
on capital transfers, gambling tax, vehicle excise and hydrocarbons retail sales tax. In Poland, tax sharing
arrangements include PIT and CIT, the latter being particularly problematic both in terms of its sharing
formula and high volatility leading to large horizontal disparities among regions and cyclical swings in their
revenue base.
Different transfers play an important role in subnational financing and help achieve important
objectives within the fiscal decentralization process.
• In Poland, the general grant (non-earmarked) constitutes the most important grant. It is made up of
several shares, including the education share, the equalization share, the balancing share and the
regional share. The education share is by far the largest, and it aims at covering educational
expenses, including teacher’s salaries, but it is not earmarked. The equalization share is allocated
to all SNGs with below-average tax capacities. The regional share is calculated for each region
based on several criteria (demography, unemployment, GDP per capital, roads, etc.). Earmarked
transfers include specific transfers for central government delegated tasks (e.g. social spending),
capital expenditure, etc.
• In Spain, Basque Country and Navarra do not receive transfers from the central government but,
on the contrary, they transfer funds to central government to participate to national general
expenses. Other ACs (in the common regime) receive general unconditional equalization grants
and conditional grants. There are two main funds: (i) the Guarantee of Basic Public Services Fund,
non-earmarked, which is intended to ensure equal funding for basic public services (health care,
education and social services), and (ii) the Global Sufficiency Fund, which is based on the
assessment of the fiscal gap between expenditure needs and fiscal capacity. In addition, regions
receive conditional grants aimed at fostering regional development, such as the compensation fund.
• In Colombia, the General System of Transfers (Sistema General de Participaciones, SGP) is the
most important central government transfer. SGP funds are earmarked for the most part, and their
distribution between key sectors (education, health and water supply and sewerage) is determined
by law according to a formula based on a combination of population coverage, social equity and
efficiency criteria.
• In Indonesia, transfers from the central government consist of three major components: the general
allocation fund, the revenue-sharing fund and the specific purpose fund. The general allocation
fund (Dana Alokasi Umum, DAU) is an equalization transfer system aiming at reducing fiscal
imbalances between sub-national governments. Transfers are formula-based, consisting of a base
allocation (equal to the amount of spending on personal) and a fiscal gap allocation (which can be
positive or negative). The shared revenue fund (Dana Bagi Hasil, DBH) is sub-divided in two
categories. The DBH from taxes is a shared tax system, based on receipts from the personal income
tax, etc. The DBH from natural resources is based on revenues derived from forestry, mining, oil,
etc. Last, the special allocation fund (Dana Alokasi Khusus, DAK) is a transfer system to fund
responsibilities that are considered as national priorities and are mostly earmarked capital transfers.
6
Subnational borrowing and fiscal rules
The case studies underscore the need for ensuring fiscal stability at the subnational level by putting
in place borrowing rules. In Colombia, the subnational entities suffered significant financial problems.
During the decade of the 1990s, many departments and large cities became excessively indebted and could
not meet their payment obligations. That prompted the national government to bail out those subnational
governments. To avoid the situation from re-occurring, a robust regulatory framework was issued imposing
borrowing restrictions on subnational governments, in order to encourage fiscal sustainability. In Indonesia,
subnational borrowing prior to the decentralization reforms used to be significant. The central government
sought to clean up the defaulting loans early in the reform period. Nowadays, regional governments can
borrow but are limited by regulations and capacity to design and manage large capital projects. The
subnational governments in Poland have a right to take loans or issue bonds to borrow in the financial
market without asking for central government prior permission, although, they are subject to regulations
and ex-post controls. If the sub-national entities have problems for servicing their debt, they need to approve
a recovery program. It often includes fiscal adjustment programs in exchange for a low-interest loan from
the central administration.
Subnational borrowing is often embedded in the subnational fiscal rules and supervised through
independent bodies or the central government:
• In Spain, the subnational debt has significantly increased after the 2008 global financial crisis. This
situation led to profound reforms regarding fiscal rules. A constitutional reform was adopted in
2011 to underpin the fiscal consolidation targets for all Spanish administrations from 2020 onward.
Moreover, an Organic Law on Budgetary Stability and Financial Sustainability passed in 2012
introduced a structural balanced budget rule and debt ceilings for all levels of governments, as well
as expenditure rules for SNGs. The regional Liquidity Fund (FLA) was also temporarily established
in 2012 to support heavily indebted regions with difficulties borrowing in open markets. Finally,
an independent authority for Fiscal Responsibility was set up to monitor and report on compliance
of all levels of government.
• In Poland, the 2011 Public Finance Act stipulated to balance local current budgets and strengthened
debt limitations requiring that the sum of loan instalments and interest payments must not exceed
15% of total debt. From 2014 onwards, the mode of calculation for debt ratios is changed in order
to reduce subnational debt.
• In Indonesia, sub-national debt must not exceed 75% of the previous year’s budget revenues. Sub-
national governments are not allowed to borrow internationally; those with outstanding arrears on
government loans are prohibited from borrowing. A cumulative lending limit for subnational loans
is set by the ministry of finance.
• In the case of Colombia, recourse to borrowing is regulated by strict prudential rules, established
in 1997 (“Traffic Light Law” or Ley de Semáforo); in addition, in 2000 and in 2003 the Law on
Fiscal Transparency and Responsibility curbed the growing subnational government indebtedness
observed during the 1990’s. In addition, since 2003, departments and large municipalities must
obtain satisfactory credit ratings from international rating agencies before they can borrow.
7
Challenges and lessons
The case studies show that the decentralization process is a continuous effort that has to be carefully
sequenced and managed. Challenges are multiple:
• The decentralization process is unlikely to succeed if it is only partial -political decentralization. If
these reforms are not accompanied by fiscal and administrative decentralization the overall
outcome can in fact have detrimental effects on the quality and effectiveness of governance in the
country.
• Accountability becomes complicated and diffused when there are overlapping competencies or
when these responsibilities are not well-defined, which also increases the likelihood of political
conflicts.
• Politically it is much easier to decentralize expenditure responsibilities than revenue sources.
However, insufficient revenue decentralization and financial autonomy is a significant threat to
accountability and the overall efficiency of the decentralized system.
• Local fiscal accountability and citizens’ participation on subnational governments’ affairs represent
a difficult challenge in the decentralization process of any country, but they are key to successful
decentralization.
Case studies also offer many lessons to other countries embarking on decentralization reforms:
• While decentralization processes are very country specific, they need to be informed by fiscal
federalism principles and the ample international experience on what has worked and what has not
work in other countries.
• Decentralization is not an effortless and simple process, on the contrary, it requires a significant
planning effort and political leadership in its execution.
• Supporting newly created subnational governments is a core responsibility of the central
government in the evolved decentralized intergovernmental architecture.
• Macroeconomic and fiscal stability are core objectives that the fiscal decentralization architecture
must support and respect. Subnational governments, even when they have autonomy in their fiscal
matters, must still be subject to the rules and regulations that are necessary to ensure economic
stability.
What can Chile learn from the case studies?
Articulate a vision. Decentralization reforms are too complicated to be planned and implemented on ad
hoc basis and only with a partial view. While they can be spread over years, it is important to have a clear
vision or roadmap in mind.
All stakeholders must get involved in the process. Chile is not in a rush, thereby, all kind of stakeholders
should get involved in the process to converge as much as possible on goals, concepts, terminology and key
options.
Good planning is essential. For expenditure responsibilities, it is important to identify and asses which is
the lowest organizational level of government at which functions can be done efficiently and successfully.
It will be necessary to find a balance between the subsidiarity principle and economies of scale. Then, a
timely and relevant capacity development plan must be prepared that recognizes critical and urgent
transition issues, but which also incorporates a longer-term perspective.
8
Create a dynamic and flexible system. The architecture and typology of functions scheme must provide
a dynamic and creative system. Chile should provide certainty to the subnational level in order to undertake
the new functions but must guarantee that there is room for changes and improvements, of course, under
the central government’s guidance and control, when needed.
Focus on establishing a comprehensive role for the intermediate level of government. Overriding
political considerations shapes the choice of intermediary roles and mechanisms. Chile may have the option
(with only one level in play) to create from the beginning an integral but at the same time transparent
intermediate level of government.
Design an efficient accountability mechanism. Lack of accountability mechanisms may generate a slow
progress on service improvement and innovation. Lack of accountability will also lead to the inefficient
and unresponsive provision of public services, and ultimate to the waste of public resources. Chile has the
chance to design good mechanisms (especially in terms of the use of the information) which are not
burdensome and involve all stakeholders more meaningfully.
Match revenues to needs. To ensure accountability, revenue should be matched as closely as possible to
expenditure needs that is: “finance follows function.” In addition, tax instruments intended to further
specific policy goals should be assigned to the tier of government which is in charge of providing that
service.
Manage increases on aggregate national expenditures. While in theory decentralization could be
considered neutral in terms of expenditures, in practice Chile should be prepared for an increase in overall
national public expenditures. This is specially the case if decentralization implies funding underprovided
key public services in lagging areas. Chile needs to find its own boundaries and priorities in implementing
a fiscal decentralization plan at the intermediate level of government.
1
Fiscal decentralization of regional
governments – the case of Colombia
prepared under the World Bank TA RAS for Chile1
1 The note for Colombia was written by Juan Gonzalo Zapata
2
Índice
Contexto y breve revisión histórica ........................................................................................................... 3
Descentralización en Colombia .................................................................................................................. 5
Competencias de departamentos y municipios ........................................................................................ 9
Transferencias Intergubernamentales Generales de la nación ............................................................. 19
Sistema General de Participaciones ........................................................................................................ 19
Sistema General de Regalías ................................................................................................................... 22
Deuda y sostenibilidad fiscal .................................................................................................................... 26
Balance de la Descentralización en Colombia: Ajustes sobre la marcha ............................................. 29
3
Contexto y breve revisión histórica
Desde mediados del siglo XIX los niveles intermedios de gobierno en Colombia han sido
importantes en términos fiscales y han tenido autotomía administrativa y política. Esto se explica
porque, si bien este país ha sido marcadamente centralista, tuvo un periodo largo en donde,
inspirado en ideas liberales, se abrió el camino para la expedición de tres constituciones de corte
federal. Las constituciones de 1853, 1858 y 1863, en un proceso lento pero persistente, crearon en
total 9 estados. Estos estados se crearon a partir de las anteriores provincias heredadas del largo
periodo colonial. En la década de los años 50 del siglo XIX las 42 provincias se agruparon y se les
dio autonomía plena en los ámbitos políticos, económicos y sociales.2
Ya para la década de los años sesenta, en el marco de la Constitución de Rionegro de 1863, que
funda los Estados Unidos de Colombia, los anteriores estados se convierten en estados soberanos
en donde cada uno tenía su asamblea legislativa, tenía su ejército, creaba sus propios impuestos y
priorizaba el gasto público que ejecutaba, entre muchas funciones más. Era un modelo federal muy
cercano a una confederación. La autonomía de estos estados era muy amplia; por ejemplo, algunos
de ellos deciden abolir la pena de muerte con una pena máxima de 10 años. Por esto, las relaciones
con el gobierno nacional eran complejas pues cada estado tenía un voto para la elección
presidencial y gran parte del poder se ejercía desde el Congreso, en donde los estados tenían una
alta representación. Además, cada estado nombraba su presidente, tenía asamblea legislativa y en
algunos de ellos nombraban sus mandatarios locales por voto calificado. Si bien no es del caso
mencionar las duras confrontaciones entre conservadores y liberales, es necesario recordar que la
agenda pública estaba signada por el papel de la religión, por la reforma educativa, por la
distribución de algunos impuestos nacionales con los mencionados estados; por ejemplo, la renta
de la producción y comercialización de las salinas, y por la difícil puesta en marcha de proyectos
nacionales. El mejor ejemplo de esto último fueron los intentos de construir ferrocarriles y otros
numerosos esfuerzos adelantados tanto por los estados soberanos como por el gobierno nacional.
De otro lado, la independencia de España no cambió la estructura tributaria existente. La mayoría
de los impuestos al consumo se mantuvieron e inclusive buena parte de los monopolios coloniales
aún estaban en la lista de los gravámenes departamentales vigentes. Esto es bien importante, puesto
que el monopolio del aguardiente, los ingresos por juegos de suerte y azar y del degüello mayor y
menor, entre otros, han sido importantes para las finanzas departamentales desde que estos fueron
creados. A pesar de todos los cambios políticos producto de las guerras civiles y nuevas
constituciones, estos impuestos se han mantenido en el tiempo. Es más, a finales de siglo XIX
cuando los estados soberanos se degradan y se convierten en departamentos, varios de sus tributos
mencionados los incorpora el gobierno nacional y su peso dentro del total de ingresos fue
importante.
2 Zapata, G. J.G. Reforma radical en el Estado de Santander, 1850-1885. Bogotá: Universidad del Rosario, 2015.
4
Aunque es conocido que este periodo federal termina con la expedición de la constitución de 1886,
que era muy centralista, buena parte del desarrollo institucional que se adelantó durante el periodo
federal se mantuvo en los años siguientes. Los estados soberanos pasaron a ser departamentos, los
gobernadores eran designados por el gobierno nacional, y estos a su vez nombraban a los alcaldes.
Si bien la autonomía política del modelo federal murió, se mantuvo la misma estructura de las
secretarías (ministerios) sectoriales (salud, educación, vías, etc.). Por supuesto, los ejércitos de los
estados se acabaron y las asambleas no tenían funciones legislativas mayores, ya que no expedían
leyes sino ordenanzas con un alcance mucho más limitado.
Es el momento de mencionar que el primer esfuerzo de descentralización en Colombia fue a
mediados del siglo XIX. Se dio durante el gobierno de José Hilario López, cuando en 1850 su
secretario Manuel Murillo Toro descentralizó en favor de las provincias varios de los impuestos
nacionales. Esto con el fin de agilizar su cobro y darles más autonomía y poder a los mandatarios
territoriales. Desde lo fiscal, se buscaba además que el gobierno nacional se concentrara en el
cobro de pocos impuestos y, que las provincias pusieran en marcha el cobro del impuesto directo.
Por explicarlo en forma resumida, este impuesto era una combinación de impuesto de renta y de
impuesto a la propiedad de acuerdo con parámetros actuales. Por ejemplo, en el estado de
Santander, la autoridad entregaba una declaración de bienes a la persona llamada riqueza gravada,
y a partir de esta declaración se le aplicaba una tarifa cercana al 1% anual. Era un sistema de cobro
elaborado pues la persona podía solicitar una revisión de la declaración de su riqueza gravada y
existía una autoridad encargada de dicha revisión. Además, las alcaldías, llamadas en Santander
distritos, decidían la tarifa a aplicar sobre la riqueza gravada, ver Zapata (2016).3 En este impuesto
muchos de los líderes del partido liberal que apoyaban el modelo federal, centraron muchas de las
esperanzas de autonomía fiscal de los gobiernos federales.
Más adelante, durante el gobierno del general Rafael Reyes a comienzos del siglo XX, varios
departamentos se escindieron, con lo cual se crearon nuevos departamentos. Se llegó así, a un total
de 15 y casi al mismo tiempo se crearon las intendencias y comisarias para los territorios nacionales
poco poblados y alejados del centro. Estos fueron administrados desde el nivel central por una
entidad pública y un departamento administrativo nacional. Ya durante el siglo XX los
departamentos encontraron en el monopolio de los licores y en sus loterías sus principales fuentes
de recursos. Luego, la explotación del chance y el impuesto a los vehículos automotores, entre
otros tributos tomaron relevancia. Se ha criticado que estos impuestos al ocio son regresivos, que
tienen cuño colonial y que sus bases gravables son poco dinámicas. Este tema, sin embargo, por
lo pronto lo dejaremos de lado.
De lo anterior queda en claro que, desde el siglo XIX, los departamentos son importantes en la
vida fiscal y financiera del sector público colombiano. También que estos siempre han tenido
fuentes propias de recursos y han tenido claridad en las funciones que les competían. A pesar de
lo anterior, a lo largo del siglo XX los departamentos pierden relevancia al interior de la vida
3 Zapata, J. G. (2015). Caps. 2 y 3. Ibid.
5
pública por varias razones. Primero, sus fuentes de recursos propias perdieron fuerza; segundo, los
impuestos nacionales crecieron notablemente y desplazaron en términos relativos a los impuestos
territoriales. Tercero, la descentralización, que comenzó en la década de los años noventa del siglo
XX, inicialmente se concentró en los municipios y el marco legal que se desarrolló favoreció su
financiamiento, tanto sus recursos propios como transferidos.
Descentralización en Colombia
En los años ochenta del siglo XX, una serie larga de paros cívicos eran la expresión de las regiones.
La mayoría de estos paros no tenían reivindicaciones políticas y eran más sociales, en especial por
la falta de servicios públicos. Acueductos, interconexión eléctrica y vías eran los principales temas
(Maldonado: 2012).4 En este sentido la descentralización fue en gran parte, la respuesta política a
las demandas que comenzaron en las regiones. Las demandas venían desde abajo pues se
identificaban como malos o inoperantes a los alcaldes elegidos directamente por los gobernadores.
El descredito de la vida política local era muy alto. Sin embargo, con la posterior elección popular
de alcaldes los paros cívicos disminuyeron rápidamente.
De otra parte, el proceso de descentralización tuvo antecedentes técnicos importantes en los años
80, antes de los cambios normativos centrales. El informe Bird- Wiesner, una misión de expertos
nacionales e internacionales presentó sus resultados en 1979, demostró que el 84.6% de los
ingresos del Estado estaban concentrados en el nivel central, mientras que solo 9.7% en los
departamentos, intendencias y comisarias.5 Con este muy bajo nivel de gasto territorial era muy
difícil responder a las demandas locales. Una de las recomendaciones del informe fue de fortalecer
las fuentes de recursos territoriales. Es así como se expiden varias leyes que fortalecen los fiscos
municipales; la Ley 14 de 1983 mejoró el recaudo de impuestos como el de timbre nacional,
licores, cigarrillos. Esta ley lo que hizo fue aumentar las tasas y las bases gravables. Mas adelante
en 1995, se crea la sobretasa a la gasolina y los municipios eran los encargados de decidir su tarifa;
sin embargo, la legislación posterior volvió obligatorio el cobro del 20% en todos los municipios.
También en 1998 con la expedición de la ley 488 se creó el impuesto a los vehículos automotores
que reemplazó al de Circulación y Transito, el de timbre sobre vehículos automotores y el impuesto
unificado de vehículos que había creado Bogotá. Con esto se aumentó la base gravable y es el
ministerio del transporte el que decide el precio de los vehículos nuevos y usados (base gravable)
para su cobro. Su recaudo se destina mayoritariamente a los departamentos. A su vez, más
adelante, con la creación del Impuesto al Valor Agregado (IVA), que reemplazó al anterior
impuesto a las ventas, aumentó al mismo tiempo la transferencia en favor de los municipios.
Debe mencionarse que un artículo transitorio de la Constitución Nacional obliga la expedición de
un nuevo estatuto tributario territorial; sin embargo, después de 28 años este estatuto aún no se ha
4 Maldonado, A. Los límites de la descentralización territorial: el caso de Colombia 1991- 2008. Tesis de Doctorado. Universidad
Complutense. Madrid. 2011. 5 DNP (1981). Las finanzas intergubernamentales en Colombia: informe de la Misión Wiesner-Bird de finanzas
intergubernamentales. Bogotá.
6
expedido. El gobierno nacional ha utilizado las reformas tributarias nacionales para mejorar, poco
a poco, el recaudo de los ingresos corrientes o propios de departamentos y municipios al incluir
siempre algunos artículos al respecto. Por ejemplo, la ley 1943 incluyó un aumento importante en
la tarifa del impuesto a los cigarrillos. Esta tarifa se triplica en un periodo de sólo 3 años. Una de
las últimas reformas tributarias nacionales, la mencionada ley 1943 de 2018, creo la Comisión de
Estudio del Sistema Tributario Territorial. Esta comisión se reúne desde el mes de junio y se espera
que sus recomendaciones estén para mediados del 2020. Estas recomendaciones, no obligan su
adopción o la presentación de un proyecto de ley, pero es la primera vez que una comisión de este
tipo se concentra en analizar los ingresos territoriales.
Un paso importante para la descentralización política se dio con el Acto Legislativo 1 de 1986 que
estableció la elección de alcaldes, anteriormente eran funcionarios de libre nombramiento y
remoción por parte de los gobernadores. Esta decisión contribuyó a ampliar la democracia
representativa en el país. Para este mismo año hubo un cambio importante en la distribución de
funciones de las entidades territoriales, especialmente de los municipios. La Ley 12 de 1986, al
mismo tiempo que aumentó la participación de los municipios del recién creado impuesto al valor
agregado (IVA), se les asignó más competencias en la administración de servicios en el sector
salud, educación, desarrollo agropecuario, desarrollo urbano y saneamiento básico. Este salto no
fue exento de críticas pues no se crearon planes o mecanismos claros de implementación que
ayudaran a los territorios a asumir estas funciones. Adicionalmente, se criticó que no se
diferenciaran las funciones de acuerdo con criterios como el número de habitantes, nivel de
ruralidad o generación de recursos propios, entre muchos más. La mayoría de las funciones
descentralizadas pasaron del nivel nacional al municipal, en especial en el sector salud. En esta
coyuntura no se entregaron funciones a los departamentos.
El proceso de descentralización se volvió más integral con la expedición de la Constitución
Nacional de 1991. Esta constitución permitió que los departamentos lograran desarrollarse como
entidades autónomas en lo político, lo administrativo y lo fiscal en forma paralela a como se hizo
con los municipios. Se decidió que las autoridades departamentales se eligieran por voto popular.
Hay que tener presente que durante los debates de la Asamblea Constituyente se expresaron dos
líneas sobre la elección popular de gobernadores. Los que querían que la descentralización fuera
únicamente municipal y los que querían un tercer nivel de gobierno fuerte. Los principales reparos
para extender la descentralización a los departamentos eran fiscales; se entendía que no se disponía
de los recursos necesarios para financiar tres niveles de gobierno. Sin embargo, las realidades
políticas, los departamentos siempre han tenido presencia en la vida nacional, permitieron que esta
decisión no tuviera fuerte oposición en la Asamblea Constituyente. Como veremos, esta decisión
explica el gran aumento de las transferencias intergubernamentales en favor de departamentos y
municipios.
La elección de gobernadores por voto popular se entendió como un complemento de la elección
municipal. Además, las anteriores intendencias y comisarías se volvieron departamentos con
iguales funciones y responsabilidades. Se llegó así a un total de 32 departamentos, con lo cual en
7
Colombia se formalizó un proceso de descentralización con tres niveles de gobierno fuertes. Falleti
argumenta que en Colombia se dio muy fácil la descentralización política pero que la cesión de
funciones y recursos fue mucho más lenta.6 Esto generó problemas en las relaciones entre el
gobierno nacional y los mandatarios de los territorios.7 El proceso de descentralización fue
complejo pues el gobierno nacional cerró varias entidades descentralizadas nacionales para
seguidamente ceder las funciones a los territorios. En especial se debe mencionar al sector agua
potable y saneamiento en donde una entidad era la encargada de construir los acueductos. Esta
entidad, el Instituto de Fomento Municipal (INSFOPAL) tenía muy malos resultados. Hay ejemplo
en el sector agrícola y en la construcción de vías, etc. El proceso de cesión de funciones y recursos
tuvo con la Constitución Nacional de 1991 un salto cualitativo pues la descentralización fue uno
de los temas ganadores con la nueva carta fundamental.
Este cambio constitucional hizo que el aumento de las transferencias intergubernamentales, junto
con el de las regalías por la explotación de recursos naturales no renovables, tuvieran en cuenta a
los dos niveles de gobierno territoriales. La distribución de estos recursos favoreció a los gobiernos
subnacionales. De esta manera se reconoció el gasto social como prioritario, así como la
destinación condicionada de los recursos de inversión en sectores como salud, educación y
saneamiento básico. En pocas palabras los territorios y la descentralización fueron los ganadores
con el nuevo marco normativo producto de la CN de 1991. Se desarrolló igualmente una nueva
institucionalidad por parte del gobierno nacional encargada de administrar los recursos
transferidos, de hacer seguimiento de la planeación en los territorios e intervenir mediante
convenios de desempeño en las entidades territoriales con problemas financieros críticos, ley 358
junto con la ley 550 de 1999, que es una ley de quiebras que tiene su capítulo para el sector público.
Esta ley permite reestructurar sus pasivos. Cuando un gobierno territorial, departamento o
municipio, tiene problemas financieros puede acogerse a cualquiera de estas dos leyes. Para esto
debe firmar un convenio de desempeño o un acuerdo de reestructuración con la Dirección de
Apoyo Fiscal (DAF) del Ministerio de Hacienda. Estos convenios y acuerdos son ortodoxos,
puesto que obligan a que el gobierno subnacional mejore sus ingresos, controle sus gastos de
funcionamiento o generales, limite la inversión en infraestructura y, cierre o reorganice sus
empresas de servicios públicos o cualquier entidad de su jurisdicción. Las metas son anuales y se
hace un seguimiento de ellas permanente. A su vez la firma y el cumplimiento de los convenios
de desempeño les permite acceder a recursos frescos de los bancos para refinanciarse. Sin la firma
de los convenios de desempeño no es posible acceder al crédito, ver Caja 1.
Caja 1 - Reestructuración de Pasivos y Convenios de Desempeño de los Territorios
Los departamentos y municipios se encuentran en programas de Saneamiento Fiscal y Financiero,
siempre y cuando tengan suscritos convenios o planes de desempeño en el marco de la ley 358 de
6 Falletti, T. A sequential theory of decentralization and its effects on the intergovernmental balance of power: latin american cases
in comparative perspective. Working Paper # 314. Kellog Institute. July 2004. 7 En este trabajo cuando se utiliza la palabra territorios se debe entender que son al tiempo los departamentos y municipios. Así los
mandatarios territoriales son los alcaldes y gobernadores.
8
1997 o suscriban acuerdos de reestructuración de pasivos, ley 550 de 1999. Estos programas de
saneamiento deben contar con el concepto favorable del Ministerio de Hacienda y Crédito, ley 617
de 2000, y es la dirección de Apoyo Fiscal (DAF) del Ministerio de Hacienda la encargada de
cumplir con la reestructuración o con los convenios. Veamos un resumen de estas dos figuras de
ajuste financiero para auxiliar a los territorios con problemas financieros.
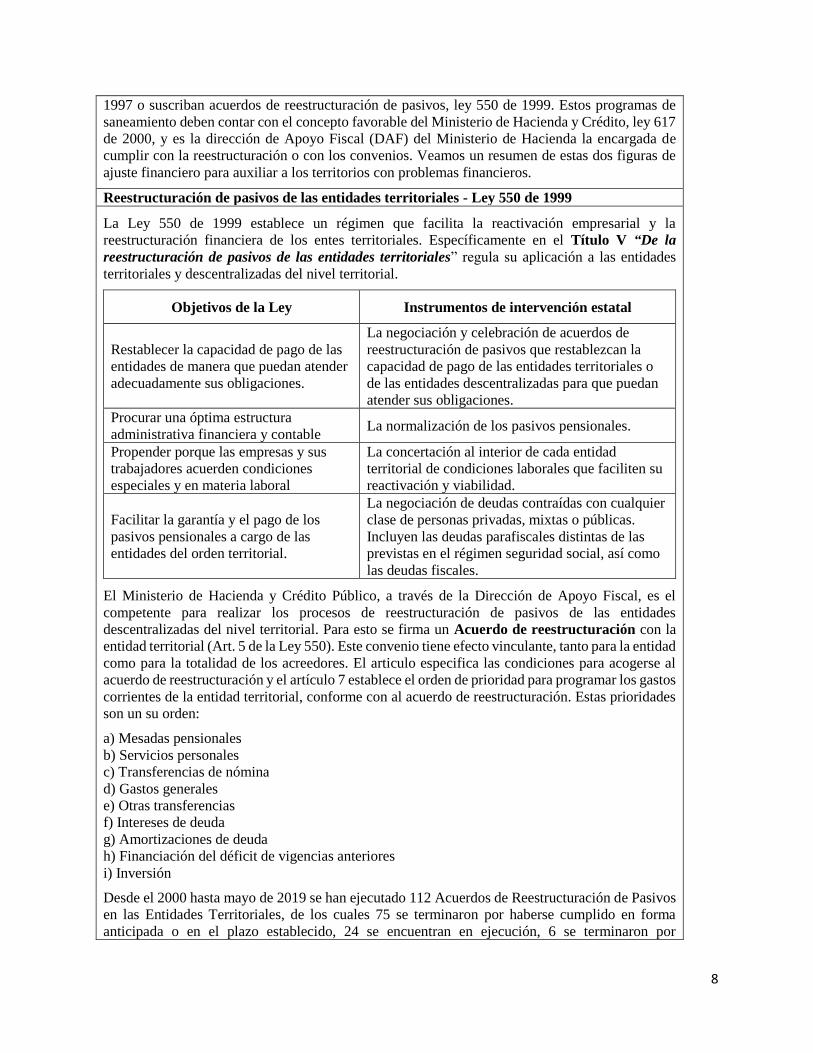
Reestructuración de pasivos de las entidades territoriales - Ley 550 de 1999
La Ley 550 de 1999 establece un régimen que facilita la reactivación empresarial y la
reestructuración financiera de los entes territoriales. Específicamente en el Título V “De la
reestructuración de pasivos de las entidades territoriales” regula su aplicación a las entidades
territoriales y descentralizadas del nivel territorial.
Objetivos de la Ley Instrumentos de intervención estatal
Restablecer la capacidad de pago de las
entidades de manera que puedan atender
adecuadamente sus obligaciones.
La negociación y celebración de acuerdos de
reestructuración de pasivos que restablezcan la
capacidad de pago de las entidades territoriales o
de las entidades descentralizadas para que puedan
atender sus obligaciones.
Procurar una óptima estructura
administrativa financiera y contable La normalización de los pasivos pensionales.
Propender porque las empresas y sus
trabajadores acuerden condiciones
especiales y en materia laboral
La concertación al interior de cada entidad
territorial de condiciones laborales que faciliten su
reactivación y viabilidad.
Facilitar la garantía y el pago de los
pasivos pensionales a cargo de las
entidades del orden territorial.
La negociación de deudas contraídas con cualquier
clase de personas privadas, mixtas o públicas.
Incluyen las deudas parafiscales distintas de las
previstas en el régimen seguridad social, así como
las deudas fiscales.
El Ministerio de Hacienda y Crédito Público, a través de la Dirección de Apoyo Fiscal, es el
competente para realizar los procesos de reestructuración de pasivos de las entidades
descentralizadas del nivel territorial. Para esto se firma un Acuerdo de reestructuración con la
entidad territorial (Art. 5 de la Ley 550). Este convenio tiene efecto vinculante, tanto para la entidad
como para la totalidad de los acreedores. El articulo especifica las condiciones para acogerse al
acuerdo de reestructuración y el artículo 7 establece el orden de prioridad para programar los gastos
corrientes de la entidad territorial, conforme con al acuerdo de reestructuración. Estas prioridades
son un su orden:
a) Mesadas pensionales
b) Servicios personales
c) Transferencias de nómina
d) Gastos generales
e) Otras transferencias
f) Intereses de deuda
g) Amortizaciones de deuda
h) Financiación del déficit de vigencias anteriores
i) Inversión
Desde el 2000 hasta mayo de 2019 se han ejecutado 112 Acuerdos de Reestructuración de Pasivos
en las Entidades Territoriales, de los cuales 75 se terminaron por haberse cumplido en forma
anticipada o en el plazo establecido, 24 se encuentran en ejecución, 6 se terminaron por
9
incumplimiento, 2 se encuentran en negociación y 5 no se suscribieron porque no se obtuvo la
votación requerida, fracaso la negociación o por no tener facultades del concejo municipal.
Convenios de Desempeño
Estos planes o convenios de desempeño son programas de ajuste fiscal, financiero y administrativo
que buscan restablecer la solidez económica y financiera de la entidad territorial. Buscan garantizar
la capacidad de pago de largo plazo y el mejoramiento de los indicadores de endeudamiento de las
entidades territoriales (artículo 7 – ley 358). Estos planes de desempeño incluyen medidas de
racionalización del gasto y el fortalecimiento de los ingresos propios. También obligan a tomar
decisiones como el cierre o la mejora de la gestión de las entidades descentralizadas del
departamento o municipio.
Los planes son ortodoxos, pue se hace un seguimiento periódico de las metas acordadas. Por esto
las entidades territoriales deberán enviar trimestralmente la información de la evolución de los
planes de desempeño a la DAF. Esta dirección evalúa el cumplimiento de dichos planes. Las
entidades que incumplan esta medida quedarán sujetas a las sanciones pertinentes. Estos planes
son de largo plazo y los mismos se mantienen vigentes hasta que la entidad territorial registre un
nivel de intereses/ahorro operacional menor o igual al 40%.
Sin el cumplimiento de los planes de desempeño, los departamentos y municipios no pueden
acceder a los recursos del crédito.
A continuación, se presentará el desarrollo que ha tenido este proceso en la definición de las
competencias asignadas a los departamentos y municipios; el comportamiento de las finanzas
públicas en los últimos 20 años; el funcionamiento de los sistemas de transferencias y, el
desempeño fiscal y al endeudamiento de las entidades territoriales. Como veremos, la legislación
que se expidió abarcó a los dos gobiernos subnacionales.
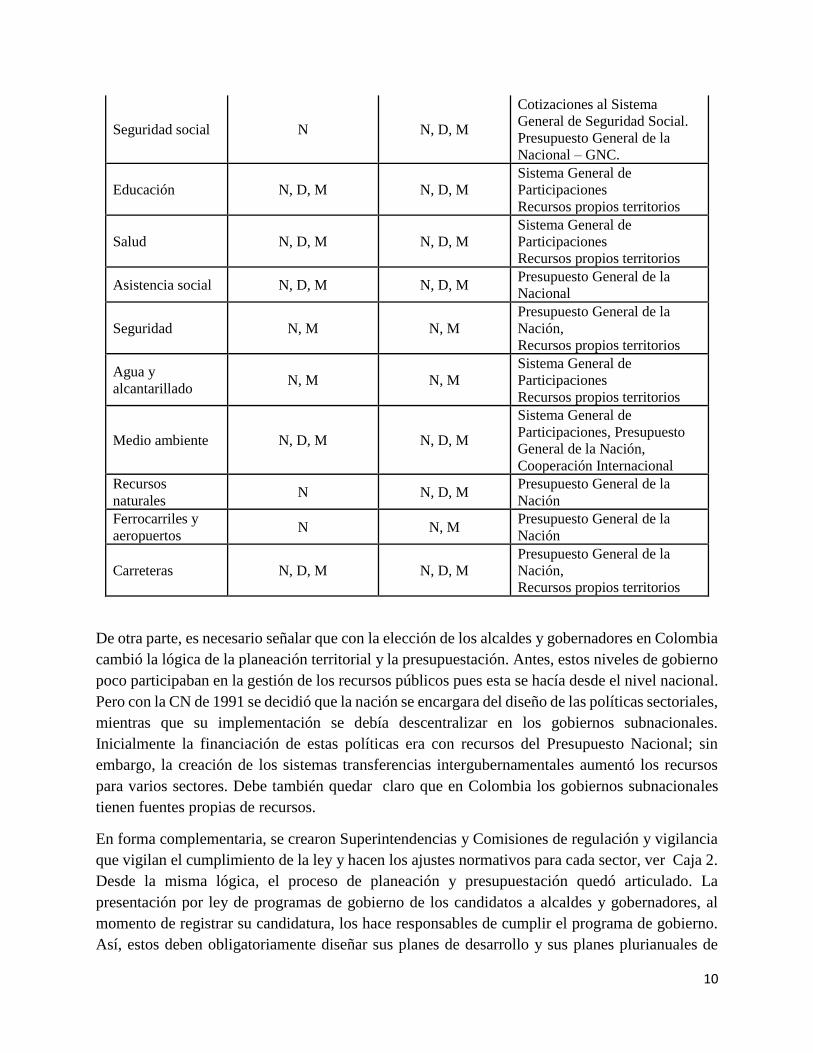
Competencias de departamentos y municipios
De acuerdo con lo señalado con anterioridad, la asignación de competencias a los departamentos
y municipios tuvo cambios importantes durante la década de los años 80. En general, la mayoría
de las funciones son compartidas entre los tres niveles de gobierno, en especial en los sectores de
salud y educación en donde se movilizan los mayores recursos y las nóminas públicas son muy
grandes; por ejemplo, en Colombia hay más de 300 mil maestros públicos. La tabla 1 nos muestra
la competencia de los gobiernos por sectores del gasto. La lógica que hay al compartir
responsabilidades es que el gobierno nacional es el encargado de diseñar las políticas sectoriales
y los gobiernos subnacionales los encargados de ejecutarlas. Sin embargo, dado que en Colombia
se demoró 20 años la expedición de la Ley Orgánica de Ordenamiento Territorial (LOOT),
estipulada en la CN de 1991, lo que se dio fue un proceso en donde las leyes sectoriales, al tiempo
que distribuían las funciones y recursos, creaban su propio ordenamiento territorial sectorial.
Tabla 1 – Funciones y responsabilidades por sectores del Gasto
Función Responsabilidad de
política y control
Responsabilidad
de provisión
Financiación
10
Seguridad social N N, D, M
Cotizaciones al Sistema
General de Seguridad Social.
Presupuesto General de la
Nacional – GNC.
Educación N, D, M N, D, M
Sistema General de
Participaciones
Recursos propios territorios
Salud N, D, M N, D, M
Sistema General de
Participaciones
Recursos propios territorios
Asistencia social N, D, M N, D, M Presupuesto General de la
Nacional
Seguridad N, M N, M
Presupuesto General de la
Nación,
Recursos propios territorios
Agua y
alcantarillado N, M N, M
Sistema General de
Participaciones
Recursos propios territorios
Medio ambiente N, D, M N, D, M
Sistema General de
Participaciones, Presupuesto
General de la Nación,
Cooperación Internacional
Recursos
naturales N N, D, M
Presupuesto General de la
Nación
Ferrocarriles y
aeropuertos N N, M
Presupuesto General de la
Nación
Carreteras N, D, M N, D, M
Presupuesto General de la
Nación,
Recursos propios territorios
De otra parte, es necesario señalar que con la elección de los alcaldes y gobernadores en Colombia
cambió la lógica de la planeación territorial y la presupuestación. Antes, estos niveles de gobierno
poco participaban en la gestión de los recursos públicos pues esta se hacía desde el nivel nacional.
Pero con la CN de 1991 se decidió que la nación se encargara del diseño de las políticas sectoriales,
mientras que su implementación se debía descentralizar en los gobiernos subnacionales.
Inicialmente la financiación de estas políticas era con recursos del Presupuesto Nacional; sin
embargo, la creación de los sistemas transferencias intergubernamentales aumentó los recursos
para varios sectores. Debe también quedar claro que en Colombia los gobiernos subnacionales
tienen fuentes propias de recursos.
En forma complementaria, se crearon Superintendencias y Comisiones de regulación y vigilancia
que vigilan el cumplimiento de la ley y hacen los ajustes normativos para cada sector, ver Caja 2.
Desde la misma lógica, el proceso de planeación y presupuestación quedó articulado. La
presentación por ley de programas de gobierno de los candidatos a alcaldes y gobernadores, al
momento de registrar su candidatura, los hace responsables de cumplir el programa de gobierno.
Así, estos deben obligatoriamente diseñar sus planes de desarrollo y sus planes plurianuales de
11
inversión para garantizar el cumplimiento de estos programas. Estos presupuestos plurianuales de
inversión los deben ejecutar en sus presupuestos anuales. Si esto no se cumple pueden inclusive
ser revocados de su mandato; esto último ha ocurrido en algunos casos, ver tabla 2.8
Caja 2 – Superintendencias y Comisiones de Regulación en Colombia Comisiones de regulación
La ley 142 de 1994, creó las comisiones de regulación con el fin de desarrollar la intervención estatal
necesaria, tanto en el ámbito económico, como en el social. Así, estas se encargan por el correcto
desarrollo de la competencia y por los derechos de los usuarios.
De esta forma, las comisiones son unidades administrativas especiales que cuentan con independencia
en términos administrativos, técnicos y patrimoniales. Sin embargo, cada una de ellas se encuentra
adscrita al ministerio que corresponda a la actividad sobre la que intervienen.
La delegación de las funciones de las comisiones de regulación la realiza el presidente de la república,
en ejercicio de su poder, durante el acto de creación. Las principales Comisiones de regulación en
Colombia son: La Comisión de Regulación de las Comunicaciones (CRC), la Comisión de Agua Potable
y Saneamiento Básico (CRA), la Comisión de Regulación en Salud (CRES) y la Comisión de Regulación
de Energía y Gas (CREG).
Superintendencias
Las superintendencias se crean con la Constitución Nacional de 1991, donde se creó la figura dentro de
la rama ejecutiva. Las funciones de las superintendencias, en términos generales, están definidas por el
artículo 66 de la ley 498 de 1998. Estas realizan labores de inspección y vigilancia según la ley o según
lo ordene el presidente de la república.
Las superintendencias se encuentran adscritas a la rama de poder ejecutiva y su función es inspeccionar
y vigilar determinadas actividades económicas y de servicios. Estas funciones se definen por medio de
la actividad que cubran y pueden llevar a cabo labores de auditoria, vigilancia e incluso impartir
sanciones y penalidades a quienes no cumplan con lo estipulado en la ley. Así, estos organismos realizan
funciones de control que resultan claves para Colombia.
En momento hay 10 superintendencias: notariado y registro, servicios públicos domiciliarios, industria
y comercio, salud, economía solidaria, puertos y transporte, financiera, subsidio familiar, puertos y
transporte y, seguridad privada.
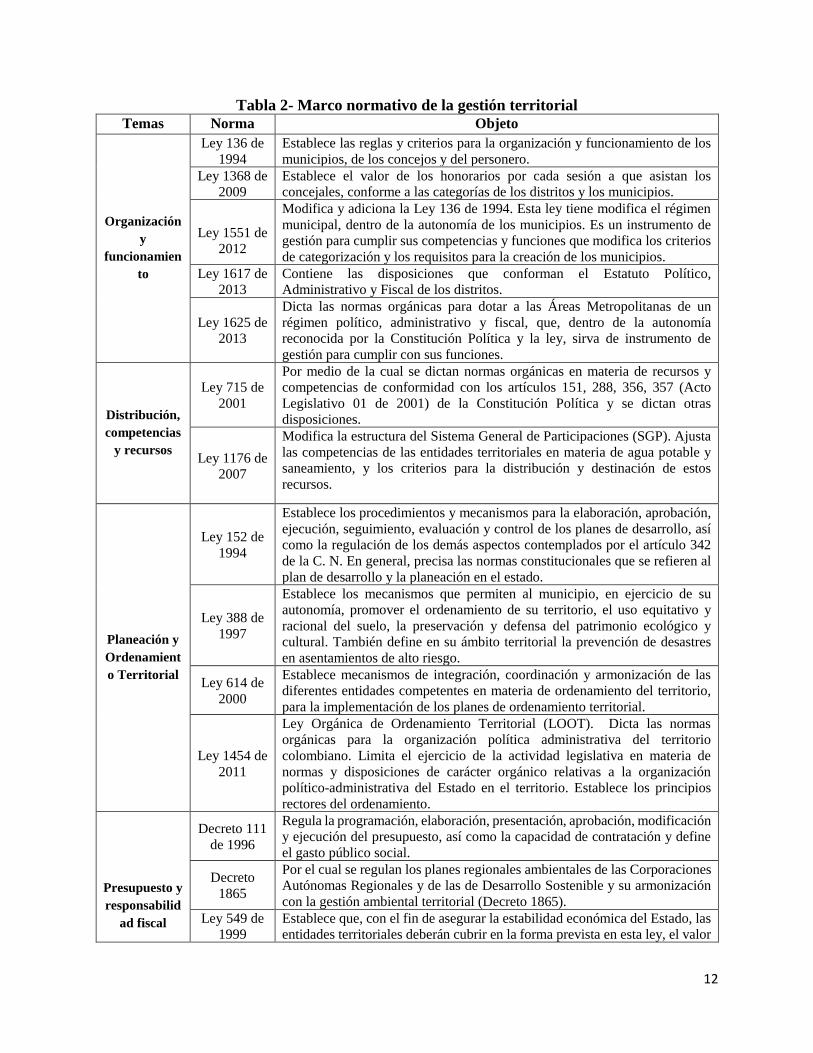
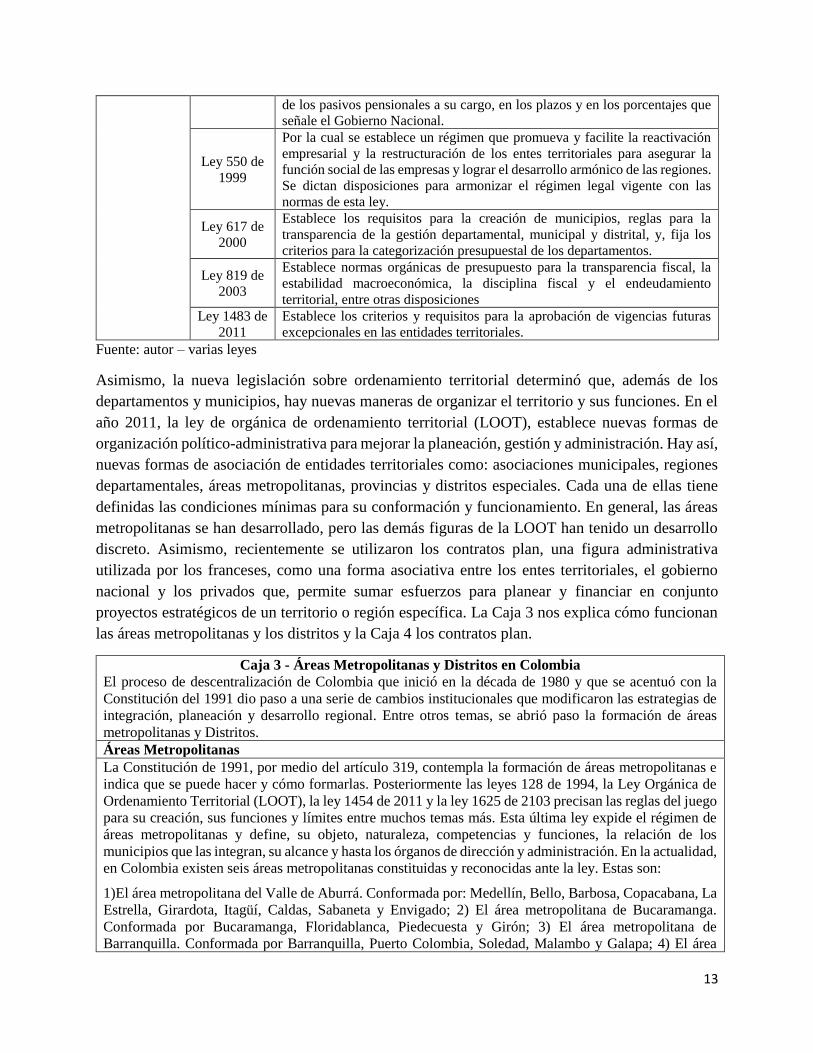
Por su parte, la tabla 2 nos muestra un resumen de las principales leyes expedidas en el marco de
la descentralización. En primer lugar, queda en claro que fue un proceso acelerado en donde se
expidieron numerosas leyes que cambiaron en forma radical la gestión de los recursos públicos y
la relación entre niveles de gobierno. Segundo, vemos como la planeación en los territorios se
vuelven mucho más compleja, ya que queda relacionada con el proceso político, en específico el
electoral. Esto incluye la expedición de planes de ordenamiento territorial por parte de los
municipios. Estos planes son los que definen el uso del suelo en los municipios. Tercero, aparece
una profusa legislación sobre finanzas y responsabilidad fiscal. Estas leyes limitan el acceso a la
deuda, definen limites a los gastos de funcionamiento y obligan a una planeación financiera de
largo plazo.
8 Velásquez, F. y González, E. ¿Qué ha pasado con la participación ciudadana en Colombia? CIDER – Uniandes y Fundación
Corona. Bogotá. 2003.
12
Tabla 2- Marco normativo de la gestión territorial
Temas Norma Objeto
Organización
y
funcionamien
to
Ley 136 de
1994
Establece las reglas y criterios para la organización y funcionamiento de los
municipios, de los concejos y del personero.
Ley 1368 de
2009
Establece el valor de los honorarios por cada sesión a que asistan los
concejales, conforme a las categorías de los distritos y los municipios.
Ley 1551 de
2012
Modifica y adiciona la Ley 136 de 1994. Esta ley tiene modifica el régimen
municipal, dentro de la autonomía de los municipios. Es un instrumento de
gestión para cumplir sus competencias y funciones que modifica los criterios
de categorización y los requisitos para la creación de los municipios.
Ley 1617 de
2013
Contiene las disposiciones que conforman el Estatuto Político,
Administrativo y Fiscal de los distritos.
Ley 1625 de
2013
Dicta las normas orgánicas para dotar a las Áreas Metropolitanas de un
régimen político, administrativo y fiscal, que, dentro de la autonomía
reconocida por la Constitución Política y la ley, sirva de instrumento de
gestión para cumplir con sus funciones.
Distribución,
competencias
y recursos
Ley 715 de
2001
Por medio de la cual se dictan normas orgánicas en materia de recursos y
competencias de conformidad con los artículos 151, 288, 356, 357 (Acto
Legislativo 01 de 2001) de la Constitución Política y se dictan otras
disposiciones.
Ley 1176 de
2007
Modifica la estructura del Sistema General de Participaciones (SGP). Ajusta
las competencias de las entidades territoriales en materia de agua potable y
saneamiento, y los criterios para la distribución y destinación de estos
recursos.
Planeación y
Ordenamient
o Territorial
Ley 152 de
1994
Establece los procedimientos y mecanismos para la elaboración, aprobación,
ejecución, seguimiento, evaluación y control de los planes de desarrollo, así
como la regulación de los demás aspectos contemplados por el artículo 342
de la C. N. En general, precisa las normas constitucionales que se refieren al
plan de desarrollo y la planeación en el estado.
Ley 388 de
1997
Establece los mecanismos que permiten al municipio, en ejercicio de su
autonomía, promover el ordenamiento de su territorio, el uso equitativo y
racional del suelo, la preservación y defensa del patrimonio ecológico y
cultural. También define en su ámbito territorial la prevención de desastres
en asentamientos de alto riesgo.
Ley 614 de
2000
Establece mecanismos de integración, coordinación y armonización de las
diferentes entidades competentes en materia de ordenamiento del territorio,
para la implementación de los planes de ordenamiento territorial.
Ley 1454 de
2011
Ley Orgánica de Ordenamiento Territorial (LOOT). Dicta las normas
orgánicas para la organización política administrativa del territorio
colombiano. Limita el ejercicio de la actividad legislativa en materia de
normas y disposiciones de carácter orgánico relativas a la organización
político-administrativa del Estado en el territorio. Establece los principios
rectores del ordenamiento.
Presupuesto y
responsabilid
ad fiscal
Decreto 111
de 1996
Regula la programación, elaboración, presentación, aprobación, modificación
y ejecución del presupuesto, así como la capacidad de contratación y define
el gasto público social.
Decreto
1865
Por el cual se regulan los planes regionales ambientales de las Corporaciones
Autónomas Regionales y de las de Desarrollo Sostenible y su armonización
con la gestión ambiental territorial (Decreto 1865).
Ley 549 de
1999
Establece que, con el fin de asegurar la estabilidad económica del Estado, las
entidades territoriales deberán cubrir en la forma prevista en esta ley, el valor
13
de los pasivos pensionales a su cargo, en los plazos y en los porcentajes que
señale el Gobierno Nacional.
Ley 550 de
1999
Por la cual se establece un régimen que promueva y facilite la reactivación
empresarial y la restructuración de los entes territoriales para asegurar la
función social de las empresas y lograr el desarrollo armónico de las regiones.
Se dictan disposiciones para armonizar el régimen legal vigente con las
normas de esta ley.
Ley 617 de
2000
Establece los requisitos para la creación de municipios, reglas para la
transparencia de la gestión departamental, municipal y distrital, y, fija los
criterios para la categorización presupuestal de los departamentos.
Ley 819 de
2003
Establece normas orgánicas de presupuesto para la transparencia fiscal, la
estabilidad macroeconómica, la disciplina fiscal y el endeudamiento
territorial, entre otras disposiciones
Ley 1483 de
2011
Establece los criterios y requisitos para la aprobación de vigencias futuras
excepcionales en las entidades territoriales.
Fuente: autor – varias leyes
Asimismo, la nueva legislación sobre ordenamiento territorial determinó que, además de los
departamentos y municipios, hay nuevas maneras de organizar el territorio y sus funciones. En el
año 2011, la ley de orgánica de ordenamiento territorial (LOOT), establece nuevas formas de
organización político-administrativa para mejorar la planeación, gestión y administración. Hay así,
nuevas formas de asociación de entidades territoriales como: asociaciones municipales, regiones
departamentales, áreas metropolitanas, provincias y distritos especiales. Cada una de ellas tiene
definidas las condiciones mínimas para su conformación y funcionamiento. En general, las áreas
metropolitanas se han desarrollado, pero las demás figuras de la LOOT han tenido un desarrollo
discreto. Asimismo, recientemente se utilizaron los contratos plan, una figura administrativa
utilizada por los franceses, como una forma asociativa entre los entes territoriales, el gobierno
nacional y los privados que, permite sumar esfuerzos para planear y financiar en conjunto
proyectos estratégicos de un territorio o región específica. La Caja 3 nos explica cómo funcionan
las áreas metropolitanas y los distritos y la Caja 4 los contratos plan.
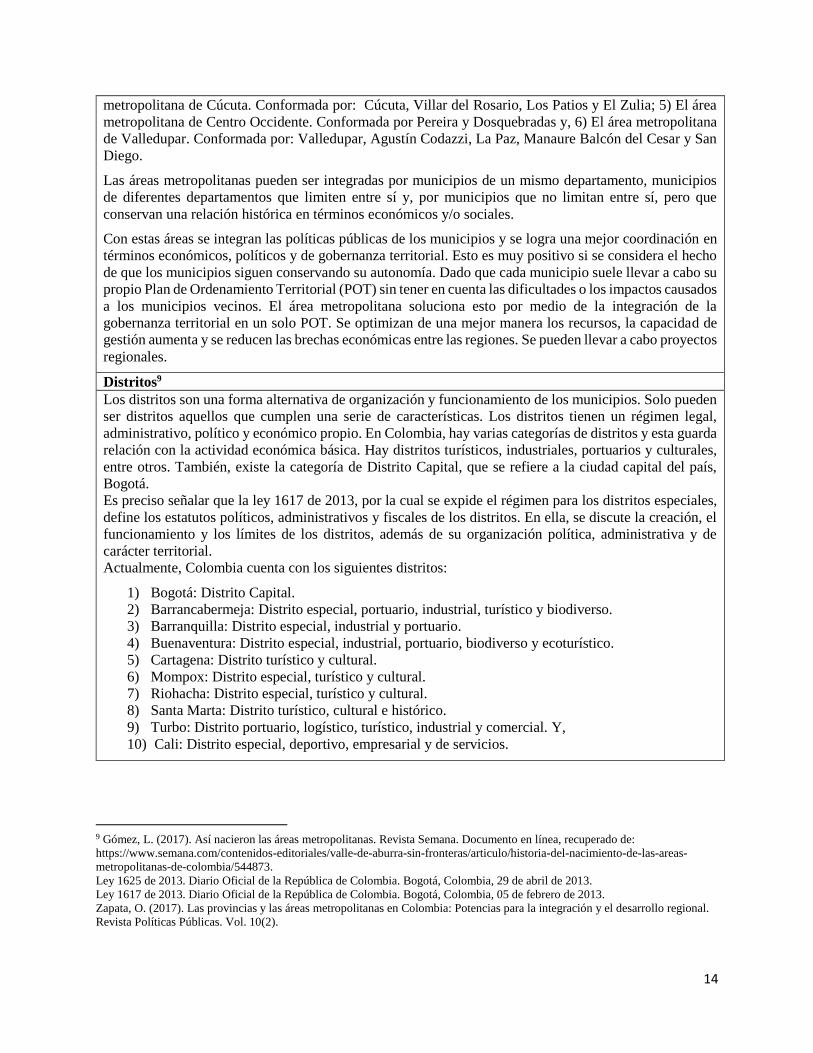
Caja 3 - Áreas Metropolitanas y Distritos en Colombia
El proceso de descentralización de Colombia que inició en la década de 1980 y que se acentuó con la
Constitución del 1991 dio paso a una serie de cambios institucionales que modificaron las estrategias de
integración, planeación y desarrollo regional. Entre otros temas, se abrió paso la formación de áreas
metropolitanas y Distritos.
Áreas Metropolitanas
La Constitución de 1991, por medio del artículo 319, contempla la formación de áreas metropolitanas e
indica que se puede hacer y cómo formarlas. Posteriormente las leyes 128 de 1994, la Ley Orgánica de
Ordenamiento Territorial (LOOT), la ley 1454 de 2011 y la ley 1625 de 2103 precisan las reglas del juego
para su creación, sus funciones y límites entre muchos temas más. Esta última ley expide el régimen de
áreas metropolitanas y define, su objeto, naturaleza, competencias y funciones, la relación de los
municipios que las integran, su alcance y hasta los órganos de dirección y administración. En la actualidad,
en Colombia existen seis áreas metropolitanas constituidas y reconocidas ante la ley. Estas son:
1)El área metropolitana del Valle de Aburrá. Conformada por: Medellín, Bello, Barbosa, Copacabana, La
Estrella, Girardota, Itagüí, Caldas, Sabaneta y Envigado; 2) El área metropolitana de Bucaramanga.
Conformada por Bucaramanga, Floridablanca, Piedecuesta y Girón; 3) El área metropolitana de
Barranquilla. Conformada por Barranquilla, Puerto Colombia, Soledad, Malambo y Galapa; 4) El área
14
metropolitana de Cúcuta. Conformada por: Cúcuta, Villar del Rosario, Los Patios y El Zulia; 5) El área
metropolitana de Centro Occidente. Conformada por Pereira y Dosquebradas y, 6) El área metropolitana
de Valledupar. Conformada por: Valledupar, Agustín Codazzi, La Paz, Manaure Balcón del Cesar y San
Diego.
Las áreas metropolitanas pueden ser integradas por municipios de un mismo departamento, municipios
de diferentes departamentos que limiten entre sí y, por municipios que no limitan entre sí, pero que
conservan una relación histórica en términos económicos y/o sociales.
Con estas áreas se integran las políticas públicas de los municipios y se logra una mejor coordinación en
términos económicos, políticos y de gobernanza territorial. Esto es muy positivo si se considera el hecho
de que los municipios siguen conservando su autonomía. Dado que cada municipio suele llevar a cabo su
propio Plan de Ordenamiento Territorial (POT) sin tener en cuenta las dificultades o los impactos causados
a los municipios vecinos. El área metropolitana soluciona esto por medio de la integración de la
gobernanza territorial en un solo POT. Se optimizan de una mejor manera los recursos, la capacidad de
gestión aumenta y se reducen las brechas económicas entre las regiones. Se pueden llevar a cabo proyectos
regionales.
Distritos9
Los distritos son una forma alternativa de organización y funcionamiento de los municipios. Solo pueden
ser distritos aquellos que cumplen una serie de características. Los distritos tienen un régimen legal,
administrativo, político y económico propio. En Colombia, hay varias categorías de distritos y esta guarda
relación con la actividad económica básica. Hay distritos turísticos, industriales, portuarios y culturales,
entre otros. También, existe la categoría de Distrito Capital, que se refiere a la ciudad capital del país,
Bogotá.
Es preciso señalar que la ley 1617 de 2013, por la cual se expide el régimen para los distritos especiales,
define los estatutos políticos, administrativos y fiscales de los distritos. En ella, se discute la creación, el
funcionamiento y los límites de los distritos, además de su organización política, administrativa y de
carácter territorial.
Actualmente, Colombia cuenta con los siguientes distritos:
1) Bogotá: Distrito Capital.
2) Barrancabermeja: Distrito especial, portuario, industrial, turístico y biodiverso.
3) Barranquilla: Distrito especial, industrial y portuario.
4) Buenaventura: Distrito especial, industrial, portuario, biodiverso y ecoturístico.
5) Cartagena: Distrito turístico y cultural.
6) Mompox: Distrito especial, turístico y cultural.
7) Riohacha: Distrito especial, turístico y cultural.
8) Santa Marta: Distrito turístico, cultural e histórico.
9) Turbo: Distrito portuario, logístico, turístico, industrial y comercial. Y,
10) Cali: Distrito especial, deportivo, empresarial y de servicios.
9 Gómez, L. (2017). Así nacieron las áreas metropolitanas. Revista Semana. Documento en línea, recuperado de:
https://www.semana.com/contenidos-editoriales/valle-de-aburra-sin-fronteras/articulo/historia-del-nacimiento-de-las-areas-
metropolitanas-de-colombia/544873.
Ley 1625 de 2013. Diario Oficial de la República de Colombia. Bogotá, Colombia, 29 de abril de 2013.
Ley 1617 de 2013. Diario Oficial de la República de Colombia. Bogotá, Colombia, 05 de febrero de 2013.
Zapata, O. (2017). Las provincias y las áreas metropolitanas en Colombia: Potencias para la integración y el desarrollo regional.
Revista Políticas Públicas. Vol. 10(2).
15
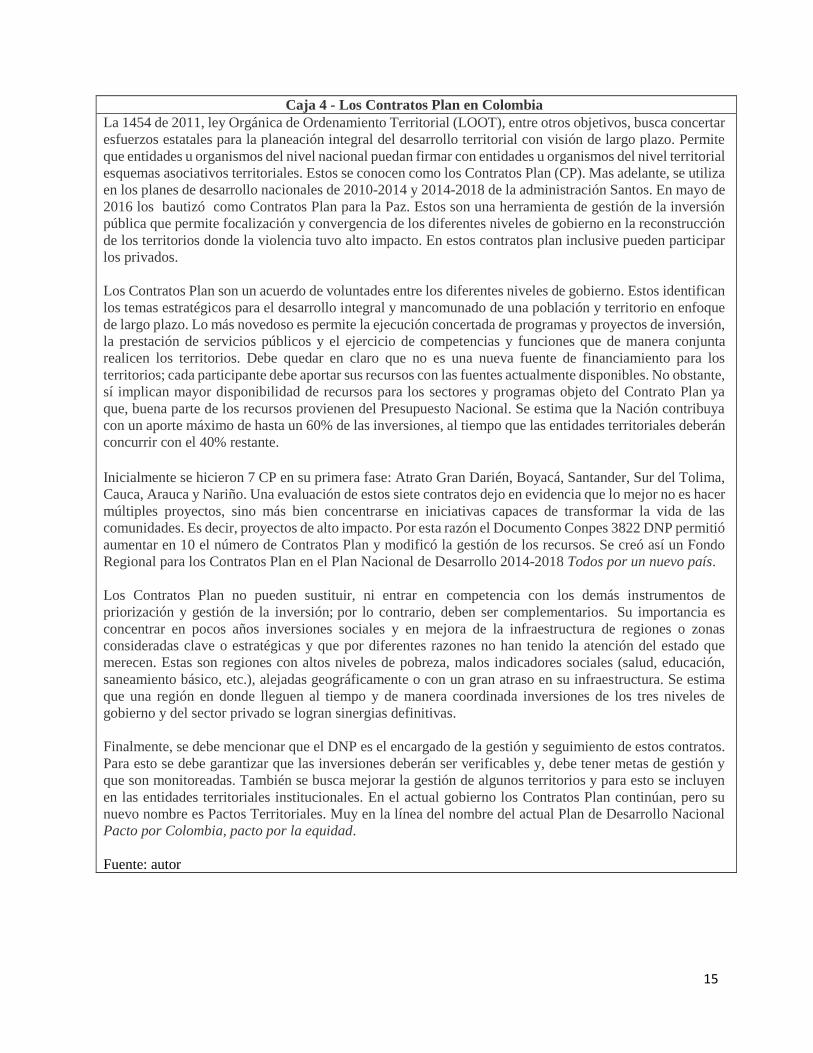
Caja 4 - Los Contratos Plan en Colombia
La 1454 de 2011, ley Orgánica de Ordenamiento Territorial (LOOT), entre otros objetivos, busca concertar
esfuerzos estatales para la planeación integral del desarrollo territorial con visión de largo plazo. Permite
que entidades u organismos del nivel nacional puedan firmar con entidades u organismos del nivel territorial
esquemas asociativos territoriales. Estos se conocen como los Contratos Plan (CP). Mas adelante, se utiliza
en los planes de desarrollo nacionales de 2010-2014 y 2014-2018 de la administración Santos. En mayo de
2016 los bautizó como Contratos Plan para la Paz. Estos son una herramienta de gestión de la inversión
pública que permite focalización y convergencia de los diferentes niveles de gobierno en la reconstrucción
de los territorios donde la violencia tuvo alto impacto. En estos contratos plan inclusive pueden participar
los privados.
Los Contratos Plan son un acuerdo de voluntades entre los diferentes niveles de gobierno. Estos identifican
los temas estratégicos para el desarrollo integral y mancomunado de una población y territorio en enfoque
de largo plazo. Lo más novedoso es permite la ejecución concertada de programas y proyectos de inversión,
la prestación de servicios públicos y el ejercicio de competencias y funciones que de manera conjunta
realicen los territorios. Debe quedar en claro que no es una nueva fuente de financiamiento para los
territorios; cada participante debe aportar sus recursos con las fuentes actualmente disponibles. No obstante,
sí implican mayor disponibilidad de recursos para los sectores y programas objeto del Contrato Plan ya
que, buena parte de los recursos provienen del Presupuesto Nacional. Se estima que la Nación contribuya
con un aporte máximo de hasta un 60% de las inversiones, al tiempo que las entidades territoriales deberán
concurrir con el 40% restante.
Inicialmente se hicieron 7 CP en su primera fase: Atrato Gran Darién, Boyacá, Santander, Sur del Tolima,
Cauca, Arauca y Nariño. Una evaluación de estos siete contratos dejo en evidencia que lo mejor no es hacer
múltiples proyectos, sino más bien concentrarse en iniciativas capaces de transformar la vida de las
comunidades. Es decir, proyectos de alto impacto. Por esta razón el Documento Conpes 3822 DNP permitió
aumentar en 10 el número de Contratos Plan y modificó la gestión de los recursos. Se creó así un Fondo
Regional para los Contratos Plan en el Plan Nacional de Desarrollo 2014-2018 Todos por un nuevo país.
Los Contratos Plan no pueden sustituir, ni entrar en competencia con los demás instrumentos de
priorización y gestión de la inversión; por lo contrario, deben ser complementarios. Su importancia es
concentrar en pocos años inversiones sociales y en mejora de la infraestructura de regiones o zonas
consideradas clave o estratégicas y que por diferentes razones no han tenido la atención del estado que
merecen. Estas son regiones con altos niveles de pobreza, malos indicadores sociales (salud, educación,
saneamiento básico, etc.), alejadas geográficamente o con un gran atraso en su infraestructura. Se estima
que una región en donde lleguen al tiempo y de manera coordinada inversiones de los tres niveles de
gobierno y del sector privado se logran sinergias definitivas.
Finalmente, se debe mencionar que el DNP es el encargado de la gestión y seguimiento de estos contratos.
Para esto se debe garantizar que las inversiones deberán ser verificables y, debe tener metas de gestión y
que son monitoreadas. También se busca mejorar la gestión de algunos territorios y para esto se incluyen
en las entidades territoriales institucionales. En el actual gobierno los Contratos Plan continúan, pero su
nuevo nombre es Pactos Territoriales. Muy en la línea del nombre del actual Plan de Desarrollo Nacional
Pacto por Colombia, pacto por la equidad.
Fuente: autor
16
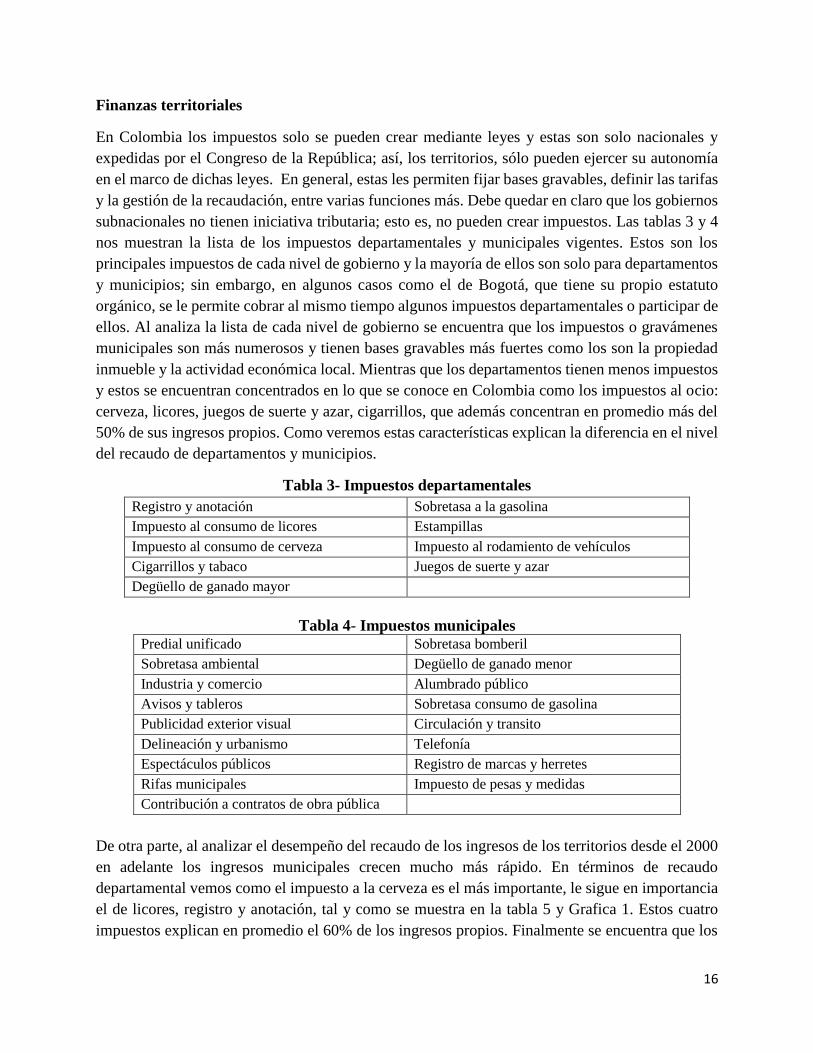
Finanzas territoriales
En Colombia los impuestos solo se pueden crear mediante leyes y estas son solo nacionales y
expedidas por el Congreso de la República; así, los territorios, sólo pueden ejercer su autonomía
en el marco de dichas leyes. En general, estas les permiten fijar bases gravables, definir las tarifas
y la gestión de la recaudación, entre varias funciones más. Debe quedar en claro que los gobiernos
subnacionales no tienen iniciativa tributaria; esto es, no pueden crear impuestos. Las tablas 3 y 4
nos muestran la lista de los impuestos departamentales y municipales vigentes. Estos son los
principales impuestos de cada nivel de gobierno y la mayoría de ellos son solo para departamentos
y municipios; sin embargo, en algunos casos como el de Bogotá, que tiene su propio estatuto
orgánico, se le permite cobrar al mismo tiempo algunos impuestos departamentales o participar de
ellos. Al analiza la lista de cada nivel de gobierno se encuentra que los impuestos o gravámenes
municipales son más numerosos y tienen bases gravables más fuertes como los son la propiedad
inmueble y la actividad económica local. Mientras que los departamentos tienen menos impuestos
y estos se encuentran concentrados en lo que se conoce en Colombia como los impuestos al ocio:
cerveza, licores, juegos de suerte y azar, cigarrillos, que además concentran en promedio más del
50% de sus ingresos propios. Como veremos estas características explican la diferencia en el nivel
del recaudo de departamentos y municipios.
Tabla 3- Impuestos departamentales
Registro y anotación Sobretasa a la gasolina
Impuesto al consumo de licores Estampillas
Impuesto al consumo de cerveza Impuesto al rodamiento de vehículos
Cigarrillos y tabaco Juegos de suerte y azar
Degüello de ganado mayor
Tabla 4- Impuestos municipales
Predial unificado Sobretasa bomberil
Sobretasa ambiental Degüello de ganado menor
Industria y comercio Alumbrado público
Avisos y tableros Sobretasa consumo de gasolina
Publicidad exterior visual Circulación y transito
Delineación y urbanismo Telefonía
Espectáculos públicos Registro de marcas y herretes
Rifas municipales Impuesto de pesas y medidas
Contribución a contratos de obra pública
De otra parte, al analizar el desempeño del recaudo de los ingresos de los territorios desde el 2000
en adelante los ingresos municipales crecen mucho más rápido. En términos de recaudo
departamental vemos como el impuesto a la cerveza es el más importante, le sigue en importancia
el de licores, registro y anotación, tal y como se muestra en la tabla 5 y Grafica 1. Estos cuatro
impuestos explican en promedio el 60% de los ingresos propios. Finalmente se encuentra que los
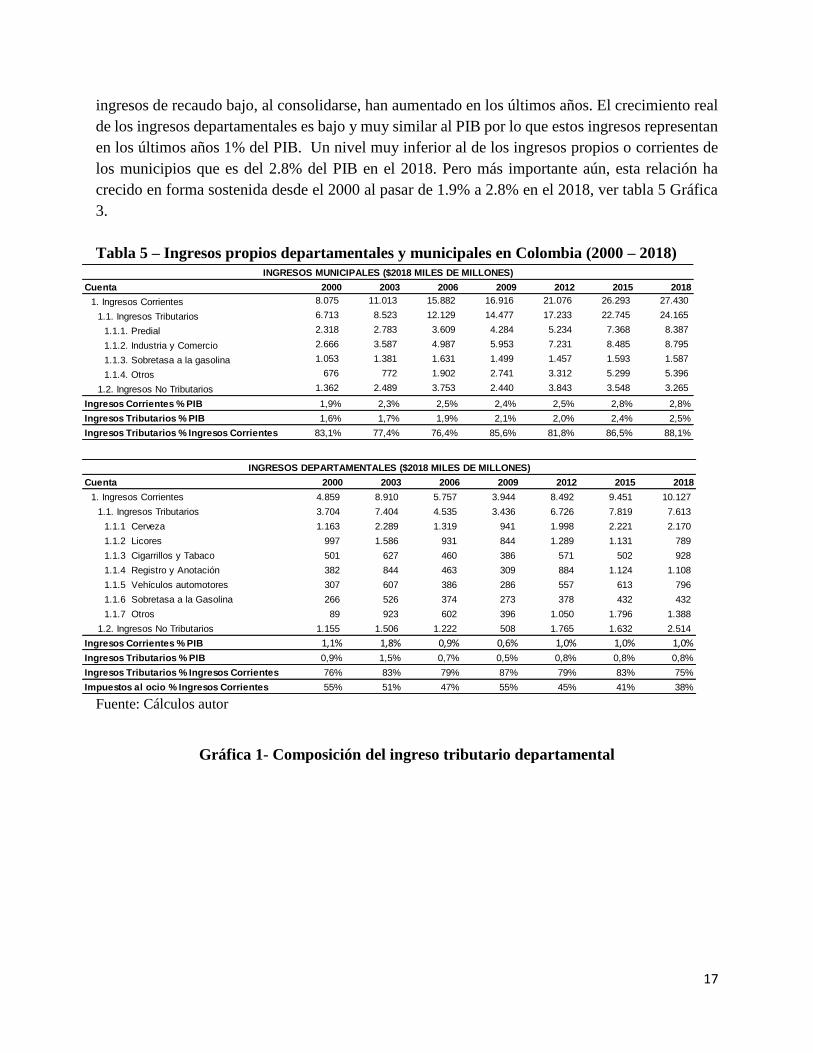
17
ingresos de recaudo bajo, al consolidarse, han aumentado en los últimos años. El crecimiento real
de los ingresos departamentales es bajo y muy similar al PIB por lo que estos ingresos representan
en los últimos años 1% del PIB. Un nivel muy inferior al de los ingresos propios o corrientes de
los municipios que es del 2.8% del PIB en el 2018. Pero más importante aún, esta relación ha
crecido en forma sostenida desde el 2000 al pasar de 1.9% a 2.8% en el 2018, ver tabla 5 Gráfica
3.
Tabla 5 – Ingresos propios departamentales y municipales en Colombia (2000 – 2018)
Fuente: Cálculos autor
Gráfica 1- Composición del ingreso tributario departamental
Cuenta 2000 2003 2006 2009 2012 2015 2018
1. Ingresos Corrientes 8.075 11.013 15.882 16.916 21.076 26.293 27.430
1.1. Ingresos Tributarios 6.713 8.523 12.129 14.477 17.233 22.745 24.165
1.1.1. Predial 2.318 2.783 3.609 4.284 5.234 7.368 8.387
1.1.2. Industria y Comercio 2.666 3.587 4.987 5.953 7.231 8.485 8.795
1.1.3. Sobretasa a la gasolina 1.053 1.381 1.631 1.499 1.457 1.593 1.587
1.1.4. Otros 676 772 1.902 2.741 3.312 5.299 5.396
1.2. Ingresos No Tributarios 1.362 2.489 3.753 2.440 3.843 3.548 3.265
Ingresos Corrientes % PIB 1,9% 2,3% 2,5% 2,4% 2,5% 2,8% 2,8%
Ingresos Tributarios % PIB 1,6% 1,7% 1,9% 2,1% 2,0% 2,4% 2,5%
Ingresos Tributarios % Ingresos Corrientes 83,1% 77,4% 76,4% 85,6% 81,8% 86,5% 88,1%
INGRESOS MUNICIPALES ($2018 MILES DE MILLONES)
Cuenta 2000 2003 2006 2009 2012 2015 2018
1. Ingresos Corrientes 4.859 8.910 5.757 3.944 8.492 9.451 10.127
1.1. Ingresos Tributarios 3.704 7.404 4.535 3.436 6.726 7.819 7.613
1.1.1 Cerveza 1.163 2.289 1.319 941 1.998 2.221 2.170
1.1.2 Licores 997 1.586 931 844 1.289 1.131 789
1.1.3 Cigarrillos y Tabaco 501 627 460 386 571 502 928
1.1.4 Registro y Anotación 382 844 463 309 884 1.124 1.108
1.1.5 Vehículos automotores 307 607 386 286 557 613 796
1.1.6 Sobretasa a la Gasolina 266 526 374 273 378 432 432
1.1.7 Otros 89 923 602 396 1.050 1.796 1.388
1.2. Ingresos No Tributarios 1.155 1.506 1.222 508 1.765 1.632 2.514
Ingresos Corrientes % PIB 1,1% 1,8% 0,9% 0,6% 1,0% 1,0% 1,0%
Ingresos Tributarios % PIB 0,9% 1,5% 0,7% 0,5% 0,8% 0,8% 0,8%
Ingresos Tributarios % Ingresos Corrientes 76% 83% 79% 87% 79% 83% 75%
Impuestos al ocio % Ingresos Corrientes 55% 51% 47% 55% 45% 41% 38%
INGRESOS DEPARTAMENTALES ($2018 MILES DE MILLONES)
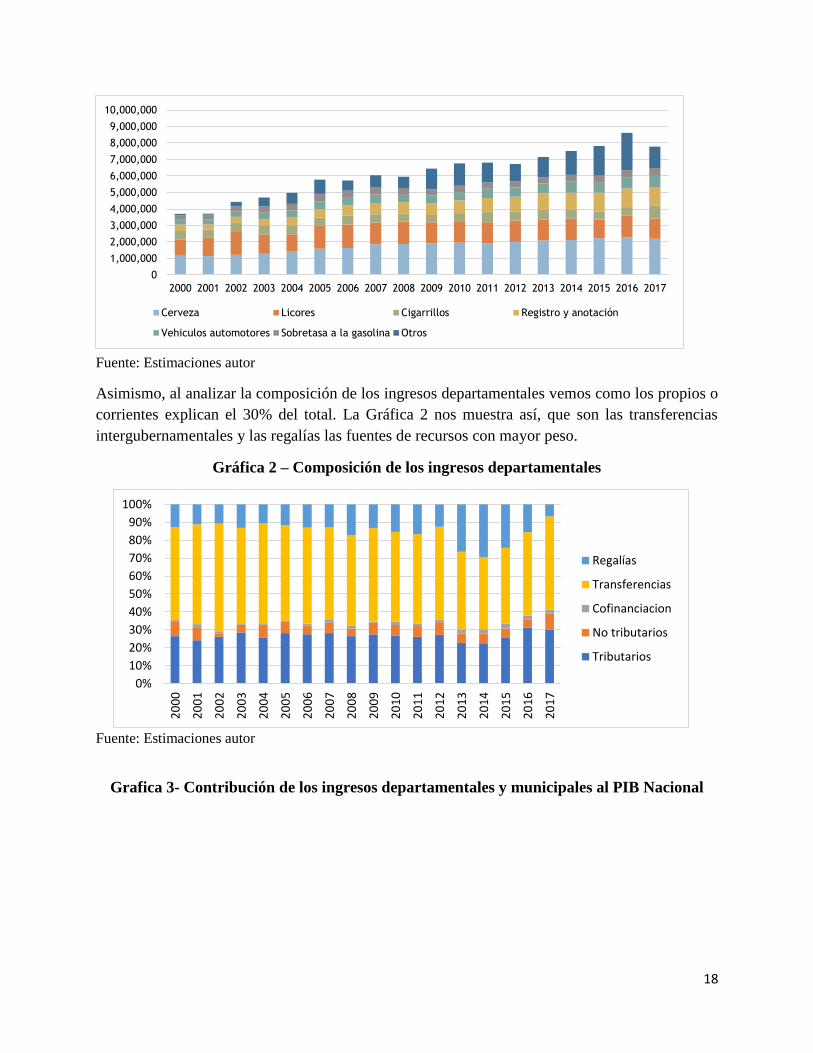
18
Fuente: Estimaciones autor
Asimismo, al analizar la composición de los ingresos departamentales vemos como los propios o
corrientes explican el 30% del total. La Gráfica 2 nos muestra así, que son las transferencias
intergubernamentales y las regalías las fuentes de recursos con mayor peso.
Gráfica 2 – Composición de los ingresos departamentales
Fuente: Estimaciones autor
Grafica 3- Contribución de los ingresos departamentales y municipales al PIB Nacional
0
1,000,000
2,000,000
3,000,000
4,000,000
5,000,000
6,000,000
7,000,000
8,000,000
9,000,000
10,000,000
2000 2001 2002 2003 2004 2005 2006 2007 2008 2009 2010 2011 2012 2013 2014 2015 2016 2017
Cerveza Licores Cigarrillos Registro y anotación
Vehiculos automotores Sobretasa a la gasolina Otros
0%
10%
20%
30%
40%
50%
60%
70%
80%
90%
100%
20
00
20
01
20
02
20
03
20
04
20
05
20
06
20
07
20
08
20
09
20
10
20
11
20
12
20
13
20
14
20
15
20
16
20
17
Regalías
Transferencias
Cofinanciacion
No tributarios
Tributarios
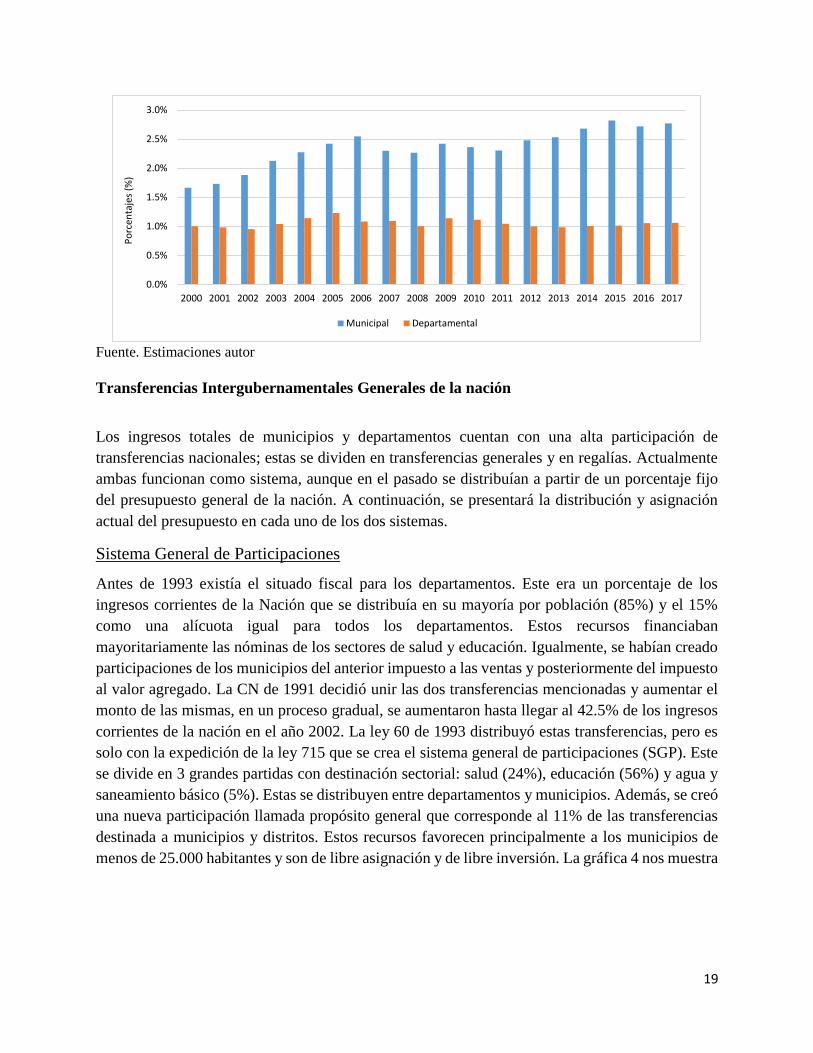
19
Fuente. Estimaciones autor
Transferencias Intergubernamentales Generales de la nación
Los ingresos totales de municipios y departamentos cuentan con una alta participación de
transferencias nacionales; estas se dividen en transferencias generales y en regalías. Actualmente
ambas funcionan como sistema, aunque en el pasado se distribuían a partir de un porcentaje fijo
del presupuesto general de la nación. A continuación, se presentará la distribución y asignación
actual del presupuesto en cada uno de los dos sistemas.
Sistema General de Participaciones
Antes de 1993 existía el situado fiscal para los departamentos. Este era un porcentaje de los
ingresos corrientes de la Nación que se distribuía en su mayoría por población (85%) y el 15%
como una alícuota igual para todos los departamentos. Estos recursos financiaban
mayoritariamente las nóminas de los sectores de salud y educación. Igualmente, se habían creado
participaciones de los municipios del anterior impuesto a las ventas y posteriormente del impuesto
al valor agregado. La CN de 1991 decidió unir las dos transferencias mencionadas y aumentar el
monto de las mismas, en un proceso gradual, se aumentaron hasta llegar al 42.5% de los ingresos
corrientes de la nación en el año 2002. La ley 60 de 1993 distribuyó estas transferencias, pero es
solo con la expedición de la ley 715 que se crea el sistema general de participaciones (SGP). Este
se divide en 3 grandes partidas con destinación sectorial: salud (24%), educación (56%) y agua y
saneamiento básico (5%). Estas se distribuyen entre departamentos y municipios. Además, se creó
una nueva participación llamada propósito general que corresponde al 11% de las transferencias
destinada a municipios y distritos. Estos recursos favorecen principalmente a los municipios de
menos de 25.000 habitantes y son de libre asignación y de libre inversión. La gráfica 4 nos muestra
0.0%
0.5%
1.0%
1.5%
2.0%
2.5%
3.0%
2000 2001 2002 2003 2004 2005 2006 2007 2008 2009 2010 2011 2012 2013 2014 2015 2016 2017
Po
rcen
taje
s (%
)
Municipal Departamental
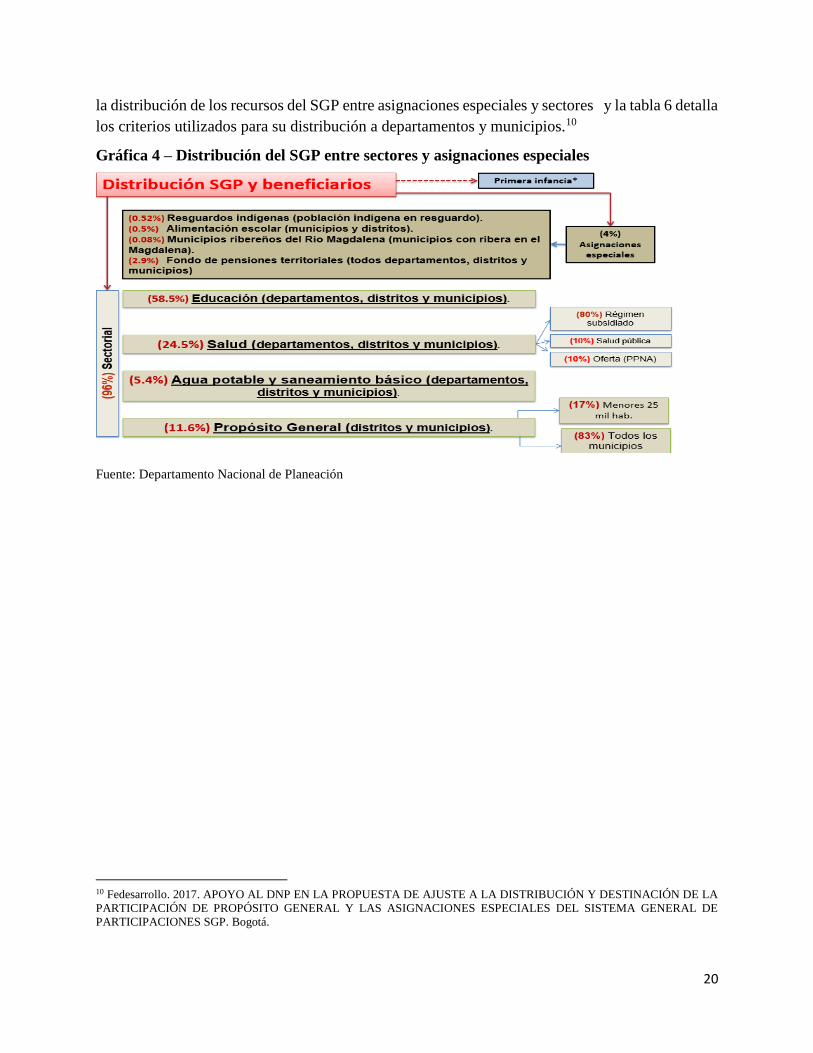
20
la distribución de los recursos del SGP entre asignaciones especiales y sectores y la tabla 6 detalla
los criterios utilizados para su distribución a departamentos y municipios.10
Gráfica 4 – Distribución del SGP entre sectores y asignaciones especiales
Fuente: Departamento Nacional de Planeación
10 Fedesarrollo. 2017. APOYO AL DNP EN LA PROPUESTA DE AJUSTE A LA DISTRIBUCIÓN Y DESTINACIÓN DE LA
PARTICIPACIÓN DE PROPÓSITO GENERAL Y LAS ASIGNACIONES ESPECIALES DEL SISTEMA GENERAL DE
PARTICIPACIONES SGP. Bogotá.
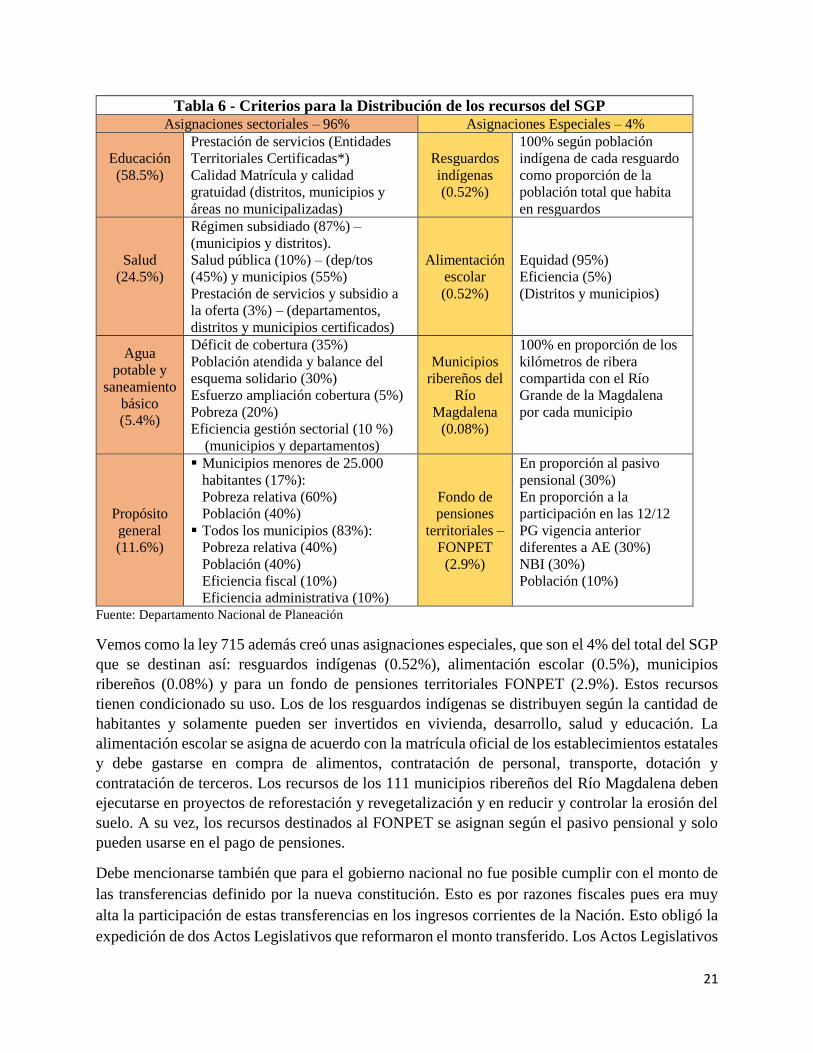
21
Tabla 6 - Criterios para la Distribución de los recursos del SGP Asignaciones sectoriales – 96% Asignaciones Especiales – 4%
Educación
(58.5%)
Prestación de servicios (Entidades
Territoriales Certificadas*)
Calidad Matrícula y calidad
gratuidad (distritos, municipios y
áreas no municipalizadas)
Resguardos
indígenas
(0.52%)
100% según población
indígena de cada resguardo
como proporción de la
población total que habita
en resguardos
Salud
(24.5%)
Régimen subsidiado (87%) –
(municipios y distritos).
Salud pública (10%) – (dep/tos
(45%) y municipios (55%)
Prestación de servicios y subsidio a
la oferta (3%) – (departamentos,
distritos y municipios certificados)
Alimentación
escolar
(0.52%)
Equidad (95%)
Eficiencia (5%)
(Distritos y municipios)
Agua
potable y
saneamiento
básico
(5.4%)
Déficit de cobertura (35%)
Población atendida y balance del
esquema solidario (30%)
Esfuerzo ampliación cobertura (5%)
Pobreza (20%)
Eficiencia gestión sectorial (10 %)
(municipios y departamentos)
Municipios
ribereños del
Río
Magdalena
(0.08%)
100% en proporción de los
kilómetros de ribera
compartida con el Río
Grande de la Magdalena
por cada municipio
Propósito
general
(11.6%)
▪ Municipios menores de 25.000
habitantes (17%):
Pobreza relativa (60%)
Población (40%)
▪ Todos los municipios (83%):
Pobreza relativa (40%)
Población (40%)
Eficiencia fiscal (10%)
Eficiencia administrativa (10%)
Fondo de
pensiones
territoriales –
FONPET
(2.9%)
En proporción al pasivo
pensional (30%)
En proporción a la
participación en las 12/12
PG vigencia anterior
diferentes a AE (30%)
NBI (30%)
Población (10%)
Fuente: Departamento Nacional de Planeación
Vemos como la ley 715 además creó unas asignaciones especiales, que son el 4% del total del SGP
que se destinan así: resguardos indígenas (0.52%), alimentación escolar (0.5%), municipios
ribereños (0.08%) y para un fondo de pensiones territoriales FONPET (2.9%). Estos recursos
tienen condicionado su uso. Los de los resguardos indígenas se distribuyen según la cantidad de
habitantes y solamente pueden ser invertidos en vivienda, desarrollo, salud y educación. La
alimentación escolar se asigna de acuerdo con la matrícula oficial de los establecimientos estatales
y debe gastarse en compra de alimentos, contratación de personal, transporte, dotación y
contratación de terceros. Los recursos de los 111 municipios ribereños del Río Magdalena deben
ejecutarse en proyectos de reforestación y revegetalización y en reducir y controlar la erosión del
suelo. A su vez, los recursos destinados al FONPET se asignan según el pasivo pensional y solo
pueden usarse en el pago de pensiones.
Debe mencionarse también que para el gobierno nacional no fue posible cumplir con el monto de
las transferencias definido por la nueva constitución. Esto es por razones fiscales pues era muy
alta la participación de estas transferencias en los ingresos corrientes de la Nación. Esto obligó la
expedición de dos Actos Legislativos que reformaron el monto transferido. Los Actos Legislativos
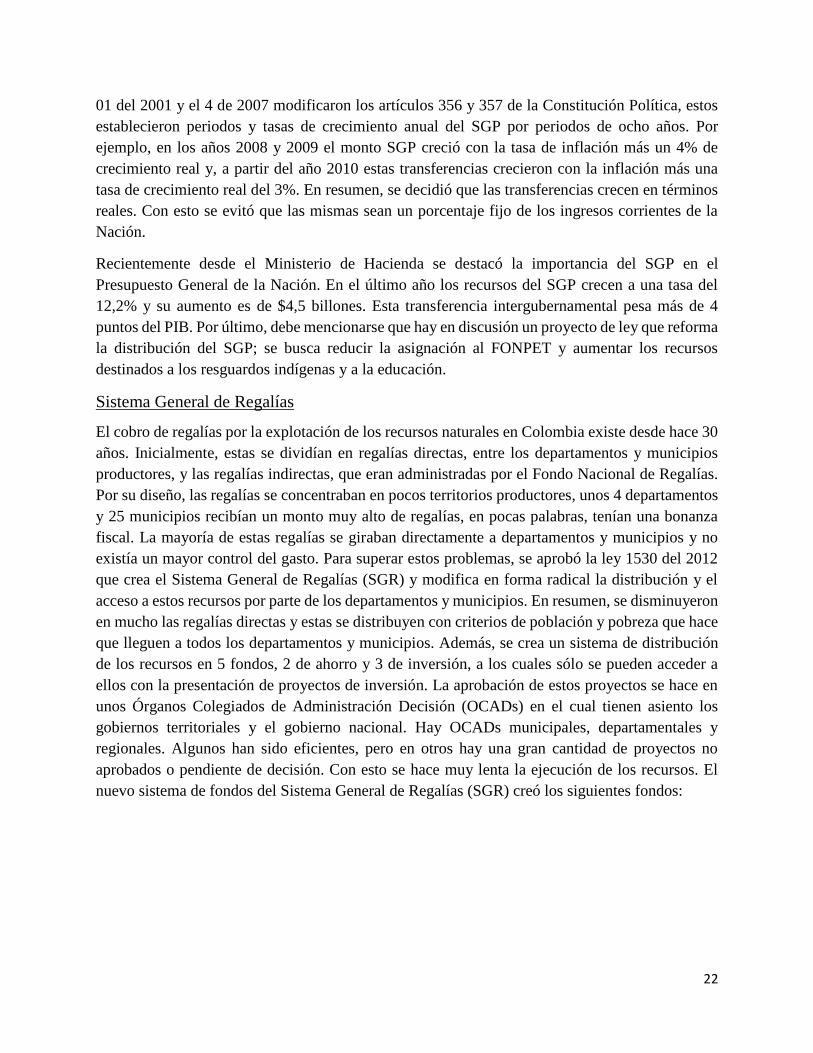
22
01 del 2001 y el 4 de 2007 modificaron los artículos 356 y 357 de la Constitución Política, estos
establecieron periodos y tasas de crecimiento anual del SGP por periodos de ocho años. Por
ejemplo, en los años 2008 y 2009 el monto SGP creció con la tasa de inflación más un 4% de
crecimiento real y, a partir del año 2010 estas transferencias crecieron con la inflación más una
tasa de crecimiento real del 3%. En resumen, se decidió que las transferencias crecen en términos
reales. Con esto se evitó que las mismas sean un porcentaje fijo de los ingresos corrientes de la
Nación.
Recientemente desde el Ministerio de Hacienda se destacó la importancia del SGP en el
Presupuesto General de la Nación. En el último año los recursos del SGP crecen a una tasa del
12,2% y su aumento es de $4,5 billones. Esta transferencia intergubernamental pesa más de 4
puntos del PIB. Por último, debe mencionarse que hay en discusión un proyecto de ley que reforma
la distribución del SGP; se busca reducir la asignación al FONPET y aumentar los recursos
destinados a los resguardos indígenas y a la educación.
Sistema General de Regalías
El cobro de regalías por la explotación de los recursos naturales en Colombia existe desde hace 30
años. Inicialmente, estas se dividían en regalías directas, entre los departamentos y municipios
productores, y las regalías indirectas, que eran administradas por el Fondo Nacional de Regalías.
Por su diseño, las regalías se concentraban en pocos territorios productores, unos 4 departamentos
y 25 municipios recibían un monto muy alto de regalías, en pocas palabras, tenían una bonanza
fiscal. La mayoría de estas regalías se giraban directamente a departamentos y municipios y no
existía un mayor control del gasto. Para superar estos problemas, se aprobó la ley 1530 del 2012
que crea el Sistema General de Regalías (SGR) y modifica en forma radical la distribución y el
acceso a estos recursos por parte de los departamentos y municipios. En resumen, se disminuyeron
en mucho las regalías directas y estas se distribuyen con criterios de población y pobreza que hace
que lleguen a todos los departamentos y municipios. Además, se crea un sistema de distribución
de los recursos en 5 fondos, 2 de ahorro y 3 de inversión, a los cuales sólo se pueden acceder a
ellos con la presentación de proyectos de inversión. La aprobación de estos proyectos se hace en
unos Órganos Colegiados de Administración Decisión (OCADs) en el cual tienen asiento los
gobiernos territoriales y el gobierno nacional. Hay OCADs municipales, departamentales y
regionales. Algunos han sido eficientes, pero en otros hay una gran cantidad de proyectos no
aprobados o pendiente de decisión. Con esto se hace muy lenta la ejecución de los recursos. El
nuevo sistema de fondos del Sistema General de Regalías (SGR) creó los siguientes fondos:
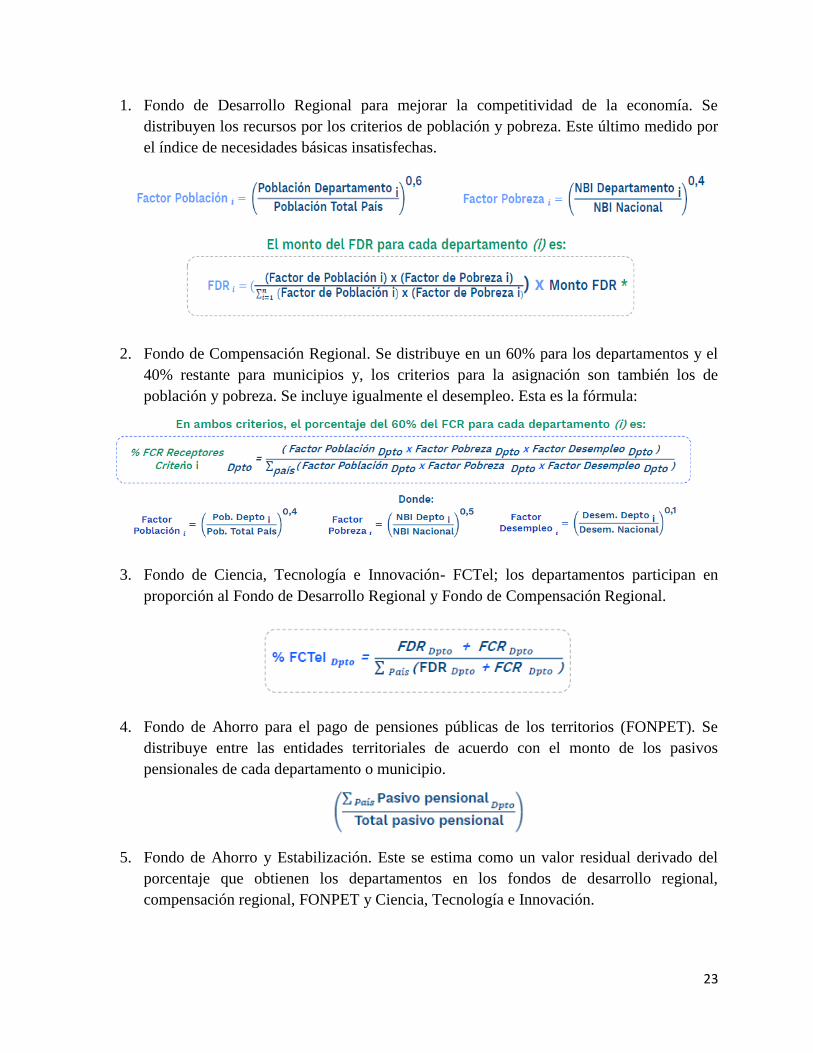
23
1. Fondo de Desarrollo Regional para mejorar la competitividad de la economía. Se
distribuyen los recursos por los criterios de población y pobreza. Este último medido por
el índice de necesidades básicas insatisfechas.
2. Fondo de Compensación Regional. Se distribuye en un 60% para los departamentos y el
40% restante para municipios y, los criterios para la asignación son también los de
población y pobreza. Se incluye igualmente el desempleo. Esta es la fórmula:
3. Fondo de Ciencia, Tecnología e Innovación- FCTel; los departamentos participan en
proporción al Fondo de Desarrollo Regional y Fondo de Compensación Regional.
4. Fondo de Ahorro para el pago de pensiones públicas de los territorios (FONPET). Se
distribuye entre las entidades territoriales de acuerdo con el monto de los pasivos
pensionales de cada departamento o municipio.
5. Fondo de Ahorro y Estabilización. Este se estima como un valor residual derivado del
porcentaje que obtienen los departamentos en los fondos de desarrollo regional,
compensación regional, FONPET y Ciencia, Tecnología e Innovación.
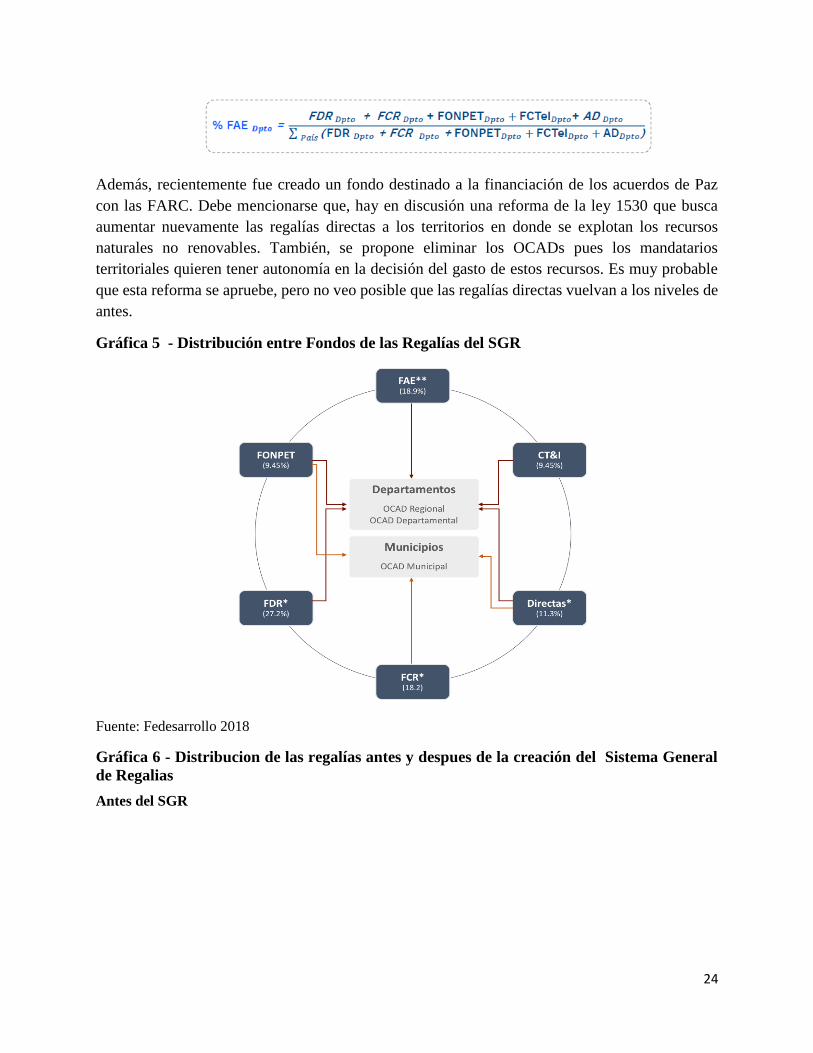
24
Además, recientemente fue creado un fondo destinado a la financiación de los acuerdos de Paz
con las FARC. Debe mencionarse que, hay en discusión una reforma de la ley 1530 que busca
aumentar nuevamente las regalías directas a los territorios en donde se explotan los recursos
naturales no renovables. También, se propone eliminar los OCADs pues los mandatarios
territoriales quieren tener autonomía en la decisión del gasto de estos recursos. Es muy probable
que esta reforma se apruebe, pero no veo posible que las regalías directas vuelvan a los niveles de
antes.
Gráfica 5 - Distribución entre Fondos de las Regalías del SGR
Fuente: Fedesarrollo 2018
Gráfica 6 - Distribucion de las regalías antes y despues de la creación del Sistema General
de Regalias
Antes del SGR
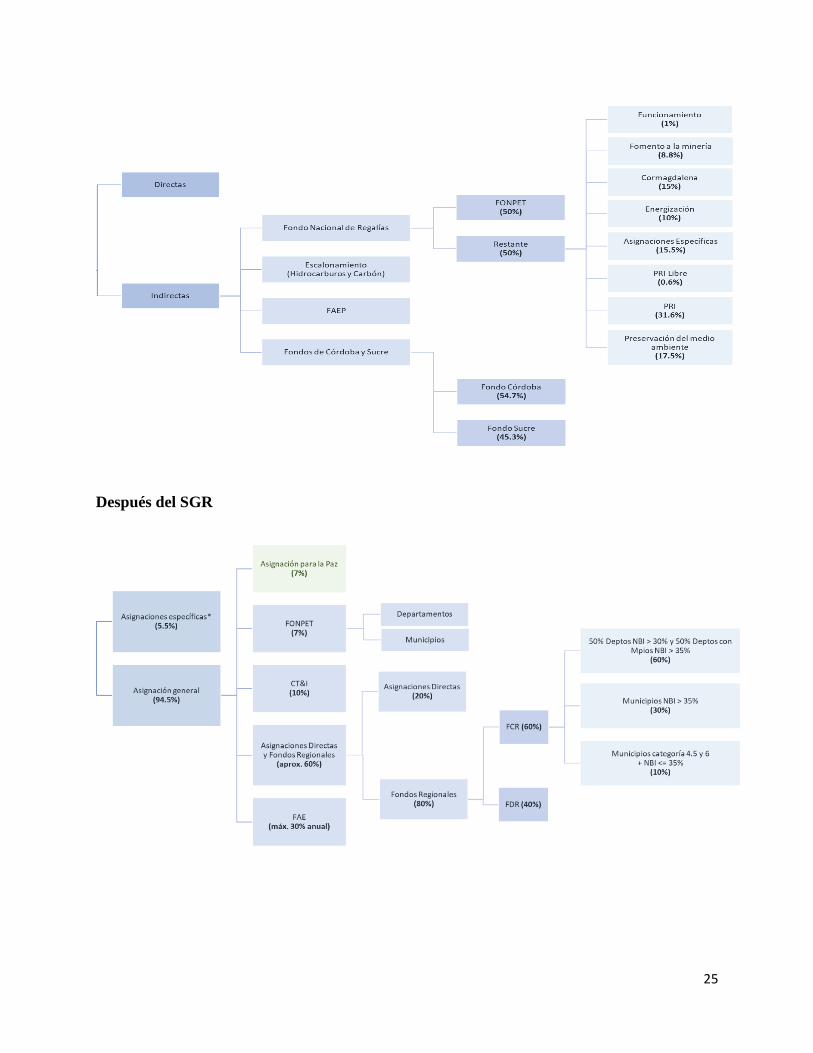
25
Después del SGR
26
Deuda y sostenibilidad fiscal
Debe mencionarse que el proceso de descentralización no estuvo ausente de problemas financieros
y que, durante la década la de los años noventa, una buena parte de los 32 departamentos y de las
grandes ciudades se endeudó y no pudieron cumplir con el pago de la deuda. Esto obligó a que el
gobierno nacional rescatara a algunos gobiernos subnacionales respaldando estas deudas (bail
outs) y logrando que las mismas se refinanciaran. Como consecuencia, se expidió un marco
normativo rígido que hace casi muy restrictivo el endeudamiento de los territorios y que propende
ante todo por finanzas sanas y sostenibles en el largo plazo.
El primer avance normativo en el camino de una mayor sostenibilidad fiscal fue la Ley 358 de
1997 que reglamenta el acceso al endeudamiento de las entidades territoriales. Se crea un conocido
sistema de semáforos para los departamentos y municipios. Para lo anterior se tiene en cuenta dos
criterios, el de liquidez que estima la relación entre intereses de la deuda y el ahorro operacional y
define que este no debe superar el 40%. Este indicador no incluye las amortizaciones de la deuda
efectuadas en el periodo. El segundo criterio es de solvencia que fija el 60% como el límite de la
relación del saldo de la deuda y los ingresos corrientes.
A partir de estos dos criterios, los territorios que cumplan con las dos condiciones pueden
endeudarse libremente (semáforo verde). Si solo se cumple un criterio pueden endeudarse con
previa consulta de la Dirección de Asuntos Fiscales (DAF) del Ministerio de Hacienda (semáforo
amarillo). Por último, si no se cumple con ninguno de los criterios, no pueden endeudarse
(semáforo rojo). La misma ley permite que los territorios con problemas fiscales y financieros, no
solo de deuda, adelantar un plan de desempeño con la Dirección de Apoyo Fiscal (DAF) del
ministerio de Hacienda. Estos convenios fijan metas ortodoxas de ajuste del gasto y aumento de
los ingresos. Ha sido una política utilizada con buenos resultados.
Posteriormente la legislación avanzó con la Ley 617 del 2000 en varias dimensiones. Primero
clasifico a los departamentos y municipios según su población e ingresos propios con el fin de
controlar la creación de entidades territoriales. Segundo, reglamentó que el funcionamiento debe
financiarse con los recursos propios, esto con el objetivo de un mayor control sobre el gasto. Para
esto se definió un límite del gasto de funcionamiento cómo % de sus recursos propios. De acuerdo
con la clasificación departamental o municipal; este límite se encuentra entre el 50% y el 70% para
los departamentos y hasta el 80% para los municipios.
Asimismo, en el año 2003 la ley 819 hace obligatoria la expedición de los marcos fiscales de
mediano plazo para municipios y departamentos. Se busca garantizar la sostenibilidad de la deuda.
Los marcos fiscales deben asegurar que las entidades territoriales generan superávit primario, lo
que les permite pagar los intereses de la deuda o financiar parte de su inversión con sus ingresos
corrientes. La ley igualmente analiza si el saldo de la deuda es muy alto o bajo de acuerdo estos
ingresos corrientes. Además, para cada vigencia debe presentarse un plan financiero específico
para asegurar el control y ejecución del presupuesto articulado a las metas de planeación.
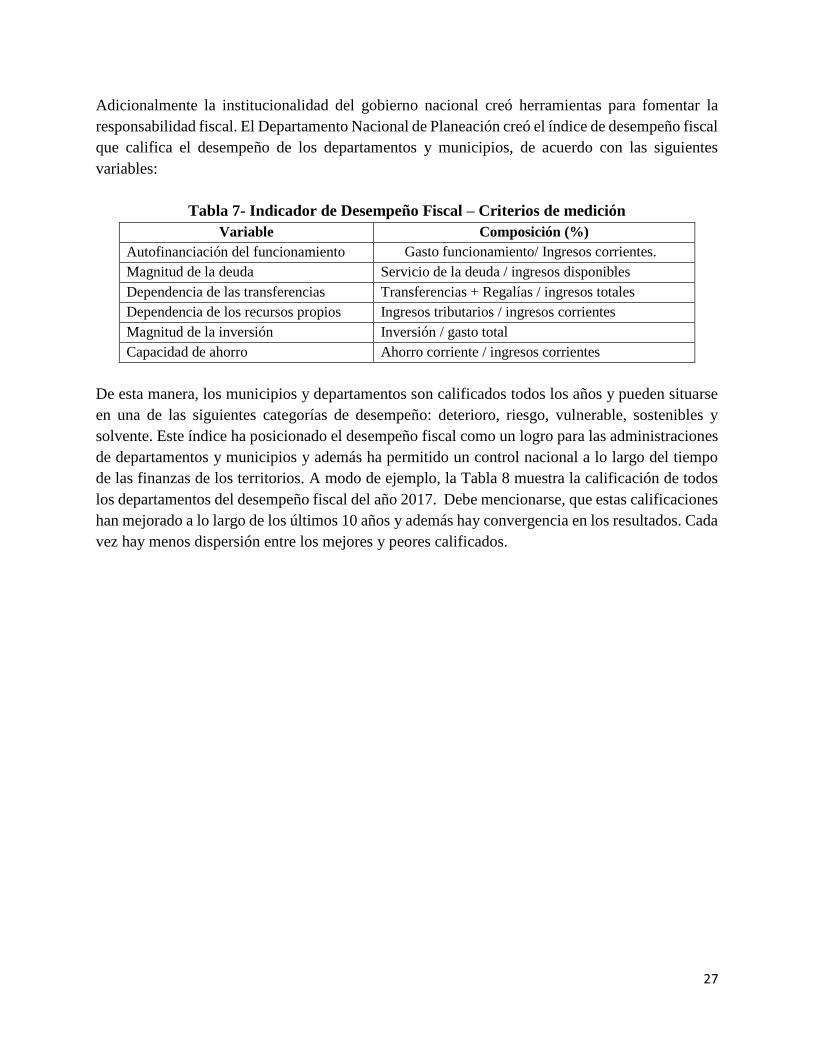
27
Adicionalmente la institucionalidad del gobierno nacional creó herramientas para fomentar la
responsabilidad fiscal. El Departamento Nacional de Planeación creó el índice de desempeño fiscal
que califica el desempeño de los departamentos y municipios, de acuerdo con las siguientes
variables:
Tabla 7- Indicador de Desempeño Fiscal – Criterios de medición
Variable Composición (%)
Autofinanciación del funcionamiento Gasto funcionamiento/ Ingresos corrientes.
Magnitud de la deuda Servicio de la deuda / ingresos disponibles
Dependencia de las transferencias Transferencias + Regalías / ingresos totales
Dependencia de los recursos propios Ingresos tributarios / ingresos corrientes
Magnitud de la inversión Inversión / gasto total
Capacidad de ahorro Ahorro corriente / ingresos corrientes
De esta manera, los municipios y departamentos son calificados todos los años y pueden situarse
en una de las siguientes categorías de desempeño: deterioro, riesgo, vulnerable, sostenibles y
solvente. Este índice ha posicionado el desempeño fiscal como un logro para las administraciones
de departamentos y municipios y además ha permitido un control nacional a lo largo del tiempo
de las finanzas de los territorios. A modo de ejemplo, la Tabla 8 muestra la calificación de todos
los departamentos del desempeño fiscal del año 2017. Debe mencionarse, que estas calificaciones
han mejorado a lo largo de los últimos 10 años y además hay convergencia en los resultados. Cada
vez hay menos dispersión entre los mejores y peores calificados.
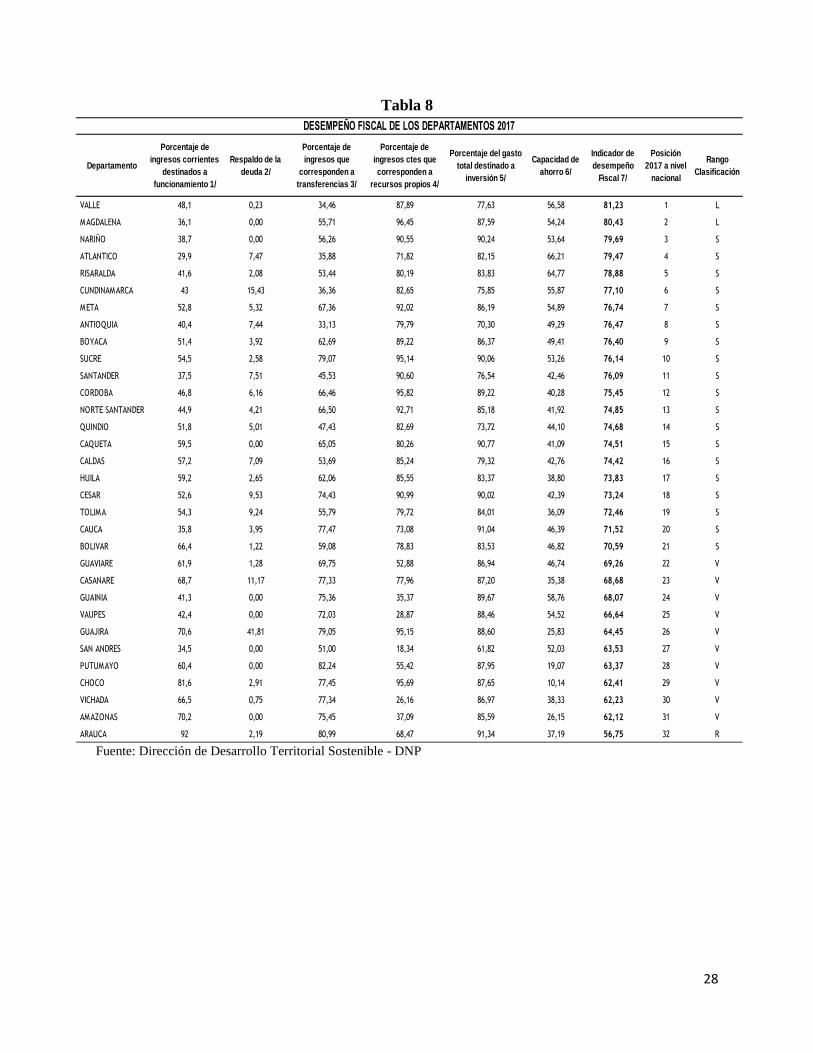
28
Tabla 8
Fuente: Dirección de Desarrollo Territorial Sostenible - DNP
Departamento
Porcentaje de
ingresos corrientes
destinados a
funcionamiento 1/
Respaldo de la
deuda 2/
Porcentaje de
ingresos que
corresponden a
transferencias 3/
Porcentaje de
ingresos ctes que
corresponden a
recursos propios 4/
Porcentaje del gasto
total destinado a
inversión 5/
Capacidad de
ahorro 6/
Indicador de
desempeño
Fiscal 7/
Posición
2017 a nivel
nacional
Rango
Clasificación
VALLE 48,1 0,23 34,46 87,89 77,63 56,58 81,23 1 L
MAGDALENA 36,1 0,00 55,71 96,45 87,59 54,24 80,43 2 L
NARIÑO 38,7 0,00 56,26 90,55 90,24 53,64 79,69 3 S
ATLANTICO 29,9 7,47 35,88 71,82 82,15 66,21 79,47 4 S
RISARALDA 41,6 2,08 53,44 80,19 83,83 64,77 78,88 5 S
CUNDINAMARCA 43 15,43 36,36 82,65 75,85 55,87 77,10 6 S
META 52,8 5,32 67,36 92,02 86,19 54,89 76,74 7 S
ANTIOQUIA 40,4 7,44 33,13 79,79 70,30 49,29 76,47 8 S
BOYACA 51,4 3,92 62,69 89,22 86,37 49,41 76,40 9 S
SUCRE 54,5 2,58 79,07 95,14 90,06 53,26 76,14 10 S
SANTANDER 37,5 7,51 45,53 90,60 76,54 42,46 76,09 11 S
CORDOBA 46,8 6,16 66,46 95,82 89,22 40,28 75,45 12 S
NORTE SANTANDER 44,9 4,21 66,50 92,71 85,18 41,92 74,85 13 S
QUINDIO 51,8 5,01 47,43 82,69 73,72 44,10 74,68 14 S
CAQUETA 59,5 0,00 65,05 80,26 90,77 41,09 74,51 15 S
CALDAS 57,2 7,09 53,69 85,24 79,32 42,76 74,42 16 S
HUILA 59,2 2,65 62,06 85,55 83,37 38,80 73,83 17 S
CESAR 52,6 9,53 74,43 90,99 90,02 42,39 73,24 18 S
TOLIMA 54,3 9,24 55,79 79,72 84,01 36,09 72,46 19 S
CAUCA 35,8 3,95 77,47 73,08 91,04 46,39 71,52 20 S
BOLIVAR 66,4 1,22 59,08 78,83 83,53 46,82 70,59 21 S
GUAVIARE 61,9 1,28 69,75 52,88 86,94 46,74 69,26 22 V
CASANARE 68,7 11,17 77,33 77,96 87,20 35,38 68,68 23 V
GUAINIA 41,3 0,00 75,36 35,37 89,67 58,76 68,07 24 V
VAUPES 42,4 0,00 72,03 28,87 88,46 54,52 66,64 25 V
GUAJIRA 70,6 41,81 79,05 95,15 88,60 25,83 64,45 26 V
SAN ANDRES 34,5 0,00 51,00 18,34 61,82 52,03 63,53 27 V
PUTUMAYO 60,4 0,00 82,24 55,42 87,95 19,07 63,37 28 V
CHOCO 81,6 2,91 77,45 95,69 87,65 10,14 62,41 29 V
VICHADA 66,5 0,75 77,34 26,16 86,97 38,33 62,23 30 V
AMAZONAS 70,2 0,00 75,45 37,09 85,59 26,15 62,12 31 V
ARAUCA 92 2,19 80,99 68,47 91,34 37,19 56,75 32 R
DESEMPEÑO FISCAL DE LOS DEPARTAMENTOS 2017
29
Balance de la Descentralización en Colombia: Ajustes sobre la marcha
En Colombia se dieron grandes cambios en materia fiscal y política en favor de las autoridades
territoriales. Con la Constitución Nacional de 1991 se dio una redistribución del poder político
entre niveles de gobierno. Este cambio inclusive afectó la estructura de los partidos políticos. Esto
fue importante puesto que el gasto territorial disminuyó desde la década de los años sesenta y por
casi 20 años, la gestión de lo público estuvo en manos del gobierno nacional. La descentralización,
en un país de regiones, era inevitable. Así, tras estos cambios políticos, se fortaleció el proceso de
descentralización en Colombia, que había comenzado en la década de los años ochenta. La gran
decisión fue que se coexistieran tres niveles de gobierno con igual importancia. Si en un comienzo
la descentralización fue municipal, rápidamente se aceptó que los departamentos son igual de
importantes. Esta decisión fue acertada pues los departamentos tienen una gran tradición política,
las gobernaciones siempre han sido importantes y la elección popular las fortaleció.
Asimismo, la nueva constitución modificó los procesos de planeación y presupuestación y los
articuló con la vida política. Los programas de gobierno de los políticos son la base para la
planeación y presupuestación de los recursos públicos. Al mismo tiempo, se reconoció la
importancia de la participación política y ciudadana en la planeación y ejecución de los recursos
públicos. Este proceso de planeación – presupuestación detallado y compulsivo también
contribuyó a atar las metas políticas con la responsabilidad fiscal de nuevos mandatarios. No se
puede presupuestar lo que no está financiado.
Sin embargo, los primeros años de la descentralización, 90´s, generaron una crisis fiscal que obligó
a la expedición de una legislación ortodoxa de responsabilidad fiscal con el objetivo de tener
finanzas sanas en el largo plazo. En resumen, el gasto y el endeudamiento territorial se elevaron a
niveles no sostenibles en el largo plazo. El gobierno nacional demostró tener capacidad para ajustar
el marco normativo y la gestión para hacer un seguimiento y control de las finanzas de los
territorios. En pocos años se crearon nuevas instituciones públicas, direcciones en ministerios y el
DNP, que controlan a los territorios e impulsa la buena gestión territorial.
Lo anterior se complementó con un marco normativo estricto alrededor del control del
endeudamiento y un buen desempeño fiscal. Para ello, también se modificó la distribución de los
sistemas de transferencias con el objetivo de garantizar un mejor reparto y una inversión alta en
los sectores sociales.
De otra parte, al estudiar los ingresos propios de los territorios se encontró que estos han crecido
en forma sostenida desde el 2000 en adelante. Sin embargo, los departamentos han tenido un
crecimiento más discreto, sobre todo si compara con los municipios. Esto se explica porque las
bases las bases gravables departamentales son inelásticas y el número de impuestos es mucho
menor.
Igualmente, los sistemas de transferencias aumentaron notablemente los ingresos para los
territorios. Vimos cómo fue necesario reformar la C. N. de 1991 mediante dos Actos Legislativos
30
para ralentizar el crecimiento anual de las transferencias; sin embargo, estas todavía crecen en
términos reales. Asimismo, un proceso similar se tuvo con las regalías producto de la explotación
de los recursos naturales no renovables. La creación del SGR buscó una mejor distribución de
estos recursos entre los territorios y un mayor control de las inversiones financiadas con estos
recursos. Por último, vemos como el ajuste de estos sistemas es periódico y en la actual coyuntura
es probable que en ambos sistemas de transferencias ajusten los criterios de distribución de sus
recursos y la manera como deben invertirse.
Un balance después de más de 30 de iniciada la descentralización nos muestra que Colombia tiene
departamentos fuertes en lo político, estables en lo fiscal y algunos con gran capacidad para
desarrollar políticas sociales. Sin embargo, no hay una homogeneidad. Hay aún departamentos
débiles en lo institucional y financiero; en particular los que son grandes en territorio y poco
poblados. Finalmente, la fortaleza de esta compleja transición del poder político y recursos entre
niveles gobierno, se explica por la capacidad de ajuste sobre la marcha. La experiencia colombiana
demuestra la necesidad de tener flexibilidad para corregir errores y retomar el rumbo en el corto
plazo. Estos ajustes, sin embargo, son cada vez más difíciles puesto que los gobernadores y
alcaldes son cada vez más fuertes y tienen gran peso político. No negocian su autonomía.
La experiencia reciente de Colombia sobre la gestión de los gobiernos intermedios deja varias
enseñanzas:
• En primer lugar, las autoridades de Chile deben tener en claro que al momento de tener
gobernadores electos por voto popular la relación de poder se modifica en mucho. Esto
significa que los nuevos gobernadores, serán mas fuertes y por lo tanto sus demandas
financieras por diversos motivos serán mayores. Entre estos se encuentra la necesidad de
cumplir con sus propuestas de campaña que los obliga a ejecutar gasto social o proyectos de
infraestructura. En este contexto veo difícil que se pueda mantener el modelo actual de
cogobierno con la Nación. La no entrega de mayor autonomía y mayores recursos puede ser
un limitante para el desarrollo político de los gobernadores.
• Segundo, Es necesario que en Chile el ordenamiento territorial tenga nuevas posibilidades
como las áreas metropolitanas, distritos, asociaciones de municipios o departamentos, regiones
administrativas de planeación e inclusive contratos plan. Un amplio abanico de posibilidades
permite monitorear a lo largo del tiempo cuales de estas nuevas figuras fueron útiles o no. Esto
significa que la estructura rígida de gobierno nacional y subnacionales es limitada. Hay muchos
problemas y retos regionales que necesitan el concurso de autoridades de varios niveles de
gobierno e inclusive del sector privado.
• Tercero, la experiencia muestra que es inevitable disponer de mayores recursos para financiar
a un estado que descentraliza sus funciones y competencias entre varios niveles de gobierno.
En Colombia esto significó un aumento importante de las transferencias intergubernamentales
a través de dos sistemas: el SGP y SGR. Esto puede ser una buena decisión siempre y cuando
la administración de estos recursos sea eficiente y transparente. En general, estos sistemas de
transferencias financian muy poco gasto corriente y se concentran en inversiones en
infraestructura o gasto social. En Colombia, las nóminas de los sectores de salud y educación
31
se financian en gran parte con estos recursos. Asimismo, esto implica que hay que definir para
cada sector del gasto la distribución de recursos y funciones entre niveles de gobierno.
• Cuarto, preocupa que no estén definidas fuentes de recursos estables para los gobiernos
intermedios en Chile. Como vimos en Colombia estos gobiernos dependen en gran medida de
los impuestos al ocio como los impuestos a las loterías, licores, cerveza, cigarrillos y juegos
de suerte y azar. Estas son fuentes poco dinámicas, pero son una garantía de ingresos en el
largo plazo. Estos recursos son los que han garantizado el funcionamiento de los departamentos
desde mucho tiempo atrás. Chile debe identificar posibles fuentes de recursos que puedan ser
cedidas y / o compartidas ente niveles de gobierno. En todo caso es mejor que los
departamentos administren sus propios impuestos o gravámenes, de lo contrario su fortaleza
política se ve comprometida.
• Quinto, la experiencia del proceso de descentralización colombiano nos muestra que los
problemas no son solo de distribución de funciones y recursos entre gobiernos. Se necesita
igualmente desarrollar una institucionalidad que garantice tener los espacios coordinación
entre el gobierno nacional y los subnacionales. En Colombia hay direcciones en el DNP y del
ministerio de Hacienda encargadas de esta función. Entre estas tareas se han convertido en
muy importantes los sistemas de información y de ejecución presupuestales y contables de
obligatorio reporte periódico. Es mejor manera de hacer seguimiento a la gestión de los
territorios.
• Sexto, es necesario ajustar la normatividad a las nuevas condiciones creadas por los cambios
políticos. Es claro, la mayor autonomía no significa bajo compromiso en materia financiera.
Hay que expedir leyes de responsabilidad fiscal o capítulos para los territorios en las leyes
existentes. Se les debe imponer límites al gasto de funcionamiento, controlar el crecimiento de
las nóminas y por supuesto el acceso al endeudamiento. Por ejemplo, los gobiernos
subnacionales que no generen superávit corriente no pueden endeudarse. Colombia y otros
países tienen este tipo de leyes con muy buenos resultados.
• Séptimo y último, al que tener presente que estos procesos de descentralización política,
administrativa y financiera son mucho más complejos de los que inicialmente se estima.
Demandan mucho tiempo, requieren de una visión estratégica, se debe generar un mayor
volumen de recursos y distribuirlo apropiadamente entre niveles de gobierno, rediseñar el
ordenamiento territorial y el reparto de funciones recursos y de pensar en nuevas posibilidades
de organización en el territorio. Además, hay que tener la capacidad de ajustar sobre la marcha.
Muy buena parte de la nueva legislación y de la reorganización institucional en Colombia, se
dio a la luz de los problemas que surgieron con el proceso de descentralización ya en ejecución
32
Bibliografía:
Acosta O. y Bird, R. El dilema de la Descentralización en Colombia. En Bases para una Reforma
Tributaria Estructural en Colombia. Banco de la República – Fedesarrollo. Bogotá. 2005.
Fedesarrollo. 2017. Apoyo al DNP en la propuesta de ajuste a la distribución y destinación de la
participación de propósito general y las asignaciones especiales del sistema general de
participaciones SGP. Bogotá.
Daughters, R. Harper, L. Reformas de descentralización fiscal y política. En Lora, Eduardo
(editor). El estado de las reformas del Estado en América Latina. BID. Washington. 2007.
Dirección de Apoyo Fiscal –DAF- 10 años de Transformación Fiscal Territorial en Colombia 1998
- 2008. DAF- Ministerio de Hacienda. Bogotá. Mayo de 2009.
DNP (2002). Evaluación de la descentralización municipal en Colombia: balance de una década.
Bogotá.
Duque, N. (2007). El departamento en la descentralización político-administrativa en Colombia.
Bogotá: Escuela Superior de Administración Pública.
Econometría Consultores. (2014). Evaluación de operación del sistema general de
participaciones. Bogotá
Estupiñan, L. (2012). Desequilibrios territoriales. Bogotá: Universidad del Rosario.
Falletti, Tulia. A sequential theory of decentralization and its effects on the intergovernmental
balance of power: Latin American cases in comparative perspective. Working Paper # 314. Kellog
Institute. July 2004.
Federación Colombiana de Municipios (2009). Tributación municipal para la equidad y el desarrollo.
Memorias Foro nacional de autoridades locales sept. 2008. GTZ- Federación Colombiana de
Municipios. Bogotá.
Maldonado, A. Los límites de la descentralización territorial: el caso de Colombia 1991- 2008.
Tesis de Doctorado. Universidad Complutense. Madrid. 2011.
Núñez, J. Zapata, J. 2018. Evaluación de Impacto del Sistema General de Regalías. Fedesarrollo
– evaluación para el DNP. Bogotá.
Pening, J. P. El modelo de descentralización en Colombia. Capítulo de tesis doctorado en
Desarrollo. Universidad de Lovaina.
PGR. Guía básica de tributos municipales. Bogotá. 2018.
Piza, J. R. (2008). El régimen fiscal en la Constitución de 1991. Revista Derecho del Estado, núm.
21, diciembre de 2008. Universidad Externado. Bogotá.
Porto, A., Pineda, C. R. y Eguino, H. (2018). Descentralización y autonomía fiscal subnacional
en América Latina: Panorama comparado de Brasil, Colombia, México y Perú. BID.
Restrepo, D. (2014). Procesos de Descentralización en Bolivia y Colombia, 1980 – 2005 Una
propuesta de economía política espacial comparada. Universidad Nacional de Colombia -
Facultad de Ciencias Humanas - Departamento de Historia. Tesis de Grado. Bogotá.
33
Sánchez, A. & Herrera, D. Revisión histórica del proceso de descentralización administrativa y
sus restos en Colombia, de 1985 a 2016. Universidad Santo Tomas. Tesis. Bogotá. 2016.
Sánchez, F., & Zenteno, J. (2010). Descentralización y desempeño fiscal subnacional - el caso de
Colombia. En Descentralización y sostenibilidad fiscal subnacional: los casos de Colombia y Perú
(págs. 47-97). BID.
Valencia-Tello, D; Karam De Chueiri, V. Antecedentes de la descentralización territorial en
Colombia. (2014); 23(1):171-194. DOI: 10.5294/DIKA.2014.23.1.7
Velásquez, F. y González, E. ¿Qué ha pasado con la participación ciudadana en Colombia?
CIDER – Uniandes y Fundación Corona. Bogotá. 2003.
Ver Perry et. al. (2009) Propuestas para el fortalecimiento Fiscal de los Departamentos.
Fedesarrollo - Federación Nacional de Departamentos. Bogotá.
Zambrano Pantoja, F. El contexto histórico de la descentralización territorial en Colombia.
Revista Nómadas núm. 3. Universidad Central. Bogotá. 1995.
Zapata, G. J.G. Reforma radical en el Estado de Santander, 1850-1885. Bogotá: Universidad del
Rosario, 2015.
1
Fiscal decentralization of regional
governments – the case of Indonesia
prepared under the World Bank TA RAS for Chile1
1 The Indonesia note was written by Gabriele (Gabe) Ferrazzi
i
Contents
Introduction ................................................................................................................................................... 1
Chapter 1. Indonesia and its regional government at a glance ...................................................................... 2
Chapter 2. Indonesia’s Big Bang decentralization ........................................................................................ 4
Chapter 3. Indonesia’s choices in functional assignment ............................................................................. 8
Chapter 4. Functions of regional government ............................................................................................. 12
Chapter 5. Regional government revenues ................................................................................................. 13
Chapter 6. Regional government borrowing ............................................................................................... 20
Chapter 7. Regional government budget process ........................................................................................ 21
Chapter 8. Effectiveness of regional government spending ........................................................................ 23
Chapter 9. Improvement and accountability in regional government ......................................................... 25
Chapter 10. Lessons and implications for other countries .......................................................................... 28
References ................................................................................................................................................... 30
Appendix 1: Comparative view of Indonesia and Chile ............................................................................. 32
Appendix 2: Example of education function assignment in Law 23/2014 on Regional Government ........ 33
Appendix 3: Changes in regional taxes over time/legislation in Indonesia ................................................ 34
Appendix 4: Essential features of decentralization modalities ................................................................... 35
1
Introduction2
1. Spurred by political necessity, in 1999 Indonesia embarked on what has become known as its
“big bang” decentralization (Hofman and Kaiser 2004, Lamont and Imansyah 2012, Decentralization
Support Facility 2012, Nasution, 2016). From a heavily centralized country it quickly became one of
the world’s most decentralized countries, with the two levels of regional government (provinces and
district/city levels) becoming responsible for about half of total public expenditure.
2. Indonesia’s approach to decentralization holds lessons for other countries contemplating
decentralization reforms. In some respects, Indonesia’s radical reforms were a success, surprising
advisors of international finance institutions that called for a much more cautious approach. Aspects
of the design and the political will and pressure for decentralization figured prominently in the reforms’
success. In other respects, the Big Bang was disruptive and has required considerable clean-up and
retrofitting over the years. As might be expected, it is still a work in progress. Both the successes and
pitfalls can be instructive to other countries.
3. Chile’s policy makers in particular can learn from Indonesia’s experience. The countries have
some similarities (see Appendix 1 for a general statistical comparison), with the scale of the Indonesian
district/city regional government approximating the scale of the regional governments in Chile.
Although the province in Indonesia is considerably larger in scale, the efforts to suppress and then
enlarge its intermediary role also offers lessons useful to the evolving regional government of Chile.
The large variation in Chile’s regions mirrors that of Indonesia, making the latter’s attempts to bridge
income and capacity disparities in the context of decentralization very relevant. Additionally,
Indonesia’s attempt to build greater accountability to improve service delivery holds lessons that are
relevant to regions regardless of their scale.
4. The relevance of the Indonesian experience for Chile is best analyzed via the essential features
of decentralization and subnational governance. These essential features relate to choices made in
functional assignment (architecture and modalities), own revenues, intergovernmental transfers, public
financial management practices, and accountability mechanisms. Moreover, the lessons are more
meaningful if they bridge to the specific circumstances and challenges of Chile’s situation. An effort
is made in the case study to achieve this bridging, but the benefit of a wide-ranging and participatory
dialogue within Chile is necessary to extract maximum benefit from any international experience. In
line with these observations, the case study is organized to highlight some features of Indonesia and
its regional government that can help in understanding the context and assessing relevance (Chapter
1). It then provides the essential changes made in the decentralization reforms of Indonesia (Chapter
2), followed by a deeper examination of choices made in functional assignment (Chapter 3) and the
resulting distribution of functions (Chapter 4). Chapter 5 explain the regional revenues composition,
followed by its borrowing powers/limitations (Chapter 6). The vertically integrated budget process is
covered in Chapter 7. Evidence is offered in Chapter 8 for the effectiveness of regional government
spending, and regional government performance is viewed more broadly through the lens of
improvement and accountability incentives in Chapter 9. In the final Chapter 10, some lessons are
drawn relevant to countries contemplating decentralization and specific suggestions are offered for
Chilean policy-makers.
2 The author is grateful for the opportunities provided by the World Bank to become familiar with the Chilean context and policy
information needs. The video session with Ministry of Finance officials in Chile was particularly useful. The sharing of recent
information on the reforms in Indonesia provided some inspiration and data for the issues raised here.
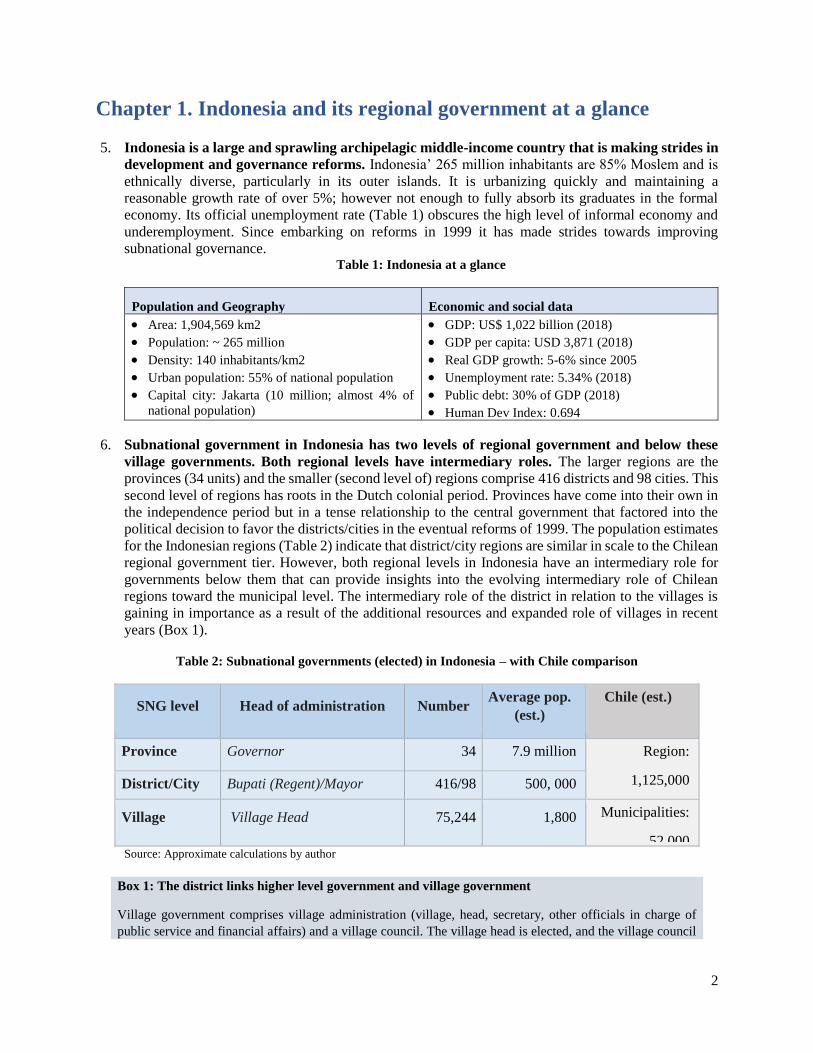
2
Chapter 1. Indonesia and its regional government at a glance
5. Indonesia is a large and sprawling archipelagic middle-income country that is making strides in
development and governance reforms. Indonesia’ 265 million inhabitants are 85% Moslem and is
ethnically diverse, particularly in its outer islands. It is urbanizing quickly and maintaining a
reasonable growth rate of over 5%; however not enough to fully absorb its graduates in the formal
economy. Its official unemployment rate (Table 1) obscures the high level of informal economy and
underemployment. Since embarking on reforms in 1999 it has made strides towards improving
subnational governance. Table 1: Indonesia at a glance
Population and Geography Economic and social data
• Area: 1,904,569 km2
• Population: ~ 265 million
• Density: 140 inhabitants/km2
• Urban population: 55% of national population
• Capital city: Jakarta (10 million; almost 4% of
national population)
• GDP: US$ 1,022 billion (2018)
• GDP per capita: USD 3,871 (2018)
• Real GDP growth: 5-6% since 2005
• Unemployment rate: 5.34% (2018)
• Public debt: 30% of GDP (2018)
• Human Dev Index: 0.694
6. Subnational government in Indonesia has two levels of regional government and below these
village governments. Both regional levels have intermediary roles. The larger regions are the
provinces (34 units) and the smaller (second level of) regions comprise 416 districts and 98 cities. This
second level of regions has roots in the Dutch colonial period. Provinces have come into their own in
the independence period but in a tense relationship to the central government that factored into the
political decision to favor the districts/cities in the eventual reforms of 1999. The population estimates
for the Indonesian regions (Table 2) indicate that district/city regions are similar in scale to the Chilean
regional government tier. However, both regional levels in Indonesia have an intermediary role for
governments below them that can provide insights into the evolving intermediary role of Chilean
regions toward the municipal level. The intermediary role of the district in relation to the villages is
gaining in importance as a result of the additional resources and expanded role of villages in recent
years (Box 1).
Table 2: Subnational governments (elected) in Indonesia – with Chile comparison
SNG level Head of administration Number Average pop.
(est.)
Chile (est.)
Province Governor 34 7.9 million Region:
1,125,000 District/City Bupati (Regent)/Mayor 416/98 500, 000
Village Village Head 75,244 1,800 Municipalities:
52,000 Source: Approximate calculations by author
Box 1: The district links higher level government and village government
Village government comprises village administration (village, head, secretary, other officials in charge of
public service and financial affairs) and a village council. The village head is elected, and the village council
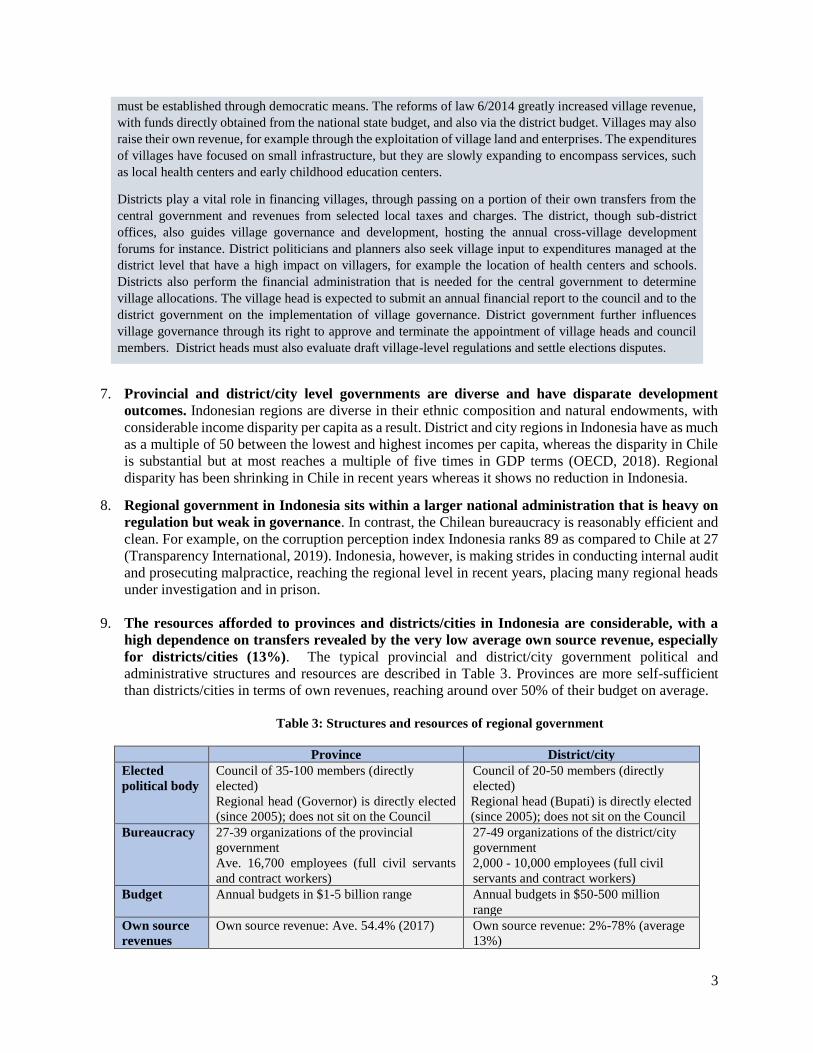
3
must be established through democratic means. The reforms of law 6/2014 greatly increased village revenue,
with funds directly obtained from the national state budget, and also via the district budget. Villages may also
raise their own revenue, for example through the exploitation of village land and enterprises. The expenditures
of villages have focused on small infrastructure, but they are slowly expanding to encompass services, such
as local health centers and early childhood education centers.
Districts play a vital role in financing villages, through passing on a portion of their own transfers from the
central government and revenues from selected local taxes and charges. The district, though sub-district
offices, also guides village governance and development, hosting the annual cross-village development
forums for instance. District politicians and planners also seek village input to expenditures managed at the
district level that have a high impact on villagers, for example the location of health centers and schools.
Districts also perform the financial administration that is needed for the central government to determine
village allocations. The village head is expected to submit an annual financial report to the council and to the
district government on the implementation of village governance. District government further influences
village governance through its right to approve and terminate the appointment of village heads and council
members. District heads must also evaluate draft village-level regulations and settle elections disputes.
7. Provincial and district/city level governments are diverse and have disparate development
outcomes. Indonesian regions are diverse in their ethnic composition and natural endowments, with
considerable income disparity per capita as a result. District and city regions in Indonesia have as much
as a multiple of 50 between the lowest and highest incomes per capita, whereas the disparity in Chile
is substantial but at most reaches a multiple of five times in GDP terms (OECD, 2018). Regional
disparity has been shrinking in Chile in recent years whereas it shows no reduction in Indonesia.
8. Regional government in Indonesia sits within a larger national administration that is heavy on
regulation but weak in governance. In contrast, the Chilean bureaucracy is reasonably efficient and
clean. For example, on the corruption perception index Indonesia ranks 89 as compared to Chile at 27
(Transparency International, 2019). Indonesia, however, is making strides in conducting internal audit
and prosecuting malpractice, reaching the regional level in recent years, placing many regional heads
under investigation and in prison.
9. The resources afforded to provinces and districts/cities in Indonesia are considerable, with a
high dependence on transfers revealed by the very low average own source revenue, especially
for districts/cities (13%). The typical provincial and district/city government political and
administrative structures and resources are described in Table 3. Provinces are more self-sufficient
than districts/cities in terms of own revenues, reaching around over 50% of their budget on average.
Table 3: Structures and resources of regional government
Province District/city
Elected
political body
Council of 35-100 members (directly
elected)
Regional head (Governor) is directly elected
(since 2005); does not sit on the Council
Council of 20-50 members (directly
elected)
Regional head (Bupati) is directly elected
(since 2005); does not sit on the Council
Bureaucracy 27-39 organizations of the provincial
government
Ave. 16,700 employees (full civil servants
and contract workers)
27-49 organizations of the district/city
government
2,000 - 10,000 employees (full civil
servants and contract workers)
Budget Annual budgets in $1-5 billion range Annual budgets in $50-500 million
range
Own source
revenues
Own source revenue: Ave. 54.4% (2017) Own source revenue: 2%-78% (average
13%)
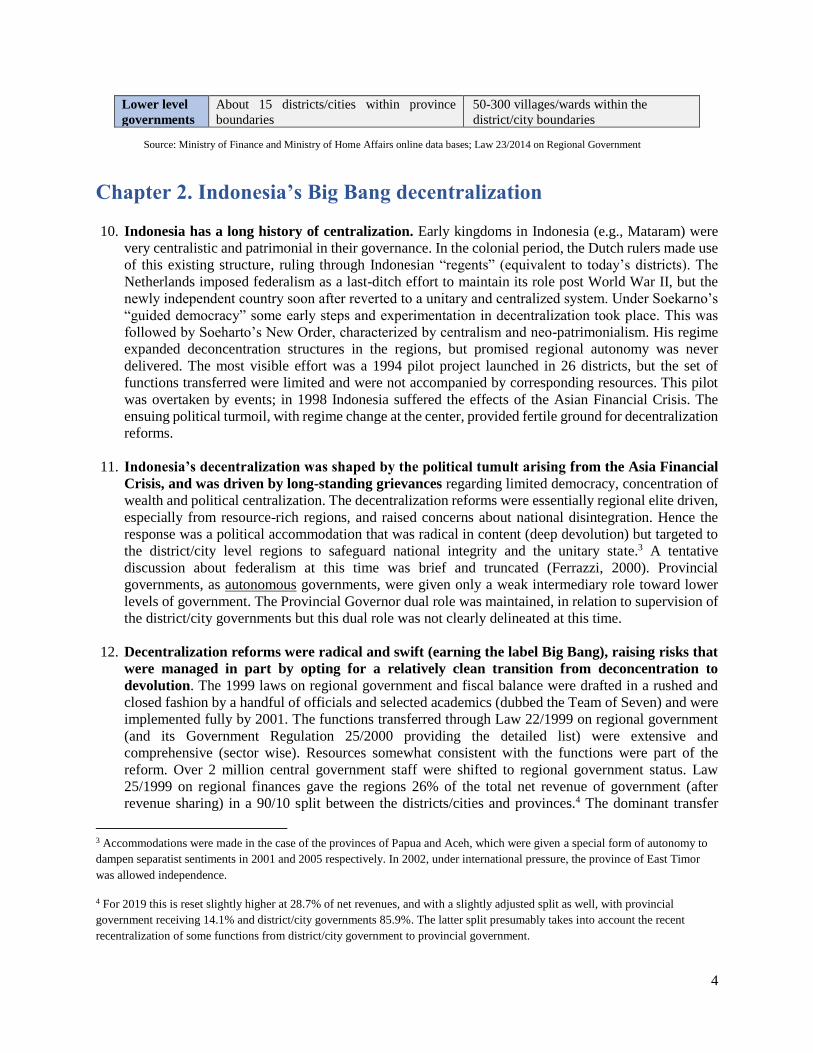
4
Lower level
governments
About 15 districts/cities within province
boundaries
50-300 villages/wards within the
district/city boundaries
Source: Ministry of Finance and Ministry of Home Affairs online data bases; Law 23/2014 on Regional Government
Chapter 2. Indonesia’s Big Bang decentralization
10. Indonesia has a long history of centralization. Early kingdoms in Indonesia (e.g., Mataram) were
very centralistic and patrimonial in their governance. In the colonial period, the Dutch rulers made use
of this existing structure, ruling through Indonesian “regents” (equivalent to today’s districts). The
Netherlands imposed federalism as a last-ditch effort to maintain its role post World War II, but the
newly independent country soon after reverted to a unitary and centralized system. Under Soekarno’s
“guided democracy” some early steps and experimentation in decentralization took place. This was
followed by Soeharto’s New Order, characterized by centralism and neo-patrimonialism. His regime
expanded deconcentration structures in the regions, but promised regional autonomy was never
delivered. The most visible effort was a 1994 pilot project launched in 26 districts, but the set of
functions transferred were limited and were not accompanied by corresponding resources. This pilot
was overtaken by events; in 1998 Indonesia suffered the effects of the Asian Financial Crisis. The
ensuing political turmoil, with regime change at the center, provided fertile ground for decentralization
reforms.
11. Indonesia’s decentralization was shaped by the political tumult arising from the Asia Financial
Crisis, and was driven by long-standing grievances regarding limited democracy, concentration of
wealth and political centralization. The decentralization reforms were essentially regional elite driven,
especially from resource-rich regions, and raised concerns about national disintegration. Hence the
response was a political accommodation that was radical in content (deep devolution) but targeted to
the district/city level regions to safeguard national integrity and the unitary state.3 A tentative
discussion about federalism at this time was brief and truncated (Ferrazzi, 2000). Provincial
governments, as autonomous governments, were given only a weak intermediary role toward lower
levels of government. The Provincial Governor dual role was maintained, in relation to supervision of
the district/city governments but this dual role was not clearly delineated at this time.
12. Decentralization reforms were radical and swift (earning the label Big Bang), raising risks that
were managed in part by opting for a relatively clean transition from deconcentration to
devolution. The 1999 laws on regional government and fiscal balance were drafted in a rushed and
closed fashion by a handful of officials and selected academics (dubbed the Team of Seven) and were
implemented fully by 2001. The functions transferred through Law 22/1999 on regional government
(and its Government Regulation 25/2000 providing the detailed list) were extensive and
comprehensive (sector wise). Resources somewhat consistent with the functions were part of the
reform. Over 2 million central government staff were shifted to regional government status. Law
25/1999 on regional finances gave the regions 26% of the total net revenue of government (after
revenue sharing) in a 90/10 split between the districts/cities and provinces.4 The dominant transfer
3 Accommodations were made in the case of the provinces of Papua and Aceh, which were given a special form of autonomy to
dampen separatist sentiments in 2001 and 2005 respectively. In 2002, under international pressure, the province of East Timor
was allowed independence.
4 For 2019 this is reset slightly higher at 28.7% of net revenues, and with a slightly adjusted split as well, with provincial
government receiving 14.1% and district/city governments 85.9%. The latter split presumably takes into account the recent
recentralization of some functions from district/city government to provincial government.
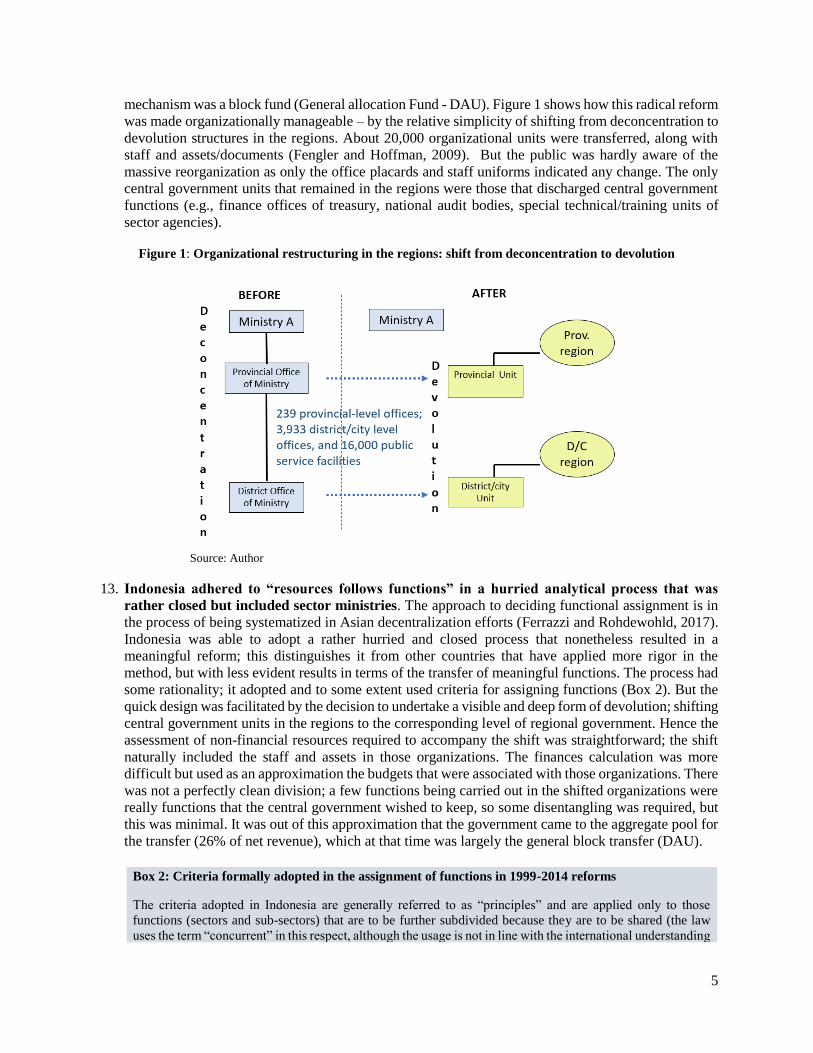
5
mechanism was a block fund (General allocation Fund - DAU). Figure 1 shows how this radical reform
was made organizationally manageable – by the relative simplicity of shifting from deconcentration to
devolution structures in the regions. About 20,000 organizational units were transferred, along with
staff and assets/documents (Fengler and Hoffman, 2009). But the public was hardly aware of the
massive reorganization as only the office placards and staff uniforms indicated any change. The only
central government units that remained in the regions were those that discharged central government
functions (e.g., finance offices of treasury, national audit bodies, special technical/training units of
sector agencies).
Figure 1: Organizational restructuring in the regions: shift from deconcentration to devolution
Source: Author
13. Indonesia adhered to “resources follows functions” in a hurried analytical process that was
rather closed but included sector ministries. The approach to deciding functional assignment is in
the process of being systematized in Asian decentralization efforts (Ferrazzi and Rohdewohld, 2017).
Indonesia was able to adopt a rather hurried and closed process that nonetheless resulted in a
meaningful reform; this distinguishes it from other countries that have applied more rigor in the
method, but with less evident results in terms of the transfer of meaningful functions. The process had
some rationality; it adopted and to some extent used criteria for assigning functions (Box 2). But the
quick design was facilitated by the decision to undertake a visible and deep form of devolution; shifting
central government units in the regions to the corresponding level of regional government. Hence the
assessment of non-financial resources required to accompany the shift was straightforward; the shift
naturally included the staff and assets in those organizations. The finances calculation was more
difficult but used as an approximation the budgets that were associated with those organizations. There
was not a perfectly clean division; a few functions being carried out in the shifted organizations were
really functions that the central government wished to keep, so some disentangling was required, but
this was minimal. It was out of this approximation that the government came to the aggregate pool for
the transfer (26% of net revenue), which at that time was largely the general block transfer (DAU).
Box 2: Criteria formally adopted in the assignment of functions in 1999-2014 reforms
The criteria adopted in Indonesia are generally referred to as “principles” and are applied only to those
functions (sectors and sub-sectors) that are to be further subdivided because they are to be shared (the law
uses the term “concurrent” in this respect, although the usage is not in line with the international understanding
6
of concurrent, where the division of functions process has ended and still two or more levels of government
are empowered to carry out the very same function). The principles were culled and adapted from international
experience, with development partners playing a large role in exposing Indonesian officials to the relevant
literature. The principles, or criteria as they are generally referred to internationally, were discussed quite
deeply within the ministry leading the decentralization policy (The Ministry for Administrative Reform).
Stakeholders or experts were not brought into the discussion. As explained in the Law 23/2014, the principles
are as follows:
Accountability: related to the proximity of the regional government to the impact of the function.
Efficiency: related to the ability to extract the highest utility from the function.
Externalities: related to the scope of the impact arising from the function
Strategic national interest: related to maintaining the integrity and unity of the state.
The principles were shared informally with the sector ministries, and several were given support in applying
them. However, there was little checking on how thoroughly and consistently sector ministries applied the
principles. One of the challenges in applying the principles is the way they were adapted; the above definitions
veer somewhat from those adopted internationally (see Ferrazzi and Rohdewohld, 2017). For instance,
externality is generally viewed as the impact felt by other jurisdictions in the discharge of a function. Notably
missing is the principle/criteria of economies of scale.
Source: Author’s elaboration.
14. While the larger political reforms ensured more contested regional government elections,
decentralization lacked sufficient complementary mechanisms to ensure greater accountability
to citizens and better overall governance. This stems in part from the fact that decentralization was
political accommodation of regional elite (at least initially) and did not arise from any groundswell of
citizen demand for improved service delivery. Decentralization reforms reinforced electoral reforms
(local politicians had larger decisions to make and more resources) but the motivation for these related
reforms had more to do with the regional elite wanting their turn to enjoy the benefits of development
and what comes with power than a desire to improve governance. For this reason, decentralization also
served to enlarge the patronage system, although it also destabilized it for a while, upsetting the
informal market for promotions, contracts etc.
15. Resistance to decentralization did make itself felt, largely by sector ministries fighting a rear-
guard battle, to retain funds and “their” laws/regulations. While the initial pressure was felt by all
politicians to come through with deep reforms, some senior officials in certain ministries were not
enthusiastic, or rightfully were concerned about some aspects of the reforms. As some predicted, the
communication/reporting channels were disrupted as district/city regional heads (dubbed “little
kings”) thumbed their nose at the central government with the weight of favourable constitutional and
legal principles (ignoring some legislative and regulatory detail on their obligations). The resistance
from sector ministries took the form of directives to regional government that referred to legal
instruments that were not yet amended to conform to the new regional government framework.5 There
was also some resistance from other stakeholders, with provincial governors concerned that their role
as representatives of the central government was not sufficiently robust. Teachers also were wary of
being managed by district/city governments. Some of these concerns dissipated over time, while others
grew to fuel the 2004 and 2014 revisions of the regional government framework.
5 These directives often clashed with those of the Ministry of Home Affairs, the institution charged with providing general
guidance to subnational government and thus the source of many of the directives that sought to operationalize the new regional
government law and government regulations.
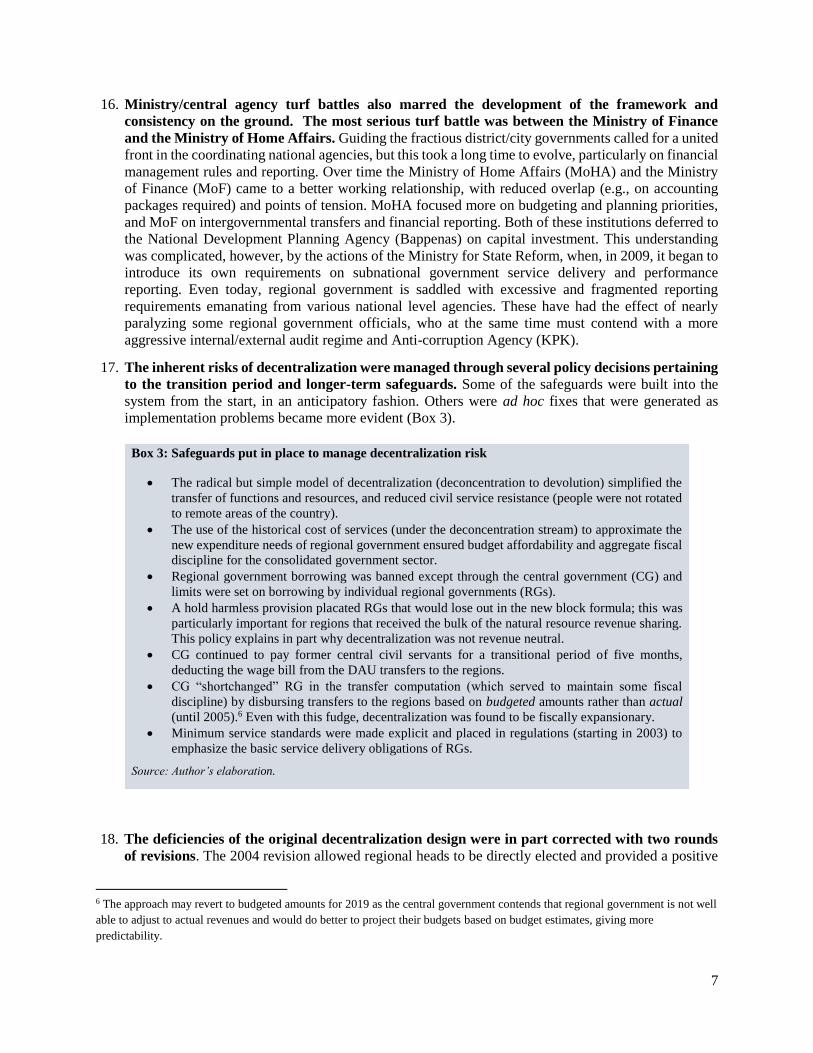
7
16. Ministry/central agency turf battles also marred the development of the framework and
consistency on the ground. The most serious turf battle was between the Ministry of Finance
and the Ministry of Home Affairs. Guiding the fractious district/city governments called for a united
front in the coordinating national agencies, but this took a long time to evolve, particularly on financial
management rules and reporting. Over time the Ministry of Home Affairs (MoHA) and the Ministry
of Finance (MoF) came to a better working relationship, with reduced overlap (e.g., on accounting
packages required) and points of tension. MoHA focused more on budgeting and planning priorities,
and MoF on intergovernmental transfers and financial reporting. Both of these institutions deferred to
the National Development Planning Agency (Bappenas) on capital investment. This understanding
was complicated, however, by the actions of the Ministry for State Reform, when, in 2009, it began to
introduce its own requirements on subnational government service delivery and performance
reporting. Even today, regional government is saddled with excessive and fragmented reporting
requirements emanating from various national level agencies. These have had the effect of nearly
paralyzing some regional government officials, who at the same time must contend with a more
aggressive internal/external audit regime and Anti-corruption Agency (KPK).
17. The inherent risks of decentralization were managed through several policy decisions pertaining
to the transition period and longer-term safeguards. Some of the safeguards were built into the
system from the start, in an anticipatory fashion. Others were ad hoc fixes that were generated as
implementation problems became more evident (Box 3).
Box 3: Safeguards put in place to manage decentralization risk
• The radical but simple model of decentralization (deconcentration to devolution) simplified the
transfer of functions and resources, and reduced civil service resistance (people were not rotated
to remote areas of the country).
• The use of the historical cost of services (under the deconcentration stream) to approximate the
new expenditure needs of regional government ensured budget affordability and aggregate fiscal
discipline for the consolidated government sector.
• Regional government borrowing was banned except through the central government (CG) and
limits were set on borrowing by individual regional governments (RGs).
• A hold harmless provision placated RGs that would lose out in the new block formula; this was
particularly important for regions that received the bulk of the natural resource revenue sharing.
This policy explains in part why decentralization was not revenue neutral.
• CG continued to pay former central civil servants for a transitional period of five months,
deducting the wage bill from the DAU transfers to the regions.
• CG “shortchanged” RG in the transfer computation (which served to maintain some fiscal
discipline) by disbursing transfers to the regions based on budgeted amounts rather than actual
(until 2005).6 Even with this fudge, decentralization was found to be fiscally expansionary.
• Minimum service standards were made explicit and placed in regulations (starting in 2003) to
emphasize the basic service delivery obligations of RGs.
Source: Author’s elaboration.
18. The deficiencies of the original decentralization design were in part corrected with two rounds
of revisions. The 2004 revision allowed regional heads to be directly elected and provided a positive
6 The approach may revert to budgeted amounts for 2019 as the central government contends that regional government is not well
able to adjust to actual revenues and would do better to project their budgets based on budget estimates, giving more
predictability.
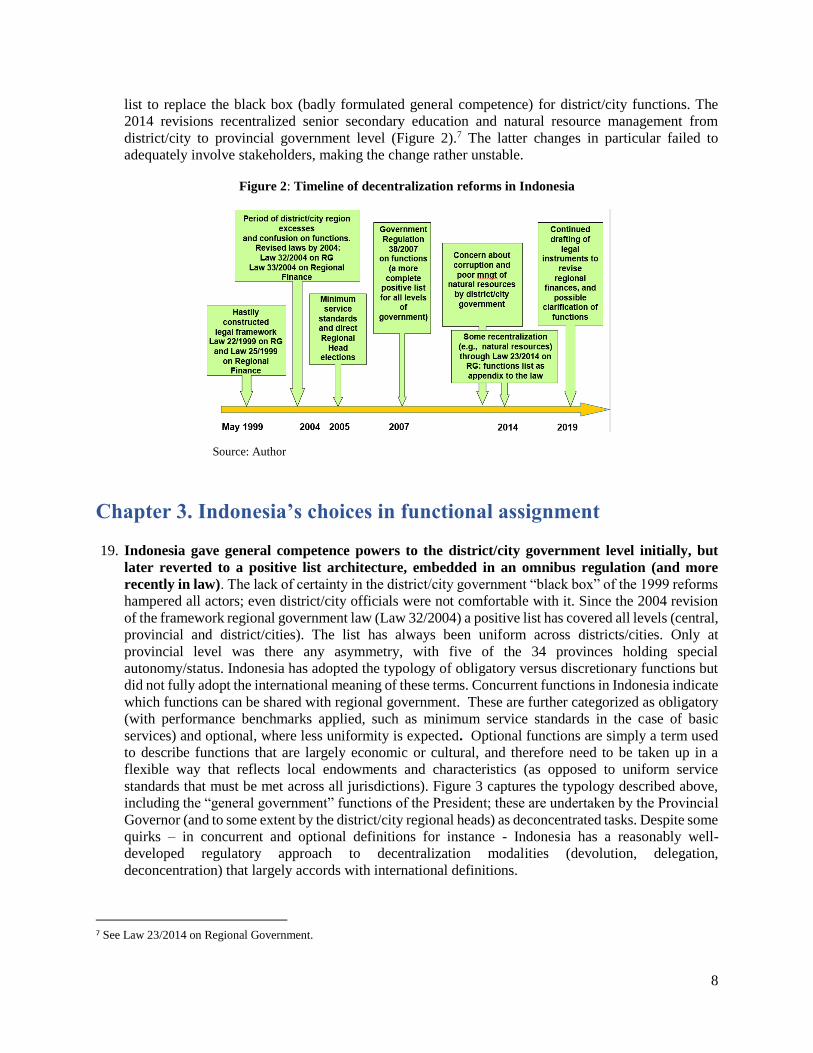
8
list to replace the black box (badly formulated general competence) for district/city functions. The
2014 revisions recentralized senior secondary education and natural resource management from
district/city to provincial government level (Figure 2).7 The latter changes in particular failed to
adequately involve stakeholders, making the change rather unstable.
Figure 2: Timeline of decentralization reforms in Indonesia
Source: Author
Chapter 3. Indonesia’s choices in functional assignment
19. Indonesia gave general competence powers to the district/city government level initially, but
later reverted to a positive list architecture, embedded in an omnibus regulation (and more
recently in law). The lack of certainty in the district/city government “black box” of the 1999 reforms
hampered all actors; even district/city officials were not comfortable with it. Since the 2004 revision
of the framework regional government law (Law 32/2004) a positive list has covered all levels (central,
provincial and district/cities). The list has always been uniform across districts/cities. Only at
provincial level was there any asymmetry, with five of the 34 provinces holding special
autonomy/status. Indonesia has adopted the typology of obligatory versus discretionary functions but
did not fully adopt the international meaning of these terms. Concurrent functions in Indonesia indicate
which functions can be shared with regional government. These are further categorized as obligatory
(with performance benchmarks applied, such as minimum service standards in the case of basic
services) and optional, where less uniformity is expected. Optional functions are simply a term used
to describe functions that are largely economic or cultural, and therefore need to be taken up in a
flexible way that reflects local endowments and characteristics (as opposed to uniform service
standards that must be met across all jurisdictions). Figure 3 captures the typology described above,
including the “general government” functions of the President; these are undertaken by the Provincial
Governor (and to some extent by the district/city regional heads) as deconcentrated tasks. Despite some
quirks – in concurrent and optional definitions for instance - Indonesia has a reasonably well-
developed regulatory approach to decentralization modalities (devolution, delegation,
deconcentration) that largely accords with international definitions.
7 See Law 23/2014 on Regional Government.
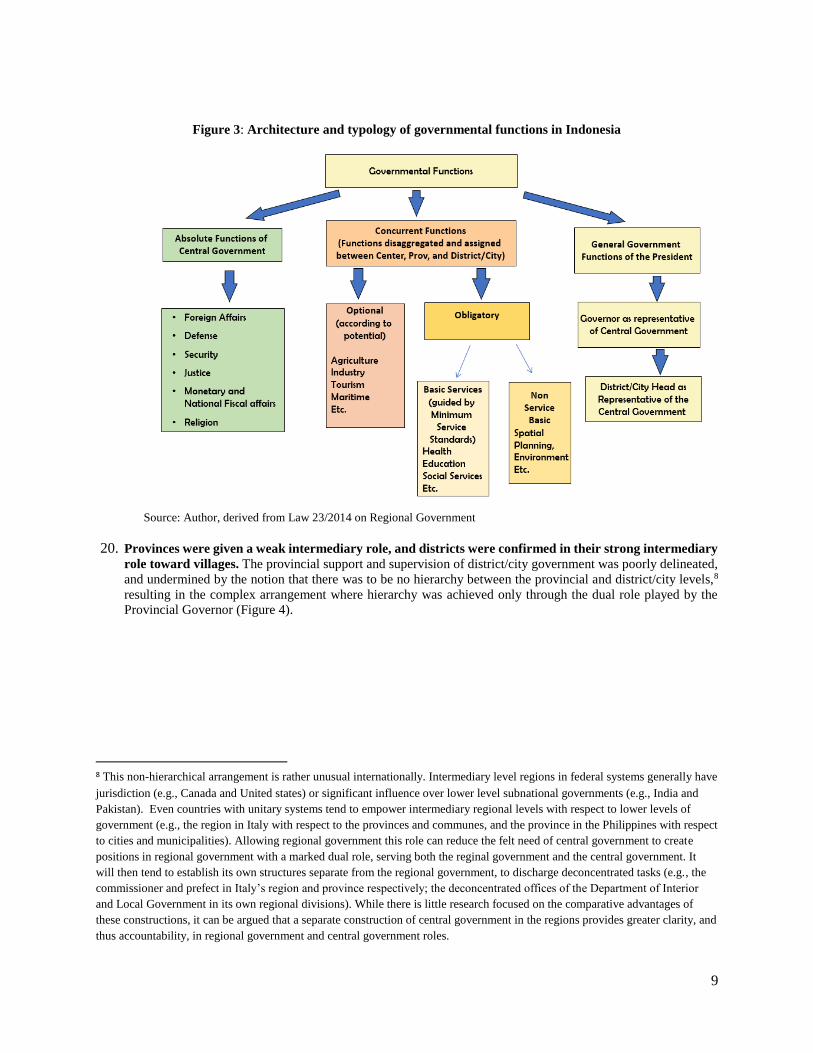
9
Figure 3: Architecture and typology of governmental functions in Indonesia
Source: Author, derived from Law 23/2014 on Regional Government
20. Provinces were given a weak intermediary role, and districts were confirmed in their strong intermediary
role toward villages. The provincial support and supervision of district/city government was poorly delineated,
and undermined by the notion that there was to be no hierarchy between the provincial and district/city levels,8
resulting in the complex arrangement where hierarchy was achieved only through the dual role played by the
Provincial Governor (Figure 4).
8 This non-hierarchical arrangement is rather unusual internationally. Intermediary level regions in federal systems generally have
jurisdiction (e.g., Canada and United states) or significant influence over lower level subnational governments (e.g., India and
Pakistan). Even countries with unitary systems tend to empower intermediary regional levels with respect to lower levels of
government (e.g., the region in Italy with respect to the provinces and communes, and the province in the Philippines with respect
to cities and municipalities). Allowing regional government this role can reduce the felt need of central government to create
positions in regional government with a marked dual role, serving both the reginal government and the central government. It
will then tend to establish its own structures separate from the regional government, to discharge deconcentrated tasks (e.g., the
commissioner and prefect in Italy’s region and province respectively; the deconcentrated offices of the Department of Interior
and Local Government in its own regional divisions). While there is little research focused on the comparative advantages of
these constructions, it can be argued that a separate construction of central government in the regions provides greater clarity, and
thus accountability, in regional government and central government roles.
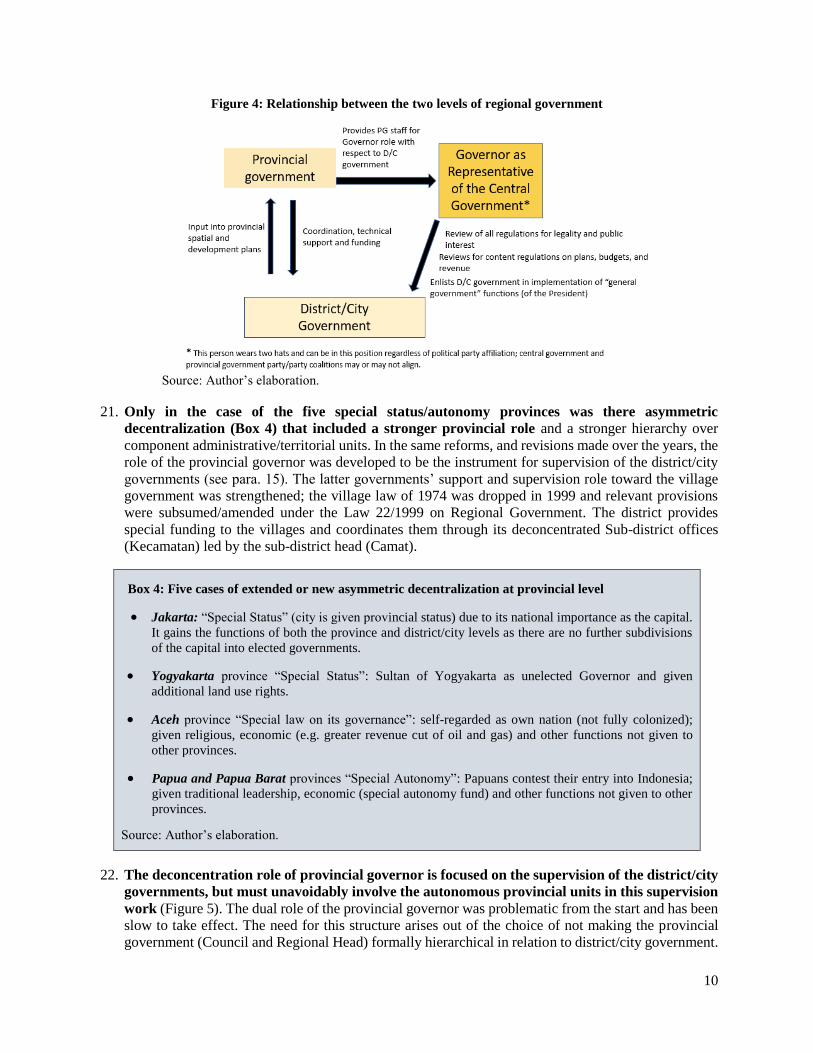
10
Figure 4: Relationship between the two levels of regional government
Source: Author’s elaboration.
21. Only in the case of the five special status/autonomy provinces was there asymmetric
decentralization (Box 4) that included a stronger provincial role and a stronger hierarchy over
component administrative/territorial units. In the same reforms, and revisions made over the years, the
role of the provincial governor was developed to be the instrument for supervision of the district/city
governments (see para. 15). The latter governments’ support and supervision role toward the village
government was strengthened; the village law of 1974 was dropped in 1999 and relevant provisions
were subsumed/amended under the Law 22/1999 on Regional Government. The district provides
special funding to the villages and coordinates them through its deconcentrated Sub-district offices
(Kecamatan) led by the sub-district head (Camat).
Box 4: Five cases of extended or new asymmetric decentralization at provincial level
• Jakarta: “Special Status” (city is given provincial status) due to its national importance as the capital.
It gains the functions of both the province and district/city levels as there are no further subdivisions
of the capital into elected governments.
• Yogyakarta province “Special Status”: Sultan of Yogyakarta as unelected Governor and given
additional land use rights.
• Aceh province “Special law on its governance”: self-regarded as own nation (not fully colonized);
given religious, economic (e.g. greater revenue cut of oil and gas) and other functions not given to
other provinces.
• Papua and Papua Barat provinces “Special Autonomy”: Papuans contest their entry into Indonesia;
given traditional leadership, economic (special autonomy fund) and other functions not given to other
provinces.
Source: Author’s elaboration.
22. The deconcentration role of provincial governor is focused on the supervision of the district/city
governments, but must unavoidably involve the autonomous provincial units in this supervision
work (Figure 5). The dual role of the provincial governor was problematic from the start and has been
slow to take effect. The need for this structure arises out of the choice of not making the provincial
government (Council and Regional Head) formally hierarchical in relation to district/city government.
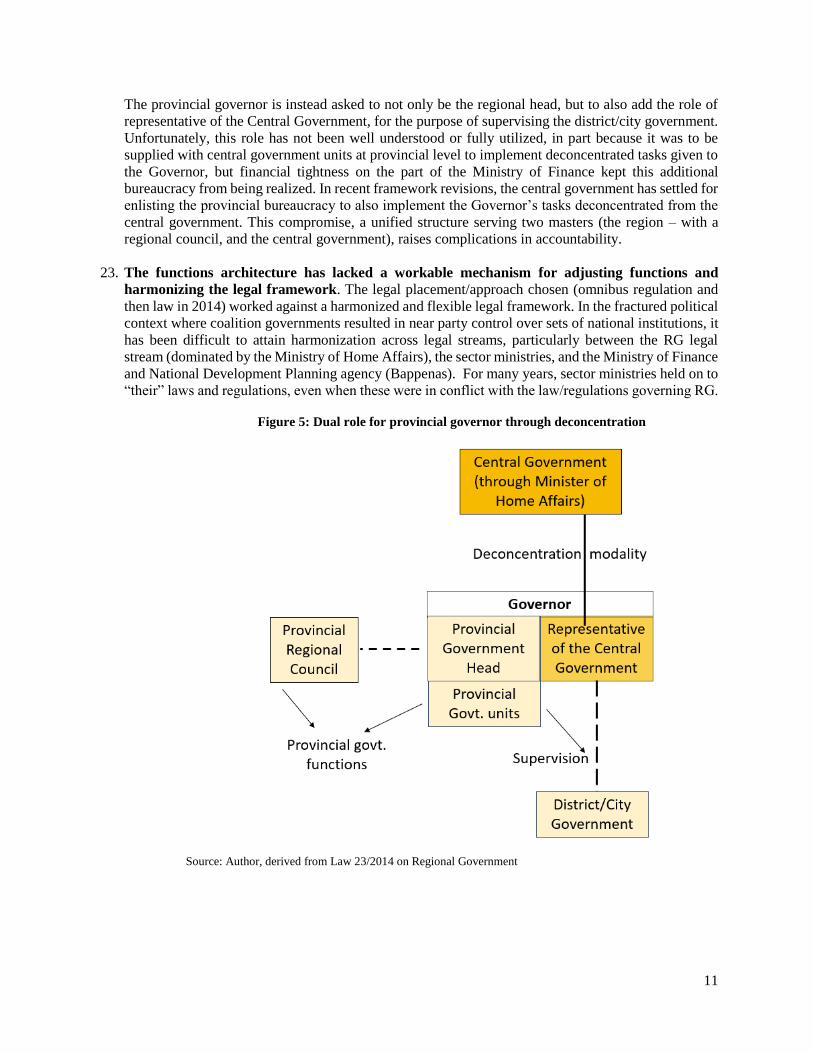
11
The provincial governor is instead asked to not only be the regional head, but to also add the role of
representative of the Central Government, for the purpose of supervising the district/city government.
Unfortunately, this role has not been well understood or fully utilized, in part because it was to be
supplied with central government units at provincial level to implement deconcentrated tasks given to
the Governor, but financial tightness on the part of the Ministry of Finance kept this additional
bureaucracy from being realized. In recent framework revisions, the central government has settled for
enlisting the provincial bureaucracy to also implement the Governor’s tasks deconcentrated from the
central government. This compromise, a unified structure serving two masters (the region – with a
regional council, and the central government), raises complications in accountability.
23. The functions architecture has lacked a workable mechanism for adjusting functions and
harmonizing the legal framework. The legal placement/approach chosen (omnibus regulation and
then law in 2014) worked against a harmonized and flexible legal framework. In the fractured political
context where coalition governments resulted in near party control over sets of national institutions, it
has been difficult to attain harmonization across legal streams, particularly between the RG legal
stream (dominated by the Ministry of Home Affairs), the sector ministries, and the Ministry of Finance
and National Development Planning agency (Bappenas). For many years, sector ministries held on to
“their” laws and regulations, even when these were in conflict with the law/regulations governing RG.
Figure 5: Dual role for provincial governor through deconcentration
Source: Author, derived from Law 23/2014 on Regional Government
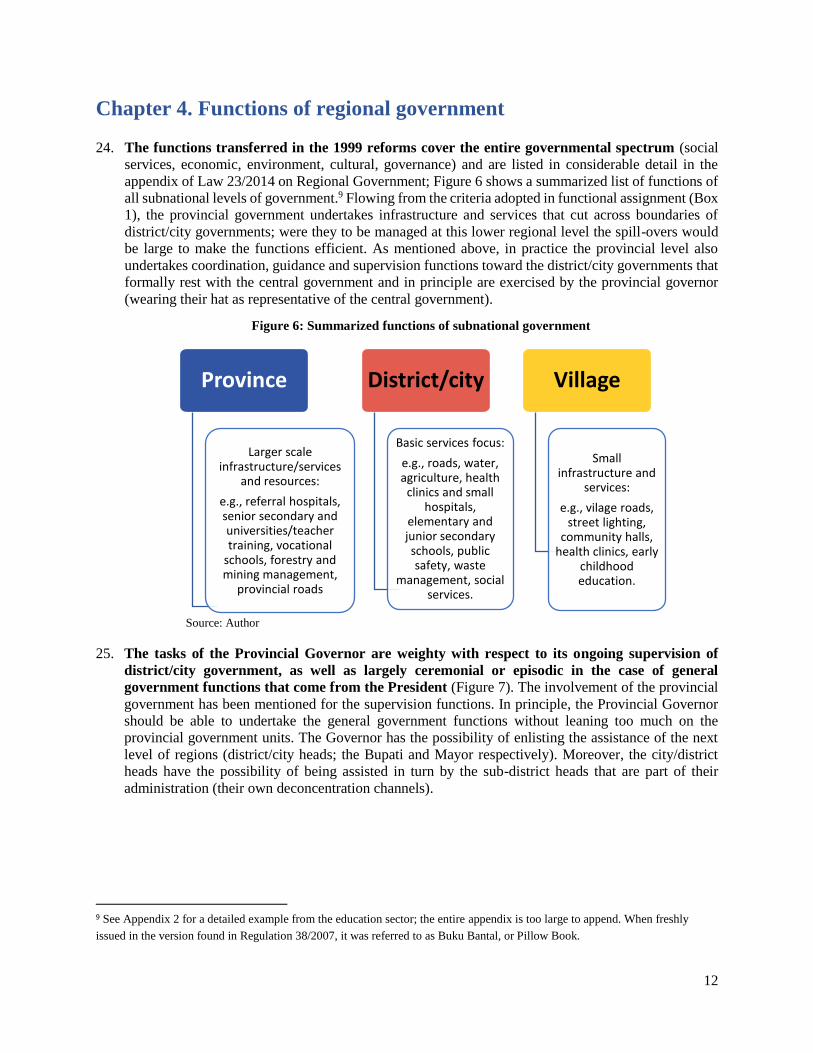
12
Chapter 4. Functions of regional government
24. The functions transferred in the 1999 reforms cover the entire governmental spectrum (social
services, economic, environment, cultural, governance) and are listed in considerable detail in the
appendix of Law 23/2014 on Regional Government; Figure 6 shows a summarized list of functions of
all subnational levels of government.9 Flowing from the criteria adopted in functional assignment (Box
1), the provincial government undertakes infrastructure and services that cut across boundaries of
district/city governments; were they to be managed at this lower regional level the spill-overs would
be large to make the functions efficient. As mentioned above, in practice the provincial level also
undertakes coordination, guidance and supervision functions toward the district/city governments that
formally rest with the central government and in principle are exercised by the provincial governor
(wearing their hat as representative of the central government).
Figure 6: Summarized functions of subnational government
Source: Author
25. The tasks of the Provincial Governor are weighty with respect to its ongoing supervision of
district/city government, as well as largely ceremonial or episodic in the case of general
government functions that come from the President (Figure 7). The involvement of the provincial
government has been mentioned for the supervision functions. In principle, the Provincial Governor
should be able to undertake the general government functions without leaning too much on the
provincial government units. The Governor has the possibility of enlisting the assistance of the next
level of regions (district/city heads; the Bupati and Mayor respectively). Moreover, the city/district
heads have the possibility of being assisted in turn by the sub-district heads that are part of their
administration (their own deconcentration channels).
9 See Appendix 2 for a detailed example from the education sector; the entire appendix is too large to append. When freshly
issued in the version found in Regulation 38/2007, it was referred to as Buku Bantal, or Pillow Book.
Province
Larger scale infrastructure/services
and resources:
e.g., referral hospitals, senior secondary and universities/teacher training, vocational
schools, forestry and mining management,
provincial roads
District/city
Basic services focus:
e.g., roads, water, agriculture, health
clinics and small hospitals,
elementary and junior secondary schools, public safety, waste
management, social services.
Village
Small infrastructure and
services:
e.g., vilage roads, street lighting,
community halls, health clinics, early
childhood education.
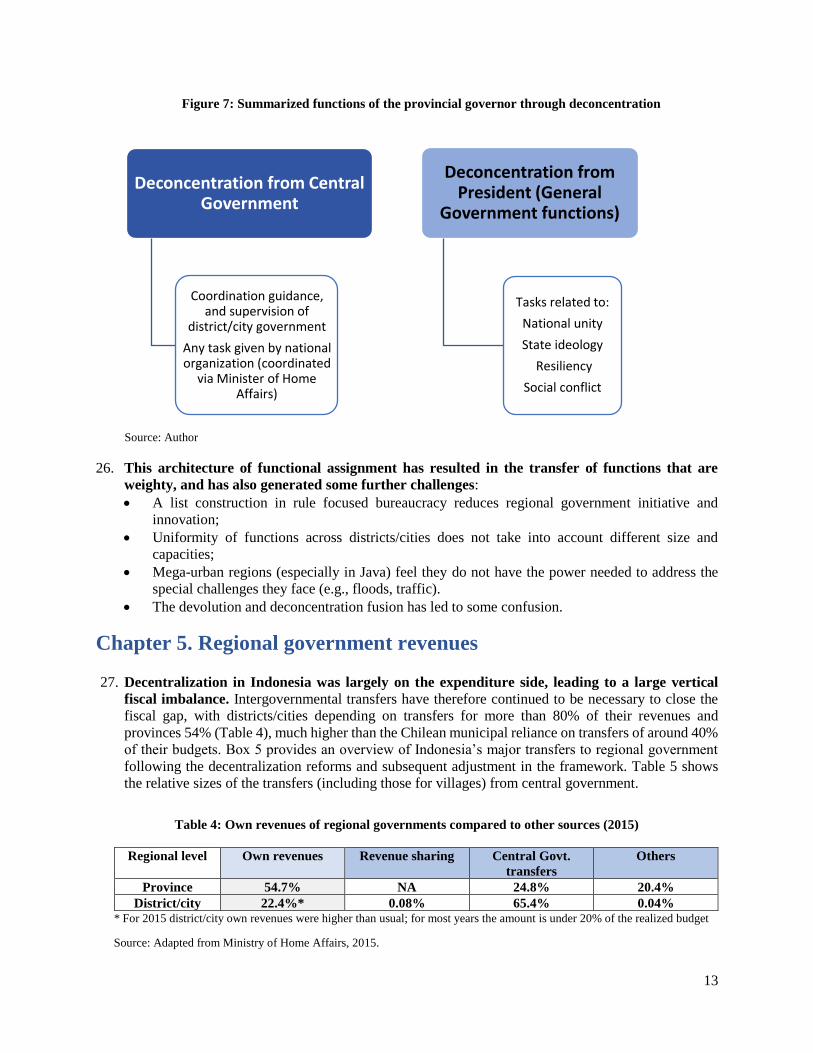
13
Figure 7: Summarized functions of the provincial governor through deconcentration
Source: Author
26. This architecture of functional assignment has resulted in the transfer of functions that are
weighty, and has also generated some further challenges:
• A list construction in rule focused bureaucracy reduces regional government initiative and
innovation;
• Uniformity of functions across districts/cities does not take into account different size and
capacities;
• Mega-urban regions (especially in Java) feel they do not have the power needed to address the
special challenges they face (e.g., floods, traffic).
• The devolution and deconcentration fusion has led to some confusion.
Chapter 5. Regional government revenues
27. Decentralization in Indonesia was largely on the expenditure side, leading to a large vertical
fiscal imbalance. Intergovernmental transfers have therefore continued to be necessary to close the
fiscal gap, with districts/cities depending on transfers for more than 80% of their revenues and
provinces 54% (Table 4), much higher than the Chilean municipal reliance on transfers of around 40%
of their budgets. Box 5 provides an overview of Indonesia’s major transfers to regional government
following the decentralization reforms and subsequent adjustment in the framework. Table 5 shows
the relative sizes of the transfers (including those for villages) from central government.
Table 4: Own revenues of regional governments compared to other sources (2015)
Regional level Own revenues Revenue sharing Central Govt.
transfers
Others
Province 54.7% NA 24.8% 20.4%
District/city 22.4%* 0.08% 65.4% 0.04% * For 2015 district/city own revenues were higher than usual; for most years the amount is under 20% of the realized budget
Source: Adapted from Ministry of Home Affairs, 2015.
Deconcentration from Central Government
Coordination guidance, and supervision of
district/city government
Any task given by national organization (coordinated
via Minister of Home Affairs)
Deconcentration from President (General
Government functions)
Tasks related to:
National unity
State ideology
Resiliency
Social conflict
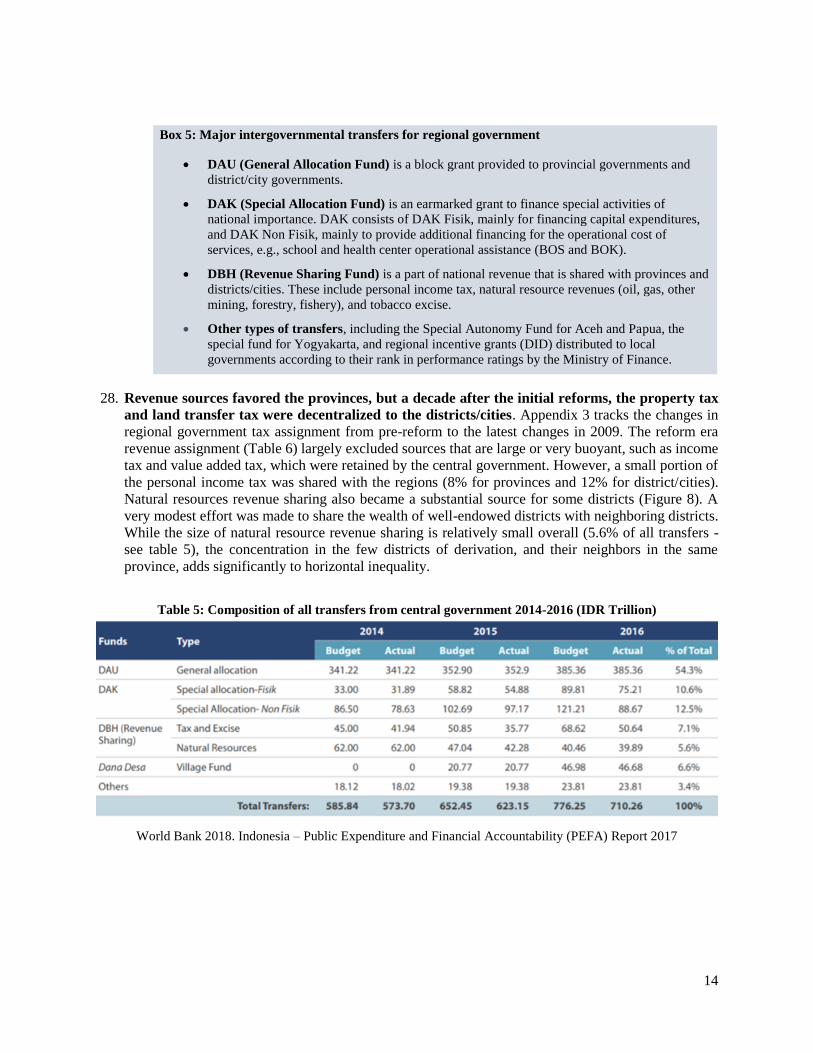
14
Box 5: Major intergovernmental transfers for regional government
• DAU (General Allocation Fund) is a block grant provided to provincial governments and
district/city governments.
• DAK (Special Allocation Fund) is an earmarked grant to finance special activities of
national importance. DAK consists of DAK Fisik, mainly for financing capital expenditures,
and DAK Non Fisik, mainly to provide additional financing for the operational cost of
services, e.g., school and health center operational assistance (BOS and BOK).
• DBH (Revenue Sharing Fund) is a part of national revenue that is shared with provinces and
districts/cities. These include personal income tax, natural resource revenues (oil, gas, other
mining, forestry, fishery), and tobacco excise.
• Other types of transfers, including the Special Autonomy Fund for Aceh and Papua, the
special fund for Yogyakarta, and regional incentive grants (DID) distributed to local
governments according to their rank in performance ratings by the Ministry of Finance.
28. Revenue sources favored the provinces, but a decade after the initial reforms, the property tax
and land transfer tax were decentralized to the districts/cities. Appendix 3 tracks the changes in
regional government tax assignment from pre-reform to the latest changes in 2009. The reform era
revenue assignment (Table 6) largely excluded sources that are large or very buoyant, such as income
tax and value added tax, which were retained by the central government. However, a small portion of
the personal income tax was shared with the regions (8% for provinces and 12% for district/cities).
Natural resources revenue sharing also became a substantial source for some districts (Figure 8). A
very modest effort was made to share the wealth of well-endowed districts with neighboring districts.
While the size of natural resource revenue sharing is relatively small overall (5.6% of all transfers -
see table 5), the concentration in the few districts of derivation, and their neighbors in the same
province, adds significantly to horizontal inequality.
Table 5: Composition of all transfers from central government 2014-2016 (IDR Trillion)
World Bank 2018. Indonesia – Public Expenditure and Financial Accountability (PEFA) Report 2017
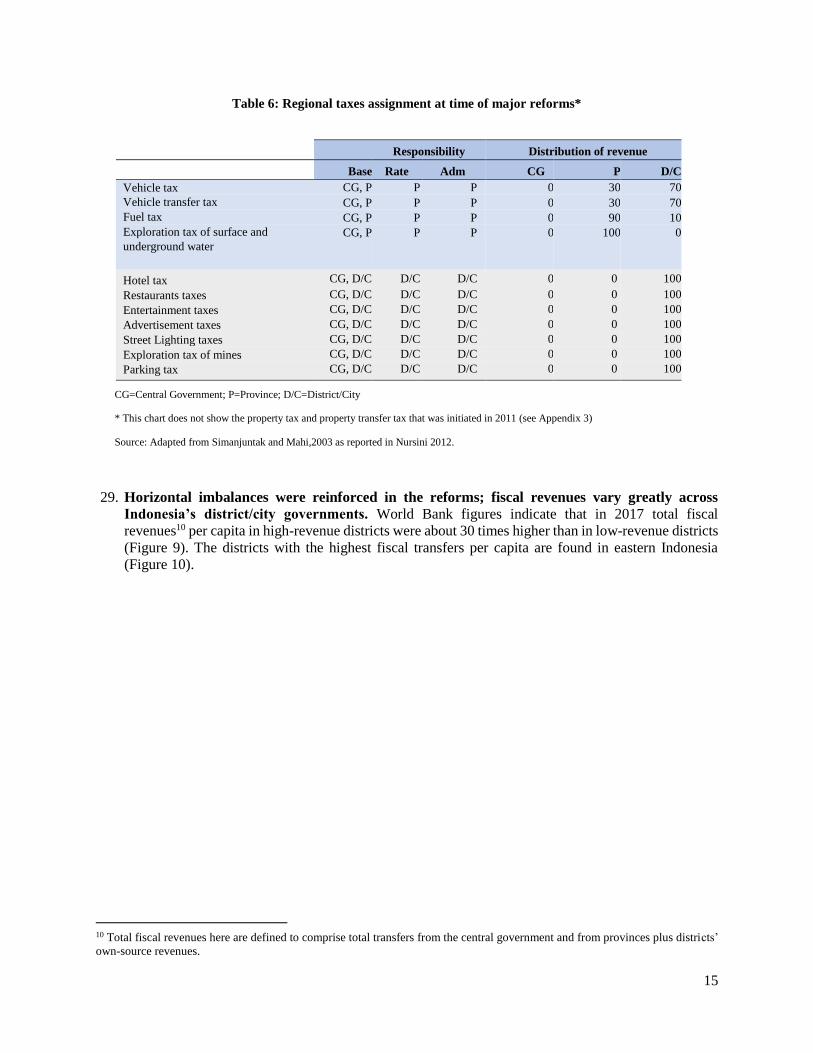
15
Table 6: Regional taxes assignment at time of major reforms*
Responsibility Distribution of revenue
Base Rate Adm CG P D/C
Vehicle tax CG, P P P 0 30 70
Vehicle transfer tax CG, P P P 0 30 70
Fuel tax CG, P P P 0 90 10
Exploration tax of surface and
underground water
CG, P P P 0 100 0
Hotel tax CG, D/C D/C D/C 0 0 100
Restaurants taxes CG, D/C D/C D/C 0 0 100
Entertainment taxes CG, D/C D/C D/C 0 0 100
Advertisement taxes CG, D/C D/C D/C 0 0 100
Street Lighting taxes CG, D/C D/C D/C 0 0 100
Exploration tax of mines CG, D/C D/C D/C 0 0 100
Parking tax CG, D/C D/C D/C 0 0 100
CG=Central Government; P=Province; D/C=District/City
* This chart does not show the property tax and property transfer tax that was initiated in 2011 (see Appendix 3)
Source: Adapted from Simanjuntak and Mahi,2003 as reported in Nursini 2012.
29. Horizontal imbalances were reinforced in the reforms; fiscal revenues vary greatly across
Indonesia’s district/city governments. World Bank figures indicate that in 2017 total fiscal
revenues10 per capita in high-revenue districts were about 30 times higher than in low-revenue districts
(Figure 9). The districts with the highest fiscal transfers per capita are found in eastern Indonesia
(Figure 10).
10 Total fiscal revenues here are defined to comprise total transfers from the central government and from provinces plus districts’
own-source revenues.

16
Figure 8: Natural Resources Revenue Sharing (%) between all levels
Source: Law 33/2004 as reported in Agustina et al. 2012.
Figure 9: Indonesia’s regional inequality in per capita revenues compared to other countries
Source: OECD, 2018.
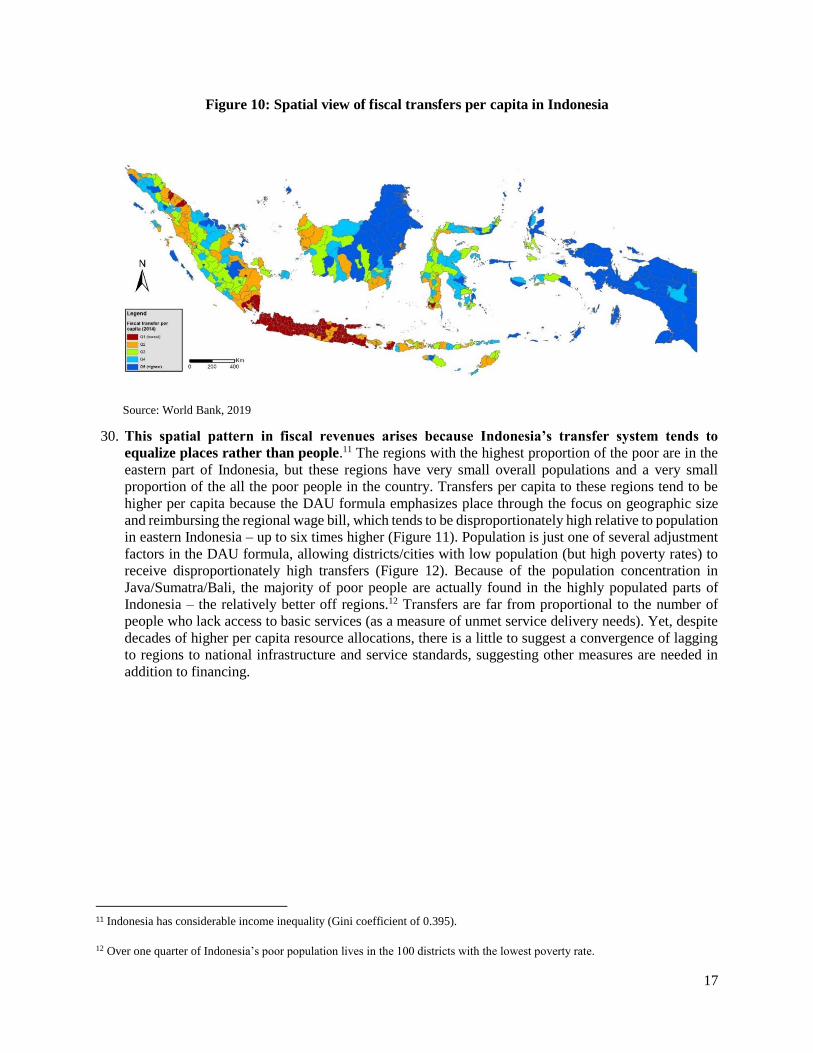
17
Figure 10: Spatial view of fiscal transfers per capita in Indonesia
Source: World Bank, 2019
30. This spatial pattern in fiscal revenues arises because Indonesia’s transfer system tends to
equalize places rather than people.11 The regions with the highest proportion of the poor are in the
eastern part of Indonesia, but these regions have very small overall populations and a very small
proportion of the all the poor people in the country. Transfers per capita to these regions tend to be
higher per capita because the DAU formula emphasizes place through the focus on geographic size
and reimbursing the regional wage bill, which tends to be disproportionately high relative to population
in eastern Indonesia – up to six times higher (Figure 11). Population is just one of several adjustment
factors in the DAU formula, allowing districts/cities with low population (but high poverty rates) to
receive disproportionately high transfers (Figure 12). Because of the population concentration in
Java/Sumatra/Bali, the majority of poor people are actually found in the highly populated parts of
Indonesia – the relatively better off regions.12 Transfers are far from proportional to the number of
people who lack access to basic services (as a measure of unmet service delivery needs). Yet, despite
decades of higher per capita resource allocations, there is a little to suggest a convergence of lagging
to regions to national infrastructure and service standards, suggesting other measures are needed in
addition to financing.
11 Indonesia has considerable income inequality (Gini coefficient of 0.395).
12 Over one quarter of Indonesia’s poor population lives in the 100 districts with the lowest poverty rate.
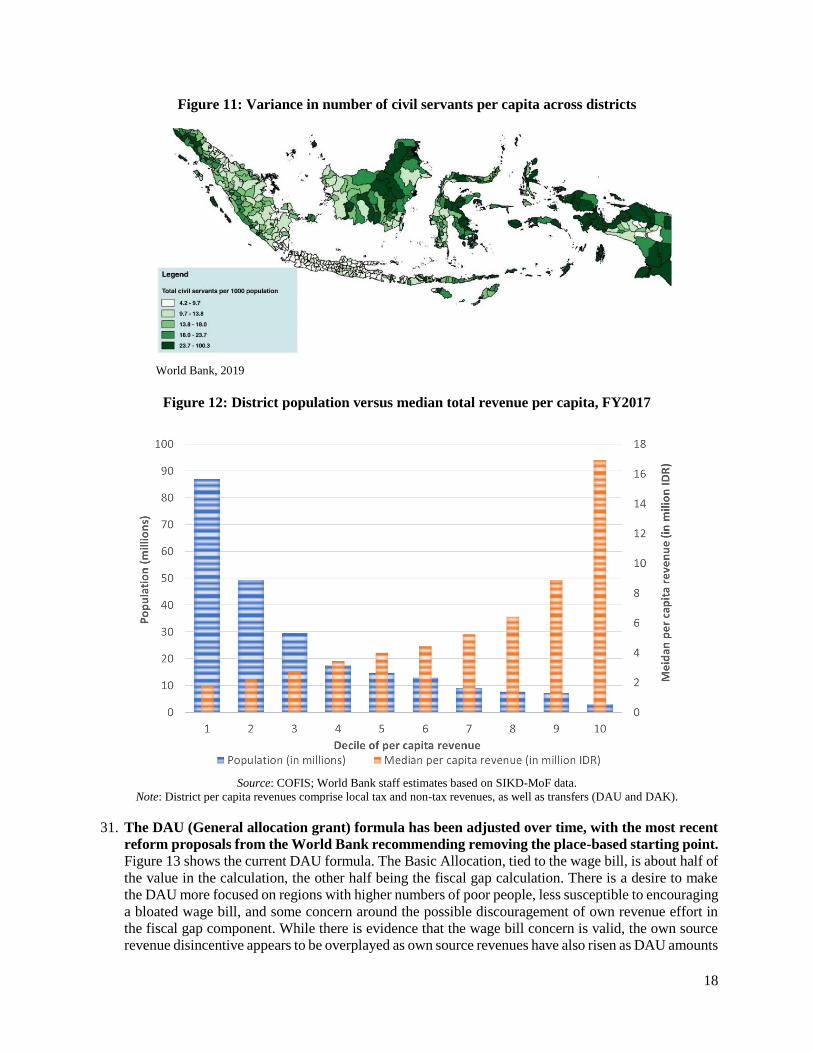
18
Figure 11: Variance in number of civil servants per capita across districts
World Bank, 2019
Figure 12: District population versus median total revenue per capita, FY2017
Source: COFIS; World Bank staff estimates based on SIKD-MoF data.
Note: District per capita revenues comprise local tax and non-tax revenues, as well as transfers (DAU and DAK).
31. The DAU (General allocation grant) formula has been adjusted over time, with the most recent
reform proposals from the World Bank recommending removing the place-based starting point.
Figure 13 shows the current DAU formula. The Basic Allocation, tied to the wage bill, is about half of
the value in the calculation, the other half being the fiscal gap calculation. There is a desire to make
the DAU more focused on regions with higher numbers of poor people, less susceptible to encouraging
a bloated wage bill, and some concern around the possible discouragement of own revenue effort in
the fiscal gap component. While there is evidence that the wage bill concern is valid, the own source
revenue disincentive appears to be overplayed as own source revenues have also risen as DAU amounts
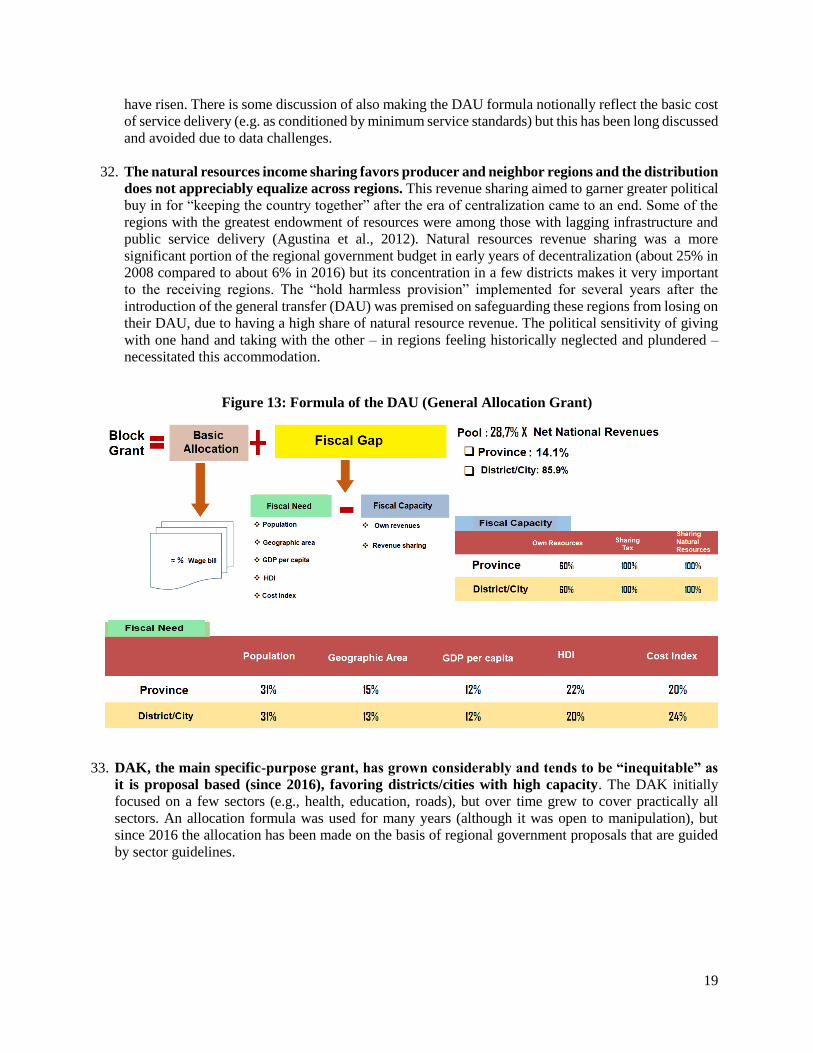
19
have risen. There is some discussion of also making the DAU formula notionally reflect the basic cost
of service delivery (e.g. as conditioned by minimum service standards) but this has been long discussed
and avoided due to data challenges.
32. The natural resources income sharing favors producer and neighbor regions and the distribution
does not appreciably equalize across regions. This revenue sharing aimed to garner greater political
buy in for “keeping the country together” after the era of centralization came to an end. Some of the
regions with the greatest endowment of resources were among those with lagging infrastructure and
public service delivery (Agustina et al., 2012). Natural resources revenue sharing was a more
significant portion of the regional government budget in early years of decentralization (about 25% in
2008 compared to about 6% in 2016) but its concentration in a few districts makes it very important
to the receiving regions. The “hold harmless provision” implemented for several years after the
introduction of the general transfer (DAU) was premised on safeguarding these regions from losing on
their DAU, due to having a high share of natural resource revenue. The political sensitivity of giving
with one hand and taking with the other – in regions feeling historically neglected and plundered –
necessitated this accommodation.
Figure 13: Formula of the DAU (General Allocation Grant)
33. DAK, the main specific-purpose grant, has grown considerably and tends to be “inequitable” as
it is proposal based (since 2016), favoring districts/cities with high capacity. The DAK initially
focused on a few sectors (e.g., health, education, roads), but over time grew to cover practically all
sectors. An allocation formula was used for many years (although it was open to manipulation), but
since 2016 the allocation has been made on the basis of regional government proposals that are guided
by sector guidelines.
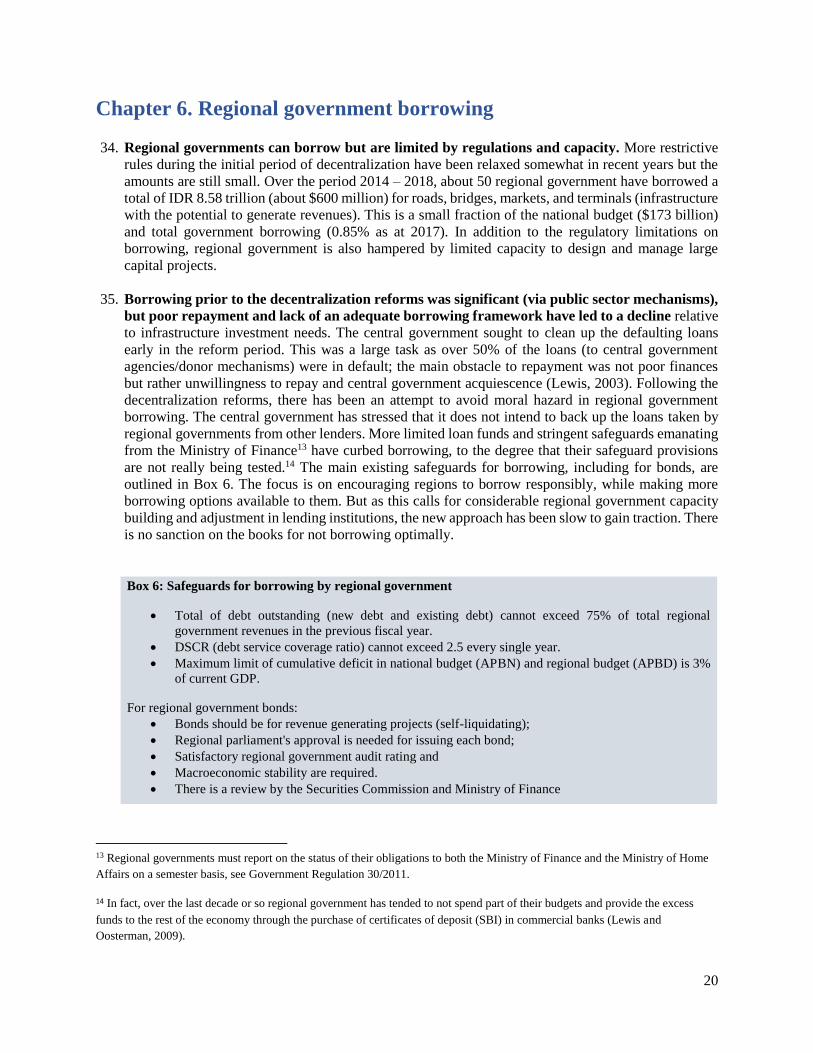
20
Chapter 6. Regional government borrowing
34. Regional governments can borrow but are limited by regulations and capacity. More restrictive
rules during the initial period of decentralization have been relaxed somewhat in recent years but the
amounts are still small. Over the period 2014 – 2018, about 50 regional government have borrowed a
total of IDR 8.58 trillion (about $600 million) for roads, bridges, markets, and terminals (infrastructure
with the potential to generate revenues). This is a small fraction of the national budget ($173 billion)
and total government borrowing (0.85% as at 2017). In addition to the regulatory limitations on
borrowing, regional government is also hampered by limited capacity to design and manage large
capital projects.
35. Borrowing prior to the decentralization reforms was significant (via public sector mechanisms),
but poor repayment and lack of an adequate borrowing framework have led to a decline relative
to infrastructure investment needs. The central government sought to clean up the defaulting loans
early in the reform period. This was a large task as over 50% of the loans (to central government
agencies/donor mechanisms) were in default; the main obstacle to repayment was not poor finances
but rather unwillingness to repay and central government acquiescence (Lewis, 2003). Following the
decentralization reforms, there has been an attempt to avoid moral hazard in regional government
borrowing. The central government has stressed that it does not intend to back up the loans taken by
regional governments from other lenders. More limited loan funds and stringent safeguards emanating
from the Ministry of Finance13 have curbed borrowing, to the degree that their safeguard provisions
are not really being tested.14 The main existing safeguards for borrowing, including for bonds, are
outlined in Box 6. The focus is on encouraging regions to borrow responsibly, while making more
borrowing options available to them. But as this calls for considerable regional government capacity
building and adjustment in lending institutions, the new approach has been slow to gain traction. There
is no sanction on the books for not borrowing optimally.
Box 6: Safeguards for borrowing by regional government
• Total of debt outstanding (new debt and existing debt) cannot exceed 75% of total regional
government revenues in the previous fiscal year.
• DSCR (debt service coverage ratio) cannot exceed 2.5 every single year.
• Maximum limit of cumulative deficit in national budget (APBN) and regional budget (APBD) is 3%
of current GDP.
For regional government bonds:
• Bonds should be for revenue generating projects (self-liquidating);
• Regional parliament's approval is needed for issuing each bond;
• Satisfactory regional government audit rating and
• Macroeconomic stability are required.
• There is a review by the Securities Commission and Ministry of Finance
13 Regional governments must report on the status of their obligations to both the Ministry of Finance and the Ministry of Home
Affairs on a semester basis, see Government Regulation 30/2011.
14 In fact, over the last decade or so regional government has tended to not spend part of their budgets and provide the excess
funds to the rest of the economy through the purchase of certificates of deposit (SBI) in commercial banks (Lewis and
Oosterman, 2009).
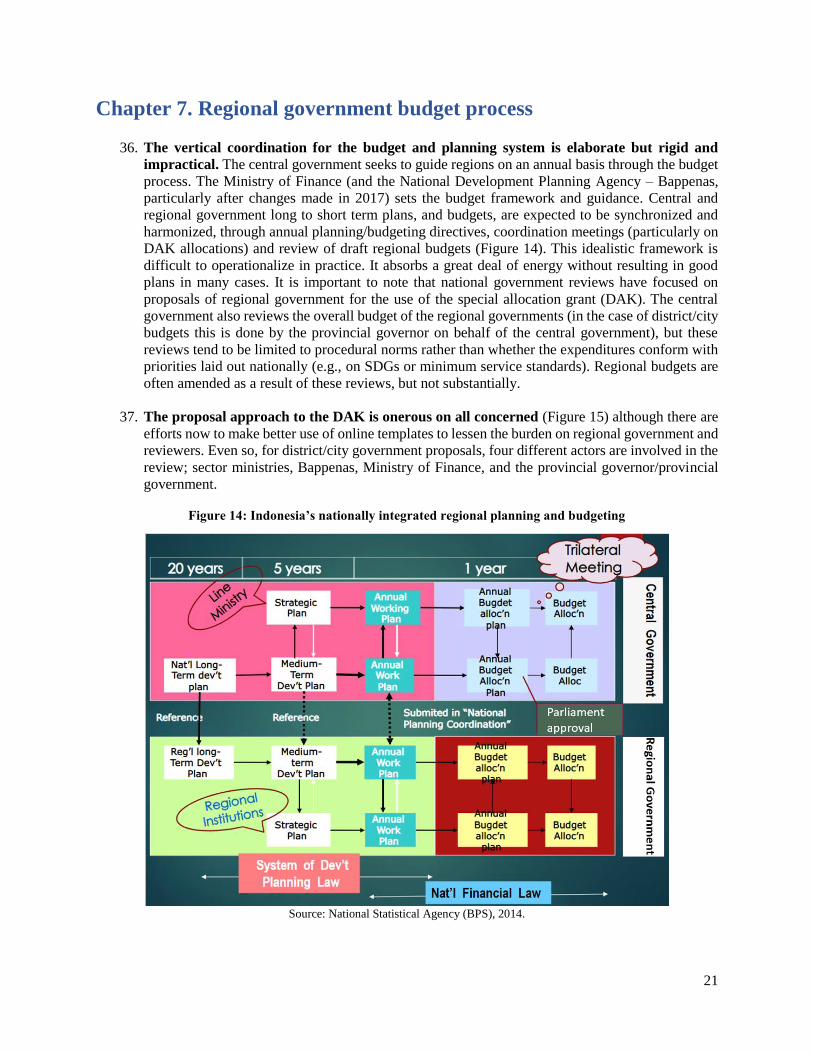
21
Chapter 7. Regional government budget process
36. The vertical coordination for the budget and planning system is elaborate but rigid and
impractical. The central government seeks to guide regions on an annual basis through the budget
process. The Ministry of Finance (and the National Development Planning Agency – Bappenas,
particularly after changes made in 2017) sets the budget framework and guidance. Central and
regional government long to short term plans, and budgets, are expected to be synchronized and
harmonized, through annual planning/budgeting directives, coordination meetings (particularly on
DAK allocations) and review of draft regional budgets (Figure 14). This idealistic framework is
difficult to operationalize in practice. It absorbs a great deal of energy without resulting in good
plans in many cases. It is important to note that national government reviews have focused on
proposals of regional government for the use of the special allocation grant (DAK). The central
government also reviews the overall budget of the regional governments (in the case of district/city
budgets this is done by the provincial governor on behalf of the central government), but these
reviews tend to be limited to procedural norms rather than whether the expenditures conform with
priorities laid out nationally (e.g., on SDGs or minimum service standards). Regional budgets are
often amended as a result of these reviews, but not substantially.
37. The proposal approach to the DAK is onerous on all concerned (Figure 15) although there are
efforts now to make better use of online templates to lessen the burden on regional government and
reviewers. Even so, for district/city government proposals, four different actors are involved in the
review; sector ministries, Bappenas, Ministry of Finance, and the provincial governor/provincial
government.
Figure 14: Indonesia’s nationally integrated regional planning and budgeting
Source: National Statistical Agency (BPS), 2014.
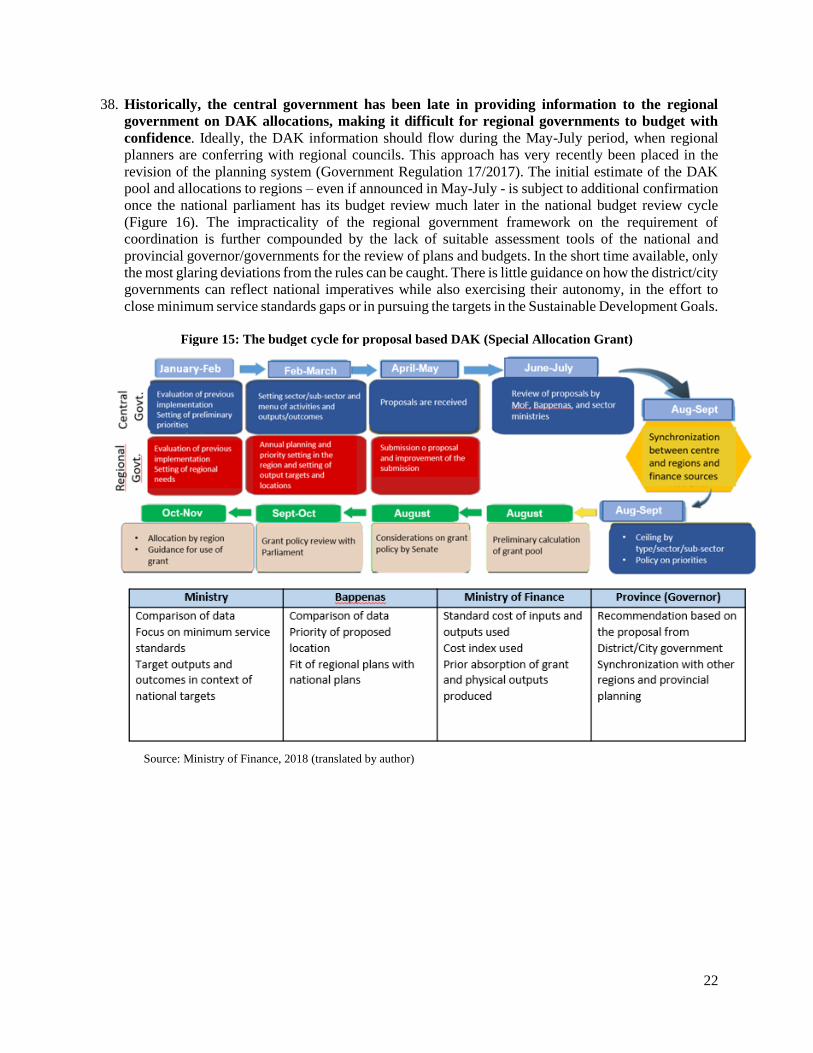
22
38. Historically, the central government has been late in providing information to the regional
government on DAK allocations, making it difficult for regional governments to budget with
confidence. Ideally, the DAK information should flow during the May-July period, when regional
planners are conferring with regional councils. This approach has very recently been placed in the
revision of the planning system (Government Regulation 17/2017). The initial estimate of the DAK
pool and allocations to regions – even if announced in May-July - is subject to additional confirmation
once the national parliament has its budget review much later in the national budget review cycle
(Figure 16). The impracticality of the regional government framework on the requirement of
coordination is further compounded by the lack of suitable assessment tools of the national and
provincial governor/governments for the review of plans and budgets. In the short time available, only
the most glaring deviations from the rules can be caught. There is little guidance on how the district/city
governments can reflect national imperatives while also exercising their autonomy, in the effort to
close minimum service standards gaps or in pursuing the targets in the Sustainable Development Goals.
Figure 15: The budget cycle for proposal based DAK (Special Allocation Grant)
Source: Ministry of Finance, 2018 (translated by author)
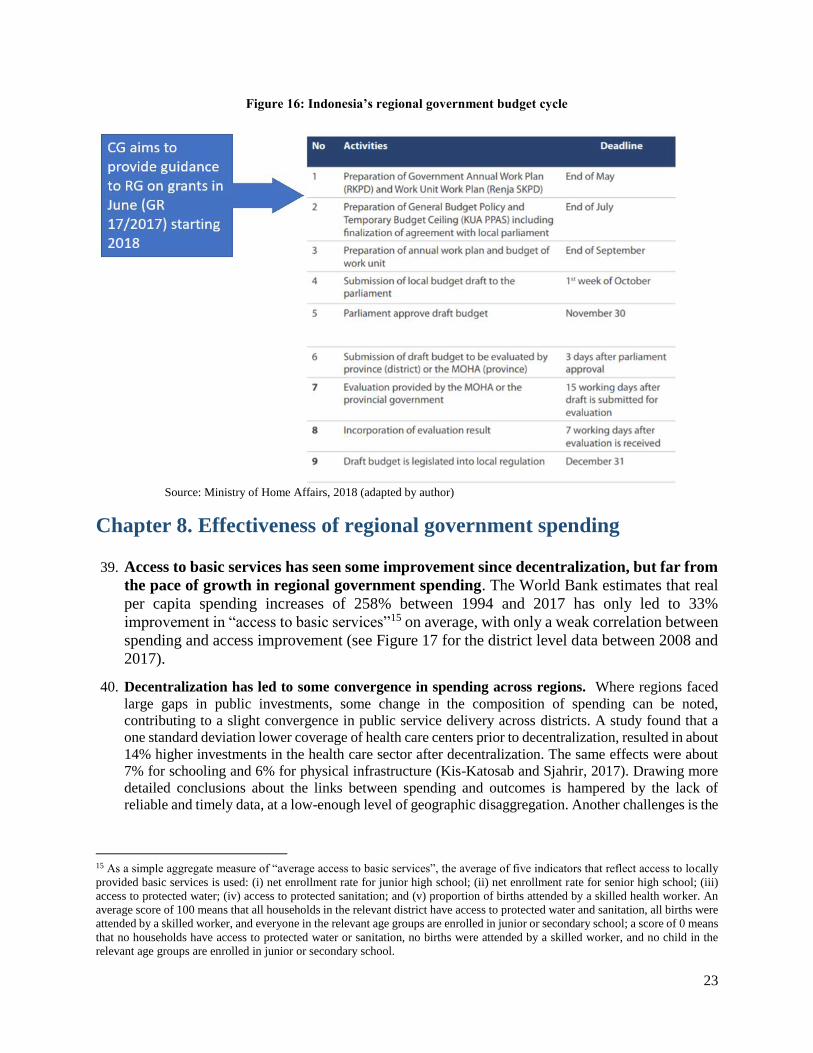
23
Figure 16: Indonesia’s regional government budget cycle
Source: Ministry of Home Affairs, 2018 (adapted by author)
Chapter 8. Effectiveness of regional government spending
39. Access to basic services has seen some improvement since decentralization, but far from
the pace of growth in regional government spending. The World Bank estimates that real
per capita spending increases of 258% between 1994 and 2017 has only led to 33%
improvement in “access to basic services”15 on average, with only a weak correlation between
spending and access improvement (see Figure 17 for the district level data between 2008 and
2017).
40. Decentralization has led to some convergence in spending across regions. Where regions faced
large gaps in public investments, some change in the composition of spending can be noted,
contributing to a slight convergence in public service delivery across districts. A study found that a
one standard deviation lower coverage of health care centers prior to decentralization, resulted in about
14% higher investments in the health care sector after decentralization. The same effects were about
7% for schooling and 6% for physical infrastructure (Kis-Katosab and Sjahrir, 2017). Drawing more
detailed conclusions about the links between spending and outcomes is hampered by the lack of
reliable and timely data, at a low-enough level of geographic disaggregation. Another challenges is the
15 As a simple aggregate measure of “average access to basic services”, the average of five indicators that reflect access to locally
provided basic services is used: (i) net enrollment rate for junior high school; (ii) net enrollment rate for senior high school; (iii)
access to protected water; (iv) access to protected sanitation; and (v) proportion of births attended by a skilled health worker. An
average score of 100 means that all households in the relevant district have access to protected water and sanitation, all births were
attended by a skilled worker, and everyone in the relevant age groups are enrolled in junior or secondary school; a score of 0 means
that no households have access to protected water or sanitation, no births were attended by a skilled worker, and no child in the
relevant age groups are enrolled in junior or secondary school.
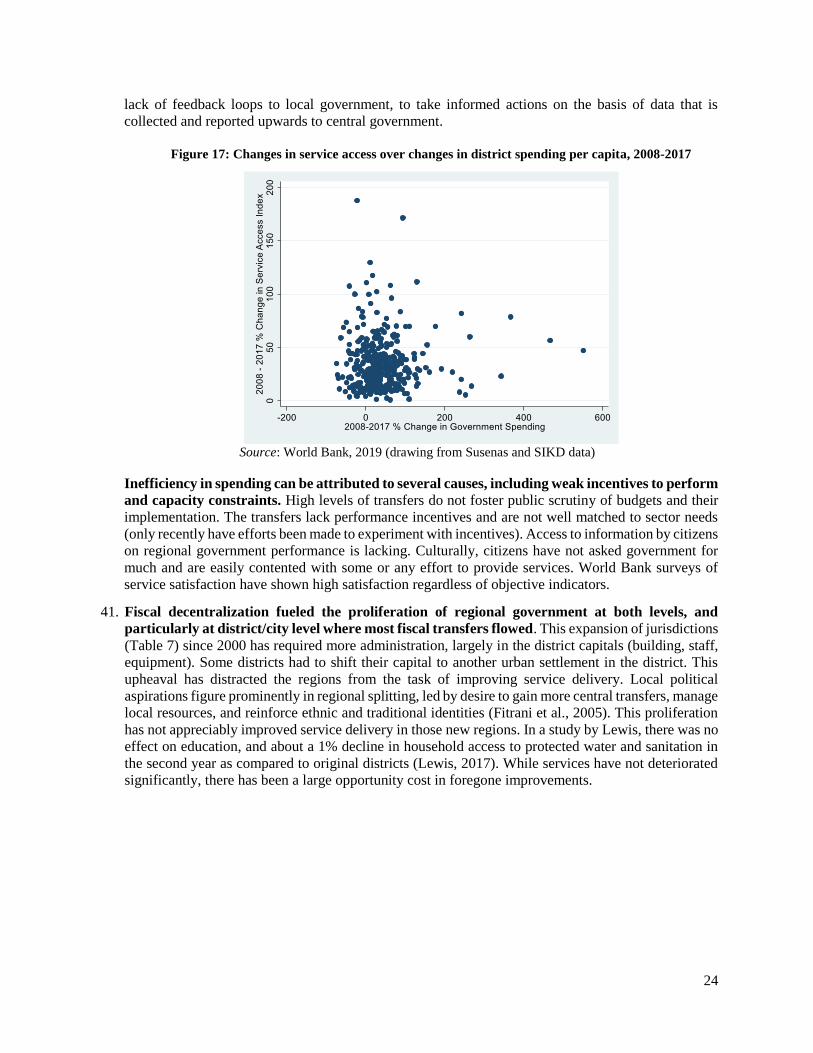
24
lack of feedback loops to local government, to take informed actions on the basis of data that is
collected and reported upwards to central government.
Figure 17: Changes in service access over changes in district spending per capita, 2008-2017
Source: World Bank, 2019 (drawing from Susenas and SIKD data)
Inefficiency in spending can be attributed to several causes, including weak incentives to perform
and capacity constraints. High levels of transfers do not foster public scrutiny of budgets and their
implementation. The transfers lack performance incentives and are not well matched to sector needs
(only recently have efforts been made to experiment with incentives). Access to information by citizens
on regional government performance is lacking. Culturally, citizens have not asked government for
much and are easily contented with some or any effort to provide services. World Bank surveys of
service satisfaction have shown high satisfaction regardless of objective indicators.
41. Fiscal decentralization fueled the proliferation of regional government at both levels, and
particularly at district/city level where most fiscal transfers flowed. This expansion of jurisdictions
(Table 7) since 2000 has required more administration, largely in the district capitals (building, staff,
equipment). Some districts had to shift their capital to another urban settlement in the district. This
upheaval has distracted the regions from the task of improving service delivery. Local political
aspirations figure prominently in regional splitting, led by desire to gain more central transfers, manage
local resources, and reinforce ethnic and traditional identities (Fitrani et al., 2005). This proliferation
has not appreciably improved service delivery in those new regions. In a study by Lewis, there was no
effect on education, and about a 1% decline in household access to protected water and sanitation in
the second year as compared to original districts (Lewis, 2017). While services have not deteriorated
significantly, there has been a large opportunity cost in foregone improvements.
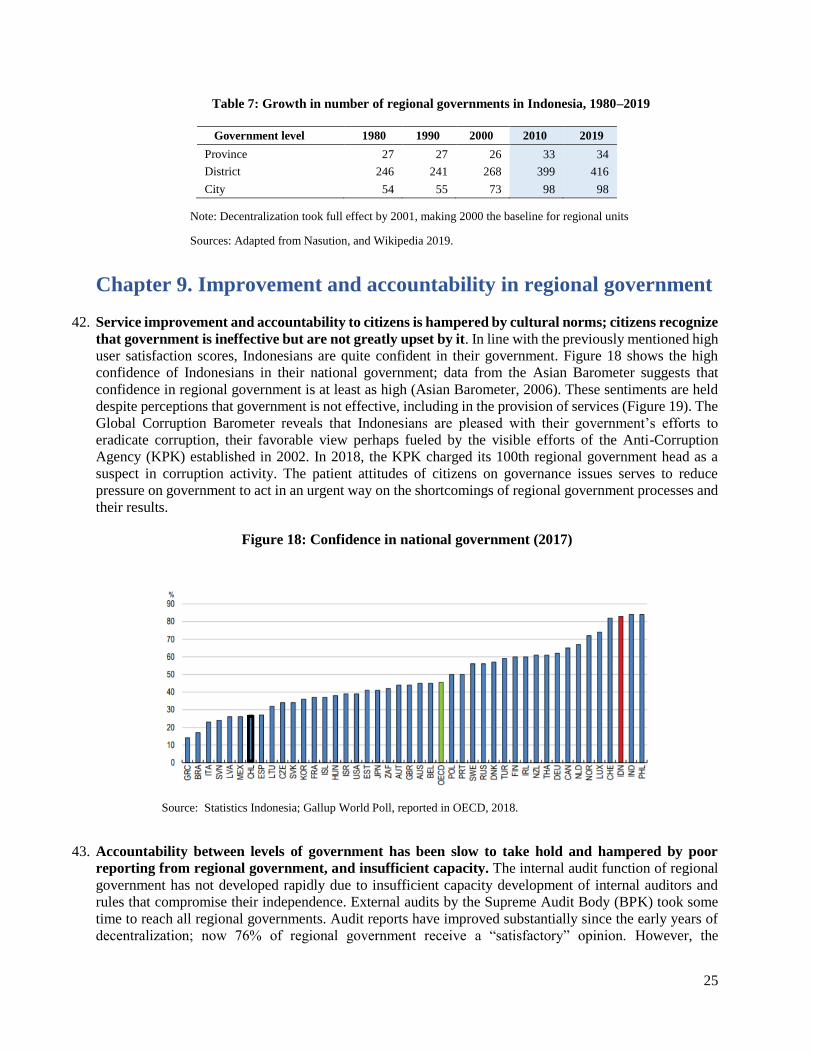
25
Table 7: Growth in number of regional governments in Indonesia, 1980–2019
Government level 1980 1990 2000 2010 2019
Province 27 27 26 33 34 District 246 241 268 399 416 City 54 55 73 98 98
Note: Decentralization took full effect by 2001, making 2000 the baseline for regional units
Sources: Adapted from Nasution, and Wikipedia 2019.
Chapter 9. Improvement and accountability in regional government
42. Service improvement and accountability to citizens is hampered by cultural norms; citizens recognize
that government is ineffective but are not greatly upset by it. In line with the previously mentioned high
user satisfaction scores, Indonesians are quite confident in their government. Figure 18 shows the high
confidence of Indonesians in their national government; data from the Asian Barometer suggests that
confidence in regional government is at least as high (Asian Barometer, 2006). These sentiments are held
despite perceptions that government is not effective, including in the provision of services (Figure 19). The
Global Corruption Barometer reveals that Indonesians are pleased with their government’s efforts to
eradicate corruption, their favorable view perhaps fueled by the visible efforts of the Anti-Corruption
Agency (KPK) established in 2002. In 2018, the KPK charged its 100th regional government head as a
suspect in corruption activity. The patient attitudes of citizens on governance issues serves to reduce
pressure on government to act in an urgent way on the shortcomings of regional government processes and
their results.
Figure 18: Confidence in national government (2017)
Source: Statistics Indonesia; Gallup World Poll, reported in OECD, 2018.
43. Accountability between levels of government has been slow to take hold and hampered by poor
reporting from regional government, and insufficient capacity. The internal audit function of regional
government has not developed rapidly due to insufficient capacity development of internal auditors and
rules that compromise their independence. External audits by the Supreme Audit Body (BPK) took some
time to reach all regional governments. Audit reports have improved substantially since the early years of
decentralization; now 76% of regional government receive a “satisfactory” opinion. However, the
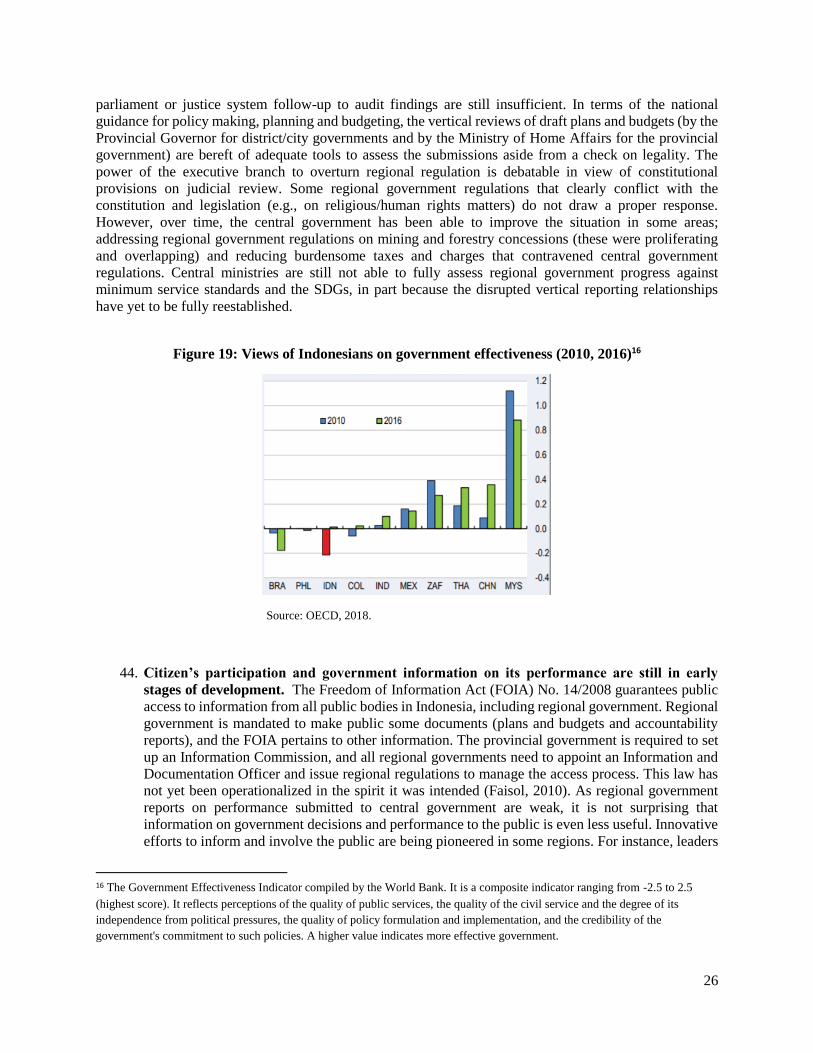
26
parliament or justice system follow-up to audit findings are still insufficient. In terms of the national
guidance for policy making, planning and budgeting, the vertical reviews of draft plans and budgets (by the
Provincial Governor for district/city governments and by the Ministry of Home Affairs for the provincial
government) are bereft of adequate tools to assess the submissions aside from a check on legality. The
power of the executive branch to overturn regional regulation is debatable in view of constitutional
provisions on judicial review. Some regional government regulations that clearly conflict with the
constitution and legislation (e.g., on religious/human rights matters) do not draw a proper response.
However, over time, the central government has been able to improve the situation in some areas;
addressing regional government regulations on mining and forestry concessions (these were proliferating
and overlapping) and reducing burdensome taxes and charges that contravened central government
regulations. Central ministries are still not able to fully assess regional government progress against
minimum service standards and the SDGs, in part because the disrupted vertical reporting relationships
have yet to be fully reestablished.
Figure 19: Views of Indonesians on government effectiveness (2010, 2016)16
Source: OECD, 2018.
44. Citizen’s participation and government information on its performance are still in early
stages of development. The Freedom of Information Act (FOIA) No. 14/2008 guarantees public
access to information from all public bodies in Indonesia, including regional government. Regional
government is mandated to make public some documents (plans and budgets and accountability
reports), and the FOIA pertains to other information. The provincial government is required to set
up an Information Commission, and all regional governments need to appoint an Information and
Documentation Officer and issue regional regulations to manage the access process. This law has
not yet been operationalized in the spirit it was intended (Faisol, 2010). As regional government
reports on performance submitted to central government are weak, it is not surprising that
information on government decisions and performance to the public is even less useful. Innovative
efforts to inform and involve the public are being pioneered in some regions. For instance, leaders
16 The Government Effectiveness Indicator compiled by the World Bank. It is a composite indicator ranging from -2.5 to 2.5
(highest score). It reflects perceptions of the quality of public services, the quality of the civil service and the degree of its
independence from political pressures, the quality of policy formulation and implementation, and the credibility of the
government's commitment to such policies. A higher value indicates more effective government.
27
are holding public meetings or radio shows to reach the public. The planning system requires a
bottom-up approach that includes citizen participation in an annual development meeting (in
villages and regions), but this has been rather pro-forma in most localities or captured by local
elites. More genuine participatory budgeting is being attempted in a few regions, facilitated by
NGOs (Kota Kita, 2017). Indonesia has joined the Open Budgets Portal of the World Bank, and
has received a score of 62 (2012) placing it in the “substantial” openness category, but with the
finding that its public participation could be improved
45. Innovation has been slow to take hold after decentralization but is picking up momentum and
is incentivized by recognition events. As new leaders emerge, from the CSO sector or the private
sector, regional governments are showing some innovation in public service delivery – beyond the
efforts of the central government to introduce new approaches (like e-procurement). One visible
effort is the provincial effort to establish Innovation Hubs, beginning with East Java17 which has
now spread to two other provinces. Strongly supported by KemenPan R&B (Ministry of State
Apparatus and Bureaucratic Reform) and development partners (e.g., GIZ), the provinces currently
involved have put competitions and technical support to good use in fostering district/city level
innovations. The spread (replication) of these innovations is less evident or incentivized.
Replication does not have the same cachet as innovation and is not rewarded as much. Innovation
is often hamstrung by regional officials’ concerns about overstepping their roles/functions; the rigid
positive list of functional assignments and auditing practices underlie this apprehension.
46. Minimum service standards (MSS), a safeguard born in the decentralization reform design,
are slowly being incorporated by regional governments in their planning and budgeting. MSS
were designed to give district/city government some parameters in the initial general competence
architecture of functions (Ferrazzi, 2005) (Box 7). The challenge in setting normative service
standards is to focus these on the highest priority services and ensure that regional government will
have the resources to achieve them within a reasonable timeframe. A proliferation of minimum
service standards, as seen in the period 2005-2013, has led to a loss of credibility that they can be
achieved and that they are priority, losing their power to motivate improvement. Since 2014, an
effort has been made to refocus these on basic services. Even attaining a streamlined set of
standards has been a challenge in Indonesia, particularly with the persistent vertical and horizontal
fiscal imbalances. Even so, many regional governments can now boast of having met most of these
standards (pertaining to basic services). They have done so by generally increasing spending on
these services relative to other expenditures or finding innovative ways of delivering the services.
At national level there is continuing exploration on how fiscal transfers and other levers can be
used to further spur their achievement across all regions.
Box 7: Concept of Minimum Service Standards as applied in Indonesia
• Nationally set standards applicable to all regional governments.
• Focused on basic service delivery (health, education, water provision etc.).
• Introduced in 2001 to ensure basic services would be delivered by regional government (at
that time districts/cities had a general competence functional assignment architecture).
• Have been supported in some fashion through the Special Allocation Grant (DAK).
• Some regional governments have struggled to meet them, due to lack of funds and capacity to
cost them and to plan and budget accordingly.
17 See the East Java platform at http://jipp.jatimprov.go.id/
28
• Central Government does not have complete/reliable data on achievement.
• The concept is slowly becoming internalized in public discourse.
Chapter 10. Lessons and implications for other countries
47. Indonesia’s experience has several lessons that can serve any country contemplating
decentralization:
1) Deep forms of decentralization (devolution/Big Bang) have some advantages, and the risks
entailed can be managed. Such reforms generally need to be demanded and seen as a political
necessity.
2) Matching resources to functions is essential to the achievement of success by subnational
governments. A clean shift of modalities (deconcentration to devolution) can facilitate this
matching and simplify reform.
3) There is value in keeping reforms simple, particularly in limiting asymmetry in the assignment
of functions; it may be better to help some weaker regions to manage a uniform assignment
than to deal with numerous regions with a variable range of functions.
4) Functional assignment should be understood as setting roles across levels and deciding on the
overall architecture/typologies. It should result in both certainty and sufficient room for
discretion/initiative to realize the promises of decentralization.
5) Decentralization design needs to address and balance all major building blocks of
decentralization, including appropriate planning, reporting, and accountability systems.
6) The success in fulfilling new roles requires substantial time and capacity development efforts,
particularly where there is considerable variation in capacity.
7) Decentralization can lock in or even exacerbate regional disparities. Reducing these is arduous
and politically charged work, with difficult trade-offs in addressing historical grievances
versus current needs (e.g., place versus people trade-off in Indonesia).
8) The quest for increased efficiency and improved governance at the regional government level
has no simple policy solution, but rather calls for the collection of data to confidently report
on spending trends and development results, the communication of such data to create political
incentives to improve, sustained pressure from citizens, experimentation, and learning from
experience.
9) Decentralization reforms may have a big bang moment, but they are generally an ongoing
process that can add or reduce local autonomy and build systems. It is useful to have consensus
building forums/processes to review progress and develop corrective measures.
48. In particular for Chile, the following cautions and suggestions might be especially relevant:
1) Indonesia was rushed, but Chile has more time, so do involve stakeholders (all levels of
government and others) to converge on goals, concepts, terminology and key options, e.g.,
scope and mechanisms of intermediary roles; balance of expenditure and revenue assignments;
policy on regional disparities.
2) Indonesia did a few things right on the architecture and typology of functions but has not
provided for a dynamic and creative system; Chile should ensure there is CG control,
certainty and safety in RGs taking up functions, but also room for RG to take the
initiative and be creative.
3) Overriding political considerations shaped Indonesia’s choice of intermediary roles and
mechanisms. Chile may have the option (with only one level in play) to make the
intermediary role more fulsome and simplified from the start.
29
4) The slow progress on service improvement and innovation in Indonesia points to a lack of
accountability mechanisms, with clumsy and burdensome retrofitting thereafter. Chile has a
chance to design mechanisms (especially on information use) that are not burdensome
and involve stakeholders more meaningfully.
5) While in principle decentralization can be considered revenue neutral, in practice Chile should
be prepared for an increased overall national expenditure. This may be desirable, if it puts
more funds into key services and lagging areas but has to be managed. Indonesia had some
safeguards in this respect that were helpful for its context; Chile may need to find its own
brakes and guard rails.
6) If Chile is interested in a more rigorous approach to minimum service standards – as it transfers
service functions to regional governments – it would do well to limit these to the most
essential services, ensure data on progress is collected and communicated to regions and
the public, and to stress the attendant shift of resources from less-priority expenditures
to these higher-priority services.
7) A careful assessment of transfer formulae should be undertaken, recognizing the trade-off
between focusing on people (population numbers or service users) versus places (relative
indices e.g., poverty rates across certain regions). This entails discussions of national values
(including the need to address historical placed-based injustices), and an understanding
that views on equity can be highly political and often incommensurate in nature. It should
also be noted that increased revenue alone will likely not address the service gaps of
lagging regions, which will also require other support (e.g. capacity injections) to catch
up to national averages.
8) Prepare a timely and relevant capacity development plan that recognizes critical and
urgent transition issues and also has a longer-term perspective.
30
References
Agustina, Cut Dian, Ahmad, Ehtisham, Nugroho, Dhanie and Siagian Herbert. 2012. Political economy of
natural resource revenue sharing in Indonesia. World Bank, LSE Asia, and University of Bonn.
Asian Barometer. 2006. The 2006 Asian barometer survey; Wave 2.
Asian Development Bank. 2019 (forthcoming). Indonesia: Country Assistance Program Evaluation.
Manila.
Boex, Jameson, and Jorge Martinez-Vazquez. 2007. Designing intergovernmental equalization transfers
with imperfect data: Concepts, practices, and lessons. In Fiscal Equalization, 291-343. Springer.
Decentralization Support Facility. 2012. Proceedings of a conference on Alternative Visions for
Decentralization in Indonesia. Jakarta: Decentralization Support Facility.
Faisol, A. et al 2010. Fulfilling to Right to Information: Baseline Assessment on Access to Information in
East Nusa Tenggara, Indonesia. Article 19, TIFA, Bappeda NTT, AusAID.
http://www.article19.org/data/files/pdfs/publications/fulfilling-the-right-to-information.pdf
Fengler, W. and Hoffman, B. 2009. Managing Indonesia’s Rapid Decentralization: Achievements and
Challenges, in Bahl, R.W. and Ichimura, S. Decentralization Policies in Asian Development. Hackensack,
N.J.: World Scientific.
Ferrazzi, G. (2005). Obligatory Functions and Minimum Service Standards for Indonesian Regional
Government: Searching for a Model. Public Administration and Development, 25 (3): 227-238.
Ferrazzi, G. (2000). Using the “F” Word: Federalism in the Decentralization Discourse in Indonesia,
Publius - The Journal of Federalism, 30 (2), (Spring).
Ferrazzi, G. and Rohdewohld R. 2017. Emerging practices in Intergovernmental Functional Assignment.
Routledge: London.
Feruglio, F. and Rifai, A. 2017. Participatory budgeting in Indonesia: past, present and future, Making All
Voices Count. Practice Paper, Brighton: IDS
Fitrani, Fitria, Hofman, Bert, and Kaiser, Kai. 2005. Unity in diversity? The creation of new local
governments in a decentralising Indonesia, Bulletin of Indonesian Economic Studies, 41 (1): 57-79.
Hofman, B., Kaiser, K. 2004. The making of the big bang and its aftermath: A political economy
perspective’, in Alm, J., Martinez-Vazquez, J. and Indrawati, S. eds. Reforming intergovernmental fiscal
relations and the rebuilding of Indonesia. Cheltenham: Edward Elgar.
Krisztina Kis-Katosab and Bambang Suharnoko Sjahrir. 2017. The impact of fiscal and political
decentralization on local public investment in Indonesia. Journal of Comparative Economics, 45(2): 344-
365.
Lamont, J., Imansyah, H., eds. 2012. Ten Years After the Big Bang: The Future of Fiscal Decentralization
in Indonesia. Jakarta: University of Indonesia Press.
Nursini. 2012. Implementation of Fiscal Decentralization in Indonesia: 2001-2009, Jurnal Ekonomi
Pembangunan, Volume 13, Nomor 1, Juni, hlm.1-17.

31
Lewis, Blane D. 2017. "Local government spending and service delivery in Indonesia: the perverse effects
of substantial fiscal resources." Regional Studies. 51 (11):1695-1707.
Lewis, Blane. 2017. Does local government proliferation improve public service delivery? Evidence from
Indonesia. Journal of Urban Affairs, 39(8): 1047–1065.
Lewis, Blane. (2003). Local Government Borrowing and Repayment in Indonesia: Does Fiscal Capacity
Matter? World Development. 31: 1047-1063.
Lewis, Blane D, Neil McCulloch, and Audrey Sacks. 2016. "Measuring local government service delivery
performance: Challenges and (partial) solutions in Indonesia." Journal of International Development. 28
(5):808-817.
Lewis, B. and Smoke, P. 2017. Intergovernmental fiscal transfers and local incentives and responses: the
case of Indonesia. Fiscal Studies 38(1):111-139.
Lewis B. and Oosterman, A. 2009. Impact of Decentralization on Subnational Government Fiscal Slack in
Indonesia. Public Budgeting & Finance, Summer. 29(2), 27-47.
Ministry of Home Affairs (Kementerian Dalam Negeri). 2016. Pemutakhiran Data Pajak Daerah
dan Retribusi Daerah.
Nasution, A. 2016. Working Paper Series GOVERNMENT DECENTRALIZATION PROGRAM IN
INDONESIA. Asian Development Bank Institute. No. 601 October. Manila.
OECD. 2018. Regions and Cities at a Glance 2018 – CHILE. Paris: OECD Publishing.
https://www.oecd.org/cfe/CHILE-Regions-and-Cities-2018.pdf
OECD. 2018. Economic Surveys: Indonesia. Paris: OECD Publishing
http://www.oecd.org/eco/surveys/Indonesia-2018-OECD-economic-survey-overview.pdf
OECD. 2016. Subnational governments around the world. Structure and finance. A first contribution to the
Global Observatory on Local Finances. Paris: OECD Publishing.
Pakaya, J. S. 2017. Redesign of Judicial Review System of Regional Regulations. Jurnal Legislasi
Indonesia, 14 (1) - Maret: 91 – 98.
World Bank. 2017. Indonesia Subnational Public Expenditure Review. Jakarta.
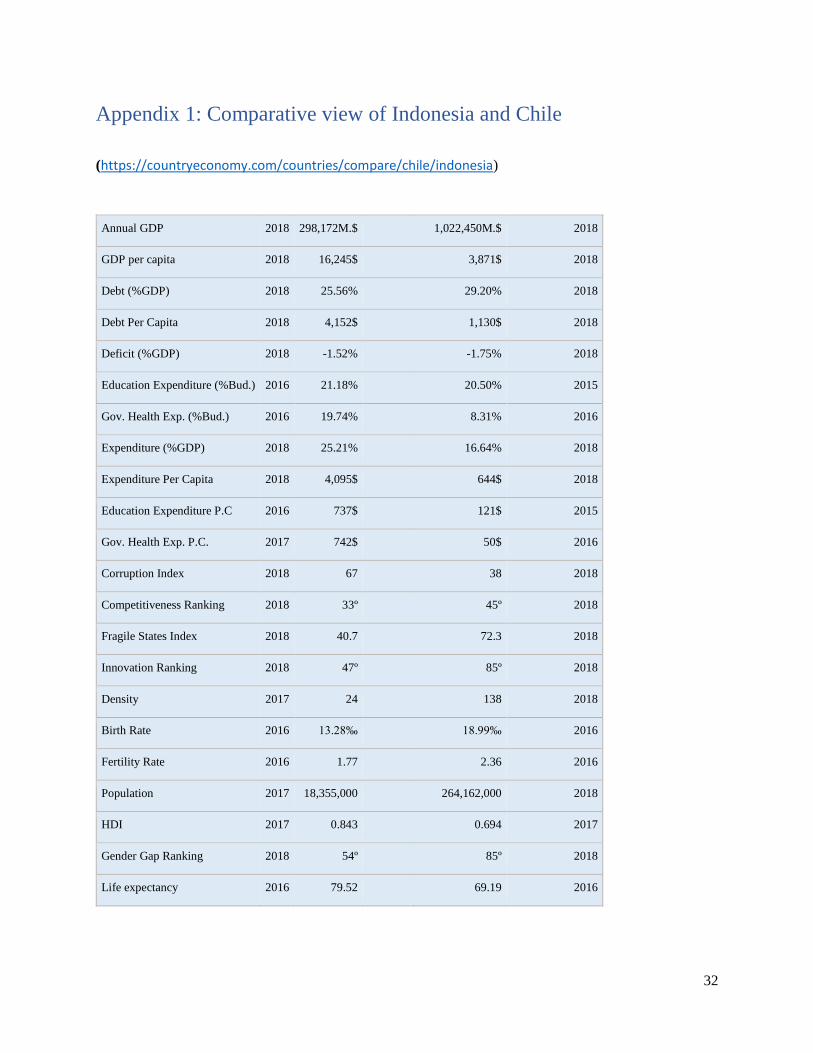
32
Appendix 1: Comparative view of Indonesia and Chile
(https://countryeconomy.com/countries/compare/chile/indonesia)
Annual GDP 2018 298,172M.$
1,022,450M.$ 2018
GDP per capita 2018 16,245$
3,871$ 2018
Debt (%GDP) 2018 25.56%
29.20% 2018
Debt Per Capita 2018 4,152$
1,130$ 2018
Deficit (%GDP) 2018 -1.52%
-1.75% 2018
Education Expenditure (%Bud.) 2016 21.18%
20.50% 2015
Gov. Health Exp. (%Bud.) 2016 19.74%
8.31% 2016
Expenditure (%GDP) 2018 25.21%
16.64% 2018
Expenditure Per Capita 2018 4,095$
644$ 2018
Education Expenditure P.C 2016 737$
121$ 2015
Gov. Health Exp. P.C. 2017 742$
50$ 2016
Corruption Index 2018 67
38 2018
Competitiveness Ranking 2018 33º
45º 2018
Fragile States Index 2018 40.7
72.3 2018
Innovation Ranking 2018 47º
85º 2018
Density 2017 24
138 2018
Birth Rate 2016 13.28‰
18.99‰ 2016
Fertility Rate 2016 1.77
2.36 2016
Population 2017 18,355,000
264,162,000 2018
HDI 2017 0.843
0.694 2017
Gender Gap Ranking 2018 54º
85º 2018
Life expectancy 2016 79.52
69.19 2016

33
Appendix 2: Example of education function assignment in Law 23/2014
on Regional Government
4. Educators and
Educational
Staff
a. Control of the educators’
formation, educators’
transfers, and educators’
career development.
b. Transfers of educators and educational staff
across provincial regions.
Transfers of educators and
educational staff across
district/city regions within 1 (one) provincial region.
Transfers of educators and
educational staff within a district/city
region.
5. Educational Licenses a. Issuance of licenses for
private universities
organized by the public.
b. Issuance of operating licenses for foreign
educational units.
a. Issuance of licenses
for secondary
education organized by the public.
b. Issuance of licenses
for special education
organized by the public.
a. Issuance of licenses for
primary education organized
by the public.
b. Issuance of licenses for early childhood education organized
by the public and non-formal
education organized by the public.
6. Language and
Literature
Fostering of Indonesian
language and literature.
Study of language and
literature whose speakers are spread across district/city
regions within 1 (one)
provincial region.
Study of language and literature
whose speakers are present within the district/city region.
NO SUB-FUNCTION CENTRAL
GOVERNMENT
PROVINCIAL
REGION
DISTRICT/CITY
REGION 1. Educational
Management a. Establishment of national
education standards.
b. Management of higher
education.
a. Management of secondary education.
b. Management of
special education.
a. Management of primary education.
b. Management of early
childhood education
and non-formal education.
2. Curriculum Establishment of the national curriculum for secondary
education, primary education,
early childhood education, and non-formal education.
Establishment of local content curriculum for
secondary education and
local special education.
Establishment of local content curriculum for primary education,
early childhood education, and non-
formal education.
3. Accreditation Accreditations for higher
education, secondary education, primary education,
early childhood education, and
non-formal education.
-- --
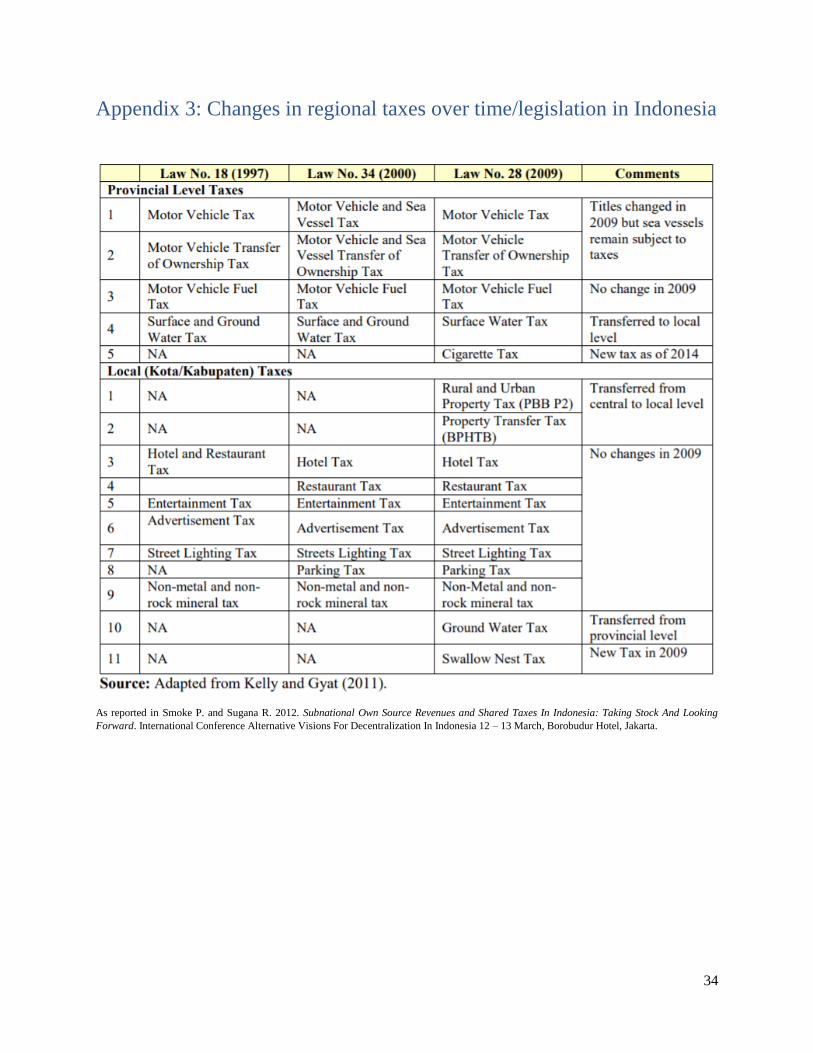
34
Appendix 3: Changes in regional taxes over time/legislation in Indonesia
As reported in Smoke P. and Sugana R. 2012. Subnational Own Source Revenues and Shared Taxes In Indonesia: Taking Stock And Looking
Forward. International Conference Alternative Visions For Decentralization In Indonesia 12 – 13 March, Borobudur Hotel, Jakarta.
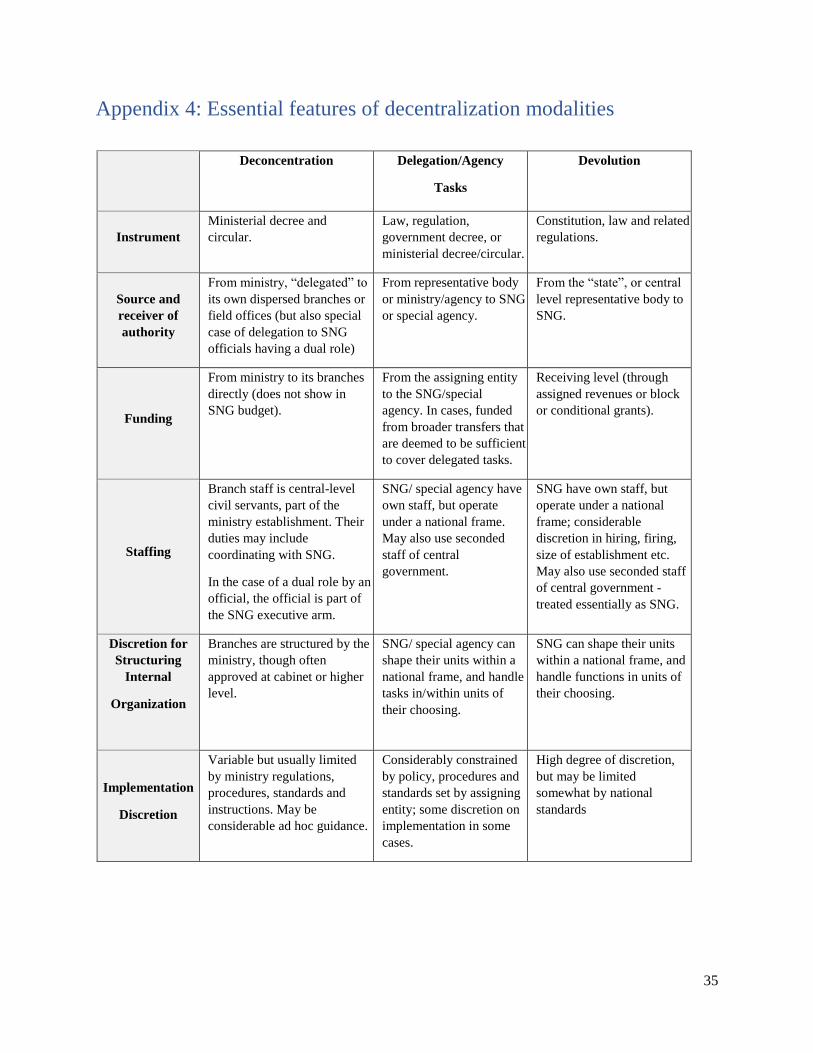
35
Appendix 4: Essential features of decentralization modalities
Deconcentration Delegation/Agency
Tasks
Devolution
Instrument
Ministerial decree and
circular.
Law, regulation,
government decree, or
ministerial decree/circular.
Constitution, law and related
regulations.
Source and
receiver of
authority
From ministry, “delegated” to
its own dispersed branches or
field offices (but also special
case of delegation to SNG
officials having a dual role)
From representative body
or ministry/agency to SNG
or special agency.
From the “state”, or central
level representative body to
SNG.
Funding
From ministry to its branches
directly (does not show in
SNG budget).
From the assigning entity
to the SNG/special
agency. In cases, funded
from broader transfers that
are deemed to be sufficient
to cover delegated tasks.
Receiving level (through
assigned revenues or block
or conditional grants).
Staffing
Branch staff is central-level
civil servants, part of the
ministry establishment. Their
duties may include
coordinating with SNG.
In the case of a dual role by an
official, the official is part of
the SNG executive arm.
SNG/ special agency have
own staff, but operate
under a national frame.
May also use seconded
staff of central
government.
SNG have own staff, but
operate under a national
frame; considerable
discretion in hiring, firing,
size of establishment etc.
May also use seconded staff
of central government -
treated essentially as SNG.
Discretion for
Structuring
Internal
Organization
Branches are structured by the
ministry, though often
approved at cabinet or higher
level.
SNG/ special agency can
shape their units within a
national frame, and handle
tasks in/within units of
their choosing.
SNG can shape their units
within a national frame, and
handle functions in units of
their choosing.
Implementation
Discretion
Variable but usually limited
by ministry regulations,
procedures, standards and
instructions. May be
considerable ad hoc guidance.
Considerably constrained
by policy, procedures and
standards set by assigning
entity; some discretion on
implementation in some
cases.
High degree of discretion,
but may be limited
somewhat by national
standards

36
Reporting/
Accountability
From branch/official to
ministry head-quarters.
Primarily to the assigning
entity, but also to the SNG
representative body and
citizens.
Primarily to citizens of
receiving level, through the
SNG representative body;
vertical accountability
remains and in principle is
more pronounced in early
stages of decentralization
Source: In Ferrazzi and Rohdewohld, 2017 (adapted from GTZ 2009)
1
Fiscal decentralization of regional
governments – the case of Poland
prepared under the World Bank TA RAS for Chile1
1 The note was written by Paweł Swianiewicz, Department of Local Development and Policy, Faculty of Geography and
Regional Studies at University of Warsaw with contributions from Ewa Korczyc (Economist, World Bank).
2
Contents
Country context ............................................................................................................................................. 3
Brief history of decentralization in Poland ................................................................................................... 3
Prior to independence in 1918 .................................................................................................................. 3
Since 1918 until the modern wave of decentralization ............................................................................. 4
Modern wave of decentralization 1990 and 1998 reforms ........................................................................ 5
Current decentralization model ..................................................................................................................... 8
Description of the administrative structure and the key characteristics .................................................... 8
Transition process ................................................................................................................................... 11
Functions of regional governments ............................................................................................................. 12
Revenue sources of regional governments .................................................................................................. 15
Own revenues and tax sharing ................................................................................................................ 15
Transfers to regional budgets .................................................................................................................. 17
Subnational borrowing ................................................................................................................................ 23
Budget process – the role of the MEF......................................................................................................... 25
Supervision, transparency and accountability ............................................................................................. 26
Financial supervision .............................................................................................................................. 26
Transparency and participatory mechanisms .......................................................................................... 27
Other country-specific observations ........................................................................................................... 28
Role of regions in regional development policies ................................................................................... 28
Lessons learnt and insights for other countries ........................................................................................... 34
References: .................................................................................................................................................. 36
Further readings in English: ........................................................................................................................ 37
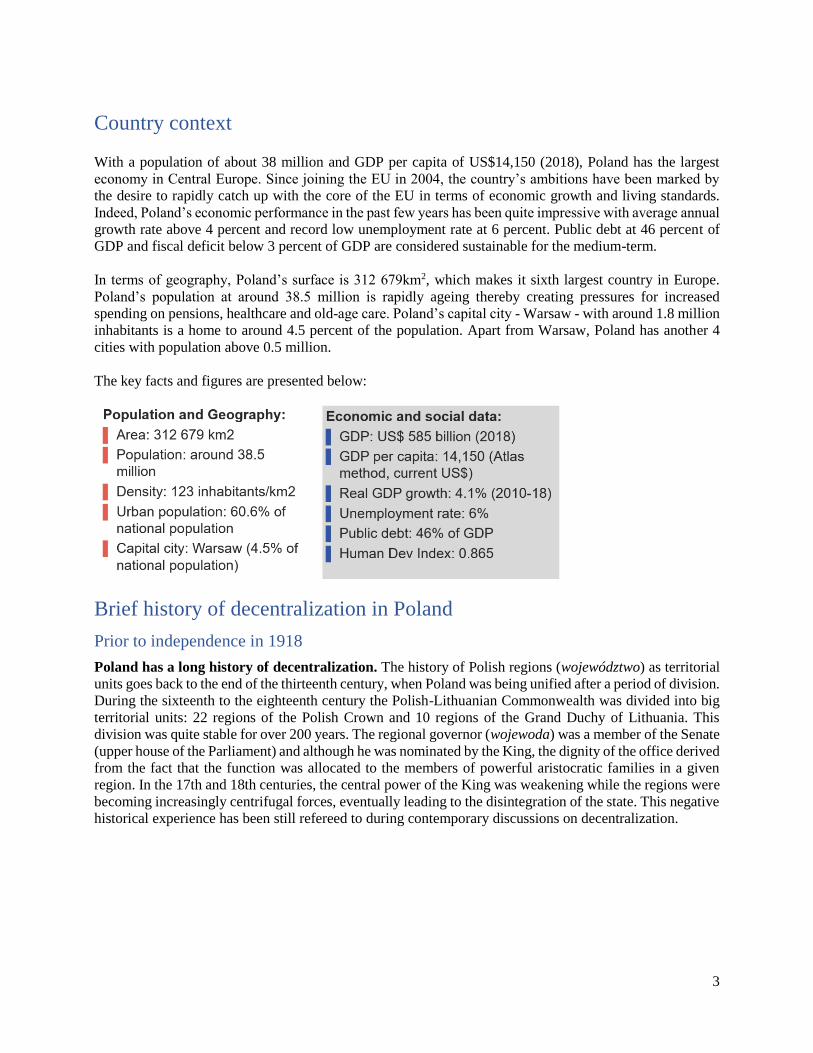
3
Country context
With a population of about 38 million and GDP per capita of US$14,150 (2018), Poland has the largest
economy in Central Europe. Since joining the EU in 2004, the country’s ambitions have been marked by
the desire to rapidly catch up with the core of the EU in terms of economic growth and living standards.
Indeed, Poland’s economic performance in the past few years has been quite impressive with average annual
growth rate above 4 percent and record low unemployment rate at 6 percent. Public debt at 46 percent of
GDP and fiscal deficit below 3 percent of GDP are considered sustainable for the medium-term.
In terms of geography, Poland’s surface is 312 679km2, which makes it sixth largest country in Europe.
Poland’s population at around 38.5 million is rapidly ageing thereby creating pressures for increased
spending on pensions, healthcare and old-age care. Poland’s capital city - Warsaw - with around 1.8 million
inhabitants is a home to around 4.5 percent of the population. Apart from Warsaw, Poland has another 4
cities with population above 0.5 million.
The key facts and figures are presented below:
Brief history of decentralization in Poland
Prior to independence in 1918
Poland has a long history of decentralization. The history of Polish regions (województwo) as territorial
units goes back to the end of the thirteenth century, when Poland was being unified after a period of division.
During the sixteenth to the eighteenth century the Polish-Lithuanian Commonwealth was divided into big
territorial units: 22 regions of the Polish Crown and 10 regions of the Grand Duchy of Lithuania. This
division was quite stable for over 200 years. The regional governor (wojewoda) was a member of the Senate
(upper house of the Parliament) and although he was nominated by the King, the dignity of the office derived
from the fact that the function was allocated to the members of powerful aristocratic families in a given
region. In the 17th and 18th centuries, the central power of the King was weakening while the regions were
becoming increasingly centrifugal forces, eventually leading to the disintegration of the state. This negative
historical experience has been still refereed to during contemporary discussions on decentralization.
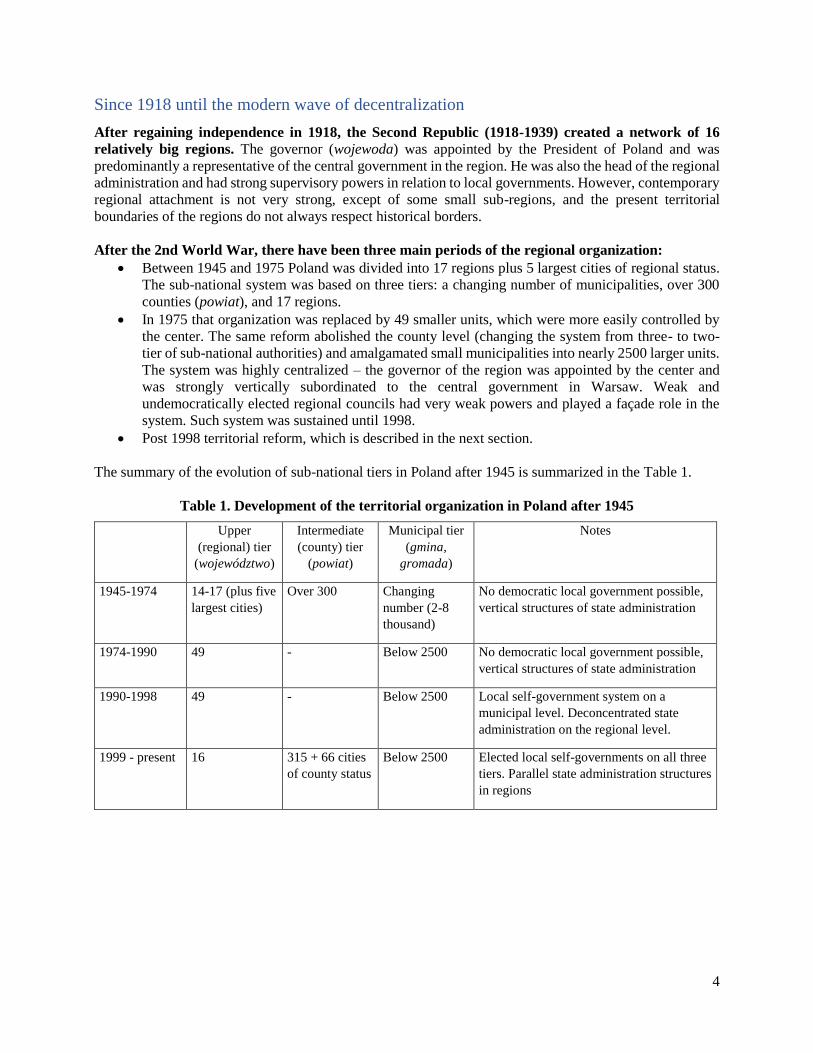
4
Since 1918 until the modern wave of decentralization
After regaining independence in 1918, the Second Republic (1918-1939) created a network of 16
relatively big regions. The governor (wojewoda) was appointed by the President of Poland and was
predominantly a representative of the central government in the region. He was also the head of the regional
administration and had strong supervisory powers in relation to local governments. However, contemporary
regional attachment is not very strong, except of some small sub-regions, and the present territorial
boundaries of the regions do not always respect historical borders.
After the 2nd World War, there have been three main periods of the regional organization:
• Between 1945 and 1975 Poland was divided into 17 regions plus 5 largest cities of regional status.
The sub-national system was based on three tiers: a changing number of municipalities, over 300
counties (powiat), and 17 regions.
• In 1975 that organization was replaced by 49 smaller units, which were more easily controlled by
the center. The same reform abolished the county level (changing the system from three- to two-
tier of sub-national authorities) and amalgamated small municipalities into nearly 2500 larger units.
The system was highly centralized – the governor of the region was appointed by the center and
was strongly vertically subordinated to the central government in Warsaw. Weak and
undemocratically elected regional councils had very weak powers and played a façade role in the
system. Such system was sustained until 1998.
• Post 1998 territorial reform, which is described in the next section.
The summary of the evolution of sub-national tiers in Poland after 1945 is summarized in the Table 1.
Table 1. Development of the territorial organization in Poland after 1945
Upper
(regional) tier
(województwo)
Intermediate
(county) tier
(powiat)
Municipal tier
(gmina,
gromada)
Notes
1945-1974 14-17 (plus five
largest cities)
Over 300 Changing
number (2-8
thousand)
No democratic local government possible,
vertical structures of state administration
1974-1990 49 - Below 2500 No democratic local government possible,
vertical structures of state administration
1990-1998 49 - Below 2500 Local self-government system on a
municipal level. Deconcentrated state
administration on the regional level.
1999 - present 16 315 + 66 cities
of county status
Below 2500 Elected local self-governments on all three
tiers. Parallel state administration structures
in regions
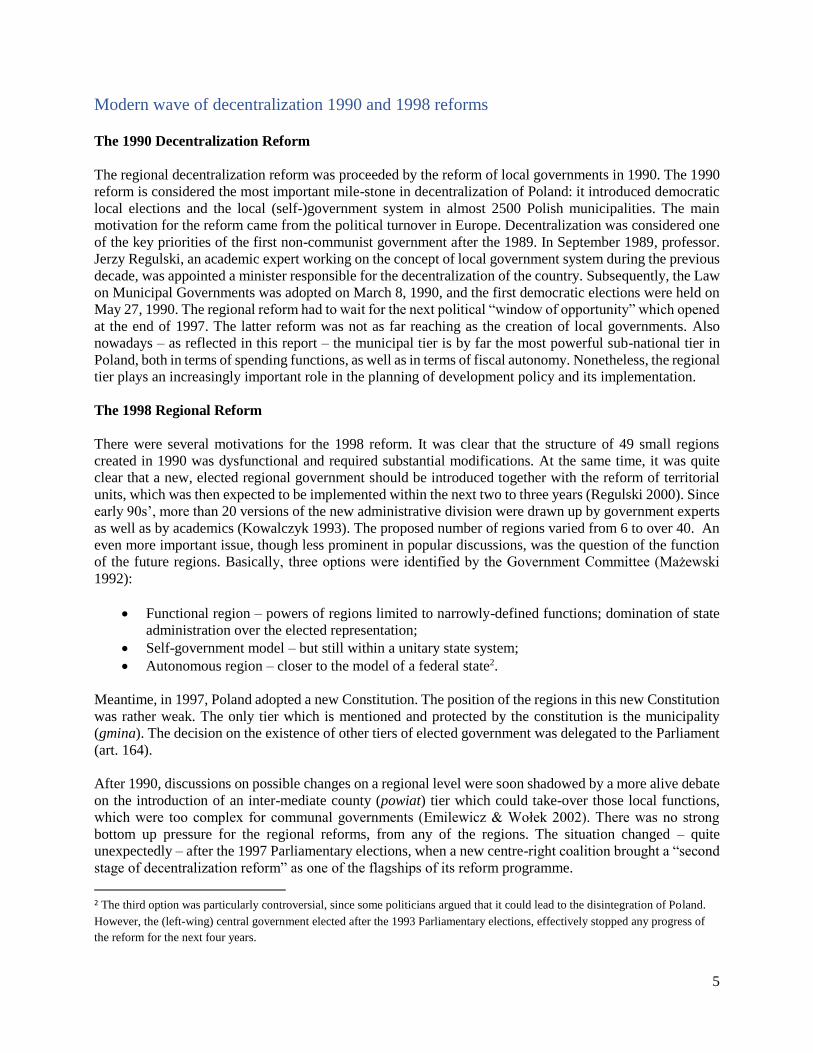
5
Modern wave of decentralization 1990 and 1998 reforms
The 1990 Decentralization Reform
The regional decentralization reform was proceeded by the reform of local governments in 1990. The 1990
reform is considered the most important mile-stone in decentralization of Poland: it introduced democratic
local elections and the local (self-)government system in almost 2500 Polish municipalities. The main
motivation for the reform came from the political turnover in Europe. Decentralization was considered one
of the key priorities of the first non-communist government after the 1989. In September 1989, professor.
Jerzy Regulski, an academic expert working on the concept of local government system during the previous
decade, was appointed a minister responsible for the decentralization of the country. Subsequently, the Law
on Municipal Governments was adopted on March 8, 1990, and the first democratic elections were held on
May 27, 1990. The regional reform had to wait for the next political “window of opportunity” which opened
at the end of 1997. The latter reform was not as far reaching as the creation of local governments. Also
nowadays – as reflected in this report – the municipal tier is by far the most powerful sub-national tier in
Poland, both in terms of spending functions, as well as in terms of fiscal autonomy. Nonetheless, the regional
tier plays an increasingly important role in the planning of development policy and its implementation.
The 1998 Regional Reform
There were several motivations for the 1998 reform. It was clear that the structure of 49 small regions
created in 1990 was dysfunctional and required substantial modifications. At the same time, it was quite
clear that a new, elected regional government should be introduced together with the reform of territorial
units, which was then expected to be implemented within the next two to three years (Regulski 2000). Since
early 90s’, more than 20 versions of the new administrative division were drawn up by government experts
as well as by academics (Kowalczyk 1993). The proposed number of regions varied from 6 to over 40. An
even more important issue, though less prominent in popular discussions, was the question of the function
of the future regions. Basically, three options were identified by the Government Committee (Mażewski
1992):
• Functional region – powers of regions limited to narrowly-defined functions; domination of state
administration over the elected representation;
• Self-government model – but still within a unitary state system;
• Autonomous region – closer to the model of a federal state2.
Meantime, in 1997, Poland adopted a new Constitution. The position of the regions in this new Constitution
was rather weak. The only tier which is mentioned and protected by the constitution is the municipality
(gmina). The decision on the existence of other tiers of elected government was delegated to the Parliament
(art. 164).
After 1990, discussions on possible changes on a regional level were soon shadowed by a more alive debate
on the introduction of an inter-mediate county (powiat) tier which could take-over those local functions,
which were too complex for communal governments (Emilewicz & Wołek 2002). There was no strong
bottom up pressure for the regional reforms, from any of the regions. The situation changed – quite
unexpectedly – after the 1997 Parliamentary elections, when a new centre-right coalition brought a “second
stage of decentralization reform” as one of the flagships of its reform programme.
2 The third option was particularly controversial, since some politicians argued that it could lead to the disintegration of Poland.
However, the (left-wing) central government elected after the 1993 Parliamentary elections, effectively stopped any progress of
the reform for the next four years.
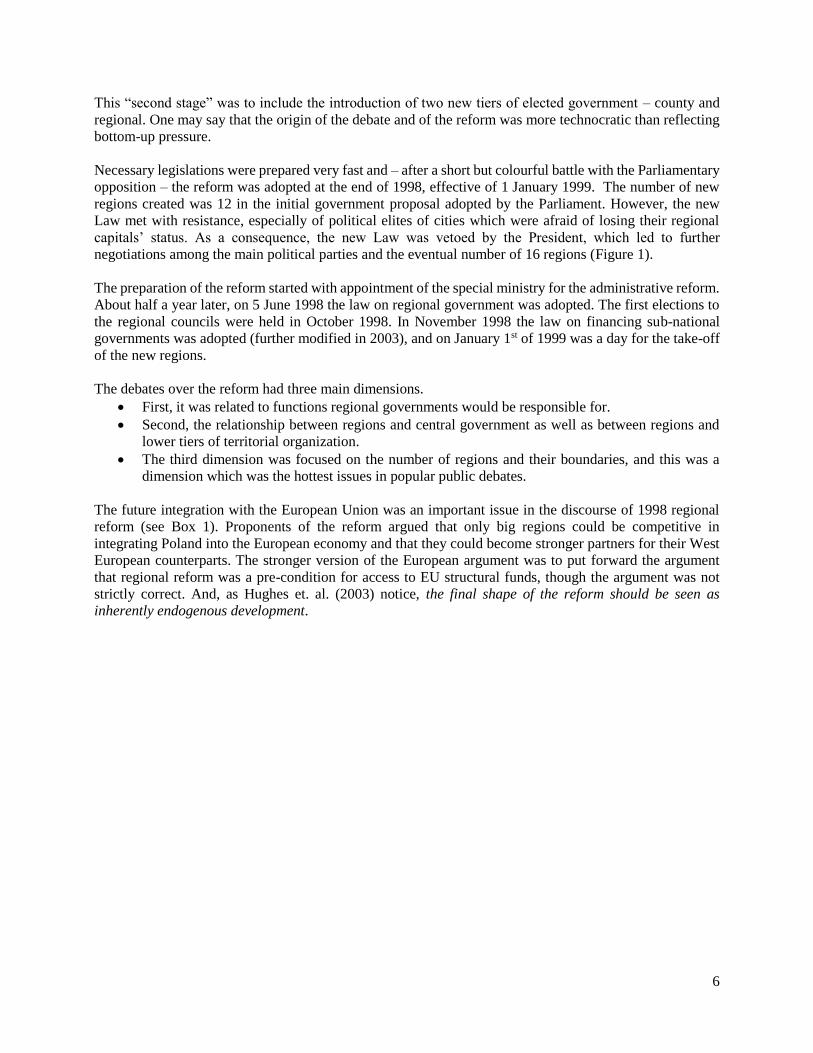
6
This “second stage” was to include the introduction of two new tiers of elected government – county and
regional. One may say that the origin of the debate and of the reform was more technocratic than reflecting
bottom-up pressure.
Necessary legislations were prepared very fast and – after a short but colourful battle with the Parliamentary
opposition – the reform was adopted at the end of 1998, effective of 1 January 1999. The number of new
regions created was 12 in the initial government proposal adopted by the Parliament. However, the new
Law met with resistance, especially of political elites of cities which were afraid of losing their regional
capitals’ status. As a consequence, the new Law was vetoed by the President, which led to further
negotiations among the main political parties and the eventual number of 16 regions (Figure 1).
The preparation of the reform started with appointment of the special ministry for the administrative reform.
About half a year later, on 5 June 1998 the law on regional government was adopted. The first elections to
the regional councils were held in October 1998. In November 1998 the law on financing sub-national
governments was adopted (further modified in 2003), and on January 1st of 1999 was a day for the take-off
of the new regions.
The debates over the reform had three main dimensions.
• First, it was related to functions regional governments would be responsible for.
• Second, the relationship between regions and central government as well as between regions and
lower tiers of territorial organization.
• The third dimension was focused on the number of regions and their boundaries, and this was a
dimension which was the hottest issues in popular public debates.
The future integration with the European Union was an important issue in the discourse of 1998 regional
reform (see Box 1). Proponents of the reform argued that only big regions could be competitive in
integrating Poland into the European economy and that they could become stronger partners for their West
European counterparts. The stronger version of the European argument was to put forward the argument
that regional reform was a pre-condition for access to EU structural funds, though the argument was not
strictly correct. And, as Hughes et. al. (2003) notice, the final shape of the reform should be seen as
inherently endogenous development.
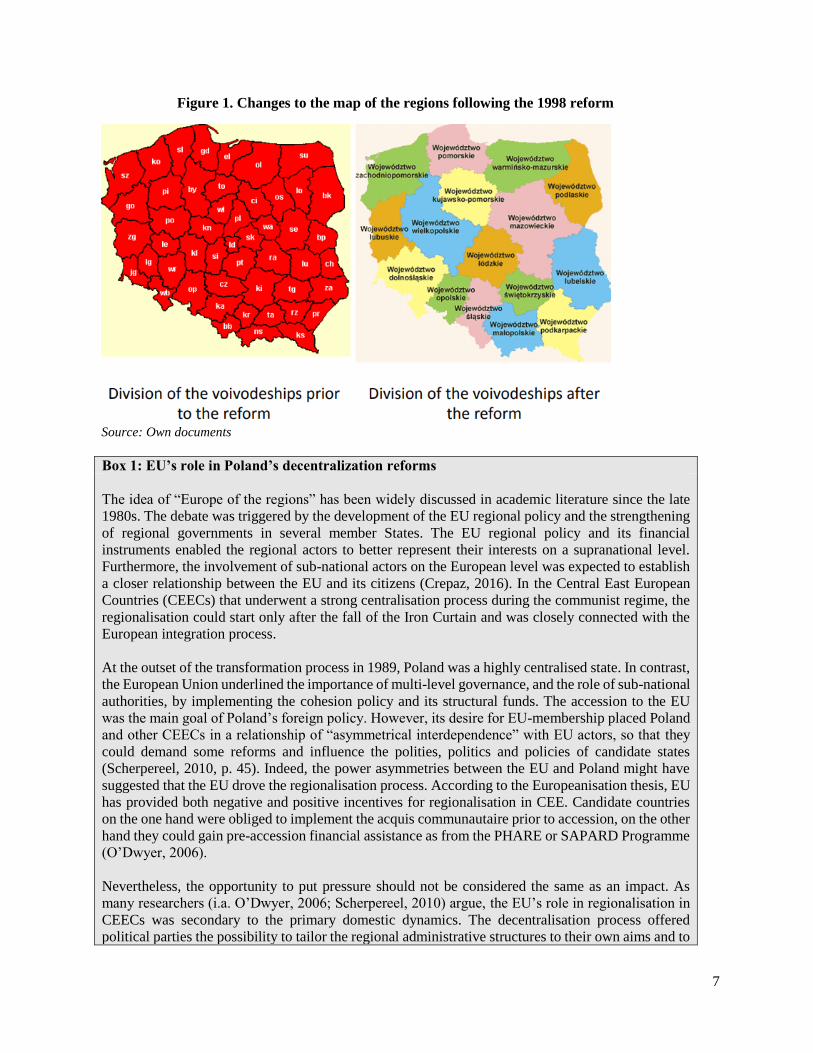
7
Figure 1. Changes to the map of the regions following the 1998 reform
Source: Own documents
Box 1: EU’s role in Poland’s decentralization reforms
The idea of “Europe of the regions” has been widely discussed in academic literature since the late
1980s. The debate was triggered by the development of the EU regional policy and the strengthening
of regional governments in several member States. The EU regional policy and its financial
instruments enabled the regional actors to better represent their interests on a supranational level.
Furthermore, the involvement of sub-national actors on the European level was expected to establish
a closer relationship between the EU and its citizens (Crepaz, 2016). In the Central East European
Countries (CEECs) that underwent a strong centralisation process during the communist regime, the
regionalisation could start only after the fall of the Iron Curtain and was closely connected with the
European integration process.
At the outset of the transformation process in 1989, Poland was a highly centralised state. In contrast,
the European Union underlined the importance of multi-level governance, and the role of sub-national
authorities, by implementing the cohesion policy and its structural funds. The accession to the EU
was the main goal of Poland’s foreign policy. However, its desire for EU-membership placed Poland
and other CEECs in a relationship of “asymmetrical interdependence” with EU actors, so that they
could demand some reforms and influence the polities, politics and policies of candidate states
(Scherpereel, 2010, p. 45). Indeed, the power asymmetries between the EU and Poland might have
suggested that the EU drove the regionalisation process. According to the Europeanisation thesis, EU
has provided both negative and positive incentives for regionalisation in CEE. Candidate countries
on the one hand were obliged to implement the acquis communautaire prior to accession, on the other
hand they could gain pre-accession financial assistance as from the PHARE or SAPARD Programme
(O’Dwyer, 2006).
Nevertheless, the opportunity to put pressure should not be considered the same as an impact. As
many researchers (i.a. O’Dwyer, 2006; Scherpereel, 2010) argue, the EU’s role in regionalisation in
CEECs was secondary to the primary domestic dynamics. The decentralisation process offered
political parties the possibility to tailor the regional administrative structures to their own aims and to
8
build party structures in regions: “the EU figured as a useful pretext for reforms that allowed domestic
political forces, in particular governing party coalitions, to shape regional institutions in their own
interests” (O’Dwyer, 2006, p. 222). In Poland the decentralisation was guaranteed in the Constitution
of 1997 (Art. 15): “The territorial system of the Republic of Poland shall ensure the decentralisation
of public power”.
Source: Elżbieta Opiłowska, « Regionalisation in Poland: background, features and public perception. A first appraisal »,
Belgeo [En ligne], 2 | 2019, mis en ligne le 24 mai 2019, consulté le 01 février 2020. URL :
http://journals.openedition.org/belgeo/34254 ; DOI : 10.4000/belgeo.34254
How could the rationale of the reform and arguments used in the preceding debates be summarized?
First of all, it has been widely presented as the second step of decentralization of the country, which was
initiated by the 1990 reform which concentrated on the municipal tier. The 1998 reform did not affect the
functions allocated to the municipal tier, which stayed untouched, but passed more functions to newly
created elected governments at the county and regional levels. This has remained true even for those
functions which were allocated to municipalities, but which might be more rationally allocates at the county
level – such as waste management, for which most of single municipalities are too small to benefit from
economies of scale, and its organization requires inter-municipal cooperation. But from the point of view of
the regions the main argument was based on an assumption that 49, relatively small regions were too weak
to play an important role in the preparation and implementation of regional development policies and to be
capable to compete in this respect with larger regions of other European countries (e.g. with the regions of
Germany, France, Italy or Spain). In this case economic competitiveness combined with an impact of
expected further European integration were on the top of the policy arguments.
Current decentralization model
Description of the administrative structure and the key characteristics
As a result of the reform process, there are currently three tiers of sub-national governments in Poland:
- 2479 municipalities (gminy) with the mean population size around 15,500 (the median size of
municipality is 7,500 and the smallest one has around 1,300 citizens)
- 315 counties (powiaty) plus 66 cities of county status (performing functions allocated both to
municipal and county level). The mean population size of a county is around 100,000, and the
smallest is just over 20,000.
- 16 regions (województwa) with an average population size of around 25. Million. Two (the smallest)
regions have just about 1 million population (Opole and Lubuskie) while the largest (Mazovia, with
Warsaw being its capital) has more than 5 million citizens.
The number and size of units on each of the tiers is summarized in the Table 2.
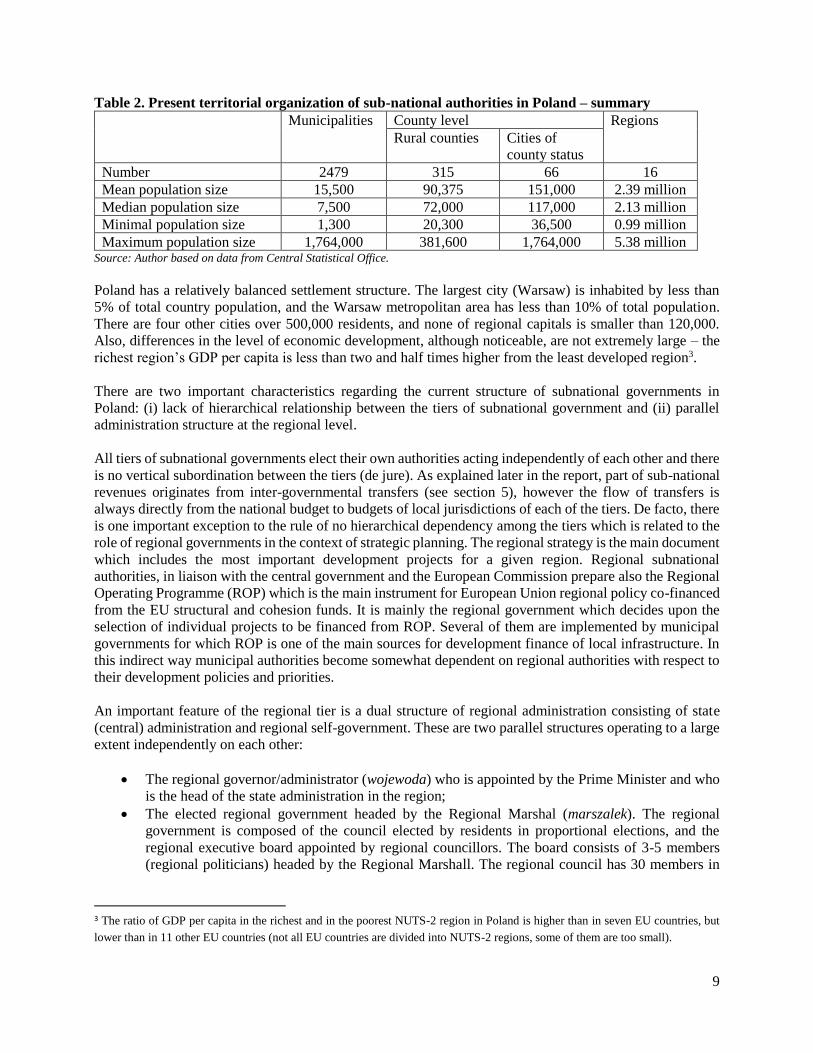
9
Table 2. Present territorial organization of sub-national authorities in Poland – summary
Municipalities County level Regions
Rural counties Cities of
county status
Number 2479 315 66 16
Mean population size 15,500 90,375 151,000 2.39 million
Median population size 7,500 72,000 117,000 2.13 million
Minimal population size 1,300 20,300 36,500 0.99 million
Maximum population size 1,764,000 381,600 1,764,000 5.38 million Source: Author based on data from Central Statistical Office.
Poland has a relatively balanced settlement structure. The largest city (Warsaw) is inhabited by less than
5% of total country population, and the Warsaw metropolitan area has less than 10% of total population.
There are four other cities over 500,000 residents, and none of regional capitals is smaller than 120,000.
Also, differences in the level of economic development, although noticeable, are not extremely large – the
richest region’s GDP per capita is less than two and half times higher from the least developed region3.
There are two important characteristics regarding the current structure of subnational governments in
Poland: (i) lack of hierarchical relationship between the tiers of subnational government and (ii) parallel
administration structure at the regional level.
All tiers of subnational governments elect their own authorities acting independently of each other and there
is no vertical subordination between the tiers (de jure). As explained later in the report, part of sub-national
revenues originates from inter-governmental transfers (see section 5), however the flow of transfers is
always directly from the national budget to budgets of local jurisdictions of each of the tiers. De facto, there
is one important exception to the rule of no hierarchical dependency among the tiers which is related to the
role of regional governments in the context of strategic planning. The regional strategy is the main document
which includes the most important development projects for a given region. Regional subnational
authorities, in liaison with the central government and the European Commission prepare also the Regional
Operating Programme (ROP) which is the main instrument for European Union regional policy co-financed
from the EU structural and cohesion funds. It is mainly the regional government which decides upon the
selection of individual projects to be financed from ROP. Several of them are implemented by municipal
governments for which ROP is one of the main sources for development finance of local infrastructure. In
this indirect way municipal authorities become somewhat dependent on regional authorities with respect to
their development policies and priorities.
An important feature of the regional tier is a dual structure of regional administration consisting of state
(central) administration and regional self-government. These are two parallel structures operating to a large
extent independently on each other:
• The regional governor/administrator (wojewoda) who is appointed by the Prime Minister and who
is the head of the state administration in the region;
• The elected regional government headed by the Regional Marshal (marszalek). The regional
government is composed of the council elected by residents in proportional elections, and the
regional executive board appointed by regional councillors. The board consists of 3-5 members
(regional politicians) headed by the Regional Marshall. The regional council has 30 members in
3 The ratio of GDP per capita in the richest and in the poorest NUTS-2 region in Poland is higher than in seven EU countries, but
lower than in 11 other EU countries (not all EU countries are divided into NUTS-2 regions, some of them are too small).
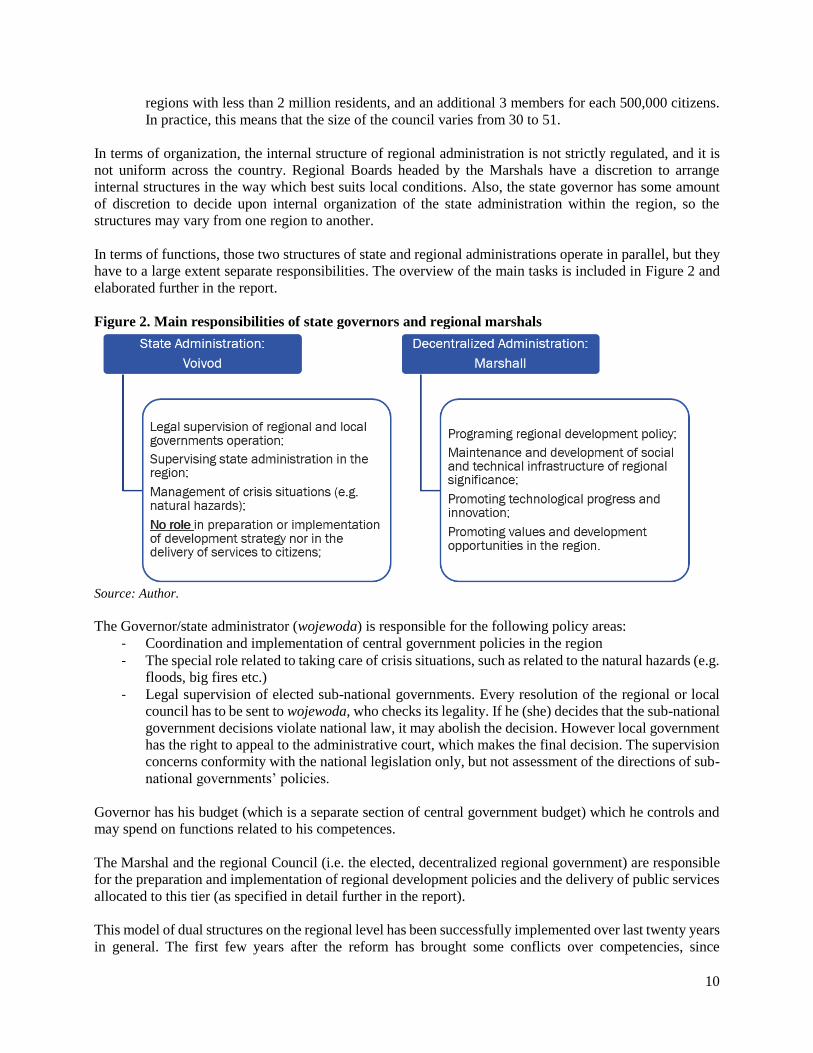
10
regions with less than 2 million residents, and an additional 3 members for each 500,000 citizens.
In practice, this means that the size of the council varies from 30 to 51.
In terms of organization, the internal structure of regional administration is not strictly regulated, and it is
not uniform across the country. Regional Boards headed by the Marshals have a discretion to arrange
internal structures in the way which best suits local conditions. Also, the state governor has some amount
of discretion to decide upon internal organization of the state administration within the region, so the
structures may vary from one region to another.
In terms of functions, those two structures of state and regional administrations operate in parallel, but they
have to a large extent separate responsibilities. The overview of the main tasks is included in Figure 2 and
elaborated further in the report.
Figure 2. Main responsibilities of state governors and regional marshals
Source: Author.
The Governor/state administrator (wojewoda) is responsible for the following policy areas:
- Coordination and implementation of central government policies in the region
- The special role related to taking care of crisis situations, such as related to the natural hazards (e.g.
floods, big fires etc.)
- Legal supervision of elected sub-national governments. Every resolution of the regional or local
council has to be sent to wojewoda, who checks its legality. If he (she) decides that the sub-national
government decisions violate national law, it may abolish the decision. However local government
has the right to appeal to the administrative court, which makes the final decision. The supervision
concerns conformity with the national legislation only, but not assessment of the directions of sub-
national governments’ policies.
Governor has his budget (which is a separate section of central government budget) which he controls and
may spend on functions related to his competences.
The Marshal and the regional Council (i.e. the elected, decentralized regional government) are responsible
for the preparation and implementation of regional development policies and the delivery of public services
allocated to this tier (as specified in detail further in the report).
This model of dual structures on the regional level has been successfully implemented over last twenty years
in general. The first few years after the reform has brought some conflicts over competencies, since
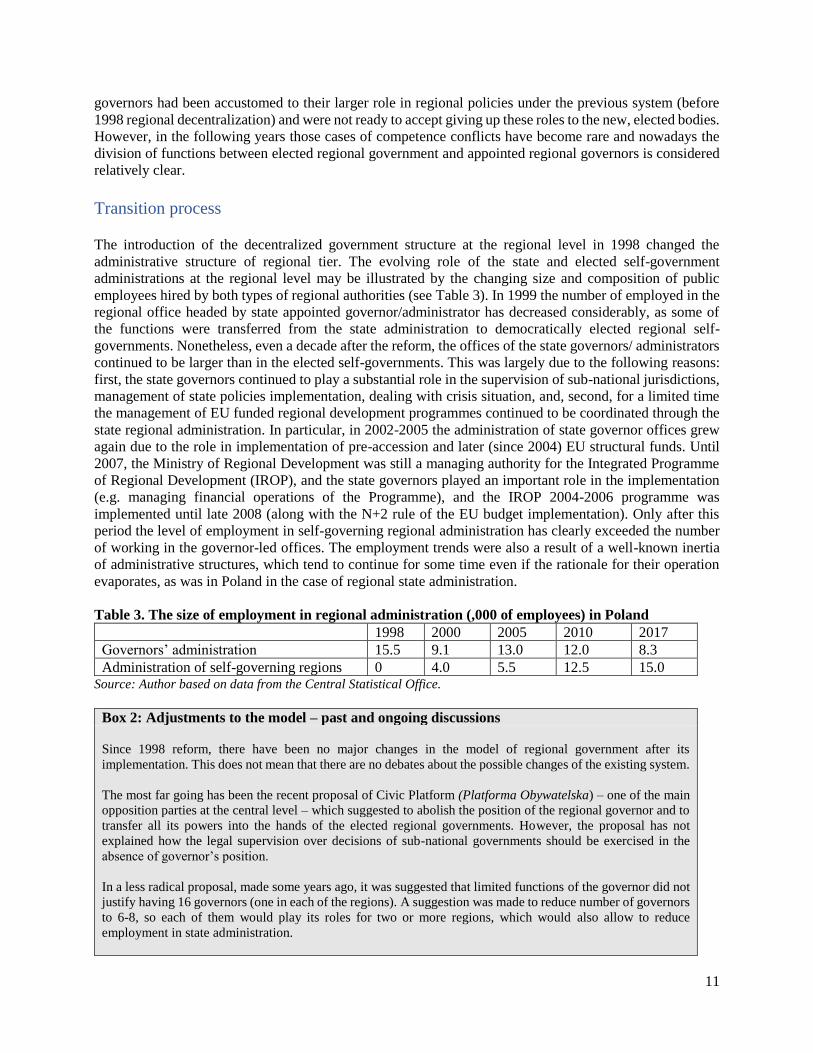
11
governors had been accustomed to their larger role in regional policies under the previous system (before
1998 regional decentralization) and were not ready to accept giving up these roles to the new, elected bodies.
However, in the following years those cases of competence conflicts have become rare and nowadays the
division of functions between elected regional government and appointed regional governors is considered
relatively clear.
Transition process
The introduction of the decentralized government structure at the regional level in 1998 changed the
administrative structure of regional tier. The evolving role of the state and elected self-government
administrations at the regional level may be illustrated by the changing size and composition of public
employees hired by both types of regional authorities (see Table 3). In 1999 the number of employed in the
regional office headed by state appointed governor/administrator has decreased considerably, as some of
the functions were transferred from the state administration to democratically elected regional self-
governments. Nonetheless, even a decade after the reform, the offices of the state governors/ administrators
continued to be larger than in the elected self-governments. This was largely due to the following reasons:
first, the state governors continued to play a substantial role in the supervision of sub-national jurisdictions,
management of state policies implementation, dealing with crisis situation, and, second, for a limited time
the management of EU funded regional development programmes continued to be coordinated through the
state regional administration. In particular, in 2002-2005 the administration of state governor offices grew
again due to the role in implementation of pre-accession and later (since 2004) EU structural funds. Until
2007, the Ministry of Regional Development was still a managing authority for the Integrated Programme
of Regional Development (IROP), and the state governors played an important role in the implementation
(e.g. managing financial operations of the Programme), and the IROP 2004-2006 programme was
implemented until late 2008 (along with the N+2 rule of the EU budget implementation). Only after this
period the level of employment in self-governing regional administration has clearly exceeded the number
of working in the governor-led offices. The employment trends were also a result of a well-known inertia
of administrative structures, which tend to continue for some time even if the rationale for their operation
evaporates, as was in Poland in the case of regional state administration.
Table 3. The size of employment in regional administration (,000 of employees) in Poland
1998 2000 2005 2010 2017
Governors’ administration 15.5 9.1 13.0 12.0 8.3
Administration of self-governing regions 0 4.0 5.5 12.5 15.0 Source: Author based on data from the Central Statistical Office.
Box 2: Adjustments to the model – past and ongoing discussions
Since 1998 reform, there have been no major changes in the model of regional government after its
implementation. This does not mean that there are no debates about the possible changes of the existing system.
The most far going has been the recent proposal of Civic Platform (Platforma Obywatelska) – one of the main
opposition parties at the central level – which suggested to abolish the position of the regional governor and to
transfer all its powers into the hands of the elected regional governments. However, the proposal has not
explained how the legal supervision over decisions of sub-national governments should be exercised in the
absence of governor’s position.
In a less radical proposal, made some years ago, it was suggested that limited functions of the governor did not
justify having 16 governors (one in each of the regions). A suggestion was made to reduce number of governors
to 6-8, so each of them would play its roles for two or more regions, which would also allow to reduce
employment in state administration.
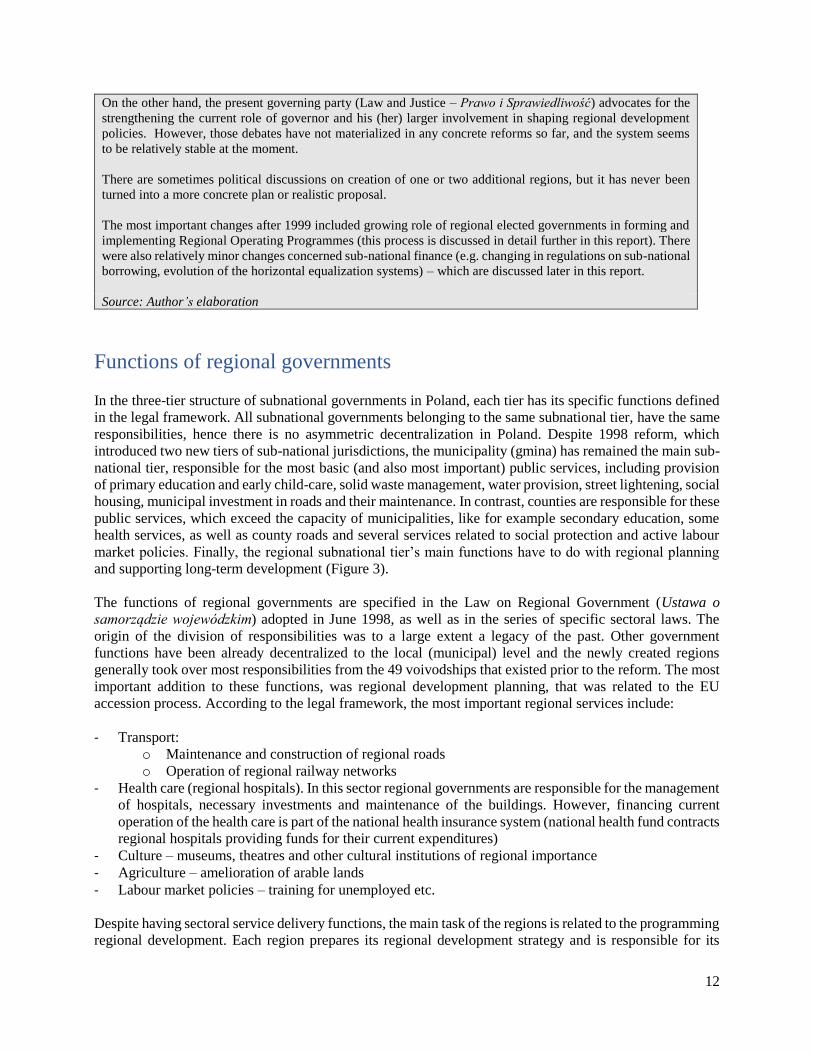
12
On the other hand, the present governing party (Law and Justice – Prawo i Sprawiedliwość) advocates for the
strengthening the current role of governor and his (her) larger involvement in shaping regional development
policies. However, those debates have not materialized in any concrete reforms so far, and the system seems
to be relatively stable at the moment.
There are sometimes political discussions on creation of one or two additional regions, but it has never been
turned into a more concrete plan or realistic proposal.
The most important changes after 1999 included growing role of regional elected governments in forming and
implementing Regional Operating Programmes (this process is discussed in detail further in this report). There
were also relatively minor changes concerned sub-national finance (e.g. changing in regulations on sub-national
borrowing, evolution of the horizontal equalization systems) – which are discussed later in this report.
Source: Author’s elaboration
Functions of regional governments
In the three-tier structure of subnational governments in Poland, each tier has its specific functions defined
in the legal framework. All subnational governments belonging to the same subnational tier, have the same
responsibilities, hence there is no asymmetric decentralization in Poland. Despite 1998 reform, which
introduced two new tiers of sub-national jurisdictions, the municipality (gmina) has remained the main sub-
national tier, responsible for the most basic (and also most important) public services, including provision
of primary education and early child-care, solid waste management, water provision, street lightening, social
housing, municipal investment in roads and their maintenance. In contrast, counties are responsible for these
public services, which exceed the capacity of municipalities, like for example secondary education, some
health services, as well as county roads and several services related to social protection and active labour
market policies. Finally, the regional subnational tier’s main functions have to do with regional planning
and supporting long-term development (Figure 3).
The functions of regional governments are specified in the Law on Regional Government (Ustawa o
samorządzie wojewódzkim) adopted in June 1998, as well as in the series of specific sectoral laws. The
origin of the division of responsibilities was to a large extent a legacy of the past. Other government
functions have been already decentralized to the local (municipal) level and the newly created regions
generally took over most responsibilities from the 49 voivodships that existed prior to the reform. The most
important addition to these functions, was regional development planning, that was related to the EU
accession process. According to the legal framework, the most important regional services include:
- Transport:
o Maintenance and construction of regional roads
o Operation of regional railway networks
- Health care (regional hospitals). In this sector regional governments are responsible for the management
of hospitals, necessary investments and maintenance of the buildings. However, financing current
operation of the health care is part of the national health insurance system (national health fund contracts
regional hospitals providing funds for their current expenditures)
- Culture – museums, theatres and other cultural institutions of regional importance
- Agriculture – amelioration of arable lands
- Labour market policies – training for unemployed etc.
Despite having sectoral service delivery functions, the main task of the regions is related to the programming
regional development. Each region prepares its regional development strategy and is responsible for its
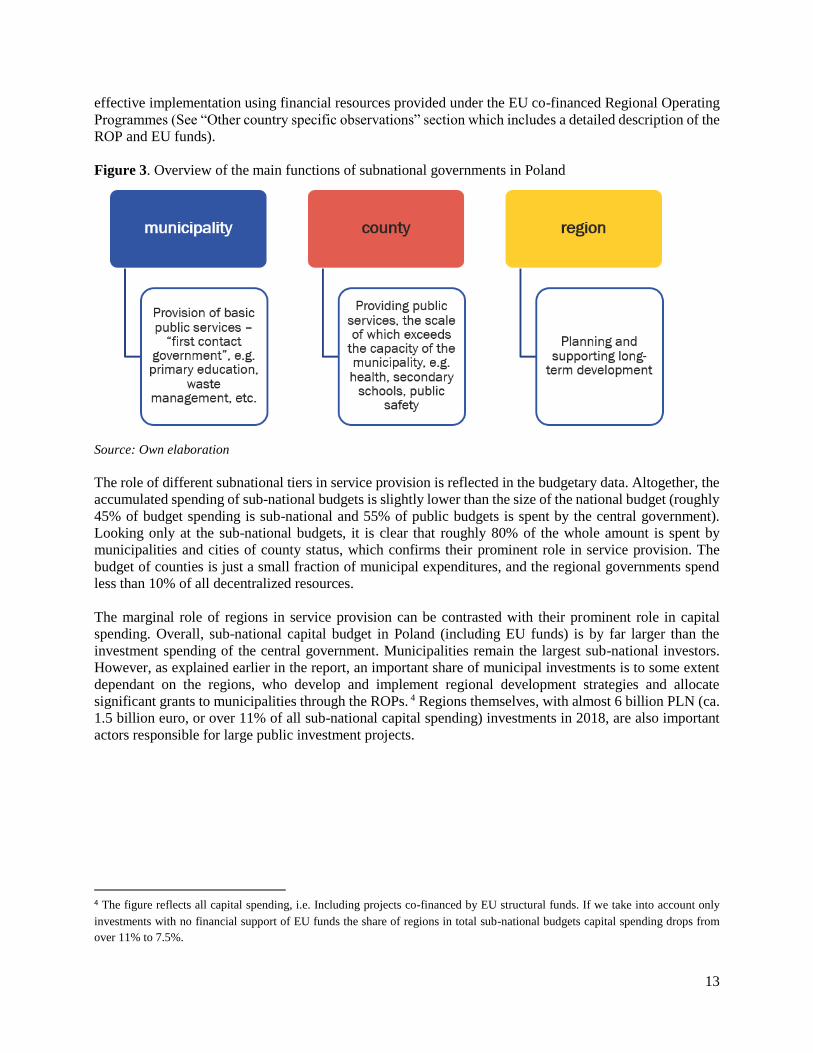
13
effective implementation using financial resources provided under the EU co-financed Regional Operating
Programmes (See “Other country specific observations” section which includes a detailed description of the
ROP and EU funds).
Figure 3. Overview of the main functions of subnational governments in Poland
Source: Own elaboration
The role of different subnational tiers in service provision is reflected in the budgetary data. Altogether, the
accumulated spending of sub-national budgets is slightly lower than the size of the national budget (roughly
45% of budget spending is sub-national and 55% of public budgets is spent by the central government).
Looking only at the sub-national budgets, it is clear that roughly 80% of the whole amount is spent by
municipalities and cities of county status, which confirms their prominent role in service provision. The
budget of counties is just a small fraction of municipal expenditures, and the regional governments spend
less than 10% of all decentralized resources.
The marginal role of regions in service provision can be contrasted with their prominent role in capital
spending. Overall, sub-national capital budget in Poland (including EU funds) is by far larger than the
investment spending of the central government. Municipalities remain the largest sub-national investors.
However, as explained earlier in the report, an important share of municipal investments is to some extent
dependant on the regions, who develop and implement regional development strategies and allocate
significant grants to municipalities through the ROPs. 4 Regions themselves, with almost 6 billion PLN (ca.
1.5 billion euro, or over 11% of all sub-national capital spending) investments in 2018, are also important
actors responsible for large public investment projects.
4 The figure reflects all capital spending, i.e. Including projects co-financed by EU structural funds. If we take into account only
investments with no financial support of EU funds the share of regions in total sub-national budgets capital spending drops from
over 11% to 7.5%.
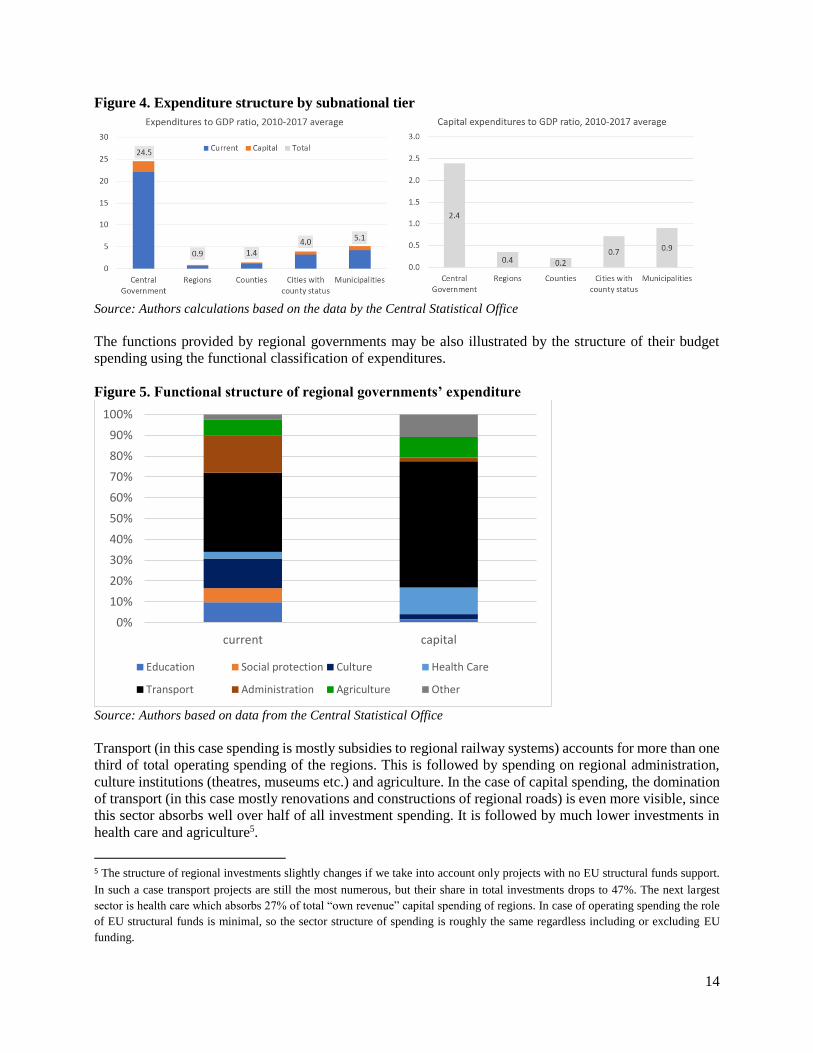
14
Figure 4. Expenditure structure by subnational tier
Source: Authors calculations based on the data by the Central Statistical Office
The functions provided by regional governments may be also illustrated by the structure of their budget
spending using the functional classification of expenditures.
Figure 5. Functional structure of regional governments’ expenditure
Source: Authors based on data from the Central Statistical Office
Transport (in this case spending is mostly subsidies to regional railway systems) accounts for more than one
third of total operating spending of the regions. This is followed by spending on regional administration,
culture institutions (theatres, museums etc.) and agriculture. In the case of capital spending, the domination
of transport (in this case mostly renovations and constructions of regional roads) is even more visible, since
this sector absorbs well over half of all investment spending. It is followed by much lower investments in
health care and agriculture5.
5 The structure of regional investments slightly changes if we take into account only projects with no EU structural funds support.
In such a case transport projects are still the most numerous, but their share in total investments drops to 47%. The next largest
sector is health care which absorbs 27% of total “own revenue” capital spending of regions. In case of operating spending the role
of EU structural funds is minimal, so the sector structure of spending is roughly the same regardless including or excluding EU
funding.
0%
10%
20%
30%
40%
50%
60%
70%
80%
90%
100%
current capital
Education Social protection Culture Health Care
Transport Administration Agriculture Other
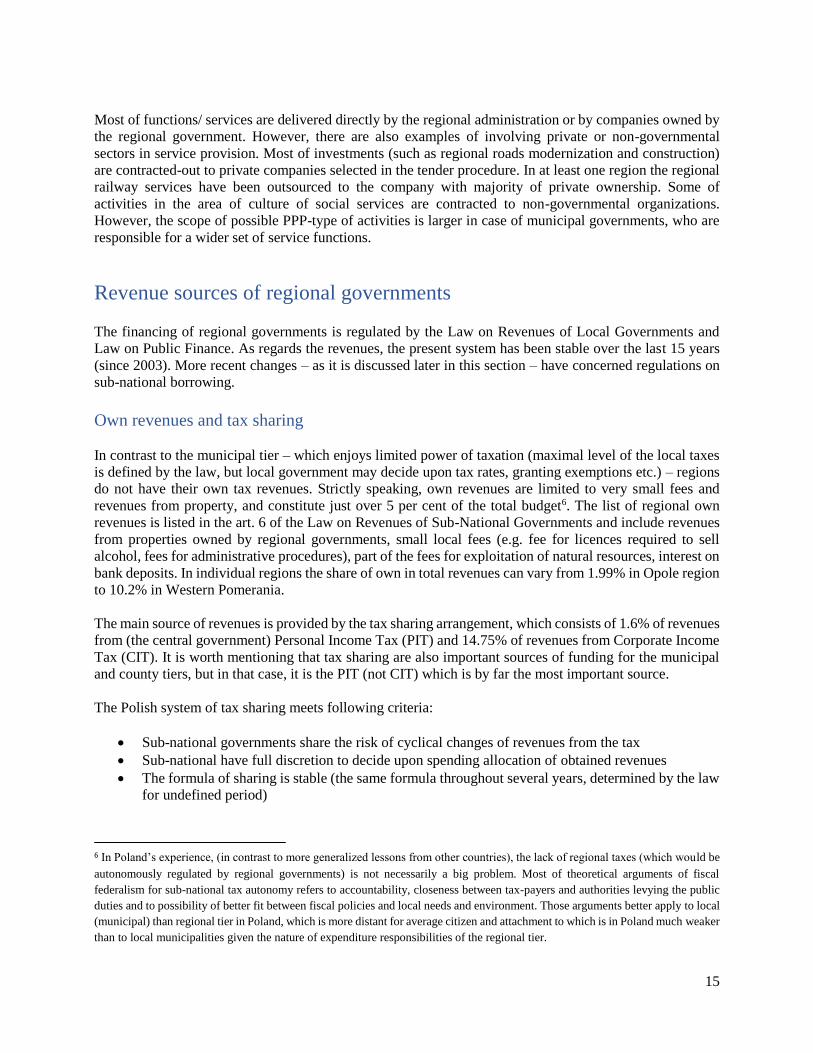
15
Most of functions/ services are delivered directly by the regional administration or by companies owned by
the regional government. However, there are also examples of involving private or non-governmental
sectors in service provision. Most of investments (such as regional roads modernization and construction)
are contracted-out to private companies selected in the tender procedure. In at least one region the regional
railway services have been outsourced to the company with majority of private ownership. Some of
activities in the area of culture of social services are contracted to non-governmental organizations.
However, the scope of possible PPP-type of activities is larger in case of municipal governments, who are
responsible for a wider set of service functions.
Revenue sources of regional governments
The financing of regional governments is regulated by the Law on Revenues of Local Governments and
Law on Public Finance. As regards the revenues, the present system has been stable over the last 15 years
(since 2003). More recent changes – as it is discussed later in this section – have concerned regulations on
sub-national borrowing.
Own revenues and tax sharing
In contrast to the municipal tier – which enjoys limited power of taxation (maximal level of the local taxes
is defined by the law, but local government may decide upon tax rates, granting exemptions etc.) – regions
do not have their own tax revenues. Strictly speaking, own revenues are limited to very small fees and
revenues from property, and constitute just over 5 per cent of the total budget6. The list of regional own
revenues is listed in the art. 6 of the Law on Revenues of Sub-National Governments and include revenues
from properties owned by regional governments, small local fees (e.g. fee for licences required to sell
alcohol, fees for administrative procedures), part of the fees for exploitation of natural resources, interest on
bank deposits. In individual regions the share of own in total revenues can vary from 1.99% in Opole region
to 10.2% in Western Pomerania.
The main source of revenues is provided by the tax sharing arrangement, which consists of 1.6% of revenues
from (the central government) Personal Income Tax (PIT) and 14.75% of revenues from Corporate Income
Tax (CIT). It is worth mentioning that tax sharing are also important sources of funding for the municipal
and county tiers, but in that case, it is the PIT (not CIT) which is by far the most important source.
The Polish system of tax sharing meets following criteria:
• Sub-national governments share the risk of cyclical changes of revenues from the tax
• Sub-national have full discretion to decide upon spending allocation of obtained revenues
• The formula of sharing is stable (the same formula throughout several years, determined by the law
for undefined period)
6 In Poland’s experience, (in contrast to more generalized lessons from other countries), the lack of regional taxes (which would be
autonomously regulated by regional governments) is not necessarily a big problem. Most of theoretical arguments of fiscal
federalism for sub-national tax autonomy refers to accountability, closeness between tax-payers and authorities levying the public
duties and to possibility of better fit between fiscal policies and local needs and environment. Those arguments better apply to local
(municipal) than regional tier in Poland, which is more distant for average citizen and attachment to which is in Poland much weaker
than to local municipalities given the nature of expenditure responsibilities of the regional tier.
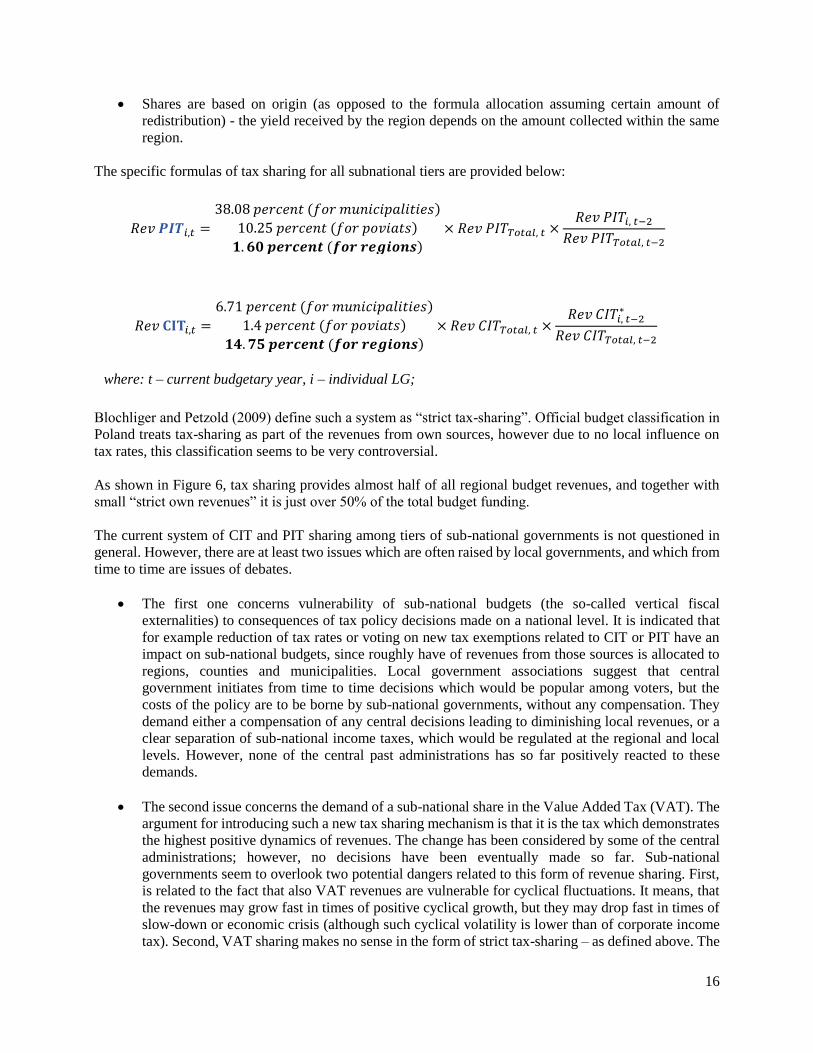
16
• Shares are based on origin (as opposed to the formula allocation assuming certain amount of
redistribution) - the yield received by the region depends on the amount collected within the same
region.
The specific formulas of tax sharing for all subnational tiers are provided below:
Blochliger and Petzold (2009) define such a system as “strict tax-sharing”. Official budget classification in
Poland treats tax-sharing as part of the revenues from own sources, however due to no local influence on
tax rates, this classification seems to be very controversial.
As shown in Figure 6, tax sharing provides almost half of all regional budget revenues, and together with
small “strict own revenues” it is just over 50% of the total budget funding.
The current system of CIT and PIT sharing among tiers of sub-national governments is not questioned in
general. However, there are at least two issues which are often raised by local governments, and which from
time to time are issues of debates.
• The first one concerns vulnerability of sub-national budgets (the so-called vertical fiscal
externalities) to consequences of tax policy decisions made on a national level. It is indicated that
for example reduction of tax rates or voting on new tax exemptions related to CIT or PIT have an
impact on sub-national budgets, since roughly have of revenues from those sources is allocated to
regions, counties and municipalities. Local government associations suggest that central
government initiates from time to time decisions which would be popular among voters, but the
costs of the policy are to be borne by sub-national governments, without any compensation. They
demand either a compensation of any central decisions leading to diminishing local revenues, or a
clear separation of sub-national income taxes, which would be regulated at the regional and local
levels. However, none of the central past administrations has so far positively reacted to these
demands.
• The second issue concerns the demand of a sub-national share in the Value Added Tax (VAT). The
argument for introducing such a new tax sharing mechanism is that it is the tax which demonstrates
the highest positive dynamics of revenues. The change has been considered by some of the central
administrations; however, no decisions have been eventually made so far. Sub-national
governments seem to overlook two potential dangers related to this form of revenue sharing. First,
is related to the fact that also VAT revenues are vulnerable for cyclical fluctuations. It means, that
the revenues may grow fast in times of positive cyclical growth, but they may drop fast in times of
slow-down or economic crisis (although such cyclical volatility is lower than of corporate income
tax). Second, VAT sharing makes no sense in the form of strict tax-sharing – as defined above. The
𝑅𝑒𝑣 𝑷𝑰𝑻𝑖,𝑡 =
38.08 𝑝𝑒𝑟𝑐𝑒𝑛𝑡 (𝑓𝑜𝑟 𝑚𝑢𝑛𝑖𝑐𝑖𝑝𝑎𝑙𝑖𝑡𝑖𝑒𝑠)
10.25 𝑝𝑒𝑟𝑐𝑒𝑛𝑡 (𝑓𝑜𝑟 𝑝𝑜𝑣𝑖𝑎𝑡𝑠)
𝟏. 𝟔𝟎 𝒑𝒆𝒓𝒄𝒆𝒏𝒕 (𝒇𝒐𝒓 𝒓𝒆𝒈𝒊𝒐𝒏𝒔)× 𝑅𝑒𝑣 𝑃𝐼𝑇𝑇𝑜𝑡𝑎𝑙, 𝑡 ×
𝑅𝑒𝑣 𝑃𝐼𝑇𝑖, 𝑡−2𝑅𝑒𝑣 𝑃𝐼𝑇𝑇𝑜𝑡𝑎𝑙, 𝑡−2
𝑅𝑒𝑣 𝐂𝐈𝐓𝑖,𝑡 =
6.71 𝑝𝑒𝑟𝑐𝑒𝑛𝑡 (𝑓𝑜𝑟 𝑚𝑢𝑛𝑖𝑐𝑖𝑝𝑎𝑙𝑖𝑡𝑖𝑒𝑠)
1.4 𝑝𝑒𝑟𝑐𝑒𝑛𝑡 (𝑓𝑜𝑟 𝑝𝑜𝑣𝑖𝑎𝑡𝑠)
𝟏𝟒. 𝟕𝟓 𝒑𝒆𝒓𝒄𝒆𝒏𝒕 (𝒇𝒐𝒓 𝒓𝒆𝒈𝒊𝒐𝒏𝒔)× 𝑅𝑒𝑣 𝐶𝐼𝑇𝑇𝑜𝑡𝑎𝑙, 𝑡 ×
𝑅𝑒𝑣 𝐶𝐼𝑇𝑖, 𝑡−2∗
𝑅𝑒𝑣 𝐶𝐼𝑇𝑇𝑜𝑡𝑎𝑙, 𝑡−2
where: t – current budgetary year, i – individual LG;
17
revenues collected from VAT within certain territory are poorly connected with the production
activity in the given region. Obviously, it would be possible to introduce VAT sharing based on
population or other allocation formula (as it is e.g. in Germany or Spain) but such option has not
been discussed in Poland thus far. Moreover, introducing such an allocation formula would make
the sharing system closer to the transfer (general purpose grant) with a defined amount to be
allocated among sub-national jurisdictions than own revenue, as currently classified under the
Polish nomenclature.
Figure 6. Structure of regional government revenues (2018)
Source: Authors based on data from the Central Statistical Office
Apart from excessive volatility, the there is one additional issue related to the present system of CIT-sharing,
which makes the system questionable (even though it has not been widely discussed thus far). It relates to
how CIT is distributed - according to the Law, the CIT is shared with subnational governments by origin.
However, there are many companies (and especially the largest tax-payers such as banks or mobile
telephone networks) which operate in more than one sub-national unit. Who should receive a share in the
paid CIT in such a case? Formally the issue is regulated by the paragraph 10 of the Law on Sub-National
Revenues. It stipulates that the amount of CIT is distributed among all sub-national governments in which
the company operates, proportionally to the number of employed in each of regions (or municipalities in
case of municipal shares). But in practice this regulation is not really implemented. Nobody bothers to
allocate e.g. shares in CIT paid by a large bank among all 16 regions, over 300 counties and more than 2000
municipalities. In practice the share goes to the sub-national government in which the company is registered,
exacerbating horizontal inequalities in revenues. This explains why city of Warsaw (where most of the
largest, nation-wide companies have their headquarters) and the region of Mazovia have by far the highest
revenues from this source. Per capita CIT revenues of Mazovia are over twice as high as of the next region
in the ranking and over 5.5 times higher than of the region with the lowest CIT revenues. In case of revenues
from PIT sharing the disproportions are much lower.
Transfers to regional budgets
The rest of regional revenues originates from the transfer system, which may be divided into three parts:
(1) Vertical general-purpose grant
(2) Horizontal equalization mechanism in the form of “Robin Hood tax”
(3) Various specific purpose transfers.
7%
9%
37%
11%2%
34%
own revenues
PIT share
CIT share
General purpose grant -vertical
General purpose grant -horizontal
Specific purpose grants
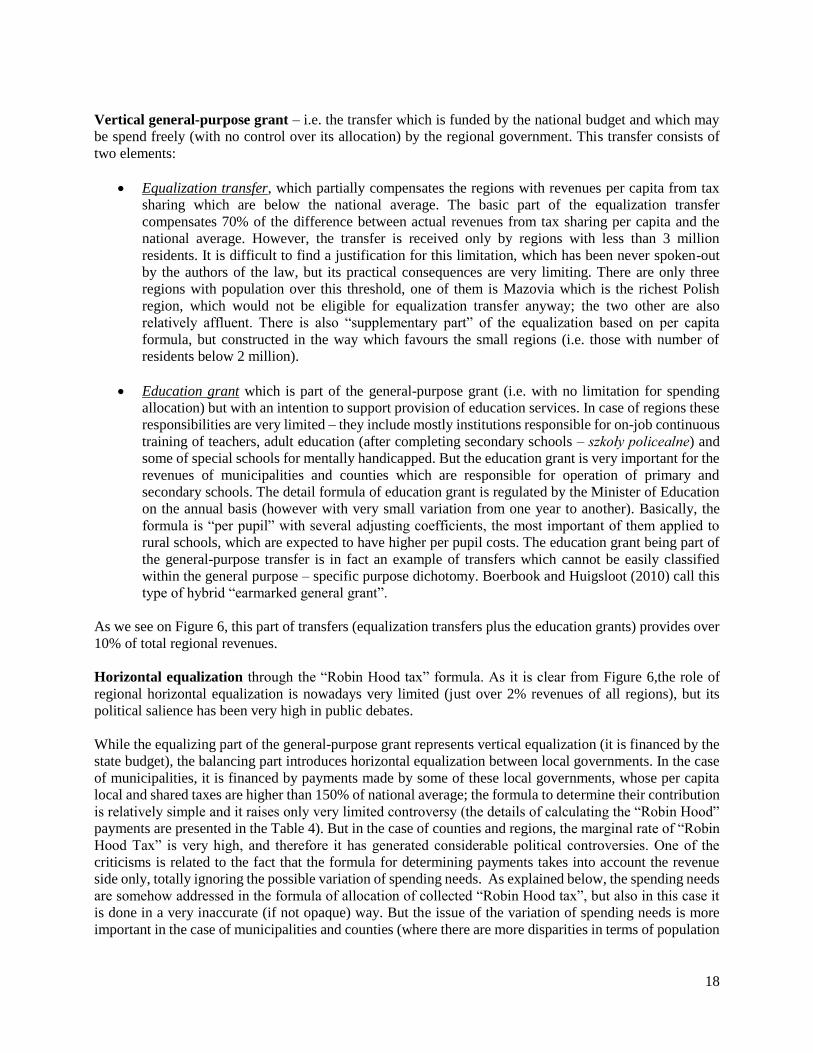
18
Vertical general-purpose grant – i.e. the transfer which is funded by the national budget and which may
be spend freely (with no control over its allocation) by the regional government. This transfer consists of
two elements:
• Equalization transfer, which partially compensates the regions with revenues per capita from tax
sharing which are below the national average. The basic part of the equalization transfer
compensates 70% of the difference between actual revenues from tax sharing per capita and the
national average. However, the transfer is received only by regions with less than 3 million
residents. It is difficult to find a justification for this limitation, which has been never spoken-out
by the authors of the law, but its practical consequences are very limiting. There are only three
regions with population over this threshold, one of them is Mazovia which is the richest Polish
region, which would not be eligible for equalization transfer anyway; the two other are also
relatively affluent. There is also “supplementary part” of the equalization based on per capita
formula, but constructed in the way which favours the small regions (i.e. those with number of
residents below 2 million).
• Education grant which is part of the general-purpose grant (i.e. with no limitation for spending
allocation) but with an intention to support provision of education services. In case of regions these
responsibilities are very limited – they include mostly institutions responsible for on-job continuous
training of teachers, adult education (after completing secondary schools – szkoły policealne) and
some of special schools for mentally handicapped. But the education grant is very important for the
revenues of municipalities and counties which are responsible for operation of primary and
secondary schools. The detail formula of education grant is regulated by the Minister of Education
on the annual basis (however with very small variation from one year to another). Basically, the
formula is “per pupil” with several adjusting coefficients, the most important of them applied to
rural schools, which are expected to have higher per pupil costs. The education grant being part of
the general-purpose transfer is in fact an example of transfers which cannot be easily classified
within the general purpose – specific purpose dichotomy. Boerbook and Huigsloot (2010) call this
type of hybrid “earmarked general grant”.
As we see on Figure 6, this part of transfers (equalization transfers plus the education grants) provides over
10% of total regional revenues.
Horizontal equalization through the “Robin Hood tax” formula. As it is clear from Figure 6,the role of
regional horizontal equalization is nowadays very limited (just over 2% revenues of all regions), but its
political salience has been very high in public debates.
While the equalizing part of the general-purpose grant represents vertical equalization (it is financed by the
state budget), the balancing part introduces horizontal equalization between local governments. In the case
of municipalities, it is financed by payments made by some of these local governments, whose per capita
local and shared taxes are higher than 150% of national average; the formula to determine their contribution
is relatively simple and it raises only very limited controversy (the details of calculating the “Robin Hood”
payments are presented in the Table 4). But in the case of counties and regions, the marginal rate of “Robin
Hood Tax” is very high, and therefore it has generated considerable political controversies. One of the
criticisms is related to the fact that the formula for determining payments takes into account the revenue
side only, totally ignoring the possible variation of spending needs. As explained below, the spending needs
are somehow addressed in the formula of allocation of collected “Robin Hood tax”, but also in this case it
is done in a very inaccurate (if not opaque) way. But the issue of the variation of spending needs is more
important in the case of municipalities and counties (where there are more disparities in terms of population
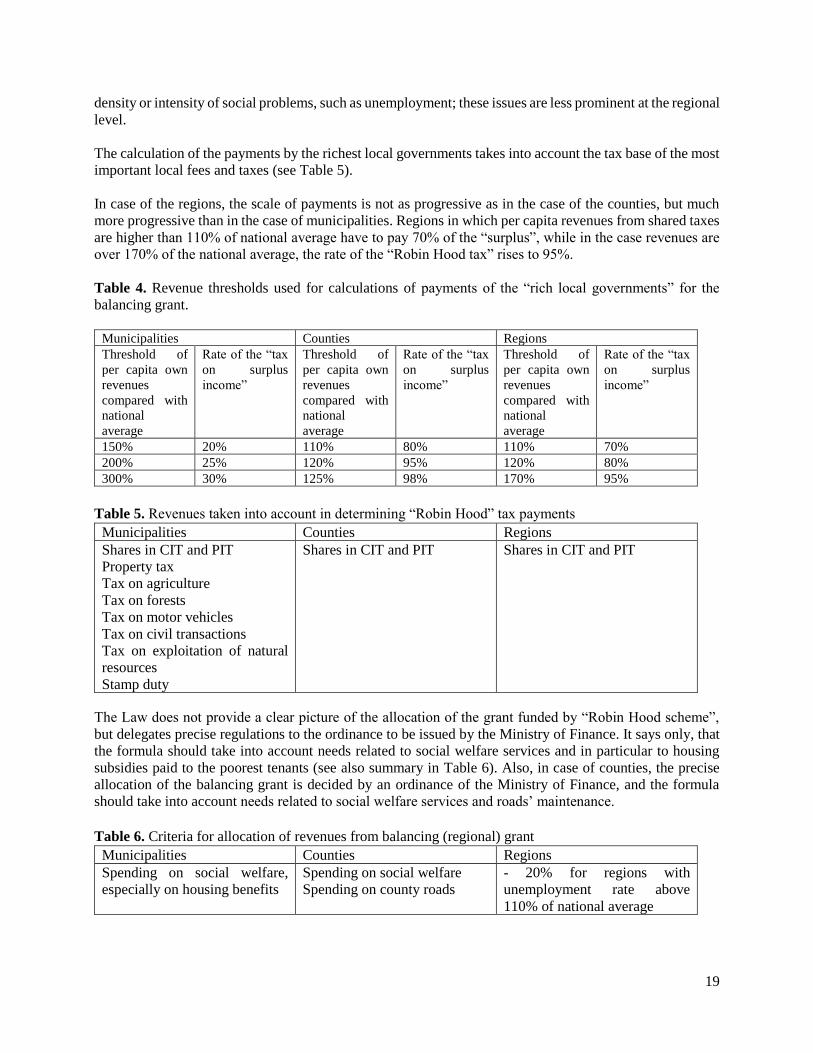
19
density or intensity of social problems, such as unemployment; these issues are less prominent at the regional
level.
The calculation of the payments by the richest local governments takes into account the tax base of the most
important local fees and taxes (see Table 5).
In case of the regions, the scale of payments is not as progressive as in the case of the counties, but much
more progressive than in the case of municipalities. Regions in which per capita revenues from shared taxes
are higher than 110% of national average have to pay 70% of the “surplus”, while in the case revenues are
over 170% of the national average, the rate of the “Robin Hood tax” rises to 95%.
Table 4. Revenue thresholds used for calculations of payments of the “rich local governments” for the
balancing grant.
Municipalities Counties Regions
Threshold of
per capita own
revenues
compared with
national
average
Rate of the “tax
on surplus
income”
Threshold of
per capita own
revenues
compared with
national
average
Rate of the “tax
on surplus
income”
Threshold of
per capita own
revenues
compared with
national
average
Rate of the “tax
on surplus
income”
150% 20% 110% 80% 110% 70%
200% 25% 120% 95% 120% 80%
300% 30% 125% 98% 170% 95%
Table 5. Revenues taken into account in determining “Robin Hood” tax payments
Municipalities Counties Regions
Shares in CIT and PIT
Property tax
Tax on agriculture
Tax on forests
Tax on motor vehicles
Tax on civil transactions
Tax on exploitation of natural
resources
Stamp duty
Shares in CIT and PIT Shares in CIT and PIT
The Law does not provide a clear picture of the allocation of the grant funded by “Robin Hood scheme”,
but delegates precise regulations to the ordinance to be issued by the Ministry of Finance. It says only, that
the formula should take into account needs related to social welfare services and in particular to housing
subsidies paid to the poorest tenants (see also summary in Table 6). Also, in case of counties, the precise
allocation of the balancing grant is decided by an ordinance of the Ministry of Finance, and the formula
should take into account needs related to social welfare services and roads’ maintenance.
Table 6. Criteria for allocation of revenues from balancing (regional) grant
Municipalities Counties Regions
Spending on social welfare,
especially on housing benefits
Spending on social welfare
Spending on county roads
- 20% for regions with
unemployment rate above
110% of national average
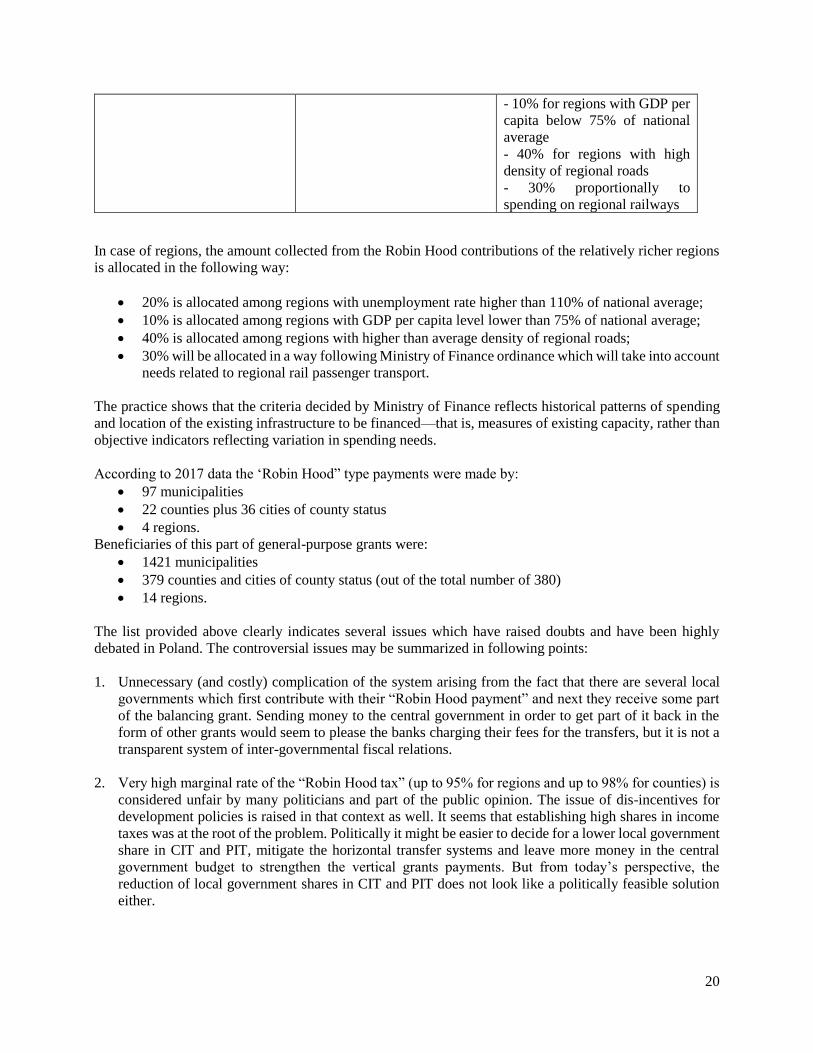
20
- 10% for regions with GDP per
capita below 75% of national
average
- 40% for regions with high
density of regional roads
- 30% proportionally to
spending on regional railways
In case of regions, the amount collected from the Robin Hood contributions of the relatively richer regions
is allocated in the following way:
• 20% is allocated among regions with unemployment rate higher than 110% of national average;
• 10% is allocated among regions with GDP per capita level lower than 75% of national average;
• 40% is allocated among regions with higher than average density of regional roads;
• 30% will be allocated in a way following Ministry of Finance ordinance which will take into account
needs related to regional rail passenger transport.
The practice shows that the criteria decided by Ministry of Finance reflects historical patterns of spending
and location of the existing infrastructure to be financed—that is, measures of existing capacity, rather than
objective indicators reflecting variation in spending needs.
According to 2017 data the ‘Robin Hood” type payments were made by:
• 97 municipalities
• 22 counties plus 36 cities of county status
• 4 regions.
Beneficiaries of this part of general-purpose grants were:
• 1421 municipalities
• 379 counties and cities of county status (out of the total number of 380)
• 14 regions.
The list provided above clearly indicates several issues which have raised doubts and have been highly
debated in Poland. The controversial issues may be summarized in following points:
1. Unnecessary (and costly) complication of the system arising from the fact that there are several local
governments which first contribute with their “Robin Hood payment” and next they receive some part
of the balancing grant. Sending money to the central government in order to get part of it back in the
form of other grants would seem to please the banks charging their fees for the transfers, but it is not a
transparent system of inter-governmental fiscal relations.
2. Very high marginal rate of the “Robin Hood tax” (up to 95% for regions and up to 98% for counties) is
considered unfair by many politicians and part of the public opinion. The issue of dis-incentives for
development policies is raised in that context as well. It seems that establishing high shares in income
taxes was at the root of the problem. Politically it might be easier to decide for a lower local government
share in CIT and PIT, mitigate the horizontal transfer systems and leave more money in the central
government budget to strengthen the vertical grants payments. But from today’s perspective, the
reduction of local government shares in CIT and PIT does not look like a politically feasible solution
either.
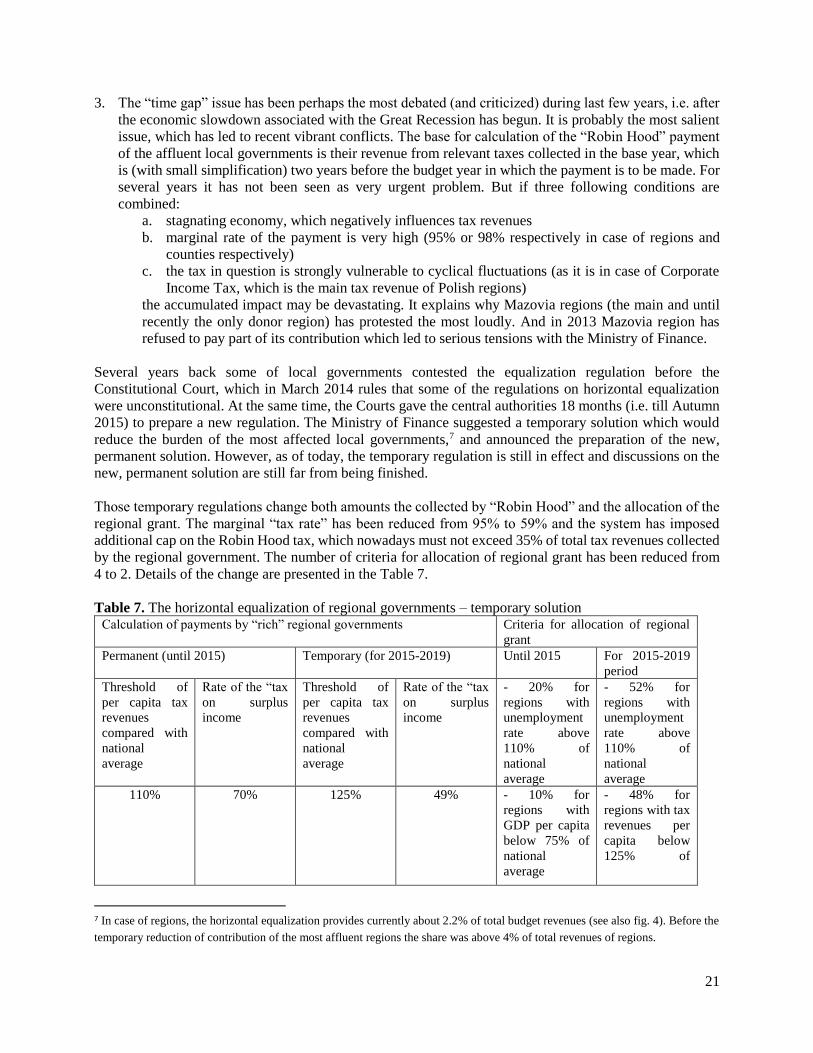
21
3. The “time gap” issue has been perhaps the most debated (and criticized) during last few years, i.e. after
the economic slowdown associated with the Great Recession has begun. It is probably the most salient
issue, which has led to recent vibrant conflicts. The base for calculation of the “Robin Hood” payment
of the affluent local governments is their revenue from relevant taxes collected in the base year, which
is (with small simplification) two years before the budget year in which the payment is to be made. For
several years it has not been seen as very urgent problem. But if three following conditions are
combined:
a. stagnating economy, which negatively influences tax revenues
b. marginal rate of the payment is very high (95% or 98% respectively in case of regions and
counties respectively)
c. the tax in question is strongly vulnerable to cyclical fluctuations (as it is in case of Corporate
Income Tax, which is the main tax revenue of Polish regions)
the accumulated impact may be devastating. It explains why Mazovia regions (the main and until
recently the only donor region) has protested the most loudly. And in 2013 Mazovia region has
refused to pay part of its contribution which led to serious tensions with the Ministry of Finance.
Several years back some of local governments contested the equalization regulation before the
Constitutional Court, which in March 2014 rules that some of the regulations on horizontal equalization
were unconstitutional. At the same time, the Courts gave the central authorities 18 months (i.e. till Autumn
2015) to prepare a new regulation. The Ministry of Finance suggested a temporary solution which would
reduce the burden of the most affected local governments,7 and announced the preparation of the new,
permanent solution. However, as of today, the temporary regulation is still in effect and discussions on the
new, permanent solution are still far from being finished.
Those temporary regulations change both amounts the collected by “Robin Hood” and the allocation of the
regional grant. The marginal “tax rate” has been reduced from 95% to 59% and the system has imposed
additional cap on the Robin Hood tax, which nowadays must not exceed 35% of total tax revenues collected
by the regional government. The number of criteria for allocation of regional grant has been reduced from
4 to 2. Details of the change are presented in the Table 7.
Table 7. The horizontal equalization of regional governments – temporary solution Calculation of payments by “rich” regional governments Criteria for allocation of regional
grant
Permanent (until 2015) Temporary (for 2015-2019) Until 2015 For 2015-2019
period
Threshold of
per capita tax
revenues
compared with
national
average
Rate of the “tax
on surplus
income
Threshold of
per capita tax
revenues
compared with
national
average
Rate of the “tax
on surplus
income
- 20% for
regions with
unemployment
rate above
110% of
national
average
- 52% for
regions with
unemployment
rate above
110% of
national
average
110% 70% 125% 49% - 10% for
regions with
GDP per capita
below 75% of
national
average
- 48% for
regions with tax
revenues per
capita below
125% of
7 In case of regions, the horizontal equalization provides currently about 2.2% of total budget revenues (see also fig. 4). Before the
temporary reduction of contribution of the most affluent regions the share was above 4% of total revenues of regions.
22
120% 80% 150% 59% - 40% for
regions with
high density of
regional roads
national
average
170% 95% In addition, total payment cannot
exceed 35% of tax revenues
- 30%
proportionally
to spending on
regional
railways
The third component of the transfer system consist of several, sectoral specific purpose grants. As it is
clear from the Figure 6, these conditional transfers provide more than one third of all regional budget
revenues. This funding source has been criticized for being very fragmented, for being heavily controlled
by sectoral ministries, and for rarely providing fully transparent rules for the allocation of resources among
subnational units. In addition, these transfers are not predictable.
Obviously, the specific purpose grants should not be totally eliminated. They are justified – as for a limited
period of time - in case of transfer of new functions. But more fundamentally to support well-defined
sectoral policies and programs of the central governments that can be better delivered by subnational
governments and to address externalities and other well-known justifications for conditional central
government transfers. Nevertheless, the current situation the system is definitely too complex, not
sufficiently transparent and constitutes an unnecessarily large part of total revenues of the Polish regions’
budgets.
In 2018 the total value of specific grants for regional governments was almost 6 billion PLN. The vast
majority (4.5 billion PLN) was related to EU supported project – either as direct grant from operating
programs or as central budget support to finance matching funds necessary in order to apply for the EU
funding. About 55% of all specific grants were allocated as capital grants and 45% to support current
expenditures.
The most significant specific grants programs include:
1. 1.75 billion PLN for transport. This amount allows to cover:
a. 715 million for investments and 220 mln for maintenance of regional roads
b. 600 million to support regional bus transportation (mostly to refund costs of reduced fares
for students, pensioners etc.)
c. Over 125 million to support operating costs of regional railways
2. Almost 150 million of various grants for social care
3. Over 100 million of various grants for agriculture (mostly amelioration of lands).
Most of specific grants is operated by Ministry of Development, but some programs are also handled by
Ministry of Finance, Ministry of Labor and Social Protection, Ministry of Culture and other line ministries,
and discretion of ministries in allocation of some of the grants among regions is considerable. The amount
of grant is typically provided by the Ministry in the stage of budget preparation (i.e. before November of a
year before the budget year), but it happens that the sum is being changed during the budget year (typically
the increase is financed form the budget reserve line). Technically speaking, most of the central grants are
transferred to regional governments through the regional governor, but his (her) role is almost purely
technical, with no discretion to change the amount or formulate additional conditions.
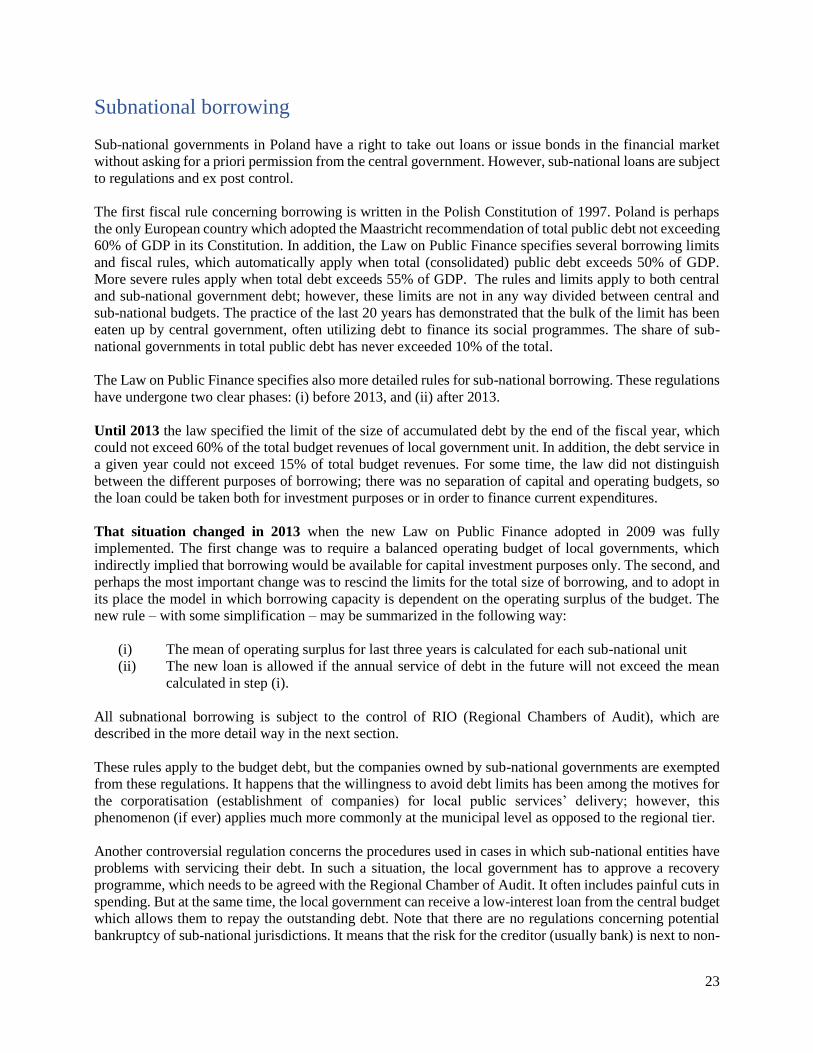
23
Subnational borrowing
Sub-national governments in Poland have a right to take out loans or issue bonds in the financial market
without asking for a priori permission from the central government. However, sub-national loans are subject
to regulations and ex post control.
The first fiscal rule concerning borrowing is written in the Polish Constitution of 1997. Poland is perhaps
the only European country which adopted the Maastricht recommendation of total public debt not exceeding
60% of GDP in its Constitution. In addition, the Law on Public Finance specifies several borrowing limits
and fiscal rules, which automatically apply when total (consolidated) public debt exceeds 50% of GDP.
More severe rules apply when total debt exceeds 55% of GDP. The rules and limits apply to both central
and sub-national government debt; however, these limits are not in any way divided between central and
sub-national budgets. The practice of the last 20 years has demonstrated that the bulk of the limit has been
eaten up by central government, often utilizing debt to finance its social programmes. The share of sub-
national governments in total public debt has never exceeded 10% of the total.
The Law on Public Finance specifies also more detailed rules for sub-national borrowing. These regulations
have undergone two clear phases: (i) before 2013, and (ii) after 2013.
Until 2013 the law specified the limit of the size of accumulated debt by the end of the fiscal year, which
could not exceed 60% of the total budget revenues of local government unit. In addition, the debt service in
a given year could not exceed 15% of total budget revenues. For some time, the law did not distinguish
between the different purposes of borrowing; there was no separation of capital and operating budgets, so
the loan could be taken both for investment purposes or in order to finance current expenditures.
That situation changed in 2013 when the new Law on Public Finance adopted in 2009 was fully
implemented. The first change was to require a balanced operating budget of local governments, which
indirectly implied that borrowing would be available for capital investment purposes only. The second, and
perhaps the most important change was to rescind the limits for the total size of borrowing, and to adopt in
its place the model in which borrowing capacity is dependent on the operating surplus of the budget. The
new rule – with some simplification – may be summarized in the following way:
(i) The mean of operating surplus for last three years is calculated for each sub-national unit
(ii) The new loan is allowed if the annual service of debt in the future will not exceed the mean
calculated in step (i).
All subnational borrowing is subject to the control of RIO (Regional Chambers of Audit), which are
described in the more detail way in the next section.
These rules apply to the budget debt, but the companies owned by sub-national governments are exempted
from these regulations. It happens that the willingness to avoid debt limits has been among the motives for
the corporatisation (establishment of companies) for local public services’ delivery; however, this
phenomenon (if ever) applies much more commonly at the municipal level as opposed to the regional tier.
Another controversial regulation concerns the procedures used in cases in which sub-national entities have
problems with servicing their debt. In such a situation, the local government has to approve a recovery
programme, which needs to be agreed with the Regional Chamber of Audit. It often includes painful cuts in
spending. But at the same time, the local government can receive a low-interest loan from the central budget
which allows them to repay the outstanding debt. Note that there are no regulations concerning potential
bankruptcy of sub-national jurisdictions. It means that the risk for the creditor (usually bank) is next to non-
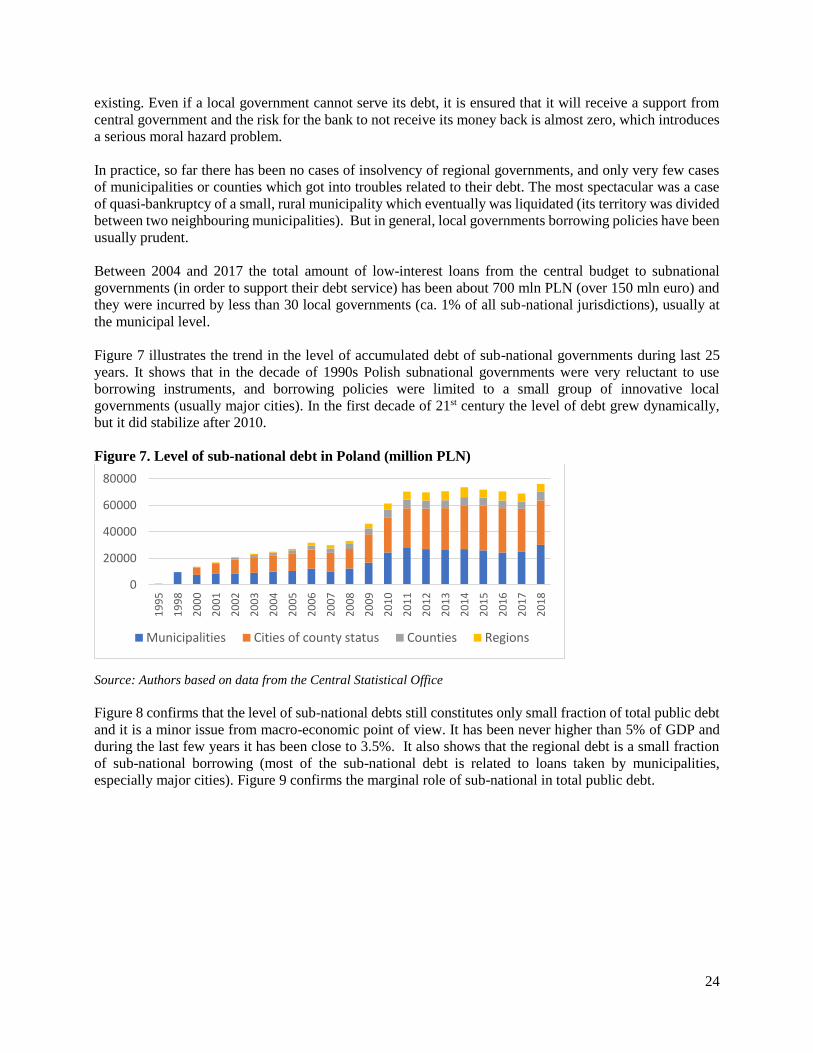
24
existing. Even if a local government cannot serve its debt, it is ensured that it will receive a support from
central government and the risk for the bank to not receive its money back is almost zero, which introduces
a serious moral hazard problem.
In practice, so far there has been no cases of insolvency of regional governments, and only very few cases
of municipalities or counties which got into troubles related to their debt. The most spectacular was a case
of quasi-bankruptcy of a small, rural municipality which eventually was liquidated (its territory was divided
between two neighbouring municipalities). But in general, local governments borrowing policies have been
usually prudent.
Between 2004 and 2017 the total amount of low-interest loans from the central budget to subnational
governments (in order to support their debt service) has been about 700 mln PLN (over 150 mln euro) and
they were incurred by less than 30 local governments (ca. 1% of all sub-national jurisdictions), usually at
the municipal level.
Figure 7 illustrates the trend in the level of accumulated debt of sub-national governments during last 25
years. It shows that in the decade of 1990s Polish subnational governments were very reluctant to use
borrowing instruments, and borrowing policies were limited to a small group of innovative local
governments (usually major cities). In the first decade of 21st century the level of debt grew dynamically,
but it did stabilize after 2010.
Figure 7. Level of sub-national debt in Poland (million PLN)
Source: Authors based on data from the Central Statistical Office
Figure 8 confirms that the level of sub-national debts still constitutes only small fraction of total public debt
and it is a minor issue from macro-economic point of view. It has been never higher than 5% of GDP and
during the last few years it has been close to 3.5%. It also shows that the regional debt is a small fraction
of sub-national borrowing (most of the sub-national debt is related to loans taken by municipalities,
especially major cities). Figure 9 confirms the marginal role of sub-national in total public debt.
0
20000
40000
60000
80000
19
95
19
98
20
00
20
01
20
02
20
03
20
04
20
05
20
06
20
07
20
08
20
09
20
10
20
11
20
12
20
13
20
14
20
15
20
16
20
17
20
18
Municipalities Cities of county status Counties Regions
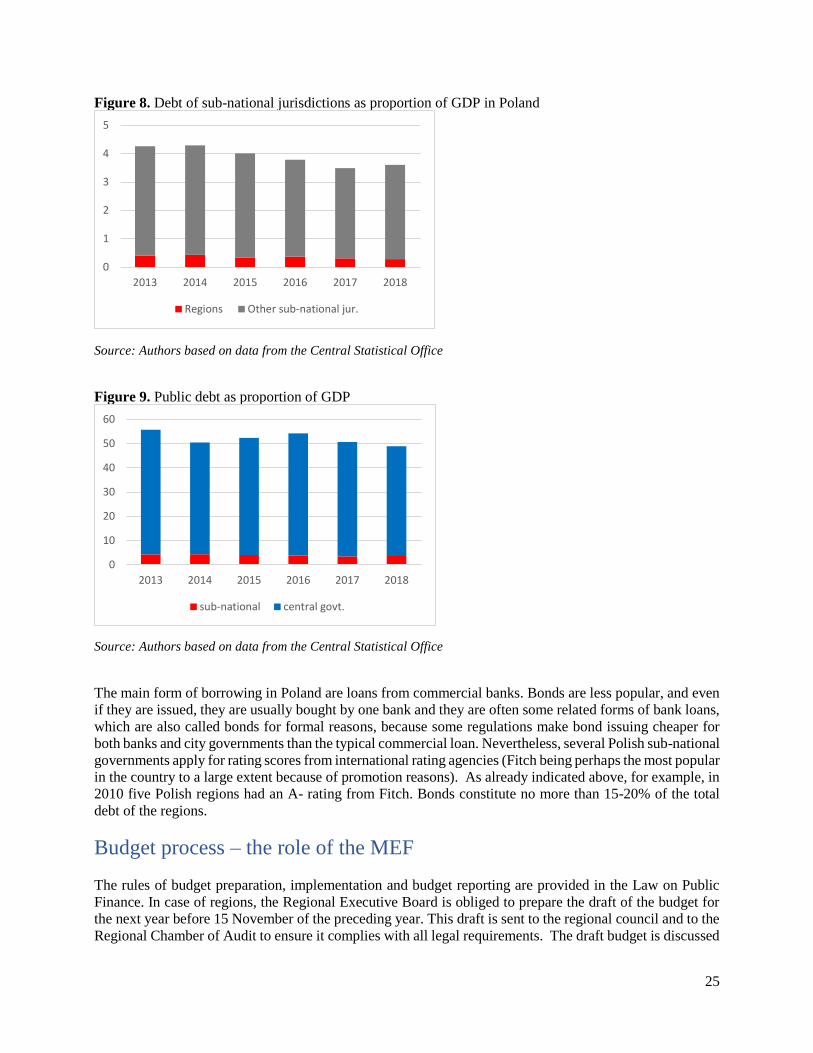
25
Figure 8. Debt of sub-national jurisdictions as proportion of GDP in Poland
Source: Authors based on data from the Central Statistical Office
Figure 9. Public debt as proportion of GDP
Source: Authors based on data from the Central Statistical Office
The main form of borrowing in Poland are loans from commercial banks. Bonds are less popular, and even
if they are issued, they are usually bought by one bank and they are often some related forms of bank loans,
which are also called bonds for formal reasons, because some regulations make bond issuing cheaper for
both banks and city governments than the typical commercial loan. Nevertheless, several Polish sub-national
governments apply for rating scores from international rating agencies (Fitch being perhaps the most popular
in the country to a large extent because of promotion reasons). As already indicated above, for example, in
2010 five Polish regions had an A- rating from Fitch. Bonds constitute no more than 15-20% of the total
debt of the regions.
Budget process – the role of the MEF
The rules of budget preparation, implementation and budget reporting are provided in the Law on Public
Finance. In case of regions, the Regional Executive Board is obliged to prepare the draft of the budget for
the next year before 15 November of the preceding year. This draft is sent to the regional council and to the
Regional Chamber of Audit to ensure it complies with all legal requirements. The draft budget is discussed
0
1
2
3
4
5
2013 2014 2015 2016 2017 2018
Regions Other sub-national jur.
0
10
20
30
40
50
60
2013 2014 2015 2016 2017 2018
sub-national central govt.
26
by the council, which may change the allocation of expenditures and even the projection of revenues;
however, it has no right to propose changes which would result in an increase of the budget deficit (to be
financed by borrowing). As a matter of principle, the budget for the next year should be adopted by the
regional council before the end of December. But limited delays in the budget resolution are acceptable; in
such cases, in the first months of the new year the draft budget is the base used to authorize any necessary
spending. However, if the budget is not agreed and voted by the end of February, the Regional Chamber of
Audit (RIO) may impose the budget prepared by the RIO.
The communication between Ministry of Finance and regional government is important for the budgeting
process. Large part of revenue projections, especially related to shares in PIT and CIT revenues, as well as
general purpose grants, is based on the forecasts provided by the Ministry. Since regions – opposite to
municipalities – do not have their own regional taxes, the role of their own revenue projections is much
smaller.
The budget may be amended during the year, but the only institution allowed to propose amendments is the
Regional Executive Board. After the end of the year, the Regional Executive Board prepares report on
budget execution which has to be submitted to the regional council (and also to the Regional Chamber of
Audit) before the end of March of the subsequent year. The detail report follows the official budget
classification and is publicly available on the web-site of the Ministry of Finance. (The reports are sent to
both Ministry and Finance and RIO not only after full budget year, but also after every quarter). The 2009
Law on Public Finance also requires the preparation of a multi-year prognosis of budget revenues and
spending. The minimal time horizon for such a prognosis is 3-years, and it is prepared int the “rolling
system” (the document for next three years adopted on an annual basis). Most of sub-national governments
prepares these prognoses in parallel with their multi-year investment programmes.
Supervision, transparency and accountability
Financial supervision
Ensuring the fiscal probity of subnational governments is always a challenge. One way to meet this
challenge is to make local governments finance themselves, placing the regulatory burden on taxpayers and
creditors. Another is to make a government agency or a specialised court responsible for financial oversight.
Poland’s reformers never seriously considered the first, because they knew local governments would be
heavily dependent on transfers. But they also rejected the second because they were afraid that a national
government agency might use financial oversight to meddle in local politics. Instead, a new financial
oversight institution was developed – Regional Chambers of Audit (RIOs).
In 1992 that seventeen RIOs were actually created. They were made independent of all line ministries and
their boundaries extended across regions, making their jurisdictions different from all other government
institutions. Each RIO operated independently, though their directors belonged to a Collegium designed to
co-ordinate their activities. Most importantly, while the Prime Minister nominated their Directors, but it has
always been non-political position and the leadership of the RIOs remains unchanged in the case of changes
in government (there are still 2 or 3 Presidents of RIO who have hold their posts since very beginning of
RIO’s operation in 1992). In addition, the nominees had to be approved by the Sejmiki, who also named
half of their managing boards. The result was a decentralized, co-governed institution whose “hybrid”
structure and operational independence were explicitly seen as ways to prevent state overreach while
fostering workable financial standards. Also, the staff of RIO was recruited from the recent college graduates
or accountants and lawyers drawn from industry to ensure independence from the central government.
27
The primary aim of the RIO is to oversee the “financial economy of local governments”, which is divided
into four main functions: Control, Oversight, Opinion Giving, and Information and Training. Under
“Control” they review the legality – not substance – of all local budget resolutions (e.g. budget plan, report
on budget execution, resolutions on rates of municipal taxes, compliance with legal rules concerning local
borrowing). They can declare resolutions illegal and even take temporary control of a municipality’s
finances if its Council fails to comply with applicable law. In the cases of conflicts over legality, the final
decisions belong to the court system. All checks on legality are performed by the so called “collegium of
RIO”, which consists of President, Vice Presidents, and experts (usually lawyers and economists from local
universities) invited by the President. Under “Oversight” they must audit the finances of all local
government once every four years and they must issue non-binding opinions – “Opinion Giving” – on a
local government’s ability to service prospective debts. Finally, they are responsible for developing annual
training programs for their jurisdictions.
Transparency and participatory mechanisms
Perhaps the most important regulation concerning the transparency of subnational governments is related to
public access to information. This is implemented in practice by several means, including:
- Compulsory publication of several information on web-sites of regional governments;
- Right of citizens to participate in the meetings of regional council. Agendas and minutes of meetings
are also published in the internet, and several regions allow to watch the council meetings live in the
internet
- Very detail reports on budget execution of each of sub-national government are publicly available on
the web-site of Ministry of Finance
- Citizens have a right to demand access to documents and information on the basis of the “right of access
to public information”.
As regards the direct impact of residents on decision making, the most far going regulation concerns the
possibility of local and regional referenda. However, so far there has been only one case of a regional
referendum. However, several local referenda – usually at the municipal level – are organized every year.
This only case of a regional referendum concerned the building of a regional airport in Podlasie region
(north-eastern Poland), held in 2017.
The law on referenda provides slightly different regulations concerning two types of referenda. The first
one is related to early termination of the regional council and regional executive board. Several conditions
need to be met in order to decide on early termination of the council:
- Petition to organize referendum signed by no less than 5% of eligible voters;
- Majority of votes for early termination
- Turn-out in referendum no less than 3/5 of the turn-out in the most recent regular elections.
In addition, such a referendum must not be organized in less than one year after the regular election, less
than half a year before the next regular elections, nor less than a year after the previous referendum.
All other referenda (on any other issue than early termination of regional council) are organized according
to very similar rules, with one important difference concerning the threshold of turn-out required in order
referendum to be valid. In this case, the threshold is set on the level of 30% of eligible voters.
The tool which has gained considerable popularity in Poland in recent years has been participatory
budgeting. It has been voluntarily introduced by most of Polish large-- and also by several smaller-- towns,
28
and in 2017 it has become compulsory for cities of county status. Overall, this form of community
involvement as well as several other forms of participatory democracy seem to be much more suitable for a
local (municipal) level than for regions. Nevertheless, there is at least one Polish region which has used
participatory budgeting mechanism. Usually in Poland the tool has involved very limited amount of funding
(typically no more than 1% of the budget). Another line of criticism concerns the fact that contrary to
original assumptions, participatory budgeting has little to do with public deliberation. Instead, it is rather a
form of plebiscite or “beauty contest” in which citizens vote for projects submitted by various NGOs or
local activists.
There is also gradually increasing role of various consultative bodies functioning on a regional (and even
more on a local) level which are a form of involvement of civic society in the process of governance.
One example of such civic institutions are the labour market councils (LMCs), which have been created on
the basis of a national law, the Act on Employment Promotion and Labour Market Institutions, adopted in
2004. These councils have been created at the state, the regional and the county levels. The councils work
with the regional and local labour offices, a sectoral administration subordinated to the regional and county
governments providing services to the employers and unemployed. The labour market councils were
established in response to the unemployment crisis observed in early 2000 in Poland following the massive
collapse of the state-owned companies in the first years of the economic transition after 1989.
Another example of consultative institutions is the “Public Benefit Councils” which are a for a to discuss
cooperation of regional or local governments with non-governmental organizations. Their functioning has
been regulated by the Law on Public Benefit and Volunteerism from 2003. And since 2015 their creation
has been obligatory on request of local NGOs.
An important part of the role of civic society in preparation and implementation of development policies is
related to the EU-co-funded Regional Operating Programmes. Each of the Programmes has its Regional
Monitoring Committee which includes representatives of local businesses, societal organizations and
experts from local universities. The Committee is the forum for discussion of development priorities and
details of the programmes’ implementation.
Other country-specific observations
Role of regions in regional development policies
The role of regions in sub-national investments is not very important (less than ¼ of total sub-national
investment spending). The major regional investments concern regional roads, hospitals and amelioration
of arable lands. The evolution of investment spending of subnational governments is shown on Figure 10.
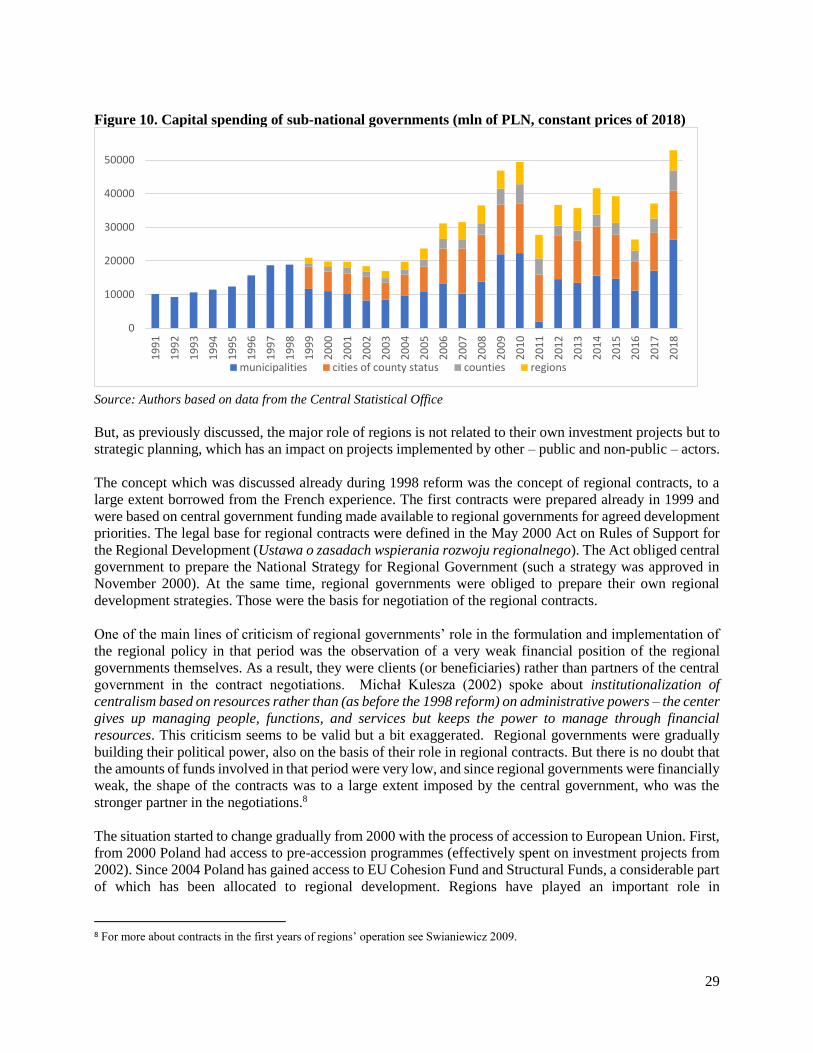
29
Figure 10. Capital spending of sub-national governments (mln of PLN, constant prices of 2018)
Source: Authors based on data from the Central Statistical Office
But, as previously discussed, the major role of regions is not related to their own investment projects but to
strategic planning, which has an impact on projects implemented by other – public and non-public – actors.
The concept which was discussed already during 1998 reform was the concept of regional contracts, to a
large extent borrowed from the French experience. The first contracts were prepared already in 1999 and
were based on central government funding made available to regional governments for agreed development
priorities. The legal base for regional contracts were defined in the May 2000 Act on Rules of Support for
the Regional Development (Ustawa o zasadach wspierania rozwoju regionalnego). The Act obliged central
government to prepare the National Strategy for Regional Government (such a strategy was approved in
November 2000). At the same time, regional governments were obliged to prepare their own regional
development strategies. Those were the basis for negotiation of the regional contracts.
One of the main lines of criticism of regional governments’ role in the formulation and implementation of
the regional policy in that period was the observation of a very weak financial position of the regional
governments themselves. As a result, they were clients (or beneficiaries) rather than partners of the central
government in the contract negotiations. Michał Kulesza (2002) spoke about institutionalization of
centralism based on resources rather than (as before the 1998 reform) on administrative powers – the center
gives up managing people, functions, and services but keeps the power to manage through financial
resources. This criticism seems to be valid but a bit exaggerated. Regional governments were gradually
building their political power, also on the basis of their role in regional contracts. But there is no doubt that
the amounts of funds involved in that period were very low, and since regional governments were financially
weak, the shape of the contracts was to a large extent imposed by the central government, who was the
stronger partner in the negotiations.8
The situation started to change gradually from 2000 with the process of accession to European Union. First,
from 2000 Poland had access to pre-accession programmes (effectively spent on investment projects from
2002). Since 2004 Poland has gained access to EU Cohesion Fund and Structural Funds, a considerable part
of which has been allocated to regional development. Regions have played an important role in
8 For more about contracts in the first years of regions’ operation see Swianiewicz 2009.
0
10000
20000
30000
40000
500001
99
1
19
92
19
93
19
94
19
95
19
96
19
97
19
98
19
99
20
00
20
01
20
02
20
03
20
04
20
05
20
06
20
07
20
08
20
09
20
10
20
11
20
12
20
13
20
14
20
15
20
16
20
17
20
18
municipalities cities of county status counties regions

30
implementing those development policies. Formally, the funding still goes through the system of regional
contracts, but now the negotiations over the contracts are trilateral – with participation of regions, central
government and the European Commission – and the bulk of financial resources comes from the EU budget
which is planned for 7-years perspective (in the case of Poland 2004-2006, 2007-2013 and 2014-2020).
As shown in Figure 11, the amount of EU funds for local governments was very small in the pre-accession
period (2000-2004), but has grown significantly in the following years. The direct share of regions in EU
structural funds’ absorption is rather small, but this picture would be misleading from the point of view of
the role of regions in the whole process. The majority of EU funds allocated to municipalities and major
cities is dependent on the strategic decisions adopted by the regional government, and the funds are
distributed through the Regional Operating Programme, which is prepared and managed by the region.
Figure 11. EU funds in sub-national government spending (million of PLN)
Source: Author based on information from the Ministry of Finance and Ministry of Regional Development
Figure 12 illustrates the role of EU funding (mostly of Regional Operating Programmes) in financing
investments of subnational governments in Poland. EU grants have provided usually about one fifth of the
total funds for investments, but in some years (2011-2015) it has been closer to 30%. The role of EU funding
though not dominant is definitely very important.
Figure 12. EU funds as % of total capital spending of sub-national governments
Source: Author based on information from the Ministry of Finance and Ministry of Regional Development
0
2000
4000
6000
8000
10000
12000
14000
16000
18000
2002 2003 2004 2005 2006 2007 2008 2009 2010 2011 2012 2013 2014 2015 2016 2017 2018
regionscountiescities of county statusmunicipalities
4.6
12.0
18.2
14.5
9.7
13.9
24.9
29.0 29.2 28.430.6
27.9
6.3
19.1
0
5
10
15
20
25
30
35
2004 2006 2008 2010 2012 2014 2016
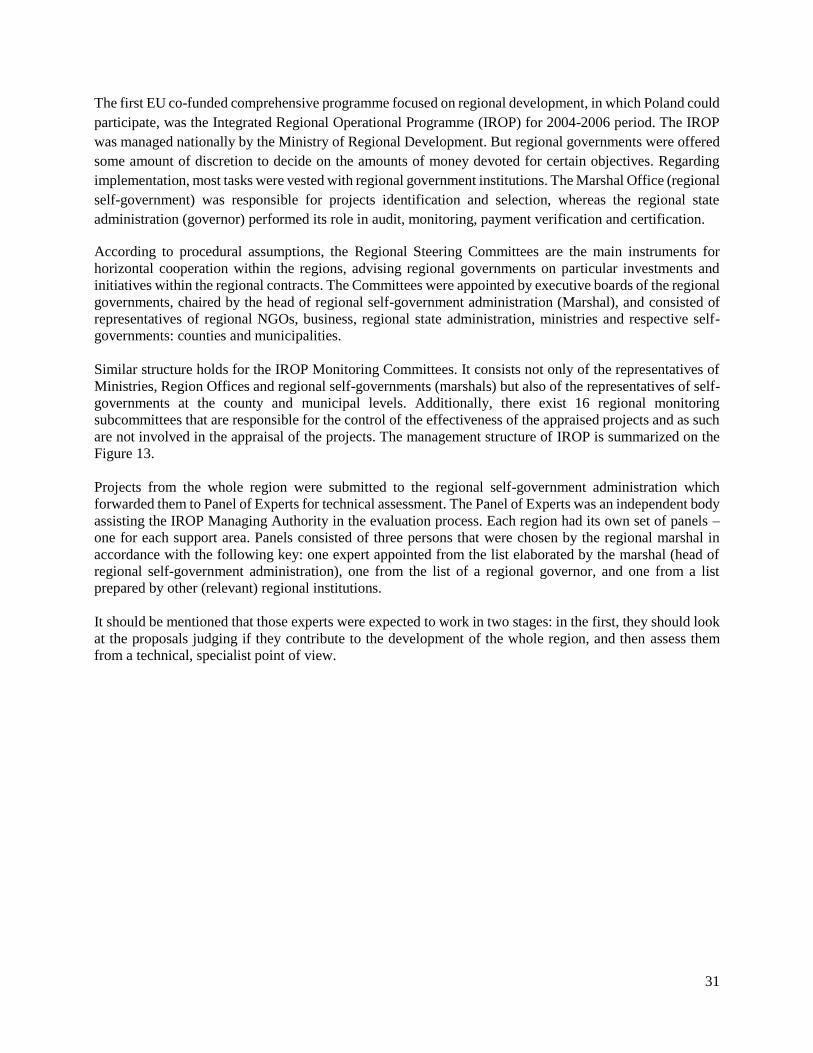
31
The first EU co-funded comprehensive programme focused on regional development, in which Poland could
participate, was the Integrated Regional Operational Programme (IROP) for 2004-2006 period. The IROP
was managed nationally by the Ministry of Regional Development. But regional governments were offered
some amount of discretion to decide on the amounts of money devoted for certain objectives. Regarding
implementation, most tasks were vested with regional government institutions. The Marshal Office (regional
self-government) was responsible for projects identification and selection, whereas the regional state
administration (governor) performed its role in audit, monitoring, payment verification and certification.
According to procedural assumptions, the Regional Steering Committees are the main instruments for
horizontal cooperation within the regions, advising regional governments on particular investments and
initiatives within the regional contracts. The Committees were appointed by executive boards of the regional
governments, chaired by the head of regional self-government administration (Marshal), and consisted of
representatives of regional NGOs, business, regional state administration, ministries and respective self-
governments: counties and municipalities.
Similar structure holds for the IROP Monitoring Committees. It consists not only of the representatives of
Ministries, Region Offices and regional self-governments (marshals) but also of the representatives of self-
governments at the county and municipal levels. Additionally, there exist 16 regional monitoring
subcommittees that are responsible for the control of the effectiveness of the appraised projects and as such
are not involved in the appraisal of the projects. The management structure of IROP is summarized on the
Figure 13.
Projects from the whole region were submitted to the regional self-government administration which
forwarded them to Panel of Experts for technical assessment. The Panel of Experts was an independent body
assisting the IROP Managing Authority in the evaluation process. Each region had its own set of panels –
one for each support area. Panels consisted of three persons that were chosen by the regional marshal in
accordance with the following key: one expert appointed from the list elaborated by the marshal (head of
regional self-government administration), one from the list of a regional governor, and one from a list
prepared by other (relevant) regional institutions.
It should be mentioned that those experts were expected to work in two stages: in the first, they should look
at the proposals judging if they contribute to the development of the whole region, and then assess them
from a technical, specialist point of view.
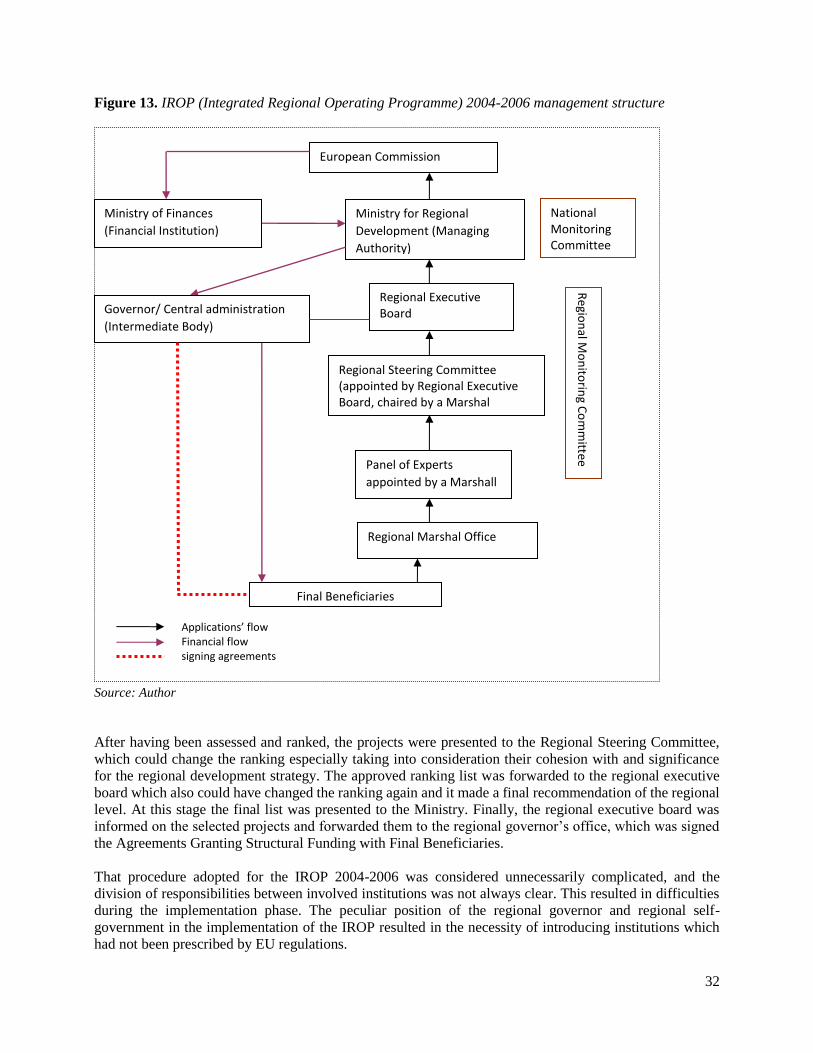
32
Figure 13. IROP (Integrated Regional Operating Programme) 2004-2006 management structure
Source: Author
After having been assessed and ranked, the projects were presented to the Regional Steering Committee,
which could change the ranking especially taking into consideration their cohesion with and significance
for the regional development strategy. The approved ranking list was forwarded to the regional executive
board which also could have changed the ranking again and it made a final recommendation of the regional
level. At this stage the final list was presented to the Ministry. Finally, the regional executive board was
informed on the selected projects and forwarded them to the regional governor’s office, which was signed
the Agreements Granting Structural Funding with Final Beneficiaries.
That procedure adopted for the IROP 2004-2006 was considered unnecessarily complicated, and the
division of responsibilities between involved institutions was not always clear. This resulted in difficulties
during the implementation phase. The peculiar position of the regional governor and regional self-
government in the implementation of the IROP resulted in the necessity of introducing institutions which
had not been prescribed by EU regulations.
Ministry for Regional
Development (Managing
Authority)
Regional Executive Board
National Monitoring Committee
Regional Steering Committee (appointed by Regional Executive Board, chaired by a Marshal
Panel of Experts
appointed by a Marshall
Regio
nal M
on
itorin
g Co
mm
ittee
Regional Marshal Office
Final Beneficiaries
European Commission
Ministry of Finances
(Financial Institution)
Governor/ Central administration
(Intermediate Body)
Applications’ flow Financial flow signing agreements
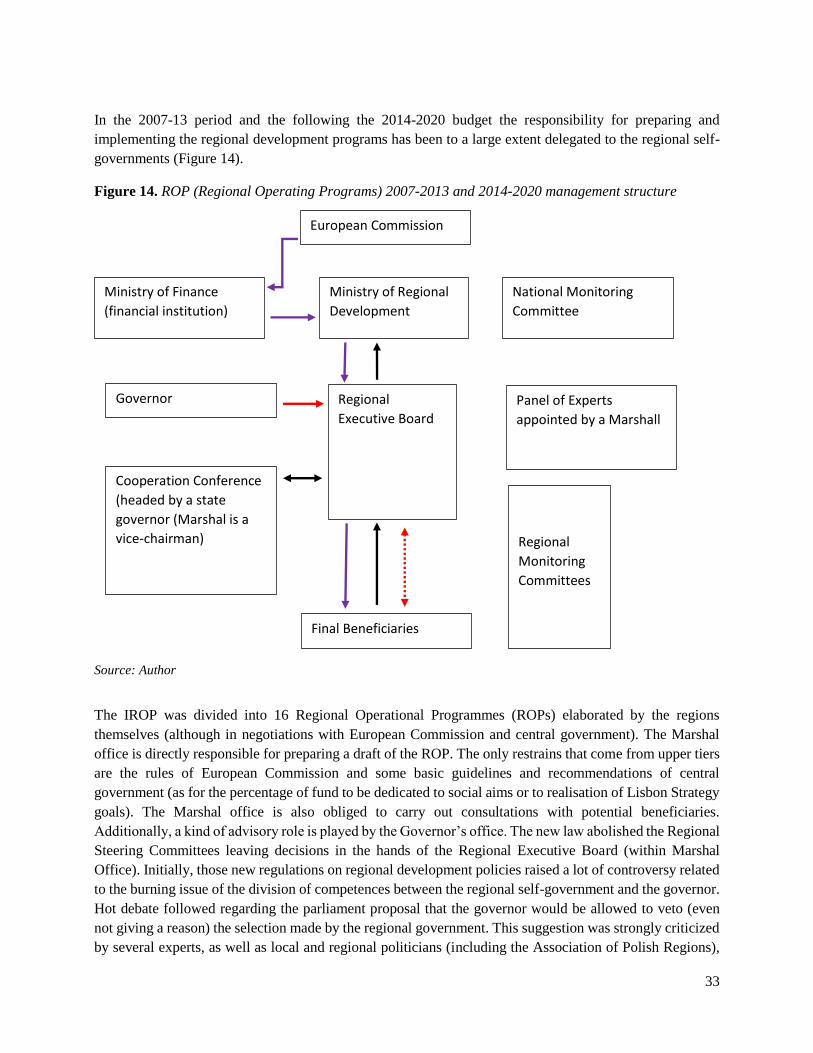
33
In the 2007-13 period and the following the 2014-2020 budget the responsibility for preparing and
implementing the regional development programs has been to a large extent delegated to the regional self-
governments (Figure 14).
Figure 14. ROP (Regional Operating Programs) 2007-2013 and 2014-2020 management structure
Source: Author
The IROP was divided into 16 Regional Operational Programmes (ROPs) elaborated by the regions
themselves (although in negotiations with European Commission and central government). The Marshal
office is directly responsible for preparing a draft of the ROP. The only restrains that come from upper tiers
are the rules of European Commission and some basic guidelines and recommendations of central
government (as for the percentage of fund to be dedicated to social aims or to realisation of Lisbon Strategy
goals). The Marshal office is also obliged to carry out consultations with potential beneficiaries.
Additionally, a kind of advisory role is played by the Governor’s office. The new law abolished the Regional
Steering Committees leaving decisions in the hands of the Regional Executive Board (within Marshal
Office). Initially, those new regulations on regional development policies raised a lot of controversy related
to the burning issue of the division of competences between the regional self-government and the governor.
Hot debate followed regarding the parliament proposal that the governor would be allowed to veto (even
not giving a reason) the selection made by the regional government. This suggestion was strongly criticized
by several experts, as well as local and regional politicians (including the Association of Polish Regions),
European Commission
Ministry of Finance
(financial institution)
Ministry of Regional
Development
National Monitoring
Committee
Governor
Cooperation Conference
(headed by a state
governor (Marshal is a
vice-chairman)
Regional
Executive Board
Panel of Experts
appointed by a Marshall
Final Beneficiaries
Regional
Monitoring
Committees
34
some of them suggesting that it might not comply with the Polish Constitution and/or EU regulations.
Interestingly enough, the “veto clause” was proposed by a group of MPs from the governing coalition, while
the Ministry for Regional Development was against such a regulation. Eventually, after long debates the
veto right for the governor has not been implemented, and regional elected self-governments have gained
considerable discretion in selecting the individual projects to be implemented.
Considering a huge role of EU funding for the regions, it is important to ask the question what the evolution
of regional governments after the EU funding expires would be. It is clear that the level of funding available
in 2014-2020 budget will decrease substantially in 2021-2027 budget, and after 2027 it is even less certain.
In one of the recent reports on decentralization (Hausner 2013) it has been stated that “regions have to re-
invent themselves” thinking about the “post EU structural funds era”. But the reflection on this issue is
relatively scarce. One may speculate that the political role or regions will diminish to the similar which was
played in 1999-2002 period, before the EU funding became significant. Regional governments will deliver
services they are responsible for, but the role in regional development programs – supported just by
relatively minor funding offered by regional contracts signed with central government - will be relatively
marginal.
Lessons learnt and insights for other countries
1. It is generally believed that the decentralization to regional governments devolving more discretion and
powers to elected self-governments has had a positive impact on effective and the efficient
implementation of policies. Poland is the only of EU “New Member States” (countries who joined EU
in 21st century) which decided to give considerable autonomy to regional governments in the preparation
and implementation of their own Regional Operating Programmes. Comparison of disbursement rates
in Poland with another countries suggests that it has helped to achieve higher absorption rate of available
funds. This claim is commonly accepted and repeated in several EU level documents on regional
policies. Also, the evaluation reports of ROPs usually confirm the good management of the
programmes. Finally, in my own research from 2011-2013 most of the researched municipal
beneficiaries of the EU supported projects have indicated that the programme managed at the regional
level have been more “user-friendly” and better tailored to local environment than programmes
managed directly from the centre (Swianiewicz et al. 2013). It is difficult to find hard, quantitative
evidence illustrating gains of regional decentralization. Searching for such evidences is
methodologically very complex. It is easy to illustrate progress in service delivery or in development
projects, but it is hard to prove causal relationship between decentralization and those positive trends.
The indirect evidence might be searched in comparison with other countries in the same part of Europe
which adopted alternative (more centralized) models of managing regional development policies. This
comparison confirms gains of decentralization, but there are so many other factors which should be
controlled in the comparison that methodologically rigid proof of the causal relationship is extremely
difficult.
2. Financial decentralization to the regional level has been to a large limited to expenditure decentralization
Revenue autonomy of regions (in contrast to the municipal level) is minimal – more than 1/3 of regional
budgets is funded by earmarked grants and the rest originated either from the general-purpose block
grant or tax sharing. The high role of conditional grants is still a problematic issue. Of course, there are
reasons for some role of this type of transfers for example for well-defined social programs; however,
the size of those programmes still seems to be too large. Moreover, the rules of funds allocation are
neither sufficiently transparent nor stable. The whole system is fragmented among small programmes
run by various ministries.
35
3. Horizontal equalization through the Robin Hood mechanism has always been politically controversial.
This is experience of other European countries using this kind of mechanisms (Denmark, Sweden,
Norway, Germany, Switzerland, Spain) and it is also confirmed in the Polish case. This political
sensitivity remains even if the amount of funding redistributed in that way is relatively limited (as it is
in Poland). A different design of the regional tax sharing might allow to avoid these political difficulties,
without negative consequences for the disparities in the level of regional governments’ income.
4. The lack of hierarchical subordination between sub-national tiers seems to be an important feature of
the Polish system. The positive consequence of such a solution is a clearer local accountability of elected
subnational governments. In Poland before 1990 there has been a long period of a strict vertical
subordination of lower tiers, and breaking those hierarchical links seemed to be natural after 1990
political turn-over. It has been almost identified with democratization. There are no obvious negative
side-effects of such a design. Regional programmes and mechanisms of investment grants allocation
through ROPs and other programmes secure considerable amount of regional coordination allowing
coherent strategic development planning.
5. Polish regions are not protected by the Constitution. The Constitution adopted in 1997 mentions only
the municipal level, leaving the decision on existence of counties and regions to the will of the
Parliament. The reason of this fact is that the Constitution was adopted before the debates on number
and territorial shape to sub-national tiers had been completed. Anyway, the current legal protection of
regions is relatively weak. This issue may become more important nowadays, since the central
government in power since 2015 has not been supportive of decentralization. On the contrary, most of
the key political actors of the current governing party do not trust subnational governments and have a
tendency towards re-establishing stricter control by the centre. The weak protection of regions makes
them even more vulnerable towards re-centralization tendencies. In the current situation one may
indicate at least a few examples of slow, crawling re-centralization limiting regional government powers
and competencies. One is the taking control over the centre control over Regional Funds and
Environment Protection and Water Management (Wojewódzkie Fundusze Ochrony Środowiska i
Gospodarki Wodnej – WFOŚiGW), which were previously subordinated to regional governments.
Another similar example is related to the Agricultural Advisory Centres (Ośrodki Doradztwa
Rolniczego – ODR). Last but not least, the role of regional governments in managing regional
development programmes in the 2021-2027 European budget has not been clarified yet. The danger of
reducing the regional discretion in this respect and stricter control by the centre is still a possible option.
36
References:
Blöchliger, H., Petzold, O. (2009) „Finding the Dividing Line Between Tax Sharing and Grants: A
Statistical Investigation“, Paris: OECD Network on Fiscal Relations Across Levels of Government.
Boerboom, H., Huigsloot, P. (2010) „Earmeked General Grants and General Earmarked Grants in the
Netherlands” ” [w:] J. Kim, J. Lotz, N.J. Mau (eds.) General Grants versus Earmarked Grants:
Theory and Practice, Albertslund-Seul: The Korea Institute of Public Finance and The Danish
Ministry of Interior and Health, p. 394-414.
Emilewicz, J. & Wołek, A. (2002) Reformers and Politicians: The Power Play for the 1998 Reform of
Public Administration in Poland, as Seen by its Man Players, Elipsa: Warszawa.
Hughes, J., Sasse, G. & Gordon, C. (2003) “EU Enlargement, Europeanisation and the Dynamics of
Regionalisation in the CEECs” [in:] M. Keating, J. Hughes (eds.) The Regional Challenge in
Central and Eastern Europe, PIE-Peter Lang: Bruxelles-Bern-Berlin-Frankfurt-New York-Oxford-
Wien.
Kowalczyk, A. (1993) “Dotychczasowe doświadczenia i obecny stan prac badawczych nad refomrą
podziału Polski na regiony” [in:] G. Gorzelak, B. Jałowiecki (eds.) Czy Polska będzie państwem
regionalnym?, Warsaw University.
Hughes J. Sasse G., Gordon C. (2003) “EU Enlargement, Europeanisation and the Dynamics of
Regionalisation in the CEECs” [in:] M. Keating, J. Hughes (eds.) The Regional Challenge in
Central and Eastern Europe, PIE-Peter Lang: Bruxelles-Bern-Berlin-Frankfurt-New York-
Oxford-Wien
Kulesza M. (2002) “Methods and Techniques of Managing Decentralisation Reforms in CEE Countries:
The Polish Experience” [in:] G. Peteri (ed.) Mastering Decentralisation and Public Administration
Reforms in Central and Eastern Europe, Open Society Institute: Budapest
Mażewski, L. (1992) „Przyszłość województwa” [in:] Samorząd terytorialny w Polsce. Materiały na
seminarium 29-30.09.1992, Warszawa: Senat R.P.
Regulski, J. (2003) Local government reform in Poland: an insider story, Budapest: LGI – Open Society
Institute.
Swianiewicz, P. (1999) The long history of radical change: local government and regional policies in Poland
[In:] M. Tatur (ed.) The challenge of regional policies: actors and institutions of the local and
regional level in post-socialist Europe, Deutsche Gesellschaft fur Technische Zuzammenarbeit,
Eshborn.
Swianiewicz, P., Krukowska, J., Lackowska, M. (2013) Profesjonalizacja absorpcji funduszy: beneficjenci
samorządowi centralnie zarządzanych programów operacyjnych w okresie 2007-2013, Warszawa:
Ministerstwo Rozwoju Regionalnego.
37
Further readings in English:
Emilewicz, J. & Wołek, A. (2002) Reformers and Politicians: The Power Play for the 1998 Reform of
Public Administration in Poland, as Seen by its Man Players, Elipsa: Warszawa.
Kulesza, M. (2002) “Methods and Techniques of Managing Decentralisation Reforms in CEE Countries:
The Polish Experience” [in:] G. Peteri (ed.) Mastering Decentralisation and Public Administration
Reforms in Central and Eastern Europe, Open Society Institute: Budapest.
Levitas, A., 2018, Local government reform as state building: What the Polish case says about
“decentralisation”, Public Governance, No. 3(45)
Regulski, J. (2003) Local government reform in Poland: an insider story, Budapest: LGI – Open Society
Institute.
Swianiewicz, P. (2013) “Poland: Creeping Decentralization of the Unitary State” [in:] J. Loughlin, J.
Kincaid, W. Swenden (eds.) Routledge Handbook of Regionalism and Federalism, Milton Park –
New York: Routledge, p. 331-340.
Swianiewicz, P. (2011) Poland [in:] H. Heinelt, X. Bertrana (eds.) The Second Tier of Local Goverment in
Europe: Provinces, Counties, Departments and Landkreise in Comparison, London: Routledge.
Swianiewicz, P. (2010) Poland: Europeanization of Subnational Governments, [in:] J. Loughlin, F.
Hendriks, A. Lidstrom (eds.) The Oxford Handbook of Local and Regional Democracy in Europe,
Oxford University Press, p. 480-504
Swianiewicz, P. (2006) Local Government Organization and Finance: Poland, [in:] A. Shah (ed.) Local
Governance in Developing Countries, Washington: The World Bank, p. 302-346.
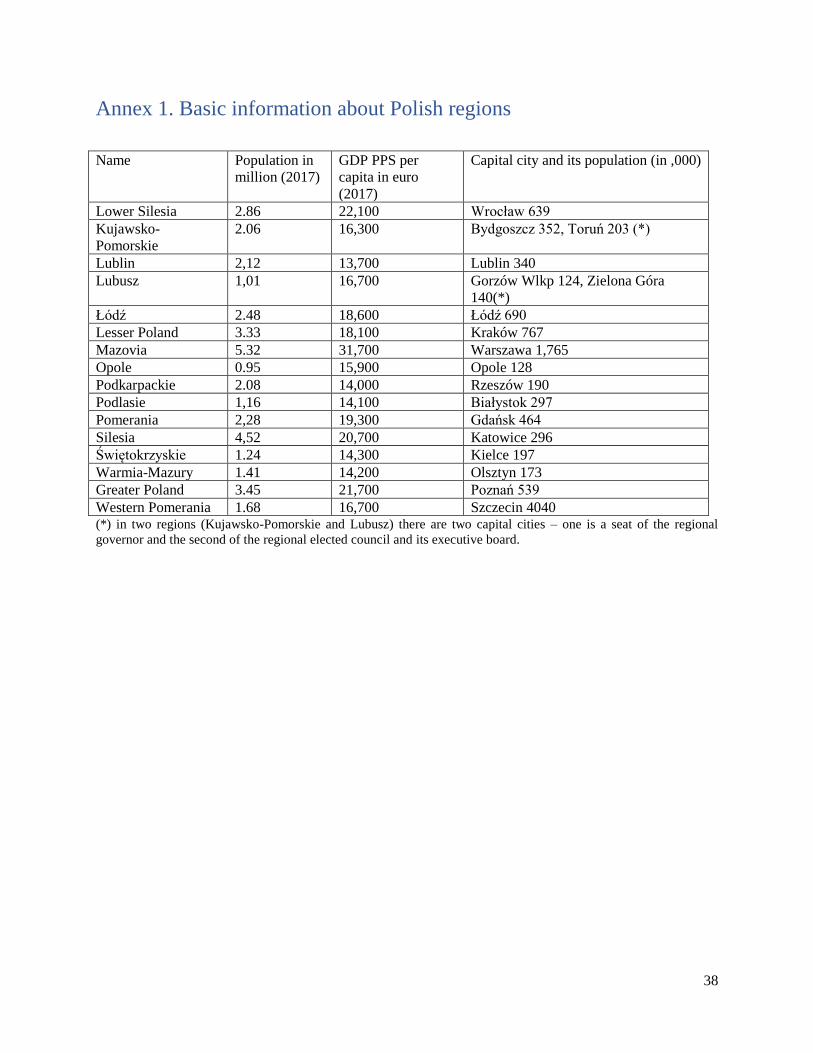
38
Annex 1. Basic information about Polish regions
Name Population in
million (2017)
GDP PPS per
capita in euro
(2017)
Capital city and its population (in ,000)
Lower Silesia 2.86 22,100 Wrocław 639
Kujawsko-
Pomorskie
2.06 16,300 Bydgoszcz 352, Toruń 203 (*)
Lublin 2,12 13,700 Lublin 340
Lubusz 1,01 16,700 Gorzów Wlkp 124, Zielona Góra
140(*)
Łódź 2.48 18,600 Łódź 690
Lesser Poland 3.33 18,100 Kraków 767
Mazovia 5.32 31,700 Warszawa 1,765
Opole 0.95 15,900 Opole 128
Podkarpackie 2.08 14,000 Rzeszów 190
Podlasie 1,16 14,100 Białystok 297
Pomerania 2,28 19,300 Gdańsk 464
Silesia 4,52 20,700 Katowice 296
Świętokrzyskie 1.24 14,300 Kielce 197
Warmia-Mazury 1.41 14,200 Olsztyn 173
Greater Poland 3.45 21,700 Poznań 539
Western Pomerania 1.68 16,700 Szczecin 4040 (*) in two regions (Kujawsko-Pomorskie and Lubusz) there are two capital cities – one is a seat of the regional
governor and the second of the regional elected council and its executive board.
1
Fiscal decentralization of regional
governments – the case of Spain
prepared under the World Bank TA RAS for Chile1
1 The note was written by Santiago Lago-Peñas, GEN – Universidad de Vigo (España), http://slagop.webs.uvigo.es/..
Contents
1. Introducción y Contexto ....................................................................................................................... 3
2. Estado Actual del Modelo de Descentralización .................................................................................. 3
3. Cambios Relevantes en el Modelo de Descentralización: el Iter del Proceso ...................................... 5
4. Asignación de Responsabilidades de Gasto .......................................................................................... 7
5. Las Fuentes de Ingreso .......................................................................................................................... 8
6. Endeudamiento Regional y Estabilidad Fiscal .................................................................................... 15
7. El Proceso Presupuestario ................................................................................................................... 19
8. Auditoría, Control y Rendición de Cuentas ........................................................................................ 19
9. El Impacto de la Descentralización: Evidencia Empírica ................................................................... 21
10. Lecciones del Caso Español .............................................................................................................. 22
Anexo I: La Economía de las Regiones .................................................................................................. 24
Anexo II: Evolución de las Cuentas Regionales ..................................................................................... 29
Anexo III: Índice General de Transparencia ........................................................................................... 32
Anexo IV: Información Administrativa .................................................................................................. 33
REFERENCIAS ...................................................................................................................................... 34
1. Introducción y Contexto
1. Tras un largo período de casi cuatro décadas de dictadura, la Constitución aprobada en el año 1978
define un nuevo marco democrático, en el que la descentralización política y financiera y la creación de un
nuevo escalón regional de gobierno en España ocupa un lugar relevante. La redacción concreta del texto
constitucional posibilitaba evoluciones distintas, tanto en lo que atañe al número de regiones, como a sus
fronteras y competencias. Esta indeterminación ayudó, sin duda, a un respaldo muy mayoritario de los
ciudadanos a la nueva Constitución, porque pocos agentes de la época podían siquiera imaginar la
intensidad y profundidad del proceso; empezando por los defensores de la tradición centralista.
2. En la actualidad, existen tres niveles de gobierno en España, al margen del escalón supranacional
europeo. La Administración central, que incluye la Seguridad Social; 17 regiones, llamadas oficialmente
Comunidades Autónomas (CCAA)2, y 2 pequeñas Ciudades Autónomas situadas en el Norte de África;3 y
las Corporaciones Locales, que incluyen 8131 municipios y 39 Diputaciones Provinciales. Las
Diputaciones proceden de la anterior estructura administrativa (similar al modelo francés, importado en la
primera mitad el Siglo XIX) y han desaparecido en las Comunidades Autónomas uniprovinciales, que han
absorbido sus competencias y financiación. Su función principal es el apoyo a los municipios más pequeños.
Existe democracia directa en el caso de las CCAA y los municipios. En contraste, los gobiernos de las
Diputaciones se escogen indirectamente a partir de los resultados de las elecciones municipales. Antes de
1978 existían regiones, pero sin relevancia administrativa ni política. Ese mapa regional sirvió de base para
la demarcación territorial de algunas Comunidades Autónomas, pero no todas, que nacieron realmente con
el proceso descentralizador.
2. Estado Actual del Modelo de Descentralización
3. A pesar de no ser formalmente un país federal y de que hace 40 años era un país fuertemente
centralizado, el grado de descentralización a escala regional en España es hoy de los más elevados del
Mundo, de acuerdo con los indicadores cuantitativos más habituales.4 Comenzamos con el RAI (“Regional
Authority Index” o “Índice de autoridad regional” en español), un índice relativamente reciente, pero de
uso muy extendido por dos motivos fundamentales. Primero, por la amplitud temporal e internacional de la
base. Segundo, porque abarca los aspectos económicos y fiscales, pero también institucionales y políticos,
de forma que ofrece una pintura general de la descentralización en cada país. Los resultados para España
son extraordinarios. De aparecer entre los Estados más centralizados y a enorme distancia de las naciones
federales, se pasa al segundo puesto mundial en el arranque de este siglo. Solo Alemania ha estado por
delante en el conjunto del período. Federaciones como Bélgica, Estados Unidos, Canadá o Australia estarían
hoy por detrás de España según el índice (Gráfico 1).
2 Andalucía, Aragón, Asturias, Cantabria, Castilla La-Mancha, Castilla y León, Cataluña, Comunidad Valenciana, Canarias,
Extremadura, Galicia, Islas Baleares, La Rioja, Comunidad de Madrid, Murcia, Navarra y País Vasco. 3 Ceuta y Melilla, ambas con una población por debajo de los 100.000 habitantes. 4 En la panorámica elaborada por Martínez-Vázquez et al (2017) se aborda la cuestión de la medición del grado de descentralización.
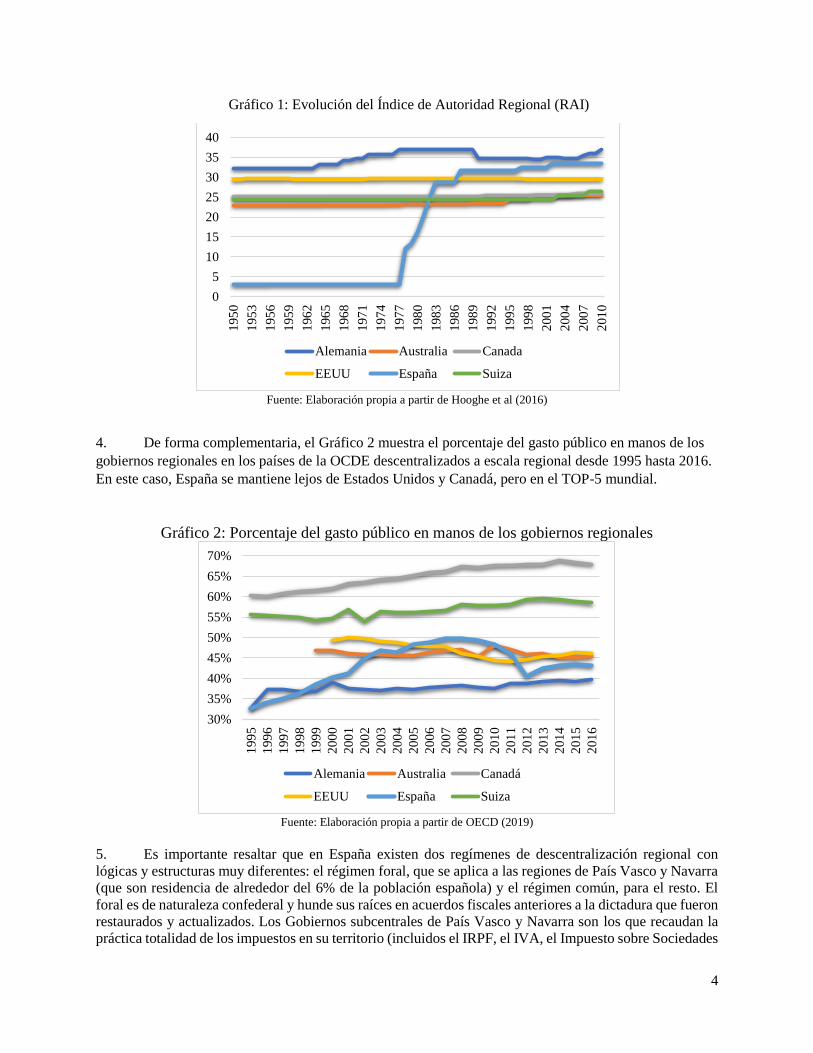
4
Gráfico 1: Evolución del Índice de Autoridad Regional (RAI)
Fuente: Elaboración propia a partir de Hooghe et al (2016)
4. De forma complementaria, el Gráfico 2 muestra el porcentaje del gasto público en manos de los
gobiernos regionales en los países de la OCDE descentralizados a escala regional desde 1995 hasta 2016.
En este caso, España se mantiene lejos de Estados Unidos y Canadá, pero en el TOP-5 mundial.
Gráfico 2: Porcentaje del gasto público en manos de los gobiernos regionales
Fuente: Elaboración propia a partir de OECD (2019)
5. Es importante resaltar que en España existen dos regímenes de descentralización regional con
lógicas y estructuras muy diferentes: el régimen foral, que se aplica a las regiones de País Vasco y Navarra
(que son residencia de alrededor del 6% de la población española) y el régimen común, para el resto. El
foral es de naturaleza confederal y hunde sus raíces en acuerdos fiscales anteriores a la dictadura que fueron
restaurados y actualizados. Los Gobiernos subcentrales de País Vasco y Navarra son los que recaudan la
práctica totalidad de los impuestos en su territorio (incluidos el IRPF, el IVA, el Impuesto sobre Sociedades
0
5
10
15
20
25
30
35
40
195
0
195
3
195
6
195
9
196
2
196
5
196
8
197
1
197
4
197
7
198
0
198
3
198
6
198
9
199
2
199
5
199
8
200
1
200
4
200
7
201
0
Alemania Australia Canada
EEUU España Suiza
30%
35%
40%
45%
50%
55%
60%
65%
70%
199
5
199
6
199
7
199
8
199
9
200
0
200
1
200
2
200
3
200
4
200
5
200
6
200
7
200
8
200
9
201
0
201
1
201
2
201
3
201
4
201
5
201
6
Alemania Australia Canadá
EEUU España Suiza
5
y los impuestos sobre consumos específicos) y transfieren al Gobierno central una cuantía anual por los
servicios no descentralizados. Es un caso atípico en el Mundo. El régimen común sí es de tipo federal. En
este caso, las Comunidades Autónomas recaudan una parte de sus ingresos y reciben transferencias de
diferente tipo para complementar sus ingresos.
6. Esta dualidad de sistemas ha sido una fuente de distorsión permanente. Fundamentalmente, porque
la cuantía anual a transferir desde las Comunidades forales es muy reducida5 y su PIB per cápita se sitúa
entre los más altos de España. Como resultado de lo anterior, con unos tipos impositivos algo inferiores a
la media, los gobiernos de las regiones forales cuentan con muchos más recursos que los demás, al no
contribuir a la financiación de la nivelación interterritorial como le correspondería dada su elevada
capacidad fiscal. Y eso acaba generando sentimientos de agravio comparativo en las regiones con un PIB
per cápita elevado, pero sujetas al régimen común (en particular, Cataluña). En este documento la atención
se centra en el caso de las regiones sujetas al régimen común, por ser el de mayor interés potencial para una
estrategia descentralizadora en Chile.
7. La descentralización del gasto en España ha ido acompañada, desde el primer momento, por una
especial atención y cuidado de que la descentralización no generase diferencias entre las regiones (de
régimen común) en su capacidad financiera para prestar servicios públicos. Además, tradicionalmente, se
ha incidido en la existencia de diferencias significativas en el coste per cápita de la prestación de los
servicios autonómicos.
8. Como consecuencia de lo anterior, la nivelación interregional es muy intensa y persigue la
nivelación plena de las necesidades de gasto (“expenditure needs”) y no solo de las capacidades fiscales.
En ambos sentidos (nivelación plena y preocupación por las necesidades de gasto), España se parece a
Australia. Pero a diferencia de Australia, no existe un organismo independiente que estime las disparidades
en los costes de prestación de servicios. La negociación política sobre las variables a tener en cuenta y sus
ponderaciones sigue pesando mucho; si bien es cierto que se ha ido mejorando con el tiempo sobre el
fundamento técnico de las cifras.
9. La descentralización tributaria ha ido siempre por detrás de la del gasto. Aunque se han producido
avances notables, como examinaremos posteriormente, existe un margen sustancial de mejora.
10. La política regional es muy intensa, por la confluencia de las medidas e instrumentos del Gobierno
central y los de la Unión Europea (UE). España ingresa en la Comunidad Económica Europea en 1986 y es
a finales de los años ochenta cuando se refuerza este vector de la política comunitaria. Durante muchos
años, hasta la ampliación a países del Este europeo, España era el país que recibía más fondos de la Unión
Europea para la implementación de una política regional ambiciosa.
3. Cambios Relevantes en el Modelo de Descentralización: el Iter del Proceso
11. En noviembre de 1975 fallece el dictador Francisco Franco y arranca la transición a la democracia.
En 1978 se aprueba la nueva Constitución española y se abre el proceso de creación de las Comunidades
Autónomas, que había arrancado con el establecimiento de algunas pre-autonomías ya en 1977.
12. En 1980 se promulga la Ley Orgánica de Financiación de las Comunidades Autónomas (LOFCA),
que dibuja de forma muy general su marco financiero. Con varias reformas parciales, sigue vigente. En
5 Los cálculos de Zabalza y López-Laborda (2017) sitúan alrededor del 30% esa sobrefinanciación. No existen fundamentos
económicos para ello, tan solo políticos.
6
paralelo y hasta 1983, se van aprobando los Estatutos de autonomía regionales, una suerte de Constituciones
o Cartas regionales definidas y votadas por su poder legislativo y que, posteriormente, deben ser refrendadas
por el poder legislativo nacional. El nuevo mapa autonómico aparece formado por 17 Comunidades
Autónomas, cuyas fronteras solo en parte coinciden con las anteriores regiones geográficas definidas en el
siglo XIX, y dos ciudades autónomas en el Norte de África (Ceuta y Melilla). El proceso de traspaso de
competencias de gasto gana fuerza en todas las Comunidades Autónomas.
13. En 1984 se regula el funcionamiento del llamado Fondo de Compensación interterritorial (FCI), un
programa de transferencias condicionadas para financiar tanto el desarrollo de las regiones más pobres
como inversiones en las competencias descentralizadas en las más ricas.
14. Desde 1978 hasta 1986, la prioridad era dotar de recursos suficientes (transferencias
incondicionadas y recaudación de algunos tributos sin otorgar capacidad normativa) a las Comunidades
Autónomas para la financiación del coste efectivo de los servicios que se iban descentralizando a ritmos
distintos en cada Comunidad Autónoma, negociando bilateralmente con la administración central. La
autonomía fiscal de las CCAA es en esos años prácticamente nula. A finales de 1986 se aprueba el primer
sistema de financiación quinquenal (1987-1991) que sigue sin proporcionar autonomía fiscal significativa.
Se empieza a hablar de las necesidades de gasto para la prestación de servicios como criterio de reparto de
los recursos. En paralelo, se traspasan nuevas competencias a algunas regiones, incluyendo sanidad y
educación.
15. En 1991 se actualiza el modelo anterior para el quinquenio 1992-1996. Lo más sustancial de este
acuerdo tiene que ver con el endeudamiento autonómico, a fin de cumplir los compromisos con la Unión
Europea en materia de estabilidad fiscal en el camino hacia la creación del Euro. Se reforma el FCI para
convertirlo en un verdadero instrumento de política regional, excluyendo a las CCAA más desarrolladas.
16. En 1993 se modifica parcialmente el sistema 1992-1996 para ceder una parte (15%) del Impuesto
sobre la Renta de las Personas Físicas (IRPF), sin que las regiones cuenten con capacidad normativa para
alterar tipos impositivos o deducciones.
17. En 1997 entra en vigor el sistema de financiación 1997-2001. Marca un claro punto de inflexión en
la descentralización tributaria. Se cede capacidad normativa sobre el tramo de IRPF cuya recaudación fue
cedida en 1993 y en los Impuestos sobre Patrimonio, Sucesiones y Donaciones, Impuesto sobre
Transmisiones Patrimoniales y Actos jurídicos Documentados, y los impuestos sobre el juego, sobre los
que previamente no existía la posibilidad de cambiar tipos impositivos o deducciones fiscales.
18. En enero de 2002 comienza a aplicarse la reforma de la financiación autonómica aprobada en
diciembre de 2001 y finaliza el proceso de traspaso de competencias educativas y sanitarias a todas las
Comunidades Autónomas. Se elimina la referencia a la revisión quinquenal del sistema de financiación y
se pretende que el sistema de financiación sea permanente. Además, se profundiza en las posibilidades
legales para el ejercicio de la autonomía tributaria las CCAA, se incrementa el porcentaje del IRPF hasta
un tercio y se cede como coparticipación de ingresos (revenue sharing) una parte de la recaudación del IVA
y los impuestos sobre consumos específicos.
19. En 2009 se produce una reforma sustancial del sistema de financiación autonómica, para dar pasos
adicionales en la descentralización tributaria de 2002. En concreto, se cede la mitad del IRPF a las CCAA
y se amplía el porcentaje de coparticipación de ingresos en el IVA y los impuestos sobre consumos
específicos.
20. En 2017 se crea una Comisión de expertos pactada por el Gobierno central y las Comunidades
Autónomas de régimen común para acordar una nueva reforma del sistema de financiación autonómica. La
Comisión emiten su informe final en el verano de 2017 (Comisión de expertos, 2018). Desde entonces, los
7
Directores generales regionales competentes en la materia y los técnicos del Ministerio de Hacienda han
estado trabajando sobre el Informe de la Comisión de Expertos, pero se han producido aplazamientos
sucesivos en la fase política final de la negociación debido a la fragmentación electoral en el Congreso de
los diputados español y la inestabilidad electoral del Gobierno central.
4. Asignación de Responsabilidades de Gasto
21. La regulación del reparto de responsabilidades de gasto está recogida en la Constitución Española
de 1978. Así, en su artículo 149 se enumeran las competencias exclusivas del Estado o Gobierno central;
en el 148 aparece el listado de competencias que las Comunidades Autónomas pueden asumir si así aparece
recogido en su Estatuto de autonomía; y en el 150 se abre la posibilidad de la delegación de competencias
estatales incluidas en el artículo 150, a través de una ley orgánica que debe aprobarse en las Cortes
españolas. En la práctica, lo anterior se traduce en la existencia de una triple casuística:
• Competencias legislativas y ejecutivas exclusivas. Es el caso de servicios sociales, agricultura y
ganadería, pesca interior, industria, comercio, desarrollo económico, turismo, juventud o deportes.
• Competencias para el desarrollo de la legislación básica del Estado, así como para la ejecución de
esta legislación. Es el caso de medio ambiente, política económica, protección de los consumidores,
educación, asistencia sanitaria o salud pública.
• Competencias para la ejecución de la legislación aprobada en exclusiva por el Estado. Este es el
caso de las políticas de empleo.
22. Para el despliegue de todas estas competencias, existen diferentes organismos e instrumentos para
la cooperación horizontal (entre Comunidades Autónomas) y vertical (con la Administración central):
• La Conferencia de Presidentes, de la que forman parte el Presidente del Gobierno y los
Presidentes de las CCAA.
• El Consejo de Política Fiscal y Financiera de las Comunidades Autónomas (CPFF), como
órgano de coordinación del Estado y las CCAA en materia fiscal y financiera.
• Las Conferencias Sectoriales sobre materias concretas, en las que participan el Estado y todas
las CCAA.
• Las Comisiones Bilaterales de Cooperación, entre el Estado y una determinada Comunidad
Autónoma
• Las Comisiones Sectoriales, Grupos de Trabajo y Ponencias de composición técnica y
adscritos en gran medida a las conferencias Sectoriales.
No obstante, existe un amplio consenso en que, en la práctica, este marco institucional es insuficiente y no
funciona con la eficacia necesaria. A pesar de sus deficiencias de recursos y competenciales (Comisión de
expertos, 2018), el CPFF es el instrumento más dinámico, eficaz y relevante para la gobernanza multinivel.
23. Consecuentemente, las regiones son hoy el principal prestador de servicios públicos para los
ciudadanos. En cambio, el grueso de las transferencias monetarias (pensiones, seguro por desempleo)
siguen en manos estatales. El Gráfico 3 muestra el gasto público como porcentaje de PIB en España y su
distribución por escalones de gobierno.
24. Ese protagonismo en la prestación directa de servicios hace que las regiones dominen claramente
la distribución del empleo público (Gráfico 4). El 58% depende de los Gobiernos regionales y solo uno de
cada cinco empleados sigue dependiendo de la Administración central. La Administración central se ha
especializado en la gestión de los principales programas de transferencias monetarias (pensiones, seguro
por desempleo), los bienes públicos clásicos (defensa nacional, orden público, relaciones exteriores…) y la
inversión en las grandes infraestructuras de transporte.
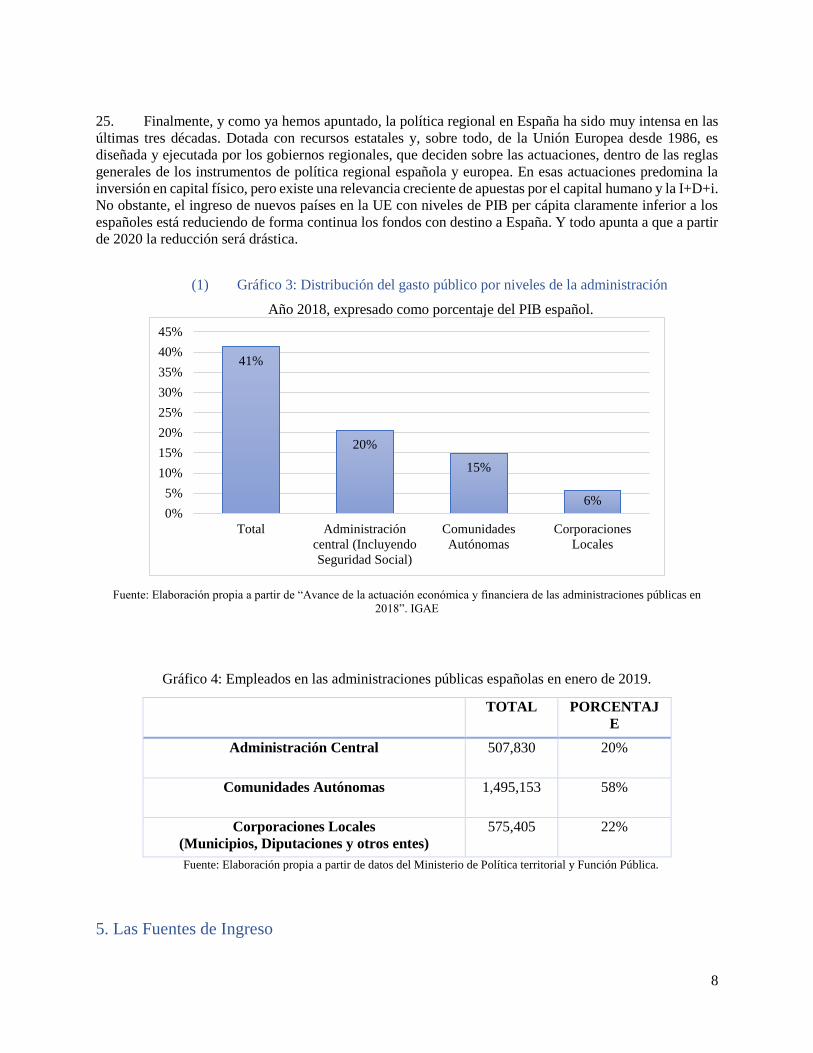
8
25. Finalmente, y como ya hemos apuntado, la política regional en España ha sido muy intensa en las
últimas tres décadas. Dotada con recursos estatales y, sobre todo, de la Unión Europea desde 1986, es
diseñada y ejecutada por los gobiernos regionales, que deciden sobre las actuaciones, dentro de las reglas
generales de los instrumentos de política regional española y europea. En esas actuaciones predomina la
inversión en capital físico, pero existe una relevancia creciente de apuestas por el capital humano y la I+D+i.
No obstante, el ingreso de nuevos países en la UE con niveles de PIB per cápita claramente inferior a los
españoles está reduciendo de forma continua los fondos con destino a España. Y todo apunta a que a partir
de 2020 la reducción será drástica.
(1) Gráfico 3: Distribución del gasto público por niveles de la administración
Año 2018, expresado como porcentaje del PIB español.
Fuente: Elaboración propia a partir de “Avance de la actuación económica y financiera de las administraciones públicas en
2018”. IGAE
Gráfico 4: Empleados en las administraciones públicas españolas en enero de 2019.
TOTAL PORCENTAJ
E
Administración Central 507,830 20%
Comunidades Autónomas 1,495,153 58%
Corporaciones Locales
(Municipios, Diputaciones y otros entes)
575,405 22%
Fuente: Elaboración propia a partir de datos del Ministerio de Política territorial y Función Pública.
5. Las Fuentes de Ingreso
41%
20%
15%
6%0%
5%
10%
15%
20%
25%
30%
35%
40%
45%
Total Administración
central (Incluyendo
Seguridad Social)
Comunidades
Autónomas
Corporaciones
Locales
9
26. Las fuentes de ingresos de las regiones incluyen:
a. Tributos propios. Desde el principio del proceso descentralizador, las CCAA cuentan con
la posibilidad de crear impuestos propios, sin necesidad de autorización del gobierno
central.6 Sin embargo, no pueden gravar hechos imponibles previamente gravados por el
Estado o los municipios, a fin de evitar un problema de doble imposición. Eso ha hecho
que haya habido numerosos conflictos entre el Gobierno central y los autonómicos sobre
figuras de nueva creación, generando inseguridad jurídica en los contribuyentes, y que esta
vía de ingresos sea de relevancia marginal en términos recaudatorios (menos del 2% de
todos los ingresos regionales). Los tributos propios se concentran en el campo de la
imposición medioambiental; sobre residuos y contaminación ambiental de todo tipo.
b. Tributos cedidos por la administración central. Esta cesión se produce en porcentajes
diversos (existen impuestos compartidos) y con diferentes grados de autonomía normativa.
c. Transferencias incondicionadas de nivelación horizontal y vertical de la administración
central.
d. Transferencias condicionadas de la administración central y la Unión Europea,
destacando la financiación de la política regional.
e. Deuda pública.
27. En lo que atañe a los tributos cedidos, en algunos casos existe transferencia de recaudación o
coparticipación de ingresos sin capacidad normativa. El más importante es el Impuesto sobre el Valor
Añadido (IVA) y los impuestos especiales sobre consumos (hidrocarburos, tabaco y alcohol). Las
Comunidades reciben el 50% de la recaudación (el 58% en el caso de los especiales), pero no pueden
modificar los parámetros del impuesto. La normativa europea prohíbe la existencia de tipos diferenciados
entre las regiones de un mismo país. Sería, por tanto, una fórmula de “tax sharing”. También hay impuestos
donde las CCAA tiene capacidad para alterar tipos impositivos o deducciones, se quedan con la
recaudación, pero la gestión y recaudación es realizada por la Agencia Tributaria estatal (como el propio
IRPF). En la Tabla 1 se sintetiza toda la información sobre descentralización de los tributos cedidos.
6 La Constitución Española establece este poder tributario regional y la Ley Orgánica de Financiación de las Comunidades
Autónomas regula su ejercicio en su artículo 6, el cual establece que:
“Uno. Las Comunidades Autónomas podrán establecer y exigir sus propios tributos de acuerdo con la Constitución y las Leyes.
Dos. Los tributos que establezcan las Comunidades Autónomas no podrán recaer sobre hechos imponibles gravados por el Estado.
Cuando el Estado, en el ejercicio de su potestad tributaria originaria establezca tributos sobre hechos imponibles gravados por las
Comunidades Autónomas, que supongan a éstas una disminución de ingresos, instrumentará las medidas de compensación o
coordinación adecuadas en favor de las mismas.
Tres. Los tributos que establezcan las Comunidades Autónomas no podrán recaer sobre hechos imponibles gravados por los tributos
locales. Las Comunidades Autónomas podrán establecer y gestionar tributos sobre las materias que la legislación de Régimen Local
reserve a las Corporaciones locales […].
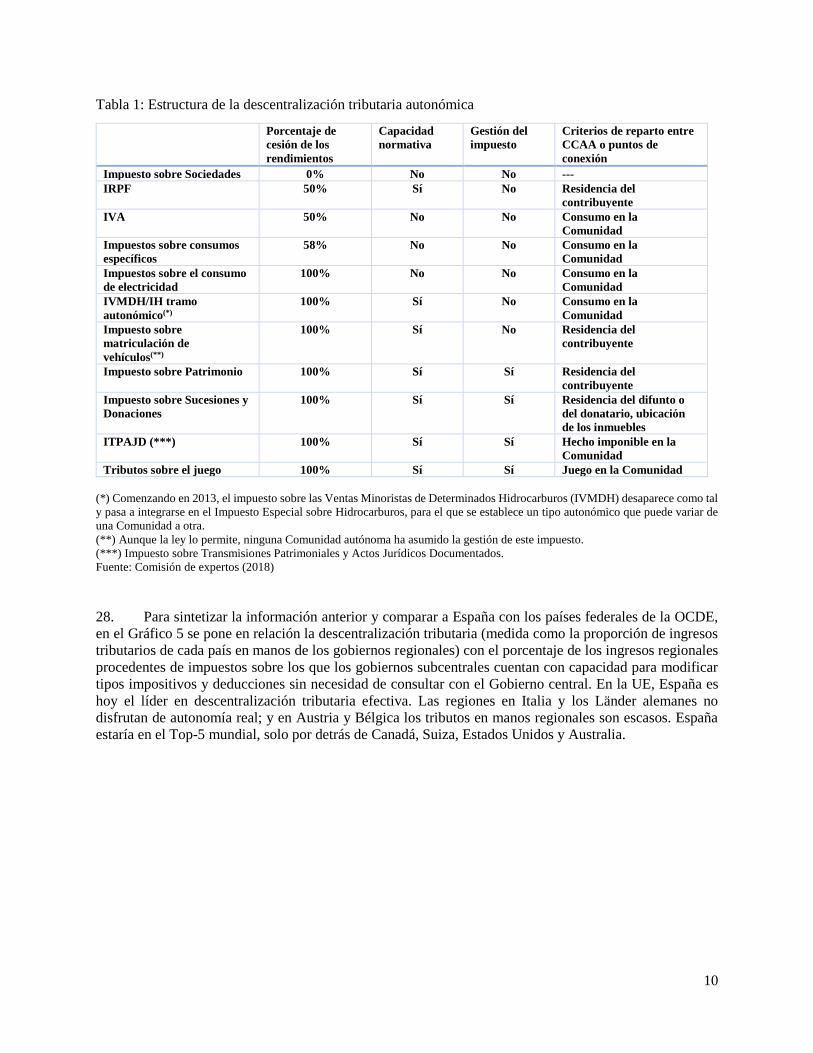
10
Tabla 1: Estructura de la descentralización tributaria autonómica
Porcentaje de
cesión de los
rendimientos
Capacidad
normativa
Gestión del
impuesto
Criterios de reparto entre
CCAA o puntos de
conexión
Impuesto sobre Sociedades 0% No No ---
IRPF 50% Sí No Residencia del
contribuyente
IVA 50% No No Consumo en la
Comunidad
Impuestos sobre consumos
específicos
58% No No Consumo en la
Comunidad
Impuestos sobre el consumo
de electricidad
100% No No Consumo en la
Comunidad
IVMDH/IH tramo
autonómico(*)
100% Sí No Consumo en la
Comunidad
Impuesto sobre
matriculación de
vehículos(**)
100% Sí No Residencia del
contribuyente
Impuesto sobre Patrimonio 100% Sí Sí Residencia del
contribuyente
Impuesto sobre Sucesiones y
Donaciones
100% Sí Sí Residencia del difunto o
del donatario, ubicación
de los inmuebles
ITPAJD (***) 100% Sí Sí Hecho imponible en la
Comunidad
Tributos sobre el juego 100% Sí Sí Juego en la Comunidad
(*) Comenzando en 2013, el impuesto sobre las Ventas Minoristas de Determinados Hidrocarburos (IVMDH) desaparece como tal
y pasa a integrarse en el Impuesto Especial sobre Hidrocarburos, para el que se establece un tipo autonómico que puede variar de
una Comunidad a otra.
(**) Aunque la ley lo permite, ninguna Comunidad autónoma ha asumido la gestión de este impuesto.
(***) Impuesto sobre Transmisiones Patrimoniales y Actos Jurídicos Documentados.
Fuente: Comisión de expertos (2018)
28. Para sintetizar la información anterior y comparar a España con los países federales de la OCDE,
en el Gráfico 5 se pone en relación la descentralización tributaria (medida como la proporción de ingresos
tributarios de cada país en manos de los gobiernos regionales) con el porcentaje de los ingresos regionales
procedentes de impuestos sobre los que los gobiernos subcentrales cuentan con capacidad para modificar
tipos impositivos y deducciones sin necesidad de consultar con el Gobierno central. En la UE, España es
hoy el líder en descentralización tributaria efectiva. Las regiones en Italia y los Länder alemanes no
disfrutan de autonomía real; y en Austria y Bélgica los tributos en manos regionales son escasos. España
estaría en el Top-5 mundial, solo por detrás de Canadá, Suiza, Estados Unidos y Australia.
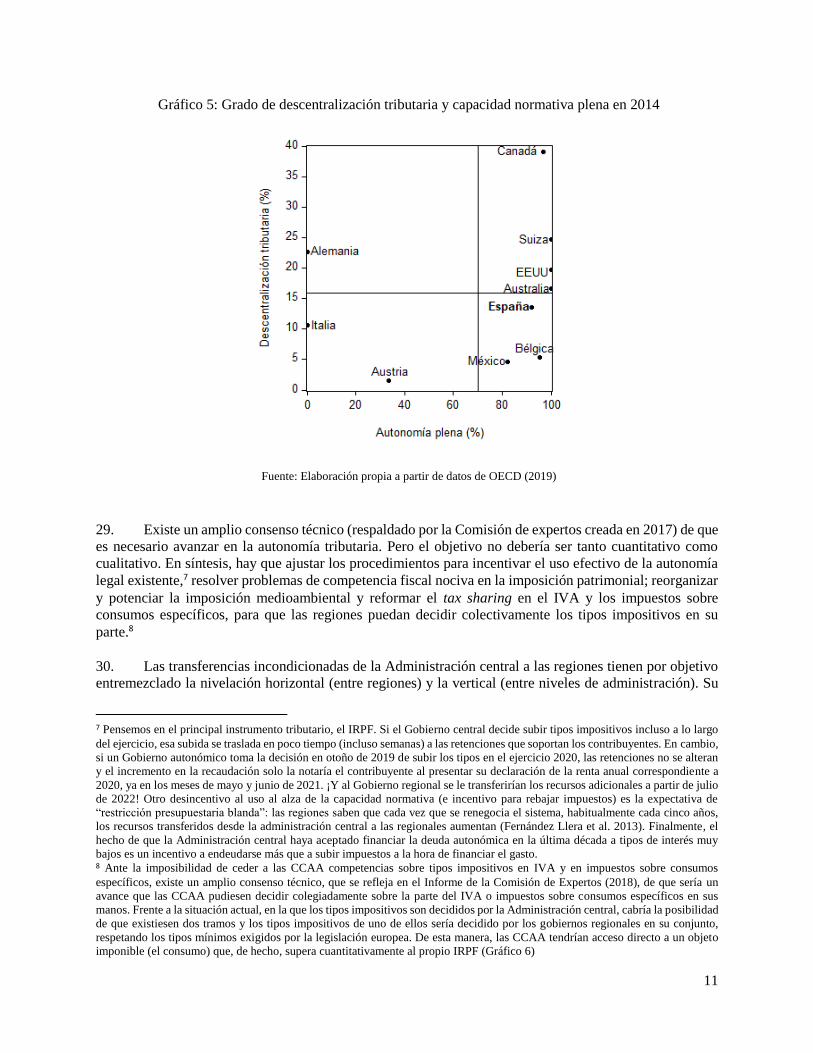
11
Gráfico 5: Grado de descentralización tributaria y capacidad normativa plena en 2014
Fuente: Elaboración propia a partir de datos de OECD (2019)
29. Existe un amplio consenso técnico (respaldado por la Comisión de expertos creada en 2017) de que
es necesario avanzar en la autonomía tributaria. Pero el objetivo no debería ser tanto cuantitativo como
cualitativo. En síntesis, hay que ajustar los procedimientos para incentivar el uso efectivo de la autonomía
legal existente,7 resolver problemas de competencia fiscal nociva en la imposición patrimonial; reorganizar
y potenciar la imposición medioambiental y reformar el tax sharing en el IVA y los impuestos sobre
consumos específicos, para que las regiones puedan decidir colectivamente los tipos impositivos en su
parte.8
30. Las transferencias incondicionadas de la Administración central a las regiones tienen por objetivo
entremezclado la nivelación horizontal (entre regiones) y la vertical (entre niveles de administración). Su
7 Pensemos en el principal instrumento tributario, el IRPF. Si el Gobierno central decide subir tipos impositivos incluso a lo largo
del ejercicio, esa subida se traslada en poco tiempo (incluso semanas) a las retenciones que soportan los contribuyentes. En cambio,
si un Gobierno autonómico toma la decisión en otoño de 2019 de subir los tipos en el ejercicio 2020, las retenciones no se alteran
y el incremento en la recaudación solo la notaría el contribuyente al presentar su declaración de la renta anual correspondiente a
2020, ya en los meses de mayo y junio de 2021. ¡Y al Gobierno regional se le transferirían los recursos adicionales a partir de julio
de 2022! Otro desincentivo al uso al alza de la capacidad normativa (e incentivo para rebajar impuestos) es la expectativa de
“restricción presupuestaria blanda”: las regiones saben que cada vez que se renegocia el sistema, habitualmente cada cinco años,
los recursos transferidos desde la administración central a las regionales aumentan (Fernández Llera et al. 2013). Finalmente, el
hecho de que la Administración central haya aceptado financiar la deuda autonómica en la última década a tipos de interés muy
bajos es un incentivo a endeudarse más que a subir impuestos a la hora de financiar el gasto. 8 Ante la imposibilidad de ceder a las CCAA competencias sobre tipos impositivos en IVA y en impuestos sobre consumos
específicos, existe un amplio consenso técnico, que se refleja en el Informe de la Comisión de Expertos (2018), de que sería un
avance que las CCAA pudiesen decidir colegiadamente sobre la parte del IVA o impuestos sobre consumos específicos en sus
manos. Frente a la situación actual, en la que los tipos impositivos son decididos por la Administración central, cabría la posibilidad
de que existiesen dos tramos y los tipos impositivos de uno de ellos sería decidido por los gobiernos regionales en su conjunto,
respetando los tipos mínimos exigidos por la legislación europea. De esta manera, las CCAA tendrían acceso directo a un objeto
imponible (el consumo) que, de hecho, supera cuantitativamente al propio IRPF (Gráfico 6)
12
dinámica se vincula a la de los ingresos generales del Estado; es decir, se define un índice de evolución que
toma como referencia la recaudación de los impuestos estatales.
31. El sistema de nivelación es técnicamente complejo, porque existen varios mecanismos que
persiguen, al mismo tiempo, la corrección de desequilibrios horizontales y desequilibrios verticales.
Además, en la medida en que la referencia son las necesidades de gasto estimadas para cada región y los
porcentajes de cesión tributaria son idénticos, las regiones más ricas “devuelven” una parte de la cesión
tributaria (el exceso sobre sus necesidades estimadas) que nutre el Fondo de Garantía de Servicios Públicos
Fundamentales (FGSF). Por tanto es de hecho, un sistema de tipo “Robin Hood”. Dado que la gestión de
los tributos implicados (IRPF, IVA, impuestos especiales) es responsabilidad de la Administración
tributaria central, los recursos nunca llegan a entrar en las arcas de las regiones contribuyentes netas y esas
transferencias horizontales no son muy visibles. En general, son solo conocidas por los expertos.
32. Para complicarlo aún más, en la práctica se producen desviaciones sustanciales de la distribución
de recursos que resulta de esas necesidades de gasto estimadas. Las condiciones en las que en su momento
se negoció el traspaso de cada competencia en cada región siguen pesando. Cada vez que se reforma el
modelo de financiación, la financiación percibida con el sistema anterior se toma como consolidado
(aplicándose la cláusula del “hold harmless”), y así reforzando el statu quo desde las primeras etapas del
proceso descentralizador.9 Es decir, si los recursos que resultan de la nueva fórmula de reparto (con sus
variables y ponderaciones) difieren significativamente del reparto actual entre regiones se acaban
introduciendo en la negociación política entre la administración central y las regiones ajustes ad hoc y
modulaciones que desactivan parcialmente los efectos de cada reforma.
33. Otro ejemplo de la influencia de la negociación política sobre los resultados financieros finales fue
la introducción del criterio de la nivelación parcial en la reforma de 2009. El texto de la ley recogía la idea
de que solo se nivelarían los llamados servicios públicos fundamentales (sanidad, educación y servicios
sociales, que suponen alrededor del 70% del gasto regional) para así atender a las demandas de Cataluña
en el frente de la nivelación, que pretendía reducir así su contribución al fondo común. Pero en la propia
normativa se introdujeron modificaciones para que de facto se mantuviese la nivelación plena. Hoy la
Comunidad Autónoma de menor PIB per cápita (Extremadura) sigue teniendo unos recursos
presupuestarios por habitante claramente superiores a los de las regiones más ricas de Madrid o Cataluña.
34. También existen transferencias condicionadas procedentes del nivel central para la financiación de
actuaciones de política regional, que son definidas por los gobiernos de las regiones de menor PIB per
cápita, y para financiar servicios o materias sobre las que las Comunidades Autónomas tienen la
competencia de gestión; entre las que destacan cuantitativamente las correspondientes a la formación
laboral continua para desempleados y a la llamada “ley de dependencia”, aprobada en 2006 y que tiene
como objetivo proteger y atender a las personas que, por edad, enfermedad o discapacidad, precisan de
atención y ayuda para la vida diaria.
35. Por último, aparecen las transferencias condicionadas de la Unión Europea para la financiación de
actuaciones de política regional y otras (como la política agraria).10 En la Tabla 2 se sintetizan los
principales programas de transferencias a las regiones.
9 Las negociaciones bilaterales entre cada región y la administración central sobre el coste efectivo de cada competencia que se iba
transfiriendo dieron como resultado financiación por habitante de las competencias (y por agregación, de la financiación total) muy
diferentes, dependiendo de la habilidad de los negociadores en cada momento, de la coyuntura económica en cada momento (y,
por tanto, el margen para la administración central) y del propio mapa de prestación de servicios en cada territorio: si un servicio
centralizado estaba particularmente bien dotado en una región, esa ventaja se trasladaba al ser descentralizado.
Las estimaciones sobre el efecto de las transferencias condicionadas apuntan a que en su mayor parte (alrededor del 90%) aumentan
el gasto en las áreas que se pretende y en torno al 10% se traducen en un menor déficit (Lago-Peñas, 2006).
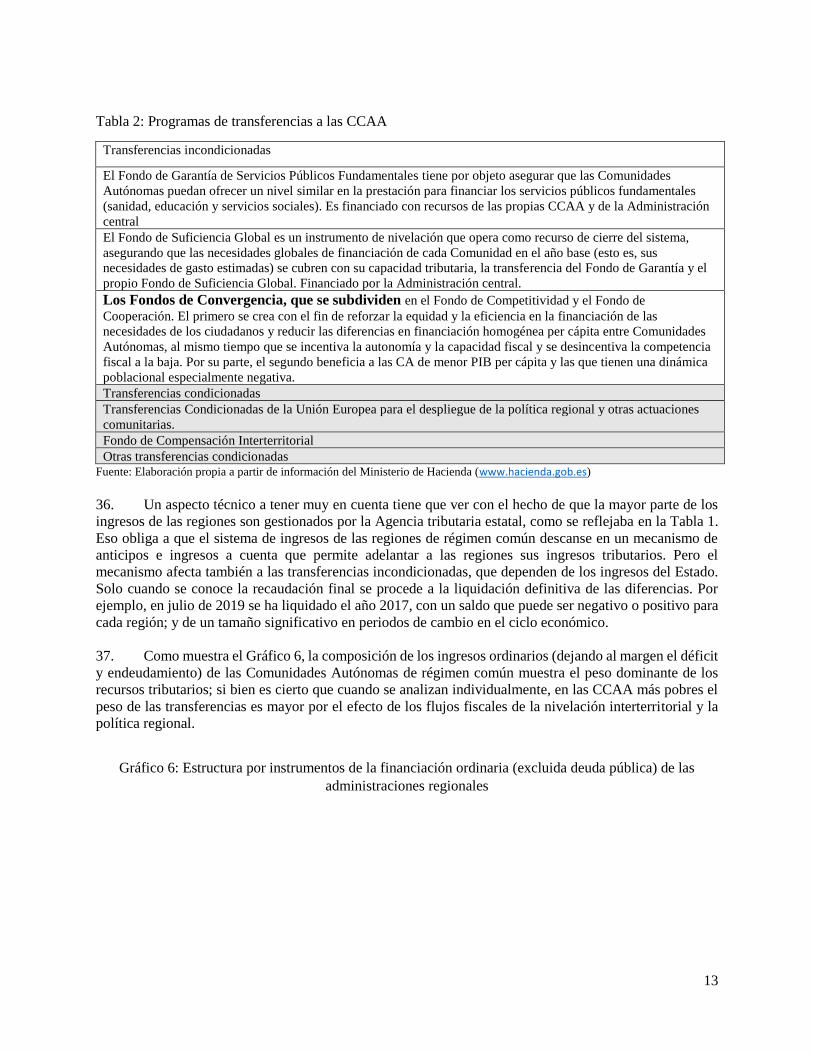
13
Tabla 2: Programas de transferencias a las CCAA
Transferencias incondicionadas
El Fondo de Garantía de Servicios Públicos Fundamentales tiene por objeto asegurar que las Comunidades
Autónomas puedan ofrecer un nivel similar en la prestación para financiar los servicios públicos fundamentales
(sanidad, educación y servicios sociales). Es financiado con recursos de las propias CCAA y de la Administración
central
El Fondo de Suficiencia Global es un instrumento de nivelación que opera como recurso de cierre del sistema,
asegurando que las necesidades globales de financiación de cada Comunidad en el año base (esto es, sus
necesidades de gasto estimadas) se cubren con su capacidad tributaria, la transferencia del Fondo de Garantía y el
propio Fondo de Suficiencia Global. Financiado por la Administración central.
Los Fondos de Convergencia, que se subdividen en el Fondo de Competitividad y el Fondo de
Cooperación. El primero se crea con el fin de reforzar la equidad y la eficiencia en la financiación de las
necesidades de los ciudadanos y reducir las diferencias en financiación homogénea per cápita entre Comunidades
Autónomas, al mismo tiempo que se incentiva la autonomía y la capacidad fiscal y se desincentiva la competencia
fiscal a la baja. Por su parte, el segundo beneficia a las CA de menor PIB per cápita y las que tienen una dinámica
poblacional especialmente negativa.
Transferencias condicionadas
Transferencias Condicionadas de la Unión Europea para el despliegue de la política regional y otras actuaciones
comunitarias.
Fondo de Compensación Interterritorial
Otras transferencias condicionadas Fuente: Elaboración propia a partir de información del Ministerio de Hacienda (www.hacienda.gob.es)
36. Un aspecto técnico a tener muy en cuenta tiene que ver con el hecho de que la mayor parte de los
ingresos de las regiones son gestionados por la Agencia tributaria estatal, como se reflejaba en la Tabla 1.
Eso obliga a que el sistema de ingresos de las regiones de régimen común descanse en un mecanismo de
anticipos e ingresos a cuenta que permite adelantar a las regiones sus ingresos tributarios. Pero el
mecanismo afecta también a las transferencias incondicionadas, que dependen de los ingresos del Estado.
Solo cuando se conoce la recaudación final se procede a la liquidación definitiva de las diferencias. Por
ejemplo, en julio de 2019 se ha liquidado el año 2017, con un saldo que puede ser negativo o positivo para
cada región; y de un tamaño significativo en periodos de cambio en el ciclo económico.
37. Como muestra el Gráfico 6, la composición de los ingresos ordinarios (dejando al margen el déficit
y endeudamiento) de las Comunidades Autónomas de régimen común muestra el peso dominante de los
recursos tributarios; si bien es cierto que cuando se analizan individualmente, en las CCAA más pobres el
peso de las transferencias es mayor por el efecto de los flujos fiscales de la nivelación interterritorial y la
política regional.
Gráfico 6: Estructura por instrumentos de la financiación ordinaria (excluida deuda pública) de las
administraciones regionales
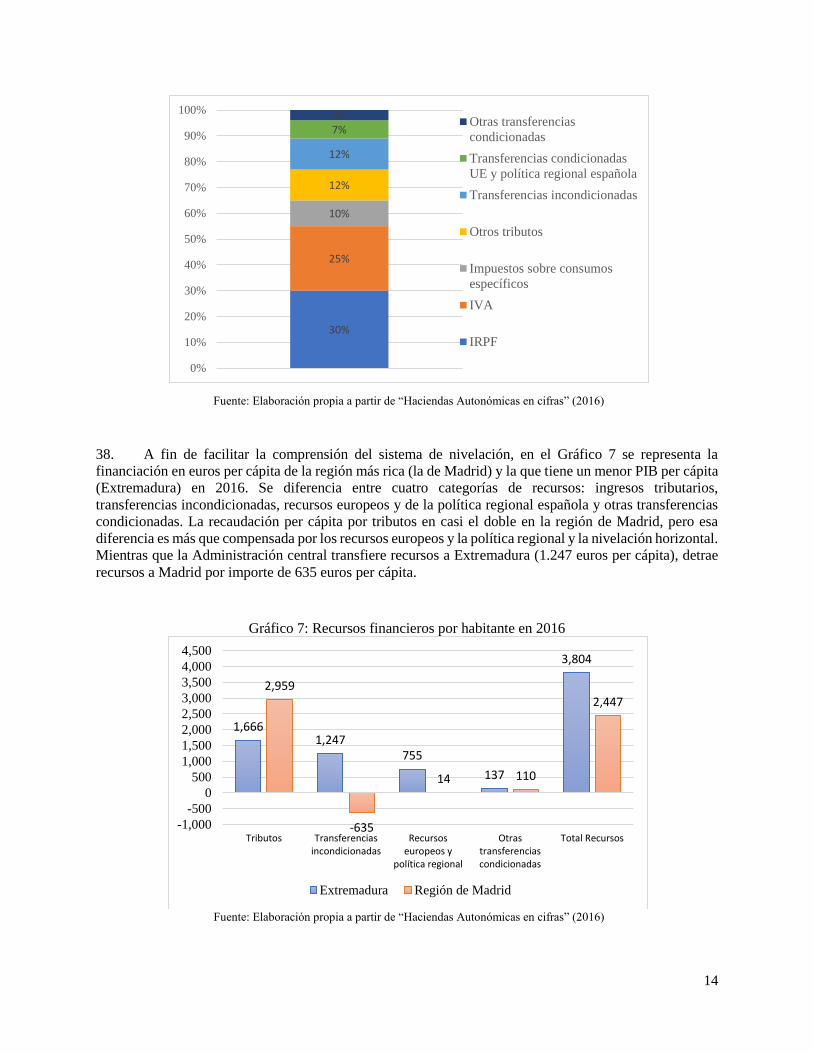
14
Fuente: Elaboración propia a partir de “Haciendas Autonómicas en cifras” (2016)
38. A fin de facilitar la comprensión del sistema de nivelación, en el Gráfico 7 se representa la
financiación en euros per cápita de la región más rica (la de Madrid) y la que tiene un menor PIB per cápita
(Extremadura) en 2016. Se diferencia entre cuatro categorías de recursos: ingresos tributarios,
transferencias incondicionadas, recursos europeos y de la política regional española y otras transferencias
condicionadas. La recaudación per cápita por tributos en casi el doble en la región de Madrid, pero esa
diferencia es más que compensada por los recursos europeos y la política regional y la nivelación horizontal.
Mientras que la Administración central transfiere recursos a Extremadura (1.247 euros per cápita), detrae
recursos a Madrid por importe de 635 euros per cápita.
Gráfico 7: Recursos financieros por habitante en 2016
Fuente: Elaboración propia a partir de “Haciendas Autonómicas en cifras” (2016)
30%
25%
10%
12%
12%
7%4%
0%
10%
20%
30%
40%
50%
60%
70%
80%
90%
100%Otras transferencias
condicionadas
Transferencias condicionadas
UE y política regional española
Transferencias incondicionadas
Otros tributos
Impuestos sobre consumos
específicos
IVA
IRPF
1,6661,247
755
137
3,804
2,959
-635
14 110
2,447
-1,000
-500
0
500
1,000
1,500
2,000
2,500
3,000
3,500
4,000
4,500
Tributos Transferenciasincondicionadas
Recursoseuropeos y
política regional
Otrastransferenciascondicionadas
Total Recursos
Extremadura Región de Madrid
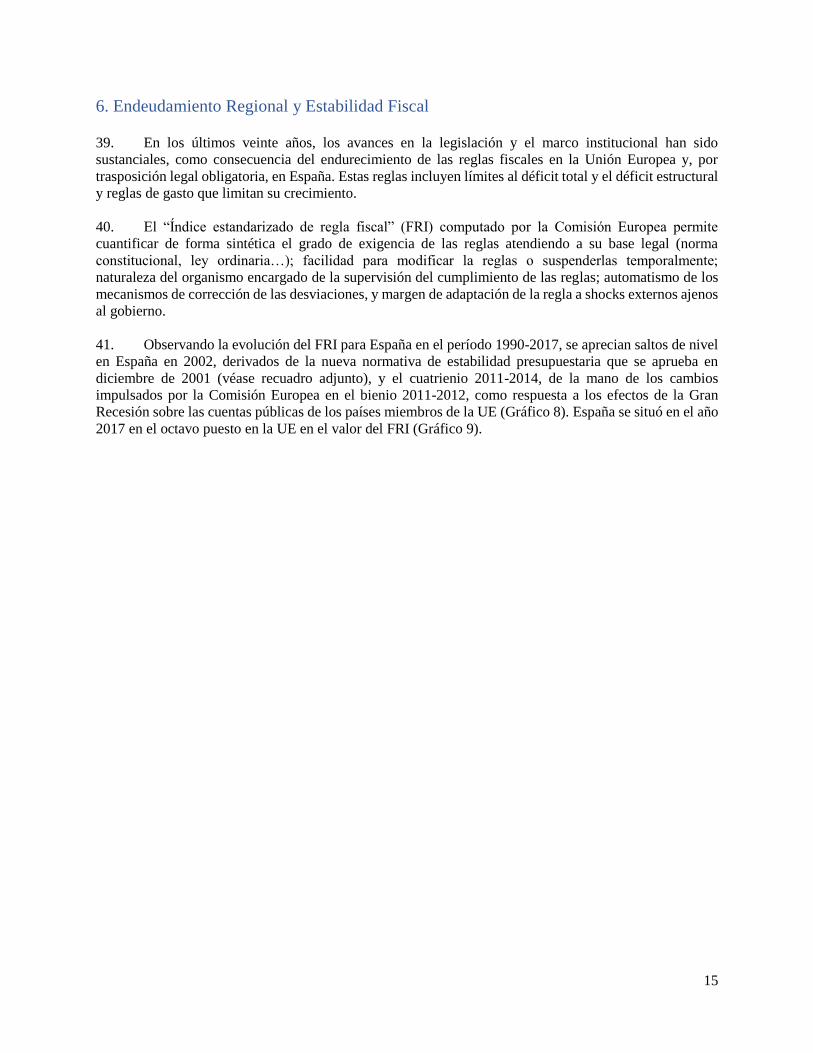
15
6. Endeudamiento Regional y Estabilidad Fiscal
39. En los últimos veinte años, los avances en la legislación y el marco institucional han sido
sustanciales, como consecuencia del endurecimiento de las reglas fiscales en la Unión Europea y, por
trasposición legal obligatoria, en España. Estas reglas incluyen límites al déficit total y el déficit estructural
y reglas de gasto que limitan su crecimiento.
40. El “Índice estandarizado de regla fiscal” (FRI) computado por la Comisión Europea permite
cuantificar de forma sintética el grado de exigencia de las reglas atendiendo a su base legal (norma
constitucional, ley ordinaria…); facilidad para modificar la reglas o suspenderlas temporalmente;
naturaleza del organismo encargado de la supervisión del cumplimiento de las reglas; automatismo de los
mecanismos de corrección de las desviaciones, y margen de adaptación de la regla a shocks externos ajenos
al gobierno.
41. Observando la evolución del FRI para España en el período 1990-2017, se aprecian saltos de nivel
en España en 2002, derivados de la nueva normativa de estabilidad presupuestaria que se aprueba en
diciembre de 2001 (véase recuadro adjunto), y el cuatrienio 2011-2014, de la mano de los cambios
impulsados por la Comisión Europea en el bienio 2011-2012, como respuesta a los efectos de la Gran
Recesión sobre las cuentas públicas de los países miembros de la UE (Gráfico 8). España se situó en el año
2017 en el octavo puesto en la UE en el valor del FRI (Gráfico 9).
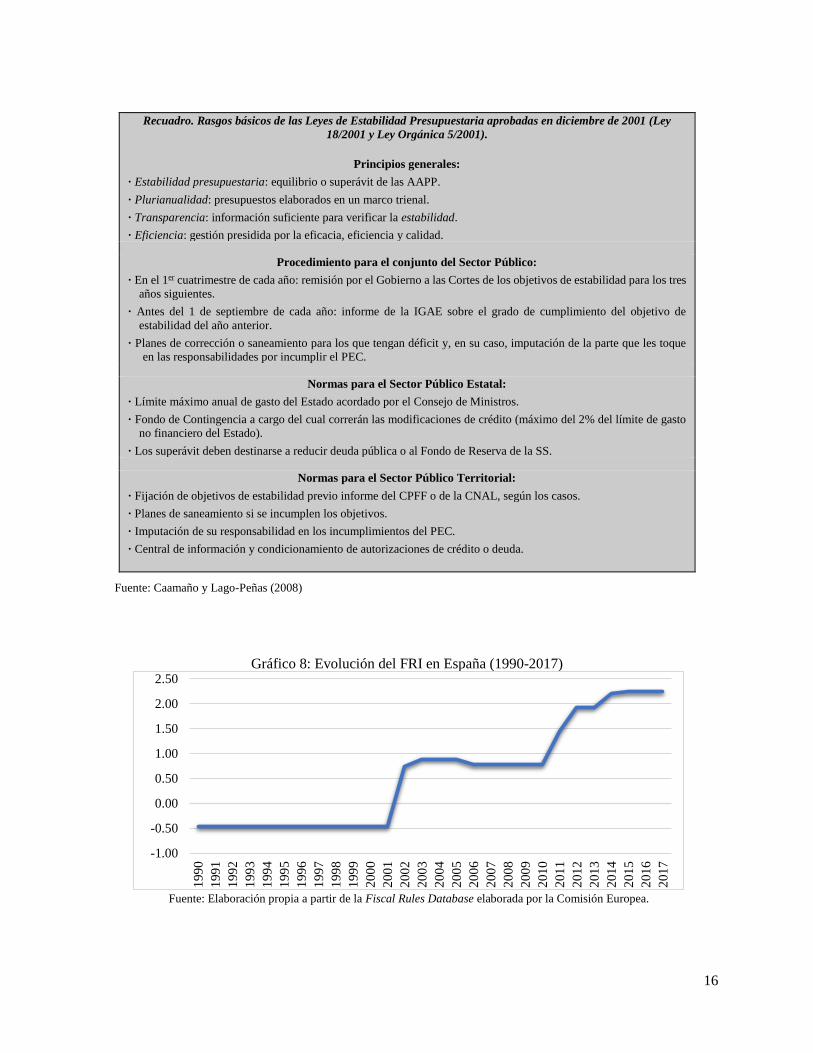
16
Recuadro. Rasgos básicos de las Leyes de Estabilidad Presupuestaria aprobadas en diciembre de 2001 (Ley
18/2001 y Ley Orgánica 5/2001).
Principios generales:
· Estabilidad presupuestaria: equilibrio o superávit de las AAPP.
· Plurianualidad: presupuestos elaborados en un marco trienal.
· Transparencia: información suficiente para verificar la estabilidad.
· Eficiencia: gestión presidida por la eficacia, eficiencia y calidad.
Procedimiento para el conjunto del Sector Público:
· En el 1er cuatrimestre de cada año: remisión por el Gobierno a las Cortes de los objetivos de estabilidad para los tres
años siguientes.
· Antes del 1 de septiembre de cada año: informe de la IGAE sobre el grado de cumplimiento del objetivo de
estabilidad del año anterior.
· Planes de corrección o saneamiento para los que tengan déficit y, en su caso, imputación de la parte que les toque
en las responsabilidades por incumplir el PEC.
Normas para el Sector Público Estatal:
· Límite máximo anual de gasto del Estado acordado por el Consejo de Ministros.
· Fondo de Contingencia a cargo del cual correrán las modificaciones de crédito (máximo del 2% del límite de gasto
no financiero del Estado).
· Los superávit deben destinarse a reducir deuda pública o al Fondo de Reserva de la SS.
Normas para el Sector Público Territorial:
· Fijación de objetivos de estabilidad previo informe del CPFF o de la CNAL, según los casos.
· Planes de saneamiento si se incumplen los objetivos.
· Imputación de su responsabilidad en los incumplimientos del PEC.
· Central de información y condicionamiento de autorizaciones de crédito o deuda.
Fuente: Caamaño y Lago-Peñas (2008)
Gráfico 8: Evolución del FRI en España (1990-2017)
Fuente: Elaboración propia a partir de la Fiscal Rules Database elaborada por la Comisión Europea.
-1.00
-0.50
0.00
0.50
1.00
1.50
2.00
2.50
199
0
199
1
199
2
199
3
199
4
199
5
199
6
199
7
199
8
199
9
200
0
200
1
200
2
200
3
200
4
200
5
200
6
200
7
200
8
200
9
201
0
201
1
201
2
201
3
201
4
201
5
201
6
201
7
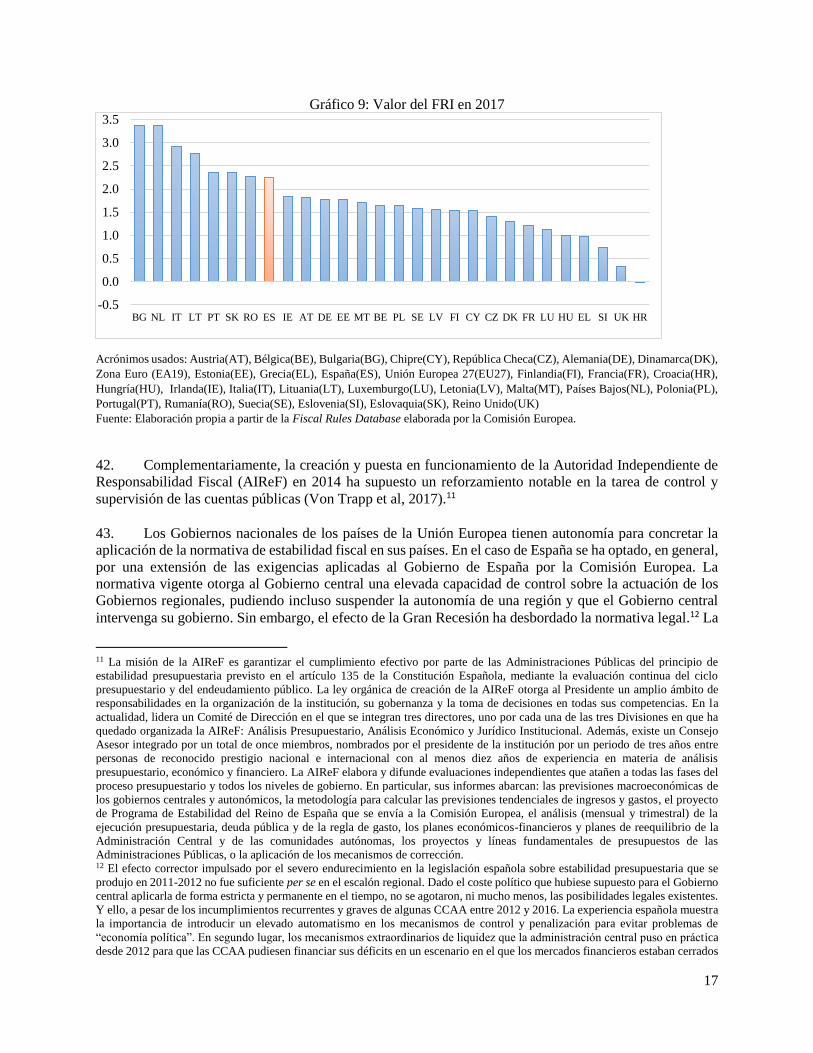
17
Gráfico 9: Valor del FRI en 2017
Acrónimos usados: Austria(AT), Bélgica(BE), Bulgaria(BG), Chipre(CY), República Checa(CZ), Alemania(DE), Dinamarca(DK),
Zona Euro (EA19), Estonia(EE), Grecia(EL), España(ES), Unión Europea 27(EU27), Finlandia(FI), Francia(FR), Croacia(HR),
Hungría(HU), Irlanda(IE), Italia(IT), Lituania(LT), Luxemburgo(LU), Letonia(LV), Malta(MT), Países Bajos(NL), Polonia(PL),
Portugal(PT), Rumanía(RO), Suecia(SE), Eslovenia(SI), Eslovaquia(SK), Reino Unido(UK)
Fuente: Elaboración propia a partir de la Fiscal Rules Database elaborada por la Comisión Europea.
42. Complementariamente, la creación y puesta en funcionamiento de la Autoridad Independiente de
Responsabilidad Fiscal (AIReF) en 2014 ha supuesto un reforzamiento notable en la tarea de control y
supervisión de las cuentas públicas (Von Trapp et al, 2017).11
43. Los Gobiernos nacionales de los países de la Unión Europea tienen autonomía para concretar la
aplicación de la normativa de estabilidad fiscal en sus países. En el caso de España se ha optado, en general,
por una extensión de las exigencias aplicadas al Gobierno de España por la Comisión Europea. La
normativa vigente otorga al Gobierno central una elevada capacidad de control sobre la actuación de los
Gobiernos regionales, pudiendo incluso suspender la autonomía de una región y que el Gobierno central
intervenga su gobierno. Sin embargo, el efecto de la Gran Recesión ha desbordado la normativa legal.12 La
11 La misión de la AIReF es garantizar el cumplimiento efectivo por parte de las Administraciones Públicas del principio de
estabilidad presupuestaria previsto en el artículo 135 de la Constitución Española, mediante la evaluación continua del ciclo
presupuestario y del endeudamiento público. La ley orgánica de creación de la AIReF otorga al Presidente un amplio ámbito de
responsabilidades en la organización de la institución, su gobernanza y la toma de decisiones en todas sus competencias. En la
actualidad, lidera un Comité de Dirección en el que se integran tres directores, uno por cada una de las tres Divisiones en que ha
quedado organizada la AIReF: Análisis Presupuestario, Análisis Económico y Jurídico Institucional. Además, existe un Consejo
Asesor integrado por un total de once miembros, nombrados por el presidente de la institución por un periodo de tres años entre
personas de reconocido prestigio nacional e internacional con al menos diez años de experiencia en materia de análisis
presupuestario, económico y financiero. La AIReF elabora y difunde evaluaciones independientes que atañen a todas las fases del
proceso presupuestario y todos los niveles de gobierno. En particular, sus informes abarcan: las previsiones macroeconómicas de
los gobiernos centrales y autonómicos, la metodología para calcular las previsiones tendenciales de ingresos y gastos, el proyecto
de Programa de Estabilidad del Reino de España que se envía a la Comisión Europea, el análisis (mensual y trimestral) de la
ejecución presupuestaria, deuda pública y de la regla de gasto, los planes económicos-financieros y planes de reequilibrio de la
Administración Central y de las comunidades autónomas, los proyectos y líneas fundamentales de presupuestos de las
Administraciones Públicas, o la aplicación de los mecanismos de corrección. 12 El efecto corrector impulsado por el severo endurecimiento en la legislación española sobre estabilidad presupuestaria que se
produjo en 2011-2012 no fue suficiente per se en el escalón regional. Dado el coste político que hubiese supuesto para el Gobierno
central aplicarla de forma estricta y permanente en el tiempo, no se agotaron, ni mucho menos, las posibilidades legales existentes.
Y ello, a pesar de los incumplimientos recurrentes y graves de algunas CCAA entre 2012 y 2016. La experiencia española muestra
la importancia de introducir un elevado automatismo en los mecanismos de control y penalización para evitar problemas de
“economía política”. En segundo lugar, los mecanismos extraordinarios de liquidez que la administración central puso en práctica
desde 2012 para que las CCAA pudiesen financiar sus déficits en un escenario en el que los mercados financieros estaban cerrados
-0.5
0.0
0.5
1.0
1.5
2.0
2.5
3.0
3.5
BG NL IT LT PT SK RO ES IE AT DE EE MT BE PL SE LV FI CY CZ DK FR LU HU EL SI UK HR
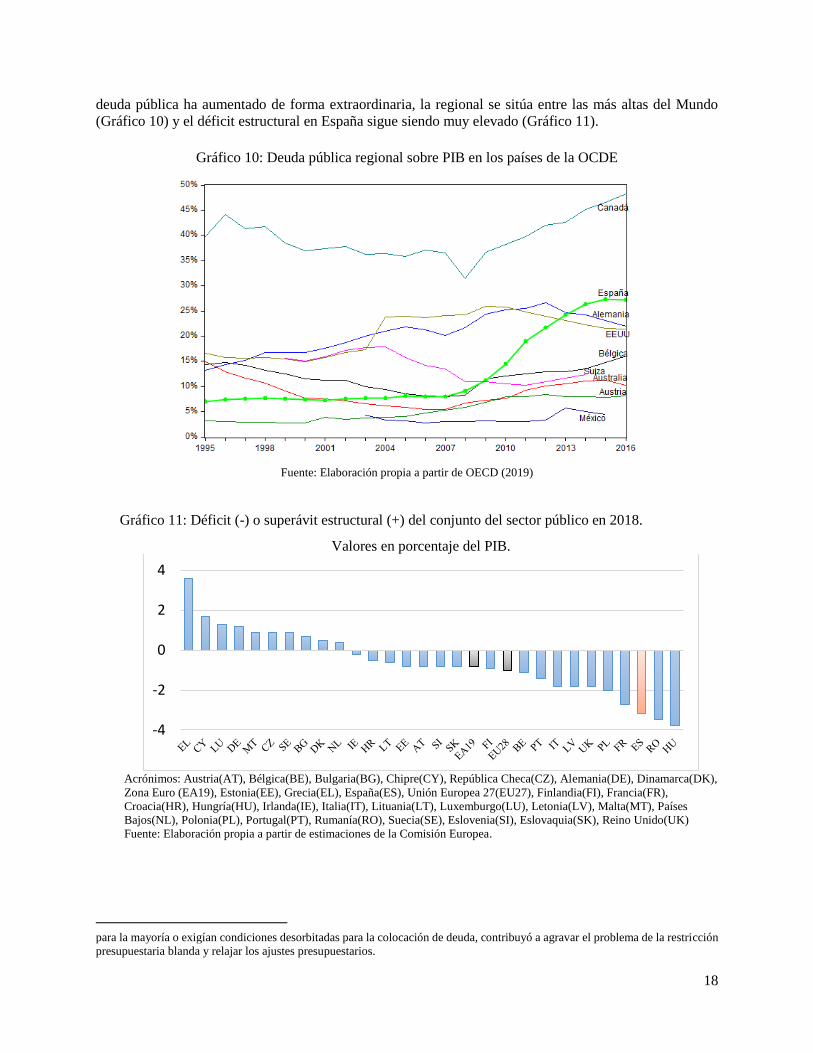
18
deuda pública ha aumentado de forma extraordinaria, la regional se sitúa entre las más altas del Mundo
(Gráfico 10) y el déficit estructural en España sigue siendo muy elevado (Gráfico 11).
Gráfico 10: Deuda pública regional sobre PIB en los países de la OCDE
Fuente: Elaboración propia a partir de OECD (2019)
Gráfico 11: Déficit (-) o superávit estructural (+) del conjunto del sector público en 2018.
Valores en porcentaje del PIB.
Acrónimos: Austria(AT), Bélgica(BE), Bulgaria(BG), Chipre(CY), República Checa(CZ), Alemania(DE), Dinamarca(DK),
Zona Euro (EA19), Estonia(EE), Grecia(EL), España(ES), Unión Europea 27(EU27), Finlandia(FI), Francia(FR),
Croacia(HR), Hungría(HU), Irlanda(IE), Italia(IT), Lituania(LT), Luxemburgo(LU), Letonia(LV), Malta(MT), Países
Bajos(NL), Polonia(PL), Portugal(PT), Rumanía(RO), Suecia(SE), Eslovenia(SI), Eslovaquia(SK), Reino Unido(UK)
Fuente: Elaboración propia a partir de estimaciones de la Comisión Europea.
para la mayoría o exigían condiciones desorbitadas para la colocación de deuda, contribuyó a agravar el problema de la restricción
presupuestaria blanda y relajar los ajustes presupuestarios.
-4
-2
0
2
4
19
44. En síntesis, el problema del déficit ha afectado muy intensamente a todas las Administraciones
Públicas españolas, salvo la administración local.13 Por tanto, las regiones en su conjunto han puesto en
jaque la estabilidad fiscal en los últimos años. El enorme shock fiscal que supuso la Gran Recesión hizo
insuficientes las reglas y los mecanismos de control. El Gobierno central tuvo que facilitar la financiación
de sus déficits cuando los mercados financieros estaban cerrados para la colocación de deuda pública
autonómica.
45. En estos momentos, el principal acreedor de las regiones es el Gobierno central, aunque no se ha
producido una quita del principal de la deuda. Los créditos concedidos se mantienen como pasivos
financieros de las administraciones regionales.
46. Los ajustes de las Comunidades Autónomas han sido en todo caso intensos y han pivotado sobre
todo (en conjunto, más del 90%) en recortes de gasto más que en incrementos en la recaudación tributaria
a nivel regional.
7. El Proceso Presupuestario
47. El proceso presupuestario en las regiones es completamente autónomo y separado del de la
Administración central, pero esencialmente se sigue el mismo proceso que en el caso de los Presupuestos
Generales del Estado. El ciclo comienza en los meses de junio y julio con la comunicación por parte del
Ministerio de Hacienda de la previsión de recursos de las Comunidades Autónomas en concepto de
transferencias e ingresos tributarios regionales gestionados por la Agencia tributaria estatal. En paralelo, se
discute multilateralmente entre el Gobierno central y los autonómicos en el Consejo de Política Fiscal y
Financiera y se vota el objetivo de déficit que le corresponde a cada Comunidad Autónoma; si bien el
Gobierno central cuenta con la mayoría de votos y, por tanto, puede imponer su criterio. Finalmente, las
regiones establecen individualmente su “techo de gasto”14 coherente con la llamada “regla de gasto” que se
aplica desde el año 2013 y que es hecha pública por el Gobierno central durante el propio mes de julio.15
En el mes de octubre se presenta el proyecto coherente con todo lo anterior en el Parlamento regional y
comienza la discusión y votación, primero de las enmiendas a la totalidad y luego de enmiendas parciales.
El proceso dura alrededor de 2 meses. Si es exitoso, los presupuestos se aprueban en diciembre y entran en
vigor el 1 de enero de cada año, abarcando el año natural completo. La ley contempla la posibilidad de
prorrogar los presupuestos del ejercicio anterior si el Parlamento regional no vota favorablemente el
proyecto de presupuestos.
8. Auditoría, Control y Rendición de Cuentas
48. Las Comunidades Autónomas disponen de una Intervención general de cuentas propia (“General
regional comptroller”) que supervisa el cumplimiento de obligaciones contables y legales de todo tipo, con
personal cualificado y seleccionado para esa función. No obstante, su independencia puede verse limitada,
13 El superávit de los municipios registrado en los últimos años se explica por tres motivos. En primer lugar, los municipios cuentan
con una base fiscal más estable y menos sensible al ciclo. En segundo lugar, los municipios estaban gastando una parte sustancial
de sus presupuestos (alrededor de un cuarto del mismo) en competencias no obligatorias por ley, pero demandadas por los
ciudadanos. El Gobierno central impuso en 2012 que ese gasto debía dejar de hacerse. Finalmente, los municipios están también
sujetos a la llamada “regla de gasto” que se explica en el apartado siguiente. 14 Esto es, el máximo nivel de gasto que pueden contemplar en su presupuesto. 15 La regla de gasto se aplica a todas las administraciones menos a la Seguridad Social y, en esencia, determina que el gasto público
no puede crecer más que el PIB tendencial o de referencia de medio plazo para España, si no se adoptan medidas discrecionales
que eleven los ingresos (en particular, subidas impositivas). Para un mayor detalle puede consultarse
https://www.airef.es/es/noticias/quieres-conocer-la-regla-de-gasto/
20
en ocasiones, por el hecho de que la Intervención es un departamento integrado en los Gobiernos regionales
y su máximo responsable es nombrado por estos.
49. Adicionalmente, en 12 de las 17 regiones se han creado organismos dedicados al control externo
de las cuentas y de la gestión económico-financiera de las instituciones y entidades del sector público
autonómico y local (“Regional Audit Office). Estos organismos coordinan su actuación con el Tribunal de
Cuentas de la nación. En este caso, la elección de sus miembros depende de los Parlamentos regionales. La
principal crítica al funcionamiento de estos organismos de control es el retraso recurrente en la publicación
de sus informes.
50. Tanto el control interno desarrollado por las intervenciones generales, como el de los organismos
externos se centra en la legalidad de las actuaciones y muy escasamente en la eficiencia y la rentabilidad
social. Esta es otra debilidad que, no obstante, es extensible a muchos otros países de la OCDE.
51. La Unión Europea ha sido un motor de cambio muy positivo para la rendición de cuentas en las
Comunidades Autónomas. Especialmente en aquellas Comunidades Autónomas más beneficiadas por
fondos europeos. La trasposición de directivas comunitarias sobre transparencia, contratación, buen
gobierno, etcétera ha sido generalizada y también su puesta en práctica. En este sentido, las evaluaciones
de Transparencia Internacional sobre las Comunidades Autónomas reflejan una puntuación en general alta
o muy alta.
52. Los presupuestos participativos en España tienen una historia de más de 20 años, aunque su
difusión se ha acelerado en el último quinquenio y todas las grandes ciudades reservan una parte de sus
inversiones para ser repartidas tras un proceso de deliberación ciudadano. Sin embargo, en las Comunidades
Autónomas los presupuestos participativos son más bien anecdóticos.
53. Las encuestas disponibles ponen en evidencia problemas de falta de información sobre la
asignación de responsabilidades de gasto y tributarias. El acierto en la atribución de responsabilidades es
sustancialmente mayor en el caso de las correspondientes al gobierno central que en el de los autonómicos.
Alrededor de la mitad de ciudadanos no tienen claro quién es el responsable principal en materia sanitaria
y educativa. Al contrario, la responsabilidad del Gobierno Central sobre pensiones y seguro por desempleo
es, en general, bien asignada. Los resultados son similares en lo que atañe a los impuestos. El acierto es
sustancialmente mayor en los impuestos exclusivos del Estado (Impuesto sobre Sociedades) que en los
autonómicos o los compartidos (IVA e IRPF). No obstante, con el paso del tiempo, los ciudadanos tienden
a asignar mejor entre los distintos niveles de gobierno las responsabilidades de gasto y los impuestos. Entre
2005 y 2015 hay una clara tendencia creciente en las cuatro competencias seleccionadas (Gráfico 12).
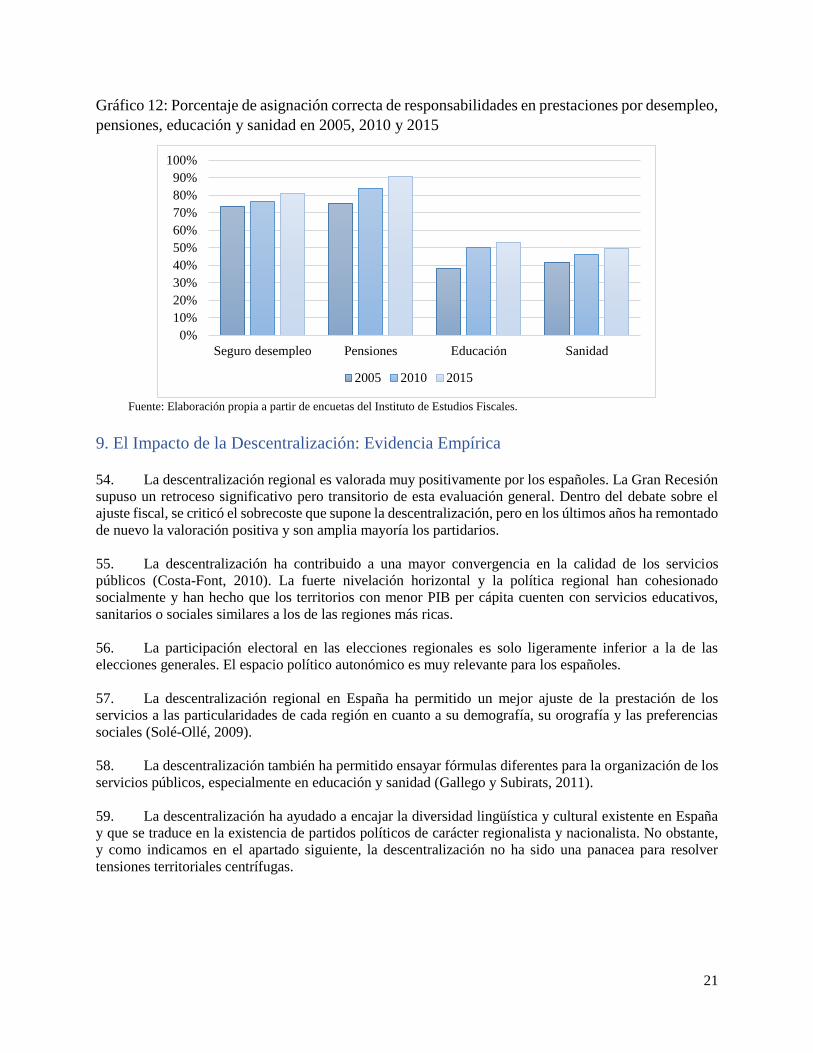
21
Gráfico 12: Porcentaje de asignación correcta de responsabilidades en prestaciones por desempleo,
pensiones, educación y sanidad en 2005, 2010 y 2015
Fuente: Elaboración propia a partir de encuetas del Instituto de Estudios Fiscales.
9. El Impacto de la Descentralización: Evidencia Empírica
54. La descentralización regional es valorada muy positivamente por los españoles. La Gran Recesión
supuso un retroceso significativo pero transitorio de esta evaluación general. Dentro del debate sobre el
ajuste fiscal, se criticó el sobrecoste que supone la descentralización, pero en los últimos años ha remontado
de nuevo la valoración positiva y son amplia mayoría los partidarios.
55. La descentralización ha contribuido a una mayor convergencia en la calidad de los servicios
públicos (Costa-Font, 2010). La fuerte nivelación horizontal y la política regional han cohesionado
socialmente y han hecho que los territorios con menor PIB per cápita cuenten con servicios educativos,
sanitarios o sociales similares a los de las regiones más ricas.
56. La participación electoral en las elecciones regionales es solo ligeramente inferior a la de las
elecciones generales. El espacio político autonómico es muy relevante para los españoles.
57. La descentralización regional en España ha permitido un mejor ajuste de la prestación de los
servicios a las particularidades de cada región en cuanto a su demografía, su orografía y las preferencias
sociales (Solé-Ollé, 2009).
58. La descentralización también ha permitido ensayar fórmulas diferentes para la organización de los
servicios públicos, especialmente en educación y sanidad (Gallego y Subirats, 2011).
59. La descentralización ha ayudado a encajar la diversidad lingüística y cultural existente en España
y que se traduce en la existencia de partidos políticos de carácter regionalista y nacionalista. No obstante,
y como indicamos en el apartado siguiente, la descentralización no ha sido una panacea para resolver
tensiones territoriales centrífugas.
0%
10%
20%
30%
40%
50%
60%
70%
80%
90%
100%
Seguro desempleo Pensiones Educación Sanidad
2005 2010 2015
22
10. Lecciones del Caso Español
60. Aunque el mapa territorial y las fronteras regionales vienen la mayor parte de las veces dados, la
existencia de diferencias extremas en el tamaño poblacional (La Rioja con 315,000 habitantes versus
Andalucía con 8.4 millones) plantea desafíos si se pretende desplegar una descentralización intensa y
simétrica. Para algunos servicios públicos (sanidad o educación universitaria) las economías de escala
exigen tamaños poblacionales que superen un umbral.
61. Si bien la descentralización política y financiera es una solución razonable para acomodar
diferencias étnicas, culturales o lingüísticas, es un proceso que también contribuye a reforzarlas. La
búsqueda y creación de identidades regionales propias se refuerza con la descentralización. Por otro lado,
la apuesta por soluciones asimétricas en el sistema de financiación o el acervo competencial para satisfacer
a las regiones con mayor demanda de descentralización, pueden generar sentimientos de agravio
comparativo. El “federalismo asimétrico” que busca garantizar mayor estabilidad política puede acabar
generando el efecto contrario en el medio y largo plazo: la tolerancia a las asimetrías es variable en el
tiempo (Bird y Ebel, 2006).
62. Es fundamental adaptar el marco institucional a la nueva realidad descentralizada. En particular,
resulta clave contar con foros políticos y técnicos bien organizados para coordinarse vertical y
horizontalmente, en los que el gobierno central y los subcentrales actúen con lealtad mutua. Además, es
muy importante contar con organismos técnicos independientes que permitan resolver algunas cuestiones
difíciles porque conllevan efectos económicos. Por ejemplo, la estimación de las diferencias en los costes
de los servicios públicos o la medición de la capacidad fiscal en cada región.
63. El mantenimiento de una legislación nacional básica muy exigente permite garantizar unidad de
mercado, derechos de los ciudadanos y homogeneidad en la prestación de servicios. Pero también puede
limitar las ventajas de la descentralización (el mejor ajuste a las preferencias dominantes en cada región o
la experimentación) y dificultar la correcta asignación de responsabilidades de los gobiernos. Cuando varios
niveles de gobierno tienen competencias muy relevantes sobre un servicio, la rendición de cuentas
(“accountability”) se complica. Y aumenta la probabilidad de que se produzcan conflictos políticos sobre
el alcance de las competencias de cada nivel de gobierno que acaban en el Tribunal constitucional.
64. La descentralización regional conlleva la necesidad de reforzar reglas fiscales y contar con
supervisores fiscales y organismos de coordinación para evitar problemas de estabilidad fiscal. Cuando
aumenta el número de agentes que deciden sobre déficit y deuda y teniendo en cuenta que la estabilidad
fiscal es un bien común, aumentan los incentivos al desequilibrio fiscal. Especialmente, si existen
expectativas fundadas de rescate (“bail-out”). Por ello, en paralelo a la descentralización de los
instrumentos fiscales, hay que adaptar el marco institucional para garantizar la estabilidad fiscal (Lago-
Peñas et al, 2019).
65. Es importante equilibrar la elasticidad de gasto e ingresos regionales al ciclo económico. En
particular, si se descentralizan gastos rígidos a la baja y difíciles de ajustar, pero los ingresos son sensibles
al ciclo, se genera un problema de coherencia fiscal, que se agrava si las regiones no cuentan con
instrumentos fiscales suficientes.
66. Resulta fundamental dejarse guiar por la teoría del federalismo fiscal a la hora de decidir qué
impuestos se descentralizan; cuáles son las buenas opciones y cuáles no (Martínez-Vázquez, 2013). Aunque
en general, España no se ha desviado significativamente de lo que serían las buenas opciones, los principales
problemas han surgido cuando lo ha hecho. En concreto, la cesión del Impuesto sobre sociedades a las
Comunidades Autónomas forales ha generado externalidades negativas y distorsiones en la localización
23
empresarial que han acabo siendo sancionadas por los tribunales. Por su parte, la cesión sin restricciones
de los impuestos sobre sucesiones y donaciones y sobre patrimonio neto han provocado un proceso de
competencia fiscal nociva, poniendo en riesgo la existencia de ambos tributos. Como sostiene la literatura,
descentralizar impuestos que gravan bases altamente móviles como la riqueza no inmobiliaria es una mala
idea.
67. Aunque la evidencia empírica internacional muestra que la descentralización tributaria (casi)
siempre va más despacio y por detrás de la del gasto, la falta de autonomía y responsabilidad fiscal es un
problema para la rendición de cuentas (“accountability”), la responsabilidad y estabilidad fiscal y el
funcionamiento global del sistema. Idealmente, los procesos deberían converger lo máximo posible en el
tiempo. En España el proceso de descentralización tributaria arrancó realmente veinte años más tarde que
la del gasto y todavía hoy no está del todo resuelto.
68. La nivelación horizontal (“fiscal equalization”) es un reto mayor. Hay que ponerse de acuerdo
sobre el grado (plena o parcial) y sobre si se nivelan solo las diferencias en la capacidad fiscal o si además
de las necesidades de gasto generadas por distintos perfiles demográficos, etcétera también se tienen en
cuenta las diferencias interregionales en el coste de los servicios estándares. Compensar las diferencias
interregionales en el coste de prestación de servicios es más difícil, pero no imposible. Pero para hacerlo
bien hacen falta organismos técnicos independientes que fundamenten las ponderaciones y las cifras.
69. Una buena política regional exige buenos planes regionales de desarrollo y evaluación ex-ante de
la rentabilidad social de los proyectos mediante análisis coste-beneficio. La abundancia de recursos para
invertir sin una cultura de análisis de eficiencia bien asentada conduce a malas decisiones de inversión, que
van desde la infrautilización de las infraestructuras construidas a una carga de mantenimiento (gasto
corriente) a menudo no prevista y que condiciona los presupuestos futuros. La experiencia española muestra
que no es suficiente invertir dinero. Hay que optimizar su empleo. Y eso pasa por adaptar el marco
institucional del gobierno decisor a la cultura de la evaluación rigurosa de la rentabilidad social del gasto
público.
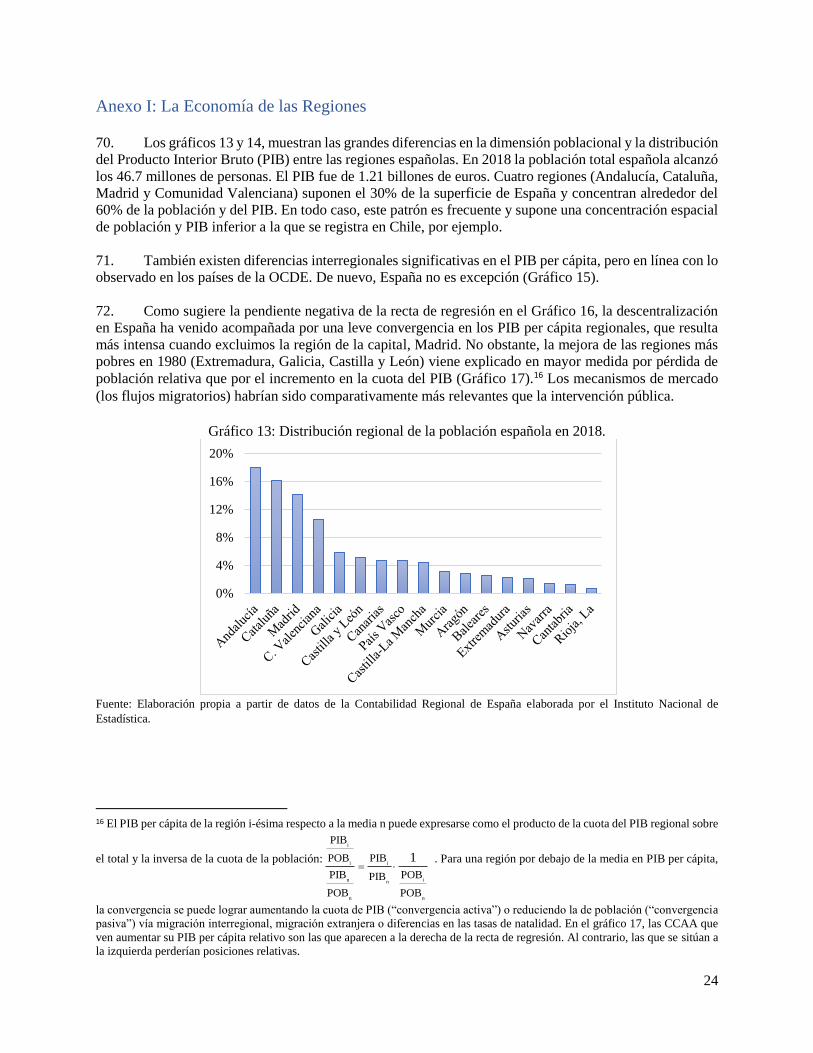
24
Anexo I: La Economía de las Regiones
70. Los gráficos 13 y 14, muestran las grandes diferencias en la dimensión poblacional y la distribución
del Producto Interior Bruto (PIB) entre las regiones españolas. En 2018 la población total española alcanzó
los 46.7 millones de personas. El PIB fue de 1.21 billones de euros. Cuatro regiones (Andalucía, Cataluña,
Madrid y Comunidad Valenciana) suponen el 30% de la superficie de España y concentran alrededor del
60% de la población y del PIB. En todo caso, este patrón es frecuente y supone una concentración espacial
de población y PIB inferior a la que se registra en Chile, por ejemplo.
71. También existen diferencias interregionales significativas en el PIB per cápita, pero en línea con lo
observado en los países de la OCDE. De nuevo, España no es excepción (Gráfico 15).
72. Como sugiere la pendiente negativa de la recta de regresión en el Gráfico 16, la descentralización
en España ha venido acompañada por una leve convergencia en los PIB per cápita regionales, que resulta
más intensa cuando excluimos la región de la capital, Madrid. No obstante, la mejora de las regiones más
pobres en 1980 (Extremadura, Galicia, Castilla y León) viene explicado en mayor medida por pérdida de
población relativa que por el incremento en la cuota del PIB (Gráfico 17).16 Los mecanismos de mercado
(los flujos migratorios) habrían sido comparativamente más relevantes que la intervención pública.
Gráfico 13: Distribución regional de la población española en 2018.
Fuente: Elaboración propia a partir de datos de la Contabilidad Regional de España elaborada por el Instituto Nacional de
Estadística.
16 El PIB per cápita de la región i-ésima respecto a la media n puede expresarse como el producto de la cuota del PIB regional sobre
el total y la inversa de la cuota de la población:
i
i i
n in
n n
PIB
POB PIB
PIB POBPIB
POB POB
1=
. Para una región por debajo de la media en PIB per cápita,
la convergencia se puede lograr aumentando la cuota de PIB (“convergencia activa”) o reduciendo la de población (“convergencia
pasiva”) vía migración interregional, migración extranjera o diferencias en las tasas de natalidad. En el gráfico 17, las CCAA que
ven aumentar su PIB per cápita relativo son las que aparecen a la derecha de la recta de regresión. Al contrario, las que se sitúan a
la izquierda perderían posiciones relativas.
0%
4%
8%
12%
16%
20%
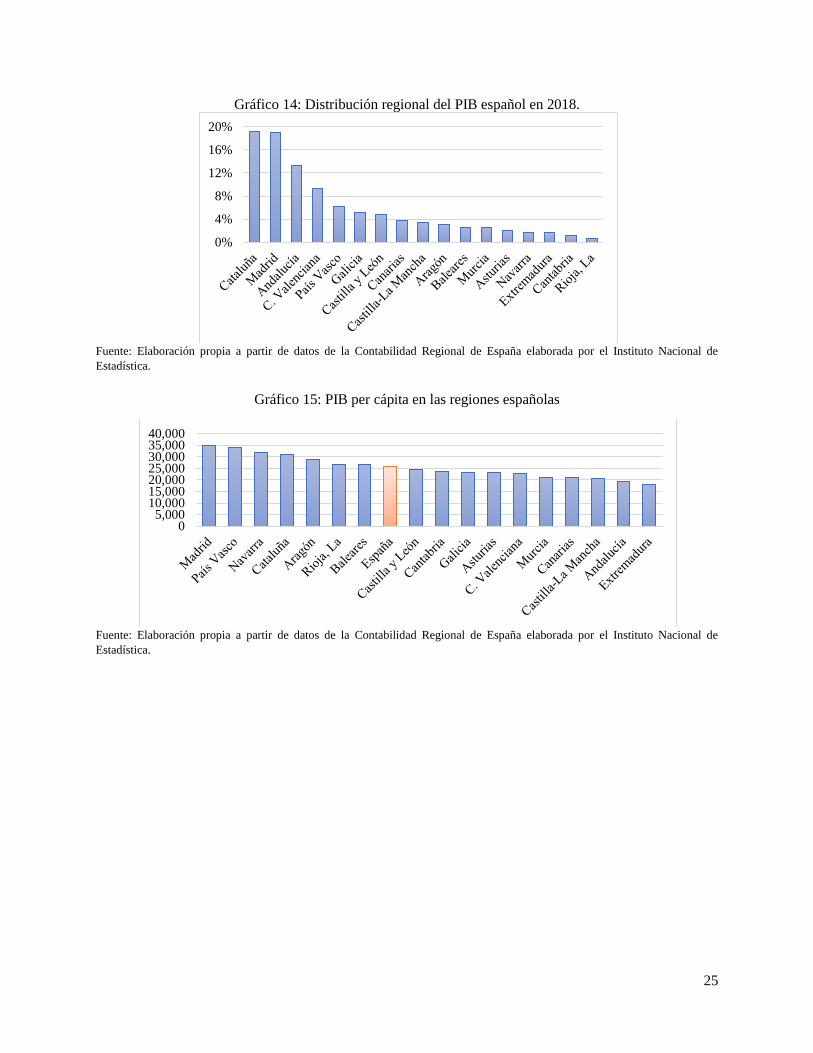
25
Gráfico 14: Distribución regional del PIB español en 2018.
Fuente: Elaboración propia a partir de datos de la Contabilidad Regional de España elaborada por el Instituto Nacional de
Estadística.
Gráfico 15: PIB per cápita en las regiones españolas
Fuente: Elaboración propia a partir de datos de la Contabilidad Regional de España elaborada por el Instituto Nacional de
Estadística.
0%
4%
8%
12%
16%
20%
05,000
10,00015,00020,00025,00030,00035,00040,000
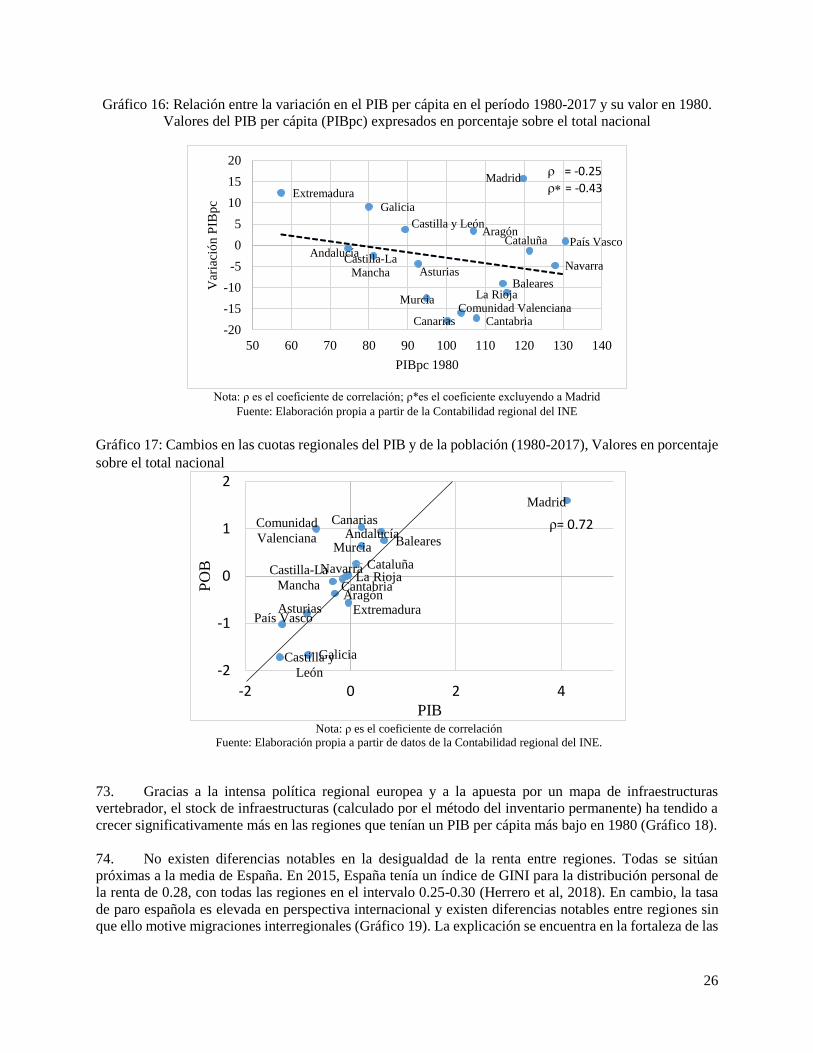
26
Gráfico 16: Relación entre la variación en el PIB per cápita en el período 1980-2017 y su valor en 1980.
Valores del PIB per cápita (PIBpc) expresados en porcentaje sobre el total nacional
Nota: ρ es el coeficiente de correlación; ρ*es el coeficiente excluyendo a Madrid
Fuente: Elaboración propia a partir de la Contabilidad regional del INE
Gráfico 17: Cambios en las cuotas regionales del PIB y de la población (1980-2017), Valores en porcentaje
sobre el total nacional
Nota: ρ es el coeficiente de correlación
Fuente: Elaboración propia a partir de datos de la Contabilidad regional del INE.
73. Gracias a la intensa política regional europea y a la apuesta por un mapa de infraestructuras
vertebrador, el stock de infraestructuras (calculado por el método del inventario permanente) ha tendido a
crecer significativamente más en las regiones que tenían un PIB per cápita más bajo en 1980 (Gráfico 18).
74. No existen diferencias notables en la desigualdad de la renta entre regiones. Todas se sitúan
próximas a la media de España. En 2015, España tenía un índice de GINI para la distribución personal de
la renta de 0.28, con todas las regiones en el intervalo 0.25-0.30 (Herrero et al, 2018). En cambio, la tasa
de paro española es elevada en perspectiva internacional y existen diferencias notables entre regiones sin
que ello motive migraciones interregionales (Gráfico 19). La explicación se encuentra en la fortaleza de las
Andalucía
Aragón
AsturiasBaleares
Canarias Cantabria
Castilla y León
Castilla-La
Mancha
Cataluña
Comunidad Valenciana
Extremadura
Galicia
Madrid
Murcia
Navarra
País Vasco
La Rioja
-20
-15
-10
-5
0
5
10
15
20
50 60 70 80 90 100 110 120 130 140
Var
iaci
ón P
IBp
c
PIBpc 1980
r = -0.25
r* = -0.43
Andalucía
AragónAsturias
Baleares
Canarias
Cantabria
Castilla y
León
Castilla-La
Mancha
Cataluña
Comunidad
Valenciana
Extremadura
Galicia
Madrid
Murcia
Navarra
País Vasco
La Rioja
-2
-1
0
1
2
-2 0 2 4
PO
B
PIB
ρ= 0.72
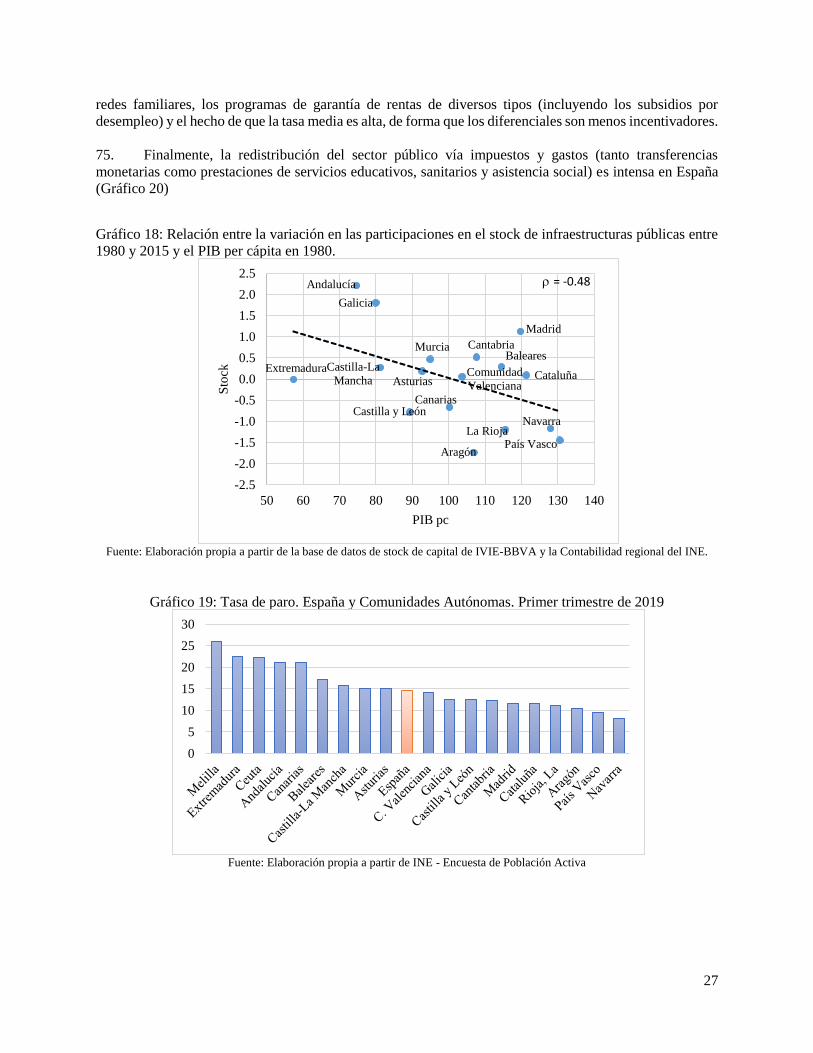
27
redes familiares, los programas de garantía de rentas de diversos tipos (incluyendo los subsidios por
desempleo) y el hecho de que la tasa media es alta, de forma que los diferenciales son menos incentivadores.
75. Finalmente, la redistribución del sector público vía impuestos y gastos (tanto transferencias
monetarias como prestaciones de servicios educativos, sanitarios y asistencia social) es intensa en España
(Gráfico 20)
Gráfico 18: Relación entre la variación en las participaciones en el stock de infraestructuras públicas entre
1980 y 2015 y el PIB per cápita en 1980.
Fuente: Elaboración propia a partir de la base de datos de stock de capital de IVIE-BBVA y la Contabilidad regional del INE.
Gráfico 19: Tasa de paro. España y Comunidades Autónomas. Primer trimestre de 2019
Fuente: Elaboración propia a partir de INE - Encuesta de Población Activa
Andalucía
Aragón
Asturias
Baleares
Canarias
Cantabria
Castilla y León
Castilla-La
Mancha CataluñaComunidad
Valenciana
Extremadura
Galicia
Madrid
Murcia
Navarra
País VascoLa Rioja
-2.5
-2.0
-1.5
-1.0
-0.5
0.0
0.5
1.0
1.5
2.0
2.5
50 60 70 80 90 100 110 120 130 140
Sto
ck
PIB pc
r = -0.48
0
5
10
15
20
25
30
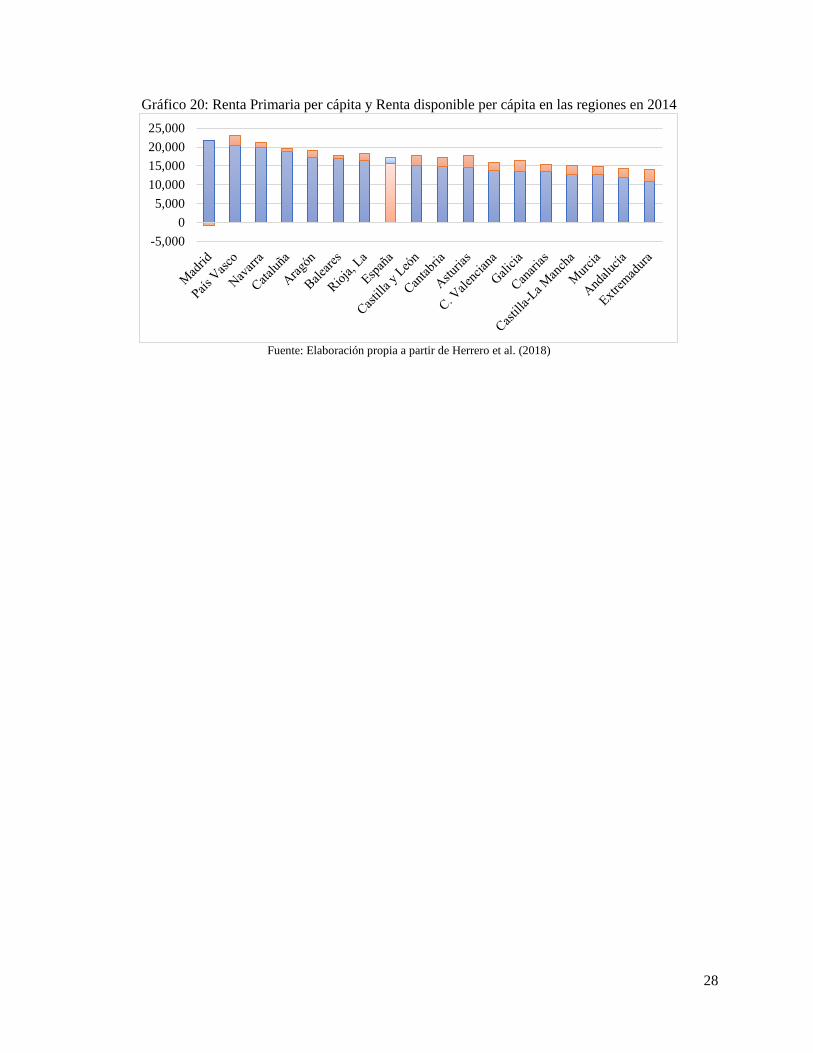
28
Gráfico 20: Renta Primaria per cápita y Renta disponible per cápita en las regiones en 2014
Fuente: Elaboración propia a partir de Herrero et al. (2018)
-5,000
0
5,000
10,000
15,000
20,000
25,000
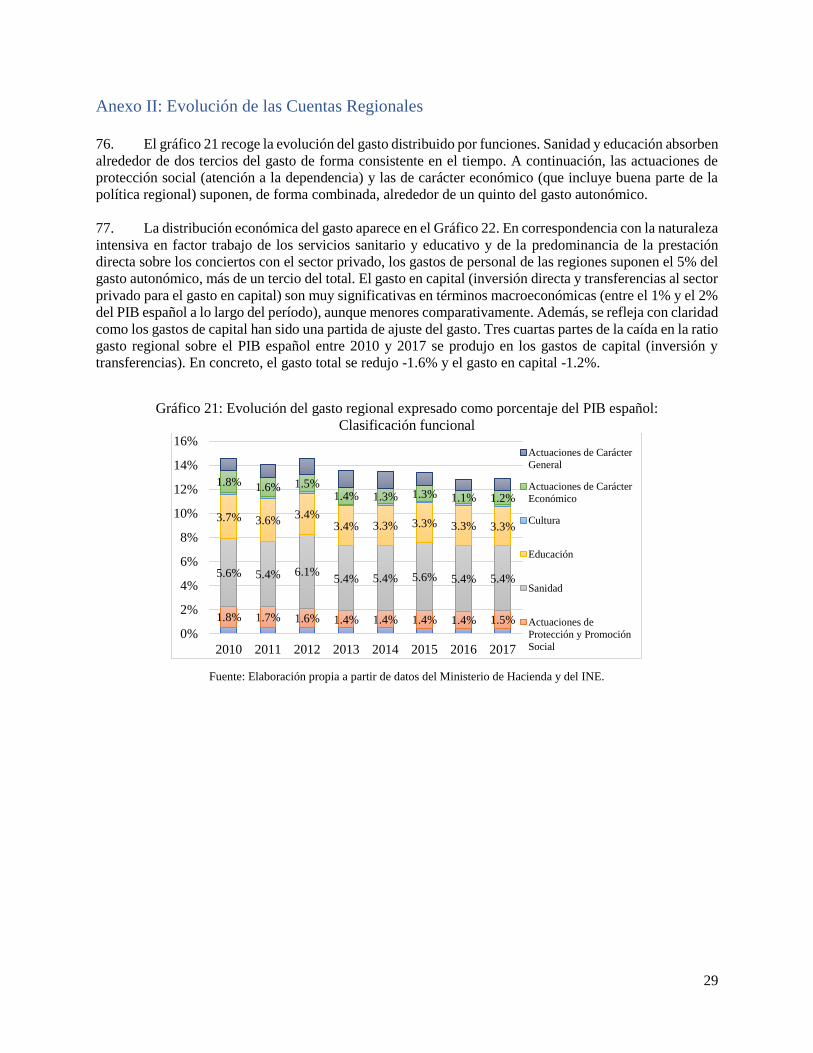
29
Anexo II: Evolución de las Cuentas Regionales
76. El gráfico 21 recoge la evolución del gasto distribuido por funciones. Sanidad y educación absorben
alrededor de dos tercios del gasto de forma consistente en el tiempo. A continuación, las actuaciones de
protección social (atención a la dependencia) y las de carácter económico (que incluye buena parte de la
política regional) suponen, de forma combinada, alrededor de un quinto del gasto autonómico.
77. La distribución económica del gasto aparece en el Gráfico 22. En correspondencia con la naturaleza
intensiva en factor trabajo de los servicios sanitario y educativo y de la predominancia de la prestación
directa sobre los conciertos con el sector privado, los gastos de personal de las regiones suponen el 5% del
gasto autonómico, más de un tercio del total. El gasto en capital (inversión directa y transferencias al sector
privado para el gasto en capital) son muy significativas en términos macroeconómicas (entre el 1% y el 2%
del PIB español a lo largo del período), aunque menores comparativamente. Además, se refleja con claridad
como los gastos de capital han sido una partida de ajuste del gasto. Tres cuartas partes de la caída en la ratio
gasto regional sobre el PIB español entre 2010 y 2017 se produjo en los gastos de capital (inversión y
transferencias). En concreto, el gasto total se redujo -1.6% y el gasto en capital -1.2%.
Gráfico 21: Evolución del gasto regional expresado como porcentaje del PIB español:
Clasificación funcional
Fuente: Elaboración propia a partir de datos del Ministerio de Hacienda y del INE.
1.8% 1.7% 1.6% 1.4% 1.4% 1.4% 1.4% 1.5%
5.6% 5.4% 6.1%5.4% 5.4% 5.6% 5.4% 5.4%
3.7% 3.6%3.4%
3.4% 3.3% 3.3% 3.3% 3.3%
1.8% 1.6% 1.5%1.4% 1.3% 1.3% 1.1% 1.2%
0%
2%
4%
6%
8%
10%
12%
14%
16%
2010 2011 2012 2013 2014 2015 2016 2017
Actuaciones de Carácter
General
Actuaciones de Carácter
Económico
Cultura
Educación
Sanidad
Actuaciones de
Protección y Promoción
Social
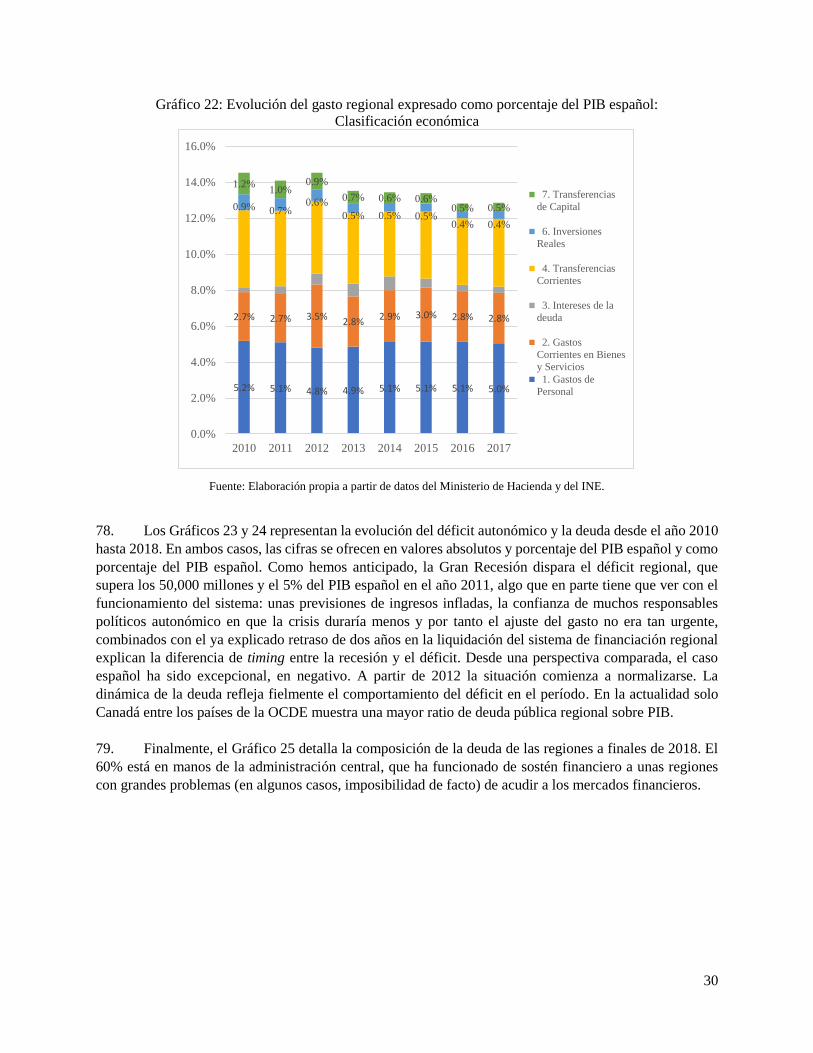
30
Gráfico 22: Evolución del gasto regional expresado como porcentaje del PIB español:
Clasificación económica
Fuente: Elaboración propia a partir de datos del Ministerio de Hacienda y del INE.
78. Los Gráficos 23 y 24 representan la evolución del déficit autonómico y la deuda desde el año 2010
hasta 2018. En ambos casos, las cifras se ofrecen en valores absolutos y porcentaje del PIB español y como
porcentaje del PIB español. Como hemos anticipado, la Gran Recesión dispara el déficit regional, que
supera los 50,000 millones y el 5% del PIB español en el año 2011, algo que en parte tiene que ver con el
funcionamiento del sistema: unas previsiones de ingresos infladas, la confianza de muchos responsables
políticos autonómico en que la crisis duraría menos y por tanto el ajuste del gasto no era tan urgente,
combinados con el ya explicado retraso de dos años en la liquidación del sistema de financiación regional
explican la diferencia de timing entre la recesión y el déficit. Desde una perspectiva comparada, el caso
español ha sido excepcional, en negativo. A partir de 2012 la situación comienza a normalizarse. La
dinámica de la deuda refleja fielmente el comportamiento del déficit en el período. En la actualidad solo
Canadá entre los países de la OCDE muestra una mayor ratio de deuda pública regional sobre PIB.
79. Finalmente, el Gráfico 25 detalla la composición de la deuda de las regiones a finales de 2018. El
60% está en manos de la administración central, que ha funcionado de sostén financiero a unas regiones
con grandes problemas (en algunos casos, imposibilidad de facto) de acudir a los mercados financieros.
5.2% 5.1% 4.8% 4.9% 5.1% 5.1% 5.1% 5.0%
2.7% 2.7% 3.5%2.8%
2.9% 3.0% 2.8% 2.8%
0.9% 0.7%0.6%
0.5% 0.5% 0.5%0.4% 0.4%
1.2%1.0%
0.9%
0.7% 0.6% 0.6%0.5% 0.5%
0.0%
2.0%
4.0%
6.0%
8.0%
10.0%
12.0%
14.0%
16.0%
2010 2011 2012 2013 2014 2015 2016 2017
7. Transferencias
de Capital
6. Inversiones
Reales
4. Transferencias
Corrientes
3. Intereses de la
deuda
2. Gastos
Corrientes en Bienes
y Servicios
1. Gastos de
Personal
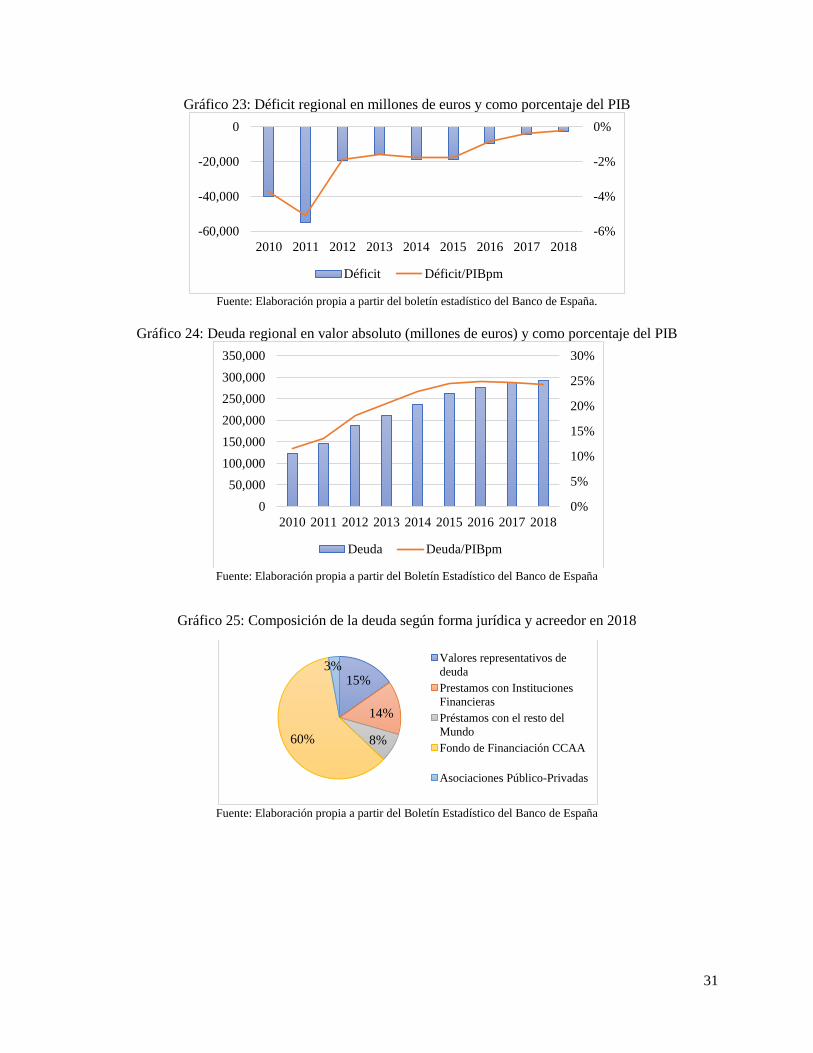
31
Gráfico 23: Déficit regional en millones de euros y como porcentaje del PIB
Fuente: Elaboración propia a partir del boletín estadístico del Banco de España.
Gráfico 24: Deuda regional en valor absoluto (millones de euros) y como porcentaje del PIB
Fuente: Elaboración propia a partir del Boletín Estadístico del Banco de España
Gráfico 25: Composición de la deuda según forma jurídica y acreedor en 2018
Fuente: Elaboración propia a partir del Boletín Estadístico del Banco de España
-6%
-4%
-2%
0%
-60,000
-40,000
-20,000
0
2010 2011 2012 2013 2014 2015 2016 2017 2018
Déficit Déficit/PIBpm
0%
5%
10%
15%
20%
25%
30%
0
50,000
100,000
150,000
200,000
250,000
300,000
350,000
2010 2011 2012 2013 2014 2015 2016 2017 2018
Deuda Deuda/PIBpm
15%
14%
8%60%
3%Valores representativos de
deuda
Prestamos con Instituciones
Financieras
Préstamos con el resto del
Mundo
Fondo de Financiación CCAA
Asociaciones Público-Privadas
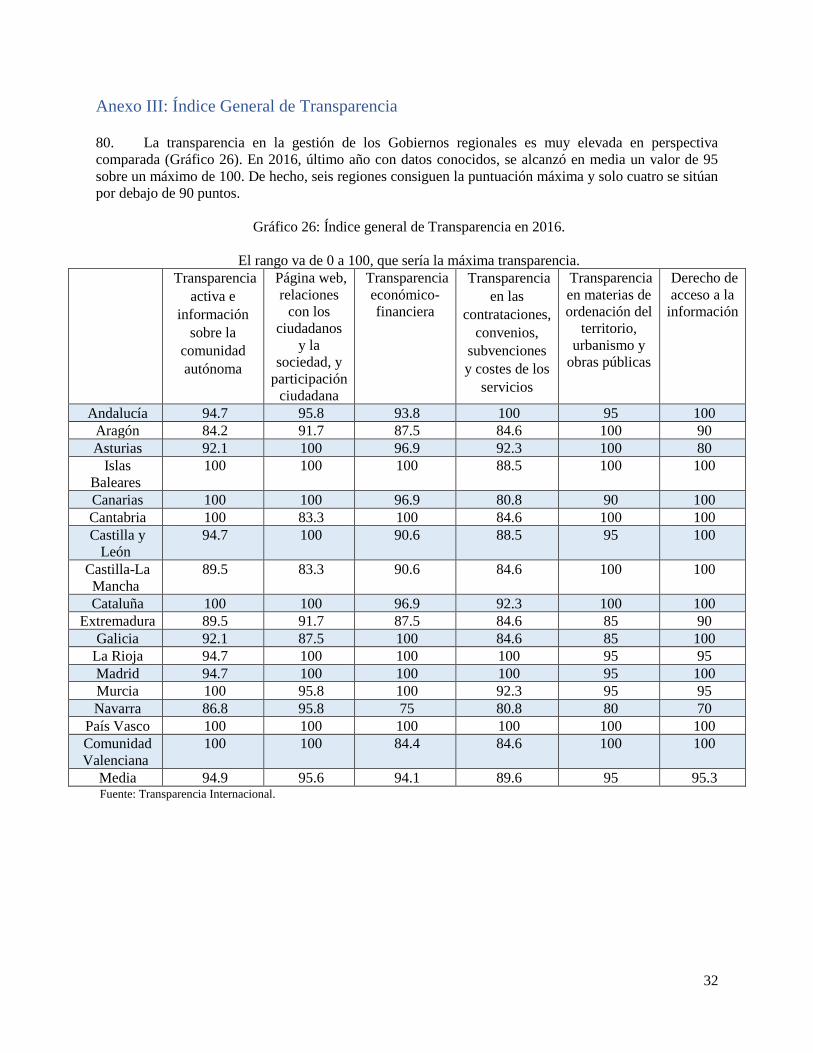
32
Anexo III: Índice General de Transparencia
80. La transparencia en la gestión de los Gobiernos regionales es muy elevada en perspectiva
comparada (Gráfico 26). En 2016, último año con datos conocidos, se alcanzó en media un valor de 95
sobre un máximo de 100. De hecho, seis regiones consiguen la puntuación máxima y solo cuatro se sitúan
por debajo de 90 puntos.
Gráfico 26: Índice general de Transparencia en 2016.
El rango va de 0 a 100, que sería la máxima transparencia. Transparencia
activa e
información
sobre la
comunidad
autónoma
Página web,
relaciones
con los
ciudadanos
y la
sociedad, y
participación
ciudadana
Transparencia
económico-
financiera
Transparencia
en las
contrataciones,
convenios,
subvenciones
y costes de los
servicios
Transparencia
en materias de
ordenación del
territorio,
urbanismo y
obras públicas
Derecho de
acceso a la
información
Andalucía 94.7 95.8 93.8 100 95 100
Aragón 84.2 91.7 87.5 84.6 100 90
Asturias 92.1 100 96.9 92.3 100 80
Islas
Baleares
100 100 100 88.5 100 100
Canarias 100 100 96.9 80.8 90 100
Cantabria 100 83.3 100 84.6 100 100
Castilla y
León
94.7 100 90.6 88.5 95 100
Castilla-La
Mancha
89.5 83.3 90.6 84.6 100 100
Cataluña 100 100 96.9 92.3 100 100
Extremadura 89.5 91.7 87.5 84.6 85 90
Galicia 92.1 87.5 100 84.6 85 100
La Rioja 94.7 100 100 100 95 95
Madrid 94.7 100 100 100 95 100
Murcia 100 95.8 100 92.3 95 95
Navarra 86.8 95.8 75 80.8 80 70
País Vasco 100 100 100 100 100 100
Comunidad
Valenciana
100 100 84.4 84.6 100 100
Media 94.9 95.6 94.1 89.6 95 95.3 Fuente: Transparencia Internacional.
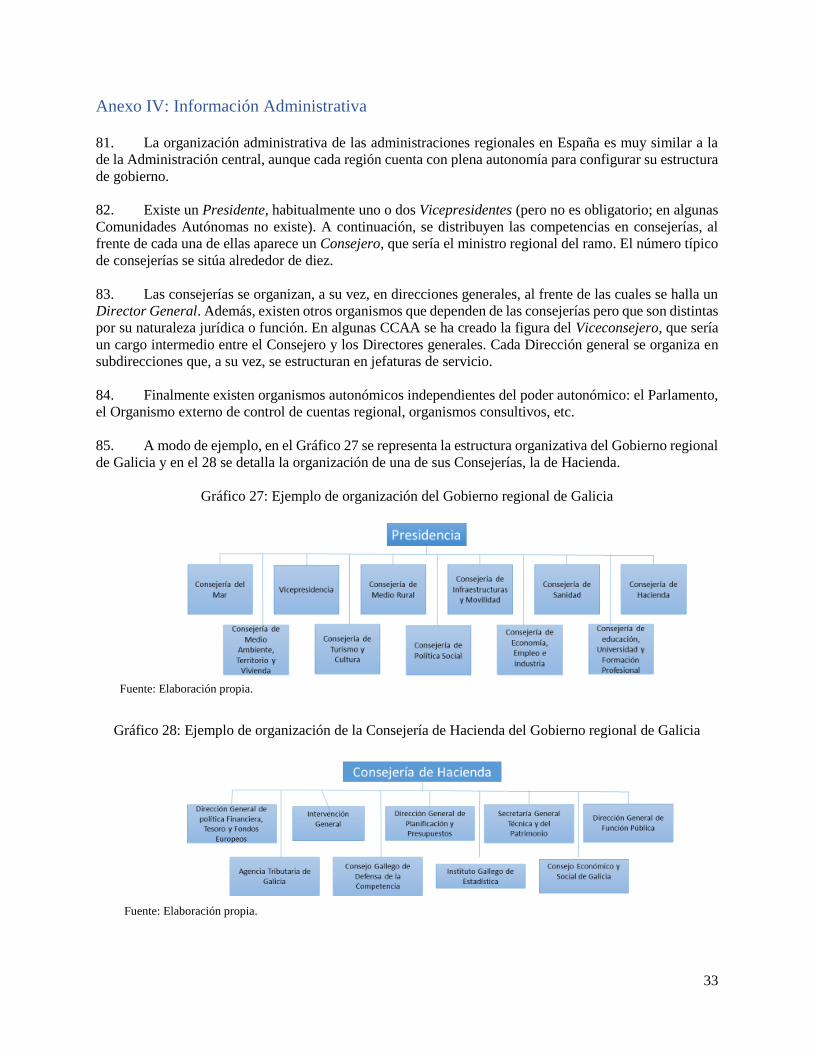
33
Anexo IV: Información Administrativa
81. La organización administrativa de las administraciones regionales en España es muy similar a la
de la Administración central, aunque cada región cuenta con plena autonomía para configurar su estructura
de gobierno.
82. Existe un Presidente, habitualmente uno o dos Vicepresidentes (pero no es obligatorio; en algunas
Comunidades Autónomas no existe). A continuación, se distribuyen las competencias en consejerías, al
frente de cada una de ellas aparece un Consejero, que sería el ministro regional del ramo. El número típico
de consejerías se sitúa alrededor de diez.
83. Las consejerías se organizan, a su vez, en direcciones generales, al frente de las cuales se halla un
Director General. Además, existen otros organismos que dependen de las consejerías pero que son distintas
por su naturaleza jurídica o función. En algunas CCAA se ha creado la figura del Viceconsejero, que sería
un cargo intermedio entre el Consejero y los Directores generales. Cada Dirección general se organiza en
subdirecciones que, a su vez, se estructuran en jefaturas de servicio.
84. Finalmente existen organismos autonómicos independientes del poder autonómico: el Parlamento,
el Organismo externo de control de cuentas regional, organismos consultivos, etc.
85. A modo de ejemplo, en el Gráfico 27 se representa la estructura organizativa del Gobierno regional
de Galicia y en el 28 se detalla la organización de una de sus Consejerías, la de Hacienda.
Gráfico 27: Ejemplo de organización del Gobierno regional de Galicia
Fuente: Elaboración propia.
Gráfico 28: Ejemplo de organización de la Consejería de Hacienda del Gobierno regional de Galicia
Fuente: Elaboración propia.
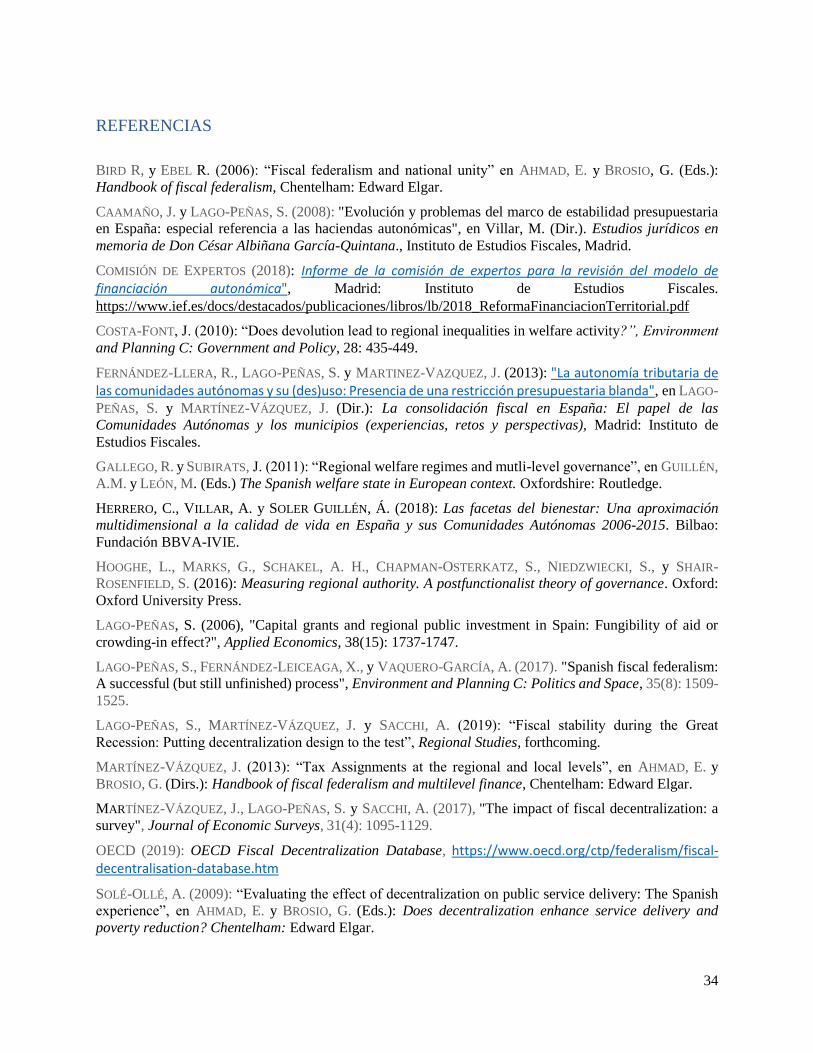
34
REFERENCIAS
BIRD R, y EBEL R. (2006): “Fiscal federalism and national unity” en AHMAD, E. y BROSIO, G. (Eds.):
Handbook of fiscal federalism, Chentelham: Edward Elgar.
CAAMAÑO, J. y LAGO-PEÑAS, S. (2008): "Evolución y problemas del marco de estabilidad presupuestaria
en España: especial referencia a las haciendas autonómicas", en Villar, M. (Dir.). Estudios jurídicos en
memoria de Don César Albiñana García-Quintana., Instituto de Estudios Fiscales, Madrid.
COMISIÓN DE EXPERTOS (2018): Informe de la comisión de expertos para la revisión del modelo de financiación autonómica", Madrid: Instituto de Estudios Fiscales.
https://www.ief.es/docs/destacados/publicaciones/libros/lb/2018_ReformaFinanciacionTerritorial.pdf
COSTA-FONT, J. (2010): “Does devolution lead to regional inequalities in welfare activity?”, Environment
and Planning C: Government and Policy, 28: 435-449.
FERNÁNDEZ-LLERA, R., LAGO-PEÑAS, S. y MARTINEZ-VAZQUEZ, J. (2013): "La autonomía tributaria de las comunidades autónomas y su (des)uso: Presencia de una restricción presupuestaria blanda", en LAGO-
PEÑAS, S. y MARTÍNEZ-VÁZQUEZ, J. (Dir.): La consolidación fiscal en España: El papel de las
Comunidades Autónomas y los municipios (experiencias, retos y perspectivas), Madrid: Instituto de
Estudios Fiscales.
GALLEGO, R. y SUBIRATS, J. (2011): “Regional welfare regimes and mutli-level governance”, en GUILLÉN,
A.M. y LEÓN, M. (Eds.) The Spanish welfare state in European context. Oxfordshire: Routledge.
HERRERO, C., VILLAR, A. y SOLER GUILLÉN, Á. (2018): Las facetas del bienestar: Una aproximación
multidimensional a la calidad de vida en España y sus Comunidades Autónomas 2006-2015. Bilbao:
Fundación BBVA-IVIE.
HOOGHE, L., MARKS, G., SCHAKEL, A. H., CHAPMAN-OSTERKATZ, S., NIEDZWIECKI, S., y SHAIR-
ROSENFIELD, S. (2016): Measuring regional authority. A postfunctionalist theory of governance. Oxford:
Oxford University Press.
LAGO-PEÑAS, S. (2006), "Capital grants and regional public investment in Spain: Fungibility of aid or
crowding-in effect?", Applied Economics, 38(15): 1737-1747.
LAGO-PEÑAS, S., FERNÁNDEZ-LEICEAGA, X., y VAQUERO-GARCÍA, A. (2017). "Spanish fiscal federalism:
A successful (but still unfinished) process", Environment and Planning C: Politics and Space, 35(8): 1509-
1525.
LAGO-PEÑAS, S., MARTÍNEZ-VÁZQUEZ, J. y SACCHI, A. (2019): “Fiscal stability during the Great
Recession: Putting decentralization design to the test”, Regional Studies, forthcoming.
MARTÍNEZ-VÁZQUEZ, J. (2013): “Tax Assignments at the regional and local levels”, en AHMAD, E. y
BROSIO, G. (Dirs.): Handbook of fiscal federalism and multilevel finance, Chentelham: Edward Elgar.
MARTÍNEZ-VÁZQUEZ, J., LAGO-PEÑAS, S. y SACCHI, A. (2017), "The impact of fiscal decentralization: a
survey", Journal of Economic Surveys, 31(4): 1095-1129.
OECD (2019): OECD Fiscal Decentralization Database, https://www.oecd.org/ctp/federalism/fiscal-decentralisation-database.htm
SOLÉ-OLLÉ, A. (2009): “Evaluating the effect of decentralization on public service delivery: The Spanish
experience”, en AHMAD, E. y BROSIO, G. (Eds.): Does decentralization enhance service delivery and
poverty reduction? Chentelham: Edward Elgar.

35
VON TRAPP, L. ; NICOL, S. ; FONTAINE, P. ; LAGO-PEÑAS, S. y SUYKER, W. (2017): OECD review of the
Independent Authority for Fiscal Responsibility (AIReF), París: OECD,
http://www.oecd.org/gov/budgeting/airef-review-en.pdf
ZABALZA, A. y LÓPEZ-LABORDA J. (2014): “The uneasy coexistence of the Spanish foral and common
regional finance systems”, Investigaciones Regionales, 37:119-152.
Related Documents