Cola Wars Continue Coke and Pepsi in 2006 Presented by- TEAM 6

Welcome message from author
This document is posted to help you gain knowledge. Please leave a comment to let me know what you think about it! Share it to your friends and learn new things together.
Transcript
Cola Wars Continue Coke and Pepsi in 2006
Presented by-TEAM 6
War over $66bn CSD industry
lasted from 1975-mid1990s
New Challenges
• Cola wars continued into the 21st century with new challenges–Was their era of sustained growth and
profitability coming to a close or was this slowdown just another blip in the course of the cola giants’ long and evitable history?
– Could they boost flagging domestic CSD sales?
–Would newly popular beverages provide them with new (and profitable) revenue streams?
Economics of the U.S. CSD industry
• Americans consumed 23 gallons of CSDs annually in 1970
• Consumption grew by 3% per year over the next 3 decades
• Increasing availability of CSDs and introduction of diet and flavored varieties
• Non-cola CSDs were introduced

Production & distribution of CSD• Concentrate producers • Bottlers • Retail channels • Suppliers

Concentrate Producer
• Blended raw material ingredients, packaged the mixture, shipped those container to the bottler.
• Key production investment areas - machinery, overhead and labor.• A typical manufacturing plant cost - $25 million to $50 million• CDA’s with retailers like Wal-Mart

Concentrate Producer• Significant costs
were for advertising, promotion, market research.
• Coca-Cola and Pepsi-Cola claimed a combined 74.8% of the U.S. CSD market in sales volume in 2004

Bottlers
• Purchased concentrate
• Added carbonated water and high-fructose corn syrup
• Bottled or canned the resulting CSD product
• Delivered it to customer account
Bottlers
• Bottling process is capital intensive.
• Packaging accounted for 40% to 45% of sales, same for concentrate and sweeteners for 5% to 10%.
• Coke and Pepsi bottlers offered “direct store door” delivery.
• Cooperative merchandizing agreements is a key ingredient of soft drink sales.
Profitability
• Concentrate producer earn more profit than bottler.
• Cost of sale is more in bottler.
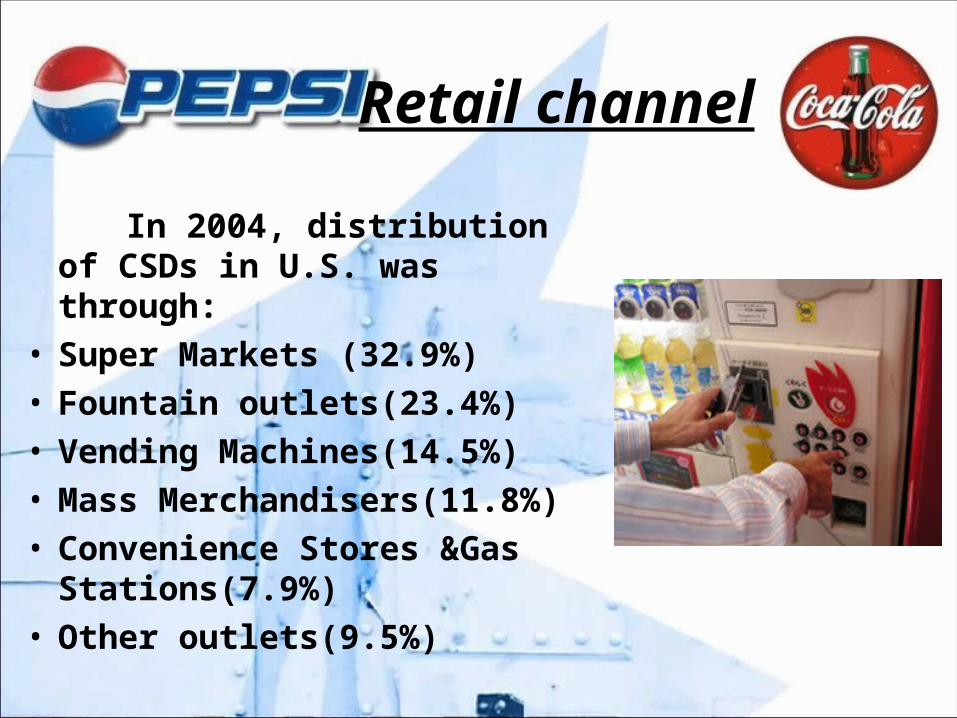
Retail channel
In 2004, distribution of CSDs in U.S. was through:
• Super Markets (32.9%)• Fountain outlets(23.4%)• Vending Machines(14.5%)• Mass
Merchandisers(11.8%) • Convenience Stores &Gas
Stations(7.9%)• Other outlets(9.5%)

Suppliers to Bottlers
• Coke and Pepsi were among the Metal Can industry’s largest customers.
• Major Can producers- Ball, Rexam, Crown Cork & Seal

EVOLUTION OF COKE
• Formulated in 1886 by John Pemberton, a pharmacist in Atlanta, Georgia
• Sold it at a drug store soda fountains as “ a potion for mental and physical disorders”
• In 1891, Asa Candler acquired the formula, established a sales force and began brand advertising
• The formula for Coca-Cola syrup known as “Merchandise 7X” remained a secret
• The rest is history
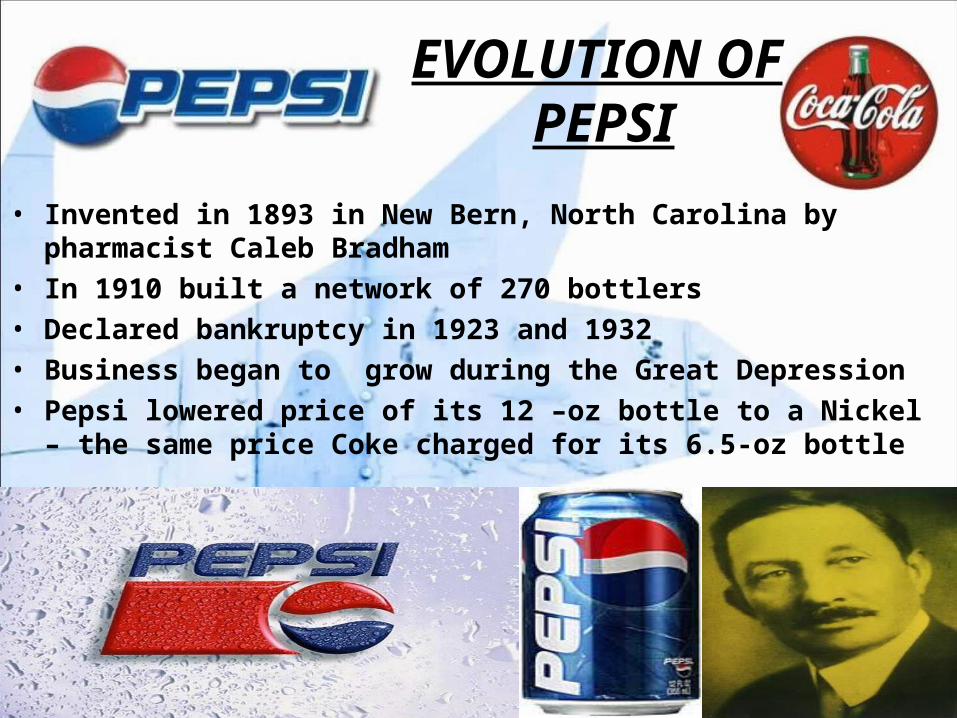
EVOLUTION OF PEPSI
• Invented in 1893 in New Bern, North Carolina by pharmacist Caleb Bradham
• In 1910 built a network of 270 bottlers• Declared bankruptcy in 1923 and 1932• Business began to grow during the Great Depression• Pepsi lowered price of its 12 –oz bottle to a Nickel –
the same price Coke charged for its 6.5-oz bottle
Cola War begins
• “Beat Coke”
• “Pepsi Generation”
• “Young At Heart.”
• Concentrate Price 20% Lower
• 1970 – Larger Bottlers
• “American’s preferred taste”
• “No wonder Coke refreshes best”
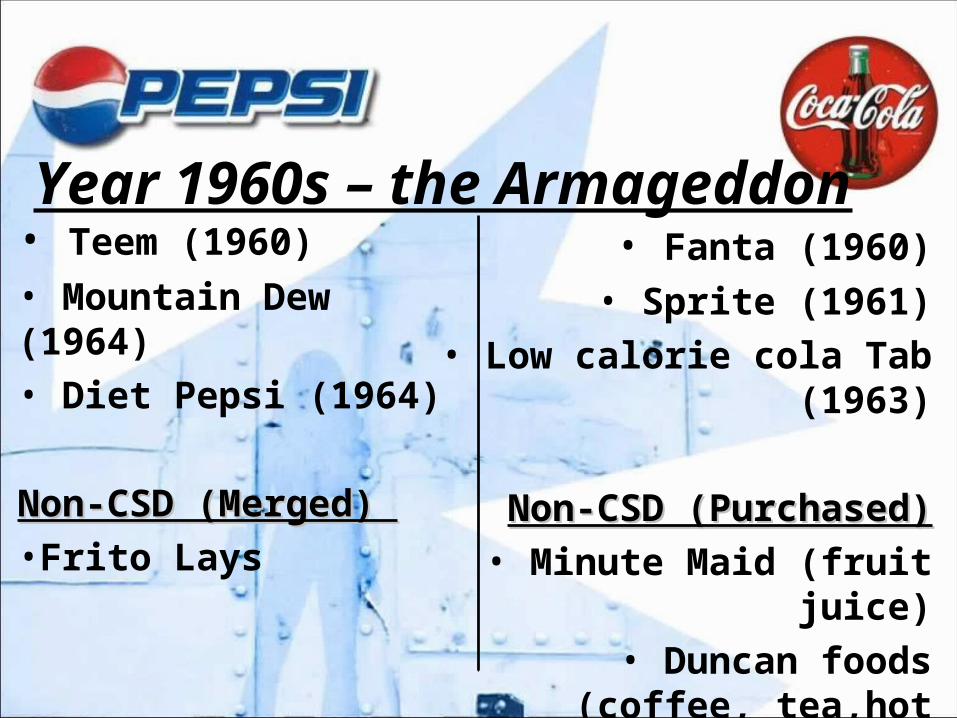
Year 1960s – the Armageddon• Fanta (1960)• Sprite (1961)
• Low calorie cola Tab (1963)
Non-CSD (Purchased)Non-CSD (Purchased)• Minute Maid (fruit
juice)• Duncan foods (coffee,
tea,hot chocolate)• Belmont Springs
water
• Teem (1960)• Mountain Dew (1964)• Diet Pepsi (1964)
Non-CSD (Merged) Non-CSD (Merged) •Frito Lays
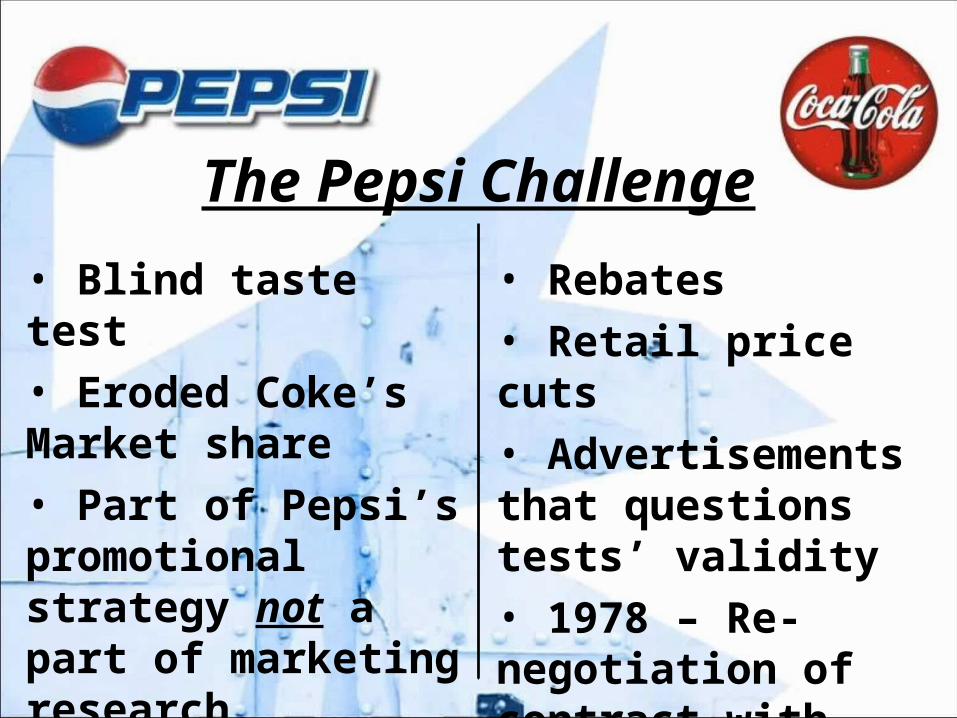
The Pepsi Challenge
• Blind taste test• Eroded Coke’s Market share• Part of Pepsi’s promotional strategy not a part of marketing research.
• Rebates• Retail price cuts• Advertisements that questions tests’ validity• 1978 – Re-negotiation of contract with franchisee bottlers
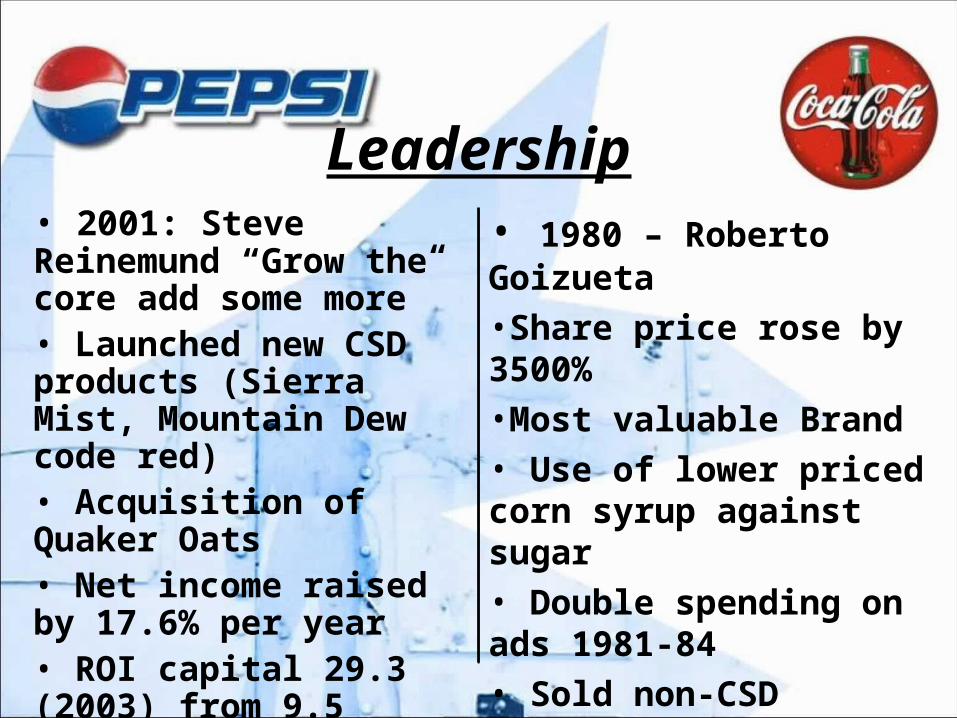
Leadership• 1980 – Roberto Goizueta•Share price rose by 3500%•Most valuable Brand• Use of lower priced corn syrup against sugar• Double spending on ads 1981-84• Sold non-CSD business• Diet Coke (1982)
• 2001: Steve Reinemund “Grow the core add some more”• Launched new CSD products (Sierra Mist, Mountain Dew code red)• Acquisition of Quaker Oats • Net income raised by 17.6% per year• ROI capital 29.3 (2003) from 9.5 (1996)
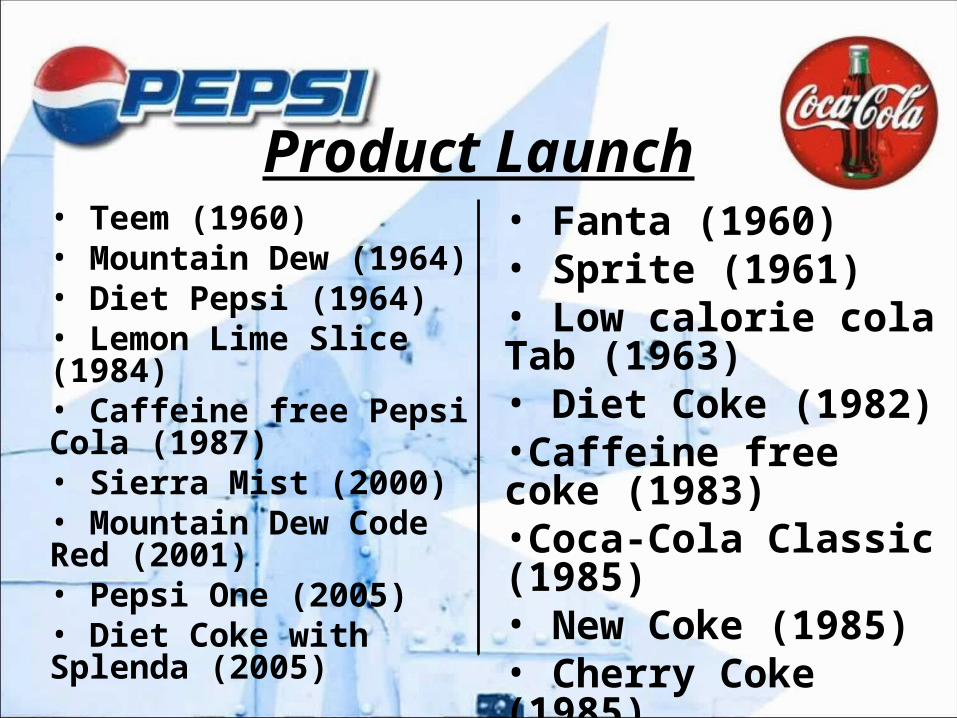
Product Launch• Teem (1960)• Mountain Dew (1964)• Diet Pepsi (1964)• Lemon Lime Slice (1984)• Caffeine free Pepsi Cola (1987)• Sierra Mist (2000)• Mountain Dew Code Red (2001)• Pepsi One (2005)• Diet Coke with Splenda (2005)
• Fanta (1960)• Sprite (1961)• Low calorie cola Tab (1963)• Diet Coke (1982)•Caffeine free coke (1983) •Coca-Cola Classic (1985)• New Coke (1985)• Cherry Coke (1985)• Sierra Mist Free (2004)• Coca-Cola Zero (2005)
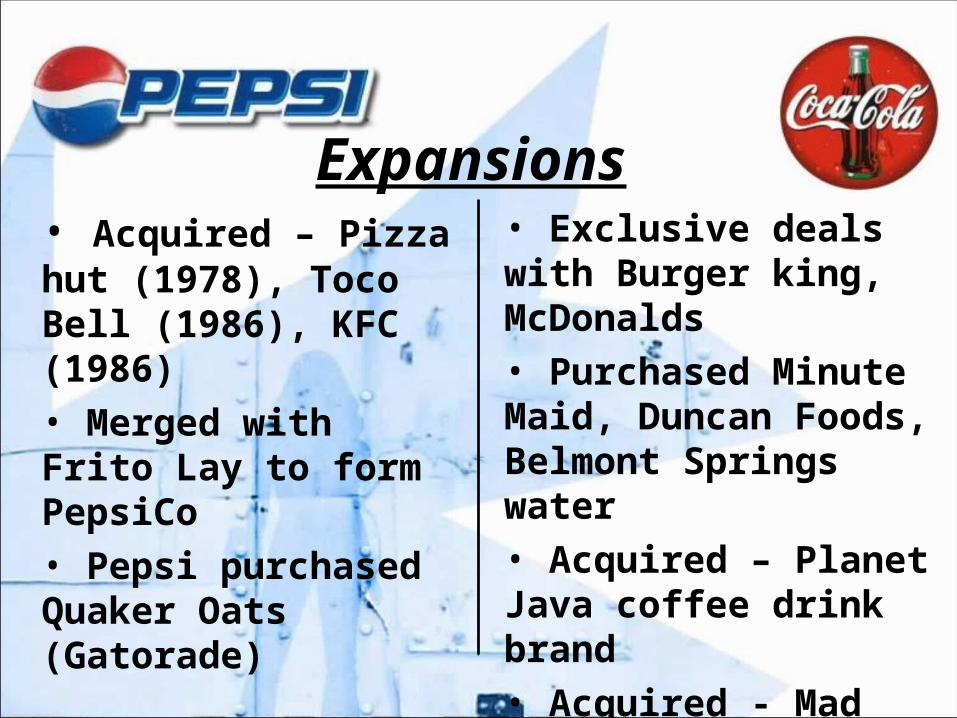
Expansions• Acquired – Pizza hut (1978), Toco Bell (1986), KFC (1986)• Merged with Frito Lay to form PepsiCo• Pepsi purchased Quaker Oats (Gatorade)
• Exclusive deals with Burger king, McDonalds• Purchased Minute Maid, Duncan Foods, Belmont Springs water• Acquired – Planet Java coffee drink brand• Acquired - Mad River juices and tea
Marketing Campaigns
• Pepsi generation• Young at heart• Pepsi challenge• Smart Spot – good for you
• Americans Preferred Taste• No wonder Coke refreshes best
Challenges to Pepsi
•Flat demand during 1998 to 2004.•Contamination scare at India•Obesity Issue•Challenges of Internationalization

Challenges to Coca-Cola• Performance & execution:
on providing alternative beverages on adjusting key strategic relationships, on cultivating international markets
• Currency crisis in Asia and Russia• Recall in Belgium – (public relations disaster)• Series of legal problems

1996-2004: Reversal Of Fortune
• Pepsi flourished• Acquisition of
Quaker oats• 3% growth
2004• Net income
rose by 17.6% per year
• ROI 29.3% from 9.5%(1996)
• Shareholders return 46%
• Coke struggled
• Flat growth• Annual
growth in net income falls to 4.2% from 18%(1990-96)
• Shareholders return -26%
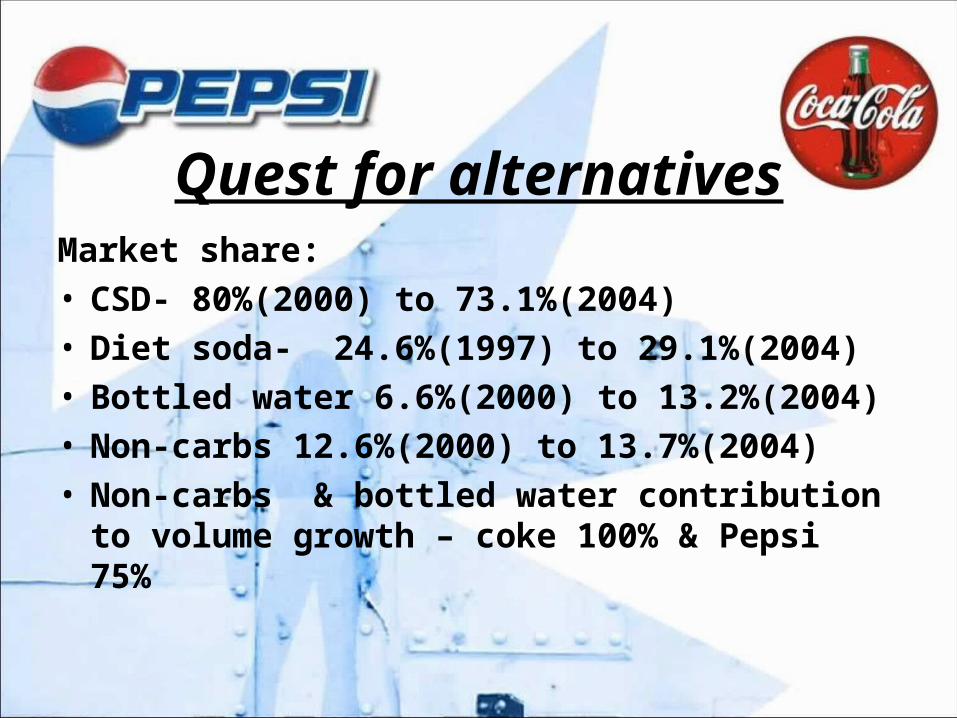
Quest for alternativesMarket share:• CSD- 80%(2000) to 73.1%(2004) • Diet soda- 24.6%(1997) to 29.1%(2004)• Bottled water 6.6%(2000) to 13.2%(2004)• Non-carbs 12.6%(2000) to 13.7%(2004)• Non-carbs & bottled water contribution to
volume growth – coke 100% & Pepsi 75%

Quest for alternatives• No longer
designing of marketing course
• Diet Pepsi, Pepsi One, Diet Coke with slpenda
• Diet Pepsi as flagship brand
• Non-CSD: total beverage company
• Reluctant to diversify
Evolving structures and strategies• System profitability• Price war• Low -cost strategy by the bottlers• Incidence pricing• Retailers resist price increases
(Wal-Mart)• Coke’s relationship with bottlers
like CCE was “Dysfunctional”

Internationalizing the Cola Wars• Next largest market: Mexico, Brazil, Germany,
China, and the United Kingdom • Asia and Eastern Europe• 837 eight ounce cans: 21 eight ounce cans• Coke’s dominance : Western Europe, much of Latin
America, while Pepsi :Middle East and Southeast Asia.
• Coca-Cola became synonymous with American culture.
• About 70% of Coke’s sales and about 80% of its profits came from outside the United States; only about one-third of Pepsi’s beverage sales took place overseas.
• Arab and Soviet exclusion of Coke
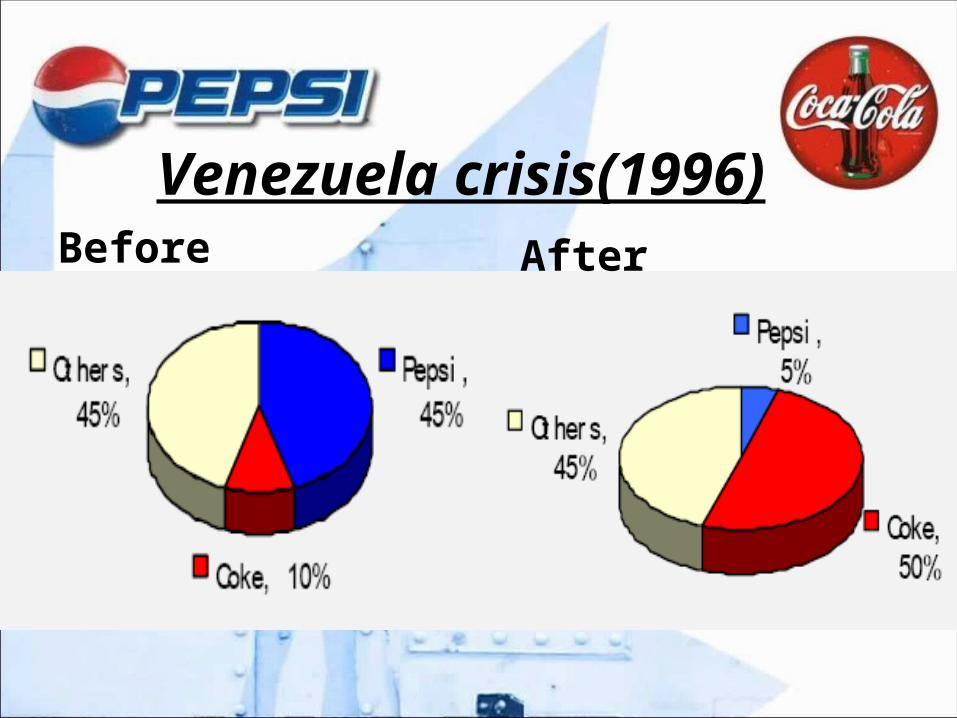
Venezuela crisis(1996) Before After
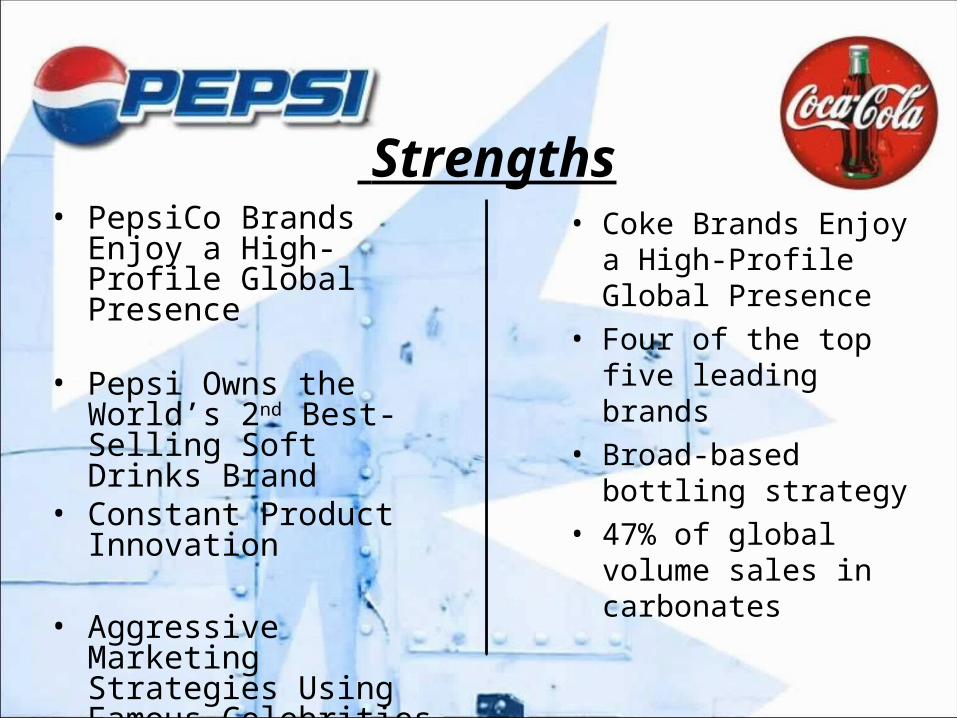
Strengths• Coke Brands Enjoy
a High-Profile Global Presence
• Four of the top five leading brands
• Broad-based bottling strategy
• 47% of global volume sales in carbonates
• PepsiCo Brands Enjoy a High-Profile Global Presence
• Pepsi Owns the World’s 2nd Best-Selling Soft Drinks Brand
• Constant Product Innovation
• Aggressive Marketing Strategies Using Famous Celebrities
• A Broad Portfolio of Products
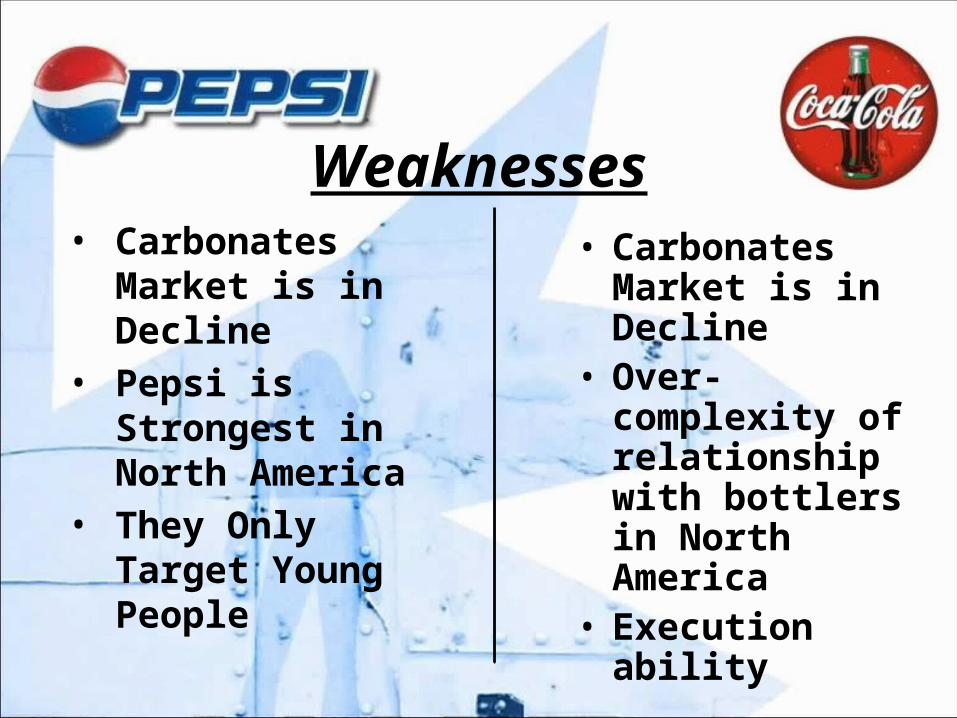
Weaknesses• Carbonates
Market is in Decline
• Over-complexity of relationship with bottlers in North America
• Execution ability
• Carbonates Market is in Decline
• Pepsi is Strongest in North America
• They Only Target Young People

Opportunities• Soft drinks volumes in
the Asia-Pacific region forecast to increase by over 45%
• Brands like Minute Maid Light and Minute Maid Premium Heart Wise are positioned well with the “Health-concerned” market
• Use distribution strengths in Eastern Europe and Latin America
• Increased Consumer Concerns with Regard to Drinking Water
• Growth in Healthier Beverages
• Growth in RTD Tea and Asian Beverages
• Growth in the Functional Drinks Industry
Threats• Growing "health-
conscience" society• PepsiCo’s
Gatorade, Tropicana and Aquafina are stronger brands
• Boycott in the Middle East
• Protest against Coke in India
• Negative publicity in WesternEurope
• Obesity and Health Concerns
• Coca-Cola Increases Marketing and Innovation Spending to $400M Globally
• Relying on North America only is Bad
Key Issues
Who has been losing?• Smaller Brands:• Because-Entry Barrier,
Duopoly
Who has been wining the war?
• 1950: Coke have 47% and Pepsi have 10%• 1970: Coke have 35% and Pepsi have 29%• 1990: Coke have 41% and Pepsi have 32%• 2000:Coke have 44%Pepsi have31.4% other beverage Cadbury
Schweppes 14.7%• 2006:Coke have 43.1% Pepsi have 31.7% Cadbury Schweppes
14.5%

Could they boost flagging domestic CSD sales?• Through Product innovation• Aggressive marketing and promotion• Packaging innovations
Key questions
Would newly popular beverages provide them with new (and profitable) revenue streams?• Yes• Non carb and Bottled water contribution to• Total volume growth: Coke-100%, Pepsi-75• Contamination issue, Obesity issueCan Coke and Pepsi sustain their profits in the wake of flattening demand and the growing popularity of non-CSDs?•Coke and Pepsi did not just inherit this business they created it. •By diversification.•Innovation : e.g diet coke

CURRENT UPDATES
PEPSI COCA-COLA
CEO INDRA K.NOOYI MUHTAR KENT
SHARE PRICE
NET OPERATING REVENUES (2008)(millions of $)
$43,251 $31,944
UPDATES

Thank youPresented By,
ShivappaGaneshSantanu
Vijay SavlaMahaveer
Related Documents