CMP-MIC 2006 Modeling Wafer Surface Damage Caused During CMP Terry A. Ring ◊ , Paul Feeney, Jaishankar Kasthurirangan, Shoutian Li, David Boldridge, James Dirksen ◊ Chemical Engineering Department 50 S. Central Campus Drive, MEB3 University of Utah Salt Lake City, UT 84112 www.che.utah.edu/~ring Cabot Microelectronics Corporation and 870 Commons Drive Aurora, IL 60504

CMP-MIC 2006 Modeling Wafer Surface Damage Caused During CMP Terry A. Ring ◊, Paul Feeney, Jaishankar Kasthurirangan, Shoutian Li, David Boldridge, James.
Dec 17, 2015
Welcome message from author
This document is posted to help you gain knowledge. Please leave a comment to let me know what you think about it! Share it to your friends and learn new things together.
Transcript
CMP-MIC 2006
Modeling Wafer Surface Damage Caused During CMP
Terry A. Ring◊, Paul Feeney, Jaishankar Kasthurirangan, Shoutian Li, David Boldridge,
James Dirksen
◊Chemical Engineering Department50 S. Central Campus Drive, MEB3290University of UtahSalt Lake City, UT 84112www.che.utah.edu/~ring
Cabot Microelectronics Corporation and
870 Commons DriveAurora, IL 60504
CMP-MIC 2006
Overview
• Description of Surface Damage– Fracture Mechanics
• Description of Surface Damage Experiments• Description of Surface Damage Model
– Two Simultaneous Population Balances• Under Wafer Impurity Particles• Surface Damage
• Comparison of Model with Experiments• Conclusions

CMP-MIC 2006
CL
CR
Plastic DamageBrittle Damage
Surface Damage•Indenter = Hard Impurity Particle
•Indenter Forced Into Surface•Indenter Dragged Across Surface
Plastic Deformation (Plow) Brittle Fracture gives Flakes

CMP-MIC 2006
Surface Damage
• ILD (PETEOS)• Failure by Brittle
Fracture
5 104
0.0010
50
100
150
200
250Borosilicate Glass
Elongation (or Strain)
Str
ess
(MP
a)
CMP-MIC 2006
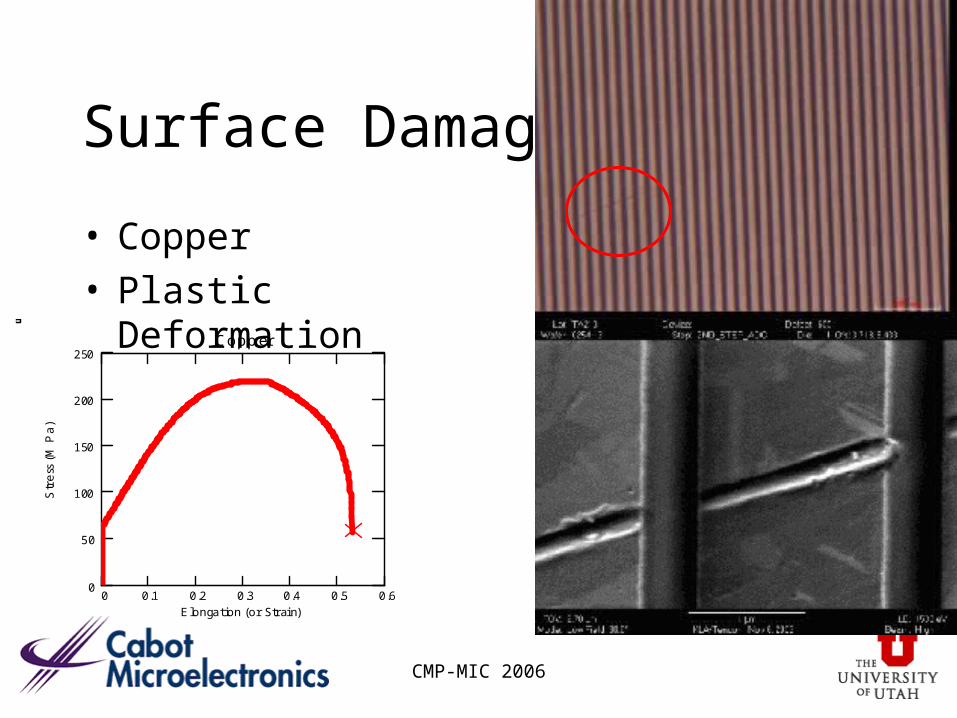
Surface Damage
• Copper• Plastic Deformation
0 0 .1 0 .2 0 .3 0 .4 0 .5 0 .60
50
100
150
200
250Co p p er
E longa tion (o r Str ain)
Str
ess
(M
Pa
)

CMP-MIC 2006
Surface Damage
• Copper• Plastic Deformation
0 0 .1 0 .2 0 .3 0 .4 0 .5 0 .60
50
100
150
200
250Co p p er
E longa tion (o r Str ain)
Str
ess
(M
Pa
)
Dp=1-2 micron

CMP-MIC 2006
Experiments
• Copper CMP – Copper Slurry
• Fumed SiO2 Abrasive
– Same Copper Slurry• With 0.07% wgt
• 1.1 m -Al2O3 particles
• ILD CMP– Copper Slurry
• Fumed SiO2 Abrasive
– Same Copper Slurry• With 0.07% wgt
• 1.1 m -Al2O3 particles
100 mm Blanket Wafers, 60 s polishing on a Logitech CDP polisher (Logitech Ltd., Glasgow, UK) with an A110 pad with CMC standard concentric grooving (30 mils x 10 mils x 80 mils)
0
2
4
6
8
10
12
14
16
0.1 1 10
Particle Dia. (micro-meter)
Dif
fere
nti
al N
um
ber
%
Series1
Series2
Series3
Series4
Series5

CMP-MIC 2006
Experimental Results – Candela Instruments
• PETEOS– Explosion of Brittle
Fractures
• Copper– Explosion of Surface Damage
• Plow Lines
• Rolling Indenter
1
10
100
1000
10000
100000
50 100 200 500 1000
Size (micron)
Nu
mb
er o
f S
crat
ches
SiO2-1 SiO2-2
1
10
100
1000
10000
100000
50 100 200 500 1000
Size (micron)
Nu
mb
er o
f S
crat
ches
Cu-1 Cu-2 Theory
CMP-MIC 2006
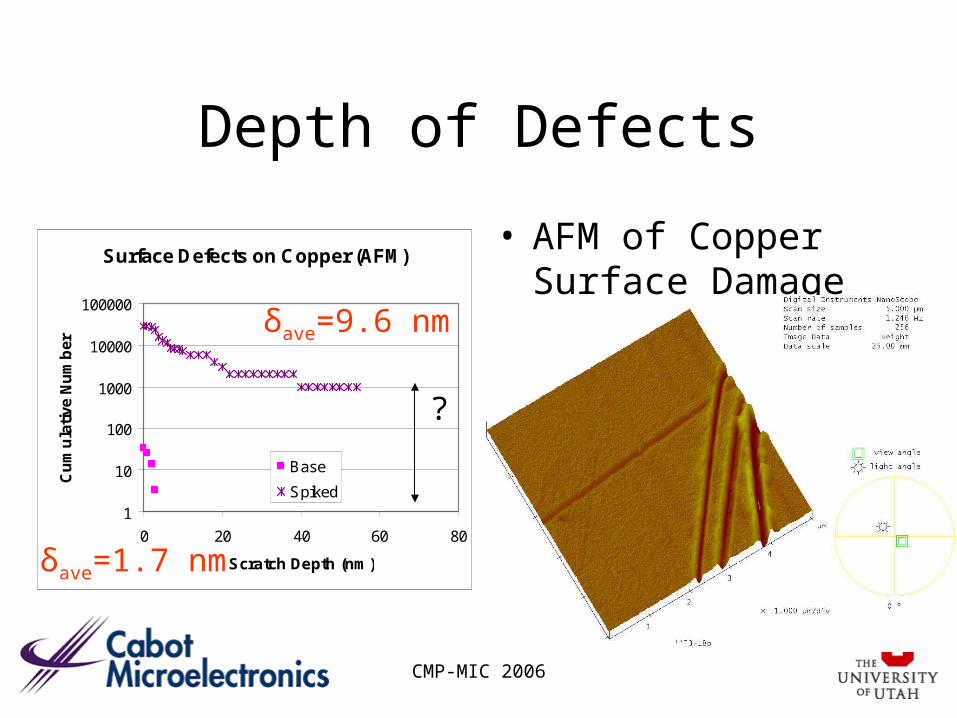
Surface Defects on Copper (AFM)
1
10
100
1000
10000
100000
0 20 40 60 80
Scratch Depth (nm)
Cu
mu
lati
ve N
um
ber
Base
Spiked
Depth of Defects
• AFM of Copper Surface Damage
δave=9.6 nm
δave=1.7 nm
?

CMP-MIC 2006
Model Equations-1
• 1) Surface Damage type=i; surface material=j,
• Population No./cm2
• Population Balance of Surface Damage
02_ )(
# dcm
N sTs
Removal Generation Uncovery
ts_i t d
dRRj
s_i t d
d kij
i
I
i
t
UR t
s
s=/i
Impurity Particles

CMP-MIC 2006
Surface Damage Results
• Evolution of the Initial Size Distribution of Scratches with time, RRo=-400 nm/s, UR=0, PR=0.
0.01 0.1 1 10 100 1 1030
0.001
0.002
0.003
0.004
0.005
Scratch size (nm)
Differen
tial N
um
ber D
istribution
i 10
i
102
0.01 0.1 1 10 100 1 1031 10
71 10
61 10
51 10
4
1 103
0.01
0.1
1
Time (s)
Num
ber o
f Scr
atch
es
Time
Total Number density of Scratches
CMP-MIC 2006
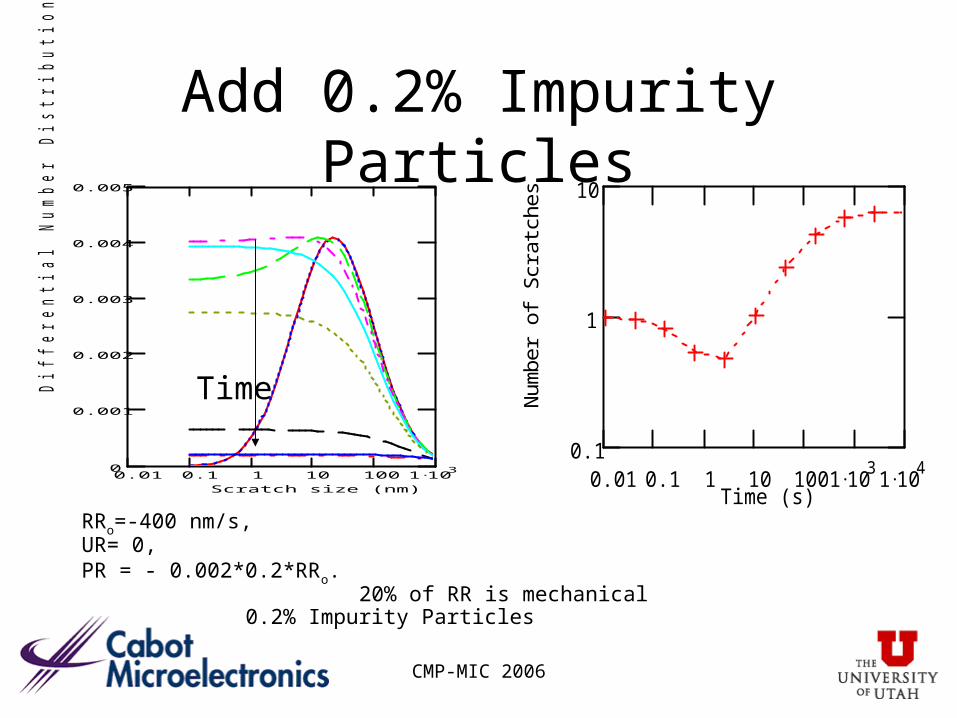
Add 0.2% Impurity Particles
RRo=-400 nm/s,UR= 0, PR = - 0.002*0.2*RRo. 20% of RR is mechanical 0.2% Impurity Particles
0.01 0.1 1 10 100 1 1030
0.001
0.002
0.003
0.004
0.005
Scratch size (nm)
Differen
tial N
um
ber D
istribution i 10
i
102
0.01 0.1 1 10 100 1 103
1 104
0.1
1
10
Time (s)
Num
ber o
f Scr
atch
es
Time
CMP-MIC 2006
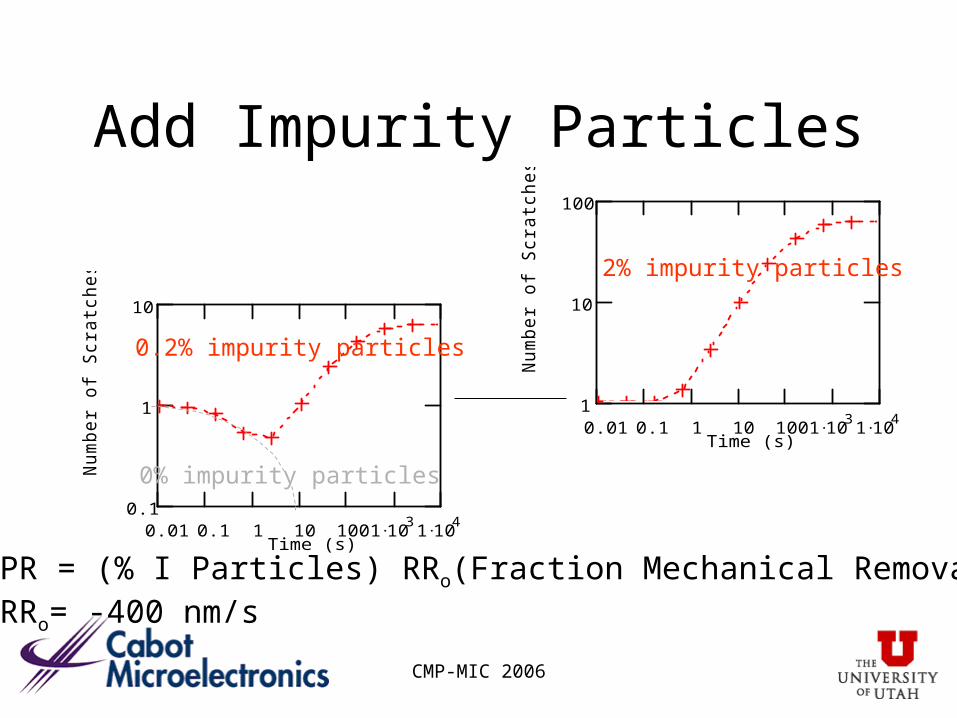
Add Impurity Particlesi 10
i
102
0.01 0.1 1 10 100 1 103
1 104
1
10
100
Time (s)
Nu
mbe
r of
Scr
atch
es
i 10
i
102
0.01 0.1 1 10 100 1 103
1 104
0.1
1
10
Time (s)
Nu
mb
er o
f S
crat
ches
2% impurity particles
0.2% impurity particles
0% impurity particles
PR = (% I Particles) RRo(Fraction Mechanical Removal)RRo= -400 nm/s

CMP-MIC 2006
Uncover of Pores with Scratch Production
• Total Number of Scratches as a Function of Polishing Time, RRo= -400 nm/s, UR= -RRo commencing at 5 s and continuing until the 4,000 nm pores are uncovered, PR = - 0.02*0.2*RRo.
i 10
i
102
0.01 0.1 1 10 1001 1031 10
41 10
50.1
1
10
100
1 103
1 104
Time (s)
Num
ber o
f Scra
tches
w/o uncovery
w uncovery
s
s=/i
s
Pore

CMP-MIC 2006
Surface Damage Model Conclusions
• Dynamic Population Balance Model of Scratches has been developed– With simple models for RR, PR and UR– Results are Expected
• Starting with a large population of surface scratches
– Low PR results in decreased number of scratches
– High PR results in increased number of scratches
• Uncover of pores is a temporal problem

CMP-MIC 2006
Model Equations-2
• 2) Impurity Particle Population No./mL
• Under Wafer Impurity Particle Population Balance
0
),()( dststN IT
Dissolution Inflow Outflow Production Removal by Grooves
t I s t( )d
dD
s I s t( )d
d
I_in s t( )
I s t( )
s( ) I s t( ) 1 s( ) I s t( ) 0
CMP-MIC 2006
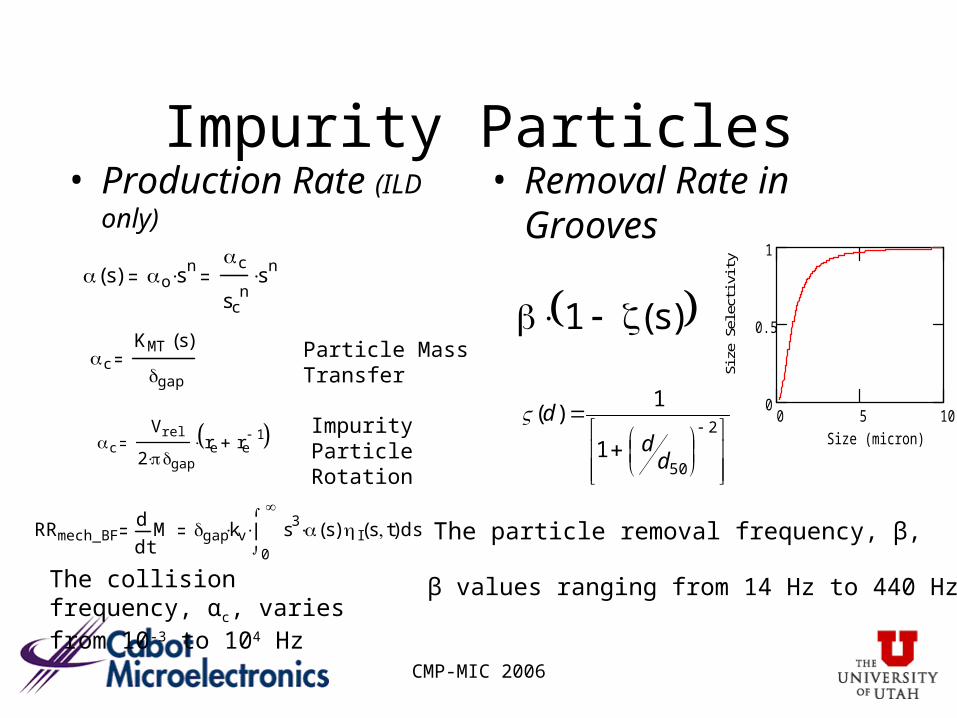
Impurity Particles• Production Rate (ILD only) • Removal Rate in
Grooves s( ) o s n
c
scn
s n
RRmech_BFtMd
dgap kv
0
ss3 s( ) I s t( )
d
c
KMT s( )
gap
c
Vrel
2 gap
re re1
2
501
1)(
dd
d
1 s( )
The collision frequency, αc, varies from 10-3 to 104 Hz
The particle removal frequency, β,
β values ranging from 14 Hz to 440 Hz.
Impurity Particle Rotation
Particle Mass Transfer
0 5 100
0.5
1
Size (micron)
Size
Sele
ctivi
ty

CMP-MIC 2006
Size of scratch debris particles (red line) versus the size of the
indenter causing the damage to the wafer surface (ILD).
12
Evans, A.G. and Marshall, D.B. Fundamentals of Friction and Wear of Materials, (ASM: 1980), p. 441
s
α(s)
0 0.5 1 1.5 20
0.5
1
1.5
2
Size of Indenter (micron)
Siz
e of
Scr
atch
Deb
ris
(mic
ron)
1/8 Results
Pointed Particle with 1/10th radius of curvature
Flake
n=1

CMP-MIC 2006
Flow in Grooves
Velocity Vectors for Flow of Slurry in Groove, Vrel= 1 m/s
Particle Trajectories for Flow of Slurry in Groove, Vrel= 1 m/s

CMP-MIC 2006
Solution for Impurity Particles
• Impurity Particle Population Balance
• Separation of Variables
• Solve for functions individually • Initial Condition
t I s t( )d
dD
L I s t( )d
d
I_in s t( )
I s t( )
s( ) I s t( ) 1 s( ) I s t( ) 0
I s t( ) t( ) s( )
I s t 0( )No
so
exps
so
CMP-MIC 2006
Solution for Impurity Particles
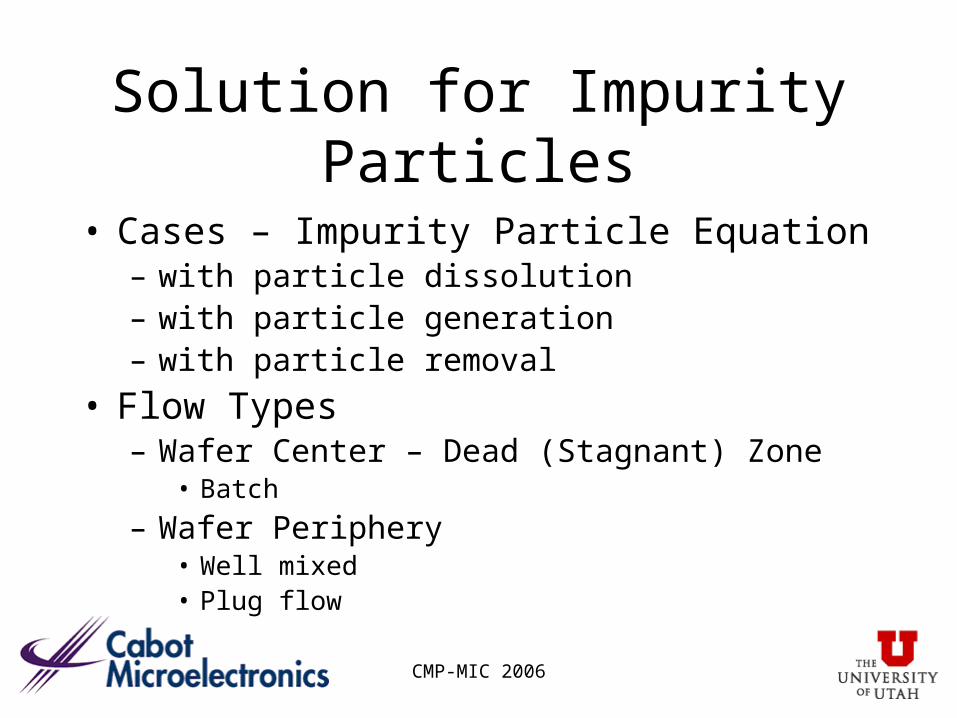
• Cases – Impurity Particle Equation– with particle dissolution– with particle generation– with particle removal
• Flow Types– Wafer Center – Dead (Stagnant) Zone
• Batch
– Wafer Periphery• Well mixed• Plug flow

CMP-MIC 2006
Impurity Particles - Stagnant Zone• Analytical Solutions• Stagnant Zone – dissolution + generation, n=0
• Stagnant Zone – dissolution + generation
• Stagnant Zone – dissolution + generation + Groove removal
I s t( )No
so
expo s n 1( ) so s D n s D
s so n 1( ) t
exps
so
I s t( )N o
s o
exp
o s n 1( ) s o d 50 atans
d 50
s o n 1( ) s D n 1( )
s s o n 1( ) t
exps
s o
I s t( )No
so
expD
so
c
t
exps
so

CMP-MIC 2006
Stagnant Zone – dissolution
Plot of impurity particle population with time for the conditions, n = 0, αc = 10-4 Hz, sc= 500 nm, D = 30
nm/s, No=1/mL, so=103nm. ηI_o(s) is given by the red
solid line, the population ηI(s,t) is given by all the other
lines with the dotted blue line for t = 0.1 τ, the dashed green line for t = 2 τ, the dot-dash magenta line for t = 4 τ, the dotted cyan line for t = 6 τ, the dotted brown line for t = 8 τ, the dashed black line for t = 10 τ, the dot-dash red line for t = 12 τ and the solid blue line for t = 14 τ where τ = 10 s. Scratch Debris Batch-2.mcd.
Impurity Particles
2000 4000 6000 8000 1 104
1
10
100
1 103
1 104
1 105
1 106
1 107
1 108
1 109
1 1010
1 1011
1 1012
1 1013
1 1014
1 1015
1 1016
Prime
Size of Impurity Particles (nm)
Impu
rity
Pop
ulat
ion
Den
sity
(#/
m^3
/m)
CMP-MIC 2006
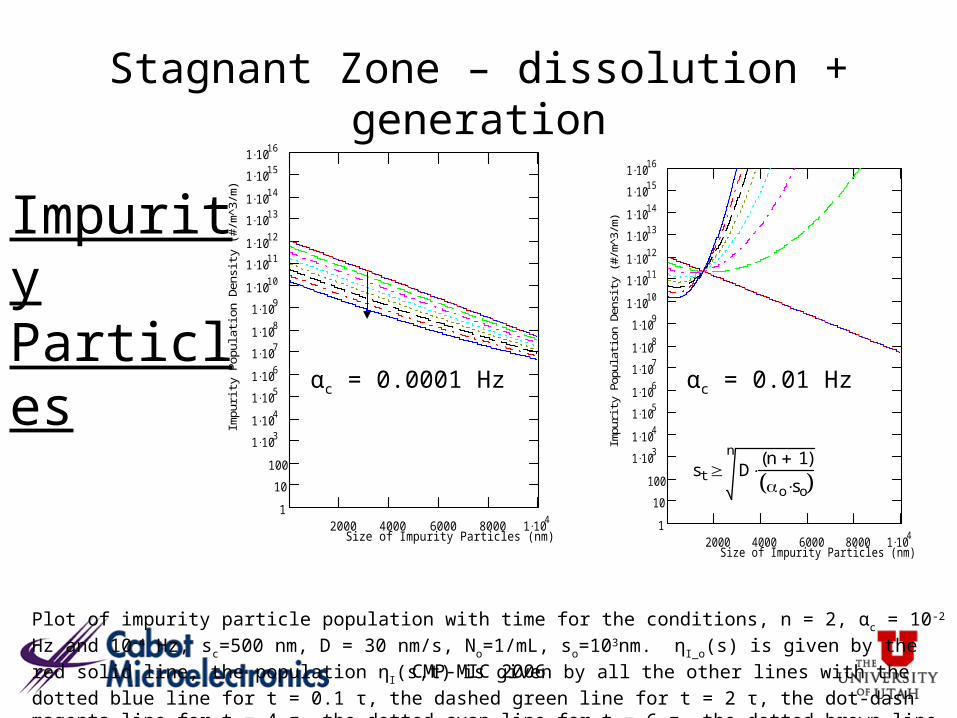
Stagnant Zone – dissolution + generation
Plot of impurity particle population with time for the conditions, n = 2, αc = 10-2 Hz and 10-4 Hz, sc=500 nm, D =
30 nm/s, No=1/mL, so=103nm. ηI_o(s) is given by the red solid line, the population η I(s,t) is given by all the other
lines with the dotted blue line for t = 0.1 τ, the dashed green line for t = 2 τ, the dot-dash magenta line for t = 4 τ, the dotted cyan line for t = 6 τ, the dotted brown line for t = 8 τ, the dashed black line for t = 10 τ, the dot-dash red line for t = 12 τ and the solid blue line for t = 14 τ where τ = 10 s. Scratch Debris Batch-2.mcd.
s t
n
Dn 1( )
o so
Impurity Particles
2000 4000 6000 8000 1 104
1
10
100
1 103
1 104
1 105
1 106
1 107
1 108
1 109
1 1010
1 1011
1 1012
1 1013
1 1014
1 1015
1 1016
Size of Impurity Particles (nm)
Impu
rity
Popu
latio
n D
ensi
ty (#
/m^3
/m)
2000 4000 6000 8000 1 104
1
10
100
1 103
1 104
1 105
1 106
1 107
1 108
1 109
1 1010
1 1011
1 1012
1 1013
1 1014
1 1015
1 1016
Size of Impurity Particles (nm)
Impu
rity
Popu
latio
n D
ensi
ty (#
/m^3
/m)
αc = 0.0001 Hz αc = 0.01 Hz

CMP-MIC 2006
Stagnant Zone – dissolution + generation + groove removal
Plot of groove enhanced impurity particle population with time for the conditions, β = 1 Hz (A) and 10 Hz (B), d50= 1000 nm, n = 2, αc = 10-4 Hz, sc=500nm, D = 30 nm/s, No=1/mL, so=103nm. ηI_o(s) is given by the red solid
line, the population ηI(s,t) is given by all the other lines with the dotted blue line for t = 0.1 τ, the dashed green
line for t = 2 τ, the dot-dash magenta line for t = 4 τ, the dotted cyan line for t = 6 τ, the dotted brown line for t = 8 τ, the dashed black line for t = 10 τ, the dot-dash red line for t = 12 τ and the solid blue line for t = 14 τ where τ = 10 s. Scratch Debris Batch-2.mcd.
2000 4000 6000 8000 1 104
1
10
100
1 103
1 104
1 105
1 106
1 107
1 108
1 109
1 1010
1 1011
1 1012
1 1013
1 1014
1 1015
1 1016
Size of Impurity Particles (nm)
Impu
rity
Pop
ulat
ion
Den
sity
(#/
m^3
/m)
2000 4000 6000 8000 1 104
1
10
100
1 103
1 104
1 105
1 106
1 107
1 108
1 109
1 1010
1 1011
1 1012
1 1013
1 1014
1 1015
1 1016
Size of Impurity Particles (nm)
Impu
rity
Pop
ulat
ion
Den
sity
(#/
m^3
/m) =1 Hz =10 Hz
αc = 0.00001 Hz

CMP-MIC 2006
Conclusions-Impurity Particle Model
• When Impurity Particle Production Rate is Dominant– Explosion of Impurity Particles
• When Impurity Particle Removal Rate is Dominant– Decreasing Population of Under Wafer
Impurity Particles

CMP-MIC 2006
Apply to Several Types of Surface Damage
• ILD– Brittle Fracture
• Copper– Plastic Plow
– Rolling Indenter
• One Equation for Each type of Surface Damage
CMP-MIC 2006
Surface Damage
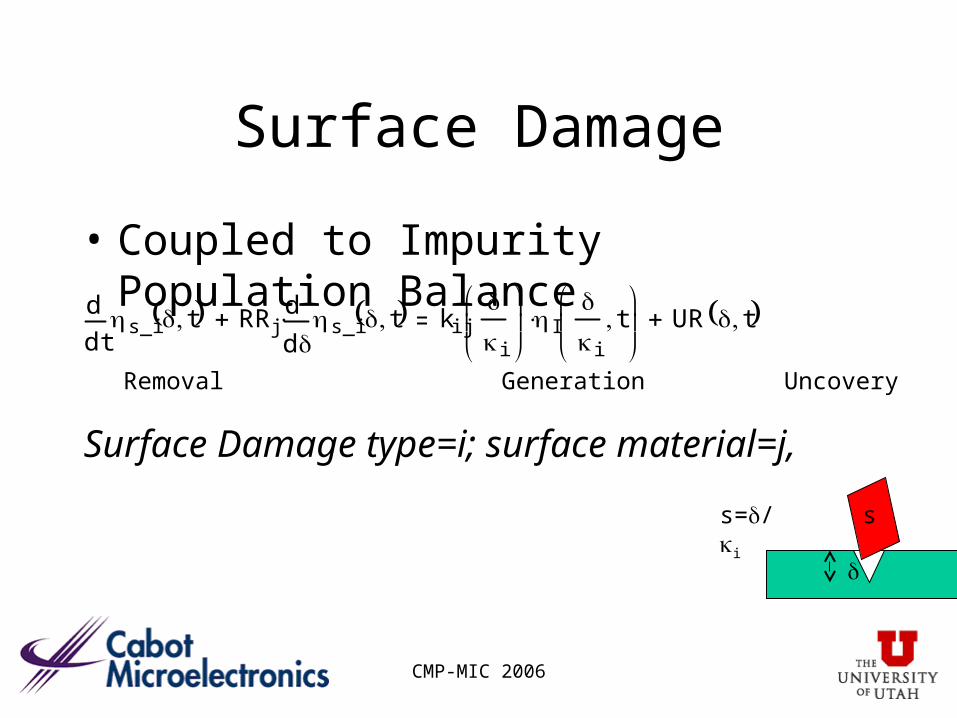
• Coupled to Impurity Population Balance
Removal Generation Uncovery
ts_i t d
dRRj
s_i t d
d kij
i
I
i
t
UR t
Surface Damage type=i; surface material=j,
ss=/i

CMP-MIC 2006
0 1 2 30
500
1000
1500
2000Copper Surface Damage Depth
Size of Particle Causing Damage (micron)
Dep
th o
f S
urfa
ce D
amag
e (n
m)
x 10 nm 20 nm 3000nm
0 1 2 30
100
200
300
400
500ILD Surface Damage Depth
Size of Particle Causing Damage (micron)
Dep
th o
f S
urfa
ce D
amag
e (n
m)
Scratch Depth
κκ
δ
δ
ss
Particle Pressed into Pad Asperity by Wafer Surface
CMP-MIC 2006
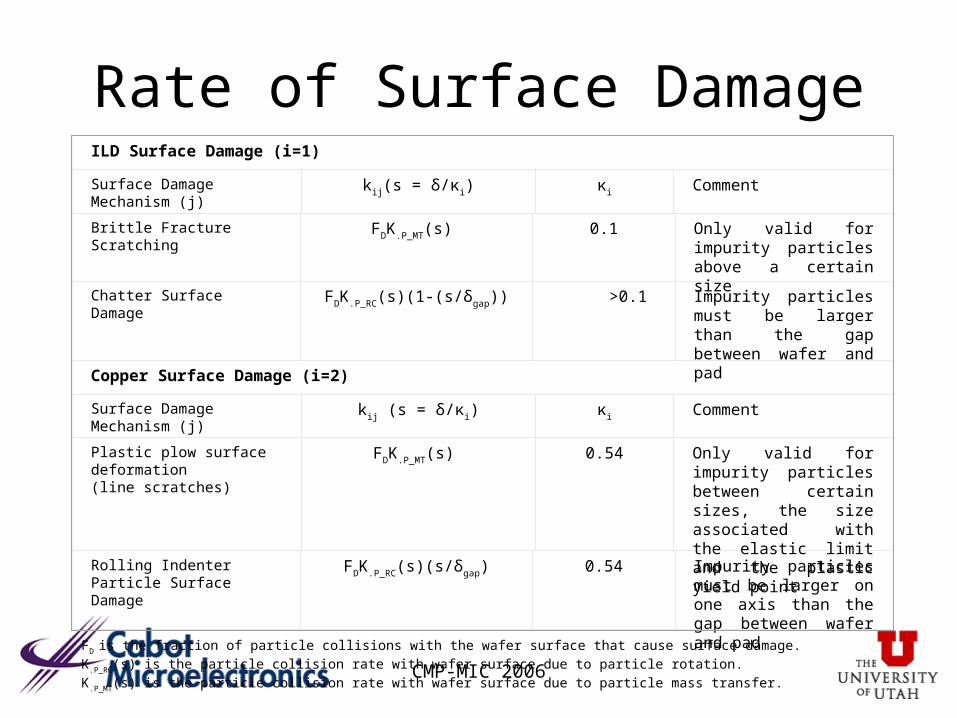
Rate of Surface Damage
FD is the fraction of particle collisions with the wafer surface that cause surface damage.
K.P_RC(s) is the particle collision rate with wafer surface due to particle rotation.
K.P_MT(s) is the particle collision rate with wafer surface due to particle mass transfer.
ILD Surface Damage (i=1)
Surface Damage Mechanism (j)
kij(s = δ/κi) κi Comment
Brittle Fracture Scratching FDK.P_MT(s) 0.1 Only valid for impurity particles above a certain size
Chatter Surface Damage FDK.P_RC(s)(1-(s/δgap)) >0.1 Impurity particles must be larger than the gap between wafer and pad
Copper Surface Damage (i=2)
Surface Damage Mechanism (j)
kij (s = δ/κi) κi Comment
Plastic plow surface deformation (line scratches)
FDK.P_MT(s) 0.54 Only valid for impurity particles between certain sizes, the size associated with the elastic limit and the plastic yield point
Rolling Indenter Particle Surface Damage
FDK.P_RC(s)(s/δgap) 0.54 Impurity particles must be larger on one axis than the gap between wafer and pad

CMP-MIC 2006
StagnantZone w/o Grooves
Stagnant Zone for Pad Without Grooves
A 10 100 1 10
31 10
41 10
101 1091 1081 1071 1061 1051 1041 1030.010.1
110
1001 10
31 1041 1051 1061 1071 1081 1091 10
101 10111 10121 10131 10141 10151 10161 10171 10181 10191 1020
Cu - Line Scratch
Size (nm)
Popu
latio
n of
Sur
face
Dam
age(
#/m
^3)
B 10 100 1 10
31 10
41 10
101 1091 1081 1071 1061 1051 1041 1030.010.1
110
1001 10
31 1041 1051 1061 1071 1081 1091 10
101 10111 10121 10131 10141 10151 10161 10171 10181 10191 1020
Cu - Rolling Particle Indenter
Size (nm)
Popu
latio
n of
Sur
face
Dam
age(
#/m
^3)
C 10 100 1 10
31 10
41 10
6
1 107
1 108
1 109
1 1010
1 1011
1 1012
1 1013
1 1014
1 1015
1 1016
1 1017
1 1018
1 1019
1 1020
BSG - Surface Damage
Size (nm)
Popu
latio
n of
Sur
face
Dam
age(
#/m
^3)
D
10 100 1 103
1 104
1
10
100
1 103
1 104
1 105
1 106
1 107
1 108
1 109
1 1010
1 1011
1 1012
1 1013
1 1014
1 1015
1 1016
Impurity Particles
Size (nm)
Po
pu
latio
n o
f Im
pu
rity
Par
ticle
s(#
/m^4
)
D 10 nm 9.896 10111
m4

CMP-MIC 2006
Stagnant Zone w Grooves
Stagnant Zone for Pad With Grooves
A10 100 1 10
31 10
41 10
101 1091 1081 1071 1061 1051 1041 1030.010.1
110
1001 10
31 1041 1051 1061 1071 1081 1091 10
101 10111 10121 10131 10141 10151 10161 10171 10181 10191 1020
Cu - L ine Scratch
Size (nm)
Popu
latio
n of
Sur
face
Dam
age(
#/m
^3)
B 10 100 1 10
31 10
41 10
101 1091 1081 1071 1061 1051 1041 1030.010.1
110
1001 10
31 1041 1051 1061 1071 1081 1091 10
101 10111 10121 10131 10141 10151 10161 10171 10181 10191 1020
Cu - Rolling Partic le Indenter
Size (nm)
Popu
latio
n of
Sur
face
Dam
age(
#/m
^3)
C 10 100 1 10
31 10
41 10
6
1 107
1 108
1 109
1 1010
1 1011
1 1012
1 1013
1 1014
1 1015
1 1016
1 1017
1 1018
1 1019
1 1020
BSG - Surface Damage
Size (nm)
Pop
ula
tion
of Sur
face
Dam
age(
#/m
^3)
D
10 100 1 103
1 104
1
10
100
1 103
1 104
1 105
1 106
1 107
1 108
1 109
1 1010
1 1011
1 1012
1 1013
1 1014
1 1015
1 1016
Impurity Particles
Size (nm)
Popu
latio
n of
Impu
rity
Parti
cles
(#/m
^4)
RRMech_BF0
t '0
x'o x'n x'3 D x' t'( )
d
d

CMP-MIC 2006
Peripheral (CSTR) w/o Grooves
Peripheral Zone for Pad Without Grooves and well-mixed flow
A10 100 1 10
31 10
41 10
101 1091 1081 1071 1061 1051 1041 1030.010.1
110
1001 10
31 1041 1051 1061 1071 1081 1091 10
101 10111 10121 10131 10141 10151 10161 10171 10181 10191 1020
Cu - Line Scratches
Size (nm)
Popu
latio
n of
Sur
face
Dam
age(
#/m
^3)
B10 100 1 10
31 10
41 10
101 1091 1081 1071 1061 1051 1041 1030.010.1
110
1001 10
31 1041 1051 1061 1071 1081 1091 10
101 10111 10121 10131 10141 10151 10161 10171 10181 10191 1020
Cu - Rolling Particle Indenter
Size (nm)
Popu
latio
n of
Sur
face
Dam
age(
#/m
^3)
C10 100 1 10
31 10
41 10
101 1091 1081 1071 1061 1051 1041 1030.010.1
110
1001 10
31 1041 1051 1061 1071 1081 1091 10
101 10111 10121 10131 10141 10151 10161 10171 10181 10191 1020
BSG - Surface Damage
Size (nm)
Popu
latio
n of
Sur
face
Dam
age(
#/m
^3)
D
1 0 1 0 0 1 1 03
1 1 04
1
1 0
1 0 0
1 1 03
1 1 04
1 1 05
1 1 06
1 1 07
1 1 08
1 1 09
1 1 010
1 1 011
1 1 012
1 1 013
1 1 014
1 1 015
1 1 016
Impurity Particles
Size (n m)
Po
pu
latio
n o
f Im
pu
rity
Par
ticle
s(#
/m^4
)

CMP-MIC 2006
Peripheral (CSTR) w Groove
Peripheral Zone for Pad With Grooves and well-mixed flow
A10 100 1 10
31 10
41 10
101 1091 1081 1071 1061 1051 1041 1030.010.1
110
1001 10
31 1041 1051 1061 1071 1081 1091 10
101 10111 10121 10131 10141 10151 10161 10171 10181 10191 1020
Cu - Line Scratches
Size (nm)
Popu
latio
n of
Sur
face
Dam
age(
#/m
^3)
B10 100 1 10
31 10
41 10
101 1091 1081 1071 1061 1051 1041 1030.010.1
110
1001 10
31 1041 1051 1061 1071 1081 1091 10
101 10111 10121 10131 10141 10151 10161 10171 10181 10191 1020
Cu - Rolling Particle Indenter
Size (nm)
Popu
latio
n of
Sur
face
Dam
age(
#/m
^3)
C10 100 1 10
31 10
41 10
101 1091 1081 1071 1061 1051 1041 1030.010.1
110
1001 10
31 1041 1051 1061 1071 1081 1091 10
101 10111 10121 10131 10141 10151 10161 10171 10181 10191 1020
BSG - Surface Damage
Size (nm)
Popu
latio
n of
Sur
face
Dam
age(
#/m
^3)
D
1 0 1 0 0 1 1 03
1 1 04
1
1 0
1 0 0
1 1 03
1 1 04
1 1 05
1 1 06
1 1 07
1 1 08
1 1 09
1 1 010
1 1 011
1 1 012
1 1 013
1 1 014
1 1 015
1 1 016
Impurity Particles
Size (n m)
Po
pu
latio
n o
f Im
pu
rity
Par
ticle
s(#
/m^4
)
RRMech _ BF0
t'0
x'o x'n x'3 D x' t'( )
d
d

CMP-MIC 2006
Model Comparison
• Measure the number, types and location of surface defects on a wafer polished under a given set of CMP operating conditions – Standard Slurry
– Spiked with Impurity Particles
1
10
100
1000
10000
100000
50 100 200 500 1000
Size (micron)
Nu
mb
er o
f S
crat
ches
Cu-1 Cu-2 Theory
CMP-MIC 2006
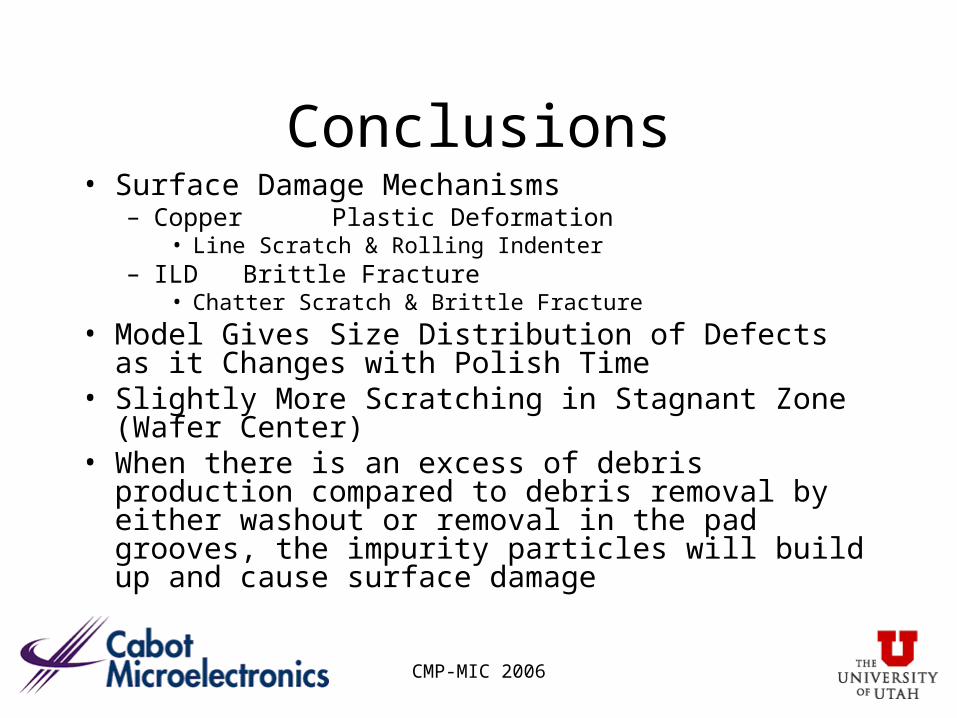
Conclusions• Surface Damage Mechanisms
– Copper Plastic Deformation• Line Scratch & Rolling Indenter
– ILD Brittle Fracture• Chatter Scratch & Brittle Fracture
• Model Gives Size Distribution of Defects as it Changes with Polish Time
• Slightly More Scratching in Stagnant Zone (Wafer Center)• When there is an excess of debris production compared to
debris removal by either washout or removal in the pad grooves, the impurity particles will build up and cause surface damage
CMP-MIC 2006
Extra Slides
CMP-MIC 2006
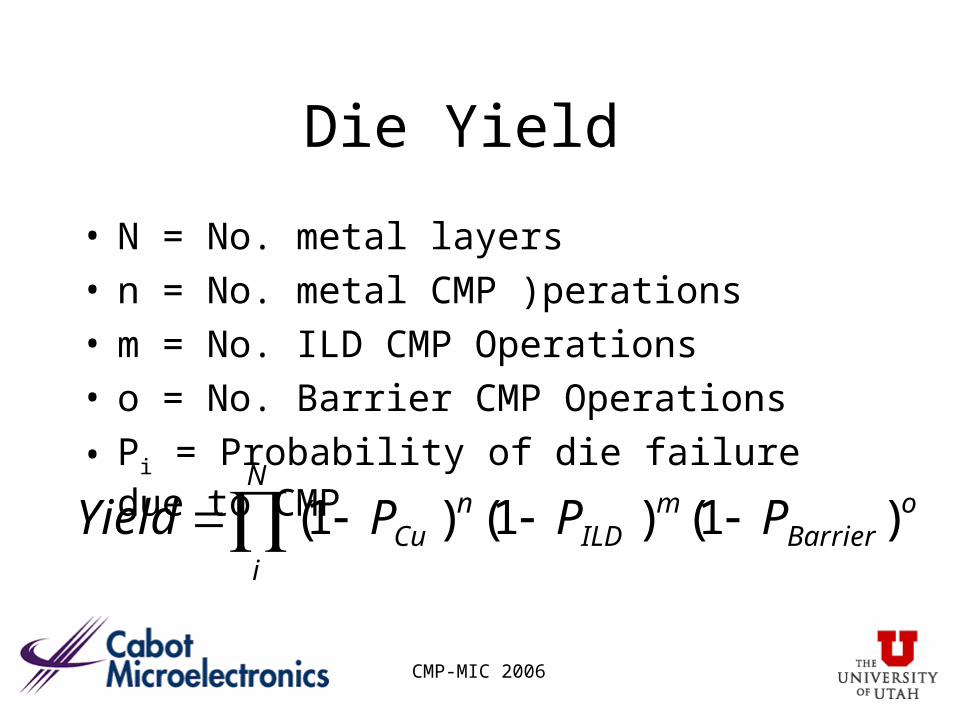
Die Yield
• N = No. metal layers• n = No. metal CMP )perations• m = No. ILD CMP Operations• o = No. Barrier CMP Operations
• Pi = Probability of die failure due to CMP o
Barrierm
ILD
N
i
nCu PPPYield )1()1()1(

CMP-MIC 2006
Surface Damage at Wafer Rim• Scratching in Wafer Rim
• Production Rate (BSG only)
s( ) o s nc
scn
s n
c
Vrel
2 gap
re re1 Impurity Particle
Rotation
Across Gap
x = Rw - r
CMP-MIC 2006
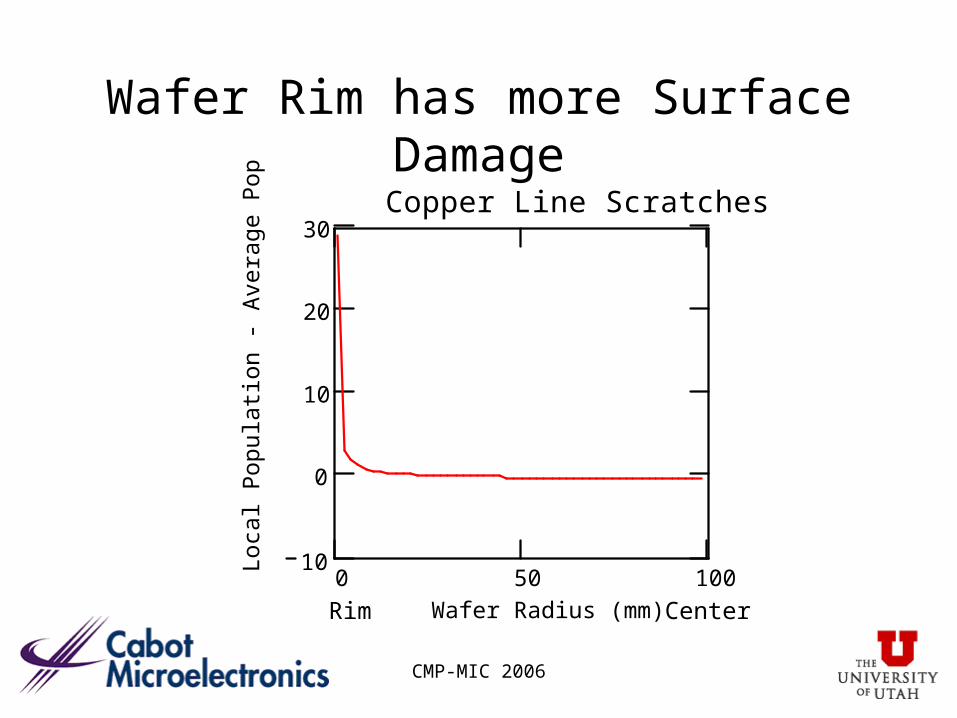
Wafer Rim has more Surface Damage
0 50 10010
0
10
20
30Copper Line Scratches
Wafer Radius (mm)
Loc
al P
opul
atio
n - A
vera
ge P
opul
atio
n
Rim Center

CMP-MIC 2006
Model Equations
• Impurity Particle Population No./mL• Under Wafer Impurity Particle Population Balance
• Surface Damage type=i; surface material=j, • Population No./cm2
• Population Balance of Surface Damage
0
),()( dststN IT
Dissolution Inflow Outflow Production Removal by Grooves
02_ )(
# dcm
N sTs
Removal Generation Uncovery
ts_i t d
dRRj
s_i t d
d kij
i
I
i
t
UR t
t I s t( )d
dD
s I s t( )d
d
I_in s t( )
I s t( )
s( ) I s t( ) 1 s( ) I s t( ) 0
s
s=/i

CMP-MIC 2006
Increase Generation RateStagnant Zone – dissolution + generation + groove removal
Plot of groove enhanced impurity particle population with time for the conditions, β = 1 Hz (A) and 10 Hz (B), d50= 1000 nm, n = 2, αc = 10-2 Hz, sc=500nm, D = 30 nm/s, No=1/mL, so=103nm. ηI_o(s) is given by the red solid
line, the population ηI(s,t) is given by all the other lines with the dotted blue line for t = 0.1 τ, the dashed green
line for t = 2 τ, the dot-dash magenta line for t = 4 τ, the dotted cyan line for t = 6 τ, the dotted brown line for t = 8 τ, the dashed black line for t = 10 τ, the dot-dash red line for t = 12 τ and the solid blue line for t = 14 τ where τ = 10 s. Scratch Debris Batch-2.mcd.
s t root o s n 1( ) so d50 atans
d50
so n 1( )( ) s D n 1( )
s
=1 Hz =10 Hz
2000 4000 6000 8000 1 104
1
10
100
1 103
1 104
1 105
1 106
1 107
1 108
1 109
1 1010
1 1011
1 1012
1 1013
1 1014
1 1015
1 1016
Size of Impurity Particles (nm)
Impu
rity
Pop
ulat
ion
Den
sity
(#/
m^3
/m)
2000 4000 6000 8000 1 104
1
10
100
1 103
1 104
1 105
1 106
1 107
1 108
1 109
1 1010
1 1011
1 1012
1 1013
1 1014
1 1015
1 1016
Size of Impurity Particles (nm)Im
puri
ty P
opul
atio
n D
ensi
ty (
#/m
^3/m
)
αc = 0.01 Hz
Related Documents