Citation: Evagelopoulos, V.; Charisiou, N.D.; Logothetis, M.; Evagelopoulos, G.; Logothetis, C. Cloud-Based Decision Support System for Air Quality Management. Climate 2022, 10, 39. https:// doi.org/10.3390/cli10030039 Academic Editor: Steven McNulty Received: 17 February 2022 Accepted: 9 March 2022 Published: 10 March 2022 Publisher’s Note: MDPI stays neutral with regard to jurisdictional claims in published maps and institutional affil- iations. Copyright: © 2022 by the authors. Licensee MDPI, Basel, Switzerland. This article is an open access article distributed under the terms and conditions of the Creative Commons Attribution (CC BY) license (https:// creativecommons.org/licenses/by/ 4.0/). climate Article Cloud-Based Decision Support System for Air Quality Management Vasilis Evagelopoulos 1, * , Nikolaos D. Charisiou 2 , Milton Logothetis 2 , Georgios Evagelopoulos 3 and Christopher Logothetis 2 1 Department of Chemical Engineering, University of Western Macedonia, 50100 Kozani, Greece 2 Purcon Ltd., 146 Mihalakopoulou Str., 11527 Athens, Greece; [email protected] (N.D.C.); [email protected] (M.L.); [email protected] (C.L.) 3 School of Electrical & Computer Engineering, Technical University of Crete, 73100 Chania, Greece; [email protected] * Correspondence: [email protected] Abstract: Air quality is important for the protection of human health, the environment and our cultural heritage and it is an issue that will acquire increased significance in the future due to the adverse effects of climate change. Thus, it is important to not simply monitor air quality, but to make information immediately available to those responsible for monitoring the networks, to pol- icy/decision makers, but also to the general population. Moreover, the development of information technologies over the last couple of decades has allowed the proliferation of real-time pollution monitoring. The work presented herein concerns the development of an effective way of monitoring environmental parameters using dedicated software. It offers a complete suite of applications that support environmental data collection management and reporting for air quality and associated meteorology. It combines modern technologies for the proper monitoring of air quality networks, which can consist of one or more measuring stations. Innovatively, it also focuses on how to effec- tively present the relevant information, utilizing modern technologies, such as cloud and mobile applications, to network engineers, policy/decision managers, and to the general public at large. It also has the capability of notifying appropriate personnel in the event of failures, overruns or abnormal values. The system, in its current configuration, handles information from six networks that include over 55 air pollution monitoring stations that are located throughout Greece. This practical application has shown that the system can achieve high data availability rates, even higher than 99% during the year. Keywords: air pollution; monitoring; integrated information systems; web services; air quality management system 1. Introduction The development of human societies and the accompanying growth in the consump- tion of natural resources, especially over the past couple of centuries, has given rise to a multitude of human-induced environmental problems. Chief amongst these is climate change, whose adverse effects are fast becoming the familiar horsemen of a planetary apocalypse, as so vividly made clear to world leaders at the recent cop26 summit. Climate change also affects outdoor air quality (AQ), long recognized as one of the main factors leading to deteriorating human health, especially in urban or industrial areas. In fact, the World Health Organization (WHO) has estimated that air pollution is responsible for over seven (7) million premature deaths worldwide, per year [1]; in the EU, it is responsible for 400,000 premature deaths, and health-related external costs that are estimated in the hundreds of billions of euros [2]. The major air pollutants are particulate matter (PM), classified into PM2.5 (particles with a maximum diameter of 2.5 μm) and PM10 (particles with a maximum diameter of 10 μm) and gaseous pollutants such as SO 2 Climate 2022, 10, 39. https://doi.org/10.3390/cli10030039 https://www.mdpi.com/journal/climate

Welcome message from author
This document is posted to help you gain knowledge. Please leave a comment to let me know what you think about it! Share it to your friends and learn new things together.
Transcript
�����������������
Citation: Evagelopoulos, V.;
Charisiou, N.D.; Logothetis, M.;
Evagelopoulos, G.; Logothetis, C.
Cloud-Based Decision Support
System for Air Quality Management.
Climate 2022, 10, 39. https://
doi.org/10.3390/cli10030039
Academic Editor: Steven McNulty
Received: 17 February 2022
Accepted: 9 March 2022
Published: 10 March 2022
Publisher’s Note: MDPI stays neutral
with regard to jurisdictional claims in
published maps and institutional affil-
iations.
Copyright: © 2022 by the authors.
Licensee MDPI, Basel, Switzerland.
This article is an open access article
distributed under the terms and
conditions of the Creative Commons
Attribution (CC BY) license (https://
creativecommons.org/licenses/by/
4.0/).
climate
Article
Cloud-Based Decision Support System for AirQuality ManagementVasilis Evagelopoulos 1,* , Nikolaos D. Charisiou 2, Milton Logothetis 2, Georgios Evagelopoulos 3
and Christopher Logothetis 2
1 Department of Chemical Engineering, University of Western Macedonia, 50100 Kozani, Greece2 Purcon Ltd., 146 Mihalakopoulou Str., 11527 Athens, Greece; [email protected] (N.D.C.);
[email protected] (M.L.); [email protected] (C.L.)3 School of Electrical & Computer Engineering, Technical University of Crete, 73100 Chania, Greece;
[email protected]* Correspondence: [email protected]
Abstract: Air quality is important for the protection of human health, the environment and ourcultural heritage and it is an issue that will acquire increased significance in the future due to theadverse effects of climate change. Thus, it is important to not simply monitor air quality, but tomake information immediately available to those responsible for monitoring the networks, to pol-icy/decision makers, but also to the general population. Moreover, the development of informationtechnologies over the last couple of decades has allowed the proliferation of real-time pollutionmonitoring. The work presented herein concerns the development of an effective way of monitoringenvironmental parameters using dedicated software. It offers a complete suite of applications thatsupport environmental data collection management and reporting for air quality and associatedmeteorology. It combines modern technologies for the proper monitoring of air quality networks,which can consist of one or more measuring stations. Innovatively, it also focuses on how to effec-tively present the relevant information, utilizing modern technologies, such as cloud and mobileapplications, to network engineers, policy/decision managers, and to the general public at large.It also has the capability of notifying appropriate personnel in the event of failures, overruns orabnormal values. The system, in its current configuration, handles information from six networks thatinclude over 55 air pollution monitoring stations that are located throughout Greece. This practicalapplication has shown that the system can achieve high data availability rates, even higher than 99%during the year.
Keywords: air pollution; monitoring; integrated information systems; web services; air qualitymanagement system
1. Introduction
The development of human societies and the accompanying growth in the consump-tion of natural resources, especially over the past couple of centuries, has given rise to amultitude of human-induced environmental problems. Chief amongst these is climatechange, whose adverse effects are fast becoming the familiar horsemen of a planetaryapocalypse, as so vividly made clear to world leaders at the recent cop26 summit.
Climate change also affects outdoor air quality (AQ), long recognized as one of themain factors leading to deteriorating human health, especially in urban or industrialareas. In fact, the World Health Organization (WHO) has estimated that air pollution isresponsible for over seven (7) million premature deaths worldwide, per year [1]; in the EU,it is responsible for 400,000 premature deaths, and health-related external costs that areestimated in the hundreds of billions of euros [2]. The major air pollutants are particulatematter (PM), classified into PM2.5 (particles with a maximum diameter of 2.5 µm) andPM10 (particles with a maximum diameter of 10 µm) and gaseous pollutants such as SO2
Climate 2022, 10, 39. https://doi.org/10.3390/cli10030039 https://www.mdpi.com/journal/climate

Climate 2022, 10, 39 2 of 15
and NOx [2,3]. As is well understood, exposure to particulate matter can cause or aggravatecardiovascular and lung diseases, heart attacks and arrhythmias, affect the central nervoussystem and the reproductive system, and cause cancer [4–13].
Climate change will also worsen indoor air, as it will lead to an increase of outdoorairborne allergens (which can then infiltrate indoor spaces), dampness and humidity (whichcan lead to increases in mold, dust mites, bacteria, and other biological contaminantsindoors), and higher indoor temperatures [14–16]. The current Covid-19 pandemic, whichstill forces people to spend increasing amounts of time indoors, as well as the likelihoodthat such pandemics may become more frequent in the future (as humans further push andshrink the limits of ecosystems), should focus the mind further.
Given the context provided above, the regulation and control of emissions is ofparamount importance. For the EU, relevant provisions were first made in the Envi-ronment Act/Air Quality Management Areas (AQMAs) of 1995 [17]. This was augmentedby the Ambient Air Quality and Clean Air for Europe Directive [18], which requires EUmember states to operate appropriate measurement systems and defines the rules underwhich the setup of observation networks should take place [19]. In terms of PM10, thethreshold for the protection of human health has been set at 40 mg/m3 over the course ofa year, while a concentration of 50 mg/m3 shall not be exceeded for more than 35 days ayear. Similarly, for PM2.5, the annual threshold has been set at 20 mg/m3 [20,21].
The setup of such thresholds has been made possible by advancements in monitor-ing and modeling. For example, satellite measurements, utilizing the Moderate Resolu-tion Imaging Spectroradiometer (MODIS) and/or Multi-angle Imaging Spectroradiometer(MISR), can be used to obtain an overview of PM2.5 concentrations over large geographicalareas [22–25]. In addition, the use of models has gained traction as these can be used tointegrate different datasets, auxiliary datasets and estimate and predict air pollution, utiliz-ing spatial and/or temporal coverage of observations [22,26–31]. However, continuous airquality monitoring can be performed only by ground-based monitoring stations, whichhave the added advantage of being able to provide real-time information in case of limitexceedance. Moreover, although such systems provide time series of different air qualityparameters that are relevant to the direct vicinity of a particular location, when combinedwith sampling of particulate matter, they can be characterized, the source identified andtoxicity studied [32,33].
Scientists and decision/policymakers have long stressed the need for science-baseddecision support systems [34–37]. Moreover, for air quality data to be effective, they needto be provided in a timely manner (so that decisions can be taken at the time an eventis occurring), but also in a format that will be easy to understand by the potential users.There are a number of studies that show that when local and/or national authoritiesare successfully informed with real-time air pollution data, then hospital admissions aresignificantly reduced [38]. Although there is room for the improvement of air qualitymanagement systems worldwide, this is particularly true for developing countries, wheresuch efforts are hampered by a lack of commitment from relevant authorities, reducedparticipation of stakeholders, policy or regulation weaknesses and also, of the physicalsystems that will provide real–time air quality data and emission inventories [39].
The advent of information technologies has led to the development of a huge numberof different online air quality information sources [40]. In an influential work, Karatzaset al. [41] described the techniques that are available for the effective dissemination of urbanair quality information to the public using mobile applications, street panels and massmedia. In the EU, most member states provide air quality information on publicly availablewebsites and through regular print publications [42]. In the USA, air quality informationis shared with the public via AIRNow [43], which provides real time measurements andforecasts for 300 cities. In South Africa, a system has been developed, which allowsinformation related to air quality to be disseminated through mobile application tools [44].Finally, in China and India, both print and electronic media are employed, alongside street

Climate 2022, 10, 39 3 of 15
panels and web pages, for the dissemination of air quality information to the public inurban areas [45,46].
Given the background discussed above, it is imperative for air quality measuring sta-tions to operate and record environmental measurements on a continuous basis. However,faults often occur, with the end result that important information is often left unrecordedfor periods that last from a few hours to several days. Moreover, modern analyzers alsomeasure critical diagnostic parameters of their function, such as flow, pressure, tempera-tures, etc., which can be accessed by technical personnel during site visits or stored usingappropriate software for later review. However, for systems that present live measurements,these parameters need to be controlled continuously.
The manuscript presented herein provides an effective way of monitoring air qualitymeasurement stations through the development of a dedicated software, AirDMS [47]. Thisdedicated software comprises of a set of tools that supports the collection and reportingof air quality and associated meteorological data. It also focuses on data quality controland provides tools that can address difficult and time-consuming validation tasks, byproviding real time and user-friendly information on multiple platforms. AirDMS can notonly enhance data quality and support quick decision-making, it can also reduce operationsand maintenance costs. Although the AirDMS system is being continuously improved andexpanded, in its current configuration, it handles information from 6 networks that includeover 55 air pollution monitoring stations that are located throughout Greece. Through thispractical application, it has been shown that it can allow network operators to increase theavailability rate of measurements even to rates greater than 99%. It also has the capabilityof accepting custom-made additional components (modules) to meet national and localrequirements. Thus, it can provide a valuable tool for the timely and correct information ofrelevant technical personnel, policy/decision-making authorities, but also, for the generalpublic at large.
2. The AirDMS Information System Architecture
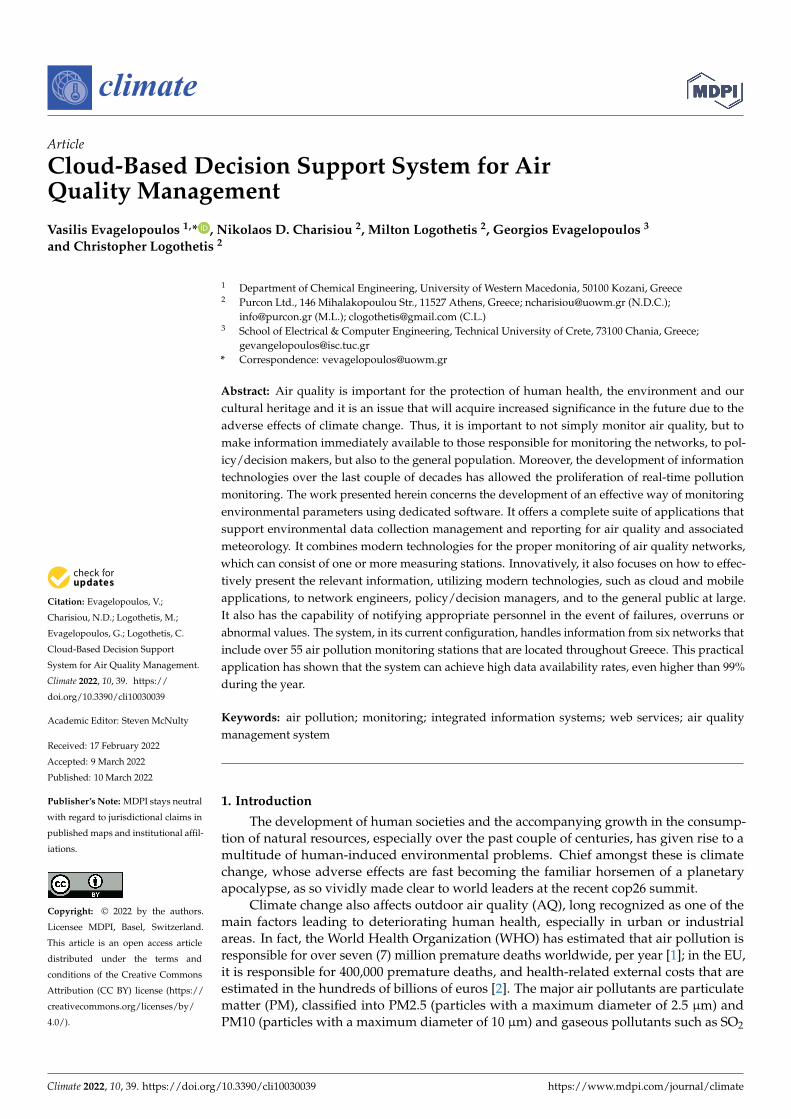
The AirDMS information system consists of: (i) the Communication system (CS) whichis the system responsible for collecting data, and (ii) the cloud-based information systemwith four subparts: (a) the web interface, which disseminates environmental data includingair quality, meteorological, and noise data, (b) the Remote Communication System (RCS),which automatically retrieves data through the Application Programming Interface (API)protocol, (c) the AirDMS Service, which disseminates instrumentation diagnostics, andlastly, (d) the AirDMS Alerts system, which sends alerts to authorized personnel in caseof instrumentation failure or measurement exceedances over high or low limits. Thesesystems are described in detail in the sections that follow. A schematic workflow diagramof the AirDMS information system is presented in Figure 1.
2.1. Communication System
The communication system (CS) is responsible for collecting the data, and after per-forming quality control (described below) and calculating average values (usually 5 min,hourly, 8 h, and daily average value), it sends the data to the central AirDMS database,which is located on the cloud. It is noted that the average values are calculated only if thedata availability is more than 75% for the reference period. For every measurement value,a flag that holds the measurement’s quality check is associated and stored. Possible flagsoccur: (a) when the measurements are not logged, for example, when an analyzer is beingmaintained, (b) when the values are invalid due to an analyzer’s diagnostic parameters be-ing outside of the pre-determined limits, (c) when not enough measurements are availableto calculate an average value, (d) when there is no communication with an analyzer, and (e)when a value is valid. In the case of incorrect values, these get stored for further evaluationbut are not displayed on the web interface, indicating only the abbreviation according toTable 1.
Climate 2022, 10, 39 4 of 15
Table 1. Abbreviation status explanation (flags).
Instrument Status Abbreviation
Measurements are not recorded OffScanNo Data ND
Not enough measurements to calculate average Sample<No Communication NC
Valid data ValidClimate 2022, 10, x FOR PEER REVIEW 4 of 15
Figure 1. Workflow Diagram of AirDMS.
Table 1. Abbreviation status explanation (flags).
Instrument Status Abbreviation
Measurements are not recorded OffScan
No Data ND
Not enough measurements to calculate average Sample<
No Communication NC
Valid data Valid
As CS has been developed using Java, it can be installed on many operating systems
such as Windows, Linux, and MacOS. Moreover, it can collect data from many sources,
including SQL Server, text files, Web API, and TCP/IP (Transmission Control Protocol/In-
ternet Protocol). It collects the data directly from the analyzers (streaming or internally
stored) or from any data logger in which the data are already collected. Another advanta-
geous feature of the CS is that it can operate with Arduino compatible boards with IoT
sensors or can even be installed in a Raspberry Pi. Both are low-cost controllers, which
have proven valuable measurement tools especially for indoor environment quality [48].
2.2. Cloud-Based Information System
As is well understood, cloud services provide cost-effective options to access, pro-
cess, and disseminate data and information in real-time [49,50]. For AirDMS, the cloud-
based system consists of four parts: (a) the web-based system, which displays real time
data on a 5-min basis on the web site, (b) the Remote Communication System, which can
collect or provide data in an automated way to authorized users, (c) the AirDMS Service,
which provides the diagnostic measurements of the analyzers and stations’ operating sta-
tus (e.g., internal temperature, current voltage, door status), and (d) the AirDMS Alerts.
The above was developed using the PHP scripting language with JavaScript and Html
version 5, which are especially suited to web development.
Figure 1. Workflow Diagram of AirDMS.
As CS has been developed using Java, it can be installed on many operating sys-tems such as Windows, Linux, and MacOS. Moreover, it can collect data from manysources, including SQL Server, text files, Web API, and TCP/IP (Transmission ControlProtocol/Internet Protocol). It collects the data directly from the analyzers (streaming orinternally stored) or from any data logger in which the data are already collected. Anotheradvantageous feature of the CS is that it can operate with Arduino compatible boards withIoT sensors or can even be installed in a Raspberry Pi. Both are low-cost controllers, whichhave proven valuable measurement tools especially for indoor environment quality [48].
2.2. Cloud-Based Information System
As is well understood, cloud services provide cost-effective options to access, process,and disseminate data and information in real-time [49,50]. For AirDMS, the cloud-basedsystem consists of four parts: (a) the web-based system, which displays real time data ona 5-min basis on the web site, (b) the Remote Communication System, which can collector provide data in an automated way to authorized users, (c) the AirDMS Service, whichprovides the diagnostic measurements of the analyzers and stations’ operating status (e.g.,internal temperature, current voltage, door status), and (d) the AirDMS Alerts. The abovewas developed using the PHP scripting language with JavaScript and Html version 5,which are especially suited to web development.
Climate 2022, 10, 39 5 of 15
2.2.1. Web Interface (WI)
The web interface has been constructed in a way that is as simple and easy to use aspossible, while also offering tools for monitoring the network of measuring stations thatappear within the application and optimizing data presentation.
Data can be accessed with username and password credentials generated by thesystem administrator. As the system incorporates multiple networks with many stations,each user may be authorized by the administrator to have access to certain networks orstations. Users may also be given access to other functions (such as, reports, data export,scientific graphs, data statistics, log files, analyzers manual) that collectively make up acomplex tool with multiple access levels.
Moreover, in compliance with the European Union ambient air quality directive [18],certain information (such as the air pollution index) may be made available to the public atthe request of network operators.
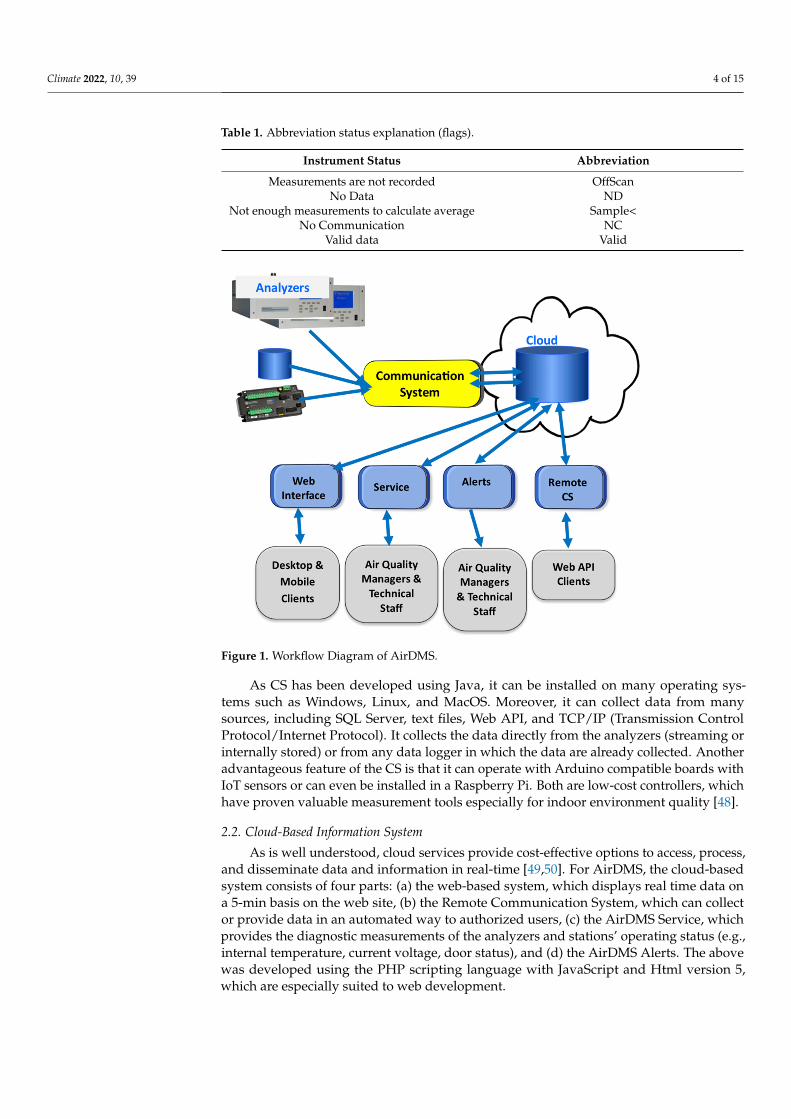
The spatial distribution of data utilizes OpenStreetmap (OSM) [51], which provides freegeographic data, such as street maps. These are generated with the use of Leaflet.js, which isone of the most popular open-source JavaScript libraries for interactive maps [52,53]. Leafletallows developers to display tiled web maps, with optional tiled overlays. It can load featuredata from GeoJSON files, style them, and create interactive layers, such as markers withpopups when clicked.
Figure 2 presents measurements for ambient temperature (value inside the circle) andwind in the form of a vector which changes direction and length according to the windmeasurements. The circle’s color changes dynamically based on temperature. Legends areincluded to help understand the context of each display. The chosen parameter displayedin the circle can be changed dynamically by the user, allowing for a personalized viewbased on user preferences.
Climate 2022, 10, x FOR PEER REVIEW 5 of 15
2.2.1. Web Interface (WI)
The web interface has been constructed in a way that is as simple and easy to use as
possible, while also offering tools for monitoring the network of measuring stations that
appear within the application and optimizing data presentation.
Data can be accessed with username and password credentials generated by the sys-
tem administrator. As the system incorporates multiple networks with many stations,
each user may be authorized by the administrator to have access to certain networks or
stations. Users may also be given access to other functions (such as, reports, data export,
scientific graphs, data statistics, log files, analyzers manual) that collectively make up a
complex tool with multiple access levels.
Moreover, in compliance with the European Union ambient air quality directive [18],
certain information (such as the air pollution index) may be made available to the public
at the request of network operators.
The spatial distribution of data utilizes OpenStreetmap (OSM) [51], which provides
free geographic data, such as street maps. These are generated with the use of Leaflet.js,
which is one of the most popular open-source JavaScript libraries for interactive maps
[52,53]. Leaflet allows developers to display tiled web maps, with optional tiled overlays.
It can load feature data from GeoJSON files, style them, and create interactive layers, such
as markers with popups when clicked.
Figure 2 presents measurements for ambient temperature (value inside the circle)
and wind in the form of a vector which changes direction and length according to the
wind measurements. The circle’s color changes dynamically based on temperature. Leg-
ends are included to help understand the context of each display. The chosen parameter
displayed in the circle can be changed dynamically by the user, allowing for a personal-
ized view based on user preferences.
Figure 2. Map with metrological parameters for every network station (value inside the circle cor-
responds to ambient temperature).
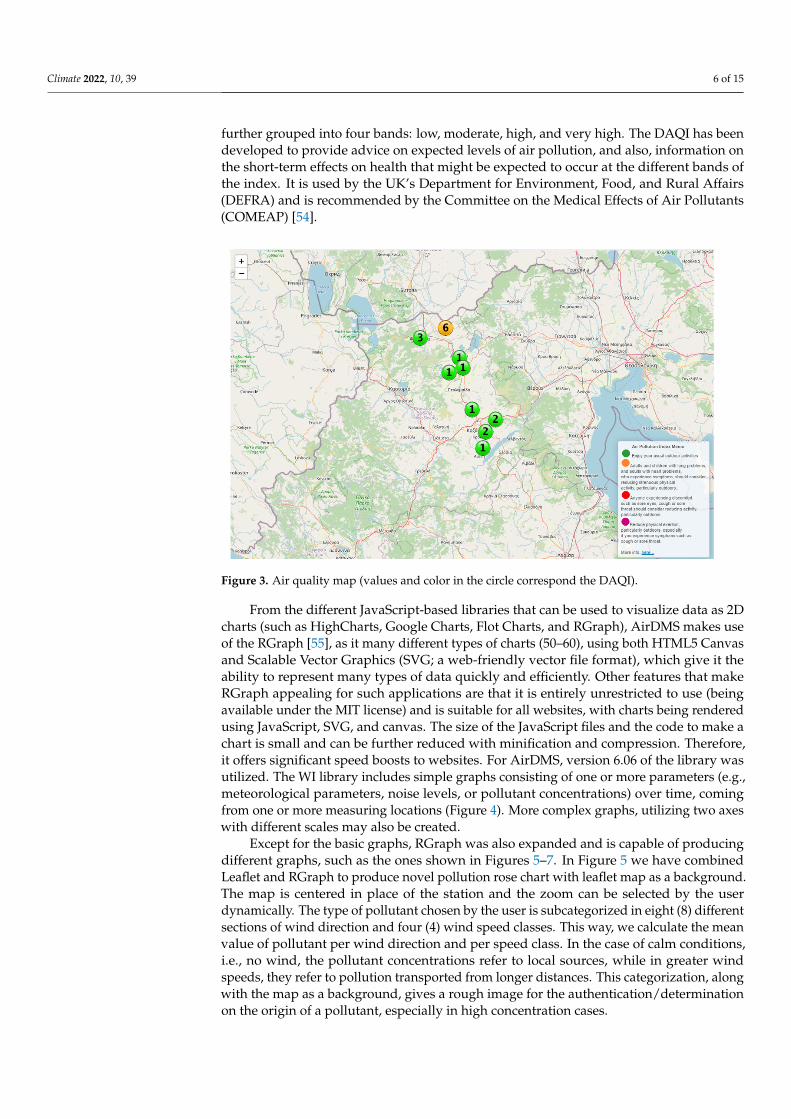
The map in Figure 3 shows air pollution in multiple locations. The data obtained are
classified according to the Daily Air Quality Index (DAQI), which has ten points that are
further grouped into four bands: low, moderate, high, and very high. The DAQI has been
Figure 2. Map with metrological parameters for every network station (value inside the circlecorresponds to ambient temperature).
The map in Figure 3 shows air pollution in multiple locations. The data obtained areclassified according to the Daily Air Quality Index (DAQI), which has ten points that are
Climate 2022, 10, 39 6 of 15
further grouped into four bands: low, moderate, high, and very high. The DAQI has beendeveloped to provide advice on expected levels of air pollution, and also, information onthe short-term effects on health that might be expected to occur at the different bands ofthe index. It is used by the UK’s Department for Environment, Food, and Rural Affairs(DEFRA) and is recommended by the Committee on the Medical Effects of Air Pollutants(COMEAP) [54].
Climate 2022, 10, x FOR PEER REVIEW 6 of 15
developed to provide advice on expected levels of air pollution, and also, information on
the short-term effects on health that might be expected to occur at the different bands of
the index. It is used by the UK’s Department for Environment, Food, and Rural Affairs
(DEFRA) and is recommended by the Committee on the Medical Effects of Air Pollutants
(COMEAP) [54].
Figure 3. Air quality map (values and color in the circle correspond the DAQI).
From the different JavaScript-based libraries that can be used to visualize data as 2D
charts (such as HighCharts, Google Charts, Flot Charts, and RGraph), AirDMS makes use
of the RGraph [55], as it many different types of charts (50–60), using both HTML5 Canvas
and Scalable Vector Graphics (SVG; a web-friendly vector file format), which give it the
ability to represent many types of data quickly and efficiently. Other features that make
RGraph appealing for such applications are that it is entirely unrestricted to use (being
available under the MIT license) and is suitable for all websites, with charts being ren-
dered using JavaScript, SVG, and canvas. The size of the JavaScript files and the code to
make a chart is small and can be further reduced with minification and compression.
Therefore, it offers significant speed boosts to websites. For AirDMS, version 6.06 of the
library was utilized. The WI library includes simple graphs consisting of one or more pa-
rameters (e.g., meteorological parameters, noise levels, or pollutant concentrations) over
time, coming from one or more measuring locations (Figure 4). More complex graphs,
utilizing two axes with different scales may also be created.
Except for the basic graphs, RGraph was also expanded and is capable of producing
different graphs, such as the ones shown in Figures 5–7. In Figure 5 we have combined
Leaflet and RGraph to produce novel pollution rose chart with leaflet map as a back-
ground. The map is centered in place of the station and the zoom can be selected by the
user dynamically. The type of pollutant chosen by the user is subcategorized in eight (8)
different sections of wind direction and four (4) wind speed classes. This way, we calculate
the mean value of pollutant per wind direction and per speed class. In the case of calm
conditions, i.e., no wind, the pollutant concentrations refer to local sources, while in
greater wind speeds, they refer to pollution transported from longer distances. This cate-
gorization, along with the map as a background, gives a rough image for the authentica-
tion/determination on the origin of a pollutant, especially in high concentration cases.
Figure 3. Air quality map (values and color in the circle correspond the DAQI).
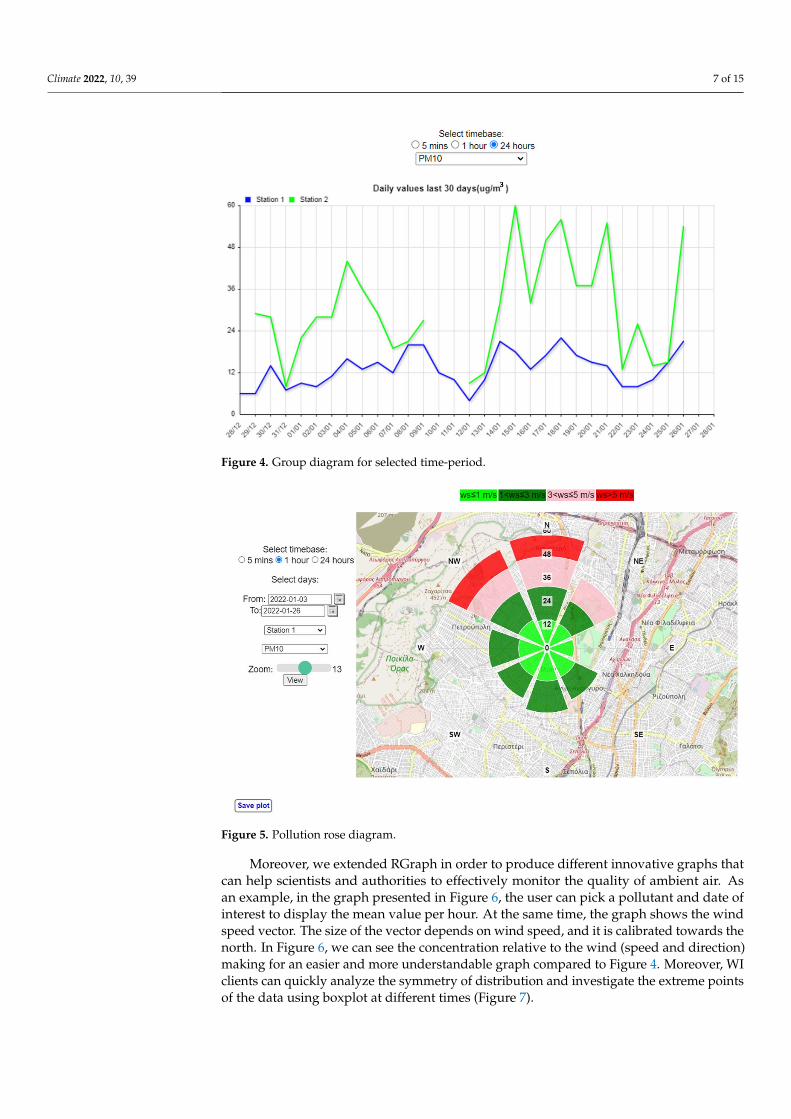
From the different JavaScript-based libraries that can be used to visualize data as 2Dcharts (such as HighCharts, Google Charts, Flot Charts, and RGraph), AirDMS makes useof the RGraph [55], as it many different types of charts (50–60), using both HTML5 Canvasand Scalable Vector Graphics (SVG; a web-friendly vector file format), which give it theability to represent many types of data quickly and efficiently. Other features that makeRGraph appealing for such applications are that it is entirely unrestricted to use (beingavailable under the MIT license) and is suitable for all websites, with charts being renderedusing JavaScript, SVG, and canvas. The size of the JavaScript files and the code to make achart is small and can be further reduced with minification and compression. Therefore,it offers significant speed boosts to websites. For AirDMS, version 6.06 of the library wasutilized. The WI library includes simple graphs consisting of one or more parameters (e.g.,meteorological parameters, noise levels, or pollutant concentrations) over time, comingfrom one or more measuring locations (Figure 4). More complex graphs, utilizing two axeswith different scales may also be created.
Except for the basic graphs, RGraph was also expanded and is capable of producingdifferent graphs, such as the ones shown in Figures 5–7. In Figure 5 we have combinedLeaflet and RGraph to produce novel pollution rose chart with leaflet map as a background.The map is centered in place of the station and the zoom can be selected by the userdynamically. The type of pollutant chosen by the user is subcategorized in eight (8) differentsections of wind direction and four (4) wind speed classes. This way, we calculate the meanvalue of pollutant per wind direction and per speed class. In the case of calm conditions,i.e., no wind, the pollutant concentrations refer to local sources, while in greater windspeeds, they refer to pollution transported from longer distances. This categorization, alongwith the map as a background, gives a rough image for the authentication/determinationon the origin of a pollutant, especially in high concentration cases.
Climate 2022, 10, 39 7 of 15Climate 2022, 10, x FOR PEER REVIEW 7 of 15
Figure 4. Group diagram for selected time-period.
Figure 5. Pollution rose diagram.
Moreover, we extended RGraph in order to produce different innovative graphs that
can help scientists and authorities to effectively monitor the quality of ambient air. As an
example, in the graph presented in Figure 6, the user can pick a pollutant and date of
interest to display the mean value per hour. At the same time, the graph shows the wind
speed vector. The size of the vector depends on wind speed, and it is calibrated towards
the north. In Figure 6, we can see the concentration relative to the wind (speed and direc-
tion) making for an easier and more understandable graph compared to Figure 4. Moreo-
ver, WI clients can quickly analyze the symmetry of distribution and investigate the ex-
treme points of the data using boxplot at different times (Figure 7).
Figure 4. Group diagram for selected time-period.
Climate 2022, 10, x FOR PEER REVIEW 7 of 15
Figure 4. Group diagram for selected time-period.
Figure 5. Pollution rose diagram.
Moreover, we extended RGraph in order to produce different innovative graphs that
can help scientists and authorities to effectively monitor the quality of ambient air. As an
example, in the graph presented in Figure 6, the user can pick a pollutant and date of
interest to display the mean value per hour. At the same time, the graph shows the wind
speed vector. The size of the vector depends on wind speed, and it is calibrated towards
the north. In Figure 6, we can see the concentration relative to the wind (speed and direc-
tion) making for an easier and more understandable graph compared to Figure 4. Moreo-
ver, WI clients can quickly analyze the symmetry of distribution and investigate the ex-
treme points of the data using boxplot at different times (Figure 7).
Figure 5. Pollution rose diagram.
Moreover, we extended RGraph in order to produce different innovative graphs thatcan help scientists and authorities to effectively monitor the quality of ambient air. Asan example, in the graph presented in Figure 6, the user can pick a pollutant and date ofinterest to display the mean value per hour. At the same time, the graph shows the windspeed vector. The size of the vector depends on wind speed, and it is calibrated towards thenorth. In Figure 6, we can see the concentration relative to the wind (speed and direction)making for an easier and more understandable graph compared to Figure 4. Moreover, WIclients can quickly analyze the symmetry of distribution and investigate the extreme pointsof the data using boxplot at different times (Figure 7).

Climate 2022, 10, 39 8 of 15Climate 2022, 10, x FOR PEER REVIEW 8 of 15
Figure 6. Pollutant with wind data diagram.
Figure 7. Box plot diagram.
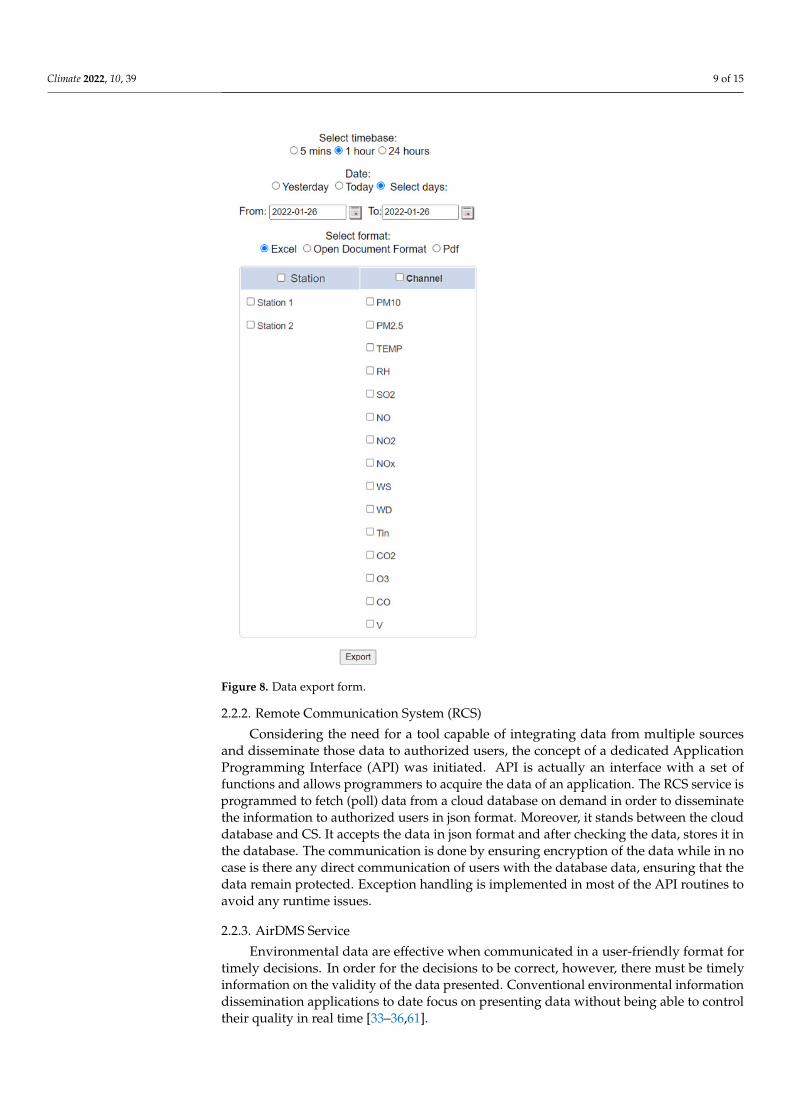
All current and historical data can be presented in a table form and can be exported
to spreadsheet or pdf files (Figure 8). The data are acquired from the database in 5 min, 60
min, 8 h, or 24 h intervals. To present the data in a table form, we use ApPHP DataGrid
software [56]. The ApPHP DataGrid script is a simple, innovative, and powerful tool for
generating data-bound grid control. It is excellent for online-based data administration
and also useful for dynamic content management. In order to export data in a spreadsheet
file format, we use the PhpSpreadsheet library [57], which offers a set of classes that allow
the reading and writing of various spreadsheet file formats such as Microsoft Excel [58]
and LibreOffice Calc [59]. Moreover, for the pdf file format, we use mPDF [60], a PHP
library which generates PDF files from UTF-8 encoded HTML.
Figure 6. Pollutant with wind data diagram.
Climate 2022, 10, x FOR PEER REVIEW 8 of 15
Figure 6. Pollutant with wind data diagram.
Figure 7. Box plot diagram.
All current and historical data can be presented in a table form and can be exported
to spreadsheet or pdf files (Figure 8). The data are acquired from the database in 5 min, 60
min, 8 h, or 24 h intervals. To present the data in a table form, we use ApPHP DataGrid
software [56]. The ApPHP DataGrid script is a simple, innovative, and powerful tool for
generating data-bound grid control. It is excellent for online-based data administration
and also useful for dynamic content management. In order to export data in a spreadsheet
file format, we use the PhpSpreadsheet library [57], which offers a set of classes that allow
the reading and writing of various spreadsheet file formats such as Microsoft Excel [58]
and LibreOffice Calc [59]. Moreover, for the pdf file format, we use mPDF [60], a PHP
library which generates PDF files from UTF-8 encoded HTML.
Figure 7. Box plot diagram.
All current and historical data can be presented in a table form and can be exportedto spreadsheet or pdf files (Figure 8). The data are acquired from the database in 5 min,60 min, 8 h, or 24 h intervals. To present the data in a table form, we use ApPHP DataGridsoftware [56]. The ApPHP DataGrid script is a simple, innovative, and powerful tool forgenerating data-bound grid control. It is excellent for online-based data administration andalso useful for dynamic content management. In order to export data in a spreadsheet fileformat, we use the PhpSpreadsheet library [57], which offers a set of classes that allow thereading and writing of various spreadsheet file formats such as Microsoft Excel [58] andLibreOffice Calc [59]. Moreover, for the pdf file format, we use mPDF [60], a PHP librarywhich generates PDF files from UTF-8 encoded HTML.
Climate 2022, 10, 39 9 of 15
Climate 2022, 10, x FOR PEER REVIEW 9 of 15
Figure 8. Data export form.
2.2.2. Remote Communication System (RCS)
Considering the need for a tool capable of integrating data from multiple sources and
disseminate those data to authorized users, the concept of a dedicated Application Pro-
gramming Interface (API) was initiated. API is actually an interface with a set of functions
and allows programmers to acquire the data of an application. The RCS service is pro-
grammed to fetch (poll) data from a cloud database on demand in order to disseminate
the information to authorized users in json format. Moreover, it stands between the cloud
database and CS. It accepts the data in json format and after checking the data, stores it in
the database. The communication is done by ensuring encryption of the data while in no
case is there any direct communication of users with the database data, ensuring that the
data remain protected. Exception handling is implemented in most of the API routines to
avoid any runtime issues.
2.2.3. AirDMS Service
Environmental data are effective when communicated in a user-friendly format for
timely decisions. In order for the decisions to be correct, however, there must be timely
information on the validity of the data presented. Conventional environmental infor-
mation dissemination applications to date focus on presenting data without being able to
control their quality in real time [33–36,61].
Modern atmospheric quality recording analyzers have recording capabilities for
many parameters, setting limits outside which the analyzer does not work properly, re-
sulting in recorded values which are considered incorrect. These operating parameters are
recorded (both current and historically) in AirDMS. This enables the air quality managers
on the one hand, to judge whether the pollutant values were correct, while on the other,
the technical staff can be informed of problems in order to take appropriate action. Fur-
thermore, technical personnel, based on historical diagnostics, can prevent damage (e.g.,
observing the rate of change of a certain functional parameter or its rate of approach to
the limit of abnormal operation) and can proactively schedule the repair of the analyzer.
Moreover, as in large environmental monitoring networks the distances between stations
Figure 8. Data export form.
2.2.2. Remote Communication System (RCS)
Considering the need for a tool capable of integrating data from multiple sourcesand disseminate those data to authorized users, the concept of a dedicated ApplicationProgramming Interface (API) was initiated. API is actually an interface with a set offunctions and allows programmers to acquire the data of an application. The RCS service isprogrammed to fetch (poll) data from a cloud database on demand in order to disseminatethe information to authorized users in json format. Moreover, it stands between the clouddatabase and CS. It accepts the data in json format and after checking the data, stores it inthe database. The communication is done by ensuring encryption of the data while in nocase is there any direct communication of users with the database data, ensuring that thedata remain protected. Exception handling is implemented in most of the API routines toavoid any runtime issues.
2.2.3. AirDMS Service
Environmental data are effective when communicated in a user-friendly format fortimely decisions. In order for the decisions to be correct, however, there must be timelyinformation on the validity of the data presented. Conventional environmental informationdissemination applications to date focus on presenting data without being able to controltheir quality in real time [33–36,61].

Climate 2022, 10, 39 10 of 15
Modern atmospheric quality recording analyzers have recording capabilities for manyparameters, setting limits outside which the analyzer does not work properly, resulting inrecorded values which are considered incorrect. These operating parameters are recorded(both current and historically) in AirDMS. This enables the air quality managers on the onehand, to judge whether the pollutant values were correct, while on the other, the technicalstaff can be informed of problems in order to take appropriate action. Furthermore, technicalpersonnel, based on historical diagnostics, can prevent damage (e.g., observing the rate ofchange of a certain functional parameter or its rate of approach to the limit of abnormaloperation) and can proactively schedule the repair of the analyzer. Moreover, as in largeenvironmental monitoring networks the distances between stations are long, the AirDMScan help to get rid of unneeded field service engineer travel, saving time and funds.
Figure 9 shows the operating status of the stations supervised by a service engineer.The stations are represented as dots on a map of the area. Depending on the operationalstatus of the station (communication with the station, supply voltage of the station, com-munication with the analyzers, operational parameters of the analyzers), the color of thedot changes according to the legend on the map. Selecting one of the stations (Figure 10)displays the operational data for the specific station, while selecting one of the analyzers,whose diagnostics are recorded, revealing a table displaying the current values of theanalyzer operating parameters as well as their minimum and maximum values for validoperation (Figure 11).
Finally, the historical data for the operational parameters of the analysts can be dis-played in tables and graphs by freely selecting the time-period of their presentation.
Climate 2022, 10, x FOR PEER REVIEW 10 of 15
are long, the AirDMS can help to get rid of unneeded field service engineer travel, saving
time and funds.
Figure 9 shows the operating status of the stations supervised by a service engineer.
The stations are represented as dots on a map of the area. Depending on the operational
status of the station (communication with the station, supply voltage of the station, com-
munication with the analyzers, operational parameters of the analyzers), the color of the
dot changes according to the legend on the map. Selecting one of the stations (Figure 10)
displays the operational data for the specific station, while selecting one of the analyzers,
whose diagnostics are recorded, revealing a table displaying the current values of the an-
alyzer operating parameters as well as their minimum and maximum values for valid
operation (Figure 11).
Finally, the historical data for the operational parameters of the analysts can be dis-
played in tables and graphs by freely selecting the time-period of their presentation.
Figure 9. Operating status of the network stations. Figure 9. Operating status of the network stations.

Climate 2022, 10, 39 11 of 15Climate 2022, 10, x FOR PEER REVIEW 11 of 15
Figure 10. Operating status for analyzers of selected station.
Figure 11. Operating parameters for selected analyzer.
2.3. AirDMS Alerts
Timely update of environmental parameters, especially in cases of limit exceedances
of pollutants or severe weather phenomena, is a critical process for the protection of citi-
zens. In addition, it allows service engineers to be informed of the operational condition
of the equipment in order to intervene as quickly as possible, avoiding unnecessary travel
time. For the above reasons, AirDMS software has been enriched with the addition of an-
other important tool, AirDMS Alerts.
AirDMS Alerts is a personalized information tool for AirDMS users. It can be pro-
grammed through the web interface and send messages to users in various ways, such as
email, SMS, and push notifications through the mobile application. The application works
as an operating system service and shows push notifications for the user. Currently, it is
available only for mobile phones and tablets using the Android operating system.
The station administrator can schedule to send a message in one of the above formats
in various cases, such as in exceeding a maximum or minimum limit for any parameter
set by the user or operating condition of the station in relation to parameters, such as its
internal temperature, mains voltage, etc., or finally, for the operating parameters of the
Figure 10. Operating status for analyzers of selected station.
Climate 2022, 10, x FOR PEER REVIEW 11 of 15
Figure 10. Operating status for analyzers of selected station.
Figure 11. Operating parameters for selected analyzer.
2.3. AirDMS Alerts
Timely update of environmental parameters, especially in cases of limit exceedances
of pollutants or severe weather phenomena, is a critical process for the protection of citi-
zens. In addition, it allows service engineers to be informed of the operational condition
of the equipment in order to intervene as quickly as possible, avoiding unnecessary travel
time. For the above reasons, AirDMS software has been enriched with the addition of an-
other important tool, AirDMS Alerts.
AirDMS Alerts is a personalized information tool for AirDMS users. It can be pro-
grammed through the web interface and send messages to users in various ways, such as
email, SMS, and push notifications through the mobile application. The application works
as an operating system service and shows push notifications for the user. Currently, it is
available only for mobile phones and tablets using the Android operating system.
The station administrator can schedule to send a message in one of the above formats
in various cases, such as in exceeding a maximum or minimum limit for any parameter
set by the user or operating condition of the station in relation to parameters, such as its
internal temperature, mains voltage, etc., or finally, for the operating parameters of the
Figure 11. Operating parameters for selected analyzer.
2.3. AirDMS Alerts
Timely update of environmental parameters, especially in cases of limit exceedances ofpollutants or severe weather phenomena, is a critical process for the protection of citizens.In addition, it allows service engineers to be informed of the operational condition of theequipment in order to intervene as quickly as possible, avoiding unnecessary travel time.For the above reasons, AirDMS software has been enriched with the addition of anotherimportant tool, AirDMS Alerts.
AirDMS Alerts is a personalized information tool for AirDMS users. It can be pro-grammed through the web interface and send messages to users in various ways, such asemail, SMS, and push notifications through the mobile application. The application worksas an operating system service and shows push notifications for the user. Currently, it isavailable only for mobile phones and tablets using the Android operating system.
Climate 2022, 10, 39 12 of 15
The station administrator can schedule to send a message in one of the above formatsin various cases, such as in exceeding a maximum or minimum limit for any parameterset by the user or operating condition of the station in relation to parameters, such as itsinternal temperature, mains voltage, etc., or finally, for the operating parameters of theanalyzers based on the limits specified by the manufacturer or the service engineer ofthe station.
3. Conclusions
This manuscript presents an effective way to monitor air quality and environmentalparameters (such as noise or meteorological data) using modern technologies, throughthe development of a dedicated software, AirDMS. As is well understood, air qualitymonitoring plays an important role in the protection of human health. However, it isexpected to be of even greater importance in the future, due to the adverse effects onair quality that will be brought about by climate change. Thus, it is critical for citizensto be informed about air quality in real time in order to avoid prolonged exposure tohigh concentrations of pollutants, but it is equally important that the information givento the public is correct, and in the case of equipment malfunction, corrective actions to beundertaken in a timely and efficient manner.
With the use of AirDMS, this is done immediately, as technical personnel and airquality managers are constantly updated on the operational status of the measurementanalyzers. Thus, the AirDMS focuses on how to effectively manage air quality monitoringnetworks, but also on informing the public in a simple and easy to understand way. Thepresentation of data is done using modern technologies. A JavaScript charting library(RGraph) was extended in AirDMS, and thus, data are visualized in an efficient way, givinga clear picture of air quality even to non-specialized people.
An important issue to consider when dealing with air quality monitoring is that, inmany cases, analyzers may record incorrect values. It can, as often happens in the field,take several days to repair the fault, especially when it comes to a large monitoring networkwith long distances from the stations to the management center. It is therefore advisable torecord and review the operational status of the analyzers performing the measurements. InAirDMS, these are available in real time, in addition to environmental quality parametersand critical parameters such as analytical operating parameters and station status (roomtemperature, mains voltage, etc.). Thus, the current and historical situation of the criticaloperational parameters of the analyzers can be reviewed.
Moreover, for the air quality data review to be effective, evaluation should be doneimmediately and automatically. AirDMS allows network technical and administrativepersonnel to receive messages in the event of failures, overruns, or abnormal values. Thisis done via email, SMS, or push notifications using native mobile application. In thisway, the AirDMS users can save time and money, while at the same time having highdata availability rates. Although the AirDMS system is being continuously improved andexpanded, in its current configuration, it handles information from 6 networks that includeover 55 air pollution monitoring stations that are located throughout Greece. Experiencewhile operating the system has shown that data availability rates can exceed 99% duringthe year. Although at present the system is being operated only in Greece, it can be easilyadapted for use in other countries or regions. Future expansion of the system’s capabilitieswill include the incorporation of artificial intelligence in recognizing technical failures inmonitoring stations.
Author Contributions: Conceptualization, C.L. and V.E.; software, V.E., G.E. and M.L.; investigation,N.D.C. and V.E.; writing—original draft preparation, V.E. and N.D.C.; visualization, G.E.; supervision,V.E. All authors have read and agreed to the published version of the manuscript.
Funding: This research received no external funding.
Institutional Review Board Statement: Not applicable.

Climate 2022, 10, 39 13 of 15
Informed Consent Statement: Not applicable.
Data Availability Statement: Not applicable.
Conflicts of Interest: The authors declare no conflict of interest.
References1. World Health Organization. Air Pollution. Available online: https://www.who.int/health-topics/air-pollution (accessed on 3
January 2021).2. Sielski, J.; Kaziród-Wolski, K.; Józwiak, M.A.; Józwiak, M. The influence of air pollution by PM2.5, PM10 and associated heavy
metals on the parameters of out-of-hospital cardiac arrest. Sci. Total Environ. 2021, 788, 147541. [CrossRef] [PubMed]3. Zoras, S.; Triantafyllou, A.; Evagelopoulos, V. Aspects of year-long differential optical absorption spectroscopy and ground
station measurements in an urban street canyon near industrial pollution sources. Atmos. Environ. 2008, 42, 4293–4303. [CrossRef]4. Fattore, E.; Paiano, V.; Borgini, A.; Tittarelli, A.; Bertoldi, M.; Crosignani, P.; Fanelli, R. Human health risk in relation to air quality
in two municipalities in an industrialized area of Northern Italy. Environ. Res. 2011, 111, 1321–1327. [CrossRef] [PubMed]5. Meister, K.; Johansson, C.; Forsberg, B. Estimated Short-Term Effects of Coarse Particles on Daily Mortality in Stockholm, Sweden.
Environ. Health Perspect. 2012, 120, 431–436. [CrossRef] [PubMed]6. Correia, A.W.; Pope, C.A., III; Dockery, D.W.; Wang, Y.; Ezzati, M.; Dominici, F. The effect of air pollution control on life expectancy
in the United States: An analysis of 545 US counties for the period 2000 to 2007. Epidemiology 2013, 24, 23–31. [CrossRef] [PubMed]7. Fang, Y.; Naik, V.; Horowitz, L.W.; Mauzerall, D.L. Air pollution and associated human mortality: The role of air pollutant
emissions, climate change and methane concentration increases from the preindustrial period to present. Atmos. Chem. Phys.2013, 13, 1377–1394. [CrossRef]
8. Jiang, X.-Q.; Mei, X.-D.; Feng, D. Air pollution and chronic airway diseases: What should people know and do? J. Thorac. Dis.2016, 8, E31–E40. [CrossRef] [PubMed]
9. Kortoçi, P.; Motlagh, N.H.; Zaidan, M.A.; Fung, P.L.; Varjonen, S.; Rebeiro-Hargrave, A.; Niemi, J.V.; Nurmi, P.; Hussein, T.; Petäjä,T.; et al. Air pollution exposure monitoring using portable low-cost air quality sensors. Smart Health 2021, 23, 100241. [CrossRef]
10. Ma, X.; Zhang, T.; Ji, C.; Zhai, Y.; Shen, X.; Hong, J. Threats to human health and ecosystem: Looking for air-pollution relateddamage since 1990. Renew. Sustain. Energy Rev. 2021, 145, 111146. [CrossRef]
11. Orach, J.; Rider, C.F.; Carlsten, C. Concentration-dependent health effects of air pollution in controlled human exposures. Environ.Int. 2021, 150, 106424. [CrossRef]
12. Khomenko, S.; Cirach, M.; Pereira-Barboza, E.; Mueller, N.; Barrera-Gómez, J.; Rojas-Rueda, D.; de Hoogh, K.; Hoek, G.;Nieuwenhuijsen, M. Premature mortality due to air pollution in European cities: A health impact assessment. Lancet Planet.Health 2021, 5, e121–e134. [CrossRef]
13. Poole, J.A.; Barnes, C.S.; Demain, J.G.; Bernstein, J.A.; Padukudru, M.A.; Sheehan, W.J.; Fogelbach, G.G.; Wedner, J.; Codina,R.; Levetin, E.; et al. Impact of weather and climate change with indoor and outdoor air quality in asthma: A Work GroupReport of the AAAAI Environmental Exposure and Respiratory Health Committee. J. Allergy Clin. Immunol. 2019, 143, 1702–1710.[CrossRef]
14. Salthammer, T.; Schieweck, A.; Gu, J.; Ameri, S.; Uhde, E. Future trends in ambient air pollution and climate in Germany–Implications for the indoor environment. Build. Environ. 2018, 143, 661–670. [CrossRef]
15. Ahmed, T.; Kumar, P.; Mottet, L. Natural ventilation in warm climates: The challenges of thermal comfort, heatwave resilienceand indoor air quality. Renew. Sustain. Energy Rev. 2021, 138, 110669. [CrossRef]
16. Zhang, Y.; Wang, H.; Han, Y.; Wang, D.; Zhu, G.; Lu, X. Shale gas development in China: Implications for indoor and outdoor airquality and greenhouse gas emissions. Environ. Int. 2020, 141, 105727. [CrossRef]
17. McLaren, J.; Williams, I. The impact of communicating information about air pollution events on public health. Sci. Total Environ.2015, 538, 478–491. [CrossRef]
18. EC Directive 2008/120/EC. Available online: https://eur-lex.europa.eu/legal-content/EN/TXT/PDF/?uri=CELEX:32008L0120&from=EN (accessed on 16 February 2022).
19. Wiemann, S.; Brauner, J.; Karrasch, P.; Henzen, D.; Bernard, L. Design and prototype of an interoperable online air qualityinformation system. Environ. Model. Softw. 2016, 79, 354–366. [CrossRef]
20. Evagelopoulos, V.; Charisiou, N. Smart air monitoring for indoor public spaces using mobile applications. IOP Conf. Ser. EarthEnviron. Sci. 2021, 899, 012006. [CrossRef]
21. Hoff, R.M.; Christopher, S.A. Remote Sensing of Particulate Pollution from Space: Have We Reached the Promised Land? J. AirWaste Manag. Assoc. 2009, 59, 645–675. [CrossRef]
22. Engel-Cox, J.; Oanh, N.T.K.; van Donkelaar, A.; Martin, R.V.; Zell, E. Toward the next generation of air quality monitoring:Particulate Matter. Atmos. Environ. 2013, 80, 584–590. [CrossRef]
23. Cooper, M.J.; Martin, R.V.; Van Donkelaar, A.; Lamsal, L.; Brauer, M.; Brook, J.R. A Satellite-Based Multi-Pollutant Index of GlobalAir Quality. Environ. Sci. Technol. 2012, 46, 8523–8524. [CrossRef]
24. Li, J.; Zhang, H.; Chao, C.-Y.; Chien, C.-H.; Wu, C.-Y.; Luo, C.H.; Chen, L.-J.; Biswas, P. Integrating low-cost air quality sensornetworks with fixed and satellite monitoring systems to study ground-level PM2.5. Atmos. Environ. 2020, 223, 117293. [CrossRef]

Climate 2022, 10, 39 14 of 15
25. Semlali, B.-E.B.; El Amrani, C.; Ortiz, G.; Boubeta-Puig, J.; Garcia-De-Prado, A. SAT-CEP-monitor: An air quality monitoringsoftware architecture combining complex event processing with satellite remote sensing. Comput. Electr. Eng. 2021, 93, 107257.[CrossRef]
26. Van Donkelaar, A.; Martin, R.V.; Brauer, M.; Kahn, R.; Levy, R.; Verduzco, C.; Villeneuve, P.J. Global Estimates of Ambient FineParticulate Matter Concentrations from Satellite-Based Aerosol Optical Depth: Development and Application. Environ. HealthPerspect. 2010, 118, 847–855. [CrossRef]
27. Zoras, S.; Evagelopoulos, V.; Pytharoulis, I.; Kallos, G. Development and validation of a novel-based combination operational airquality forecasting system in Greece. Arch. Meteorol. Geophys. Bioclimatol. Ser. B 2010, 106, 127–133. [CrossRef]
28. Zoras, S.; Triantafyllou, A.G.; Evagelopoulos, V. Modelling of PM2.5 Episodes in Four Cities of Northwestern Greece. Frese-NiusEnviron. Bull. 2006, 15, 306–313.
29. Evagelopoulos, V.; Charisiou, N.D.; Zoras, S. Dataset of inhalable particulate matter concentrations in the region of WestMacedonia, Greece for an 11-year period. Data Brief 2022, 41, 107883. [CrossRef]
30. Tolis, E.I.; Missia, D.A.; Charisiou, N.D.; Bartzis, J.G. Polycyclic aromatic hydrocarbons and ionic species associated withparticulate matter in ambient air in Kozani City, Greece, during cold period. Fresenius Environ. Bull. 2010, 19, 2006–2012.
31. Dimitriou, K.; Kassomenos, P. Estimation of North African dust contribution on PM10 episodes at four continental Greek cities.Ecol. Indic. 2019, 106, 105530. [CrossRef]
32. Iordanidis, A.; Zoras, S.; Triantafyllou, A.; Buckman, J.; Asvesta, A.; Evagelopoulos, V. Characterisation of Airborne ParticlesCollected Proximal to Lignite Mines and Power Plants of Ptolemais-Kozani Area, Northern Greece. Fresenius Environ. Bull. 2008,17, 378–398.
33. Papadimitriou, C.; Evagelopoulos, V.; Samaras, P.; Triantafyllou, A.; Zoras, S.; Albanis, T. Toxicity of Atmospheric Particu-lateMatter Using Aquatic Bioassays. WIT Trans. Biomed. Health 2006, 10, 31–39.
34. Baklanov, A.; Cárdenas, B.; Lee, T.-C.; Leroyer, S.; Masson, V.; Molina, L.T.; Müller, T.; Ren, C.; Vogel, F.R.; Voogt, J.A. Integratedurban services: Experience from four cities on different continents. Urban Clim. 2020, 32, 100610. [CrossRef] [PubMed]
35. Grimmond, S.; Bouchet, V.; Molina, L.T.; Baklanov, A.; Tan, J.; Schlünzen, K.H.; Mills, G.; Golding, B.; Masson, V.; Ren, C.; et al.Integrated urban hydrometeorological, climate and environmental services: Concept, methodology and key messages. UrbanClim. 2020, 33, 100623. [CrossRef] [PubMed]
36. Molina, L.T.; Velasco, E.; Retama, A.; Zavala, M. Experience from Integrated Air Quality Management in the Mexico CityMetropolitan Area and Singapore. Atmosphere 2019, 10, 512. [CrossRef]
37. Von Schneidemesser, E.; Kutzner, R.D.; Schmale, J. A survey on the perceived need and value of decision-support tools for jointmitigation of air pollution and climate change in cities. Elem. Sci. Anthr. 2017, 5, 68. [CrossRef]
38. Gulia, S.; Nagendra, S.S.; Khare, M.; Khanna, I. Urban air quality management-A review. Atmos. Pollut. Res. 2015, 6, 286–304.[CrossRef]
39. Naiker, Y.; Diab, R.; Zunckel, M.; Hayes, E. Introduction of local Air Quality Management in South Africa: Overview andchallenges. Environ. Sci. Policy 2012, 17, 62–71. [CrossRef]
40. Johansson, C.; Burman, L.; Forsberg, B. The effects of congestions tax on air quality and health. Atmos. Environ. 2009, 43,4843–4854. [CrossRef]
41. Karatzas, K.; Dioudi, E.; Moussiopoulos, N. Identification of major components for integrated urban air quality management andinformation systems via user requirements prioritisation. Environ. Model. Softw. 2003, 18, 173–178. [CrossRef]
42. The Danish Environment Research Institute (DNERI). Comparison of the EU and US Air Quality Standards and Planning Requirements;A Project of DG Environment Carried Out by Milieu Ltd.; The Danish Environment Research Institute and The Center for CleanAir Policy: Roskilde, Denmark, 2004; 58p.
43. AIRNow. Available online: https://www.airnow.gov.com (accessed on 15 January 2022).44. Gwaze, P.; Mashele, S.H. South African Air Quality Information System (SAAQIS) mobile application tool: Bringing real time
state of air quality to South Africans. Clean Air J. 2018, 28, 3–4. [CrossRef]45. AQICN. Available online: https://aqicn.org (accessed on 15 January 2022).46. SAFAR-India. Available online: http://safar.tropmet.res.in (accessed on 15 January 2022).47. AirDMS. Available online: https://www.airdms.gr (accessed on 15 January 2022).48. Coulby, G.; Clear, A.; Jones, O.; Godfrey, A. A Scoping Review of Technological Approaches to Environmental Monitoring. Int. J.
Environ. Res. Public Heal. 2020, 17, 3995. [CrossRef]49. Khan, Z.; Anjum, A.; Soomro, K.; Tahir, M.A. Towards cloud based big data analytics for smart future cities. J. Cloud Comput. Adv.
Syst. Appl. 2015, 4, 2. [CrossRef]50. Kaginalkar, A.; Kumar, S.; Gargava, P.; Niyogi, D. Review of Urban Computing in Air Quality Management as Smart City Service:
An Integrated IoT, AI, and Cloud Technology Perspective. Urban Climate 2021, 39, 100972. [CrossRef]51. Haklay, M.; Weber, P. OpenStreetMap: User-Generated Street Maps. IEEE Pervasive Comput. 2008, 7, 12–18. [CrossRef]52. Brambilla, M.; Cabot, J.; Izquierdo, J.L.C.; Mauri, A. Better call the crowd: Using crowdsourcing to shape the notation of domain-
specific languages. In Proceedings of the 10th ACM SIGPLAN International Conference on Software Language Engineering,Vancouver, BC, Canada, 23–24 October 2017; Association for Computing Machinery (ACM): New York, NY, USA, 2017; pp. 129–138.
53. Donohue, R.G.; Sack, C.M.; Roth, R. Time Series Proportional Symbol Maps with Leaflet and jQuery. Cartogr. Perspect. 2014, 76,43–66. [CrossRef]

Climate 2022, 10, 39 15 of 15
54. DEFRA. Available online: https://uk-air.defra.gov.uk/air-pollution/daqi (accessed on 13 January 2022).55. RGraph. Available online: https://www.rgraph.net (accessed on 13 January 2022).56. Apphp. Available online: https://www.apphp.com (accessed on 13 January 2022).57. PhpSpreadsheet. Available online: https://github.com/PHPOffice/PhpSpreadsheet (accessed on 13 January 2022).58. Microsoft Excel. Available online: https://www.microsoft.com/en/microsoft-365/microsoft-office?rtc=1 (accessed on 13 January
2022).59. Libreoffice. Available online: https://www.libreoffice.org (accessed on 13 January 2022).60. Mpdf. Available online: https://mpdf.github.io (accessed on 13 January 2022).61. Triantafyllou, A.; Evagelopoulos, V.; Zoras, S. Design of a web-based information system for ambient environmental data. J.
Environ. Manag. 2006, 80, 230–236. [CrossRef]
Related Documents