Closure duration and VOT of word-initial voiceless plosives in English in spontaneous connected speech Yao Yao Abstract This is a corpus study on closure duration and VOT in English voiceless stops in word-initial position. 19 speakers’ (10 female, 9 male) data from the Buckeye Speech corpus are used in the study. The first half of the paper introduces a novel approach of automatically finding the point of stop release in large speech database, using Mel spectral templates and similarity scores. The performance and robustness of the algorithm is discussed in detail. To our knowledge, this is also the first automatic measure of closure duration and VOT that is reported in detail in the literature. The second half of the paper studies the closure duration and VOT as calculated by the procedure described in the first half, and investigate the correlation between these durations and a number of linguistic and extra-linguistic factors. 1 Introduction Voice onset time (VOT) is a well-studied topic in phonetics. It has been shown that VOT in voiceless stops varies with a number of factors, among which the most established one is place of articulation. Zue (1976), Crystal and House (1987), and Byrd (1993) all find longer VOT for velars compared to labials and alveolars in connected read speech. Additionally, Crystal and House (1987) and Byrd (1993) both find that alveolars have on average longer releases than bilabials. In other words, the release duration increases as the point of contact moves from the lips to the velum. Cho and Ladefoged’s (1999) cross-linguistic study of 18 languages suggests that this rule might be universally true. In recent years, more and more studies have focused on the relation between VOT and other possible correlates. Roughly speaking, the proposed correlates can be divided into two categories, speaker-related and non-speaker-related. The most widely-studied speaker-related factors are gender, age, speaking rate, lung volume, and individual talking style. In addition to place of production, other non-speaker-related factors include phonetic context, word frequency, and laboratory environmental setting. 1.2 VOT and gender Whiteside and Irving (1998) studied 36 isolated words spoken by 5 men and 5 women, all in their twenties or thirties, and showed that the female speakers had on average longer VOT for voiceless plosives than the male speakers, and the results were corroborated by several other studies (Koenig 2000, Ryalls et al. 1997, Whiteside and Marshall 2001, Robert et al. 2005, among others). Whiteside et al (2003) reported a developmental study on 5 groups of 46 boys and girls aged 5;8 (5 years, 8 months) to 13;2, all of whom were British English speakers, and the study suggested that sex UC Berkeley Phonology Lab Annual Report (2007) 183

Welcome message from author
This document is posted to help you gain knowledge. Please leave a comment to let me know what you think about it! Share it to your friends and learn new things together.
Transcript

Closure duration and VOT of word-initial voiceless plosives in
English in spontaneous connected speech
Yao Yao
Abstract
This is a corpus study on closure duration and VOT in English voiceless stops in
word-initial position. 19 speakers’ (10 female, 9 male) data from the Buckeye
Speech corpus are used in the study. The first half of the paper introduces a novel
approach of automatically finding the point of stop release in large speech database,
using Mel spectral templates and similarity scores. The performance and robustness
of the algorithm is discussed in detail. To our knowledge, this is also the first
automatic measure of closure duration and VOT that is reported in detail in the
literature. The second half of the paper studies the closure duration and VOT as
calculated by the procedure described in the first half, and investigate the correlation
between these durations and a number of linguistic and extra-linguistic factors.
1 Introduction
Voice onset time (VOT) is a well-studied topic in phonetics. It has been shown that
VOT in voiceless stops varies with a number of factors, among which the most
established one is place of articulation. Zue (1976), Crystal and House (1987), and
Byrd (1993) all find longer VOT for velars compared to labials and alveolars in
connected read speech. Additionally, Crystal and House (1987) and Byrd (1993)
both find that alveolars have on average longer releases than bilabials. In other
words, the release duration increases as the point of contact moves from the lips to the
velum. Cho and Ladefoged’s (1999) cross-linguistic study of 18 languages suggests
that this rule might be universally true.
In recent years, more and more studies have focused on the relation between VOT
and other possible correlates. Roughly speaking, the proposed correlates can be
divided into two categories, speaker-related and non-speaker-related. The most
widely-studied speaker-related factors are gender, age, speaking rate, lung volume,
and individual talking style. In addition to place of production, other
non-speaker-related factors include phonetic context, word frequency, and laboratory
environmental setting.
1.2 VOT and gender
Whiteside and Irving (1998) studied 36 isolated words spoken by 5 men and 5 women,
all in their twenties or thirties, and showed that the female speakers had on average
longer VOT for voiceless plosives than the male speakers, and the results were
corroborated by several other studies (Koenig 2000, Ryalls et al. 1997, Whiteside and
Marshall 2001, Robert et al. 2005, among others). Whiteside et al (2003) reported a
developmental study on 5 groups of 46 boys and girls aged 5;8 (5 years, 8 months) to
13;2, all of whom were British English speakers, and the study suggested that sex
UC Berkeley Phonology Lab Annual Report (2007)
183

differences in VOT, in the same form as found for adults, started to appear well before
adolescence. The factors that contribute to the sex differences in VOT have not been
fully studied, but it has been suggested that physiological and anatomical differences,
as well as sociophonetic factors could at least partially account for the observed
differences. However, it should be noted that there are also studies which report no
significant sex differences found in VOT, e.g. Ryalls et. al (2002) (see the discussion
in 1.3) and Syrdal (1996).
1.3 VOT and age
Petrosino et al’s 1993 study on velar stop production in aged speakers found no
significant differences in mean VOT of [k] and [g] across the three vowel contexts
between two age groups, though differences in VOT variability (standard deviation)
approached significance. Similarly, a study conducted by Neiman et al in 1983 on
VOT in young and 70-year-old women found that VOT was generally the same in the
two age groups, and it was only in certain phonetic contexts that older subjects
demonstrated significantly shorter VOT.
However, Ryalls et al (2002) found significant age differences in VOT for
English voiceless plosives. They replicated an earlier study (Ryalls et al. 1997) on
younger speakers among older speakers. The earlier study found significant effects
of gender and race on VOT in younger speakers, but the 2002 study found no
significant effects of gender or ethnicity in older speakers. Interestingly, significant
differences were found between the average VOT of the two age groups as older
subjects’ VOT’s are consistently shorter than those of younger subjects (with the
difference ranging from 12 ms to 20 ms for [p], [t], [k]). It was also found that the
average syllable duration of older subjects, on the other hand, exceeded that of
younger speakers by about 100 ms, which was counter-intuitive since a lower
speaking rate ought to yield a longer VOT (the relation between VOT and speaking
rate will be discussed in 1.4). A tentative explanation was the smaller lung volumes
on the part of older speakers. But it is worth noticing from this study that aging
might also affect VOT in an indirect way, by masking the effect of other factors, such
as gender and race.
1.4 VOT, speaking rate and individual talker differences
VOT is found to be negatively correlated with speaking rate and the correlation is
highly significant, especially for voiceless stop consonants (Kessinger and Blumstein
1998, Volaitis and Miller 1992). This is not surprising at all, since, intuitively, as a
speaker slows down the speaking rate, all the phonetic segments would be stretched
and therefore they should all show an increase in duration. Allen et al (2003)
reported a study in which four female speakers and four male speakers were recorded
saying a list of 18 monosyllabic English words beginning with voiceless stops. The
results showed that 82% of the total variability was attributable to differences among
talkers in overall speaking rate, while 43% of the remaining variability (or 8% of the
total variability) was explained by individual talker identity, leaving 57% unexplained
(i.e. true error). Meanwhile, intrinsic word duration (mostly due to the different
UC Berkeley Phonology Lab Annual Report (2007)
184

vowels) was found to have no significant effect on VOT.
1.5 VOT and lung volume
Hoit et al (1993) found in a study of five adult male speakers that VOT was longer
when produced at high lung volumes and shorter when produced at low lung volumes
in most cases, which pointed out the need to take lung volume into account when
studying the correlation between VOT and other factors. As mentioned above,
Ryalls et al. (2002) considered relatively low lung volumes in older speakers as the
main reason for their shorter VOT’s compared to younger speakers.
1.6 VOT and other speaker-related factors
Other factors such as ethnic background (Ryalls et al. 1997), dialectal background
(Schmidt and Flege 1996, Syrdal 1996 ), presence of speech disorders (Baum and
Ryan 1993, Ryalls et al 1999), and hormone levels in female speakers (Whiteside et al.
2004b) have also been studied, but no convincing correlations have been established.
1.7 VOT and non-speaker-related factors
The most important non-speaker related factor is place of articulation. As mentioned
in the beginning, it is widely acknowledged that VOT in English voiceless stops
increases as the contact point moves from the lips to the velum. The other
non-speaker factor that is often mentioned in the literature is the phonetic context, or
more specifically, the following vowel. However, previous literature presents a split
in opinion with regard to this point. Since most of the previous studies involving
VOT are based on VOT values in syllables across different vowel types (most
typically including the three extreme vowels, [a], [i], and [u]), many of them have
reported that certain trends are only observed in certain vowel setting (Whiteside et al.
2004a, Neiman et al. 1983, etc). Nonetheless, as mentioned above in 1.4, Allen et al
(2003) reported no significant effects of phonetic contexts on VOT.
Robb et al (2005) reported that the subjects produced longer VOT in a
laboratory-setting than in a non-laboratory-setting, which suggested that
environmental setting might have an effect on speech style, which in turn would affect
the length of VOT.
1.8 Closure duration
Compared to the large literature on VOT in English, not many studies have
investigated the closure duration. Zue (1976) found longer closure portions for [p]
than [t] and [k]. However, Crystal and House (1987) reported that the duration of
closure in alveolar stops are slightly but consistently shorter than that of bilabials and
velars, while bilabials and velars are very similar in closure durations. Byrd’s (1993)
report on stops in TIMIT, on the other hand, supports Zue’s finding of longer closure
portions for [p].
1.9 Current study
In the broad literature on English VOT and its correlation with other factors, a
wide range of speakers were studied, however, most of the studies relied on data from
UC Berkeley Phonology Lab Annual Report (2007)
185
specifically designed lab experiments, usually in the form of reading word lists or
producing target syllables in a carrier phrase. Therefore, these studies typically have
a small pool of target syllables, a relatively low variability in phonetic context, as well
as a small set of subjects. The only two exceptions are Byrd (1993) and Crystal and
House (1987), both of which studied VOT in (read) connected speech corpus. The
TIMIT corpus that Byrd studied in Byrd (1993) contains 2,342 different sentences
read by 630 speakers (ten sentences per speaker). Crystal and House (1987) studied
the readings of two scripts (totaling approximately 600 words) by 14 speakers.
The current study uses data from the Buckeye speech corpus (Pitt et al., 2005).
The corpus was developed at Ohio State University
(http://www.buckeyecorpus.osu.edu/), and consists of recordings of spontaneous
speech of 40 speakers, all long-time local Ohio residents. The Buckeye Corpus is
orthographically transcribed and phonetically labeled. However, it is not labeled for
the point of release in stops. Thus the first half of this paper (mostly the
methodology section) will introduce and discuss the technical details of a novel
approach for automatically finding the point of release in voiceless stops. The
second half of the paper is devoted to the discussion on the distribution of closure
duration and VOT both inter- and intra- speakers and how they correlate with the
following five factors: place of articulation, age, gender, speaking rate, and word
frequency.
2. Methodology
2.1 Buckeye Corpus
The Buckeye Corpus contains recordings from 40 speakers (20 male, 20 female, 20
young – under 30, 20 old – over forty) in Columbus OH conversing freely with an
interviewer. All speakers are Caucasian, long time local residents of Columbus.
Each speaker was being interviewed for about an hour, not knowing the research
purpose of the interview until the recording was done. The speech style was
unmonitored casual speech. The acoustic signal was digitally recorded in a quiet
room with a close-talking head-mounted microphone. Currently the recordings of 20
talkers (10 male, 10 female, 10 young, 10 old) have been transcribed and phonetically
labeled. The data from all but one of these speakers are used in this study. A
young male speaker’s data were not included due to an inconsistency in the label files.
Two types of phonetic labeling are used in the corpus: word labeling and phone
labeling. At the word level, an utterance of a word is stored with both the spelling
form and the actual pronunciation, as well as a timestamp indicating the end of the
word; at the phone level, each phone – an actual sound uttered by the speaker, not
necessarily a sound in the citation form of the uttered word – is stored with the phone
name and a timestamp indicating the end point of the phone. In addition, since
labeling is done in an exhaustive way, i.e. every point in the recording has a
corresponding label in the label files, there are also labels that represent non-linguistic
sounds, including silence, noise, laughter, and interviewer sounds (interviewer’s
speech is not recorded or transcribed). Silence in a running speech flow of the
speaker is not transcribed as silence, but attributed to the neighboring sounds.
UC Berkeley Phonology Lab Annual Report (2007)
186
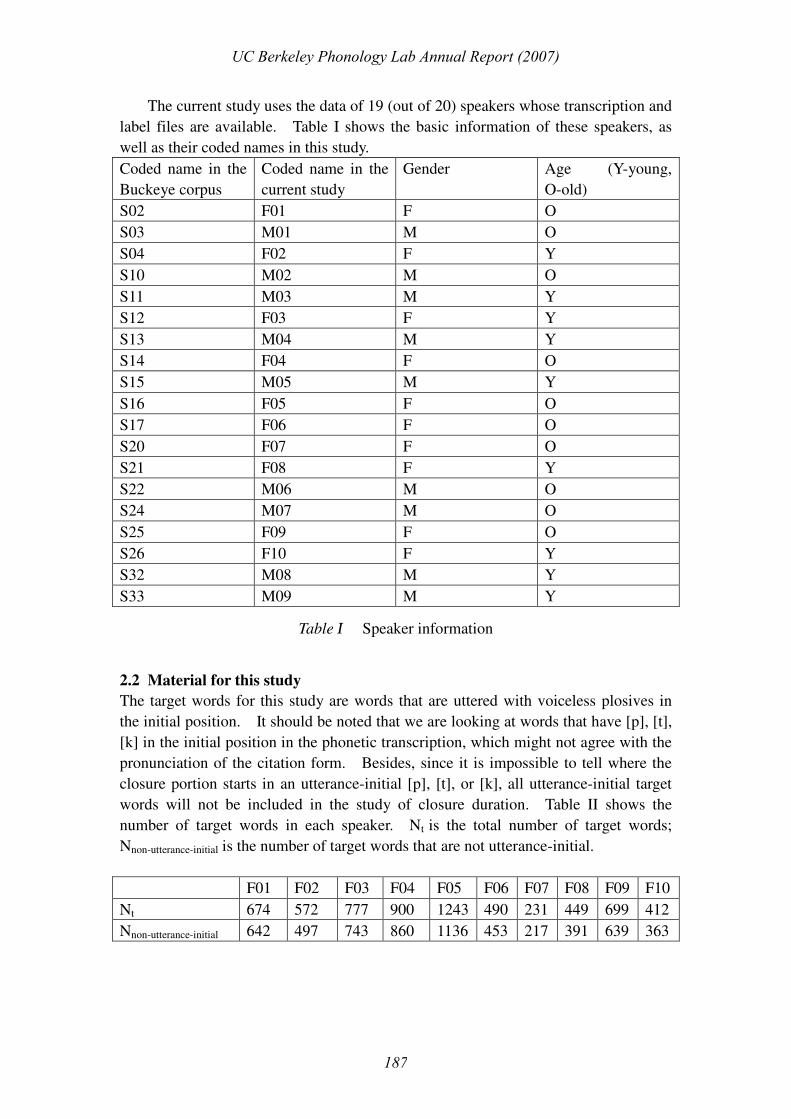
The current study uses the data of 19 (out of 20) speakers whose transcription and
label files are available. Table I shows the basic information of these speakers, as
well as their coded names in this study.
Coded name in the
Buckeye corpus
Coded name in the
current study
Gender Age (Y-young,
O-old)
S02 F01 F O
S03 M01 M O
S04 F02 F Y
S10 M02 M O
S11 M03 M Y
S12 F03 F Y
S13 M04 M Y
S14 F04 F O
S15 M05 M Y
S16 F05 F O
S17 F06 F O
S20 F07 F O
S21 F08 F Y
S22 M06 M O
S24 M07 M O
S25 F09 F O
S26 F10 F Y
S32 M08 M Y
S33 M09 M Y
Table I Speaker information
2.2 Material for this study
The target words for this study are words that are uttered with voiceless plosives in
the initial position. It should be noted that we are looking at words that have [p], [t],
[k] in the initial position in the phonetic transcription, which might not agree with the
pronunciation of the citation form. Besides, since it is impossible to tell where the
closure portion starts in an utterance-initial [p], [t], or [k], all utterance-initial target
words will not be included in the study of closure duration. Table II shows the
number of target words in each speaker. Nt is the total number of target words;
Nnon-utterance-initial is the number of target words that are not utterance-initial.
F01 F02 F03 F04 F05 F06 F07 F08 F09 F10
Nt 674 572 777 900 1243 490 231 449 699 412
Nnon-utterance-initial 642 497 743 860 1136 453 217 391 639 363
UC Berkeley Phonology Lab Annual Report (2007)
187
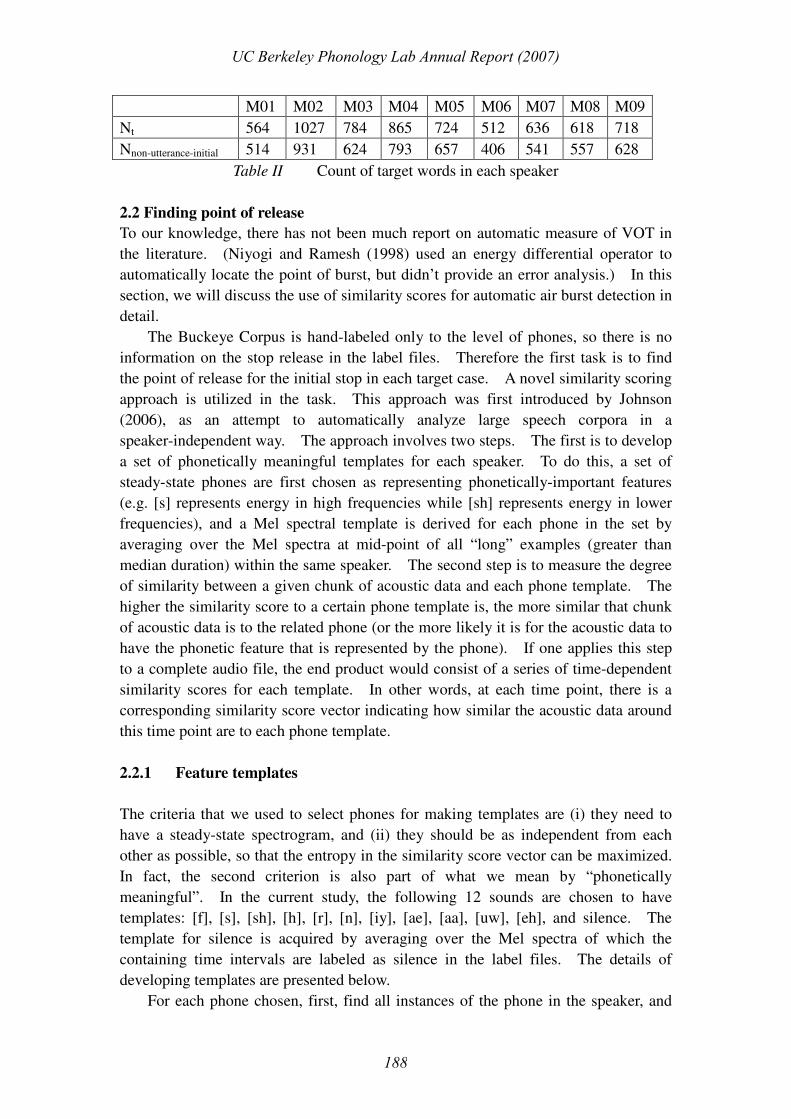
M01 M02 M03 M04 M05 M06 M07 M08 M09
Nt 564 1027 784 865 724 512 636 618 718
Nnon-utterance-initial 514 931 624 793 657 406 541 557 628
Table II Count of target words in each speaker
2.2 Finding point of release
To our knowledge, there has not been much report on automatic measure of VOT in
the literature. (Niyogi and Ramesh (1998) used an energy differential operator to
automatically locate the point of burst, but didn’t provide an error analysis.) In this
section, we will discuss the use of similarity scores for automatic air burst detection in
detail.
The Buckeye Corpus is hand-labeled only to the level of phones, so there is no
information on the stop release in the label files. Therefore the first task is to find
the point of release for the initial stop in each target case. A novel similarity scoring
approach is utilized in the task. This approach was first introduced by Johnson
(2006), as an attempt to automatically analyze large speech corpora in a
speaker-independent way. The approach involves two steps. The first is to develop
a set of phonetically meaningful templates for each speaker. To do this, a set of
steady-state phones are first chosen as representing phonetically-important features
(e.g. [s] represents energy in high frequencies while [sh] represents energy in lower
frequencies), and a Mel spectral template is derived for each phone in the set by
averaging over the Mel spectra at mid-point of all “long” examples (greater than
median duration) within the same speaker. The second step is to measure the degree
of similarity between a given chunk of acoustic data and each phone template. The
higher the similarity score to a certain phone template is, the more similar that chunk
of acoustic data is to the related phone (or the more likely it is for the acoustic data to
have the phonetic feature that is represented by the phone). If one applies this step
to a complete audio file, the end product would consist of a series of time-dependent
similarity scores for each template. In other words, at each time point, there is a
corresponding similarity score vector indicating how similar the acoustic data around
this time point are to each phone template.
2.2.1 Feature templates
The criteria that we used to select phones for making templates are (i) they need to
have a steady-state spectrogram, and (ii) they should be as independent from each
other as possible, so that the entropy in the similarity score vector can be maximized.
In fact, the second criterion is also part of what we mean by “phonetically
meaningful”. In the current study, the following 12 sounds are chosen to have
templates: [f], [s], [sh], [h], [r], [n], [iy], [ae], [aa], [uw], [eh], and silence. The
template for silence is acquired by averaging over the Mel spectra of which the
containing time intervals are labeled as silence in the label files. The details of
developing templates are presented below.
For each phone chosen, first, find all instances of the phone in the speaker, and
UC Berkeley Phonology Lab Annual Report (2007)
188

get the medial phone duration. Second, disregard all instances with a shorter
duration than the medial duration value (which would exclude half of the instances).
Third, for each remaining instance, calculate a Mel frequency spectral vector using a
20 ms analysis window centered at the center of the phone and store the vector in a
60-bin array. This is done by the following XWAVES command:
(1) fft –z –wHamming –l$w –r$s:+$w-1 –o10 - - | melspec –n60 - -| pplain
–fre_spec_val -
where $w is the variable that stores window size, and $s stores the starting
point of the analysis window
Last, average over the Mel spectral vectors calculated in the previous step. The
final template consists of an average spectral vector of 60 dimensions, as well as the
standard deviation of each dimension.
The spectral templates of some selected phones ([a], [f], and silence) of speaker
F01 are shown below in Figure 1.
1a 1b
1c
2.2.2 Similarity Scores
A similarity score measures how similar the current frame (window size=20ms) is to a
spectral template by comparing the Mel spectral vector of the current frame to the
average Mel spectral vector of the template. The Mel spectral vector of the current
Fig. 1a is the spectral
template for [a]; Fig. 1b is
the spectral template for [f];
Fig. 1c is the spectral
template for silence. The
X-axis represents 60
equidistant bins on the Mel
scale from 0 to 8000. All
figures are made by speaker
F01’s data.
UC Berkeley Phonology Lab Annual Report (2007)
189
frame is computed using the XWAVES commands in (1). If the current acoustic data
is longer than 20ms, a similarity score will be calculated every 5ms (step size = 5ms).
On the time scale, the calculated similarity score will be associated with the midpoint
of the frame.
A similarity measure is calculated in two steps. First a distance measure
between the two vectors is calculated using the following formula:
(2a) di = n
sdux
ij
i
j
ijj
,1
,
1||∑
=
−
(where di is the distance measure to between the current frame and template i; xj
is the jth coordinate in the current vector, and uj,i is the jth coordinate in the
average spectral vector of template i; sdj,i is the standard deviation of the jth
coordinate in the average Mel spectral vector of template i.)
Second, the distance measure is normalized using the exponential function with
k=-0.005.
(2b) Si = e-0.005di
(where Si is the similarity score of the current frame to template i. )
Figure 2 illustrates the similarity scores for two templates, [s] (in blue/grey) and
silence (in black/dark), for the utterance of the word “personality” by speaker M08.
UC Berkeley Phonology Lab Annual Report (2007)
190
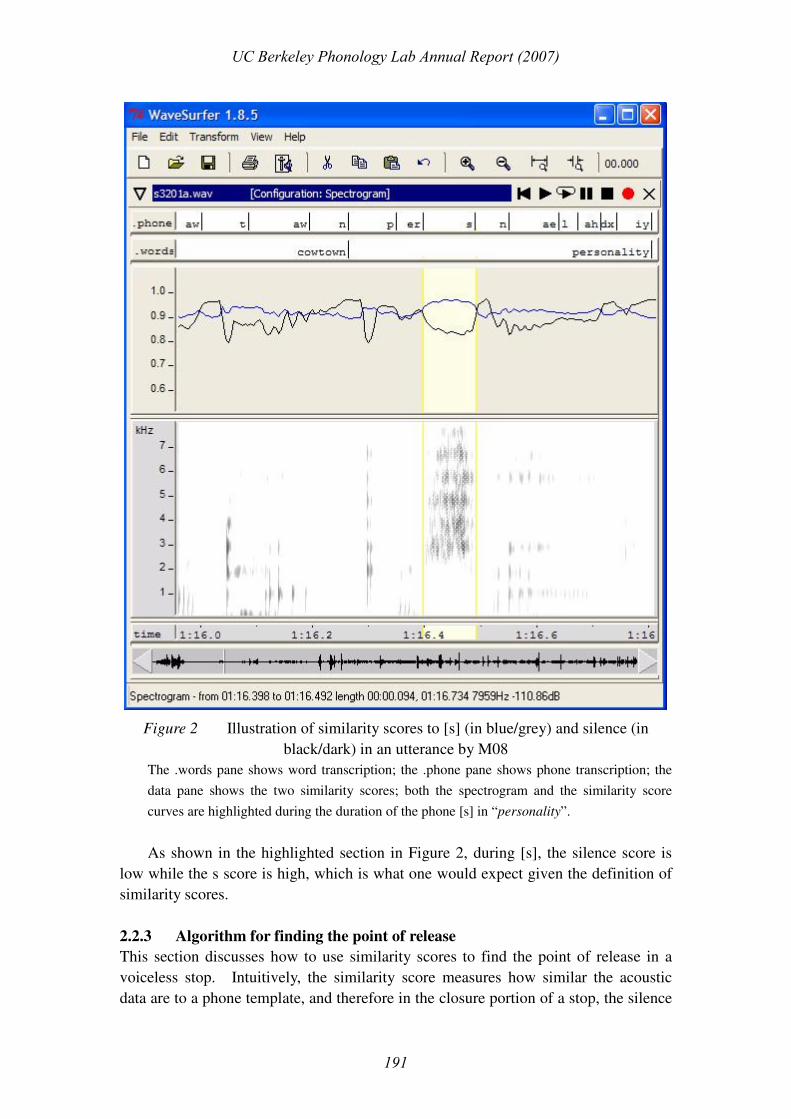
Figure 2 Illustration of similarity scores to [s] (in blue/grey) and silence (in
black/dark) in an utterance by M08
The .words pane shows word transcription; the .phone pane shows phone transcription; the
data pane shows the two similarity scores; both the spectrogram and the similarity score
curves are highlighted during the duration of the phone [s] in “personality”.
As shown in the highlighted section in Figure 2, during [s], the silence score is
low while the s score is high, which is what one would expect given the definition of
similarity scores.
2.2.3 Algorithm for finding the point of release
This section discusses how to use similarity scores to find the point of release in a
voiceless stop. Intuitively, the similarity score measures how similar the acoustic
data are to a phone template, and therefore in the closure portion of a stop, the silence
UC Berkeley Phonology Lab Annual Report (2007)
191
score should be high, while in the release portion it should be much lower since the
spectrogram is almost noise-like. In other words, at the point of release, there should
be a significant drop in the silence score. Simultaneous with this change, there
should be an increase in similarity scores to [h], [sh], and [s], since these phones are
characteristic of energy across a wide range of frequency (cf. Figure 2). In fact, we
do see this pattern in similarity scores around the point of burst. Figure 3 illustrates
three target words said by speaker F01, which start with [p], [t], [k] respectively. In
all three cases, the data pane shows similarity scores for silence, [sh], [s], and [h].
The order of the score curve is indicated in the box on the right. In all three figures,
only the similarity scores in the target word are shown; elsewhere, they are merely
straight lines connecting between target words. In Figure 3b and 3c, the point of
burst is marked by the cursor (in red/grey), while in Figure 3a it is marked by a
bi-directional arrow because the first release is very weak and the streak in
spectrogram would easily be covered by the cursor line.
UC Berkeley Phonology Lab Annual Report (2007)
192
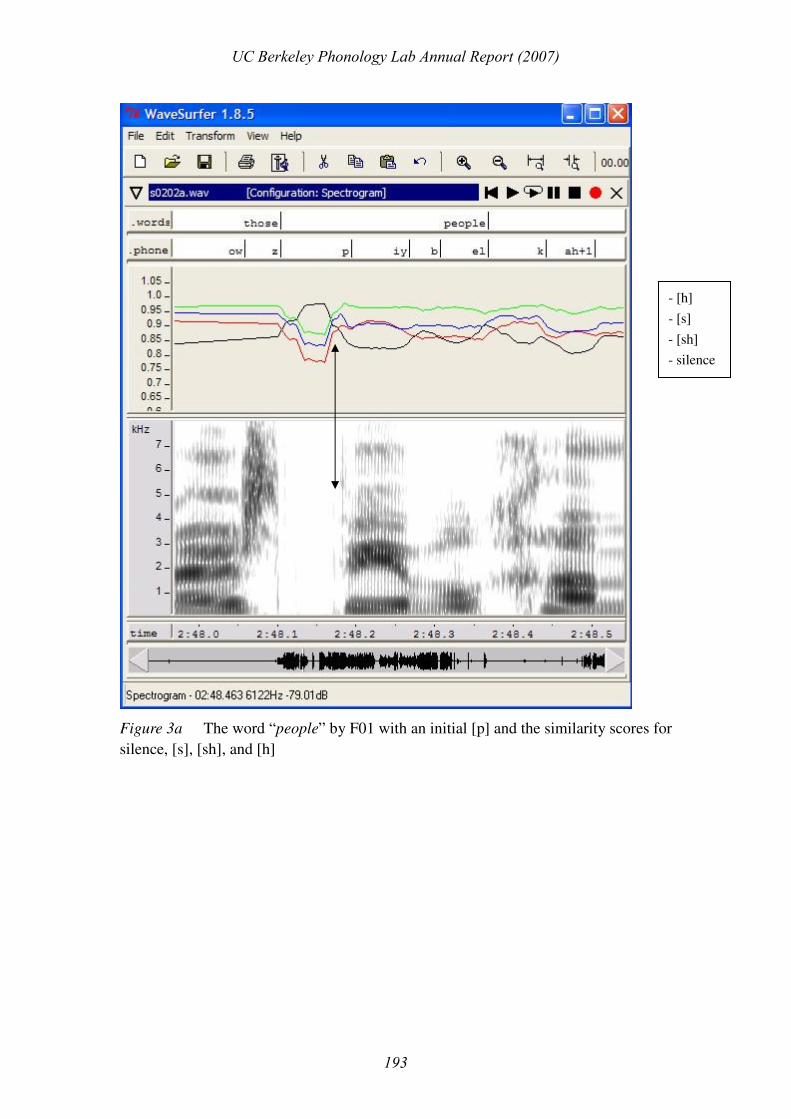
Figure 3a The word “people” by F01 with an initial [p] and the similarity scores for
silence, [s], [sh], and [h]
- [h]
- [s]
- [sh]
- silence
UC Berkeley Phonology Lab Annual Report (2007)
193

Figure 3b The word “doing” by F01 with an initial [t] and the similarity scores to
silence, [s], [sh], and [h]
- [h]
- [s]
- [sh]
- silence
UC Berkeley Phonology Lab Annual Report (2007)
194

Figure 3c The word “countries” by F01 with an initial [k] and the similarity scores
to silence, [s], [sh], and [h]
As seen from above, the similarity scores for [sh], [s], and [h] (for the sake of
simplicity, they will be referred to as <sh> score, <s> score, and <h> score
respectively) rise significantly around the point of burst, where the <silence> score
drops significantly. In view of this, we first implemented an algorithm that found the
time points corresponding to the highest peaks in <sh> score, <s> score, and <h>
score, and the time point corresponding to the lowest valley in <silence> score.
Therefore, the algorithm produced four candidates for the point of burst for each
target case. In order to test the results, we hand tagged the point of release in all
target cases of speaker F07. This speaker was chosen both because she has the
smallest target set among all speakers and because her average speaking rate
(measured in the number of syllables per sec) is the lowest (which probably make
- [h]
- [s]
- [sh]
- silence
UC Berkeley Phonology Lab Annual Report (2007)
195
automatic processing easier). When deciding the point of burst manually, we mainly
relied on the cues in the spectrogram, and in cases where it’s hard to decide from the
spectrogram, we also used waveforms as second evidence. If the phone has more
than one release, the earliest one will be taken to be the real point of burst. The
comparison of the true values and the four candidates given by the program showed
that the best prediction was made by the <silence> score, with an average error (RMS
(error)) of around 10ms. However, 10ms of error is still higher than tolerable for
studying the distribution of VOT and closure durations. We also tried fitting the data
with linear regressions of different combinations of the four estimates, but it didn’t
reduce the error significantly.
More careful observation of the scoring pattern revealed that slope was a better
predictor than absolute score value for the point of burst because the lowest valley or
highest peak in <silence> score could occur either before, around or after the point of
burst, but the most drastic dropping or rising in scores (i.e. the point with the greatest
slope) occurs consistently near (usually a few milliseconds before) the burst. Figure
4 illustrates the problem with a [k]-initial target word said by speaker M01. Only
two scores, <silence> (in black/dark) and <sh> (in red/grey), are shown for simplicity.
It can be seen that the true burst point (where the lower arrow points to on the
spectrogram) is very close to the end point of the most drastic dropping in <silence>
score and the most drastic rising in <sh> score, as pointed by the bi-directional arrow.
After the release, <silence> score keeps dropping and <sh> score keeps rising, both at
slower rate though, and as a result, both the valley in <silence> score and the peak in
<sh> score (pointed approximately by the two unidirectional arrows) occur tens of
milliseconds after the release.
UC Berkeley Phonology Lab Annual Report (2007)
196
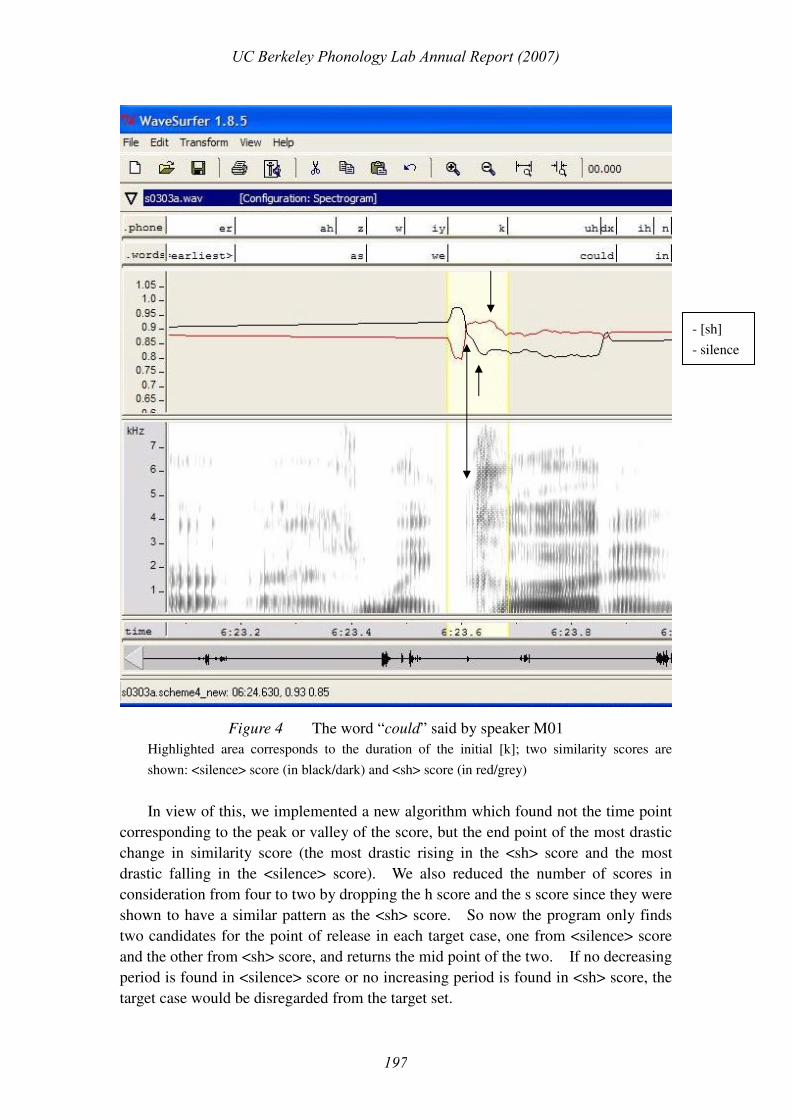
Figure 4 The word “could” said by speaker M01
Highlighted area corresponds to the duration of the initial [k]; two similarity scores are
shown: <silence> score (in black/dark) and <sh> score (in red/grey)
In view of this, we implemented a new algorithm which found not the time point
corresponding to the peak or valley of the score, but the end point of the most drastic
change in similarity score (the most drastic rising in the <sh> score and the most
drastic falling in the <silence> score). We also reduced the number of scores in
consideration from four to two by dropping the h score and the s score since they were
shown to have a similar pattern as the <sh> score. So now the program only finds
two candidates for the point of release in each target case, one from <silence> score
and the other from <sh> score, and returns the mid point of the two. If no decreasing
period is found in <silence> score or no increasing period is found in <sh> score, the
target case would be disregarded from the target set.
- [sh]
- silence
UC Berkeley Phonology Lab Annual Report (2007)
197

Using the new algorithm, the root mean square of error is 7.22ms, which shows a
significant improvement over the 10ms error of the previous algorithm. Moreover, it
is found that the error values (i.e. real point of burst - estimate) are mostly distributed
around 5ms (as shown in Figure 5 below), with a mean of 5.35ms.
Figure 5 Distribution of error values (in s) in F07, using the new algorithm
X-axis shows the error intervals in s, and Y-axis is the number of cases in the error interval
If 5ms is added to all estimated values, the RMS of error is further reduced to
4.85ms, across 231 target cases.
In order to test the robustness of the algorithm, we used part of the data from
another speaker, M08, to do a similar test. Speaker M08 was chosen because he
seemed to be the opposite of speaker F07 in every aspect. As shown in Table III
below, F07 is a female, older speaker with on average a low speaking rate (in fact the
lowest among all 19 speakers), while M08 is a male, younger speaker with the fastest
speaking rate among all talkers. Average speaking rate is measured in the average
number of syllables produced per second.
Gender Age Average Speed Speed rank
F07 F old 4.02 #19
M08 M young 6.43 #1
Table III Comparing speaker F07 and M08
The same procedures were applied to M08’s data. First, the first 261 target
cases of M08 were chosen to comprise a target sample with a comparable size to
F07’s data. Next, all of the 261 cases were hand-tagged for the point of burst in the
initial plosive. This process proved to be much harder than dealing with F07’s data.
UC Berkeley Phonology Lab Annual Report (2007)
198

M08 being both a fast and extremely soft talker (which might actually be due to the
low gain setting during the recording), his data contain many cases in which even an
experienced phonetician would have problems deciding where the point of burst is.
In particular, in some cases, it is clear that the burst doesn’t exist. That is to say,
even if the phone is transcribed as a word-initial voiceless plosive, there is no
closure-release transition during the duration of the phone – either all silence or all
noise throughout the duration. In other cases, the burst is not significant enough.
Some problematic cases are shown below in Figure 6a-c.
Figure 6a “to” said by speaker M08
Highlighted area corresponds to the duration of the initial [t]; two similarity scores are shown:
<silence> score (in black/dark) and <sh> score (in red/grey)
In Figure 6a, the transcribed duration of [t] is basically all blank in spectrogram,
- [sh]
- silence
UC Berkeley Phonology Lab Annual Report (2007)
199

and the production of the following vowel starts right after the silence – in other
words, the stop is incomplete since it doesn’t have a release.
Figure 6b “to” said by speaker M08
Highlighted area corresponds to the duration of the initial [t]; two similarity scores are shown:
<silence> score (in black/dark) and <sh> score (in red/grey)
Figure 6b shows a case where the transcribed duration of the stop is all noise in
spectrogram, with no closure portion.
- [sh]
- silence
UC Berkeley Phonology Lab Annual Report (2007)
200

Figure 6c “question” said by speaker M08
Highlighted area corresponds to the duration of the initial [k]; two similarity scores are
shown: <silence> score (in black/dark) and <sh> score (in red/grey)
Figure 6c shows a word-initial [k] in speaker M08. This velar stop is weakly
(and doubly) released, which corresponds to only two faint streaks on the spectrogram
around the mid point of the duration of the phone, with no noise-like distribution of
energy following the release. The waveform shows no periodicity after the
hypothesized release either, until the following vowel starts. Besides, when listening
to the audio, we can’t hear a velar release throughout the duration of the phone. All
the evidence points to the conclusion that the streak in the spectrogram might just be a
spurious burst, and therefore it shouldn’t be counted as a velar release.
Altogether 23 problematic cases are found among the 261 cases of M08 that are
hand-tagged, and the three cases shown in Figure 6a-c are typical of most of them.
silence -
[sh] -
UC Berkeley Phonology Lab Annual Report (2007)
201

The real points of burst are designated to be the starting point of the phone, in order to
make it possible to calculate the average error value. If anything, this distortion
increases the error value. The RMS error is 13.11ms. The histogram in Figure 7
shows that the majority of errors are in the interval [0, 20ms], however, there exist a
number of outliers with large error values.
Figure 7 Error distribution in M08 after the first rejection rule is applied
X-axis shows the error intervals in s; Y-axis is the number of cases in the error interval;
dataset size = 261 cases
Not surprisingly, the outliers are mostly those problematic cases. If the stop
doesn’t contain a release in the first place, whatever release point found by the
program would be an error. To solve this problem, the algorithm needs to be able to
detect cases with no significant releases and reject them. A rejection rule is
implemented for this purpose.
(3) First rejection rule
A target word will be rejected if the most drastic changes found in scores are not
drastic enough. The delta criterion is defined as a rising rate of 0.02 per step (i.e.
per 5 ms) for <sh> score and a dropping rate of 0.04 per step for the <silence>
score. If the <silence> score and <sh> score don’t meet the delta criterion, the
case will be rejected.
The two cutoff numbers, 0.02 and 0.04, are decided based on M08’s test dataset.
It is observed that when used together, these two cutoff numbers are able to block a
highly exhaustive and exclusive set of the problematic cases of M08, as shown in the
table below.
UC Berkeley Phonology Lab Annual Report (2007)
202
N NP NR NP^R
M08 261 23 28 19
Table IV Number of cases rejected in M7’s examined data, using the cutoff points
0.02 and 0.04
N is the number of all cases that are examined in speaker M08; NP is the number of
problematic cases found in M08; NR is the number of cases that are rejected using the two
cutoff points; NP^R is the number of problematic cases that are rejected.
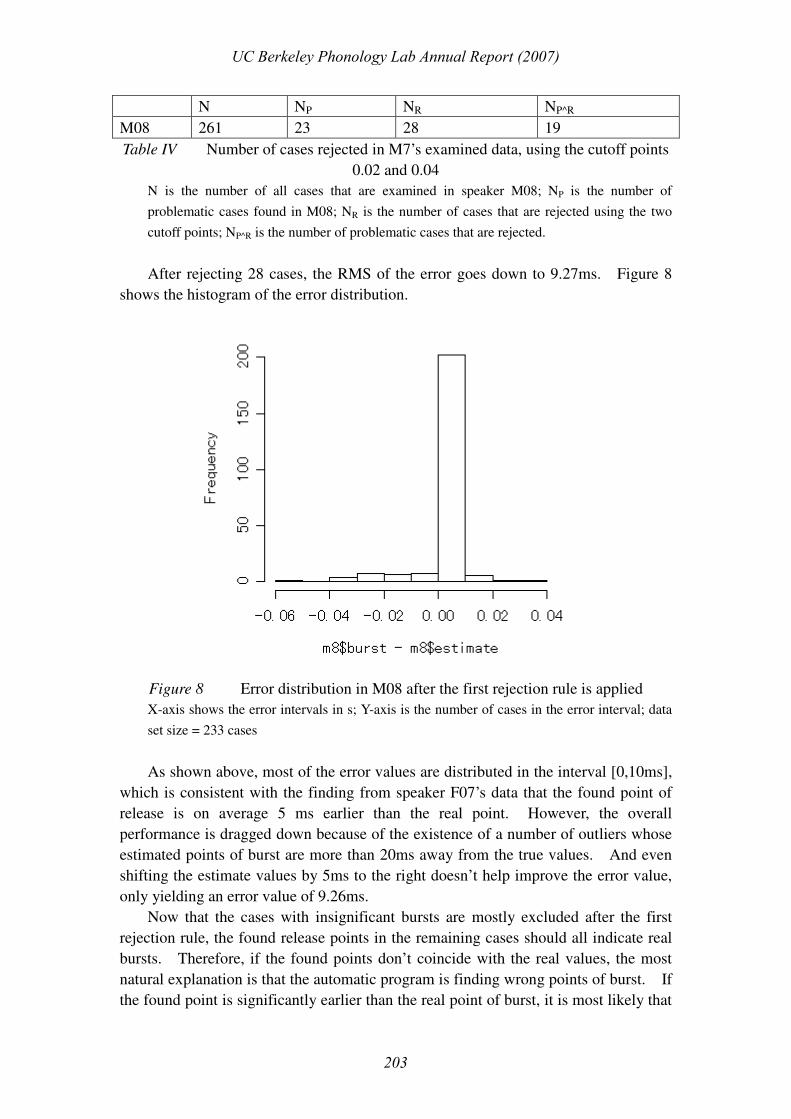
After rejecting 28 cases, the RMS of the error goes down to 9.27ms. Figure 8
shows the histogram of the error distribution.
Figure 8 Error distribution in M08 after the first rejection rule is applied
X-axis shows the error intervals in s; Y-axis is the number of cases in the error interval; data
set size = 233 cases
As shown above, most of the error values are distributed in the interval [0,10ms],
which is consistent with the finding from speaker F07’s data that the found point of
release is on average 5 ms earlier than the real point. However, the overall
performance is dragged down because of the existence of a number of outliers whose
estimated points of burst are more than 20ms away from the true values. And even
shifting the estimate values by 5ms to the right doesn’t help improve the error value,
only yielding an error value of 9.26ms.
Now that the cases with insignificant bursts are mostly excluded after the first
rejection rule, the found release points in the remaining cases should all indicate real
bursts. Therefore, if the found points don’t coincide with the real values, the most
natural explanation is that the automatic program is finding wrong points of burst. If
the found point is significantly earlier than the real point of burst, it is most likely that
UC Berkeley Phonology Lab Annual Report (2007)
203

the program finds a spurious burst (e.g. a transient), which is part of the residual after
the first rejection rule. If the found point is significantly later than the real point of
release, it most likely is a case of multiple release. Multiple release is known to
occur most often in velar stops. In fact, the case with the greatest error value (error
= -60ms) is a multiply-released initial [k], shown in the figure below.
Figure 9 The word “cause” with an initial [k] said by speaker M08
Highlighted area corresponds to the duration of the initial [k]; two similarity scores are
shown: <silence> score (in black/dark) and <sh> score (in red/grey)
The initial [k] in “cause” as shown in the figure above is unusual, not only in the
multiple releases but also in the fact that first three (or four) releases are widely apart.
As shown above, instead of finding the first release (roughly pointed by the
downward arrow), the <silence> score tracker finds the second major release (pointed
by the leftmost upward arrow) while the <sh> score tracker finds the third major
- [sh]
- silence
UC Berkeley Phonology Lab Annual Report (2007)
204
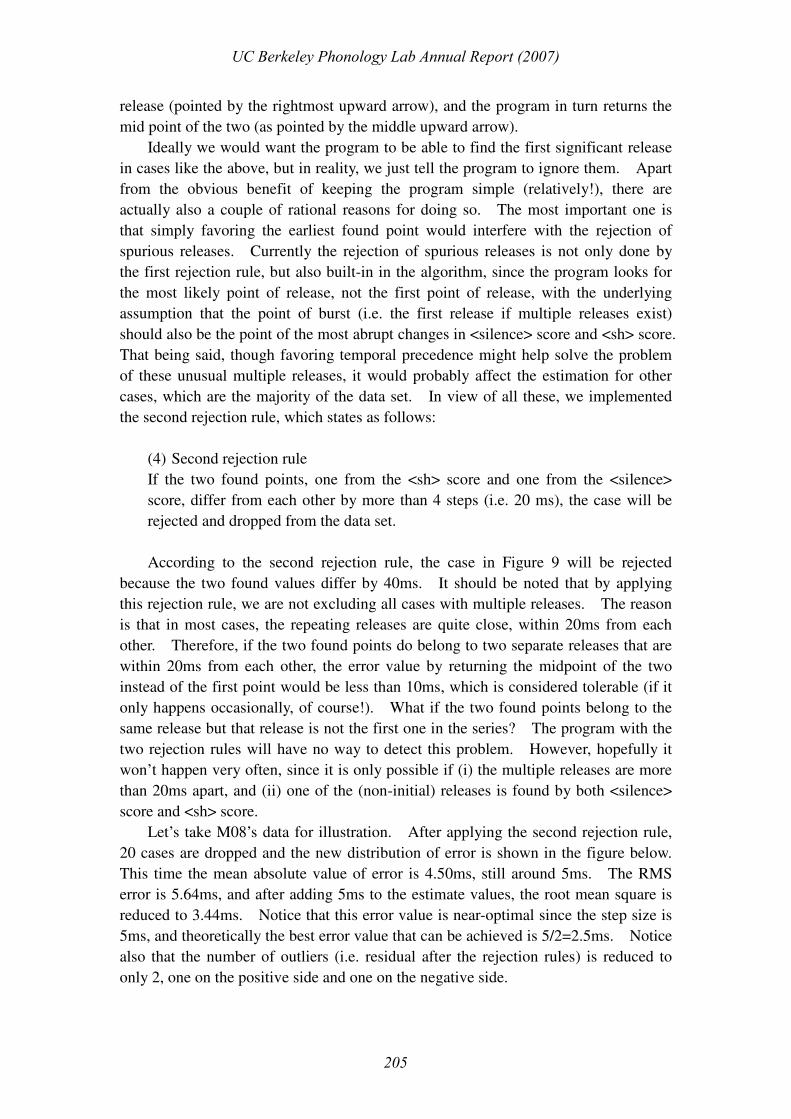
release (pointed by the rightmost upward arrow), and the program in turn returns the
mid point of the two (as pointed by the middle upward arrow).
Ideally we would want the program to be able to find the first significant release
in cases like the above, but in reality, we just tell the program to ignore them. Apart
from the obvious benefit of keeping the program simple (relatively!), there are
actually also a couple of rational reasons for doing so. The most important one is
that simply favoring the earliest found point would interfere with the rejection of
spurious releases. Currently the rejection of spurious releases is not only done by
the first rejection rule, but also built-in in the algorithm, since the program looks for
the most likely point of release, not the first point of release, with the underlying
assumption that the point of burst (i.e. the first release if multiple releases exist)
should also be the point of the most abrupt changes in <silence> score and <sh> score.
That being said, though favoring temporal precedence might help solve the problem
of these unusual multiple releases, it would probably affect the estimation for other
cases, which are the majority of the data set. In view of all these, we implemented
the second rejection rule, which states as follows:
(4) Second rejection rule
If the two found points, one from the <sh> score and one from the <silence>
score, differ from each other by more than 4 steps (i.e. 20 ms), the case will be
rejected and dropped from the data set.
According to the second rejection rule, the case in Figure 9 will be rejected
because the two found values differ by 40ms. It should be noted that by applying
this rejection rule, we are not excluding all cases with multiple releases. The reason
is that in most cases, the repeating releases are quite close, within 20ms from each
other. Therefore, if the two found points do belong to two separate releases that are
within 20ms from each other, the error value by returning the midpoint of the two
instead of the first point would be less than 10ms, which is considered tolerable (if it
only happens occasionally, of course!). What if the two found points belong to the
same release but that release is not the first one in the series? The program with the
two rejection rules will have no way to detect this problem. However, hopefully it
won’t happen very often, since it is only possible if (i) the multiple releases are more
than 20ms apart, and (ii) one of the (non-initial) releases is found by both <silence>
score and <sh> score.
Let’s take M08’s data for illustration. After applying the second rejection rule,
20 cases are dropped and the new distribution of error is shown in the figure below.
This time the mean absolute value of error is 4.50ms, still around 5ms. The RMS
error is 5.64ms, and after adding 5ms to the estimate values, the root mean square is
reduced to 3.44ms. Notice that this error value is near-optimal since the step size is
5ms, and theoretically the best error value that can be achieved is 5/2=2.5ms. Notice
also that the number of outliers (i.e. residual after the rejection rules) is reduced to
only 2, one on the positive side and one on the negative side.
UC Berkeley Phonology Lab Annual Report (2007)
205
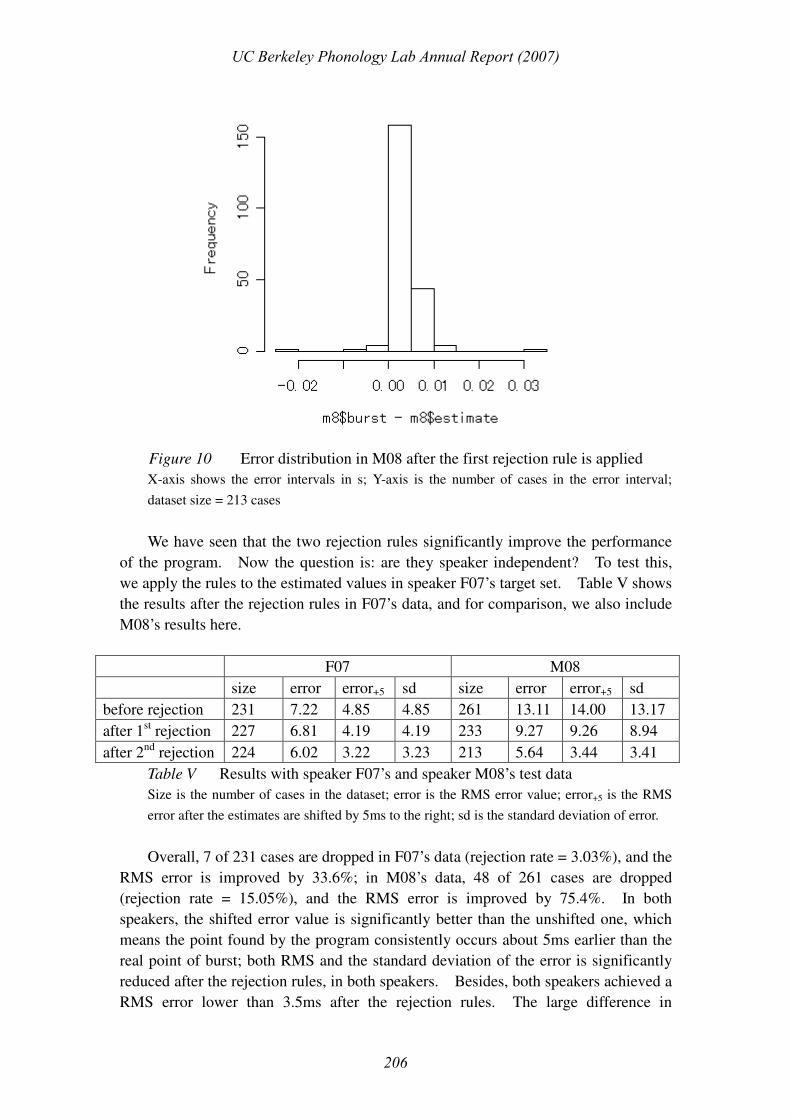
Figure 10 Error distribution in M08 after the first rejection rule is applied
X-axis shows the error intervals in s; Y-axis is the number of cases in the error interval;
dataset size = 213 cases
We have seen that the two rejection rules significantly improve the performance
of the program. Now the question is: are they speaker independent? To test this,
we apply the rules to the estimated values in speaker F07’s target set. Table V shows
the results after the rejection rules in F07’s data, and for comparison, we also include
M08’s results here.
F07 M08
size error error+5 sd size error error+5 sd
before rejection 231 7.22 4.85 4.85 261 13.11 14.00 13.17
after 1st rejection 227 6.81 4.19 4.19 233 9.27 9.26 8.94
after 2nd rejection 224 6.02 3.22 3.23 213 5.64 3.44 3.41
Table V Results with speaker F07’s and speaker M08’s test data
Size is the number of cases in the dataset; error is the RMS error value; error+5 is the RMS
error after the estimates are shifted by 5ms to the right; sd is the standard deviation of error.
Overall, 7 of 231 cases are dropped in F07’s data (rejection rate = 3.03%), and the
RMS error is improved by 33.6%; in M08’s data, 48 of 261 cases are dropped
(rejection rate = 15.05%), and the RMS error is improved by 75.4%. In both
speakers, the shifted error value is significantly better than the unshifted one, which
means the point found by the program consistently occurs about 5ms earlier than the
real point of burst; both RMS and the standard deviation of the error is significantly
reduced after the rejection rules, in both speakers. Besides, both speakers achieved a
RMS error lower than 3.5ms after the rejection rules. The large difference in
UC Berkeley Phonology Lab Annual Report (2007)
206

rejection rate, 3.03% vs. 15.05%, suggests that the rejection rates are
speaker-dependent. Remember that speaker F07 and M08 are chosen because they
are vastly different from each other in their basic information, and also considering
the fact that speaker M08’s data contain a significant portion of problematic cases that
need to be dropped while no particularly difficult cases were noticed in F07’s data
during the hand-tagging process, the low rejection rate in F07 and the relatively high
rejection rate in M08 suggests that the algorithm, together with the rejection rules, is
robust enough to be applied to a wide range of speakers without any changes. The
complete process for finding the point of release is illustrated in the flow chart below.
Y
N
Y
N
Y
N
Figure 11 Flow chart for finding the point of release
We applied the above procedure to all speakers’ data, and the rejection rate ranges
from 3.03% to 30.5%, with the average value of 13.13% and a standard deviation of
8.6%. The details of rejection in all speakers are attached in appendix I. Being
cautious, we compiled a random list of 50 target cases from all speakers, in which
about half of the cases were from speakers with a high rejection rate (>20%), and
manually checked the estimated values. In the 43 cases that are not rejected, error is
always within 5ms; in the 7 cases that are rejected, 3 of the 4 cases rejected by the
first rule and 2 of the 3 cases rejected by the second rule are legitimate. The two
Calculate <silence> score and <sh> score
Calculate the slope in <silence> score and <sh> score
In a labeled voiceless stop span, (i)find the time point of largest positive slope in <sh> score, and
store in p1; (ii)find the time point of smallest negative slope in <silence> score, and store in p2
return (p1+p2)/2+0.005
p1 = null or p2 = null
|p1–p2|>=0.02 s
slope (p1)<0.02 and
slope (p2)>0.04
reject the case
UC Berkeley Phonology Lab Annual Report (2007)
207

wrongly rejected cases are shown in Figure 12a-b below.
Figure 12a “park” said by speaker F02 (rejection rate = 30.5%), which is rejected
for having insignificant changes in <silence> and <sh> score. A phonetician might
want to consider the point around the arrow as the release point.
- [sh]
- silence
UC Berkeley Phonology Lab Annual Report (2007)
208

Figure 12b “kids” said by speaker M02 (rejection rate = 21.7%), which is rejected
for having two peaks that are two far apart. A phonetician might want to consider
the point around the arrow as the release point.
silence -
[sh] -
UC Berkeley Phonology Lab Annual Report (2007)
209
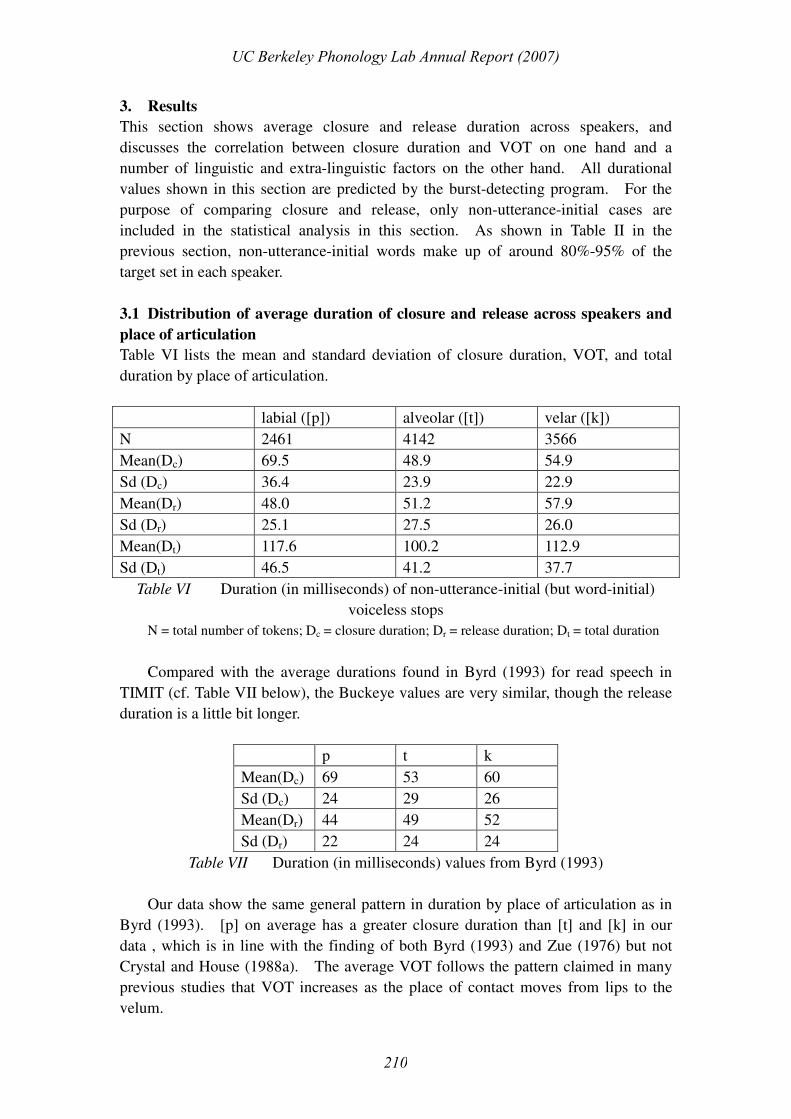
3. Results
This section shows average closure and release duration across speakers, and
discusses the correlation between closure duration and VOT on one hand and a
number of linguistic and extra-linguistic factors on the other hand. All durational
values shown in this section are predicted by the burst-detecting program. For the
purpose of comparing closure and release, only non-utterance-initial cases are
included in the statistical analysis in this section. As shown in Table II in the
previous section, non-utterance-initial words make up of around 80%-95% of the
target set in each speaker.
3.1 Distribution of average duration of closure and release across speakers and
place of articulation
Table VI lists the mean and standard deviation of closure duration, VOT, and total
duration by place of articulation.
labial ([p]) alveolar ([t]) velar ([k])
N 2461 4142 3566
Mean(Dc) 69.5 48.9 54.9
Sd (Dc) 36.4 23.9 22.9
Mean(Dr) 48.0 51.2 57.9
Sd (Dr) 25.1 27.5 26.0
Mean(Dt) 117.6 100.2 112.9
Sd (Dt) 46.5 41.2 37.7
Table VI Duration (in milliseconds) of non-utterance-initial (but word-initial)
voiceless stops
N = total number of tokens; Dc = closure duration; Dr = release duration; Dt = total duration
Compared with the average durations found in Byrd (1993) for read speech in
TIMIT (cf. Table VII below), the Buckeye values are very similar, though the release
duration is a little bit longer.
p t k
Mean(Dc) 69 53 60
Sd (Dc) 24 29 26
Mean(Dr) 44 49 52
Sd (Dr) 22 24 24
Table VII Duration (in milliseconds) values from Byrd (1993)
Our data show the same general pattern in duration by place of articulation as in
Byrd (1993). [p] on average has a greater closure duration than [t] and [k] in our
data , which is in line with the finding of both Byrd (1993) and Zue (1976) but not
Crystal and House (1988a). The average VOT follows the pattern claimed in many
previous studies that VOT increases as the place of contact moves from lips to the
velum.
UC Berkeley Phonology Lab Annual Report (2007)
210
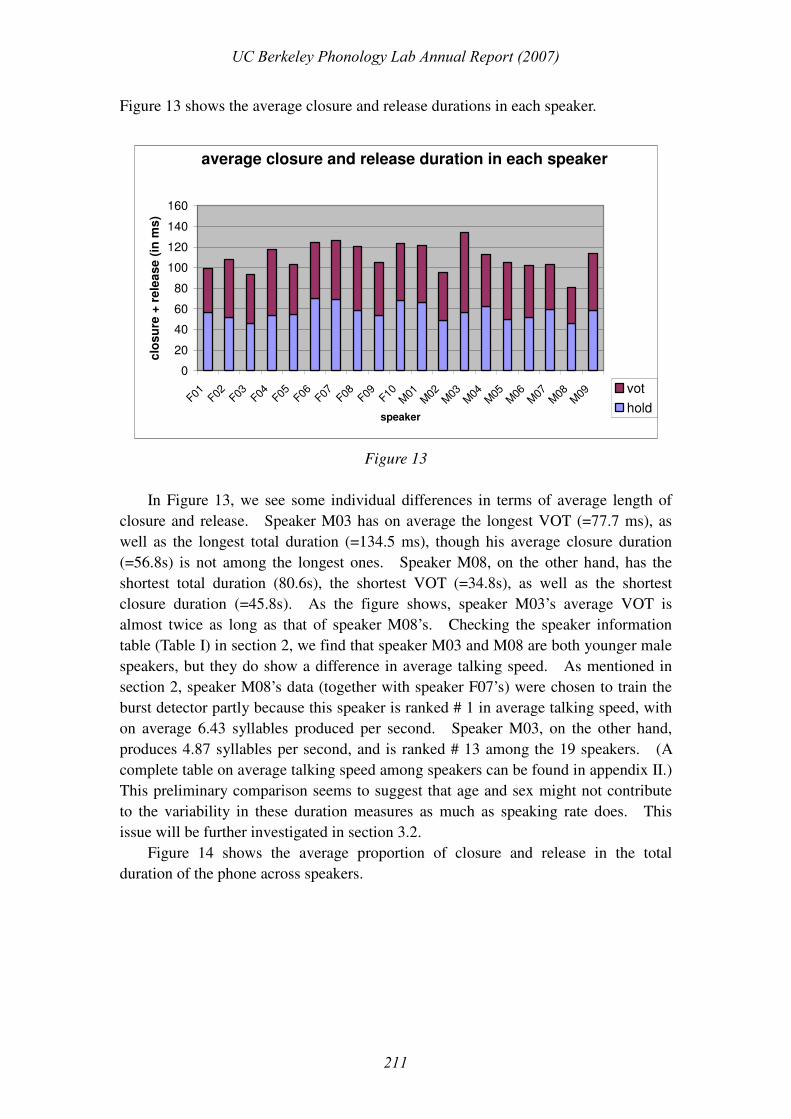
Figure 13 shows the average closure and release durations in each speaker.
average closure and release duration in each speaker
0
20
40
60
80
100
120
140
160
F01
F02
F03
F04
F05
F06
F07
F08
F09
F10
M01
M02
M03
M04
M05
M06
M07
M08
M09
speaker
clo
su
re +
re
lea
se
(in
ms
)
vot
hold
Figure 13
In Figure 13, we see some individual differences in terms of average length of
closure and release. Speaker M03 has on average the longest VOT (=77.7 ms), as
well as the longest total duration (=134.5 ms), though his average closure duration
(=56.8s) is not among the longest ones. Speaker M08, on the other hand, has the
shortest total duration (80.6s), the shortest VOT (=34.8s), as well as the shortest
closure duration (=45.8s). As the figure shows, speaker M03’s average VOT is
almost twice as long as that of speaker M08’s. Checking the speaker information
table (Table I) in section 2, we find that speaker M03 and M08 are both younger male
speakers, but they do show a difference in average talking speed. As mentioned in
section 2, speaker M08’s data (together with speaker F07’s) were chosen to train the
burst detector partly because this speaker is ranked # 1 in average talking speed, with
on average 6.43 syllables produced per second. Speaker M03, on the other hand,
produces 4.87 syllables per second, and is ranked # 13 among the 19 speakers. (A
complete table on average talking speed among speakers can be found in appendix II.)
This preliminary comparison seems to suggest that age and sex might not contribute
to the variability in these duration measures as much as speaking rate does. This
issue will be further investigated in section 3.2.
Figure 14 shows the average proportion of closure and release in the total
duration of the phone across speakers.
UC Berkeley Phonology Lab Annual Report (2007)
211

proportion of closure and release in each speaker
0
10
20
30
40
50
60
70
80
90
100
F01
F02
F03
F04
F05
F06
F07
F08
F09
F10
M01
M02
M03
M04
M05
M06
M07
M08
M09
speaker
%
release
closure
Figure 14
Similarly, Figure 14 shows individual differences in terms of ratio of closure and
release, which suggests that the ratio is not constant across speakers.
Figure 15a-c show the average closure and release duration, as well as the
proportion of closure in total duration, in each place of production, across speakers.
Average closure duration of [p],[t],[k]
across speakers
0102030405060708090100
F01 F02 F03 F04 F05 F06 F07 F08 F09 F10 M01 M02 M03 M04 M05 M06 M07 M08 M09speaker
closure (in ms)
p
t
k
Figure 15a
It is clear from the above figure that the average closure duration of [p] is
consistently and significantly greater than [t] and [k] in all speakers. A student’s
UC Berkeley Phonology Lab Annual Report (2007)
212
t-test on place confirms that the average closure duration of [p] across speakers is
significantly different from that of [t] and [k] ([p] and [k]: t = -5.0663, df = 32.487, p
<0.001; [p] and [t]: t = -7.0883, df = 32.275, p <0.001). This provides further
support for the finding in Table VI with regards to closure durations by showing that
the pattern is highly robust across speakers. From the figure we can tell that the
average closure duration of [k] is greater than [t] in all speakers, though to a lesser
degree compared to the difference between [p] and the other two stops. A t-test
confirms that the difference in average closure duration in [k] and [t] is much less
significant (p = 0.020).
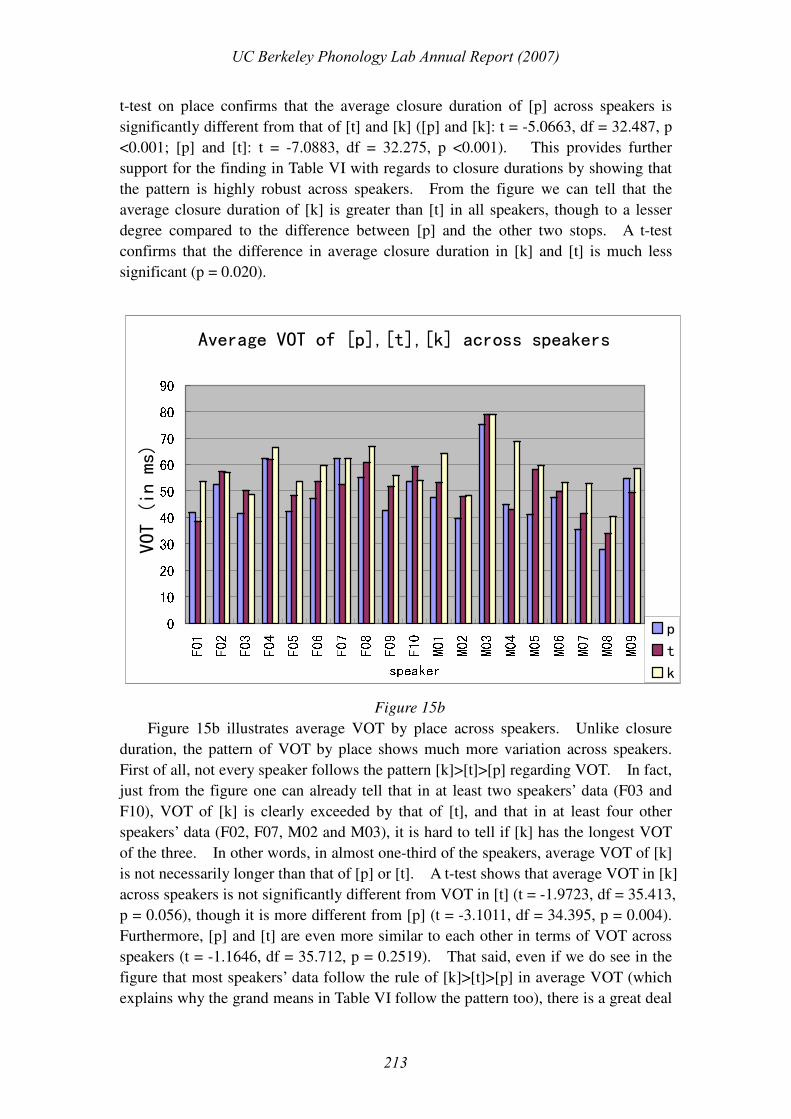
Average VOT of [p],[t],[k] across speakers
0102030405060708090
F01 F02 F03 F04 F05 F06 F07 F08 F09 F10 M01 M02 M03 M04 M05 M06 M07 M08 M09speaker
VOT (in ms)
p
t
k
Figure 15b
Figure 15b illustrates average VOT by place across speakers. Unlike closure
duration, the pattern of VOT by place shows much more variation across speakers.
First of all, not every speaker follows the pattern [k]>[t]>[p] regarding VOT. In fact,
just from the figure one can already tell that in at least two speakers’ data (F03 and
F10), VOT of [k] is clearly exceeded by that of [t], and that in at least four other
speakers’ data (F02, F07, M02 and M03), it is hard to tell if [k] has the longest VOT
of the three. In other words, in almost one-third of the speakers, average VOT of [k]
is not necessarily longer than that of [p] or [t]. A t-test shows that average VOT in [k]
across speakers is not significantly different from VOT in [t] (t = -1.9723, df = 35.413,
p = 0.056), though it is more different from [p] (t = -3.1011, df = 34.395, p = 0.004).
Furthermore, [p] and [t] are even more similar to each other in terms of VOT across
speakers (t = -1.1646, df = 35.712, p = 0.2519). That said, even if we do see in the
figure that most speakers’ data follow the rule of [k]>[t]>[p] in average VOT (which
explains why the grand means in Table VI follow the pattern too), there is a great deal
UC Berkeley Phonology Lab Annual Report (2007)
213
of individual difference that might be masked if we only look at the grand mean
values.
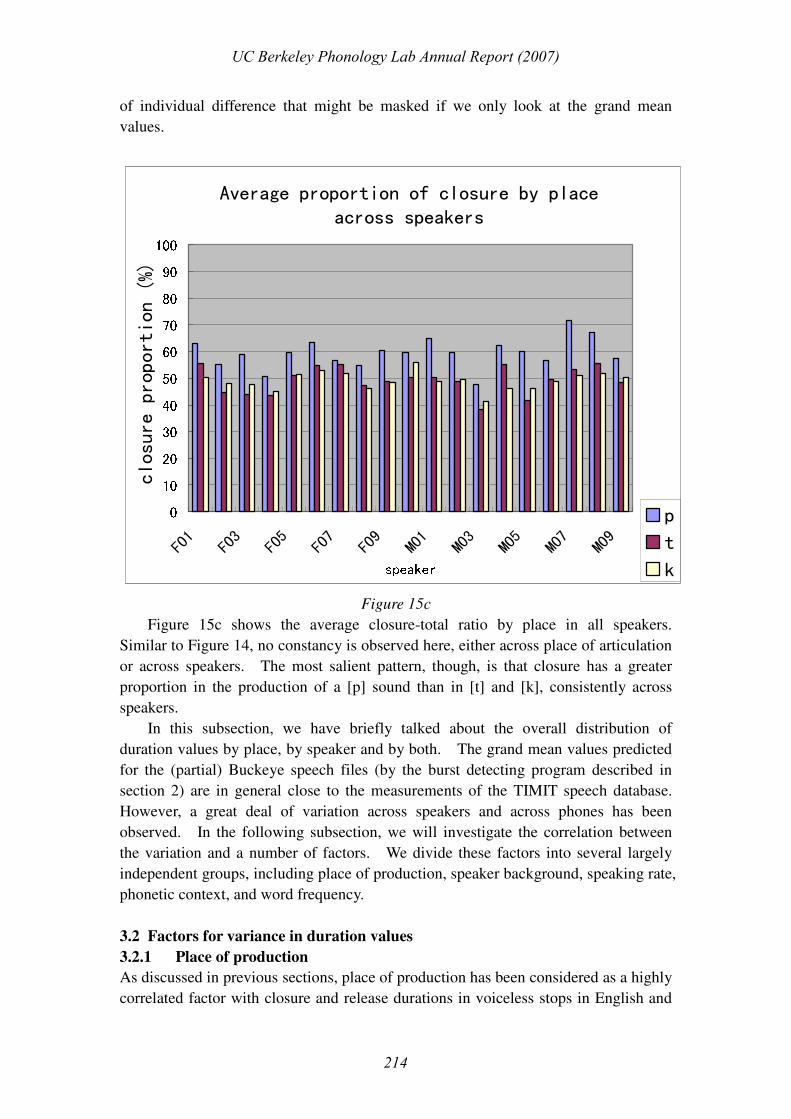
Average proportion of closure by place
across speakers
0102030405060708090100
F
0
1
F
0
3
F
0
5
F
0
7
F
0
9
M
0
1
M
0
3
M
0
5
M
0
7
M
0
9speaker
closure proportion (%)
p
t
k
Figure 15c
Figure 15c shows the average closure-total ratio by place in all speakers.
Similar to Figure 14, no constancy is observed here, either across place of articulation
or across speakers. The most salient pattern, though, is that closure has a greater
proportion in the production of a [p] sound than in [t] and [k], consistently across
speakers.
In this subsection, we have briefly talked about the overall distribution of
duration values by place, by speaker and by both. The grand mean values predicted
for the (partial) Buckeye speech files (by the burst detecting program described in
section 2) are in general close to the measurements of the TIMIT speech database.
However, a great deal of variation across speakers and across phones has been
observed. In the following subsection, we will investigate the correlation between
the variation and a number of factors. We divide these factors into several largely
independent groups, including place of production, speaker background, speaking rate,
phonetic context, and word frequency.
3.2 Factors for variance in duration values
3.2.1 Place of production
As discussed in previous sections, place of production has been considered as a highly
correlated factor with closure and release durations in voiceless stops in English and
UC Berkeley Phonology Lab Annual Report (2007)
214

many other languages (Cho & Ladefoged 1999).
An ANOVA on phone type ([p],[t],[k]) and release duration shows that phone
type has a significant effect on VOT (F(2,10166) = 115.51, p<0.001). But it only
accounts for 2.2% of the variability in VOT. An ANOVA on phone type and closure
duration shows that it also has a significant effect on closure duration (F(2,10166) =
447.95, p<0.001). It accounts for 8.1% of the variability in closure duration.
3.2.2 Factors of speaker background
Gender and age are the two most well-studied speaker-background factors in
determining VOT. As mentioned in the introduction, a number of studies claimed
that women have longer VOT than men and younger speakers have longer VOT than
older speakers. The explanation for the difference usually has to do with
physiological and anatomical differences as well as sociophonetic factors. However
most of these studies are based on results from well-controlled experiments with a
small number of stimuli.
Using the Buckeye data, a two-factor ANOVA testing the effect of age and gender
and their interaction, on release duration shows that there is some effect of both age
(F(1,10165) = 20.068, p<0.001) and gender (F(1,10165)= 47.336, p<0.001), as well as
their interaction (F(1,10165)=38.466, p<0.001). But altogether they can only
account for 1% of the variability in VOT.
Individual talker difference is another speaker factor that has been investigated
(Allen et al. 2003, Pitt et al. 2005 among others). In our data, the speaker identity
factor shows an effect on VOT (F(1,10150) = 58.855, p<0.001)1 and it alone accounts
for 9.29% of the variability in VOT.
Similarly, speaker identity factor also shows an effect on closure duration
(F(1,10150) =22.916, p<0.001) and accounts for 3.7% of the variability. Age and
gender, together with their interaction, only accounts for less than 1% of the
variability in closure duration.
3.2.3 Factors of speaking rate
In section 2, we briefly mentioned the use of (global) average speaking rate, measured
in number of syllables produced per second, as part of the speaker information used in
selecting pilot study subjects. In this subsection, we will test two local speaking rate
measures. The first one is similar to the global speaking rate measure, but in a more
local environment. The locality of this measure is defined as the speech stretch
(naturally delimited by silence, laughter, noise and other non-linguistic sounds) that
contains the target phone. This rate measure, referred to as the local stretch speed
and measured in number of syllables per second, represents the characteristic
speaking rate of the current stretch. The second speech rate measure is the duration
of the following phone (which, in most cases, is a vowel). This measure is
independent of the duration of the target phone. It represents an even more local
speed measure than the local stretch speed, however, it should be noted that because it
1 Since the speaker identity variable is inherently correlated with other speaker-background factors such as gender and age, there is no need to test the interaction between them.
UC Berkeley Phonology Lab Annual Report (2007)
215

only measures the duration of one segment after the target phone, it is also more
susceptible to non-rate-related factors, such as intrinsic vowel duration.
A two-factor ANOVA testing the effects of local stretch speed measure and
duration of the following phone, as well as their interaction, on VOT shows that both
of them, but not so much the interaction, have significant effects on the release
duration (see Table VIII below). Altogether they account for 12.99% of the
variability in VOT. A similar ANOVA on the speed measures’ effects on closure
duration shows that basically only the local stretch speed has an effect on closure, but
not the duration of the following phone nor their interaction. Altogether they can
account for 4.9% of the variability in closure duration (while local stretch speed alone
can account for 4.8%).
df de F p
local stretch speed 1 10165 915.79 <0.001
duration of following phone 1 10165 598.69 <0.001
interaction 1 10165 6.87 0.008
Table VIIIa ANOVA on the effects of two speed measures and their interaction
on VOT; df = degree of freedom; de = degree of error
df de F p
local stretch speed 1 10165 517.71 <0.001
duration of following phone 1 10165 10.24 =0.001
interaction 1 10165 1.68 0.194
Table VIIIb ANOVA on the effects of two speed measures and their interaction
on closure duration; df = degree of freedom; de = degree of error
3.2.4 Factors of phonetic context
In order to study the effects of phonetic context, the two neighboring phones of the
target phone are coded for category (C for consonant, V of single vowel, O of
diphthong and nasalized vowels, <N> for non-linguistic noise). Since this whole
section only concentrates on word-initial voiceless stops in non-utterance-initial
location, by definition none of the target cases immediately follow a sound of
category <N>. Besides, most of them precede a vowel sound and none of them
immediately precede a sound of category <N>, which is not surprising since they are
all word-initial. Table VIIII gives a general count of neighboring phones by
category.
C V O <N>
preceding phone 5528 4596 45 0
following phone 670 9375 124 0
Table VIIII Counts of preceding phones and following phones by category
The ANOVA results on the effects of both the preceding phone category and the
following phone category and their interaction on VOT are shown in Table Xa and
test results on their effects on closure duration are shown in Table Xb.
UC Berkeley Phonology Lab Annual Report (2007)
216
df de F p
preceding phone cat. 2 10161 55.74 <0.001
following phone cat. 2 10161 13.21 <0.001
interaction 3 10161 1.95 0.118
Table Xa ANOVA on the effects of phonetic context factors on VOT
df de F p
preceding phone cat. 2 10161 372.35 <0.001
following phone cat. 2 10161 1.51 0.22
interaction 3 10161 0.57 0.63
Table Xb ANOVA on the effects of phonetic context factors on closure
duration
Both variables but not their interaction have an effect on VOT; but only preceding
phone category has an effect on closure duration, not following phone category nor
their interaction. Altogether they account for 1.3% of the variability in VOT, and
6.8% of the variability in closure duration.
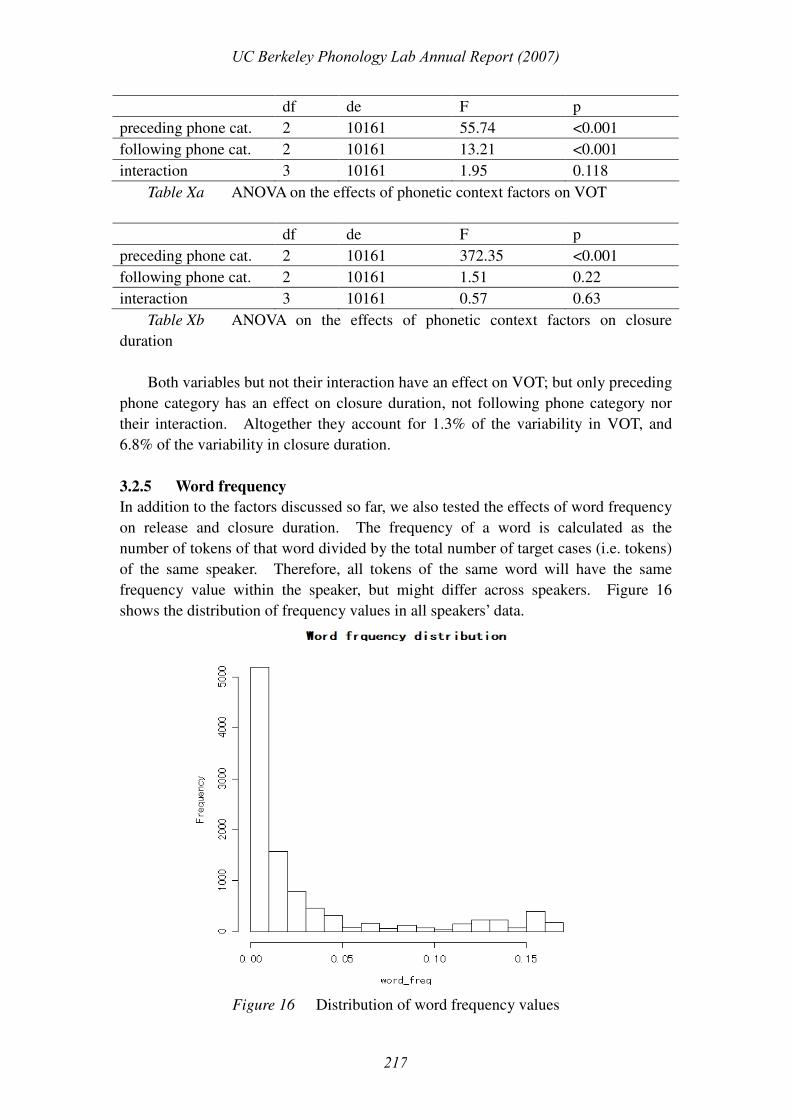
3.2.5 Word frequency
In addition to the factors discussed so far, we also tested the effects of word frequency
on release and closure duration. The frequency of a word is calculated as the
number of tokens of that word divided by the total number of target cases (i.e. tokens)
of the same speaker. Therefore, all tokens of the same word will have the same
frequency value within the speaker, but might differ across speakers. Figure 16
shows the distribution of frequency values in all speakers’ data.
Figure 16 Distribution of word frequency values
UC Berkeley Phonology Lab Annual Report (2007)
217

As shown in the above figure, the distribution of word frequency values roughly
follows the inverse function, with most word tokens accumulated in the
low-frequency bins and only a few in the high-frequency bins. Notice that the above
figure plots the frequency variable of each token, and if the word has a high frequency
in the data set, there are also more tokens of it in the set by definition. That is why
there appears to be an increase along the vertical direction near the right end of the
horizontal axis.
This frequency variable has also been shown to have an effect on VOT and
closure duration (Fosler-Lussier and Morgan 2000). In our study, as shown in the
figure, the frequency distribution of words in real speech is anything but balanced.
In fact, in all the speakers, the most frequent word in their target set is the word “to”
(frequency ranging from 8% to 13% across speakers), without exception. If some
words occur extremely often, it is possible that they become the target of certain
changes in production, for instance, acceleration, phone reduction and coarticulation.
Therefore if the frequency variable is shown to have an effect on duration values like
closure and release in stops, it can be a sign of the presence of these processes.
An ANOVA on word frequency’s effect on VOT shows there to be a significant
effect of word frequency on VOT (F(1,10167) = 547.67, p<0.001). This variable
alone accounts for 5% of the variability in VOT. The ANOVA on word frequency
and closure duration shows that there, too, is also a significant effect of word
frequency on closure (F(1,10167) = 306.88, p<0.001). The word frequency variable
accounts for 2.92% of the variability in closure duration.
3.2.5 Overall correlation with variance in duration values
For both closure and release duration values, a multi-variable linear regression is
performed on all the factors that are shown in previous subsections to have significant
effects. The variables that are used in each regression model (Model A for VOT and
Model B for closure duration), together with a summary of statistics, are listed below.
Model A:
formula: VOT ~ phone type + speaker + local stretch speed + duration of
following phone + preceding phone category + following phone category +
word frequency
adjusted R square: 26.06%
F(27,10141) = 134.1
p<0.001
Model B:
formula: closure ~ phone type + speaker + local stretch speed + preceding
phone category + word frequency
adjusted R square: 20.72%
F(24,10144)=111.7
p<0.001
UC Berkeley Phonology Lab Annual Report (2007)
218

In other words, we are only able to account for about 26% of the variability in
release duration and 20% of the variability in closure duration in the data, after taking
into account all factors that have been so far examined and shown to be correlated
with closure or release duration. The proportion of variability accounted for is much
lower than what has been shown in previous studies, using similar factors. (Among
others, Allen et al. 2003 claims that 80% of the variability in VOT can be accounted
for by speaking rate, measured in the duration of the following vowel+coda. )
As seen from the two models above, VOT and closure have different predictors.
The duration and category of the following phone are not significantly correlated with
closure duration (duration: p=0.001; category: p=0.22. cf. section 3.2.3 and 3.2.4).
In fact, if we compare the effects of each single factor on VOT and on closure
duration (Figure 17), we find interesting differences between VOT and closure
duration.
proportion of variability accounted in VOT and
closrue duration
0
1
2
3
4
5
6
7
8
9
10
phon_place speakerstretch_spdnext_phon_durprev_phon_catnext_phon_cat word_freq
%
VOT
closure
Figure 17
As shown in the above figure, the best predictors for VOT are very different from
the best predictors for closure duration. For instance, speed (both two measures) and
speaker identity are the best predictors for VOT (the two speed measures account for
7.8%, 8.4% of the variability separately, and 12.99% when they are combined;
speaker identity accounts for 9.29% of the variability in VOT), but they only account
a small amount of the variability in closure duration (4.8% and 0.7% from the two
speed measures separately and 4.9% when they are combined; speaker identity
accounts for 3.7% of the variability in closure duration). On the other hand, the best
predictors for closure duration – place of phone production (a.k.a. phone type) and the
category of previous phone – account for 8.1% and 6.8% (respectively) of the
UC Berkeley Phonology Lab Annual Report (2007)
219
variability in closure but only 2.2% and 1.3% in VOT. Word frequency also has a
noticeable difference in explaining the variability of the two (5% in VOT and 2.92%
in closure).
When put together, all the pieces suggest that closure duration is most sensitive to
a very local environment, i.e. the current phone and the previous phone (not even the
following phone since that’s already separated by the release). VOT, on the contrary,
is more susceptible to global and therefore more general factors, such as speaker
differences, speaking rate, word forms, etc. This sheds light on the direction for
future study in search of the sources of the remaining 80% variability: for studying
closure duration, more variables with respect to the current and the previous phone
need to be examined; for studying VOT, more variables with a global domain (at least
as big as a syllable or a word) need to be taken into account.
4. Discussion
This paper mainly discusses two issues. The first is a methodology question: how to
automatically extract phonetically important information (such as VOT and closure
duration in voiceless stops) from a large-scale speech corpus? The second one is a
linguistic question: how is closure and release duration distributed over speaker and
context in spontaneous connected speech, and what factors vary with the variation in
closure and release duration?
4.1 On the methodology
Our take on the first one is to further develop the similarity score approach, which
was first proposed and tested in Johnson 2006, and implement a burst detector
program that makes use of the calculated scores. The scoring approach is, in its very
heart, just a simple measure of how similar one piece of acoustic information is to
another on the spectrogram. But together with Mel spectral templates developed for
a set of steady-state phones of the speaker, one is able to measure how similar a piece
of acoustic data is to, say, the typical [a], or the typical [f] of the same speaker.
Therefore the method itself is in essence speaker-independent.
In this study, we have developed an algorithm that recognizes certain patterns in
the score vectors and uses that to determine the point of release in voiceless stops.
We find that a two-dimensional score vector (<silence> score plus <sh> score) is
already adequate to represent the pattern of release in stops and such a pattern is
robust enough across a wide range of context in uncontrolled spontaneous speech.
The pattern recognition algorithm works confidently on average around 90% of the
time (average rejection rate among the 19 speakers is 13.13%); the optimal error in
theory is 2.5ms due to the 5ms step size in scores and the mean error is estimated to
be around 3-5ms (error is around 3.22ms in the two training cases, and within 5ms in
the test with 50 examples across speaker). As discussed before, a large portion of
the error comes from residuals of the two rejections rules (e.g. spurious releases) and
unusual multiply-released stops.
UC Berkeley Phonology Lab Annual Report (2007)
220

4.2 On the linguistic question
As for the second question, most of the previous research involving VOT and closure
duration in stops was about well-controlled laboratory experiments, typically
involving reading of word lists or short paragraphs. The biggest advantage of these
studies is that many factors can be carefully controlled and unambiguously recorded.
However, these can be disadvantages, too, since they no longer reflect the features of
natural speech, and whatever conclusion is achieved cannot be applied in a wider
context.
In this study, we used predicted values for VOT and closure duration in
word-initial voiceless stops in 19 speakers’ data from the Buckeye Corpus, and
studied their correlation with a number of factors. As discussed in the result session,
all the factors we’ve investigated, which are also factors that have been studied a lot
in previous literature, only account for up to 26% of the variability in VOT and
around 20% of the variability in closure duration. Specifically, our data clearly show
that gender and age, whose effect on VOT has been asserted in a number of studies
(Koenig 2000, Ryalls et al. 1997, Whiteside and Marshall 2001, Robert et al. 2005,
among others), only account for no more than 1% of the variability in both VOT and
closure duration. (But it should be noted that the division between younger and
older speaker groups in our study is by under thirty and over forty, while in most of
other studies, the age gap between the two groups is much bigger.)
Speaking rate, which, according to Allen et al. (2003), accounts for 80% of the
variability in VOT, in our data only accounts for 13% of the variability in VOT and
4.5% of the variability in closure, even if the rate measure employed in their study, the
duration of the following vowel, is very similar to one of the two rate measures we
use in our study.
Place of articulation doesn’t account for much variability in VOT either (2.2%).
As a matter of fact, the widely-recognized rule of velars having the longest VOTs and
alveolars the shortest is not strictly followed in one third of the speakers. But place
of articulation has a more significant effect on closure duration (8.1% of variability).
We also tested the word frequency variable. Our preliminary results show that it
could have a significant effect on both VOT and closure duration.
Last but not least, our study also shows the different patterns of VOT and closure
duration in terms of both mean value distribution and correlate factors. VOT is
shown to have higher correlation with global variables while closure duration is
mostly only sensitive to the local setting (i.e. the previous phone and the current
plosive). Though this suggestion needs to be examined more thoroughly, it certainly
points to a promising direction for future study on the topic of VOT and closure
duration in English stops.
UC Berkeley Phonology Lab Annual Report (2007)
221

Appendix I Rejection details in all speakers
F01 F02 F03 F04 F05 F06 F07 F08 F09 F10
N 674 572 777 900 1243 490 231 449 699 412
Rsil 2 1 0 0 4 0 0 1 0 0
Rsh 1 1 1 0 1 0 0 0 0 0
R1 46 48 207 28 75 24 4 29 21 14
R2 12 30 29 33 48 31 3 18 15 18
Ngood 613 492 540 839 1115 435 224 401 663 380
R% 9.05 13.98 30.5 6.77 9.64 11.22 3.03 10.69 5.15 7.76
M01 M02 M03 M04 M05 M06 M07 M08 M09
N 564 1027 784 865 724 512 636 618 718
Rsil 0 0 0 1 0 0 0 0 0
Rsh 0 1 0 0 2 0 1 0 1
R1 31 94 7 48 93 53 3 54 7
R2 12 128 39 27 98 21 12 44 20
Ngood 521 804 738 789 531 438 663 520 690
R% 7.62 21.71 5.86 8.78 26.65 14.45 2.51 15.85 3.89
N = the total number of target cases
Rsil = the number of cases where no decreasing period is found in <silence> score
Rsh = the number of cases where no increasing period is found in <sh> score
R1 = the number of cases rejected by the first rejection rule
R2 = the number of cases rejected by the second rejection rule
Ngood = the number of remaining cases after all rejection
R% = 1- Ngood /N, the rejection rate
Rejection is applied in the above sequence.
UC Berkeley Phonology Lab Annual Report (2007)
222
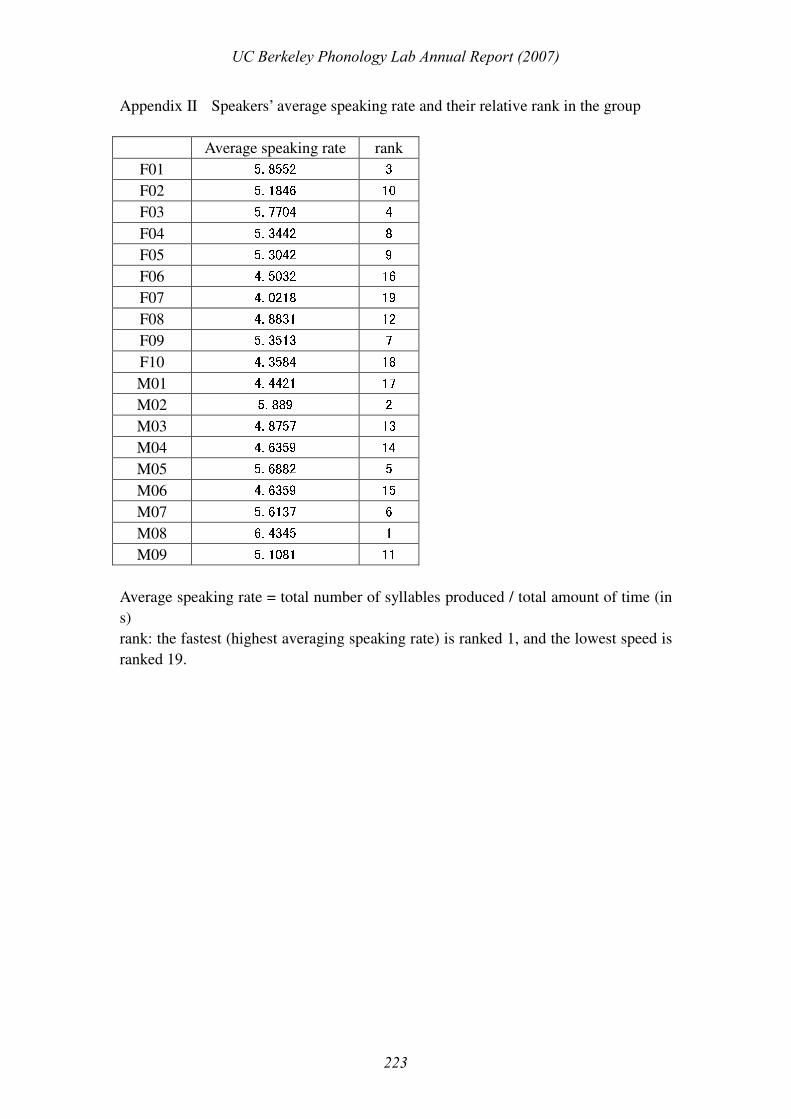
Appendix II Speakers’ average speaking rate and their relative rank in the group
Average speaking rate rank
F01 5.8552 3 F02 5.1846 10 F03 5.7704 4 F04 5.3442 8 F05 5.3042 9 F06 4.5032 16 F07 4.0218 19 F08 4.8831 12 F09 5.3513 7 F10 4.3584 18 M01 4.4421 17 M02 5.889 2 M03 4.8757 13 M04 4.6359 14 M05 5.6882 5 M06 4.6359 15 M07 5.6137 6 M08 6.4345 1 M09 5.1081 11
Average speaking rate = total number of syllables produced / total amount of time (in
s)
rank: the fastest (highest averaging speaking rate) is ranked 1, and the lowest speed is
ranked 19.
UC Berkeley Phonology Lab Annual Report (2007)
223
Reference
Allen, J.S., Miller, J.L., DeSteno, D.. (2003). Individual talker differences in
voice-onset-time. J Acoust Soc Am. Vol 113, No 1, pp: 544-52.
Bailey, P.J., Haggard, M.P.. (1973). Perception and production: some correlations on
voicing of an initial stop. Lang. Speech. Vol 16, pp: 189-195
Baum, S.R., Ryan, L.. (1993). Rate of speech effects in aphasia: voice onset time.
Brain Lang. Vol 44, No 4, pp :431-45.
Byrd, D.. (1993). 54,000 American stops. UCLA Working Papers in Phonetics. No 83,
pp: 97-116.
Cho, T., Ladefoged, P.. (1999). Variations and universals in VOT: evidence from 18
languages. Journal of Phonetics. Vol 27, pp: 207-229.
Fosler-Lussier, E., Morgan, N.. (2000). Effects of speaking rate and word frequency
on conversational pronunciations. Speech Communication. Vol 29, No 2-4, pp:
37-157.
Hoit, J.D., Solomon, N.P., Hixon, T.J.. (1993). Effect of lung volume on voice onset
time (VOT). J Speech Hear Res. Vol 36, pp: 516-520.
Johnson, K.. (2006). Acoustic attribute scoring: A preliminary report.
Koenig, L.L.. (2000). Laryngeal factors in voiceless consonant production in men,
women, and 5-year-olds. J Speech Lang Hear Res. Vol 43, pp: 1211-1228.
Kessinger, R.H., Bloomstein, S.E.. (1998). Effects of speaking rate on voice-onset
time and vowel production: Some implications for perception studies. J
Phonetics. Vol 26, No 2, pp: 117:128.
Neiman, G.S., Klich, R.J., Shuey, E.M.. (1983). Voice onset time in young and
70-year-old women. J Speech Hear Res. Vol 26, No 1, pp:118-23.
Niyogi, P., Ramesh, P.. (1998) Incorporating voice onset time to improve letter
recognition accuracies. Proceedings of the 1998 IEEE International Conference
on Acoustics, Speech, and Signal Processing, ICASSP '98. Vol 1, pp: 13-16.
Petrosino, L., Colcord, R.D., Kurcz, K.B., Yonker, R.J.. (1993). Voice onset time of
velar stop productions in aged speakers. Percept Mot Skills. Vol 76, No 1,
pp :83-88.
Pitt, M., Johnson, K., Hume, E., Kiesling, S., Raymond, W.. (2005). The Buckeye
Corpus of conversational speech: labeling conventions and a test of transcriber
reliability. Speech Communication. Vol 45, pp: 90-95
Robb, M., Gilbert, H., Lerman, J.. (2005). Influence of gender and environmental
setting on voice onset time. Folia Phoniatr Logop. Vol 57, No 3, pp:125-33.
Ryalls, J., Zipprer, A., Baldauff, P.. (1997). A preliminary investigation of the effects
of gender and race on Voice Onset Time. J Speech Lang Hear Res. Vol 40 No 3,
pp:642-645.
Ryalls, J., Simon, M., Thomason, J.. (2004). Voice Onset Time production in older
Caucasian- and African-Americans. Journal of Multilingual Communication
Disorders. Vol 2, No 1, pp: 61 – 67
Schmidt, A.M., Flege, J.E.. (1996). Speaking rate effects on stops produced by
Spanish and English monolinguals and Spanish/English bilinguals. Phonetica.
Vol 53, No 3, pp:162-179.
UC Berkeley Phonology Lab Annual Report (2007)
224

Sydal, A.K.. (1996). Acoustic variability in spontaneous conversational speech of
American English talkers. Proceedings of ICSLP ’96.
Volatis, L.E., Miller, J.L.. (1992). Phonetic prototypes: Influence of place of
articulation and speaking rate on the internal structure of voicing categories. J
Acoust Soc Am. Vol 92, No 2, pp: 723-735.
Whiteside, S.P., Henry, L., Dobbin, R.. (2004). Sex differences in voice onset time: a
developmental study of phonetic context effects in British English. J Acoust Soc
Am. Vol 116, No 2, pp:1179-1183.
Whiteside, S.P., Irving, C.J.. (1998). Speakers' sex differences in voice onset time: a
study of isolated word production. Percept Mot Skills. Vol 86, No 2, pp:
651-654.
Zue, V.W.. (1976). Acoustic Characteristics of stop consonants: A controlled study. Sc.
D. thesis. MIT, Cambridge, MA.
UC Berkeley Phonology Lab Annual Report (2007)
225
Related Documents


