www.fruitrop.com Southern Hemisphere pip fruits Struggling to hold up Close-up Mango March 2015 - No. 230 English edition Southern Hemisphere pip fruits 2015 campaign Content published by the Market News Service of CIRAD - All rights reserved

Welcome message from author
This document is posted to help you gain knowledge. Please leave a comment to let me know what you think about it! Share it to your friends and learn new things together.
Transcript

ww
w.fr
uitr
op.c
om
Southern Hemisphere
pip fruits
Struggling to hold up
Close-up
Mango
Mar
ch 2
015
- No.
230
English edition
Southern Hemisphere
pip fruits
2015 campaign
Content published by the Market News Service of CIRAD − All rights reserved

WITH THE HALLS “RIPE” RANGE WHY WAIT?
HALLS IS A MEMBER OF THE HL HALL & SONS GROUP
Good for growth. Growth for good.www.halls.co.za
At Halls, we understand your customers are looking to buy quality mangoes that are ready to eat every time. That is why we offer the Halls “RIPE” Range of fruits in retail-ready formats to meet the growing need for ripe & ready fruit.
To find out more, please contact us ont +44 (0) 1892 723488 or +33 (0) 1 82 39 00 30e [email protected] or [email protected]
Content published by the Market News Service of CIRAD − All rights reserved

1No. 230 March 2015
THE LATEST ON...
Another myth busted… Research is not a place where altruism, sharing and self-lessness are values upheld by an entire united community devoted solely to the progress of humanity. This might come as a tough blow to citizens, with some of their taxes feeding the worldwide research system. What a disappointment for the public, when they realise that this microcosm is to humility what Google is to free service: an illusion! No doubt because they belong to another age, we retain an idealised image of researchers such as Pasteur or the Curies. But the technical-economic-scientific establishment, along with globalisation, has long since replaced ideals of democracy.
Yet the veil has been partly lifted with the recent scandal over the lucrative and highly com-petitive business of scientific reviews. Indeed, all of the world’s press has covered problems of honesty in the results of certain researchers. Some journals have taken the opportunity to question the motives driving researchers to go as far as falsifying their data to ensure a prominent place in a review with a high impact factor, the Holy Grail of scientists. There are no holds barred: low blows, more or less active corruption, conflicts of influence, pack be-haviour, etc. Again, the reality does not live up to the fiction. Actually, to find out anything about the progress of mankind, you would need to ask the students. The researchers are too busy writing their next articles.
Denis Loeillet
ContentsDirect from the markets (E. Imbert, D. Loeillet, C. Dawson, P. Gerbaud, T. Paqui, R. Bright)
p. 2 JANUARY-feBRUARY 2015
• Banana: Spanish banana market hyperactive in 2014 — European banana market: and the winner is… Fyffes! — World banana market came down to earth with a bang in Janu-ary 2015.
• Citrus: Threat of greening now tangible in the Mediterranean — Peruvian citruses: still on the up! — 2013-14 winter grapefruit season: better late than never — Moroccan citrus ex-port season: not as good as predicted — Illegal Orri plantation in Spain: dubious alchemy backfires.
• Avocado: Mexico: the avocado in all its states… — Peruvian avocado welcomed to two new Asian markets.
• exotics: Costa Rican pineapple: scaling new heights — Imports of certain Dominican fruits to the United States suspended.
• Temperate fruits: New export record for Chilean cherries — Good export level for South African stone fruits — Spanish strawberry seeking value.
• Sea freight: 6th International Banana Congress, and 21st International Meeting of ACORBAT — Launch of the new site commodafrica.com.
E. Imbert, D. Loeillet, C. Dawson, P. Gerbaud, T. Paqui, R. Bright
The latest on...
p. 16
p. 20
• 2015 Southern Hemisphere pip fruits campaign Options becoming a necessity (Cécilia Céleyrette)
• Southern Hemisphere pip fruits Struggling to hold up (Cécilia Céleyrette)
Close-up by Pierre Gerbaud: MANGO
p. 26
p. 32
p. 60
p. 64
p. 66
p. 68
• european mango market — Several sources on the offensive
• 2014 mango campaign — Review by source: rising tonnages and concentration of campaigns
• european mango market — 2014 monthly review: short-lived disruption on a steady market
• World statistics panorama
• Mango quality defects
• The main mango varieties
Wholesale prices in europe
p. 71 JANUARY-feBRUARY 2015
Cover photograph: © Regis Domergue
Publisher Cirad TA B-26/PS4 34398 Montpellier cedex 5, France Tel: 33 (0) 4 67 61 71 41 Fax: 33 (0) 4 67 61 59 28 Email: [email protected] www.fruitrop.com
Publishing Director Hubert de Bon
editors-in-chief Denis Loeillet and Eric Imbert
editor Catherine Sanchez
Computer graphics Martine Duportal
Iconography Régis Domergue
Website Actimage
Advertising Manager Eric Imbert
Subscriptions www.fruitrop.com
Translators James Brownlee, Simon Barnard
Printed by Impact Imprimerie n°483 ZAC des Vautes 34980 Saint Gély du Fesc, France
ISSN French: 1256-544X English: 1256-5458 Separate french and english editions © Copyright Cirad
Subscription rate eUR 300 / 11 issues per year
(paper and electronic editions)
This document was produced by the Markets News Service of the PERSYST department at CI-RAD, for the exclusive use of subscribers. The data presented are from reliable sources, but CIRAD may not be held responsible for any error or omis-sion. Under no circumstances may the published prices be considered to be transaction prices. Their aim is to shed light on the medium and long-term market trends and evolutions. This pub-lication is protected by copyright, and all rights of reproduction and distribution are prohibited.
Content published by the Market News Service of CIRAD − All rights reserved

2 March 2015 No. 230
Direct from the markets
Banana
eUROPe - ReTAIL PRICe
Countryfebruary 2015 Comparison
type euro/kg January 2015
average for last 3 years
France normal 1.57 + 2 % 0 %special offer 1.26 - 1 % - 7 %
Germany normal 1.30 0 % - 2 %discount 1.18 + 2 % - 1 %
UK (£/kg) packed 1.14 - 1 % - 6 %loose 0.72 - 4 % 0 %
Spain platano 1.98 - 5 % + 9 %banano 1.29 + 2 % - 4 %
eUROPe
Spanish banana market hyperactive in 2014. According to Spanish customs figures report-ed by the blog “hojasbananeras”, banana import volumes in 2014 ap-proached the 500 000-tonne mark, up more than 56 000 t from 2013.This rise went hand-in-hand with a consumption boom, since re- exports (as usual targeted practical-ly solely once more at the Portu-guese market) increased by 23 000 t to near the 100 000-t mark. The Canaries platano took advantage of this renewed appetite for bananas, with its shipments to the peninsula up by 15 000 t. Yet it was primarily the Cavendish banana which saw the steepest rise, perhaps an effect of the economic crisis. Hence in-coming volumes were up by more than 60 000 t, peaking at approxi-mately 260 000 t. The figures from Eurostat, though not yet finalised, confirm these trends. Could there be a cause & effect link in the decision by Canaries producers to relaunch a big promotion cam-paign for “El sabor de lo nuestro”, involving TV adverts showing the platano alongside the most iconic Spanish specialities such as olive oil or serrano ham?
Source: www.hojasbananeras.blogspot.fr
January-february 2015The banana market proved highly dynam-ic in the early part of 2015. On the one hand, the supply remained moderate in January, because of smaller shiploads dur-ing the holiday period and some logistical problems. On the other hand, demand picked up thanks to promotions, which helped those stocks in place at the begin-ning of the year to be absorbed rapidly. Yet most of all, the markets started to tighten up considerably towards the end of Jan-uary because of the intensifying African shortfall (effects of a particularly powerful Harmattan) and the dollar banana supply remaining moderate. However, a Colom-bian resurgence was observed, with some high levels (+ 12 % in January and + 18 % in February). Costa Rican volumes were slightly in shortfall, as a consequence of cold temperatures at the production stage. Despite overall Ecuadorian imports being similar to last year, the spot supply from this source remained very limited because of the unfavourable euro/dollar exchange rate for imports. Faced with this and with demand picking up, especially in February (ongoing temperatures fa-vourable for consumption and weak com-petition from other fruits), green banana prices, average since the beginning of the year, steeply strengthened from late Janu-ary, to reach above-average levels in Feb-ruary. In Spain, the market remained well balanced due to a falling Platano supply, caused by cold January temperatures in the Canaries. In Russia, the situation saw a turnaround: prices rose rapidly thanks to the reductions of import volumes ob-served since late 2014, and to demand focusing more on the banana.
13.714.0
J F M A M J J A S O N D
euro
/col
is
2015 2014 2013
Allemagne - Prix vert (2e et 3e marques)
NORTHeRN eUROPe — IMPORT PRICefebruary
2015euro/box
Comparisonprevious
monthaverage for last 2 years
13.97 + 2 % 0 %
european banana market: and the winner is… fyffes! So declared the Fyffes group itself in the presentation of its 2014 results: the Ireland-based multinational is the leading European banana distributor, with volumes of approx-imately 44 million boxes, ahead of Chiquita (33 million boxes), Del Monte (23 million boxes) and Dole (19 million boxes). Yet the tables are turned if we switch to a worldwide scale. Chiquita is dominant with 125 million boxes, ahead of Del Monte (117 million) and Dole (110 million). Fyffes is well behind in fourth posi-tion, with 54 million boxes.
Source: Fyffes
Others60%
Banana - european market: 300 million boxes
Source: Fyffes
Chiquita 11%
Del Monte 8%
Dole 6%
fyffes 15%
© D
enis
Loe
illet
Germany - Green price (2nd/3rd brands)
euro
/box
Content published by the Market News Service of CIRAD − All rights reserved

3No. 230 March 2015
Direct from the markets
Banana
World banana market down to earth with a bang in January 2015. It had to happen at some point, since the upward trend could not go on for ever. Consumption in the United States decreased by 9 % in January 2015, a fall of around 30 000 tonnes. Costa Rica (- 43 %), Colombia (- 30 %) and Honduras (- 3 %) were responsible for this poor performance. Mexico, how-ever, did see another steep rise, as did the other minor sources: Peru, Nicaragua and the Dominican Re-public. The re-export flow to Canada remained stable. We can also note that the United States imported 20 000 tonnes of organic registered bananas, as opposed to just 12 000 t in January 2014 (market share 5 %).
The EU-28 held up its end; true, its imports did fall, but by just 3 %, i.e. 13 000 tonnes less than in Janu-ary 2014. Again, it was Costa Rica (- 13 %), on the dollar side, which dragged the market down. Ghana (- 10 %) and Saint Lucia (- 28 %) were the weak links on the ACP side. Conversely, in the ACP group, Came-
roon, Belize and Surinam had a very good January. Colombia (+ 8 %) was back to its optimum levels, while Ecuador consolidated its position (+ 1 %). Guatemala was a big hit, go-ing from 55 tonnes of exports to the EU in January 2014 to 3 600 tonnes in January 2015. If we add to the import figures the volumes shipped from the European production zones, EU consumption fell by no more than 2 %. Martinique had an excellent performance, with a rise of nearly 60 %, while the other Europe-an sources remained stable.
Source: CIRAD
eUROPe - IMPORTeD VOLUMeS - feBRUARY 2015
SourceComparaison
January 2015
february2014
2015 cumulative total compared to 2014
French West Indies 0 % + 16 %Cameroon/Ghana/Côte d’Ivoire - 9 % - 6 %Surinam - 11 % - 6 %Canaries = - 13 % - 7 %Dollar:
Ecuador + 18 % + 28 %Colombia* + 16 % + 15 %Costa Rica - 19 % + 62 %
CANARIeS - IMPORT PRICe*
february 2015
euro/box
Comparison
previousmonth
average forlast 2 years
15.50 + 5 % + 9 %
CANARIeS
* 18.5-kg box equivalent Estimated thanks to professional sources / * total all destinations
RUSSIA - IMPORT PRICe
february 2015
USD/box
Comparison
previousmonth
average forlast 2 years
17.80 + 45 % + 19 %
R U S S I A
UNITeD STATeS - IMPORT PRICe
february 2015
USD/box
Comparison
previousmonth
average forlast 2 years
19.00 + 16 % + 15 %
UNITeD
STATeS
Banana - January 2015 (provisional)
000 tonnes 2013 2014 2015 Difference 2015/2014
eU-27 — Supply 447 485 476 -2%Total import, of which 401 437 424 -3%
MFN 322 353 350 -1%ACP Africa 49 49 42 -14%
ACP others 30 36 32 -11%Total eU, of which 46 47 53 12%
Martinique 10 10 15 59%Guadeloupe 5 6 6 0%
Canaries 30 30 30 0%USA — Import 378 378 349 -8%
Re-exports 43 46 46 0%Net supply 335 332 302 -9%
EU sources: CIRAD, EUROSTAT (excl. EU domestic production) / USA source: US Customs
16.419.0
J F M A M J J A S O N D
USD
/col
is
2015 2014 2013
etats-Unis - Prix vert (spot)
12.3
17.8
J F M A M J J A S O N D
USD
/col
is
2015 2014 2013
Russie - Prix vert CIf St Petersburg
14.8 15.5
J F M A M J J A S O N D
euro
/col
is
2015 2014 2013
espagne - Prix vert platano*
© D
enis
Loe
illet
Russia - Green price
Spain - Platano - Green price*
United States - Green price (spot)
euro
/box
euro
/box
euro
/box
Content published by the Market News Service of CIRAD − All rights reserved

4 March 2015 No. 230
Direct from the markets
P R I C e
VO L U M e S
OrangeJanuary-february 2015The orange market remained under pressure at the beginning of the year, with a difficult end to the Spanish Nave-line campaign. Due to quality problems (advanced maturity) and a large supply, rates remained near cost price levels. The switch in late January to the bet-ter quality Navelate, and slightly livelier sales due to the decline of easy peelers, helped ease the market and restore rates to a seasonal level. On the juice orange side, the Salustiana supply continued to rise, reaching its incoming shipments peak, though prices remained stable and similar to table orange prices. The Tunisian Maltaise campaign continued to progress, with more fluid sales for small fruits at more competitive prices. Batches of Spanish blood oranges (Cara Cara, Tarocco and Sanguinelli) supple-mented the supply in February.
TypeComparison
previous month
average for last 2 years
Dessert orange + 19 %
Juice orange + 17 %
Type
Average monthly
priceeuro/15-kg box
Comparison with average
for last 2 years
Dessert orange 12.40 + 4 %
Juice orange 8.89 + 2 %
VO L U M e S
Varietiesby
source
Comparison
Observations
Cumulative total / cumulative
average for last 2 years
previousmonth
average forlast 2 years
Spanish Navel + 30 % Campaign on the wane. Quality concerns over the last
batches. + 33 %
SpanishNavelate
+ 11 % Navelate progressing rapidly, exhibiting better quality than Navel. + 21 %
SpanishSalustiana + 17 % Salustiana volumes on the rise. Incoming shipments peak in
February, before the beginning of the seasonal fall. + 32 %
TunisianMaltaise + 1 % Incoming shipments peak. Good size spread. - 4 %
Threat of greening now tangible in the Mediterranean. This is among the worst news that the Spanish, and more generally Mediterranean, citrus growing industry could have feared. Trioza Erytrea, more commonly known as the African psyllid, a vector of the African form of greening, has been discovered in Galicia, in the Western provinces of Pontevedra and La Coruña. The pest has also reportedly been identified on the other side of the border, in the Porto region. Most fortunately, no tree bacterial infection has been detected so far. Let’s hope that what is for the time being nothing more than a serious warning shot results in the threat of greening finally being taken seriously by the sanitary protection services in Spain, and more generally in the other Mediterranean producer countries. It is now high time to take action, and finally develop a Mediterranean epidemic moni-toring network for this disease.
The European Commission must get things in motion, given the economic, social and environmen-tal challenges represented by this disease. Andalusia has decided to set up a phytosanitary monitoring plan, aimed at detecting emerging diseases such as greening, while a crisis committee has been set up in Valencia.
Source: CIRAD
Peruvian citruses: still on the up! 2015 should be another growth year for Peruvian citrus exporters. Procitrus, the repre-sentative body of Peruvian citrus growers, is predicting an export potential of 120 000 t, up 10 % from 2014. The increase is report-edly due to the young W. Murcott stock reaching its prime. In 2013, this variety on its own represented 12 % of the 70 000 ha Peruvian cultivation area.
Source: Procitrus
0
20
40
60
80
100
120
2000 2002 2004 2006 2008 2010 2012 2014
000
tonn
es
Source: SIICEX
Citrus - Peru - exports
oranges
easy peelers
0.0
0.2
0.4
0.6
0.8
1.0
O N D J F M A M J J A S
euro
/kg
Orange - france - Prix import
14/15 13/14 12/13
Orange - france - Import price
Content published by the Market News Service of CIRAD − All rights reserved

5No. 230 March 2015
Direct from the markets
GrapefruitJanuary-february 2015Despite quiet demand at the beginning of the year, the grapefruit market re-mained well balanced. Indeed, after in-coming Floridian shipments returned to average in late 2014, the supply fell back into shortfall because of the exchange rate remaining unfavourable for imports. A shortage of size 48 was particularly perceptible. Rates started to strengthen in February, due to the early fall in vol-umes from this source. On the Mediter-ranean grapefruit side, sales maintained better fluidity than in previous years, because of certain lines switching over to Mediterranean sources and the Israeli supply shortfall. Rates remained slightly above average, though there was no fur-ther price increase, given the presence of Turkish and Spanish batches register-ing competitive prices.
V O L U M e S
TypeComparison
previous month
average for last 2 years
Tropical - 28 %
Mediterranean - 5 %
PRIC e
Type
Average monthly
priceeuro/17-kg box
equivalent
Comparison with average
for last 2 years
Tropical 19.72 + 15 %Mediterranean 9.90 + 6 %
V O L U M e S
Source
Comparison
Observations
Cumulative total / cumulative
average for last 2 years
previousmonth
average forlast 2 years
Florida - 28 %Floridian supply falling in February due to the effects of an unfavourable euro/dollar exchange rate for imports.
- 17 %
Israel - 22 % Slight increase in volumes since the beginning of the year, with levels still in shortfall. - 16 %
Turkey + 25 % Turkish volumes up from January, in particular on the North Euro-pean markets. But production zones affected by the cold spell. + 31 %
2013-14 winter grapefruit season: better late than never. The significant recovery by Euro-pean imports to nearly 240 000 t should be put into perspective on two counts. Firstly, it came after plummeting volumes in 2012-13, the worst season ever recorded by the EU in terms of consumption. Secondly, this rise to a perfectly ordinary level came at the expense of prices, which were well below average, or even calamitous during the seven-month season. Further-more, this lamentable record led to an unprecedented wave of up-rooting in Israel. The sole positive point was the stabilisation of the Floridian grapefruit market, after years of waning imports. The cur-rent season should end up seeing another decrease in volumes, with all supplier countries besides Spain registering a significant delay to market in March. Conversely, rates should see a recovery, though not necessarily accompanied by better profitability for an import sector weighed down by the rise of the dollar.
Sources: Eurostat, CIRAD
Grapefruit - eU - Winter season supply
Tonnes 2008-09 2009-10 2010-11 2011-12 2012-13 2013-14
Total 245 863 246 755 231 181 229 759 196 892 225 005
Turkey 64 634 75 004 66 286 81 960 52 786 87 993
Israel 68 502 58 101 48 576 44 170 45 401 41 664
USA 64 548 55 132 52 721 45 988 40 676 41 847
Spain 36 300 47 900 51 825 44 560 46 998 45 033
Cyprus 11 880 10 617 11 773 13 081 11 031 8 468 Source: Eurostat
246 247 231 230197
225
08/0
9
09/1
0
10/1
1
11/1
2
12/1
3
13/1
4
000
tonn
es
Grapefruit - eU - Winter season
Source: Eurostat
0.98 0.95 0.99 1.05 1.06 1.01
0.69 0.63 0.74 0.69 0.66 0.62
08/0
9
09/1
0
10/1
1
11/1
2
12/1
3
13/1
4
MediterraneanFlorida
Grapefruit - eU - Winter seasonPrice indicator (euro/kg)
Source: CIRAD0.0
0.2
0.4
0.6
0.8
1.0
1.2
O N D J F M A M J J A S
euro
/kg
Pomelo - france - Prix import
14/15 13/14 12/13
Grapefruit - france - Import price
Content published by the Market News Service of CIRAD − All rights reserved
6 March 2015 No. 230
Direct from the markets
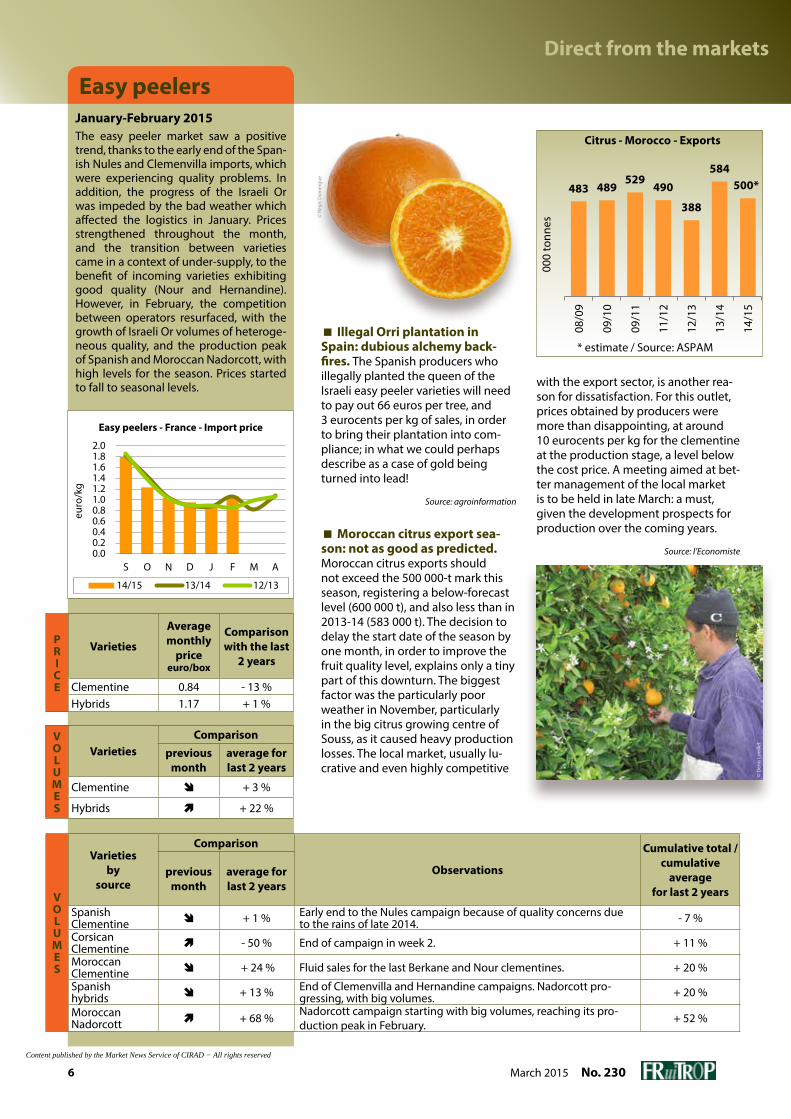
easy peelersJanuary-february 2015The easy peeler market saw a positive trend, thanks to the early end of the Span-ish Nules and Clemenvilla imports, which were experiencing quality problems. In addition, the progress of the Israeli Or was impeded by the bad weather which affected the logistics in January. Prices strengthened throughout the month, and the transition between varieties came in a context of under-supply, to the benefit of incoming varieties exhibiting good quality (Nour and Hernandine). However, in February, the competition between operators resurfaced, with the growth of Israeli Or volumes of heteroge-neous quality, and the production peak of Spanish and Moroccan Nadorcott, with high levels for the season. Prices started to fall to seasonal levels.
V O L U M e S
VarietiesComparison
previousmonth
average forlast 2 years
Clementine + 3 %
Hybrids + 22 %
PRIC e
Varieties
Averagemonthly
priceeuro/box
Comparisonwith the last
2 years
Clementine 0.84 - 13 %Hybrids 1.17 + 1 %
V O L U M e S
Varietiesby
source
Comparison
Observations
Cumulative total / cumulative
average for last 2 years
previousmonth
average forlast 2 years
SpanishClementine + 1 % Early end to the Nules campaign because of quality concerns due
to the rains of late 2014. - 7 %
CorsicanClementine - 50 % End of campaign in week 2. + 11 %
MoroccanClementine + 24 % Fluid sales for the last Berkane and Nour clementines. + 20 %
Spanishhybrids + 13 % End of Clemenvilla and Hernandine campaigns. Nadorcott pro-
gressing, with big volumes. + 20 %
MoroccanNadorcott + 68 % Nadorcott campaign starting with big volumes, reaching its pro-
duction peak in February. + 52 %
Illegal Orri plantation in Spain: dubious alchemy back-fires. The Spanish producers who illegally planted the queen of the Israeli easy peeler varieties will need to pay out 66 euros per tree, and 3 eurocents per kg of sales, in order to bring their plantation into com-pliance; in what we could perhaps describe as a case of gold being turned into lead!
Source: agroinformation
Moroccan citrus export sea-son: not as good as predicted. Moroccan citrus exports should not exceed the 500 000-t mark this season, registering a below-forecast level (600 000 t), and also less than in 2013-14 (583 000 t). The decision to delay the start date of the season by one month, in order to improve the fruit quality level, explains only a tiny part of this downturn. The biggest factor was the particularly poor weather in November, particularly in the big citrus growing centre of Souss, as it caused heavy production losses. The local market, usually lu-crative and even highly competitive
with the export sector, is another rea-son for dissatisfaction. For this outlet, prices obtained by producers were more than disappointing, at around 10 eurocents per kg for the clementine at the production stage, a level below the cost price. A meeting aimed at bet-ter management of the local market is to be held in late March: a must, given the development prospects for production over the coming years.
Source: l’Economiste
483 489529
490
388
584500*
08/0
9
09/1
0
09/1
1
11/1
2
12/1
3
13/1
4
14/1
5
000
tonn
es
* estimate / Source: ASPAM
Citrus - Morocco - exports
0.00.20.40.60.81.01.21.41.61.82.0
S O N D J F M A
euro
/kg
Petits agrumes - france - Prix import
14/15 13/14 12/13
© R
égis
Dom
ergu
e
© D
enis
Loe
illet
easy peelers - france - Import price
Content published by the Market News Service of CIRAD − All rights reserved

7No. 230 March 2015
Direct from the markets
VO L U M e S
P R I C e
VO L U M e S
AvocadoJanuary-february 2015Prices continued to strengthen at the beginning of the year. However, demand remained moderate because of high im-port and retail prices. However, despite a weekly supply of nearly one million box-es, a near-average level, the impression of under-supply persisted due to mod-erate incoming Hass shipments from Chile and Mexico (volumes earmarked primarily for the USA for the Super Bowl in week 5). Meanwhile, Israeli imports were disrupted in late January by logis-tical concerns. The supply diversified in February with the shipments peak from Israel and Spain, and the presence of batches from Morocco, Kenya and Co-lombia. Prices started to drop in week 7. The green varieties strengthened fur-ther because of the end of the Spanish campaign and a reduction in the Israeli supply due to bad weather.
VarietiesComparison
previousmonth
average forlast 2 years
Green - 3 %
Hass + 4 %
Varieties
Averagemonthly
priceeuro/box
Comparisonwith the last
2 years
Green 7.56 + 28 %
Hass 10.75 + 13 %
Source
Comparison
Observations
Cumulative total / cumulative
average for last 2 years
previousmonth
average forlast 2 years
Chile + 6 % Seasonal fall underway, though volumes average for the season. - 8 %
Israel - 4 %Rise in Hass volumes, with levels similar to the previous year. Fall in imports of green varieties due to production losses. Logistics disrupted by poor weather.
+ 12 %
Mexico - 6 % Mexican supply on the up, with volumes returning to average for the season (shipments to the USA for the Super Bowl).
+ 77 %
Spain + 18 % Spanish production peak, with higher levels than in previous years. Green varieties beginning their fall.
+ 17 %
Mexico: the avocado in all its states… Michoacán is set to no longer be the only Mexican State able to export its avocados to the United States! Ten districts in Jalisco were officially recognised as free from quarantine diseases in late February. This decision enables exporters in this State to undertake the final step in the access protocol for the world’s main Hass market, namely a 180-day public consulta-tion. While the production capacity of Jalisco is much less than for Michoacán, it is far from small-scale. The cultivation area comprises no less than 15 000 ha (i.e. one-and-a-half times the Spanish surface area, and more than twice the Israeli surface area), and its productivity is well above average for the country (high technical level, thanks to the near-universal use of irrigation, high density, etc.). Furthermore, surface areas have seen explosive growth: 10 000 ha were planted be-tween 2009 and 2014. The approval of Jalisco will further reinforce Mexico’s hold over the US market, to the detriment of other countries exporting to this destination. This is
bad news, particularly for Peruvian exporters, who currently enjoy an advantageous market window to the United States during the sum-mer. Jalisco has its production peak during this period, supplementing that of Michoacán.
Source: Notihass
Peruvian avocado welcomed to two new Asian markets. Peruvian exporters will be able to access the Chinese market and the Japanese market during the 2015 season. The agreement with the Chinese authorities has already been signed, while the agreement with Japan should be in place by April. Exporters believe that they will be able to send a combined to-tal of between 10 000 and 15 000 t of Hass starting from this season to these two destinations. The Japa-nese market is the world number three in terms of volume, absorbing approximately 60 000 tonnes per year, mainly from Mexico. China is for the moment just a marginal importer (3 000 tonnes).
Source: Notihass
Gra
phic
s: Ci
rad
-Fru
iTro
p
Mexico
MichoacánJalisco
0.0
0.5
1.0
1.5
2.0
2.5
3.0
O N D J F M A M J J A S
euro
/kg
Avocat - france - Prix import
14/15 13/14 12/13
© G
uy B
réhi
nier
Avocado - france - Import price
Content published by the Market News Service of CIRAD − All rights reserved

8 March 2015 No. 230
Direct from the markets
eUROPe
PineappleJanuary-february 2015Despite a tough start to the year, the situation for the pineapple in January and February was very bright. The mar-ket was a bit quiet in the first half of January. The flat demand and the pres-ence of stored batches (left over from the end-of-year holidays) hinted at a sluggish start to the year. Yet clearance sales helped put the market right. Mean-while, the Latin American Sweet supply subsided. From an overloaded market at the beginning of the month, by the end of the month the market was much less much less swollen. In February, the Sweet supply fell steeply, in the knowl-edge that it would not be likely to rise for several weeks. Indeed, cargo allocation problems, with the melon supplanting the pineapple, as well as rains at the pro-duction stage in Costa Rica, contributed to this heavy reduction in the supply, now a long way down on demand. On a market which had become promising, rates began an increase which kept go-ing throughout the month. Large sizes, which were less available, obtained bet-ter value, at prices not seen for years.
The Cayenne supply was too restricted - to the point of being non-existent - to be able to take advantage of the good market conditions.
PINeAPPLe - IMPORT PRICe IN fRANCe - MAIN SOURCeSWeeks 2015 1 2 3 4 5 6 7 8 9
Air-freight (euro/kg)Smooth Cayenne Benin 1.80-2.00 1.80-2.00 1.80-2.00 1.8-1.90 1.70-1.90 1.70-1.90 1.70-1.90 1.70-1.90 1.70-1.90
Cameroon 1.80-2.00 1.80-2.00 1.75-1.90 1.75-1.90 1.70-1.90 1.70-1.90 1.70-1.90 1.70-1.90 1.70-1.90Ghana 1.85-2.00 1.85-2.00 1.85-2.00 1.80-1.90 1.80-1.90 1.80-1.90 1.80-1.90 1.80-1.90 1.80-1.90Côte d’Ivoire 1.85-1.90 1.85-1.90 1.85-1.90 1.85-1.90 - - - - -
Victoria Reunion 2.50-3.50 2.50-3.50 2.50-3.50 3.00-3.80 3.50-3.60 3.00-3.80 3.50-4.00 3.50-4.00 3.00-4.00Mauritius 2.90-3.40 2.90-3.40 2.90-3.00 2.80-3.30 3.00-3.50 3.00-3.50 3.00-3.50 3.00-3.50 3.00-3.80
Sea-freight (euro/box)Smooth Cayenne Côte d’Ivoire 6.00-7.00 6.00-7.00 6.00-8.00 - 8.00-10.00 - - - -Sweet Côte d’Ivoire 7.50-8.50 7.50-8.50 7.50-8.50 8.00-9.00 8.50-10.00 8.50-10.00 8.50-10.00 9.00-11.00 9.00-13.00
Ghana 7.50-8.50 7.50-8.50 7.50-8.50 8.00-9.00 8.50-10.00 8.50-10.00 8.50-10.00 9.00-11.00 9.00-13.00Costa Rica 6.00-7.00 6.00-7.50 8.00-10.00 8.00-11.00 9.00-11.00 9.00-11.00 9.00-12.00 10.00-13.00 10.00-13.00
Slow and listless at the beginning of the year, the air-freight pineapple mar-ket gradually livened up as the supply subsided. In early January, the swollen market sought to absorb the influx of fruits received for the end-of-year holi-days. Fearing the drop in demand which usually follows the holidays, operators considerably scaled back their imports. Imports fell far more than expected be-cause of the low availability of fruits from Benin and Ghana, as well as quality con-cerns over certain fruits from Cameroon. The overall Cayenne supply remained small in February, enabling fairly high prices to be charged on a rather buoy-
eUROPe
PINeAPPLe — IMPORT PRICe
Weeks1 to 9 Min Max
Air-freight (euro/kg)
Smooth CayenneVictoria
1.702.50
2.004.00
Sea-freight (euro/box)
Smooth CayenneSweet
6.006.00
10.0013.00
ant market. The Ivorian supply, of good quality and limited volume, sold on a good footing. The reduction in exports from Benin also affected the Sugarloaf supply, which sold on a fairly stable foot-ing of between 1.85 and 2.00 euros/kg, depending on availability.
During the first two months of the year, the Victoria supply was very limited be-cause of production shortages in Reun-ion, and rains and cyclone conditions in Mauritius. So rates for those batches that were available were very high, although the quality of fruits reaching the market was not beyond reproach.
© P
aulin
e Fe
sche
t
Content published by the Market News Service of CIRAD − All rights reserved

9No. 230 March 2015
Direct from the markets
Costa Rican pineapple: scaling new heights. Or, to parody the description of Cyrano de Bergerac’s nose: “Tis a rock! A peak! A cape! No, it’s a peninsula”! Costa Rican Sweet exports not only set a new record in 2014, but they exceeded the symbolic threshold of 2 million tonnes. Shipments of the predominant fruit of the Costa Rican agro-industry have risen by more than 1 million in less than ten years, and the dynamic seems to be undiminished. US consumer appetite continued to drive the market upwards, with imports to this destination up nearly 90 000 t, to exceed the one million-tonne mark for the first time. Europeans also continued to purchase this product in a big way, with incoming volumes to the Community up nearly 30 000 t to exceed 920 000 t. As the cherry on the cake, there was an increase in economic returns to accompany the volume increase. The customs values in dollars maintained their levels from previous years, but a favourable exchange rate enabled returns in local currency to approach the heights seen at the end of the last decade.
Source: Procomer
0.90
1.181.35
1.441.42
1.661.72
1.881.94
2.07
2005
2006
2007
2008
2009
2010
2011
2012
2013
2014
mill
ion
tonn
es
Source: Procomer
Pineapple - Costa Rica - exports
UNIVEG, YOUR DIRECT CONNECTION TO THE FIELD
UNIVEG KATOPÉ FRANCE IS A MEMBER OF THE UNIVEG GROUP | www.univeg.com
UNIVEG Katopé France S.A.S.15, boulevard du Delta | Zone Euro Delta | DE1 - 94658 | RUNGIS CEDEX | FranceT +33 1 49 78 20 00 | F +33 1 46 87 16 45 | [email protected] | www.univeg.fr
UNIVEG Katopé France is an important player in the production, packaging, export, storage, ripening and distribution of fresh fruit and vegetables. All these services are carried out to ensure the quality and natural flavour of the fresh produce.
UNIVEG Katopé France and its Fruit Partners offer a year-long supply of pineapples from various origins.
189_15_presseA5_fruitrop_L174XH124_mars_ananas.indd 2 23/03/2015 10:21Content published by the Market News Service of CIRAD − All rights reserved

10 March 2015 No. 230
Direct from the markets
eUROPe
MangoJanuary-february 2015In the first half of January, the fall in Brazilian shipments was partially com-pensated for by the increase in Peru-vian shipments, which maintained the market balance between supply and demand, while also consolidating the rate of Peruvian mangoes. The Brazilian mango rate, at the end of the campaign, took advantage of Peru’s slow start, and rapidly strengthened. The simultaneous presence of the two sources did not result in an influx of merchandise, as is often observed in January. Conversely, these imports complemented each oth-er, with the majority of large fruits from Brazil, and mainly small sizes from Peru. In this favourable context, the more ir-regular quality of Brazilian produce did not hinder rates from strengthening. In the second half-month, the supply proved to be less than the natural mar-ket demand. This led to a price increase which continued until the end of the period, earning uncommon value for January.
The air-freight market was more mixed. Brazil was coming to the end of its cam-paign, with produce of variable quality selling on a fairly wide price footing, depending on the stage of maturity. The rates for Peruvian mangoes remained stronger, their good overall quality and higher cost prices justifying the price differences seen. In the second half of
MANGO - INCOMING SHIPMeNTS(estimates in tonnes)
Weeks2015 1 2 3 4 5
Air-freightBrazil 60 20 10 5 -Peru 70 60 100 150 150
Sea-freightBrazil 1 900 1 100 990 880 950Ecuador 330 150 110 70 -Peru 500 1 650 2 370 2 550 3 430
January, although certain sales were in excess of 5.00 euros/kg for higher qual-ity Peruvian mangoes, prices dropped slightly in parallel with the increase in quantities on the market. The rise in incoming shipments, and the prolifera-tion of import operators, disrupted the market conditions, making sales more difficult.
In February, Peru very much dominated the European market supply. Abnormal-ly high in January, the rate for Peruvian Kents sagged under the effect of large, regular shipments and moderate de-mand. The prices charged since the be-ginning of the year probably deterred certain supermarket sector purchasers from this product. The winter holidays in the second half of the month only in-tensified this downturn in demand. The price slump, not yet much in evidence at the beginning of the month, was more marked in the second half of Febru-ary. Certain sales of fruits brought out of more or less extended storage were made at prices below those mentioned above (from 4.50 euros/box). In the mid-
dle of the period, the gradual change of harvest zone (from Piura to Casma) was also accompanied by a changing size range. The small sizes, hitherto in the majority, became rarer; conversely, the large sizes made up the bulk of Peruvian shipments. This told on prices, with the minority sizes generally earning better value. Meanwhile, Brazil was shipping more limited quantities, mainly of Tom-my Atkins. This produce, primarily aimed at North European countries, sold at prices falling from 7.50 euros/box in the first half of February to 6.00 euros/box thereafter.
The air-freight mango market saw a re-verse trend, with prices slumping in ear-ly February because of heavier imports, and probably the arrival on the market of sea-freight fruits of air-freight quali-ty. The market recovered its balance to some extent in the second half-month, with Peruvian shipments dipping. The strengthening of rates can also be ex-plained by the increase in cost prices, due to the change in harvest zone, but also to currency rate variations.
eUROPe
MANGO - IMPORT PRICe ON THe fReNCH MARKeT
Weeks 2015 6 7 8 9 Averagefeb. 2015
Averagefeb. 2014
Air-freight (euro/kg)
Peru Kent 4.00-5.00 4.50-5.50 5.00-5.50 5.00-5.50 4.60-5.35 3.50-4.15
Sea-freight (euro/box)
Peru Kent 7.00-8.50 6.00-7.00 5.00-7.00 5.00-7.00 5.75-7.35 3.75-5.00
MANGO - INCOMING SHIPMeNTS(estimates in tonnes)
Weeks2015 6 7 8 9
Air-freightPeru 100 80 70 80
Sea-freightBrazil 1 010 810 680 1 050Peru 5 250 5 320 4 930 5 100
MANGO - IMPORT PRICe ON THe fReNCH MARKeT
Weeks 2015 1 2 3 4 5 Average
Jan. 2015Average
Jan. 2014Air-freight (euro/kg)
Brazil Kent 3.50-4.80 3.50-4.80 4.50-5.00 - - 3.80-4.85 3.25-4.15
Peru Kent 4.50-5.50 4.20-5.00 4.20-5.00 4.00-5.00 4.00-5.00 4.20-5.10 3.65-4.15
Sea-freight (euro/box)Peru Kent 6.00-6.50 7.00-8.50 6.50-8.50 7.00-9.00 7.00-8.50 6.70-8.20 2.30-4.20
Brazil Keitt 4.00-6.00 - - 7.00-8.00 7.00-8.00 6.00-7.30 3.00-4.00
Brazil Kent 4.00-6.00 5.00-8.00 - 7.00-8.00 - 5.30-7.30 2.30-3.80
Content published by the Market News Service of CIRAD − All rights reserved
11No. 230 March 2015
Direct from the markets
eUROPe
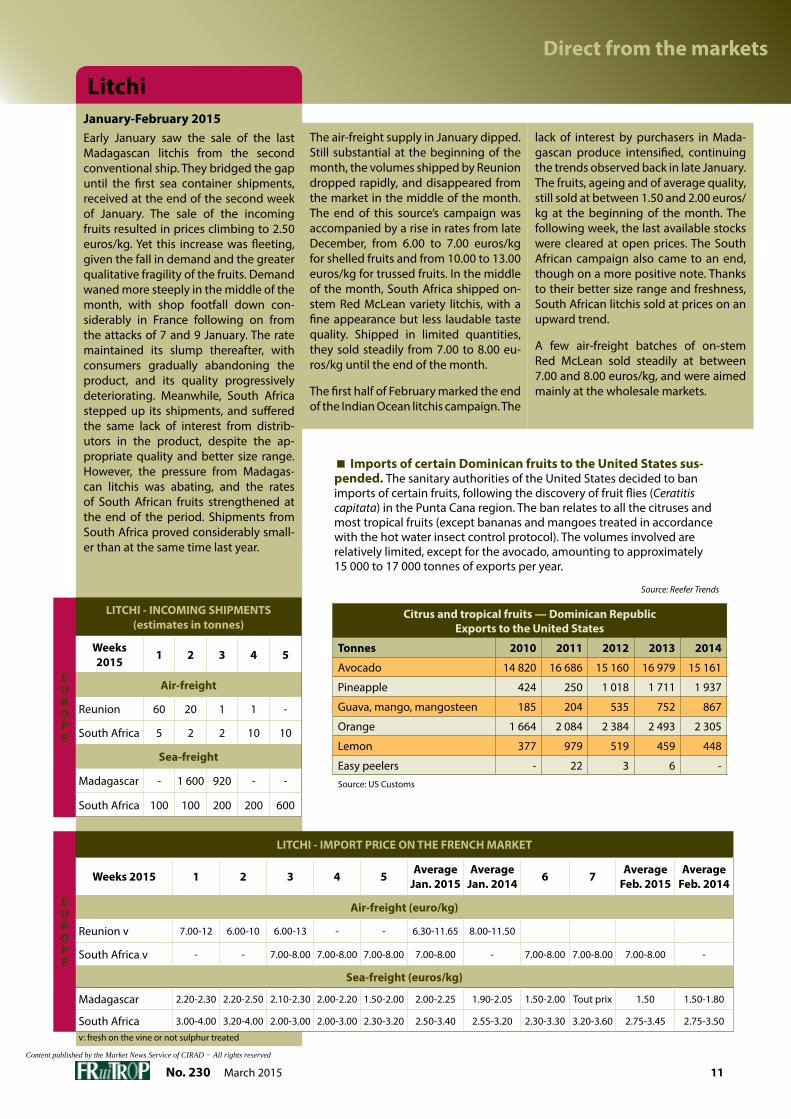
January-february 2015Early January saw the sale of the last Madagascan litchis from the second conventional ship. They bridged the gap until the first sea container shipments, received at the end of the second week of January. The sale of the incoming fruits resulted in prices climbing to 2.50 euros/kg. Yet this increase was fleeting, given the fall in demand and the greater qualitative fragility of the fruits. Demand waned more steeply in the middle of the month, with shop footfall down con-siderably in France following on from the attacks of 7 and 9 January. The rate maintained its slump thereafter, with consumers gradually abandoning the product, and its quality progressively deteriorating. Meanwhile, South Africa stepped up its shipments, and suffered the same lack of interest from distrib-utors in the product, despite the ap-propriate quality and better size range. However, the pressure from Madagas-can litchis was abating, and the rates of South African fruits strengthened at the end of the period. Shipments from South Africa proved considerably small-er than at the same time last year.
LITCHI - INCOMING SHIPMeNTS(estimates in tonnes)
Weeks2015 1 2 3 4 5
Air-freight
Reunion 60 20 1 1 -
South Africa 5 2 2 10 10
Sea-freight
Madagascar - 1 600 920 - -
South Africa 100 100 200 200 600
Litchi
Imports of certain Dominican fruits to the United States sus-pended. The sanitary authorities of the United States decided to ban imports of certain fruits, following the discovery of fruit flies (Ceratitis capitata) in the Punta Cana region. The ban relates to all the citruses and most tropical fruits (except bananas and mangoes treated in accordance with the hot water insect control protocol). The volumes involved are relatively limited, except for the avocado, amounting to approximately 15 000 to 17 000 tonnes of exports per year.
Source: Reefer Trends
The air-freight supply in January dipped. Still substantial at the beginning of the month, the volumes shipped by Reunion dropped rapidly, and disappeared from the market in the middle of the month. The end of this source’s campaign was accompanied by a rise in rates from late December, from 6.00 to 7.00 euros/kg for shelled fruits and from 10.00 to 13.00 euros/kg for trussed fruits. In the middle of the month, South Africa shipped on-stem Red McLean variety litchis, with a fine appearance but less laudable taste quality. Shipped in limited quantities, they sold steadily from 7.00 to 8.00 eu-ros/kg until the end of the month.
The first half of February marked the end of the Indian Ocean litchis campaign. The
eUROPe
LITCHI - IMPORT PRICe ON THe fReNCH MARKeT
Weeks 2015 1 2 3 4 5 AverageJan. 2015
AverageJan. 2014 6 7 Average
feb. 2015Average
feb. 2014
Air-freight (euro/kg)
Reunion v 7.00-12 6.00-10 6.00-13 - - 6.30-11.65 8.00-11.50
South Africa v - - 7.00-8.00 7.00-8.00 7.00-8.00 7.00-8.00 - 7.00-8.00 7.00-8.00 7.00-8.00 -
Sea-freight (euros/kg)
Madagascar 2.20-2.30 2.20-2.50 2.10-2.30 2.00-2.20 1.50-2.00 2.00-2.25 1.90-2.05 1.50-2.00 Tout prix 1.50 1.50-1.80
South Africa 3.00-4.00 3.20-4.00 2.00-3.00 2.00-3.00 2.30-3.20 2.50-3.40 2.55-3.20 2.30-3.30 3.20-3.60 2.75-3.45 2.75-3.50v: fresh on the vine or not sulphur treated
lack of interest by purchasers in Mada-gascan produce intensified, continuing the trends observed back in late January. The fruits, ageing and of average quality, still sold at between 1.50 and 2.00 euros/kg at the beginning of the month. The following week, the last available stocks were cleared at open prices. The South African campaign also came to an end, though on a more positive note. Thanks to their better size range and freshness, South African litchis sold at prices on an upward trend.
A few air-freight batches of on-stem Red McLean sold steadily at between 7.00 and 8.00 euros/kg, and were aimed mainly at the wholesale markets.
Citrus and tropical fruits — Dominican Republic exports to the United States
Tonnes 2010 2011 2012 2013 2014
Avocado 14 820 16 686 15 160 16 979 15 161
Pineapple 424 250 1 018 1 711 1 937
Guava, mango, mangosteen 185 204 535 752 867
Orange 1 664 2 084 2 384 2 493 2 305
Lemon 377 979 519 459 448
Easy peelers - 22 3 6 - Source: US Customs
Content published by the Market News Service of CIRAD − All rights reserved

12 March 2015 No. 230
Direct from the markets
Stone fruits — South Africa — export forecasts
Boxes 2014-15Comparison with
2013-14 2012-13
Nectarine (2.50 kg) 3 852 233 + 31 % + 23 %
Peach (2.50 kg) 1 928 975 + 23 % + 40 %
Plum (5.25 kg) 11 418 711 + 9 % + 1 %
Apricot (4.75 kg) 810 620 - 17 % - 27 %Source: HortGro
Good export level for South African stone fruits. The stone fruits season got off to a difficult start in South Africa. The season com-ing 7 to 10 days’ early, the small size range and the early-season rains did not help the marketing process, although the decision was made to ban exports of excessively small sizes, especially of plums. However, the peach and nectarine seasons did live up to their potential, with new varieties such as flat peaches, but also of plums, with the growth in the cultivation area and a highly diversified range. So exports should get back to the 2012-13 level, or even climb further, although certain desti-nations such as Europe are less receptive. The combined total registered in week 7 seemed to confirm the export forecasts, with a 23 % increase in shipments for the plum from 2013-14, a 20 % increase for the peach and 32 % for the nectarine. Conversely, shipments fell steeply for the apricot (- 17 %), given the falling potential. They were particularly limited to Continental Europe (- 42 %), but registered another gradual rise to the Middle East (+ 20 %).
Source: HortGro
Temperate fruits
New export record for Chilean cherries. The 2014-15 Chilean cherry season finished with a new record of approximately 100 000 tonnes, according to estimates by the association ASOEX (99 000 t ex-ported in week 5, i.e. + 45 % on 2013-14). The bulk of the volumes were absorbed by Asian countries (83 % of exports), for the vast majority by China. The rest is divided between the United States (9 %), Latin America (5 %) and Europe (4 %). Climate conditions were fairly favourable after a slightly difficult start to the season. Surfaces areas have increased considerably in recent years, now reaching 18 000 ha. The potential will be 150 000 t by 4 to 5 years’ time.
Source: ASOEX
Spanish strawberry seeking value. To claw back the loss of profitability suffered by the industry, the Spanish professional or-ganisations have launched several projects to boost the value of Huelva’s production. In spring, the various federations (Interfresa, FAECA, UPA, ASAJA, COAG and Freshuelva), under the aegis of the Andalusian govern-ment, created a working group responsible for discussing ways forward for the industry, and for contemplating unification of the companies under a “Huelva strawberries” PGI. A research programme is also under-way at the Cerdanyola del Vallés genome research centre (IRTA Barcelona), to decode the genes involved in the flavour of wild strawberries, in order to develop taste vari-eties in collaboration with Planasa. Finally, a big promotion campaign for Spanish strawberries is set to be launched in autumn 2015 by the Andalusian strawberry inter-professional organisation, Interfresa, for a period of three years and a budget of 3.6 million euros, allocated to measures aimed at promoting strawberry consumption on the internal and export markets. The bulk of the funds is set to focus on Germany and France, with 1.45 million euros each, as well as 500 000 euros for Spain.
Source: Infofruit
7.1 7.6 9.9 10.1
12.5 13.1 14.1 16.1 17.1 18.0
2005 2006 2007 2008 2009 2010 2011 2012 2013 2014
000
hect
ares
Cherry - Chile - Planted areas
Sources: ODEPA, ASOEX
© A
nne-
Char
lott
e O
réfic
e
Content published by the Market News Service of CIRAD − All rights reserved

Adding a touch of differenceto your plate!
Fresh asparagus
Fresh European asparagus is rich in vitaminsand minerals, very low in fats and full of flavour.
Discover the enjoyment of using it to createyour own unique haute cuisine dishes!
ACTION CO-FUNDED BY THE EUROPEAN UNION AND GREECEContent published by the Market News Service of CIRAD − All rights reserved

Tissue culture produc�on of tropical fruit plants
Your banana �ssue culture plant specialist
What we promise youThe most produc�ve selected elite varie�es
Prime bunch quality
Op�mum homogeneity in the �eld
The best sanitary guarantees of the market
Unequalled responsiveness
Tel: +33 (0)4 67 55 34 58Fax: +33 (0)4 67 55 23 05
ZAE des Avants34270 Saint Mathieu de Tréviers
FRANCEwww.vitropic.fr
A uniquerange
of elitevarieties
f189 pub vitropic pleine page.ai 1 24/05/2011 10:27:49
f189 pub vitropic pleine page ver3 ANG.pdf 1 01/06/2011 09:26:46
Content published by the Market News Service of CIRAD − All rights reserved

15No. 230 March 2015
Direct from the markets
eUROPe
Sea freightJanuary-february 2015The solid end to 2014 and a lively start to the chartering year did not last long – by mid-January the Ecuadorian exit price had soared on high demand for a short supply of bananas, reducing the de-mand for Spot charters. Chile was una-ble absorb more tonnage despite an un-expected peak in table grape supply and discharge issues on the US west coast, while the squid returned to the depths of the South Atlantic after an unusually early foray to the surface.
Although fixture activity was disappoint-ing, the market and therefore monthly TCE average was supported by a gener-ally balanced supply/demand scenario and low bunker prices. The lower bunker price environment this year has a sig-nificant role to play in the voyage yield, giving operators greater flexibility to achieve a satisfactory return even if they have had to concede ground against the container lines on headline rates.
This supply/demand equilibrium con-tinued until mid-February, at which time Chile called for more vessels to meet the deadline for the US Marketing Or-der, and desperate Californian citrus charterers finally bowed to pressure to charter units in order to ship their cargo to equally desperate receivers in Japan and South Korea. With Filipino banana charterers fixing vessels to cover a reviv-al of banana exports and other tonnage sailing south to meet demand in the Falkland Islands, the market shortened quickly and rates increased.
The last week of February saw the TCE average yield on vessels fixed break the 100c/cbft mark for the first time since March 2011. With a heavy squid catch forecast for the South Atlantic, more ba-
MONTHLY SPOT AVeRAGe
USD cents/cubic foot x 30 days
Largereefers
Smallreefers
January 2015 61 88
January 2014 77 82
January 2013 60 86
February 2015 82 79
February 2014 70 79
February 2013 89 107
0
25
50
75
100
125
1 6 11 16 21 26 31 36 41 46 51
Grands reefers
201420132012
US
Cent
s / C
ubft
x 3
0 jo
urs
Semaines / Source : Reefer Trends
0
25
50
75
100
125
150
1 6 11 16 21 26 31 36 41 46 51
Petits reefers201420132012
US
Cent
s / C
ubft
x 3
0 jo
urs
Semaines / Source : Reefer Trends
6th International Banana Congress, and 21st Interna-tional Meeting of ACORBAT. For the first time, these two big events for the banana and plantain will be held at the same time in San José, Costa Rica, from 22 to 26 February 2016. More than 800 representatives from the international banana community will come togeth-er on this occasion. For five days, internationally renowned experts will present the latest advances in research and current trends in the banana market.
Source: Corbana
nanas available east and west of the Pan-ama Canal this year, a total of 55 charters required for a much larger New Zealand kiwifruit crop and 60K MT more Argen-tinean lemon exports anticipated, there may be a substantial peak to the season.
There may also be some help from else-where: although the dispute between the ILWU and PMA on the US west coast is resolved, port officials believe that it could be anywhere between 6-12 weeks before the backlog of containerized car-go is cleared — well into the season for
Valencia oranges and past season’s end for Navels, the principal export variety for those shippers that have chosen not to take the specialized reefer route to market in Japan and Korea. Should the forecast prove accurate, it may be suf-ficient to encourage Chilean apple and pear shippers to consider the reefer as a viable alternative to the third-party lin-er services. Throughout the slowdown reefer ships were able to load and dis-charge in Hueneme and San Diego with only minor delays.
Launch of the new site commodafrica.com. This site is dedicated to information and analysis of agriculture and other sectors of the economy which help and contribute to agricultural and agro-industrial development across West African country, in both French-speaking and English-speaking countries. The information is classified by country, industry and sector. The featured industries include the plantain banana, cashew, fruits, market gardening crops and roots & tubers.
Source: commodafrica.com
Large reefers Small reefers
Weeks / Source: Reefer Trends Weeks / Source: Reefer Trends
US
Cent
s / C
ubft
x 3
0 da
ys
US
Cent
s / C
ubft
x 3
0 da
ys
Content published by the Market News Service of CIRAD − All rights reserved
16 March 2015 No. 230
THE LATEST ON...
2015 Southern Hemisphere pip fruits campaign
Options becoming a necessity
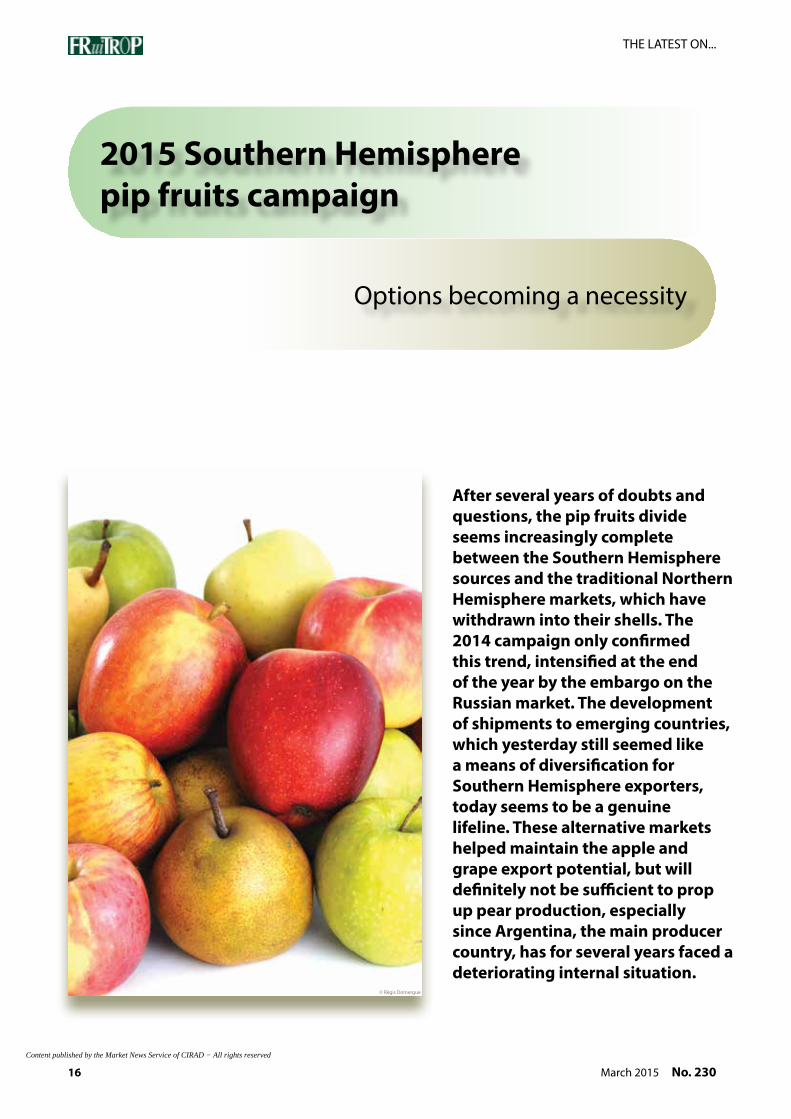
After several years of doubts and questions, the pip fruits divide seems increasingly complete between the Southern Hemisphere sources and the traditional Northern Hemisphere markets, which have withdrawn into their shells. The 2014 campaign only confirmed this trend, intensified at the end of the year by the embargo on the Russian market. The development of shipments to emerging countries, which yesterday still seemed like a means of diversification for Southern Hemisphere exporters, today seems to be a genuine lifeline. These alternative markets helped maintain the apple and grape export potential, but will definitely not be sufficient to prop up pear production, especially since Argentina, the main producer country, has for several years faced a deteriorating internal situation.
© Régis Domergue
Content published by the Market News Service of CIRAD − All rights reserved

17No. 230 March 2015
THE LATEST ON...
With difficult economic prospects, but good production po-tential, Southern Hemisphere pip fruit exporters have their work cut out to place their merchandise. The historic outlets, whether the United States, Europe or Russia, are less and less receptive, due to local production, economic and political difficulties. So developing the customer portfolio remains a necessity for a number of operators, with these outlets now representing a predominant share of shipments for certain products.
Grape: a quiet market, but with a good tempo
The 2014-15 Southern Hemisphere grape campaign en-joyed good market conditions, with the campaign ending early and high price levels for the last European grapes. So exporters are reckoning on good performances once more after two years of stagnation. With an optimum production potential in most countries, the 2015 vintage should be close to a record level (2.75 million tonnes, i.e. + 11 % on 2014). The export potential could even exceed the 3-year average (1.4 million tonnes) by 14 %, with the return of Argentina, good volumes in South Africa, Chile and Brazil, and the steep rise expected from Peruvian shipments.
So the campaign got off to an excellent start in Europe for the early sources. Brazil was practically absent in October.
The first Peruvian grapes appeared from early November. Prices immediately adopted high levels (4 euros/kg), and remained very strong until late 2014. The cyclical con-ditions then deteriorated slightly. Rates fell very signifi-cantly in mid-January (2.00-2.50 euros/kg), with Namibia, South Africa and Peru coming to the fore, and Argentina making a comeback in view of the Russian crisis.
While sales were slow, there was no real competition due to the absence of Chile, more marked every year. This source is increasingly favouring markets other than the Eurozone at the beginning of the season, especially Asia with the Chinese New Year. So its progress was deferred in Europe, from its planned week 4 start, although the strikes in the North American ports impeded shipments to the United States. The first Chilean volumes were ex-pected from early March, at the same time as from India, but the campaign will doubtless be limited. Prices re-mained around 1.90 to 2 euros/kg until late February.
So this rearrangement of the calendar is actually a guar-antee of stability for the European market, with table grape consumption struggling to get going there in the counter-season. While the Red Globe variety seems to have gained ground on many Community markets, seed-less varieties remain especially prized by the North Euro-pean markets. Furthermore, globalisation is leading to strategic choices by exporters, who are not of one mind in all the distribution sectors, especially in terms of pack-aging, such as Chile’s 8.2-kg boxes.
5.01 5.00 5.36
5.13 5.21 4.99
2.55 2.57 2.56 2.56 2.64 2.48
1.45 1.31 1.41 1.36 1.46 1.37
2009 2010 2011 2012 2013 2014
mill
ion
tonn
es
Apple Grape Pear
* South Africa, Argentina, Brazil, Chile, New Zealand / Sources: WAPA, USDA / Processed by Infofruit
Pip fruits - Production of mainSouthern Hemisphere countries ©
Eric
Imbe
rt
Content published by the Market News Service of CIRAD − All rights reserved

18 March 2015 No. 230
THE LATEST ON...
Pear: reduced market absorption capacity
The apple and pear market calendar has seen great dis-ruption on the traditional markets over the last few cam-paigns, especially in Europe, which has greatly narrowed the import window. This rearrangement is even forcing importers to review their requirements, and is weighing down heavily on export levels of the pear, for which Eu-rope remains an essential outlet. However, after a 2014 campaign slightly in shortfall due to the reduced potential in Argentina (- 12 %), Chile (- 8 %) and New Zealand due to frosts, a good harvest level was expected for 2015. Hence the initial estimates unveiled in late 2014 and early 2015 heralded the return to a slightly above-average produc-tion level (+ 5 %).
Yet there are fears that these figures might be revised downward, since while a production return from Chile (+ 9 % on 2014) and New Zealand (+ 30 %) is expect-ed, there were heavy losses in Argentina due to the hail storms, strikes, over-maturity and producers preferring to leave the fruits on the trees in the absence of lucrative outlets. Furthermore, since the harvest of the first varieties ended up being scaled back in South Africa, overall pro-
duction could ultimately be well below the + 7 to + 8 % announced before the harvest. The export potential could also be reduced since the climate conditions did not fa-vour size, and the European market could be difficult to penetrate due to the good level of the European harvest (2.27 million tonnes, i.e. + 23 % on 2014). Indeed, the stock was still 592 000 t in Europe on 1st February 2015, i.e. + 16 % on the 3-year average.
Moreover, the delay to the campaigns, with the season starting in week 4 for South Africa and in week 10 for Ar-gentina, was rather favourable for sales, with the Italian Williams campaign now ending in early February (week 6). However, with a highly reduced Williams potential for both these sources, price levels were fairly disappointing, with North European pressure to clear the cold chambers before the arrival of the Packham’s preventing price level rises (0.95-1.10 euro/kg on import into Northern Europe, depending on size). Conversely, there should be no con-cerns for the Comice, as the European campaigns ended in late February as per a normal calendar. Yet the market could slow down subsequently, and the leftover European Conference and Abate volumes could well hinder South-ern Hemisphere Packham’s and Abate sales. The Europe-an stock was actually still 18 % above the 3-year average for Conference and 23 % above average for Abate in early February, leaving no hope for the market easing before May and June.
11.01
9.74 10.75
10.10 10.91
11.89
2.60 2.28 2.65
1.89 2.33 2.27
2009 2010 2011 2012 2013 2014
mill
ion
tonn
es
Apple Pear
Source: WAPA, October 2014
Apple and pear - eU-28 - Production
Content published by the Market News Service of CIRAD − All rights reserved

19No. 230 March 2015
THE LATEST ON...
Apple: salvation outside of europe
The initial apple forecasts reckoned on most of the South-ern Hemisphere countries returning to production, after the drop in potential registered last year (- 4 to - 5 %). So the harvest, estimated at between 4.8 and 5.2 mil-lion tonnes depending on sources, was set to be slightly above the 3-year average (+ 2 to + 6 %). On the strength of these prospects, exporters reckoned on good export performances, ranging from + 3 % for the most optimistic forecasts to - 1 % for the lowest (1.3 to 1.7 million tonnes, depending on the sources). However, certain markets such as the United States, Europe or Russia could have lit-tle demand, the former because of the leftover produce, and Russia in view of the political and economic situation.
So most operators once more this season will bank main-ly on the Asian markets, although the phytosanitary pro-tocols sometimes impede shipments. So exports could intensify out of New Zealand, Chile and South Africa to China, Taiwan but also India. Meanwhile, operators should step up their sales to nearby markets. Hence South Africa is targeting several African countries, especially Nigeria, Angola, Kenya, Zambia and Cameroon, while Chile should step up its presence in Latin America, especially in Peru, Ecuador and Mexico. The Middle East will also remain a favoured target, although the performances of the previ-
ous year did not meet the forecasts, with volumes actu-ally down. Brazil could have a bigger presence in Russia, taking advantage of the expected fall from other sources. The campaign is set to be particularly difficult for Argen-tina, whose main outlets are Europe, Russia and Brazil, especially since this supplier has seen its competitiveness reduced, between the recurrent annual wage increase of 30 % per year and the non-devaluation of the peso. So imports to Europe should be scaled back, especially since the European stock still amounted to 3.7 million tonnes in early February (+ 16 % on the 3-year average).
The beginning of the Southern Hemisphere apple season could again be delayed for most varieties. Indeed, while the first incoming Gala shipments were received in early March last year, the first significant volumes only reached the wholesale stage in mid-April, and the supermarket sector in June. Similarly, Granny sales remained scarce un-til the second half of June. Certain varieties such as Pink Lady, however, should again enjoy a promising window. The first volumes appeared last year in early May, and rapidly made it to stock rooms. Sales then picked up from mid-May with the end of the European campaign, and the market remained buoyant until mid-July. However, the influx of volumes, the summer holidays and the predomi-nance of small sizes overcame this segment thereafter
Cécilia Céleyrette, consultant [email protected]
3.34
2.79
3.313.66
0.42 0.62
0.35 0.59
2011 2012 2013 2014
mill
ion
tonn
es
Apple
Pear
Sources: WAPA and professional organisations Processed by Infofruit
Apple and pear - eU-28 - Stocks in main countries at 1st february
© R
égis
Dom
ergu
e
Content published by the Market News Service of CIRAD − All rights reserved

20 March 2015 No. 230
THE LATEST ON...
Southern Hemisphere pip fruits
Struggling to hold up
The cyclical conditions are set to remain difficult for Southern Hemisphere pip fruits, with the risk, at least for the pear and even the grape, of triggering cutbacks in production surface areas. They are still relatively stable in most countries thanks to market diversification and varietal renewal. However, the Russian crisis and strengthening trend of “local consumption” are already weighing heavily on the long-term future of upstream companies and on pip fruit importers, especially in europe.
© R
égis
Dom
ergu
e
Content published by the Market News Service of CIRAD − All rights reserved

21No. 230 March 2015
THE LATEST ON...
A more marked slowdown in table grape exports
Although the 2015 table grape campaign has a more optimistic outlook than the previous two seasons, the general trend remains for a slowdown in shipments, with a fall of 8 % in 2014 (1.2 million tonnes, i.e. - 5 % on the 3-year average). This dip is primarily attribut-able to the downturn in exports to the United States (- 17 %), which should not conceal the lukewarm results on the other markets. The European and Middle East markets saw sta-bility, or even a slight fall, with variable per-formances in Asia, depending on the country and suppliers. While Chile and Argentina reg-istered the steepest drops in 2014 due to fall-ing production, the export levels out of South Africa or Brazil did not hold up either, with exporters lamenting the falling profitability of this crop with the decrease in sale prices.
Hence production is now stalling signifi-cantly. Surface areas are stable at best in most of these countries, except for Peru and to a lesser degree South Africa. Yet they are already shrinking in Chile and Brazil. The de-velopment of seedless varieties, which was to boost sales, does not seem to have fully borne fruit; and it has been on such a scale that these varieties now represent the majority of the stock in certain Southern Hemisphere countries, especially South Africa, Chile and increasingly in Brazil. Conversely, Red Globe remains dominant in Argentina and Peru, though their ranges are also expanding with white and pink seedless varieties.
Apple struggling to hold up despite a diversified customer portfolio
While apple exports from the main Southern Hemisphere countries have maintained a lev-el of around 1.6 to 1.7 million tonnes over the past few years, it must be emphasised that they fell by 7 % in 2014, though this followed a very strong 2013. This drop was particularly sharp on the European market (- 22 %), which
Table grapes - Southern Hemisphere Main sources exports by destination in 2013-14
Tonnes Total USA eU-28 OthersChile 750 000 314 662 124 978 310 360 South Africa, Namibia 238 157 47 181 641 56 469
Brazil 43 181 62 36 259 6 860 Argentina 12 000 19 5 049 6 932 Peru 177 000 35 000 55 705 86 295 Total 1 220 338 349 790 403 632 466 916 National sources, professional organisations / Processed by Infofruit
© V
anes
sa R
ingl
er -
Uni
veg
0
100
200
300
400
500
600
2000
2001
2002
2003
2004
2005
2006
2007
2008
2009
2010
2011
2012
2013
2014
000
tonn
es
USA EU-28 Others
*South Africa, Chile, Argentina, Peru, Brazil National sources , professional organisations
Processed by Infofruit
Table grapes - Southern Hemisphere*exports by destination
Content published by the Market News Service of CIRAD − All rights reserved

22 March 2015 No. 230
THE LATEST ON...
registered its lowest level, below even that of 2012. There was also a significant decrease in the United States (- 9 %), where Chilean apple exports were down significantly. Yet not all the sources had poor results on this market, with improved performances by Argentina (+ 3 %) and New Zealand (+ 3 %).
Hence the 2014 campaign confirmed the need for exporters to find other outlets, es-pecially Asia, since the growth toward Middle Eastern countries is more mixed. This trend is reaffirmed year on year, and the upward curve of volumes imported by the emerging countries is such that these outlets are now predominant. Hence destinations outside of the EU, USA and Russia, i.e. primarily South America, Asia and the Middle East, absorbed 60 % of tonnages as opposed to 26 % for Europe, 11 % for the USA/Canada and 2 % for Russia. The still high shipments to this latter destination also ebbed more sharply last year (- 50 %), under the effect of the cri-sis, with a marked fall in exports from most sources, with the exception of New Zealand, which registered its best performance to this country.
Thanks to these alternative markets, produc-ers were able to maintain their surface are-as in most Southern Hemisphere countries: they were stable in Chile or Argentina, and still growing slightly in South Africa and New Zealand. They dropped slightly in Brazil, with producers uprooting old orchards, and show-ing little inclination to replant given the high set-up costs and the economic prospects.
The two-tone varieties were the most sought-after on the export markets. Gala re-mained by far the main planted variety, with a potential of around 1.8 million tonnes (34 % of volumes produced), just ahead of Fuji (794 000 t, i.e. 14 %), whose potential was still growing, especially in Brazil, South Africa and New Zealand. Conversely, production growth was slower for Cripps Pink (nearly 400 000 t, i.e. 7 % of production, 164 000 t of which in Chile and 87 000 t in South Africa) or Jazz (52 000 t in New Zealand), but was still con-tinuing for specific varieties such as the Pa-cific range (54 000 t in New Zealand). Other varieties such as Braeburn were struggling to establish themselves, seeing their potential wane, especially in New Zealand (112 000 t). Uprooting continued for Red Delicious, which still represented 15 % of volumes harvested (850 000 t), with a marked fall over the past
0
200
400
600
800
1 000
1 200
2006
2007
2008
2009
2010
2011
2012
2013
2014
000
tonn
es
EU-28 USARussia Others
Sources: National Customs, professional organisations / Processed by Infofruit
Apple - Southern Hemisphereexports by destination
Apple - Southern Hemisphere Main sources by destination in 2014
Tonnes Total USA eU-28 Russia OthersChile 820 000 138 428 164 256 15 201 502 115 S. Africa 397 452 84 206 3 662 309 584 Argentina 135 000 9 216 35 414 11 991 78 379 Brazil 44 294 30 437 42 13 815 N. Zealand 310 500 48 009 128 904 8 144 125 443 Total 1 707 246 195 653 443 217 39 040 1 029 336 National sources, professional organisations / Processed by Infofruit
© R
égis
Dom
ergu
e
Content published by the Market News Service of CIRAD − All rights reserved

23No. 230 March 2015
THE LATEST ON...
few years in Chile. Granny Smith, the num-ber four variety planted, held up at around 740 000 t (13 %), while the potential of Gold-en was relatively stable (175 000 t, i.e. 3 %).
A more marked downturn in pear exports with the staggering of the Northern Hemisphere campaigns
The situation is more worrying for pear ex-porters. Southern Hemisphere shipments fell below 700 000 t in 2014, i.e. another 10 % fall. A considerable drop in shipments was observed to Russia (- 21 %) and the Europe-an market (- 15 %), while other destinations, whether the United States, Africa or Asia, did not absorb any more volumes. However, this drop was primarily due to the fall in ship-ments from Chile (- 21 %), and to a lesser de-gree from Argentina (- 7 %) due to the frosts of September 2013. South African exports barely just held up (+ 1 %). Despite quantities on the wane, sales were very slow last year because of the leftover European production, which led to give-away price levels to end the campaigns.
Hence the growth in production surface are-as came to a halt, except in South Africa (+ 1 to + 2 % per year), where it has now slowed down (high set-up cost and market uncer-tainty). In this country, however, growth was still significant for Packham’s (+ 7 %), the lead-ing stock variety, Rosemarie (+ 6 %), Forelle (+ 5 %) and Abate (+ 3 %), while it fell for Wil-liams (- 3 %). Nonetheless, we should empha-sise the growth of the Early Bon Chrétien sup-ply. Surface areas were stable in Chile, with the clear dominance of Packham’s persisting (50 % of production). Over the past few years, growth has been more considerable for Abate (+ 37 % on the 3-year average in 2015). Simi-larly, the Forelle potential is on the up. Other varieties such as Beurré Bosc, however, are ex-pected to fall. In Argentina, the varietal range has not changed in recent years, still focused on Williams (47 % of stock), followed by Pack-ham’s (31 %)
Cécilia Céleyrette, consultant [email protected]
0
50
100
150
200
250
300
350
2006
2007
2008
2009
2010
2011
2012
2013
2014
000
tonn
es
EU-28 USARussia Others
Sources: National Customs, professional organisations / Processed by Infofruit
Pear - Southern Hemisphereexports by destination
Pear - Southern Hemisphere Main sources by destination in 2014
Tonnes Total USA eU-28 Russia OthersChile 100 000 16 270 40 534 4 610 38 586 S. Africa 200 600 1 824 99 045 13 113 86 618 Argentina 380 000 43 803 86 972 84 723 164 502 N. Zealand 5 350 2 304 1 131 - 1 915 Total 685 950 64 201 227 682 102 446 291 621 National sources, professional organisations / Processed by Infofruit
© R
égis
Dom
ergu
e
Content published by the Market News Service of CIRAD − All rights reserved

March 2015 No. 230 24
A report prepared by Pierre Gerbaud
Contents
p. 26 european mango market — Several sources on the offensive
p. 32 2014 mango campaign —Review by source: Rising tonnages and concentration of campaigns
p. 60 european mango market — 2014 monthly review: Short-lived disruption on a steady market
p. 64 World statistics panorama
p. 66 Mango quality defects
p. 68 The main mango varieties
Mango
MangoMango
© Régis Domergue
Content published by the Market News Service of CIRAD − All rights reserved

Content published by the Market News Service of CIRAD − All rights reserved

26 March 2015 No. 230
CLOSE-UP
european mango market
Several sources on the offensive
In a global economic context of ongoing crisis, the international mango trade is coping well. While consumption of fruits and vegetables is stagnating, or even sagging, european mango imports are continuing their rise, with quantities more than doubling over the past fifteen years. 2014, with an additional 10 000 tonnes from 2013, was another year of positive trends. Was this caused by production increases by supplier countries, or rising european consumption? The most likely answer is a combination of the two factors.
© C
arol
ina
Daw
son
Content published by the Market News Service of CIRAD − All rights reserved

The strength of our products is based on our requirements as a producer.That is why our mangoes are at the top of the podium, whether they are ripened on the tree in Southern Spain or imported from our partners.
Measuring up
100% Quality and Reliability
Content published by the Market News Service of CIRAD − All rights reserved

28 March 2015 No. 230
CLOSE-UP
USA still leading the way in mango imports, despite a cyclical downturn
The international mango trade seems to be set fair, according to the latest statistical data available. Euro-pean imports are increasing year on year, approaching the 300 000-tonnes threshold. True, this is not a uni-form rise if we take global trade, and in particular the world’s two main import centres, which in order of size are the United States and Europe (see graph).
While European imports continued to rise, with more than 270 000 tonnes imported in 2014, US imports dipped for the first time for fifteen years. With a pop-ulation of 320 million, the USA usually used to import around 100 000 to 150 000 tonnes more than Europe, on a regular basis. In 2014, imports registered a down-turn of 50 000 tonnes, as opposed to their booming expansion in previous years. This hiccup is apparently attributable to the downturn from the leading suppli-er to the United States: Mexico. Indeed, Mexican pro-duction in 2014 was affected by major meteorological phenomena. Hurricanes and floods heavily disrupted mango production, especially on the West coast of the country, where big production zones are located (Michoacán). Hence Mexican shipments fell by more than 40 000 tonnes. Shipments from Ecuador to the USA were also down, with nearly 12 000 tonnes less than in previous years. The other US market suppliers could not make up for this shortfall, because of a man-go shortage, or more likely a calendar difference.
However, taking into account the population, the United States still has a higher mango consumption than Europe. With its 270 000 tonnes of imports (near-ly 290 000 tonnes if we add Spain as a supplier) and a population of 507 million, Europe still has potential for development. Making up the consumption gap with the United States would herald a bright future for mango imports to Europe!
european market in good shape
With an increase of 10 000 tonnes, or nearly 30 000 tonnes if we count Spanish shipments, the European mango market is not doing too badly. The graph op-posite is a fairly good summary of the 2014 campaign. It is based on European Union monthly imports and on price averages observed on the French market for sea-freight Kents, from all sources.
At the beginning of the year, the large quantities of fruit from Peru, but also Brazil which was at the end
0
50
100
150
200
250
300
350
400
450
2000
2001
2002
2003
2004
2005
2006
2007
2008
2009
2010
2011
2012
2013
2014
000
tonn
es
Source: national Customs
USA
EU
Mango - Import trendin the United States and europe
© E
ric Im
bert
Content published by the Market News Service of CIRAD − All rights reserved

RCS
- Exo
farm
- 40
9.52
2.96
8
Contact us : +33 (0)1 41 80 46 30
Mango !Coming soon...
20150331-CFF-APMangue-Exe.indd 1 31/03/2015 11:02
Content published by the Market News Service of CIRAD − All rights reserved
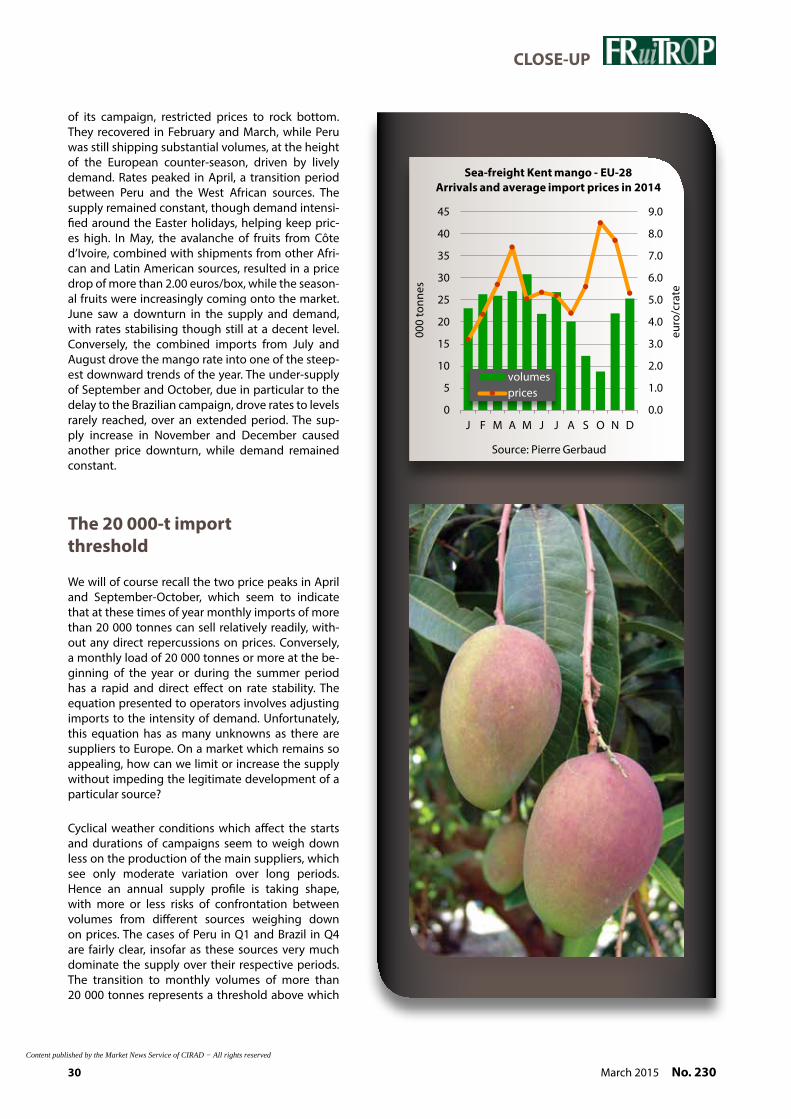
30 March 2015 No. 230
CLOSE-UP
of its campaign, restricted prices to rock bottom. They recovered in February and March, while Peru was still shipping substantial volumes, at the height of the European counter-season, driven by lively demand. Rates peaked in April, a transition period between Peru and the West African sources. The supply remained constant, though demand intensi-fied around the Easter holidays, helping keep pric-es high. In May, the avalanche of fruits from Côte d’Ivoire, combined with shipments from other Afri-can and Latin American sources, resulted in a price drop of more than 2.00 euros/box, while the season-al fruits were increasingly coming onto the market. June saw a downturn in the supply and demand, with rates stabilising though still at a decent level. Conversely, the combined imports from July and August drove the mango rate into one of the steep-est downward trends of the year. The under-supply of September and October, due in particular to the delay to the Brazilian campaign, drove rates to levels rarely reached, over an extended period. The sup-ply increase in November and December caused another price downturn, while demand remained constant.
The 20 000-t import threshold
We will of course recall the two price peaks in April and September-October, which seem to indicate that at these times of year monthly imports of more than 20 000 tonnes can sell relatively readily, with-out any direct repercussions on prices. Conversely, a monthly load of 20 000 tonnes or more at the be-ginning of the year or during the summer period has a rapid and direct effect on rate stability. The equation presented to operators involves adjusting imports to the intensity of demand. Unfortunately, this equation has as many unknowns as there are suppliers to Europe. On a market which remains so appealing, how can we limit or increase the supply without impeding the legitimate development of a particular source?
Cyclical weather conditions which affect the starts and durations of campaigns seem to weigh down less on the production of the main suppliers, which see only moderate variation over long periods. Hence an annual supply profile is taking shape, with more or less risks of confrontation between volumes from different sources weighing down on prices. The cases of Peru in Q1 and Brazil in Q4 are fairly clear, insofar as these sources very much dominate the supply over their respective periods. The transition to monthly volumes of more than 20 000 tonnes represents a threshold above which
0.0
1.0
2.0
3.0
4.0
5.0
6.0
7.0
8.0
9.0
0
5
10
15
20
25
30
35
40
45
J F M A M J J A S O N D
euro
/cra
te
000
tonn
es
Source: Pierre Gerbaud
volumesprices
Sea-freight Kent mango - eU-28Arrivals and average import prices in 2014
Content published by the Market News Service of CIRAD − All rights reserved

31No. 230 March 2015
CLOSE-UP
prices fluctuate considerably. The spring period, driven by the West African sources, appears more fragile due to competition from seasonal products. Exceeding the 20 000-tonne mark, across all sourc-es, at this time of year leads to more or less heavy price disruption. The situation is even clearer for the summer period (July and August), when demand traditionally shrinks, and when paradoxically more and more sources operate with rising quantities: Is-rael, Senegal, Puerto Rico, the Dominican Republic, and to a lesser degree Mexico. This increase comes from a multitude of sources, which is characterised by an expanded range of varieties and qualities, is a factor disrupting the mango marketing process. The marked under-supply also causes big price var-iations in the transition periods (April and Septem-ber-October). Yet in this case, we often get self-reg-ulation of the market, whereby demand shrinks at a certain price level.
Persistent problems
Outside of the quantitative fluctuations disrupting marketing, there are other remaining weighty con-cerns. This is the case with the persistent sanitary and phytosanitary problems, which are intensify-ing as the supply increases. Excess residual levels of treatment products are still in place, though they are apparently moderate. Conversely, the fruit fly prob-lem represents a genuine threat to producer coun-tries. While certain sources, such as Peru, seem to be relatively spared from high parasite pressure, given the pedoclimatic data from the production zones, the same cannot be said for other more exposed sources.
The case of India has a significant lesson. After sev-eral alerts and audits of the country’s services, the number of border interceptions led Europe to de-clare an embargo on certain fruits, including the mango. The audit by the EU services concerned also revealed certain shortcomings in terms of inspec-tion. Corrective actions have been planned in order to reduce the previously growing number of inter-ceptions. This is resulting in greater restrictions on imports, which could somewhat modify the logistics practices developed to prevent seizure of batches. African countries are also under tight phytosanitary monitoring by the European Union. The industries and public services of these sources will rapidly need to implement effective management resourc-es, unless they want to compromise the growth of their mango exports to Europe
Pierre Gerbaud, consultant [email protected]
-4 000
-3 000
-2 000
-1 000
0
1 000
2 000
3 000
4 000
5 000
6 000
J f M A M J J A S O N D
tonn
es
Source: Pierre Gerbaud
Mango - eU-28Monthly imports variation from the average
© D
enis
Loe
illet
Content published by the Market News Service of CIRAD − All rights reserved

32 March 2015 No. 230
CLOSE-UP
2014 mango campaignReview by sourceRising tonnages and concentration of campaigns
2014 was characterised by another rise in volumes on the market, both from extra-eU sources and Spain, which consolidated its position at the expense of Brazil, which started its campaign late. The sources operating during the european summer also stepped up their presence at a time when demand is quiet. However, the quantitative development of the mango market found a tough context in which external events sometimes disrupted the organisation of exports from certain sources. Among other events, we can mention the troubles in Mali, the renewed tension in the Israeli-Palestinian conflict at the beginning of summer and the ebola epidemic in West Africa.
© Eric Imbert
Content published by the Market News Service of CIRAD − All rights reserved

Mango Avocado Sunrise OrriMedjol Dates Sharon
www.mehadrin.co.il
Nature at it's best
Content published by the Market News Service of CIRAD − All rights reserved
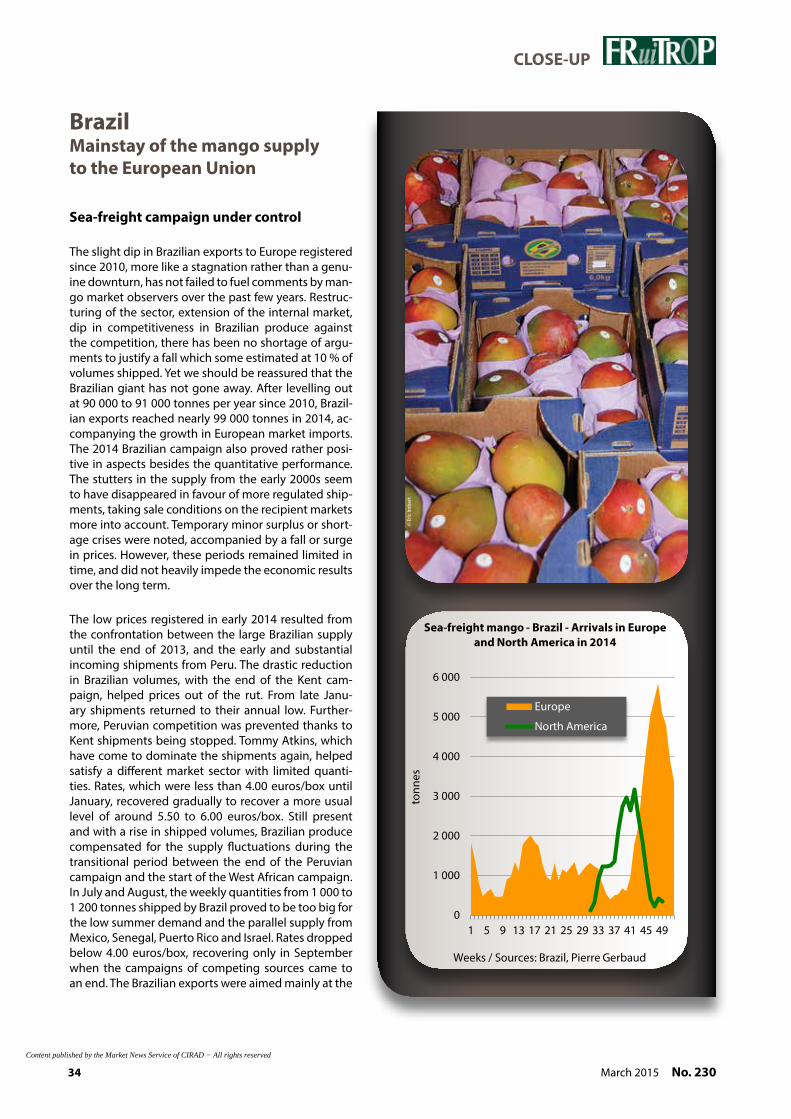
34 March 2015 No. 230
CLOSE-UP
Brazil Mainstay of the mango supply to the european Union
Sea-freight campaign under control
The slight dip in Brazilian exports to Europe registered since 2010, more like a stagnation rather than a genu-ine downturn, has not failed to fuel comments by man-go market observers over the past few years. Restruc-turing of the sector, extension of the internal market, dip in competitiveness in Brazilian produce against the competition, there has been no shortage of argu-ments to justify a fall which some estimated at 10 % of volumes shipped. Yet we should be reassured that the Brazilian giant has not gone away. After levelling out at 90 000 to 91 000 tonnes per year since 2010, Brazil-ian exports reached nearly 99 000 tonnes in 2014, ac-companying the growth in European market imports. The 2014 Brazilian campaign also proved rather posi-tive in aspects besides the quantitative performance. The stutters in the supply from the early 2000s seem to have disappeared in favour of more regulated ship-ments, taking sale conditions on the recipient markets more into account. Temporary minor surplus or short-age crises were noted, accompanied by a fall or surge in prices. However, these periods remained limited in time, and did not heavily impede the economic results over the long term.
The low prices registered in early 2014 resulted from the confrontation between the large Brazilian supply until the end of 2013, and the early and substantial incoming shipments from Peru. The drastic reduction in Brazilian volumes, with the end of the Kent cam-paign, helped prices out of the rut. From late Janu-ary shipments returned to their annual low. Further-more, Peruvian competition was prevented thanks to Kent shipments being stopped. Tommy Atkins, which have come to dominate the shipments again, helped satisfy a different market sector with limited quanti-ties. Rates, which were less than 4.00 euros/box until January, recovered gradually to recover a more usual level of around 5.50 to 6.00 euros/box. Still present and with a rise in shipped volumes, Brazilian produce compensated for the supply fluctuations during the transitional period between the end of the Peruvian campaign and the start of the West African campaign. In July and August, the weekly quantities from 1 000 to 1 200 tonnes shipped by Brazil proved to be too big for the low summer demand and the parallel supply from Mexico, Senegal, Puerto Rico and Israel. Rates dropped below 4.00 euros/box, recovering only in September when the campaigns of competing sources came to an end. The Brazilian exports were aimed mainly at the
0
1 000
2 000
3 000
4 000
5 000
6 000
1 5 9 13 17 21 25 29 33 37 41 45 49
tonn
es
Europe
North America
Sea-freight mango - Brazil - Arrivals in europeand North America in 2014
Weeks / Sources: Brazil, Pierre Gerbaud
© E
ric Im
bert
Content published by the Market News Service of CIRAD − All rights reserved

35No. 230 March 2015
CLOSE-UP
green fruits, though at a satisfactory stage of maturity. In the first half of November, the supply expanded and the number of import operators grew, leading to a fall in rates stabilising at around 4.00 euros/kg in the second half of December. The influx of merchandise of variable quality did not enable a price re-evaluation for the end-of-year holidays, in spite of livelier demand. It was not until January that rates recovered, due to dwindling incoming shipments and moderate competition from Peruvian pro-duce, which was embarking on its season.
Compatibility with international demand
In 2014, Brazil assumed its role of the lead-ing mango supplier to the European mar-ket. We can note that its exports remained mainly aimed at Europe, and that its pres-ence on the North American markets was limited to August and September. On these markets, competition from the Latin Amer-ican sources proved more intense, with produce from Mexico and Ecuador among others. Peru also grabbed some market share in the North American consumption
North American markets, with Tommy Atkins and Keitts, abandoning European markets due to the absence of available Kent volumes. The campaign of this variety only started late, creating a marked period of under-supply on European markets, highly profitable to Spanish pro-duce which found an unexpected and extended commercial window. The delay to the Kents caused a surge in the rates of Tommy Atkins, driv-ing prices up to 9.00 to 10.00 euros/box, an exceptional level for this va-riety. The first Kents in early November were able to find a place on the market on the same price footing. The large, abrupt increase in volumes received gradually weighed down on rates, which dropped to 6.00 euros/box in December. The delay to Brazilian Kents raised concerns of tonnages being deferred to January, when the Peruvian shipments are on the up. Indeed the previous year the Brazilian supply came up against Peruvian shipments on the rise, causing a particularly steep fall in prices. This scenario did not recur in 2014, due on the one hand to the rapid decrease in Brazilian shipments, and on the other hand to small-er Peruvian production. Quite the contrary, the last batches from Brazil, primarily comprising large sizes, still found purchasers at the beginning of 2015 in spite of more haphazard quality. These fruits proved useful in supplementing the abnormally scarce Peruvian supply at the beginning of the year, comprising mainly small sizes.
Air-freight campaign marked by a variation in quantity and quality
Brazilian air-freight Kent exports started in early October, and finished in late January. Given the quantitative shortfall at the beginning of the campaign, the rate of Brazilian fruits was set at around 5.00 euros/kg, while low availability persisted. The first shipments comprised fairly
0.0
1.0
2.0
3.0
4.0
5.0
6.0
0
20
40
60
80
100
120
40 42 44 46 48 50 52 2 4
euro
/kg
tonn
es
volumesprices
Air-freight Kent mango - Brazil - Weekly arrivals and average import price
on the french market in 2014
Weeks / Sources: Brazil, Pierre Gerbaud
0
1
2
3
4
5
6
7
8
9
10
11
1 5 9 13 17 21 25 29 33 37 41 45 49
euro
/cra
te
Tommy Atkins/Netherlands
Kent/France
Sea-freight mango - BrazilAverage import price for Kent in france
and Tommy Atkins in the Netherlands in 2014
Weeks / Source: Pierre Gerbaud
Content published by the Market News Service of CIRAD − All rights reserved

36 March 2015 No. 230
CLOSE-UP
centres, having overtaken Brazil around a decade ago.
The abundance of Brazilian mangoes on the European market was based on the scale of production, taking advantage of favourable pedoclimatic conditions in the various parts of the country. However, the consolidation of flows to Europe was not down to chance. The source has a con-siderable internal market, and a process-ing industry with the ability to harness its non-exportable produce. These assets are backed up by better structuring of the in-dustry for the past decade, which has cur-tailed the crises of the early 2000s. Finally, more recently, we have observed better compatibility of supply with the demands of the international market. For Europe, the varietal modifications made over the past few years speak for themselves. In 2010, the varietal breakdown of Brazilian exports was as follows: Tommy Atkins 71 %, Kent and Keitt 12 % each and Palmer 5 %. In 2014, we had Tommy Atkins 43 %, Kent 25 %, Keitt 21 % and Palmer 11 %. The transition from all Tommy Atkins to a wider and more bal-anced varietal range illustrates the ability of the Brazilian industry to rapidly adapt its stock to the imperatives of trade.
Peru from low point to high point
The 2013-14 Peruvian campaign got off to a painful start. In late Novem-ber 2013, the first sea-freight shipments reached Europe and quickly came up against large imports from Brazil, which compensated for the late start of its winter campaign by extending its shipments. This resulted in particu-larly low rates, in complete contrast with the beginning of the previous season. Under pressure from volumes available and moderate demand, the Peruvian mango rate dipped in January, stabilising at around 3.00 eu-ros/box. In February, the liquidation of the last Brazilian batches left Peru as the sole supplier to the European market. Rates rose rapidly, stabilising in the first half of March at 4.50 euros/box. In mid-March, Peruvian exports dipped rapidly, causing a particularly big price surge with demand picking up in the run-up to Easter. In practically three weeks, rates soared from 4.50 to 7.50/box. In late April, they dropped again to 4.00 euros/box for the last incoming batches.
The Peruvian air-freight campaign fluctuated in line with the scale of in-coming shipments and the market demand. At the beginning of the cam-paign, the novelty effect enabled high prices, above 5.00 euros/kg, though the simultaneous presence of Brazilian mangoes rapidly dragged prices downward. In December, the increase in shipments from both Brazil and Peru dragged prices downward, below 4.00 euros/kg. The gradual cessa-tion of Brazilian shipments favoured a partial recovery of rates in January. Yet this rapidly came to a halt under the effect of a distinct rise in sup-ply, which in January drove prices to their lowest level of the campaign. Rates continued to fluctuate in line with the supply levels, and the state of
0%
10%
20%
30%
40%
50%
60%
70%
80%
90%
100%
1 5 9 13 17 21 25 29 33 37 41 45 49
Palmer
Keitt
Kent
Tommy Atkins
Mango - Brazil - Varietal distribution of exportsto europe in 2014
Weeks / Sources: Brazil, Pierre Gerbaud
© Henri Vannière
Content published by the Market News Service of CIRAD − All rights reserved
31, Avenue de l’Europe - Zone des Entrepôts - Bât. I 9BP 70122 - 94538 Rungis Cedex - FRANCETel +33 (0)1 46 87 30 00 - Fax : +33 (0)1 45 12 96 [email protected]
Con
cept
ion
TPC
: 01
41
31 5
8 90
- Ph
oto
: Ste
w P
atrik
ian©
... the expertise of specialistsat the service of our customers!
The best of exoticsare now part of our range!
and fruits available all the year round...fruits availabble all the year rounHigh quality, various origins
Content published by the Market News Service of CIRAD − All rights reserved

38 March 2015 No. 230
CLOSE-UP
demand. In late February, a temporary decrease in the supply generated a price increase, followed by renewed deterioration caused by a bigger supply surge in anticipation of the traditional Easter de-mand peak. In April, prices strengthened as Peru-vian shipments waned, gradually replaced by West African shipments.
The Peruvian campaign registered fairly lukewarm results, and in any case, was not as good as the pre-vious campaign. First we saw a big rise in volumes shipped to Europe (nearly 72 000 tonnes), intensi-fying the presence of the source in relation to the previous campaign (approximately 69 000 tonnes). Peru consolidated its number two spot among mango suppliers to Europe, behind its main com-petitor Brazil. These two sources followed the same trend, with exports aimed at both the North Amer-ican and European markets. While Brazil remained the number one supplier to the European market, Peru has for several years been ahead of its com-petitor in North America, shipping in total double the quantities shipped by Brazil.
These two sources can be distinguished mainly by their harvest calendars, which are fortunately staggered, covering six months of the supply to Europe. Yet the transition from one country to the other in December sometimes proves problematic. The accumulation of Brazilian volumes at the end of the year can lead to confrontation between the two suppliers. Peru needs only to start its campaign early, with large volumes. In this scenario, the recip-ient markets are rapidly saturated, leading to falling or sometimes plummeting rates; and not even the theoretical increase in demand for the end-of-year holidays can halt this trend. This was how the cam-paign went from late 2013-early 2014, plunging the European market into a slump from which it was only able to emerge after more than one month. Such starts to the campaign are extremely difficult to retrieve, even though prices soared at the end of the season before the massive influx of West African volumes. Indeed, the tonnages shipped in this period have nothing in common with the Jan-uary-February shipments, which represented 55 % of total Peruvian exports in 2014, compared with the 17 % exported in April-May.
The imbalance in the size range too remains a dis-rupting factor. The excess of small sizes at the be-ginning of the campaign, and of large sizes in the second half of the season, represents a variable in setting the sale prices. Opting for medium-sized fruit to satisfy European demand might help limit the overall volumes shipped, and in so doing pre-vent the big price fluctuations and earn better val-ue for the fruit.
0
1 000
2 000
3 000
4 000
5 000
6 000
7 000
46 48 50 52 2 4 6 8 10 12 14 16 18 20
tonn
es
2013-142012-132011-12
Sea-freight mango - Peru - Arrivals in france
Weeks / Source: Pierre Gerbaud
0
1
2
3
4
5
6
7
8
50 52 2 4 6 8 10 12 14 16 18 20
euro
/cra
tes
2013-142012-132011-12
Sea-freight mango - PeruAverage import price on the french market
Weeks / Source: Pierre Gerbaud
Content published by the Market News Service of CIRAD − All rights reserved

39No. 230 March 2015
CLOSE-UP
0
20
40
60
80
100
120
140
160
46 48 50 52 2 4 6 8 10 12 14 16 18
tonn
es
2013-142012-132011-12
Air-freight mango - Peru - Arrivals in france
Weeks / Source: Pierre Gerbaud
0
1
2
3
4
5
6
46 48 50 52 2 4 6 8 10 12 14 16 18eu
ro/k
g
2013-142012-132011-12
Air-freight Kent mango - PeruAverage import price on the french market
Weeks / Source: Pierre Gerbaud
© E
ric Im
bert
Content published by the Market News Service of CIRAD − All rights reserved
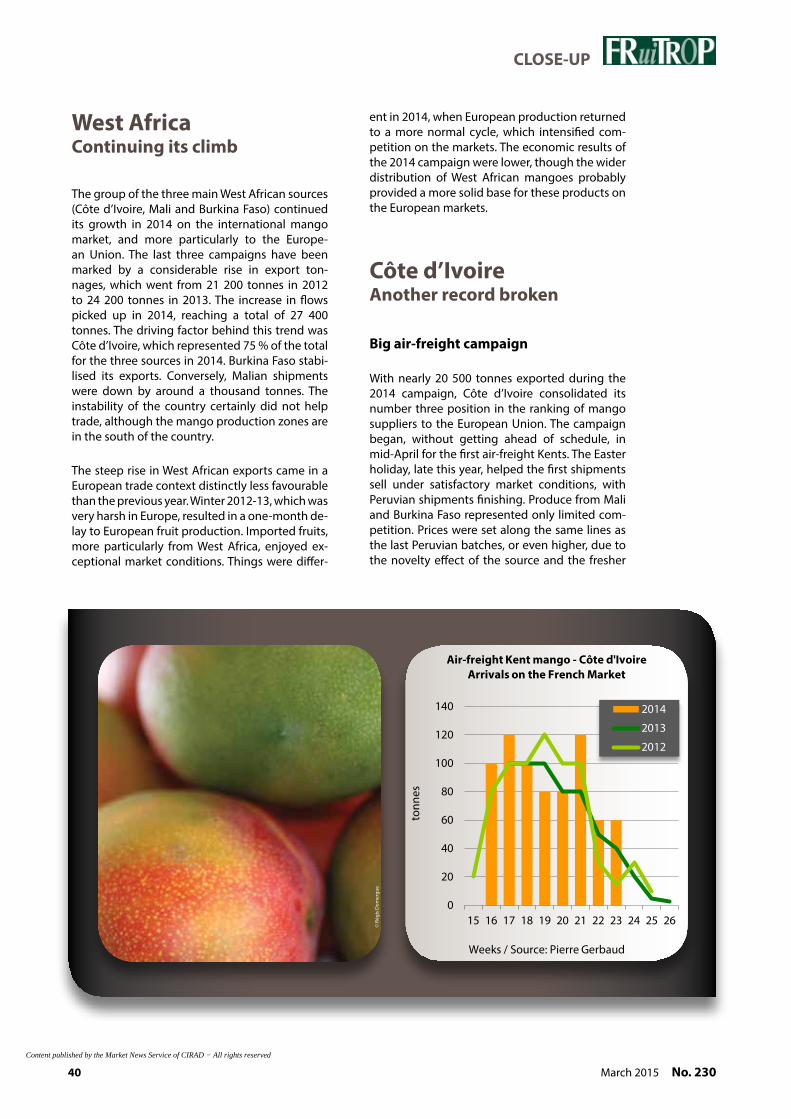
40 March 2015 No. 230
CLOSE-UP
ent in 2014, when European production returned to a more normal cycle, which intensified com-petition on the markets. The economic results of the 2014 campaign were lower, though the wider distribution of West African mangoes probably provided a more solid base for these products on the European markets.
Côte d’Ivoire Another record broken
Big air-freight campaign
With nearly 20 500 tonnes exported during the 2014 campaign, Côte d’Ivoire consolidated its number three position in the ranking of mango suppliers to the European Union. The campaign began, without getting ahead of schedule, in mid-April for the first air-freight Kents. The Easter holiday, late this year, helped the first shipments sell under satisfactory market conditions, with Peruvian shipments finishing. Produce from Mali and Burkina Faso represented only limited com-petition. Prices were set along the same lines as the last Peruvian batches, or even higher, due to the novelty effect of the source and the fresher
West Africa Continuing its climb
The group of the three main West African sources (Côte d’Ivoire, Mali and Burkina Faso) continued its growth in 2014 on the international mango market, and more particularly to the Europe-an Union. The last three campaigns have been marked by a considerable rise in export ton-nages, which went from 21 200 tonnes in 2012 to 24 200 tonnes in 2013. The increase in flows picked up in 2014, reaching a total of 27 400 tonnes. The driving factor behind this trend was Côte d’Ivoire, which represented 75 % of the total for the three sources in 2014. Burkina Faso stabi-lised its exports. Conversely, Malian shipments were down by around a thousand tonnes. The instability of the country certainly did not help trade, although the mango production zones are in the south of the country.
The steep rise in West African exports came in a European trade context distinctly less favourable than the previous year. Winter 2012-13, which was very harsh in Europe, resulted in a one-month de-lay to European fruit production. Imported fruits, more particularly from West Africa, enjoyed ex-ceptional market conditions. Things were differ-
0
20
40
60
80
100
120
140
15 16 17 18 19 20 21 22 23 24 25 26
tonn
es
2014
2013
2012
Weeks / Source: Pierre Gerbaud
Air-freight Kent mango - Côte d'IvoireArrivals on the french Market
© R
égis
Dom
ergu
e
Content published by the Market News Service of CIRAD − All rights reserved
It’s ripe, enjoy it!The fruit ripening specialist
The expertise of the producer associated with the know how of the ripener to guarantee a carefully maturated and selected mango.
Availableall year long!
- MIN Rungis - Bât. C3 - D2 - E2, 2-16 rue de Perpignan, Fruileg CP 60431,94642 Rungis Cedex, France - Tel.: +33 1 45 12 29 60 - Fax: +33 1 45 60 01 29 - E-mail: [email protected]
PRODUCER – IMPORTER – RIPENER – DISTRIBUTOR
Content published by the Market News Service of CIRAD − All rights reserved

42 March 2015 No. 230
CLOSE-UP
produce. After the pull from the Easter period, the Ivorian mango rate dipped until mid-May, when it stabilised at around 3.50 euros/kg. This downturn was probably due to a fall in demand, but also to an overladen market given the large volumes arriving in regular shipments within three or four weeks. The latish start to the campaign encouraged operators initially to favour air-freight shipments, to ensure their presence on the European market, pending the arrival of sea-freight mangoes. The market con-gestion and relatively poor fruit sales led to more or less prolonged storage, causing accelerated matu-ration of the produce, and its depreciation. The rate recovered to around 4.00 euros/kg until the end of the campaign, in early June, in parallel with the re-duction in incoming volumes.
Better distribution of sea-freight mangoes
With an additional 4 000 tonnes on the previous year, and less favourable market conditions, the Ivorian campaign proved more difficult and mixed in 2014. The first Kent containers were received in the last week of April, on a lightly supplied market, enabling fairly high rates of around 7.00 euros/box on average. Yet the massive influx of merchandise in the following weeks, as the seasonal fruit supply progressed, drove the Ivorian mango rate into a downward trend until the end of May. It stabilised at around 4.50 euros/box until the end of the cam-paign. In late May and early June, sales were made at lower prices for fruits of more fragile quality. Some exports continued in the first half of June with Kents, but also some small quantities of later Keitts. The Ivorian campaign was beset with numerous logisti-cal problems, causing shipping and delivery delays, which constantly undermined the product quality.
This campaign will be remembered for its extreme brevity, a trend observed previously. Indeed, 16 000 of the 20 500 tonnes exported by Côte d’Ivoire went in May, causing an influx of merchandise which forced import operators to store the incoming ship-ments, or risk seeing quality deterioration. However, rates did not plummet, as was the case a few years ago. One of the possible explanations lies in the better distribution of Ivorian mangoes across the various European markets. For the past several cam-paigns, interest from European operators outside of France in Ivorian fruits has seemed to be on the rise. The availability of substantial volumes of Kent, of satisfactory overall quality, doubtless represents the best form of promotion. The increasing devel-opment of mango triggering processes has also contributed to the relatively fluid sales of quantities entering Europe.
0
1
2
3
4
5
6
16 17 18 19 20 21 22 23 24 25 26
euro
/kg
2014
2013
2012
Weeks / Source: Pierre Gerbaud
Air-freight Kent mango - Côte d'IvoireAverage import price on the french market
© R
égis
Dom
ergu
e
Content published by the Market News Service of CIRAD − All rights reserved

43No. 230 March 2015
CLOSE-UP
0
500
1000
1500
2000
2500
3000
3500
4000
4500
14 15 16 17 18 19 20 21 22 23 24 25
tonn
es
2014
2013
2012
Weeks / Source: Pierre Gerbaud
Sea-freight mango - Côte d'IvoireArrivals on the french market
0
1
2
3
4
5
6
7
8
9
17 18 19 20 21 22 23 24 25 26 27
euro
/cra
te
2014
2013
2012
Weeks / Source: Pierre Gerbaud
Sea-freight Kent mango - Côte d'Ivoire Average import price on the french market
The fact remains that the very short duration of its campaign represents a major handicap for this big supplier. Indeed, it is limited by its fairly late start - which leaves the field open to the expansion dreams of Peru, Brazil and to a lesser degree the Dominican Republic - as well as by the real risks of fungal development on the fruits, generally from mid-May. The constraint on the start of the cam-paign is difficult to overcome, given the composi-tion of the Ivorian stock. Conversely, actions against fungal development could be contemplated, but would require investment by exporters and pro-ducers to which they would not necessarily agree. These actions could be achieved through better orchard maintenance and the implementation of crop treatment programmes to combat parasites. This would all come under actions aimed at limit-ing parasite pressure by the fruit fly, another recur-rent factor which is limiting the long-term growth of exports. A major crisis in the profession, such as that suffered by the Madagascan litchi industry in 2010 with excess residual levels of treatment prod-ucts, could force the Ivorian mango industry to develop more quickly. Of course, this type of crisis is not desirable, and concerted action by the oper-ators would be preferable and less painful.
Content published by the Market News Service of CIRAD − All rights reserved

44 March 2015 No. 230
CLOSE-UP
Mali Back to square one
A more difficult air-freight campaign
2014 was a more difficult campaign for this land-locked source. Mali ploughed the same furrow as Côte d’Ivoire in 2013, given the particular circum-stances of the European market with its shortage of temperate produce at the beginning of the cam-paign. Its perhaps less abundant production and the weaker pull from European demand explain in part the downturn in Malian exports in 2014. Down by around a thousand tonnes, Mali returned to its usual export quantities.
The Malian campaign began in mid-March with near-simultaneous shipments of Amélie and Valen-cia. While Amélie customers are a determinedly spe-cific group, Valencia retains a wider customer base. The first Amélie batches sold at around 3.00 euros/kg, taking advantage of the fall in Peruvian ship-ments. Their rates quickly dipped to between 2.50 and 3.00 euros/kg until the end of the campaign in the first week of June. Valencia exports also started in mid-March. Generally, this more coloured varie-ty was in greater demand at the beginning of the
season, before the first Kent batches came in. It was also an alternative to the Peruvian supply. Curiously, its flows seem to have been more modest this year. Customers fairly quickly turned from this product, fuelling a continuous price fall. At between 3.00 and 3.50 euros/kg from mid-March to mid-April, prices struggled to hold up at around 3.00 euros/kg until mid-May when shipments came to an end. The av-erage quality and rapid development of the fruits probably contributed to purchasers pulling out.
Mid-April saw the start of the Kent shipments. Tak-ing advantage of livelier demand for Easter, this pro-duce sold at around 4.50 euros/kg, given the tem-porarily dwindling supply at this time. Prices of the other varieties available slumped with the arrival of the Kents, whose fairly high rates dropped rapidly from their third week on the market. The big ship-ments from Côte d’Ivoire, of more uniform quality, gave the Malian produce some definite competi-tion. The rates of Malian Kents then stabilised at be-tween 3.00 and 3.50 euros/kg, before strengthening slightly at the end of the campaign with the gradual withdrawal of Côte d’Ivoire.
A more fluid sea-freight campaign
Whereas in 2013 Malian sea-freight shipments start-ed at the same time as those from Côte d’Ivoire, they were offset in 2014. The first volumes came onto
4.00
4.50
5.00
5.50
6.00
6.50
7.00
20 22 24 26 28
euro
/cra
te
NetherlandsGermanyFranceBelgium
Sea-freight mango - Mali Average import price in europe in 2014
Weeks / Source: Pierre Gerbaud
© R
égis
Dom
ergu
e
Content published by the Market News Service of CIRAD − All rights reserved
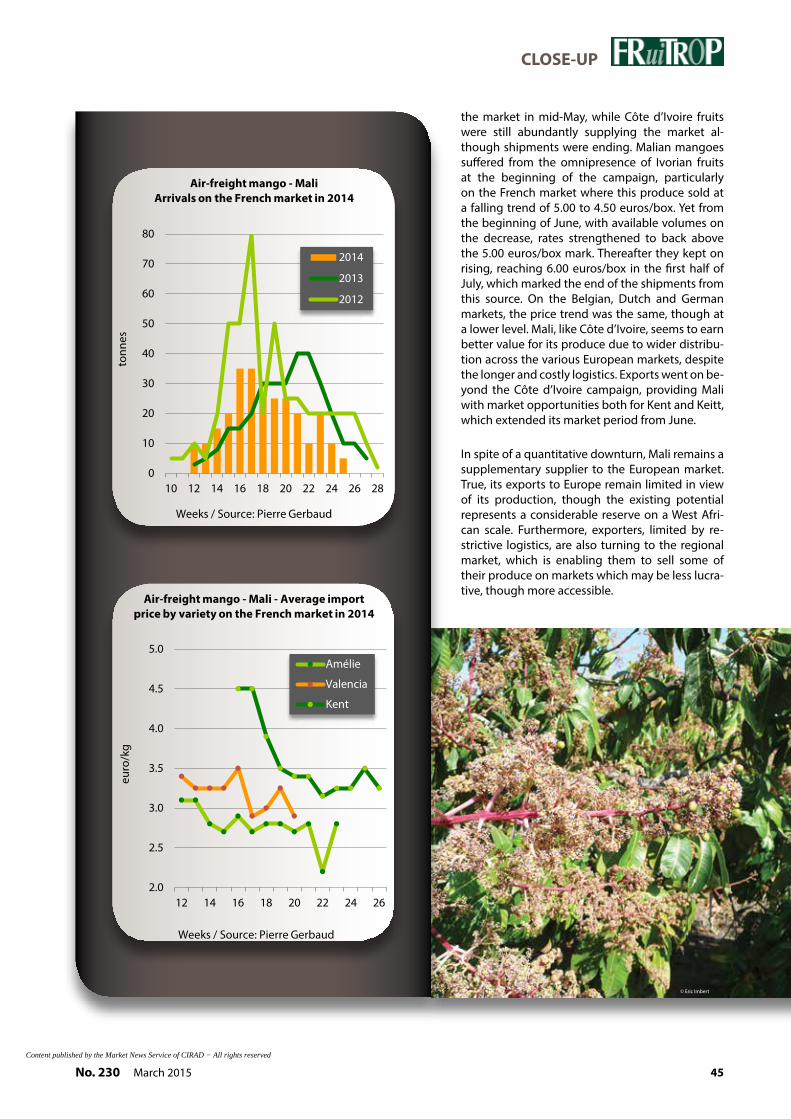
45No. 230 March 2015
CLOSE-UP
the market in mid-May, while Côte d’Ivoire fruits were still abundantly supplying the market al-though shipments were ending. Malian mangoes suffered from the omnipresence of Ivorian fruits at the beginning of the campaign, particularly on the French market where this produce sold at a falling trend of 5.00 to 4.50 euros/box. Yet from the beginning of June, with available volumes on the decrease, rates strengthened to back above the 5.00 euros/box mark. Thereafter they kept on rising, reaching 6.00 euros/box in the first half of July, which marked the end of the shipments from this source. On the Belgian, Dutch and German markets, the price trend was the same, though at a lower level. Mali, like Côte d’Ivoire, seems to earn better value for its produce due to wider distribu-tion across the various European markets, despite the longer and costly logistics. Exports went on be-yond the Côte d’Ivoire campaign, providing Mali with market opportunities both for Kent and Keitt, which extended its market period from June.
In spite of a quantitative downturn, Mali remains a supplementary supplier to the European market. True, its exports to Europe remain limited in view of its production, though the existing potential represents a considerable reserve on a West Afri-can scale. Furthermore, exporters, limited by re-strictive logistics, are also turning to the regional market, which is enabling them to sell some of their produce on markets which may be less lucra-tive, though more accessible.
0
10
20
30
40
50
60
70
80
10 12 14 16 18 20 22 24 26 28
tonn
es
2014
2013
2012
Air-freight mango - MaliArrivals on the french market in 2014
Weeks / Source: Pierre Gerbaud
2.0
2.5
3.0
3.5
4.0
4.5
5.0
12 14 16 18 20 22 24 26
euro
/kg
Amélie
Valencia
Kent
Air-freight mango - Mali - Average import price by variety on the french market in 2014
Weeks / Source: Pierre Gerbaud
© Eric Imbert
Content published by the Market News Service of CIRAD − All rights reserved

46 March 2015 No. 230
CLOSE-UP
Burkina faso As you were
The number three West African mango supplier to the European market, Burkina Faso exported the same quantities as in 2013, to within a few dozen tonnes. As with Mali, its landlocked location restricts it to a supplementary role on the European market. The first exports comprised air-freight Amélie from mid-March, which were sold on the same footing as Malian exports, present at the same time, of between 2.50 and 3.00 euros/kg. Kent shipments took over from late April. The first batches sold at around 4.00 euros/kg, and then the rate dipped, before stabilising at between 3.00 and 3.50 euros/kg until late June.
As in 2013, sea-freight exports were aimed mainly at North European countries, over a short period from late May to the third week of June. Sale prices were at around 5.50 euros/box for good quality produce. Some batches of more fragile quality sold at around 4.50 euros/box.
Burkina Faso is diversifying the sale of its mangoes, with organic certified produce, and is taking target-ed trade circuits. The development of outlets toward the West African sub-region and dried mango pro-duction have also been more prominent trends for this source for the past few years.
0
5
10
15
20
25
30
35
40
45
50
55
11 13 15 17 19 21 23 25 27
tonn
es
2014
2013
2012
Air-freight mango - Burkina fasoArrivals on the french market
Weeks / Source: Pierre Gerbaud
1.5
2.0
2.5
3.0
3.5
4.0
4.5
12 14 16 18 20 22 24 26
euro
/kg
Amélie
Kent
Air-freight mango - Burkina fasoAverage import price by variety
on the french market in 2014
Weeks / Source: Pierre Gerbaud
© Eric Imbert
Content published by the Market News Service of CIRAD − All rights reserved

47No. 230 March 2015
CLOSE-UP
GuineaA supplementary source
When we talk about the European man-go market, and more particularly the West African supplier countries, Guin-ea rarely gets a mention. Indeed, this source is not among the main suppli-ers to the European market. However, it enjoys substantial mango resources, from the region of Kindia to Kankan toward the Malian border. The underex-ploited Guinean cultivation stock sup-plies mainly the national and regional markets. The rather archaic structuring of the orchards and major logistical constraints considerably limit exports. Flows to Europe remain moderate and far removed from the production po-tential. In 2012 and 2013, Guinean ex-ports amounted to around 800 tonnes per year. In 2014, the results climbed to reach around one thousand tonnes. Guinean exports primarily comprise Keitts available from April to June, most particularly aimed at the Belgian and British markets, where customer loyal-ty has been built over the campaigns. The rise in Guinean exports came under tough conditions, given the Ebola epi-demic. The development of the disease, which sprang from this country, led to concern among import operators over the risks of it spreading to the recipient countries. The proof provided by the major international health institutions that the fruits were safe, conveyed by the media and professional organisa-tions, was ultimately able to keep the mango trade circuits open.
Content published by the Market News Service of CIRAD − All rights reserved

48 March 2015 No. 230
CLOSE-UP
Dominican Republic A source on the rise
From 2008 to 2010, the Dominican Republic shipped approximately 4 000 tonnes of mangoes per year to the European markets, and in 2011 and 2012, it passed the 6 000-tonnes mark. This rise was con-firmed in 2013 with 9 600 tonnes. 2014 marked another stride forward, with nearly 11 000 tonnes. The Dominican shipping calendar runs from May to September, with a quantitative peak from June to August.
While the rise in tonnages has confirmed the source’s export capacity, the 2014 campaign was tougher than the previous one. The weight of volumes on the market clearly hindered price development. Yet besides the growth of Dominican flows, we should note the overall load on the markets during the shipment period. In May-June, the rate of Domini-can Keitts maintained between 5.00 and 5.50 euros/box. Conversely it dipped in July and August, when market demand was lower but an abundant supply in place. The rate did not recover until the second half of August, which saw several competing sourc-es scale back or withdraw their shipments. In 2013, flows were smaller in summer, which helped keep prices steadier for Dominican fruits. The context of 2014 was characterised by a more abundant summer supply, which caused a general dip in prices, across all sources and varieties. Like Puerto Rico, the Domin-ican Republic exceeded 10 000 tonnes of exports in 2014, thereby expanding the group of the main sup-pliers to the European market and offering an alter-native to operators still seeking a regular supply over the longest possible periods.
Senegal Another boom
Senegal continued its quantitative surge in 2014. Back in 2013, the source rose steeply, with 8 300 t of mango exports, as opposed to 6 000 t traditionally. For the last campaign, all previous records were bro-ken, with 10 200 tonnes shipped to European mar-kets. Conversely, this rapid and protracted growth is not certain to result in a proportional improvement in economic results.
The air-freight and sea-freight campaigns ran in par-allel from mid-June to early September, i.e. the same amplitude as last year. Senegalese air-freight man-
0.0
1.0
2.0
3.0
4.0
5.0
6.0
7.0
22 23 24 25 26 27 28 29 30 31 32 33 34
euro
/cra
te2014
2013
2012
Sea-freight mango - Dominican RepublicAverage import price on the french market
Weeks / Source: Pierre Gerbaud
© D
enis
Loe
illet
Content published by the Market News Service of CIRAD − All rights reserved

49No. 230 March 2015
CLOSE-UP
0.0
1.0
2.0
3.0
4.0
5.0
6.0
7.0
8.0
25 26 27 28 29 30 31 32 33 34 35 36 37
euro
s
air-freight/kg
sea-freight/crate
Kent mango - Senegal - Average import price on the french market in 2014
Weeks / Source: Pierre Gerbaud
goes sold at around 4.50 euros/kg for the first incoming batches. Yet their rate rapidly dropped, before stabilising at around 3.25 euros/kg in the second half of July. This price level lasted until mid-August, when Kent volumes were dipping, which helped rates recover, though to no more than 4.00 euros/kg.
The sea-freight supply saw the same type of trend, though at a different tempo. In June, the first incoming shipments from Sen-egal sold at high prices (6.00 to 7.00 euros/box), due to the dwin-dling good quality Kent on the European market, which was be-ing supplied at the time by end-of-campaign West African fruits (Côte d’Ivoire, Mali, Burkina Faso). Yet rapidly the Senegalese mango rate took a downturn and dropped until the second half of August, when it bottomed out at 3.00 euros/box. This big price downturn period coincided with the supply peak, with Senegal packing in 80 % of its total shipments between July and August. These combined with the merchandise from the other sources, which were practically all sending rising quantities. The quality deterioration also explains the price downturn. The heterogene-ous maturity and above all the development of fungal diseases made a big contribution to the deterioration in market condi-tions, paradoxically at a time when the supply was easing off.
Despite their standard presentation and appearance, Senegalese mangoes are often judged to have superior taste quality to fruit of the same variety from other sources. This is a positive point based on which this source could boost its trade outlets in the long term.
© C
arol
ina
Daw
son
Content published by the Market News Service of CIRAD − All rights reserved

50 March 2015 No. 230
CLOSE-UP
Mexico A source on the wane?
A mediocre campaign
We are leaving behind the time when the Mexican mango kept conquering the European market, bridging the gap between the end of the West Af-rican campaigns and the Israeli campaign. After a considerable rise to 5 000 tonnes per year in 2010 and 2011, Mexican exports to Europe ebbed as the seasons went by. Still at around 3 000 tonnes in 2013, they saw their presence dwindle further in 2014 to 2 200 tonnes. The June-August trade window available to Mexican Kents for the past several years has not widened, as certain Mexican exporters wishing to diversify their outlets might have believed. The attraction of the North Amer-ican markets, the later batches from West Africa and Senegal coming to the fore seem to have, at least partially, put a stop to Mexican dreams of expansion.
While Mexican air-freight Kents have maintained their trade window between June and August, it has been mainly sea-freight shipments which have declined in recent years. In 2014, they were
3.0
3.5
4.0
4.5
5.0
5.5
6.0
6.5
1 2 3 4 5
euro
/cra
te
Sea-freight Kent mango - MexicoAverage import price on the Dutch market
in 2014
Weeks / Source: Pierre Gerbaud
© R
égis
Dom
ergu
e
© D
enis
Loe
illet
Content published by the Market News Service of CIRAD − All rights reserved

51No. 230 March 2015
CLOSE-UP
packed into July, when demand was dip-ping rapidly and when the European mar-ket was fairly abundantly supplied by Sene-gal, Israel at the beginning of its campaign, Puerto Rico and the Dominican Republic in mid-season. Faced with this strong compe-tition and unfavourable market conditions, the Mexican mango rate kept falling, which doubtless explained the premature halt to shipments, which in previous years had continued until late August. The multiple storms and hurricanes striking in 2014 also contributed to reducing exports and to the qualitative fragility of the produce shipped.
The air-freight campaign was different. It started earlier in June, when Kent availa-bility was lower. The Mexican mango rate was also fairly stable at around 4.50 euros/kg on average during this period. It saw a progressive and steep deterioration in July due to stiffer competition, demand losing momentum and above all a quality deterio-ration in the fruit. The prices registered wid-ened considerably because of the highly variable maturity, even leading to clearance
sales for the highly mature batches. On top of this the second half of July saw increas-ingly frequent fungal development, which accelerated the price falls and ultimately led to the suspension of shipments two to three weeks before the end of campaigns from previous years.
Potential intact
Mexico has seen a real downturn, but this source can make a comeback on the Eu-ropean market if new opportunities arise. Mexico remains the world number one mango exporter, shipping nearly 300 000 tonnes per year, which puts it in a favoured situation with clear potential to direct its merchandise flows. While the North Amer-ican market remains the main target of Mexican operators for reasons of proximi-ty, profitability and commercial relations, a few thousand tonnes can always be divert-ed from this captive market. The opening up of the Japanese market to Mexican fruits for the past few years is proof of this.
0.0
1.0
2.0
3.0
4.0
5.0
23 24 25 26 27 28 29 30 31 32 33 34
euro
/kg
201420132012
Air-freight Kent mango - MexicoAverage import price on the french market
Weeks / Source: Pierre Gerbaud
© C
arol
ina
Daw
son
Content published by the Market News Service of CIRAD − All rights reserved
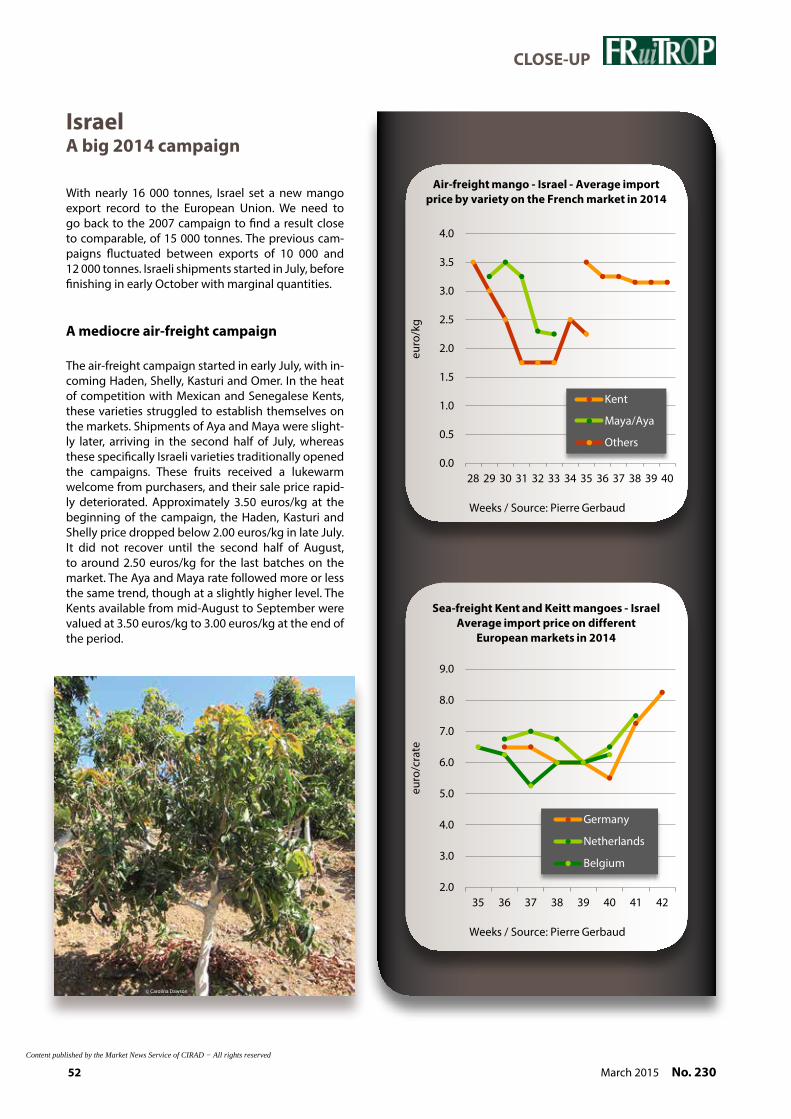
52 March 2015 No. 230
CLOSE-UP
Israel A big 2014 campaign
With nearly 16 000 tonnes, Israel set a new mango export record to the European Union. We need to go back to the 2007 campaign to find a result close to comparable, of 15 000 tonnes. The previous cam-paigns fluctuated between exports of 10 000 and 12 000 tonnes. Israeli shipments started in July, before finishing in early October with marginal quantities.
A mediocre air-freight campaign
The air-freight campaign started in early July, with in-coming Haden, Shelly, Kasturi and Omer. In the heat of competition with Mexican and Senegalese Kents, these varieties struggled to establish themselves on the markets. Shipments of Aya and Maya were slight-ly later, arriving in the second half of July, whereas these specifically Israeli varieties traditionally opened the campaigns. These fruits received a lukewarm welcome from purchasers, and their sale price rapid-ly deteriorated. Approximately 3.50 euros/kg at the beginning of the campaign, the Haden, Kasturi and Shelly price dropped below 2.00 euros/kg in late July. It did not recover until the second half of August, to around 2.50 euros/kg for the last batches on the market. The Aya and Maya rate followed more or less the same trend, though at a slightly higher level. The Kents available from mid-August to September were valued at 3.50 euros/kg to 3.00 euros/kg at the end of the period.
0.0
0.5
1.0
1.5
2.0
2.5
3.0
3.5
4.0
28 29 30 31 32 33 34 35 36 37 38 39 40
euro
/kg
Kent
Maya/Aya
Others
Air-freight mango - Israel - Average importprice by variety on the french market in 2014
Weeks / Source: Pierre Gerbaud
2.0
3.0
4.0
5.0
6.0
7.0
8.0
9.0
35 36 37 38 39 40 41 42
euro
/cra
te
Germany
Netherlands
Belgium
Sea-freight Kent and Keitt mangoes - IsraelAverage import price on different
european markets in 2014
Weeks / Source: Pierre Gerbaud
© Carolina Dawson
Content published by the Market News Service of CIRAD − All rights reserved
Content published by the Market News Service of CIRAD − All rights reserved

54 March 2015 No. 230
CLOSE-UP
The early-campaign varieties seem to have suffered from competition from Kents from other sources. In France in particular, an-other factor was observed on the whole-sale markets, where the retailers made the bulk of their procurements. This involved a sort of boycott of Israeli produce due to the rising tension in the Israeli-Palestinian con-flict. Indeed a number of purchasers aban-doned the source, causing poor sales which drove prices downward.
Sea-freight quantities on the up
In parallel with the air-freight export cam-paign, a big sea-freight campaign took shape. It began in the second half of July with the Shelly variety, and continued from late August with Kents and above all Keitts until early October. Shelly exports were aimed mainly at the North European coun-tries (Belgium, Germany and the Nether-lands), while demand rapidly withered and the European market was abundantly sup-plied by the Dominican Republic, Puerto Rico, Senegal, and to a lesser degree Mexico. While the rate of these mangoes remained fixed at between 6.00 and 7.00 euros/box in
the Netherlands, it was considerably lower on the German and Belgian markets, with averages of between 3.00 and 4.00 euros/box characterised by big fluctuations. The more southern European markets favoured Senegalese Kents during the same period. In the second half of August, the Shelly rate recovered as the European supply dipped. At this time, Israel started its Kent and then Keitt shipments, more popular with pur-chasers and with less competition from merchandise from other sources. Rates rose to between 6.00 and 7.00 euros/box, with a surge for the last batches on the market due to the dwindling overall supply. Kents and Keitts sold at more moderate prices on the French market, already focused on Spanish produce. Despite the pressure from sources operating during the summer period, Israel remained an essential market supplier, with volumes on the increase. The source maintained its place on European markets, though its varietal choices and the proliferation of competition made selling its produce more difficult. The Kent availa-bility period seemed to shrink in favour of Shelly and Keitt, which are not the most popular varieties if there is a Kent supply at the same time.
0
500
1 000
1 500
2 000
2 500
3 000
3 500
27 29 31 33 35 37 39 41 43
201420132012
Weeks / Source: Pierre Gerbaud
Sea-freight mango - IsraelArrivals in europe (tonnes)
3.5
4.0
4.5
5.0
5.5
6.0
35 37 39 41
euro
/cra
te
Kent 2014
Keitt 2014
Kent 2013
Keitt 2013
Weeks / Source: Pierre Gerbaud
Sea-freight mango - IsraelAverage import price by variety
on the french market
0.0
1.0
2.0
3.0
4.0
5.0
6.0
7.0
8.0
30 31 32 33 34 35 36 37 38
euro
/cra
te
Germany
Netherlands
Belgium
Sea-freight Shelly mango - IsraelAverage import price on different
european markets in 2014
Weeks / Source: Pierre Gerbaud
Content published by the Market News Service of CIRAD − All rights reserved

55No. 230 March 2015
CLOSE-UP
Puerto Rico A stabilisation campaign
After the leap registered in 2013 to nearly 12 000 tonnes, from the traditional 7 000 to 8 000 tonnes, the 2014 campaign appears to have been a season of stabilising tonnages, with 11 200 tonnes shipped to the European markets. This slight quantitative down-turn probably results from a later season than in 2013, leading to delayed exports. From mid-May to late July, the Puerto Rican mango rate fluctuated between 5.00 and 6.00 euros/box, with some peaks up to 6.75 euros/box in late June, when the supply to the European market was smaller. It then progressively plunged to below 4.00 euros/box in the first half of August, when demand was smaller and when the supply remained substantial, with the combined shipments from Israel, the Dominican Republic, Sen-egal and Mexico. It then recovered from the second half of Au-gust, regaining its initial level in September (5.00-6.00 euros/box) when the source’s campaign was coming to its end.
Puerto Rican shipments primarily comprised Keitts aimed at the supermarket sector, which found an alternative of standard and regular quality. The later start this year doubtless contributed to the more compressed results than in 2013, when the early-cam-paign shipments took advantage of particularly favourable mar-ket conditions during the transition between Peru and West Africa. Nearly 50 % of mangoes from this source went to the Netherlands, and 40 % to the United Kingdom. They then under-went intra-Community trade depending on the supply needs of the various EU markets. More than a top-up source, Puerto Rico is gradually establishing itself as a regular supplier to the European Union, and making a proportional contribution to the overall in-crease in the European mango market.
2.0
3.0
4.0
5.0
6.0
7.0
8.0
9.0
15 17 19 21 23 25 27 29 31 33 35 37 39
euro
/cra
te
Source: Pierre Gerbaud
2014
2013
Mango - Puerto Rico - Average import priceon the french market
© C
arol
ina
Daw
son
Content published by the Market News Service of CIRAD − All rights reserved

56 March 2015 No. 230
CLOSE-UP
Spain Steep rise under a lucky star
With the passing campaigns, Spain has established itself as a major mango supplier to the European market. Its production, mainly based in Andalusia in the Malaga-Grenada region, is intimately associat-ed with production of other tropical or subtropical fruits, such as the avocado, cherimoya, and to a less-er degree the litchi. Over the years, the number of mango orchards has kept on rising, and the positive economic results of the last few seasons plus the po-litical readjustments following on from the property crisis have encouraged producers to step up plant-ing. The 2012, 2013 and 2014 campaigns consolidat-ed this trend, which could eventually cause chronic overproduction and a fall in revenue for the sector. For now, we can note the climb of the source based on supplying a quality product, taking advantage of favourable endogenous and exogenous factors - which helped Spain join the leading group of man-go suppliers to the European Union.
From July, the initial export forecasts were set to be particularly abundant, with exceptional production. The clement weather conditions in spring had led to intense flowering with fruit-setting to match. The trees, heavily laden in early summer, hinted at a production to break the already exceptional re-cord from 2012. At the time there was talk of exports of around 24 000 tonnes. Producers and exporters feared for the market’s absorption capacities and for maintaining sale prices. Fruit-bearing in July and August was partially stopped by less favourable weather, causing high fruit droppage. However, pro-duction remained high, at a level rarely reached by the Spanish cultivation stock.
Spanish production was also early, with the first Osteen shipments coming from the second half of August, in still limited volumes. The campaign pen-etration price was set at around 8.00 euros/box. The availability of substantial tonnages drove producers and exporters to ship increasing quantities, causing rates to collapse, bottoming out in the second half of September (5.50 euros/box). Curiously, this sit-uation seemed to contradict the state of the Euro-pean market, with a lean supply and more dynamic in terms of demand. Spanish shipments then came under control, which helped Osteen rates recover until the end of the campaign in the second half of October. This unexpected reversal in trend can be explained by external factors, which created ex-ceptional market conditions. The rapid end to the Israeli campaign in the second half of September,
0
2 000
4 000
6 000
8 000
10 000
12 000
14 000
16 000
18 000
20 000
2010 2011 2012 2013 2014
tonn
es
Mango - Spainexport evolution (estimate)
Source: Pierre Gerbaud
© C
arol
ina
Daw
son
Content published by the Market News Service of CIRAD − All rights reserved

Content published by the Market News Service of CIRAD − All rights reserved

58 March 2015 No. 230
CLOSE-UP
by Brazil, but most of all its own produc-tion being less abundant after the harsh 2012-13 winter (around 7 000 tonnes).
The trade window occupied by Spain also enabled small but additional quanti-ties of Kent, Keitt and Irwin to be sold off. The Kent campaign was focused on one month, from late September to mid-Oc-tober. These fruits, particularly popular since Spain alone was providing them at the time in more limited quantities, sold steadily at around 4.00 euros/kg. This year we can note that certain brands adopted a segmentation of the Kent supply by color-ation (coloured, half-coloured and green-er), by virtue of the proximity between the production zone and place of consump-tion. This choice of segmentation, which requires additional work by the shipping facilities, is aimed at optimising the prod-uct presentation and price level. The Keitts extended the end of the Spanish campaign until late November, with increasingly lim-
with marginal volumes, left the field free for Spanish produce. This market, with no real competition, was extended due to the particularly late start to the Brazilian Kent campaign, with substantial shipments only starting to arrive in early November, when the Spanish Osteen and Kent cam-paigns had already finished, and the Keitt volumes available proved more moderate. For practically one-and-a-half months, from mid-September to late October, Spain operated on a competition-free mar-ket, a particularly favourable scenario for selling big volumes while ensuring stable, high prices.
The estimated tonnages shipped by Span-ish operators was around 18 000 tonnes, hauling this source up to 4th place among the mango suppliers to the European Un-ion, behind Brazil, Peru and Côte d’Ivoire. The previous year Spain had enjoyed fa-vourable market conditions, with a smaller Israeli presence and another fairly late start
© G
uy B
réhi
nier
Content published by the Market News Service of CIRAD − All rights reserved

59No. 230 March 2015
CLOSE-UP
ited volumes, and prices dipping from 12.00 to 8.00 euros/box because of more variable quality at the end of the season, and the return of Brazilian competition which was establishing itself on the market.
We can also recall the growth, though to a lower quantitative level, of Irwin shipments alongside Os-teen shipments. The smaller sized Spanish Irwins made up for the air-freight mango shortfall in Sep-tember and October. These fruits, presented in the same packaging as air-freight quality mangoes, were warmly received by tropical produce specialists, ob-taining high and strong rates which stabilised at around 4.50 euros/kg. The stronger presence of this variety illustrates the concern for varietal diversifica-tion among Spanish operators, and their dynamic in terms of market conquest.
The rise of Spain in the Community mango trade has been impressive and remarkable. While it is based on a clear dynamic of production and quest for quality in the produce, we should not conceal the particular-ly favourable conditions that this source has enjoyed for the past two or three campaigns. Its weight in the mango trade has been confirmed, but how would things change in a different context, combining abundant production and simultaneous exports from Israel and Brazil?
Pierre Gerbaud, consultant [email protected]
© C
arol
ina
Daw
son
2.5
5.0
7.5
10.0
12.5
15.0
17.5
20.0
34 35 36 37 38 39 40 41 42 43 44 45 46 47 48
euro
/cra
te
OsteenKentKeittIrwin
Mango - Spain - Average import price by variety on the french market in 2014
Weeks / Source: Pierre Gerbaud
2.5
3.5
4.5
5.5
6.5
7.5
8.5
9.5
10.5
34 35 36 37 38 39 40 41 42 43 44 45 46
euro
/cra
te
2014
2012
2013
Osteen mango - SpainAverage import price on the french market
Weeks / Source: Pierre Gerbaud
Content published by the Market News Service of CIRAD − All rights reserved
60 March 2015 No. 230
CLOSE-UP
european mango market 2014 monthly reviewShort-lived disruption on a steady market
The supply variations were more marked in 2014, doubtless intensified by the overall increase in quantities sold. The Peruvian supply surplus at the beginning of the year was succeeded by lean periods, such as in spring with a late start from the West African sources, or in autumn with the Brazilian shortfall. Conversely, the increase in availability during the summer was another cause of price fluctuations.
© Denis Loeillet
Content published by the Market News Service of CIRAD − All rights reserved
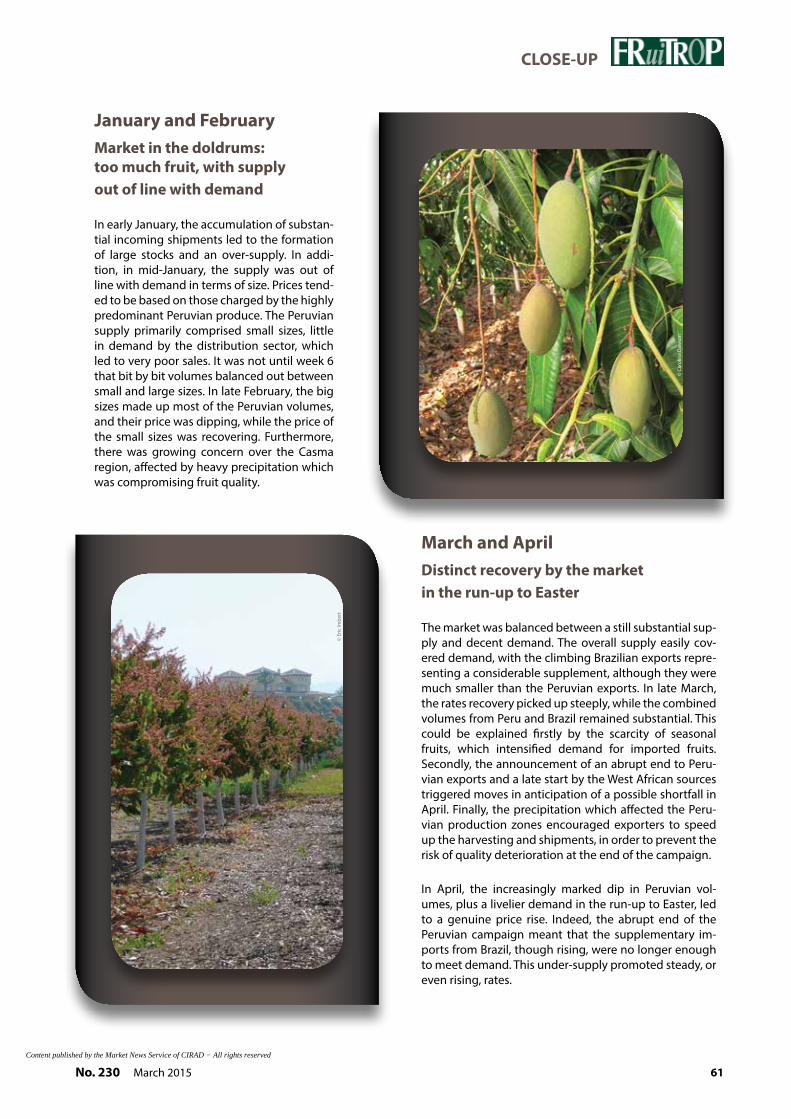
61No. 230 March 2015
CLOSE-UP
January and februaryMarket in the doldrums: too much fruit, with supply out of line with demand
In early January, the accumulation of substan-tial incoming shipments led to the formation of large stocks and an over-supply. In addi-tion, in mid-January, the supply was out of line with demand in terms of size. Prices tend-ed to be based on those charged by the highly predominant Peruvian produce. The Peruvian supply primarily comprised small sizes, little in demand by the distribution sector, which led to very poor sales. It was not until week 6 that bit by bit volumes balanced out between small and large sizes. In late February, the big sizes made up most of the Peruvian volumes, and their price was dipping, while the price of the small sizes was recovering. Furthermore, there was growing concern over the Casma region, affected by heavy precipitation which was compromising fruit quality.
March and AprilDistinct recovery by the market in the run-up to easter
The market was balanced between a still substantial sup-ply and decent demand. The overall supply easily cov-ered demand, with the climbing Brazilian exports repre-senting a considerable supplement, although they were much smaller than the Peruvian exports. In late March, the rates recovery picked up steeply, while the combined volumes from Peru and Brazil remained substantial. This could be explained firstly by the scarcity of seasonal fruits, which intensified demand for imported fruits. Secondly, the announcement of an abrupt end to Peru-vian exports and a late start by the West African sources triggered moves in anticipation of a possible shortfall in April. Finally, the precipitation which affected the Peru-vian production zones encouraged exporters to speed up the harvesting and shipments, in order to prevent the risk of quality deterioration at the end of the campaign.
In April, the increasingly marked dip in Peruvian vol-umes, plus a livelier demand in the run-up to Easter, led to a genuine price rise. Indeed, the abrupt end of the Peruvian campaign meant that the supplementary im-ports from Brazil, though rising, were no longer enough to meet demand. This under-supply promoted steady, or even rising, rates.
© C
arol
ina
Daw
son
© E
ric Im
bert
Content published by the Market News Service of CIRAD − All rights reserved

62 March 2015 No. 230
CLOSE-UP
Late April and MayMarket on a tightrope during the transition between Peru and West Africa
The market was on a tightrope after the more dynamic period of demand around the Easter holidays. The more restrained volumes avail-able after Easter created a relative under-sup-ply, which helped keep rates high. However, the considerable downturn in demand and the progress of seasonal fruits put the market on a downward trend.
In early May, the dip in demand, the more abun-dant arrival of seasonal fruits and the substantial shipments from West Africa led to a distinct mar-ket depression, especially marked since prices had hitherto been high. The first rains affecting the Côte d’Ivoire production zones encouraged several operators to close their packing stations and end their export campaign, in order to pre-vent fungal attack and fruit fly infestation of batches.
Thus the European market was in a way left floating, with demand still decent but less lively. West African mangoes seemed to be more wide-ly spread across the European markets than dur-ing the previous campaigns, when flows were more focused on French importers.
Late May and JuneDiversification of sources
The market was mainly supplied by the West African sources, and more particularly Côte d’Ivoire. Nonetheless there were mangoes from Brazil, Puerto Rico and the first incoming ship-ments from the Dominican Republic. The rise in seasonal fruits, abundant and sold at attractive prices, led to gradual loss of interest in import-ed produce. The proliferation of sources, quality and varieties disrupted sales due to lack of uni-formity.
However, the slight under-supply fostered strong and high prices. In June, the supply matched the natural market demand.
July and August
A quiet and sluggish summer …
In July, the rising imports from Brazil, Puerto Rico, the Dominican Republic and Senegal were easily sufficient. In August, the prolifer-ation of sources, varieties, sizes and qualities made sales particularly difficult, in the face of lean demand. The influx of seasonal fruits, which sold slowly, contributed to the sluggish market conditions for the mango. Operators repeatedly pointed to the lack of demand.
The political situation in the Middle East disrupted incoming Israeli shipments, as well as sales of fruit from this source in certain market sectors. The export restrictions to Russia also contributed to the lack of market fluidity.
© D
enis
Loe
illet
Content published by the Market News Service of CIRAD − All rights reserved

63No. 230 March 2015
CLOSE-UP
SeptemberBusiness picking up
The European market underwent a gradual change under the effect of a reduction in available quantities, and a still barely perceptible recovery. Brazilian ship-ments, shared between the North American market (2/3) and European market (1/3), proved to be well down on the same period of the previous year. Sene-gal and Puerto Rico, which were approaching the end of their export campaigns, had a smaller presence. Hence the European market was primarily supplied by Brazil and Israel. The dwindling supply helped prices hold up, or even rise slightly. Spanish fruits became a genuine alternative.
OctoberA spectacular shortage!
Week 41 saw a distinct change in the European mar-ket trend. The late progression of Brazilian shipments, the end of the Israeli campaign and the gradual start by Spain contributed to an under-supply to the Euro-pean market, which looked like a cyclical shortage. In this context prices across all sources and varieties boomed, temporarily exceeding 10.00 euros/box, a level rarely reached. The knock-on effect of this un-common situation was certain distributors abandon-ing the mango. In late October, the product shortage in relation to the natural market demand generated spectacular price inflation, which was down more to speculation on fruit shortage than the real value of the merchandise.
November and early DecemberA late return by Brazil
The market was nearly exclusively supplied by Brazil, with a surge in incoming volumes. This considerable increase in-fluenced the prices, which gradually dipped though main-taining high levels. The enlargement of the supply seemed to be accompanied by an increase in demand, which helped keep prices high. Brazil really was late in embarking on its end-of-year campaign. In late November, the accumulation of large incoming shipments from Brazil drove the market into a perceptible downward trend. A substantial part of the supply comprised large sizes, unsuitable for supermarket sector demand, which caused more marked price falls for these products.
DecemberAwaiting the Peruvian changeover
From week 50, the European mango market seemed to stabi-lise with the run-up to the Christmas holidays. The downward trend was halted by a moderate invigoration in demand. In-coming Brazilian shipments dipped, which also contributed to rates strengthening on certain markets. There were often wide price differences, depending on the fruit quality and suitability of the sizes available, especially in terms of super-market sector demand. The European market remained fair-ly stable at the end of the year. Some upward or downward price variations were observed nonetheless. Temporary in-creases were primarily attributable to rising demand for the end-of-year holidays. Price falls illustrated the uneven quality of Brazilian merchandise, which dominated the supply. The transition from Brazil to Peru proceeded bit by bit
Pierre Gerbaud, consultant [email protected]
© D
enis
Loe
illet
Content published by the Market News Service of CIRAD − All rights reserved

64 March 2015 No. 230
MANGO - Production (2012)
MANGO - Exports (2013)
MANGO - Imports (2013)
Mango - The 10 leading producer countriesmillion tonnes 2012
India 15.3China 4.4
Thailand 2.7Indonesia 2.4Pakistan 2.0Mexico 1.8Brazil 1.2
Bangladesh 0.9Nigeria 0.9Egypt 0.8
Sources: FAO, professionals
Mango - The 6 leading exporter countries
tonnes 2013
Mexico 338 169
India 263 918
Thailand 252 904
Brazil 122 178
Peru 126 815
Pakistan 98 926
Sources: National Customs, professionals
USA - Imports - Main supplier countriestonnes 2009 2010 2011 2012 2013 2014
Total 295 653 332 095 379 803 377 408 436 085 385 861 Mexico 186 807 221 945 241 468 251 321 285 679 242 737
Peru 17 316 32 175 45 223 26 974 41 277 44 653 Ecuador 35 304 25 650 30 364 37 868 45 945 34 483
Brazil 23 193 24 407 24 810 24 215 23 924 22 361 Guatemala 14 706 12 679 17 875 16 986 16 948 20 803
Haiti 9 014 6 502 9 241 8 045 10 262 9 894
Philippines 2 996 2 815 3 989 2 929 2 411 2 220
Others 6 318 5 922 6 833 9 070 9 639 8 710 Source: US Customs
Mango - The 6 leading importer countries
tonnes 2013
United States 436 085
China 190 182
Netherlands 154 122
Canada 60 290
Saudi Arabia 57 858
Malaysia 55 000
Source: National Customs
Canada - Imports - Main supplier countriestonnes 2009 2010 2011 2012 2013 2014
Total 41 544 46 649 56 375 54 291 60 290 57 991 Mexico 27 843 29 501 35 923 35 173 38 940 35 211
Peru 1 627 4 704 6 195 4 346 5 826 6 437
Brazil 3 563 3 529 4 310 4 850 4 706 6 318
Ecuador 3 445 3 568 4 083 3 709 3 979 3 192 Source: Comtrade
Central and South America - Main marketstonnes 2008 2009 2010 2011 2012 2013
Total 11 163 14 982 20 782 23 119 27 025 27 051 Colombia 5 078 7 277 9 675 13 132 13 132 11 530
Chile 690 766 2 344 3 240 3 421 5 141 Mexico 2 007 2 982 2 300 1 976 2 921 3 307
Honduras 843 970 3 000 1 339 2 565 2 174 El Salvador 987 1 582 665 569 1 966 1 761 Argentina 729 873 1 024 1 353 1 408 1 399
Panama 111 137 173 374 535 464 Bolivia 84 77 105 79 133 426
Paraguay 142 50 105 121 117 375
Guatemala 147 155 201 228 124 277 Source: Comtrade
Content published by the Market News Service of CIRAD − All rights reserved
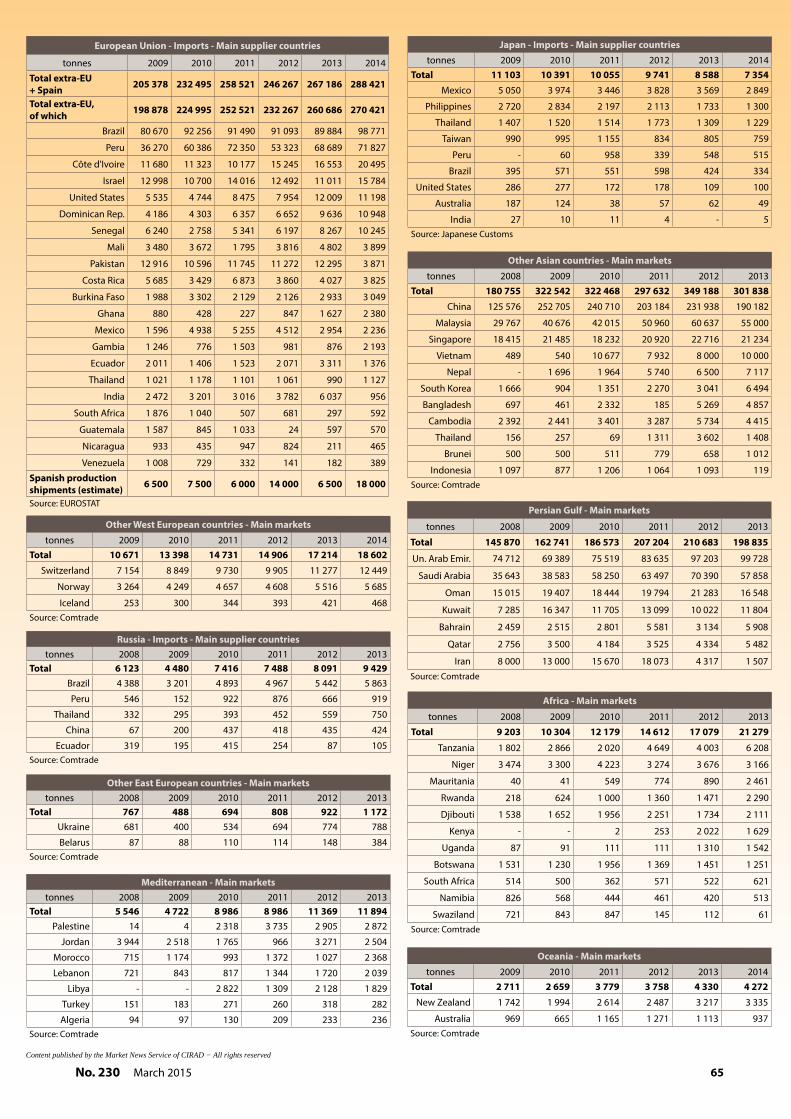
65No. 230 March 2015
european Union - Imports - Main supplier countries
tonnes 2009 2010 2011 2012 2013 2014
Total extra-eU + Spain 205 378 232 495 258 521 246 267 267 186 288 421
Total extra-eU, of which 198 878 224 995 252 521 232 267 260 686 270 421
Brazil 80 670 92 256 91 490 91 093 89 884 98 771
Peru 36 270 60 386 72 350 53 323 68 689 71 827
Côte d'Ivoire 11 680 11 323 10 177 15 245 16 553 20 495
Israel 12 998 10 700 14 016 12 492 11 011 15 784
United States 5 535 4 744 8 475 7 954 12 009 11 198
Dominican Rep. 4 186 4 303 6 357 6 652 9 636 10 948
Senegal 6 240 2 758 5 341 6 197 8 267 10 245
Mali 3 480 3 672 1 795 3 816 4 802 3 899
Pakistan 12 916 10 596 11 745 11 272 12 295 3 871
Costa Rica 5 685 3 429 6 873 3 860 4 027 3 825
Burkina Faso 1 988 3 302 2 129 2 126 2 933 3 049
Ghana 880 428 227 847 1 627 2 380
Mexico 1 596 4 938 5 255 4 512 2 954 2 236
Gambia 1 246 776 1 503 981 876 2 193
Ecuador 2 011 1 406 1 523 2 071 3 311 1 376
Thailand 1 021 1 178 1 101 1 061 990 1 127
India 2 472 3 201 3 016 3 782 6 037 956
South Africa 1 876 1 040 507 681 297 592
Guatemala 1 587 845 1 033 24 597 570
Nicaragua 933 435 947 824 211 465
Venezuela 1 008 729 332 141 182 389
Spanish production shipments (estimate) 6 500 7 500 6 000 14 000 6 500 18 000
Source: EUROSTAT
Other West european countries - Main markets
tonnes 2009 2010 2011 2012 2013 2014Total 10 671 13 398 14 731 14 906 17 214 18 602
Switzerland 7 154 8 849 9 730 9 905 11 277 12 449
Norway 3 264 4 249 4 657 4 608 5 516 5 685
Iceland 253 300 344 393 421 468 Source: Comtrade
Russia - Imports - Main supplier countriestonnes 2008 2009 2010 2011 2012 2013
Total 6 123 4 480 7 416 7 488 8 091 9 429 Brazil 4 388 3 201 4 893 4 967 5 442 5 863
Peru 546 152 922 876 666 919
Thailand 332 295 393 452 559 750
China 67 200 437 418 435 424
Ecuador 319 195 415 254 87 105 Source: Comtrade
Other east european countries - Main marketstonnes 2008 2009 2010 2011 2012 2013
Total 767 488 694 808 922 1 172 Ukraine 681 400 534 694 774 788
Belarus 87 88 110 114 148 384 Source: Comtrade
Japan - Imports - Main supplier countriestonnes 2009 2010 2011 2012 2013 2014
Total 11 103 10 391 10 055 9 741 8 588 7 354 Mexico 5 050 3 974 3 446 3 828 3 569 2 849
Philippines 2 720 2 834 2 197 2 113 1 733 1 300
Thailand 1 407 1 520 1 514 1 773 1 309 1 229
Taiwan 990 995 1 155 834 805 759
Peru - 60 958 339 548 515
Brazil 395 571 551 598 424 334
United States 286 277 172 178 109 100
Australia 187 124 38 57 62 49
India 27 10 11 4 - 5 Source: Japanese Customs
Other Asian countries - Main markets
tonnes 2008 2009 2010 2011 2012 2013Total 180 755 322 542 322 468 297 632 349 188 301 838
China 125 576 252 705 240 710 203 184 231 938 190 182
Malaysia 29 767 40 676 42 015 50 960 60 637 55 000
Singapore 18 415 21 485 18 232 20 920 22 716 21 234
Vietnam 489 540 10 677 7 932 8 000 10 000
Nepal - 1 696 1 964 5 740 6 500 7 117
South Korea 1 666 904 1 351 2 270 3 041 6 494
Bangladesh 697 461 2 332 185 5 269 4 857
Cambodia 2 392 2 441 3 401 3 287 5 734 4 415
Thailand 156 257 69 1 311 3 602 1 408
Brunei 500 500 511 779 658 1 012
Indonesia 1 097 877 1 206 1 064 1 093 119 Source: Comtrade
Persian Gulf - Main markets
tonnes 2008 2009 2010 2011 2012 2013
Total 145 870 162 741 186 573 207 204 210 683 198 835
Un. Arab Emir. 74 712 69 389 75 519 83 635 97 203 99 728
Saudi Arabia 35 643 38 583 58 250 63 497 70 390 57 858
Oman 15 015 19 407 18 444 19 794 21 283 16 548
Kuwait 7 285 16 347 11 705 13 099 10 022 11 804
Bahrain 2 459 2 515 2 801 5 581 3 134 5 908
Qatar 2 756 3 500 4 184 3 525 4 334 5 482
Iran 8 000 13 000 15 670 18 073 4 317 1 507 Source: Comtrade
Africa - Main markets
tonnes 2008 2009 2010 2011 2012 2013
Total 9 203 10 304 12 179 14 612 17 079 21 279
Tanzania 1 802 2 866 2 020 4 649 4 003 6 208
Niger 3 474 3 300 4 223 3 274 3 676 3 166
Mauritania 40 41 549 774 890 2 461
Rwanda 218 624 1 000 1 360 1 471 2 290
Djibouti 1 538 1 652 1 956 2 251 1 734 2 111
Kenya - - 2 253 2 022 1 629
Uganda 87 91 111 111 1 310 1 542
Botswana 1 531 1 230 1 956 1 369 1 451 1 251
South Africa 514 500 362 571 522 621
Namibia 826 568 444 461 420 513
Swaziland 721 843 847 145 112 61 Source: Comtrade
Mediterranean - Main marketstonnes 2008 2009 2010 2011 2012 2013
Total 5 546 4 722 8 986 8 986 11 369 11 894 Palestine 14 4 2 318 3 735 2 905 2 872
Jordan 3 944 2 518 1 765 966 3 271 2 504
Morocco 715 1 174 993 1 372 1 027 2 368
Lebanon 721 843 817 1 344 1 720 2 039
Libya - - 2 822 1 309 2 128 1 829
Turkey 151 183 271 260 318 282
Algeria 94 97 130 209 233 236 Source: Comtrade
Oceania - Main markets
tonnes 2009 2010 2011 2012 2013 2014Total 2 711 2 659 3 779 3 758 4 330 4 272
New Zealand 1 742 1 994 2 614 2 487 3 217 3 335
Australia 969 665 1 165 1 271 1 113 937 Source: Comtrade
Content published by the Market News Service of CIRAD − All rights reserved

66 March 2015 No. 230
CLOSE-UP
Immaturity and spotting Natural discoloration of the epidermis
Misshapen fruit Scarred-over insect pricking
Mechanical wounds after picking Mechanical wounds after picking
Stalk too long Spotting on epidermis
Mango quality defects
Photos © Pierre Gerbaud
Content published by the Market News Service of CIRAD − All rights reserved

67No. 230 March 2015
CLOSE-UP
Anthracnose type fungal infection fruitfly larvae Sun scorching
Misshapen fruit Discoloration caused by scales Wounding with wind-caused rubbing
Postharvest sap burn Postharvest soiling by sap Stalk rot
fungal infection Overripeness Internal breakdown caused by excessive nitrogen (high calcium
and boron contents too)
Content published by the Market News Service of CIRAD − All rights reserved
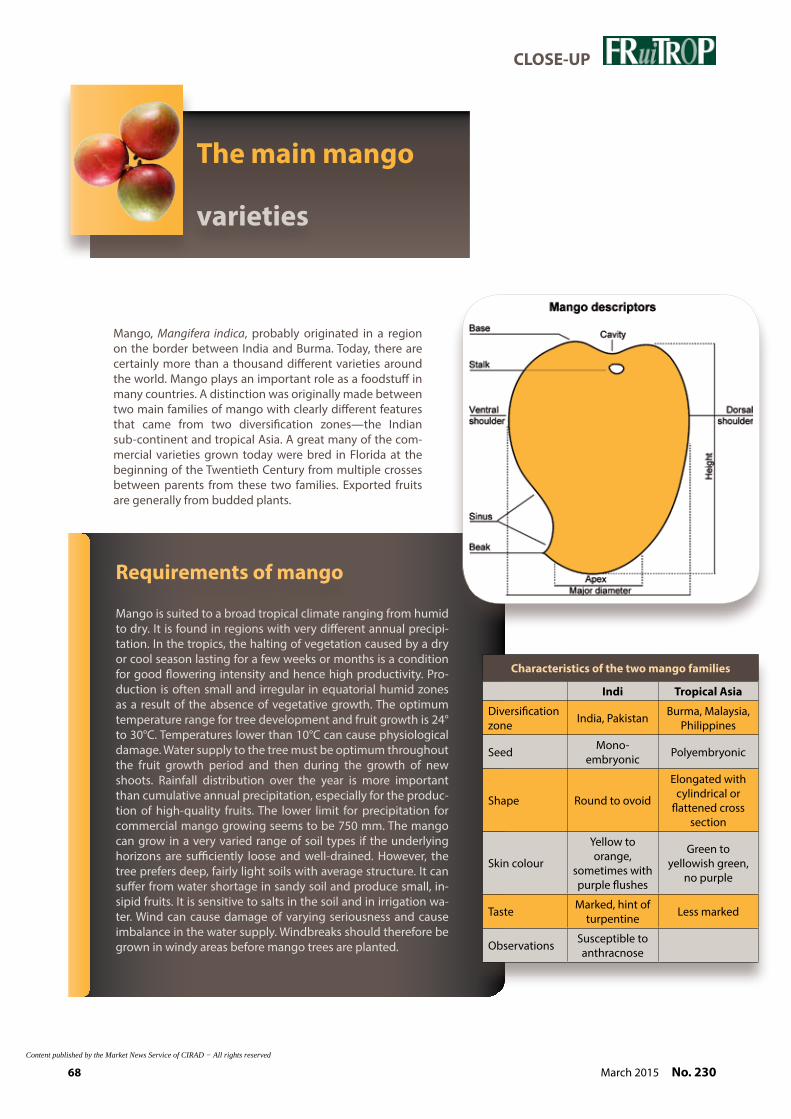
68 March 2015 No. 230
CLOSE-UP
The main mango
varieties
Mango is suited to a broad tropical climate ranging from humid to dry. It is found in regions with very different annual precipi-tation. In the tropics, the halting of vegetation caused by a dry or cool season lasting for a few weeks or months is a condition for good flowering intensity and hence high productivity. Pro-duction is often small and irregular in equatorial humid zones as a result of the absence of vegetative growth. The optimum temperature range for tree development and fruit growth is 24° to 30°C. Temperatures lower than 10°C can cause physiological damage. Water supply to the tree must be optimum throughout the fruit growth period and then during the growth of new shoots. Rainfall distribution over the year is more important than cumulative annual precipitation, especially for the produc-tion of high-quality fruits. The lower limit for precipitation for commercial mango growing seems to be 750 mm. The mango can grow in a very varied range of soil types if the underlying horizons are sufficiently loose and well-drained. However, the tree prefers deep, fairly light soils with average structure. It can suffer from water shortage in sandy soil and produce small, in-sipid fruits. It is sensitive to salts in the soil and in irrigation wa-ter. Wind can cause damage of varying seriousness and cause imbalance in the water supply. Windbreaks should therefore be grown in windy areas before mango trees are planted.
Requirements of mango
Mango, Mangifera indica, probably originated in a region on the border between India and Burma. Today, there are certainly more than a thousand different varieties around the world. Mango plays an important role as a foodstuff in many countries. A distinction was originally made between two main families of mango with clearly different features that came from two diversification zones—the Indian sub-continent and tropical Asia. A great many of the com-mercial varieties grown today were bred in Florida at the beginning of the Twentieth Century from multiple crosses between parents from these two families. Exported fruits are generally from budded plants.
Characteristics of the two mango families
Indi Tropical Asia
Diversification zone India, Pakistan Burma, Malaysia,
Philippines
Seed Mono- embryonic Polyembryonic
Shape Round to ovoid
Elongated with cylindrical or
flattened cross section
Skin colour
Yellow to orange,
sometimes with purple flushes
Green to yellowish green,
no purple
Taste Marked, hint of turpentine Less marked
Observations Susceptible to anthracnose
Content published by the Market News Service of CIRAD − All rights reserved
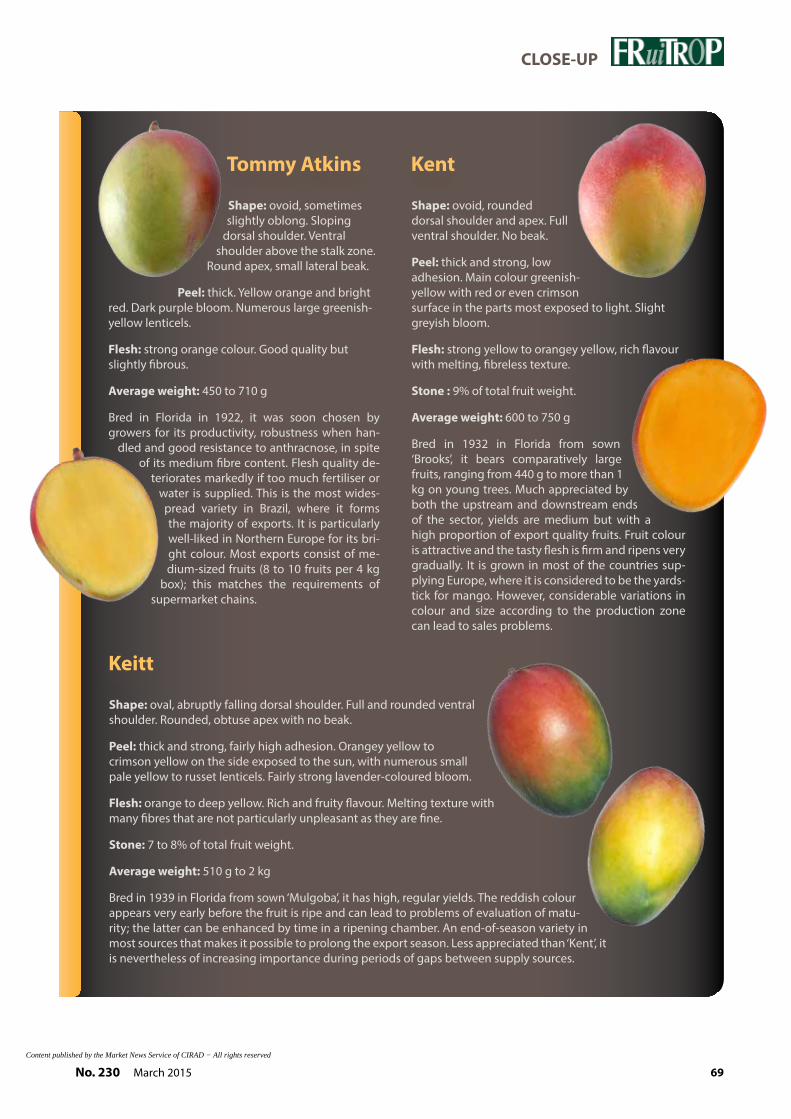
69No. 230 March 2015
CLOSE-UP
Shape: ovoid, sometimes slightly oblong. Sloping
dorsal shoulder. Ventral shoulder above the stalk zone.
Round apex, small lateral beak.
Peel: thick. Yellow orange and bright red. Dark purple bloom. Numerous large greenish-yellow lenticels.
flesh: strong orange colour. Good quality but slightly fibrous.
Average weight: 450 to 710 g
Bred in Florida in 1922, it was soon chosen by growers for its productivity, robustness when han-
dled and good resistance to anthracnose, in spite of its medium fibre content. Flesh quality de-
teriorates markedly if too much fertiliser or water is supplied. This is the most wides-pread variety in Brazil, where it forms the majority of exports. It is particularly well-liked in Northern Europe for its bri-ght colour. Most exports consist of me-dium-sized fruits (8 to 10 fruits per 4 kg
box); this matches the requirements of supermarket chains.
Tommy Atkins
Shape: ovoid, rounded dorsal shoulder and apex. Full ventral shoulder. No beak.
Peel: thick and strong, low adhesion. Main colour greenish-yellow with red or even crimson surface in the parts most exposed to light. Slight greyish bloom.
flesh: strong yellow to orangey yellow, rich flavour with melting, fibreless texture.
Stone : 9% of total fruit weight.
Average weight: 600 to 750 g
Bred in 1932 in Florida from sown ‘Brooks’, it bears comparatively large fruits, ranging from 440 g to more than 1 kg on young trees. Much appreciated by both the upstream and downstream ends of the sector, yields are medium but with a high proportion of export quality fruits. Fruit colour is attractive and the tasty flesh is firm and ripens very gradually. It is grown in most of the countries sup-plying Europe, where it is considered to be the yards-tick for mango. However, considerable variations in colour and size according to the production zone can lead to sales problems.
Kent
Shape: oval, abruptly falling dorsal shoulder. Full and rounded ventral shoulder. Rounded, obtuse apex with no beak.
Peel: thick and strong, fairly high adhesion. Orangey yellow to crimson yellow on the side exposed to the sun, with numerous small pale yellow to russet lenticels. Fairly strong lavender-coloured bloom.
flesh: orange to deep yellow. Rich and fruity flavour. Melting texture with many fibres that are not particularly unpleasant as they are fine.
Stone: 7 to 8% of total fruit weight.
Average weight: 510 g to 2 kg
Bred in 1939 in Florida from sown ‘Mulgoba’, it has high, regular yields. The reddish colour appears very early before the fruit is ripe and can lead to problems of evaluation of matu-rity; the latter can be enhanced by time in a ripening chamber. An end-of-season variety in most sources that makes it possible to prolong the export season. Less appreciated than ‘Kent’, it is nevertheless of increasing importance during periods of gaps between supply sources.
Keitt
Content published by the Market News Service of CIRAD − All rights reserved
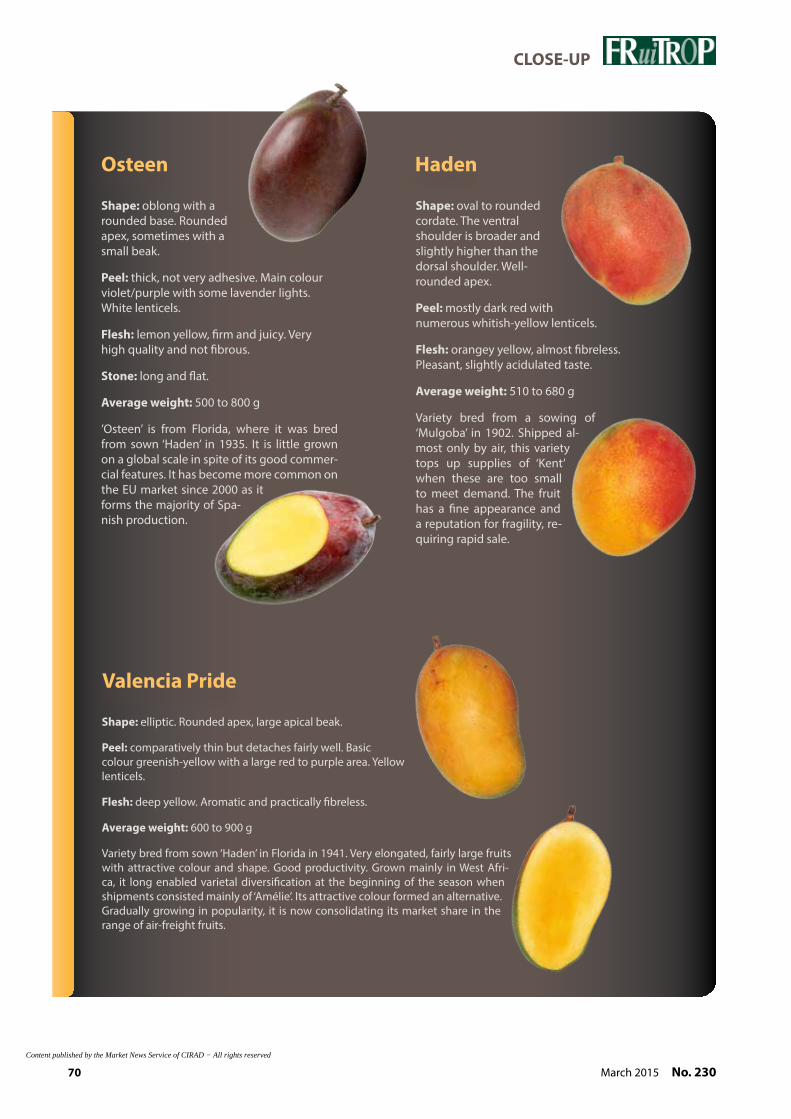
70 March 2015 No. 230
CLOSE-UP
Shape: oblong with a rounded base. Rounded apex, sometimes with a small beak.
Peel: thick, not very adhesive. Main colour violet/purple with some lavender lights. White lenticels.
flesh: lemon yellow, firm and juicy. Very high quality and not fibrous.
Stone: long and flat.
Average weight: 500 to 800 g
’Osteen’ is from Florida, where it was bred from sown ‘Haden’ in 1935. It is little grown on a global scale in spite of its good commer-cial features. It has become more common on the EU market since 2000 as it forms the majority of Spa-nish production.
Osteen
Shape: oval to rounded cordate. The ventral shoulder is broader and slightly higher than the dorsal shoulder. Well-rounded apex.
Peel: mostly dark red with numerous whitish-yellow lenticels.
flesh: orangey yellow, almost fibreless. Pleasant, slightly acidulated taste.
Average weight: 510 to 680 g
Variety bred from a sowing of ‘Mulgoba’ in 1902. Shipped al-most only by air, this variety tops up supplies of ‘Kent’ when these are too small to meet demand. The fruit has a fine appearance and a reputation for fragility, re-quiring rapid sale.
Haden
Shape: elliptic. Rounded apex, large apical beak.
Peel: comparatively thin but detaches fairly well. Basic colour greenish-yellow with a large red to purple area. Yellow lenticels.
flesh: deep yellow. Aromatic and practically fibreless.
Average weight: 600 to 900 g
Variety bred from sown ‘Haden’ in Florida in 1941. Very elongated, fairly large fruits with attractive colour and shape. Good productivity. Grown mainly in West Afri-ca, it long enabled varietal diversification at the beginning of the season when shipments consisted mainly of ‘Amélie’. Its attractive colour formed an alternative. Gradually growing in popularity, it is now consolidating its market share in the range of air-freight fruits.
Valencia Pride
Content published by the Market News Service of CIRAD − All rights reserved

71No. 230 March 2015
WHOLESALE MARKET PRICES IN EUROPE - JANUARY-FEBRUARY 2015
Wholesale market prices in EuropeJanuary-February 2015
eUROPeAN UNION - eUROGermany Belgium france Holland UK
AVOCADO Air TROPICAL BRAZIL Box 18.38DOMINICAN REP. Box 13.60
Sea ARAD ISRAEL Box 7.50 7.31ETTINGER ISRAEL Box 6.00FINO ISRAEL Box 6.25 7.50FUERTE ISRAEL Box 6.88 7.00 7.50HASS CHILE Box 12.00 11.00 9.13 11.75
COLOMBIA Box 11.88ISRAEL Box 12.00 9.78 10.25 9.06KENYA Box 9.19MEXICO Box 9.18MOROCCO Box 12.50 11.00 9.42 11.75PERU Box 9.00 16.21
PINKERTON ISRAEL Box 6.88 7.25 7.13 8.28 9.45Truck BACON SPAIN Box 4.25
FUERTE SPAIN Box 6.88HASS SPAIN Box 12.00 10.44 11.75 7.84REED SPAIN Box 7.25
BANANA Air RED ECUADOR kg 5.19SMALL COLOMBIA kg 6.95
ECUADOR kg 5.50Sea RED ECUADOR kg 2.33
SMALL ECUADOR kg 1.70 2.65
CARAMBOLA Air MALAYSIA kg 5.00 4.93 5.26COLOMBIA kg 3.80
Sea MALAYSIA kg 3.86
COCONUT Sea NOT DETERMINED COSTA RICA Bag 18.50COTE D'IVOIRE Bag 14.00 10.00 12.02 15.29DOMINICAN REP. Bag 23.30DOMINICA Bag 13.28SRI LANKA Bag 21.20 10.29
YOUNG COSTA RICA Bag 16.50
DATe Sea KENTA TUNISIA kg 1.75MEDJOOL ISRAEL kg 7.92
PERU kg 6.00MOZAFATI IRAN kg 3.20NOT DETERMINED ALGERIA kg 1.42
ISRAEL kg 4.33RAVIER TUNISIA kg 2.07STONELESS TUNISIA kg 3.00
GINGeR Sea BRAZIL kg 3.66CHINA kg 2.22 3.00 2.73 3.03PERU kg 2.59 2.54THAILAND kg 2.00 1.55
GUAVA Air BRAZIL kg 6.22Sea BRAZIL kg 2.39
EGYPT kg 1.86
KUMQUAT Air BRAZIL kg 4.79ISRAEL kg 4.38 7.09SOUTH AFRICA kg 6.53
LIMe Air BRAZIL kg 4.00Sea BRAZIL kg 1.16 1.25 1.70 1.31 1.44
HAITI kg 1.50MEXICO kg 1.38 1.61 1.90 1.47 1.69
LITCHI Air MAURITIUS kg 4.00SOUTH AFRICA kg 4.13
Sea MADAGASCAR kg 2.30 1.88 3.40SOUTH AFRICA kg 3.25 2.41 2.94
MANGO Air KENT BRAZIL kg 4.20PERU kg 5.75 5.19
NAM DOK MAI THAILAND kg 9.10Sea ATKINS BRAZIL kg 1.50 1.20 1.97
KEITT BRAZIL kg 2.13KENT BRAZIL kg 2.13 2.13
PERU kg 2.00 2.00 2.42 2.06NOT DETERMINED BRAZIL kg 2.28Content published by the Market News Service of CIRAD − All rights reserved
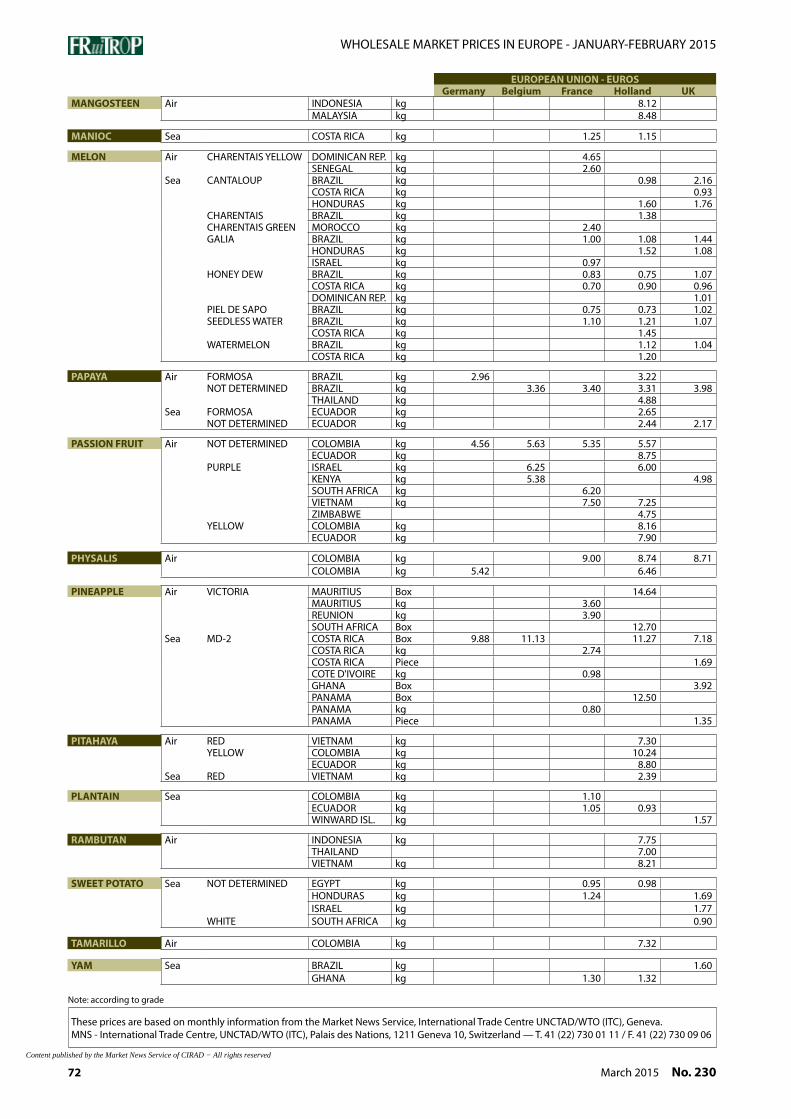
72 March 2015 No. 230
WHOLESALE MARKET PRICES IN EUROPE - JANUARY-FEBRUARY 2015
These prices are based on monthly information from the Market News Service, International Trade Centre UNCTAD/WTO (ITC), Geneva. MNS - International Trade Centre, UNCTAD/WTO (ITC), Palais des Nations, 1211 Geneva 10, Switzerland — T. 41 (22) 730 01 11 / F. 41 (22) 730 09 06
Note: according to grade
eUROPeAN UNION - eUROSGermany Belgium france Holland UK
MANGOSTeeN Air INDONESIA kg 8.12MALAYSIA kg 8.48
MANIOC Sea COSTA RICA kg 1.25 1.15
MeLON Air CHARENTAIS YELLOW DOMINICAN REP. kg 4.65SENEGAL kg 2.60
Sea CANTALOUP BRAZIL kg 0.98 2.16COSTA RICA kg 0.93HONDURAS kg 1.60 1.76
CHARENTAIS BRAZIL kg 1.38CHARENTAIS GREEN MOROCCO kg 2.40GALIA BRAZIL kg 1.00 1.08 1.44
HONDURAS kg 1.52 1.08ISRAEL kg 0.97
HONEY DEW BRAZIL kg 0.83 0.75 1.07COSTA RICA kg 0.70 0.90 0.96DOMINICAN REP. kg 1.01
PIEL DE SAPO BRAZIL kg 0.75 0.73 1.02SEEDLESS WATER BRAZIL kg 1.10 1.21 1.07
COSTA RICA kg 1.45WATERMELON BRAZIL kg 1.12 1.04
COSTA RICA kg 1.20
PAPAYA Air FORMOSA BRAZIL kg 2.96 3.22NOT DETERMINED BRAZIL kg 3.36 3.40 3.31 3.98
THAILAND kg 4.88Sea FORMOSA ECUADOR kg 2.65
NOT DETERMINED ECUADOR kg 2.44 2.17
PASSION fRUIT Air NOT DETERMINED COLOMBIA kg 4.56 5.63 5.35 5.57ECUADOR kg 8.75
PURPLE ISRAEL kg 6.25 6.00KENYA kg 5.38 4.98SOUTH AFRICA kg 6.20VIETNAM kg 7.50 7.25ZIMBABWE 4.75
YELLOW COLOMBIA kg 8.16ECUADOR kg 7.90
PHYSALIS Air COLOMBIA kg 9.00 8.74 8.71COLOMBIA kg 5.42 6.46
PINeAPPLe Air VICTORIA MAURITIUS Box 14.64MAURITIUS kg 3.60REUNION kg 3.90SOUTH AFRICA Box 12.70
Sea MD-2 COSTA RICA Box 9.88 11.13 11.27 7.18COSTA RICA kg 2.74COSTA RICA Piece 1.69COTE D'IVOIRE kg 0.98GHANA Box 3.92PANAMA Box 12.50PANAMA kg 0.80PANAMA Piece 1.35
PITAHAYA Air RED VIETNAM kg 7.30YELLOW COLOMBIA kg 10.24
ECUADOR kg 8.80Sea RED VIETNAM kg 2.39
PLANTAIN Sea COLOMBIA kg 1.10ECUADOR kg 1.05 0.93WINWARD ISL. kg 1.57
RAMBUTAN Air INDONESIA kg 7.75THAILAND 7.00VIETNAM kg 8.21
SWeeT POTATO Sea NOT DETERMINED EGYPT kg 0.95 0.98HONDURAS kg 1.24 1.69ISRAEL kg 1.77
WHITE SOUTH AFRICA kg 0.90
TAMARILLO Air COLOMBIA kg 7.32
YAM Sea BRAZIL kg 1.60GHANA kg 1.30 1.32
Content published by the Market News Service of CIRAD − All rights reserved

Content published by the Market News Service of CIRAD − All rights reserved
UNIVEG, YOUR DIRECT CONNECTION TO THE FIELD
UNIVEG KATOPÉ FRANCE IS A MEMBER OF THE UNIVEG GROUP | www.univeg.com
UNIVEG Katopé France S.A.S.15, boulevard du Delta | Zone Euro Delta | DE1 - 94658 | RUNGIS CEDEX | FranceT +33 1 49 78 20 00 | F +33 1 46 87 16 45 | [email protected] | www.univeg.fr
UNIVEG Katopé France is an important player in the production, packaging, export, storage, ripening and distribution of fresh fruit and vegetables. All these services are carried out to ensure the quality and natural flavour of the fresh produce.
In association with its Fruit Partners, UNIVEG Katopé France offers multi-origins mangos receiving all the know-how of the European leader in ripening.
Content published by the Market News Service of CIRAD − All rights reserved
Related Documents