Close Brothers Group Asset Management Division Presentation to Investors and Analysts 22 April 2009

Welcome message from author
This document is posted to help you gain knowledge. Please leave a comment to let me know what you think about it! Share it to your friends and learn new things together.
Transcript

Close Brothers Group
Asset Management Division
Presentation to Investors and Analysts
22 April 2009
Page 2
Cautionary statement
Certain statements included in this presentation may constitute "forward-looking statements" in respect of the Group’s operations, performance, prospects and/or financial condition. By their nature, forward looking statements involve a number of risks, uncertainties and assumptions and actual results or events may differ materially from those expressed or implied by those statements. Accordingly, no assurance can be given that any particular expectation will be met and reliance should not be placed on any forward-looking statement. Additionally, forward-looking statements regarding past trends or activities should not be taken as a representation that such trends or activities will continue in the future. No responsibility or obligation is accepted to update or revise any forward-looking statement resulting from new information, future events or otherwise. Nothing in this presentation should be construed as a profit forecast.
This presentation does not constitute or form part of any offer or invitation to sell, or any solicitation of any offer to purchase any shares in the Company, nor shall it or any part of it or the fact of its distribution form the basis of, or be relied on in connection with, any contract or commitment or investment decisions relating thereto, nor does it constitute a recommendation regarding the shares of the Company. Past performance cannot be relied upon as a guide to future performance.
Information in this presentation reflects the knowledge and information available at the time of its preparation.Not intended for distribution to retail customers.
Regarding information in this presentation
Page 3
Agenda
1. Introduction – Jonathan Howell, Group Finance Director
2. Presentation on Asset Management Division – Martin Andrew, Chief Executive Asset Management
• Overview
• Private Clients and Funds
• Banking and Administration
• Operational Efficiency
• Summary
3. Q&A
Page 4
Agenda
1. Introduction – Jonathan Howell, Group Finance Director
2. Presentation on Asset Management Division – Martin Andrew, Chief Executive Asset Management
• Overview
• Private Clients and Funds
• Banking and Administration
• Operational Efficiency
• Summary
3. Q&A
Page 5
Introduction
• The Asset Management Division developed via acquisitions over 20+ years
• Encompassed a diverse range of autonomous businesses and capabilities
• Generated significant profit growth to 2007
• Restructuring to improve focus and deliver improved results
Page 6
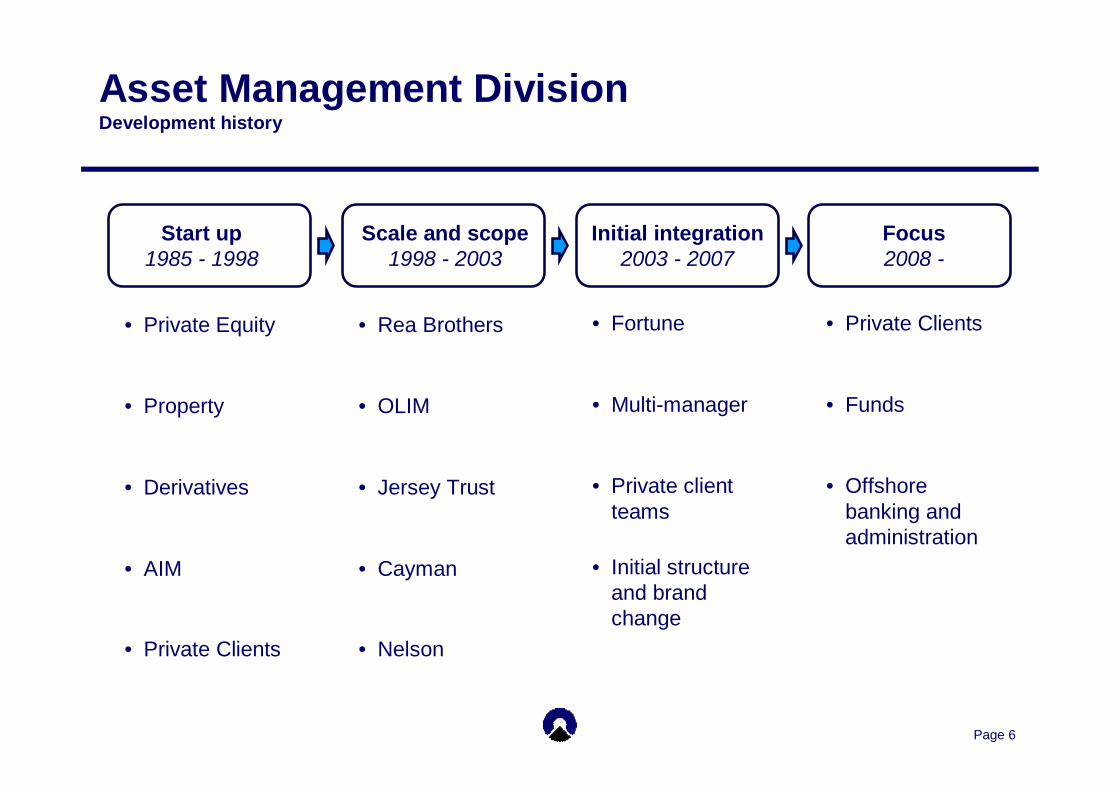
Asset Management DivisionDevelopment history
• Private Equity
• Property
• Derivatives
• AIM
• Private Clients
Start up1985 - 1998
Scale and scope1998 - 2003
Initial integration2003 - 2007
Focus2008 -
• Rea Brothers
• OLIM
• Jersey Trust
• Cayman
• Nelson
• Fortune
• Multi-manager
• Private client teams
• Initial structure and brand change
• Private Clients
• Funds
• Offshore banking and administration
Page 7
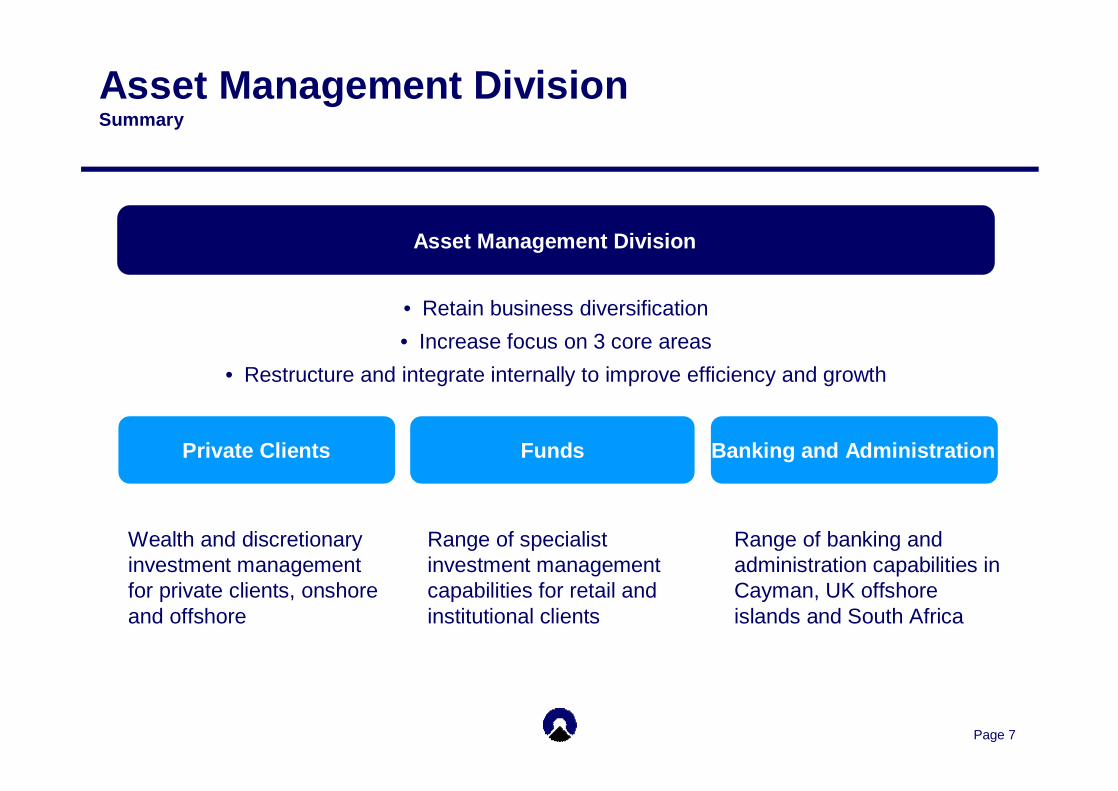
Asset Management DivisionSummary
Private Clients Funds Banking and Administration
Wealth and discretionary investment management for private clients, onshore and offshore
Range of specialist investment management capabilities for retail and institutional clients
Range of banking and administration capabilities in Cayman, UK offshore islands and South Africa
Asset Management Division
• Retain business diversification• Increase focus on 3 core areas
• Restructure and integrate internally to improve efficiency and growth
Page 8
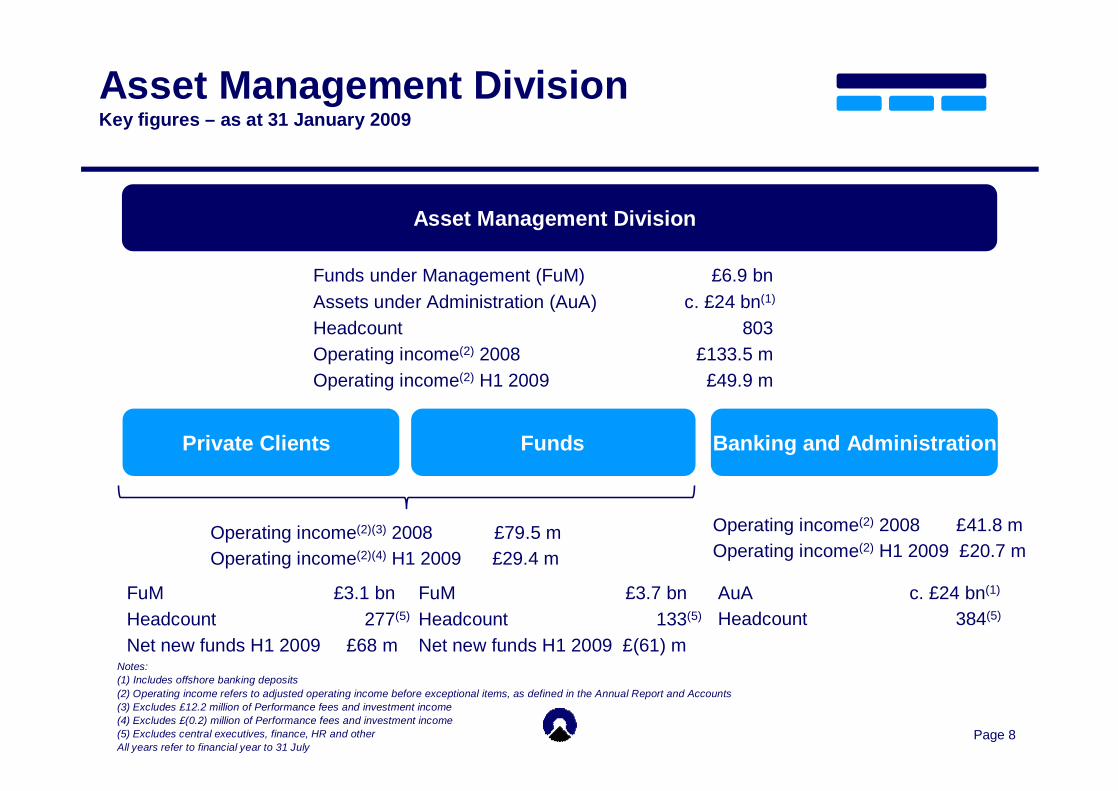
Asset Management DivisionKey figures – as at 31 January 2009
Private Clients Funds Banking and Administration
Asset Management Division
Funds under Management (FuM) £6.9 bnAssets under Administration (AuA) c. £24 bn(1)
Headcount 803Operating income(2) 2008 £133.5 mOperating income(2) H1 2009 £49.9 m
FuM £3.1 bnHeadcount 277(5)
Net new funds H1 2009 £68 m
FuM £3.7 bnHeadcount 133(5)
Net new funds H1 2009 £(61) m
AuA c. £24 bn(1)
Headcount 384(5)
Operating income(2) 2008 £41.8 mOperating income(2) H1 2009 £20.7 m
Operating income(2)(3) 2008 £79.5 mOperating income(2)(4) H1 2009 £29.4 m
Notes: (1) Includes offshore banking deposits(2) Operating income refers to adjusted operating income before exceptional items, as defined in the Annual Report and Accounts(3) Excludes £12.2 million of Performance fees and investment income(4) Excludes £(0.2) million of Performance fees and investment income(5) Excludes central executives, finance, HR and otherAll years refer to financial year to 31 July
Page 9
31.1
36.641.0 41.8
20.7
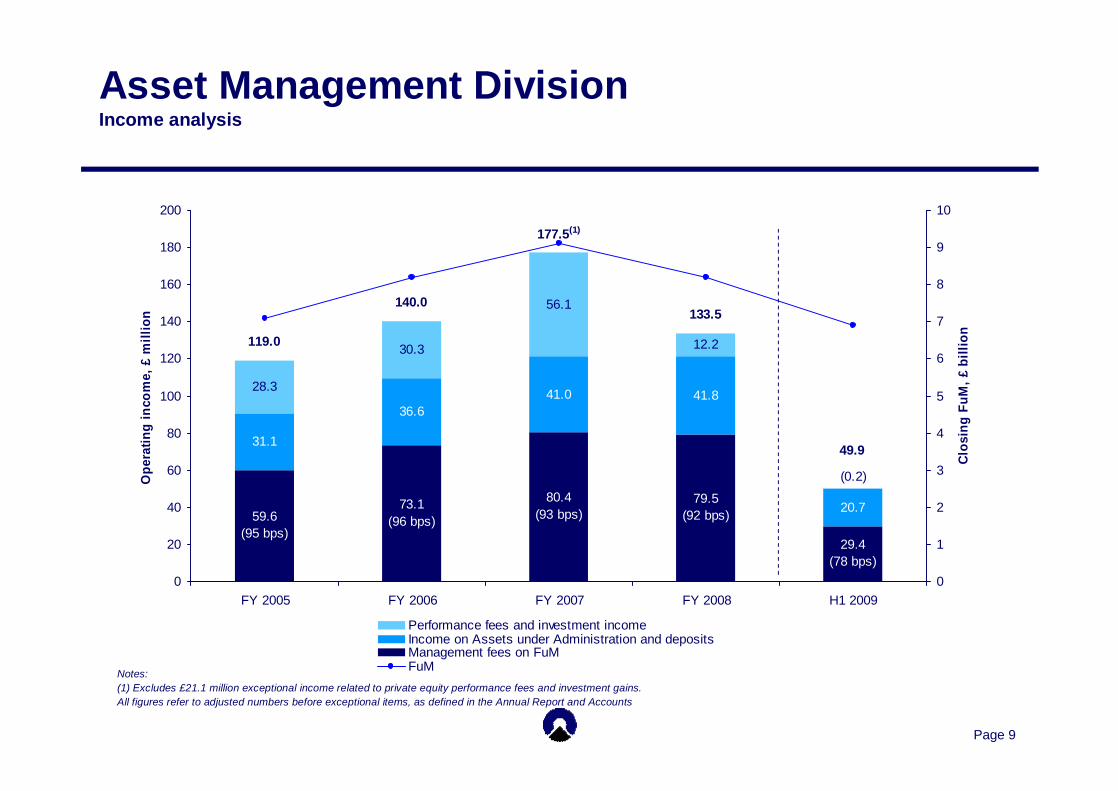
28.3
30.3
56.1
12.2
59.6(95 bps)
73.1(96 bps)
29.4(78 bps)
79.5(92 bps)
80.4(93 bps)
(0.2)
133.5
177.5(1)
119.0
140.0
49.9
0
20
40
60
80
100
120
140
160
180
200
FY 2005 FY 2006 FY 2007 FY 2008 H1 2009
Ope
ratin
g in
com
e, £
mill
ion
0
1
2
3
4
5
6
7
8
9
10
Clos
ing
FuM
, £ b
illio
n
Column 4Performance fees and investment incomeIncome on Assets under Administration and depositsManagement fees on FuMFuM
Asset Management DivisionIncome analysis
Notes:(1) Excludes £21.1 million exceptional income related to private equity performance fees and investment gains.All figures refer to adjusted numbers before exceptional items, as defined in the Annual Report and Accounts
Page 10
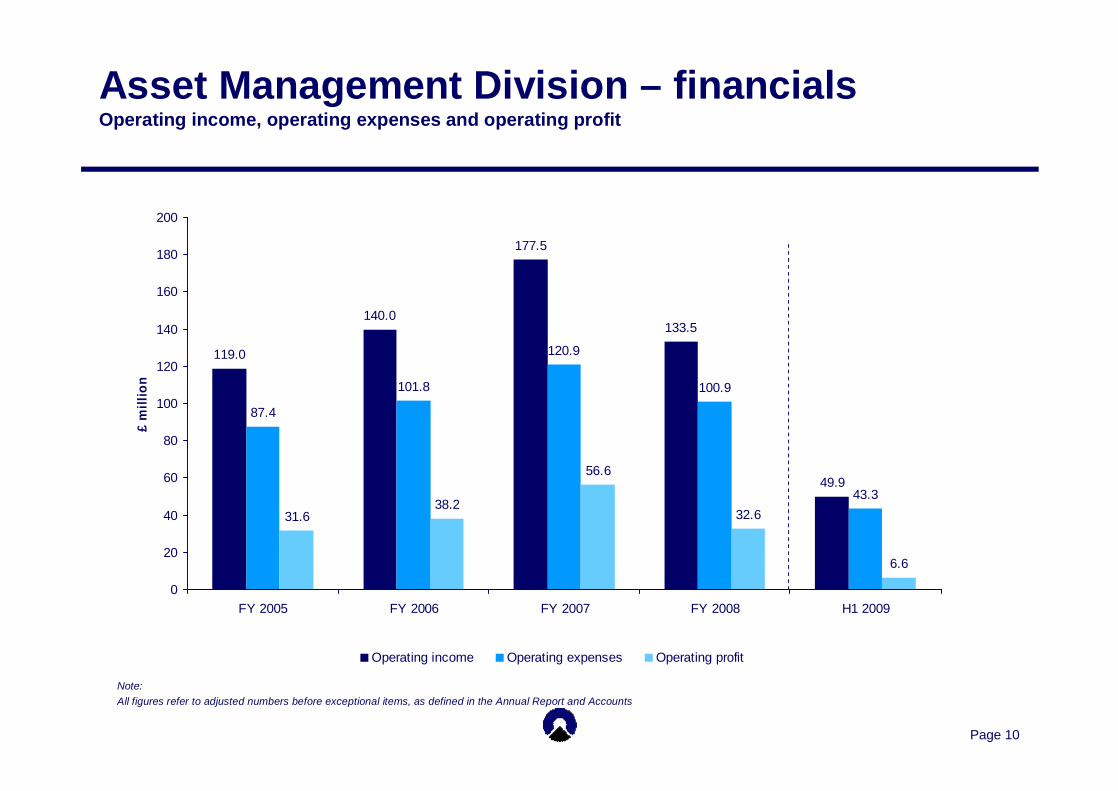
119.0
140.0
177.5
133.5
49.9
87.4
101.8
120.9
100.9
43.3
31.638.2
56.6
32.6
6.6
0
20
40
60
80
100
120
140
160
180
200
FY 2005 FY 2006 FY 2007 FY 2008 H1 2009
£ m
illio
n
Operating income Operating expenses Operating profit
Asset Management Division – financialsOperating income, operating expenses and operating profit
Note: All figures refer to adjusted numbers before exceptional items, as defined in the Annual Report and Accounts
Page 11
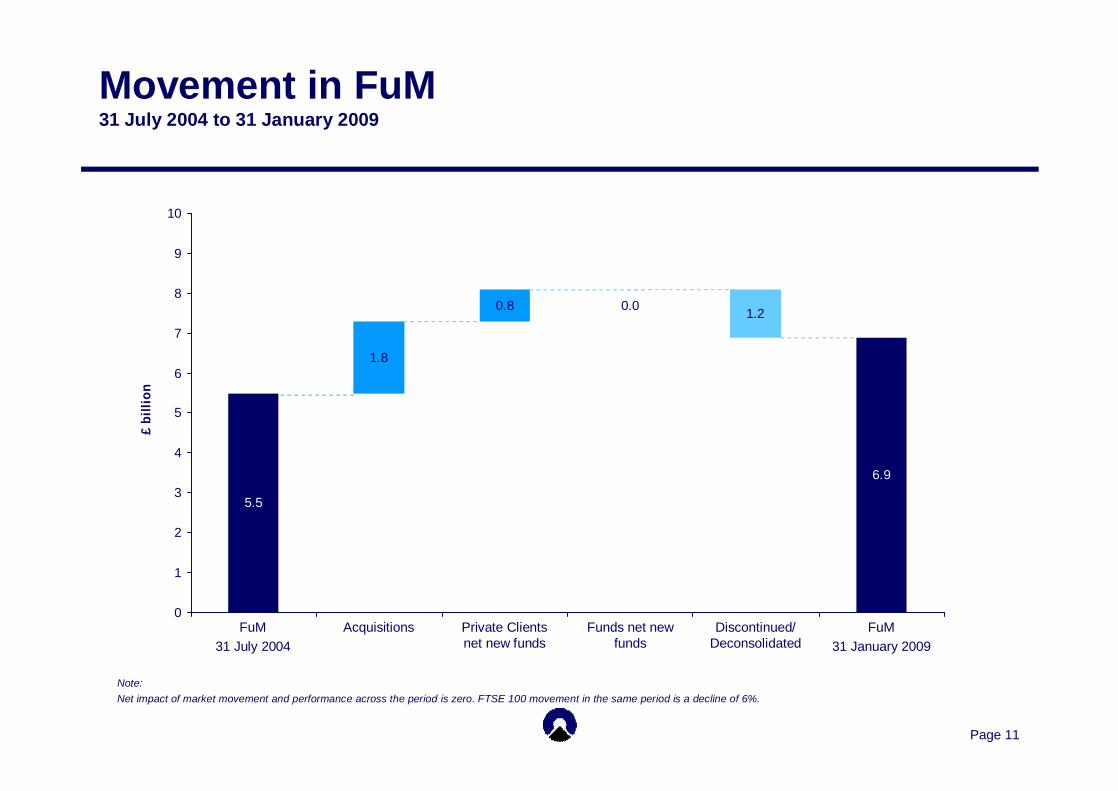
0.0
5.5
1.8
0.8 1.2
6.9
0
1
2
3
4
5
6
7
8
9
10
£ b
illio
n
Movement in FuM31 July 2004 to 31 January 2009
Discontinued/ Deconsolidated
FuM31 January 2009
Funds net new funds
Private Clients net new funds
AcquisitionsFuM31 July 2004
Note: Net impact of market movement and performance across the period is zero. FTSE 100 movement in the same period is a decline of 6%.
Page 12
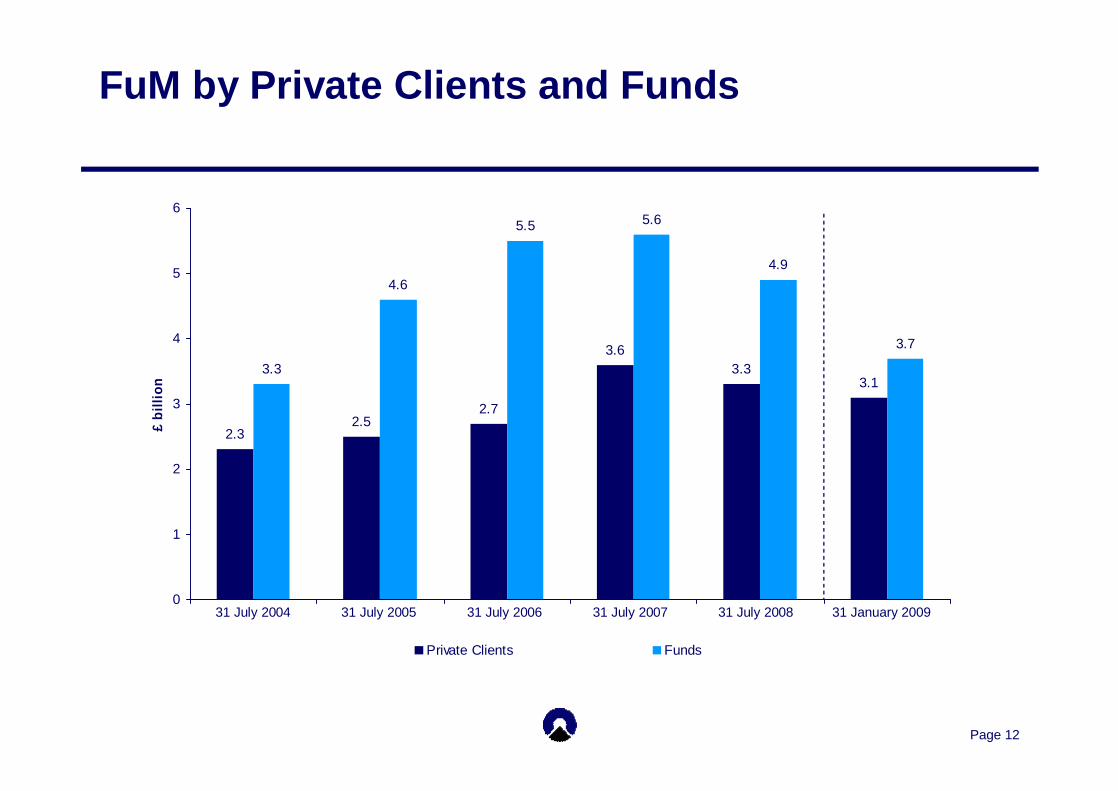
FuM by Private Clients and Funds
2.32.5
2.7
3.63.3
3.13.3
4.6
5.5 5.6
4.9
3.7
0
1
2
3
4
5
6
31 July 2004 31 July 2005 31 July 2006 31 July 2007 31 July 2008 31 January 200
£ bi
llion
Private Clients Funds
31 July 2007 31 January 200931 July 200831 July 200631 July 200531 July 2004
Page 13
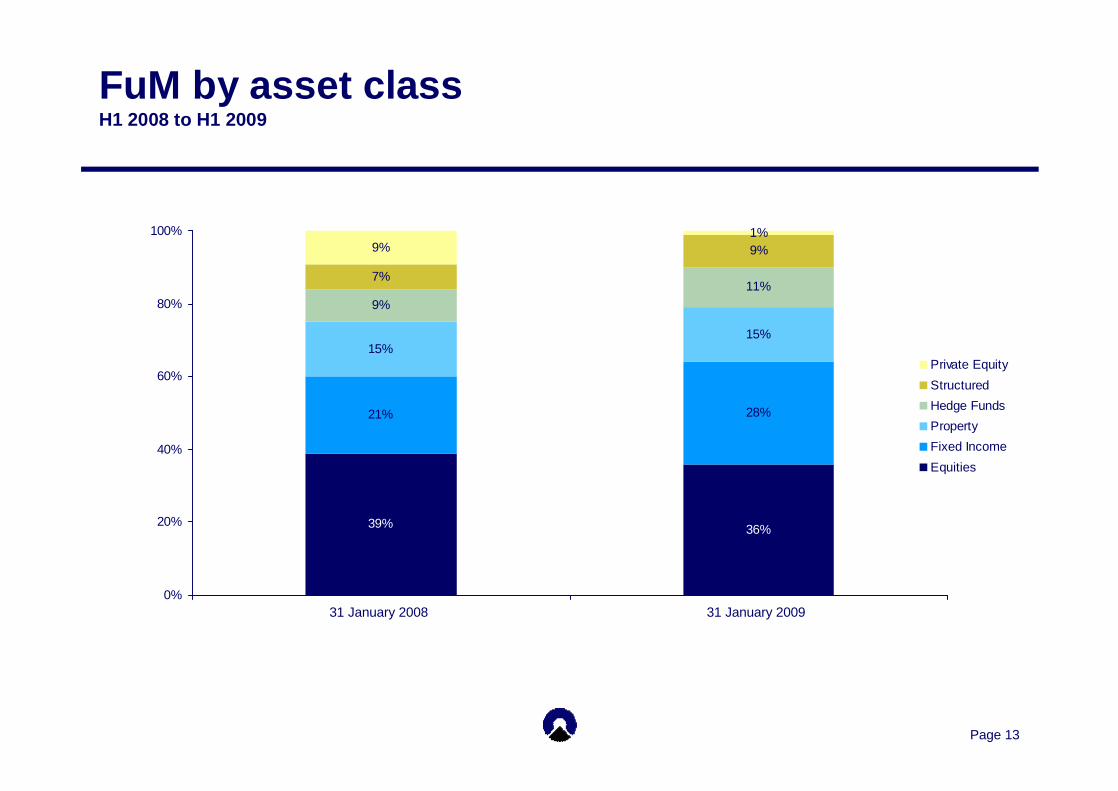
FuM by asset classH1 2008 to H1 2009
39% 36%
21% 28%
15%15%
9%11%
7%
9%9%1%
0%
20%
40%
60%
80%
100%
2008 2009
Private EquityStructuredHedge FundsPropertyFixed IncomeEquities
31 January 200931 January 2008
Page 14
Agenda
1. Introduction – Jonathan Howell, Group Finance Director
2. Presentation on Asset Management Division – Martin Andrew, Chief Executive Asset Management
• Overview
• Private Clients and Funds
• Banking and Administration
• Operational Efficiency
• Summary
3. Q&A
Page 15
Private Clients and FundsOverall themes
• Integration for efficiency, scalability and growth
• Primary focus on UK individual investors
• Dual channel distribution
• Secondary focus on institutions and international
• Primary focus on multi-asset “Managed Solutions”
• Secondary focus on specialist propositions
Page 16
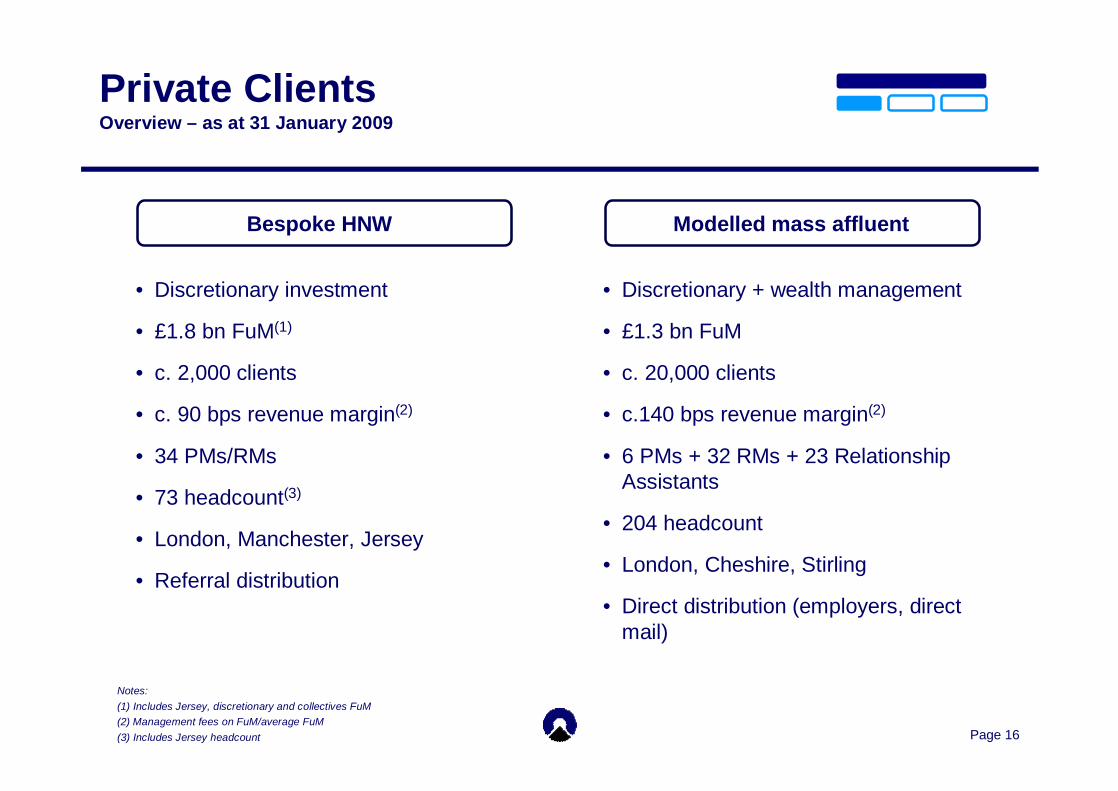
Private ClientsOverview – as at 31 January 2009
• Discretionary investment
• £1.8 bn FuM(1)
• c. 2,000 clients
• c. 90 bps revenue margin(2)
• 34 PMs/RMs
• 73 headcount(3)
• London, Manchester, Jersey
• Referral distribution
• Discretionary + wealth management
• £1.3 bn FuM
• c. 20,000 clients
• c.140 bps revenue margin(2)
• 6 PMs + 32 RMs + 23 Relationship Assistants
• 204 headcount
• London, Cheshire, Stirling
• Direct distribution (employers, direct mail)
Bespoke HNW Modelled mass affluent
Notes:(1) Includes Jersey, discretionary and collectives FuM(2) Management fees on FuM/average FuM(3) Includes Jersey headcount
Page 17
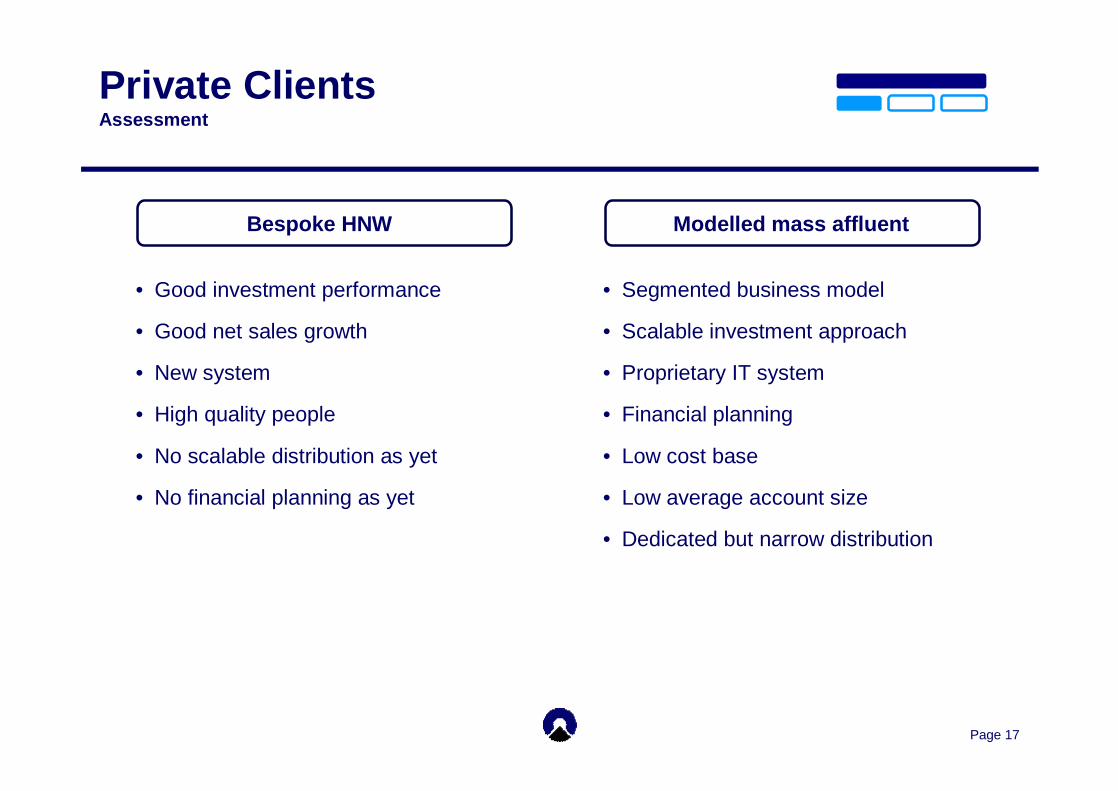
Private ClientsAssessment
• Good investment performance
• Good net sales growth
• New system
• High quality people
• No scalable distribution as yet
• No financial planning as yet
• Segmented business model
• Scalable investment approach
• Proprietary IT system
• Financial planning
• Low cost base
• Low average account size
• Dedicated but narrow distribution
Bespoke HNW Modelled mass affluent
Page 18
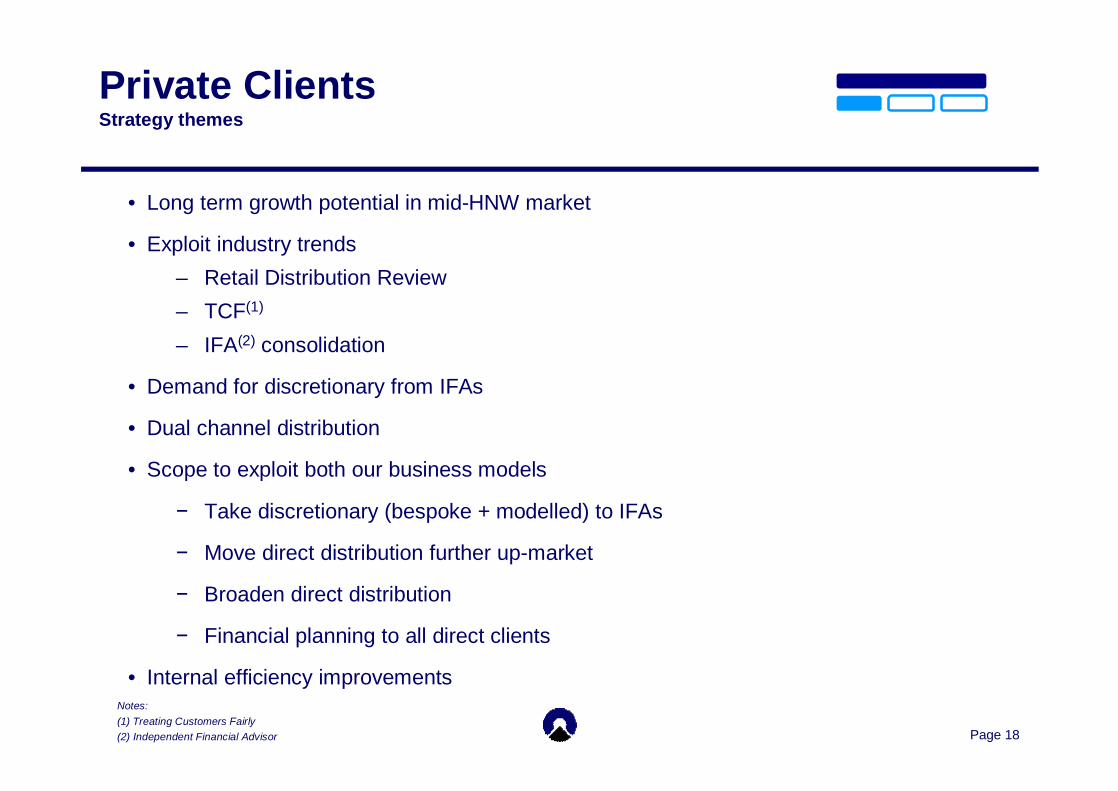
Private ClientsStrategy themes
• Long term growth potential in mid-HNW market
• Exploit industry trends– Retail Distribution Review – TCF(1)
– IFA(2) consolidation
• Demand for discretionary from IFAs
• Dual channel distribution
• Scope to exploit both our business models
− Take discretionary (bespoke + modelled) to IFAs
− Move direct distribution further up-market
− Broaden direct distribution
− Financial planning to all direct clients
• Internal efficiency improvementsNotes:(1) Treating Customers Fairly(2) Independent Financial Advisor

Page 19
Private ClientsBusiness model and Managed Solutions
Private Individuals£0.3 m – £3 m
Direct Intermediated
Close IFA
Bespoke Modelled
Discretionary Investment Propositions
Target market
Client acquisition and relationship management
Provider of advice and relationship manager
Consistent range of Managed Solutions
Page 20
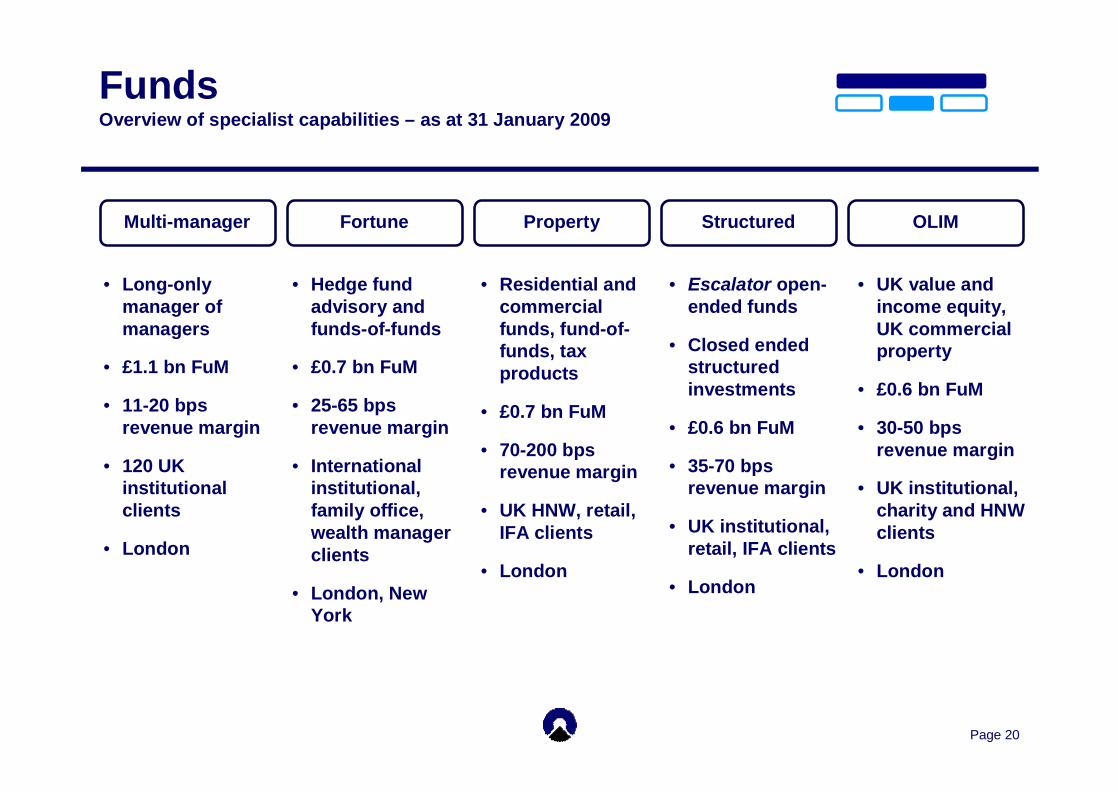
FundsOverview of specialist capabilities – as at 31 January 2009
• Long-only manager of managers
• £1.1 bn FuM
• 11-20 bps revenue margin
• 120 UK institutional clients
• London
Multi-manager
• UK value and income equity, UK commercial property
• £0.6 bn FuM
• 30-50 bps revenue margin
• UK institutional, charity and HNW clients
• London
OLIM
• Escalator open-ended funds
• Closed ended structured investments
• £0.6 bn FuM
• 35-70 bps revenue margin
• UK institutional, retail, IFA clients
• London
Structured
• Residential and commercial funds, fund-of-funds, tax products
• £0.7 bn FuM
• 70-200 bps revenue margin
• UK HNW, retail, IFA clients
• London
Property
• Hedge fund advisory and funds-of-funds
• £0.7 bn FuM
• 25-65 bps revenue margin
• International institutional, family office, wealth manager clients
• London, New York
Fortune
Page 21
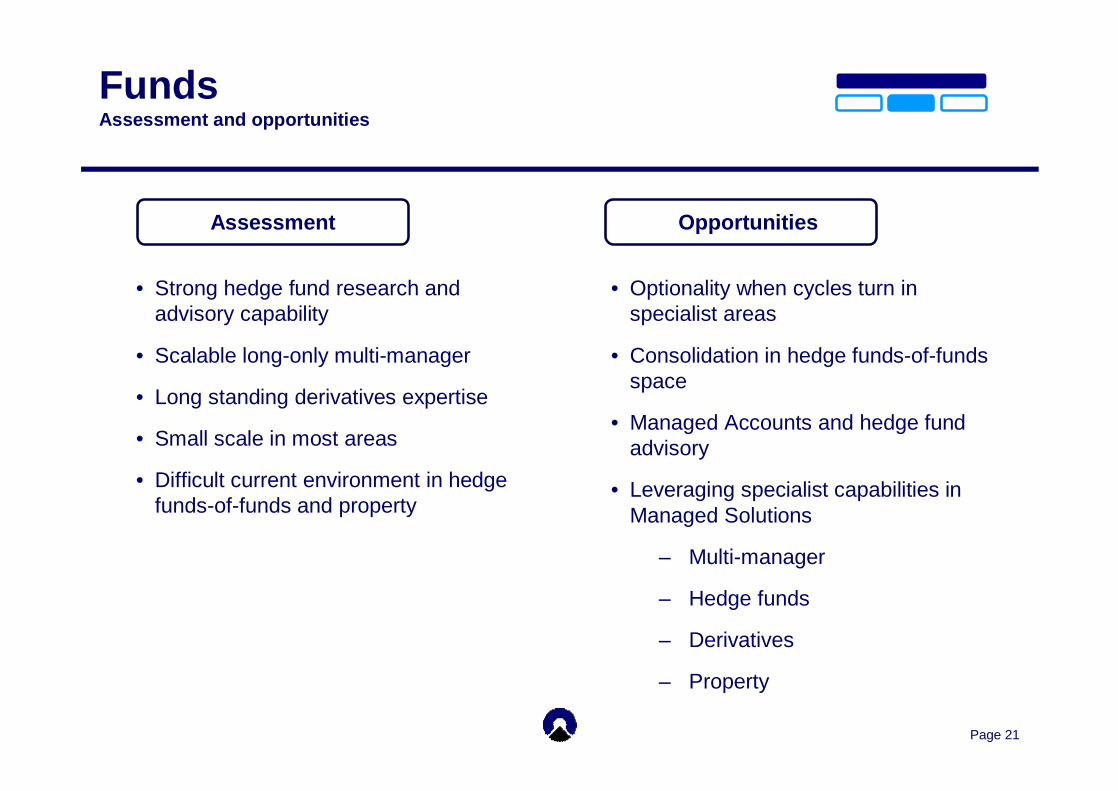
• Strong hedge fund research and advisory capability
• Scalable long-only multi-manager
• Long standing derivatives expertise
• Small scale in most areas
• Difficult current environment in hedge funds-of-funds and property
Assessment
FundsAssessment and opportunities
• Optionality when cycles turn in specialist areas
• Consolidation in hedge funds-of-funds space
• Managed Accounts and hedge fund advisory
• Leveraging specialist capabilities in Managed Solutions
– Multi-manager
– Hedge funds
– Derivatives
– Property
Opportunities
Page 22
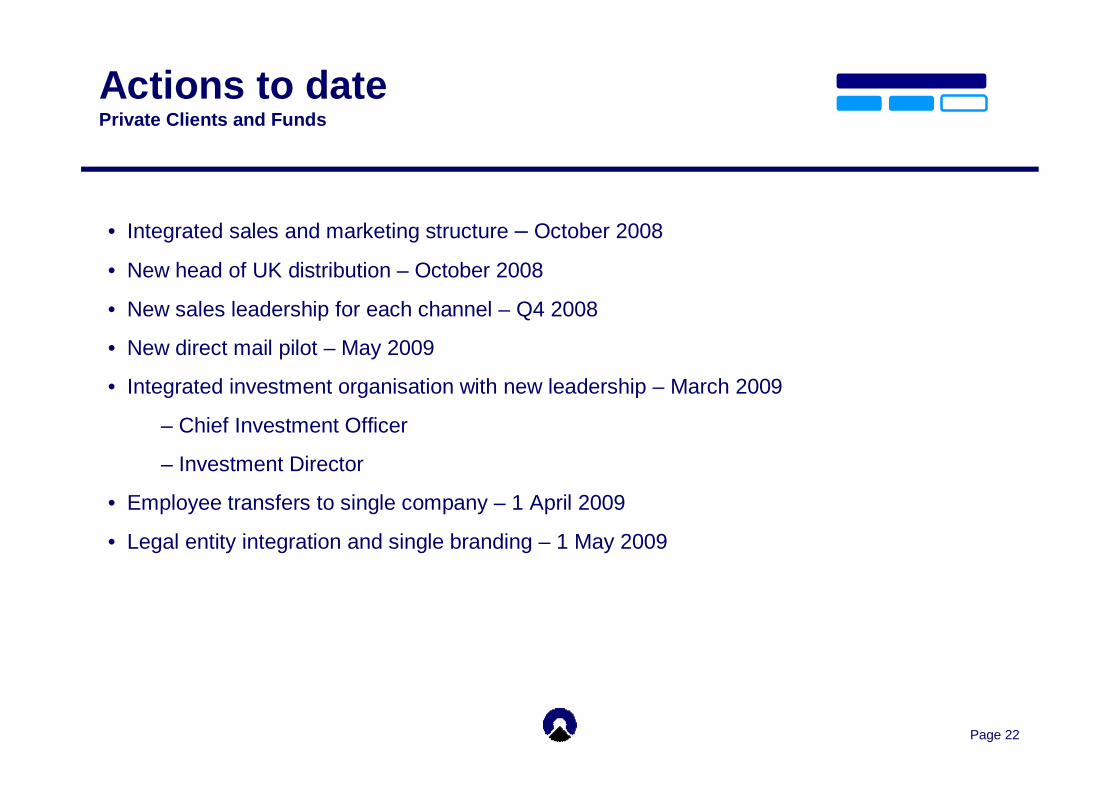
Actions to datePrivate Clients and Funds
• Integrated sales and marketing structure – October 2008
• New head of UK distribution – October 2008
• New sales leadership for each channel – Q4 2008
• New direct mail pilot – May 2009
• Integrated investment organisation with new leadership – March 2009
– Chief Investment Officer
– Investment Director
• Employee transfers to single company – 1 April 2009
• Legal entity integration and single branding – 1 May 2009
Page 23
Agenda
1. Introduction – Jonathan Howell, Group Finance Director
2. Presentation on Asset Management Division – Martin Andrew, Chief Executive Asset Management
• Overview
• Private Clients and Funds
• Banking and Administration
• Operational Efficiency
• Summary
3. Q&A
Page 24
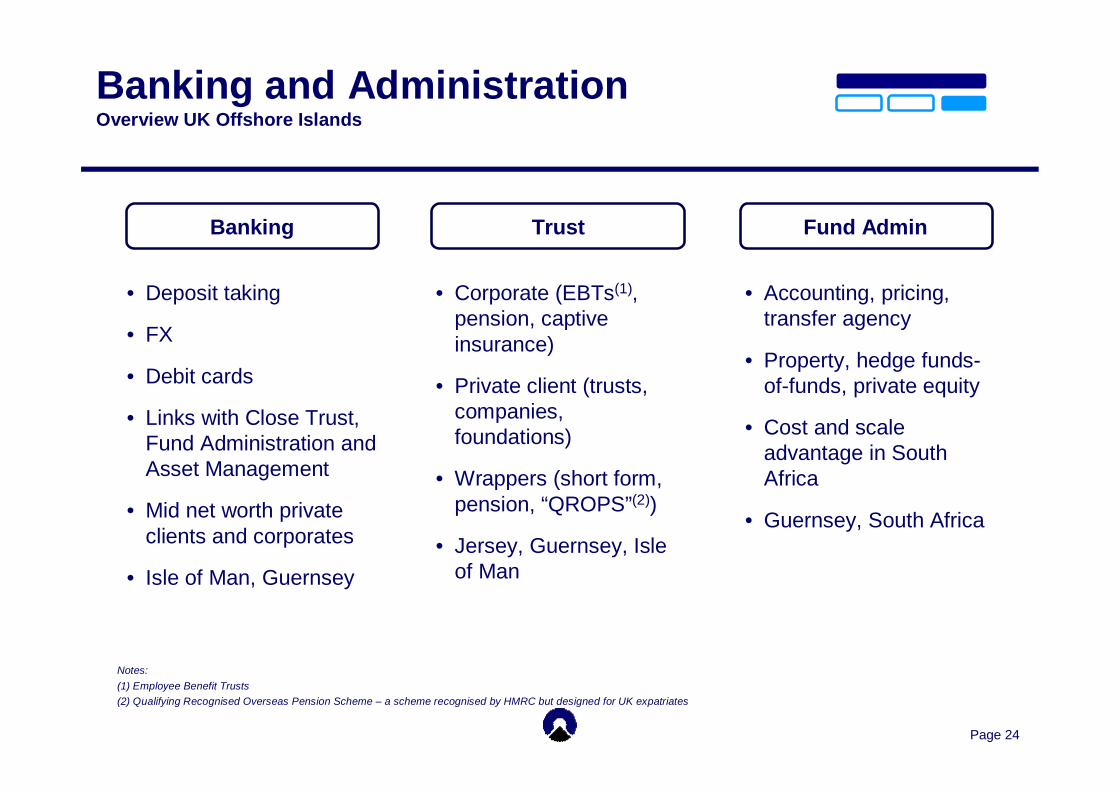
Banking and AdministrationOverview UK Offshore Islands
• Deposit taking
• FX
• Debit cards
• Links with Close Trust, Fund Administration and Asset Management
• Mid net worth private clients and corporates
• Isle of Man, Guernsey
Banking
• Accounting, pricing, transfer agency
• Property, hedge funds-of-funds, private equity
• Cost and scale advantage in South Africa
• Guernsey, South Africa
Fund Admin
• Corporate (EBTs(1), pension, captive insurance)
• Private client (trusts, companies, foundations)
• Wrappers (short form, pension, “QROPS”(2))
• Jersey, Guernsey, Isle of Man
Trust
Notes: (1) Employee Benefit Trusts(2) Qualifying Recognised Overseas Pension Scheme – a scheme recognised by HMRC but designed for UK expatriates

Page 25
Banking and AdministrationUK Offshore assessment and opportunities
• Links between businesses
• Revenue diversity
• Operational gearing in bank
• Fund administration capability in South Africa
• Uncertainty due to political rhetoric about offshore centres
• Market environment impact on fund administration
• Scalability in Trust
Assessment
• “QROPS(1)”
• “Manufacturing” in South Africa
• Fund administration consolidation
Opportunities
Note: (1) Qualifying Recognised Overseas Pension Scheme – a scheme recognised by HMRC but designed for UK expatriates
Page 26
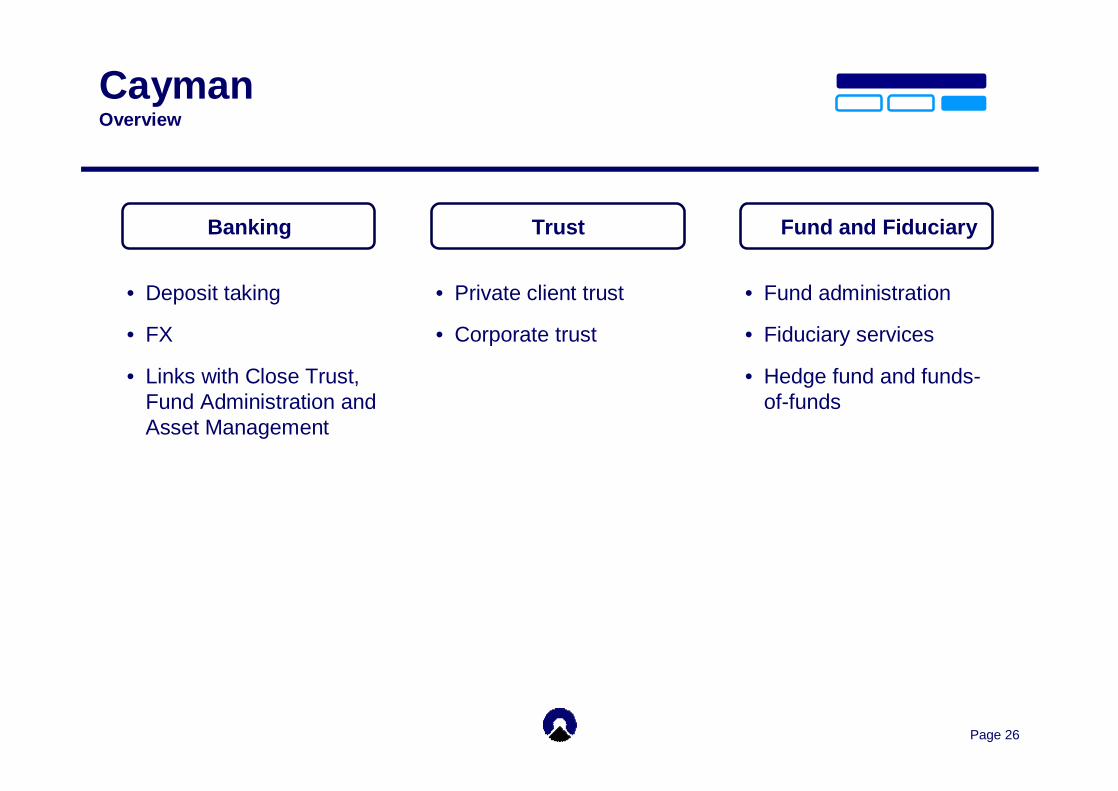
CaymanOverview
• Deposit taking
• FX
• Links with Close Trust, Fund Administration and Asset Management
Banking
• Fund administration
• Fiduciary services
• Hedge fund and funds-of-funds
Fund and Fiduciary
• Private client trust
• Corporate trust
Trust

Page 27
CaymanAssessment and opportunities
• Revenue diversity and low correlation to markets
• Acquisition record
• Uncertainty due to political rhetoric about offshore centres
• Hedge fund exposure
Assessment
• Further growth in core areas
• Latin America
Opportunities
Page 28
Agenda
1. Introduction – Jonathan Howell, Group Finance Director
2. Presentation on Asset Management Division – Martin Andrew, Chief Executive Asset Management
• Overview
• Private Clients and Funds
• Banking and Administration
• Operational Efficiency
• Summary
3. Q&A
Page 29
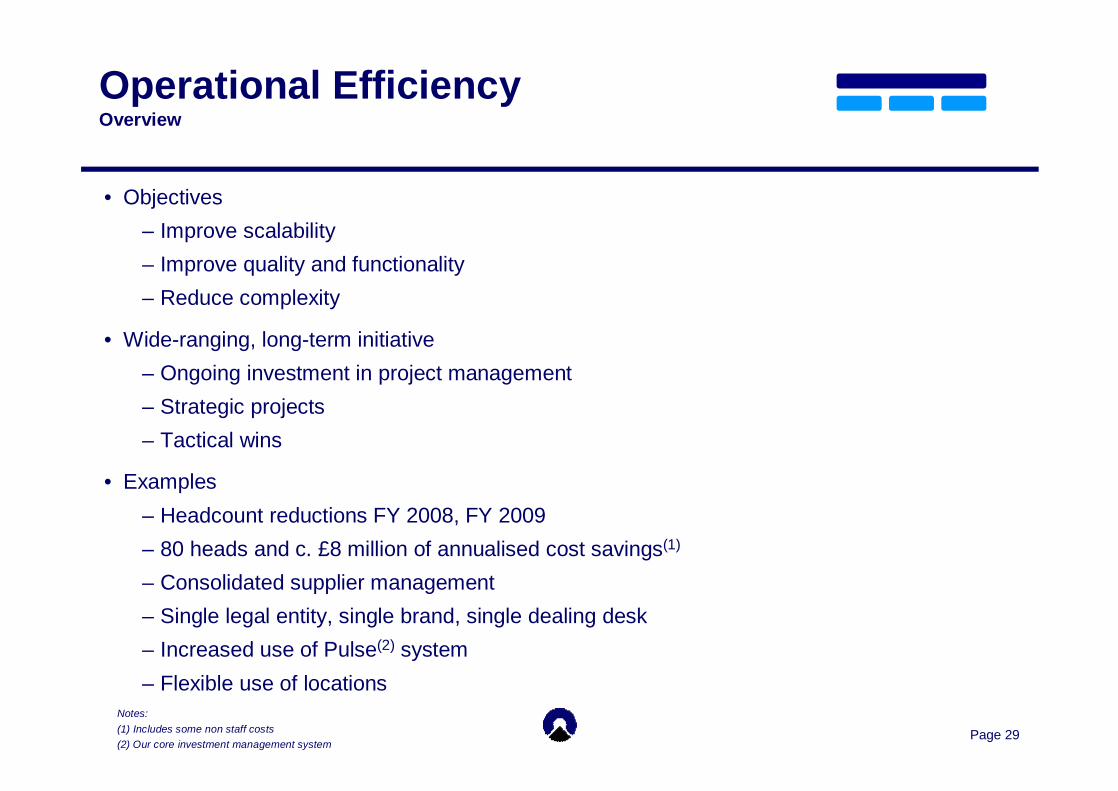
Operational EfficiencyOverview
• Objectives– Improve scalability– Improve quality and functionality– Reduce complexity
• Wide-ranging, long-term initiative– Ongoing investment in project management– Strategic projects– Tactical wins
• Examples– Headcount reductions FY 2008, FY 2009– 80 heads and c. £8 million of annualised cost savings(1)
– Consolidated supplier management– Single legal entity, single brand, single dealing desk– Increased use of Pulse(2) system– Flexible use of locations
Notes: (1) Includes some non staff costs(2) Our core investment management system
Page 30
Agenda
1. Introduction – Jonathan Howell, Group Finance Director
2. Presentation on Asset Management Division – Martin Andrew, Chief Executive Asset Management
• Overview
• Private Clients and Funds
• Banking and Administration
• Operational Efficiency
• Summary
3. Q&A
Page 31
Asset Management Division Summary
• 3 core areas representing blend of growth, stability and diversification
• Private Clients– Strong business position– Alignment to key changes in the industry– Scope to grow organically and inorganically
• Funds– Opportunistic development by acquisition– High-quality capabilities– Impact of current market environment– Optionality when cycle turns
• Banking and Administration– Resilient– Diversifier
Page 32
Agenda
1. Introduction – Jonathan Howell, Group Finance Director
2. Presentation on Asset Management Division – Martin Andrew, Chief Executive Asset Management
• Overview
• Private Clients and Funds
• Banking and Administration
• Operational Efficiency
• Summary
3. Q&A
Close Brothers Group
Asset Management Division
Presentation to Investors and Analysts
22 April 2009
Page 34
Appendix
• Fund performance summary
• Private client performance
• Senior management biographies
Page 35
Three year
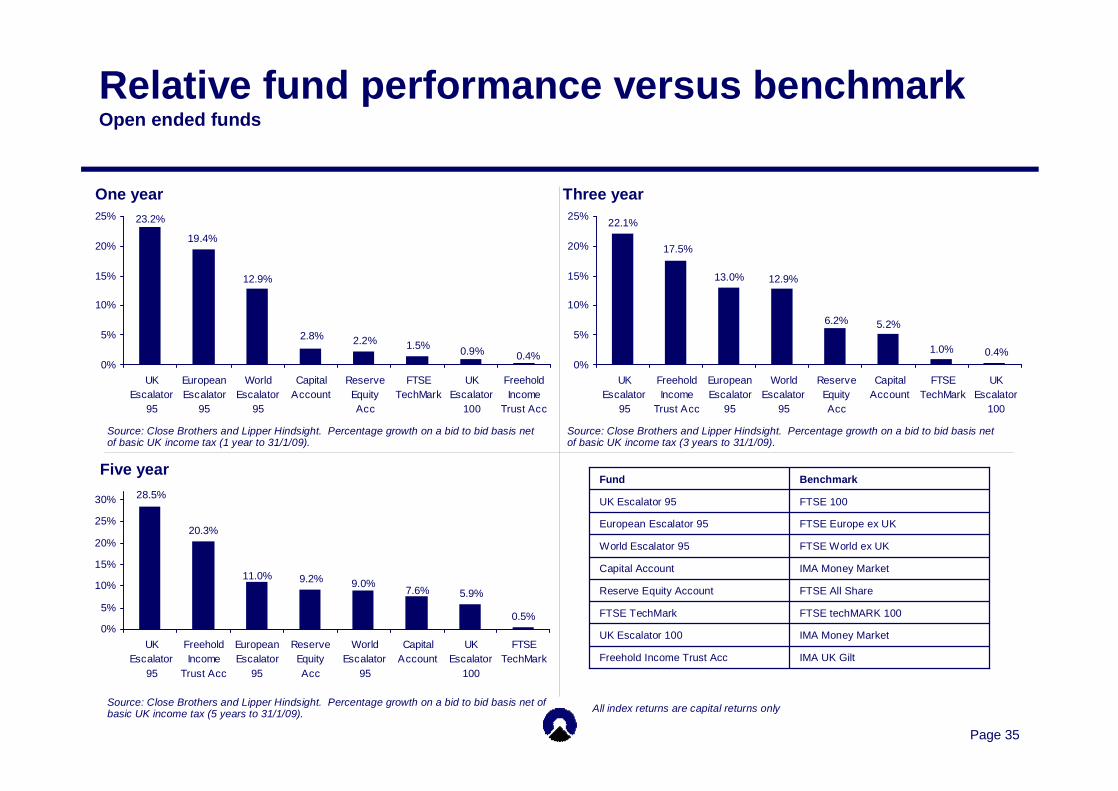
Relative fund performance versus benchmarkOpen ended funds
0.4%
2.8% 2.2% 1.5% 0.9%
12.9%
19.4%
23.2%
0%
5%
10%
15%
20%
25%
UKEscalator
95
EuropeanEscalator
95
WorldEscalator
95
CapitalAccount
ReserveEquityAcc
FTSETechMark
UKEscalator
100
FreeholdIncome
Trust Acc
0.5%
28.5%
20.3%
11.0%
5.9%7.6%9.0%9.2%
0%
5%
10%
15%
20%
25%
30%
UKEscalator
95
FreeholdIncome
Trust Acc
EuropeanEscalator
95
ReserveEquityAcc
WorldEscalator
95
CapitalAccount
UKEscalator
100
FTSETechMark
0.4%
22.1%
17.5%
13.0%
1.0%
5.2%6.2%
12.9%
0%
5%
10%
15%
20%
25%
UKEscalator
95
FreeholdIncome
Trust Acc
EuropeanEscalator
95
WorldEscalator
95
ReserveEquityAcc
CapitalAccount
FTSETechMark
UKEscalator
100
Five year
One year
Source: Close Brothers and Lipper Hindsight. Percentage growth on a bid to bid basis net of basic UK income tax (1 year to 31/1/09).
Source: Close Brothers and Lipper Hindsight. Percentage growth on a bid to bid basis net of basic UK income tax (3 years to 31/1/09).
Source: Close Brothers and Lipper Hindsight. Percentage growth on a bid to bid basis net of basic UK income tax (5 years to 31/1/09). All index returns are capital returns only
FTSE World ex UKWorld Escalator 95
FTSE Europe ex UKEuropean Escalator 95
FTSE 100UK Escalator 95
FTSE techMARK 100FTSE TechMark
FTSE All ShareReserve Equity Account
IMA UK GiltFreehold Income Trust Acc
IMA Money MarketUK Escalator 100
IMA Money MarketCapital Account
BenchmarkFund
Page 36
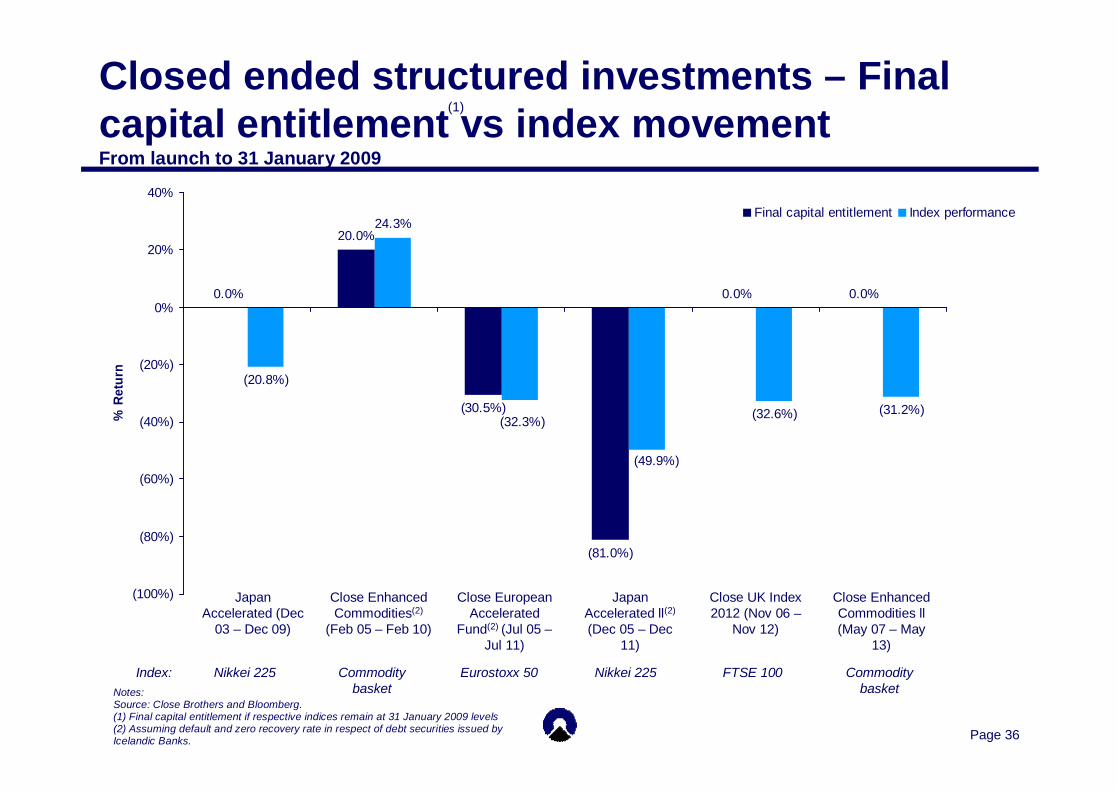
Closed ended structured investments – Final capital entitlement vs index movement From launch to 31 January 2009
0.0%
20.0%
(30.5%)
(81.0%)
0.0% 0.0%
(20.8%)
24.3%
(32.6%) (31.2%)
(49.9%)
(32.3%)
(100%)
(80%)
(60%)
(40%)
(20%)
0%
20%
40%
% R
etur
n
Final capital entitlement Index performance
Japan Accelerated ll(2)
(Dec 05 – Dec 11)
Close Enhanced Commodities ll(May 07 – May
13)
Close UK Index 2012 (Nov 06 –
Nov 12)
Close European Accelerated
Fund(2) (Jul 05 –Jul 11)
Close Enhanced Commodities(2)
(Feb 05 – Feb 10)
Japan Accelerated (Dec
03 – Dec 09)
Notes:Source: Close Brothers and Bloomberg. (1) Final capital entitlement if respective indices remain at 31 January 2009 levels(2) Assuming default and zero recovery rate in respect of debt securities issued by Icelandic Banks.
FTSE 100Eurostoxx 50 Commodity basket
Nikkei 225Commodity basket
Nikkei 225Index:
(1)
Page 37
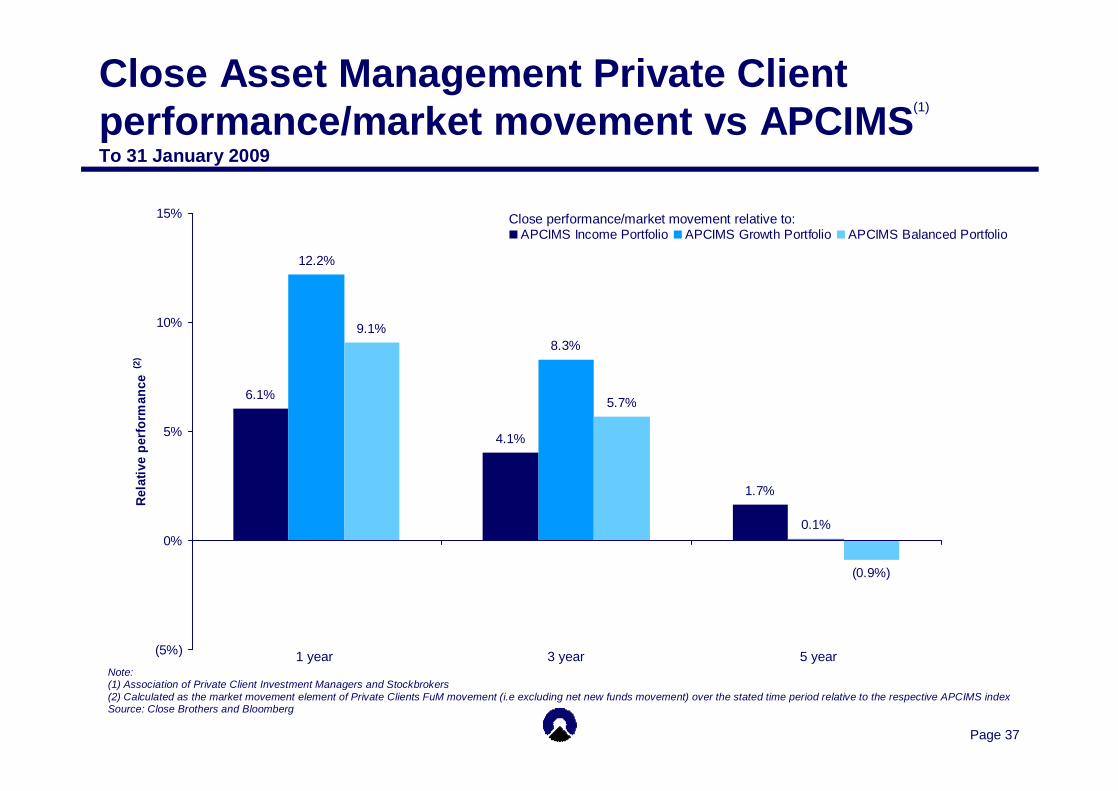
Close Asset Management Private Client performance/market movement vs APCIMS To 31 January 2009
6.1%
4.1%
1.7%
12.2%
8.3%
0.1%
9.1%
5.7%
(0.9%)
(5%)
0%
5%
10%
15%
Rela
tive
perf
orm
ance
(2)
APCIMS Income Portfolio APCIMS Growth Portfolio APCIMS Balanced Portfolio
5 year3 year1 yearNote:(1) Association of Private Client Investment Managers and Stockbrokers(2) Calculated as the market movement element of Private Clients FuM movement (i.e excluding net new funds movement) over the stated time period relative to the respective APCIMS indexSource: Close Brothers and Bloomberg
Close performance/market movement relative to:
(1)
Page 38
Asset Management – senior management experience• Martin Andrew CEO – Asset Management
- Joined from Merrill Lynch in 2005, originally as head of Private Clients business. Took over as Chief Executive of the division in 2008
• Andrew Henton – Head of UK Offshore- Joined Close Brothers in 2001 initially in a group principal investment role. Has held responsibility for the UK offshore businesses since 2004
• Julian Daly – Finance Director- Finance Director of the Asset Management division since 2000 and has line responsibility for the division’s Cayman businesses and OLIM
• Stuart Dyer – Head of UK Distribution- Joined Close Brothers in 2006 as head of the UK offshore fund administration and trust businesses. Appointed head of UK distribution in 2008
• Richard Curry – Chief Operating Officer- Joined as Head of Operations for Close Private Asset Management in 2006, becoming Chief Operating Officer for the Close Wealth Management Group in 2007
• Simon Hopkins – CEO Fortune- Established Fortune in 1996. Close Brothers Group plc acquired a controlling interest in 2006
• Nigel Ashfield – Head of Property- Joined Close Brothers in 2001. Appointed Managing Director of the Property team in January 2009
• Richard Killingbeck – Head of HNW- Joined Close Brothers in 2005. Was appointed as deputy Chief Executive Officer of Close Investments in 2006 and as Chief Executive Officer of Close Private Asset Management in 2008
• Mark Bray – Chief Investment Officer- Joined Close Brothers in 2004 with over 20 years of fund management experience including at Credit Suisse First Boston, Exane SA and Gerrard
• Adrian Swales – Investment Director- Joined Close Brothers as CEO of the Multi Manager business with the purchase of Aon Asset Management in 2007
Related Documents


![Untitled-1 [] news.pdf · bola voli futsal tenis meia kangmas & mbakyu pan brothers kangmas mbakyu pt. pan brothers group 2016 . pan brothers group olympic games 2016 pt. pan brothers](https://static.cupdf.com/doc/110x72/5a912f167f8b9af27f8e34c9/untitled-1-newspdfbola-voli-futsal-tenis-meia-kangmas-mbakyu-pan-brothers-kangmas.jpg)