Clinical applications of the functional connectome F. Xavier Castellanos a,b, ⁎, Adriana Di Martino a , R. Cameron Craddock b,c , Ashesh D. Mehta d , Michael P. Milham b,c, ⁎⁎ a Phyllis Green and Randolph Cowen Institute for Pediatric Neuroscience, New York University Child Study Center, New York, NY 10016, USA b Nathan Kline Institute for Psychiatric Research, Orangeburg, NY 10962, USA c Center for the Developing Brain, Child Mind Institute, New York, NY 10022, USA d Department of Neurosurgery, Hofstra North Shore LIJ School of Medicine and Feinstein Institute for Medical Research, Manhasset, NY 11030, USA abstract article info Article history: Accepted 20 April 2013 Available online 28 April 2013 Keywords: Validity Reliability Sensitivity Specificity Functional connectome Predictive modeling Central to the development of clinical applications of functional connectomics for neurology and psychiatry is the discovery and validation of biomarkers. Resting state fMRI (R-fMRI) is emerging as a mainstream approach for imaging-based biomarker identification, detecting variations in the functional connectome that can be attributed to clinical variables (e.g., diagnostic status). Despite growing enthusiasm, many chal- lenges remain. Here, we assess evidence of the readiness of R-fMRI based functional connectomics to lead to clinically meaningful biomarker identification through the lens of the criteria used to evaluate clinical tests (i.e., validity, reliability, sensitivity, specificity, and applicability). We focus on current R-fMRI-based prediction efforts, and survey R-fMRI used for neurosurgical planning. We identify gaps and needs for R-fMRI-based biomarker identification, highlighting the potential of emerging conceptual, analytical and cultural innovations (e.g., the Research Domain Criteria Project (RDoC), open science initiatives, and Big Data) to address them. Additionally, we note the need to expand future efforts beyond identification of biomarkers for disease status alone to include clinical variables related to risk, expected treatment response and prognosis. © 2013 Elsevier Inc. All rights reserved. Introduction As well documented in this issue, mapping the functional connectome is now in the foreground of neuroscience research, with a frequently enunciated goal of attaining clinical utility. Indeed, the rate of growth for studies incorporating resting state fMRI (R-fMRI) approaches has overtaken that of traditional task-based fMRI (Snyder and Raichle, 2012), with an increasing focus on clinical questions (Kelly et al., 2012). Despite the multiple advantages that attach to R-fMRI approaches vis-à-vis clinical samples (Fox and Greicius, 2010), progress towards advancing the clinical enterprise has been disappointingly slow. This situation was recently analyzed in the wider context of clinical neuroscience (Kapur et al., 2012) and the lessons drawn are particularly germane to R-fMRI and efforts to map the functional connectome. In this selective overview, we focus on R-fMRI because its relatively widespread availability and amenability to large-scale aggregation across imaging centers and populations (Milham, 2012) make possible attaining data sets on scales comparable to genetic investigations (e.g., Cross-Disorder Group of the Psychiatric Genomics Consortium, 2013). We examine common elements that need to be considered to make the efforts of mapping the functional connectome relevant to clinicians. These include validity, reliability, sensitivity, specificity, positive and negative predictive values of potential biomarkers. Beyond these, our rudimentary knowledge of brain disorders also requires that we adopt intermediate strategies, as recommended by Kapur et al. (2012). We will assess the evidence and gaps in relation to validity, reliability, sensitivity and specificity of efforts to map the functional connectome using R-fMRI, primarily in the context of diagnostic prediction studies. We also examine the nascent literature applying R-fMRI methods for neurosurgical planning, as this best exemplifies person-centered clinical applications. Biomarkers Central to the development of clinical applications with R-fMRI is the discovery and validation of biomarkers. The NIH Biomarkers Definitions Working Group defined a biomarker as “a characteristic that is objectively measured and evaluated as an indicator of normal NeuroImage 80 (2013) 527–540 ⁎ Correspondence to: F.X. Castellanos, Department of Child and Adolescent Psychiatry, NYU Langone Medical Center, One Park Avenue, 7th Floor, New York, NY 10016, USA. Fax: +1 646 754 5211. ⁎⁎ Correspondence to: M.P. Milham, Center for the Developing Brain, Child Mind In- stitute, 445 Park Avenue, New York, NY 10022, USA. Fax: +1 646 625 4371. E-mail addresses: [email protected] (F.X. Castellanos), [email protected] (M.P. Milham). 1053-8119/$ – see front matter © 2013 Elsevier Inc. All rights reserved. http://dx.doi.org/10.1016/j.neuroimage.2013.04.083 Contents lists available at SciVerse ScienceDirect NeuroImage journal homepage: www.elsevier.com/locate/ynimg

Welcome message from author
This document is posted to help you gain knowledge. Please leave a comment to let me know what you think about it! Share it to your friends and learn new things together.
Transcript

NeuroImage 80 (2013) 527–540
Contents lists available at SciVerse ScienceDirect
NeuroImage
j ourna l homepage: www.e lsev ie r .com/ locate /yn img
Clinical applications of the functional connectome
F. Xavier Castellanos a,b,⁎, Adriana Di Martino a, R. Cameron Craddock b,c,Ashesh D. Mehta d, Michael P. Milham b,c,⁎⁎a Phyllis Green and Randolph Cowen Institute for Pediatric Neuroscience, New York University Child Study Center, New York, NY 10016, USAb Nathan Kline Institute for Psychiatric Research, Orangeburg, NY 10962, USAc Center for the Developing Brain, Child Mind Institute, New York, NY 10022, USAd Department of Neurosurgery, Hofstra North Shore LIJ School of Medicine and Feinstein Institute for Medical Research, Manhasset, NY 11030, USA
⁎ Correspondence to: F.X. Castellanos, Department of CNYU LangoneMedical Center, One Park Avenue, 7th Floor,+1 646 754 5211.⁎⁎ Correspondence to: M.P. Milham, Center for the Destitute, 445 Park Avenue, New York, NY 10022, USA. Fa
E-mail addresses: [email protected]@childmind.org (M.P. Milham).
1053-8119/$ – see front matter © 2013 Elsevier Inc. Allhttp://dx.doi.org/10.1016/j.neuroimage.2013.04.083
a b s t r a c t
a r t i c l e i n f oArticle history:Accepted 20 April 2013Available online 28 April 2013
Keywords:ValidityReliabilitySensitivitySpecificityFunctional connectomePredictive modeling
Central to the development of clinical applications of functional connectomics for neurology and psychiatry isthe discovery and validation of biomarkers. Resting state fMRI (R-fMRI) is emerging as a mainstreamapproach for imaging-based biomarker identification, detecting variations in the functional connectomethat can be attributed to clinical variables (e.g., diagnostic status). Despite growing enthusiasm, many chal-lenges remain. Here, we assess evidence of the readiness of R-fMRI based functional connectomics to leadto clinically meaningful biomarker identification through the lens of the criteria used to evaluate clinicaltests (i.e., validity, reliability, sensitivity, specificity, and applicability). We focus on current R-fMRI-basedprediction efforts, and survey R-fMRI used for neurosurgical planning. We identify gaps and needs forR-fMRI-based biomarker identification, highlighting the potential of emerging conceptual, analytical andcultural innovations (e.g., the Research Domain Criteria Project (RDoC), open science initiatives, and Big Data)to address them. Additionally, we note the need to expand future efforts beyond identification of biomarkersfor disease status alone to include clinical variables related to risk, expected treatment response and prognosis.
© 2013 Elsevier Inc. All rights reserved.
Introduction
As well documented in this issue, mapping the functionalconnectome is now in the foreground of neuroscience research,with a frequently enunciated goal of attaining clinical utility. Indeed,the rate of growth for studies incorporating resting state fMRI(R-fMRI) approaches has overtaken that of traditional task-basedfMRI (Snyder and Raichle, 2012), with an increasing focus on clinicalquestions (Kelly et al., 2012). Despite the multiple advantages thatattach to R-fMRI approaches vis-à-vis clinical samples (Fox andGreicius, 2010), progress towards advancing the clinical enterprisehas been disappointingly slow. This situation was recently analyzedin the wider context of clinical neuroscience (Kapur et al., 2012)and the lessons drawn are particularly germane to R-fMRI and effortsto map the functional connectome.
hild and Adolescent Psychiatry,New York, NY 10016, USA. Fax:
veloping Brain, Child Mind In-x: +1 646 625 4371.(F.X. Castellanos),
rights reserved.
In this selective overview, we focus on R-fMRI because its relativelywidespread availability and amenability to large-scale aggregationacross imaging centers and populations (Milham, 2012) make possibleattaining data sets on scales comparable to genetic investigations(e.g., Cross-Disorder Group of the Psychiatric Genomics Consortium,2013). We examine common elements that need to be considered tomake the efforts of mapping the functional connectome relevant toclinicians. These include validity, reliability, sensitivity, specificity,positive and negative predictive values of potential biomarkers. Beyondthese, our rudimentary knowledge of brain disorders also requires thatwe adopt intermediate strategies, as recommended by Kapur et al.(2012).
Wewill assess the evidence and gaps in relation to validity, reliability,sensitivity and specificity of efforts to map the functional connectomeusing R-fMRI, primarily in the context of diagnostic prediction studies.We also examine the nascent literature applying R-fMRI methods forneurosurgical planning, as this best exemplifies person-centered clinicalapplications.
Biomarkers
Central to the development of clinical applications with R-fMRI isthe discovery and validation of biomarkers. The NIH BiomarkersDefinitions Working Group defined a biomarker as “a characteristicthat is objectively measured and evaluated as an indicator of normal

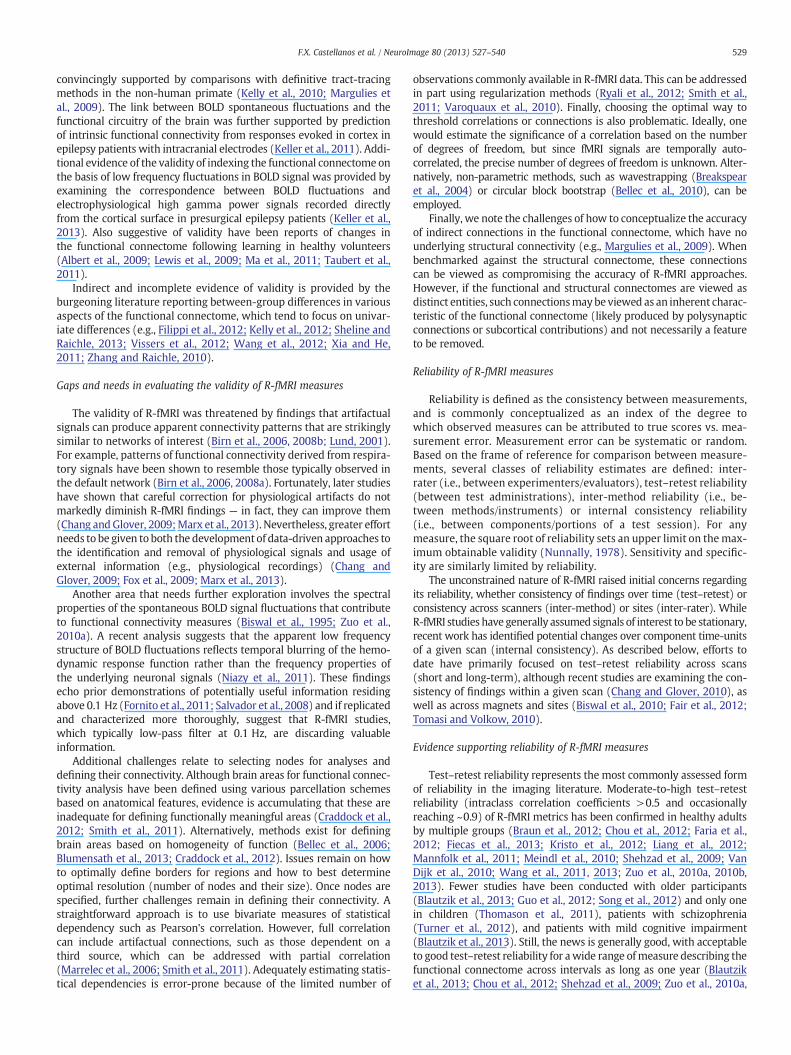
0.0 0.2 0.4 0.6 0.8 1.0
0.5
0.6
0.7
0.8
0.9
1.0
1-Specificity
Sen
sitiv
ity
ROC for a range of Cohen's d values
d = 1.5, AUC = 0.85d = 2, AUC = 0.915d = 2.5, AUC = 0.955d = 3, AUC = 0.978
Fig. 1. Receiver operating characteristic (ROC) curves for between-group differenceswith a range of large effect sizes.
528 F.X. Castellanos et al. / NeuroImage 80 (2013) 527–540
biological processes, pathogenic processes, or pharmacologic responsesto a therapeutic intervention” (Atkinson et al., 2001). The WorkingGroup noted that potential clinical applications of biomarkers include:1) determination of the presence or absence of a disease (i.e., diagnosis),2) staging of a disease, 3) determination of risk prognosis, or 4) predic-tion and monitoring of clinical response to an intervention.
However, enthusiasm regarding biomarker discovery has led tosome misconceptions. First, biomarkers are associative by definition,but not necessarily causal. They can directly or indirectly index diseaseprocesses anywhere along the disease pathway. Second, they do notnecessarily convey neuroscientific meaning; brain-related biomarkerscan index any single feature or combination of features relating tobrain physiology or anatomy. Thus, they may not be interpretablebased on our current understanding. As discussed in the section onSensitivity and specificity of R-fMRI measures in the context of predic-tive modeling, the potential high-dimensionality of feature sets usedfor prediction, and non-linearity commonly introduced into predictivemodeling techniques mean that the biological meaning of a biomarkermay not be straightforwardly discoverable. Finally, identifying a signif-icant association between some feature (or combination of features)and a clinical variable does not equal discovery of a clinically usefulbiomarker. As is apparent from Fig. 1, even relationships with largeeffect sizes have modest predictive value when the ultimate intent isdisease prediction or clinical monitoring. Thus, the elusive goalcontinues to be to “carve nature at the joints,” as famously enunciatedby Thomas Huxley, so as to obtain sufficiently large effect sizes.
Elements of clinically useful tests
Determination of clinical utility depends at a minimum on thefollowing properties:
■ Validity (accuracy): the extent to which a measure captures the“true” value; generally computed bymeasuring agreement betweentwo measures obtained bymaximally different methods
■ Reliability (precision): the consistency with which repeated mea-sures assess a given trait; computed by measuring agreementbetween two measures obtained by the same or maximally similarmethods
■ Sensitivity: ability to correctly identify affected individuals■ Specificity: ability to correctly exclude unaffected individuals
While validity and reliability can be considered independently ofthe disease to which the clinical tool will be applied, sensitivity andspecificity are directly determined by the intended application. Thereis no established cutoff for determining utility based on sensitivity orspecificity; rather, utility derives from a combination of the intent andthe implications of positive findings. For example, screening tools aimto rule in all affected individuals (high sensitivity), at the cost of beingoverly inclusive (low specificity). This bias must be considered in lightof the potential harm that can result from follow-up procedures aftera positive screening result. In contrast, for diagnostic tests, greatervalue is put on arriving at a correct diagnosis (high specificity) at thecost of being less inclusive (lower sensitivity). Similar tradeoffs are en-counteredwhen clinical tools are used to assess andmonitor disease se-verity, as sufficient sensitivity must be achieved to detect changes indisease severity, while maintaining adequate specificity to avoidconfounding by artifactual factors or physiologic processes.
Additional features for successfully developing a clinical tool includewidespread availability, repeatability with low risk of harm and beingeasily administered to both non-clinical and clinical populations. MRIbased methods are widely available and can be repeated withoutknown evidence of harm. In terms of ease of administration, MRI isintermediate between electroencephalography and radioligand-basedmethods, which are much less spatially localizing, on one hand, andinvasive, on the other.
Validity of R-fMRI measures
A key challenge for neuroimaging methods is establishing validityor accuracy of our measures, i.e., are we measuring what we think weare (e.g., Sechrest, 2005)? Validity can be differentiated based on thestrength of the evidence. At one end, criterion validity compares themeasure of interest to an independent measure designated as thecriterion or “gold standard” measurement. While structural imagingcan reference dissection- and histology-based findings as gold-standards, R-fMRI lacks a gold standard. In theory, intracranial record-ings should provide such an anchor, but their utility is limited by theirinvasive nature. Encouragingly, initial efforts to validate R-fMRI usingintracranial approaches such as electrocorticography and cortico-cortical evoked potentials have demonstrated good correspondencewith R-fMRI results (He et al., 2008; Keller et al., 2011). At the otherextreme is face validity, in which findings are simply consistent with“common sense” expectations. Initial R-fMRI studies only aspired toface validity, as they were limited in focus (e.g., to the motor system).As the field has matured, more R-fMRI measures are attaining constructvalidity, defined as ability to accuratelymeasure the construct of interest(Cronbach and Meehl, 1955). For example, the biological relevance offunctional connectivity has been buttressed by demonstrations that itresponds to surgical intervention (Johnston et al., 2008; Pawela et al.,2010) and varies with levels of consciousness (Noirhomme et al.,2010). The consistency of R-fMRI findings across neural systems withour knowledge of human brain architecture and with findings fromother imaging modalities confirms that construct validity is oftenbeing attained, as briefly reviewed below.
Evidence supporting validity of R-fMRI measures
The popularity of R-fMRI functional connectivity has been spurredby the close correspondence between the statistical maps resultingfrom R-fMRI analyses and task-based fMRI coactivations (Biswalet al., 1995; Damoiseaux et al., 2006; Mennes et al., 2010, 2013;Smith et al., 2009). Particularly convincing are data-driven (e.g., inde-pendent component analysis-based) demonstrations of spatially inde-pendent intrinsic connectivity networks corresponding to thosepreviously established by neuropsychological and task-based imagingstudies (Beckmann et al., 2005; Damoiseaux et al., 2006; Filippiniet al., 2009; Fox et al., 2006). The conclusion that patterns of synchronyin spontaneous fluctuations of blood oxygen level dependent (BOLD)signals delineate functional brain circuits that are at least partiallyunderpinned by anatomically definable tracts has been most
529F.X. Castellanos et al. / NeuroImage 80 (2013) 527–540
convincingly supported by comparisons with definitive tract-tracingmethods in the non-human primate (Kelly et al., 2010; Margulies etal., 2009). The link between BOLD spontaneous fluctuations and thefunctional circuitry of the brain was further supported by predictionof intrinsic functional connectivity from responses evoked in cortex inepilepsy patients with intracranial electrodes (Keller et al., 2011). Addi-tional evidence of the validity of indexing the functional connectome onthe basis of low frequency fluctuations in BOLD signal was provided byexamining the correspondence between BOLD fluctuations andelectrophysiological high gamma power signals recorded directlyfrom the cortical surface in presurgical epilepsy patients (Keller et al.,2013). Also suggestive of validity have been reports of changes inthe functional connectome following learning in healthy volunteers(Albert et al., 2009; Lewis et al., 2009; Ma et al., 2011; Taubert et al.,2011).
Indirect and incomplete evidence of validity is provided by theburgeoning literature reporting between-group differences in variousaspects of the functional connectome, which tend to focus on univar-iate differences (e.g., Filippi et al., 2012; Kelly et al., 2012; Sheline andRaichle, 2013; Vissers et al., 2012; Wang et al., 2012; Xia and He,2011; Zhang and Raichle, 2010).
Gaps and needs in evaluating the validity of R-fMRI measures
The validity of R-fMRI was threatened by findings that artifactualsignals can produce apparent connectivity patterns that are strikinglysimilar to networks of interest (Birn et al., 2006, 2008b; Lund, 2001).For example, patterns of functional connectivity derived from respira-tory signals have been shown to resemble those typically observed inthe default network (Birn et al., 2006, 2008a). Fortunately, later studieshave shown that careful correction for physiological artifacts do notmarkedly diminish R-fMRI findings — in fact, they can improve them(Chang andGlover, 2009;Marx et al., 2013). Nevertheless, greater effortneeds to be given to both the development of data-driven approaches tothe identification and removal of physiological signals and usage ofexternal information (e.g., physiological recordings) (Chang andGlover, 2009; Fox et al., 2009; Marx et al., 2013).
Another area that needs further exploration involves the spectralproperties of the spontaneous BOLD signal fluctuations that contributeto functional connectivity measures (Biswal et al., 1995; Zuo et al.,2010a). A recent analysis suggests that the apparent low frequencystructure of BOLD fluctuations reflects temporal blurring of the hemo-dynamic response function rather than the frequency properties ofthe underlying neuronal signals (Niazy et al., 2011). These findingsecho prior demonstrations of potentially useful information residingabove 0.1 Hz (Fornito et al., 2011; Salvador et al., 2008) and if replicatedand characterized more thoroughly, suggest that R-fMRI studies,which typically low-pass filter at 0.1 Hz, are discarding valuableinformation.
Additional challenges relate to selecting nodes for analyses anddefining their connectivity. Although brain areas for functional connec-tivity analysis have been defined using various parcellation schemesbased on anatomical features, evidence is accumulating that these areinadequate for defining functionally meaningful areas (Craddock et al.,2012; Smith et al., 2011). Alternatively, methods exist for definingbrain areas based on homogeneity of function (Bellec et al., 2006;Blumensath et al., 2013; Craddock et al., 2012). Issues remain on howto optimally define borders for regions and how to best determineoptimal resolution (number of nodes and their size). Once nodes arespecified, further challenges remain in defining their connectivity. Astraightforward approach is to use bivariate measures of statisticaldependency such as Pearson's correlation. However, full correlationcan include artifactual connections, such as those dependent on athird source, which can be addressed with partial correlation(Marrelec et al., 2006; Smith et al., 2011). Adequately estimating statis-tical dependencies is error-prone because of the limited number of
observations commonly available in R-fMRI data. This can be addressedin part using regularization methods (Ryali et al., 2012; Smith et al.,2011; Varoquaux et al., 2010). Finally, choosing the optimal way tothreshold correlations or connections is also problematic. Ideally, onewould estimate the significance of a correlation based on the numberof degrees of freedom, but since fMRI signals are temporally auto-correlated, the precise number of degrees of freedom is unknown. Alter-natively, non-parametric methods, such as wavestrapping (Breakspearet al., 2004) or circular block bootstrap (Bellec et al., 2010), can beemployed.
Finally, we note the challenges of how to conceptualize the accuracyof indirect connections in the functional connectome, which have nounderlying structural connectivity (e.g., Margulies et al., 2009). Whenbenchmarked against the structural connectome, these connectionscan be viewed as compromising the accuracy of R-fMRI approaches.However, if the functional and structural connectomes are viewed asdistinct entities, such connectionsmaybe viewed as an inherent charac-teristic of the functional connectome (likely produced by polysynapticconnections or subcortical contributions) and not necessarily a featureto be removed.
Reliability of R-fMRI measures
Reliability is defined as the consistency between measurements,and is commonly conceptualized as an index of the degree towhich observed measures can be attributed to true scores vs. mea-surement error. Measurement error can be systematic or random.Based on the frame of reference for comparison between measure-ments, several classes of reliability estimates are defined: inter-rater (i.e., between experimenters/evaluators), test–retest reliability(between test administrations), inter-method reliability (i.e., be-tween methods/instruments) or internal consistency reliability(i.e., between components/portions of a test session). For anymeasure, the square root of reliability sets an upper limit on themax-imum obtainable validity (Nunnally, 1978). Sensitivity and specific-ity are similarly limited by reliability.
The unconstrained nature of R-fMRI raised initial concerns regardingits reliability, whether consistency of findings over time (test–retest) orconsistency across scanners (inter-method) or sites (inter-rater). WhileR-fMRI studies have generally assumed signals of interest to be stationary,recent work has identified potential changes over component time-unitsof a given scan (internal consistency). As described below, efforts todate have primarily focused on test–retest reliability across scans(short and long-term), although recent studies are examining the con-sistency of findings within a given scan (Chang and Glover, 2010), aswell as across magnets and sites (Biswal et al., 2010; Fair et al., 2012;Tomasi and Volkow, 2010).
Evidence supporting reliability of R-fMRI measures
Test–retest reliability represents the most commonly assessed formof reliability in the imaging literature. Moderate-to-high test–retestreliability (intraclass correlation coefficients >0.5 and occasionallyreaching ~0.9) of R-fMRI metrics has been confirmed in healthy adultsby multiple groups (Braun et al., 2012; Chou et al., 2012; Faria et al.,2012; Fiecas et al., 2013; Kristo et al., 2012; Liang et al., 2012;Mannfolk et al., 2011; Meindl et al., 2010; Shehzad et al., 2009; VanDijk et al., 2010; Wang et al., 2011, 2013; Zuo et al., 2010a, 2010b,2013). Fewer studies have been conducted with older participants(Blautzik et al., 2013; Guo et al., 2012; Song et al., 2012) and only onein children (Thomason et al., 2011), patients with schizophrenia(Turner et al., 2012), and patients with mild cognitive impairment(Blautzik et al., 2013). Still, the news is generally good, with acceptableto good test–retest reliability for awide range ofmeasure describing thefunctional connectome across intervals as long as one year (Blautziket al., 2013; Chou et al., 2012; Shehzad et al., 2009; Zuo et al., 2010a,
530 F.X. Castellanos et al. / NeuroImage 80 (2013) 527–540
2010b, 2013). For comparison, these generally surpass the test–retestreliabilities of diagnostic assessments of themajor psychiatric disordersrecently documented in the DSM-5 Field Trials (Regier et al., 2013).
Gaps and needs in assessing the reliability of R-fMRI measures
A key limitation of the existent R-fMRI literature is the lack ofrigorous examination of key features capable of compromising reliabil-ity (e.g., eyes open or closed, time of the day). Knowledge of such factorsis crucial— both for careful design and analysis of multi-site studies, aswell for efforts to obtain diagnostic or treatment response information.Although not commonly examined in a reliability framework, severalstudies have demonstrated factors capable of introducing systematicmeasurement error into R-fMRI studies if not properly controlled. Inparticular, scanning with eyes open vs. closed during R-fMRI scansyields systematically different results (Ben-Simon et al., 2008; Brandt,2006; Chen et al., 2008; Marx et al., 2004; McAvoy et al., 2008; Uludaget al., 2004; Yan et al., 2009; Yang et al., 2007; Zou et al., 2009). Forexample, spontaneous occipital fluctuations are substantially largerduring eyes closed than during fixation with eyes open (Bianciardiet al., 2009). Factors related to scan order and session duration arealso starting to receive attention. For example, Yan et al. (2009)observed significant differences between the first and second scans ina session. Other pragmatic factors, such as satiety status (Lohmannet al., 2010) or morning–evening variations (Shannon et al., 2013)have received scant attention. The limitation of these studies from thepoint of view of reliability is that they were conducted as withinsubject-analyses (e.g., hunger vs. satiety) rather than quantifying the im-pact of satiety or circadian factors on test–retest reliability. Fortunately,re-analysis of such datasets could easily yield estimates of test–retestreliability.
In considering reliability, we note that artifactual signals can con-tribute to reliability just as much as signals of interest. For example,Yan et al. found that in-scanner motion can artifactually enhance test–retest reliability (Yan et al., 2013). Generally unexplored is the potentialimpact of factors such as age or disease status on reliability — both ofwhich can impact between- and/or within-subject variations whichdirectly determine reliability estimates. Of relevance to clinical applica-tions, low test–retest reliability is a limiting factor for longitudinal stud-ies of development, aging and response to intervention.
Sensitivity and specificity of R-fMRI measures in the context of predictivemodeling
Sensitivity and specificity are a central focus of multivariate predic-tive modeling (MPM) analyses which aim to identify biomarkers ofneuropsychiatric diseases.Most of these studies are based on diagnosticprediction of psychiatric disorders previously examined in group com-parisons using R-fMRI (e.g., Craddock et al., 2009).
Predictive modeling is typically performed in a supervised learningsetting, in which each feature (e.g., correlations between regions) hasa label which can correspond to disease status, severity, treatment out-come, or other phenotypic variables (Hansen, 2007). Various modelingapproaches can be applied to “learn” or “train” amathematical relation-ship between the features and labels. The accuracy of the model is esti-mated using a procedure called cross-validation, in which the data areiteratively split into a subset used to train the model, and a subsetused for testing. The trained model is applied to the testing data todecode the variable of interest from the data; these predictions arecompared to the true labels for the testing data to estimate predictionaccuracy (Bishop, 2006; Pereira et al., 2009). This procedure providesa framework for estimating sensitivity and specificity, which are keyfor evaluating biomarker performance (Craddock et al., 2009). Otherconcepts that are important for predictive modeling are feature extrac-tion and feature selection. Feature extraction involves transforming thedata so that they are better conditioned for modeling (e.g., principal
component analysis (PCA) dimensionality reduction) (Bishop, 2006)and feature selection, which involves identifying the subset of featuresthat are most important to the model (Guyon and Elisseeff, 2003). Asthe advantages and disadvantages of each analytical approach are be-yond the scope of this paper, we refer elsewhere for an instructive over-view (Pereira et al., 2009).
Evidence regarding sensitivity and specificity in R-fMRI predictivemodelingstudies
As summarized in Table 1, the literature on predictive modelingon functional connectivity (as of 2/1/2013) addresses schizophrenia(n = 9 studies, Bassett et al., 2012; Du et al., 2012; Fan et al., 2011;Liu et al., 2012; Shen et al., 2010; Tang et al., 2012; Venkataramanet al., 2010, 2012; Yu et al., 2013), attention-deficit/hyperactivity dis-order (ADHD; n = 10, Bohland et al., 2012; Cheng et al., 2012; Colbyet al., 2012; Dai et al., 2012; Dey et al., 2012; Eloyan et al., 2012; Fairet al., 2012; Sato et al., 2012; Sidhu et al., 2012; Zhu et al., 2008),major depression (n = 3, Craddock et al., 2009; Lord et al., 2012;Zeng et al., 2012), autism (n = 2, Anderson et al., 2011; Murdaughet al., 2012), epilepsy (n = 1, Zhang et al., 2012) prenatal cocaine ex-posure (n = 1, Deshpande et al., 2010) andmultiple sclerosis (n = 1,Richiardi et al., 2012). Beyond differences in the disorders examined,studies vary in modeling approach, feature selection or extraction al-gorithms as well as cross validation employed.
The indices (i.e., features) of intrinsic functional architecture uti-lized also vary. Most authors have opted for exploratory wholebrain approaches using graph theory measures or whole-brain intrin-sic functional connectivity based on the application of structural orfunctional parcellation atlases. Others have focused on regional mea-sures of variance (Cheng et al., 2012; Sato et al., 2012), and regional orglobal graph statistics (Bassett et al., 2012; Cheng et al., 2012; Dai etal., 2012; Dey et al., 2012; Lord et al., 2012; Sato et al., 2012; Zhanget al., 2012; Zhu et al., 2008). Fewer studies have focused on indicesof functional architecture emerging frommodels of the pathophysiol-ogy of the disorder. In one example (Craddock et al., 2009), functionalconnectivity of 15 regions-of-interest emerging from the depressionliterature were entered into the prediction analyses. Interestingly,selecting brain regions on the basis of expert opinion improved over-all prediction accuracy from 53% for whole-brain unbiased explora-tion to 75% in a study of schizophrenia (Venkataraman et al., 2012).Yet, none of these studies alone or in combination point toward acommon feature or feature set for each of the disorders examined. In-stead, they should be considered proofs-of-concept on which the nextwave of examinations will be built.
Gaps and needs in predictive modeling with R-fMRI measures
Better datasetsMost studies (but see exceptions, e.g., Colby et al., 2012; Fair et al.,
2012; Yu et al., 2013) have focused on two-class prediction — pro-bands with a diagnosis are contrasted to healthy controls. Thesefirst generation studies have been conducted with generally smallsamples (mean group size is 27.6 ± 17.5) with the exception of theefforts based on the ADHD-200 Competition (ADHD Consortium,2012). In 2012 the ADHD-200 Consortium made available a datasetof individuals with ADHD and controls (ages 7–21 years; 285 individ-uals with ADHD and 491 controls in the training set; 78 individualswith ADHD and 93 controls reserved for the holdout set) and an-nounced a global competition to develop novel diagnostic predictivealgorithms and to identify potentially useful ADHD biomarkers(ADHD Consortium, 2012). As a result, nine papers were publishedon ADHD classification using intrinsic functional connectivity indicesalone or in combination with other modalities (Bohland et al., 2012;Chang et al., 2012; Colby et al., 2012; Dai et al., 2012; Dey et al.,2012; Eloyan et al., 2012; Fair et al., 2012; Sato et al., 2012; Sidhu et

531F.X. Castellanos et al. / NeuroImage 80 (2013) 527–540
al., 2012). This represented a marked increase from the one priorstudy on ADHD diagnostic prediction (Zhu et al., 2008). While theADHD-200 Global Competition demonstrated the utility of data shar-ing to promote discovery science, similar gaps and needs can be iden-tified across the entire field. The ADHD-200 Global Competition alsounderscored that there is still much work to be done to achieve bio-markers based on R-fMRI metrics. For example, the best classifier per-formance in the competition was achieved not by using R-fMRIfeatures, but by taking advantage of the male predominance and thetendency to manifest lower IQ which characterizes ADHD (ADHDConsortium, 2012; Brown et al., 2012).
Biomarker identification and evaluation will require massivedatasets that provide sufficient variance for the disease under inquiry,while also including other disorders so that specificity can beascertained (Dudley and Butte, 2009). Acquiring such large samples,in a reasonable amount of time, requires collaborative data collectionefforts that span many imaging sites. Ideally such collaboration wouldbe coordinated, such as the Alzheimer's Disease Neuroimaging Initia-tive (Mueller et al., 2005), in which variance in experimental proce-dures, such as scanning protocols, has been minimized. But suchinitiatives are costly. Alternatively, efforts such as the InternationalNeuroimaging Data-sharing Initiative (INDI) (Mennes et al., inpress), 1000 Functional Connectomes Project (Biswal et al., 2010),and consortia like the ADHD-200 (ADHD Consortium, 2012) and theAutism Brain Imaging Data Exchange (ABIDE) (Di Martino et al., inpress) are amassing such datasets post-hoc. Although each of theseare confounded by between site variation in experiment protocols,they provide the best current hope for identifying biomarkers, untillarge coordinated initiatives are established.
Real world assessment of biomarker propertiesOverall, as shown in Table 1, the reviewed studies yielded
moderate-to-excellent accuracy, sensitivity, and specificity — provid-ing an optimistic outlook for functional connectivity based clinical di-agnostics. But these estimates of external validity (generalizationability) do not provide a realistic picture of the positive (probabilityof having the disease given a positive test) and negative (probabilityof not having the disorder given a negative test) predictive value ofthe biomarker. This requires incorporating information about disor-der prevalence (Grimes and Schulz, 2002). We calculated these mea-sures for the reviewed literature using recent estimates of disorderprevalence from Centers for Disease Control and Prevention Mortalityand Morbidity Weekly Reports. Positive and negative predictionvalues (PPV and NPV, respectively) are calculated from sensitivity(SS), specificity (SP) and prevalence (Prev) using the following equa-tions (Altman and Bland, 1994):
PPV ¼ SS � PrevSS � Prevþ 1−SPð Þ � 1−Prevð Þ : ð1Þ
NPV ¼ SP � 1−Prevð ÞSP � 1−Prevð Þ þ 1−SSð Þ � Prev : ð2Þ
There is a remarkable disparity between the performance esti-mates reported in the literature and clinical utility, some of whichlead to strikingly different conclusions about the relative quality ofmodeling approaches. For example, the performance (prediction ac-curacy, sensitivity, specificity) of the modeling approach employedby Tang et al. (2012) (93%, 86%, 100%, respectively), and Du et al.(2012) (93%, 93%, 93%) are very similar. The two methods would betied if the J-statistic (J = SS + SP − 1) (Youden, 1950) were usedto compare them, but PPV gives a drastically different picture (100%vs. 27.4% for Tang et al. and Du et al., respectively). This disparity isdue to the low population prevalence of schizophrenia (0.6%),which results in Eq. (1) being dominated by specificity, resulting ina 72.6% change in PPV from a 7% change in specificity. A consequence
of this phenomenon is that the best performing classifiers for diagno-sis are those that model healthy individuals well, and are hence oflimited utility for understanding disease processes. We note thatspecificity is calculated based on the ability to differentiate the dis-ease state from healthy controls, and not for differentiating amongdiseases. Future studies will need to incorporate larger datasets thatspan multiple disorders to adequately evaluate the clinical utility ofprospective biomarkers (Dudley and Butte, 2009).
The manner in which training levels are generated also impacts theclinical utility of a learned model. A common presumption of predic-tive modeling for disease state classification is that current standardsof most clinical diagnoses (e.g., clinical interview and self report as-sessments) are limited because they are subjective and that we needbetter objective diagnostic markers (Linden, 2012). But the labelsused to train classifiers are determined using the same clinical diag-nostic criteria that are acknowledged as imprecise. As a result, themodel can only be optimized to attain the same level of diagnosticconfidence as was obtained by the initial methods. Although theresulting model may incorporate measures of physiology, it is not nec-essarily any more sensitive to biological factors than other methods.One way to address this issue is to employ modeling methods thattreat the labels as noisy, or otherwise incorporate some measure oflabel confidence (Lawrence and Schoelkopf, 2001).
Needs and gaps in applying predictive modeling to brain mappingAlthough prediction ability is an end in itself, we often desire to be
able to map the brain regions and interactions that are most relevantto the prediction. Machine learning algorithms are highly optimizedfor obtaining accurate prediction but tend to be black boxes, fromwhich the information that led to the prediction is not easily extracted.Feature weights, which determine the prediction equation, can beextracted from linear models and visualized, but this is rarely possiblefor non-linear (kernel) methods (Bishop, 2006). Once extracted, thereis no clear statistical theory for thresholding the weights to determinewhich have statistically significant involvement, although non-parametric methods such as bootstrapping can be used (McIntosh andLobaugh, 2004). Instead practitioners turn to feature selection methodsto identify themost relevant subset of features for the predictivemodel.
Feature selection methods can be categorized as filter methods,wrapper methods and embedded methods, all of which impact theinterpretation of the results in different ways (Guyon and Elisseeff,2003). Filter methods apply a (typically univariate) statistical test toexclude features that are not statistically dependent on the traininglabels. When univariate methods are used as a filter, features maybe excluded that would otherwise improve prediction if multivariateinteractions were considered. Wrapper methods address this issue byoptimizing the feature set based on prediction ability. Model trainingis performed several times with a different subset of features, and thesubset with the best prediction accuracy is chosen. Embedded methodsdirectly incorporate constraints into the modeling algorithm to reducethe feature set. All of these methods must be run inside cross-validation (CV) to avoid overfitting and optimistic estimates of theability of the model to generalize (Pereira et al., 2009). This oftenleads to different features being selected for each iteration of CV, whichcomplicates the issue of feature interpretation, e.g. the same modellearned from a different subset of observations identifies a different setof features (Craddock et al., 2009). Additionally, the constraints used inmodel learning impart different properties to the selected features. Forexample, LASSO (least absolute shrinkage and selection operator), apopular embedded method, limits the number of non-zero featureweights in the model to the number of observations. Additionally,when highly correlated features exist, LASSOwill tend to exclude a sub-set of them even though they may possess predictive power (Wanget al., 2007). Thus, features identified using this method do not repre-sent all of the features that are involved in a disease process of interest

Table 1Predictive modeling based on intrinsic brain functional architecture.
Pt NC Other Pos Neg
LOO 95%
Holdoutd 83% – –
Lord et al. (2012) MDD 22 22 – Adults
Graph theory:
participation index,
betweeness
centrality, efficiency
Linear SVC
Minimum
redundancy
maximum
relevance;RFE
Split–half
(two–fold)
90% to 99%
(2 to 6
features)
99% 99% 80.9% 100.0%
Some regions involved in Craddock et al. (2009),
were also reported as discriminating features
here (rACC, thalamus).
Zeng et al. (2012) MDD 24 29 – Adults Whole brain iFC Linear SVC
Kendall tau
rank correlation
coefficient
LOO 94% 100% 90% 29.9% 100.0%
The most discriminating functional connections
mainly located in DN, affective network, visual
cortical areas and cerebellum.
Shen et al. (2010) SCZ 32 18 – Young adults Whole brain iFC
Quasi–nearest
neighbour
classifier
Kendall tau
rank correlation
coefficient
LOO 92% 94% 75% 2.2% 100.0%
Feature extraction with locally linear embedding
& C–Means clustering. 3D PCA and SVC also
utilized; SCZ–related decreases in frontal–
parietal and temporal iFC with cerebellum.
Fan et al. (2011) SCZ 31 31 – Young adults ICA–based networks Linear SVC
Forward
component
selection
LOO 87% 90% 84% 3.3% 99.9%
Feature extraction with Grassman manifold.
Accuracy based on feature combination of DN
and temporal lobe ICA–based networks.
Bassett et al. (2012) SCZ 29 29 – Adults
Graph theory:
largest connected
component in the graph
Linear SVCGroup
comparisons
Split–Half
(Two–fold)75% 85% 64% 1.4% 99.9%
Weaker iFC in SCZ for circuits based on
olfactory cortex, temporal pole, AG,
parahippocampus, amygdala, caudate, pallidum,
posterior parietal cortex.
Tang et al. (2012) SCZ 22 22 – Young adults Whole brain iFC Linear SVC
Kendall tau
rank correlation
coefficient
LOO 93% 86% 100% 100.0% 99.9%
68% of discriminating features represented iFC
decreases in SCZ, primarily in visual cortical
network, DN, self referential network and
sensory–motor networks.
SCZ expert selected
regions75% – – – –
Whole brain iFC 53% – – – –
Du et al. (2012) SCZ 28 28 –Adults
(unmatched)ICA–based networks PCA–FDA TF LOO 93% 93% 93% 7.4% 100.0%
Prediction using network derived from task
based fMRI (auditory oddball task) yielded better
performance (Accuracy = 98%). Algorithm tested
both with individual ICA and different
combinations of the ICA networks separately for
R–fMRI and fMRI; combinations always
performed better.
Liu et al. (2012) SCZ 24 22 25d
Young adults Whole brain iFC
NonLinear SVC
Multiclass:one
against one
– LOO 79% 72% 86% 3.0% 99.8%
NC siblings of patients with SCZ. Feature
extraction with PCA. Separate classifiers were
used for SCZ vs. HC and SCZ vs. NC. We report
performance of SCZ vs. HCd.
Yu et al. (2013) SCZ 24 22 25d
Young adults Whole brain iFC
Linear SVC
Multiclass:one
against rest
– LOO 62% 67% 87% 3.0% 99.8%
NC siblings of patients with SCZ. Feature
extraction with PCA. Most discriminative features
DN and cerebellum iFCd.
4.1%
0.6%Young adults NR
Both papers used same sample and methods;
2012 paper reported correlations with
symptoms. SCZ exhibited increased iFC
between parietal and frontal regions, and
decreased iFC between parietal and temporal
regions, and between the temporal cortex
bilaterally. Decreased parieto–temporal iFC
related to severity of positive symptoms,
increased fronto–parietal iFC related to negative
& general symptoms.
Venkataraman et
al. (2010, 2012)SCZ 18 18 –
Random forest
analysisGini importance
RF, RRFE, RFE,
TF – –
Holdout sample included 6 patients with MDD.
SVM performance varied as a function of the
feature selection approach; several circuits
previously implicated in MDD were relevant for
discrimination. Classification accuracy = 63%
w/o feature selection.
Real world
predictive values Notes
Craddock et al.
(2009)MDD 20 20 –
Adults
(unmatched)
iFC among 15 ROI
relevant for
depression
Linear SVC
Feature
selection
approach
Cross
validationAccuracy Sensitivity Specificity
Disorder
prevalencebAuthor, year Disorder
N Age groupa Features
Prediction
method
Zhu et al. (2008) ADHD 12 12 Adolesc. Reho PCA-FDA - LOO 85% 78% 91% 40.2% 98.2%
Reho-based classification better than gray
matter-based classification; ACC, putamen,
temporal cortex, cerebellum thalamus best
discriminators.
Dey et al. (2012) ADHD 285 491 -
Child,
adolesc.,
young adults
Graph theory:
degree, 3-cycle PCA-LDA
Randomized
optimization
ADHD200
Holdoutc 70% 49% 87% 22.6% 95.6%
Each index was measured on whole brain and on
an ADHD-relevant mask. We report the best
overall accuracy (3-cycle on ADHD relevant
mask).
532F.X
.Castellanoset
al./NeuroIm
age80
(2013)527
–540

Co
lby
et
al.
(2
01
2)
AD
HD
16
3
(C)
49
11
11
(I)
Ch
ild
,
ad
ole
sc.,
yo
un
g a
du
lts
Co
mb
ina
tio
n o
f
fun
ctio
na
l a
nd
stru
ctu
ral
fea
ture
s
RB
F k
ern
el
SV
C R
FE
, mu
ltip
le
SV
M–
RF
E
AD
HD
20
0
Ho
ldo
ut
55
%3
3%
79
%1
0.9
%9
3.8
%
Fu
nct
ion
al
fea
ture
s fo
r co
rtic
al
an
d s
ub
cort
ica
l
are
as
incl
ud
ed
: iF
C, g
rap
h t
he
ory
me
tric
s, n
od
al
po
we
r sp
ect
ra, g
lob
al
iFC
an
d R
eh
o. S
tru
ctu
ral
fea
ture
s in
clu
de
d c
ort
ica
l th
ick
ne
ss, g
ray
ma
tte
r
vo
lum
e, s
urf
ace
are
a a
nd
su
rfa
ce v
ert
ice
s,
cort
ica
l m
ea
n c
urv
atu
re, g
au
ssia
n c
urv
atu
re,
cort
ica
l fo
ldin
g, c
ort
ica
l cu
rva
ture
in
de
x, a
nd
reg
ion
al
vo
lum
e, v
ox
el
inte
nsi
ty m
ea
n, a
nd
SD
for
sub
cort
ex
.
Da
i e
t a
l. (
20
12
)A
DH
D2
85
49
1–
Ch
ild
,
ad
ole
sc.,
yo
un
g a
du
lts
Co
rtic
al
thic
kn
ess
,
gra
y m
att
er
pro
ba
bil
ity
, Re
Ho
,
iFC
RB
F k
ern
el
SV
C
& M
KL
Fil
ter–
ba
sed
,
RF
E
AD
HD
20
0
Ho
ldo
ut
68
%3
8%
84
%1
5.6
%9
4.6
%
MK
L u
sed
to
cla
ssif
y o
n t
he
ba
sis
of
mu
ltim
od
al
fea
ture
s; i
t y
ield
ed
be
st p
erf
om
an
ces
wh
ich
are
rep
ort
ed
he
re. A
ccu
racy
58
% w
he
n 3
cla
sse
s
test
ed
(A
DH
D–
C, A
DH
D–
I, N
C).
Bo
hla
nd
et
al.
(20
12
)A
DH
D2
85
49
1–
Ch
ild
,
ad
ole
sc.,
yo
un
g a
du
lts
Str
uct
ura
l fu
nct
ion
al
an
d p
he
no
typ
ica
l Li
ne
ar
SV
C2
sa
mp
le t
–te
st;
ne
ste
d C
V, R
FE
AD
HD
20
0
Ho
ldo
ut/
sit
e4
4–
74
%–
––
–
Ph
en
oty
pic
va
ria
ble
s a
lon
e p
rov
ide
d g
oo
d
pre
dic
tio
n a
ccu
racy
, wh
ich
wa
s e
nh
an
ced
by
inco
rpo
rati
ng
fe
atu
res
fro
m f
un
ctio
na
l a
nd
stru
ctu
ral
ne
uro
ima
gin
g.
Elo
ya
n e
t a
l. (
20
12
)A
DH
D2
85
49
1–
Ch
ild
,
ad
ole
sc.,
yo
un
g a
du
lts
Mo
tor
ne
two
rk
pa
rce
lla
tio
ns
iFC
,
wh
ole
bra
in i
FC
,
mo
tio
n p
ara
me
ters
Ag
gre
ga
te o
fM
ult
iple
AD
HD
20
0
Ho
ldo
ut
61
%2
1%
94
%2
1.4
%9
3.9
%
A c
orr
ela
tio
n g
rap
h f
or
a m
oto
r n
etw
ork
pa
rce
lla
tio
n w
as
hig
hli
gh
ted
as
a p
rom
isin
g
bio
ma
rke
r.
Sa
to e
t a
l. (
20
12
)A
DH
D2
85
49
1–
Ch
ild
,
ad
ole
sc.,
yo
un
g a
du
lts
Re
ho
, ALF
F, I
CA
ne
two
rk
Mu
ltip
le
cla
ssif
iers
Mu
ltip
leA
DH
D2
00
Ho
ldo
ut
67
%6
5%
70
%1
4.4
%9
6.3
%
Co
mb
inin
g A
LFF
an
d R
eh
o d
iscr
imin
ate
d A
DH
D
fro
m N
C b
ut
w/l
imit
ed
acc
ura
cy. C
om
bin
ing
th
e
thre
e f
ea
ture
s d
iscr
imin
ate
d A
DH
D–
C v
s A
DH
D–
I
(67
% a
ccu
racy
). R
ele
va
nt
fea
ture
s w
ere
bro
ad
ly
dis
trib
ute
d i
n t
he
bra
in. H
igh
ly s
imil
ar
resu
lts
acr
oss
me
tho
ds
test
ed
.
AD
HD
20
0
Ho
ldo
ut
63
%–
––
–
10
–fo
ld7
6%
––
––
Ch
en
g e
t a
l. (
20
12
)A
DH
D1
01
14
3–
Ch
ild
Re
Ho
, ALF
F, P
ea
rso
n
corr
ela
tio
n, s
pa
tia
l
corr
ela
tio
n
RB
F k
ern
el
SV
CB
WA
SLO
O7
6%
63
%8
5%
24
.6%
96
.7%
AD
HD
–C
(n
=3
8)
an
d A
DH
D–
I (n
=6
3)
incl
ud
ed
.
Th
e m
ost
dis
crim
ina
tiv
e f
ea
ture
s w
ere
ass
oci
ate
d t
o f
ron
tal
an
d c
ere
be
lla
r re
gio
ns.
77
%7
5%
77
%2
0.2
%9
7.5
%
81
%8
0%
83
%2
6.7
%9
8.2
%
Zh
an
g e
t a
l. (
20
12
)E
pil
ep
sy1
00
80
–Y
ou
ng
ad
ult
s
Co
mm
un
ity
ma
trix
K;
inte
rhe
mis
ph
eri
c
asy
mm
etr
y i
n I
FC
Lin
ea
r S
VC
Sp
ars
e
reg
ress
ion
LO
O8
4%
83
%8
5%
1.0
0%
5.3
%9
8.5
%
Mo
stly
pa
rtia
l e
pil
ep
sy;
me
dic
ate
d. M
ult
iple
fea
ture
s a
nd
ap
pro
ach
es
use
d;
resu
lts
rep
ort
ed
he
re b
ase
d o
n c
om
bin
ing
co
mm
un
ity
ma
trix
K
an
d i
FC
asy
mm
etr
y.
LOO
79
%8
3%
79
%3
.8%
99
.8%
Ho
ldo
ut
71
%7
5%
69
%2
.4%
99
.6%
Se
ed
ba
sed
iF
C:A
G,
MP
FC
PC
C
96
% (
AG
),
70
% (
MP
FC
,
PC
C)
––
––
Wh
ole
bra
in i
FC
78
%7
7%
79
%3
.6%
99
.7%
De
shp
an
de
et
al.
(20
10
)
Pre
na
tal
coca
ine
ex
po
sure
30
26
–A
do
lesc
.iF
C &
EC
Li
ne
ar
SV
CR
FE
10
–fo
ld9
0%
––
7.2
0%
––
Fu
nct
ion
al
con
ne
ctiv
ity
me
asu
red
wit
ho
ut
GS
R
wa
s a
lso
te
ste
d;
he
re w
e r
ep
ort
re
sult
s o
bta
ine
d
wit
h G
SR
. Ta
sk b
ase
d e
ffe
ctiv
e c
on
ne
ctiv
ity
als
o
test
ed
as
we
ll a
s p
he
no
typ
ic i
nfo
rma
tio
n.
Ric
hia
rdi
et
al.
(20
12
)M
S2
21
4–
Ad
ult
Wh
ole
bra
in i
FC
Fu
nct
ion
al
tre
es
Pe
rmu
tati
on
test
LOO
88
%8
2%
86
%0
.10
%0
.6%
10
0.0
%F
ea
ture
ex
tra
ctio
n w
ith
dir
ect
gra
ph
em
be
dd
ing
me
tho
d.
7.2
0%
1.0
%
Fe
atu
re e
xtr
act
ion
wit
h F
FT
, PC
A a
nd
FF
T° +
° PC
A.
AD
HD
su
bty
pe
s a
lso
cla
ssif
ied
ag
ain
st N
C. 6
9%
acc
ura
cy f
or
3 g
rou
p c
lass
ific
ati
on
.
Ch
ild
,
ad
ole
sc.
iFC
of
sele
cte
d s
ee
ds
ba
sed
on
me
ta–
an
aly
sis
of
co
gn
itiv
e
task
s
Lin
ea
r S
VC
TF
LOO
11
2
(C)
45
58
0
(I)
Ea
ch A
DH
D s
ub
typ
e (
C=
com
bin
ed
,
I=in
att
en
tiv
e)
wa
s te
ste
d a
ga
inst
th
e N
C g
rou
p.
To
p r
ow
re
fers
to
AD
HD
–C
an
d l
ow
er
row
to
AD
HD
–I.
Als
o t
est
ed
3–
gro
up
cla
ssif
ica
tio
n
yie
din
g 6
3%
acc
ura
cy. D
ata
pre
pro
cess
ed
usi
ng
dif
fere
nt
mo
tio
n c
orr
ect
ion
s; r
esu
lts
rep
ort
ed
he
re o
bta
ine
d w
ith
th
e g
rou
p l
ev
el
mo
tio
n
corr
ect
ion
.
–
Ch
ild
,
ad
ole
sc.,
yo
un
g a
du
lts
Co
mb
ina
tio
n o
f
ph
en
oty
pic
an
d
fun
ctio
na
l d
ata
Lin
ea
r S
VC
No
ne
Sid
hu
et
al.
(2
01
2)
AD
HD
14
14
29
Yo
un
g a
du
lts
Fa
ir e
t a
l. (
20
12
)A
DH
D
LOO
Pse
ud
ore
st (
i.e
., ta
sk r
eg
ress
ed
). A
SD
ha
ve
red
uce
d i
FC
be
twe
en
AG
an
d o
ccip
ita
l re
gio
n a
nd
incr
ea
sed
iF
C b
etw
ee
n A
G a
nd
su
pp
lem
en
tary
mo
tor
cort
ex
.
Yo
un
g a
du
lts
ad
ole
sc.
Qu
asi
–n
ea
rest
ne
igh
bo
r
cla
ssif
ier
2 t
ail
ed
t t
est
Ho
ldo
ut
sam
ple
in
clu
de
d 8
pa
tie
nts
wit
h a
uti
sm
& 1
3 N
C.
Mu
rda
ug
h e
t a
l.
(20
12
)A
SD
13
14
–Lo
gis
tic
reg
ress
ion
No
ne
An
de
rso
n e
t a
l.
(20
11
)A
SD
40
40
–W
ho
le b
rain
iF
C
rela
tio
nsh
ip w
ith
ag
e
fou
r cl
ass
ifie
rs
533F.X. Castellanos et al. / NeuroImage 80 (2013) 527–540
534 F.X. Castellanos et al. / NeuroImage 80 (2013) 527–540
and the exclusion of a feature does not mean that it is not involved inthe disease process.
If features are appropriately scaled prior to model training then themodel weights can be interpreted as a measure of a feature's relativeimportance to the model (Guyon and Elisseeff, 2003). Additionally, itis tempting to interpret the sign of the model weight as an indicationof the relationship between the feature and the predicted label(Mourao-Miranda et al., 2005). For example, a positive weight mightindicate that the feature is greater for the class corresponding to posi-tive labels, or is positively correlated with a continuous label. However,when using multivariate methods, these relationships are much morecomplicated. The sign of a feature's weight does not necessarily matchgroup differences identified through univariate methods, and it maychange based on the inclusion of another feature (Craddock et al.,2009). Details of the modeling algorithm must also be consideredwhen interpreting model weights. In support vector classification,model weights reflect the border between groups, whereas in Fisher'slinear discriminant analysis, the weights reflect differences betweengroup means (Bishop, 2006).
Multivariate regression algorithms are an alternative to classifica-tion that has been used to predict brain maturity from resting statefunctional connectivity (Dosenbach et al., 2010). Only one study todate has leveraged continuous measures of disease severity with pat-tern recognition (Lynch et al., 2013). Such regression-based methodsare obviously of interest for the dimensional perspectives being increas-ingly embraced, as discussed below in the section on Nosologicallimitations and extreme comparisons. The only impediment to thewider application of multivariate regression approaches is the require-ment for sufficiently large data sets.
Finally, we note that although leave one out cross validationmethods are typically used to train and test predictive models, theyare prone to overfitting, particularly when large numbers of modelsare tested with small samples (Rao et al., 2008). To generate estimatesof prediction accuracy that can be considered for real world applica-tions, completely independent datasets should be used to train andtest a given model, which also requires large, well-characterizeddatasets.
Neurosurgical planning — an opportunity for clinical applicationof R-fMRI methods
Functional brainmappingmay be used both to predict the efficacy ofneurosurgical treatment and to avoid neurological deficit. Brain surgerytypically involves the lesioning, inactivation by brain stimulation orremoval of a pathological region (e.g., for tumor, tremor, psychiatric dis-orders or epilepsy). Precisely identifying both the pathological regionsto treat aswell as the functional regions to spare is the key to an optimaloutcome (Haberg et al., 2004). Challenges arise due to the fact that sen-sorimotor and language regions cannot be identified by anatomy alone(Ojemann, 1979; Steinmetz et al., 1990) and when pathological regionsare not readily detectable with structural imaging. This is further com-plicated when we consider that many neurosurgical treatments aredirected towards disorders of brain networks, as is likely the case
Notes to Table 1ADHD: attention-deficit/hyperactivity disorder; ADHD-C: combined type ADHD; ADHD-I: infrequency fluctuations; BWAS: brain-wide association study; DN; default network; dACC: diFC: intrinsic functional connectivity; iFN: intrinsic functional networks; GSR: global signal rorder; MKL: multikernel learning; MPFC: medial prefrontal cortex; NC: neurotypical controlsPCA-linear discriminant analysis; PCC: posterior cingulate cortex; pt: patient; RBF: radial belimination; ROI: region of interest; RRFE: reliability reverse feature elimination; SCZ: schiunless specified. School-age = 6–12, adolescents:13–19, young adults 20–30; adults 30–60Control and Prevention Morbidity Mortality Weekly Reports for all targeted disorders exceptic Dis 2010.cHold out sample included 93 NC and 78 ADHD.dNC siblings of patients with SC
for epilepsy (Spencer, 2002), movement disorders (Niethammerand Eidelberg, 2012), and psychiatric disorders (Llinas et al., 1999).
Electrical stimulation mapping — a questionable gold standard
Investigators are currently focusing on improving existing methodsto define “eloquent” (sensorimotor and language) areas that must bepreserved during surgical procedures using R-fMRI methods (Martinoet al., 2011; Zhang et al., 2009). The gold standard for localization offunction remains direct cortical electrical stimulation mapping (ESM)with over 100 years of neurosurgical experience (Horsley, 1909;Pendleton et al., 2012). For this, a patient must remain awake whilehaving a craniotomy and direct cortical stimulation is applied to small(1 cm) patches. This temporarily mimics the effect of ablation whilecognitive function is tested (Ojemann, 1979). Awake craniotomy canresult in patient anxiety, increased operating time and difficulty withanesthesia. Intraoperative ESM can produce seizures and the absenceof ventilator control in an awake patient can produce hypercarbia andconsequent brain swelling (Silvergeld, 2001). An alternative approachfrequently used in epilepsy surgery involves implanting invasive elec-trode arrays to precisely identify the seizure onset zone as well as toperform ESM extraoperatively (Bancaud et al., 1970; Wyler et al.,1984). However, this too carries risks, including requiring twoproceduresto implant and explant electrodes, patient discomfort, brain swelling andinfection (Hamer et al., 2002). A sampling problem is inherent to ESM inthat intraoperative time limits testing to a few sites, and extraoperativemapping is limited by the extent of the electrode array. Also, ESM cannotbe used to test function of tissue within the depths of sulci unless atime-consuming intrasulcal dissection is performed or penetratingdepth electrodes are implanted. Finally, ESMmay falsely localize functionby activating distant areas through corticocortical connections,questioning its status as the gold standard (Sinai et al., 2005).
Gaps and needs in the use of task-based fMRI for neurosurgical planning
Clearly, a noninvasive methodology to image cortical functionwithout sampling bias that is sensitive to activity in deeper regionsand that does not disrupt function would be desirable. While task-based fMRI has been used extensively to study normal brain function,the clinical utility of this method has yet to be firmly established (Hillet al., 2000; Mehta and Klein, 2010; Roux et al., 2003). A major factorthat limits clinical utility involves poor task performance in patientswith cognitive impairment and neurological deficits — the verypatients who need neurosurgical intervention (Pujol et al., 1998). Thelow amplitude of task-related changes in the BOLD signal requires repe-tition, resulting in fatigue that is further complicated when multiplefunctions must be tested. Unlike most clinical studies where inferencesaremade by comparing results across groups, neurosurgical planning re-quires a precise within-subject spatial correspondence of intraoperativenavigation with preoperative results (Kekhia et al., 2011). Due to theseissues, the correspondence of ESM results with preoperative task-based fMRI is inconsistent (Kunii et al., 2011; Mehta and Klein, 2010;Roux et al., 2003; Ruge et al., 1999; Rutten et al., 2002).
attentive type ADHD; adolesc: adolescents; AG: angular gyrus; ALFF: amplitude of loworsal anterior cingulate cortex; EC: effective connectivity; FFT: fast Fourier transform;egression; LOO: leave-one-out cross validation algorithm; MDD: major depressive dis-; PCA: principal component analysis; FDA: PCA–Fisher discriminant analysis; PCA-LDA:asis function; ReHo: regional homogeneity; RF: reliability filter; RFE: recursive featurezophrenia; SVC: support vector classification; TF: T test filter.aGroups matched for age; elderly >60.bDisorder prevalence was based on the most recent Centers for Diseasemultiple sclerosis (MS); MS prevalence based on a CDC study published in Prev Chron-Z.
535F.X. Castellanos et al. / NeuroImage 80 (2013) 527–540
Readiness of R-fMRI-based neurosurgical planning
Due to minimal requirements for subject performance and thelarge amplitude spontaneous fluctuations of the BOLD signal, R-fMRImay be quite useful when neurosurgical planning requires localizationof brain function (Bottger et al., 2011; Matthews et al., 2006;Shimony et al., 2009; Tie et al., 2013; Zhang et al., 2009). A brief (6–10 min) scan can produce consistent maps of functional zones withinsingle individuals reliably (Kokkonen et al., 2009; Tie et al., 2013)and with an even higher correspondence with results of ESM thantask-based methods (Zhang et al., 2009). Resting functional connectiv-ity may also be used to define pathology that is elusive using standardstructural imaging. Brain tumor infiltration alters intrinsic functionalconnectivity — this provides information regarding the residual pres-ence of function and also defines the extent of brain tumor invasionthat may not be evident on structural MRI (Martino et al., 2011). In pa-tients undergoing epilepsy surgery, areas within the ictal onset zoneshow increased R-fMRI intrinsic functional connectivity compared todata from a large (N = 300) normative sample (Stufflebeam et al.,2011). However, others have shown seizure-generating areas that arefunctionally disconnected from non-irritative brain areas both withR-fMRI (Bettus et al., 2010, 2011; Pittau et al., 2012) and using electrocor-ticography (Warren et al., 2010). These findings pave the way to usefunctional connectivitymeasures to guide the placement of invasive elec-trodes for confirming the localization of epileptic foci as well as to guidethe extent of resection for both brain tumors and epileptogenic zones.
Intrinsic functional connectivity measures may also predict surgicaloutcome, and this may be particularly useful in determining whether aparticular individual or a disease syndrome in general is appropriate forneurosurgical intervention. Increased contralateral connectivity withtemporal lobe epilepsy has been shown to predict failure of unilateraltemporal lobectomy (Negishi et al., 2011). Increased connectivitywithin the posterior cingulate has been shown to correlatewith postop-erative memory decline after ipsilateral temporal lobe resection(McCormick et al., 2013). Network measures using metabolic imagingto aid in the medical and surgical evaluation of movement disorders iswell-established (Eidelberg, 2009). Both noninvasivemagnetoencepha-lography (Martino et al., 2011) and invasive electrocorticography(Schevon et al., 2007; Warren et al., 2010) have demonstrated thatsynchrony measures predict the extent of brain tumors and the epilep-togenic zone. It remains to be determined whether R-fMRI connectivitymeasures will detect intrinsic network abnormalities better thanmeta-bolic or electrophysiological methods. However, within-individualcorrespondence of electrophysiological and fMRI-based resting connec-tivity measures (He et al., 2008; Keller et al., 2011, 2013) suggests thatR-fMRI should provide substantial supplemental information withsuperior spatial resolution and sampling in a less invasive fashion.
In summary, R-fMRI functional connectivity holds great promisefor advancing neurosurgical treatment. Efforts are well under wayto improve surgical treatment for epilepsy, movement disorders andbrain tumors. The ability to resolve intrinsic functional connectivitynetworks opens awindowof possibility to predict results using invasivebrain stimulation for the treatment of other neurological disorders, suchas dementia and coma, as well as a variety of psychiatric disorders.
Prerequisites for attaining clinical utility with R-fMRI measures:rethinking practices
Significance chasing and approximate replications
A recent commentary noted that clinical neuroscience, includingneuroimaging, is characterized by “significance chasing with under-powered studies,” and “approximate replications” (Kapur et al., 2012).Clinical neuroimaging studies routinely report statistically significantresults with 15–30 subjects per group. Though this is understandablegiven the challenge and expense of recruiting clinical samples to meet
typically restrictive criteria, such sample sizes are vastly underpoweredgiven the high dimensionality of imaging data. Statistical correction formultiple comparisons often proves to be insurmountable for investiga-tors, necessitating limiting the scope of explorations of the connectome(e.g., to specific circuits or networks) or loosening statistical thresholdsand expanding the type 1 error rate. Not surprisingly, failure to replicateis the rule (Ioannidis, 2005). As a result, roughly similar findings(e.g., same general brain structure/region, different subdivision) areinterpreted as approximate replications, and methodological differencesand sample size limitations are cited as likely explanations for failure totruly replicate (Kapur et al., 2012).
This situation is not limited to neuroimaging — large-scaledatasets are required for attaining scientifically valid biomarkers.The molecular genetics community first confronted this challenge atthe 1996 Bermuda Summit. The resulting Bermuda Principles wereadopted to effect radical culture change through open data sharinghttp://www.genome.gov/10506376. They specifically mandated:1) release of sequence assemblies larger than 1 kb within 24 h,2) immediate publication of finished annotated sequences, and3) making the entire sequence freely available in the public domain.With a few notable exceptions (Milham, 2012; Weiner et al., 2012),the neuroimaging community has been slow in embracing open datasharing. Change in the cultural ethos supported by financial investmentfrom funding agencies is needed to implement an open science cultureneeded to generate the prerequisite large-scale neuroimaging datasets.
Nosological limitations and extreme comparisons
As recently highlighted by the U.S. National Institute of MentalHealth (NIMH) Research Domain Criteria Project (RDoC) http://www.nimh.nih.gov/research-funding/rdoc/index.shtml, the lack of specificitybetween findings of abnormal brain function and categorical diagnosticclassifications of psychiatric illness precludes the identification ofmeaningful biomarkers to inform clinical diagnosis or prognosis, or toprovide novel targets for therapeutic interventions. The defaultnetwork (DN) is a case in point, given the ever-increasing number ofdiagnostic categories in which DN abnormalities are being reported(Fox and Greicius, 2010). The DN is a distributed set of brain regionsassociated with spontaneous cognition, internalized thought andemotion regulation that are consistently deactivated during the perfor-mance of goal-driven cognitive tasks (Andrews-Hanna, 2012; Andrews-Hanna et al., 2010; Raichle and Snyder, 2007). Dysregulation of the DNcommonlymanifests as failure to deactivate during goal-directed cogni-tive task performance or abnormal activation during tasks probingemotion and internal mentation, and is associated with a broad arrayof psychiatric disorders (e.g., ADHD, autism, depression, social phobia,PTSD) and their related symptoms (e.g., rumination in depression,attention lapses in ADHD) (Zhang and Raichle, 2010). The lack of a spe-cific association of DN dysregulation with any one disorder preventsdisorder-centric perspectives from achieving a more comprehensiveunderstanding of DN dysregulation as a pathophysiologic process.Beyond implicating DN dysregulation in these disorders, current imag-ing methods and diagnostic category-based frameworks are unable toprovide an understanding of the underlyingmechanisms at the systemslevel and their behavioral associations (Castellanos and Proal, 2012).
The NIMH has recently called for an alternative approach tounderstandingmental illness in terms of its underlying pathophysiologyrather than symptomatology. Specifically, NIMH has cited the need fora neuroscience-based classification approach for parsing psychiatricillness (“neurophenotyping”), and is encouraging the RDoC frameworkas a first step in its evolution. The guiding principles of RDoC entailadopting a dimensional perspective that is agnostic about current diag-nostic categories while intentionally crossingmultiple levels of analysis(i.e., genes, molecules, cells, circuits, physiology, behavior, self-reports,experimental paradigms).
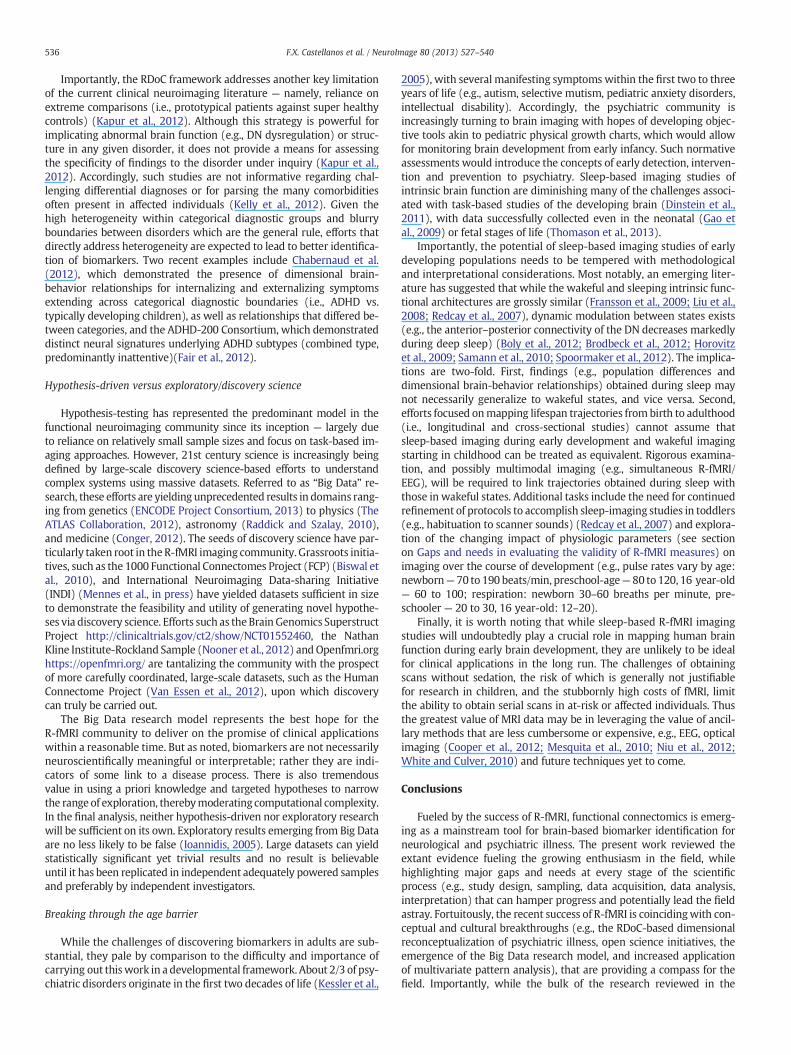
536 F.X. Castellanos et al. / NeuroImage 80 (2013) 527–540
Importantly, the RDoC framework addresses another key limitationof the current clinical neuroimaging literature — namely, reliance onextreme comparisons (i.e., prototypical patients against super healthycontrols) (Kapur et al., 2012). Although this strategy is powerful forimplicating abnormal brain function (e.g., DN dysregulation) or struc-ture in any given disorder, it does not provide a means for assessingthe specificity of findings to the disorder under inquiry (Kapur et al.,2012). Accordingly, such studies are not informative regarding chal-lenging differential diagnoses or for parsing the many comorbiditiesoften present in affected individuals (Kelly et al., 2012). Given thehigh heterogeneity within categorical diagnostic groups and blurryboundaries between disorders which are the general rule, efforts thatdirectly address heterogeneity are expected to lead to better identifica-tion of biomarkers. Two recent examples include Chabernaud et al.(2012), which demonstrated the presence of dimensional brain-behavior relationships for internalizing and externalizing symptomsextending across categorical diagnostic boundaries (i.e., ADHD vs.typically developing children), as well as relationships that differed be-tween categories, and the ADHD-200 Consortium, which demonstrateddistinct neural signatures underlying ADHD subtypes (combined type,predominantly inattentive)(Fair et al., 2012).
Hypothesis-driven versus exploratory/discovery science
Hypothesis-testing has represented the predominant model in thefunctional neuroimaging community since its inception — largely dueto reliance on relatively small sample sizes and focus on task-based im-aging approaches. However, 21st century science is increasingly beingdefined by large-scale discovery science-based efforts to understandcomplex systems using massive datasets. Referred to as “Big Data” re-search, these efforts are yielding unprecedented results in domains rang-ing from genetics (ENCODE Project Consortium, 2013) to physics (TheATLAS Collaboration, 2012), astronomy (Raddick and Szalay, 2010),and medicine (Conger, 2012). The seeds of discovery science have par-ticularly taken root in the R-fMRI imaging community. Grassroots initia-tives, such as the 1000 Functional Connectomes Project (FCP) (Biswal etal., 2010), and International Neuroimaging Data-sharing Initiative(INDI) (Mennes et al., in press) have yielded datasets sufficient in sizeto demonstrate the feasibility and utility of generating novel hypothe-ses via discovery science. Efforts such as the Brain Genomics SuperstructProject http://clinicaltrials.gov/ct2/show/NCT01552460, the NathanKline Institute-Rockland Sample (Nooner et al., 2012) andOpenfmri.orghttps://openfmri.org/ are tantalizing the community with the prospectof more carefully coordinated, large-scale datasets, such as the HumanConnectome Project (Van Essen et al., 2012), upon which discoverycan truly be carried out.
The Big Data research model represents the best hope for theR-fMRI community to deliver on the promise of clinical applicationswithin a reasonable time. But as noted, biomarkers are not necessarilyneuroscientifically meaningful or interpretable; rather they are indi-cators of some link to a disease process. There is also tremendousvalue in using a priori knowledge and targeted hypotheses to narrowthe range of exploration, therebymoderating computational complexity.In the final analysis, neither hypothesis-driven nor exploratory researchwill be sufficient on its own. Exploratory results emerging from Big Dataare no less likely to be false (Ioannidis, 2005). Large datasets can yieldstatistically significant yet trivial results and no result is believableuntil it has been replicated in independent adequately powered samplesand preferably by independent investigators.
Breaking through the age barrier
While the challenges of discovering biomarkers in adults are sub-stantial, they pale by comparison to the difficulty and importance ofcarrying out thiswork in a developmental framework. About 2/3 of psy-chiatric disorders originate in the first two decades of life (Kessler et al.,
2005), with several manifesting symptoms within the first two to threeyears of life (e.g., autism, selective mutism, pediatric anxiety disorders,intellectual disability). Accordingly, the psychiatric community isincreasingly turning to brain imaging with hopes of developing objec-tive tools akin to pediatric physical growth charts, which would allowfor monitoring brain development from early infancy. Such normativeassessments would introduce the concepts of early detection, interven-tion and prevention to psychiatry. Sleep-based imaging studies ofintrinsic brain function are diminishing many of the challenges associ-ated with task-based studies of the developing brain (Dinstein et al.,2011), with data successfully collected even in the neonatal (Gao etal., 2009) or fetal stages of life (Thomason et al., 2013).
Importantly, the potential of sleep-based imaging studies of earlydeveloping populations needs to be tempered with methodologicaland interpretational considerations. Most notably, an emerging liter-ature has suggested that while the wakeful and sleeping intrinsic func-tional architectures are grossly similar (Fransson et al., 2009; Liu et al.,2008; Redcay et al., 2007), dynamic modulation between states exists(e.g., the anterior–posterior connectivity of the DN decreases markedlyduring deep sleep) (Boly et al., 2012; Brodbeck et al., 2012; Horovitzet al., 2009; Samann et al., 2010; Spoormaker et al., 2012). The implica-tions are two-fold. First, findings (e.g., population differences anddimensional brain-behavior relationships) obtained during sleep maynot necessarily generalize to wakeful states, and vice versa. Second,efforts focused onmapping lifespan trajectories from birth to adulthood(i.e., longitudinal and cross-sectional studies) cannot assume thatsleep-based imaging during early development and wakeful imagingstarting in childhood can be treated as equivalent. Rigorous examina-tion, and possibly multimodal imaging (e.g., simultaneous R-fMRI/EEG), will be required to link trajectories obtained during sleep withthose in wakeful states. Additional tasks include the need for continuedrefinement of protocols to accomplish sleep-imaging studies in toddlers(e.g., habituation to scanner sounds) (Redcay et al., 2007) and explora-tion of the changing impact of physiologic parameters (see sectionon Gaps and needs in evaluating the validity of R-fMRI measures) onimaging over the course of development (e.g., pulse rates vary by age:newborn— 70 to 190 beats/min, preschool-age— 80 to 120, 16 year-old— 60 to 100; respiration: newborn 30–60 breaths per minute, pre-schooler — 20 to 30, 16 year-old: 12–20).
Finally, it is worth noting that while sleep-based R-fMRI imagingstudies will undoubtedly play a crucial role in mapping human brainfunction during early brain development, they are unlikely to be idealfor clinical applications in the long run. The challenges of obtainingscans without sedation, the risk of which is generally not justifiablefor research in children, and the stubbornly high costs of fMRI, limitthe ability to obtain serial scans in at-risk or affected individuals. Thusthe greatest value of MRI data may be in leveraging the value of ancil-lary methods that are less cumbersome or expensive, e.g., EEG, opticalimaging (Cooper et al., 2012; Mesquita et al., 2010; Niu et al., 2012;White and Culver, 2010) and future techniques yet to come.
Conclusions
Fueled by the success of R-fMRI, functional connectomics is emerg-ing as a mainstream tool for brain-based biomarker identification forneurological and psychiatric illness. The present work reviewed theextant evidence fueling the growing enthusiasm in the field, whilehighlighting major gaps and needs at every stage of the scientificprocess (e.g., study design, sampling, data acquisition, data analysis,interpretation) that can hamper progress and potentially lead the fieldastray. Fortuitously, the recent success of R-fMRI is coincidingwith con-ceptual and cultural breakthroughs (e.g., the RDoC-based dimensionalreconceptualization of psychiatric illness, open science initiatives, theemergence of the Big Data research model, and increased applicationof multivariate pattern analysis), that are providing a compass for thefield. Importantly, while the bulk of the research reviewed in the

537F.X. Castellanos et al. / NeuroImage 80 (2013) 527–540
present work focused on the diagnosis of psychiatric illness, this is onlya piece of the puzzle. As recently noted by Kapur et al., the real impact ofimaging-based biomarkers will be through the identification ofbiological mechanisms that can lead to effective stratification based ondisease risk, expected treatment response and prognosis. These arethe ambitious goals and hopes of functional connectomics in the eraof Big Data.
Acknowledgments
The authors thank Eva Petkova, PhD for computing the ROC curvesand providing Fig. 1. This work was partially supported by grantsfrom NIH (K23MH087770 (ADM); R01MH094639 & R03MH096321(MPM)), and from the Brain & Behavior Research Foundation (formerlyNARSAD) to R.C.C.
Conflicts of interest
The authors declare no conflicts of interest.
References
ADHDConsortium, 2012. TheADHD-200 Consortium: amodel to advance the translationalpotential of neuroimaging in clinical neuroscience. Front. Syst. Neurosci. 6, 62.
Albert, N.B., Robertson, E.M., Miall, R.C., 2009. The resting human brain and motorlearning. Curr. Biol. 19, 1023–1027.
Altman, D.G., Bland, J.M., 1994. Diagnostic tests 2: predictive values. BMJ 309, 102.Anderson, J.S., Nielsen, J.A., Froehlich, A.L., Dubray, M.B., Druzgal, T.J., Cariello, A.N.,
Cooperrider, J.R., Zielinski, B.A., Ravichandran, C., Fletcher, P.T., Alexander, A.L.,Bigler, E.D., Lange, N., Lainhart, J.E., 2011. Functional connectivity magneticresonance imaging classification of autism. Brain 134, 3742–3754.
Andrews-Hanna, J.R., 2012. The brain's default network and its adaptive role in internalmentation. Neuroscientist 18, 251–270.
Andrews-Hanna, J.R., Reidler, J.S., Sepulcre, J., Poulin, R., Buckner, R.L., 2010. Functional-anatomic fractionation of the brain's default network. Neuron 65, 550–562.
Atkinson Jr., A.J., Colburn, W.A., DeGruttola, V.G., DeMets, D.L., Downing, G.J., Hoth, D.F.,Oates, J.A., Peck, C.C., Schooley, R.T., Spilker, B.A., Woodcock, J., Zeger, S.L., 2001.Biomarkers and surrogate endpoints: preferred definitions and conceptual frame-work. Clin. Pharmacol. Ther. 69, 89–95.
Bancaud, J., Angelergues, R., Bernouilli, C., Bonis, A., Bordas-Ferrer, M., Bresson, M.,Buser, P., Covello, L., Morel, P., Szikla, G., Takeda, A., Talairach, J., 1970. Functionalstereotaxic exploration (SEEG) of epilepsy. Electroencephalogr. Clin. Neurophysiol.28, 85–86.
Bassett, D.S., Nelson, B.G., Mueller, B.A., Camchong, J., Lim, K.O., 2012. Altered restingstate complexity in schizophrenia. Neuroimage 59, 2196–2207.
Beckmann, C.F., DeLuca, M., Devlin, J.T., Smith, S.M., 2005. Investigations into resting-state connectivity using independent component analysis. Philos. Trans. R. Soc.Lond. B Biol. Sci. 360, 1001–1013.
Bellec, P., Perlbarg, V., Jbabdi, S., Pelegrini-Issac, M., Anton, J.L., Doyon, J., Benali, H.,2006. Identification of large-scale networks in the brain using fMRI. Neuroimage29, 1231–1243.
Bellec, P., Rosa-Neto, P., Lyttelton, O.C., Benali, H., Evans, A.C., 2010. Multi-level bootstrapanalysis of stable clusters in resting-state fMRI. Neuroimage 51, 1126–1139.
Ben-Simon, E., Podlipsky, I., Arieli, A., Zhdanov, A., Hendler, T., 2008. Never restingbrain: simultaneous representation of two alpha related processes in humans.PLoS One 3, e3984.
Bettus, G., Bartolomei, F., Confort-Gouny, S., Guedj, E., Chauvel, P., Cozzone, P.J.,Ranjeva, J.P., Guye, M., 2010. Role of resting state functional connectivity MRI inpresurgical investigation of mesial temporal lobe epilepsy. J. Neurol. Neurosurg.Psychiatry 81, 1147–1154.
Bettus, G., Ranjeva, J.P., Wendling, F., Benar, C.G., Confort-Gouny, S., Regis, J., Chauvel,P., Cozzone, P.J., Lemieux, L., Bartolomei, F., Guye, M., 2011. Interictal functionalconnectivity of human epileptic networks assessed by intracerebral EEG andBOLD signal fluctuations. PLoS One 6, e20071.
Bianciardi, M., Fukunaga, M., Van Gelderen, P., Horovitz, S.G., de Zwart, J.A., Duyn, J.H.,2009. Modulation of spontaneous fMRI activity in human visual cortex by behavioralstate. Neuroimage 45, 160–168.
Birn, R.M., Diamond, J.B., Smith, M.A., Bandettini, P.A., 2006. Separating respiratory-variation-related fluctuations from neuronal-activity-related fluctuations in fMRI.Neuroimage 31, 1536–1548.
Birn, R.M., Murphy, K., Bandettini, P.A., 2008. The effect of respiration variations onindependent component analysis results of resting state functional connectivity.Hum. Brain Mapp. 29, 740–750.
Birn, R.M., Smith, M.A., Jones, T.B., Bandettini, P.A., 2008. The respiration responsefunction: the temporal dynamics of fMRI signal fluctuations related to changes inrespiration. Neuroimage 40, 644–654.
Bishop, C.M., 2006. Pattern Recognition and Machine Learning. Springer-Verlag,New York.
Biswal, B., Yetkin, F.Z., Haughton, V.M., Hyde, J.S., 1995. Functional connectivity in themotor cortex of resting human brain using echo-planar MRI. Magn. Reson. Med.34, 537–541.
Biswal, B.B., Mennes, M., Zuo, X.N., Gohel, S., Kelly, C., Smith, S.M., Beckmann, C.F.,Adelstein, J.S., Buckner, R.L., Colcombe, S.J., Dogonowski, A.M., Ernst, M., Fair, D.A.,Hampson, M., Hoptman, M.J., Hyde, J.S., Kiviniemi, V.J., Kötter, R., Li, S.J., Lin, C.P.,Lowe, M.J., Mackay, C., Madden, D.J., Madsen, K.H., Margulies, D.S., Mayberg, H.S.,McMahon, K., Monk, C.S., Mostofsky, S.H., Nagel, B.J., Pekar, J.J., Peltier, S.J.,Petersen, S.E., Riedl, V., Rombouts, S.A.R.B., Rypma, B., Schlaggar, B.L., Schmidt, S.,Seidler, R.D., Siegle, G.J., Sorg, C., Teng, G.J., Veijola, J., Villringer, A., Walter, M.,Wang, L., Weng, X.C., Whitfield-Gabrieli, S., Williamson, P., Windischberger, C.,Zang, Y.F., Zhang, H.Y., Castellanos, F.X., Milham, M.P., 2010. Toward discoveryscience of human brain function. Proc. Natl. Acad. Sci. U. S. A. 107, 4734–4739.
Blautzik, J., Keeser, D., Berman, A., Paolini, M., Kirsch, V., Mueller, S., Coates, U., Reiser,M., Teipel, S.J., Meindl, T., 2013. Long-term test–retest reliability of resting-statenetworks in healthy elderly subjects and mild cognitive impairment patients.J. Alzheimers Dis. 34, 741–754.
Blumensath, T., Jbabdi, S., Glasser, M.F., Van Essen, D.C., Ugurbil, K., Behrens, T.E., Smith,S.M., 2013. Spatially constrained hierarchical parcellation of the brain with resting-state fMRI. Neuroimage 76, 313–324.
Bohland, J.W., Saperstein, S., Pereira, F., Rapin, J., Grady, L., 2012. Network, anatomical,and non-imaging measures for the prediction of ADHD diagnosis in individualsubjects. Front. Syst. Neurosci. 6, 78.
Boly, M., Perlbarg, V., Marrelec, G., Schabus, M., Laureys, S., Doyon, J., Pelegrini-Issac, M.,Maquet, P., Benali, H., 2012. Hierarchical clustering of brain activity during humannonrapid eye movement sleep. Proc. Natl. Acad. Sci. U. S. A. 109, 5856–5861.
Bottger, J., Margulies, D.S., Horn, P., Thomale, U.W., Podlipsky, I., Shapira-Lichter, I.,Chaudhry, S.J., Szkudlarek, C., Mueller, K., Lohmann, G., Hendler, T., Bohner, G.,Fiebach, J.B., Villringer, A., Vajkoczy, P., Abbushi, A., 2011. A software tool for interac-tive exploration of intrinsic functional connectivity opens new perspectives for brainsurgery. Acta Neurochir. (Wien) 153, 1561–1572.
Brandt, T., 2006. How to see what you are looking for in fMRI and PET—or the crucialbaseline condition. J. Neurol. 253, 551–555.
Braun, U., Plichta, M.M., Esslinger, C., Sauer, C., Haddad, L., Grimm, O., Mier, D., Mohnke,S., Heinz, A., Erk, S., Walter, H., Seiferth, N., Kirsch, P., Meyer-Lindenberg, A., 2012.Tes–retest reliability of resting-state connectivity network characteristics usingfMRI and graph theoretical measures. Neuroimage 59, 1404–1412.
Breakspear, M., Brammer, M.J., Bullmore, E.T., Das, P., Williams, L.M., 2004. Spatiotemporalwavelet resampling for functional neuroimaging data. Hum. Brain Mapp. 23, 1–25.
Brodbeck, V., Kuhn, A., von Wegner, F., Morzelewski, A., Tagliazucchi, E., Borisov, S.,Michel, C.M., Laufs, H., 2012. EEG microstates of wakefulness and NREM sleep.Neuroimage 62, 2129–2139.
Brown, M.R., Sidhu, G.S., Greiner, R., Asgarian, N., Bastani, M., Silverstone, P.H.,Greenshaw, A.J., Dursun, S.M., 2012. ADHD-200 Global Competition: diagnosingADHD using personal characteristic data can outperform resting state fMRI measure-ments. Front. Syst. Neurosci. 6, 69.
Castellanos, F.X., Proal, E., 2012. Large-scale brain systems in ADHD: beyond theprefrontal-striatal model. Trends Cogn. Sci. 16, 17–26.
Chabernaud, C., Mennes, M., Kelly, C., Nooner, K., Di Martino, A., Castellanos, F.X.,Milham, M.P., 2012. Dimensional brain-behavior relationships in children withAttention-Deficit/Hyperactivity Disorder. Biol. Psychiatry 71, 434–442.
Chang, C., Glover, G.H., 2009. Effects of model-based physiological noise correctionon default mode network anti-correlations and correlations. Neuroimage 47,1448–1459.
Chang, C., Glover, G.H., 2010. Time–frequency dynamics of resting-state brain connec-tivity measured with fMRI. Neuroimage 50, 81–98.
Chang, C.W., Ho, C.C., Chen, J.H., 2012. ADHD classification by a texture analysis ofanatomical brain MRI data. Front. Syst. Neurosci. 6, 66.
Chen, A.C., Feng, W., Zhao, H., Yin, Y., Wang, P., 2008. EEG default mode network in thehuman brain: spectral regional field powers. Neuroimage 41, 561–574.
Cheng, W., Ji, X., Zhang, J., Feng, J., 2012. Individual classification of ADHD patients byintegrating multiscale neuroimaging markers and advanced pattern recognitiontechniques. Front. Syst. Neurosci. 6, 58.
Chou, Y.H., Panych, L.P., Dickey, C.C., Petrella, J.R., Chen, N.K., 2012. Investigation oflong-term reproducibility of intrinsic connectivity network mapping: a resting-state fMRI study. AJNR Am. J. Neuroradiol. 33, 833–838.
Colby, J.B., Rudie, J.D., Brown, J.A., Douglas, P.K., Cohen, M.S., Shehzad, Z., 2012. Insightsinto multimodal imaging classification of ADHD. Front. Syst. Neurosci. 6, 59.
Conger, K., 2012. B!G DATA. What it means for our health and the future of medicalresearch. Stanford Medicine. 1 (Summer).
Cooper, R.J., Gagnon, L., Goldenholz, D., Boas, D.A., Greve, D.N., 2012. The utility ofnear-infrared spectroscopy in the regression of low-frequency physiologicalnoise from functional magnetic resonance imaging data. Neuroimage 59,3128–3138.
Craddock, R.C., Holtzheimer III, P.E., Hu, X.P., Mayberg, H.S., 2009. Disease state predictionfrom resting state functional connectivity. Magn. Reson. Med. 62, 1619–1628.
Craddock, R.C., James, G.A., Holtzheimer III, P.E., Hu, X.P., Mayberg, H.S., 2012. A wholebrain fMRI atlas generated via spatially constrained spectral clustering. Hum. BrainMapp. 33, 1914–1928.
Cronbach, L.J., Meehl, P.E., 1955. Construct validity in psychological tests. Psychol. Bull.52, 281–302.
Cross-Disorder Group of the Psychiatric Genomics Consortium, 2013. Identification ofrisk loci with shared effects on five major psychiatric disorders: a genome-wideanalysis. Lancet. http://dx.doi.org/10.1016/S0140-6736(12)62129-1.
Dai, D., Wang, J., Hua, J., He, H., 2012. Classification of ADHD children through multi-modal magnetic resonance imaging. Front. Syst. Neurosci. 6, 63.

538 F.X. Castellanos et al. / NeuroImage 80 (2013) 527–540
Damoiseaux, J.S., Rombouts, S.A., Barkhof, F., Scheltens, P., Stam, C.J., Smith, S.M.,Beckmann, C.F., 2006. Consistent resting-state networks across healthy subjects.Proc. Natl. Acad. Sci. U. S. A. 103, 13848–13853.
Deshpande, G., Li, Z., Santhanam, P., Coles, C.D., Lynch, M.E., Hamann, S., Hu, X., 2010.Recursive cluster elimination based support vector machine for disease stateprediction using resting state functional and effective brain connectivity. PLoSOne 5, e14277.
Dey, S., Rao, A.R., Shah, M., 2012. Exploiting the brain's network structure in identifyingADHD subjects. Front. Syst. Neurosci. 6, 75.
Di Martino, A., Yan, C.G., Li, Q., Denio, E., Castellanos, F.X., Adolphs, R., Alaerts, K.,Anderson, J.S., Assaf, M., Bookheimer, S.Y., Dapretto, M., Delmonte, S., Deen, B.,Dinstein, I., Ertl-Wagner, B., Fair, D.A., Gallagher, L.N., Kennedy, D.P., Keysers, C.,Keown, C.L., Lainhart, J.E., Lord, C., Luna, B., O'Hearn, K., Menon, V., Minshew, N.,Mueller, S., Monk, C.S., Mueller, R.A., Nebel, M.B., Nigg, J., Pelphrey, K., Peltier, S.J.,Rudie, J.D., Sunaert, S., Thioux, M., Uddin, L.Q., Verhoeven, J.S., Wenderoth, N.,Wiggins, J.L., Mostofsky, S.H., Milham, M.P., 2013. The autism brain imaging dataexchange: towards large-scale evaluation of the intrinsic brain in autism. Mol.Psychiatry (in press).
Dinstein, I., Pierce, K., Eyler, L., Solso, S., Malach, R., Behrmann, M., Courchesne, E., 2011.Disrupted neural synchronization in toddlers with autism. Neuron 70, 1218–1225.
Dosenbach, N.U., Nardos, B., Cohen, A.L., Fair, D.A., Power, J.D., Church, J.A., Nelson, S.M.,Wig, G.S., Vogel, A.C., Lessov-Schlaggar, C.N., Barnes, K.A., Dubis, J.W., Feczko, E.,Coalson, R.S., Pruett Jr., J.R., Barch, D.M., Petersen, S.E., Schlaggar, B.L., 2010. Predictionof individual brain maturity using fMRI. Science 329, 1358–1361.
Du, W., Calhoun, V.D., Li, H., Ma, S., Eichele, T., Kiehl, K.A., Pearlson, G.D., Adali, T., 2012.High classification accuracy for schizophrenia with rest and task FMRI data. Front.Hum. Neurosci. 6, 145.
Dudley, J.T., Butte, A.J., 2009. Identification of discriminating biomarkers for humandisease using integrative network biology. Pac. Symp. Biocomput. 27–38.
Eidelberg, D., 2009.Metabolic brainnetworks inneurodegenerative disorders: a functionalimaging approach. Trends Neurosci. 32, 548–557.
Eloyan, A., Muschelli, J., Nebel, M.B., Liu, H., Han, F., Zhao, T., Barber, A.D., Joel, S., Pekar,J.J., Mostofsky, S.H., Caffo, B., 2012. Automated diagnoses of attention deficit hyper-active disorder using magnetic resonance imaging. Front. Syst. Neurosci. 6, 61.
ENCODE Project Consortium, 2013. An integrated encyclopedia of DNA elements in thehuman genome. Nature 57–74.
Fair, D.A., Nigg, J.T., Iyer, S., Bathula, D., Mills, K.L., Dosenbach, N.U., Schlaggar, B.L.,Mennes, M., Gutman, D., Bangaru, S., Buitelaar, J.K., Dickstein, D.P., Di, M.A.,Kennedy, D.N., Kelly, C., Luna, B., Schweitzer, J.B., Velanova, K., Wang, Y.F.,Mostofsky, S., Castellanos, F.X., Milham, M.P., 2012. Distinct neural signaturesdetected for ADHD subtypes after controlling for micro-movements in restingstate functional connectivity MRI data. Front. Syst. Neurosci. 6, 80.
Fan, Y., Liu, Y., Wu, H., Hao, Y., Liu, H., Liu, Z., Jiang, T., 2011. Discriminant analysis offunctional connectivity patterns on Grassmannmanifold. Neuroimage 56, 2058–2067.
Faria, A.V., Joel, S.E., Zhang, Y., Oishi, K., van Zjil, P.C., Miller, M.I., Pekar, J.J., Mori, S.,2012. Atlas-based analysis of resting-state functional connectivity: evaluation forreproducibility and multi-modal anatomy-function correlation studies. Neuroimage61, 613–621.
Fiecas, M., Ombao, H., van, L.D., Baumgartner, R., Coimbra, A., Feng, D., 2013. Quantifyingtemporal correlations: a test–retest evaluation of functional connectivity in resting-state fMRI. Neuroimage 65, 231–241.
Filippi, M., Agosta, F., Spinelli, E.G., Rocca, M.A., 2012. Imaging resting state brainfunction in multiple sclerosis. J. Neurol. http://dx.doi.org/10.1007/s00415-012-6695-z.
Filippini, N., MacIntosh, B.J., Hough, M.G., Goodwin, G.M., Frisoni, G.B., Smith, S.M.,Matthews, P.M., Beckmann, C.F., Mackay, C.E., 2009. Distinct patterns of brainactivity in young carriers of the APOE-epsilon4 allele. Proc. Natl. Acad. Sci. U. S. A.106, 7209–7214.
Fornito, A., Zalesky, A., Bassett, D.S., Meunier, D., Ellison-Wright, I., Yucel, M., Wood, S.J.,Shaw, K., O'Connor, J., Nertney, D., Mowry, B.J., Pantelis, C., Bullmore, E.T., 2011.Genetic influences on cost-efficient organization of human cortical functionalnetworks. J. Neurosci. 31, 3261–3270.
Fox, M.D., Greicius, M., 2010. Clinical applications of resting state functional connectivity.Front. Syst. Neurosci. 4, 19.
Fox, M.D., Corbetta, M., Snyder, A.Z., Vincent, J.L., Raichle, M.E., 2006. Spontaneousneuronal activity distinguishes human dorsal and ventral attention systems. Proc.Natl. Acad. Sci. U. S. A. 103, 10046–10051.
Fox, M.D., Zhang, D., Snyder, A.Z., Raichle, M.E., 2009. The global signal and observedanticorrelated resting state brain networks. J. Neurophysiol. 101, 3270–3283.
Fransson, P., Skiold, B., Engstrom, M., Hallberg, B., Mosskin, M., Aden, U., Lagercrantz,H., Blennow, M., 2009. Spontaneous brain activity in the newborn brain duringnatural sleep—an fMRI study in infants born at full term. Pediatr. Res. 66, 301–305.
Gao, W., Zhu, H., Giovanello, K.S., Smith, J.K., Shen, D., Gilmore, J.H., Lin, W., 2009.Evidence on the emergence of the brain's default network from 2-week-old to2-year-old healthy pediatric subjects. Proc. Natl. Acad. Sci. U. S. A. 106, 6790–6795.
Grimes, D.A., Schulz, K.F., 2002. Uses and abuses of screening tests. Lancet 359, 881–884.Guo, C.C., Kurth, F., Zhou, J., Mayer, E.A., Eickhoff, S.B., Kramer, J.H., Seeley, W.W., 2012.
One-year test–retest reliability of intrinsic connectivity network fMRI in olderadults. Neuroimage 61, 1471–1483.
Guyon, I., Elisseeff, A., 2003. An introduction to variable and feature selection. J. Mach.Learn. Res. 3, 1157–1182.
Haberg, A., Kvistad, K.A., Unsgard, G., Haraldseth, O., 2004. Preoperative blood oxygenlevel-dependent functional magnetic resonance imaging in patients with primarybrain tumors: clinical application and outcome. Neurosurgery 54, 902–914.
Hamer, H.M., Morris, H.H., Mascha, E.J., Karafa, M.T., Bingaman, W.E., Bej, M.D., Burgess,R.C., Dinner, D.S., Foldvary, N.R., Hahn, J.F., Kotagal, P., Najm, I., Wyllie, E., Luders,
H.O., 2002. Complications of invasive video-EEG monitoring with subdural gridelectrodes. Neurology 58, 97–103.
Hansen, L.K., 2007. Multivariate strategies in functional magnetic resonance imaging.Brain Lang. 102, 186–191.
He, B.J., Snyder, A.Z., Zempel, J.M., Smyth, M.D., Raichle, M.E., 2008. Electrophysiologicalcorrelates of the brain's intrinsic large-scale functional architecture. Proc. Natl.Acad. Sci. U. S. A. 105, 16039–16044.
Hill, D.L., Smith, A.D., Simmons, A., Maurer Jr., C.R., Cox, T.C., Elwes, R., Brammer, M.,Hawkes, D.J., Polkey, C.E., 2000. Sources of error in comparing functional magneticresonance imaging and invasive electrophysiological recordings. J. Neurosurg. 93,214–223.
Horovitz, S.G., Braun, A.R., Carr, W.S., Picchioni, D., Balkin, T.J., Fukunaga, M., Duyn, J.H.,2009. Decoupling of the brain's default mode network during deep sleep. Proc.Natl. Acad. Sci. U. S. A. 106, 11376–11381.
Horsley, V., 1909. The Linacre Lecture on the function of the so-called motor area of thebrain: delivered to the Master and Fellows of St. John's College, Cambridge, May6th, 1909. Br. Med. J. 2, 121–132.
Ioannidis, J.P., 2005. Whymost published research findings are false. PLoS Med. 2, e124.Johnston, J.M., Vaishnavi, S.N., Smyth, M.D., Zhang, D., He, B.J., Zempel, J.M., Shimony,
J.S., Snyder, A.Z., Raichle, M.E., 2008. Loss of resting interhemispheric functionalconnectivity after complete section of the corpus callosum. J. Neurosci. 28,6453–6458.
Kapur, S., Phillips, A.G., Insel, T.R., 2012. Why has it taken so long for biological psychiatryto develop clinical tests and what to do about it? Mol. Psychiatry 17, 1174–1179.
Kekhia, H., Rigolo, L., Norton, I., Golby, A.J., 2011. Special surgical considerations forfunctional brain mapping. Neurosurg. Clin. N. Am. 22, 111–132 (vii).
Keller, C.J., Bickel, S., Entz, L., Ulbert, I., Milham, M.P., Kelly, C., Mehta, A.D., 2011. Intrinsicfunctional architecture predicts electrically evoked responses in the human brain.Proc. Natl. Acad. Sci. U. S. A. 108, 10308–10313.
Keller, C.J., Bickel, S., Honey, C.J., Groppe, D.M., Entz, L., Craddock, R.C., Lado, F.A., Kelly,C., Milham, M.P., Mehta, A.D., 2013. Neurophysiological investigation of spontaneouscorrelated and anticorrelated fluctuations of the BOLD signal. J. Neurosci. 33,6333–6342.
Kelly, C., Uddin, L.Q., Shehzad, Z., Margulies, D.S., Castellanos, F.X., Milham, M.P.,Petrides, M., 2010. Broca's region: linking human brain functional connectivity dataand non-human primate tracing anatomy studies. Eur. J. Neurosci. 32, 383–398.
Kelly, C., Biswal, B.B., Craddock, R.C., Castellanos, F.X.,Milham,M.P., 2012. Characterizing var-iation in the functional connectome: promise andpitfalls. Trends Cogn. Sci. 16, 181–188.
Kessler, R.C., Berglund, P., Demler, O., Jin, R., Merikangas, K.R., Walters, E.E., 2005. Life-time prevalence and age-of-onset distributions of DSM-IV disorders in the NationalComorbidity Survey Replication. Arch. Gen. Psychiatry 62, 593–602.
Kokkonen, S.M., Nikkinen, J., Remes, J., Kantola, J., Starck, T., Haapea, M., Tuominen, J.,Tervonen, O., Kiviniemi, V., 2009. Preoperative localization of the sensorimotorarea using independent component analysis of resting-state fMRI. Magn. Reson.Imaging 27, 733–740.
Kristo, G., Rutten, G.J., Raemaekers, M., de, G.B., Rombouts, S., Ramsey, N., 2012. Taskand task-free FMRI reproducibility comparison for motor network identification.Hum. Brain Mapp. http://dx.doi.org/10.1002/hbm.22180 (Electronic publicationahead of print).
Kunii, N., Kamada, K., Ota, T., Kawai, K., Saito, N., 2011. A detailed analysis of functionalmagnetic resonance imaging in the frontal language area: a comparative studywith extraoperative electrocortical stimulation. Neurosurgery 69, 590–596.
Lawrence, N.D., Schoelkopf, B., 2001. Estimating a kernel Fisher discriminant in thepresence of label noise. Proceedings of the 18th International Conference onMachine Learning, pp. 306–313.
Lewis, C.M., Baldassarre, A., Committeri, G., Romani, G.L., Corbetta, M., 2009. Learningsculpts the spontaneous activity of the resting human brain. Proc. Natl. Acad. Sci.U. S. A. 106, 17558–17563.
Liang, X., Wang, J., Yan, C., Shu, N., Xu, K., Gong, G., He, Y., 2012. Effects of differentcorrelation metrics and preprocessing factors on small-world brain functionalnetworks: a resting-state functional MRI study. PLoS One 7, e32766.
Linden, D.E., 2012. The challenges and promise of neuroimaging in psychiatry. Neuron73, 8–22.
Liu, W.C., Flax, J.F., Guise, K.G., Sukul, V., Benasich, A.A., 2008. Functional connectivity ofthe sensorimotor area in naturally sleeping infants. Brain Res. 1223, 42–49.
Liu, M., Zeng, L.L., Shen, H., Liu, Z., Hu, D., 2012. Potential risk for healthy siblings todevelop schizophrenia: evidence from pattern classification with whole-brainconnectivity. Neuroreport 23, 265–269.
Llinas, R.R., Ribary, U., Jeanmonod, D., Kronberg, E., Mitra, P.P., 1999. Thalamocorticaldysrhythmia: a neurological and neuropsychiatric syndrome characterized bymagnetoencephalography. Proc. Natl. Acad. Sci. U. S. A. 96, 15222–15227.
Lohmann, G., Margulies, D.S., Horstmann, A., Pleger, B., Lepsien, J., Goldhahn, D.,Schloegl, H., Stumvoll, M., Villringer, A., Turner, R., 2010. Eigenvector centralitymapping for analyzing connectivity patterns in fMRI data of the human brain.PLoS One 5, e10232.
Lord, A., Horn, D., Breakspear, M., Walter, M., 2012. Changes in community structure ofresting state functional connectivity in unipolar depression. PLoS One 7, e41282.
Lund, T.E., 2001. fcMRI-mapping functional connectivity or correlating cardiac-inducednoise? Magn. Reson. Med. 46, 628–629.
Lynch, C.J., Uddin, L.Q., Supekar, K., Khouzam, A., Phillips, J., Menon, V., 2013. Defaultmode network in childhood autism: posteromedial cortex heterogeneity and rela-tionship with social deficits. Biol. Psychiatry. http://dx.doi.org/10.1016/j.biopsych.2012.12.013.
Ma, L., Narayana, S., Robin, D.A., Fox, P.T., Xiong, J., 2011. Changes occur in resting statenetwork of motor system during 4 weeks of motor skill learning. Neuroimage 58,226–233.
539F.X. Castellanos et al. / NeuroImage 80 (2013) 527–540
Mannfolk, P., Nilsson, M., Hansson, H., Stahlberg, F., Fransson, P., Weibull, A., Svensson,J., Wirestam, R., Olsrud, J., 2011. Can resting-state functional MRI serve as a com-plement to task-based mapping of sensorimotor function? A test–retest reliabilitystudy in healthy volunteers. J. Magn. Reson. Imaging 34, 511–517.
Margulies, D.S., Vincent, J.L., Kelly, C., Lohmann, G., Uddin, L.Q., Biswal, B.B., Villringer,A., Castellanos, F.X., Milham, M.P., Petrides, M., 2009. Precuneus shares intrinsicfunctional architecture in humans and monkeys. Proc. Natl. Acad. Sci. U. S. A.106, 20069–20074.
Marrelec, G., Krainik, A., Duffau, H., Pelegrini-Issac, M., Lehericy, S., Doyon, J., Benali, H.,2006. Partial correlation for functional brain interactivity investigation in functionalMRI. Neuroimage 32, 228–237.
Martino, J., Honma, S.M., Findlay, A.M., Guggisberg, A.G., Owen, J.P., Kirsch, H.E., Berger,M.S., Nagarajan, S.S., 2011. Resting functional connectivity in patients with braintumors in eloquent areas. Ann. Neurol. 69, 521–532.
Marx, E., Deutschlander, A., Stephan, T., Dieterich, M., Wiesmann, M., Brandt, T., 2004.Eyes open and eyes closed as rest conditions: impact on brain activation patterns.Neuroimage 21, 1818–1824.
Marx, M., Pauly, K.B., Chang, C., 2013. A novel approach for global noise reduction inresting-state fMRI: APPLECOR. Neuroimage 64, 19–31.
Matthews, P.M., Honey, G.D., Bullmore, E.T., 2006. Applications of fMRI in translationalmedicine and clinical practice. Nat. Rev. Neurosci. 7, 732–744.
McAvoy, M., Larson-Prior, L., Nolan, T.S., Vaishnavi, S.N., Raichle, M.E., d'Avossa, G.,2008. Resting states affect spontaneous BOLD oscillations in sensory andparalimbic cortex. J. Neurophysiol. 100, 922–931.
McCormick, C., Quraan, M., Cohn, M., Valiante, T.A., McAndrews, M.P., 2013. Defaultmode network connectivity indicates episodic memory capacity in mesial tempo-ral lobe epilepsy. Epilepsia 54, 809–818.
McIntosh, A.R., Lobaugh, N.J., 2004. Partial least squares analysis of neuroimaging data:applications and advances. Neuroimage 23 (Suppl. 1), S250–S263.
Mehta, A.D., Klein, G., 2010. Clinical utility of functional magnetic resonance imagingfor brain mapping in epilepsy surgery. Epilepsy Res. 89, 126–132.
Meindl, T., Teipel, S., Elmouden, R., Mueller, S., Koch, W., Dietrich, O., Coates, U., Reiser,M., Glaser, C., 2010. Test–retest reproducibility of the default-mode network inhealthy individuals. Hum. Brain Mapp. 31, 237–246.
Mennes, M., Kelly, C., Zuo, X.N., Di Martino, A., Biswal, B., Castellanos, F.X., Milham, M.P.,2010. Inter-individual differences in resting state functional connectivity predicttask-induced BOLD activity. Neuroimage 50, 1690–1701.
Mennes, M., Biswal, B., Castellanos, F.X., Milham, M.P., 2012. Making data sharing work: theFCP/INDI experience. Neuroimage. http://dx.doi.org/10.1016/j.neuroimage.2012.10.064(in press).
Mennes, M., Kelly, C., Colcombe, S., Castellanos, F.X., Milham, M.P., 2013. The extrinsicand intrinsic functional architectures of the human brain are not equivalent. Cereb.Cortex 23, 223–229.
Mesquita, R.C., Franceschini,M.A., Boas, D.A., 2010. Resting state functional connectivity ofthe whole head with near-infrared spectroscopy. Biomed. Opt. Express 1, 324–336.
Milham, M.P., 2012. Open neuroscience solutions for the connectome-wide associationera. Neuron 73, 214–218.
Mourao-Miranda, J., Bokde, A.L., Born, C., Hampel, H., Stetter, M., 2005. Classifying brainstates and determining the discriminating activation patterns: Support VectorMachine on functional MRI data. Neuroimage 28, 980–995.
Mueller, S.G., Weiner, M.W., Thal, L.J., Petersen, R.C., Jack, C.R., Jagust, W., Trojanowski,J.Q., Toga, A.W., Beckett, L., 2005. Ways toward an early diagnosis in Alzheimer'sdisease: the Alzheimer's Disease Neuroimaging Initiative (ADNI). AlzheimersDement. 1, 55–66.
Murdaugh, D.L., Shinkareva, S.V., Deshpande, H.R., Wang, J., Pennick, M.R., Kana, R.K.,2012. Differential deactivation during mentalizing and classification of autismbased on default mode network connectivity. PLoS One 7, e50064.
Negishi, M., Martuzzi, R., Novotny, E.J., Spencer, D.D., Constable, R.T., 2011. Functional MRIconnectivity as a predictor of the surgical outcome of epilepsy. Epilepsia 52, 1733–1740.
Niazy, R.K., Xie, J., Miller, K., Beckmann, C.F., Smith, S.M., 2011. Spectral characteristicsof resting state networks. Prog. Brain Res. 193, 259–276.
Niethammer, M., Eidelberg, D., 2012. Metabolic brain networks in translational neurol-ogy: concepts and applications. Ann. Neurol. 72, 635–647.
Niu, H., Wang, J., Zhao, T., Shu, N., He, Y., 2012. Revealing topological organization ofhuman brain functional networks with resting-state functional near infrared spec-troscopy. PLoS One 7, e45771.
Noirhomme, Q., Soddu, A., Lehembre, R., Vanhaudenhuyse, A., Boveroux, P., Boly, M.,Laureys, S., 2010. Brain connectivity in pathological and pharmacological coma.Front. Syst. Neurosci. 4, 160.
Nooner, K.B., Colcombe, S.J., Tobe, R.H., Mennes, M., Benedict, M.M., Moreno, A.L.,Panek, L.J., Brown, S., Zavitz, S.T., Li, Q., Sikka, S., Gutman, D., Bangaru, S.,Schlachter, R.T., Kamiel, S.M., Anwar, A.R., Hinz, C.M., Kaplan, M.S., Rachlin, A.B.,Adelsberg, S., Cheung, B., Khanuja, R., Yan, C., Craddock, R.C., Calhoun, V.,Courtney, W., King, M., Wood, D., Cox, C.L., Kelly, A.M., Di, M.A., Petkova, E., Reiss,P.T., Duan, N., Thomsen, D., Biswal, B., Coffey, B., Hoptman, M.J., Javitt, D.C.,Pomara, N., Sidtis, J.J., Koplewicz, H.S., Castellanos, F.X., Leventhal, B.L., Milham,M.P., 2012. The NKI-Rockland Sample: a model for accelerating the pace of discoveryscience in psychiatry. Front. Neurosci. 6, 152.
Nunnally, J.C., 1978. Psychometric Theory. McGraw Hill, New York.Ojemann, G.A., 1979. Individual variability in cortical localization of language.
J. Neurosurg. 50, 164–169.Pawela, C.P., Biswal, B.B., Hudetz, A.G., Li, R., Jones, S.R., Cho, Y.R., Matloub, H.S., Hyde,
J.S., 2010. Interhemispheric neuroplasticity following limb deafferentationdetected by resting-state functional connectivity magnetic resonance imaging(fcMRI) and functional magnetic resonance imaging (fMRI). Neuroimage 49,2467–2478.
Pendleton, C., Zaidi, H.A., Chaichana, K.L., Raza, S.M., Carson, B.S., Cohen-Gadol, A.A.,Quinones-Hinojosa, A., 2012. Harvey Cushing's contributions to motor mapping:1902–1912. Cortex 48, 7–14.
Pereira, F., Mitchell, T., Botvinick, M., 2009. Machine learning classifiers and fMRI: a tu-torial overview. Neuroimage 45, S199–S209.
Pittau, F., Grova, C., Moeller, F., Dubeau, F., Gotman, J., 2012. Patterns of altered func-tional connectivity in mesial temporal lobe epilepsy. Epilepsia 53, 1013–1023.
Pujol, J., Conesa, G., Deus, J., Lopez-Obarrio, L., Isamat, F., Capdevila, A., 1998. Clinical ap-plication of functional magnetic resonance imaging in presurgical identification ofthe central sulcus. J. Neurosurg. 88, 863–869.
Raddick, M.J., Szalay, A.S., 2010. The universe online. Science 329, 1028–1029.Raichle, M.E., Snyder, A.Z., 2007. A default mode of brain function: a brief history of an
evolving idea. Neuroimage 37, 1083–1090.Rao, R.B., Fung, G., Rosales, R., 2008. On the dangers of cross-validation. An experimen-
tal evaluation. Proceedings of the 2008 SIAM International Conference on DataMining DM08, pp. 588–596.
Redcay, E., Kennedy, D.P., Courchesne, E., 2007. fMRI during natural sleep as a methodto study brain function during early childhood. Neuroimage 38, 696–707.
Regier, D.A., Narrow, W.E., Clarke, D.E., Kraemer, H.C., Kuramoto, S.J., Kuhl, E.A., Kupfer,D.J., 2013. DSM-5 field trials in the United States and Canada, Part II: test–retest re-liability of selected categorical diagnoses. Am. J. Psychiatry 170, 59–70.
Richiardi, J., Gschwind, M., Simioni, S., Annoni, J.M., Greco, B., Hagmann, P., Schluep, M.,Vuilleumier, P., Van De Ville, D., 2012. Classifying minimally disabled multiple sclero-sis patients from resting state functional connectivity. Neuroimage 62, 2021–2033.
Roux, F.E., Boulanouar, K., Lotterie, J.A., Mejdoubi, M., LeSage, J.P., Berry, I., 2003.Language functional magnetic resonance imaging in preoperative assessment of lan-guage areas: correlationwith direct cortical stimulation. Neurosurgery 52, 1335–1345.
Ruge, M.I., Victor, J., Hosain, S., Correa, D.D., Relkin, N.R., Tabar, V., Brennan, C., Gutin,P.H., Hirsch, J., 1999. Concordance between functional magnetic resonance imagingand intraoperative language mapping. Stereotact. Funct. Neurosurg. 72, 95–102.
Rutten, G.J., Ramsey, N.F., van Rijen, P.C., Noordmans, H.J., van Veelen, C.W., 2002. De-velopment of a functional magnetic resonance imaging protocol for intraoperativelocalization of critical temporoparietal language areas. Ann. Neurol. 51, 350–360.
Ryali, S., Chen, T., Supekar, K., Menon, V., 2012. Estimation of functional connectivity infMRI data using stability selection-based sparse partial correlation with elastic netpenalty. Neuroimage 59, 3852–3861.
Salvador, R., Martinez, A., Pomarol-Clotet, E., Gomar, J., Vila, F., Sarro, S., Capdevila, A.,Bullmore, E., 2008. A simple view of the brain through a frequency-specific func-tional connectivity measure. Neuroimage 39, 279–289.
Samann, P.G., Tully, C., Spoormaker, V.I., Wetter, T.C., Holsboer, F., Wehrle, R., Czisch,M., 2010. Increased sleep pressure reduces resting state functional connectivity.MAGMA 23, 375–389.
Sato, J.R., Hoexter, M.Q., Fujita, A., Rohde, L.A., 2012. Evaluation of pattern recognitionand feature extraction methods in ADHD prediction. Front. Syst. Neurosci. 6, 68.
Schevon, C.A., Cappell, J., Emerson, R., Isler, J., Grieve, P., Goodman, R., McKhann Jr., G.,Weiner, H., Doyle, W., Kuzniecky, R., Devinsky, O., Gilliam, F., 2007. Cortical abnor-malities in epilepsy revealed by local EEG synchrony. Neuroimage 35, 140–148.
Sechrest, L., 2005. Validity of measures is no simple matter. Health Serv. Res. 40,1584–1604.
Shannon, B.J., Dosenbach, R.A., Su, Y., Vlassenko, A.G., Larson-Prior, L.J., Nolan, T.S.,Snyder, A.Z., Raichle, M.E., 2013. Morning–evening variation in human brain me-tabolism and memory circuits. J. Neurophysiol. 109, 1444–1456.
Shehzad, Z., Kelly, A.M., Reiss, P.T., Gee, D.G., Gotimer, K., Uddin, L.Q., Lee, S.H.,Margulies, D.S., Roy, A.K., Biswal, B.B., Petkova, E., Castellanos, F.X., Milham, M.P.,2009. The resting brain: unconstrained yet reliable. Cereb. Cortex 19, 2209–2229.
Sheline, Y.I., Raichle, M.E., 2013. Resting state functional connectivity in preclinicalAlzheimer's disease. Biol. Psychiatry. http://dx.doi.org/10.1016/j.biopsych.2012.11.028.:.
Shen, H., Wang, L., Liu, Y., Hu, D., 2010. Discriminative analysis of resting-state func-tional connectivity patterns of schizophrenia using low dimensional embeddingof fMRI. Neuroimage 49, 3110–3121.
Shimony, J.S., Zhang, D., Johnston, J.M., Fox, M.D., Roy, A., Leuthardt, E.C., 2009. Resting-state spontaneous fluctuations in brain activity: a new paradigm for presurgicalplanning using fMRI. Acad. Radiol. 16, 578–583.
Sidhu, G.S., Asgarian, N., Greiner, R., Brown, M.R., 2012. Kernel Principal ComponentAnalysis for dimensionality reduction in fMRI-based diagnosis of ADHD. Front.Syst. Neurosci. 6, 74.
Silvergeld, D.L., 2001. Cortical mapping, In: Luders, H.O., Comair, Y.G. (Eds.), EpilepsySurgery, 2nd ed. Lippincott Williams & Wilkins, Philadelphia, pp. 633–639.
Sinai, A., Bowers, C.W., Crainiceanu, C.M., Boatman, D., Gordon, B., Lesser, R.P., Lenz,F.A., Crone, N.E., 2005. Electrocorticographic high gamma activity versus electricalcortical stimulation mapping of naming. Brain 128, 1556–1570.
Smith, S.M., Fox, P.T., Miller, K.L., Glahn, D.C., Fox, P.M., Mackay, C.E., Filippini, N.,Watkins, K.E., Toro, R., Laird, A.R., Beckmann, C.F., 2009. Correspondence of thebrain's functional architecture during activation and rest. Proc. Natl. Acad. Sci. U.S. A. 106, 13040–13045.
Smith, S.M., Miller, K.L., Salimi-Khorshidi, G., Webster, M., Beckmann, C.F., Nichols, T.E.,Ramsey, J.D., Woolrich, M.W., 2011. Network modelling methods for fMRI.Neuroimage 54, 875–891.
Snyder, A.Z., Raichle, M.E., 2012. A brief history of the resting state: the WashingtonUniversity perspective. Neuroimage 62, 902–910.
Song, J., Desphande, A.S., Meier, T.B., Tudorascu, D.L., Vergun, S., Nair, V.A., Biswal, B.B.,Meyerand, M.E., Birn, R.M., Bellec, P., Prabhakaran, V., 2012. Age-related differ-ences in test–retest reliability in resting-state brain functional connectivity. PLoSOne 7, e49847.
Spencer, S.S., 2002. Neural networks in human epilepsy: evidence of and implicationsfor treatment. Epilepsia 43, 219–227.

540 F.X. Castellanos et al. / NeuroImage 80 (2013) 527–540
Spoormaker, V.I., Gleiser, P.M., Czisch, M., 2012. Frontoparietal connectivity and hierar-chical structure of the brain's functional network during sleep. Front. Neurol. 3, 80.
Steinmetz, H., Furst, G., Freund, H.J., 1990. Variation of perisylvian and calcarine ana-tomic landmarks within stereotaxic proportional coordinates. AJNR Am. J.Neuroradiol. 11, 1123–1130.
Stufflebeam, S.M., Liu, H., Sepulcre, J., Tanaka, N., Buckner, R.L., Madsen, J.R., 2011.Localization of focal epileptic discharges using functional connectivity magneticresonance imaging. J. Neurosurg. 114, 1693–1697.
Tang, Y.,Wang, L., Cao, F., Tan, L., 2012. Identify schizophrenia using resting-state function-al connectivity: an exploratory research and analysis. Biomed. Eng. Online 11, 50.
Taubert, M., Lohmann, G., Margulies, D.S., Villringer, A., Ragert, P., 2011. Long-term ef-fects of motor training on resting-state networks and underlying brain structure.Neuroimage 57, 1492–1498.
The ATLAS Collaboration, 2012. A particle consistent with the Higgs Boson observedwith the ATLAS detector at the Large Hadron Collider. Science 338, 1576–1582.
Thomason, M.E., Dennis, E.L., Joshi, A.A., Joshi, S.H., Dinov, I.D., Chang, C., Henry, M.L.,Johnson, R.F., Thompson, P.M., Toga, A.W., Glover, G.H., Van Horn, J.D., Gotlib, I.H.,2011. Resting-state fMRI can reliably map neural networks in children. Neuroimage55, 165–175.
Thomason, M.E., Dassanayake, M.T., Shen, S., Katkuri, Y., Alexis, M., Anderson, A.L., Yeo,L., Mody, S., Hernandez-Andrade, E., Hassan, S.S., Studholme, C., Jeong, J.W.,Romero, R., 2013. Cross-hemispheric functional connectivity in the human fetalbrain. Sci. Transl. Med. 5, 173ra24.
Tie, Y., Rigolo, L., Norton, I.H., Huang, R.Y.,Wu,W., Orringer, D.,Mukundan Jr., S., Golby, A.J.,2013. Defining language networks from resting-state fMRI for surgical planning—afeasibility study. Hum. Brain Mapp. http://dx.doi.org/10.1002/hbm.22231.
Tomasi, D., Volkow, N.D., 2010. Functional connectivity density mapping. Proc. Natl.Acad. Sci. U. S. A. 107, 9885–9890.
Turner, J.A., Chen, H., Mathalon, D.H., Allen, E.A., Mayer, A.R., Abbott, C.C., Calhoun, V.D.,Bustillo, J., 2012. Reliability of the amplitude of low-frequency fluctuations in rest-ing state fMRI in chronic schizophrenia. Psychiatry Res. 201, 253–255.
Uludag, K., Dubowitz, D.J., Yoder, E.J., Restom, K., Liu, T.T., Buxton, R.B., 2004. Couplingof cerebral blood flow and oxygen consumption during physiological activationand deactivation measured with fMRI. Neuroimage 23, 148–155.
Van Dijk, K.R., Hedden, T., Venkataraman, A., Evans, K.C., Lazar, S.W., Buckner, R.L.,2010. Intrinsic functional connectivity as a tool for human connectomics: theory,properties, and optimization. J. Neurophysiol. 103, 297–321.
Van Essen, D.C., Ugurbil, K., Auerbach, E., Barch, D., Behrens, T.E., Bucholz, R., Chang, A.,Chen, L., Corbetta, M., Curtiss, S.W., Della Penna, S., Feinberg, D., Glasser, M.F.,Harel, N., Heath, A.C., Larson-Prior, L., Marcus, D., Michalareas, G., Moeller, S.,Oostenveld, R., Petersen, S.E., Prior, F., Schlaggar, B.L., Smith, S.M., Snyder, A.Z.,Xu, J., Yacoub, E., 2012. The Human Connectome Project: a data acquisition per-spective. Neuroimage 62, 2222–2231.
Varoquaux, G., Gramfort, A., Poline, J.-B., Thirion, B., 2010. Brain covariance selection:better individual functional connectivity models using population prior. Advancesin Neural Information Processing Systems, Vancouver, Canada, pp. 1–10 (http://hal.inria.fr/inria-00512451).
Venkataraman, A., Kubicki, M., Westin, C.F., Golland, P., 2010. Robust feature selectionin resting-state fMRI connectivity based on population studies. Conf. Comput. Vis.Pattern. Recognit. Workshops 63–70.
Venkataraman, A., Whitford, T.J., Westin, C.F., Golland, P., Kubicki, M., 2012. Wholebrain resting state functional connectivity abnormalities in schizophrenia.Schizophr. Res. 139, 7–12.
Vissers, M.E., Cohen, M.X., Geurts, H.M., 2012. Brain connectivity and high functioningautism: a promising path of research that needs refined models, methodologicalconvergence, and stronger behavioral links. Neurosci. Biobehav. Rev. 36, 604–625.
Wang, L., Zhu, J., Zou, H., 2007. Hybrid huberized support vector machines for microar-ray classification. Proceedings of the 24th International Conference on MachineLearning, 24, pp. 983–990.
Wang, J.H., Zuo, X.N., Gohel, S., Milham, M.P., Biswal, B.B., He, Y., 2011. Graph theoret-ical analysis of functional brain networks: test–retest evaluation on short- andlong-term resting-state functional MRI data. PLoS One 6, e21976.
Wang, L., Hermens, D.F., Hickie, I.B., Lagopoulos, J., 2012. A systematic review of resting-state functional-MRI studies in major depression. J. Affect. Disord. 142, 6–12.
Wang, J., Zuo, X., Dai, Z., Xia, M., Zhao, Z., Zhao, X., Jia, J., Han, Y., He, Y., 2013. Disruptedfunctional brain connectome in individuals at risk for Alzheimer's disease. Biol.Psychiatry 73, 472–481.
Warren, C.P., Hu, S., Stead, M., Brinkmann, B.H., Bower, M.R., Worrell, G.A., 2010. Syn-chrony in normal and focal epileptic brain: the seizure onset zone is functionallydisconnected. J. Neurophysiol. 104, 3530–3539.
Weiner, M.W., Veitch, D.P., Aisen, P.S., Beckett, L.A., Cairns, N.J., Green, R.C., Harvey, D.,Jack, C.R., Jagust, W., Liu, E., Morris, J.C., Petersen, R.C., Saykin, A.J., Schmidt, M.E.,Shaw, L., Siuciak, J.A., Soares, H., Toga, A.W., Trojanowski, J.Q., 2012. TheAlzheimer's Disease Neuroimaging Initiative: a review of papers published sinceits inception. Alzheimers Dement. 8, S1–S68.
White, B.R., Culver, J.P., 2010. Quantitative evaluation of high-density diffuse optical to-mography: in vivo resolution and mapping performance. J. Biomed. Opt. 15, 026006.
Wyler, A.R., Ojemann, G.A., Lettich, E., Ward Jr., A.A., 1984. Subdural strip electrodes forlocalizing epileptogenic foci. J. Neurosurg. 60, 1195–1200.
Xia, M., He, Y., 2011. Magnetic resonance imaging and graph theoretical analysis ofcomplex brain networks in neuropsychiatric disorders. Brain Connect. 1, 349–365.
Yan, C., Liu, D., He, Y., Zou, Q., Zhu, C., Zuo, X., Long, X., Zang, Y., 2009. Spontaneousbrain activity in the default mode network is sensitive to different resting-stateconditions with limited cognitive load. PLoS One 4, e5743.
Yan, C.G., Cheung, B., Kelly, C., Colcombe, S., Craddock, R.C., Di Martino, A., Li, Q., Zuo,X.N., Castellanos, F.X., Milham, M.P., 2013. A comprehensive assessment of regionalvariation in the impact of micromovement head motion on functionalconnectomics. Neuroimage 76C, 183–201.
Yang, H., Long, X.Y., Yang, Y., Yan, H., Zhu, C.Z., Zhou, X.P., Zang, Y.F., Gong, Q.Y., 2007.Amplitude of low frequency fluctuation within visual areas revealed by resting-state functional MRI. Neuroimage 36, 144–152.
Youden, W.J., 1950. Index for rating diagnostic tests. Cancer 3, 32–35.Yu, Y., Shen, H., Zhang, H., Zeng, L.L., Xue, Z., Hu, D., 2013. Functional connectivity-
based signatures of schizophrenia revealed by multiclass pattern analysis ofresting-state fMRI from schizophrenic patients and their healthy siblings. Biomed.Eng. Online 12, 10.
Zeng, L.L., Shen, H., Liu, L., Wang, L., Li, B., Fang, P., Zhou, Z., Li, Y., Hu, D., 2012. Identi-fying major depression using whole-brain functional connectivity: a multivariatepattern analysis. Brain 135, 1498–1507.
Zhang, D., Raichle,M.E., 2010. Disease and the brain's dark energy. Nat. Rev. Neurol. 6, 15–28.Zhang, D., Johnston, J.M., Fox, M.D., Leuthardt, E.C., Grubb, R.L., Chicoine, M.R., Smyth, M.D.,
Snyder, A.Z., Raichle, M.E., Shimony, J.S., 2009. Preoperative sensorimotor mapping inbrain tumor patients using spontaneous fluctuations in neuronal activity imaged withfunctional magnetic resonance imaging: initial experience. Neurosurgery 65, 226–236.
Zhang, J., Cheng,W., Wang, Z., Zhang, Z., Lu, W., Lu, G., Feng, J., 2012. Pattern classificationof large-scale functional brain networks: identification of informative neuroimagingmarkers for epilepsy. PLoS One 7, e36733.
Zhu, C.Z., Zang, Y.F., Cao, Q.J., Yan, C.G., He, Y., Jiang, T.Z., Sui, M.Q., Wang, Y.F., 2008.Fisher discriminative analysis of resting-state brain function for attention-deficit/hyperactivity disorder. Neuroimage 40, 110–120.
Zou, Q., Long, X., Zuo, X., Yan, C., Zhu, C., Yang, Y., Liu, D., He, Y., Zang, Y., 2009. Func-tional connectivity between the thalamus and visual cortex under eyes closedand eyes open conditions: a resting-state fMRI study. Hum. Brain Mapp. 30,3066–3078.
Zuo, X.N., Di Martino, A., Kelly, C., Shehzad, Z.E., Gee, D.G., Klein, D.F., Castellanos, F.X.,Biswal, B.B., Milham, M.P., 2010. The oscillating brain: complex and reliable.Neuroimage 49, 1432–1445.
Zuo, X.N., Kelly, C., Adelstein, J.S., Klein, D.F., Castellanos, F.X., Milham, M.P., 2010. Reli-able intrinsic connectivity networks: test–retest evaluation using ICA and dual re-gression approach. Neuroimage 49, 2163–2177.
Zuo, X.N., Xu, T., Jiang, L., Yang, Z., Cao, X.Y., He, Y., Zang, Y.F., Castellanos, F.X., Milham,M.P., 2013. Toward reliable characterization of functional homogeneity in thehuman brain: preprocessing, scan duration, imaging resolution and computationalspace. Neuroimage 65, 374–386.
Related Documents