ORIGINAL ARTICLE Climatic controls on sap flow dynamics and used water sources of Salix psammophila in a semi-arid environment in northwest China Jinting Huang • Yangxiao Zhou • Lihe Yin • J. Wenninger • Jing Zhang • Guangcai Hou • Eryong Zhang • S. Uhlenbrook Received: 23 June 2013 / Accepted: 7 June 2014 / Published online: 18 July 2014 Ó Springer-Verlag Berlin Heidelberg 2014 Abstract Systematic field measurements were conducted to investigate the relationships between the sap flow of Salix bushes (Salix psammophila) and climatic variables and the sources of water use in the semi-arid Hailiutu River catchment in northwest China. The statistical analyses identified the controls of climatic factors on sap flow and the water use strategy of Salix bushes in periods charac- terized by different wetness conditions. Correlation anal- yses indicate strong positive correlations between diurnal sap flow, net radiation, air temperature and wind speed but a negative correlation with relative humidity. The peak values of sap flow occured at the same time as the peak values of net radiation but a few hours ahead of the peak values of temperature and the relative humidity minimum. Multiple regression equations between diurnal sap flow and climatic factors (i.e., net radiation, temperature, relative humidity and wind speed) can account for more than 80 % of the variations in sap flow. Correlation and multiple linear regression analyses between sap flow, soil water contents and groundwater level were used to quantify the water sources of S. psammophila. The results indicate that Salix bushes can use both soil water and groundwater for transpiration. In the dry periods, the cumulative transpira- tion of Salix caused a continuous decline of soil water contents and shallow groundwater levels. During rain events, sap flow was very low, but immediately after the rain, the peak value of sap flow increased significantly due to better soil water availability. The correlation and regression analysis identified a strong relationship between sap flow and groundwater levels that fluctuated at depths of 145.5–180.7 cm. Therefore, Salix bushes can be consid- ered as groundwater-dependent plants in the Hailiutu River catchment. Keywords Salix psammophila Sap flow Climatic factors Plant water use Soil water Groundwater-dependent ecosystems Introduction A large-scale land use and land cover change has been taking place in the Mu Us Desert that is part of the Ordos Plateau in northwest China (Wu and Zou 2010). This area suffers from frequent sandstorms, and farmland is threa- tened by moving sands. In the beginning of the 1980s, the Chinese government initiated a reforestation project called the ‘‘Three North Forest Shelterbelts’’ (Zhang and Song 2003). Starting in 2000, the ‘‘Return Farmland to Forest and Grassland’’ project was initiated (Wang et al. 2009). Water resources are very precious in this area because of the area’s semi-arid climate with scant rainfall and strong evaporation. Allocating scarce water resources for socio- economic development while maintaining the ecosystem in J. Huang (&) L. Yin J. Zhang G. Hou Xi’an Institute of Geology and Mineral Resources, No. 438, Youyidong Road, Xi’an 710054, People’s Republic of China e-mail: [email protected]; [email protected] Y. Zhou J. Wenninger S. Uhlenbrook Department of Water Science and Engineering, UNESCO-IHE Institute for Water Education, P.O. Box 3015, 2601 DA Delft, The Netherlands J. Wenninger S. Uhlenbrook Faculty of Civil Engineering and Applied Geosciences, Water Resources Section, Delft University of Technology, P.O. Box 5048, 2600 GA Delft, The Netherlands E. Zhang China Geological Survey, No. 45, Fuwai Street, Beijing 100037, People’s Republic of China 123 Environ Earth Sci (2015) 73:289–301 DOI 10.1007/s12665-014-3505-1

Welcome message from author
This document is posted to help you gain knowledge. Please leave a comment to let me know what you think about it! Share it to your friends and learn new things together.
Transcript

ORIGINAL ARTICLE
Climatic controls on sap flow dynamics and used watersources of Salix psammophila in a semi-arid environmentin northwest China
Jinting Huang • Yangxiao Zhou • Lihe Yin •
J. Wenninger • Jing Zhang • Guangcai Hou •
Eryong Zhang • S. Uhlenbrook
Received: 23 June 2013 / Accepted: 7 June 2014 / Published online: 18 July 2014
� Springer-Verlag Berlin Heidelberg 2014
Abstract Systematic field measurements were conducted
to investigate the relationships between the sap flow of
Salix bushes (Salix psammophila) and climatic variables
and the sources of water use in the semi-arid Hailiutu River
catchment in northwest China. The statistical analyses
identified the controls of climatic factors on sap flow and
the water use strategy of Salix bushes in periods charac-
terized by different wetness conditions. Correlation anal-
yses indicate strong positive correlations between diurnal
sap flow, net radiation, air temperature and wind speed but
a negative correlation with relative humidity. The peak
values of sap flow occured at the same time as the peak
values of net radiation but a few hours ahead of the peak
values of temperature and the relative humidity minimum.
Multiple regression equations between diurnal sap flow and
climatic factors (i.e., net radiation, temperature, relative
humidity and wind speed) can account for more than 80 %
of the variations in sap flow. Correlation and multiple
linear regression analyses between sap flow, soil water
contents and groundwater level were used to quantify the
water sources of S. psammophila. The results indicate that
Salix bushes can use both soil water and groundwater for
transpiration. In the dry periods, the cumulative transpira-
tion of Salix caused a continuous decline of soil water
contents and shallow groundwater levels. During rain
events, sap flow was very low, but immediately after the
rain, the peak value of sap flow increased significantly due
to better soil water availability. The correlation and
regression analysis identified a strong relationship between
sap flow and groundwater levels that fluctuated at depths of
145.5–180.7 cm. Therefore, Salix bushes can be consid-
ered as groundwater-dependent plants in the Hailiutu River
catchment.
Keywords Salix psammophila � Sap flow � Climatic
factors � Plant water use � Soil water �Groundwater-dependent ecosystems
Introduction
A large-scale land use and land cover change has been
taking place in the Mu Us Desert that is part of the Ordos
Plateau in northwest China (Wu and Zou 2010). This area
suffers from frequent sandstorms, and farmland is threa-
tened by moving sands. In the beginning of the 1980s, the
Chinese government initiated a reforestation project called
the ‘‘Three North Forest Shelterbelts’’ (Zhang and Song
2003). Starting in 2000, the ‘‘Return Farmland to Forest
and Grassland’’ project was initiated (Wang et al. 2009).
Water resources are very precious in this area because of
the area’s semi-arid climate with scant rainfall and strong
evaporation. Allocating scarce water resources for socio-
economic development while maintaining the ecosystem in
J. Huang (&) � L. Yin � J. Zhang � G. Hou
Xi’an Institute of Geology and Mineral Resources, No. 438,
Youyidong Road, Xi’an 710054, People’s Republic of China
e-mail: [email protected]; [email protected]
Y. Zhou � J. Wenninger � S. Uhlenbrook
Department of Water Science and Engineering, UNESCO-IHE
Institute for Water Education, P.O. Box 3015, 2601 DA Delft,
The Netherlands
J. Wenninger � S. Uhlenbrook
Faculty of Civil Engineering and Applied Geosciences, Water
Resources Section, Delft University of Technology,
P.O. Box 5048, 2600 GA Delft, The Netherlands
E. Zhang
China Geological Survey, No. 45, Fuwai Street, Beijing 100037,
People’s Republic of China
123
Environ Earth Sci (2015) 73:289–301
DOI 10.1007/s12665-014-3505-1

a healthy state is a primary challenge (Hultine et al. 2010),
especially in arid areas (Yang et al. 2012). Proper species
selection for vegetating sand dunes might reduce water use
to acceptable levels (van Dijk and Keenan 2007) and
minimize the adverse effects on water resources, based on
lessons from ecological restoration projects (Cao et al.
2011). In addition, the large-scale development of natural
resources (coal and gas) is taking place in the area (Yin
et al. 2011), facilitating the possible loss of large amounts
of precious water from the overlying loose water-bearing
sand to a large extent during the mining process. Further-
more, mining may have adverse impact on plants (Wang
et al. 2013). In the Mu Us Desert, one of the dominant
desert bushes is Salix psammophila (C. Wang et Chang Y.
Yang) (S. psammophila) (Xiao and Zhou 2001). S. psam-
mophila grows in desert sandy soil and can tolerate moving
sand dunes that can periodically cover part of the plant.
The plant is used in soil and water conservation, wind
sheltering and sand fixation. S. psammophila is very
important for preventing desertification and sandstorms
(Huang et al. 2006). Thus, one of the scientific challenges
for this area is to quantify the water use of S. psammophila
and its response to changing environmental conditions.
Evaluating the ecosystem response to environmental
fluctuations is crucial, among other things, to the man-
agement and restoration of plant communities (Wright and
Chambers 2002; Ridolfi et al. 2006). These processes
depend on sap flow, which drives the physiological
responses of desert plants, and sap flow depends on the
plant’s water balance and on subsurface hydrology (Lambs
and Berthelot 2002). Therefore, accurately estimating the
response of sap flow to changes in environmental variables
is the basis for comprehending the physiological response
of plants to their habitats. Sap flow changes in response to
the variations of environmental variables, such as radiation
intensity, relative humidity, air temperature, wind speed,
rainfall and soil moisture availability (McDowell et al.
2008). The sap flow of some typical desert plants, such as
Caragana korshinskii, Tamarix elongate Ledeb, Populus
euphratica, Elaeagnus angastifolia, Artemisia ordosica
and Nitraria sphaerocarpa in relation to climatic variables
has been previously analyzed (Zhang et al. 2003; Qu et al.
2007; Xia et al. 2008; Huang et al. 2010; Liu et al. 2011),
but little information is available on the transpiration of
S. psammophila. More work in desert plants in relation to
changing environmental variables is needed to improve the
understanding of the dominating processes and controls for
different plant species.
Potential water sources for plant survival include soil
water and groundwater. In water-limited environments,
high vapor pressure deficit (VPD) may lead to the
development of water stress. To maintain open stomata,
plants tend to extract water from the deep soil layers or
groundwater via deep roots under conditions of water
unavailability in shallow soil layers (Naumburg et al.
2005; West et al. 2008). In arid desert areas, the deep
roots of trees can reach ten meters to tap groundwater
(Lubczynski 2009). Phreatophytic vegetation will respond
to groundwater level decreases caused by groundwater
pumping in the short term (Shatfroth et al. 2000; Lite and
Stromberg 2005) and long term (Copper et al. 2006).
Large-scale afforestation will induce a decline of
groundwater table and then affect the phreatophytic
vegetation (Zheng et al. 2012). A previous study indi-
cates that water and salt conditions have a significant
influence on S. psammophila growth, based on using the
influence of water and salt on vegetation (IWSV) model
in the Mu Us Desert (Chen et al. 2011); however, further
proof is needed under different soil moisture wetness
conditions.
In this study, systematic field measurements were
conducted to investigate the relationships between the
sap flow of S. psammophila, climatic factors and dif-
ferent water sources in the semi-arid Hailiutu River
catchment in northwest China. The objectives of the
study are (1) to establish an empirical relationship
between sap flow and climatic factors, such as net
radiation, air temperature, relative humidity and wind
speed; (2) to assess the water use of S. psammophila
under different soil moisture wetness conditions; and (3)
to evaluate S. psammophila suitability for preventing
desertification in the Mu Us Desert. The results of the
study provide further insights into the water use strategy
of S. psammophila and provide scientific information for
the selection of appropriate vegetation species for pre-
venting desertification.
Research site and field measurements
Research site
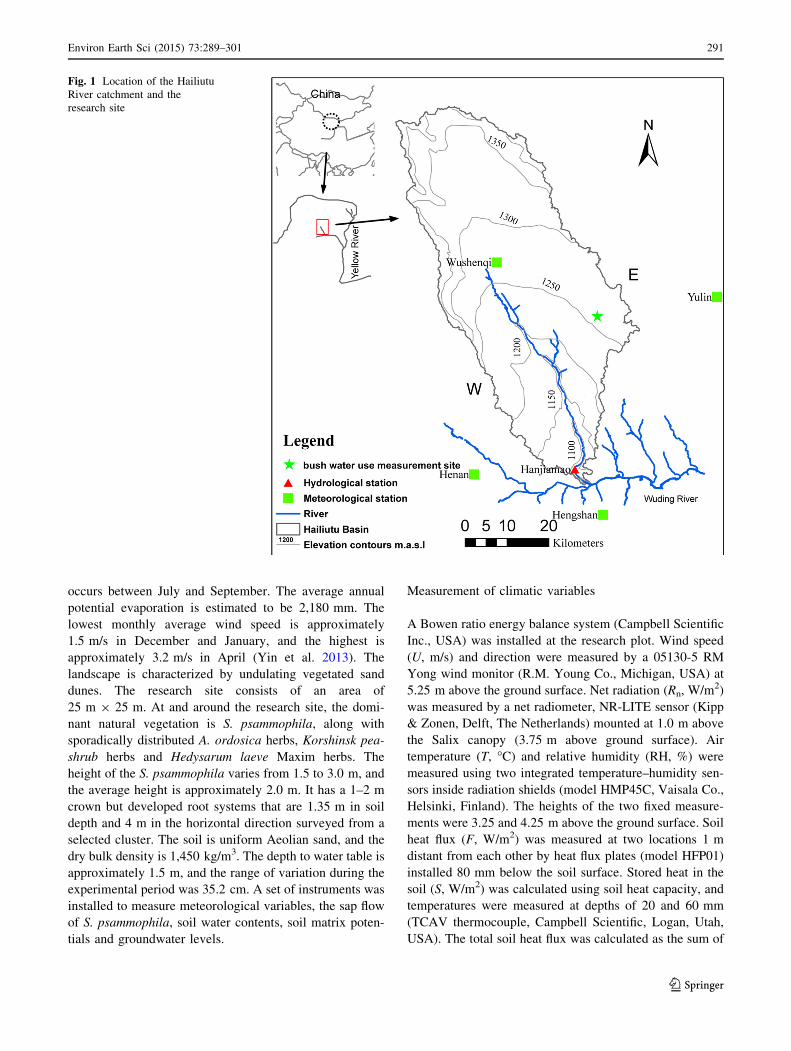
The experimental site is located in the Hailiutu River
catchment (between 38�060 and 38�500N, 108�370 and
109�150E), on the Ordos Plateau, northwest China (Fig. 1).
The Hailiutu River is one of the branches of the Wuding
River, which is the major tributary of the Yellow River.
The total area of the Hailiutu River catchment is approxi-
mately 2,645 km2. The surface elevation is 1,250 m above
sea level, and the climate is semi-arid. Based on the
meteorological data for a 50-year period (1957–2007) from
a metrological station *40 km northwest of the study site,
the long-term average annual air temperature is 8.1 �C, and
the lowest and highest monthly average air temperature is
-8.6 �C in January and 23.9 �C in July. The average
annual precipitation is 340 mm, and approximately 70 %
290 Environ Earth Sci (2015) 73:289–301
123
occurs between July and September. The average annual
potential evaporation is estimated to be 2,180 mm. The
lowest monthly average wind speed is approximately
1.5 m/s in December and January, and the highest is
approximately 3.2 m/s in April (Yin et al. 2013). The
landscape is characterized by undulating vegetated sand
dunes. The research site consists of an area of
25 m 9 25 m. At and around the research site, the domi-
nant natural vegetation is S. psammophila, along with
sporadically distributed A. ordosica herbs, Korshinsk pea-
shrub herbs and Hedysarum laeve Maxim herbs. The
height of the S. psammophila varies from 1.5 to 3.0 m, and
the average height is approximately 2.0 m. It has a 1–2 m
crown but developed root systems that are 1.35 m in soil
depth and 4 m in the horizontal direction surveyed from a
selected cluster. The soil is uniform Aeolian sand, and the
dry bulk density is 1,450 kg/m3. The depth to water table is
approximately 1.5 m, and the range of variation during the
experimental period was 35.2 cm. A set of instruments was
installed to measure meteorological variables, the sap flow
of S. psammophila, soil water contents, soil matrix poten-
tials and groundwater levels.
Measurement of climatic variables
A Bowen ratio energy balance system (Campbell Scientific
Inc., USA) was installed at the research plot. Wind speed
(U, m/s) and direction were measured by a 05130-5 RM
Yong wind monitor (R.M. Young Co., Michigan, USA) at
5.25 m above the ground surface. Net radiation (Rn, W/m2)
was measured by a net radiometer, NR-LITE sensor (Kipp
& Zonen, Delft, The Netherlands) mounted at 1.0 m above
the Salix canopy (3.75 m above ground surface). Air
temperature (T, �C) and relative humidity (RH, %) were
measured using two integrated temperature–humidity sen-
sors inside radiation shields (model HMP45C, Vaisala Co.,
Helsinki, Finland). The heights of the two fixed measure-
ments were 3.25 and 4.25 m above the ground surface. Soil
heat flux (F, W/m2) was measured at two locations 1 m
distant from each other by heat flux plates (model HFP01)
installed 80 mm below the soil surface. Stored heat in the
soil (S, W/m2) was calculated using soil heat capacity, and
temperatures were measured at depths of 20 and 60 mm
(TCAV thermocouple, Campbell Scientific, Logan, Utah,
USA). The total soil heat flux was calculated as the sum of
Fig. 1 Location of the Hailiutu
River catchment and the
research site
Environ Earth Sci (2015) 73:289–301 291
123

soil heat flux and heat storage. Precipitation (P, mm/h) was
measured using a rain gauge (Model 52203 RM Young rain
gauge, R.M. Young Co., Michigan, USA) at 2 m above the
ground surface and away from the Salix canopy. All data
were collected by a data-logger (CR3000, Campbell Sci-
entific, Logan, Utah, USA) every 60 s, and 1-h averages
were calculated and stored. The instruments used in the
study are listed in Table 1.
Measurement of sap flow
The height of the selected S. psammophila for sap flow
measurements is 2.2 m, which is close to the average
height of S. psammophila around the research site. A sap
flow system (Flow 32-1K, Dynamax Inc., Houston, TX,
USA) was used to measure sap flow in the S. psammophila
stems from 29 May to 13 July 2011. The theory and
methodology of using sap flow gauges have been described
previously in detail by Yue et al. (2008). Eight branches
with a stem circumference of 8 cm from the S. psammo-
phila in different directions, i.e., eastern, south, west, north,
southeast, southwest, northeast and northwest, were
equipped with sap flow sensors (SGB9-WS; Dynamax Inc.,
Houston, TX, USA) at a mean height of 70 cm above the
ground surface. The data were recorded at 10-s intervals
and stored as 1-h averages using a CR1000 data-logger
(Campbell Scientific, Logan, Utah, USA).
Measurement of soil water contents
At the research site, the unsaturated zone has an
approximately 5–15 cm dry layer in the upper soil profile
caused by strong evaporation. Thus, two types of sensors
with different resolution were used to measure the soil
water contents (SWC, cm3/cm3) at 8 different depths,
both based on the time-domain reflectometry (TDR)
technology. All sensors were inserted horizontally into the
soil. The sensors installed at 6 and 15 cm depths are
CS616 (Campbell Scientific, USA, the resolution is 1 %).
The data were recorded at 10-s intervals and stored as 1-h
averages using a CR1000 data-logger (Campbell Scien-
tific, USA). The sensors installed at 20, 40, 70, 100, 120
and 140 cm depths are 6005CL2 (Wintrase SEC Co. Ltd,
USA; 2 % resolution). The data were recorded every 10 s
and stored every 4 h with a data-logger (Wintrase SEC
Co. Ltd, USA).
Measurement of groundwater level
A MiniDiver (DI501, Eijkelkamp, The Netherlands) was
installed in a piezometer (at a 160-cm depth below the
ground surface) to monitor the groundwater level and
temperature. The piezometer was covered by a ventilated
PVC cap for protection. The data were recorded at 10-s
intervals and stored as 1-h average values.
Table 1 Instruments used for
measurement of meteorological
variables at the research site
Variable Height (m) Horizontal
distance
to the bush
stem (m)
Instrument or sensor type
Wind speed (W/m2) 5.25 3.0 05130-5 RM Yong wind
monitor
Net radiation (W/m2) 3.75 3.0 NR-LITE sensor
Rainfall (mm/h) 3.0 52203 RM Young rain gauge
Air temperature
(K) and
relative humidity
(%)
3.25 3.0 HMP45C temperature–
humidity
sensors4.25 3.0
Soil heat flux (W/m2) -0.08 3.0 HFP01 heat flow plates
Soil temperature (�C) -0.06 3.0 TCAV thermocouple
Sap flow 0.7 Flow 32-1K
Soil water content -0.06, -0.15 1.5 CS616
-0.2, -0.4, -0.7
-1.0, -1.2, -1.4
1.5 6005CL2
Groundwater level -1.6 1.5 DI501
Root auger -0.15, -0.3, -0.45,
-0.6, -0.75, -0.9,
-1.05, -1.2, -1.35,
-1.5
– –
292 Environ Earth Sci (2015) 73:289–301
123

Roots survey
Root distribution somewhat reflects used water sources of
plants. Considering the root distribution that varies with
depth and radial distance, soil cores were taken around
the S. psammophila using a Root Auger (Eijkelkamp, The
Netherlands) after defoliation. Undisturbed, uniform soil
samples of 10 cm diameter and 15 cm height were
obtained, and the position of each sample was recorded
including the horizontal radial distance from the stem and
depth to the point of each sample. Four symmetrical
transects, centered with the stem and having a radius of
4 m, were investigated. The total area of the root distri-
bution was determined to be 50.24 m2. Roots were sieved
out of the core sample and washed at the sampling day.
The cleaned roots of each core sample were weighed
using an electric balance (readout 0.01 g; resolution limit
is 1 %), and photos were taken on scaled paper (resolu-
tion is 1 mm). The total root length of fine roots (diameter
\2 mm) was measured with GIS free source software
(www.gvsig.org). The root length density (cm/cm3) of
each sample was determined by dividing the total root
length by the core volume. The vertical distribution of
fine roots was determined from the average of the root
length density at the same sample depth and radial dis-
tance within the root zone of the S. psammophila (Fig. 2).
Two maxima of the root length density can be observed,
one between 0 and 30 cm, with a second one being
observed between 60 and 120 cm (the peak at approxi-
mately 80–90 cm) soil layer.
Results of measurements
Climatic variables
During the study period (29 May 2011–13 July 2011), the
total precipitation was 71.8 mm and heavy rainfall events
occurred on July 1 and July 2 with a total amount of
42.8 mm. The temperature varied between 6.6 �C during
the night and 32.9 �C during the daytime with a daily
average of 21.7 �C. Relative humidity ranged from 20 to
100 % with a daily average of 45 %. The net radiation
reached the maximum value of 897 W/m2 approximately
12:00 and displayed negative values during the night. The
maximum of wind speed was 6.8 m/s, whereas the daily
average was approximately 2 m/s (Fig. 3). Net radiation
and temperature display clear diurnal fluctuations, but the
peaks do not occur at the same time. Relative humidity and
wind speed have more complex variations and change in
opposite directions. It is interesting to note that during the
rain on July 1 and July 2, net radiation was nearly zero,
temperature was low, and relative humidity was very high.
The climatic variables’ changes over the long-term period
have similar characteristics compared to that from a me-
trological station *40 km northwest of the study site. The
pattern of rainfall is similar to that in other arid regions
(Loik et al. 2004; Zhao and Liu 2010).
Sap flow of S. psammophila
The sap flow (g/h) of S. psammophila indicates diurnal
fluctuation patterns in all 8 branches. As sap flow has
positively skewed distribution, the harmonic mean of sap
flow of 8 branches is used as a representative average. The
total plant water use was estimated from the harmonic
mean of the measured branches multiplied by the total
amount of branches (n = 179). The average of the sap flow
of the Salix bush during the measurement period is
3,186 cm3/h or 0.076 m3/d. The total water use was divi-
ded by the root distribution area, 50.24 m2, determined by
the root survey to obtain the transpiration rate (SF, mm/h).
The calculated transpiration rate and cumulative transpi-
ration rate are shown in Fig. 4. The cumulative transpira-
tion from May 29 to July 13 was 68 mm with an average of
1.5 mm/d, which is in accordance with previous monitor-
ing results (Ding et al. 2011).
Soil water content at various depths
The measurements of soil water contents are shown in
Fig. 5. During the dry period, the volumetric soil water
contents (SWC, cm3/cm3) decreased with time and were
increased with depth. The small amount of rainfall on June
only caused an increase of soil water content in the top
Fig. 2 Vertical root length density of the experimental S.
psammophila
Environ Earth Sci (2015) 73:289–301 293
123

layer. The reason is that the soil was too dry and strong
evaporation. The heavy rainfall started at 0:00 on July 1,
and the soil water contents increased after 2 h at a depth of
6 cm. The process of infiltration continued along with the
rainfall. The infiltration front reached 100 cm when the
rainfall stopped at 12:00 on July 2. The rapid movement of
soil water indicated that the vadose zone has good
infiltration ability. At the 140 cm depth, soil water content
remained high during the whole period, indicating that the
capillary height is very close to 140 cm depth.
Based on the variations of soil water contents and root
distribution, soil water contents can be grouped into three
layers. Layer 1 represents the soil water contents from 6 to
40 cm (SWC1). Layer 1 is very dry and responds to rain
Fig. 3 Measured climatic
variables at the research site
during the investigated period
Fig. 4 Diurnal fluctuations of
transpiration rate (SF, mm/h)
and cumulative transpiration
(SFc, mm) of S. psammophila at
the research site
Fig. 5 Precipitation, soil water
content (SWC) and depth to
water table (GWT) at the
research site during the research
period
294 Environ Earth Sci (2015) 73:289–301
123

very fast. Layer 2 represents soil water content from 70 to
120 cm. The average soil water content (SWC2) continu-
ously decreases until the rainfall event in July 1 and July 2.
The response to this heavy rain event in layer 2 is delayed
compared with layer 1. Layer 3 represents the soil water
content at 140 cm (SWC3). In addition, the soil water
content is very close to saturation and also responds to the
heavy rain with a time delay.
Water table fluctuations
The groundwater level continuously decreased until the
heavy rain on July 1 and July 2 (Fig. 5). The groundwater
level did not respond to the rain events in June and only
increased after the heavy rainfall in early July.
Analysis of sap flow in relation to climatic factors
The influence of climatic factors on the sap flow of S.
psammophila was analyzed for three distinct periods: per-
iod 1 was from May 29 to June 12, representing a long dry
period; period 2 lasted from June 30 to July 7, representing
a wet period, and period 3 was defined from July 8 to 13,
representing a relative dry period after a wet period.
Relationship between sap flow and climatic factors
The correlation coefficients between the hourly sap flow and
climatic factors for the three periods are shown in Table 2.
The sap flow is positively dependent on the net radiation,
temperature and wind speed, but negatively dependent on
the relative humidity in all of the three periods. It can further
be seen that the correlation coefficient between the sap flow
and net radiation is much higher than those of temperature,
relative humidity and wind speed.
Lag time between sap flow and climatic factors
Figure 6 shows the diurnal patterns of sap flow and climatic
factors. The diurnal fluctuation of sap flow closely follows
the net radiation in all three periods, and the peak of sap flow
occurs at the same time as the peak of net radiation. The
peak of temperature and the minimum relative humidity
occur some hours later than the sap flow peak.
A cross-correlation analysis was used to identify the time
lag between sap flow and climatic variables. There was no
time lag between sap flow and net radiation (Table 2).
However, the peak of the temperature and the minimum
value of relative humidity lagged behind the peak of sap flow
by 3 h in period 1, 1 h in period 2 and 2 h in period 3. The lag
time between the peak of sap flow and the peak of the wind
speed was 2 h in periods 1 and 3 and 1 h in period 2.
Regression analysis between sap flow and climatic
factors
Multiple linear regression analysis was applied for the
three periods. The multiple linear regression equation was
defined as follows:
Table 2 Correlation, cross-correlation coefficients, R, and lag time between sap flow and climatic factors
Correlation Cross-correlation
SF Rn T RH U SF Rn T RH U Lag
Period 1 (May 5 June 12) SF 1 1.00
Rn 0.87 1 0.87 1.00 0
T 0.56 0.41 1 0.83 0.74 1.00 3
RH -0.43 -0.31 -0.7 1 -0.70 -0.60 -0.71 1.00 3
U 0.56 0.5 0.61 -0.54 1 0.66 0.65 0.63 -0.56 1.00 2
Period 2 (June 30 July 7) SF 1 1.00
Rn 0.92 1 0.92 1.00 0
T 0.69 0.61 1 0.82 0.74 1.00 1
RH -0.66 -0.52 -0.64 1 -0.78 -0.67 -0.90 1.00 1
U 0.45 0.48 0.43 -0.4 1 0.44 0.50 0.40 -0.24 1.00 1
Period 3 (July 8 July 12) SF 1 1.00
Rn 0.92 1 0.93 1.00 0
T 0.64 0.56 1 0.77 0.70 1.00 2
RH -0.56 -0.5 -0.9 1 -0.72 -0.64 -0.80 1.00 2
U 0.44 0.46 0.61 -0.61 1 0.46 0.48 0.46 -0.65 1.00 2
SF sap flow, Rn net radiation, T temperature, RH relative humidity, U wind speed, lag Lag time (h)
Environ Earth Sci (2015) 73:289–301 295
123

SFðtÞ ¼ b0 þ b1RnðtÞ þ b2TðtÞ þ b3RH(tÞ þ b4UðtÞ ð1Þ
The derived regression coefficients are listed in Table 3
together with the coefficient of determination (R2). The
multiple linear regressions can simulate sap flow very well
as shown by the scatter plots (Fig. 7). The coefficients of
determination indicate that 81, 90 and 87 % of the varia-
tions in sap flow can be explained with the combined
variations of the net radiation, temperature, relative
humidity and wind speed in periods 1, 2 and 3, respectively.
The correlation coefficients between the hourly sap flow
of two clusters adjacent to S. psammophila and meteoro-
logical variables measured from May to September 2012 and
from July to August 2013 indicate that hourly sap flow is
significantly correlated with climatic variables. The average
Fig. 6 Diurnal patterns of sap
flow, SF, and different climatic
factors on a May 31 in period 1,
b July 4 in period 2 and c July
10 in period 3
Table 3 Regression
coefficients of Eq. 1 and
coefficients of determination for
the investigated periods
b0 b1 b2 b3 b4 R2
Period 1 -0.00569 0.00019 0.00219 -0.00013 0.00239 0.81
Period 2 0.03415 0.00021 0.00146 -0.00055 -0.00320 0.90
Period 3 -0.03849 0.00021 0.00344 0.00022 -0.00623 0.87
Fig. 7 Scatter plots of the
calculated sap flows based on
multiple linear regressions and
observed sap flows for the three
periods
296 Environ Earth Sci (2015) 73:289–301
123

correlation coefficient between the sap flow and net radiation,
air temperature, relative humidity and wind speed is 0.57,
0.48, -0.36 and 0.21, respectively, in 2012. In addition, the
average correlation coefficient between sap flow and net
radiation, air temperature, relative humidity and wind speed
is 0.88, 0.66, -0.63 and 0.42, respectively, in 2013. This
indicates that the net radiation affects the dynamics of sap
flow significantly in hourly scale, which is consistent with the
correlation analysis data collected in 2011.
Analysis of sap flow in relation to water sources
The wetness conditions of soil have a significant effect on
water use strategy of plants. To quantify the water source
of experimental S. psammophila, three periods were ana-
lyzed during the research period according to soil water
content (SWC) and the depth to groundwater table (GWT)
changes effected by rainfall input, i.e., the dry period
character as SWC decrease and GWT increase with no
rainfall input, the wet period character as SWC increase
and GWT decrease after rainfall input and the relative dry
period character as SWC decrease and GWT increase after
a few days of rainfall input.
Dry period
In this dry period, the soil water contents and water table
(Fig. 8) decrease with the increase of the cumulative
transpiration rate of S. psammophila. The correlation
coefficients between the cumulative transpiration rate (SFc)
and soil water contents in all layers display very strong
negative correlations (Table 4), whereas the correlation
between the cumulative transpiration rate and the depth to
groundwater table is positive. All this evidence supports
the conclusion that S. psammophila, which is the dominant
vegetation also in the site surrounding the environment,
uses soil water and groundwater for transpiration during
this dry period.
Fig. 8 Relation between
cumulative transpiration rate,
soil water contents at different
layers (SWCa), and depth to
groundwater table in dry period
Table 4 Correlation coefficients between cumulative transpiration
rate (SFc) and soil water contents at different depths and water table
depth in the three periods
SFc SWC1 SWC2 SWC3 GWT
Period 1 (May 5
June 12)
SFc 1
SWC1 -0.97 1
SWC2 -0.99 0.96 1
SWC3 -0.89 0.92 0.91 1
GWT 0.99 -0.96 -0.99 -0.9 1
Period 2 (June 30
July 7)
SFc 1
SWC1 -0.21 1
SWC2 0.76 0.17 1
SWC3 0.62 0.08 0.91 1
GWT -0.78 -0.13 -0.99 -0.93 1
Period 3 (July 8
July 12)
SFc 1
SWC1 -0.95 1
SWC2 -0.7 0.7 1
SWC3 -0.91 0.92 0.77 1
GWT 0.78 -0.73 -0.75 -0.75 1
Environ Earth Sci (2015) 73:289–301 297
123
As the transpiration of S. psammophila causes the
decrease of the groundwater level, a regression equation
between the depth to groundwater table (GWT) and
cumulative transpiration rate (SFc) in this period was as
follows:
GWT ¼ 160:36þ 0:3103SFc ð2Þ
The regression equation yields a coefficient of determi-
nation of 0.99, indicating that 99 % of the variation in the
depth to groundwater table can be explained by the variation
of the cumulative transpiration during this dry period.
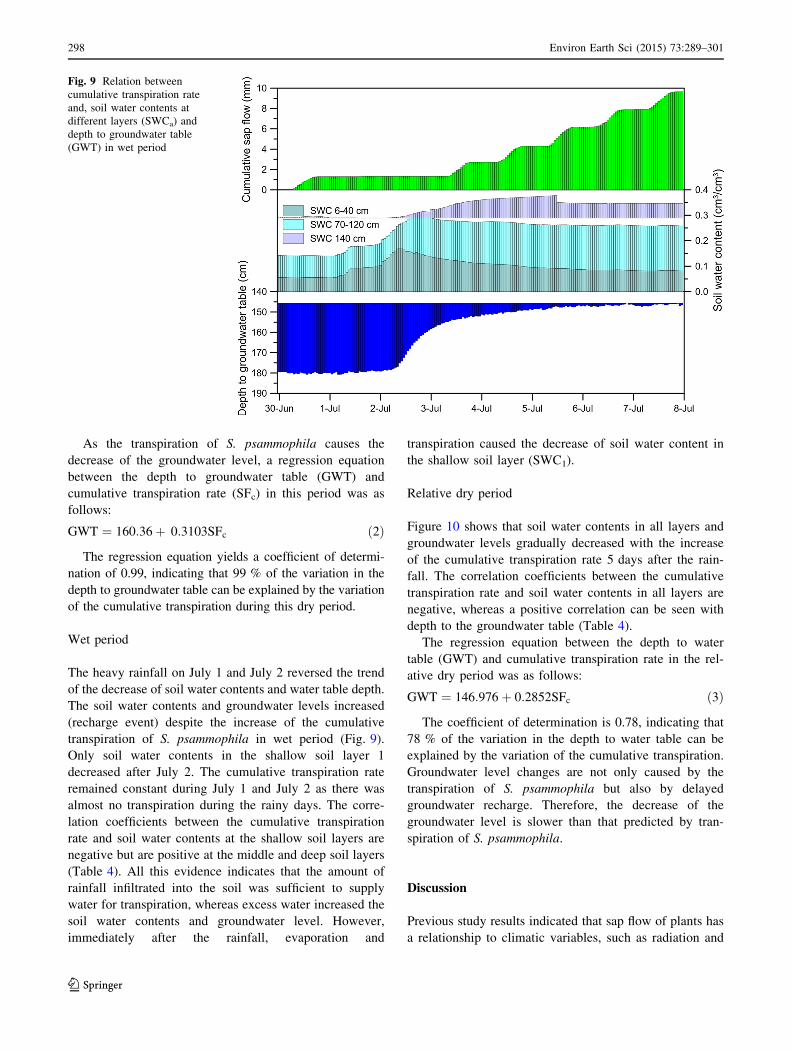
Wet period
The heavy rainfall on July 1 and July 2 reversed the trend
of the decrease of soil water contents and water table depth.
The soil water contents and groundwater levels increased
(recharge event) despite the increase of the cumulative
transpiration of S. psammophila in wet period (Fig. 9).
Only soil water contents in the shallow soil layer 1
decreased after July 2. The cumulative transpiration rate
remained constant during July 1 and July 2 as there was
almost no transpiration during the rainy days. The corre-
lation coefficients between the cumulative transpiration
rate and soil water contents at the shallow soil layers are
negative but are positive at the middle and deep soil layers
(Table 4). All this evidence indicates that the amount of
rainfall infiltrated into the soil was sufficient to supply
water for transpiration, whereas excess water increased the
soil water contents and groundwater level. However,
immediately after the rainfall, evaporation and
transpiration caused the decrease of soil water content in
the shallow soil layer (SWC1).
Relative dry period
Figure 10 shows that soil water contents in all layers and
groundwater levels gradually decreased with the increase
of the cumulative transpiration rate 5 days after the rain-
fall. The correlation coefficients between the cumulative
transpiration rate and soil water contents in all layers are
negative, whereas a positive correlation can be seen with
depth to the groundwater table (Table 4).
The regression equation between the depth to water
table (GWT) and cumulative transpiration rate in the rel-
ative dry period was as follows:
GWT ¼ 146:976þ 0:2852SFc ð3Þ
The coefficient of determination is 0.78, indicating that
78 % of the variation in the depth to water table can be
explained by the variation of the cumulative transpiration.
Groundwater level changes are not only caused by the
transpiration of S. psammophila but also by delayed
groundwater recharge. Therefore, the decrease of the
groundwater level is slower than that predicted by tran-
spiration of S. psammophila.
Discussion
Previous study results indicated that sap flow of plants has
a relationship to climatic variables, such as radiation and
Fig. 9 Relation between
cumulative transpiration rate
and, soil water contents at
different layers (SWCa) and
depth to groundwater table
(GWT) in wet period
298 Environ Earth Sci (2015) 73:289–301
123

VPD in arid and semi-arid areas. The empirical relation-
ships found between the sap flow of plants and radiation
have been identified as hyperbolic (Guan et al. 2012),
quadratic (Ortuno et al. 2006) or other non-linear functions
(Oguntunde 2005). In their study, a threshold value of
radiation was detected. Sap flow increases rapidly with the
increase of radiation below the threshold value but remains
at a constant level beyond the threshold. However, in our
results, the relationship between the sap flow and net
radiation was found linear in all investigated dry and wet
periods. Many researchers (e.g., Hogg and Hurdle 1997;
Liu et al. 2011) combined the temperature and relative
humidity into VPD to analyze the water demand of the
atmosphere and the ability of plants to satisfy this demand.
They also found a threshold of VPD in relation to the
increase of sap flow. This threshold value was not found in
our study. The multiple linear regression equations deter-
mined between hourly sap flow and climatic factors were
established with very high coefficients of determination
and represent the combined effects of climatic factors on
the control of sap flow (Eq. 1; Fig. 7).
Rainfall pulses can rapidly increase sap velocity and
alter the water-use efficiency of vegetation (Schwinning
and Sala 2004; Zeppel et al. 2008). In our results, sap flow
after rainfall was larger than that before rainfall for all
rainfall events (Fig. 4) regardless of the increase of soil
water contents triggered by different amounts of rainfall
(Fig. 5). The ratio between the first day before a rainfall
event to the time when maximum sap flow occurred after
the rainfall did not increase linearly with the amount of the
rainfall. For example, the sap flow after rainfall of 13.8 mm
(on Jun 13) was lower than that 2.4 mm (on Jun 22). This
finding agrees with other desert studies (e.g., Reynolds
et al. 2004; Zhao and Liu 2010). Under the strong evapo-
ration in the semi-arid climates and given the low water-
holding capacity of the soil at our experimental site (sandy
soil), we would expect S. psammophila to be subjected to
water stress in the experimental period. However, an
exception is that sap flow of the June 7 in the dry period
was larger than that after small rain events (except for July
1–2 rainfall events). This phenomenon indicated that even
during the first dry period S. psammophila did not experi-
ence obvious water stress.
The correlation and regression analyses indicate that the
experimental S. psammophila depends on groundwater for
transpiration. The role of groundwater supply in the
maintenance of the transpiration during drought for dif-
ferent plants has been reported elsewhere, through different
approaches (Miller et al. 2010; Chen et al. 2013). To sus-
tain high transpiration rates given the low soil water con-
tents in the upper soil (Fig. 5), S. psammophila needs to tap
groundwater. Therefore, the root distribution has strong
influence on the water use strategy (Canadell et al. 1996).
At our site, the root distribution was characterized as
dimorphic root system (Fig. 2). Shallow-rooted plants will
depend more dynamically on shallow moisture, whereas
deep-rooted plants are more coupled to deep soil water.
This finding is also in line with the water sources of
S. psammophila as evaluated by model and isotope meth-
ods on the Ordos Plateau (Chen et al. 2011; Wang et al.
Fig. 10 Relation between
cumulative transpiration rate,
soil water contents at different
layers (SWCa), and depth to
groundwater table (GWT) in
relative dry period
Environ Earth Sci (2015) 73:289–301 299
123

2013). Therefore, S. psammophila can be classified as
groundwater-dependent vegetation in this semi-arid envi-
ronment, which has effects on groundwater recharge and
discharge and consequences on groundwater resources
management. The examined S. psammophila used on
average 3,186 cm3/h or 0.076 m3/d of water in the growing
period from May 29 to July 13. Ding et al. (2011), using a
portable LI-1600 stoma meter, found monthly water con-
sumption values in the same order of magnitude of indi-
vidual plants such as S. psammophila, A. ordosica, A.
ordosica and Caragana intermedia. Chen et al. (2013)
found that S. psammophila consumes more water than A.
ordosica based on diurnal water table fluctuation. More-
over, Zhou et al. (2013) confirmed that S. psammophila
consumes more water than Salix matsudana at the Hailiutu
river catchment. Therefore, S. psammophila might not be a
suitable species for stabilizing sand dunes in water-scarce
environments.
Conclusions
Systematic field measurements from May 29 to July 13
identified the relationships between sap flow of S. psam-
mophila, climatic factors and water sources in the semi-arid
Hailiutu River catchment in northwest China. The diurnal
fluctuations of sap flow of S. psammophila were mainly
driven by net radiation, but sap flow also depends on the
temperature, relative humidity and wind speed. The daily
peak of sap flow occurs at the same time as that of net
radiation but a few hours ahead of the peak of temperature
and the minimum of relative humidity. The sap flow of S.
psammophila increased almost linearly with net radiation,
temperature and wind speed but the decrease of relative
humidity. Multiple regression of sap flow of S. psammo-
phila and climatic variables can account for more than
80 % of the variations in diurnal fluctuations of sap flow.
The studied S. psammophila can use both soil water and
groundwater for transpiration. The cumulative transpiration
of S. psammophila caused the continuous decline of soil
water contents at all depths and groundwater levels during
the dry period from May 29 to June 12. The heavy rainfall
on July 1 and 2 provided sufficient water to restore the
depleted soil water and groundwater while maintaining
water supply for transpiration. The peak of sap flow after
the rain increased significantly on July 3, 4 and 5. In the
relative dry period, after the rain from July 8 to 12, tran-
spiration of S. psammophila caused a decrease of soil water
contents and groundwater level but at a slower rate.
Regression and correlation analyses demonstrate a strong
relation between sap flow and groundwater levels. There-
fore, S. psammophila can be considered as groundwater-
dependent plant in the semi-arid Hailiutu River catchment.
Finally, comparing these results to other drought-resis-
tant plants used to combat desertification (such as A.
ordosica), it is remarkable that S. psammophila appears to
consume much water for transpiration. Therefore, S.
psammophila might not be a water-efficient plant for
desertification prevention in water-scarce environments.
Further investigations are required to compare water uses
of dominant plants in the area.
Acknowledgments This study was supported by the Dutch gov-
ernment’s Asia Facility for China project ‘‘Partnership for research
and education in water and ecosystem interactions,’’ the Honor Power
Foundation, the project ‘‘Study on the transpiration dynamics of
phreatophytic vegetation in response to groundwater fluctuation in the
semiarid area (41102160)’’ by the National Natural Science Foun-
dation of China, the project ‘‘The construction of a scientific platform
for the investigation of the relationship between water and vegetation
in the Ordos Basin (201311076)’’ by the Ministry of Land and
Resources of the People’s Republic of China and Shaanxi Science and
Technology Research and Development Program (2011KJXX56). We
would like to thank the three anonymous reviewers for their helpful
comments and suggestions that greatly improved the earlier version of
the manuscript.
References
Canadell J, Jackson RB, Ehleringer JR, Mooney HA, Sla OE, Schulze
ED (1996) Maximum rooting depth of vegetation types at the
global scale. Oecologia 108:583–595
Cao SX, Chen L, Shankman D, Wang CM, Wang XB, Zhang H
(2011) Excessive reliance on afforestation in China’s arid and
semi-arid regions: lessons in ecological restoration. Earth Sci
Rev 104:240–245
Chen DH, Wang WK, Chen XH, Hou GC, Yang HB, Li Y (2011) A
model for evaluating the influence of water and salt on
vegetation in a semi-arid desert region, northern China. Environ
Earth Sci 64:337–346
Chen DH, Li Y, Chen XH, Wang WK, Hou GC, Wang CL (2013)
Estimation of groundwater evapotranspiration using diurnal
water table fluctuations in the Mu Us Desert, northern China.
J Hydrol 490:106–113
Copper DJ, Sanderson JS, Stannard DI, Groeneveld DP (2006) Effects
of long-term water table drawdown on evapotranspiration and
vegetation in an arid region phreatophyte community. J Hydrol
325:21–34
Ding YK, Yang J, Zhang ZP, Song BY (2011) Studies on
characteristics of water consumption of main constructive
species in Mowusu desert by transpiration. Chin J Grassland
33:37–43 (in Chinese with English Abstract)
Guan DX, Zhang XJ, Yuan FH, Chen NN, Wang AZ, Wu JB, Jin CJ
(2012) The relationship between sap flow of intercropped young
poplar trees (Populus euramericana cn. N3016) and environ-
mental factors in a semiarid region of northeastern China. Hydrol
Process 26:2925–2937
Hogg EH, Hurdle PA (1997) Sap flow in trembling aspen: implica-
tions for stomatal responses to vapor pressure deficit. Tree
Physiol 17:501–509
Huang JT, Wang WK, He Y, Wang Z, Qiao G, Ma XD (2006) The
formation and evolution and ecological functions of lakes in
Erdos Desert Plateau. Resour Sci 8:140–146 (in Chinese with
English Abstract)
300 Environ Earth Sci (2015) 73:289–301
123
Huang L, Zhang ZS, Li XR (2010) Sap flow of Artemisia ordosica
and the influence of environmental factors in a revegetated desert
area: Tengger Desert, China. Hydrol Process 24:1248–1253
Hultine KR, Naler PL, Morino K, Bush SE, Burtch KG, Dennison PE,
Glenn EP, Ehleringer JR (2010) Sap flux-scaled transpiration by
tamarisk (Tamarix spp.) before, during and after episodic
defoliation by the saltcedar leaf beetle (Diorhabda carinulata).
Agric For Meteorol 150:1467–1475
Lambs L, Berthelot M (2002) Monitoring of water from the
underground of the tree: first results with a new sap extractor
on a riparian woodland. Plant Soil 241:197–207
Lite SJ, Stromberg JC (2005) Surface water and groundwater
thresholds for maintaining Populus-Salix forests, San Pedro
River, Arizona. Biol Conserv 125:153–167
Liu B, Zhao WZ, Bowen J (2011) The response of sap flow in desert
shrubs to environmental variables in an arid region of China.
Ecohydrology 4:448–457
Loik ME, Breshears DD, Lauenroth WK, Belnap J (2004) A multi-
scale perspective of water pulses in dryland ecosystems:
climatology and ecohydrology of the western USA. Oecologia
141:269–281
Lubczynski MW (2009) The hydrogeological role of trees in water-
limited environments. Hydrol J 17:247–259
McDowell NG, White S, Pockman WT (2008) Transpiration and
stomatal conductance across a steep climatie gradient in the
southern Rocky Mountains. Ecohydrology 1:193–204
Miller GR, Chen X, Rubin Y, Ma S, Baldocchi DD (2010)
Groundwater uptake by woody vegetation in a semiarid oak
savanna. Water Resour Res 46(W10503):14
Naumburg E, Gonazlez RM, Hunter RG, Mclendon T, Martin DW
(2005) Phreatophytic vegetation and groundwater fluctuations: a
review of current research and application of ecosystem response
modeling with an emphasis on Great Basin vegetation. Environ
Manag 35:726–740
Oguntunde PG (2005) Whole-plant water use and canopy conduc-
tance of cassava under limited available soil water and varying
evaporative demand. Plant Soil 278:371–383
Ortuno MF, Garcia-Orellana Y, Conejero W, Ruiz-Sanchez MC,
Moounzer O, Alarcon JJ, Torrecillas A (2006) Relationship
between climatic variables and sap flow, stem water potential
and maximum daily trunk shrinkage in lemon trees. Plant Soil
279:229–242
Qu YP, Kang SZ, Li FS, Zhang JH, Xia GM, Li WC (2007) Xylem
sap flows of irrigated Tamarix elongate Ledeb and the influence
of environmental factors in the desert region of Northwest China.
Hydrol Process 21:1363–1369
Reynolds JF, Kemp PR, Ogle K, Fernandez RJ (2004) Modifying the
‘pulse-reserve’ paradigm for deserts of North America: precip-
itation pulses, soil water, and plant responses. Oecologia
141:194–210
Ridolfi L, D’Odorico P, Laio F (2006) Effect of vegetation-water
table feedbacks on the stability and resilience of plant ecosys-
tems. Water Resour Res 42:W01201
Schwinning S, Sala OE (2004) Hierarchy of response to resource
pluses in arid and semi-arid ecosystems. Oecologia 130:345–355
Shatfroth PB, Stromberg JC, Patten DT (2000) Woody riparian
vegetation response to different alluvial water table regimes.
West N Am Nat 60:66–76
van Dijk AJM, Keenan RJ (2007) Planted forests and water in
perspective. For Ecol Manag 251:1–9
Wang BW, Yang QK, Liu ZH (2009) Effect of conversion of
farmland to forest or grass land on soil erosion intensity changes
in Yanhe River Basin, Loess Plateau of China. Front For China
4:68–74
Wang L, Mu Y, Zhang QF, Zhang XC (2013) Groundwater use by
plants in a semi-arid coal-mining area at the Mu Us Desert
frontier. Environ Earth Sci 69:1015–1024
West AG, Sperry JS, Bush SE, Ehleringer J (2008) Transpiration and
hydraulic strategies in a pinon-juniper woodland. Ecol Appl
18:911–927
Wright JM, Chambers JC (2002) Restoring riparian meadows
currently dominated by Artemisia using alternative state con-
cepts: above-ground vegetation response. Appl Veg Sci
5:237–246
Wu XX, Zou XY (2010) Analysis of landscape pattern change and its
driving factors based on 3S technology: a case study in Uxin
banner of Inner Mongolia. J Desert Res 30:763–769 (in Chinese
with English Abstract)
Xia GM, Kang SZ, Li FS, Zhang JH, Zhou QY (2008) Diurnal and
seasonal variations of sap flow of Caragana Korshinskii in the
arid desert region of north-west China. Hydrol Process
22:1197–1205
Xiao CW, Zhou GS (2001) Study on the water balance in three
dominant plants with simulated precipitation change in Maow-
usu sandland. Acta Bot Sin 43:82–88
Yang Z, Zhou YX, Wenninger J, Uhlenbrook S (2012) The causes of
flow regime shifts in the semi-arid Hailiutu River, Northwest
China. Hydrol Earth Syst Sci 16:87–103
Yin LH, Hu GC, Huang JT, Wen DG, Dong JQ, Wang XY, Li HB
(2011) Groundwater recharge estimation in the Ordos Plateau,
China: comparison of methods. Hydrol J 19:1563–1575
Yin LH, Zhou YX, Huang JT, Wenninger J, Hou GC, Zhang EY,
Wang XY, Dong JQ, Zhang J, Uhlenbrook S (2013) Dynamics of
willow tree (Salix matsudana) water use and its response to
environmental factors in the semi-arid Hailiutu River catchment,
Northwest China. Environ Earth Sci 71:4997–5006
Yue GY, Zhao HL, Zhang TH, Zhao XY, Niu L, Drake S (2008)
Evaluation of water use of Caragana microphylla with the stem
heat-balance method in Horqin Sandy Land, Inner Mongolia,
China. Agric For Meteorol 148:1668–1678
Zeppel M, Macinnis-Ng CMO, Ford CR, Eamus D (2008) The
response of sap flow to pulse of rain in a temperate Australian
woodland. Plant Soil 305:121–131
Zhang LX, Song YQ (2003) Efficiency of the three-north forest
Shelterbelt program. Acta Sci Nat UN 39:594–600 (in Chinese
with English Abstract)
Zhang XY, Gong JD, Zhou MX, Si JH (2003) A study on the stem sap
flow of Populus euphrtaicr and Tamaris spp by heat pulse
technique. J Glaciol Geocryol 25:585–589
Zhao WZ, Liu B (2010) The response of sap flow in shrubs to rainfall
pulses in the desert region of China. Agric For Meteorol
150:1297–1306
Zheng X, Zhu JJ, Yan QL, Song LN (2012) Effects of land use
changes on the groundwater table and the decline of Pinus
sylvestris var. mongolica plantations in southern Horqin Sandy
Land, Northeast China. Agric Water Manag 109:94–106
Zhou Y, Wenninger J, Yang Z, Yin L, Huang JT, Hou L, Wang X,
Zhang D, Uhlenbrook S (2013) Groundwater-surface water
interactions, vegetation dependencies and implications for water
resources management in the semi-arid Hailiutu River catch-
ment, China: a synthesis. Hydrol Earth Syst Sci 17:2435–2447
Environ Earth Sci (2015) 73:289–301 301
123
Related Documents