CLIMATE CHANGE RISKS, VULNERABILITIES AND ADAPTIVE PRACTICES OF RURAL WOMEN IN SELECTED CARE ETHIOPIA OPERATIONAL SITES Final Report March, 2013 Addis Ababa, Submited to: Care Ethiopia

Welcome message from author
This document is posted to help you gain knowledge. Please leave a comment to let me know what you think about it! Share it to your friends and learn new things together.
Transcript

CLIMATE CHANGE RISKS, VULNERABILITIES ANDADAPTIVE PRACTICES OF RURAL WOMEN
IN SELECTED CARE ETHIOPIAOPERATIONAL SITES
Final Report
March, 2013Addis Ababa,Ethiopia
Submited to: Care Ethiopia

4
Table of ContentsList of Figures 2
List of Tables 21. Introduction 4
1.1 Background 41.2 Objectives of the Study 5
2. Methodology 62.1 Survey Structure 6
2.2 Data Analysis 73. Gender Empowerment Framework 8
4. Description Of The Study Areas 95. Findings And Discussion 11
5.1 Demographic Profile Of Sample Households 115.2 Local Climatic Variability And Trends 12
5.2.1 Variability and Trend in Maximum and Minimum Temperatures12
5.2.2 Rainfall Variability and Trends 165.3 Local Perceptions Of Climate Change 19
5.4 Perceived/Experienced Climate Change Impacts 215.5 Gender Based Differences Of Climate Change Perceptions And Vulnerability 245.6 Responses To Climate Change And Indigenous Coping Strategies
305.7 Impacts Of Gender Relations On Responses To Climate Change 34
5.7.1 Gender Division Of Labor/Roles 355.7.2 Access To And Control Over Resources 39
5.7.3 Decision Making Power 415.8 Influence Of Formal And Informal Structures 43
5.9 Recommended Measures 45

4
6. Conclusions and Recommendations 47Annex I: Dummy Tables Of All Variable Questions 51
LIST OF FIGURESFIGURE 1: TENDS AND VARIABILITY IN MONTHLY MAXIMUM TEMPERATURES AT (A) GIRAWA AND
(B) MEGA STATIONS..................................................13FIGURE 2: TENDS AND VARIABILITY IN MEAN MINIMUM TEMPERATURES AT (A) GIRAWA AND (B)
MEGA METEOROLOGICAL STATIONS..........................................15FIGURE 3: RAINFALL VARIABILITY AND TRENDS AT (A) GIRAWA AND (B) MEGA METEOROLOGICAL
STATIONS...........................................................18
LIST OF TABLESTABLE 1 DEMOGRAPHIC COMPOSITION OF THE SAMPLE HOUSEHOLD (% RESPONDENTS BY RESPONSE)
.................................................................11TABLE 2 ANNUAL AND SEASONAL MAXIMUM AND MINIMUM TEMPERATURES AND COEFFICIENTS OF
VARIABILITY........................................................12TABLE 3 LINEAR TRENDS IN THE MONTHLY MAXIMUM AND MINIMUM TEMPERATURES PER DECADE
(0C).............................................................14TABLE 4: ANNUAL AND SEASONAL RAINFALL (MM) AND COEFFICIENTS OF VARIABILITY......17TABLE 5: LINEAR TREND IN RAINFALL TOTALS PER DECADE (MM)....................17TABLE 6: MAJOR CLIMATE RELATED DISASTERS (% RESPONDENTS BY RESPONSE)...........19TABLE 7 CHANGE IN THE FREQUENCY OR SEVERITY OF CLIMATE RELATED DISASTERS (%
RESPONDENTS BY RESPONSE).............................................20TABLE 8: EXPERIENCED IMPACTS FROM PAST CLIMATE RELATED DISASTERS/ EXTREMES (%
RESPONDENTS BY RESPONSE).............................................21TABLE 9 IMPACT OF CLIMATE CHANGE/ENVIRONMENTAL HAZARDS ON LIVELIHOOD (% RESPONDENTS
BY RESPONSE) .....................................................22TABLE 10: VULNERABILITY TO CLIMATE RELATED DISASTERS BY SOCIAL GROUPS (%
RESPONDENTS BY RESPONSE).............................................24TABLE 11: SITUATIONS THAT MORE EXPOSE THE MOST VULNERABLE SOCIAL GROUPS TO
ENVIRONMENTAL DISASTERS..............................................26TABLE 12 FACTORS THAT CONTRIBUTE TO BUILDING THE RESILIENCE OF THE COMMUNITY.....27

4
TABLE 13: SIMILARITY OF IMPACTS OF CLIMATE CHANGE/ENVIRONMENTAL HAZARDS BETWEEN MEN AND WOMEN..........................................................28
TABLE 14: LOCAL COPING STRATEGIES TO CLIMATE VARIABILITY/ CHANGE (% RESPONDENTS BY RESPONSE)..........................................................30
TABLE 15 AVAILABILITY OF AWARENESS ABOUT VARIOUS ENVIRONMENTAL HAZARDS AND RISKS..32TABLE 16: WOMEN HAVING EQUAL ACCESS TO ADEQUATE INFORMATION AS MEN REGARDING CLIMATE
CHANGE/ENVIRONMENTAL HAZARDS (% RESPONDENTS BY RESPONSE)..................33TABLE 17: ENGAGEMENT IN ENVIRONMENTAL CONSERVATION...........................34TABLE 18 DIVISION OF LABOR AMONG FAMILY MEMBERS IN THE STUDY WOREDAS (% OF MALE
RESPONDENTS).......................................................35TABLE 19 DIVISION OF LABOR AMONG FAMILY MEMBERS IN THE STUDY WOREDAS (% OF FEMALE
RESPONDENTS).......................................................36TABLE 20 RESOURCE OWNERSHIP AMONG THE SURVEYED HOUSEHOLDS IN THE STUDY WOREDAS). .39TABLE 21 DECISION MAKING AUTHORITY AMONG THE SURVEYED HOUSEHOLDS IN THE STUDY AREAS
.................................................................40TABLE 22 WOMEN’S PARTICIPATION IN COMMUNITY STRUCTURES (% RESPONDENTS BY RESPONSE)
.................................................................43TABLE 23: GETTING MATERIAL AND TECHNICAL ASSISTANCE TO COPE WITH THE IMPACTS OF
CLIMATE CHANGE .....................................................44TABLE 24: WOMEN GETTING MATERIAL AND TECHNICAL SUPPORT TO WITHSTAND THE IMPACTS
OF CLIMATE CHANGE...................................................44Table 25: Suggested interventions to help women and youngsters adapt
to climate change................................................45
1. INTRODUCTION
1.1 BACKGROUND Climate change impacts gender relations in general and has adverseconsequences on women in particular. Evidence from around the worldshow that the consequences of climate change would be worse among

4
women because of the fundamental inequalities in gender relations.This is essentially the result of higher levels of vulnerability andlow levels of adaptive capacity among women. In Africa for instance,women often lack resources such as basic productive assets,agricultural and livestock inputs and services as well as carry heavywork burden. These factors imply that women compared to men are illprepared and resourced to handle the impacts of climate change ontheir livelihood be it agriculture or livestock production. Theability to actively respond and adapt to climate change depends uponcapacity, access to and control over livelihood resources to be ableto cope, adapt and transform. From a gender perspective, adaptivecapacity or the ability to adjust to climate change is sociallydetermined and reflects existing gender inequalities.1 Accordingly,although climate change negatively affects poor households in general,the adverse effect is more severe on poor women.
Various instances of the adverse impacts of climate change can be seenin the lives of women. For instance, climate change heavily impactson the availability of natural resources such as energy and water.These resources are in turn crucial for meeting both the productiveand reproductive functions of women. Women in Africa are engaged inthe dual task of agricultural production and reproductive functions,the latter encompassing a range of activities such as raising ofchildren, cooking, cleaning, fetching water and fuel wood, taking careof the sick, the elderly and generally the community. Reproductivefunctions of women are very much dependent on natural resources.Accordingly pressures on resources such as water and fuel wood end upincreasing the workload of women as they have to for example travellonger distance to fulfill these basic needs.
Similarly, for women engaged in agriculture and livestock production,climate change brings about changes in the environment and landscapewhich support production in terms of drought, erosion and flooding.2
1 Valerie Nelson Climate Change and Gender: What role for Agricultural Research among Smallholder Farmers in Africa? 2010. 2Valerie Nelson as note 1 above.

4
For women, the impact will be hard felt because limited resourcesimply that it is difficult to diversify their sources of livelihood.Further, limited mobility restricts the options available for women intimes of environmental disasters.
Climate change further impacts on human health in a number of ways.The human health hazards due to climate change are severe among women.Women as part of their reproductive role are the primary care giversof the sick in their families and communities. Health problems wouldthus add to the work burden of women and end up detracting from theirtime in productive activities.
The brief introduction above shows that vulnerability to climatechange risks is affected by various factors. Socio-cultural andeconomic inequalities, where gender is a primary determinantconstitute one such factor. Inequalities of this nature contribute toconstrain the ability of women to respond to climate change.Similarly, poor men face constraints in terms of their ability to takeaction on climate change. It is based on this underlying assumptionregarding experiences and impacts of climate change within communitiesthat the assessment of climate change risks, vulnerabilities andadaptive practices of poor and vulnerable rural women farmers in theselected study areas is carried out. Further, adaptive actions toaddress the vulnerabilities, workload and livelihood challenges of thestudy subjects will also be informed by the underlying differences(inequalities) which shape adaptive capacities.
1.2 OBJECTIVES OF THE STUDY The general objective of the study is to analyze and document therisks, vulnerabilities and adaptive practices of women and girls inrelation to climate change in selected operational woredas of CAREEthiopia. In line with this, the specific objectives are to:
understand and document climate change induced hazards, risks andvulnerabilities in selected woredas;
o drought frequency

4
o flood frequencyo frosto heat
assess community based coping mechanisms; assess adaptive capacity of women across status with focus on
resource-poor and marginalized rural women and girls; identify ways in which gender shapes women’s and men’s
differential experiences of climate change risks andvulnerabilities with regard to roles, resources and power;
identify and document good and new indigenous adaptationpractices including ways on how to popularize and scale up suchpractices; and
Recommend appropriate and feasible ways to help build theresilience and adaptive capacity of resource-poor and mostvulnerable communities and social groups- with focus on womenfarmers and pastoralists and young girls.
2. METHODOLOGYIn line with the objectives, the study employed data collectionmethodologies by using participatory, affordable, easy-to-understandand useful techniques. A set of quantitative and qualitativeinstruments were employed to collect data. Quantitative methodsconsisted of administering close ended questionnaires and compilingdata regarding the main areas of inquiry for this assessment. Thequalitative approach included in-depth and key informant interviews aswell as focus group discussions.
Key Informant Interview Targets: in each woreda, the following constitutedthe targets for the key informant interviews: Agriculture and RuralDevelopment/Pastoralist and Rural Development offices representatives,office for Women, Children and Youth Affairs at Woreda level, WoredaHealth office and Care staff at site; at Kebele level communityleaders

4
Focus Group Discussion Targets: for both woredas, men and women members ofthe community. Two FGDs per kebele one for men and another one forwomen were conducted.
Meteorological Data: Monthly rainfall and minimum and maximum temperaturetime series data for Mega and Girawa meteorological stationsrepresenting Miyo and KurfaChelleworedas respectively were obtainedfrom the National Meteorological Agency. These meteorological stationshave relatively good quality and long records (>15 years) and locatedat different climatic zones of Ethiopia. A detailed analysis of thesemeteorological records, as described below, was undertaken to detectany trends and patterns.
1.3 SURVEY STRUCTURE The structured survey was carried out using samples of households andtheir respective eligible male and female members drawn from differentRKAs in the Woredas. The design of the survey, the sample size and thesampling procedures are discussed below.
Sampling Design and Sample SizeIn order to meet the objectives and requirements of the study, and toensure all RKAs’ representativeness, we have developed a samplingframework, employing purposive and random sampling procedures. Thestudy Woredas had been selected on purpose, and in a similar approachsix Rural Kebele Administrations (RKAs) were selected from theWoredaspurposively so as to capture any variations in agro-ecologicaland climatic conditions (and hence variations in vulnerability tocurrent climatic variability) as well as accessibility to undertakethe fieldwork in the designated period of time. The 6 sample RKAs weretaken from different agro-climatic zones (kola, dega and weinadega) ofthe Woredas.
In a second stage, the secondary sampling units; i.e., households (HH)were selected in a simple random sampling procedure. But consideringdifferent statistical factors such as; intra-cluster correlationcoefficient, design effects, etc and similarity among the households

4
residing in a cluster (RKA); i.e., relative homogeneity of ruralhouseholds in terms of resource endowments, livelihood challenges andvulnerabilities to climatic and other shocks, and as households withinthe same cluster (RKA) have similar characteristics, it is prominentto take as small samples as possible from each cluster (RKAs) but alsomaking the sample size statistically significant. Using thisinformation, the sample household size has been determined to be 20households per RKA by assuming that data obtained from these sampledHH represents the total households residing in each RKA (cluster).Other factors such as time and resource constraints have also beenconsidered in fixing sample size of HH per RKA.
Therefore, we have used a sample size of 20 households; i.e., both menand women within each selected HH from each selected RKAs which makesthe total sample size 60 households (60 Men and 60 Women) for eachworeda. Consequently, the sampled women respondents were composed ofChronically Food Insecure Rural Women (CFIRW). These were Safety NetHouseholds, that include women headed households, divorced andseparated women, as well as married women/ husbanded women.
In addition to the household survey, two focus group discussions wereconducted in each of the RKAs for both woredas. Moreover, keyinformant interviews were conducted with selected stakeholders at theRKA and Woreda levels.
3.2 DATA ANALYSIS Data compiled through primary and secondary means were edited, codedand compiled using grid structure, by which similar issues were,grouped together, thereby allowing quantifying and analysis offindings. The information gathered through the review of documents andqualitative and quantitative questionnaires were analyzed within theframework of the assessment and theme objectives. The collected datawere digitalized using the statistical package for social sciences(SPSS) and analyzed based on the tabulation plan. On the other hand, the analysis of the rainfall and temperature data,both non-parametric Mann–Kendall (eq. 1) and parametric linear

4
regression (eq.2) tests were applied to detect trends over the studyperiod.
xi = f(ti) + ε………………………………………. (Eq. 1)Where, f(t) is a continuous monotonic increasing or decreasing function of time and the residuals εican be assumed to be from the same distribution with zero mean. It is therefore assumed that the varianceof the distribution is constant in time.
Y = mx + b …………………………………….. (Eq. 2)Where, y is dependent variable, m is the slope, x is independentvariable, and b is the intercept.
Mann–Kendall test was employed to test the null hypothesis of notrend, Ho, i.e. the observations xi are randomly ordered in time,against the alternative hypothesis, H1, where there is an increasingor decreasing monotonic trend.
A normalized test statistics (Z-score) was used to check thestatistical significance of the trend obtained from Mann-Kendall test.The F-distribution test was used to evaluate statistical significanceof trends obtained from linear regression technique. Apositive(negative) value of Z indicates an upward (downward) trend. The95% confidence level was used to check the significance level oftrends. The slopes of the trends were calculated by the least-squareslinear fitting method. The coefficient of variation (CV) was used as astatistical descriptor of rainfall and minimum and maximumtemperatures variability.
3. GENDER EMPOWERMENT FRAMEWORK Addressing inequalities requires the application of various sets ofmeasures targeted at empowering vulnerable sections of society.Various empowerment frameworks are applied by developmentpractitioners. This study utilizes the empowerment framework adoptedby CARE which focuses on bringing about changes in women’s ownaspirations and capabilities, the environment that influences ordictates women’s choices, and the interactions women engage in each

4
day. The combined effect of these changes is what is needed for awoman to realize her full human rights. It thus follows that concertedefforts at these three levels: individual, structure and relationslevel is what is envisaged by the CRAE empowerment framework.
It is in light of the above empowerment framework that the data isgathered and analyzed. Accordingly, through questionnaires as well asqualitative methods of data collection, the study looked into thefollowing themes:
Individual focused assessment: in this category of questions,the attempt is to examine the agency of women that are facedwith climate change hazards. The questions looked into climatechange related knowledge/information that women and men in therespective communities have; types and extent of resourceownership, control and utilization, decision making power athousehold level,
Structure focused assessment: individual choices are to a largeextent affected by both formal and informal structures insociety. Formal structures like government policies includinglegal frameworks, community support programs, package of goodsand services are all important parameters examined under thiscategory. Culture, tradition and religion also play pivotal rolein terms of shaping individual choices. In light of this,questions focusing on the impact of culture and religion vis-à-vis capacity to adapt to climate change are entertained in thissection.
Relations based assessment: power relations through which awoman negotiates her path/choices and the subsequent actions arealso examined. Household gender relations in terms of decisionmaking power on issues like expenditure, income and the likedirectly impact on her capacity to respond and adapt to climatechange.
The analysis presented below attempts to articulate the findings inline with the three elements of the empowerment framework.

4
4. DESCRIPTION OF THE STUDY AREASMiyo WoredaMiyo woreda, the study area, is located in Borena Zone of the OromiyaRegional State. The woreda is home to about 57,000: 49% male and 51%female. Health coverage in the woreda has reached 80%. Yellow feverand malnutrition related diseases are common in particular among theelderly.
The woreda is characterized by different kinds of agro-ecologicalzones. About 85% covers highland while the remaining is lowland. Thereare four seasons: long dry season, long rainy season, short dry seasonand short rainy season. The population is mostly pastoralist althoughin some areas agro-pastoralists exist. While pastoralists use 85% ofthe land, the remaining is used for farming.
There are about 17 kebeles in the woreda. All the kebeles are coveredby the safety net program. About 11,000 people are beneficiaries ofsafety net. Close to 2200 people benefit from direct support. About1/4th of the total population is covered by the safety net program. Forthe last 15 years the woreda has experienced drought and in particularin 2003 EC, it experienced severe form of drought as there was no rainin both of the rainy seasons. This led to the perishing of about105,000 livestock.
KurfaChelle WoredaKurfaChelle woreda is located in the Oromia regional state. It isinhabited by close to 65,000 people with 52.5% consisting of women.Health coverage in the woreda has reached 100% with a total of fourhealth stations. Education coverage is also high in particular atprimary level (92%) and secondary at 72%. There is relatively highlevel of drop out especially among girls which is attributed to loweconomic status of parents as well as early marriage.
The major source of livelihood is agriculture with sorghum and maizeas the main products. Cash crops like chat and coffee are alsoproduced. There is also livestock production for commercial purposes.

4
11 of the 18 kebels are covered by the safety net program. Drought iscommon in the area with a particularly severe episode in 2003EC.

4
5. FINDINGS AND DISCUSSION
1.4 DEMOGRAPHIC PROFILE OF SAMPLE HOUSEHOLDS A total of 60 households from the Miyo woreda of Borena zone took partin this study. Similarly, total of 60 households from KurfaChelleworeda of West Hararghe zone took part in this study. In eachhousehold male and female adult members were interviewed. Accordingly,about 240 respondents took part in the quantitative aspect of thestudy. Looking into the age structure, in Miyo woredathe majority(about 70%) of the men were between the ages of 35 to 45 and above,for the women, the majority (72%) fell within the age group of 25-35.In KurfaChelle, the majority (about 65%) of the men were between theages of 25 to 45 and above. The vast majority of male and femalerespondents have not completed primary cycle of education (grades 1-4). The household size for the vast majority of the respondents variedbetween 4 and 10.
TABLE 1DEMOGRAPHIC COMPOSITION OF THE SAMPLE HOUSEHOLD (% RESPONDENTS BY RESPONSE)
Demographic Attributes
WoredaK-Chelle Miyo
Male Female Male Femal
e
Age
<25 4.9 13.3 3.3 23.3 25-34 31.1 51.7 21.7 46.7 35-45 41.0 13.3 36.7 28.3 45+ 23.0 21.7 38.3 1.7
Educational Status
illiterate 63.9 91.7 81.7 91.7 Primary (1st Cycle 1 - 4Grades) 24.6 5.0 8.3 1.7
Primary (2nd Cycle 5 - 8Grades) 4.9 3.3 8.3 5.0
Secondary (9 - 12 Grades) 6.6 .0 1.7 1.7
HouseholdSize
1-3 19.7 25.0 3.3 10.0 4-6 42.6 50.0 58.3 55.0 7-10 32.8 19.6 6.7 10.0 10+ 4.9 5.4 31.7 25.0
Number OfChildren
None 3.3 13.3 1.7 1.7 4-7 34.4 33.3 48.3 46.7

4
1-3 49.2 40.0 35.0 25.0 7+ 13.1 13.3 15.0 26.7
MaritalStatus
Single 21.3 1.7 .0 1.7 Married 78.7 85.0 100.0 98.3 Widowed .0 10.0 .0 .0 Divorced .0 3.3 .0 .0
HouseholdHeadship
Female Headed HH 1.6 13.3 .0 3.3 Male Headed HH 98.4 86.7 98.3 95.0 Other Family Members .0 .0 1.7 1.7
BreadWinningResponsibility
Husband 80.3 75.0 81.7 65.0 Wife 4.9 13.3 1.7 1.7
Both 14.8 11.7 16.7 33.7
1.5 LOCAL CLIMATIC VARIABILITY AND TRENDS
1.5.1 Variability and Trend in Maximum and Minimum TemperaturesI. Maximum Temperature Variability and Trends
Table2, 3 and figure 1 shows variability and trends of the maximumtemperature at Girawa and Mega meteorological stations. Girawameteorological station has experienced mean annual maximum temperatureof 20.40C, while Mega station has experienced mean annual maximumtemperature of 24.70C. The mean annual maximum temperature at Megastation is higher than the Girawa station (Table 2).
Girawa station showed higher inter-annual and seasonal variability ofmean maximum temperature than Mega station as shown by the coefficientof variation (Table 2). Generally, at Girawa stationmean maximumtemperature is more variable during Kiremtseason than the otherseasons. In contrast, at Mega station mean maximum temperature duringthe Belg seasonis much more variable than the other seasons (Table 2).
The linear regression and Mann–Kendall trend test results (Table 2 andFigure 2) show trends in the monthly maximum temperature at Girawa andMega stations. The mean annual maximum temperature showed warmingtrends of 0.70C and 0.30C per decade at Girawa and Mega meteorologicalstations, respectively (Figure 1 and Table 1). The warming trend shownat Girawa station was statistically significant; however, the trend

4
observed at Mega station was not statistically significant. Ingeneral, the mean maximum temperature at Girawa station showedstatistically significant warming trend both at annual and seasonaltime scales.
TABLE 2ANNUAL AND SEASONAL MAXIMUM AND MINIMUM TEMPERATURES AND COEFFICIENTS OF VARIABILITYStations
AnnualTemperature (oC)
BegaTemperature (oC)
BelgTemperature (oC)
KiremtTemperature (
Min
Max
Mean
SD CV Min
Max
Mean
SD CV Min
Max
Mean
SD CV Min
Max
Girawa
MaxT18.3
22.2
20.4
1.1
5.35
17.8
23.0
20.4
1.3
6.3
19.0
23.0
21.2
1.2
5.4
17.4
21.7
MinT 8.8
10.6
9.9 0.4
4.4
7.4
10 9 0.7
7.8
9.3
11.7
10.5
0.6
6.0
9.1
11.2
MegaMaxT 21
.825.2
24.7
1.0
3.9
23.4
27.6
24.7
0.96
3.9
22.6
26.3
24.6
1.1
4.5
19.1
23.7
MinT 13.6
14.3
13.9
0.2
1.5
13.9
15 14.5
0.3
2.4
13.2
15.8
14.8
0.5
3.6
12.0
13.3

4
FIGURE 1:TENDS AND VARIABILITY IN MONTHLY MAXIMUM TEMPERATURES AT (A) GIRAWA AND (B) MEGA STATIONS
a b

4
TABLE 3LINEAR TRENDS IN THE MONTHLY MAXIMUM AND MINIMUM TEMPERATURES PER DECADE (0C).
Stations Annual Kiremt BelgLT MK LT MK LT MK
Girawa MaxT 0.71 IST 0.81 IST 0.6 ISTMinT 0.06 NST 0.32 IST 0.02 NST
Mega MaxT 0.31 NST 0.3 NST 0.9(IST) NST
MinT -0.02 NST -0.13 NST 0.09 NSTNote: The Mann–Kendall (MK) trend test result is indicated as NST forno significant trend, IST for increasing significant trend and DST fordecreasing significant trend. The 95% confidence level was used toevaluate the statistical significance of trends.
II. Minimum Temperature Variability and Trends Tables2, 3 and Figure2 show variability and trends of the monthlyminimum temperature at Girawa and Mega stations. Girawa station hasexperienced mean annual minimum temperature of 100C, while Mega stationhas experienced mean annual minimum temperature of 140C over theobservation period. The mean annual minimum temperature at Megameteorological station is higher than Girawa meteorological station(Table 3).

4

a b
4
FIGURE 2: TENDS AND VARIABILITY IN MEAN MINIMUM TEMPERATURES AT (A) GIRAWA AND (B) MEGA METEOROLOGICAL STATIONS
Girawa station showed higher inter-annual and seasonal variability ofmean minimum temperature than Mega station as shown by the coefficient

4
of variation (Table 3). Generally, at Girawa stationmean minimumtemperature is more variable during Begaseason than the other seasons.In contrast, at Mega station mean minimum temperature during the Belgseasonis much more variable than the other seasons (Table 3).
The linear regression and Mann–Kendall trend test results (Table 3 andFigure 2) show mixed trends in the mean minimum temperature at Girawaand Mega stations. The mean annual minimum temperature showed awarming trend of 0.060C at Girawa station. In contrast, the mean annualminimum temperature at Mega station showed a declining trend of -0.020Cper decade (Table 3 and Figure 2). The trends shown at Girawa and Megameteorological stations were not statistically significant howeverboth at annual and seasonal timescales except for the Kiremt season atGirawa station (Table 3 and Figure 2).
5.2.2 Rainfall Variability and TrendsNational Meteorological Service Agency (NMSA, 1996) identified threeseasons in Ethiopia. The main rainy season from June to September, thesecond is the dry season from October to December/January, and thethird is the small rainy season from February/March to May, knownlocally as Kiremt, Begaand Belgseasons respectively.
During Kiremt the air flow is dominated by a zone of convergence inlow-pressure systems accompanied by the oscillatory inter-tropicalconvergence zone (ITCZ) extending from west Africa through the northof Ethiopia towards India. Kiremt rainfall covers most of the countrywith the exception of the south and southeast of Ethiopia. DuringBega, the country predominantly falls under the influence of warm andcool northeasterly winds. These dry air masses originate either fromthe Saharan anticyclone and/or from the ridge of high pressureextending into Arabia from a large high over central Asia (Siberia).In Bega, most of the country is generally dry.
The Belg season coincides with the domination of the Arabian high asit moves towards the north Arabian Sea. Major systems during the Belgare the development of a thermal low (cyclone) over the south of the

4
Sudan, and winds from the Gulf of Aden and the Indian Ocean highs thatare drawn towards this centre and blow across central and southernEthiopia. These moist, easterly and southeasterly winds produce themain rains in southern and southeastern Ethiopia and the Belg rains tothe east-central part of the northwestern highlands.
TABLE 4: ANNUAL AND SEASONAL RAINFALL (MM) AND COEFFICIENTS OF VARIABILITYAnnual
Rainfall (mm)Kiremt
Rainfall (mm)Belg
Rainfall (mm)Stations
Min Max Mean
SD CV Min Max Mean
SD CV Min Max Mean
SD CV
Girawa
681.6
1337.7
973.9
168.6
17.3
327.0
754.8
470.6
94.0
20.0
207.6
701.6
395.8
124.8
31.5
Mega 318.2
963.2
628.1
164.9
26.3
6.6 341.1
72.9
71.6
98.2
164.5
712.4
359.0
131.2
36.5
Table 4 and Figure 3 show the seasonal and annual variability andtrends of rainfall at Girawa and Mega stations. The annual totalrainfall at Girawa station is higher than Mega station. Girawareceives much of its rainfall during the Kiremt season; while Megareceives much of its rainfall during the Belg season (Table 4).Therainfall shows high inter-annual variability as shown by thecoefficients of variability. Generally, the Belg rainfalls are muchmore variable than the Kiremt rainfall at Girawa. In contrast, theKiremt rainfalls are much more variable than the Belg rainfall at Mega(Table 4).
TABLE 5:LINEAR TREND IN RAINFALL TOTALS PER DECADE (MM).
Stations Annual Kiremt BelgLT MK LT MK LT MK
Girawa -21.2 NST -3.8 NST -34.6(NST)
DST
Mega -97.6 DST -57.3 DST -46.4 NSTNote: The Mann–Kendall (MK) trend test result is indicated as NST forno significant trend, IST for increasing significant trend and DST fordecreasing significant trend. The 95% confidence level was used toevaluate the statistical significance of trends.

4
The linear regression and Mann–Kendall trend test results showdecreasing trends in the annual and seasonal rainfall totals at Girawaand Mega (Table 5 and Figure 3). The annual total rainfall has showndeclining trends of -22mm and -98mm per decade for Girawa and Mega,respectively. However, the trend observed at Girawa was notstatistically significant (Table 5 and Figure 3). It is clearlyobserved that Mega station has experienced a dramatic decline in meanseasonal rainfall during the Kiremt season. On the other hand, asMann–Kendall trend test results show Girawa station experienced asignificant declining trend in mean annual rainfall during the Belgseason (Table 5 and Figure 3).
FIGURE 3: RAINFALL VARIABILITY AND TRENDS AT (A) GIRAWA AND (B) MEGA METEOROLOGICAL STATIONSa b

4
5.3 LOCAL PERCEPTIONS OF CLIMATE CHANGE The assessment started with establishing whether the study areas areprone to climate change induced risks/hazards. In addition to themeteorological data, community members in the study areas were askedabout the major types of climate change induced hazards they haveexperienced in their areas. 100% of the participant men and women bothin Miyo and KurfaChelle, identified drought as the major type ofclimate change induced hazard in their area. Floods and heavy rainsare also identified as major types of climate related disasters inMiyo while in KurfaChelle these are not major problems. Damagingwinds and high temperatures are reported to be major problems in Kurfabut only close to 50% of the respondents claimed the same in Miyoworeda (Table 4.2).
In Miyo woreda, in the focus group discussions, the community membersstated drought and animal diseases which in turn are attributed to thechanging climate pose great obstacle to maintain their livelihood.Focus group discussants also listed the following as some of theobserved impacts of climate change in their lives: lack of water forlivestock; new forms of animal disease due to the changing climateaffecting goats, sheep, poultry; weeds and pest affecting crops andincreasing temperature.
TABLE 6: MAJOR CLIMATE RELATED DISASTERS(% RESPONDENTS BY RESPONSE)
Q. 16 in your area?3
WestHarerege
Borena
MaleFemale
MaleFemale
Drought100.0
100.0 100.0 100.0
Flood 32.8 11.7 100.0 83.3Heavy rainfalls 34.4 10.0 93.3 76.7
3Percentiles are calculated to show only respondents that responded “Yes” for a respective question (i.e the rest of the proportion is accounted for a set of “No” responses)

4
Q. 16 in your area?West
HareregeBorena
Damaging winds 63.9 80.0 50.0 41.7High temperatures 82.0 98.3 54.0 63.7
Key informant interviews with representatives of CARE office in Miyorevealed that reduction in the volume and frequency of rain andincrease in temperature are the major climate change phenomena in thearea. These have resulted in more frequent drought, land degradation,shift from farming to charcoal production.
In KurfaChelle woreda, focus group discussant men highlighted thatdrought has occurred repeatedly in their woreda. In particular the2003 drought was severe. They also noted that rains come much laterthan expected and further there is increase in temperatures.Associated impacts according to the men are increase in epidemics aswell as the spread of pests. The women also stressed drought as themajor climate related disaster in their areas.
Key informant interviews with representatives of CARE office inKurfaChelle revealed that the frequency of drought has increased inthe woreda. In the past, drought used to occur every 8 years now it ishappening every two years. According to the representative, in termsof rainfall they have noted three things: the rain comes late becauseof this the community is unable to produce ‘belg’ products; there isreduction in the volume of the rain even when it rains hence it isinsufficient to grow crops and finally the coverage of the rain islimited to some areas leaving most areas without rain. Further thereis spread of pests affecting crops. Due to changes in the temperatureas well as distribution in rainfall, there is a shift in the types ofcrops cultivated for instance from sorghum to maize. There are healthrelated hazards on humans for example malaria is becoming a bigproblem. Shortage of water is affecting the livelihood of thepopulation. Natural disasters like landslides are also observed.
TABLE 7CHANGE IN THE FREQUENCY OR SEVERITY OF CLIMATE RELATED DISASTERS (% RESPONDENTS BY RESPONSE)

4
Q. 17 Have you noticed anychange in the frequency orseverity of climate relateddisasters affecting your areaover the past 30 years?
West Harerege Borena
Responses Male Female Male FemaleYes 96.7 76.7 84.7 93.3No 0.0 23.3 3.4 3.3No Response 3.3 0.0 11.9 3.3
Further attempts were made to assess the changes in terms of frequencyas well as severity of climate change induced hazards or disasters intheir areas. This inquiry will help to gage the extent of the problemand can give indications on future interventions. 96% of therespondent men and 76% of the women in Miyo woreda reported that theyhave noted changes in the frequency and severity of climate relateddisasters in the past thirty years. Regarding the nature of thechange, over 60% stated that the frequency and the severity of climaterelated disasters have increased. Among the men, about 52% said it hasbecome more frequent while about 42% of them reported that it is lesssevere. One notes here that the experience of changes in terms of theseverity of climate induced disasters is different among women andmen, while women believe that it has become more severe, the menexperienced less severe climate change induced disasters. There isthus a gender differentiated experience in regards to the experiencesof climate induced disasters.However, there are similarities in terms of their expectations for thefuture. Accordingly, asked whether they would think that the frequencyand severity of climate change hazards will increase in the future,both male and female respondents were of the view that climate changeinduced disasters will increase both in frequency and severity in thefuture.
In KurfaChelle woreda, 92% of the male respondents said the changeshave become more frequent and 71% said it has become more severe. Forthe women as well, about 70% of them reported that it has become more

4
frequent. Similarly, about 80% of them stated that it has become moresevere.
One notes here that the experience of changes in terms of the severityof climate induced disasters is more or less similar among women andmen in Kurfa. Similarly, male and female respondents are of the viewthat frequency and severity of climate change will increase in thefuture.
5.4 PERCEIVED/EXPERIENCED CLIMATE CHANGE IMPACTS In Miyo woreda, the respondents have reported drought, flooding andheavy rain as the major types of climate related disasters in theirareas. Questions were raised regarding the impact of these disastersat a general level and in particular on the livelihood of therespondents. For the respondent men, crop failure, displacement ofpeople, loss of livestock, disruption of water supply and destructionof property were reported as the impacts of climate related disastersin their areas. For the women, occurrence of epidemics tops the listfollowed by crop failure, loss of livestock and disruption of watersupply. Further, focus group discussions revealed that because they donot get enough dairy products from their livestock, their children arebeing affected in different ways. Some women stated that theirchildren are malnourished due to lack of milk; they are at timesforced to withdraw their children from school as they do not have thenecessary resources to send them to school and even older people aredying of malnutrition.
TABLE 8: EXPERIENCED IMPACTS FROM PAST CLIMATE RELATED DISASTERS/ EXTREMES (% RESPONDENTS BY RESPONSE)Q. 21 What impacts did climate relateddisasters cause in the past?4 West Harerege Borena
Responses Male Female Male FemaleCrop failure 77.0 80.0 70.0 55.0displacement of people 29.5 21.7 65.0 6.7
4See Footnote 3 above

4
Q. 21 What impacts did climate relateddisasters cause in the past?
West Harerege Borena
occurrence of epidemics (e.g. diarrhoea,malaria)
23.0 20.0 40.0 68.3
destruction of property 16.4 38.3 45.0 28.3destruction of infrastructure (schools,roads, health centres, bridges)
11.5 .0 30.0 1.7
disruption of water supply 14.8 8.3 55.0 35.0Loss of livestock (from diseases anddeaths)
44.3 43.3 61.7 43.3
damage to crops 3.3 20.0 5.0 10.0
It is important to note here that experiences of impacts differ amongmen and women. These differences are very much aligned to theprevailing gender division of labor in society. As women are primarycare givers for the sick in their communities (children and theelderly in particular) they felt the health related impacts of climaterelated disasters i.e. the spread of epidemics more than the men. Forthe men that are tasked with provision of households, crop failure andloss of livestock are more severely felt.
In KurfaChelle woreda, crop failure, loss of livestock anddisplacement of people were reported as the major impacts of climaterelated disasters by about 77%, 44% and 30% of the men respectively.Similarly, about 80% of the women reported that crop failure is themajor impact followed by loss of livestock for 43% of the womenrespondents. Close to 38% of the women respondents also reported thatdestruction of property is another impact attributed to climaterelated disasters.
Probing further, respondents were asked about the impact of climaterelated hazards on their livelihoods. In Miyo woreda, 88% of the menreported that they were unable to farm and to raise cattle due toclimate induced disasters. About 48% of the men reported that theynoted a decline in their farm output. Similarly about 43% noted adecline in their livestock output. For 77% of the women reduction in
4
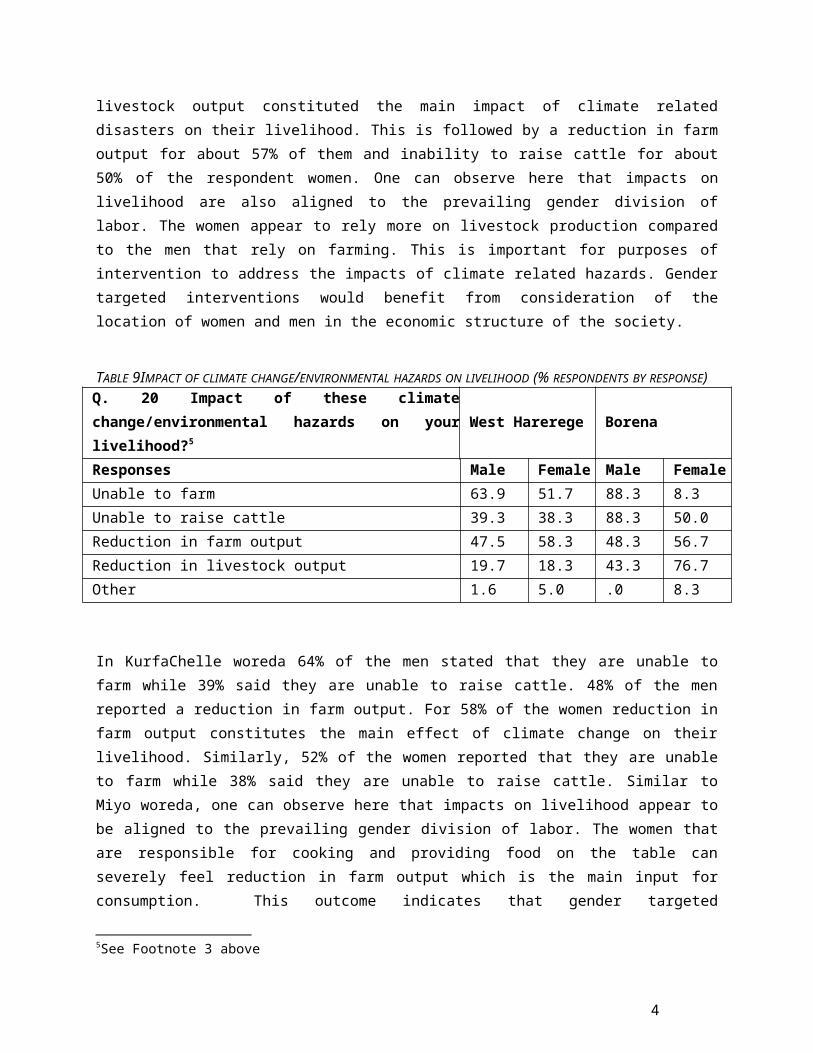
livestock output constituted the main impact of climate relateddisasters on their livelihood. This is followed by a reduction in farmoutput for about 57% of them and inability to raise cattle for about50% of the respondent women. One can observe here that impacts onlivelihood are also aligned to the prevailing gender division oflabor. The women appear to rely more on livestock production comparedto the men that rely on farming. This is important for purposes ofintervention to address the impacts of climate related hazards. Gendertargeted interventions would benefit from consideration of thelocation of women and men in the economic structure of the society.
TABLE 9IMPACT OF CLIMATE CHANGE/ENVIRONMENTAL HAZARDS ON LIVELIHOOD (% RESPONDENTS BY RESPONSE)Q. 20 Impact of these climatechange/environmental hazards on yourlivelihood?5
West Harerege Borena
Responses Male Female Male FemaleUnable to farm 63.9 51.7 88.3 8.3Unable to raise cattle 39.3 38.3 88.3 50.0Reduction in farm output 47.5 58.3 48.3 56.7Reduction in livestock output 19.7 18.3 43.3 76.7Other 1.6 5.0 .0 8.3
In KurfaChelle woreda 64% of the men stated that they are unable tofarm while 39% said they are unable to raise cattle. 48% of the menreported a reduction in farm output. For 58% of the women reduction infarm output constitutes the main effect of climate change on theirlivelihood. Similarly, 52% of the women reported that they are unableto farm while 38% said they are unable to raise cattle. Similar toMiyo woreda, one can observe here that impacts on livelihood appear tobe aligned to the prevailing gender division of labor. The women thatare responsible for cooking and providing food on the table canseverely feel reduction in farm output which is the main input forconsumption. This outcome indicates that gender targeted
5See Footnote 3 above

4
interventions would benefit from consideration of the location ofwomen and men in the economic structure of the society.
In focus group discussion, the men reported that malnutrition andstunted growth among children are commonly seen problems associatedwith climate change induced drought. The men complained that it hasmade them dependent on handouts and has led to a lot of migrationsamong the community members. Even traditional mechanisms of copinglike borrowing crop products during the dry season and repaying afterthey collect the chat produce in the rainy season have becomedifficult because they can no longer produce the chat in time due tolack of rains.
The women that took part in focus groups highlighted that due toreductions in farming output, they can no longer send their childrento school. Children are also facing stunted growth and illnesses arecommon among children. There is a lot of migration. Further, long heldtraditions of coping like borrowing food during hard times has becomedifficult because no one has enough food to give to those in need.The story of Razia Mohammed clearly illustrates the severeconsequences of climate change on the livelihood of the community.
“Razia is a window who lives with her children in KurfaChelleworeda. Some five years ago, she had about 8-10 heads oflivestock, 15 goats and she used to get about 10-15 quintals ofcrop produce per year. Due to the 2003 drought, she lost all thelivestock and further was unable to produce as much from herland. Due to this, her lot changed significantly and now she isengaged in selling firewood to sustain her family.”
Informants from the CARE office reported that significant changes inthe landscape are being observed, for instance due to heavy erosionslakes are disappearing. CARE representatives in the area also notedthat farmers are unable to prepare their land including utilize farminputs for farming as the timing of the rain is unpredictable. Thereis a huge loss of asset in particular livestock that farmers are

4
forced to use hoes and other simple farm implements for farming. Thishas its own implications for productivity. According to CAREofficials, changes are noted in terms of types of crops that farmersplant. Previously, there was a practice of diversifying the crops thatthey plant. Nowadays, everyone is shifting towards chat which is thepreferred item in terms of its drought resistance as well as goodmarket price. Because of the recurring drought the number of peopleseeking assistance is on the rise putting pressure on the supportframework.
6.5 GENDER BASED DIFFERE NCES OF CLIMATE CHANGE PERCEPTIONS AND VULNERABILITY As the findings above indicate, there are differences in terms of theexperiences of climate change and associated disasters among differentsections of the population. This is a factor of the pre-existingposition of members of society in terms of their socio-cultural andeconomic positions. This recognition opens the door to further examinethe factors that contribute to the vulnerability of some sections ofsociety to climate related hazards compared to others. This analysisis important in that it helps one to target sources of vulnerabilitywhile designing interventions aimed at empowering vulnerable sectionsof society. On the basis of this, respondents in the study areas wereasked to identify social groups which they thought were particularlyvulnerable to climate related disasters.
TABLE 10:VULNERABILITY TO CLIMATE RELATED DISASTERS BY SOCIAL GROUPS (% RESPONDENTS BY RESPONSE)Q. 22 Vulnerability to climate related disasters
Woreda West Hararghe Borena
ResponsesMost
Vulnerable
LessVulnerable
Resilience
NoResponse
MostVulnerab
le
LessVulnera
ble
Resilience
NoRespon
seSocialGroups
M F M F M F M F M F M F M F M F
Female headed households
85.2 83.314.8
16.7
0.0 0.0 .0 0.098.3
100.0
1.7 .0 .0 .0 .0 .0
Husbanded women
29.5 33.334.4
41.7
36.1
25.0
.0 .0 .0100.0
91.7
.0 8.3 .0 .0 .0

4
Q. 22 Vulnerability to climate related disasters
Girls 44.3 53.354.1
43.3
1.6 3.3 .0 .018.3
6.781.7
93.3
.0 .0 .0 .0
Elderly 88.5 96.711.5
3.3 .0 .0 .0 .090.0
100.0
10.0
.0 .0 .0 .0 .0
Boys 52.5 50.047.5
46.7
.0 3.3 .0 .025.0
28.3
75.0
71.7
.0 .0 .0 .0
Small children
100.0 100.0 .0 .0 .0 .0 .0 .098.3
100.0
1.7 .0 .0 .0 .0 .0
Disabled 91.8 90.0 8.2 3.3 .0 .0 .0 6.793.3
100.0
6.7 .0 .0 .0 .0 .0
HIV& AIDS infected
98.4 90.0 .0 .0 .0 .01.6
10.0
100.0
100.0
.0 .0 .0 .0 .0 .0
Poor households
96.7 96.7 .0 3.3 1.6 .01.6
.088.3
100.0
.0 .0 8.3 .0 3.3 .0
In Miyo woreda, male respondents identified HIV infected people,female headed households, small children, the disabled, the elderlyand poor households (in this order) as the most vulnerable to climaterelated disasters. Women respondents too identified similar categoriesof social groups as the most vulnerable. For both men and womenrespondents, boys and girls are not regarded as most vulnerable groupsin times of climate related disasters. One notable difference amongthe two sets of respondents is the identification by women respondentsof households with both male and female members (both spouses) asequally vulnerable as the other social groups. 100% of the femalerespondents claimed that women with husbands are equally vulnerable asthe other social groups. For 92% of the men respondents though womenwith husbands are regarded as less vulnerable. This outcome isinteresting in that perceptions of which social group is vulnerable toclimate induced disasters may differ among women and men. This ispartly a reflection of lived experiences among the women as well asthe gender roles where women with husbands are regarded as beingbetter off/well off as they are provided for by their husbands.

4
In KurfaChelle woreda, male respondents identified small children,HIV and AIDS infected people, poor households, the disabled, theelderly and female headed households (in this order) as the mostvulnerable in the face of climate change. Similarly for the women,small children, poor households, the elderly, the disabled, HIV andAIDS affected people, female households and girls (in this order) areregarded as the most vulnerable sections of society in the face ofclimate change disasters.
Respondents were further asked to list the factors that contribute tothe vulnerability of the social groups that they have identified assuch in the previous question.
TABLE 11:SITUATIONS THAT MORE EXPOSE THE MOST VULNERABLE SOCIAL GROUPS TO ENVIRONMENTAL DISASTERS(% RESPONDENTS BY RESPONSE)Q. 23 What are the situationsthat more expose the mostvulnerable social groups toenvironmental disasters in thearea?6
West Harerege Borena
ResponsesMale
FemaleMale
Female
Insufficient resources77.0
66.779.7
83.3
Insufficient Labor60.7
43.374.6
55.0
Lack of Information23.0
18.327.1
21.7
Poor Working Experience18.0
18.313.6
13.3
Bad Luck16.4
8.3 8.5 3.3
Others 1.6 .0 .0 20.0
In Miyo woreda, the men respondents identified insufficient resourcesand insufficient labor (80% and 75% respectively) as the most6 Multiple answer; See Footnote 3 above

4
important factors that contribute to the vulnerability of these socialgroups. Similarly, for the women respondents these two factors,insufficient resources and labor (83% and 55%), are factors thatincrease vulnerability to climate related disasters.
In KurfaChelle woreda, the men respondents identified insufficientresources and insufficient labor (77% and 61% respectively) as themost important factors that contribute to the vulnerability of thesesocial groups. Similarly, for the women respondents these two factors,insufficient resources and labor (67% and 43%), are factors thatincrease vulnerability to climate related disasters.
Just as there are vulnerable social groups, there are social groupsthat are resilient to the impacts of climate related disasters. Beyondidentifying resilient social groups, it is interesting to see thefactors that contribute to such resilience. This is important fordesigning interventions. Community members were asked to identify someof the factors that contribute to building the resilience of somemembers of the community.
TABLE 12FACTORS THAT CONTRIBUTE TO BUILDING THE RESILIENCE OFTHE COMMUNITY(% RESPONDENTS BY RESPONSE)
Q. 25 What are the main reasons thatcontribute to the resilience of some of thecommunity members? 7
West Harerege Borena
Responses Male Female MaleFemale
Maximizing income by engaging in Additionalincome generating activities
44.3 36.7 83.1 96.7
developed saving practice 41.0 35.0 47.5 16.7equal participation of man and women indecision making activities
19.7 33.3 35.6 96.7
an interest for change and accepting newideas
4.9 6.7 10.2 1.7
7 Multiple answer; See Footnote 3 above

4
Q. 25 What are the main reasons thatcontribute to the resilience of some of thecommunity members?
West Harerege Borena
availability of literate members in thefamily and forcing the family for change
8.2 5.0 3.4 1.7
Minimizing cost by quitting chate, alcohol,etc….
9.8 15.0 20.3 13.3
working hard 34.4 60.0 22.0 11.7luck 8.2 .0 .0 .0Others 1.6 3.3 .0 6.7
In Miyo woreda, the men identified income diversification, savingpractice and joint decision making with the spouses as importantfactors that contribute to build the resilience to climate relateddisasters. The women have prioritized on joint decision making anddiversification of income (both at 97%) as the main factors that buildthe resilience of communities. In focus groups, discussants statedthat it is those members of the community that have cash reserveeither because they have relatives aboard or they have sold theircattle that are more resilient. Saving culture is not recognized asimportant factor among women with only 17% of the women attributingresilience to saving culture. It is important to note here differencesin terms of priorities along gender line. Women focus groupdiscussants also stated that it is families that do not haveaddictions like chat and alcohol that are better resilient. In theagro-pastoralist areas the women stated that growing fruits andvegetables and cash crops has helped to build the resilience of somemembers of the community.
In KurfaChelle woreda, the men identified income diversification,saving practice and working hard as important factors that contributeto build the resilience to climate related disasters. The women haveprioritized on hard work, income diversification, developing savingpractice and joint decision making among the spouses as the mainfactors that build the resilience of communities. It is interesting to
4
note here that for 60% of the women, hard work is a major factor whileit only 34% of the men that attributed resilience to hard work.
In focus groups, men and women discussants stated that it is thosemembers of the community that have large land holdings, families withfewer numbers of children, those with saving culture, those that havechat farms and families that raise livestock for commercial purposesthat have better resilience to cope with impacts of climate change.
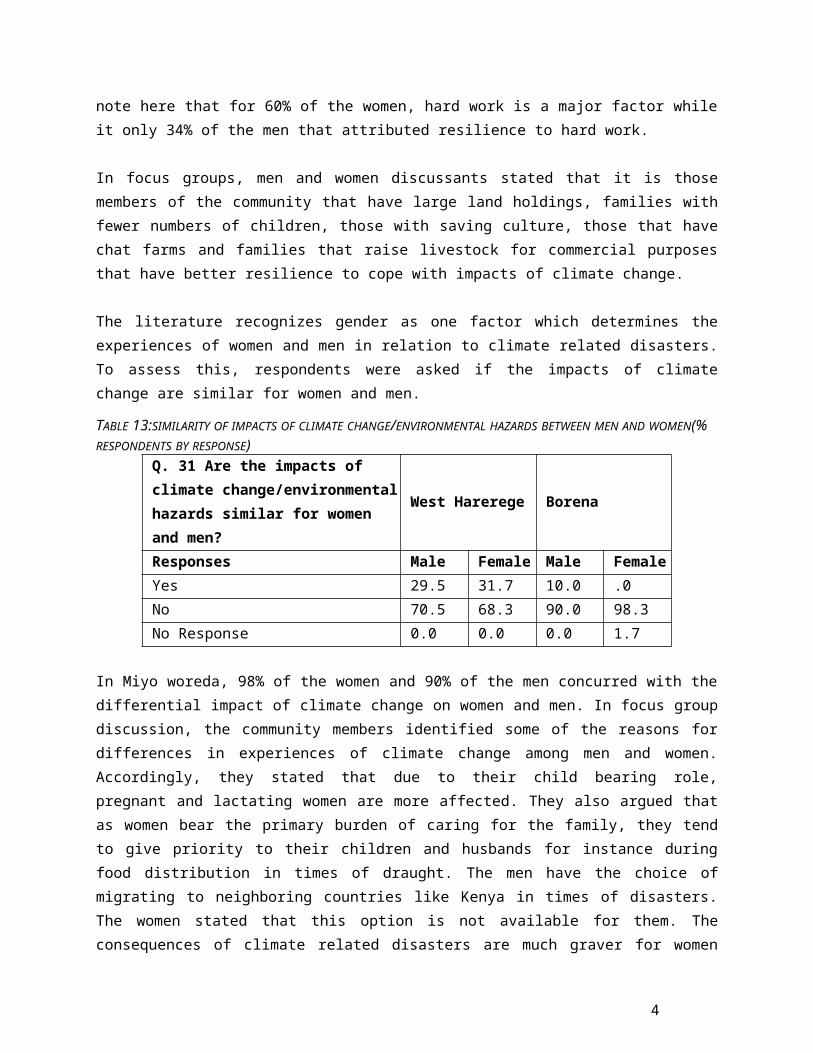
The literature recognizes gender as one factor which determines theexperiences of women and men in relation to climate related disasters.To assess this, respondents were asked if the impacts of climatechange are similar for women and men.
TABLE 13:SIMILARITY OF IMPACTS OF CLIMATE CHANGE/ENVIRONMENTAL HAZARDS BETWEEN MEN AND WOMEN(% RESPONDENTS BY RESPONSE)
Q. 31 Are the impacts of climate change/environmentalhazards similar for women and men?
West Harerege Borena
Responses Male Female Male FemaleYes 29.5 31.7 10.0 .0No 70.5 68.3 90.0 98.3No Response 0.0 0.0 0.0 1.7
In Miyo woreda, 98% of the women and 90% of the men concurred with thedifferential impact of climate change on women and men. In focus groupdiscussion, the community members identified some of the reasons fordifferences in experiences of climate change among men and women.Accordingly, they stated that due to their child bearing role,pregnant and lactating women are more affected. They also argued thatas women bear the primary burden of caring for the family, they tendto give priority to their children and husbands for instance duringfood distribution in times of draught. The men have the choice ofmigrating to neighboring countries like Kenya in times of disasters.The women stated that this option is not available for them. Theconsequences of climate related disasters are much graver for women

4
because it tends to increase their work burden according to focusgroup discussants.
CARE representatives in the area also noted that women are moreaffected by climate change disasters because of their reproductiverole. For instance, women are now forced to travel for about 4-6 hoursto get water. The increasing work burden leaves women with healthcomplications as well.
“W/ro Gena Ayele is a resident of Miyo woreda. She is a marriedwoman with children. When their particular locality was affectedby draught, the husband decided to leave the family and migrateto Kenya. This situation forced her to assume responsibility forthe entire household. Accordingly, activities that used to beunder the husband like looking after livestock fell on her. Thisis on top of her other reproductive burden which consisted oflooking after the kids and providing food for her children. Thefamily owned goats. In order to provide feed for the goats, W/roGena was forced to go to the forest and get tree branches and thelike from the bush. In one unfortunate instance, while she was inher daily routine of gathering tree branches, she fell of thebranch of a tree and broke her leg. From that time onwards shewas unable to look after the few goats the husband had left herbehind. As a result she lost all the goats. Due to the severityof the injury she was also unable to move around and provide forher children. She has become bedridden.”
In KurfaChelle woreda, about 68% of the women and 71% of the menconcurred with the differential impact of climate change on women andmen. It is interesting to note that about 30% of the respondent menand 32% of women think that the impact of climate change is similarfor both men and women. In focus group discussions, women and mendiscussants said that it is women that are affected most due tofactors like: the men migrate in times of crisis leaving women alongwith family responsibilities; she is the one who is expected to feedher children; in times of shortage, women tend to prioritize children

4
and husbands during food distribution. Overall, the consequences ofclimate related disasters are much graver for women because it tendsto increase their work burden. According to focus group discussants,consequences of the reproductive role of women such as pregnancy,lactation, looking after the sick, children and the elderly are citedas primary reasons for the severity of the disadvantages of women dueto climate change hazards.
CARE representatives in the area also noted that women are moreaffected by climate change disasters. They cited increasing workburden on women during disasters. In order to feed their family, womenare forced to look for alternative sources of income such ascollecting and selling fuel wood, charcoal making and becoming dailylaborers. Women’s health is also affected according to the keyinformants because they do not get enough to eat during food shortage.The problem is also attributed to their reproductive role. Forinstance, women are now forced to travel for about 4-6 hours to getwater. The increasing work burden leaves women with healthcomplications as well.
6.6 RESPONSES TO CLIMATE CHANGE AND INDIGENOUS COPING STRATEGIES Do poor women farmers and pastoralists in the selected study areashave and exercise agency in regards to climate change? The main focushere is to establish the capabilities and aspirations of the womenvis-à-vis climate change hazards in the study areas. Existing socio-cultural and economic status determine the level of capability thatcommunities have to respond to climate change. Similarly, theiraspirations are the product of their social and economic status.Gender, as one determinant factor of socio-cultural and economicstatus plays an important role in shaping people’s capabilities andaspirations when faced with climate change hazards. In light of this,it is important to examine where women are placed in relation to menvis-à-vis their knowledge, information, resources and power to dealwith climate change. Questions along this line were thus forwarded toboth adult women and men within the selected households in the studyareas.

4
Communities faced with climate change hazards engage in various typesof coping mechanisms. Respondents in the study areas were asked aboutthe most important coping strategies they adopt when faced withclimate induced hazards.
TABLE 14:LOCAL COPING STRATEGIES TO CLIMATE VARIABILITY/ CHANGE (% RESPONDENTS BY RESPONSE)Q. 24 What are the most important copingstrategies you adopt during emergency(hunger) situations? 8
West Harerege Borena
Responses Male Female Male FemaleFood rationing and consumption adjustments 29.5 8.3 61.7 43.3Collecting, selling or eating wild leaves,fruits, roots
1.6 20.0 10.0 10.0
Sell of livestock 49.2 38.3 43.3 95.0Engaging in daily labour 32.8 61.7 51.7 28.3Seek support from relatives and friends 3.3 23.3 21.7 11.7Food aid 63.9 71.7 38.3 71.7Seeking loan 34.4 40.0 31.7 28.3Migration 4.9 3.3 16.7 5.0
In Miyo woreda, for male respondents, the main types of copingstrategies when faced with climate induced disasters are foodrationing and consumption adjustments (62%), followed by engaging indaily labor (52%), seeking food aid (38%) and selling of livestock(43%). The men in focus groups also disclosed that they opt fordraught resistant varieties like goats and camel. For the women, sellof livestock tops the list with 95% of the women resorting to thatwhen faced with climate related disasters. Food aid (72%) and foodrationing as adjusting consumption (43%) are the other two main formsof coping mechanisms. One can observe here that there are differencesamong men and women in regards to their coping strategies. Men tendto resort to food rationing and engaging in daily labor. The lateraspect can well be due to the existence of surplus labor among men asunlike women they do not engage in both productive and reproductivefunction. The coping mechanisms of women in particular the sale of
8 Multiple answer; See Footnote 3 above

4
livestock tends to leave women to further poverty as it results inasset depletion.
Although community members engage in these types of coping strategies,in focus group discussions, they emphasized that they do not have theappropriate knowledge or the skills to withstand the impacts ofclimate change. One coping mechanism mentioned relates to opting toraise animals that are draught resistant. To this end, communitymembers have opted to raise goats. However, findings from the focusgroup discussions indicate that due to disease brought about by thedraught even goats are unable to survive these days. This, they saidhas led them to huge losses.
In KurfaChelle woreda, for the male respondents, the main types ofcoping strategies when faced with climate induced disasters areseeking food aid (64%), sell of livestock (49%) and seeking loan(34%). For the women, seeking food aid (72%), engaging in daily labor(62%), seeking loan (40%) and sell of livestock (38%) are the maintypes of coping strategies. In focus group discussions, the menhighlighted that seeking loans to repay latter after selling chat;reducing consumption, selling assets like livestock and migration arethe preferred coping strategies that communities resort to in theirareas. The women discussants also noted that they engage in collectingand selling of fire wood, selling their labor in particular in urbanareas and borrowing food items are the major types of copingstrategies.CARE representatives highlighted that farmers adopt different kinds offarming techniques like for example they engage in dry ploughingwhereby they plant their seeds on dry land so that they can make gooduse of the first drop of rains for germination. This however isproving to be problematic because the amount of rain is insufficientfor germination. Another coping mechanism is a shift to chatproduction as it is said to be drought resistant. Activities such ascharcoal production, selling of fire wood, planting of sweet potatoesand even begging are seen as coping mechanisms of the communityaccording to the officials at the woreda rural development bureau.

4
One can observe here that there are differences among men and women inregards to their coping strategies. Men tend to resort to seekingfood aid. While women also seek food aid, they also tend to engage indaily labor. Twice as much number of respondent women said they wouldengage in selling their labor than the men. This is due in part to theresponsibility of providing food through whatever means possible.
The capability and aspiration to respond to climate change depends onone’s knowledge and information about the very phenomenon of climatechange. In light of this, women and men members of households in thestudy areas were asked is there is sufficient awareness about variousenvironmental hazards and risks in their respective communities.
TABLE 15AVAILABILITY OF AWARENESS ABOUT VARIOUS ENVIRONMENTALHAZARDS AND RISKS (% RESPONDENTS BY RESPONSE)
Q. 26 Do you think thatthere is sufficientawareness about variousenvironmental hazards andrisks in your community?
West Harerege Borena
Male Female Male Female
Yes 50.8 45.0 26.7 55.0No 42.6 31.7 66.7 18.3D/K 6.6 23.3 6.7 26.7
In Miyo woreda, about 55% of the respondent women reported that thereis sufficient awareness about environmental hazards and risks in theircommunities. The percentage is quite low among men with only 26.6% ofthe men confirming that there is sufficient awareness aboutenvironmental hazards. The majority of men stated that members of thecommunity are not aware of environmental hazards.
In KurfaChelle woreda, about 45% of the respondent women reported thatthere is sufficient awareness about environmental hazards and risks intheir communities. The percentage is higher among men with 51% of themen confirming that there is sufficient awareness about environmentalhazards. About 32% of the women said there is no sufficient awareness

4
and 23% said they don’t know. Similarly, 43% of the men said there isno sufficient awareness about environmental hazards.
To assess the gender differential, respondents were further asked ifthey think that women have adequate access to information as menregarding climate change.
TABLE 16:WOMEN HAVING EQUAL ACCESS TO ADEQUATE INFORMATION AS MEN REGARDING CLIMATE CHANGE/ENVIRONMENTAL HAZARDS(% RESPONDENTS BY RESPONSE)
Q. 33 Do women have equalaccess to adequate information as men regarding climate change/environmental hazards?
West Harerege Borena
Responses Male Female Male FemaleYes 41.0 23.3 15.0 63.3No 57.4 73.3 73.3 31.7D/K 1.6 .0 5.0 1.7No Response .0 3.3 6.7 3.3
In Miyo woreda, about 63% of the women stated that women have adequateaccess to information as much as men while about 73% of the men statedthat women do not have as much information as men regarding climatechange. In the face of it, the response by the women is interesting inthat it is contrary to conventional expectation which assumes thatwomen due to various barriers to access information have limitedinformation in regards to environmental hazards. But the views of menregarding women’s access to information regarding climate changeconfirms to the conventional expectation.
The figures in the table above show that there is some level ofawareness among the community about climate change related risks andhazards. However, focus group discussion revealed that this awarenessmay not necessarily be adequate. According to men focus groupdiscussants, there is a belief among the community that phenomenonlike land degradation, draught are not necessarily related to climate
4
change. Members of the community, according to focus groupdiscussants, relate this phenomenon with God. They said theavailability or otherwise of rain is dependent upon the will of God.Due to this belief, the community members do not see a connectionbetween environmental conservation activities/measures and the stateof the environment.
In KurfaChelle woreda, about 73% of the women stated that women do nothave adequate access to information as much as men and similarly about57% of the men stated that women do not have as much information asmen regarding climate change. In the face of it, the responses in bothcategories fit conventional expectation which assumes that women dueto various barriers to access information have limited information inregards to environmental hazards.
The figures above show that there is some level of awareness among thecommunity about climate change related risks and hazards. The logicalquestion is to assess whether community members engage inenvironmental conservation?
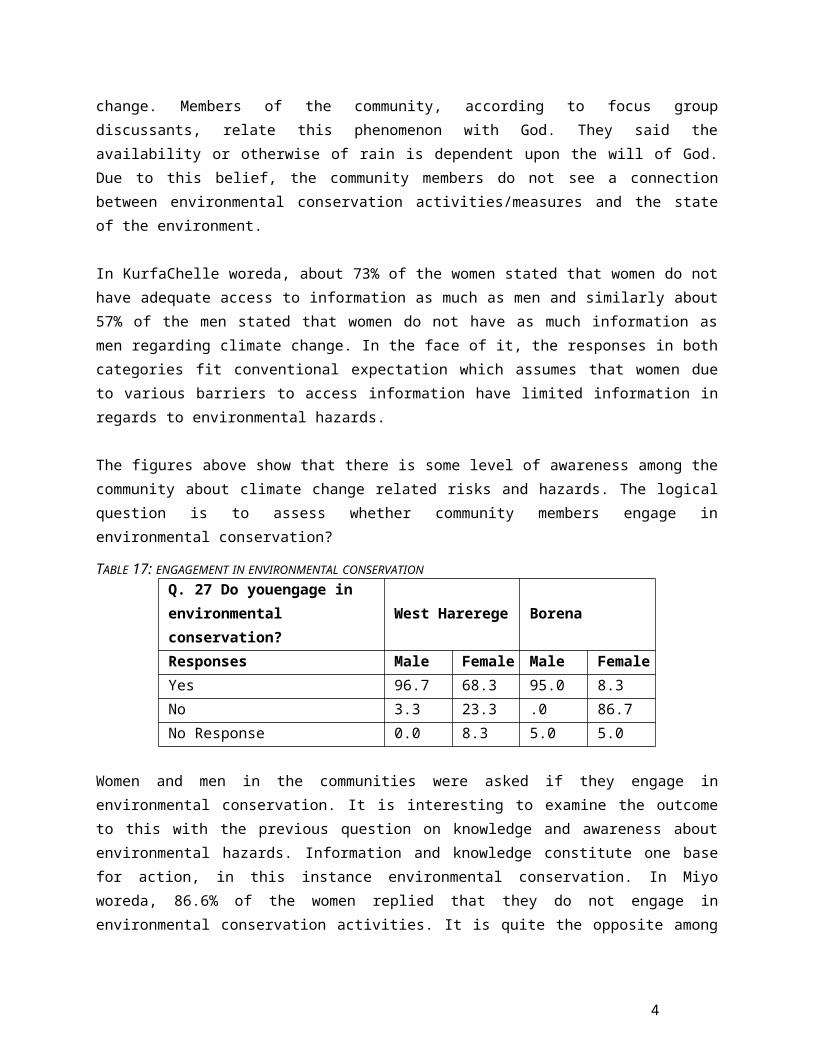
TABLE 17: ENGAGEMENT IN ENVIRONMENTAL CONSERVATIONQ. 27 Do youengage in environmental conservation?
West Harerege Borena
Responses Male Female Male FemaleYes 96.7 68.3 95.0 8.3No 3.3 23.3 .0 86.7No Response 0.0 8.3 5.0 5.0
Women and men in the communities were asked if they engage inenvironmental conservation. It is interesting to examine the outcometo this with the previous question on knowledge and awareness aboutenvironmental hazards. Information and knowledge constitute one basefor action, in this instance environmental conservation. In Miyoworeda, 86.6% of the women replied that they do not engage inenvironmental conservation activities. It is quite the opposite among

4
the men respondents where over 95% stated that they engage inenvironmental conservation.
One can observe that despite the relatively higher level of awarenessreported among women regarding environmental hazards and further theclaim among the majority to have adequate access to informationregarding climate change, there seems to be little (or no) engagementtowards environmental conservation by women. Perhaps this may as wellbe related with the community belief that an environmental phenomenonlike rain is dependent upon the will of God.
In KurfaChelle woreda, 97% of the men replied that they do engage inenvironmental conservation activities. Among the women too, 68%,stated that they engage in environmental conservation. One can observethat the majority engage in environmental conservation.
6.7 IMPACTS OF GENDER RELATIONS ON RESPONSES TO CLIMATE CHANGE The findings above have also shown that there is recognition amongwomen and men that women are more vulnerable to impacts of climatechange. Further, though there are variations among the two woredas,their coping strategies are shown to be prone to asset depletion andhence lead to further poverty. Similarly, recognized resiliencebuilding mechanisms such as saving culture are not in the toppriorities of women. In light of this overall picture, it is importantto examine the factors that give rise to these differences among womenand men in terms of experience, coping strategies, resilience buildingand generally adaptive capacities. Literature shows that resources,decision making power, roles (division of labor), technical support,availability of services, information/knowledge, skills are some ofthe factors that determine adaptive capacity. How do these factorsplay out in the communities in the study areas? Are these factorsaffected by gender?
In order to assess this and generally establish the position of womenrelative to men in respect of roles, resources and decision making,various questions were directed to community members that took part in

4
this study. Respondent women and men were asked about their respectiveroles in the household, their resources (access and control) anddecision making within the household. Further, respondents were askedabout the availability of technical support and various packages ofservices to deal with the impact of climate change. Existing formaland informal structures such as government policies and programs aswell as the influence of culture and similar factors were alsoexamined.
6.7.1 GENDER DIVISION OF LABOR/ROLES Gender division of labor is important determinant factor with regardto experiences of climate change and adaptive capacity. What we dodetermines to a large part on how we interact with changes in theclimate system and how (with what) we can respond to it. In light ofthis, respondents were asked to list out the major activities thatthey engage in on a day to day basis.
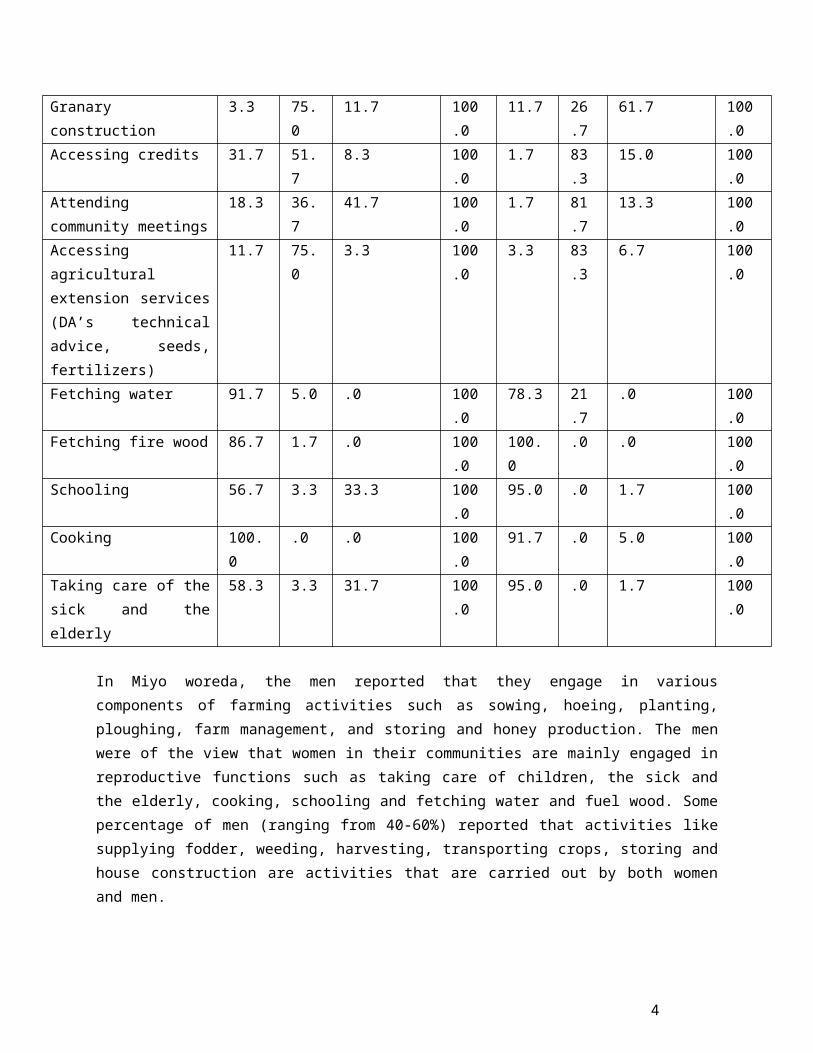
TABLE 18 DIVISIONOF LABOR AMONG FAMILY MEMBERS IN THE STUDY WOREDAS (% OF MALERESPONDENTS BY ACTIVITIES)
Male RespondentsQ.8 Which members of the family are engaged in the
following activities?9
West Harerege Borena
Activities Women MenBothMen &Women
Total
Women MenBothMen &Women
Total
Herding 14.8 36.1
26.2 100.0
1.7 53.3
6.7 100.0
Supplying fodder 16.4 44.3
31.1 100.0
6.7 20.0
56.7 100.0
Sowing/planting 0.0 86.9
13.1 100.0
1.7 90.0
8.3 100.0
Hoeing 3.3 96.7
.0 100.0
.0 95.0
3.3 100.0
9 See Annex for the complete table; there are some variable columns excluded due to their insignificance (i.e; the variables Male & female children value on the table is insignificant which shows less than 10%.Hence, the total percentile shows a deficit in cumulative of proportions.

4
Ploughing 3.3 90.2
6.6 100.0
.0 85.0
11.7 100.0
Weeding .0 45.9
54.1 100.0
.0 40.0
46.7 100.0
Harvesting 4.9 70.5
24.6 100.0
.0 35.0
46.7 100.0
Transporting the crop 14.8 19.7
63.9 100.0
3.3 21.7
60.0 100.0
Storing 6.6 47.5
42.6 100.0
1.7 55.0
43.3 100.0
Honey production 6.6 29.5
.0 100.0
3.3 55.0
1.7 100.0
Farm management (Soiland water conservation,
1.6 52.5
42.6 100.0
1.7 70.0
15.0 100.0
House construction 3.3 82.0
14.8 100.0
.0 30.0
55.0 100.0
Granary construction 1.6 95.1
3.3 100.0
.0 50.0
48.3 100.0
Accessing credits 23.0 63.9
8.2 100.0
3.3 73.3
20.0 100.0
Attending communitymeetings
4.9 36.1
59.0 100.0
1.7 90.0
8.3 100.0
Accessing agriculturalextension services(DA’s technical advice,seeds, fertilizers)
1.6 96.7
.0 100.0
1.7 88.3
10.0 100.0
Fetching water 95.1 3.3
.0 100.0
18.3 80.0
.0 100.0
Fetching fire wood 98.4 .0 .0 100.0
83.3 .0 .0 100.0
Schooling 62.3 11.5
16.4 100.0
81.7 .0 .0 100.0
Cooking 96.7 3.3
.0 100.0
83.3 .0 5.0 100.0

4
Taking care of the sickand the elderly
41.0 8.2
26.2 100.0
83.3 .0 .0 100.0
TABLE 19DIVISIONOF LABOR AMONG FAMILY MEMBERS IN THE STUDY WOREDAS (% OF FEMALERESPONDENTS BY ACTIVITIES)
Female RespondentsQ.8 Which members of the family are engaged in the following
activities?10
West Harerege Borena
Activities Women MenBoth Men &Women
Total
Women MenBoth Men &Women
Total
Herding 20.0 20.0
30.0 100.0
5.0 63.3
3.3 100.0
Supplying fodder 23.3 33.3
26.7 100.0
13.3 58.3
26.7 100.0
Sowing/planting 3.3 90.0
.0 100.0
1.7 95.0
.0 100.0
Hoeing 3.3 96.7
.0 100.0
1.7 95.0
.0 100.0
Ploughing 3.3 96.7
.0 100.0
.0 88.3
3.3 100.0
Weeding 11.7 55.0
33.3 100.0
8.3 11.7
80.0 100.0
Harvesting .0 98.3
1.7 100.0
3.3 33.3
60.0 100.0
Transporting thecrop
28.3 55.0
15.0 100.0
6.7 60.0
28.3 100.0
Storing 13.3 78.3
6.7 100.0
3.3 75.0
13.3 100.0
Honey production 3.3 15.0
3.3 100.0
1.7 18.3
3.3 100.0
Farm management(Soil and waterconservation,
3.3 85.0
5.0 100.0
10.0 43.3
40.0 100.0
House construction 3.3 83.3
11.7 100.0
21.7 25.0
45.0 100.0
10 See Footnote 9 also
4
Granaryconstruction
3.3 75.0
11.7 100.0
11.7 26.7
61.7 100.0
Accessing credits 31.7 51.7
8.3 100.0
1.7 83.3
15.0 100.0
Attendingcommunity meetings
18.3 36.7
41.7 100.0
1.7 81.7
13.3 100.0
Accessingagriculturalextension services(DA’s technicaladvice, seeds,fertilizers)
11.7 75.0
3.3 100.0
3.3 83.3
6.7 100.0
Fetching water 91.7 5.0 .0 100.0
78.3 21.7
.0 100.0
Fetching fire wood 86.7 1.7 .0 100.0
100.0
.0 .0 100.0
Schooling 56.7 3.3 33.3 100.0
95.0 .0 1.7 100.0
Cooking 100.0
.0 .0 100.0
91.7 .0 5.0 100.0
Taking care of thesick and theelderly
58.3 3.3 31.7 100.0
95.0 .0 1.7 100.0
In Miyo woreda, the men reported that they engage in variouscomponents of farming activities such as sowing, hoeing, planting,ploughing, farm management, and storing and honey production. The menwere of the view that women in their communities are mainly engaged inreproductive functions such as taking care of children, the sick andthe elderly, cooking, schooling and fetching water and fuel wood. Somepercentage of men (ranging from 40-60%) reported that activities likesupplying fodder, weeding, harvesting, transporting crops, storing andhouse construction are activities that are carried out by both womenand men.
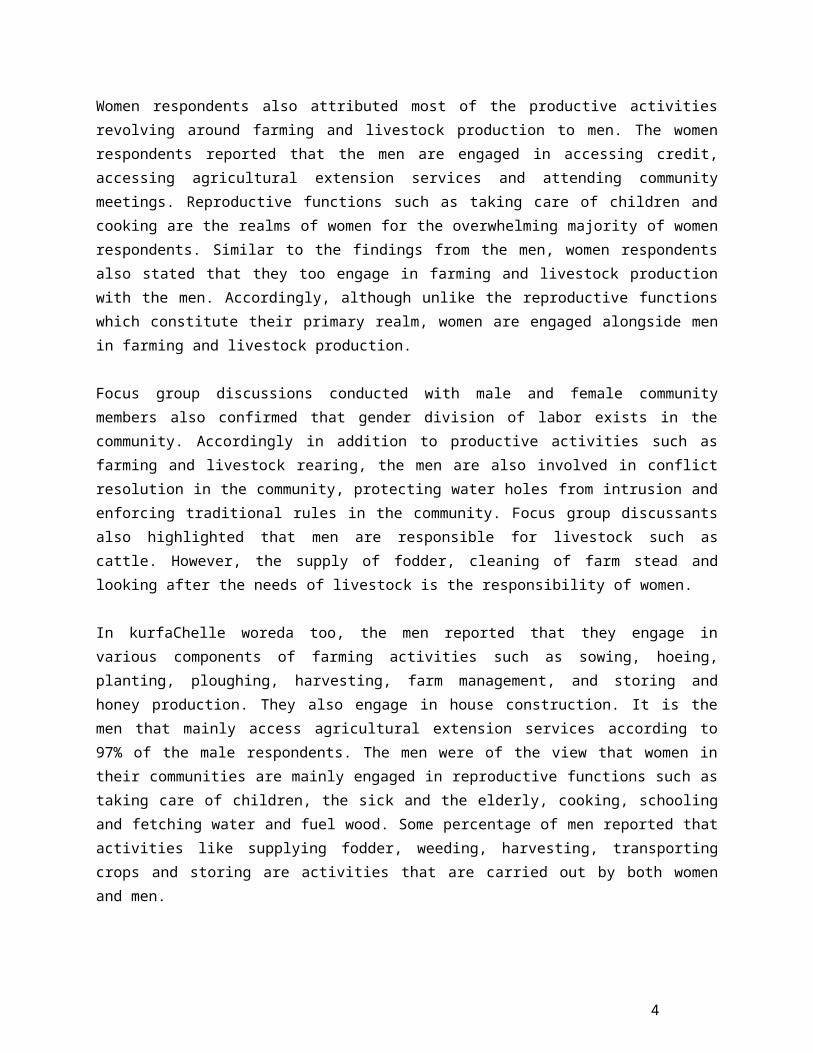
4
Women respondents also attributed most of the productive activitiesrevolving around farming and livestock production to men. The womenrespondents reported that the men are engaged in accessing credit,accessing agricultural extension services and attending communitymeetings. Reproductive functions such as taking care of children andcooking are the realms of women for the overwhelming majority of womenrespondents. Similar to the findings from the men, women respondentsalso stated that they too engage in farming and livestock productionwith the men. Accordingly, although unlike the reproductive functionswhich constitute their primary realm, women are engaged alongside menin farming and livestock production.
Focus group discussions conducted with male and female communitymembers also confirmed that gender division of labor exists in thecommunity. Accordingly in addition to productive activities such asfarming and livestock rearing, the men are also involved in conflictresolution in the community, protecting water holes from intrusion andenforcing traditional rules in the community. Focus group discussantsalso highlighted that men are responsible for livestock such ascattle. However, the supply of fodder, cleaning of farm stead andlooking after the needs of livestock is the responsibility of women.
In kurfaChelle woreda too, the men reported that they engage invarious components of farming activities such as sowing, hoeing,planting, ploughing, harvesting, farm management, and storing andhoney production. They also engage in house construction. It is themen that mainly access agricultural extension services according to97% of the male respondents. The men were of the view that women intheir communities are mainly engaged in reproductive functions such astaking care of children, the sick and the elderly, cooking, schoolingand fetching water and fuel wood. Some percentage of men reported thatactivities like supplying fodder, weeding, harvesting, transportingcrops and storing are activities that are carried out by both womenand men.

4
Women respondents also attributed most of the productive activitiesrevolving around farming and livestock production to men. Similar tothe findings from the men, women respondents also stated that they tooengage in farming and livestock production with the men. Accordingly,although unlike the reproductive functions which constitute theirprimary realm, women are engaged alongside men in farming andlivestock production.
Focus group discussions conducted with male and female communitymembers also confirmed that gender division of labor exists in thecommunity. Women in the communities in addition to their reproductiverole, also engage in small scale trading such as selling milk and lowquality chat.
The findings from the two sets of respondents show that the genderdivision of labor is skewed in favor of men. While women carry outboth reproductive and productive functions, the men are limited intheir farming and livestock production. This would have its ownimplications on time poverty which in turn adversely affects women’shealth and adaptive capacity. It is also interesting to note here thatwomen do not seem to have much opportunity in terms of accessingservices like credit, extension and the like as these are the realmsof men. Similarly, women appear to have fewer roles in public life asengagements in public meetings are again reserved for men.
This finding is interesting because it tells us a number of thingsvis-a vis the impacts of climate change and adaptive capacity. Asfindings earlier indicate, women feel the impacts of climate changemore in relation to its health impacts compared to men where theeffect is felt more on farming and livestock production. Similarly,there is less room and capacity for adaptation among women becausethey seem to have lees access to services such as credit, extensionand the like. Limited public engagement has also negative impact.
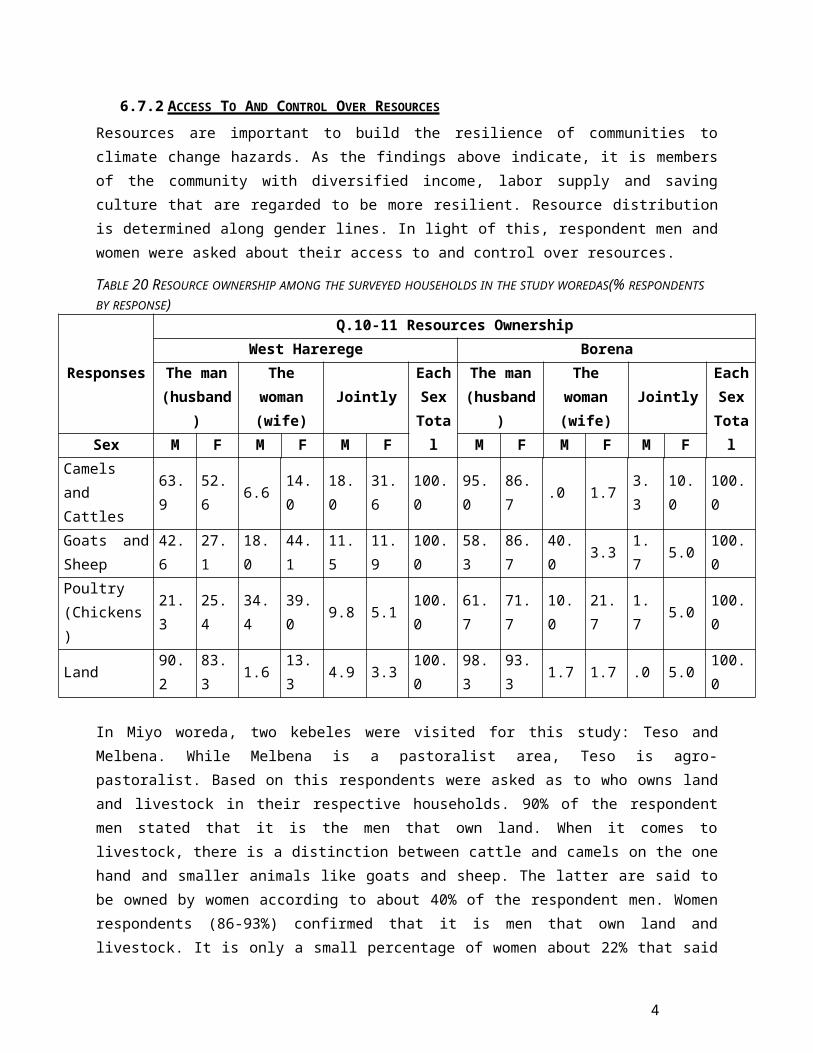
4
6.7.2 ACCESS TO AND CONTROL OVER RESOURCES Resources are important to build the resilience of communities toclimate change hazards. As the findings above indicate, it is membersof the community with diversified income, labor supply and savingculture that are regarded to be more resilient. Resource distributionis determined along gender lines. In light of this, respondent men andwomen were asked about their access to and control over resources.
TABLE 20 RESOURCE OWNERSHIP AMONG THE SURVEYED HOUSEHOLDS IN THE STUDY WOREDAS(% RESPONDENTS BY RESPONSE)
Responses
Q.10-11 Resources OwnershipWest Harerege Borena
The man(husband
)
Thewoman(wife)
JointlyEachSexTotal
The man(husband
)
Thewoman(wife)
JointlyEachSexTotalSex M F M F M F M F M F M F
CamelsandCattles
63.9
52.6
6.614.0
18.0
31.6
100.0
95.0
86.7
.0 1.73.3
10.0
100.0
Goats andSheep
42.6
27.1
18.0
44.1
11.5
11.9
100.0
58.3
86.7
40.0
3.31.7
5.0100.0
Poultry(Chickens)
21.3
25.4
34.4
39.0
9.8 5.1100.0
61.7
71.7
10.0
21.7
1.7
5.0100.0
Land90.2
83.3
1.613.3
4.9 3.3100.0
98.3
93.3
1.7 1.7 .0 5.0100.0
In Miyo woreda, two kebeles were visited for this study: Teso andMelbena. While Melbena is a pastoralist area, Teso is agro-pastoralist. Based on this respondents were asked as to who owns landand livestock in their respective households. 90% of the respondentmen stated that it is the men that own land. When it comes tolivestock, there is a distinction between cattle and camels on the onehand and smaller animals like goats and sheep. The latter are said tobe owned by women according to about 40% of the respondent men. Womenrespondents (86-93%) confirmed that it is men that own land andlivestock. It is only a small percentage of women about 22% that said

4
women own smaller animals like poultry. Focus group discussion resultsalso confirm the same view. Large animals like cattle and camels areowned by men while women own smaller animals like sheep, goats andpoultry.
In kurfaChelle woreda, given that agriculture and livestock productionconstitute the major sources of livelihood, respondents were asked asto who owns land and livestock in their respective households. 90% ofthe men stated that it is the men that own land. When it comes tolivestock, there is a distinction between cattle and camels on the onehand and smaller animals like goats and sheep. The latter are said tobe owned by women according to about 43% of the respondent men. Womenrespondents (83% and 53% respectively) confirmed that it is men thatown land and livestock. It is only 44% of the women that said womenown smaller animals like goats and sheep. 39% of the women said womenown poultry. Focus group discussions as well as key informantinterviews with government officials also confirm the same view. Largeanimals like cattle and camels are owned by men while women ownsmaller animals like sheep, goats and poultry.
To assess access to utilize resources, respondents were asked as towho decides on the sale of livestock as well as crops and sale oflivestock products.
TABLE 21 DECISION MAKING AUTHORITY AMONG THE SURVEYED HOUSEHOLDS IN THE STUDY AREAS (% RESPONDENTS BY RESPONSE)
Responses
Q.12-13 Power In Decision Making on ResourcesWest Harerege Borena
The man(husband
)
Thewoman(wife)
Jointly
EachSexTotal
The man(husband
)
Thewoman(wife)
Jointly
EachSexTotal
Sex M F M F M F M F M F M Fsale oflivestock
57.4
40.7
9.813.6
21.3
44.1
100.0
.068.3
95.0
.0 5.031.7
100.0

4
Responses
Q.12-13 Power In Decision Making on Resourcessale oflivestockproducts
1.611.7
83.6
68.3
3.318.3
100.0
5.0 1.7 3.398.3
91.7
.0100.0
cropproducts
34.4
18.6
31.1
22.0
34.4
57.6
100.0
53.3
36.7
3.3 5.043.3
58.3
100.0
In Miyo woreda, 95% of women reported that it is women who decide onthe sale of livestock products while the sale of livestock itself isthe reserve of men for 53% of the respondent men. Female respondentsagree with this with 98% of them stating that women can decide on thesale of livestock products while 53% of the women said men solelydecide on the sale of the livestock itself. The sale of crops is ajoint decision for the majority of both men and women.
In focus group discussions conducted with men, they raised the pointthat they engage in consultations with women (their wives) before theyembark of selling of livestock. If however, they cannot reachagreement, the final decision rests with the man. Asked as to why thisis the case, the men stated that in their communities women are seenas incapables (as children) and hence there is a belief that women arenot able to make rational decisions on such matters. They have addedthat as women are weak by nature, such big responsibilities cannot begiven to them. Another important reason for the exclusion of women ondecision making is that as the men have primary responsibility to lookafter these types of livestock (at times going to the extent ofsacrificing their lives to protect the same), it is only natural thatthe men hold decision making power.
In kurfaChelle woreda, 84% of the men reported that it is women whodecide on the sale of livestock products while the sale of livestockitself is the reserve of men for 57% of the respondent men. Femalerespondents agree with this with 68% of them stating that women candecide on the sale of livestock products while 41% of the women saidmen solely decide on the sale of the livestock itself. The sale ofcrops is for about 34% of men and 57% of the women a joint decision.

4
In focus group discussions conducted with men and women, it isrevealed that due to increasing levels of crisis, a tendency toconsult the wives before making major decisions is developing. Ifhowever, they cannot reach agreement, the final decision rests withthe man.
The findings clearly indicate that women in the study areas do nothave ownership over the major productive resources: land andlivestock. This shows that there is serious power imbalance betweenmen and women in the society. However, their access to utilize theseresources appears to be much better although even such power islimited when it comes to valuable resources. To the extent thatresources determine adaptive capacity, women that lack the necessaryresources appear to be at a disadvantage.
6.7.3 DECISION MAKING POWER Another determinant of adaptive capacity is decision making power atthe household level. This is directly related to the ability toexercise choice. It is important in relation to adaptive capacitybecause even where women have the knowledge, skills and resource totake adaptive measures, household gender relations may serve asobstacles to exercise decisions. Respondents were asked on who hasdecision making power on a number of points ranging from contraceptiveutilization, number of children to household expenditures.
According to over 90% of the men in Miyo woreda, reproductive healthrelated decisions are jointly made. Similarly for the women,contraceptive utilization and number of children are joint decisions100% and 97% respectively. Household expenditures like clothing andchildren’s education are for about 50% of the men the decisions of menwhile the remaining 50% attribute it to joint decision. Food relatedexpenditures are decided by women for over 55% of the men respondents.For the majority of the women, over 70%, on the other hand allhousehold expenditures are jointly made with the husband. According toresults of the focus group discussions, even with regard to householdexpenditure, if the amount of money is high, it is the men alone that

4
can decide on such matters. This, according to the discussants isbecause it is the men who can have large amounts of money in theirhands.
In KurfaChelle woreda, according to over 61% of the men, reproductivehealth related decisions are jointly made. Similarly for the women,contraceptive utilization is a joint decision for 62% of them. It isimportant to note here that close to 28% of the women said it is themen that decide on contraceptive utilization. The figure is higher formen with some 36% of the saying that they decide on contraceptiveutilization. On number of children as well, 53% of the men said theydecide on their own and 40% of the women confirmed the same.
Household expenditures like clothing and children’s education are forabout 43% of the men the decisions of men while some 39% attribute itto joint decision. Food related expenditures are decided by women forover 44% of the men respondents. For the majority of the women, over55%, on the other hand household expenditures like food are jointlymade with the husband. Similarly, over 71% of the women stated thatexpenditures like clothing and health are made jointly. According toresults of the focus group discussions, even with regard to householdexpenditure, the final say appears to be that of the husbands’. This,according to the discussants is because it is the men who can havelarge amounts of money in their hands.
Decision making extends beyond the household. In light of thisinquires were made as to the participation/activity of women incommunity structures like kebeles, women’s associations and customaryassociations.
TABLE 22 WOMEN’S PARTICIPATION IN COMMUNITY STRUCTURES (% RESPONDENTS BY RESPONSE)Q. 15 Do women in yourcommunity take part orparticipate in communitystructures? 11
WestHarerege
Borena
MaleFemale Male
Female

4
Q. 15 Do women in yourcommunity take part orparticipate in communitystructures?
WestHarerege
Borena
Within kebel 72.1 56.7 78.3 51.7Women’s associations ofdifferent forms
49.2 70.0 98.3 80.0
In customary institutions 14.8 73.3 26.7 .0Others 1.6 1.7 .0 .0
Regarding decision making positions in community structures, inkurfaChelle woreda, both men and women respondents reported that womendo take part in community structures like women’s association andkebels. Both the men and the women reported that women do not takepart in customary institutions. Regarding decision making positions incommunity structures, over 70 of the women and 85% of the men statedthat women do not have decision making power in such structures. InMiyo woreda, the men stated that women do not have decision makingpower in such structures and similarly the majority of women confirmedthe same view.
6.8 INFLUENCE OF FORMAL AND INFORMAL STRUCTURES Formal structures like government policies, programs and servicesdepending on their content may either positively influence orconstrain women’s potential to build adaptive capacity. Consideringthis, the respondents were asked questions focusing on theimplications of structures like inheritance system, access totechnical support and access to training as well as materials.Similarly, the influence of informal systems like religion and customwere examined.Inheritance systems determine resource distribution in society. InMiyo woreda, according to over 96% of the respondent men, women do nothave equal rights to inherit property when they parents are deceased.Over 98% of the women respondents confirmed that unlike men, women arenot entitled to inherit property. The existing system is thusdiscriminatory towards women. This in effect denies women of theirright towards resource ownership. In KurfaChelle, according to over11See Footnote 3 above

4
82% of the respondent men, women do not have equal rights to inheritproperty when they parents are deceased. Over 93% of the womenrespondents confirmed that unlike men, women are not entitled toinherit property. The existing system denies women of their righttowards resource ownership.
Adaptive capacity can be improved through technical assistance such astrainings and the provision of necessary package of services likeextension, improved seeds and the like. These services are provided byboth government and non-governmental organizations. Respondents wereasked if such services are accessible to them in their respectiveareas.
TABLE 23:GETTING MATERIAL AND TECHNICAL ASSISTANCE TO COPE WITH THE IMPACTS OF CLIMATE CHANGE (%RESPONDENTS BY RESPONSE)
Q. 28 Do you get support(technical, material) to helpyou cope with environmentalhazards?
WestHarerege
Borena
Responses MaleFemale
Male Female
Yes 75.4 81.6 50.0 30.0No 24.6 15.0 36.7 68.3No Response 0.0 3.4 13.3 1.7
In Miyo woreda, about 50% of the male respondents reported that theydo get material and technical assistance to cope with the impacts ofclimate change. It is however only 30% that replied in theaffirmative. The majority of women do not get such support. InKurfaChelle woreda, about 75% of the male respondents reported thatthey do get material and technical assistance to cope with the impactsof climate change. Similarly, about 82% of the women replied in theaffirmative. It appears that the majority of women do get suchsupport.

4
In order to ascertain the gender differential in accessing technicalassistance and material support, respondents were specifically askedif the women in their communities receive such services.
TABLE 24: WOMEN GETTING MATERIAL AND TECHNICAL SUPPORT TO WITHSTAND THE IMPACTS OF CLIMATE CHANGE (% RESPONDENTS BY RESPONSE)Q. 34 Do women get technical support suchas training as well as materials likeimproved seed and fertilizers the impactof climate change?
WestHarerege
Borena
Responses Male Female MaleFemale
Yes 21.3 50.0 20.0 .0No 78.7 48.3 80.0 98.3No Response .0 1.7 .0 1.7In Miyo woreda, about 80% of the men were of the view that women donot get any such support. Over 98% of the women stated that women donot get technical support such as training as well as materials likeimproved seed and fertilizers to withstand the impact of climatechange. In KurfaaChele, about 79% of the men were of the view thatwomen do not get any such support. About 50% of the women stated thatwomen do not get technical support such as training as well asmaterials like improved seed and fertilizers to withstand the impactof climate change.
6.9 RECOMMENDED MEASURES The respondents in the two woredas were asked as to what needs to bedone to help poor women farmers adapt to climate change?
TABLE 25: SUGGESTED INTERVENTIONS TO HELP WOMEN AND YOUNGSTERS ADAPT TO CLIMATE CHANGE (% RESPONDENTS BY RESPONSE)

4
Q. 35 In your opinion, what can be done to helppoor women farmers and youngsters to adapt toclimate change?12
WestHarerege
Borena
Options (Responses)Male
Female
Male
Female
Improving access to information regardingclimate change
27.9
38.325.0
11.7
Improving access to education, technicalsupport and capacity building
24.6
26.761.7
38.3
Improving access to, and control overproductive resources such as land and livestockfor women
27.9
21.746.7
.0
Access to new/adaptive technologies in regardto crop and livestock (eg. varieties,fertilizers)
49.2
50.093.3
96.7
Skills training and non-agriculturallivelihood sources
57.4
78.343.3
68.3
Others (please specify)14.8
.0 3.3 23.3
In Miyo woreda, for about 93% of the men access to new and adaptivetechnologies with regard to for instance crop and livestock varieties,fertilizers and the like would help improve the adaptive capacity ofwomen. The men, 62%, also emphasized the need for improving access toeducation, technical support and capacity building. About 48% of therespondent men also stated that it is imperative to improve women’saccess to and control over productive resources such as land andlivestock. Skills training and diversification towards non-agricultural livelihood sources are also important to improve women’sadaptive capacity according to 43% of the respondent men.
In KurfaChelleworeda, about 57% of the men, skills training anddiversification towards non-agricultural livelihood sources are
12Percentiles are calculated to show only respondents that responded “Yes” fora respective question (i.e the rest the proportion is accounted for a set of “No” responses)

4
important to improve women’s adaptive capacity. According to 49% ofthe respondent men, access to new and adaptive technologies withregard to for instance crop and livestock varieties, fertilizers andthe like would help improve the adaptive capacity of women. 28% of themen also emphasized the need for improving access to informationregarding climate change. Similar proportion of men stated that it isimperative to improve women’s access to and control over productiveresources such as land and livestock. For 78% of the women, skillstraining and diversifications towards non-agricultural livelihoodsources would help them better cope with the impacts of climatechange. About 50% of the women said access to new and adaptivetechnologies with regard to for instance crop and livestock varieties,fertilizers and the like would help improve the adaptive capacity ofwomen. According to 38% of the women they need improved access toinformation regarding climate change
It is important to hear and analyze the view points of womenthemselves as lived experience can inform the best choices anddecision on how to build adaptive capacity of women. For 97% of thewomen, access to new and adaptive technologies with regard to forinstance crop and livestock varieties, fertilizers and the like wouldhelp improve the adaptive capacity of women. 68% of the women statedthat they need skills training and diversifications towards non-agricultural livelihood sources to help them better cope with theimpacts of climate change. Improved access to education, technicalsupport and capacity building are important to target to improvewomen’s adaptive capacity according to 38% of the respondent women.
The women in focus group discussions also raised that it is importantto introduce labor saving mechanisms such as getting bore holescommunities. This saves a lot of time and energy for women. Food aidin times of crisis is important according to the women as it helps torelive the women of their primary responsibility. Facilitating accessto credit is also mentioned by the women. The women highlighted thatexisting credit facilities are not adequate to address the interestsof women. Women discussants have further suggested that women should

4
be organized into cooperatives. They should then get support to engagein the commercial production of vegetables. Service providers shouldalso target women and there should exist a system of preferentialtreatment for women according to the discussants.
It is interesting to note here that women respondents have not so muchraised the issue of improving access to and control over productiveassets like land and livestock. This despite the earlier findings thatshow women do not practically have ownership (control) over theseproductive assets.
Key informant interviews held with various government officials in thebureaus of women’s affairs, health as well as agriculture andpastoralist offices highlighted on the importance of providingtechnologies and services that reduce the work burden of women. Waterfacilities are repeatedly raised as an example by all governmentofficials that took part in the study. Organizing women in intocooperatives and facilitating credit towards income generation forwomen is another measure that the key informants raised. Child carefacilities are important for the women to move around and provide fortheir families during times of disaster according to the keyinformants. The key informants further highlighted that an importantconsideration that is missing in many of the projects aimed atbuilding adaptive capacity is the failure to consider the needs andinterests of women. There is a need to consult women from the initialdesigning stage of such programs.
Institutional capacities to adequately integrate gender in plans andprograms have also been raised as a problem by key informants. Ingovernment offices for instance, key informants disclosed that thereis tendency to consider gender related work as an additional work overand above one’s duties. This has the impact off marginalizing genderrelated work and hence it may not get the required attention duringplanning and implementation. According to CARE representatives,similar lack of expertise and dedicated manpower for gender relatedwork is noted within CARE itself.

4
7. Conclusions AND RecommendationsThis study has shown that there are differences among men and women inregards to their perception on climate change; the experiences ofclimate change; disasters and impacts on livelihood; as well as copingmechanisms. Further, factors affecting adaptive capacity also differfor example in terms of access to information and technicalsupport/assistance. The importance of recognizing and understandingthese differences is twofold. First, it helps to design interventionsbased on the respective needs and priorities of women and men. Second,it helps to uncover the underlying reasons contributing to thesedifferences. The understanding is important in turn to transform theexisting unfavorable gender relations increasing the vulnerability ofwomen.
The main elements identified in terms of unequal gender relations inthe study areas relate to: unequal access to and control overresources; unequal division of labour; limited and/or no decisionmaking power among women and the restricted mobility of women. Thesefactors either directly or indirectly shape the vulnerability of womento climate change and their adaptive capacity. The importantconsiderations in terms of recommendation relate to interventions thatare aimed at transforming the unequal gender relations.
The findings show that the gender division of labor is skewed in favorof men. While women carry out both reproductive and productivefunctions, the men are limited in their farming and livestockproduction. This would have its own implications on time poverty whichin turn adversely affects women’s health and adaptive capacity. It isalso interesting to note here that as women do not seem to have muchopportunity in terms of accessing services like credit, extension andthe like their adaptive capacity is adversely affected.
In terms of recourse, the findings clearly indicate that women in thestudy areas do not have ownership over the major productive resources:land and livestock. However, their access to utilize these resourcesappears to be much better although even such power is limited when itcomes to valuable resources. To the extent that resources determine

4
adaptive capacity, women that lack the necessary resources appear tobe at a disadvantage.
In regards to decision making power, the picture is similar in thatwomen in the communities do not have decision making power in majorissues as the final say in many instances is that of the man. Decisionmaking power as a determinant of adaptive capacity is directly relatedto the ability to exercise choice. It is important in relation toadaptive capacity because even where women have the knowledge, skillsand resource to take adaptive measures, household gender relations mayserve as obstacles to exercise decisions.
Getting support like technical assistance such as trainings and theprovision of necessary package of services like extension, improvedseeds and the like influences adaptive capacity. The majority of womendo not get such support thereby adversely affecting their adaptivecapacity.
What has been the impact of this unequal gender relations on climatechange experiences as well as adaptive capacity of women and men inthe study areas?
The findings show that women are more vulnerable to climate change dueto various factors. These include: their child bearing role affectspregnant and lactating women; women bear the primary burden of caringfor the family, they tend to give priority to their children andhusbands for instance during food distribution in times of draught;women do not have the option of migrating to neighboring countrieslike Kenya in times of disasters and climate change tends to increasetheir work burden.
The experiences of impacts differ among men and women. This is afactor of the pre-existing position of members of society in terms oftheir socio-cultural and economic positions. As the findingsindicate, these differences are very much aligned to the prevailinggender division of labor in society. As women are primary care giversfor the sick in their communities (children and the elderly inparticular) they felt the health related impacts of climate relateddisasters i.e. the spread of epidemics more than the men. Similarly,

4
the women felt the loss of livestock products as sever because itdirectly contributes to their reproductive role of feeding childrenand the family.
There are some observed differences among men and women in theircoping mechanisms. Men tend to resort to food rationing and engagingin daily labor in Miyo for instance and the later aspect can well bedue to the existence of surplus labor among men as unlike women theydo not engage in both productive and reproductive function. Similarly,migration is a preferred option for men while it appears to be arestricted option for women.
What should be done to help build the resilience and adaptive capacityof resource-poor and most vulnerable communities and social groups-with a particular focus on women?
In terms of improving women’s position at the household level, it isimportant to work on the skewed gender division of labor, the limitedaccess to and control over resources as well as women’s limiteddecision making role.
The division of labor among women and men in the target communitiesshows that women handle household activities and are also engagedoutside of the home. Men mostly engage in activities outside of thehome. This creates time poverty among women. To this end labor savingtechnology/mechanisms such as bore holes and water facilities areimportant. Similarly, food aid in times of crisis is important to thewomen as it helps to relive the women of their primary responsibility.
It is always important to conduct a gender analysis of the needs andpriorities of women and men as well as girls and boys to capturedifferences in experience, needs and priorities vis-à-vis climatechange. The analysis must take account of the needs of vulnerablepopulations including pregnant/lactating women and adolescentwives/mothers.
In order to address the problem of limited access to information amongwomen, it is important to design early warning strategies that areaccessible to women such as door to door information dissemination,information sharing through women’s organizations etc.

4
Women in the study areas have very limited, and in many instances no,decision-making power at household level. Perceptions on who has theright to control and use assets must be addressed. This can be donethrough participatory critical-thinking exercises with communitymembers. There should be support to initiate the efforts of women andgovernment stakeholders to organize as these organizations/forums canencourage increased awareness and act as spaces for capacity building.Organizing women in into cooperatives and facilitating credit towardsincome generation for women may constitute one such measure.
Access to new and adaptive technologies with regard to for instancecrop and livestock varieties, fertilizers and the like would helpimprove the adaptive capacity of women. In addition, skills trainingand diversification towards non-agricultural livelihood sources helpsbuild the resilience of vulnerable members of the community.
It is important to build the capacity of government stakeholdersthrough targeted trainings to enable them to participate in gendersensitive planning, implementation and monitoring of programs focusedon building adaptive capacity. This may involve conducting gender-sensitizing trainings with government officials, equipping personnelin the method of conducting gender analyses, integrating findings intoplans and developing gender sensitive indicators that are bothquantitative as well as qualitative for monitoring.
ANNEX I: DUMMY TABLES OF ALL VARIABLE QUESTIONSMale Respondents Q.8 Which members of the family are engaged in the
following activities?Study Woreda West Harerege Borena
Activities Women MenBothMen &Women
Total Women MenBothMen &Women
Total
Herding % 14.8%
36.1%
26.2%
100.0%
1.7% 53.3%
6.7% 100.0%
Supplying fodder % 16.4%
44.3%
31.1%
100.0%
6.7% 20.0%
56.7%
100.0%
Sowing/planting % .0% 86.9%
13.1%
100.0%
1.7% 90.0%
8.3% 100.0%
Hoeing % 3.3% 96.7%
.0% 100.0%
.0% 95.0%
3.3% 100.0%

4
Ploughing % 3.3% 90.2%
6.6% 100.0%
.0% 85.0%
11.7%
100.0%
Weeding % .0% 45.9%
54.1%
100.0%
.0% 40.0%
46.7%
100.0%
Harvesting % 4.9% 70.5%
24.6%
100.0%
.0% 35.0%
46.7%
100.0%
Transporting the crop
% 14.8%
19.7%
63.9%
100.0%
3.3% 21.7%
60.0%
100.0%
Storing % 6.6% 47.5%
42.6%
100.0%
1.7% 55.0%
43.3%
100.0%
Honey production % 6.6% 29.5%
.0% 100.0%
3.3% 55.0%
1.7% 100.0%
Farm management (Soil and water conservation,
% 1.6% 52.5%
42.6%
100.0%
1.7% 70.0%
15.0%
100.0%
House construction % 3.3% 82.0%
14.8%
100.0%
.0% 30.0%
55.0%
100.0%
Granary construction
% 1.6% 95.1%
3.3% 100.0%
.0% 50.0%
48.3%
100.0%
Accessing credits % 23.0%
63.9%
8.2% 100.0%
3.3% 73.3%
20.0%
100.0%
Attending communitymeetings
% 4.9% 36.1%
59.0%
100.0%
1.7% 90.0%
8.3% 100.0%
Accessing agricultural extension services (DA’s technical advice, seeds, fertilizers)
% 1.6% 96.7%
.0% 100.0%
1.7% 88.3%
10.0%
100.0%
Fetching water % 95.1%
3.3% .0% 100.0%
18.3%
80.0%
.0% 100.0%
Fetching fire wood % 98.4%
.0% .0% 100.0%
83.3%
.0% .0% 100.0%
Schooling % 62.3%
11.5%
16.4%
100.0%
81.7%
.0% .0% 100.0%
Cooking % 96.7%
3.3% .0% 100.0%
83.3%
.0% 5.0% 100.0%
Taking care of the sick and the elderly
% 41.0%
8.2% 26.2%
100.0%
83.3%
.0% .0% 100.0%
Female Respondents Q.8 Which members of the family are engaged in the

4
following activities?Study Woreda West Harerege Borena
Activities Women MenBothMen &Women
Total Women MenBothMen &Women
Total
Herding % 20.0%
20.0%
30.0%
100.0%
5.0% 63.3%
3.3% 100.0%
Supplying fodder % 23.3%
33.3%
26.7%
100.0%
13.3%
58.3%
26.7%
100.0%
Sowing/planting % 3.3% 90.0%
.0% 100.0%
1.7% 95.0%
.0% 100.0%
Hoeing % 3.3% 96.7%
.0% 100.0%
1.7% 95.0%
.0% 100.0%
Ploughing % 3.3% 96.7%
.0% 100.0%
.0% 88.3%
3.3% 100.0%
Weeding % 11.7%
55.0%
33.3%
100.0%
8.3% 11.7%
80.0%
100.0%
Harvesting % .0% 98.3%
1.7% 100.0%
3.3% 33.3%
60.0%
100.0%
Transporting the crop
% 28.3%
55.0%
15.0%
100.0%
6.7% 60.0%
28.3%
100.0%
Storing % 13.3%
78.3%
6.7% 100.0%
3.3% 75.0%
13.3%
100.0%
Honey production % 3.3% 15.0%
3.3% 100.0%
1.7% 18.3%
3.3% 100.0%
Farm management (Soil and water conservation,
% 3.3% 85.0%
5.0% 100.0%
10.0%
43.3%
40.0%
100.0%
House construction % 3.3% 83.3%
11.7%
100.0%
21.7%
25.0%
45.0%
100.0%
Granary construction
% 3.3% 75.0%
11.7%
100.0%
11.7%
26.7%
61.7%
100.0%
Accessing credits % 31.7%
51.7%
8.3% 100.0%
1.7% 83.3%
15.0%
100.0%
Attending communitymeetings
% 18.3%
36.7%
41.7%
100.0%
1.7% 81.7%
13.3%
100.0%
Accessing agricultural extension services (DA’s technical advice, seeds, fertilizers)
% 11.7%
75.0%
3.3% 100.0%
3.3% 83.3%
6.7% 100.0%

4
Fetching water % 91.7%
5.0% .0% 100.0%
78.3%
21.7%
.0% 100.0%
Fetching fire wood % 86.7%
1.7% .0% 100.0%
100.0%
.0% .0% 100.0%
Schooling % 56.7%
3.3% 33.3%
100.0%
95.0%
.0% 1.7% 100.0%
Cooking % 100.0%
.0% .0% 100.0%
91.7%
.0% 5.0% 100.0%
Taking care of the sick and the elderly
% 58.3%
3.3% 31.7%
100.0%
95.0%
.0% 1.7% 100.0%
Major Means Of Earning Livelihood By Sex by Woreda CrossTabulation
Q.9What is your household's major means of earning livelihood?
West Harerege Borena
Male Female Total Male Femal
e Total
Major MeansOf
EarningLivelihood
Cropcultivation % 36.1% 48.3% 42.1% .0% 10.0% 5.0%
CattleRearing % 1.6% .0% .8% 23.3% 3.3% 13.3%
MixedFarming % 60.7% 51.7% 56.2% 76.7% 81.7% 79.2%
Non-agricultura
l% 1.6% .0% .8% .0% 5.0% 2.5%
Total % 100.0%
100.0%
100.0%
100.0%
100.0%
100.0%
Responses
Q.10-11 Resources OwnershipWest Harerege Borena
The man(husband
)
Thewoman(wife)
Jointly EachSex
Total
The man(husband
)
Thewoman(wife)
Jointly
EachSex
TotalSex M F M F M F M F M F M FCamels andCattles % 63.9
%52.6% 6.6% 14.0
%18.0%
31.6%
100.0% 95.0% 86.7% .0% 1.7% 3.3%
10.0%
100.0%
Goats andSheep % 42.6
%27.1%
18.0%
44.1%
11.5%
11.9%
100.0% 58.3% 86.7%
40.0% 3.3% 1.7% 5.0% 100.0
%

4
Responses
Q.10-11 Resources OwnershipPoultry
(Chickens) % 21.3%
25.4%
34.4%
39.0% 9.8% 5.1% 100.0
% 61.7% 71.7%10.0%
21.7%
1.7% 5.0% 100.0
%
Land % 90.2%
83.3% 1.6% 13.3
% 4.9% 3.3% 100.0%
98.3%
93.3%
1.7% 1.7% .0
% 5.0% 100.0%
Responses
Q.12-13 Power In Decision Making on ResourcesWest Harerege Borena
The man(husband
)
Thewoman(wife)
Jointly EachSexTotal
The man(husband
)
Thewoman(wife)
Jointly EachSex
TotalSex M F M F M F M F M F M Fsale of
livestock % 57.4%
40.7% 9.8% 13.6
%21.3%
44.1%
100.0% .0% 68.3
%95.0% .0% 5.0%31.7%
100.0%
sale oflivestockproducts
% 1.6% 11.7%
83.6%
68.3% 3.3% 18.3
%100.0% 5.0% 1.7% 3.3% 98.3%
91.7% .0% 100.0
%
cropproducts % 34.4
%18.6%
31.1%
22.0%
34.4%
57.6%
100.0%
53.3%
36.7% 3.3% 5.0% 43.3%
58.3%
100.0%
Responses
Q.14A-E Power In Decision Making on Productive And ReproductiveActivities
West Harerege BorenaThe man(husband
)
Thewoman(wife)
Jointly EachSex
Total
The man(husband
)
Thewoman(wife)
Jointly EachSexTotalSex M F M F M F M F M F M F
use ofcontracepti
ves% 45.9
%28.3% 3.3% 10.0
%60.7%
71.7%
100.0% 6.7% .0% 1.7% .0% 91.7
%100.0
%100.0
%
number ofchildren % 36.1
%40.0% .0% 15.0
%47.5%
71.7%
100.0% 3.3% 1.7% 1.7% .0% 95.0
% 96.7% 100.0%
householdexpenditureslike fooditems
% 52.5%
16.7%
44.3%
28.3%
34.4%
55.0%
100.0% 3.3% 23.3
%55.0%
35.0%
41.7% 61.7% 100.0
%

4
Responses
Q.14A-E Power In Decision Making on Productive And ReproductiveActivities
householdexpenditures
likeclothing
% 23.0%
11.7%
18.0%
16.7%
39.3%
45.0% 100.0% 45.0 21.7
% 1.7% .0% 53.3% 76.7% 100.0
%
householdexpenditureslike health
andeducation
for children
% 42.6%
10.0%
13.1%
15.0%
32.8%
61.7% 100.0% 50.0
% 1.7% .0% 1.7% 50.0% 70.0% 100.0%
Q.14F-J Women’s Power in Decision Making onprivate as well as public spheres 13
West Harerege BorenaMale Female Male Female
Do women have equal right to mento inherit their parents'
property?
% withinSex 18.0% 7.4% 3.3% 1.7%
Do you believe that women haveequal right and position in
society to men?
% withinSex 56.0% 79.6% 43.3% 50.8%
Can women have equal decisionmaking power with men over
household resources?
% withinSex 38.0% 42.6% 48.3% 57.6%
Do women have decision makingpositions in community
structures?
% withinSex 24.0% 31.5% 15.0% 40.7%
Are women in community allowed totravel freely (without being
accompanied by men)?
% withinSex 66.0% 51.9% 98.3% 98.3%
TotalCount 50 54 60 59
13Percentiles are calculated to show only respondents that responded “Yes” fora respective question (i.e the rest of the proportion is accounted for a set of “No” responses)

4
Q. 15 Do women in your communitytake part or participate in
community structures?14
West Harerege Borena
Male Female Male FemaleWithin kebel % within
Sex72.1% 56.7% 78.3% 51.7%
Women’s associations of different forms
% within Sex
49.2% 70.0% 98.3% 80.0%
In customary institutions % within Sex
14.8% 73.3% 26.7% .0%
Others % within Sex
1.6% 1.7% .0% .0%
TotalCount 61 60 60 60
Q. 16 Major climate relateddisasters in your area?15
West Harerege BorenaMale Female Male Female
Drought % withinSex 100.0% 100.0% 100.0% 100.0%
Flood % withinSex 32.8% 11.7% 100.0% 83.3%
Heavy rainfalls % withinSex 34.4% 10.0% 93.3 76.7%
Damaging winds % withinSex 63.9% 80.0% 50.0% 41.7%
High temperatures % withinSex 82.0% 98.3% 54.0% 63.7%
Total Count 61 60 60 60
Q. 17 Have you noticed any change in thefrequency or severity of climate relateddisasters (drought, diseases, floods)affecting your area over the past 30
years?
West Harerege Borena
Responses Sex Male Female Male FemaleYes % within Sex 96.7% 76.7% 84.7% 93.3%No % within Sex .0% 23.3% 3.4% 3.3%N/R % within Sex 3.3% .0% 11.9% 3.3%
% within Sex 100.0% 100.0% 100.0% 100.0%
14See Footnote 13 above15See Footnote 13 above

4
Q. 18 If yes, what changes have youobserved?16 West Harerege Borena
Responses Sex Male Female Male FemaleMore frequent % within Sex 91.5% 69.6% 51.7% 60.0%Less frequent % within Sex 18.6% 37.0% 48.3% 38.3%More severe % within Sex 71.2% 80.4% 26.7% 68.3%Less severe % within Sex 16.9% 23.9% 41.7% 23.3%
Count 61 60 60 60
StudyWoreda
Q. 19 Change in the frequency or severity of climate relateddisasters
West Harerege Borena
Responses NoChange
Increasing
Decreasing N/R
NoChange
Increasing
Decreasing N/R
Sex M F M F M F M F M F M F M F M FFrequen
cy % 6.6%
21.7%
90.2%
75.0% 1.6% 3.3% 1.6
% .0% .0% 6.7%96.7%
93.3% .0% 3.3% 3.3% .0%
Severity % 4.9%
21.7%
88.5%
73.3% .0% 3.3% 6.6
%1.7%
1.7%
1.7%
83.3%
75.0% .0% .0% 15.0
%20.0%
Q. 20 Impact of these climatechange/environmental hazards on your
livelihood?17West Harerege Borena
Responses Sex Male Female Male FemaleUnable to farm % within Sex 63.9% 51.7% 88.3% 8.3%
Unable to raise cattle % within Sex 39.3% 38.3% 88.3% 50.0%Reduction in farm output % within Sex 47.5% 58.3% 48.3% 56.7%
Reduction in livestock output % within Sex 19.7% 18.3% 43.3% 76.7%Other % within Sex 1.6% 5.0% .0% 8.3%
Count 61 60 60 60
16See Footnote 13 above17See Footnote 13 above

4
Q. 21 What impacts did climate relateddisasters cause in the past?18 West Harerege Borena
Responses Sex Male Female Male FemaleCrop failure % within Sex 77.0% 80.0% 70.0% 55.0%
displacement of people % within Sex 29.5% 21.7% 65.0% 6.7%occurrence of epidemics (e.g.
diarrhoea, malaria) % within Sex 23.0% 20.0% 40.0% 68.3%
destruction of property % within Sex 16.4% 38.3% 45.0% 28.3%destruction of infrastructure
(schools, roads, healthcentres, bridges)
% within Sex 11.5% .0% 30.0% 1.7%
disruption of water supply % within Sex 14.8% 8.3% 55.0% 35.0%Loss of livestock (fromdiseases and deaths) % within Sex 44.3% 43.3% 61.7% 43.3%
damage to crops % within Sex 3.3% 20.0% 5.0% 10.0%Count 61 60 60 60
StudyWoreda
Q. 22 Vulnerability to climate change disasters by social groups West Harerege Borena
ResponsesMost
Vulnerable
LessVulnerab
leViable N/R
MostVulnerabl
e
LessVulnerab
le
Viable N/R
SocialGroups M F M F M F M F M F M F M F M F
Femaleheadedhouseho
lds
% 85.2%83.3%14.8%16.7% .0% .0% .0% .0% 98.3%100.0% 1.7% .0% .0% .0% .0% .0
%
Husbanded
women% 29.5%33.3%34.4%41.7%
36.1%
25.0% .0% .0% .0% 100.0
%91.7% .0% 8.3
%.0% .0% .0
%
Girls % 44.3%53.3%54.1%43.3% 1.6% 3.3% .0% .0% 18.3% 6.7% 81.7%
93.3% .0% .0
% .0% .0%
Elderly % 88.5%96.7%11.5%3.3% .0% .0% .0% .0% 90.0%100.0%10.0% .0% .0% .0
% .0% .0%
Boys % 52.5%50.0%47.5%46.7% .0% 3.3% .0% .0% 25.0%28.3%75.0%71.7% .0% .0
% .0% .0%
Smallchildre
n
% 100.0%
100.0% .0% .0% .0% .0% .0% .0% 98.3%100.0% 1.7% .0% .0% .0
% .0% .0%
18See Footnote 13 above

4
StudyWoreda
Q. 22 Vulnerability to climate change disasters by social groups Disable
d% 91.8%90.0% 8.2% 3.3% .0% .0% .0% 6.7%93.3%100.0% 6.7% .0% .0% .0
% .0% .0%
HIV&AIDS
infected
%
98.4%90.0% .0% .0% .0% .0% 1.6%
10.0%
100.0%
100.0% .0% .0% .0% .0
% .0% .0%
Poorhouseho
lds
%96.7%96.7% .0% 3.3% 1.6% .0% 1.6
% .0% 88.3%100.0% .0% .0% 8.3%
.0%
3.3%
.0%
Q. 23 What are the situations that more exposethe most vulnerable social groups to
environmental disasters in the area? 19West Harerege Borena
Responses Sex Male Female Male FemaleInsufficient resources % within Sex 77.0% 66.7% 79.7% 83.3%Insufficient Labor % within Sex 60.7% 43.3% 74.6% 55.0%Lack of Information % within Sex 23.0% 18.3% 27.1% 21.7%
Poor Working Experience % within Sex 18.0% 18.3% 13.6% 13.3%Bad Luck % within Sex 16.4% 8.3% 8.5% 3.3%Others % within Sex 1.6% .0% .0% 20.0%
Count 61 60 60 60
Q. 24 What are the most important copingstrategies you adopt during emergency (hunger)
situations?20West Harerege Borena
Responses Sex Male Female Male FemaleFood rationing and consumption
adjustments % within Sex 29.5% 8.3% 61.7% 43.3%
Collecting, selling or eatingwild leaves, fruits, roots % within Sex 1.6% 20.0% 10.0% 10.0%
Sell of livestock % within Sex 49.2% 38.3% 43.3% 95.0%Engaging in daily labour % within Sex 32.8% 61.7% 51.7% 28.3%
Seek support from relatives andfriends % within Sex 3.3% 23.3% 21.7% 11.7%
Food aid % within Sex 63.9% 71.7% 38.3% 71.7%Seeking loan % within Sex 34.4% 40.0% 31.7% 28.3%Migration % within Sex 4.9% 3.3% 16.7% 5.0%
Count 61 60 60 6019 Multiple answer; See Footnote 13 above20 Multiple answer; See Footnote 13 above

4
Q. 25What are the main reasons that contributeto the prevention of environmental disasters
to some of the community members?21West Harerege Borena
Responses Sex Male Female Male FemaleMaximizing income by engagingin Additional income generating
activities% within Sex 44.3% 36.7% 83.1% 96.7%
developed saving practice % within Sex 41.0% 35.0% 47.5% 16.7%equal participation of man and
women in decision makingactivities
% within Sex 19.7% 33.3% 35.6% 96.7%
an interest for change andaccepting new ideas % within Sex 4.9% 6.7% 10.2% 1.7%
availability of literatemembers in the family and
forcing the family for change% within Sex 8.2% 5.0% 3.4% 1.7%
Minimizing cost by quittingchate, alcohol, etc…. % within Sex 9.8% 15.0% 20.3% 13.3%
working hard % within Sex 34.4% 60.0% 22.0% 11.7%luck % within Sex 8.2% .0% .0% .0%
Others % within Sex 1.6% 3.3% .0% 6.7%Count 61 60 60 60
Q. 26Do you think that there is sufficientawareness about various environmentalhazards and risks in your community?
West Harerege Borena
Responses Sex Male Female Male FemaleYes % within Sex 50.8% 45.0% 26.7% 55.0%No % within Sex 42.6% 31.7% 66.7% 18.3%D/K % within Sex 6.6% 23.3% 6.7% 26.7%
% within Sex 100.0% 100.0% 100.0% 100.0%
21 Multiple answer; See Footnote 13 above

4
Q. 27Do you engage in environmentalconservation? West Harerege Borena
Responses Sex Male Female Male FemaleYes % within Sex 96.7% 68.3% 95.0% 8.3%No % within Sex 3.3% 23.3% .0% 86.7%N/R % within Sex .0% 8.3% 5.0% 5.0%
% within Sex 100.0% 100.0% 100.0% 100.0%
Q. 28Do you get support (technical,material) to help you cope with
environmental hazards?West Harerege Borena
Responses Sex Male Female Male FemaleYes % within Sex 75.4% 81.6% 50.0% 30.0%No % within Sex 24.6% 15.0% 36.7% 68.3%N/R % within Sex .0% 3.4% 13.3% 1.7%
% within Sex 100.0% 100.0% 100.0% 100.0%
Q. 31Are the impacts of climatechange/environmental hazards similar for
women and men?West Harerege Borena
Responses Sex Male Female Male FemaleYes % within Sex 29.5% 31.7% 10.0% .0%No % within Sex 70.5% 68.3% 90.0% 98.3%N/R % within Sex .0% .0% .0% 1.7%
% within Sex 100.0% 100.0% 100.0% 100.0%
Q. 33Do women have equal access toadequate information as men regardingclimate change/environmental hazards?
West Harerege Borena
Responses Sex Male Female Male FemaleYes % within Sex 41.0% 23.3% 15.0% 63.3%No % within Sex 57.4% 73.3% 73.3% 31.7%D/K % within Sex 1.6% .0% 5.0% 1.7%N/R % within Se .0% 3.3% 6.7% 3.3%
% within Sex 100.0% 100.0% 100.0% 100.0%

4
Q. 34Do women get technical support suchas training as well as materials like
improved seed and fertilizers to withstandthe impact of climate change?
West Harerege Borena
Responses Sex Male Female Male FemaleYes % within Sex 21.3% 50.0% 20.0% .0%No % within Sex 78.7% 48.3% 80.0% 98.3%N/R % within Sex .0% 1.7% .0% 1.7%
% within Sex 100.0% 100.0% 100.0% 100.0%
Q. 35 In your opinion, what can be done tohelp poor women farmers and youngsters to
adapt to climate change?22West Harerege Borena
Options (Responses) Sex Male Female Male FemaleImproving access to information
regarding climate change % within Sex 27.9% 38.3% 25.0% 11.7%
Improving access to education,technical support and capacity
building% within Sex 24.6% 26.7% 61.7% 38.3%
Improving access to, andcontrol over productive
resources such as land andlivestock for women
% within Sex 27.9% 21.7% 46.7% .0%
Access to new/adaptivetechnologies in regard to cropand livestock (eg. varieties,
fertilizers)
% within Sex 49.2% 50.0% 93.3% 96.7%
Skills training and non-agricultural livelihood sources % within Sex 57.4% 78.3% 43.3% 68.3%
Others (please specify) % within Sex 14.8% .0% 3.3% 23.3%Count 61 60 60 60
22Percentiles are calculated to show only respondents that responded “Yes” fora respective question (i.e the rest the proportion is accounted for a set of “No” responses)
Related Documents


![Gender and Climate Change[1]](https://static.cupdf.com/doc/110x72/577d2a1b1a28ab4e1ea8adea/gender-and-climate-change1.jpg)