Climate Change: The Move to Action (AOSS 605 (480) // NRE 501.076 ) Richard B. Rood 734-647-3530 [email protected] LECTURE NUMBER 3 January 11, 2007

Welcome message from author
This document is posted to help you gain knowledge. Please leave a comment to let me know what you think about it! Share it to your friends and learn new things together.
Transcript
Climate Change: The Move to Action (AOSS 605 (480) // NRE 501.076 )
Richard B. Rood734-647-3530
LECTURE NUMBER 3January 11, 2007

Class News
• There is a ctools site (AOSS 480 001 W07)– Lectures have all been added
• No class next week: Jan. 16 and Jan. 18 (I am out of town)– Would like to make up these lectures– January 18 … UM Workshop on Energy
• http://www.mmpei.umich.edu/workshop.html• Some climate stuff
– U o’ M Museum of Natural History. Climate Change exhibit opens on January 19, 2007
• Reception 5-7 PM– The Bar Scene: Tap Room, Ann Arbor Brewing Company,
January 24, 2007 • Perry Samson and I will have some sort of climate event
Class News
• Next Reading: Radiative Balance– Radiative Forcing of Climate Change:
Expanding the Concept and Addressing Uncertainties (2005) Board on Atmospheric Sciences and Climate (BASC) Chapter 1
• http://www.nap.edu/books/0309095069/html
Outline of lecture
• Some news• Layout of the problem: The motivators
(continued)• Science-Mitigation-Adaptation Framework• Past climate
Some Climate News
• National Oceanographic and Atmospheric Administration (NOAA) // World Data Center for Meteorology // National Climatic Data Center– http://www.ncdc.noaa.gov/oa/wmo/wdcamet.html
– State of the Climate– http://www.ncdc.noaa.gov/oa/climate/research/monitoring.html#state

Some Review
• When used in the application of the scientific method– Hypothesis is a proposition that can be tested
whether or not it is valid. Formally, by experiment, often by ability to predict.
– Theory is systematically organized knowledge based on tested hypotheses and principles.
– Principles are basic truths from which hypotheses are drawn and on which theories are built.
– Facts are information that is objectively real or true.
Some Review
• An important attribute of knowledge derived scientifically is that it is based in observation and tested. There is also independent testing by others (like an audit). Further, new tests are posed to challenge theories, which lead to refinement and strengthening of the theory. Sometimes the theories are proven wrong – at least in part.
SCIENTIFIC INVESTIGATION OF CLIMATE CHANGE
What are the pieces which we must consider? (scientific investigation)

What do predictions tell us?

Note: There iconsistency from many models, man scenarios, that there wil be warming. (1.5 – 5.5 C)
Also, it’s still going up in 2100!
Basic physics of temperature ncrease is very simple, non- controversial.
The prediction:
*
Presenter
Presentation Notes
This is a remarkable opportunity. We have knowledge, with a high degree of confidence, what is likely to happen in the future.

Projected Global Temperature Trends
IPCC ‘01
2071-2100 temperatures relative to 1961-1990.Special Report on Emissions Scenarios Storyline B2 (middle of the road warming).

Uncertainty
• If you were to assign uncertainty– Regional, seasonal predictions are more
uncertain than latitudinal, annual predictions are more uncertain than global, time-average prediction.

Systematic Temperature Changes
• Global Temperature increase 1.5 – 4.5 C• Poles warm faster than globe, especially
the North Pole.• Land warms faster than ocean.• Night warms faster than day• Spring starts earlier• Autumn starts later
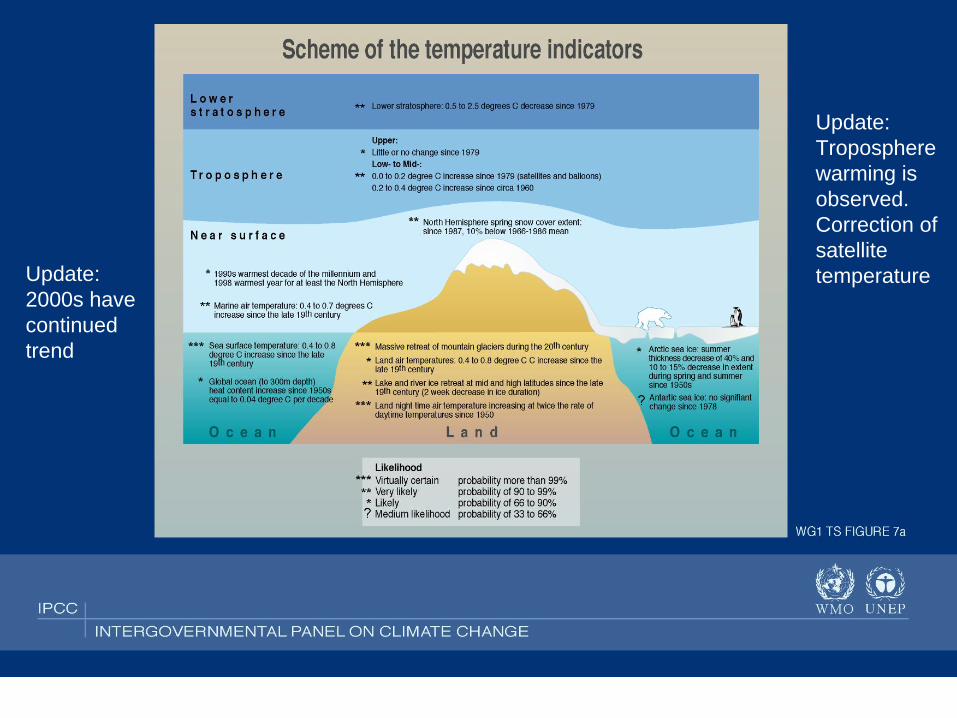
Update: 2000s have continued trend
Update: Troposphere warming is observed. Correction of satellite temperature
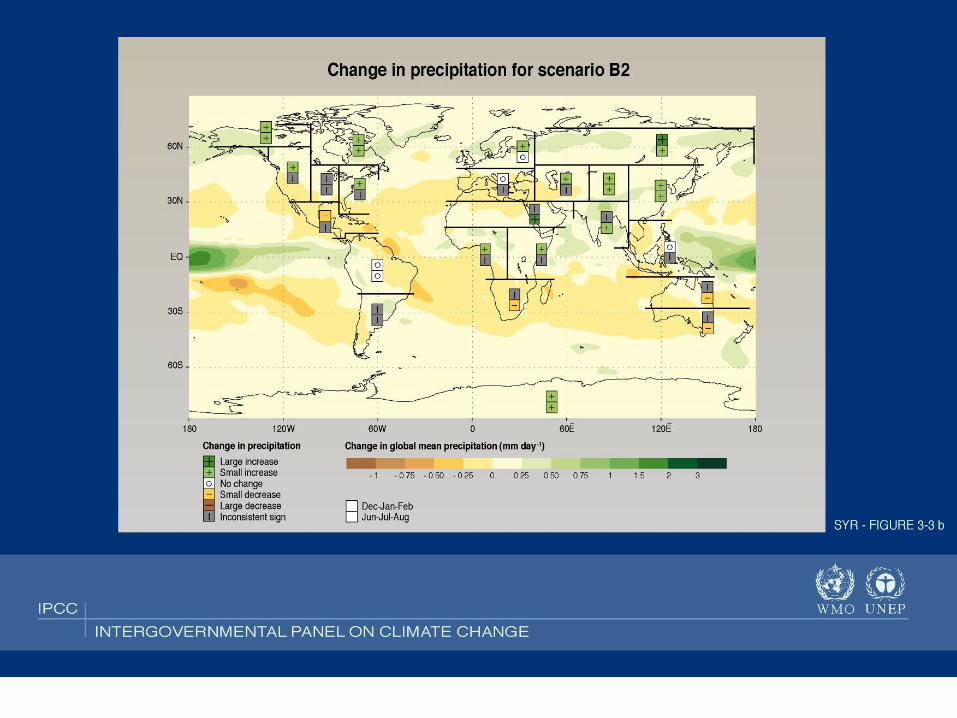
Water
• Water vapor in atmosphere will increase (It’s a greenhouse gas.)
• Precipitation will increase• Evaporation will increase (It’s warmer.)• Snow cover will be less over most
continents.• Snow could increase in Greenland and
Antarctica?

Storms, Drought, Floods

Update: Papers in 2005 that hurricane intensity has increased

Sea level predictions
• 0.11 to 0.43 meters due to thermal expansion, warming of the ocean water
• 0.01 to 0.23 meters due to melting of continental glaciers
• Greenland: -0.02 + 0.09 meters ???• Antarctica: -0.17 + 0.02 meters ???


What do with do with this information?
• Is this information about probable climate change accurate and interpretable?– Is it robust?– How often and fast does it change?
• Is it consequential?– Are there risks if we ignore it?– Are there risks if we believe it?
• How does this information about probable climate change relate to humans and the things that humans do?

SCIENTIFIC INVESTIGATION OF CLIMATE CHANGE
What are the pieces which we must consider? (how do we absorb this information?)
Belief System Values Perception Cultural Mandate Societal Needs*
How do we get our information?
• Direct research, generation of new knowledge• Review of the primary source literature• Journalism• Editorials• Entertainment• Public Outreach from Information Holders• Popular literature• Texts, formal education• Peer-reviewed evaluations of the state of the
knowledge of the field
SCIENTIFIC INVESTIGATION OF CLIMATE CHANGE
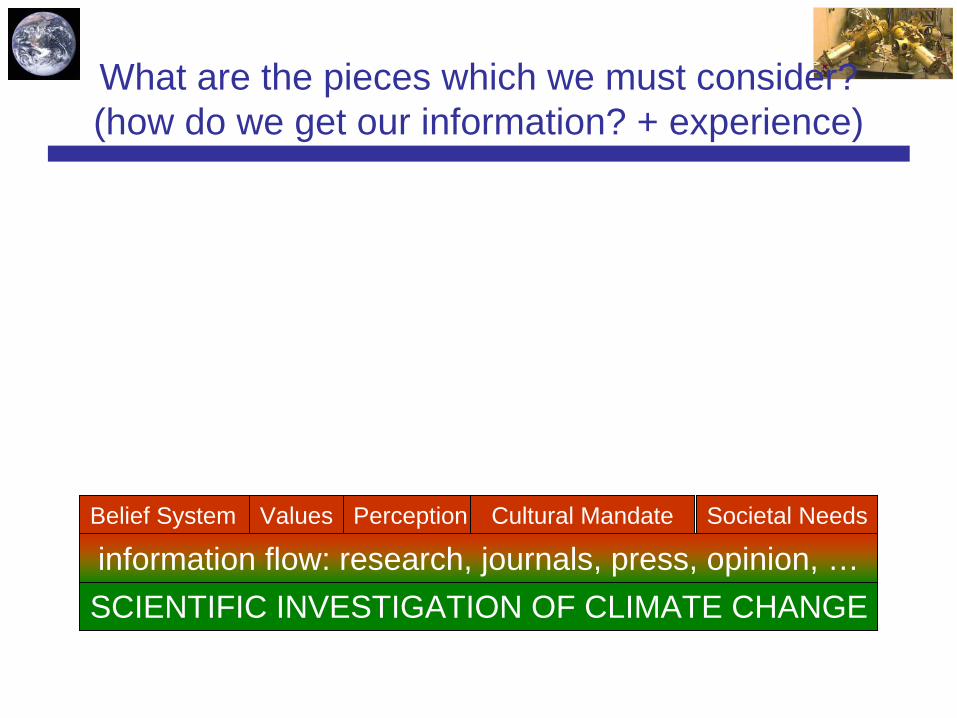
What are the pieces which we must consider? (how do we get our information? + experience)
Belief System Values Perception Cultural Mandate Societal Needs
information flow: research, journals, press, opinion, …
SCIENTIFIC INVESTIGATION OF CLIMATE CHANGE
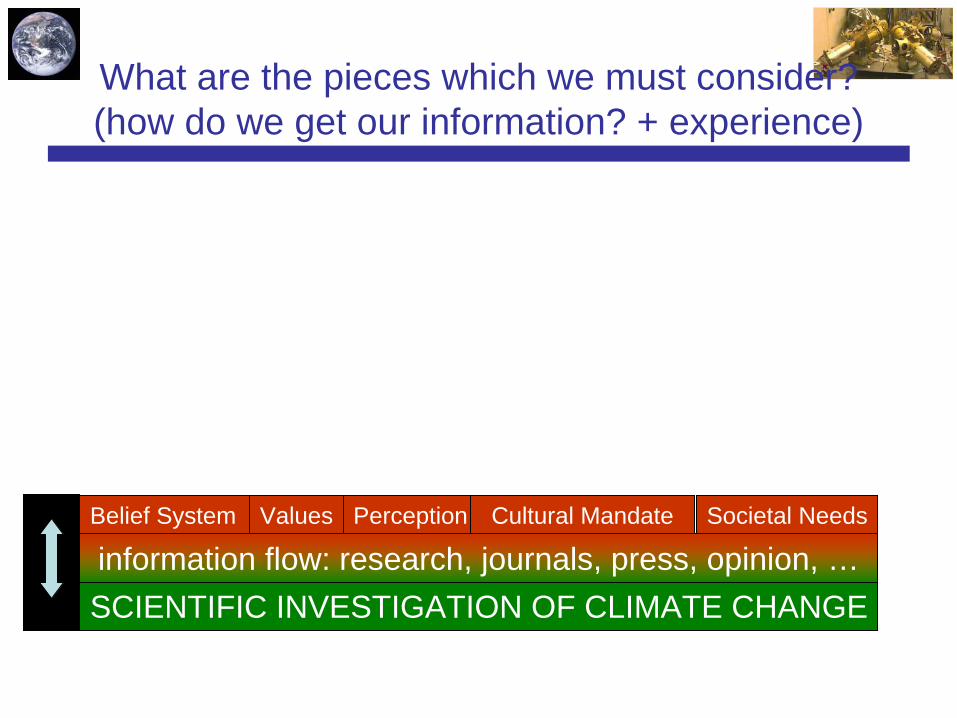
What are the pieces which we must consider? (how do we get our information? + experience)
Belief System Values Perception Cultural Mandate Societal Needs
information flow: research, journals, press, opinion, …

How do we evaluate this knowledge?
• How do we evaluate (validate?) this information?– Personal experience
• Is it hotter where I live?
– Relative to what we know and believe• How does it impact us? Does it cost something?
– In some absolute sense?• Look at past observations• Look at ability to predict• Look at quality of observations• Look at consistency of theory, robustness of hypothesis• Attribution of change, cause and effect
This is where we will spend most of the first group of lectures
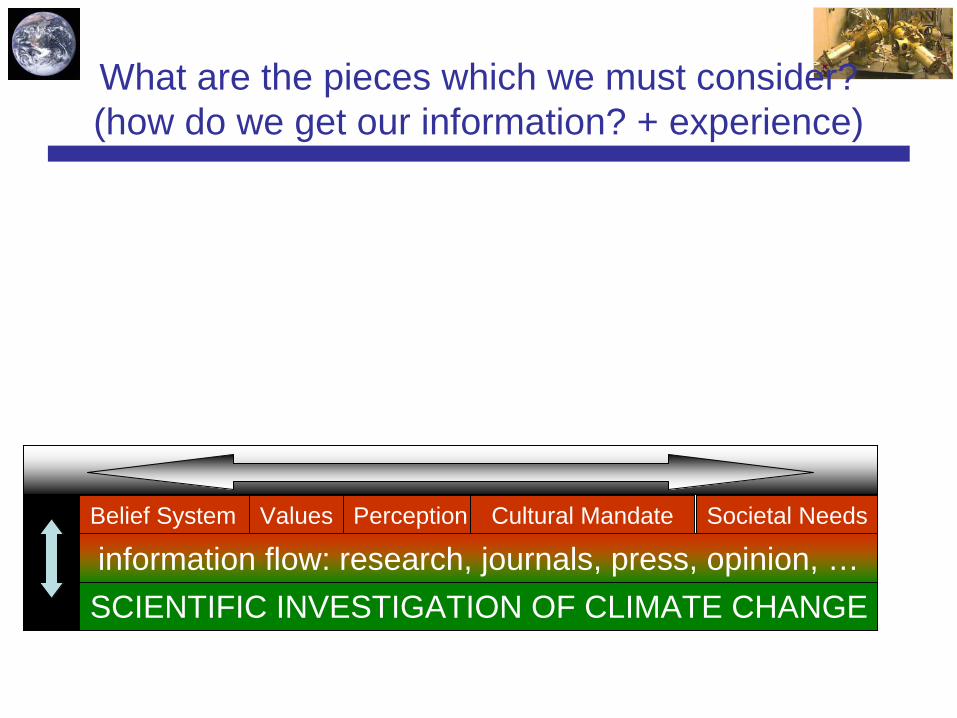
SCIENTIFIC INVESTIGATION OF CLIMATE CHANGE
What are the pieces which we must consider? (how do we get our information? + experience)
Belief System Values Perception Cultural Mandate Societal Needs
information flow: research, journals, press, opinion, …
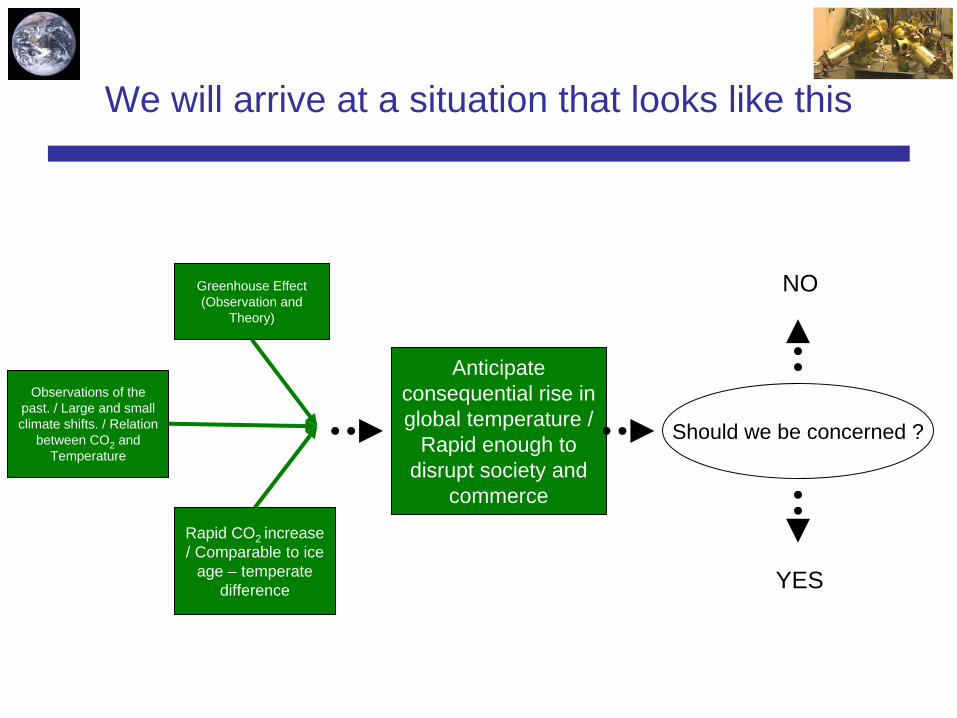
We will arrive at a situation that looks like this
Greenhouse Effect(Observation and
Theory)
Rapid CO2 increase / Comparable to ice
age – temperate difference
Observations of the past. / Large and small climate shifts. / Relation
between CO2 and Temperature
Anticipate consequential rise in global temperature /
Rapid enough to disrupt society and
commerce
Should we be concerned ?
NO
YES
SCIENTIFIC INVESTIGATION OF CLIMATE CHANGE
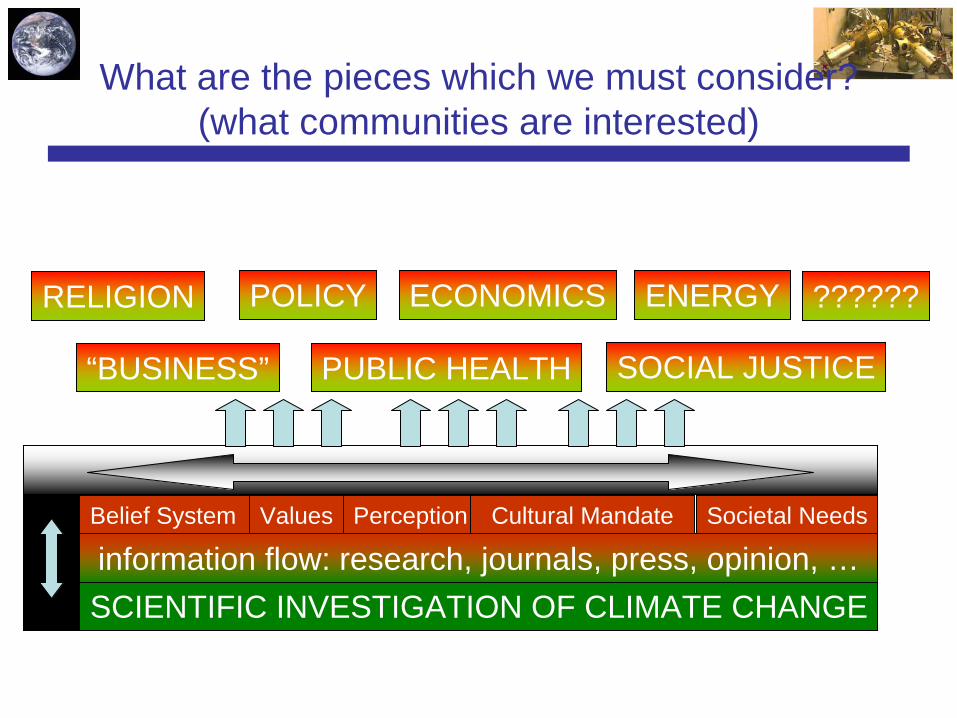
What are the pieces which we must consider? (what communities are interested)
Belief System Values Perception Cultural Mandate Societal Needs
information flow: research, journals, press, opinion, …
ECONOMICSPOLICY
“BUSINESS” PUBLIC HEALTH SOCIAL JUSTICE
ENERGYRELIGION ??????

SCIENTIFIC INVESTIGATION OF CLIMATE CHANGE
What are the pieces which we must consider? (what are the consequences)
Belief System Values Perception Cultural Mandate Societal Needs
information flow: research, journals, press, opinion, …
SecurityFood
EnvironmentalNational
Societal SuccessStandard of Living...???...
ECONOMICSPOLICY
“BUSINESS” PUBLIC HEALTH SOCIAL JUSTICE
ENERGYRELIGION ??????

Energy
• The climate change problem and energy policy are correlated, currently, they are completely intertwined.
• By most standards, energy use is directly related to societal success.
• Hence virtually all elements of society are stakeholders.
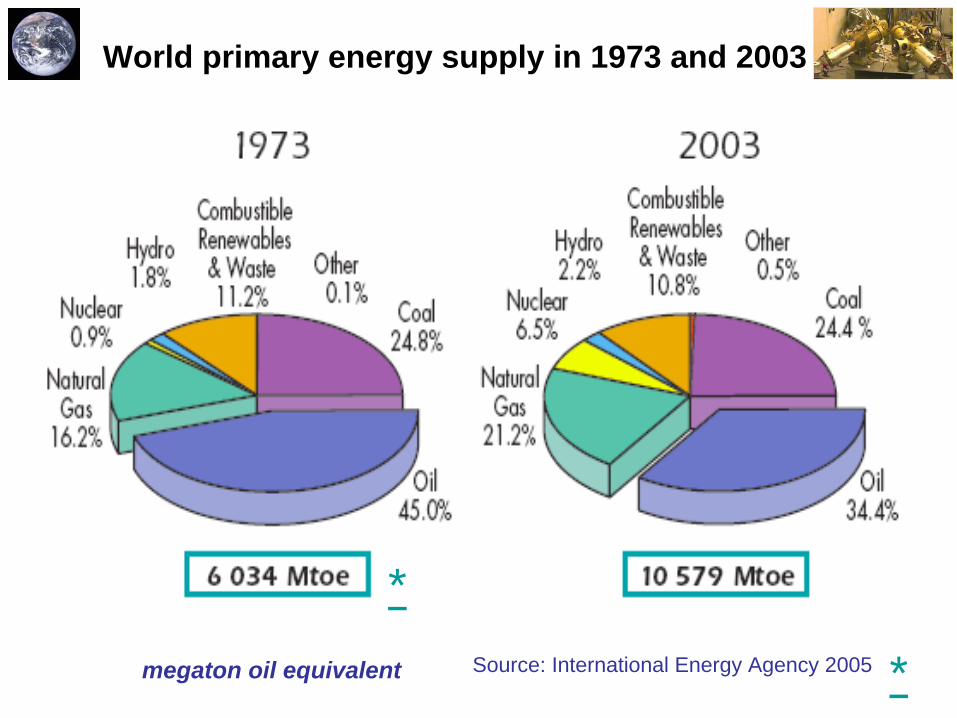
World primary energy supply in 1973 and 2003
Source: International Energy Agency 2005
*megaton oil equivalent *
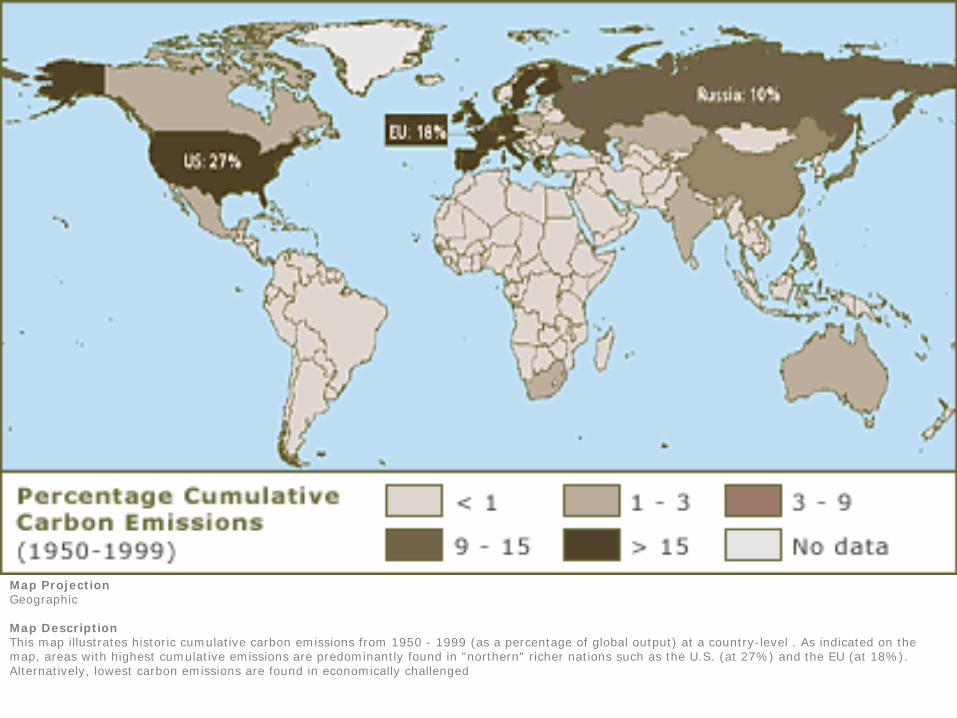
Map Projection Geographic
Map Description This map illustrates historic cumulative carbon emissions from 1950 - 1999 (as a percentage of global output) at a country-level . As indicated on the map, areas with highest cumulative emissions are predominantly found in "northern" richer nations such as the U.S. (at 27%) and the EU (at 18%). Alternatively, lowest carbon emissions are found in economically challenged

Total Carbon Dioxide Emissions from Fossil Fuel Use, 2000(Source: Boden, 2003)
0 200000 400000 600000 800000 1000000 1200000 1400000 1600000 1800000
United States
China
RussiaJapan
IndiaGermany
United Kingdom
CanadaItaly
Rep KoreaMexico
Saudi Arabia
FranceAustralia
UkraineSouth Africa
Iran
BrazilPoland
Spain
Millions of Tons of CO2 Emitted
Top 20 Emitting Nations, 2000
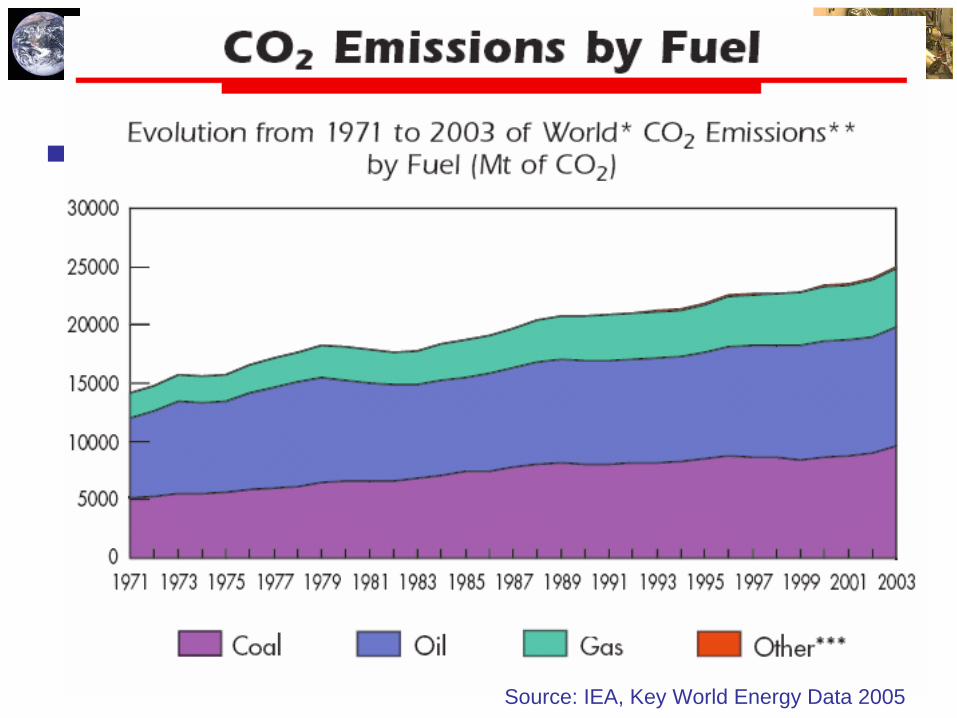
Source: IEA, Key World Energy Data 2005
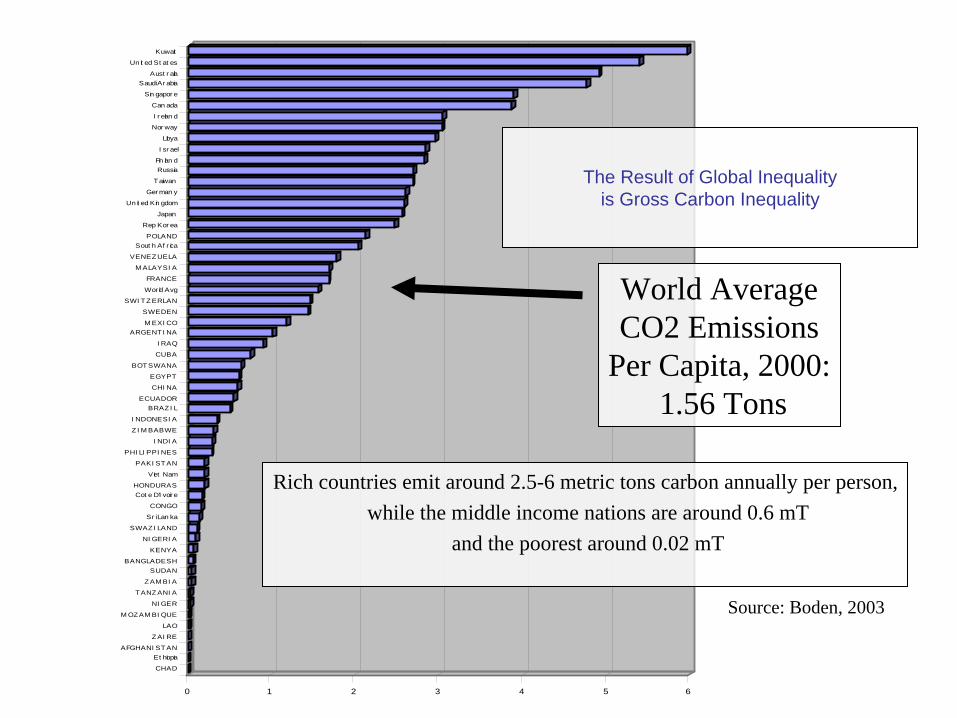
0 1 2 3 4 5 6
Kuwait
Un it ed St at es
Aust r aliaSaudi Ar abia
Sin gapor e
Can ada
I r elan d
Nor way
Libya
I sr ael
Fin lan dRussia
Taiwan
Ger man y
Un it ed Kin gdom
Japan
Rep Kor ea
POLANDSout h Af r ica
VENEZ UELA
M ALAYSI A
FRANCE
Wor ld Avg
SWI T Z ERLAN
SWEDEN
M EXI COARGENTI NA
I RAQ
CUBA
BOT SWANA
EGYPT
CHI NA
ECUADORBRAZ I L
I NDONESI A
Z I M BABWE
I NDI A
PHI LI PPI NES
PAKI ST AN
Viet Nam
HONDURASCot e D'I voir e
CONGO
Sr i Lan ka
SWAZ I LAND
NI GERI A
KENYA
BANGLADESHSUDAN
Z AM BI A
TANZ ANI A
NI GER
M OZAM BI QUE
LAO
Z AI RE
AFGHANI ST ANEt hiopia
CHAD
World AverageCO2 Emissions
Per Capita, 2000:1.56 Tons
Source: Boden, 2003
The Result of Global Inequality is Gross Carbon Inequality
Rich countries emit around 2.5-6 metric tons carbon annually per person,while the middle income nations are around 0.6 mT
and the poorest around 0.02 mT

POLICY

Science, Mitigation, Adaptation Framework
Presenter
Presentation Notes
This is a standard framework for thinking about the climate problem. It has been around since the early 1990s. We will keep coming back to this during the course.
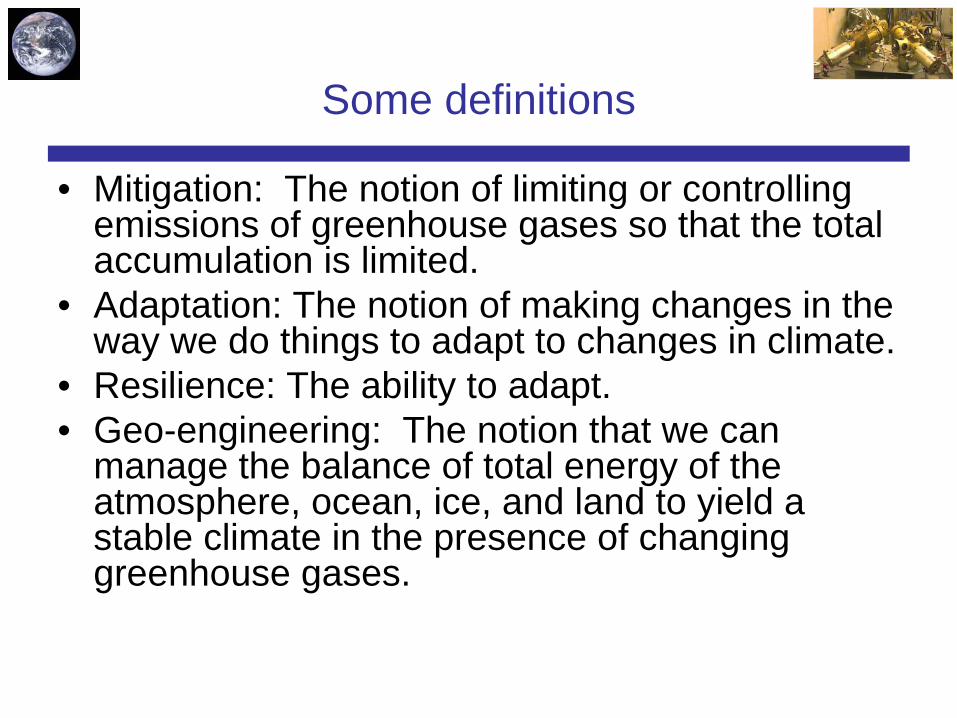
Some definitions
• Mitigation: The notion of limiting or controlling emissions of greenhouse gases so that the total accumulation is limited.
• Adaptation: The notion of making changes in the way we do things to adapt to changes in climate.
• Resilience: The ability to adapt.• Geo-engineering: The notion that we can
manage the balance of total energy of the atmosphere, ocean, ice, and land to yield a stable climate in the presence of changing greenhouse gases.
The Basics of Climate Change (Back to the Past)
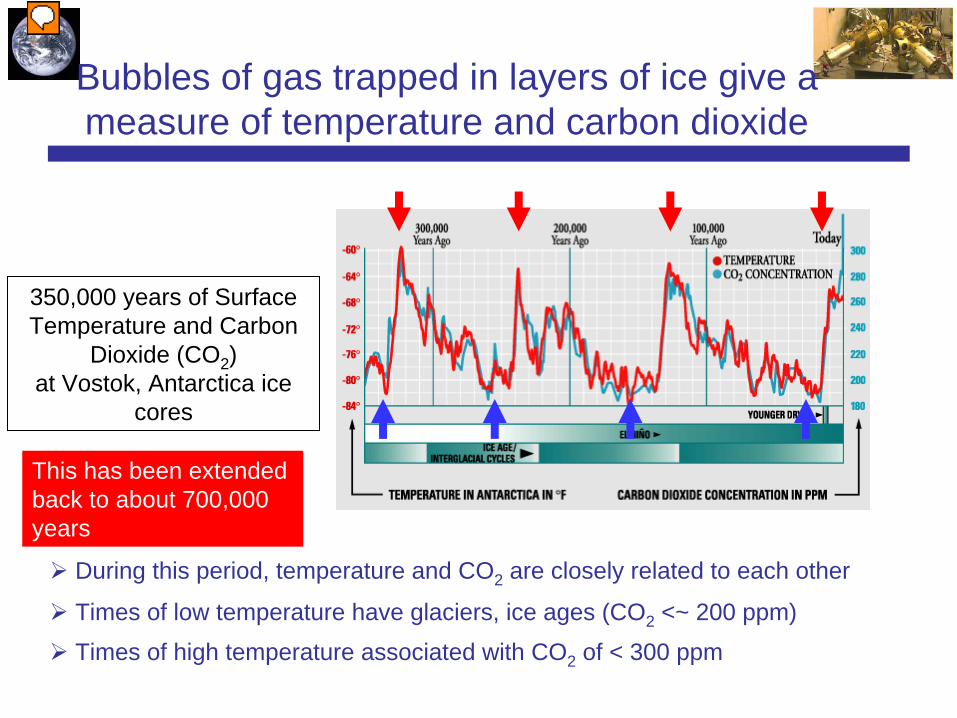
Bubbles of gas trapped in layers of ice give a measure of temperature and carbon dioxide
350,000 years of Surface Temperature and Carbon
Dioxide (CO2 ) at Vostok, Antarctica ice
cores
During this period, temperature and CO2 are closely related to each other
Times of low temperature have glaciers, ice ages (CO2 <~ 200 ppm)
Times of high temperature associated with CO2 of < 300 ppm
This has been extended back to about 700,000 years
Presenter
Presentation Notes
A primary reference for this data is Petit et al. (Nature, 1999). There is a remarkable amount of information in this figure. A good exercise would be to describe the variability in the plot, then to analyze what the plot may or may not be telling you about co2 and temperature as well as global warming. It is also interesting to think about human enterprise and this plot. I would call this one of three canonical figures that needs to be understood for participation in the climate change debate.
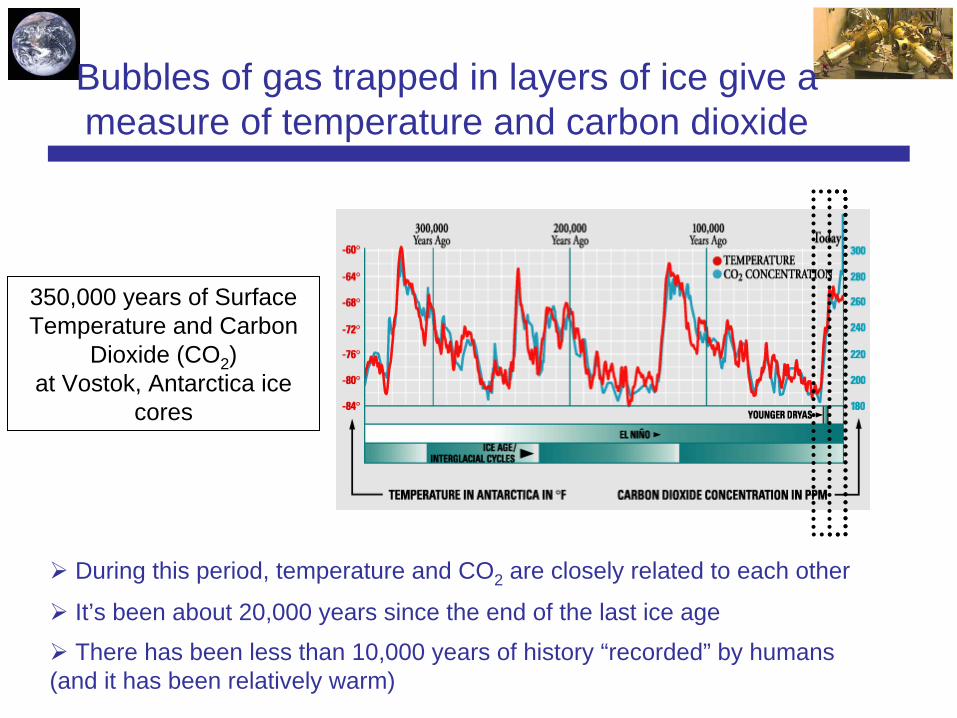
Bubbles of gas trapped in layers of ice give a measure of temperature and carbon dioxide
350,000 years of Surface Temperature and Carbon
Dioxide (CO2 ) at Vostok, Antarctica ice
cores
During this period, temperature and CO2 are closely related to each other
It’s been about 20,000 years since the end of the last ice age
There has been less than 10,000 years of history “recorded” by humans (and it has been relatively warm)
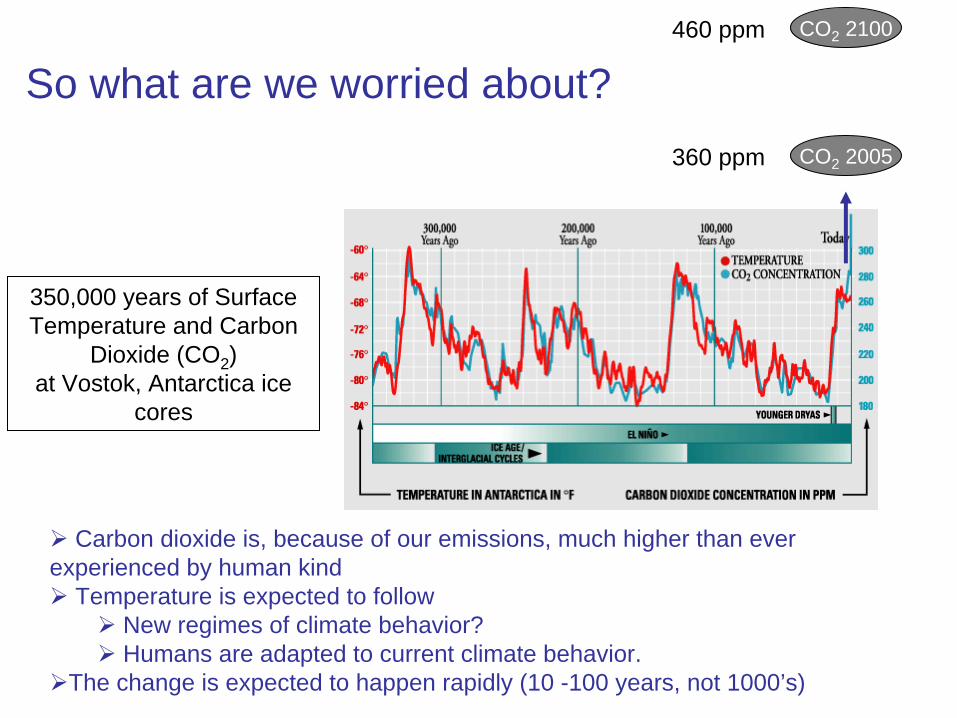
So what are we worried about?
350,000 years of Surface Temperature and Carbon
Dioxide (CO2 ) at Vostok, Antarctica ice
cores
Carbon dioxide is, because of our emissions, much higher than ever experienced by human kind
Temperature is expected to follow New regimes of climate behavior?Humans are adapted to current climate behavior.
The change is expected to happen rapidly (10 -100 years, not 1000’s)
CO2 2005
CO2 2100
360 ppm
460 ppm

Differences for the Future (100-200 years)~100 ppm CO2 (Already)
> 200-300 ppm CO2 certain~ xx C polar T difference~ xx C global average T difference
New Regimes of Climate Behavior?
ICE AGE
CURRENT(Temperate)
NEW AGE?
Differences from Past (20,000 years)~100 ppm CO2~ 20 C polar T difference~ 5 C global average T difference
Behavior o
f water; P
hase change
Time gradient of CO2 changes, 2 orders of magnitude (100 times) larger.
Presenter
Presentation Notes
This is a plot I put together to follow on the notion that the historical co2 and T record suggest, perhaps, two regimes. I called this the ice age regime and the temperate (or current) regime. The data show that in the past co2 was about 100 ppm lower. We can, reasonably, conclude that 100 ppm is consistent with changes in climate regimes. We have the fact, observable, that we have already added 100 ppm (more than) co2 to the atmosphere, and we will add at least that much more. Therefore, it is also reasonable to think that significant changes in the climate might follow. Could this be another regime, forced by co2. I called it “New Age.” It might be reasonably called the “Green House,” which is consistent with the paleoclimate nomenclature. Other things to note: 1) The time period in which co2 has been added to the atmosphere is much faster than the time co2 increased in the historical record. This is a major concern, adaptation will need to occur rapidly. 2) One of the most important things to remember in the discussion is that the phase change of water is central to the difference between past and present. This is likely to be true in the future as well. 3) The past variability is natural, in the sense that it is not caused by the behavior of man. What we are adding is, therefore, a “forcing” that is directly related to man. It is important to note that past behavior is linked to biological activity on land and in ocean. 4) Some argue that co2 has been increasing for 100 years, but that we have not been able to find the warming. What is happening with that? (What are the time scales on which co2 and T (in ice?) are correlated.)
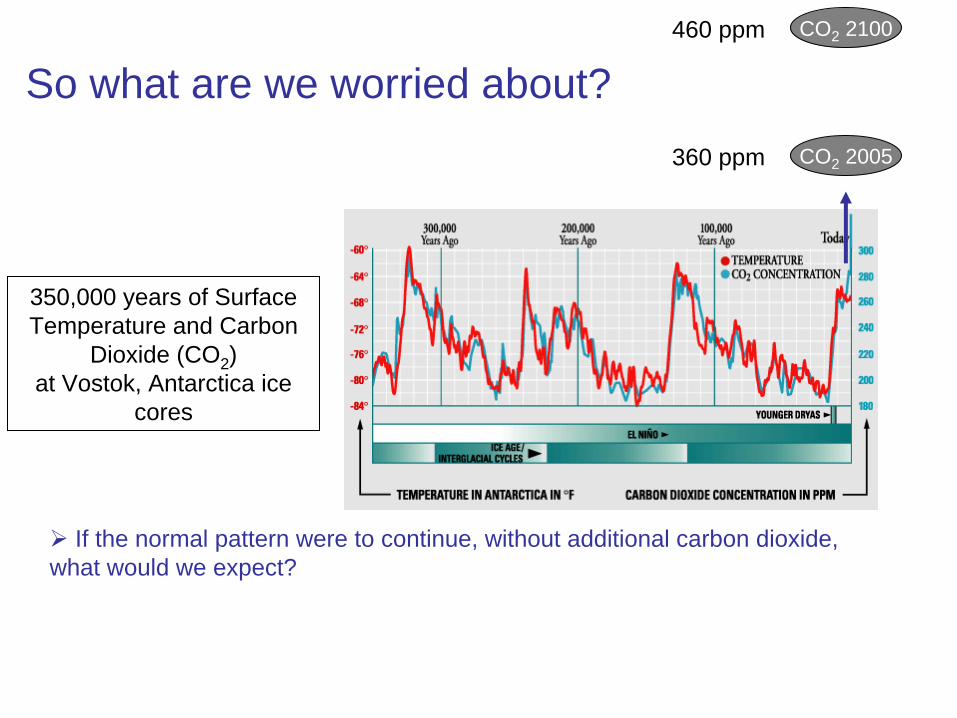
So what are we worried about?
350,000 years of Surface Temperature and Carbon
Dioxide (CO2 ) at Vostok, Antarctica ice
cores
If the normal pattern were to continue, without additional carbon dioxide, what would we expect?
CO2 2005
CO2 2100
360 ppm
460 ppm

Global cooling?
Why do we think that our predictions today are more robust than these predictions from the 1970s?
Let’s look at just the last 1000 years
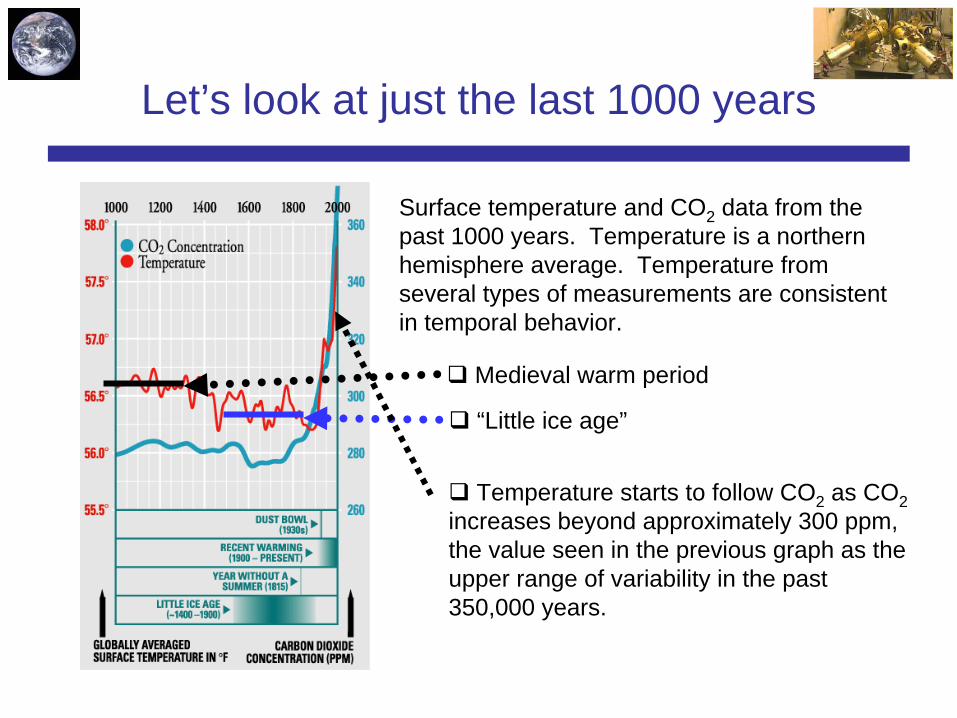
Surface temperature and CO2 data from the past 1000 years. Temperature is a northern hemisphere average. Temperature from several types of measurements are consistent in temporal behavior.
Medieval warm period
“Little ice age”
Temperature starts to follow CO2 as CO2increases beyond approximately 300 ppm, the value seen in the previous graph as the upper range of variability in the past 350,000 years.
Let’s look at just the last 1000 years
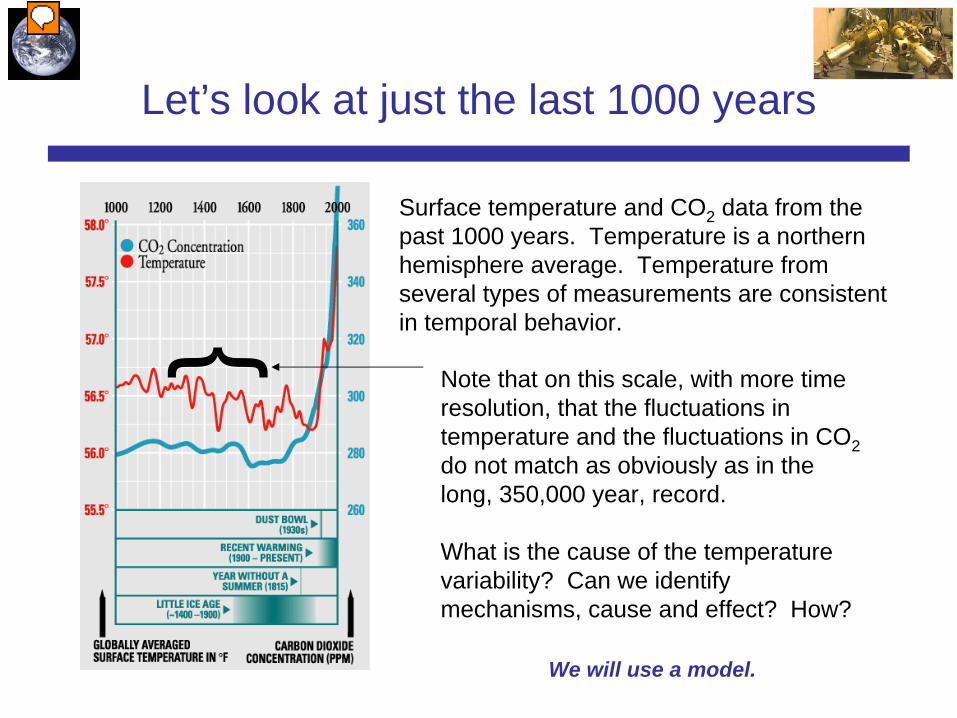
Surface temperature and CO2 data from the past 1000 years. Temperature is a northern hemisphere average. Temperature from several types of measurements are consistent in temporal behavior.
Note that on this scale, with more time resolution, that the fluctuations in temperature and the fluctuations in CO2 do not match as obviously as in the long, 350,000 year, record.
What is the cause of the temperature variability? Can we identify mechanisms, cause and effect? How?
We will use a model.
Presenter
Presentation Notes
This is an important point in the ultimate argument, on short time scales co2 and T are not so well correlated. T responds to other factors. These factors will be evaluated based on modeling experiments, which follow from (imperfect) observations of cause and effect as determined by observable events, e.g. volcanos.

STOP HERE

What do we know from model experiments and evaluation (validation) with observations
• With consideration of solar variability and volcanic activity, the variability in the temperature record prior to 1800 can be approximated.
• After 1800 need to consider the impact of man– Deforestation of North America– Fossil fuel emission– Change from coal to oil economy– Clean air act?
• Only with consideration of CO2 , increase in the greenhouse effect, can the temperature increase of the last 100 years be modeled.
We will revisit this in more detail after we learn about models.
Consideration of the past record
• Recorded human history has taken place in a period of relatively warm climate.
• Since the last ice age there have been warm and cold periods where the global average temperature varies by approximately 0.5 degrees F.
• These changes have been accompanied by discernable impact on human activities.
• In the past 100 years we have seen an increase of #### degrees.– Do you feel that there has been impact on humans?
• In the next 100 years we expect to see ~ 3.0 – 10.0 rise in global average temperature.
• It is reasonable to expect impact on human activities.

Behavior o
f water; P
hase change
Differences for the Future (100-200 years)~100 ppm CO2 (Already)
> 200-300 ppm CO2 certain~ 8-20 C polar T difference~ 2-6 C global average T difference
New Regimes of Climate Behavior?
ICE AGE~200 ppm
CURRENT(360 ppm)
NEW AGE?~500 ppm
Differences from Past (20,000 years)~100 ppm CO2~ 20 C polar T difference~ 5 C global average T difference
Time gradient of CO2 changes, 2 orders of magnitude (100 times) larger.
Class News
• There is a ctools site (AOSS 480 001 W07)– Lectures have all been added
• No class next week: Jan. 16 and Jan. 18 (I am out of town)– Would like to make up these lectures– January 18 … UM Workshop on Energy
• http://www.mmpei.umich.edu/workshop.html• Some climate stuff
– U o’ M Museum of Natural History. Climate Change exhibit opens on January 19, 2007
• Reception 5-7 PM– The Bar Scene: Tap Room, Ann Arbor Brewing Company,
January 24, 2007 • Perry Samson and I will have some sort of climate event
Related Documents