Climate change impacts on extreme precipitation in Morocco Yves Tramblay a, ⁎, Wafae Badi b , Fatima Driouech b , Salaheddine El Adlouni c, d , Luc Neppel a , Eric Servat a a Hydrosciences Montpellier, UMR 5569 (CNRS-IRD-UM1-UM2), Université Montpellier 2, Maison des Sciences de l'Eau, place Eugène Bataillon, 34095 Montpellier Cedex 5, France b Direction de la Météorologie Nationale, Centre National de Recherche Météorologiques, B.P. 8106 Casa-Oasis, Casablanca, Maroc c Université de Moncton, Département de Mathématique et de Statistique NB, Canada E1A 3E9 d Institut National de Statistique et d'Économie Appliquée, INSEA, Rabat-Maroc, Maroc abstract article info Article history: Received 23 September 2011 Accepted 20 December 2011 Available online 27 December 2011 Keywords: climate change RCM extreme events GEV non-stationary models Morocco is a North African country highly vulnerable to extreme precipitation events. In the present study, past trends in extreme precipitation and future projections using an ensemble of regional climate models (RCM) are evaluated. The extreme precipitation distributions during the extended winter season (October to April) in 10 stations are fitted with Generalized Extreme Value models (GEV). The dependence of the GEV parameters with time, winter North Atlantic Oscillation (NAO) and Mediterranean Oscillation (MO) in- dexes have been tested. Results indicate no significant trends in extreme precipitation during the observation period 1961–2007. However, dependences between precipitation extremes and NAO or MO indexes are detected, in particular for the Atlantic stations. Then 15 RCM simulations provided by the ENSEMBLES Euro- pean project ran with the A1B scenario are considered to provide future projections. The Cramér–von Mises (CM) statistic is introduced as a measure of adequacy between the observed extreme precipitation distribu- tions at the different stations and the distributions simulated by the RCMs. The CM statistic can thus provide weights to build a multi-model ensemble of future projections based on model performance in the present climate. Even if some models exhibit good skills, there is a great variability in the RCM performances to repro- duce the seasonal cycle and the extreme precipitation distributions at the different stations. The projected changes on extreme precipitation at the stations are evaluated with quantiles computed for different return periods, ranging from 2 to 40 years, during the control period 1961–2007 and two projection periods, 2020–2050 and 2070–2099. The climate change scaling factors on extreme quantiles provided by the differ- ent RCMs are averaged with equal weights, or with weights obtained from the inverse of the CM statistic. The climate change signal in the RCM simulations indicate a decrease in extreme precipitation quantiles, −12% in average for the projection period 2070–2099 but a great variability and lower convergence between models is found for the projection period 2020–2050. Overall, there is a good model convergence towards a decrease for the Atlantic stations. For the Mediterranean stations, the projected changes are difficult to assess due to the great variability. The two weighting schemes tested for model outputs provide similar results. © 2011 Elsevier B.V. All rights reserved. 1. Introduction Climate change is likely to produce more extreme precipitation events (Allan and Soden, 2008). For the Mediterranean basin, several studies indicate a possible amplification of precipitation extremes as- sociated with a decrease of precipitation totals (Gao et al., 2006; Giorgi and Lionello, 2008). This could lead to an increased probability of occurrence of events inducing both floods and droughts (Gao et al., 2006). Morocco is a North-African country where the vulnerability of the populations to extreme hydrological events is high (Douglas et al., 2008; Di Baldassarre et al., 2010). The floods and flash-floods in Morocco are mostly generated by torrential rainfalls (Driouech et al., 2009; Bouaicha and Benabdelfadel, 2010). Several events causing human losses and economic damages have been reported in the recent years, in 1995 (Ourika valley), 2002 (Mohammadia, El Jadida, Taza, Tétouan, Settat, Berrechid) or 2009 (Rabat, Tanger, Nador, Casablanca, Khenifra, Tétouan, Agadir, Essaouira) and the vulnerability of the major Moroccan cities to extreme precipitation and floods increased in the last two de- cades (Bouaicha and Benabdelfadel, 2010). With the different climate model projections available, it becomes possible to provide multi- model evaluations of the climate change impacts on extreme precipita- tion in Morocco. In the present study the impact assessment is based on future projections from climate models and historical trends of extreme precipitation. Previous research on precipitation in Morocco has mainly focused on the inter-annual variability and the relationships with large-scale circulation such as the North Atlantic Oscillation (NAO) index, to make future projections for water resource related problems (El Hamly and Sebbari, 1998; Ward et al., 1999; Knippertz et al., 2003; Bouaicha and Benabdelfadel, 2010; Driouech et al., 2010b). A few Global and Planetary Change 82-83 (2012) 104–114 ⁎ Corresponding author. E-mail address: [email protected] (Y. Tramblay). 0921-8181/$ – see front matter © 2011 Elsevier B.V. All rights reserved. doi:10.1016/j.gloplacha.2011.12.002 Contents lists available at SciVerse ScienceDirect Global and Planetary Change journal homepage: www.elsevier.com/locate/gloplacha

Welcome message from author
This document is posted to help you gain knowledge. Please leave a comment to let me know what you think about it! Share it to your friends and learn new things together.
Transcript
Global and Planetary Change 82-83 (2012) 104–114
Contents lists available at SciVerse ScienceDirect
Global and Planetary Change
j ourna l homepage: www.e lsev ie r .com/ locate /g lop lacha
Climate change impacts on extreme precipitation in Morocco
Yves Tramblay a,⁎, Wafae Badi b, Fatima Driouech b, Salaheddine El Adlouni c,d, Luc Neppel a, Eric Servat a
a Hydrosciences Montpellier, UMR 5569 (CNRS-IRD-UM1-UM2), Université Montpellier 2, Maison des Sciences de l'Eau, place Eugène Bataillon, 34095 Montpellier Cedex 5, Franceb Direction de la Météorologie Nationale, Centre National de Recherche Météorologiques, B.P. 8106 Casa-Oasis, Casablanca, Marocc Université de Moncton, Département de Mathématique et de Statistique NB, Canada E1A 3E9d Institut National de Statistique et d'Économie Appliquée, INSEA, Rabat-Maroc, Maroc
⁎ Corresponding author.E-mail address: [email protected] (Y. Tramblay
0921-8181/$ – see front matter © 2011 Elsevier B.V. Alldoi:10.1016/j.gloplacha.2011.12.002
a b s t r a c t
a r t i c l e i n f oArticle history:Received 23 September 2011Accepted 20 December 2011Available online 27 December 2011
Keywords:climate changeRCMextreme eventsGEVnon-stationary models
Morocco is a North African country highly vulnerable to extreme precipitation events. In the present study,past trends in extreme precipitation and future projections using an ensemble of regional climate models(RCM) are evaluated. The extreme precipitation distributions during the extended winter season (Octoberto April) in 10 stations are fitted with Generalized Extreme Value models (GEV). The dependence of theGEV parameters with time, winter North Atlantic Oscillation (NAO) and Mediterranean Oscillation (MO) in-dexes have been tested. Results indicate no significant trends in extreme precipitation during the observationperiod 1961–2007. However, dependences between precipitation extremes and NAO or MO indexes aredetected, in particular for the Atlantic stations. Then 15 RCM simulations provided by the ENSEMBLES Euro-pean project ran with the A1B scenario are considered to provide future projections. The Cramér–von Mises(CM) statistic is introduced as a measure of adequacy between the observed extreme precipitation distribu-tions at the different stations and the distributions simulated by the RCMs. The CM statistic can thus provideweights to build a multi-model ensemble of future projections based on model performance in the presentclimate. Even if somemodels exhibit good skills, there is a great variability in the RCM performances to repro-duce the seasonal cycle and the extreme precipitation distributions at the different stations. The projectedchanges on extreme precipitation at the stations are evaluated with quantiles computed for different returnperiods, ranging from 2 to 40 years, during the control period 1961–2007 and two projection periods,2020–2050 and 2070–2099. The climate change scaling factors on extreme quantiles provided by the differ-ent RCMs are averaged with equal weights, or with weights obtained from the inverse of the CM statistic. Theclimate change signal in the RCM simulations indicate a decrease in extreme precipitation quantiles,−12% inaverage for the projection period 2070–2099 but a great variability and lower convergence between modelsis found for the projection period 2020–2050. Overall, there is a good model convergence towards a decreasefor the Atlantic stations. For the Mediterranean stations, the projected changes are difficult to assess due tothe great variability. The two weighting schemes tested for model outputs provide similar results.
© 2011 Elsevier B.V. All rights reserved.
1. Introduction
Climate change is likely to produce more extreme precipitationevents (Allan and Soden, 2008). For the Mediterranean basin, severalstudies indicate a possible amplification of precipitation extremes as-sociated with a decrease of precipitation totals (Gao et al., 2006;Giorgi and Lionello, 2008). This could lead to an increased probabilityof occurrence of events inducing both floods and droughts (Gao et al.,2006). Morocco is a North-African country where the vulnerability ofthe populations to extreme hydrological events is high (Douglas et al.,2008; Di Baldassarre et al., 2010). The floods and flash-floods inMoroccoare mostly generated by torrential rainfalls (Driouech et al., 2009;Bouaicha and Benabdelfadel, 2010). Several events causing human losses
).
rights reserved.
and economic damages have been reported in the recent years, in 1995(Ourika valley), 2002 (Mohammadia, El Jadida, Taza, Tétouan, Settat,Berrechid) or 2009 (Rabat, Tanger, Nador, Casablanca, Khenifra,Tétouan, Agadir, Essaouira) and the vulnerability of themajorMoroccancities to extreme precipitation and floods increased in the last two de-cades (Bouaicha and Benabdelfadel, 2010). With the different climatemodel projections available, it becomes possible to provide multi-model evaluations of the climate change impacts on extreme precipita-tion inMorocco. In the present study the impact assessment is based onfuture projections from climatemodels and historical trends of extremeprecipitation.
Previous research on precipitation in Morocco has mainly focusedon the inter-annual variability and the relationships with large-scalecirculation such as the North Atlantic Oscillation (NAO) index, tomake future projections for water resource related problems (ElHamly and Sebbari, 1998; Ward et al., 1999; Knippertz et al., 2003;Bouaicha and Benabdelfadel, 2010; Driouech et al., 2010b). A few
105Y. Tramblay et al. / Global and Planetary Change 82-83 (2012) 104–114
studies considered climatemodel simulations to provide future scenar-ios for Morocco. Knippertz et al. (2003) using a 240 year experimentwith the ECHAM4/OPYC3 (IS92a scenario) general circulation model(GCM) found for the Atlantic and Mediterranean regions a global de-crease in precipitation totals. However, they observed a bad representa-tion of the influence of mountainous areas in the GCM. Together withHuebener and Kerschgens (2007a), they recommended the use ofdownscaling approaches to better reproduce the climate of the centerand southern parts of Morroco, highly influenced by orography.Driouech et al. (2009) have shown the ability of the variable resolutionARPEGE climatemodel at a 50 kmresolution to reproduce heavy rainfalland long dry periods in the center of Morocco. Born et al. (2008a,2008b) with the simulations provided by the REMO regional climatemodel (RCM) driven by ECHAM5 (A1B scenario) found a reduction ofwet periods and precipitation intensity for 2030–2050. Similarly,Driouech et al. (2010a) using a set of different RCMs observed for2021–2050 under the A1B scenario a decrease in precipitation totalsand high percentiles for several stations in Morocco. On the contrary,Huebener and Kerschgens (2007b) found for 2060–2089 an increasein precipitation for the southern parts of Morocco, using a downscalingapproach based on weather types with the outputs of the ECHAM4/OPYC3 (IS92a scenario) and ECHAM5/MPI-OM1 (A1B scenario)models.Driouech et al. (2010a) evaluated with a set of RCMs the statisticaldownscaling stationarity hypothesis with weather regimes to deducelocal precipitation in Morocco. They found for several models that thestationarity hypothesis was not always validated; probably because ofthe complex local pressure–precipitation link in Moroccan climate.Therefore they recommended the use of other statistical downscalingapproaches or dynamical downscaling, which does not rely on the sta-tionarity assumption.
Dynamical downscaling refers to the use of RCMs or limited-areamodels (Fowler et al., 2007b). These use large-scale and lateral boundaryconditions from GCMs to produce higher resolution outputs at 50 kmresolution or less. They are able to realistically simulate regional climatefeatures such as orographic precipitation, while the topographic com-plexity is very poorly resolved at GCM resolution. They also reproducethe frequency and magnitude of extreme temperature and precipitationevents more accurately than the GCMs (Frei et al., 2006; Fowler et al.,2007a; Giorgi and Lionello, 2008). However, as for all downscalingapproaches, the RCM skill depends strongly on biases inherited fromthe driving GCM (Fowler et al., 2007a). Several studies have shownthe ability of RCMs to reproduce extreme precipitation and producedfuture projections based on their outputs (Sánchez et al., 2004; Frei, etal., 2006; Fowler et al., 2007a; Kyselý and Beranová, 2009; Fowler andEkström, 2009; Hertig et al., accepted for publication). However,Herrera et al. (2010) or Quintana-Segui et al. (2011) reported theneed to evaluate the performance of the models and to correct theiroutputs if necessary. Different RCMs are likely to provide differentresults for a given region due to their different boundary conditionsand different model formulations. Therefore to cover the range of uncer-tainties most studies recommend the use of multiple model ensembles.
Combining models generally increases the skill, reliability andconsistency of model projections (Frei et al., 2006; Fowler et al.,2007b; Tebaldi and Knutti, 2007; Déqué et al., 2011). There are differ-ent ways to combine climate model projections such as Bayesianmethods (Tebaldi and Knutti, 2007), averages or weighted averages,where weights are determined by the relationship between modelsand observations (Fowler and Ekström, 2009; Déqué and Somot,2010). Most often, weights are derived from a statistic based on themean square difference between observed and modeled climate vari-ables, as for example the Brier or Ranked Probability scores (Déquéand Somot, 2010) or the metric proposed by Perkins et al. (2007).To evaluate bothmodels' efficiency in reproducing the observed variableof interest and the convergence of the projections Giorgi and Mearns(2003) developed the Reliability Ensemble Averaging approach (REA).However, no consensus exists on the best weighting scheme and
additional research is still needed on that topic (Knutti et al.,2010). Various weighting approaches have been tested and severalstudies concluded that the selection of metrics is a rather subjectivechoice and weighted or unweighted ensemble averages providedequivalent results (Christensen et al., 2010; Déqué and Somot,2010). Past performance is not necessarily a guarantee of futureskill (Reifen and Toumi, 2009) and the convergence criterion be-tween the models has raised several concerns since the futurechanges are, by essence, not known.
The goal of this study is to analyze the climate change effects onextreme daily precipitation in Morocco. The past trends observed indifferent stations in Morocco are first evaluated, and then future pro-jections are made using an ensemble of different RCM simulations.The evaluation of RCM models for extreme precipitation has neverbeen done in North Africa. Since no gridded dataset with the resolu-tion of the RCMs, such as the E-OBS for Europe (Haylock et al.,2008), is available for the study area, the comparison is made withthe distribution observed in the different stations. Extreme valuemodels (Coles, 2001) are fitted to the observed extreme precipitationdistributions and to the distributions simulated by the RCMs in thedifferent stations. The future changes are assessed by comparing thequantiles computed from the observation period and during two pro-jection periods. Scaling factors for extreme precipitation of differentreturn periods are computed from a multi-model ensemble of differ-ent RCM simulations. The multi-model ensemble consists in averag-ing scaling factors obtained from individual models with equalweights or with weights based on the RCM models' performance inreproducing the observed distributions at the different stations. Theoutline of the paper is as follows. In Section 2, we give a descriptionof the study area with the station and model data. In Section 3, themethodology used to evaluate the extremes in observed data and cli-mate simulations is presented. The results in terms of observed trendsand variability, ability of the climate models to reproduce the extremeevent distribution and the climate change impact simulated by themodels are presented in Section 4.
2. Study area and datasets
Morocco is located at the southern edge of the mid-latitude stormtrack with a semi-arid climate similar to that of south-western Europe(Spain and Portugal), especially in the winter season (Driouech et al.,2009). The climate is influenced by the Atlantic Ocean, the Mediterra-nean Sea and the Sahara, together with very steep orography in theAtlas region (Knippertz et al., 2003). Rainfall in Morocco is dominatedby three main factors; winter cyclonic depressions, topography andconvection. The precipitation, in general, decreases from north tosouth and from west to east (Shahin, 2007). Several studies have iden-tified strong links with inter-annual precipitation variability and theNAO index (El Hamly and Sebbari, 1998; Knippertz et al., 2003). There-fore, both local and large-scale factors have an impact on precipitationwhich exhibits a marked seasonality with almost no precipitation inthe summer months (May to September). During the extended winterseason fromOctober to April, most precipitation is generated as a resultof low pressure weather systems being steered southward during mid-latitude blocking episodes (Ward et al., 1999; Driouech et al., 2009). Inspring, the strengthening of the meridional temperature gradient alongthe northern African coast favors the development of Saharian depres-sions, which tends to occur on the lee side of the Atlas Mountains(Lionello et al., 2006). Torrential rainfall is the main cause of the violentfloods that affect the northern part of the country (Bouaicha andBenabdelfadel, 2010).
2.1. Stations and climatic data
Precipitation data for 11 stations located in northern Morocco isused (Table 1). They are located in the Atlantic coast for the stations
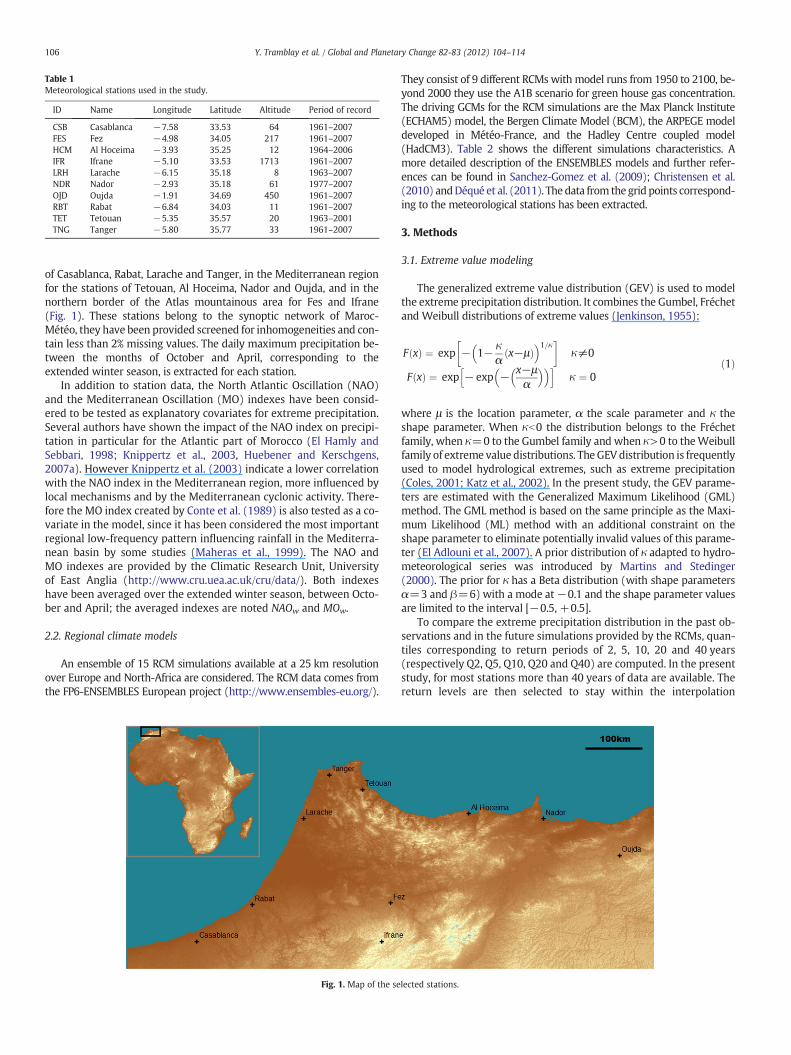
Table 1Meteorological stations used in the study.
ID Name Longitude Latitude Altitude Period of record
CSB Casablanca −7.58 33.53 64 1961–2007FES Fez −4.98 34.05 217 1961–2007HCM Al Hoceima −3.93 35.25 12 1964–2006IFR Ifrane −5.10 33.53 1713 1961–2007LRH Larache −6.15 35.18 8 1963–2007NDR Nador −2.93 35.18 61 1977–2007OJD Oujda −1.91 34.69 450 1961–2007RBT Rabat −6.84 34.03 11 1961–2007TET Tetouan −5.35 35.57 20 1963–2001TNG Tanger −5.80 35.77 33 1961–2007
106 Y. Tramblay et al. / Global and Planetary Change 82-83 (2012) 104–114
of Casablanca, Rabat, Larache and Tanger, in the Mediterranean regionfor the stations of Tetouan, Al Hoceima, Nador and Oujda, and in thenorthern border of the Atlas mountainous area for Fes and Ifrane(Fig. 1). These stations belong to the synoptic network of Maroc-Météo, they have been provided screened for inhomogeneities and con-tain less than 2% missing values. The daily maximum precipitation be-tween the months of October and April, corresponding to theextended winter season, is extracted for each station.
In addition to station data, the North Atlantic Oscillation (NAO)and the Mediterranean Oscillation (MO) indexes have been consid-ered to be tested as explanatory covariates for extreme precipitation.Several authors have shown the impact of the NAO index on precipi-tation in particular for the Atlantic part of Morocco (El Hamly andSebbari, 1998; Knippertz et al., 2003, Huebener and Kerschgens,2007a). However Knippertz et al. (2003) indicate a lower correlationwith the NAO index in the Mediterranean region, more influenced bylocal mechanisms and by the Mediterranean cyclonic activity. There-fore the MO index created by Conte et al. (1989) is also tested as a co-variate in the model, since it has been considered the most importantregional low-frequency pattern influencing rainfall in the Mediterra-nean basin by some studies (Maheras et al., 1999). The NAO andMO indexes are provided by the Climatic Research Unit, Universityof East Anglia (http://www.cru.uea.ac.uk/cru/data/). Both indexeshave been averaged over the extended winter season, between Octo-ber and April; the averaged indexes are noted NAOw and MOw.
2.2. Regional climate models
An ensemble of 15 RCM simulations available at a 25 km resolutionover Europe and North-Africa are considered. The RCM data comes fromthe FP6-ENSEMBLES European project (http://www.ensembles-eu.org/).
Fig. 1. Map of the se
They consist of 9 different RCMs with model runs from 1950 to 2100, be-yond 2000 they use the A1B scenario for green house gas concentration.The driving GCMs for the RCM simulations are the Max Planck Institute(ECHAM5) model, the Bergen Climate Model (BCM), the ARPEGE modeldeveloped in Météo-France, and the Hadley Centre coupled model(HadCM3). Table 2 shows the different simulations characteristics. Amore detailed description of the ENSEMBLES models and further refer-ences can be found in Sanchez-Gomez et al. (2009); Christensen et al.(2010) andDéqué et al. (2011). The data from the grid points correspond-ing to the meteorological stations has been extracted.
3. Methods
3.1. Extreme value modeling
The generalized extreme value distribution (GEV) is used to modelthe extreme precipitation distribution. It combines the Gumbel, Fréchetand Weibull distributions of extreme values (Jenkinson, 1955):
F xð Þ ¼ exp − 1− κα
x−μð Þ� �1=κ
� �κ≠0
F xð Þ ¼ exp − exp − x−μα
� �� �h iκ ¼ 0
ð1Þ
where μ is the location parameter, α the scale parameter and κ theshape parameter. When κb0 the distribution belongs to the Fréchetfamily, when κ=0 to the Gumbel family and when κ>0 to theWeibullfamily of extreme value distributions. The GEV distribution is frequentlyused to model hydrological extremes, such as extreme precipitation(Coles, 2001; Katz et al., 2002). In the present study, the GEV parame-ters are estimated with the Generalized Maximum Likelihood (GML)method. The GML method is based on the same principle as the Maxi-mum Likelihood (ML) method with an additional constraint on theshape parameter to eliminate potentially invalid values of this parame-ter (El Adlouni et al., 2007). A prior distribution of κ adapted to hydro-meteorological series was introduced by Martins and Stedinger(2000). The prior for κ has a Beta distribution (with shape parametersα=3 and β=6) with a mode at−0.1 and the shape parameter valuesare limited to the interval [−0.5, +0.5].
To compare the extreme precipitation distribution in the past ob-servations and in the future simulations provided by the RCMs, quan-tiles corresponding to return periods of 2, 5, 10, 20 and 40 years(respectively Q2, Q5, Q10, Q20 and Q40) are computed. In the presentstudy, for most stations more than 40 years of data are available. Thereturn levels are then selected to stay within the interpolation
lected stations.
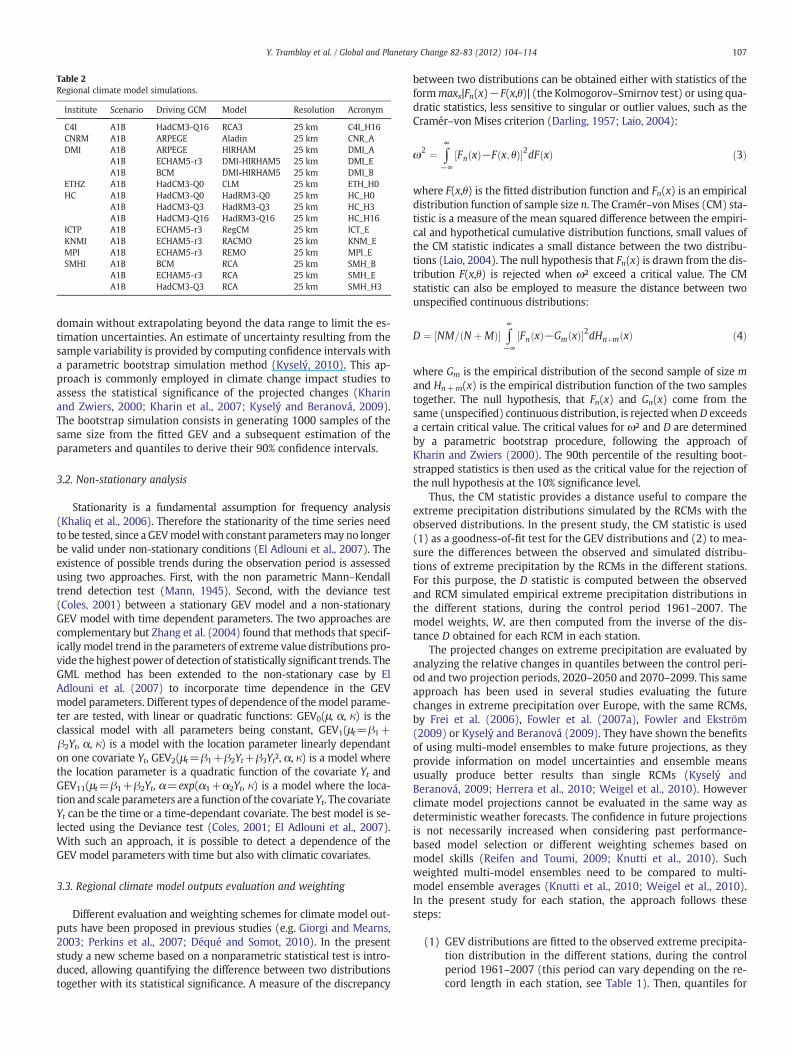
Table 2Regional climate model simulations.
Institute Scenario Driving GCM Model Resolution Acronym
C4I A1B HadCM3-Q16 RCA3 25 km C4I_H16CNRM A1B ARPEGE Aladin 25 km CNR_ADMI A1B ARPEGE HIRHAM 25 km DMI_A
A1B ECHAM5-r3 DMI-HIRHAM5 25 km DMI_EA1B BCM DMI-HIRHAM5 25 km DMI_B
ETHZ A1B HadCM3-Q0 CLM 25 km ETH_H0HC A1B HadCM3-Q0 HadRM3-Q0 25 km HC_H0
A1B HadCM3-Q3 HadRM3-Q3 25 km HC_H3A1B HadCM3-Q16 HadRM3-Q16 25 km HC_H16
ICTP A1B ECHAM5-r3 RegCM 25 km ICT_EKNMI A1B ECHAM5-r3 RACMO 25 km KNM_EMPI A1B ECHAM5-r3 REMO 25 km MPI_ESMHI A1B BCM RCA 25 km SMH_B
A1B ECHAM5-r3 RCA 25 km SMH_EA1B HadCM3-Q3 RCA 25 km SMH_H3
107Y. Tramblay et al. / Global and Planetary Change 82-83 (2012) 104–114
domain without extrapolating beyond the data range to limit the es-timation uncertainties. An estimate of uncertainty resulting from thesample variability is provided by computing confidence intervals witha parametric bootstrap simulation method (Kyselý, 2010). This ap-proach is commonly employed in climate change impact studies toassess the statistical significance of the projected changes (Kharinand Zwiers, 2000; Kharin et al., 2007; Kyselý and Beranová, 2009).The bootstrap simulation consists in generating 1000 samples of thesame size from the fitted GEV and a subsequent estimation of theparameters and quantiles to derive their 90% confidence intervals.
3.2. Non-stationary analysis
Stationarity is a fundamental assumption for frequency analysis(Khaliq et al., 2006). Therefore the stationarity of the time series needto be tested, since a GEVmodelwith constant parametersmay no longerbe valid under non-stationary conditions (El Adlouni et al., 2007). Theexistence of possible trends during the observation period is assessedusing two approaches. First, with the non parametric Mann–Kendalltrend detection test (Mann, 1945). Second, with the deviance test(Coles, 2001) between a stationary GEV model and a non-stationaryGEV model with time dependent parameters. The two approaches arecomplementary but Zhang et al. (2004) found that methods that specif-ically model trend in the parameters of extreme value distributions pro-vide the highest power of detection of statistically significant trends. TheGML method has been extended to the non-stationary case by ElAdlouni et al. (2007) to incorporate time dependence in the GEVmodel parameters. Different types of dependence of the model parame-ter are tested, with linear or quadratic functions: GEV0(μ, α, κ) is theclassical model with all parameters being constant, GEV1(μt=β1+β2Yt, α, κ) is a model with the location parameter linearly dependanton one covariate Yt, GEV2(μt=β1+β2Yt+β3Yt², α, κ) is a model wherethe location parameter is a quadratic function of the covariate Yt andGEV11(μt=β1+β2Yt, α=exp(α1+α2Yt, κ) is a model where the loca-tion and scale parameters are a function of the covariate Yt. The covariateYt can be the time or a time-dependant covariate. The best model is se-lected using the Deviance test (Coles, 2001; El Adlouni et al., 2007).With such an approach, it is possible to detect a dependence of theGEV model parameters with time but also with climatic covariates.
3.3. Regional climate model outputs evaluation and weighting
Different evaluation and weighting schemes for climate model out-puts have been proposed in previous studies (e.g. Giorgi and Mearns,2003; Perkins et al., 2007; Déqué and Somot, 2010). In the presentstudy a new scheme based on a nonparametric statistical test is intro-duced, allowing quantifying the difference between two distributionstogether with its statistical significance. A measure of the discrepancy
between two distributions can be obtained either with statistics of theformmaxx|Fn(x)−F(x,θ)| (the Kolmogorov–Smirnov test) or using qua-dratic statistics, less sensitive to singular or outlier values, such as theCramér–von Mises criterion (Darling, 1957; Laio, 2004):
ω2 ¼ ∫∞
−∞Fn xð Þ−F x; θð Þ½ �2dF xð Þ ð3Þ
where F(x,θ) is the fitted distribution function and Fn(x) is an empiricaldistribution function of sample size n. The Cramér–vonMises (CM) sta-tistic is a measure of the mean squared difference between the empiri-cal and hypothetical cumulative distribution functions, small values ofthe CM statistic indicates a small distance between the two distribu-tions (Laio, 2004). The null hypothesis that Fn(x) is drawn from the dis-tribution F(x,θ) is rejected when ω² exceed a critical value. The CMstatistic can also be employed to measure the distance between twounspecified continuous distributions:
D ¼ NM= N þMð Þ½ � ∫∞
−∞Fn xð Þ−Gm xð Þ½ �2dHnþm xð Þ ð4Þ
where Gm is the empirical distribution of the second sample of size mand Hn+m(x) is the empirical distribution function of the two samplestogether. The null hypothesis, that Fn(x) and Gn(x) come from thesame (unspecified) continuous distribution, is rejected when D exceedsa certain critical value. The critical values for ω² and D are determinedby a parametric bootstrap procedure, following the approach ofKharin and Zwiers (2000). The 90th percentile of the resulting boot-strapped statistics is then used as the critical value for the rejection ofthe null hypothesis at the 10% significance level.
Thus, the CM statistic provides a distance useful to compare theextreme precipitation distributions simulated by the RCMs with theobserved distributions. In the present study, the CM statistic is used(1) as a goodness-of-fit test for the GEV distributions and (2) to mea-sure the differences between the observed and simulated distribu-tions of extreme precipitation by the RCMs in the different stations.For this purpose, the D statistic is computed between the observedand RCM simulated empirical extreme precipitation distributions inthe different stations, during the control period 1961–2007. Themodel weights, W, are then computed from the inverse of the dis-tance D obtained for each RCM in each station.
The projected changes on extreme precipitation are evaluated byanalyzing the relative changes in quantiles between the control peri-od and two projection periods, 2020–2050 and 2070–2099. This sameapproach has been used in several studies evaluating the futurechanges in extreme precipitation over Europe, with the same RCMs,by Frei et al. (2006), Fowler et al. (2007a), Fowler and Ekström(2009) or Kyselý and Beranová (2009). They have shown the benefitsof using multi-model ensembles to make future projections, as theyprovide information on model uncertainties and ensemble meansusually produce better results than single RCMs (Kyselý andBeranová, 2009; Herrera et al., 2010; Weigel et al., 2010). Howeverclimate model projections cannot be evaluated in the same way asdeterministic weather forecasts. The confidence in future projectionsis not necessarily increased when considering past performance-based model selection or different weighting schemes based onmodel skills (Reifen and Toumi, 2009; Knutti et al., 2010). Suchweighted multi-model ensembles need to be compared to multi-model ensemble averages (Knutti et al., 2010; Weigel et al., 2010).In the present study for each station, the approach follows thesesteps:
(1) GEV distributions are fitted to the observed extreme precipita-tion distribution in the different stations, during the controlperiod 1961–2007 (this period can vary depending on the re-cord length in each station, see Table 1). Then, quantiles for
108 Y. Tramblay et al. / Global and Planetary Change 82-83 (2012) 104–114
different return levels (t=2, 5, 10, 20 and 40 years) with their90% confidence intervals are computed.
(2) GEV distributions arefitted to the extremeprecipitation distribu-tions simulated by the different RCMs at the grid points corre-sponding to the stations, during the control period 1961–2007and two projection periods, 2020–2050 and 2070–2099. The 2,5, 10, 20 and 40 year quantiles are computed for each period.
(3) Scaling factors are computed by dividing the quantiles of theprojection periods (2020–2050 and 2070–2099) with thequantiles of the control period (1961–2007), obtained in step2. The scaling factors from all RCMs are then combined, eitherby an equal weights average or by a weighted average, usingthe weights W derived from the CM statistic.
(4) For a given return level t and projection period, the quantileobtained in step 1 with the observed data (Qtobs) is multipliedby the scaling factor (St) obtained in step 3, to obtain the pro-jected future quantile (Qtproj) (Eq. (5)). The significance of thechanges is assessed with the confidence intervals obtained instep 1.
Qtproj ¼ QtobsSt ð5Þ
4. Results
4.1. Frequency analysis of observed extreme winter precipitation
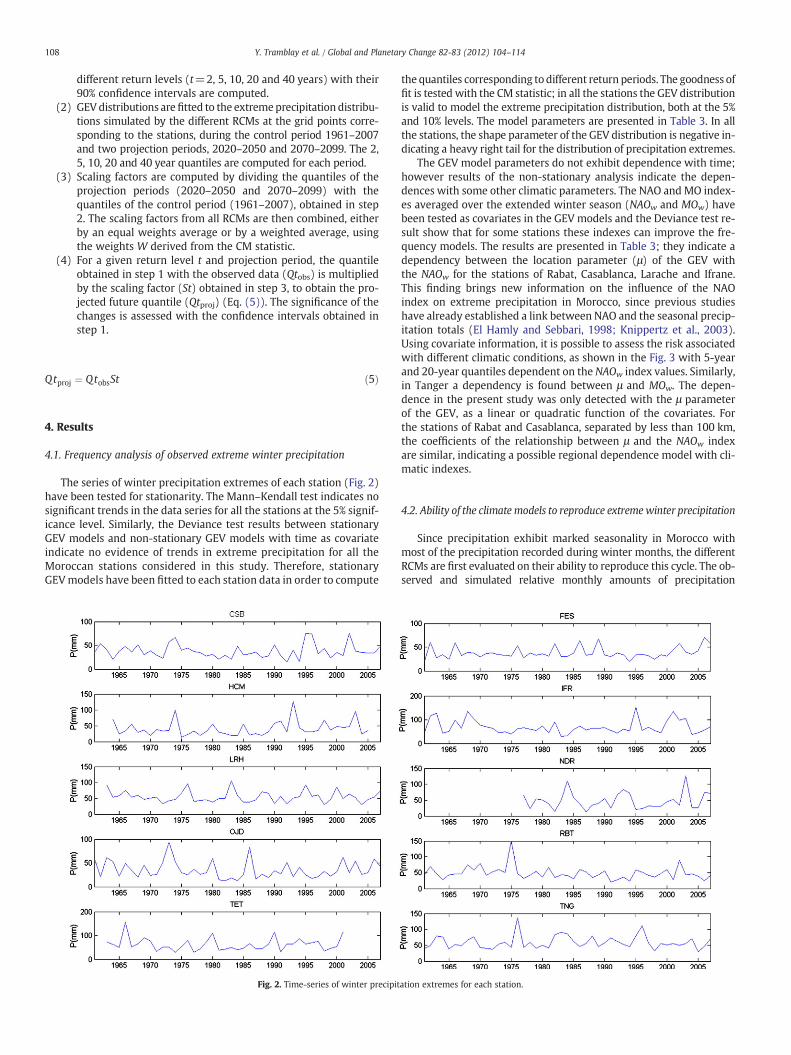
The series of winter precipitation extremes of each station (Fig. 2)have been tested for stationarity. The Mann–Kendall test indicates nosignificant trends in the data series for all the stations at the 5% signif-icance level. Similarly, the Deviance test results between stationaryGEV models and non-stationary GEV models with time as covariateindicate no evidence of trends in extreme precipitation for all theMoroccan stations considered in this study. Therefore, stationaryGEVmodels have been fitted to each station data in order to compute
Fig. 2. Time-series of winter precipit
the quantiles corresponding to different return periods. The goodness offit is tested with the CM statistic; in all the stations the GEV distributionis valid to model the extreme precipitation distribution, both at the 5%and 10% levels. The model parameters are presented in Table 3. In allthe stations, the shape parameter of the GEV distribution is negative in-dicating a heavy right tail for the distribution of precipitation extremes.
The GEV model parameters do not exhibit dependence with time;however results of the non-stationary analysis indicate the depen-dences with some other climatic parameters. The NAO andMO index-es averaged over the extended winter season (NAOw and MOw) havebeen tested as covariates in the GEV models and the Deviance test re-sult show that for some stations these indexes can improve the fre-quency models. The results are presented in Table 3; they indicate adependency between the location parameter (μ) of the GEV withthe NAOw for the stations of Rabat, Casablanca, Larache and Ifrane.This finding brings new information on the influence of the NAOindex on extreme precipitation in Morocco, since previous studieshave already established a link between NAO and the seasonal precip-itation totals (El Hamly and Sebbari, 1998; Knippertz et al., 2003).Using covariate information, it is possible to assess the risk associatedwith different climatic conditions, as shown in the Fig. 3 with 5-yearand 20-year quantiles dependent on the NAOw index values. Similarly,in Tanger a dependency is found between μ and MOw. The depen-dence in the present study was only detected with the μ parameterof the GEV, as a linear or quadratic function of the covariates. Forthe stations of Rabat and Casablanca, separated by less than 100 km,the coefficients of the relationship between μ and the NAOw indexare similar, indicating a possible regional dependence model with cli-matic indexes.
4.2. Ability of the climatemodels to reproduce extremewinter precipitation
Since precipitation exhibit marked seasonality in Morocco withmost of the precipitation recorded during winter months, the differentRCMs are first evaluated on their ability to reproduce this cycle. The ob-served and simulated relative monthly amounts of precipitation
ation extremes for each station.
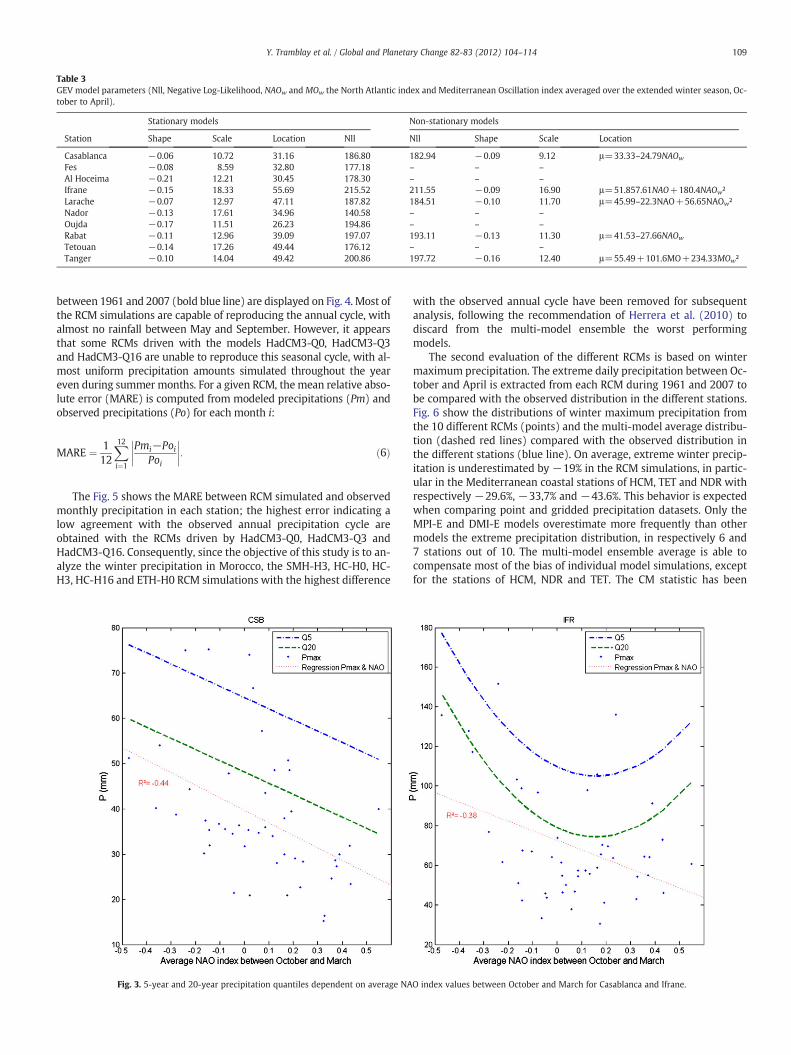
Table 3GEV model parameters (Nll, Negative Log-Likelihood, NAOw and MOw the North Atlantic index and Mediterranean Oscillation index averaged over the extended winter season, Oc-tober to April).
Stationary models Non-stationary models
Station Shape Scale Location Nll Nll Shape Scale Location
Casablanca −0.06 10.72 31.16 186.80 182.94 −0.09 9.12 μ=33.33–24.79NAOw
Fes −0.08 8.59 32.80 177.18 – – –
Al Hoceima −0.21 12.21 30.45 178.30 – – –
Ifrane −0.15 18.33 55.69 215.52 211.55 −0.09 16.90 μ=51.857.61NAO+180.4NAOw²Larache −0.07 12.97 47.11 187.82 184.51 −0.10 11.70 μ=45.99–22.3NAO+56.65NAOw²Nador −0.13 17.61 34.96 140.58 – – –
Oujda −0.17 11.51 26.23 194.86 – – –
Rabat −0.11 12.96 39.09 197.07 193.11 −0.13 11.30 μ=41.53–27.66NAOw
Tetouan −0.14 17.26 49.44 176.12 – – –
Tanger −0.10 14.04 49.42 200.86 197.72 −0.16 12.40 μ=55.49+101.6MO+234.33MOw²
109Y. Tramblay et al. / Global and Planetary Change 82-83 (2012) 104–114
between 1961 and 2007 (bold blue line) are displayed on Fig. 4. Most ofthe RCM simulations are capable of reproducing the annual cycle, withalmost no rainfall between May and September. However, it appearsthat some RCMs driven with the models HadCM3-Q0, HadCM3-Q3and HadCM3-Q16 are unable to reproduce this seasonal cycle, with al-most uniform precipitation amounts simulated throughout the yeareven during summer months. For a given RCM, the mean relative abso-lute error (MARE) is computed from modeled precipitations (Pm) andobserved precipitations (Po) for each month i:
MARE ¼ 112
X12i¼1
Pmi−PoiPoi
��������: ð6Þ
The Fig. 5 shows the MARE between RCM simulated and observedmonthly precipitation in each station; the highest error indicating alow agreement with the observed annual precipitation cycle areobtained with the RCMs driven by HadCM3-Q0, HadCM3-Q3 andHadCM3-Q16. Consequently, since the objective of this study is to an-alyze the winter precipitation in Morocco, the SMH-H3, HC-H0, HC-H3, HC-H16 and ETH-H0 RCM simulations with the highest difference
Fig. 3. 5-year and 20-year precipitation quantiles dependent on average NA
with the observed annual cycle have been removed for subsequentanalysis, following the recommendation of Herrera et al. (2010) todiscard from the multi-model ensemble the worst performingmodels.
The second evaluation of the different RCMs is based on wintermaximum precipitation. The extreme daily precipitation between Oc-tober and April is extracted from each RCM during 1961 and 2007 tobe compared with the observed distribution in the different stations.Fig. 6 show the distributions of winter maximum precipitation fromthe 10 different RCMs (points) and the multi-model average distribu-tion (dashed red lines) compared with the observed distribution inthe different stations (blue line). On average, extreme winter precip-itation is underestimated by −19% in the RCM simulations, in partic-ular in the Mediterranean coastal stations of HCM, TET and NDR withrespectively −29.6%, −33,7% and −43.6%. This behavior is expectedwhen comparing point and gridded precipitation datasets. Only theMPI-E and DMI-E models overestimate more frequently than othermodels the extreme precipitation distribution, in respectively 6 and7 stations out of 10. The multi-model ensemble average is able tocompensate most of the bias of individual model simulations, exceptfor the stations of HCM, NDR and TET. The CM statistic has been
O index values between October and March for Casablanca and Ifrane.
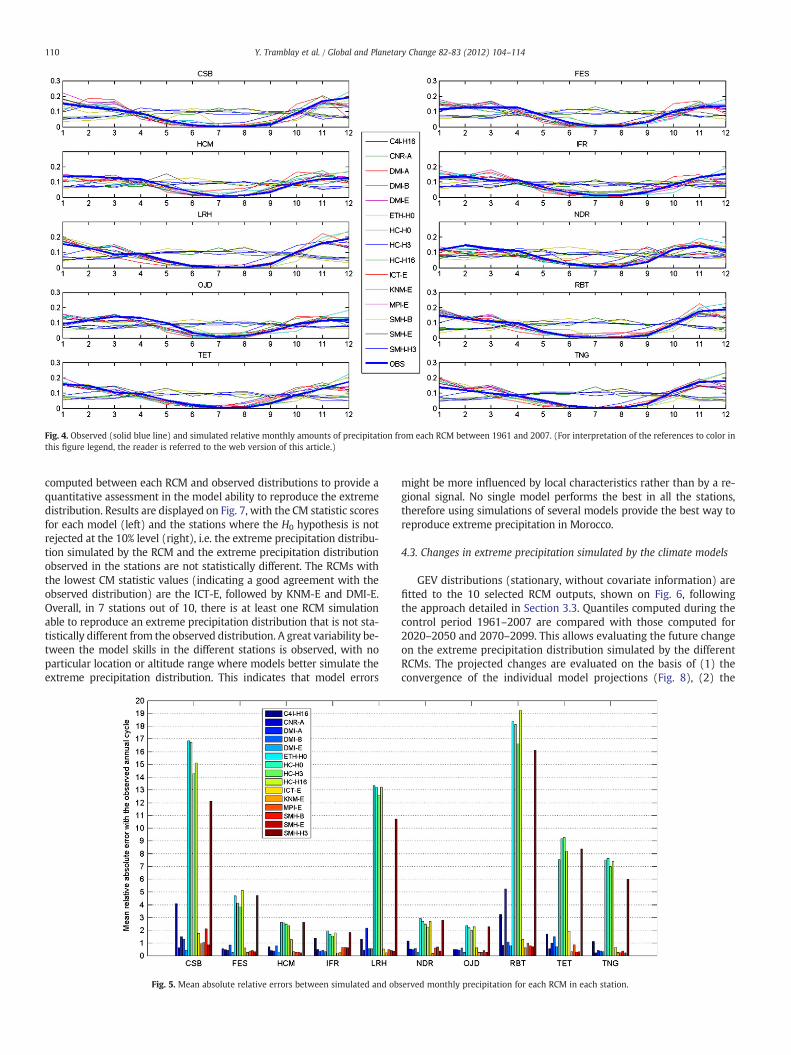
Fig. 4. Observed (solid blue line) and simulated relative monthly amounts of precipitation from each RCM between 1961 and 2007. (For interpretation of the references to color inthis figure legend, the reader is referred to the web version of this article.)
110 Y. Tramblay et al. / Global and Planetary Change 82-83 (2012) 104–114
computed between each RCM and observed distributions to provide aquantitative assessment in the model ability to reproduce the extremedistribution. Results are displayed on Fig. 7, with the CM statistic scoresfor each model (left) and the stations where the H0 hypothesis is notrejected at the 10% level (right), i.e. the extreme precipitation distribu-tion simulated by the RCM and the extreme precipitation distributionobserved in the stations are not statistically different. The RCMs withthe lowest CM statistic values (indicating a good agreement with theobserved distribution) are the ICT-E, followed by KNM-E and DMI-E.Overall, in 7 stations out of 10, there is at least one RCM simulationable to reproduce an extreme precipitation distribution that is not sta-tistically different from the observed distribution. A great variability be-tween the model skills in the different stations is observed, with noparticular location or altitude range where models better simulate theextreme precipitation distribution. This indicates that model errors
Fig. 5. Mean absolute relative errors between simulated and ob
might be more influenced by local characteristics rather than by a re-gional signal. No single model performs the best in all the stations,therefore using simulations of several models provide the best way toreproduce extreme precipitation in Morocco.
4.3. Changes in extreme precipitation simulated by the climate models
GEV distributions (stationary, without covariate information) arefitted to the 10 selected RCM outputs, shown on Fig. 6, followingthe approach detailed in Section 3.3. Quantiles computed during thecontrol period 1961–2007 are compared with those computed for2020–2050 and 2070–2099. This allows evaluating the future changeon the extreme precipitation distribution simulated by the differentRCMs. The projected changes are evaluated on the basis of (1) theconvergence of the individual model projections (Fig. 8), (2) the
served monthly precipitation for each RCM in each station.
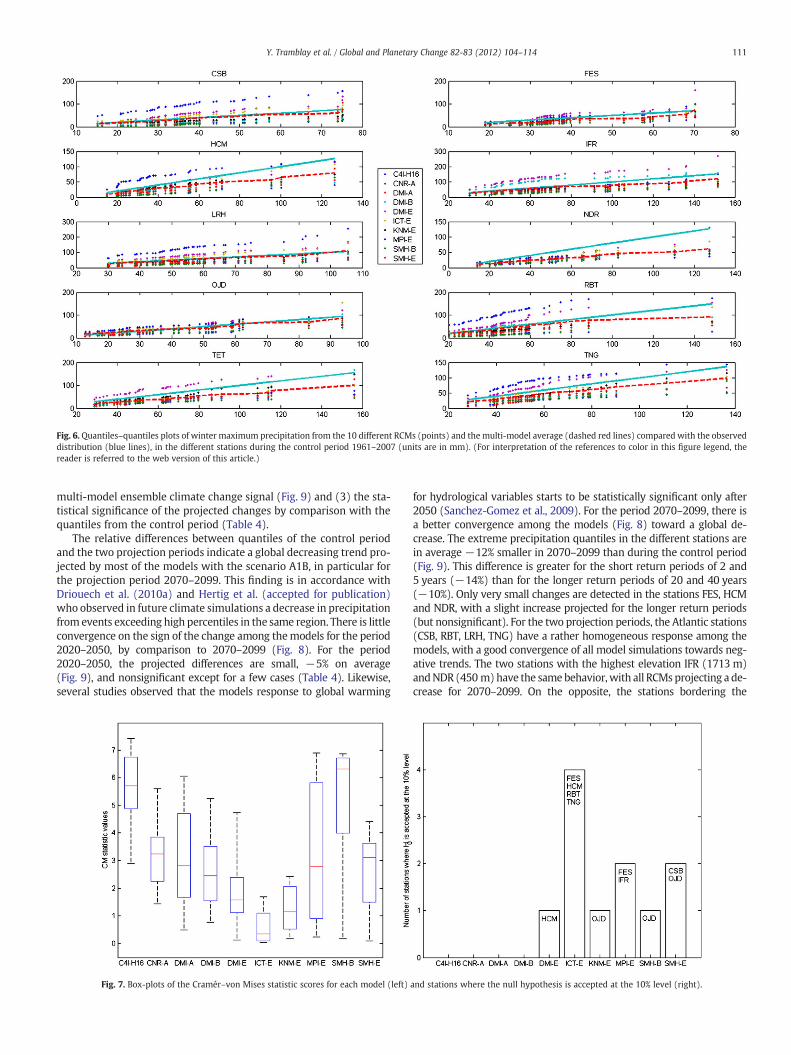
Fig. 6. Quantiles–quantiles plots of winter maximum precipitation from the 10 different RCMs (points) and the multi-model average (dashed red lines) compared with the observeddistribution (blue lines), in the different stations during the control period 1961–2007 (units are in mm). (For interpretation of the references to color in this figure legend, thereader is referred to the web version of this article.)
111Y. Tramblay et al. / Global and Planetary Change 82-83 (2012) 104–114
multi-model ensemble climate change signal (Fig. 9) and (3) the sta-tistical significance of the projected changes by comparison with thequantiles from the control period (Table 4).
The relative differences between quantiles of the control periodand the two projection periods indicate a global decreasing trend pro-jected by most of the models with the scenario A1B, in particular forthe projection period 2070–2099. This finding is in accordance withDriouech et al. (2010a) and Hertig et al. (accepted for publication)who observed in future climate simulations a decrease in precipitationfrom events exceeding high percentiles in the same region. There is littleconvergence on the sign of the change among themodels for the period2020–2050, by comparison to 2070–2099 (Fig. 8). For the period2020–2050, the projected differences are small, −5% on average(Fig. 9), and nonsignificant except for a few cases (Table 4). Likewise,several studies observed that the models response to global warming
Fig. 7. Box-plots of the Cramér–von Mises statistic scores for each model (left)
for hydrological variables starts to be statistically significant only after2050 (Sanchez-Gomez et al., 2009). For the period 2070–2099, there isa better convergence among the models (Fig. 8) toward a global de-crease. The extreme precipitation quantiles in the different stations arein average −12% smaller in 2070–2099 than during the control period(Fig. 9). This difference is greater for the short return periods of 2 and5 years (−14%) than for the longer return periods of 20 and 40 years(−10%). Only very small changes are detected in the stations FES, HCMand NDR, with a slight increase projected for the longer return periods(but nonsignificant). For the two projection periods, the Atlantic stations(CSB, RBT, LRH, TNG) have a rather homogeneous response among themodels, with a good convergence of all model simulations towards neg-ative trends. The two stations with the highest elevation IFR (1713 m)andNDR (450 m)have the samebehavior,with all RCMsprojecting a de-crease for 2070–2099. On the opposite, the stations bordering the
and stations where the null hypothesis is accepted at the 10% level (right).
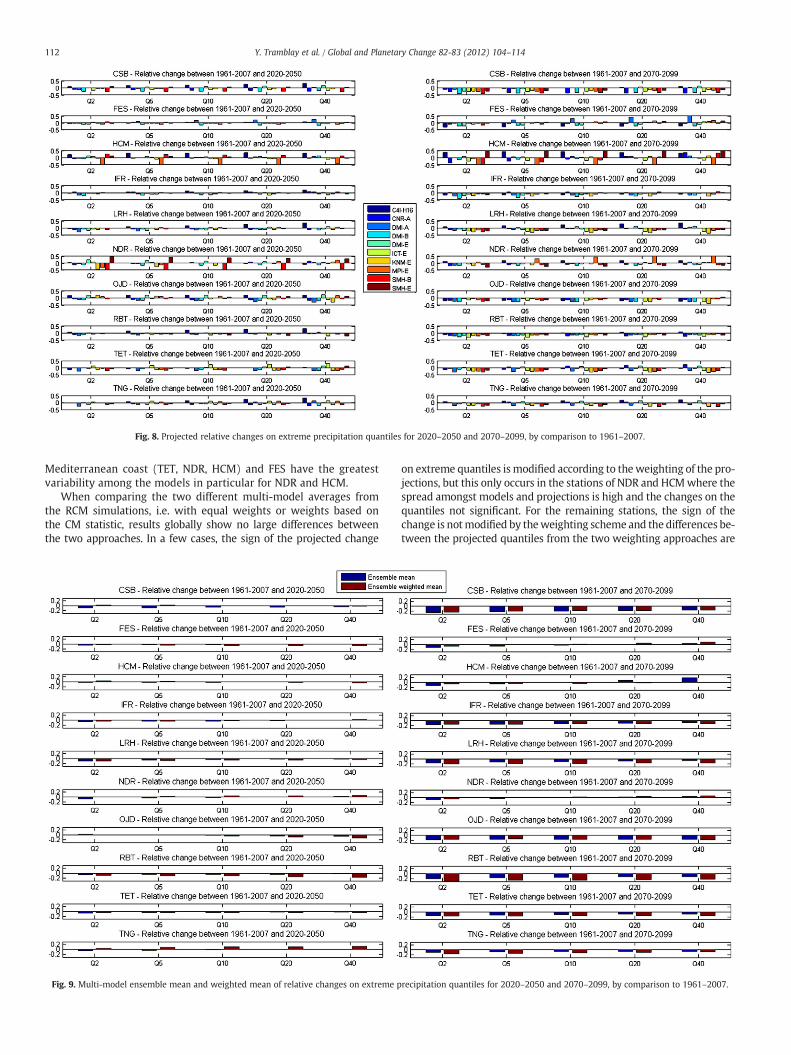
Fig. 8. Projected relative changes on extreme precipitation quantiles for 2020–2050 and 2070–2099, by comparison to 1961–2007.
112 Y. Tramblay et al. / Global and Planetary Change 82-83 (2012) 104–114
Mediterranean coast (TET, NDR, HCM) and FES have the greatestvariability among the models in particular for NDR and HCM.
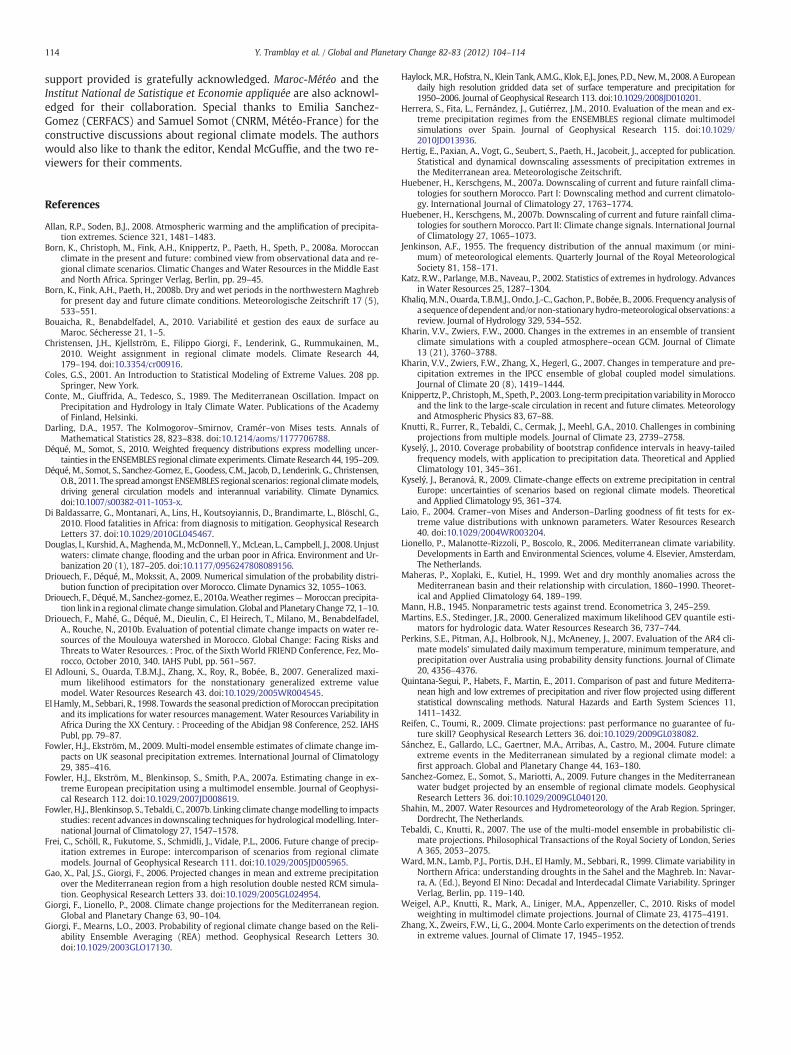
When comparing the two different multi-model averages fromthe RCM simulations, i.e. with equal weights or weights based onthe CM statistic, results globally show no large differences betweenthe two approaches. In a few cases, the sign of the projected change
Fig. 9. Multi-model ensemble mean and weighted mean of relative changes on extreme p
on extreme quantiles ismodified according to theweighting of the pro-jections, but this only occurs in the stations of NDR and HCMwhere thespread amongst models and projections is high and the changes on thequantiles not significant. For the remaining stations, the sign of thechange is notmodified by theweighting scheme and the differences be-tween the projected quantiles from the two weighting approaches are
recipitation quantiles for 2020–2050 and 2070–2099, by comparison to 1961–2007.
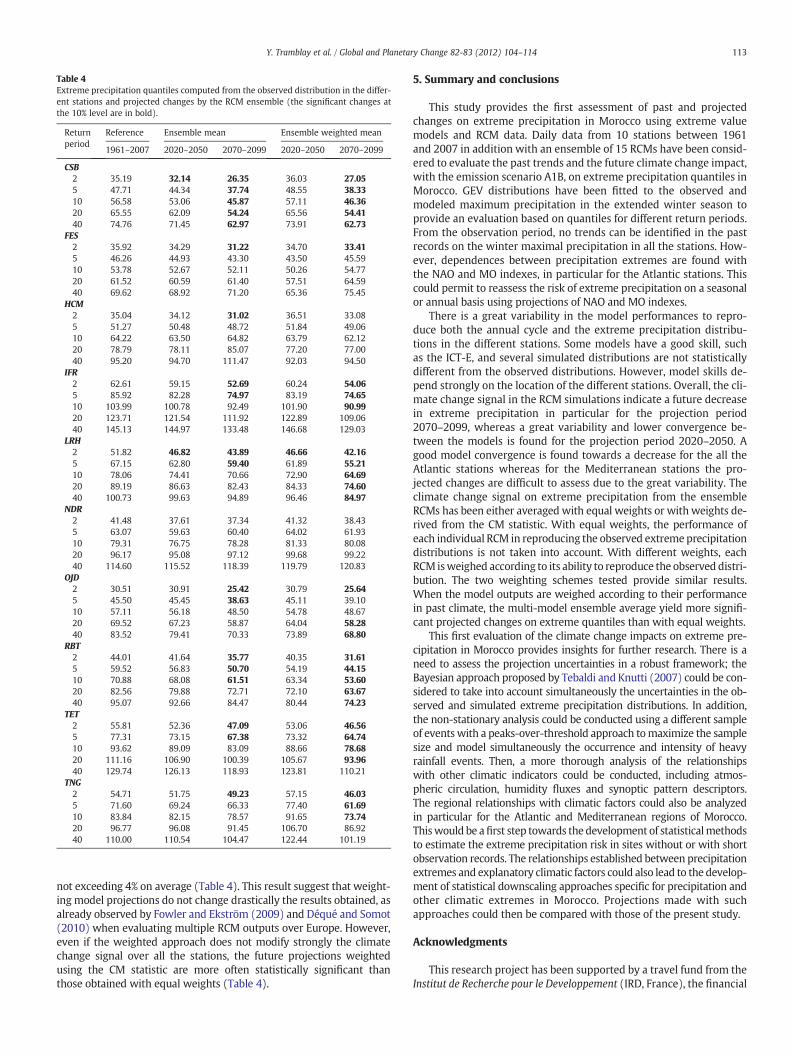
Table 4Extreme precipitation quantiles computed from the observed distribution in the differ-ent stations and projected changes by the RCM ensemble (the significant changes atthe 10% level are in bold).
Returnperiod
Reference Ensemble mean Ensemble weighted mean
1961–2007 2020–2050 2070–2099 2020–2050 2070–2099
CSB2 35.19 32.14 26.35 36.03 27.055 47.71 44.34 37.74 48.55 38.3310 56.58 53.06 45.87 57.11 46.3620 65.55 62.09 54.24 65.56 54.4140 74.76 71.45 62.97 73.91 62.73
FES2 35.92 34.29 31.22 34.70 33.415 46.26 44.93 43.30 43.50 45.5910 53.78 52.67 52.11 50.26 54.7720 61.52 60.59 61.40 57.51 64.5940 69.62 68.92 71.20 65.36 75.45
HCM2 35.04 34.12 31.02 36.51 33.085 51.27 50.48 48.72 51.84 49.0610 64.22 63.50 64.82 63.79 62.1220 78.79 78.11 85.07 77.20 77.0040 95.20 94.70 111.47 92.03 94.50
IFR2 62.61 59.15 52.69 60.24 54.065 85.92 82.28 74.97 83.19 74.6510 103.99 100.78 92.49 101.90 90.9920 123.71 121.54 111.92 122.89 109.0640 145.13 144.97 133.48 146.68 129.03
LRH2 51.82 46.82 43.89 46.66 42.165 67.15 62.80 59.40 61.89 55.2110 78.06 74.41 70.66 72.90 64.6920 89.19 86.63 82.43 84.33 74.6040 100.73 99.63 94.89 96.46 84.97
NDR2 41.48 37.61 37.34 41.32 38.435 63.07 59.63 60.40 64.02 61.9310 79.31 76.75 78.28 81.33 80.0820 96.17 95.08 97.12 99.68 99.2240 114.60 115.52 118.39 119.79 120.83
OJD2 30.51 30.91 25.42 30.79 25.645 45.50 45.45 38.63 45.11 39.1010 57.11 56.18 48.50 54.78 48.6720 69.52 67.23 58.87 64.04 58.2840 83.52 79.41 70.33 73.89 68.80
RBT2 44.01 41.64 35.77 40.35 31.615 59.52 56.83 50.70 54.19 44.1510 70.88 68.08 61.51 63.34 53.6020 82.56 79.88 72.71 72.10 63.6740 95.07 92.66 84.47 80.44 74.23
TET2 55.81 52.36 47.09 53.06 46.565 77.31 73.15 67.38 73.32 64.7410 93.62 89.09 83.09 88.66 78.6820 111.16 106.90 100.39 105.67 93.9640 129.74 126.13 118.93 123.81 110.21
TNG2 54.71 51.75 49.23 57.15 46.035 71.60 69.24 66.33 77.40 61.6910 83.84 82.15 78.57 91.65 73.7420 96.77 96.08 91.45 106.70 86.9240 110.00 110.54 104.47 122.44 101.19
113Y. Tramblay et al. / Global and Planetary Change 82-83 (2012) 104–114
not exceeding 4% on average (Table 4). This result suggest that weight-ing model projections do not change drastically the results obtained, asalready observed by Fowler and Ekström (2009) and Déqué and Somot(2010) when evaluating multiple RCM outputs over Europe. However,even if the weighted approach does not modify strongly the climatechange signal over all the stations, the future projections weightedusing the CM statistic are more often statistically significant thanthose obtained with equal weights (Table 4).
5. Summary and conclusions
This study provides the first assessment of past and projectedchanges on extreme precipitation in Morocco using extreme valuemodels and RCM data. Daily data from 10 stations between 1961and 2007 in addition with an ensemble of 15 RCMs have been consid-ered to evaluate the past trends and the future climate change impact,with the emission scenario A1B, on extreme precipitation quantiles inMorocco. GEV distributions have been fitted to the observed andmodeled maximum precipitation in the extended winter season toprovide an evaluation based on quantiles for different return periods.From the observation period, no trends can be identified in the pastrecords on the winter maximal precipitation in all the stations. How-ever, dependences between precipitation extremes are found withthe NAO and MO indexes, in particular for the Atlantic stations. Thiscould permit to reassess the risk of extreme precipitation on a seasonalor annual basis using projections of NAO and MO indexes.
There is a great variability in the model performances to repro-duce both the annual cycle and the extreme precipitation distribu-tions in the different stations. Some models have a good skill, suchas the ICT-E, and several simulated distributions are not statisticallydifferent from the observed distributions. However, model skills de-pend strongly on the location of the different stations. Overall, the cli-mate change signal in the RCM simulations indicate a future decreasein extreme precipitation in particular for the projection period2070–2099, whereas a great variability and lower convergence be-tween the models is found for the projection period 2020–2050. Agood model convergence is found towards a decrease for the all theAtlantic stations whereas for the Mediterranean stations the pro-jected changes are difficult to assess due to the great variability. Theclimate change signal on extreme precipitation from the ensembleRCMs has been either averaged with equal weights or with weights de-rived from the CM statistic. With equal weights, the performance ofeach individual RCM in reproducing the observed extremeprecipitationdistributions is not taken into account. With different weights, eachRCM isweighed according to its ability to reproduce the observed distri-bution. The two weighting schemes tested provide similar results.When the model outputs are weighed according to their performancein past climate, the multi-model ensemble average yield more signifi-cant projected changes on extreme quantiles than with equal weights.
This first evaluation of the climate change impacts on extreme pre-cipitation in Morocco provides insights for further research. There is aneed to assess the projection uncertainties in a robust framework; theBayesian approach proposed by Tebaldi and Knutti (2007) could be con-sidered to take into account simultaneously the uncertainties in the ob-served and simulated extreme precipitation distributions. In addition,the non-stationary analysis could be conducted using a different sampleof events with a peaks-over-threshold approach tomaximize the samplesize and model simultaneously the occurrence and intensity of heavyrainfall events. Then, a more thorough analysis of the relationshipswith other climatic indicators could be conducted, including atmos-pheric circulation, humidity fluxes and synoptic pattern descriptors.The regional relationships with climatic factors could also be analyzedin particular for the Atlantic and Mediterranean regions of Morocco.Thiswould be afirst step towards the development of statisticalmethodsto estimate the extreme precipitation risk in sites without or with shortobservation records. The relationships established between precipitationextremes and explanatory climatic factors could also lead to the develop-ment of statistical downscaling approaches specific for precipitation andother climatic extremes in Morocco. Projections made with suchapproaches could then be compared with those of the present study.
Acknowledgments
This research project has been supported by a travel fund from theInstitut de Recherche pour le Developpement (IRD, France), the financial
114 Y. Tramblay et al. / Global and Planetary Change 82-83 (2012) 104–114
support provided is gratefully acknowledged. Maroc-Météo and theInstitut National de Satistique et Economie appliquée are also acknowl-edged for their collaboration. Special thanks to Emilia Sanchez-Gomez (CERFACS) and Samuel Somot (CNRM, Météo-France) for theconstructive discussions about regional climate models. The authorswould also like to thank the editor, Kendal McGuffie, and the two re-viewers for their comments.
References
Allan, R.P., Soden, B.J., 2008. Atmospheric warming and the amplification of precipita-tion extremes. Science 321, 1481–1483.
Born, K., Christoph, M., Fink, A.H., Knippertz, P., Paeth, H., Speth, P., 2008a. Moroccanclimate in the present and future: combined view from observational data and re-gional climate scenarios. Climatic Changes and Water Resources in the Middle Eastand North Africa. Springer Verlag, Berlin, pp. 29–45.
Born, K., Fink, A.H., Paeth, H., 2008b. Dry and wet periods in the northwestern Maghrebfor present day and future climate conditions. Meteorologische Zeitschrift 17 (5),533–551.
Bouaicha, R., Benabdelfadel, A., 2010. Variabilité et gestion des eaux de surface auMaroc. Sécheresse 21, 1–5.
Christensen, J.H., Kjellström, E., Filippo Giorgi, F., Lenderink, G., Rummukainen, M.,2010. Weight assignment in regional climate models. Climate Research 44,179–194. doi:10.3354/cr00916.
Coles, G.S., 2001. An Introduction to Statistical Modeling of Extreme Values. 208 pp.Springer, New York.
Conte, M., Giuffrida, A., Tedesco, S., 1989. The Mediterranean Oscillation. Impact onPrecipitation and Hydrology in Italy Climate Water. Publications of the Academyof Finland, Helsinki.
Darling, D.A., 1957. The Kolmogorov–Smirnov, Cramér–von Mises tests. Annals ofMathematical Statistics 28, 823–838. doi:10.1214/aoms/1177706788.
Déqué, M., Somot, S., 2010. Weighted frequency distributions express modelling uncer-tainties in the ENSEMBLES regional climate experiments. Climate Research 44, 195–209.
Déqué, M., Somot, S., Sanchez-Gomez, E., Goodess, C.M., Jacob, D., Lenderink, G., Christensen,O.B., 2011. The spread amongst ENSEMBLES regional scenarios: regional climatemodels,driving general circulation models and interannual variability. Climate Dynamics.doi:10.1007/s00382-011-1053-x.
Di Baldassarre, G., Montanari, A., Lins, H., Koutsoyiannis, D., Brandimarte, L., Blöschl, G.,2010. Flood fatalities in Africa: from diagnosis to mitigation. Geophysical ResearchLetters 37. doi:10.1029/2010GL045467.
Douglas, I., Kurshid, A., Maghenda, M.,McDonnell, Y., McLean, L., Campbell, J., 2008. Unjustwaters: climate change, flooding and the urban poor in Africa. Environment and Ur-banization 20 (1), 187–205. doi:10.1177/0956247808089156.
Driouech, F., Déqué, M., Mokssit, A., 2009. Numerical simulation of the probability distri-bution function of precipitation over Morocco. Climate Dynamics 32, 1055–1063.
Driouech, F., Déqué, M., Sanchez-gomez, E., 2010a.Weather regimes—Moroccan precipita-tion link in a regional climate change simulation. Global and Planetary Change 72, 1–10.
Driouech, F., Mahé, G., Déqué, M., Dieulin, C., El Heirech, T., Milano, M., Benabdelfadel,A., Rouche, N., 2010b. Evaluation of potential climate change impacts on water re-sources of the Moulouya watershed in Morocco. Global Change: Facing Risks andThreats to Water Resources. : Proc. of the SixthWorld FRIEND Conference, Fez, Mo-rocco, October 2010, 340. IAHS Publ, pp. 561–567.
El Adlouni, S., Ouarda, T.B.M.J., Zhang, X., Roy, R., Bobée, B., 2007. Generalized maxi-mum likelihood estimators for the nonstationary generalized extreme valuemodel. Water Resources Research 43. doi:10.1029/2005WR004545.
El Hamly,M., Sebbari, R., 1998. Towards the seasonal prediction ofMoroccan precipitationand its implications for water resources management. Water Resources Variability inAfrica During the XX Century. : Proceeding of the Abidjan 98 Conference, 252. IAHSPubl, pp. 79–87.
Fowler, H.J., Ekström, M., 2009. Multi-model ensemble estimates of climate change im-pacts on UK seasonal precipitation extremes. International Journal of Climatology29, 385–416.
Fowler, H.J., Ekström, M., Blenkinsop, S., Smith, P.A., 2007a. Estimating change in ex-treme European precipitation using a multimodel ensemble. Journal of Geophysi-cal Research 112. doi:10.1029/2007JD008619.
Fowler, H.J., Blenkinsop, S., Tebaldi, C., 2007b. Linking climate changemodelling to impactsstudies: recent advances in downscaling techniques for hydrologicalmodelling. Inter-national Journal of Climatology 27, 1547–1578.
Frei, C., Schöll, R., Fukutome, S., Schmidli, J., Vidale, P.L., 2006. Future change of precip-itation extremes in Europe: intercomparison of scenarios from regional climatemodels. Journal of Geophysical Research 111. doi:10.1029/2005JD005965.
Gao, X., Pal, J.S., Giorgi, F., 2006. Projected changes in mean and extreme precipitationover the Mediterranean region from a high resolution double nested RCM simula-tion. Geophysical Research Letters 33. doi:10.1029/2005GL024954.
Giorgi, F., Lionello, P., 2008. Climate change projections for the Mediterranean region.Global and Planetary Change 63, 90–104.
Giorgi, F., Mearns, L.O., 2003. Probability of regional climate change based on the Reli-ability Ensemble Averaging (REA) method. Geophysical Research Letters 30.doi:10.1029/2003GLO17130.
Haylock,M.R., Hofstra, N., Klein Tank, A.M.G., Klok, E.J., Jones, P.D., New,M., 2008. A Europeandaily high resolution gridded data set of surface temperature and precipitation for1950–2006. Journal of Geophysical Research 113. doi:10.1029/2008JD010201.
Herrera, S., Fita, L., Fernández, J., Gutiérrez, J.M., 2010. Evaluation of the mean and ex-treme precipitation regimes from the ENSEMBLES regional climate multimodelsimulations over Spain. Journal of Geophysical Research 115. doi:10.1029/2010JD013936.
Hertig, E., Paxian, A., Vogt, G., Seubert, S., Paeth, H., Jacobeit, J., accepted for publication.Statistical and dynamical downscaling assessments of precipitation extremes inthe Mediterranean area. Meteorologische Zeitschrift.
Huebener, H., Kerschgens, M., 2007a. Downscaling of current and future rainfall clima-tologies for southern Morocco. Part I: Downscaling method and current climatolo-gy. International Journal of Climatology 27, 1763–1774.
Huebener, H., Kerschgens, M., 2007b. Downscaling of current and future rainfall clima-tologies for southern Morocco. Part II: Climate change signals. International Journalof Climatology 27, 1065–1073.
Jenkinson, A.F., 1955. The frequency distribution of the annual maximum (or mini-mum) of meteorological elements. Quarterly Journal of the Royal MeteorologicalSociety 81, 158–171.
Katz, R.W., Parlange, M.B., Naveau, P., 2002. Statistics of extremes in hydrology. Advancesin Water Resources 25, 1287–1304.
Khaliq,M.N., Ouarda, T.B.M.J., Ondo, J.-C., Gachon, P., Bobée, B., 2006. Frequency analysis ofa sequenceof dependent and/or non-stationaryhydro-meteorological observations: areview. Journal of Hydrology 329, 534–552.
Kharin, V.V., Zwiers, F.W., 2000. Changes in the extremes in an ensemble of transientclimate simulations with a coupled atmosphere–ocean GCM. Journal of Climate13 (21), 3760–3788.
Kharin, V.V., Zwiers, F.W., Zhang, X., Hegerl, G., 2007. Changes in temperature and pre-cipitation extremes in the IPCC ensemble of global coupled model simulations.Journal of Climate 20 (8), 1419–1444.
Knippertz, P., Christoph,M., Speth, P., 2003. Long-termprecipitation variability inMoroccoand the link to the large-scale circulation in recent and future climates. Meteorologyand Atmospheric Physics 83, 67–88.
Knutti, R., Furrer, R., Tebaldi, C., Cermak, J., Meehl, G.A., 2010. Challenges in combiningprojections from multiple models. Journal of Climate 23, 2739–2758.
Kyselý, J., 2010. Coverage probability of bootstrap confidence intervals in heavy-tailedfrequency models, with application to precipitation data. Theoretical and AppliedClimatology 101, 345–361.
Kyselý, J., Beranová, R., 2009. Climate-change effects on extreme precipitation in centralEurope: uncertainties of scenarios based on regional climate models. Theoreticaland Applied Climatology 95, 361–374.
Laio, F., 2004. Cramer–von Mises and Anderson–Darling goodness of fit tests for ex-treme value distributions with unknown parameters. Water Resources Research40. doi:10.1029/2004WR003204.
Lionello, P., Malanotte-Rizzoli, P., Boscolo, R., 2006. Mediterranean climate variability.Developments in Earth and Environmental Sciences, volume 4. Elsevier, Amsterdam,The Netherlands.
Maheras, P., Xoplaki, E., Kutiel, H., 1999. Wet and dry monthly anomalies across theMediterranean basin and their relationship with circulation, 1860–1990. Theoret-ical and Applied Climatology 64, 189–199.
Mann, H.B., 1945. Nonparametric tests against trend. Econometrica 3, 245–259.Martins, E.S., Stedinger, J.R., 2000. Generalized maximum likelihood GEV quantile esti-
mators for hydrologic data. Water Resources Research 36, 737–744.Perkins, S.E., Pitman, A.J., Holbrook, N.J., McAneney, J., 2007. Evaluation of the AR4 cli-
mate models' simulated daily maximum temperature, minimum temperature, andprecipitation over Australia using probability density functions. Journal of Climate20, 4356–4376.
Quintana-Segui, P., Habets, F., Martin, E., 2011. Comparison of past and future Mediterra-nean high and low extremes of precipitation and river flow projected using differentstatistical downscaling methods. Natural Hazards and Earth System Sciences 11,1411–1432.
Reifen, C., Toumi, R., 2009. Climate projections: past performance no guarantee of fu-ture skill? Geophysical Research Letters 36. doi:10.1029/2009GL038082.
Sánchez, E., Gallardo, L.C., Gaertner, M.A., Arribas, A., Castro, M., 2004. Future climateextreme events in the Mediterranean simulated by a regional climate model: afirst approach. Global and Planetary Change 44, 163–180.
Sanchez-Gomez, E., Somot, S., Mariotti, A., 2009. Future changes in the Mediterraneanwater budget projected by an ensemble of regional climate models. GeophysicalResearch Letters 36. doi:10.1029/2009GL040120.
Shahin, M., 2007. Water Resources and Hydrometeorology of the Arab Region. Springer,Dordrecht, The Netherlands.
Tebaldi, C., Knutti, R., 2007. The use of the multi-model ensemble in probabilistic cli-mate projections. Philosophical Transactions of the Royal Society of London, SeriesA 365, 2053–2075.
Ward, M.N., Lamb, P.J., Portis, D.H., El Hamly, M., Sebbari, R., 1999. Climate variability inNorthern Africa: understanding droughts in the Sahel and the Maghreb. In: Navar-ra, A. (Ed.), Beyond El Nino: Decadal and Interdecadal Climate Variability. SpringerVerlag, Berlin, pp. 119–140.
Weigel, A.P., Knutti, R., Mark, A., Liniger, M.A., Appenzeller, C., 2010. Risks of modelweighting in multimodel climate projections. Journal of Climate 23, 4175–4191.
Zhang, X., Zweirs, F.W., Li, G., 2004. Monte Carlo experiments on the detection of trendsin extreme values. Journal of Climate 17, 1945–1952.
Related Documents