Extreme precipitation Ethan Coffel

Extreme precipitation
Dec 31, 2015
Extreme precipitation. Ethan Coffel. SREX Ch. 3. Low/medium confidence in heavy precip changes in most regions due to conflicting observations or lack of data Medium confidence in Europe: winter precip has increase in some areas, but summer precip shows little trend - PowerPoint PPT Presentation
Welcome message from author
This document is posted to help you gain knowledge. Please leave a comment to let me know what you think about it! Share it to your friends and learn new things together.
Transcript

Extreme precipitation
Ethan Coffel
SREX Ch. 3
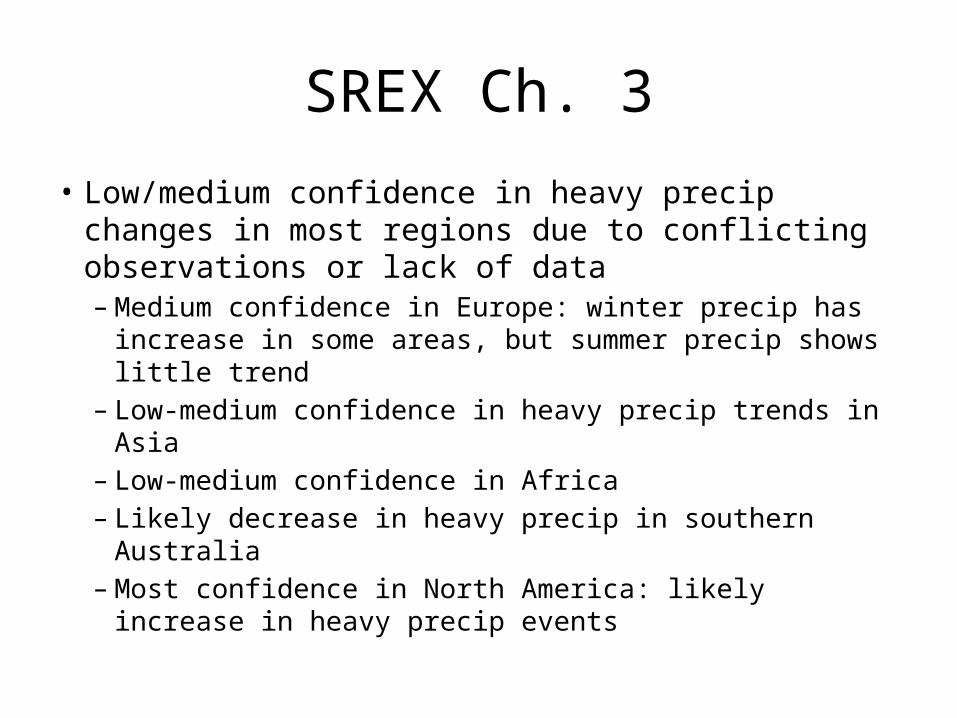
• Low/medium confidence in heavy precip changes in most regions due to conflicting observations or lack of data– Medium confidence in Europe: winter precip has increase
in some areas, but summer precip shows little trend– Low-medium confidence in heavy precip trends in Asia– Low-medium confidence in Africa– Likely decrease in heavy precip in southern Australia– Most confidence in North America: likely increase in heavy
precip events

SREX Ch. 3
• AR4: Very likely that heavy precip events will increase across the globe
• Newer work presents a similar assessment, but highlights more uncertainty


Groisman 2004• To obtain statistically significant estimates, the characteristics of heavy
precipitation should be areally averaged over a spatially homogeneous region. Otherwise, noise at the spatial scale of daily weather systems masks changes and makes them very difficult to detect (e.g., Frei and Schär 2001; Zhang et al. 2004).
• Whenever there are statistically significant regional changes in the rainy season, relative changes in heavy precipitation are of the same sign and are stronger than those of the mean. A search at various sites around the globe using our data holdings and results from others (e.g., Osborn et al. 2000; Tarhule and Woo 1998; Suppiah and Hennessy 1998; Zhai et al. 1999; Groisman et al. 2001) confirm this.
• This search also revealed several regions where mean precipitation does not noticeably change in the rainy season but heavy precipitation does change. In such cases, there was always an increase in heavy precipitation. Among these regions are Siberia, South Africa, northern Japan (Easterling et al. 2000c), and eastern Mediterranean (Alpert et al. 2002).

Groisman 2004• Heavy (>= 95th
percentile), very heavy (>= 99th percentile), and extreme (>= 99.9th percentile) precipitation has increased, as has the contribution of these events to the annual total precipitation
• Number of days with heavy and very heavy precip has also increased

Area averaging• Weather stations are clustered spatially and most have missing values
• “For each region, season, year, and intense precipitation threshold, we calculated anomalies from the long-term mean number of exceedances for each station and arithmetically averaged these anomalies within 1x1 degree grid cells. These anomalies were regionally averaged with weights proportional to their area.”

Area averaging
• Estimated spatial correlation function (2)
• Constant C0 includes local climate variability and measurement error
• Results are that for non-mountain terrain error is at least 25% with one station per gridbox, and 60% in mountainous terrain

Data problems
• Use # of exceedances of a certain threshold instead of actual station measurements to avoid missing extreme events that may happen near but not on top of the station
• Ex. mountain terrain with a station at low elevation: the station’s extreme threshold could be lower than the threshold on top of the mountain, but by using frequency of exceedance, extreme events on the mountain can be captured

Results
• Analysis of heavy precip for:– European USSR– Northern Europe– Pacific Northwest / Alaska– SE/SW Australia– South Africa– Eastern Brazil & Uruguay– Central US– Central Mexico

Former USSR
• Observed increase in total annual precip and increase in heavy & very heavy events

Former USSR

Northern Europe
• Increase in annual, & heavy/very heavy precip

US Northwest / Alaska
• Increase in annual & heavy/very heavy precip

Australia
• Increased precip in SE Australia, decrease in SW

South Africa
• Total precip unchanged, but increase in frequency of heavy/very heavy events

Eastern Brazil and Uruguay
• Increase in frequency of extreme precip in all regions and increase in general precip in the south

Central US
• Increase in very heavy precip, almost all after 1970

Central Mexico
• Decrease in total precip and heavy events, but increase in very heavy events

Summary

Comparison with models
• Changes in annual precip and 99.7th percentile exceedance in two models with a doubling of CO2
• Models capture the larger increase in extreme precip as compared to the annual total, but not great spatial agreement

Comparison with models
• Data shown where models agree in sign at gridpoint level (averaged between the two)

Comparison with models
• Frequency of upper 10% precip days in NE US (top: observations, bottom: ECHAM4 model)

Comparison with models
• Frequency of days with precip in NE US (top: observations, bottom: ECHAM4 model)
Related Documents