LETTER Climate change hotspots in the CMIP5 global climate model ensemble Noah S. Diffenbaugh & Filippo Giorgi Received: 3 April 2012 / Accepted: 1 August 2012 / Published online: 25 August 2012 # The Author(s) 2012. This article is published with open access at Springerlink.com Abstract We use a statistical metric of multi-dimensional climate change to quantify the emergence of global climate change hotspots in the CMIP5 climate model ensemble. Our hotspot metric extends previous work through the inclusion of extreme seasonal temperature and precipitation, which exert critical influence on climate change impacts. The results identify areas of the Amazon, the Sahel and tropical West Africa, Indonesia, and the Tibetan Plateau as persistent regional climate change hotspots throughout the 21st century of the RCP8.5 and RCP4.5 forcing pathways. In addition, areas of southern Africa, the Mediterranean, the Arctic, and Central America/western North America also emerge as prominent regional climate change hotspots in response to intermediate and high levels of forcing. Comparisons of different periods of the two forcing pathways suggest that the pattern of aggregate change is fairly robust to the level of global warming below approxi- mately 2 °C of global warming (relative to the late-20th-century baseline), but not at the higher levels of global warming that occur in the late-21st-century period of the RCP8.5 pathway, with areas of southern Africa, the Mediterranean, and the Arctic exhibiting particular intensification of relative aggregate climate change in response to high levels of forcing. Although specific impacts will clearly be shaped by the interaction of climate change with human and biological vulnerabilities, our identification of climate change hotspots can help to inform mitigation and adaptation decisions by quantifying the rate, magnitude and causes of the aggregate climate response in different parts of the world. 1 Introduction It is now established not only that human activities have been the primary cause of observed global warming (IPCC 2007), but also that the climate system is already committed to Climatic Change (2012) 114:813–822 DOI 10.1007/s10584-012-0570-x Electronic supplementary material The online version of this article (doi:10.1007/s10584-012-0570-x) contains supplementary material, which is available to authorized users. N. S. Diffenbaugh (*) Department of Environmental Earth System Science and Woods Institute for the Environment, Stanford University, 473 Via Ortega, Stanford, CA 94305-4216, USA e-mail: [email protected] F. Giorgi Earth System Physics Section, Abdus Salam International Centre for Theoretical Physics, Trieste, Italy

Welcome message from author
This document is posted to help you gain knowledge. Please leave a comment to let me know what you think about it! Share it to your friends and learn new things together.
Transcript
LETTER
Climate change hotspots in the CMIP5 global climatemodel ensemble
Noah S. Diffenbaugh & Filippo Giorgi
Received: 3 April 2012 /Accepted: 1 August 2012 /Published online: 25 August 2012# The Author(s) 2012. This article is published with open access at Springerlink.com
Abstract We use a statistical metric of multi-dimensional climate change to quantify theemergence of global climate change hotspots in the CMIP5 climate model ensemble. Ourhotspot metric extends previous work through the inclusion of extreme seasonal temperatureand precipitation, which exert critical influence on climate change impacts. The resultsidentify areas of the Amazon, the Sahel and tropical West Africa, Indonesia, and the TibetanPlateau as persistent regional climate change hotspots throughout the 21st century of theRCP8.5 and RCP4.5 forcing pathways. In addition, areas of southern Africa, theMediterranean, the Arctic, and Central America/western North America also emerge asprominent regional climate change hotspots in response to intermediate and high levels offorcing. Comparisons of different periods of the two forcing pathways suggest that thepattern of aggregate change is fairly robust to the level of global warming below approxi-mately 2 °C of global warming (relative to the late-20th-century baseline), but not at thehigher levels of global warming that occur in the late-21st-century period of the RCP8.5pathway, with areas of southern Africa, the Mediterranean, and the Arctic exhibitingparticular intensification of relative aggregate climate change in response to high levels offorcing. Although specific impacts will clearly be shaped by the interaction of climatechange with human and biological vulnerabilities, our identification of climate changehotspots can help to inform mitigation and adaptation decisions by quantifying the rate,magnitude and causes of the aggregate climate response in different parts of the world.
1 Introduction
It is now established not only that human activities have been the primary cause of observedglobal warming (IPCC 2007), but also that the climate system is already committed to
Climatic Change (2012) 114:813–822DOI 10.1007/s10584-012-0570-x
Electronic supplementary material The online version of this article (doi:10.1007/s10584-012-0570-x)contains supplementary material, which is available to authorized users.
N. S. Diffenbaugh (*)Department of Environmental Earth System Science and Woods Institute for the Environment, StanfordUniversity, 473 Via Ortega, Stanford, CA 94305-4216, USAe-mail: [email protected]
F. GiorgiEarth System Physics Section, Abdus Salam International Centre for Theoretical Physics, Trieste, Italy

further global warming arising from physical (e.g., (Meehl et al. 2005)), biogeochemical(e.g., (Jones et al. 2010)), socio-political (e.g., (Matthews and Weaver 2010)) and infra-structural (e.g., (Davis et al. 2010)) inertia. In addition, continued unconstrained increases ingreenhouse gas emissions are likely to cause global warming that substantially exceeds theinternationally agreed-upon target (UNFCCC 2009) of 2 °C above the pre-industrial baseline(e.g., (Matthews et al. 2009; Meinshausen et al. 2009)). Decisions about how best to adapt tocommitted warming and about what level of warming to target in order to avoid unaccept-able climate change require understanding of the pattern and magnitude of the regional andlocal response to different levels of radiative forcing. Although in many areas of the worldthe impacts of climate change are likely to be determined by highly-localized physical,biological and human factors, quantifying the magnitude of integrated change across a suiteof physical climate indicators can help to identify climate change “hotspots” that show thestrongest and most robust aggregated response to global-scale warming.
Giorgi (2006) quantified sub-continental-scale climate change hotspots in the late-21st-century period of Phase 3 of the Coupled Model Intercomparison Project (CMIP3). Aweighting of changes in mean and variability of seasonal temperature and precipitationrevealed the Mediterranean, the northern hemisphere high-latitude regions, and CentralAmerica as the most prominent hotspots (Giorgi 2006). Other aggregations of multi-dimensional climate change include integration of sea-level-rise vulnerability into theGiorgi index (Diffenbaugh et al. 2007a), summation of the number of seasons exceedingdifferent temperature and precipitation thresholds (Baettig et al. 2007), use of statisticalmetrics of the distance traveled in multi-dimensional climate space (Williams et al. 2007;Diffenbaugh et al. 2008), and use of statistical metrics of the magnitude and/or rate ofclimate change experienced by particular biological categories (Loarie et al. 2009; Ackerlyet al. 2010; Beaumont et al. 2011; Sandel et al. 2011). Given the availability of a newgeneration of global climate model simulations that comprise the CMIP5 ensemble (Tayloret al. 2012), we quantify the transient emergence of global hotspot patterns using a statisticalmetric of aggregate multi-dimensional climate change. This metric extends the statisticalapproach of Diffenbaugh et al. (2008) to also include measures of extreme seasonaltemperature and precipitation, which are particularly important for climate change impacts.
2 Methods
2.1 Models
We quantify climate change hotspots in the 2016–2035, 2046–2065, and 2080–2099 periodsof the CMIP5 RCP8.5 and RCP4.5 simulations. RCP8.5 and RCP4.5 diverge dramaticallyover the 21st century, reaching greenhouse gas concentrations of >1370 and ~650 ppmCO2-e (Moss et al. 2010), respectively, by the year 2100, along with radiative forcing of~8.5 and ~4.5 W/m2 (Moss et al. 2010), and median global warming of 4.9 and 2.4 °Cabove the pre-industrial baseline (Rogelj et al. 2012). The global warming in RCP8.5 andRCP4.5 most closely match that in the A1FI and B1 SRES scenarios, respectively(Rogelj et al. 2012).
The suite of available simulations includes realizations from 20 models, including 86realizations of the baseline period (1986–2005), and 51 realizations of the 21st century inboth the RCP8.5 and RCP4.5 pathways (Table S1). Following Giorgi (2006), Diffenbaugh etal. (2007a), and Diffenbaugh et al. (2008), our analysis is carried out after first interpolatingthe output from each model to a common 1-degree geographical grid.
814 Climatic Change (2012) 114:813–822

Further details of the CMIP5 simulations are provided in the Supplemental Information(SI).
2.2 Hotspot quantification
Following Diffenbaugh et al. (2008), we use the Standard Euclidean Distance (SED) toquantify the total change in multi-dimensional climate space between the present and futureperiods:
SEDtotal ¼X
v
SEDv
!1=2
ðEq:1Þ
for
SEDv ¼ abs Δvð Þ max abs Δvð Þ½ �ij.� �2
ðEq:2Þ
where abs(Δv) is the absolute value of change in climate indicator v at each grid pointbetween the present and future periods, and max[abs(Δv)]ij is the maximum land-grid-pointabsolute value change in climate indicator v over all land grid points ij in the 2080–2099period of RCP8.5 (i.e., the change in each period is normalized to the maximum change inthe 2080–2099 period of RCP8.5). By scaling to the maximum change in the highest forcingperiod, our approach yields a relative metric of aggregate climate change that can be directlycompared between geographic areas, forcing pathways, and time periods within a forcingpathway.
We include 7 climate indicators from each of four seasons (DJF, MAM, JJA, SON),yielding 28 total dimensions at each grid point. The climate indicators are: absolute changein mean surface air temperature, fractional change in mean precipitation, fractional change ininterannual standard deviation of de-trended surface air temperature, fractional change ininterannual coefficient of variation of de-trended precipitation, frequency of occurrence ofseasons above the baseline maximum seasonal surface air temperature, frequency of occur-rence of seasons below the baseline minimum seasonal precipitation, and frequency ofoccurrence of seasons above the baseline maximum seasonal precipitation. We calculatethe simulated change in each variable using the ensemble mean of that variable in thebaseline and future periods.
Our aggregate metric only considers land grid points north of 60°S. In order to treatthe change in each of the 28 dimensions equally in the SED calculation, we normalizethe change in each climate indicator by first calculating the absolute value of change ateach land grid point and then dividing by the largest grid-point absolute-value changethat occurs at any land grid point north of 60°S in the 2080–2099 period of RCP8.5.We then calculate the SED at each land grid point by first squaring each of thenormalized values, then summing the squared values, and then taking the square rootof the sum.
Further details of the hotspot quantification are provided in the SI.
3 Results and discussion
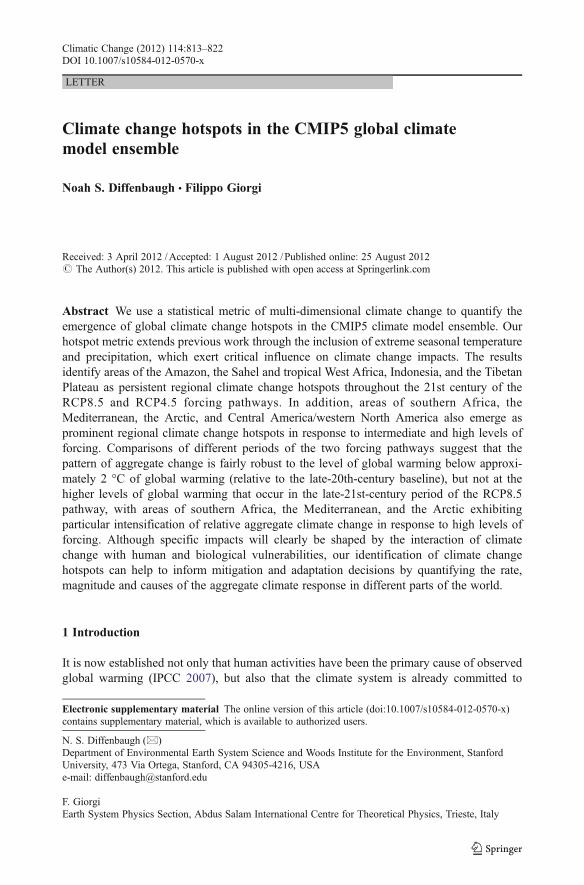
The hotspot patterns for the three future time periods of RCP8.5 and RCP4.5 are shown inFig. 1. The dominant global hotspot pattern emerges early in the 21st century, with
Climatic Change (2012) 114:813–822 815
areas of the Amazon, the Sahel and tropical West Africa, Indonesia, and the Tibetan Plateauemerging early in the 21st century and exhibiting relatively high aggregate climate change inall three periods of both forcing pathways. In addition, areas of southern Africa, theMediterranean, the Arctic, and Central America/western North America emerge at interme-diate and/or high levels of forcing, while areas of southern South America, Australia, theIndian Peninsula, and East Asia exhibit relatively small – but increasing – aggregate climatechange throughout the 21st century (Fig. 1).
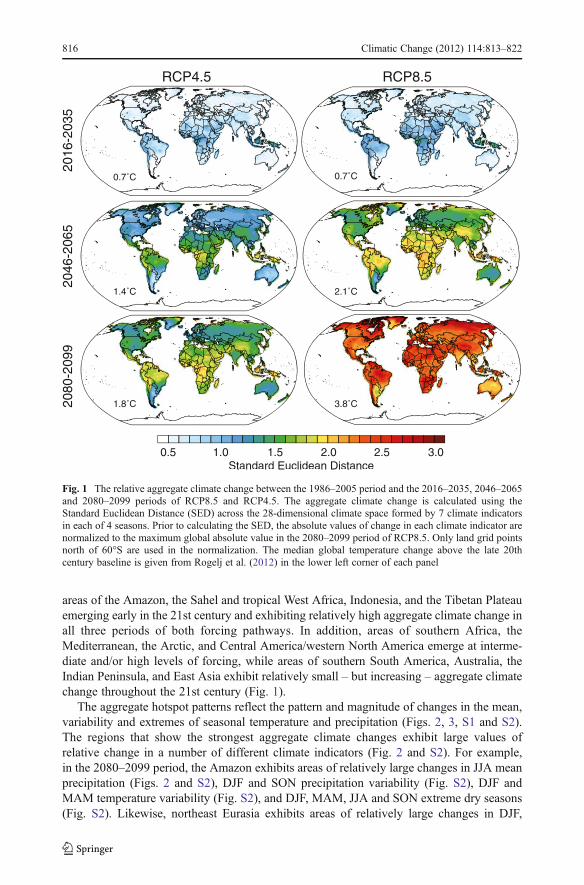
The aggregate hotspot patterns reflect the pattern and magnitude of changes in the mean,variability and extremes of seasonal temperature and precipitation (Figs. 2, 3, S1 and S2).The regions that show the strongest aggregate climate changes exhibit large values ofrelative change in a number of different climate indicators (Fig. 2 and S2). For example,in the 2080–2099 period, the Amazon exhibits areas of relatively large changes in JJA meanprecipitation (Figs. 2 and S2), DJF and SON precipitation variability (Fig. S2), DJF andMAM temperature variability (Fig. S2), and DJF, MAM, JJA and SON extreme dry seasons(Fig. S2). Likewise, northeast Eurasia exhibits areas of relatively large changes in DJF,
Fig. 1 The relative aggregate climate change between the 1986–2005 period and the 2016–2035, 2046–2065and 2080–2099 periods of RCP8.5 and RCP4.5. The aggregate climate change is calculated using theStandard Euclidean Distance (SED) across the 28-dimensional climate space formed by 7 climate indicatorsin each of 4 seasons. Prior to calculating the SED, the absolute values of change in each climate indicator arenormalized to the maximum global absolute value in the 2080–2099 period of RCP8.5. Only land grid pointsnorth of 60°S are used in the normalization. The median global temperature change above the late 20thcentury baseline is given from Rogelj et al. (2012) in the lower left corner of each panel
816 Climatic Change (2012) 114:813–822
MAM and SON mean temperature (Figs. 2 and S2), DJF and MAM mean precipitation(Figs. 2 and S2), and DJF, MAM, JJA and SON extreme wet seasons (Fig. S2).
Comparisons of different periods of the two forcing pathways suggest that the pattern ofaggregate change is fairly robust to the level of global warming below approximately 2 °C ofglobal warming (relative to the late-20th-century baseline), but not at the higher levels ofglobal warming that occur in the late-21st-century period of the RCP8.5 pathway (Fig. 1).For example, the tropical regions exhibit the greatest relative change throughout the RCP4.5pathway, with much of central Africa exhibiting increases in aggregate change fromapproximately 1.2 during the 2016–2035 period of RCP4.5, to approximately 1.9 duringthe 2046–2065 period of RCP4.5, to approximately 2.1 during the 2080–2099 period ofRCP4.5. In contrast, the high latitudes consistently exhibit smaller relative aggregate changethan the tropics throughout the RCP4.5 pathway, with broad areas of the Arctic exhibitingincreases in aggregate change from approximately 0.7 during the 2016–2035 period ofRCP4.5, to approximately 1.3 during the 2046–2065 period of RCP4.5, to approximately1.6 during the 2080–2099 period of RCP4.5. The pattern of greatest relative aggregatechange occurring over tropical regions is also seen during the 2046–2065 period of RCP8.5,when median global warming is larger than in the 2080–2099 period of RCP4.5 (Rogelj etal. 2012)). However, the highest values of relative aggregate change occur much morebroadly during the late-21st-century period of RCP8.5, with central Africa and Indonesiaboth exhibiting lower aggregate values (up to 2.5) than the Arctic (up to 3.0), theMediterranean (up to 2.9), the Sahel (up to 2.9), the Amazon (up to 2.8), Southern Africa(up to 2.8), and Tibet (up to 2.8).
The apparent acceleration of relative aggregate climate change over areas of theextra-tropics at high levels of global warming (Fig. 1) results in part from the fact thatintensification of extreme hot season occurrence emerges most strongly over the tropics in
Fig. 2 The change in December-January-February (DJF) and June-July-August (JJA) surface air temperatureand precipitation between the 1986–2005 period and the 2080–2099 period of RCP8.5 in the CMIP5ensemble
Climatic Change (2012) 114:813–822 817
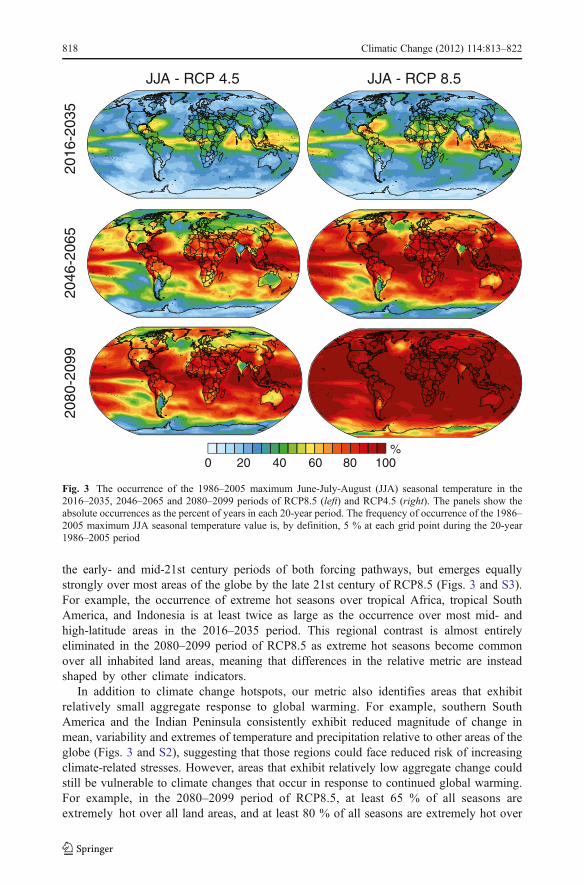
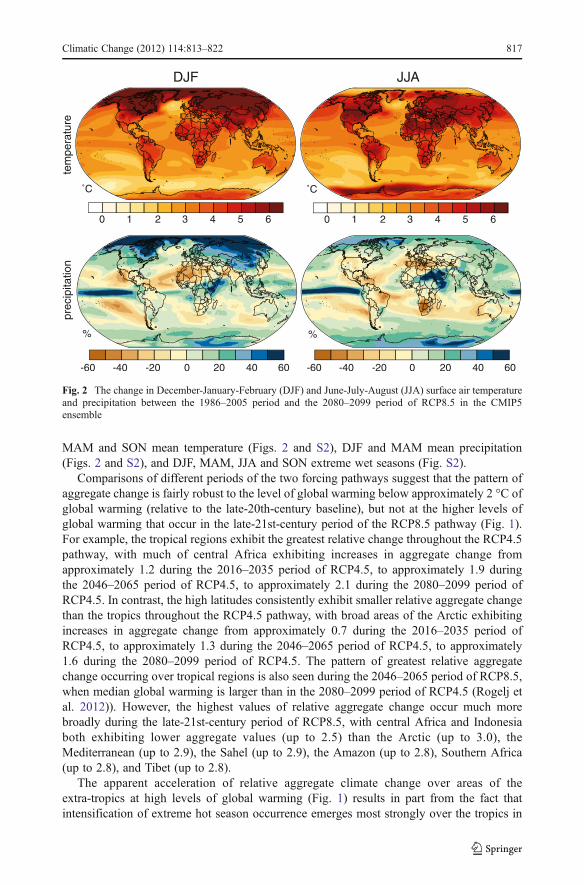
the early- and mid-21st century periods of both forcing pathways, but emerges equallystrongly over most areas of the globe by the late 21st century of RCP8.5 (Figs. 3 and S3).For example, the occurrence of extreme hot seasons over tropical Africa, tropical SouthAmerica, and Indonesia is at least twice as large as the occurrence over most mid- andhigh-latitude areas in the 2016–2035 period. This regional contrast is almost entirelyeliminated in the 2080–2099 period of RCP8.5 as extreme hot seasons become commonover all inhabited land areas, meaning that differences in the relative metric are insteadshaped by other climate indicators.
In addition to climate change hotspots, our metric also identifies areas that exhibitrelatively small aggregate response to global warming. For example, southern SouthAmerica and the Indian Peninsula consistently exhibit reduced magnitude of change inmean, variability and extremes of temperature and precipitation relative to other areas of theglobe (Figs. 3 and S2), suggesting that those regions could face reduced risk of increasingclimate-related stresses. However, areas that exhibit relatively low aggregate change couldstill be vulnerable to climate changes that occur in response to continued global warming.For example, in the 2080–2099 period of RCP8.5, at least 65 % of all seasons areextremely hot over all land areas, and at least 80 % of all seasons are extremely hot over
2046
-206
520
80-2
099
2016
-203
5JJA - RCP 8.5JJA - RCP 4.5
0 20 40 60 80 100%
Fig. 3 The occurrence of the 1986–2005 maximum June-July-August (JJA) seasonal temperature in the2016–2035, 2046–2065 and 2080–2099 periods of RCP8.5 (left) and RCP4.5 (right). The panels show theabsolute occurrences as the percent of years in each 20-year period. The frequency of occurrence of the 1986–2005 maximum JJA seasonal temperature value is, by definition, 5 % at each grid point during the 20-year1986–2005 period
818 Climatic Change (2012) 114:813–822
most land areas (Figs. 3 and S2). Frequent extreme heat could have substantial impacts onnatural and human systems (e.g., (Ciais et al. 2005; White et al. 2006; Schlenker and Roberts2009; Toomey et al. 2011; Diffenbaugh et al. 2012)), regardless of the global pattern ofrelative aggregate climate change.
Although the hotspot patterns appear to be robust to varying levels of greenhouse forcing(Fig. 1), the results are subject to other sources of uncertainty. For example, although theCMIP5 ensemble is unprecedented in its scope, the number of models and of realizations isinsufficient to span the full range of uncertainty in global climate sensitivity and regionalresponse to global warming (Taylor et al. 2012). As a result, although we haveattempted to give all models equal contribution to the ensemble mean (see SI), theresults reported here could be sensitive to the number of models included in theensemble, and to the number of realizations of each model. In addition, internal climatesystem variability could overwhelm the identified climate change patterns for timescales that are shorter than the multi-decadal scales explored here, meaning thatindividual decadal or sub-decadal periods could show different patterns of aggregateclimate anomalies.
4 Conclusions
Our statistical metric of multi-dimensional climate change identifies areas of the Amazon,the Sahel and tropical West Africa, Indonesia, and the Tibetan Plateau as regional climatechange hotspots that persist throughout the 21st century of both the RCP8.5 and RCP4.5forcing pathways. Comparisons of different periods of the two forcing pathways suggest thatthe magnitude of aggregate climate change varies relatively linearly with the magnitude ofglobal warming below approximately 2 °C of global warming (relative to the late-20th-century baseline). However, our metric also identifies areas of southern Africa, theMediterranean, the Arctic, and Central America/western North America as prominentregional climate change hotspots that emerge in response to higher levels of forcing,with areas of southern Africa, the Mediterranean, and the Arctic exhibiting late-21st-century climate change that is as large as that exhibited by the persistent hotspots. It ispossible that non-linear processes such as snow-albedo feedbacks and soil-precipitationinteractions (e.g., (Hall 2004; Diffenbaugh et al. 2005; Seneviratne et al. 2006;Diffenbaugh et al. 2007b; Quesada et al. 2012)) contribute to the emergence of theseaccelerating hotspots.
The primary discrepancies between our hotspot identification and that of Giorgi (2006)occur in the tropics, with the tropical hotspots in our analysis being strongly influenced byincreases in extreme seasons, which were not included in the analysis of Giorgi (2006). Thepattern of high and low aggregated change is quite similar to that reported by Baettig et al.(2007), who analyzed the occurrence of annual- and seasonal-scale extreme temperature andprecipitation in the CMIP3 ensemble, and with the pattern of “novel” and “disappearing”climates reported by Williams et al. (2007), who used the SED to analyze changes inseasonal temperature and precipitation as a fraction of the baseline variability. Our reportedpattern is also reflective of that reported by Beaumont et al. (2011), who emphasized anextreme temperature metric similar to ours, resulting in prominent tropical hotspots. Incontrast, our aggregated climate change patterns show less agreement with the climatechange “velocity” patterns of Sandel et al. (2011) and Loarie et al. (2009), which werefocused on the absolute rate of change of mean annual temperature, and showed greaterresponsiveness at mid and high latitudes.
Climatic Change (2012) 114:813–822 819
Our hotspot analysis has a number of possible applications. For instance, the identifiedpatterns of aggregate change provide a clear “fingerprint” for climate change detection andattribution studies. In addition, the pattern and relative magnitude of aggregate change atdifferent levels of global warming can inform mitigation decisions by helping to evaluate therelative magnitude of aggregate climate change that different regions face within a givenglobal warming target. Likewise, the hotspot analysis can also inform mitigation decisionsby identifying particular regions that exhibit increased relative change at higher levels ofglobal warming, as in the case of southern Africa, the Arctic and the Mediterranean in ouranalysis. Further, the patterns of aggregate change indicate which regions are likely to facethe greatest near-term climate change that is already committed through climate systeminertia. For instance, our analysis suggests that the most immediate emerging climate stressesare likely to be associated with extreme heat, with the most immediate intensification likelyto occur in tropical Africa, Indonesia, and parts of the Amazon.
It is important to stress that our analysis is constructed to quantify the relative responsivenessof physical climate in different regions, and not to imply the relativemagnitude of climate changeimpacts or of vulnerability to climate change. However, because our metric quantifies thedistance traveled in multi-dimensional climate space, it can provide a compact indicator ofpotential risk of climate change impacts. For example, in many systems, the impacts of climatechange are likely to be greatest where there are multiple environmental stresses (e.g., (Parsons1990; Helmuth et al. 2005; Smith et al. 2009)). The impacts of multiple stresses often result frominteractions that would not be predicted from the individual stresses themselves (e.g.,(Vinebrooke et al. 2004; Niinemets 2010)). As one example, analysis of the severe droughtsthat struck the Amazon in 2005 and 2010 shows that severe heat exacerbated the effects of drysoils to create losses in above-ground biomass that were not explained by moisture stress alone(Toomey et al. 2011). Our analysis suggests that for global warming of ~3.8 °C, the Amazonfaces combined risk of extreme heat and extreme drought that is greater than any other region.Therefore, in addition to identifying the Amazon as a region of particularly strong physicalclimate responsiveness, our analysis reveals the potential for particularly acute impacts arisingfrom existing ecosystem vulnerability to the combined effects of severe heat and severe drought.
Impacts and vulnerability assessments have increasingly recognized the importance ofmultiple stresses in shaping vulnerability to climate change (Fussel and Klein 2006; Smith etal. 2009; Ford et al. 2010). Although our hotspot identification does not consider any of thenon-climatic factors that will ultimately determine the impacts of climate change, byidentifying regions that exhibit the greatest total change across a range of climate variables,our analysis can provide a compact, quantitative guide for identifying regions wheremultiple climate stresses could become pronounced, thereby motivating more detailedvulnerability assessment. While specific impacts will clearly be shaped by the interactionof climate change with human and biological vulnerabilities, our identification of climatechange hotspots can help to inform mitigation and adaptation decisions by quantifyingthe rate, magnitude and causes of the aggregate climate response in different parts ofthe world.
Acknowledgements We thank two anonymous reviewers for insightful and constructive comments. Support fordata storage and analysis was provided by the Center for Computational Earth and Environmental Sciences (CEES)in the School of Earth Sciences at Stanford University. We acknowledge the World Climate Research Programme'sWorking Group on Coupled Modelling, which is responsible for CMIP, and we thank the climate modeling groups(listed in Table S1 of this paper) for producing and making available their model output. For CMIP the U.S.Department of Energy's Program for Climate Model Diagnosis and Intercomparison provides coordinating supportand led development of software infrastructure in partnership with the Global Organization for Earth SystemScience Portals. Our work was supported in part by NSF award 0955283 and NIH award 1R01AI090159-01.
820 Climatic Change (2012) 114:813–822
Open Access This article is distributed under the terms of the Creative Commons Attribution License whichpermits any use, distribution, and reproduction in any medium, provided the original author(s) and the sourceare credited.
References
Ackerly DD, Loarie SR et al (2010) The geography of climate change: implications for conservationbiogeography. Divers Distrib 16(3):476–487
Baettig MB, Wild M et al (2007) A climate change index: Where climate change may be most prominent inthe 21st century. Geophys Res Lett 34:L01705. doi:01710.01029/02006GL028159
Beaumont LJ, Pitman A et al (2011) Impacts of climate change on the world's most exceptional ecoregions.Proc Natl Acad Sci 108(6):2306–2311
Ciais P, Reichstein M et al (2005) Europe-wide reduction in primary productivity caused by the heat anddrought in 2003. Nature 437(7058):529–533
Davis SJ, Caldeira K et al (2010) Future CO2 emissions and climate change from existing energy infrastruc-ture. Science 329(5997):1330–1333
Diffenbaugh NS, Pal JS et al (2005) Fine-scale processes regulate the response of extreme events to globalclimate change. Proc Natl Acad Sci U S A 102(44):15774–15778
Diffenbaugh NS, Giorgi F et al (2007a) Indicators of 21st century socioclimatic exposure. Proc Natl Acad SciU S A 104(51):20195–20198
Diffenbaugh NS, Pal JS et al (2007b) Heat stress intensification in the Mediterranean climate change hotspot.Geophys Res Lett 34:L11706. doi:11710.11029/12007GL030000
Diffenbaugh NS, Giorgi F et al (2008) Climate change hotspots in the United States. Geophys Res Lett 35(inpress): doi:10.1029/2008GL035075.
Diffenbaugh NS, Hertel TW et al (2012) Response of corn markets to climate volatility under alternativeenergy futures. Nature Clim Change. doi:10.1038/nclimate1491
Ford JD, Keskitalo ECH et al (2010) Case study and analogue methodologies in climate change vulnerabilityresearch. Wiley Interdiscip Rev-Clim Chang 1(3):374–392
Fussel HM, Klein RJT (2006) Climate change vulnerability assessments: An evolution of conceptual thinking.Clim Chang 75(3):301–329
Giorgi F (2006) Climate change hot-spots. Geophys Res Lett 33(8):L08707. doi:08710.01029/02006GL025734Hall A (2004) The role of surface albedo feedback in climate. J Clim 17(7):1550–1568Helmuth B, Kingsolver JG et al (2005) Biophysics, physiologicalecology, and climate change: Does mech-
anism matter? Annu Rev Physiol 67:177–201IPCC, W. G. I (2007) Climate Change 2007: The Physical Science Basis: Contribution of Working Group I to
the Fourth Assessment Report of the Intergovernmental Panel on Climate Change. UK, CambridgeUniversity Press, Cambridge
Jones C, Liddicoat S et al (2010) Role of terrestrial ecosystems in determining CO2 stabilization and recoverybehaviour. Tellus Ser B-Chem Phys Meteorol 62(5):682–699
Loarie SR, Duffy PB et al (2009) The velocity of climate change. Nature 462(7276):U1052–U1111Matthews HD, Weaver AJ (2010) Committed climate warming. Nat Geosci 3(3):142–143Matthews HD, Gillett NP et al (2009) The proportionality of global warming to cumulative carbon emissions.
Nature 459(7248):829–832Meehl GA, Washington WM et al (2005) How much more global warming and sea level rise? Science 307
(5716):1769–1772Meinshausen M, Meinshausen N et al (2009) Greenhouse-gas emission targets for limiting global warming to
2 degrees C. Nature 458(7242):U1158–U1196Moss RH, Edmonds JA et al (2010) The next generation of scenarios for climate change research and
assessment. Nature 463(7282):747–756Niinemets U (2010) Responses of forest trees to single and multiple environmental stresses from seedlings to
mature plants: Past stress history, stress interactions, tolerance and acclimation. For Ecol Manag 260(10):1623–1639
Parsons PA (1990) The metabolic cost of multiple environmental stresses: implications for climatic-changeand conservation. Trends Ecol Evol 5(9):315–317
Quesada B, Vautard R et al (2012) Asymmetric European summer heat predictability from wet and drysouthern winters and springs. Nature Clim Change. doi:10.1038/nclimate1536
Rogelj J, Meinshausen M et al (2012) Global warming under old and new scenarios using IPCC climatesensitivity range estimates. Nat Clim Chang advance online publication
Climatic Change (2012) 114:813–822 821

Sandel B, Arge L et al (2011) The influence of late quaternary climate-change velocity on species endemism.Science 334(6056):660–664
Schlenker W, Roberts MJ (2009) Nonlinear temperature effects indicate severe damages to US crop yieldsunder climate change. Proc Natl Acad Sci U S A 106(37):15594–15598
Seneviratne SI, Luthi D et al (2006) Land-atmosphere coupling and climate change in Europe. Nature 443(7108):205–209
Smith JB, Schneider SH et al (2009) Assessing dangerous climate change through an update of theIntergovernmental Panel on Climate Change (IPCC) “reasons for concern”. Proc Natl Acad Sci U S A106(11):4133–4137
Taylor KE, Stouffer RJ et al (2012) An overview of CMIP5 and the experiment design. Bull AmMeteorol Soc93(4):485–498
Toomey M, Roberts DA et al (2011) Remotely sensed heat anomalies linked with Amazonian forest biomassdeclines. Geophys Res Lett 38:L19704. doi:19710.11029/12011GL049041
UNFCCC (2009) The Copenhagen Accord, The United Nations.Vinebrooke RD, Cottingham KL et al (2004) Impacts of multiple stressors on biodiversity and ecosystem
functioning: the role of species co-tolerance. Oikos 104(3):451–457White MA, Diffenbaugh NS et al (2006) Extreme heat reduces and shifts United States premium wine
production in the 21st century. Proc Natl Acad Sci 103(30):11217–11222Williams JW, Jackson ST et al (2007) Projected distributions of novel and disappearing climates by 2100AD.
Proc Natl Acad Sci 104(14):5738–5742
822 Climatic Change (2012) 114:813–822
Related Documents