A controlled copy of this document is maintained in the CDR Program Library. Approved for public release. Distribution is unlimited. Climate Data Record (CDR) Program Climate Algorithm Theoretical Basis Document (C-ATBD) Global Historical Climatology Network-Monthly (GHCN-M) Mean Temperature (Version 4) CDR Program Document Number: CDRP-ATBD-0859 Configuration Item Number: 03CWC001 Revision 1 / October 23, 2018

Welcome message from author
This document is posted to help you gain knowledge. Please leave a comment to let me know what you think about it! Share it to your friends and learn new things together.
Transcript
A controlled copy of this document is maintained in the CDR Program Library. Approved for public release. Distribution is unlimited.
Climate Data Record (CDR) Program Climate Algorithm Theoretical Basis Document (C-ATBD)
Global Historical Climatology Network-Monthly (GHCN-M) Mean Temperature (Version 4)
CDR Program Document Number: CDRP-ATBD-0859 Configuration Item Number: 03CWC001 Revision 1 / October 23, 2018
CDR Program Global Historical Climatology Network-Monthly Mean Temperature C-ATBD CDRP-ATBD-0859 Rev. 1 10/23/2018
A controlled copy of this document is maintained in the CDR Program Library. Approved for public release. Distribution is unlimited.
2
REVISION HISTORY
Rev. Author DSR No. Description Date
0 Jay Lawrimore DSR-1096
Initial Submission to CDR Program 12/01/2016
1 Jay Lawrimore DSR-1289
New quality control algorithms added (global extremes, streak check), treatment of high latitude stations (section 3.5.4) added.
10/23/2018
CDR Program Global Historical Climatology Network-Monthly Mean Temperature C-ATBD CDRP-ATBD-0859 Rev. 1 10/23/2018
A controlled copy of this document is maintained in the CDR Program Library. Approved for public release. Distribution is unlimited.
3
TABLE of CONTENTS
1. INTRODUCTION .............................................................................................................................. 5 1.1 Purpose ..................................................................................................................................................... 5 1.2 Definitions................................................................................................................................................. 5 1.3 Referencing this Document ....................................................................................................................... 5 1.4 Document Maintenance ............................................................................................................................ 6
2. DATASET OVERVIEW ................................................................................................................... 7 2.1 Dataset Descriptions ................................................................................................................................. 7 2.2 In situ Instrument Characteristics ............................................................................................................ 11
3. ALGORITHM DESCRIPTION ...................................................................................................... 12 3.1 Algorithm Overview ................................................................................................................................ 12 3.2 Processing Outline................................................................................................................................... 12 3.3 Data Sources and Updates ...................................................................................................................... 13
3.3.1 ISTI Databank Historical Data Sources ................................................................................................... 13 3.3.2 Data Merging of Historical Data ............................................................................................................ 16 3.3.3 Near Real-Time Updates ........................................................................................................................ 19 3.3.4 Forward Models ..................................................................................................................................... 20
3.4 Quality Control Process ........................................................................................................................... 20 3.4.1 Fully Automated Checks ........................................................................................................................ 25 3.4.2 Interactive Checks .................................................................................................................................. 28
3.5 Homogeneity Testing and Correction ...................................................................................................... 29 3.5.1 History and Overview ............................................................................................................................ 29 3.5.2 Pairwise Homogeneity Algorithm .......................................................................................................... 29 3.5.3 Time of Observation Bias ....................................................................................................................... 33 3.5.4 Comparison to v3 and Treatment of High Latitude Stations ................................................................. 34
3.6 Base Period Estimation ........................................................................................................................... 34 3.7 Dataset Output and Version Control ....................................................................................................... 35
4. TESTING AND VALIDATION ..................................................................................................... 36 4.1 Test Input Datasets ................................................................................................................................. 36 4.2 Test Output Analysis ............................................................................................................................... 36
4.2.1 Reproducibility ....................................................................................................................................... 36 4.2.2 Precision and Accuracy .......................................................................................................................... 37 4.2.3 Error Budget ........................................................................................................................................... 37
5. PRACTICAL CONSIDERATIONS ................................................................................................ 39 5.1 Quality Assessment and Diagnostics ....................................................................................................... 39 5.2 Processing Environment and Resources .................................................................................................. 39
5.2.1 Operational Deployments ...................................................................................................................... 39 5.2.2 Change Management............................................................................................................................. 40
5.3 Quality Assessment and Diagnostics ....................................................................................................... 41 5.4 Exception Handling ................................................................................................................................. 41

CDR Program Global Historical Climatology Network-Monthly Mean Temperature C-ATBD CDRP-ATBD-0859 Rev. 1 10/23/2018
A controlled copy of this document is maintained in the CDR Program Library. Approved for public release. Distribution is unlimited.
4
5.5 Algorithm Validation ............................................................................................................................... 42 5.6 Processing Environment and Resources .................................................................................................. 43
6. ASSUMPTIONS AND LIMITATIONS ........................................................................................ 44 6.1 Algorithm Performance ........................................................................................................................... 44 6.2 Sensor Performance ................................................................................................................................ 44
7. FUTURE ENHANCEMENTS......................................................................................................... 45
8. REFERENCES .................................................................................................................................. 46
APPENDIX A. ACRONYMS AND ABBREVIATIONS..................................................................... 49
LIST of FIGURES
Figure 1: Location of the ~26,000 stations in the GHCNm v4 inventory. ............................................................. 8
Figure 2. Number of Stations in GHCNm version 4. ..................................................................................................... 9
Figure 3. Global percent land coverage ......................................................................................................................... 10
Figure 4. GHCNm v4 level 0 flow diagram. ................................................................................................................... 13
Figure 5. GHCNm v4 level 1 flow diagram. ................................................................................................................... 24
Figure 6. Magnitude and timing of shifts ...................................................................................................................... 31
Figure 7. Histogram of the distribution of shifts ......................................................................................................... 32
Figure 8. Total Uncertainty for GHCNm v4. Darker greys show homogenization uncertainties and the lighter greys show anomaly and spatial coverage uncertainties. ............................................................................ 38
Figure 9. Box plot depicting the range of CONUS average trends ........................................................................ 43
LIST of TABLES
Table 1: Source datasets from which the ISTI Databank and GHCNm were constructed. ..................... 15
Table 2. List of Quality Control checks applied to monthly temperatures. .............................................. 21
Table 3. GHCNm Output files ........................................................................................................................................ 35
CDR Program Global Historical Climatology Network-Monthly Mean Temperature C-ATBD CDRP-ATBD-0859 Rev. 1 10/23/2018
A controlled copy of this document is maintained in the CDR Program Library. Approved for public release. Distribution is unlimited.
5
1. Introduction
1.1 Purpose The purpose of this document is to describe the algorithms, software, and
datasets submitted to the National Centers for Environmental Information (NCEI) by the Dataset Section (DS), Climate Science Branch (CSB), Center for Weather and Climate (CWC) that are used to produce the Global Historical Climatology Network-Monthly (GHCNm) version 4 mean temperature dataset. Data are collected from NOAA in situ networks as well as other national and international providers. They are subjected to a series of processes that combine data from various sources, perform quality control, homogeneity corrections, and output the data for customer access and permanent archive. Customers include those internal and external to NCEI. The algorithms are defined by the computer programs (code) that accompany this document, and thus the intent here is to provide a guide to understanding those algorithms, the software, and datasets, from both a scientific perspective and in order to assist a software engineer performing an evaluation of the production and update process.
1.2 Definitions Following is a summary of the symbols used to define the algorithm.
The headings below may be modified as needed.
Spectral and directional parameters:
Not Applicable. (1)
Atmospheric parameters:
TMAX = Monthly mean maximum temperature. (2)
TMIN = Monthly mean minimum temperature
TAVG = Monthly mean temperature
Polynomial representations:
Not Applicable. (3)
1.3 Referencing this Document This document should be referenced as follows:
Global Historical Climatology Network-Monthly (GHCN-M) Mean Temperature (Version 4) - Climate Algorithm Theoretical Basis Document, NOAA Climate Data Record Program CDRP-ATBD-0859 Rev. 1 (2018).
CDR Program Global Historical Climatology Network-Monthly Mean Temperature C-ATBD CDRP-ATBD-0859 Rev. 1 10/23/2018
A controlled copy of this document is maintained in the CDR Program Library. Approved for public release. Distribution is unlimited.
6
1.4 Document Maintenance This document will be maintained in a manner consistent with version control
practices for NCEI. When a new version of the global land monthly process is developed, this document will be reviewed and edited as necessary to ensure it remains consistent with the current operational version.
CDR Program Global Historical Climatology Network-Monthly Mean Temperature C-ATBD CDRP-ATBD-0859 Rev. 1 10/23/2018
A controlled copy of this document is maintained in the CDR Program Library. Approved for public release. Distribution is unlimited.
7
2. Dataset Overview
2.1 Dataset Descriptions The first version of the Global Historical Climatology Network monthly (GHCNm)
dataset was released in 1992. This first version was built upon earlier data collection efforts including the decadal volumes of World Weather Records [Clayton, 1927] and the National Center for Atmospheric Research (NCAR) World Monthly Surface Station Climatology. Compiled from these sources plus 13 other datasets, version 1 included monthly mean temperature summaries from approximately 6000 land surface stations worldwide (Vose et al., 1992).
Efforts to acquire additional data sources through personal contacts and bilateral agreements continued through the mid-1990s and led to the release of version 2 in 1997 (Peterson and Vose, 1997). Version 2 of GHCNm, compiled from 31 source datasets, substantially improved coverage in data-sparse regions of the world relative to version 1, and expanded the total number of stations with mean monthly temperatures to 7280.
In 2011 GHCNm version 3 (Lawrimore et al. 2011) was developed to simplify and improve upon various aspects of the construction of the monthly mean temperature dataset. The effort focused primarily on monthly mean temperature, but monthly mean maximum and minimum temperature also benefited from the application of new bias correction and quality control practices. Version 3 retained the same number of stations as in version 2 but improved the bias correction process through application of the Pairwise Homogeneity Algorithm (PHA), removed duplicate data records and improved the overall quality control processes.
In large part GHCNm v4 uses the same quality control and bias correction algorithms as v3. The greatest difference from the previous version is a greatly expanded set of stations based on the large data holdings in GHCN-Daily (Menne et al. 2012) as well as additional station data collected as part of the International Surface Temperature Initiative databank effort (ISTI; Rennie et al. 2013). Although the ISTI databank contains approximately 35,000 stations, GHCNm v4 consists of approximately 26,000 stations (Figure 1). Stations with less than ten years of continuous data were excluded from GHCNm v4. The number of stations throughout the period of record (Figure 2) and the percent of land coverage (Figure 3) show the improvement in comparison to version 3. Minor updates to the PHA and quality control processes are also included in v4. In addition, as described in Menne et al. (2018), a more comprehensive uncertainty budget was calculated for GHCNm v4.

CDR Program Global Historical Climatology Network-Monthly Mean Temperature C-ATBD CDRP-ATBD-0859 Rev. 1 10/23/2018
A controlled copy of this document is maintained in the CDR Program Library. Approved for public release. Distribution is unlimited.
8
Figure 1: Location of the ~26,000 stations in the GHCNm v4 inventory. The color corresponds
to the number of years of data available for each station.

CDR Program Global Historical Climatology Network-Monthly Mean Temperature C-ATBD CDRP-ATBD-0859 Rev. 1 10/23/2018
A controlled copy of this document is maintained in the CDR Program Library. Approved for public release. Distribution is unlimited.
9
Figure 2. Number of Stations in GHCNm version 4.

CDR Program Global Historical Climatology Network-Monthly Mean Temperature C-ATBD CDRP-ATBD-0859 Rev. 1 10/23/2018
A controlled copy of this document is maintained in the CDR Program Library. Approved for public release. Distribution is unlimited.
10
Figure 3. Global percent land coverage ; GHCNm version 3 (blue line) and version 4 (red line) and version 4 (black line) when based period estimates are used (see Menne et al. 2018) for details.
Dataset construction through use of the ISTI Databank is described in section 3.2. The v4 quality control process is described in section 3.3, and homogeneity correction procedures are described in section 3.4.
The same version control process introduced in v3 is carried over to v4. The initial release is v4.0.0. The version number structure enables any minor, moderate, or major change to be indicated with the increment of a corresponding digit. A description of the version numbering system is described in Section 5.2.
The uncorrected and homogeneity corrected data are provided in separate files for mean temperature. A corresponding inventory file is also provided with each data file. The inventory file contains station id and associated metadata.

CDR Program Global Historical Climatology Network-Monthly Mean Temperature C-ATBD CDRP-ATBD-0859 Rev. 1 10/23/2018
A controlled copy of this document is maintained in the CDR Program Library. Approved for public release. Distribution is unlimited.
11
2.2 In situ Instrument Characteristics The in situ data which comprise the GHCNm datasets were collected from a
variety of surface observing systems. Although reasonably good records of instrument type and observing practices are maintained for stations in the U.S., the types of instrumentation and observing practices are most often unknown for stations outside the U.S. Since the 1990s there has been a transition to a greater use of fully automated sensors; however much of the data are still collected through manual observing practices, including from stations in the U.S. The networks from which these observations are collected include those designed primarily for climate purposes as well as networks designed primarily to support purposes such as aviation and weather forecasting.
Examples of instrumentation used in the U.S. include the Cooperative Observer Network’s liquid-in-glass thermometers within naturally aspirated Stevenson screens and Maximum/Minimum Temperature System (MMTS), the HO-83 hygrothermometer and model 1088 used by the Automated Surface Observing System (ASOS), and the Climate Reference Network’s Platinum Resistance Thermometer and fan aspirated shield.
When compared with automated observing systems of the 21st century, the reliance on manual observing methods increases the possibility of errors. This can occur during the initial measurement and recording of temperature observations on paper forms and is further exacerbated by the need to hand key data into digital records. Add to that the passage of decades and centuries since instrumental measurements were first made, as well as differences in language, and the potential for random errors further increases. This makes the implementation of quality control processes and ongoing development of quality control processes for current as well as historical data especially important (Section 3.3).
In addition to problems associated with random error, biases are often present due to factors that include changes in observing practices, instrument technologies, station environment, and station location that can occur through time. This requires the use of bias correction algorithms to remove the effect of such non-climatic factors on the climate record (Section 3.4).
CDR Program Global Historical Climatology Network-Monthly Mean Temperature C-ATBD CDRP-ATBD-0859 Rev. 1 10/23/2018
A controlled copy of this document is maintained in the CDR Program Library. Approved for public release. Distribution is unlimited.
12
3. Algorithm Description
3.1 Algorithm Overview The GHCNm dataset consists of station data from dozens of unique sources. In
terms of data volume, about 75% of all monthly values originate from the GHCN-Daily (GHCNd) dataset. Source data are either merged with existing records to create a longer or more complete station time series or a new station is added to the dataset. In some cases, when it is not possible to definitely determine if a station should be merged with an existing station or added as a new station, the additional station is withheld from the merge. The process for merging station data from the other sources is described in section 3.3.
All observations in the GHCNm data set are quality controlled (QC) to flag likely errors in the monthly temperature values. The QC consists of basic integrity, outlier, and spatial consistency checks, as described in section 3.4. In addition to errors of observation, nearly all weather stations, at some point during their history, undergo changes in the circumstances under which measurements are taken, such as changes in instrument technologies and maintenance, station location, station environment, or observing practices. Such modifications to the circumstances of recording near surface air temperature can cause systematic shifts in temperature readings from a station that are unrelated to any real variation in local weather and climate. The process of identifying and removing such artifacts in the climate record is described in section 3.5. Estimation of missing values during the 30-year base period in order to maximize the number of stations with anomalies over time, is discussed in section 3.6 and dataset output and version control procedures are included in section 3.7.
3.2 Processing Outline As shown in Figure 4 (Level 0 flow diagram), the v4 process consists of Data
source collection, Databank Near Real-time Updates, followed by GHCNm Processing which includes Quality Control, Bias Correction, and Output.

CDR Program Global Historical Climatology Network-Monthly Mean Temperature C-ATBD CDRP-ATBD-0859 Rev. 1 10/23/2018
A controlled copy of this document is maintained in the CDR Program Library. Approved for public release. Distribution is unlimited.
13
Figure 4. GHCNm v4 level 0 flow diagram.
The Data sources and near real-time update process are described in Section 3.2. A set of automated quality control processes are applied to all sources of GHCNm as described in section 3.3. Quality control checks described in that section are in addition to any dataset specific checks. For example QC checks designed specifically for multi-element summary of the day observations were applied to GHCN-Daily observations in the development and operational updates of that dataset and are not described in this document. In addition, quality control checks were applied externally to the WWR during development and operational updates of the dataset.
The homogeneity of all temperature observations are tested and corrected when possible using the Pairwise Homogeneity Algorithm (PHA) as described in section 3.4. For U.S. stations a Time of Observation bias adjustment is also applied. Dataset formats, output pathways, and version control processes are described in section 5.2.
3.3 Data Sources and Updates
3.3.1 ISTI Databank Historical Data Sources The source data for GHCNm v4 is the GHCNd dataset as well as the global
temperature databank that was developed as part of the International Surface
CDR Program Global Historical Climatology Network-Monthly Mean Temperature C-ATBD CDRP-ATBD-0859 Rev. 1 10/23/2018
A controlled copy of this document is maintained in the CDR Program Library. Approved for public release. Distribution is unlimited.
14
Temperature Initiative (ISTI). Data from 67 sources were combined using a fully automated merge algorithm that is based on metadata and data comparisons. Merging was accomplished by first prioritizing each source; GHCNd was assigned the highest priority. The list of prioritized sources is shown in Table 1.
CDR Program Global Historical Climatology Network-Monthly Mean Temperature C-ATBD CDRP-ATBD-0859 Rev. 1 10/23/2018
A controlled copy of this document is maintained in the CDR Program Library. Approved for public release. Distribution is unlimited.
15
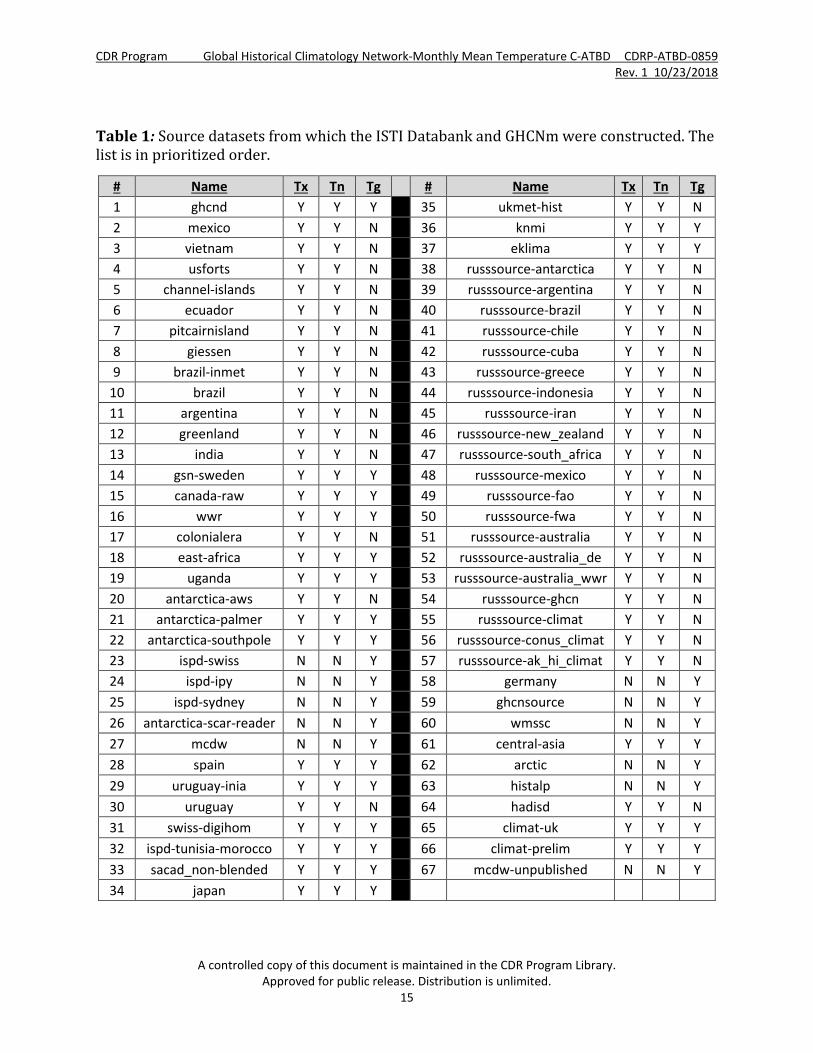
Table 1: Source datasets from which the ISTI Databank and GHCNm were constructed. The list is in prioritized order.
# Name Tx Tn Tg # Name Tx Tn Tg 1 ghcnd Y Y Y 35 ukmet-hist Y Y N 2 mexico Y Y N 36 knmi Y Y Y 3 vietnam Y Y N 37 eklima Y Y Y 4 usforts Y Y N 38 russsource-antarctica Y Y N 5 channel-islands Y Y N 39 russsource-argentina Y Y N 6 ecuador Y Y N 40 russsource-brazil Y Y N 7 pitcairnisland Y Y N 41 russsource-chile Y Y N 8 giessen Y Y N 42 russsource-cuba Y Y N 9 brazil-inmet Y Y N 43 russsource-greece Y Y N
10 brazil Y Y N 44 russsource-indonesia Y Y N 11 argentina Y Y N 45 russsource-iran Y Y N 12 greenland Y Y N 46 russsource-new_zealand Y Y N 13 india Y Y N 47 russsource-south_africa Y Y N 14 gsn-sweden Y Y Y 48 russsource-mexico Y Y N 15 canada-raw Y Y Y 49 russsource-fao Y Y N 16 wwr Y Y Y 50 russsource-fwa Y Y N 17 colonialera Y Y N 51 russsource-australia Y Y N 18 east-africa Y Y Y 52 russsource-australia_de Y Y N 19 uganda Y Y Y 53 russsource-australia_wwr Y Y N 20 antarctica-aws Y Y N 54 russsource-ghcn Y Y N 21 antarctica-palmer Y Y Y 55 russsource-climat Y Y N 22 antarctica-southpole Y Y Y 56 russsource-conus_climat Y Y N 23 ispd-swiss N N Y 57 russsource-ak_hi_climat Y Y N 24 ispd-ipy N N Y 58 germany N N Y 25 ispd-sydney N N Y 59 ghcnsource N N Y 26 antarctica-scar-reader N N Y 60 wmssc N N Y 27 mcdw N N Y 61 central-asia Y Y Y 28 spain Y Y Y 62 arctic N N Y 29 uruguay-inia Y Y Y 63 histalp N N Y 30 uruguay Y Y N 64 hadisd Y Y N 31 swiss-digihom Y Y Y 65 climat-uk Y Y Y 32 ispd-tunisia-morocco Y Y Y 66 climat-prelim Y Y Y 33 sacad_non-blended Y Y Y 67 mcdw-unpublished N N Y 34 japan Y Y Y

CDR Program Global Historical Climatology Network-Monthly Mean Temperature C-ATBD CDRP-ATBD-0859 Rev. 1 10/23/2018
A controlled copy of this document is maintained in the CDR Program Library. Approved for public release. Distribution is unlimited.
16
3.3.2 Data Merging of Historical Data
3.3.2.1 Metadata comparisons
Using the source priority list, each candidate station is run through all the target stations and four metadata criteria calculated as the first test to identify matching stations. This process takes into account the likelihood that the same station from two sources may have different precision values for longitude, latitude and elevation between sources. The station names may also differ, particularly for countries that were once colonial and have subsequently gained independence, or the phonetic spelling of names that may differ by source.
Using the latitudes and longitudes, the geographical distance between the two stations is computed. The distance is then fitted to an exponential decay function (which decays to nearly zero at 100km distance), and a metric between the two stations is determined, where 0 corresponds to no match and 1 represents a perfect match. Next, the same approach is performed using the height difference between two stations (here the exponential decays to nearly zero at 500m height difference). Third, a comparison of when the data record began is made. Although not always the case, there is a higher chance the candidate station matches with a target station if they start at or near the same year. Therefore an exponential decay function is applied if the start years fall within 10 years of each other. Finally, the similarity of the station name is considered. This is done using the Jaccard Index (JI) (Jaccard, 1901), which is defined as the intersection divided by the union of two sample sets, A and B:
In other words, JI will look for cases in which certain letters exist in both station names, as well as the number of times letters occur in one name, but not in the other. Once the ratio is known, a probability is calculated. One drawback to JI is that it does not take into account the position of the character within the word. Therefore anagrams (i.e. TOKYO and KYOTO) would have a perfect JI of 1.
Each individual metadata criteria has a value from 0 to 1, which are then combined to form a posterior metric of possible station match, known as the metadata metric.
𝑚𝑚𝑚𝑚𝑚𝑚𝑚𝑚𝑚𝑚𝑚𝑚𝑚𝑚𝑚𝑚 𝑚𝑚𝑚𝑚𝑚𝑚𝑚𝑚𝑚𝑚𝑚𝑚
= (9 ∗ 𝑚𝑚𝑚𝑚𝑑𝑑𝑚𝑚) + (1 ∗ ℎ𝑚𝑚𝑚𝑚𝑒𝑒ℎ𝑚𝑚) + (2.5 ∗ 𝑦𝑦𝑚𝑚𝑚𝑚𝑚𝑚𝑇𝑇𝑇𝑇𝑇𝑇𝑇𝑇) + (2.5 ∗ 𝑦𝑦𝑚𝑚𝑚𝑚𝑚𝑚𝑇𝑇𝑇𝑇𝑇𝑇𝑇𝑇) + (5 ∗ 𝐽𝐽𝐽𝐽)
20
Weights are given to each criteria based on the reliability of each. Since the latitude and longitude should not have changed unless there has been a station relocation,

CDR Program Global Historical Climatology Network-Monthly Mean Temperature C-ATBD CDRP-ATBD-0859 Rev. 1 10/23/2018
A controlled copy of this document is maintained in the CDR Program Library. Approved for public release. Distribution is unlimited.
17
it is given the highest weight. The height of the station is more often inaccurate or missing entirely, so it is given the lowest weight. If the metadata metric surpasses a threshold of 0.75, an evaluation based on data comparisons is then made. The threshold is set relatively low to account for possible errors in the metadata. If any of the criteria are missing, the equation is re-adjusted, with the exception of missing latitude and longitude, where the candidate station is withheld.
If none of the comparisons between the candidate station and all the target stations pass the metadata threshold, a review of each metadata criteria is performed. If two of the values are greater than 0.90, then there is the possibility that incorrect metadata within the candidate station has corrupted the overall metadata metric. When this occurs, the candidate station is withheld. If this is not the case, it is determined that the candidate station is unique and it is added to the target dataset without any further tests being performed.
3.3.2.2 Data Comparisons
For any of the stations that pass the metadata threshold, a data comparison is made between that target station and candidate station. In order to have a reliable data comparison, there is a minimum overlap threshold between the two stations of 12 months. If this threshold is met, the data comparison is performed using the Index of Agreement (IA) (Willmott, 1981).
IA is a “goodness-of-fit” measure and is defined as the ratio between the mean square error and the potential error. It was designed to overcome issues of correlation measures such as the coefficient of determination. These methods are insensitive to differences in both mean and variance between the target and candidate station, and the presence of outliers would lead to higher values due to the squaring of terms. A modified version of IA (Willmott et al., 1985; Legates and McCabe, 1999) is used where the squared term is removed, and is the equation used during the data comparison stage of the merge program:
𝐽𝐽𝐼𝐼 = 1.0 − ∑ |𝑇𝑇𝑖𝑖 −𝑛𝑛𝑖𝑖=𝑖𝑖 𝐶𝐶𝑖𝑖|
∑ |𝐶𝐶𝑖𝑖 − 𝑇𝑇| + |𝑇𝑇𝑖𝑖 − 𝑇𝑇|𝑛𝑛𝑖𝑖=1
Where Ti and Ci are corresponding monthly values for the target and candidate stations (respectively) and 𝑇𝑇� is the mean of the target station. Note that the mean of the candidate station is not used. Between a candidate and target station, IA is calculated first to the overlapping TMAX and then the overlapping TMIN. Resulting values range between 0 and 1. While these are considered a “goodness-of-fit” comparison, IA does not take into account the number of months (n) of overlap. Although the minimum requirement is 5 years, there could be 50 or more years of overlap. This may lead to a bias, with higher IA occurring for longer periods of overlap.
CDR Program Global Historical Climatology Network-Monthly Mean Temperature C-ATBD CDRP-ATBD-0859 Rev. 1 10/23/2018
A controlled copy of this document is maintained in the CDR Program Library. Approved for public release. Distribution is unlimited.
18
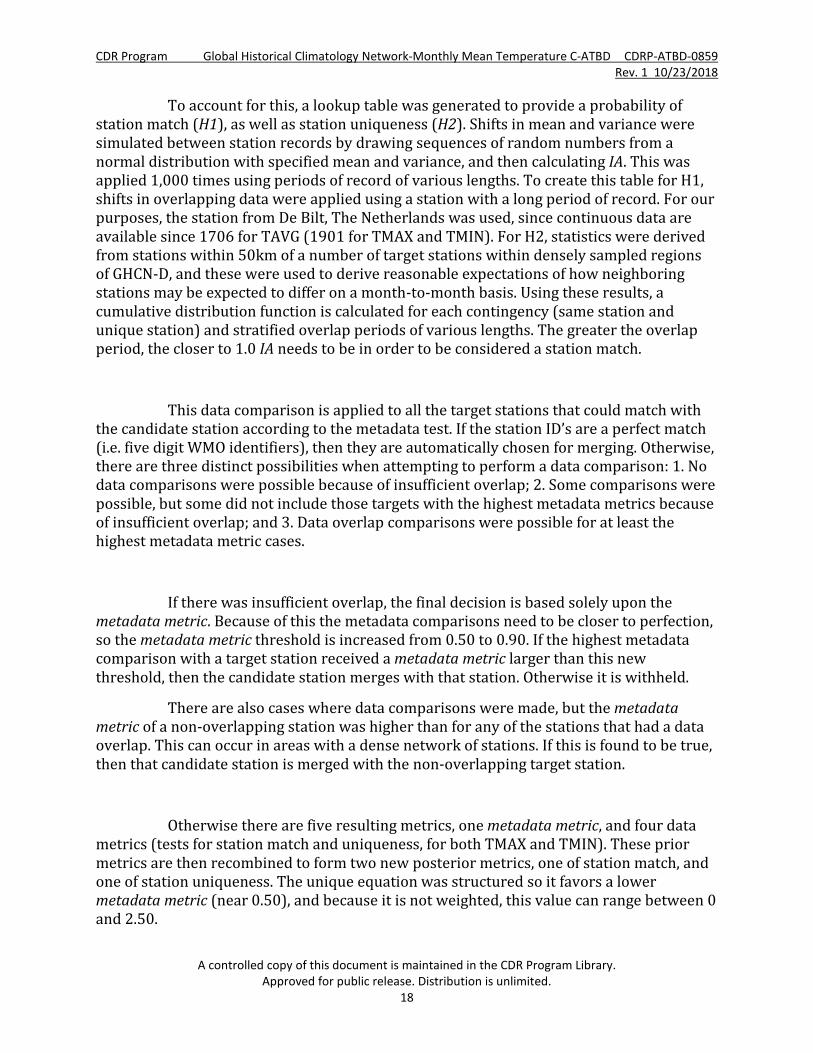
To account for this, a lookup table was generated to provide a probability of station match (H1), as well as station uniqueness (H2). Shifts in mean and variance were simulated between station records by drawing sequences of random numbers from a normal distribution with specified mean and variance, and then calculating IA. This was applied 1,000 times using periods of record of various lengths. To create this table for H1, shifts in overlapping data were applied using a station with a long period of record. For our purposes, the station from De Bilt, The Netherlands was used, since continuous data are available since 1706 for TAVG (1901 for TMAX and TMIN). For H2, statistics were derived from stations within 50km of a number of target stations within densely sampled regions of GHCN-D, and these were used to derive reasonable expectations of how neighboring stations may be expected to differ on a month-to-month basis. Using these results, a cumulative distribution function is calculated for each contingency (same station and unique station) and stratified overlap periods of various lengths. The greater the overlap period, the closer to 1.0 IA needs to be in order to be considered a station match.
This data comparison is applied to all the target stations that could match with the candidate station according to the metadata test. If the station ID’s are a perfect match (i.e. five digit WMO identifiers), then they are automatically chosen for merging. Otherwise, there are three distinct possibilities when attempting to perform a data comparison: 1. No data comparisons were possible because of insufficient overlap; 2. Some comparisons were possible, but some did not include those targets with the highest metadata metrics because of insufficient overlap; and 3. Data overlap comparisons were possible for at least the highest metadata metric cases.
If there was insufficient overlap, the final decision is based solely upon the metadata metric. Because of this the metadata comparisons need to be closer to perfection, so the metadata metric threshold is increased from 0.50 to 0.90. If the highest metadata comparison with a target station received a metadata metric larger than this new threshold, then the candidate station merges with that station. Otherwise it is withheld.
There are also cases where data comparisons were made, but the metadata metric of a non-overlapping station was higher than for any of the stations that had a data overlap. This can occur in areas with a dense network of stations. If this is found to be true, then that candidate station is merged with the non-overlapping target station.
Otherwise there are five resulting metrics, one metadata metric, and four data metrics (tests for station match and uniqueness, for both TMAX and TMIN). These prior metrics are then recombined to form two new posterior metrics, one of station match, and one of station uniqueness. The unique equation was structured so it favors a lower metadata metric (near 0.50), and because it is not weighted, this value can range between 0 and 2.50.
CDR Program Global Historical Climatology Network-Monthly Mean Temperature C-ATBD CDRP-ATBD-0859 Rev. 1 10/23/2018
A controlled copy of this document is maintained in the CDR Program Library. Approved for public release. Distribution is unlimited.
19
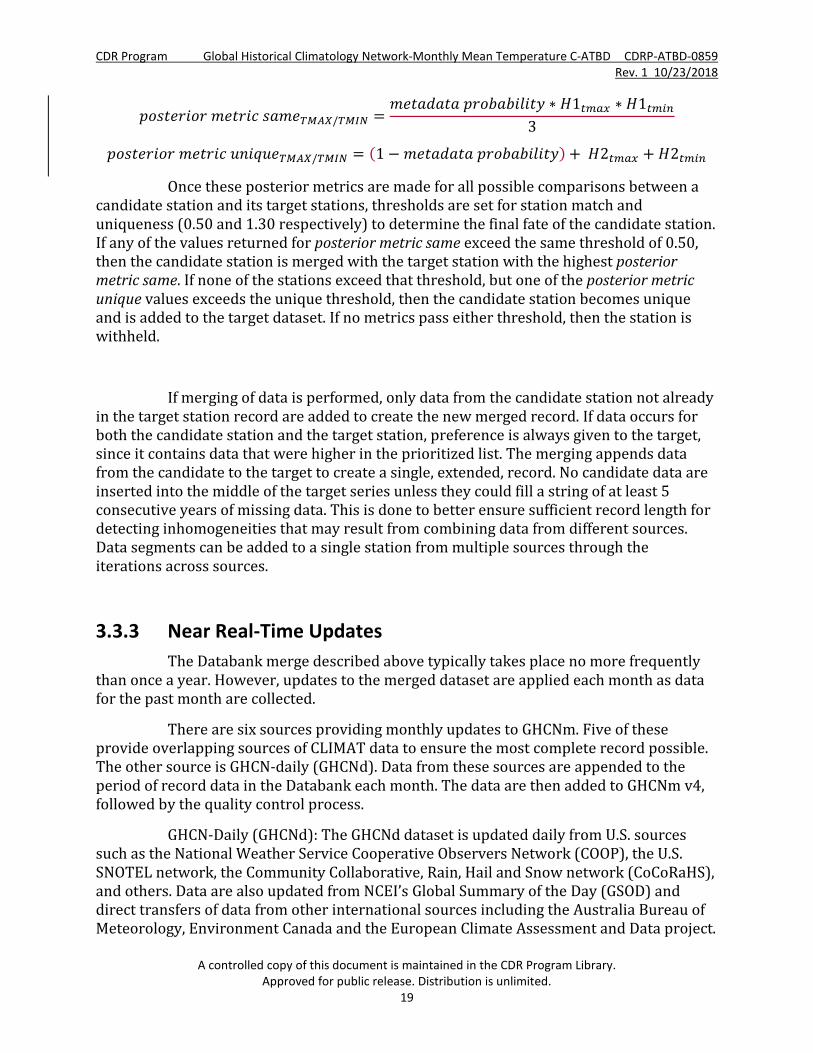
𝑝𝑝𝑝𝑝𝑑𝑑𝑚𝑚𝑚𝑚𝑚𝑚𝑚𝑚𝑝𝑝𝑚𝑚 𝑚𝑚𝑚𝑚𝑚𝑚𝑚𝑚𝑚𝑚𝑚𝑚 𝑑𝑑𝑚𝑚𝑚𝑚𝑚𝑚𝑇𝑇𝑇𝑇𝑇𝑇𝑇𝑇/𝑇𝑇𝑇𝑇𝑇𝑇𝑇𝑇 =𝑚𝑚𝑚𝑚𝑚𝑚𝑚𝑚𝑚𝑚𝑚𝑚𝑚𝑚𝑚𝑚 𝑝𝑝𝑚𝑚𝑝𝑝𝑝𝑝𝑚𝑚𝑝𝑝𝑚𝑚𝑝𝑝𝑚𝑚𝑚𝑚𝑦𝑦 ∗ 𝐻𝐻1𝑡𝑡𝑡𝑡𝑡𝑡𝑡𝑡 ∗ 𝐻𝐻1𝑡𝑡𝑡𝑡𝑖𝑖𝑛𝑛
3
𝑝𝑝𝑝𝑝𝑑𝑑𝑚𝑚𝑚𝑚𝑚𝑚𝑚𝑚𝑝𝑝𝑚𝑚 𝑚𝑚𝑚𝑚𝑚𝑚𝑚𝑚𝑚𝑚𝑚𝑚 𝑢𝑢𝑢𝑢𝑚𝑚𝑢𝑢𝑢𝑢𝑚𝑚𝑇𝑇𝑇𝑇𝑇𝑇𝑇𝑇/𝑇𝑇𝑇𝑇𝑇𝑇𝑇𝑇 = (1 −𝑚𝑚𝑚𝑚𝑚𝑚𝑚𝑚𝑚𝑚𝑚𝑚𝑚𝑚𝑚𝑚 𝑝𝑝𝑚𝑚𝑝𝑝𝑝𝑝𝑚𝑚𝑝𝑝𝑚𝑚𝑝𝑝𝑚𝑚𝑚𝑚𝑦𝑦) + 𝐻𝐻2𝑡𝑡𝑡𝑡𝑡𝑡𝑡𝑡 + 𝐻𝐻2𝑡𝑡𝑡𝑡𝑖𝑖𝑛𝑛
Once these posterior metrics are made for all possible comparisons between a candidate station and its target stations, thresholds are set for station match and uniqueness (0.50 and 1.30 respectively) to determine the final fate of the candidate station. If any of the values returned for posterior metric same exceed the same threshold of 0.50, then the candidate station is merged with the target station with the highest posterior metric same. If none of the stations exceed that threshold, but one of the posterior metric unique values exceeds the unique threshold, then the candidate station becomes unique and is added to the target dataset. If no metrics pass either threshold, then the station is withheld.
If merging of data is performed, only data from the candidate station not already in the target station record are added to create the new merged record. If data occurs for both the candidate station and the target station, preference is always given to the target, since it contains data that were higher in the prioritized list. The merging appends data from the candidate to the target to create a single, extended, record. No candidate data are inserted into the middle of the target series unless they could fill a string of at least 5 consecutive years of missing data. This is done to better ensure sufficient record length for detecting inhomogeneities that may result from combining data from different sources. Data segments can be added to a single station from multiple sources through the iterations across sources.
3.3.3 Near Real-Time Updates The Databank merge described above typically takes place no more frequently
than once a year. However, updates to the merged dataset are applied each month as data for the past month are collected.
There are six sources providing monthly updates to GHCNm. Five of these provide overlapping sources of CLIMAT data to ensure the most complete record possible. The other source is GHCN-daily (GHCNd). Data from these sources are appended to the period of record data in the Databank each month. The data are then added to GHCNm v4, followed by the quality control process.
GHCN-Daily (GHCNd): The GHCNd dataset is updated daily from U.S. sources such as the National Weather Service Cooperative Observers Network (COOP), the U.S. SNOTEL network, the Community Collaborative, Rain, Hail and Snow network (CoCoRaHS), and others. Data are also updated from NCEI’s Global Summary of the Day (GSOD) and direct transfers of data from other international sources including the Australia Bureau of Meteorology, Environment Canada and the European Climate Assessment and Data project.

CDR Program Global Historical Climatology Network-Monthly Mean Temperature C-ATBD CDRP-ATBD-0859 Rev. 1 10/23/2018
A controlled copy of this document is maintained in the CDR Program Library. Approved for public release. Distribution is unlimited.
20
The GHCN-Daily temperature data are converted to monthly means at the end of each month as part of the ISTI Databank update process.
NCEI-GTS ASCII: This is the primary source of CLIMAT data, providing preliminary observations for the preceding month. The data are typically transmitted by WMO member nations over the Global Telecommunications System (GTS) between the 2nd and 10th of each month.
NWS-GTS BUFR: This source was established when countries began transmitting CLIMAT data in BUFR format. The National Weather Service NCEP/CO Production Management Branch provides NCEI’s Data Operations branch with access to a private NWS ftp server where they place CLIMAT messages transmitted in BUFR format. These are messages with the header “ISC*”.
NWS-public ftp ASCII: The National Weather Service provides publicly accessible CLIMAT data in the transmitted ASCII format. The data are available at ftp://tgftp.nws.noaa.gov/data/raw/cs/ .
UK CLIMAT: The UK Met Office provides quality controlled CLIMAT data on or around the 20th of each month for the previous observation month. The data are available at http://www.metoffice.gov.uk/hadobs/crutem4/data/climat_summary/ .
MCDW monthly: Late and corrected CLIMAT reports are added through delayed monthly updates of the Monthly Climatic Data for the World (MCDW) dataset. The MCDW data product which is produced at NCEI consists of a collection of all CLIMAT data and includes late and corrected reports which are provided by some countries via e-mail. The MCDW data are typically available two to three months after the data month and help to fill in reports not collected as part of initial GTS transmission.
3.3.4 Forward Models
Not Applicable
3.4 Quality Control Process Following data collection and integration, quality control is performed to
identify observations that are likely erroneous. Most of the QC checks are described in Section 3.3 of Lawrimore et al. (2011). Four new checks have been developed since the original release of v3. These consist of (1) an inter-station duplicate check, (2) a spatial z-Score comparison check, (3) a streak check, and (4) a world record extremes check (see Table 2).
CDR Program Global Historical Climatology Network-Monthly Mean Temperature C-ATBD CDRP-ATBD-0859 Rev. 1 10/23/2018
A controlled copy of this document is maintained in the CDR Program Library. Approved for public release. Distribution is unlimited.
21
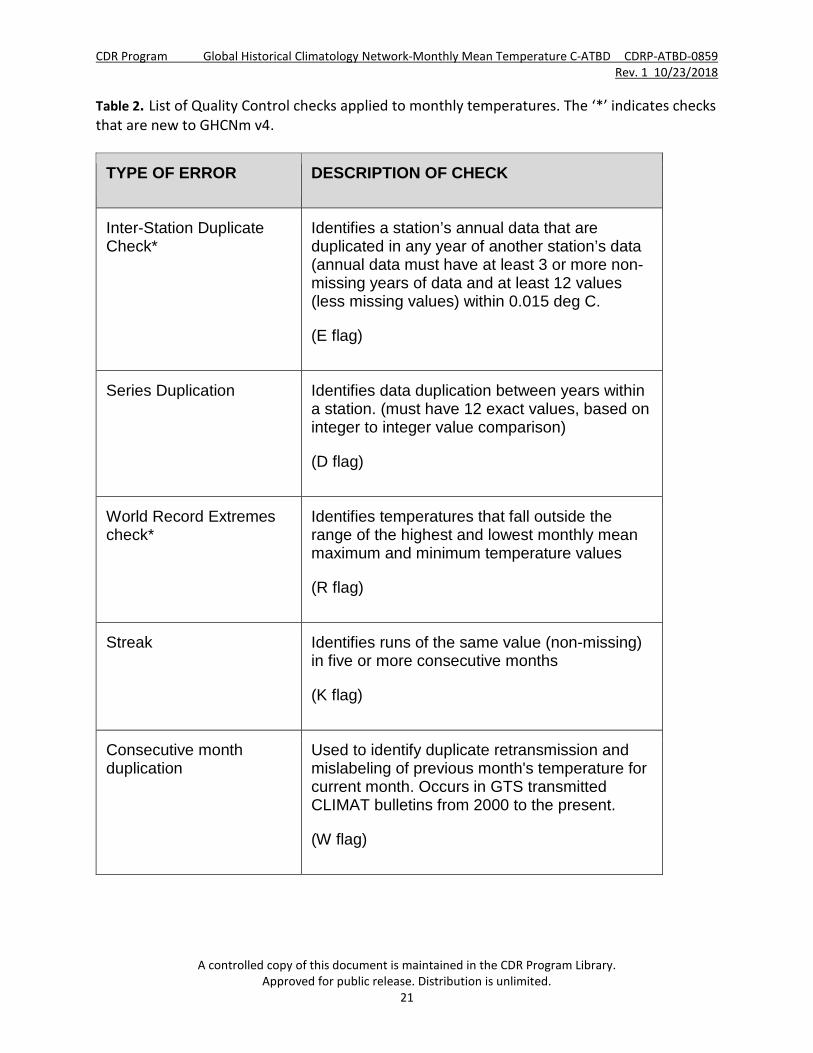
Table 2. List of Quality Control checks applied to monthly temperatures. The ‘*’ indicates checks that are new to GHCNm v4.
TYPE OF ERROR DESCRIPTION OF CHECK
Inter-Station Duplicate Check*
Identifies a station’s annual data that are duplicated in any year of another station’s data (annual data must have at least 3 or more non-missing years of data and at least 12 values (less missing values) within 0.015 deg C.
(E flag)
Series Duplication Identifies data duplication between years within a station. (must have 12 exact values, based on integer to integer value comparison)
(D flag)
World Record Extremes check*
Identifies temperatures that fall outside the range of the highest and lowest monthly mean maximum and minimum temperature values
(R flag)
Streak Identifies runs of the same value (non-missing) in five or more consecutive months
(K flag)
Consecutive month duplication
Used to identify duplicate retransmission and mislabeling of previous month's temperature for current month. Occurs in GTS transmitted CLIMAT bulletins from 2000 to the present.
(W flag)

CDR Program Global Historical Climatology Network-Monthly Mean Temperature C-ATBD CDRP-ATBD-0859 Rev. 1 10/23/2018
A controlled copy of this document is maintained in the CDR Program Library. Approved for public release. Distribution is unlimited.
22
Isolated value Identifies months that are isolated in time. One to three consecutive months of non-missing values are identified and flagged when they are separated from other non-missing months by 18 or more consecutive months of missing values both before and after the one to three months that are isolated.
(L flag)
Climatological Outlier Identifies temperatures that exceed their respective climatological means for the corresponding station and calendar month by at least five standard deviations using bi-weight mean and bi-weight standard deviation (Lanzante, 1996)
(O flag)
Spatial inconsistency 1 Flags value when the station z-score satisfies any of the following algorithm conditions.
Definitions: neighbor = any station within 500 km of target station. z-score = (bi-weight standard deviation / bi-weight mean) S(Z) = station's z-score N(Z) = the set of the "5" closest non-missing neighbor z-scores. (Note: this set may contain less than 5 neighbors, but must have at least one neighbor z-score for algorithm execution)

CDR Program Global Historical Climatology Network-Monthly Mean Temperature C-ATBD CDRP-ATBD-0859 Rev. 1 10/23/2018
A controlled copy of this document is maintained in the CDR Program Library. Approved for public release. Distribution is unlimited.
23
Algorithm: S(Z) >= 4.0 and < 5.0 and "all" N(Z) < 1.9 S(Z) >= 3.0 and < 4.0 and "all" N(Z) < 1.8 S(Z) >= 2.75 and < 3.0 and "all" N(Z) < 1.7 S(Z) >= 2.5 and < 2.75 and "all" N(Z) < 1.6 S(Z) <= -4.0 and > -5.0 and "all" N(Z) > -1.9 S(Z) <= -3.0 and > -4.0 and "all" N(Z) > -1.8 S(Z) <= -2.75 and > -3.0 and "all" N(Z) > -1.7 S(Z) <= -2.5 and > -2.75 and "all" N(Z) > -1.6
(S flag)
Spatial inconsistency 2* Identifies when the temperature z-score compared to the inverse distance weighted z-score of all neighbors within 500 km (at least 2 or more neighbors are required) is greater than or equal to 3.0.
(T flag)

CDR Program Global Historical Climatology Network-Monthly Mean Temperature C-ATBD CDRP-ATBD-0859 Rev. 1 10/23/2018
A controlled copy of this document is maintained in the CDR Program Library. Approved for public release. Distribution is unlimited.
24
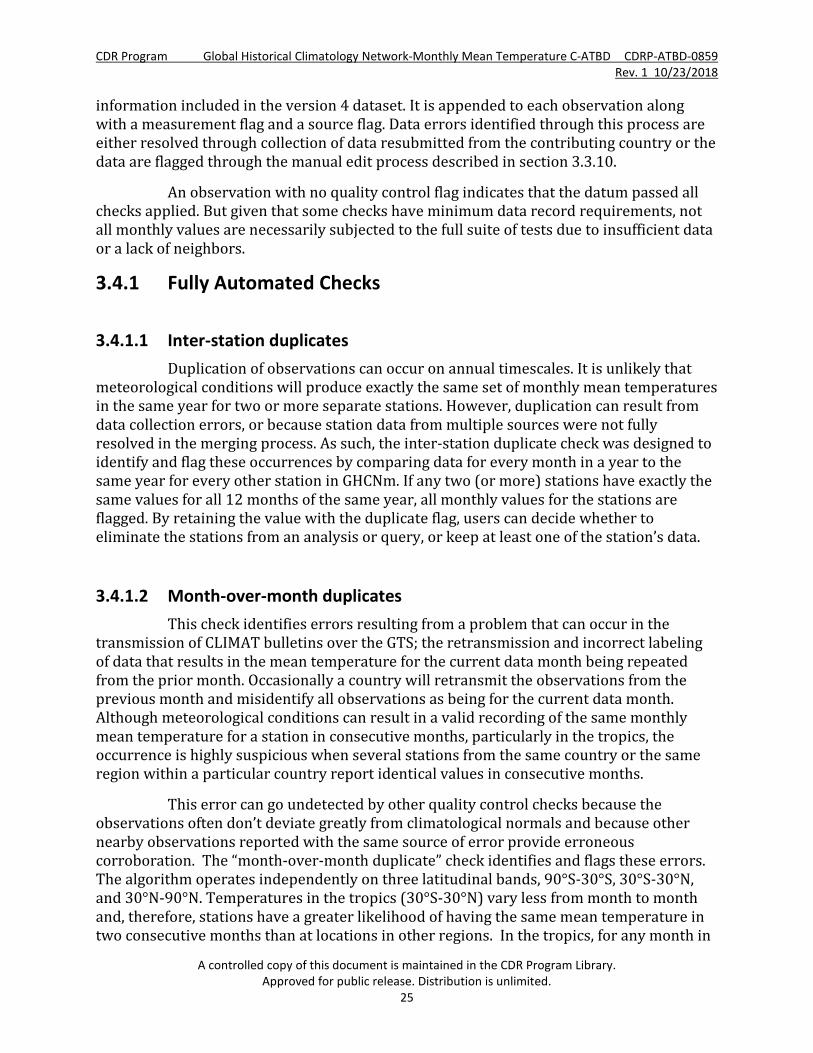
The QC process is fully automated and consists of basic integrity, outlier, and spatial consistency checks (Durre et al., 2010). The full period of record is quality controlled each time the process is executed to ensure the QC assessment can capitalize on the full period of record as new observations are added. The GHCNm QC process suite is executed at a time specified in a Unix crontab and shown in the level 1 flow diagram (Figure 5).
Figure 5. GHCNm v4 level 1 flow diagram.
The results of the quality screening is indicated by a QC flag (flag 2). Each QC check was designed to have a low false positive rate in an effort to minimize the likelihood that valid observations will be erroneously flagged. A QC flag can be overridden if later found by expert assessment to be inaccurate. Any changes made to QC flags set during the automated process are documented in NCEI’s Datzilla system.
The automated GHCNm quality control checks are grouped into three general categories: basic integrity, outlier, and spatial consistency. The process begins with basic integrity checks followed by the outlier check and ends with spatial consistency checks. Once an observation fails a quality control check, the value is excluded from subsequent checks during that processing cycle. The quality control flags are included in the version 4 dataset for any datum identified to be in error, providing information on the type of error associated with a value. The quality control flag is one of three types of metadata
CDR Program Global Historical Climatology Network-Monthly Mean Temperature C-ATBD CDRP-ATBD-0859 Rev. 1 10/23/2018
A controlled copy of this document is maintained in the CDR Program Library. Approved for public release. Distribution is unlimited.
25
information included in the version 4 dataset. It is appended to each observation along with a measurement flag and a source flag. Data errors identified through this process are either resolved through collection of data resubmitted from the contributing country or the data are flagged through the manual edit process described in section 3.3.10.
An observation with no quality control flag indicates that the datum passed all checks applied. But given that some checks have minimum data record requirements, not all monthly values are necessarily subjected to the full suite of tests due to insufficient data or a lack of neighbors.
3.4.1 Fully Automated Checks 3.4.1.1 Inter-station duplicates
Duplication of observations can occur on annual timescales. It is unlikely that meteorological conditions will produce exactly the same set of monthly mean temperatures in the same year for two or more separate stations. However, duplication can result from data collection errors, or because station data from multiple sources were not fully resolved in the merging process. As such, the inter-station duplicate check was designed to identify and flag these occurrences by comparing data for every month in a year to the same year for every other station in GHCNm. If any two (or more) stations have exactly the same values for all 12 months of the same year, all monthly values for the stations are flagged. By retaining the value with the duplicate flag, users can decide whether to eliminate the stations from an analysis or query, or keep at least one of the station’s data.
3.4.1.2 Month-over-month duplicates This check identifies errors resulting from a problem that can occur in the
transmission of CLIMAT bulletins over the GTS; the retransmission and incorrect labeling of data that results in the mean temperature for the current data month being repeated from the prior month. Occasionally a country will retransmit the observations from the previous month and misidentify all observations as being for the current data month. Although meteorological conditions can result in a valid recording of the same monthly mean temperature for a station in consecutive months, particularly in the tropics, the occurrence is highly suspicious when several stations from the same country or the same region within a particular country report identical values in consecutive months.
This error can go undetected by other quality control checks because the observations often don’t deviate greatly from climatological normals and because other nearby observations reported with the same source of error provide erroneous corroboration. The “month-over-month duplicate” check identifies and flags these errors. The algorithm operates independently on three latitudinal bands, 90°S-30°S, 30°S-30°N, and 30°N-90°N. Temperatures in the tropics (30°S-30°N) vary less from month to month and, therefore, stations have a greater likelihood of having the same mean temperature in two consecutive months than at locations in other regions. In the tropics, for any month in

CDR Program Global Historical Climatology Network-Monthly Mean Temperature C-ATBD CDRP-ATBD-0859 Rev. 1 10/23/2018
A controlled copy of this document is maintained in the CDR Program Library. Approved for public release. Distribution is unlimited.
26
which three or more stations located within the band and from the same country report a value that is an exact duplicate of the previous month’s value, the most recent month’s values from those stations are considered erroneous. Because this check was designed to identify retransmission of the prior month’s data, only the most recent month’s datum is flagged as an error. The check operates the same way in the 90°S-30°S and 30°N-90°N bands with the exception that the minimum number of stations from the same country within the band having same-month duplicates is two, rather than three.
The month-over-month duplicate check is applied to data from January 2000 to present, because data since that time are based largely on observations transmitted in CLIMAT bulletins, in which this problem is most prevalent.
3.4.1.3 World Record Extremes Check Any observation that exceeds the global record high (low) monthly mean
temperature is set to invalid by the automated quality control system. As extreme events occur that result in new record warm (cold) mean temperatures, a manual assessment is performed (section 3.3.10) and the quality control flag reset when determined to be a valid observation.
3.4.1.4 Yearly Duplicates Duplication of observations also can occur on annual timescales due to problems
with data collection and processing errors. It is unlikely that meteorological conditions will produce exactly the same set of monthly mean temperatures in any two years. As such, the duplicate year check was designed to identify and flag these occurrences by comparing on a per station basis data for every month in a year to every other year for that station. If any two years are identical, all 12 months for both years are flagged. By retaining the value with the duplicate flag, users can decide whether to eliminate both years from an analysis or query, or keep at least one of the year’s data.
3.4.1.5 Isolated Values The final basic integrity check identifies “isolated values”; a monthly value or
cluster of values that are isolated in time and have no immediate non-missing values within 18 months of either side of the value or the cluster. Experience has shown that a datum, or a small collection of data, is likely invalid when found to be isolated in time from the main collection of a station’s data. In order to identify these situations, any station having up to three consecutive observations separated from other data by at least 18 months or more of missing observations, before or after the time period containing these data, are flagged as “isolated”.
3.4.1.6 Climatological Outliers This quality control check compares each observation to all observations for the
same station and month of the year throughout its period of record. The period of record bi-weight mean and standard deviation are used to normalize station data through the
CDR Program Global Historical Climatology Network-Monthly Mean Temperature C-ATBD CDRP-ATBD-0859 Rev. 1 10/23/2018
A controlled copy of this document is maintained in the CDR Program Library. Approved for public release. Distribution is unlimited.
27
calculation of a z-score for each month and year of data. The bi-weight mean and standard deviation are used because they are robust and resistant to outliers.
Any observation equal to or greater than 5 bi-weight standard deviations above or below its period of record bi-weight mean for the month in question is flagged as an outlier. This test operates under the assumption that the data are normally distributed and requires that a station record have at least 10 years of data for any month. Normality is generally valid for monthly mean temperature data, but skewness in the distribution can result in over-flagging. The adequacy of this test was shown by the absence of any consistent spatial preference (Lawrimore et al. 2011).
3.4.1.7 Streak Check There are a small number of cases in which monthly mean temperatures are
reported identically for several months in a row. For stations in which the same temperatures persists for five or more months in a row, the observations are flagged as invalid in version 4. Experience has shown that even in regions where temperatures vary little from month to month, it is unlikely that identical monthly mean temperatures would persist for more than four months in a row.
3.4.1.8 Spatial Inconsistency For observations that are less than 5 sigma, but more than 2.5 sigma from the
station’s bi-weight mean temperature, a comparison with neighbors is used to assess its validity. Proven to be effective at verifying the validity of observations in the 15 years since it was first applied, the spatial consistency check developed by Peterson et al. (1998) for GHCNm version 2 is used in version 3. This check is implemented while recognizing 1) reliance on an implicit assumption that neighboring stations share the characteristics of the target station, and 2) for non-uniformly spaced data fields, regions with sparse data may not provide any representative neighboring data.
The check is based on a z-score comparison with the five nearest neighbors to identify occurrences of extreme temperature at the target station also observed at neighboring stations. Peterson et al. (1998) identified the point at which errors could be detected as 2.5 biweight standard deviations from the mean. Selection of the five neighbors for comparison is based only on proximity to the target station (i.e., those closest to the target). Correlation with neighbors is not considered because the GHCNm periods of record vary greatly and a neighbor may only have a few overlapping years of data making the calculation of correlation impractical.
The validity of suspect observations is based on the magnitude of the normalized value of its neighbors. At least one neighbor having a z-score as shown in Table 2 and of the same sign as the target station provides confirmation of a valid observation of the target station. If the validity of an observation is not verified by comparison with its neighbors, the corresponding flag is appended to the observation. The requirement that only one of the five neighbors provide corroboration was determined through evaluation of test results (Peterson et al., 1998). However, it is possible that all five neighbors could be separated

CDR Program Global Historical Climatology Network-Monthly Mean Temperature C-ATBD CDRP-ATBD-0859 Rev. 1 10/23/2018
A controlled copy of this document is maintained in the CDR Program Library. Approved for public release. Distribution is unlimited.
28
from the target by great distances or topographic features (e.g., mountain ranges or bodies of water), lessening the likelihood that the extreme value would be corroborated.
This check has the highest flag rate (0.10%) and is most effective in areas of high spatial density where the greater number of neighbors provides more opportunities for corroboration.
3.4.1.9 Spatial z-score The Spatial z-score check uses a weighted average of neighboring stations to
identify extreme temperatures that are likely erroneous. For the month of interest for the target station, the z-score is computed (the number of standard deviations from its mean temperature). The z-scores of all surrounding neighbor stations within 500 km of the target station are also computed and an average of the neighbor’s z-score is computed using inverse distance weighting (IDW). If the absolute difference between the target station z-score and the IDW z-score of the field of neighbors is >= 3.0, the target station’s monthly temperature is invalidated (flag=”T”). This threshold was determined through a manual evaluation of thresholds following the procedures described in Durre et al. (2008).
3.4.2 Interactive Checks
3.4.2.1 Manual Edits (Exceptions through Expert Assessment) If the quality of any observation is determined to be different than that classified
by the automated quality control process, using the check above or through other expert assessment, the update system allows for implementation of exceptions. Exceptions are incorporated into the update process through their addition to an ‘Edit file’. This file contains observations that require manual intervention to correct a problem that was found through other corroborating evidence to have been improperly handled in the update and automated QC process. Corroborating evidence includes specific verifiable information such as that provided by a local expert who witnessed the extreme event or has other evidence to support the change in quality. An edited value can fall into one of three categories.
1) Valid observations erroneously flagged in the automated quality control process and for which the error flag needs to be removed.
2) Values that remained unflagged through automated QC but found to be invalid or suspect through other corroborating evidence and for which an invalid quality flag needs to be applied.
3) Invalid or missing observations for which a valid value is known and can be used
to replace the invalid observation.

CDR Program Global Historical Climatology Network-Monthly Mean Temperature C-ATBD CDRP-ATBD-0859 Rev. 1 10/23/2018
A controlled copy of this document is maintained in the CDR Program Library. Approved for public release. Distribution is unlimited.
29
3.5 Homogeneity Testing and Correction 3.5.1 History and Overview
Surface weather stations are frequently subject to minor relocations throughout their history of operation. Observing stations may also undergo changes in instrumentation as measurement technology evolves. Furthermore, observing practices may vary through time, and the land use/land cover in the vicinity of an observing site can be altered by either natural or man-made causes. Any of these kinds of modifications to the circumstances behind temperature measurements have the potential to alter a thermometer’s microclimate exposure characteristics or otherwise change the bias of measurements relative to those taken under previous circumstances. The manifestation of such changes is often an abrupt shift in the mean level of temperature readings that is unrelated to true climate variations and trends. Ultimately, these artifacts (also known as inhomogeneities) confound attempts to quantify climate variability and change because the magnitude of the artifact can be as large as or larger than the true background climate signal. The process of removing the impact of non-climatic changes in climate series is called homogenization.
In the global land process homogenization is performed through tests that identify a shift in temperature values from a target location relative to other nearby (correlated) stations. Ideally such shifts could be found to coincide with a known change in observation practice, instrumentation, or location of the target site [Karl and Williams, 1987]. Unfortunately, because station history records are generally incomplete if available at all, especially outside the U.S., undocumented shifts may be present throughout the periods of record in a dataset such as GHCNm. As a result, an algorithm (Pairwise Homogeneity Algorithm; PHA) was designed to identify inhomogeneities in the absence of metadata (Menne and Williams, 2009). This is described in section 3.4.3.
In addition a homogeneity problem most prevalent in stations in the U.S. Cooperative Observers Network is associated with a documented change in daily time of observation. An algorithm was designed to correct for time of observation changes through the use of station metadata as described in section 3.4.2. This algorithm is applied before the Pairwise Homogeneity Algorithm on stations in the U.S.
3.5.2 Pairwise Homogeneity Algorithm While network wide biases associated with changes in time of observation are
largely unique to stations in the US Cooperative Observing Network, other sources of inhomogeneity associated with changes in observer practice, instrumentation, and station location and environment are prevalent in the US and globally. At most stations, including thousands in the U.S., metadata are not available that document the occurrence of such changes. Thus an algorithm that does not rely on metadata is required to identify and adjust for the full spectrum of inhomogeneities.
Artificial shifts in a climate series are most efficiently detected as changes relative to surrounding, highly correlated series from neighboring stations. In essence,

CDR Program Global Historical Climatology Network-Monthly Mean Temperature C-ATBD CDRP-ATBD-0859 Rev. 1 10/23/2018
A controlled copy of this document is maintained in the CDR Program Library. Approved for public release. Distribution is unlimited.
30
homogenization involves identifying and correcting for abrupt shifts in a particular station series when these shifts appear to be unique to that series. The assumption in tests for relative homogeneity is that geographically isolated shifts in temperature series that endure with time are artificial, or, at least, are likely to have originated from causes other than background variations in weather and climate. This assumption can sometimes be verified when a shift in temperature values from a target location relative to other nearby (correlated) values coincides with a known change in observation practice at the target site such as a small station move (Karl and Williams, 1987). Unfortunately, because station history records are generally incomplete if available at all, undocumented shifts may be present throughout the periods of record in a dataset such as GHCNm. While the impacts of these changes are often random, their collective impact can nevertheless systematically bias regional and global temperature trends (Menne et al., 2009).
In version 4, as in version 3, of the GHCNm temperature data, the apparent impacts of documented and undocumented inhomogeneities are detected, and corrected for, through automated pairwise comparisons of mean monthly temperature series as detailed in Menne and Williams (2009). The pairwise algorithm (Menne and Williams, 2009) starts by forming a large number of pairwise difference series between serial monthly temperature values from a region. Each difference series is then statistically evaluated for abrupt shifts, and the station series responsible for a particular break is identified automatically. Neighbors used in creating the difference series are those which are best correlated with the target. There is no limit to the physical distance between the target and its neighbors. In at least once case (St Helena Island), neighbors more than 1000 km away were sufficiently correlated to identify and correct for an inhomogeneity that occurred in 1976.
After all of the shifts that are detectable by the algorithm are attributed to the appropriate station within the network, an adjustment is made for each target shift. Adjustments are determined by estimating the magnitude of change in pairwise difference series between the target series and highly correlated neighboring series that have no apparent shifts at the same time as the target. Adjustments are not applied for statistically insignificant changes.
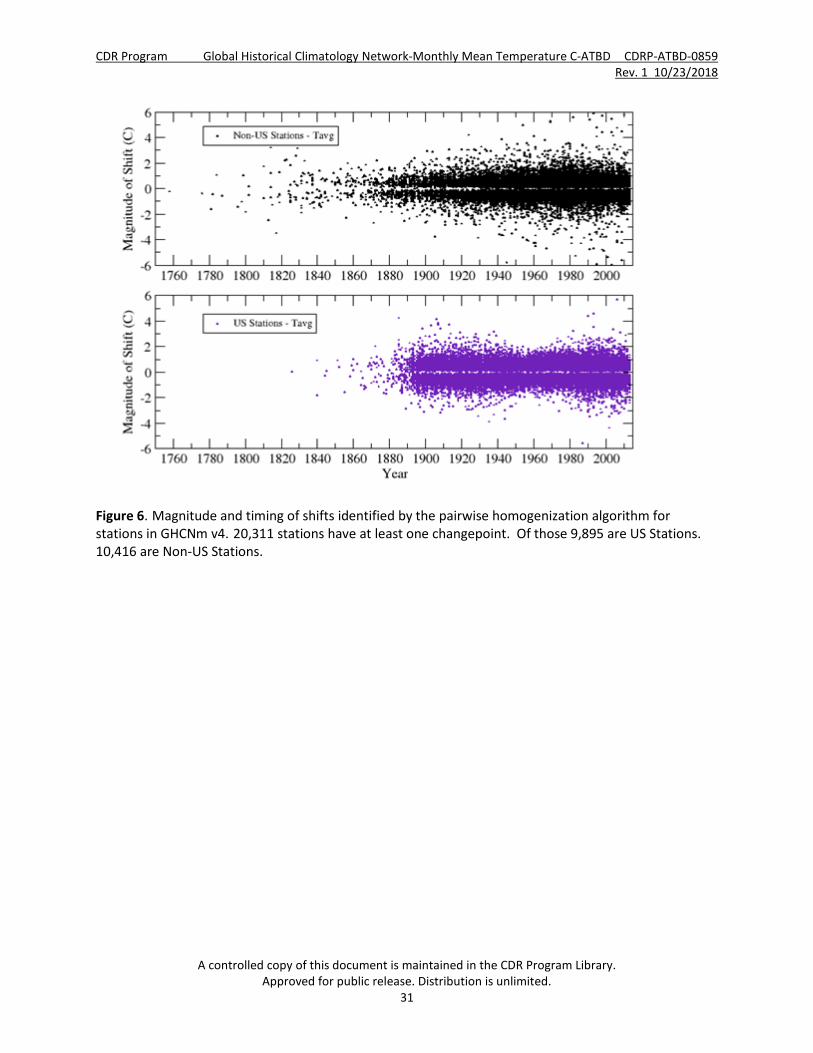
In GHCNm version 4 one or more bias corrections were applied to approximately 20,000 stations (Figure 6). The magnitude of corrections necessary for removing inhomogeneities from station records were applied equally to all months preceding the inhomogeneity, and corrections generally ranged from +/- 0.2°C to 2.0°C. Less than 5% of all corrections exceeded +/- 2.0°C (Figure 7).
CDR Program Global Historical Climatology Network-Monthly Mean Temperature C-ATBD CDRP-ATBD-0859 Rev. 1 10/23/2018
A controlled copy of this document is maintained in the CDR Program Library. Approved for public release. Distribution is unlimited.
31
Figure 6. Magnitude and timing of shifts identified by the pairwise homogenization algorithm for stations in GHCNm v4. 20,311 stations have at least one changepoint. Of those 9,895 are US Stations. 10,416 are Non-US Stations.

CDR Program Global Historical Climatology Network-Monthly Mean Temperature C-ATBD CDRP-ATBD-0859 Rev. 1 10/23/2018
A controlled copy of this document is maintained in the CDR Program Library. Approved for public release. Distribution is unlimited.
32
Figure 7. Histogram of the distribution of shifts (break size) identified by the Pairwise Homogenization Algorithm (PHA).
The efficiency of pairwise relative homogeneity testing is, in part, a function of station density. Higher densities generally increase the covariance between stations and improve the signal to noise ratio between shifts in systematic bias and the random differences between stations. There is a peak in the 1980s reflecting the impact of a transition from Cotton Region Shelters to the Maximum-Minimum Temperature System (MMTS) at many USHCN stations. Although approximately 60% of the COOP network was converted to MMTS instrumentation during a five-year period, the number of unaffected stations was sufficient to support relative homogeneity testing and bias correction even during this period when a majority of the COOP network was affected by a change in instrumentation. Outside the U.S. the highest proportion of stations receiving bias corrections coincides with the 1950s through 1970s peak in the number of stations in the GHCNm dataset.

CDR Program Global Historical Climatology Network-Monthly Mean Temperature C-ATBD CDRP-ATBD-0859 Rev. 1 10/23/2018
A controlled copy of this document is maintained in the CDR Program Library. Approved for public release. Distribution is unlimited.
33
In the case of spatially isolated series, relative homogeneity testing is less likely to reveal the impact of artificial station changes. Conversely, the relatively dense station network behind the U.S. contribution to GHCNm, as well as the more uniform record length of US stations, allows for more efficient relative changepoint detection and bias correction.
3.5.3 Time of Observation Bias The greatest number of observing stations in the US are manned by volunteers
as part of the U.S. Cooperative Observers (COOP) network. In this network, which has operated since 1895, observations of daily temperature and precipitation are typically recorded on a rolling 24-hour basis that begins and ends either in the early morning or early afternoon. Until the late 1950s the majority of observers recorded the maximum and minimum temperature (and precipitation total) for the previous 24 hours in the late afternoon, generally between 5 and 7 PM. But starting around 1960 the National Weather Service asked observers to start taking their measurements in the morning (between 7 and 9 AM) to better support hydrological forecasting.
Starting in the late 1950s, the majority of Cooperative Observer stations switched from a late afternoon to an early morning observation time, resulting in a systematic change in the temperature record for the nation. This occurred because the COOP network uses thermometers that measure both the maximum and minimum temperature that occurred since the last reading of the previous day. Depending on the time of day when the observation is taken each day, and the instrument reset occurs, (i.e., the time of observation) the effect is an occasional double counting of either high or low temperatures more frequently than actually occurred. For example, a day in which today’s high temperature is unusually warm (e.g., 10˚C warmer than average) and tomorrow’s high temperature is near average, if the observation is made at 5 PM, the temperature at the time of the instrument reset may be higher than any actual temperatures that occurred the next calendar day. But because the next day’s reading at 5PM includes all temperatures from the previous 24 hours that high temperature from just after the time of reset would be recorded as the high temperature for the current day. In a similar way, temperatures taken at 7AM occasionally result in double counting of cold low temperatures.
If the time of observation never changes over time, this artificiality would not adversely affect the calculation of long-term trends. But since much of the COOP network changed from late afternoon observations to early morning observations starting in the late 1950s, there was a shift in the climate record from occasionally double counting high temperatures to occasionally double counting low temperatures. This resulted in an artificial cool bias of around 0.6C on average and as large as 2C for some stations in the US. The magnitude and widespread nature of this change to the large US COOP network required a special adjustment that is not used in other parts of the world. The correction methodology, also used in the previous version of GHCNm, is based on the use of hourly observations from the US Automated Surface Observing Network (ASOS) to develop an
CDR Program Global Historical Climatology Network-Monthly Mean Temperature C-ATBD CDRP-ATBD-0859 Rev. 1 10/23/2018
A controlled copy of this document is maintained in the CDR Program Library. Approved for public release. Distribution is unlimited.
34
empirical model to determine the time of observation bias associated with different observation schedules (Karl et al., 1986).
3.5.4 Comparison to v3 and Treatment of High Latitude Stations As discussed in Menne et al. (2018), GHCNm v4 unadjusted data have higher
global mean annual trends than the unadjusted v3 for the periods they analyzed. Notably, the shift adjustments lead to much greater consistency between the two adjusted versions in terms of the trend magnitude and in terms of the amplitude of multi-decadal variations. As they discuss, the greater consistency in the adjusted data occurs across latitude bands for a variety of trend periods with the exception of the most recent two decades when adjustments have relatively little impact on trends. During this time global mean anomalies diverge somewhat between v3 and v4. This is a period of rapid warming in high latitudes of the Northern Hemisphere and trends diverge more from the global land average than in previous periods (Cowtan and Way, 2012). As shown in Menne et al. (2018), adjustments in v3 actually reduce the trend in the sparsely sampled highest latitudes of the Northern Hemisphere for the period since 2000. This is caused primarily by adjustments compensating for major shifts in anomalies during the 2000s at a few high arctic stations located in the Barents and Kara Sea regions where large sea ice loss has occurred (see e.g., Kintisch, 2014). Areas of sea ice loss have been accompanied by unprecedented jumps in temperature anomalies and these have appeared as artificial discontinuities from a homogeneity perspective at the noted high latitude stations. In spite of the somewhat higher number of high latitude stations (north of 60°N), v4 data are not automatically adjusted by the PHA north of 60° because of the rapid changes to anomaly patterns that are altering temperature correlation scales. Adjustments are also not made automatically for stations south of 60°S (Antarctica). Rather, any apparent artificial shifts associated with station management changes noted in the future in those areas will require manual intervention and the unadjusted data are retained in these high latitude areas. The data are distinguished by the suffix “.qcf”, indicating the final adjusted data also include the unadjusted data in high latitude regions.
3.6 Base Period Estimation In order to maximize the number of stations with anomalies over time, in
version 4 normals are estimated for stations with partially or completely missing monthly data during the 1961-90 base period. Estimates are generated as in Menne et al. (2009) using an optimal interpolation technique known informally as FILNET. The FILNET procedure iterates to find a set of neighboring correlated series for each station series requiring estimates (the target) that minimizes the confidence limits for the difference between the target and the average of neighboring series. The difference between the target and neighbor average is used as an offset in the interpolation to account for climatological differences between the target and neighbors. As shown in Fig. 3, using
CDR Program Global Historical Climatology Network-Monthly Mean Temperature C-ATBD CDRP-ATBD-0859 Rev. 1 10/23/2018
A controlled copy of this document is maintained in the CDR Program Library. Approved for public release. Distribution is unlimited.
35
estimates for base period averages greatly expands the number of stations used to compute global land anomalies. Data that included temperatures estimated during the 1961-1990 base period are distinguished with the suffix “.qfe”.
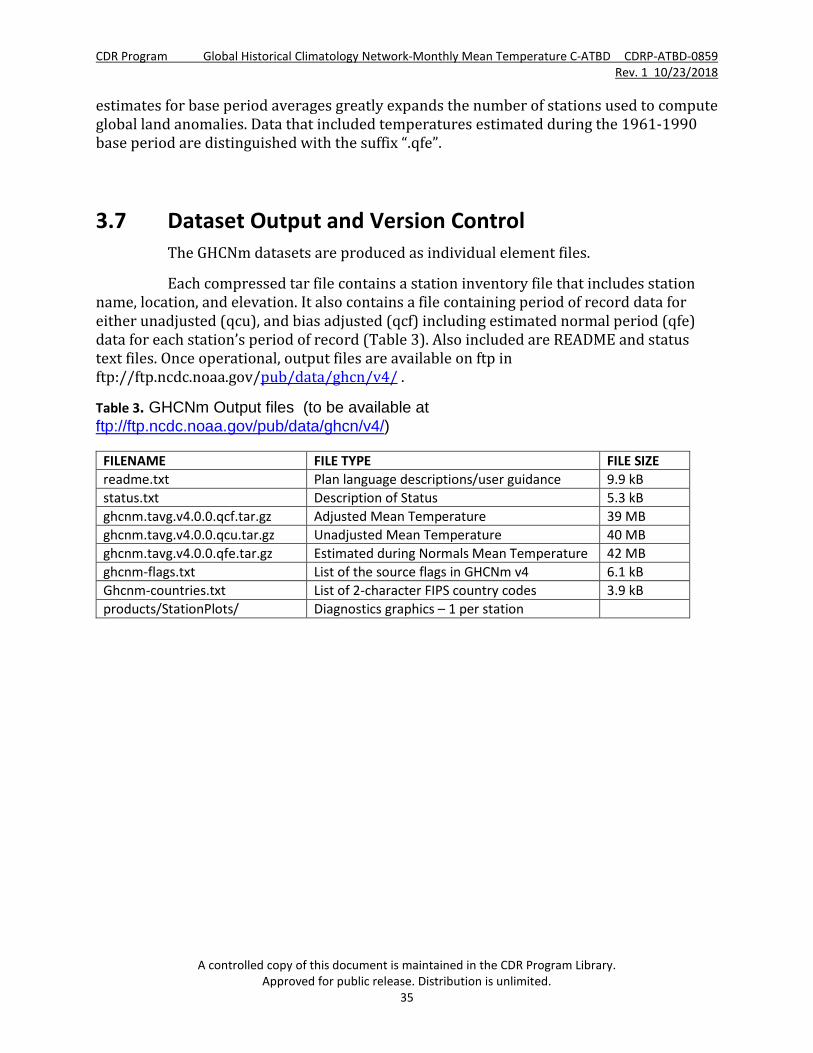
3.7 Dataset Output and Version Control The GHCNm datasets are produced as individual element files.
Each compressed tar file contains a station inventory file that includes station name, location, and elevation. It also contains a file containing period of record data for either unadjusted (qcu), and bias adjusted (qcf) including estimated normal period (qfe) data for each station’s period of record (Table 3). Also included are README and status text files. Once operational, output files are available on ftp in ftp://ftp.ncdc.noaa.gov/pub/data/ghcn/v4/ .
Table 3. GHCNm Output files (to be available at ftp://ftp.ncdc.noaa.gov/pub/data/ghcn/v4/)
FILENAME FILE TYPE FILE SIZE readme.txt Plan language descriptions/user guidance 9.9 kB status.txt Description of Status 5.3 kB ghcnm.tavg.v4.0.0.qcf.tar.gz Adjusted Mean Temperature 39 MB ghcnm.tavg.v4.0.0.qcu.tar.gz Unadjusted Mean Temperature 40 MB ghcnm.tavg.v4.0.0.qfe.tar.gz Estimated during Normals Mean Temperature 42 MB ghcnm-flags.txt List of the source flags in GHCNm v4 6.1 kB Ghcnm-countries.txt List of 2-character FIPS country codes 3.9 kB products/StationPlots/ Diagnostics graphics – 1 per station
CDR Program Global Historical Climatology Network-Monthly Mean Temperature C-ATBD CDRP-ATBD-0859 Rev. 1 10/23/2018
A controlled copy of this document is maintained in the CDR Program Library. Approved for public release. Distribution is unlimited.
36
4. Testing and Validation
4.1 Test Input Datasets Identifying inhomogeneities and estimating adjustments with the Pairwise
Homogeneity Algorithm (PHA) relies on a selection of choices for all steps in the PHA process from how to define target and reference series to the particular statistical breakpoint tests applied and mechanisms for adjusting each detected break. Ideally an optimum set of choices is made to create an algorithm that has the best performance in detecting and adjusting each inhomogeneity.
To assess the performance of the specific set of parameters selected in the PHA algorithm, a set of plausible analogs was created from which the truth was known a priori. The analog worlds share the likely principal characteristics of the raw data such as spatio-temporal sampling structure, noise and bias characteristics. The PHA algorithm was then run against the suite, allowing a quantifiable appraisal of algorithm strengths and weaknesses.
The PHA algorithm, as described in Menne and Williams (2009), was evaluated against eight analog datasets. A large-scale (contiguous U.S.) long-term trend metric is used as the measure of performance.
4.2 Test Output Analysis
4.2.1 Reproducibility To ensure plausible geographical data structures and teleconnections the analog
worlds were derived from gridded output from Global Climate Models (GCMs). A range of climate model runs were downloaded from the World Climate Research Programme's (WCRP's) Coupled Model Intercomparison Project phase 3 (CMIP3) multi-model dataset and these were each sub-sampled in space and time to the observational mask. Although not the real world, GCMs do mimic many of the gross characteristics and use of a range of models, mitigating against any issues that may be introduced through non-plausible characteristics in any single model. Because the models are at much coarser resolution than the typical station, separation climatological offsets and white noise were applied in each case before any further steps. This ensures that nearby ‘stations’ arising from the same GCM gridpoint are non-identical and mimics likely real-world physical offsets due to local environment and elevation as well as random errors.
Five principal break structures were assigned (Perfect data; Big breaks good metadata; Mixed break sizes some clustering; Very many mainly small breaks, Clustering and sign bias). For the last of these, four distinct analogs were created that while sharing the exact same breaks differed in their underlying climate change signal and interannual variability, bringing the total number of analog worlds to eight.
CDR Program Global Historical Climatology Network-Monthly Mean Temperature C-ATBD CDRP-ATBD-0859 Rev. 1 10/23/2018
A controlled copy of this document is maintained in the CDR Program Library. Approved for public release. Distribution is unlimited.
37
4.2.2 Precision and Accuracy When applied to GHCNm v4 data, the PHA finds about 70,000 shifts in the nearly
26,000 temperature stations that comprise GHCNm v4. Figure 7 shows the frequency distribution of these shifts. As the distribution indicates, the smallest temperature shifts are not detected. Rather, the distribution is bimodal with peaks for detected shift magnitudes of around ±0.5°C and much lower frequencies of adjustments near zero and at absolute magnitudes greater than 2°C. Similar results have been discussed in assessments of the U.S. land surface air temperature series (e.g., Menne et al. 2009; Williams et al. 2012), for GHCNm v3 data (Lawrimore et al. 2011) and in comparisons of homogenization techniques on simulated data.
4.2.3 Error Budget The approach to building an uncertainty budget for GHCNm v4 temperatures
broadly follows methods described in Brohan et al. (2006) and Morice et al. (2012). An ensemble of the GHCNm v4 dataset is used as a way to quantify uncertainty that arises from correlated error structures in the data. These errors, correlated in both space and time, originate largely from the artificial shifts in station temperature series and do not cancel out when spatially averaged. The major components of the uncertainty budget consist of homogenization uncertainty, station anomaly uncertainty, instrument exposure bias from non-standard screens, grid box sampling error, and spatial coverage uncertainty. These are described in full detail in Menne et al., 2018. The total uncertainty in the GHCNm v4 global annual time series is shown in Figure 8.
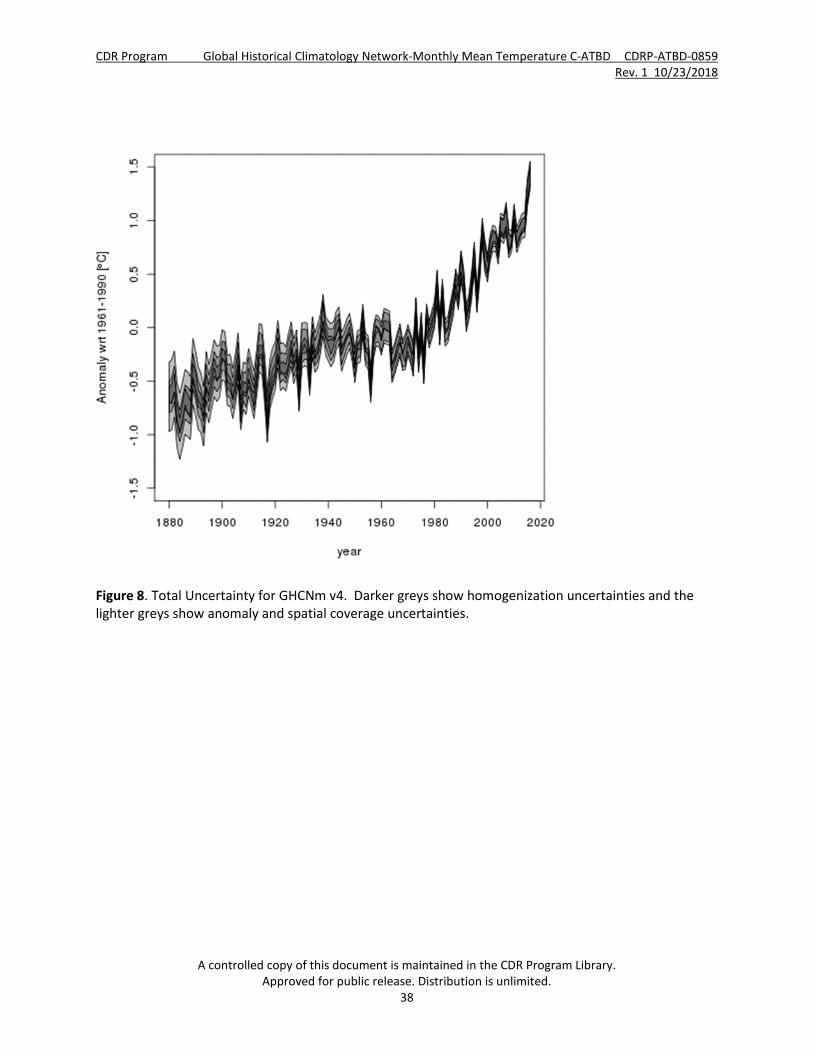
CDR Program Global Historical Climatology Network-Monthly Mean Temperature C-ATBD CDRP-ATBD-0859 Rev. 1 10/23/2018
A controlled copy of this document is maintained in the CDR Program Library. Approved for public release. Distribution is unlimited.
38
Figure 8. Total Uncertainty for GHCNm v4. Darker greys show homogenization uncertainties and the lighter greys show anomaly and spatial coverage uncertainties.

CDR Program Global Historical Climatology Network-Monthly Mean Temperature C-ATBD CDRP-ATBD-0859 Rev. 1 10/23/2018
A controlled copy of this document is maintained in the CDR Program Library. Approved for public release. Distribution is unlimited.
39
5. Practical Considerations
5.1 Quality Assessment and Diagnostics Quality Assessments are performed on a monthly basis using a set of diagnostics
and protocols which were established to ensure the quality of US and global data. The process involves a panel’s review of diagnostic output to compare the current state of the system against what is nominally expected; identification of any data quality concerns or abnormalities that may have occurred in the ingest, data source consolidation, quality control, bias correction, or dataset output process. The following diagnostics are included in the assessment process:
• Number of stations ingested by source • Change in number of stations ingested, Month minus Month-1 • Quality control algorithm flag rates • Number of stations bias adjustments applied to • Maximum bias adjustment • Difference in monthly and annual global and US anomaly time series, Month minus
Month-1 • Difference in monthly and annual global and US anomaly time series, Day minus
Day-1 • Spatial gradient in monthly temperature anomalies • Comparison against global reanalysis • Spatial distribution of monthly, seasonal, and annual anomalies • Monthly, seasonal, and annual trends
5.2 Processing Environment and Resources GHCNm development is performed on the virtual server ghcnm-dev. Production
is performed on ghcnm-prod. The production server provides the testing function and is subsequently converted to a production server when testing is complete. These servers have 72 GB of RAM. 5 GB of storage is required for each run. The ghcnm-dev virtual server has four Intel Xeon 5570 2.93 GHz CPU's. The ghcnm-prod virtual server has eight Intel Xeon 5680 3.33 GHz CPU's. Execution of Phase 1 on the dev server requires approximately 8 hours while Phase 2 requires 12 hours.
The software is a combination of Fortran77, Fortran95, IDL and scripts. All software is maintained in the subversion repository at bgleason/ghcnm_qc/ghcnm_qc-1.0/ghcnm_qc.f95.
5.2.1 Operational Deployments Scientists and system developers provide handoff of software to a system
administrator for operational deployment. The administrator does not execute a

CDR Program Global Historical Climatology Network-Monthly Mean Temperature C-ATBD CDRP-ATBD-0859 Rev. 1 10/23/2018
A controlled copy of this document is maintained in the CDR Program Library. Approved for public release. Distribution is unlimited.
40
deployment until an analysis of output and approval by the NCEI Science Council. Evaluations of any new version are based on a comparison with the previous version and an analysis of a set of statistics and diagnostics. The statistics and diagnostics can include any of the following:
• Overview of purpose of system upgrade
• Overview of coding changes implemented in upgrade
• Assessment of differences resulting from each individual change
• Impact to homogeneity breakpoint analysis
• Change in number of change points
• Change in average size of change points
• Change in quality control flag rates
• Number and magnitude of adjustments for each change implemented
• Histogram of breakpoints for U.S. and Global
• Percent of stations with bias adjustments applied; comparison of new versus previous
• Global and national-scale change in anomalies, trends, and rankings; monthly and annual time series
• Spatial analysis of change in anomalies and trends
• Analysis of grid boxes with greatest difference between old and new version
• Operational and communication considerations for climate monitoring
• Procedures for notifying partners and users of upcoming change
5.2.2 Change Management The GHCNm temperature dataset is version controlled using a three-digit
numbering system (x.y.z). The three-digit versioning tracks changes resulting from minor bug fixes up through major structural enhancements. Each change to GHCNm is documented in a manner consistent with the magnitude of the enhancement. Minor bug fixes are recorded in an online status file, moderate changes are described in a GHCNm Technical Note, and major updates are communicated in the peer-reviewed literature. Updates to this document will be made whenever there are changes to GHCNm that result in the preparation of a technical note (moderate) or peer-reviewed article (major).
The file naming structure is ghcnm.vX.Y.Z.YYYYMMDD where
1. X is incremented when there is a major change to the dataset such as implementation of
a new bias correction algorithm or new quality control system. These changes are made

CDR Program Global Historical Climatology Network-Monthly Mean Temperature C-ATBD CDRP-ATBD-0859 Rev. 1 10/23/2018
A controlled copy of this document is maintained in the CDR Program Library. Approved for public release. Distribution is unlimited.
41
through the peer review process and documented within a journal article.
2. Y is incremented when there are one or more significant changes to the dataset such as
the implementation of a single new quality control algorithm or the addition, correction, or
removal of a large number of stations. These changes are included in a technical review
document.
3. Z is incremented when any minor change is made. These can include minor bug fixes, correction of minor data errors, minor changes to bias correction or quality control processes, and small additions of new station data. Users are notified of these changes through an online status file that accompanies the data files.
Also included in the GHCNm output are directories containing products, software, and technical reports.
The products directory contains thousands of graphics files with diagnostics information including the distribution of stations flagged in the quality control process, information on bias corrections, and the temporal distribution of anomalies.
The software directory contains all software associated with the Pairwise Homogeneity Algorithm (v53).
The techreports directory contains any technical reports which were written as part of a moderate upgrade to GHCNm (e.g., 4.0.0 to 4.1.0).
5.3 Quality Assessment and Diagnostics The quality of the GHCNm v4 dataset has been assessed through a comparison
against other well established global land surface air temperature datasets; such as the Berkeley Earth Surface Temperature dataset (Rohde et al. 2013) and CRUTem4 (Jones et al. 2012; Morice et al. 2012). It also has been assessed against some smaller datasets that have been homogenized and averaged independently at the national level. Examples include one for Switzerland based on Begert and Frei (2016) and another for Australia based on the ACORN-SAT dataset (Trewin, 2013). A full description of these comparisons and their results is available in Menne et al. (2018).
5.4 Exception Handling There are several layers of quality control used to identify exceptions. These
include the automated quality control and bias correction algorithms described in Section 3, manual assessment that is performed on an operational basis to identify unusual behavior occurring temporally or spatially, and a manual override process that can be used to correct and reprocess exceptions when they occur.
CDR Program Global Historical Climatology Network-Monthly Mean Temperature C-ATBD CDRP-ATBD-0859 Rev. 1 10/23/2018
A controlled copy of this document is maintained in the CDR Program Library. Approved for public release. Distribution is unlimited.
42
5.5 Algorithm Validation In addition to the validation and assessment that was described in section 4, one
hundred randomized versions of the PHA were compiled using different values for the parameters, and the 100 different versions of the PHA were run on eight analog datasets to assess the parametric uncertainty.
Figure 9 provides an example of the results for one of the eight analog worlds. The contiguous U.S. trend produced from the data corrected using the operational (default) configuration of the PHA is very near the “true” trend computed from the homogenous data (before breaks were added). Similar conclusions are reached from the other analog worlds. The operational PHA, as well as many of the other different randomized versions of the PHA is able to move the trend more than 95% toward the true climate signal.
The eight analogs provide a measure of confidence that the pairwise algorithm will adjust monthly temperature series such that their regional mean is moved closer to the true value, even when the series contain pervasive errors with a sign bias that are clustered in time - regardless of the underlying climate forcings. Likewise, based on the other analogs, there is no evidence that the pairwise algorithm will move the trend away from truth when there is no sign bias to the errors, or when there are no errors at all.
Based upon performance against the analogs it can be concluded that the algorithm is better than 92% of the randomly detuned versions, balances type1 and type2 errors, and highly unlikely to consistently make incorrect inferences if the real world data are biased. Complete details on this analysis are available (Williams et al. 2012).
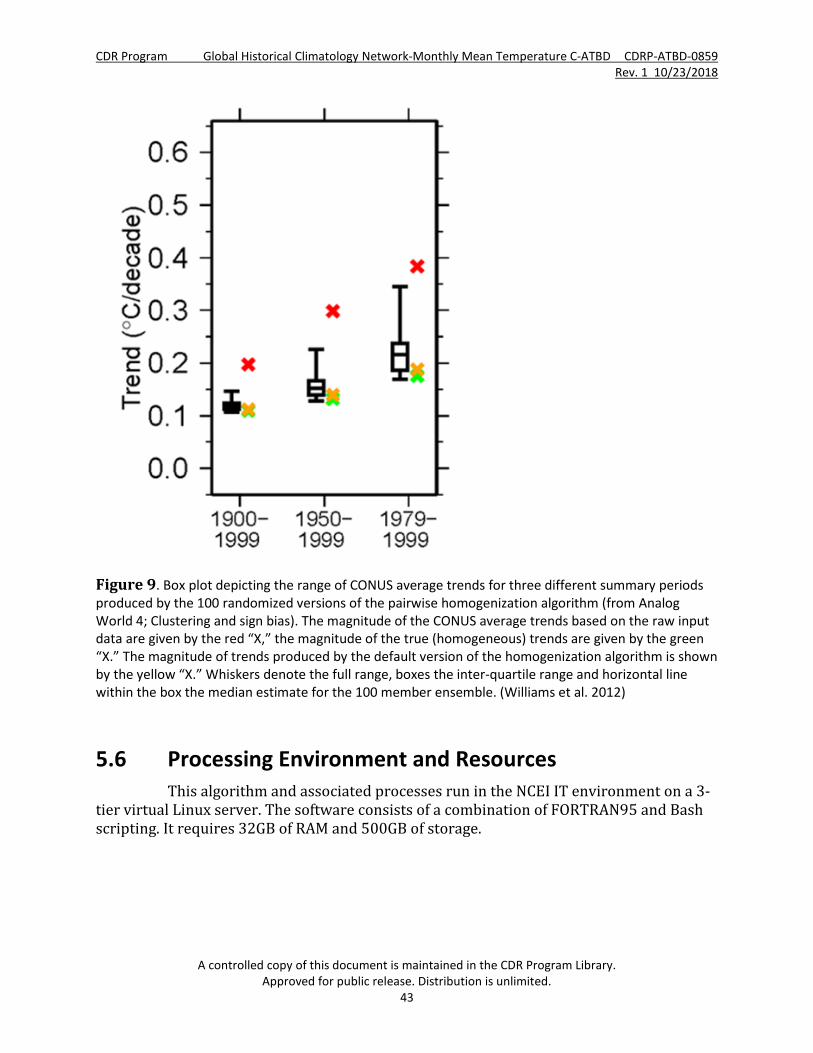
CDR Program Global Historical Climatology Network-Monthly Mean Temperature C-ATBD CDRP-ATBD-0859 Rev. 1 10/23/2018
A controlled copy of this document is maintained in the CDR Program Library. Approved for public release. Distribution is unlimited.
43
Figure 9. Box plot depicting the range of CONUS average trends for three different summary periods produced by the 100 randomized versions of the pairwise homogenization algorithm (from Analog World 4; Clustering and sign bias). The magnitude of the CONUS average trends based on the raw input data are given by the red “X,” the magnitude of the true (homogeneous) trends are given by the green “X.” The magnitude of trends produced by the default version of the homogenization algorithm is shown by the yellow “X.” Whiskers denote the full range, boxes the inter-quartile range and horizontal line within the box the median estimate for the 100 member ensemble. (Williams et al. 2012)
5.6 Processing Environment and Resources This algorithm and associated processes run in the NCEI IT environment on a 3-
tier virtual Linux server. The software consists of a combination of FORTRAN95 and Bash scripting. It requires 32GB of RAM and 500GB of storage.

CDR Program Global Historical Climatology Network-Monthly Mean Temperature C-ATBD CDRP-ATBD-0859 Rev. 1 10/23/2018
A controlled copy of this document is maintained in the CDR Program Library. Approved for public release. Distribution is unlimited.
44
6. Assumptions and Limitations All assumptions and limitations are described in section 4 and 5 in association
with the validation and assessment of this dataset.
6.1 Algorithm Performance Assumptions and limitations regarding the algorithm performance are described
in section 4 and 5 in association with the validation and assessment of this dataset.
6.2 Sensor Performance Not Applicable

CDR Program Global Historical Climatology Network-Monthly Mean Temperature C-ATBD CDRP-ATBD-0859 Rev. 1 10/23/2018
A controlled copy of this document is maintained in the CDR Program Library. Approved for public release. Distribution is unlimited.
45
7. Future Enhancements Within the coming year this dataset will be further developed to include monthly
mean maximum and monthly mean minimum temperature. No other enhancements are planned at this time.
CDR Program Global Historical Climatology Network-Monthly Mean Temperature C-ATBD CDRP-ATBD-0859 Rev. 1 10/23/2018
A controlled copy of this document is maintained in the CDR Program Library. Approved for public release. Distribution is unlimited.
46
8. References Begert M. and C. Frei, 2017: Area-mean temperatures of Switzerland. DOI:
10.18751/Climate/Timeseries/CHTM/1.0, 10.12.2017
Brohan, P., J. J. Kennedy, I. Harris, S. F. B. Tett, and P. D. Jones, 2006: Uncertainty estimates
in regional and global observed temperature changes: A new data set from 1850, J.
Geophys. Res., 111, D12106, doi:10.1029/2005JD006548.
Cowtan, K., and R.G. Way, 2014: Coverage bias in the HadCRUT4 temperature series and its
impact on recent temperature trends. Quar. J. Roy. Met. Soc., 140, 1935-1944, doi:
10.1002/qj.2297
Jones, P. D., Lister, D. H., Osborn, T. J., Harpham, C., Salmon, M., and Morice, C. P., 2012.
Hemispheric and large-scale land-surface air temperature variations: an extensive
revision and an update to 2010, J. Geophys. Res., 117, D05127,
doi:10.1029/2011JD017139, 2012.
Karl, T. R., and C. N. Williams, Jr. (1987), An approach to adjusting climatological time series
for discontinuous inhomogeneities, J. Climate Appl. Meteorol., 26, 1744–1763.
Karl, T.R., C.W. Williams, Jr., P.J. Young and W.M. Wendland (1986), A model to estimate the
time of observation bias associated with monthly mean maximum, minimum, and
mean temperatures for the United States. J. Climate Appl. Meteor., 25, 145-160.
Kintisch, E., 2014: Climate Outsider Finds Missing Global Warming, Science, 344, 348-348.
DOI: 10.1126/science.344.6182.348
Lawrimore, J. H., M. J. Menne, B. E. Gleason, C. N. Williams, D. B. Wuertz, R. S. Vose, and J.
Rennie, 2011: An overview of the Global Historical Climatology Network monthly
mean temperature data set, version 3, J. Geophys. Res., 116, D19121,
doi:10.1029/2011JD016187.
Menne, M. J., and C. N. Williams, Jr., 2009: Homogenization of temperature series via
pairwise comparisons, J. Climate, 22, 1700–1717, doi:10.1175/2008JCLI2263.1.
Menne, M. J., C. N. Williams, and R. S. Vose, 2009: The United States Historical Climatology
Network Monthly Temperature Data - Version 2, Bull. Amer. Meteorol. Soc., 90, 993–
1107, doi:10.1175/2008BAMS2613.1.
CDR Program Global Historical Climatology Network-Monthly Mean Temperature C-ATBD CDRP-ATBD-0859 Rev. 1 10/23/2018
A controlled copy of this document is maintained in the CDR Program Library. Approved for public release. Distribution is unlimited.
47
Menne. M.J., C.N. Williams, B.E. Gleason, J.J. Rennie, and R.H. Lawrimore, 2018: The Global
Historical Climatology Network Monthly Temperature Dataset, Version 4, J. Climate,
in press, doi: 10.1175/JCLI-D-18-0094.1
Morice, C. P., J. J. Kennedy, N. A. Rayner, and P. D. Jones, 2012: Quantifying uncertainties in
global and regional temperature change using an ensemble of observational
estimates: The HadCRUT4 data set, J. Geophys. Res., 117,
D08101,doi:10.1029/2011JD017187.
Peterson, T. C., and R. S. Vose, 1997: An overview of the Global Historical Climatology
Network temperature database, Bull. Amer. Meteorol. Soc., 78, 2837–2849.
Peterson, T. C., R. Vose, R. Schmoyer, and V. Razuvaev, 1998: Global historical climatology
network (GHCN) quality control of monthly temperature data, Int. J. Climatol., 18,
1169–1179.
Rennie, J. J., Lawrimore, J. H., Gleason, B. E., Thorne, P. W., Morice, C. P., Menne, M. J.,
Williams, C. N., de Almeida, W. G., Christy, J.R., Flannery, M., Ishihara, M., Kamiguchi,
K., Klein-Tank, A. M. G., Mhanda, A., Lister, D. H., Razuvaev, V., Renom, M., Rusticucci,
M., Tandy, J., Worley, S. J., Venema, V., Angel, W., Brunet, M., Dattore, B., Diamond, H.,
Lazzara, M. A., Le Blancq, F., Luterbacher, J., Mächel, H., Revadekar, J., Vose, R. S. and
Yin, X., 2014: The international surface temperature initiative global land surface
databank: monthly temperature data release description and methods. Geoscience
Data Journal, 1: 75–102. doi: 10.1002/gdj3.8
Rohde R., R.A. Muller, R. Jacobsen, E. Muller, S. Perlmutter, A. Rosenfeld, J. Wurtele, D.
Groom and C. Wickham, 2013: A New Estimate of the Average Earth Surface Land
Temperature Spanning 1753 to 2011. Geoinfor Geostat: An Overview 1:1.
doi:http://dx.doi.org/10.4172/2327-4581.1000101.
Trewin, B., 2013: A daily homogenized temperature data set for Australia. Int. J. Climatol.,
33, 1510–1529. doi:10.1002/joc.3530
Vose, R. S., R. L. Schmoyer, P. M. Steurer, T. C. Peterson, R. Heim, T. R. Karl, and J. Eischeid,
1992: The Global Historical Climatology Network: Long-term monthly temperature,
precipitation, sea level pressure, and station pressure data. ORNL/CDIAC-53, NDP-

CDR Program Global Historical Climatology Network-Monthly Mean Temperature C-ATBD CDRP-ATBD-0859 Rev. 1 10/23/2018
A controlled copy of this document is maintained in the CDR Program Library. Approved for public release. Distribution is unlimited.
48
041, 325 pp. [Available from Carbon Dioxide Information Analysis Center, Oak Ridge
National Laboratory, P.O. Box 2008, Oak Ridge, TN 37831.]
Williams, C. N., M. J. Menne, and P. W. Thorne, 2012: Benchmarking the performance of
pairwise homogenization of surface temperatures in the United States, J. Geophys.
Res., 117, D05116, doi:10.1029/2011JD016761.
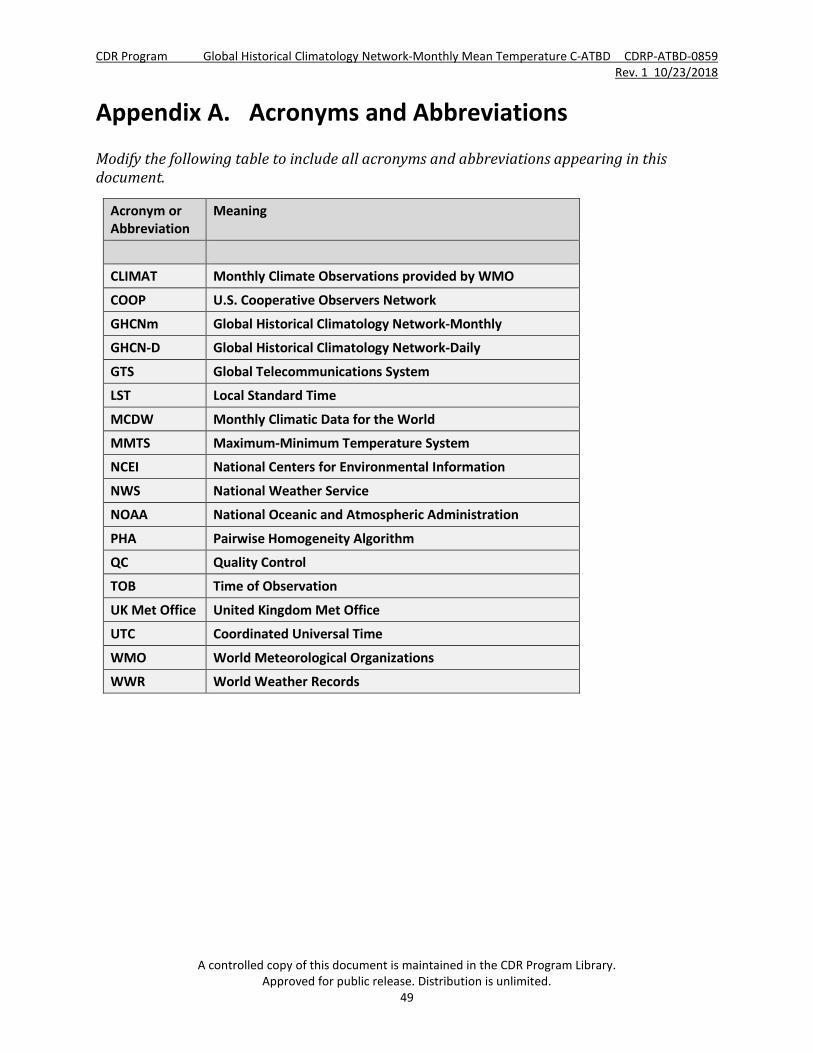
CDR Program Global Historical Climatology Network-Monthly Mean Temperature C-ATBD CDRP-ATBD-0859 Rev. 1 10/23/2018
A controlled copy of this document is maintained in the CDR Program Library. Approved for public release. Distribution is unlimited.
49
Appendix A. Acronyms and Abbreviations
Modify the following table to include all acronyms and abbreviations appearing in this document.
Acronym or Abbreviation
Meaning
CLIMAT Monthly Climate Observations provided by WMO
COOP U.S. Cooperative Observers Network
GHCNm Global Historical Climatology Network-Monthly
GHCN-D Global Historical Climatology Network-Daily
GTS Global Telecommunications System
LST Local Standard Time
MCDW Monthly Climatic Data for the World
MMTS Maximum-Minimum Temperature System
NCEI National Centers for Environmental Information
NWS National Weather Service
NOAA National Oceanic and Atmospheric Administration
PHA Pairwise Homogeneity Algorithm
QC Quality Control
TOB Time of Observation
UK Met Office United Kingdom Met Office
UTC Coordinated Universal Time
WMO World Meteorological Organizations
WWR World Weather Records
Related Documents