PNNL-21053 Prepared for the U.S. Department of Energy under Contract DE-AC05-76RL01830 Cleareye In-Ground and In-Concrete DIV Inspections: FY11 Final Report BG Braatz AM Jones JR Tedeschi WM Lechelt KM Denslow DL McMakin M Morra MS Good CD Knopik JB Sorensen RH Severtsen TE Hall January 2012

Welcome message from author
This document is posted to help you gain knowledge. Please leave a comment to let me know what you think about it! Share it to your friends and learn new things together.
Transcript
PNNL-21053
Prepared for the U.S. Department of Energy under Contract DE-AC05-76RL01830
Cleareye In-Ground and In-Concrete DIV Inspections: FY11 Final Report BG Braatz AM Jones JR Tedeschi WM Lechelt KM Denslow DL McMakin M Morra MS Good CD Knopik JB Sorensen RH Severtsen TE Hall January 2012


PNNL-21053
Cleareye In-Ground and In-Concrete DIV Inspections: FY11 Final Report BG Braatz AM Jones JR Tedeschi WM Lechelt KM Denslow DL McMakin M Morra MS Good CD Knopik JB Sorensen RH Severtsen TE Hall January 2012 Prepared for the U.S. Department of Energy under Contract DE-AC05-76RL01830 Pacific Northwest National Laboratory Richland, Washington 99352

iii
Summary
Background
The United States has a major stake in the success of the international safeguards system, which serves as an international mechanism to monitor nuclear activities in conformity with the Non-Proliferation Treaty. The Unites States Department of Energy has established the Next Generation Safeguards Initiative (NGSI) to support the International Atomic Energy Agency’s (IAEA) safeguards mission. One objective of the NGSI is to provide the IAEA with modern technology that could enable them to verify that the construction of declared facilities matches information provided by a state to the IAEA on its Design Information Questionnaire (DIQ). Inspections of such facilities will require non-destructive Design Information Verification (DIV) tools capable of in-wall inspection of concrete and in-ground inspections to ensure that pipes and other concealed infrastructure can be detected, located, and identified for comparison to facility design documentation.
Objectives
The objectives of this project are:
• DIV Tools for In-Concrete Inspections: To determine the feasibility of using holographic radar imaging (HRI), radar imaging, and acoustic time-of-flight (TOF) non-destructive evaluation technologies to detect, locate and identify pipes and voids embedded in standard-density and high-density concrete walls that typify those the IAEA will need to verify during field inspections.
• DIV Tools for In-Ground Inspections: To determine the feasibility of using HRI and radar imaging non-destructive evaluation technologies to detect, locate, and identify objects buried at various depths made of various materials (metal, plastic, wood, and concrete) and representing geometries that typify those the IAEA will need to verify during field inspections.
• Based on the results of the studies, recommend the next steps needed to realize fieldable tools for in-concrete and in-ground inspections (including detection of deeply buried polyvinyl chloride [PVC] pipes) that employ the technologies shown to be feasible.
DIV Tools for In-Concrete Inspections
To address the first objective, PNNL evaluated three technologies: 1) a prototype PNNL HRI system, 2) GSSI’s SRI-3000 commercial radar imaging system, and 3) acoustic TOF. They were tested on standard-density and high-density concrete walls containing metal pipe junctions, air voids, and a large metallic letter “F”.
1. Conclusion: For standard-density concrete walls, PNNL’s HRI technology is capable of meeting the functional requirements established for an IAEA DIV tool. For high-density concrete walls, this is not the case.

iv
Recommendation: PNNL recommends that for the inspection of standard-density concrete walls, HRI technology should be taken through the development process required to realize the portable DIV tool proposed in Section 4.1.1 of this report.
2. Conclusion: Based on the testing performed, the GSSI (using the SRI 3000 imaging unit) radar imaging technology could not detect pipes or voids embedded more than 4 inches beneath the surface of standard-density concrete walls. This technology is not capable of meeting the functional requirements established for an IAEA DIV tool in either standard or high-density concrete walls.
Recommendation: The GSSI SRI 3000 imaging system is not a viable tool for conducting DIV of structures and objects internal to standard or high-density concrete walls.
3. Conclusion: For standard- or high-density concrete walls, the single transducer-receive/transmit implementation of V-path pitch-catch acoustic TOF technology met the detection requirement portion of the functional requirements established for an IAEA DIV tool. A more mature implementation of this technology holds high potential for meeting the full functional requirements and thus becoming a viable IAEA DIV tool.
Recommendation: PNNL recommends (see Section 4.1.2 and Appendix B) that a project be undertaken to develop and test prototypes of an Ultrasonic Synthetic Aperture Array Imaging System to demonstrate the capability of this technology to meet the functional requirements established for an IAEA DIV tool.
DIV Tools for In-Ground Inspection
To address the second objective, PNNL evaluated three ground-penetrating radar imaging systems: 1) PNNL’s holographic radar imaging array (200–400 MHz), 2) GSSI’s UtilityScan (400-MHz antenna), and 3) Sensors & Software Inc.’s Noggin 100 (100-MHz). A test bed was developed containing plates, pipes, barrels, and containers buried at various depths and made of various materials (metal, plastic, wood, and concrete). The depth a radar system can penetrate the soil diminishes rapidly as the soil moisture content increases between zero and five percent. The soil moisture conditions for PNNL’s in-ground testing ranged from 4.5% to 5.8%. Based on information available in the public literature about the moisture content of desert sands worldwide, this moisture content level is considered to be at the high end of levels expected to be encountered in actual field conditions, and thus represent a worst case..
1. Conclusion: Under soil moisture content conditions (5%) at the high end of those expected to be encountered during IAEA inspections, PNNL’s ground-penetrating HRI system was able to detect and locate all but one (air-filled PVC pipe) of the objects buried in the test bed. The range of materials, sizes, and depths of the objects successfully detected and located during testing typify those the IAEA will need to verify during field inspections. The tests confirm that it is feasible for the IAEA to use PNNL’s HRI technology as a DIV tool to perform in-ground inspections at declared facilities.

v
Recommendation: PNNL recommends that a project be undertaken to develop and field-test prototypes of a modularized, readily transportable, practical-to-deploy, and easy-to-use version of this 200–400-MHz HRI DIV tool (see Section 4.2.1). The system proposed would provide good-resolution images for objects buried within a few meters of the surface and it can be operated by one person or expanded into a towable imaging array that provides for rapid scanning.
2. Conclusion: Under soil moisture content conditions (5%) at the high end of those expected to be encountered during IAEA inspections, GSSI’s UtilityScan (400-MHz antenna) system was able to detect and locate all but two (concrete and plastic barrels) of the buried objects that tests were performed on. The plastic barrel could possibly have been detected if it were not for an inadvertent error during testing. The concrete barrel could possibly have been detected if its moisture content had not come into near equilibrium with the surrounding soil. The range of materials, sizes, and depths of the objects successfully detected and located during testing typify those the IAEA will encounter during field inspections. The tests confirm that it is feasible for the IAEA to use GSSI’s UtilityScan technology as a DIV tool to perform in-ground inspections at declared facilities.
Recommendation: The GSSI UtilityScan system should be modified and its operation adapted for use in the targeted field environment of dry sandy soil.
3. Conclusion: Under soil moisture content conditions (5%) at the high end of those expected to be encountered during IAEA inspections, Sensors & Software Inc.’s Noggin 100 system was able to detect and locate all but two (concrete and 3-m-deep metal barrels) of the buried objects tests were performed on. The concrete barrel could possibly have been detected if its moisture content had not come into near equilibrium with the surrounding soil. The 3-m-deep metal barrel should have been detected but near-surface clutter and electromagnetic interference (EMI) from surrounding radio towers operating at the system’s frequency range limited the system’s depth penetration. The range of materials, sizes, and depths of the objects successfully detected and located during testing typify those the IAEA will encounter during field inspections. The tests confirm that it is feasible for the IAEA to use Sensors & Software Inc.’s Noggin 100 system as a DIV tool to perform in-ground inspections at declared facilities.
Recommendation: PNNL recommends that a project be undertaken to develop and field-test prototypes of a modularized, readily transportable, practical-to-deploy, and easy-to-use version of a 100-MHz HRI DIV tool (see Section 4.2.2 and Appendix C for two concepts proposed). The system proposed would be capable of detecting and locating buried objects down to depths of 5 m or more, and it can be operated by one person or expanded into a towable imaging array that provides for rapid scanning.


vii
Acronyms and Abbreviations
µs microseconds 3D three-dimensional DIQ design information questionnaire DIV design information verification EMI electromagnetic interference F&R functions and requirements FFT Fast Fourier transform GPR ground-penetrating radar HRI holographic radar imaging IAEA International Atomic Energy Agency PNNL Pacific Northwest National Laboratory PVC polyvinyl chloride TOF time-of-flight


ix
Contents
Summary ...................................................................................................................................................... iii Acronyms and Abbreviations ..................................................................................................................... vii 1.0 Introduction ....................................................................................................................................... 1.1 2.0 Concrete Studies ................................................................................................................................ 2.1
2.1 Study Objective ......................................................................................................................... 2.1 2.2 Holographic Radar Imaging Feasibility Study .......................................................................... 2.1
2.2.1 Functions and Requirements .......................................................................................... 2.1 2.2.2 Concrete Walls #1–#3 .................................................................................................... 2.2
2.2.2.1 Test Wall #1 – Standard Density ..................................................................... 2.3 2.2.2.2 Test Wall #2 – Standard Density ..................................................................... 2.5 2.2.2.3 Test Wall #3 – High Density ........................................................................... 2.6
2.2.3 Spiral Antenna: Circular-Polarized Planar Cavity-Backed ........................................... 2.7 2.2.4 Holographic Radar Imaging Studies .............................................................................. 2.7
2.2.4.1 Imaging Parameters ......................................................................................... 2.7 2.2.4.2 Imaging Results for Test Wall #1 – Standard Density .................................... 2.8 2.2.4.3 Imaging Results for Test Wall #2 – Standard Density .................................. 2.11 2.2.4.4 Imaging Results for Test Wall #3 – High Density ......................................... 2.11
2.2.5 Conclusions of Holographic Radar Imaging Feasibility Study .................................... 2.11 2.3 GSSI Radar Imaging System Evaluation ................................................................................ 2.12
2.3.1.1 Imaging Parameters ....................................................................................... 2.13 2.3.1.2 Imaging Results for Test Walls #1 and #2 ..................................................... 2.13
2.4 Acoustic Time-of-Flight Technique Evaluation ...................................................................... 2.14 2.4.1 Acoustic Data Acquisition System ............................................................................... 2.15 2.4.2 Acoustic Scoping Study Results................................................................................... 2.17
2.4.2.1 Transmission TOF Measurements ................................................................. 2.17 2.4.2.2 V-Path Pitch-Catch TOF Measurements ....................................................... 2.19
2.4.3 Conclusions of Acoustic Technique Evaluation........................................................... 2.22 2.5 Conclusions of Concrete Studies ............................................................................................. 2.23
3.0 Ground-Penetrating Radar Imaging Studies ...................................................................................... 3.1 3.1 Ground-Penetrating Radar Imaging – Objectives ..................................................................... 3.1 3.2 Ground-Penetrating Radar Imaging – Systems Tested ............................................................. 3.1
3.2.1 GSSI UtilityScan System ............................................................................................... 3.1 3.2.2 Sensors & Software Inc.’s Noggin 100 System ............................................................. 3.1 3.2.3 PNNL’s Holographic Radar Imaging System ................................................................ 3.3
3.3 Ground-Penetrating Radar Imaging – Buried Targets Test Site Development ......................... 3.4 3.4 Ground-Penetrating Radar Imaging – Results ........................................................................... 3.9

x
3.4.1 Soil Moisture Content Testing ..................................................................................... 3.10 3.4.2 Testing Round 1 – Suspended Design for PNNL’s Imaging Antenna Array ............... 3.11
3.4.2.1 Test #1, Imaging Metal Plate Through 1.2-m Sand ....................................... 3.11 3.4.2.2 Test #2, Imaging Metal Plate, Through Concrete-Rebar-Sand ...................... 3.13 3.4.2.3 Test #3, Imaging Four 55-Gallon Metal Barrels (0.5-m, 1-m, 2-m, and
3-m Deep) Through Sand .............................................................................. 3.16 3.4.2.4 Test #4 – Imaging Four 55-Gallon Barrels (Plastic, Steel, Wood,
Concrete) Through 1.5-m Sand ..................................................................... 3.17 3.4.2.5 Test #5 – Imaging PVC Plastic Pipe Through 1.5-m Sand ........................... 3.18 3.4.2.6 Summary of Round 1 Tests #1–#5 ................................................................ 3.19
3.4.3 Testing Round 2 – Sled Design for PNNL’s Imaging Antenna Array ......................... 3.20 3.4.3.1 Test #6 – 5-Gallon Plastic Containers, Filled With Water and Canola
Oil .................................................................................................................. 3.23 3.4.3.2 Summary of Round 2 Tests #1–#6 ................................................................ 3.24
3.4.4 Testing Round 3 – GSSI System .................................................................................. 3.25 3.4.4.1 Test #1 – Imaging Metal Plate Through 1.2-m Sand ..................................... 3.25 3.4.4.2 Tests #3 & #4, Imaging Eight 55-Gallon Barrels Through Sand .................. 3.26 3.4.4.3 Test #5, Imaging PVC Plastic Pipe Through 1.5-m Sand ............................. 3.28 3.4.4.4 Summary of Round 3 Tests #1, #3, #4, and #5 .............................................. 3.29
3.4.5 Testing Round 4 – Noggin 100 System ........................................................................ 3.29 3.4.5.1 Test #1, Imaging Metal Plate Through 1.2-m Sand ....................................... 3.29 3.4.5.2 Test #3, Imaging Four 55-Gallon Metal Barrels (0.5-m, 1-m, 2-m, and
3-m Deep) Through Sand .............................................................................. 3.30 3.4.5.3 Test #4 – Imaging Four 55-Gallon Barrels (Plastic, Steel, Wood,
Concrete) Through 1.5-m Sand ..................................................................... 3.31 3.4.5.4 Test #5 – Imaging PVC Plastic Pipe Through 1.5-m Sand ........................... 3.32 3.4.5.5 Summary of Round 4 Tests #1, #3, #4, and #5 .............................................. 3.33
3.4.6 Conclusions of Testing Rounds 1–4 ............................................................................. 3.33 4.0 Recommendations – Design Concepts for Future Systems ............................................................... 4.1
4.1 Concept Designs for In-Concrete Inspection Systems .............................................................. 4.1 4.1.1 Design Concept for a Portable Holographic Radar Imaging System ............................. 4.1 4.1.2 Concept Design for Ultrasonic Synthetic Aperture Array System ................................. 4.1
4.2 Concept Designs for the In-Ground Inspection Systems .......................................................... 4.2 4.2.1 Concept Design for 200–400-MHz Ground-Penetrating Holographic Radar
Imaging System .............................................................................................................. 4.2 4.2.2 Concept Design for 100-MHz Ground-Penetrating Holographic Radar Imaging
System ............................................................................................................................ 4.4 4.2.3 Deep Target Burial Test Site for 100-MHz Ground-Penetrating HRI System ............... 4.6
5.0 Conclusions ....................................................................................................................................... 5.1

xi
6.0 References ......................................................................................................................................... 6.1 Appendix A – Functions and Requirements for the Concrete Structure Inspection Holographic
Radar Imaging System ...................................................................................................................... A.1 Appendix B – Proposal for Imaging Internal High-Density Concrete Structures by Ultrasonic
Synthetic Aperture Array ...................................................................................................................B.1 Appendix C – Proposal for Holographic Radar Imaging ...........................................................................C.1

xii
Figures
2.1 Portable DIV System Concept ......................................................................................................... 2.2 2.2 Test Wall #1 ..................................................................................................................................... 2.4 2.3 Test Wall #2 ..................................................................................................................................... 2.5 2.4 Test Wall #3 ..................................................................................................................................... 2.6 2.5 (a) Top View of Antenna Assembly; (b) Components of Antenna Assembly; (c) Transmit
and Receive Antennas During Imaging Scan ................................................................................... 2.7 2.6 Rear Side Image Results for Test Wall #1 ....................................................................................... 2.9 2.7 Front Side Image Results for Test Wall #1 .................................................................................... 2.10 2.8 Front Side Images of Test Wall #2................................................................................................. 2.12 2.9 GSSI Concrete Scanning System ................................................................................................... 2.13 2.10 GSSI System Imaging Results ....................................................................................................... 2.14 2.11 54-kHz Exponential Acoustic Transducers (transmitter left and receiver right) ........................... 2.15 2.12 54-kHz Transducers with Dry Rubber Couplants .......................................................................... 2.16 2.13 Acoustic Scoping Study Data Acquisition System ........................................................................ 2.17 2.14 Standard-Density Concrete, Straight Through-Transmission Measurement on Test Wall #2,
16-in.-thick Wall, No Pipe in Signal Pathway ............................................................................... 2.18 2.15 High-Density Concrete, Straight Through-Transmission Measurement on Test Wall #3,
12-in.-thick Wall, No Pipe in Signal Pathway ............................................................................... 2.18 2.16 Calibration Straight Through-Transmission Measurement with Exponential Transducers
Positioned Tip-to-Tip ..................................................................................................................... 2.18 2.17 Baseline Measurement of Air-Backed Receive Transducer, in Contact with Nothing .................. 2.19 2.18 V-Path Pitch-Catch Measurement Made from the Rear Side of Test Wall #3 (high-density
concrete), 12-in.-thick Wall, No Pipe in Signal Pathway .............................................................. 2.20 2.19 V-Path Pitch-Catch Measurement from the Rear of Test Wall #3, 12-in.-thick Wall, 3-in.-
Diameter Pipe Located 6 in. Below the Surface ............................................................................ 2.21 2.20 V-Path Pitch-Catch Measurement from the Rear of Test Wall #3, 12-in.-thick Wall, 3-in.-
Diameter Pipe Located 9 in. Below the Surface ............................................................................ 2.21 2.21 V-Path Pitch-Catch Measurement from the Front of Test Wall #3, 12-in.-thick Wall, 3-in.-
Diameter Pipe Located 3 in. Below the Surface ............................................................................ 2.22 2.22 TOF versus Feature Depth for Full Wall and Three Pipes ............................................................. 2.22 3.1 GSSI UtilityScan .............................................................................................................................. 3.2 3.2 Scan Layout ...................................................................................................................................... 3.2 3.3 Sensor & Software Inc.’s Noggin 100 System ................................................................................. 3.3 3.4 PNNL’s Prototype Holographic Radar Imaging System ................................................................. 3.4 3.5 Design Plan for Buried Targets Test Site ......................................................................................... 3.5 3.6 Location of Buried Targets Test Site in Richland, Washington ....................................................... 3.6 3.7 4-ft × 32-ft Plate Buried 4-ft Deep ................................................................................................... 3.7

xiii
3.8 Empty 2-ft-Diameter × 40-ft PVC Pipe Buried 1.5 m with Ends Closed Off .................................. 3.7 3.9 Four Empty 55-Gallon Steel Drums Buried Upright at Depths of 0.5, 1, 2, and 3 m ...................... 3.8 3.10 Four 55-Gallon Drums Buried Upright at Depth of 1.5 m ............................................................... 3.8 3.11 55-Gallon Drums .............................................................................................................................. 3.9 3.12 5-Gallon Containers, Target #8 Filled with Water and Target #9 Filled with Canola Oil,
Buried 0.5-m Deep ........................................................................................................................... 3.9 3.13 Calculated Skin Depths for Sandy Soils from Yuma, Arizona, with 0% and 5% Volumetric
Moisture Content ............................................................................................................................ 3.10 3.14 Depiction of Diagonal Scans Made of Target #1, the Metal Plate ................................................. 3.12 3.15 Image of Diagonal Scan of Target #1, Array 3 in. Above the Ground .......................................... 3.12 3.16 Image of Diagonal Scan of Target #1, Array 6 in. Above the Ground .......................................... 3.13 3.17 Image of Diagonal Scan of Target #1, Array 12 in. Above the Ground ........................................ 3.13
3.18 Photograph of 16-in. × 16-in. Grid Made of ½-in.-Diameter Rebar .............................................. 3.14 3.19 PNNL’s Holographic Radar Imaging Antenna Array Suspended 3 in. Above 6-in.-Thick
Concrete Blocks ............................................................................................................................. 3.14 3.20 Imaging Target #1 Through 6 in. of Concrete ............................................................................... 3.15 3.21 Imaging Target #1 Through a 16-in. × 16-in. Grid of ½-in.-Diameter Rebar and 6 in. of
Concrete ......................................................................................................................................... 3.15 3.22 Scan Configuration for Target #3 Buried Metal Barrels ................................................................ 3.16 3.23 Scan Results for Target #3 Buried Metal Barrels .......................................................................... 3.16 3.24 Scan Configuration for Targets #4–#7 Buried 55-Gallon Barrels.................................................. 3.17 3.25 Scan Results for Targets #4–#7 Buried 55-Gallon Barrels ............................................................ 3.18 3.26 Scan Configuration for Target #2 Buried at a Depth of 1.5 m ....................................................... 3.19 3.27 Scan Results for Target #2 Buried at a Depth of 1.5 m.................................................................. 3.19 3.28 Ground-Penetrating Radar Antenna Array Modified with Sled-Style Skid Plate .......................... 3.21 3.29 Imaging Results for Ground-Penetrating Radar Array Modified with Sled-Style Skid Plate
with Antenna on the Sand .............................................................................................................. 3.22 3.30 Scanning Configuration for 5-Gallon Plastic Containers Buried 0.5-m Deep, Filled with
Water and Canola Oil ..................................................................................................................... 3.23 3.31 Imaging Results for 5-Gallon Plastic Containers Buried 0.5-m Deep, Filled with Water and
Canola Oil ...................................................................................................................................... 3.24 3.32 Imaging Results for 4-ft × 32-ft Metal Plate Buried at a Depth of 4 ft .......................................... 3.25 3.33 Detailed Depiction of the Eight 55-Gallon Barrel Targets Buried in the Test Bed ....................... 3.26 3.34 Imaging Results for Eight Barrels: Four Metal and Four Others Buried 1.5-m Deep .................. 3.27 3.35 Further Image Processing Reveals 3-m-Deep Metal Barrel ........................................................... 3.27 3.36 PVC Plastic Pipe Scan Configuration and Results ......................................................................... 3.29
3.37 Imaging Results for 4-ft × 32-ft Metal Plate Buried at a Depth of 4 ft .......................................... 3.30 3.38 Waterfall Plot Showing the Metal Plate is Buried at an Approximate Depth of 4 ft ..................... 3.30 3.39 Imaging Results for the Four Metal Barrels Buried 0.5-m, 1-m, 2-m, and 3-m Deep ................... 3.31

xiv
3.40 Waterfall Plot for the Four Metal Barrels Buried (right to left) 0.5-m, 1-m, 2-m, and 3-m Deep ............................................................................................................................................... 3.31
3.41 Imaging Results for Four Barrels Buried 1.5-m Deep ................................................................... 3.31 3.42 Waterfall Plot for Four Barrels Buried 1.5-m Deep ....................................................................... 3.32 3.43 Sensor & Software Inc.’s Voxler-2 3D Perspective View of 1.5-m-Deep Buried PVC Pipe ........ 3.32 4.1 (a) Sensor Unit for Similar Imaging System; (b) Concept for Future Systems................................ 4.1 4.2 Single Transmit/Receive Spiral Antenna Module for a 200–400-MHz Modularized System ......... 4.3 4.3 Concept Design for a 200–400-MHz HRI Imaging System Using Ten Antenna Modules ............. 4.3 4.4 Shipping Concept for the 200–400-MHz HRI Imaging System Showing Ten Antenna
Modules ............................................................................................................................................ 4.4 4.5 Mobile Transmit/Receive Dipole Antenna Module for a 100-MHz System ................................... 4.5 4.6 Concept Design for a 100-MHz HRI Imaging System Using Four Antenna Modules .................... 4.5 4.7 Shipping Concept for a 100-MHz HRI Imaging System Using Four Antenna Modules ................. 4.6 4.8 Deep Target Burial Test Site Concept Design for the 100-MHz PNNL HRI System ..................... 4.7
Table
3.1 Dimensions for Buried Targets ........................................................................................................ 3.5

1.1
1.0 Introduction
As part of a comprehensive safeguards program, the International Atomic Energy Agency (IAEA) conducts design information verification (DIV) inspections of nuclear facilities operating within its member states. The current methods used for these inspections do not allow for “seeing” into the ground or into concrete structures to detect and identify objects of interest such as process piping routes, junctions, and manifolds. Agency inspectors are typically limited to the examination of objects that are visually or physically accessible.
The Unites States Department of Energy (DOE) has established the Next Generation Safeguards Initiative (NGSI) to support the IAEA safeguards mission. One objective of the NGSI is to provide the IAEA with modern technology that might enable it to overcome current inspection limitations so that inspectors can verify that the construction of declared facilities matches information provided by a state to the IAEA on its Design Information Questionnaire (DIQ). Inspections of such facilities will require novel non-destructive DIV tools capable of in-concrete and in-ground inspections to ensure that pipes and other concealed infrastructure can be detected, located, identified, and compared to facility design documentation.
The Pacific Northwest National Laboratory (PNNL) has a long history of performing innovative research and development on nondestructive evaluation (NDE) technologies and holds multiple patents in radar imaging, holographic radar imaging, and acoustic imaging. These technologies have been shown to be capable of imaging into interior and exterior walls made of various materials and several meters into the ground. PNNL-developed laboratory-prototype DIV systems are state-of-the-art hardware and software, providing enhanced resolution, location, and detection capability. In addition, commercially available NDE systems that are battery-powered, transportable, and easily operated by one person are candidate tools for DIV evaluation.
Three systems were identified for in-concrete inspection evaluations: 1) PNNL’s prototype holographic radar imaging (HRI) system, 2) GSSI’s SRI-3000 commercial radar imaging system, and 3) a PNNL laboratory instrument configured to conduct acoustic time-of-flight (TOF) measurements. Three concrete test walls were developed with client guidance. The walls were made of standard-density and high-density concrete containing various embedded objects such as metal pipes, pipe junctions, air voids, and calibration test objects.
To conduct in-ground DIV system evaluation, three systems were identified: 1) PNNL’s holographic radar imaging array (200–400 MHz), 2) GSSI’s UtilityScan (400-MHz antenna), and 3) Sensors & Software Inc.’s Noggin 100 (100-MHz). A buried test site, designed with client input, was considered to be representative of underground architectures expected to be encountered at declared facilities. The buried test site design contained target objects buried at various depths. The target objects were made of metal, plastic, wood, and concrete, all covered with an overburden of desert sand soil. Based on the test results, recommendations are made (in the Summary section) about the suitability of the commercial and laboratory systems for potential use by the IAEA as DIV tools for inspections at declared facilities. Additionally, for the laboratory prototypes and instruments that provided good results, Section 4.0 and Appendices B and C provide recommendations and proposals for further development.

2.1
2.0 Concrete Studies
2.1 Study Objective
The objective of this concrete study was to evaluate three technologies to assess if it is feasible for them to be developed into field-deployable hardware that could be used by the IAEA as a nondestructive DIV tool to verify that the construction of declared facilities matches information provided by a state or nation on its design information questionnaire (DIQ). The three technologies evaluated were Pacific Northwest National Laboratory’s (PNNL’s) holographic radar imaging (HRI) system, GSSI’s commercial radar imaging system, and the acoustic time-of-flight (TOF) technique using transmit/receive “exponential transducers” (i.e., transducers fitted with an exponential-profile horn) placed in a V-path pitch-catch configuration.
2.2 Holographic Radar Imaging Feasibility Study
The holographic near-field radar imaging technology developed at PNNL over the last 20 years is a promising solution for the inspection and verification of objects embedded within concrete structures at nuclear facilities. This type of system can be used to produce three-dimensional (3D) images of objects such as embedded pipes in near-real time in order to confirm documented design information. In order to investigate the application of this technology for DIV scenarios, the steps outlined below were taken. Sections 2.2.1 through 2.2.4 provide the summary detail for each bulleted item.
• A Functions and Requirements (F&R) document was developed based on input from the users.
• Based on the F&R, three test walls having various sizes, materials, embedded objects, and construction configurations were developed.
• Antennas were designed, modeled, fabricated, and tested to optimize through-wall imaging capabilities.
• Imaging studies were conducted to determine the ability of the technique to detect embedded objects.
2.2.1 Functions and Requirements
The full functions and requirements document developed for the holographic radar imaging studies is provided in Appendix A. The key requirements from this document are summarized as follows:
• 3D imaging radar system for DIV scenarios
– near-real-time imaging
– rapid scan collection (8 linear feet in 5 seconds)
• Portable linear array system composed of sensor unit and display unit (Figure 2.1)
– Goal – sensor unit form factor of 36 in. × 12 in. × 6 in.
– Goal – sensor unit weight of 10 lbs.

2.2
• Detection and verification of metal objects such as process piping routes embedded within concrete surfaces
– Goal – 12-in. penetration depth in dry concrete older than 30 days
– Goal – resolution of objects with characteristic dimensions of 3 in.
Figure 2.1. Portable DIV System Concept
2.2.2 Concrete Walls #1–#3
Three concrete test walls were constructed to 1) simulate the kinds of imaging target configurations expected to be encountered in the field and 2) determine what kinds of materials and embedded objects of various sizes could be detected at various depths and in the presence of various interfering structures (e.g., rebar). The highlights of the wall construction are summarized below:
• Test walls #1 and #2 – standard-density concrete
• Test wall #3 – high-density concrete
• Concrete curing time – 30 days (minimum)

2.3
• Characteristics implemented in walls
– Pipes having two different diameters
– Pipe junctions at various depths
– Open-ended pipes
– Rebar grid interfering structure
– Circular openings (air voids)
– Embedded metallic “F” resolution target
2.2.2.1 Test Wall #1 – Standard Density
A depiction of wall #1 is shown in Figure 2.2. Key attributes of this test wall include:
• Standard-density concrete
• Six embedded steel pipes – three with 1.315-in. outer diameter and three with 2.875-in. outer diameter
• Rebar grid 0.5-in.-diameter rods, 12-in. spacing, 1.25 in. below the surface of the concrete.

2.4
Figure 2.2. Test Wall #1
2.5
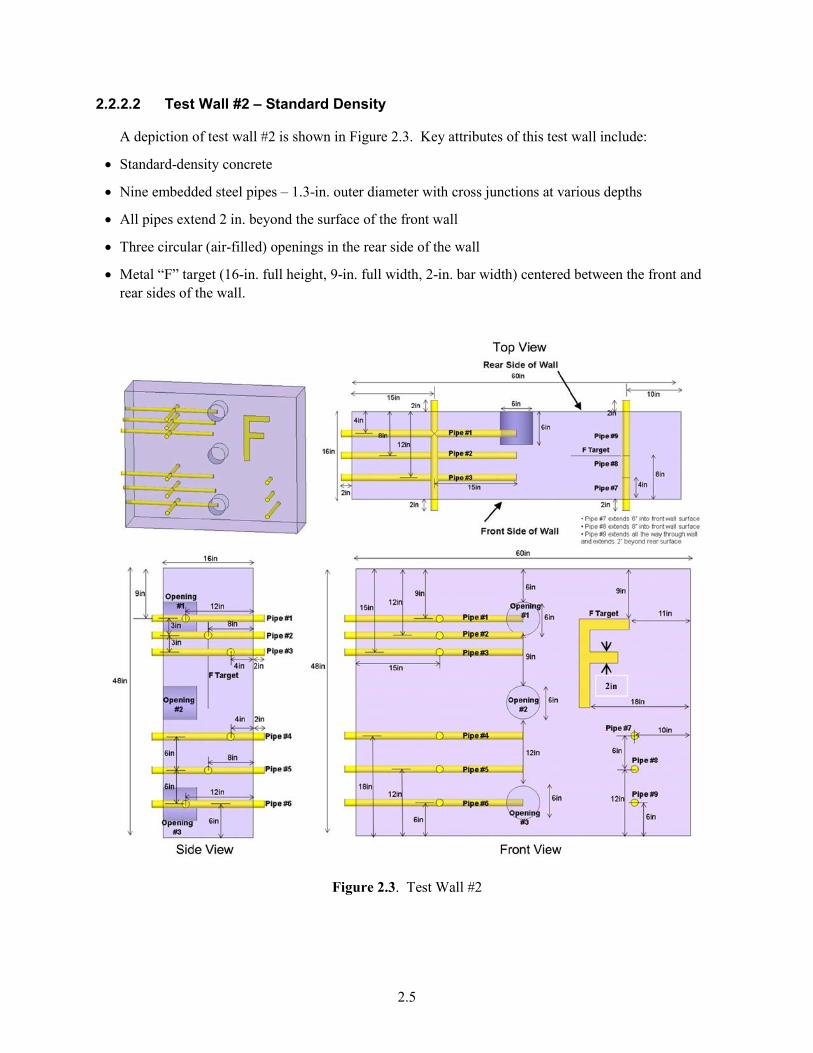
2.2.2.2 Test Wall #2 – Standard Density
A depiction of test wall #2 is shown in Figure 2.3. Key attributes of this test wall include:
• Standard-density concrete
• Nine embedded steel pipes – 1.3-in. outer diameter with cross junctions at various depths
• All pipes extend 2 in. beyond the surface of the front wall
• Three circular (air-filled) openings in the rear side of the wall
• Metal “F” target (16-in. full height, 9-in. full width, 2-in. bar width) centered between the front and rear sides of the wall.
Figure 2.3. Test Wall #2

2.6
2.2.2.3 Test Wall #3 – High Density
A depiction of test wall #3 is shown in Figure 2.4. Key attributes of this test wall include:
• High-density concrete (aggregate containing conductive materials such as magnetite, hematite, or steel)
• Two embedded steel pipes – 2.875-in. outer diameter.
Figure 2.4. Test Wall #3

2.7
2.2.3 Spiral Antenna: Circular-Polarized Planar Cavity-Backed
Circular-polarized antennas were used because they ensure that objects oriented along any direction will appear in the images. The cavity-backed spiral antennas shown in Figure 2.5 were designed for imaging within concrete structures such as test walls #1–#3. This type of antenna has been used in previous systems due to advantages such as wide bandwidth, low cost, low weight, and the use of circular polarization. A wideband antenna is necessary because the lower frequencies penetrate deeper into concrete structures while the higher frequencies provide higher resolution. The antenna operates over a bandwidth of 700 MHz to 4 GHz. The antenna assembly was designed with a surface contact skid plate, which maximizes coupling of the radar signals into the concrete structure. The antenna diameter is 3.8 in. and the height is 2.5 in. The antenna impedance and materials were matched to the dielectric constant of concrete. The cavity is filled with foam that can absorb backward-traveling electromagnetic waves. The cavity walls are metallic-plated to facilitate containment of the electromagnetic energy.
Figure 2.5. (a) Top View of Antenna Assembly; (b) Components of Antenna Assembly; (c) Transmit
and Receive Antennas During Imaging Scan
2.2.4 Holographic Radar Imaging Studies
2.2.4.1 Imaging Parameters
The parameters listed below define the key factors involved in the imaging of test walls #1–#3.
• Frequency range: 0.7–4.0 GHz
• HRI System lateral resolution: 1.66 cm – approximately ½λ, or ½ f·(c/√ε) (where λ = wavelength; f = frequency; c = velocity of light; and ε is the dielectric constant)
• Antennas: circular-polarized, cavity-backed spiral
• Spatial sampling on concrete surface: 1-cm horizontal, 1-cm vertical
• Samples/scan: 512
• Range gate: 100 cm
• Dielectric constant, ε, of concrete: 10

2.8
2.2.4.2 Imaging Results for Test Wall #1 – Standard Density
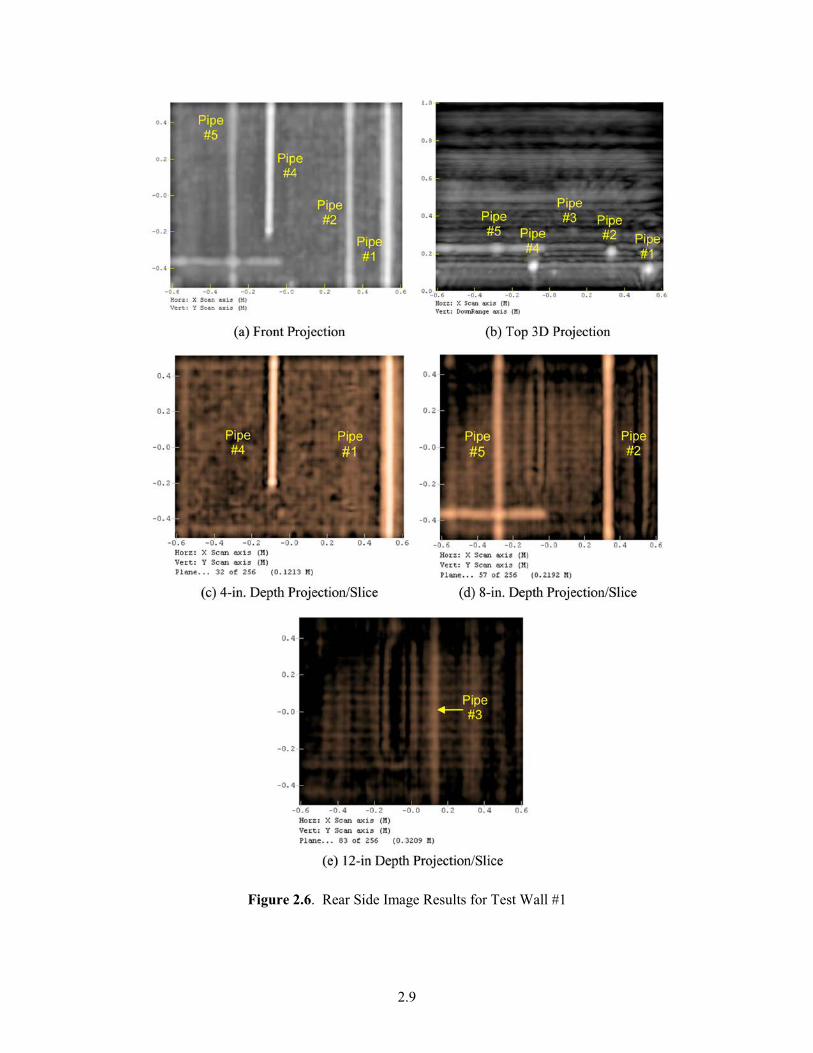
Three-dimensional (3D) datasets were collected by scanning the rear side (Figure 2.6) and front side (Figure 2.7) of test wall #1. Refer to Figure 2.2 for pipe numbering references and to compare these images to the pictorial representation of test wall #1. In order to visualize the 3D image data, sophisticated 3D holographic radar imaging algorithms were used to develop front and top projections and sliced projections at various depths. This PNNL-developed software (AhisWin Studio) is used to generate and manipulate such views in real time.
The rear-side scanning results of wall #1 depicted in Figure 2.6 show that with the exception of pipe #6, all pipes that should be visible in a given view are visible in Figure 2.6(a)–(e). A combination of factors have combined to create a negative outcome for pipe #6—1) it is a small-diameter pipe, 2) it is located 12 in. from the rear side, and 3) it is near the end of the wall surface, thus limiting the imaging aperture compared to locations further from the end wall. Regarding factor 3, the larger the aperture used during the scanning process, the more information is available for the image reconstruction process, and the higher the image quality.
The front-side scanning results of wall #1 depicted in Figure 2.7 show that with the exception of pipes #1 and #4, all pipes that should be visible in a given view are visible in Figure 2.7(a)–(e). Pipes #1 and #4 are located 12 in. away from the front side. Just as pipe #6 was not visible from the rear side, it was expected that it might be difficult to detect pipe #4 from the front side. However, because pipe #3 was visible at a 12-in. depth from the rear side, we would have expected to see pipe #1 from the front side. It is believed that the additional reflections created by the rebar 1.25 in. beneath the front-side surface contributed to the inability to see pipe #1.
2.9
Figure 2.6. Rear Side Image Results for Test Wall #1

2.10
Figure 2.7. Front Side Image Results for Test Wall #1

2.11
2.2.4.3 Imaging Results for Test Wall #2 – Standard Density
Holographic radar data were collected by scanning the front side of test wall #2. Figure 2.8 shows the results of using the PNNL-developed imaging algorithm software to develop front and side projections, and sliced projections at several depths. Refer to Figure 2.3 for pipe numbering references and to compare the images of Figure 2.8 to the pictorial representation of test wall #2. With the exception of pipes #1 and #6, all embedded objects that should be visible are visible in Figure 2.8(a)–(f). The combination of pipe diameter (1.5 in.) and pipe depth (12 in. from the imaging surface) for pipes #1 and #6 are the factors behind there being no discernible details for these pipes in the images. The front projection shown in Figure 2.8(a) shows an image created from information obtained at all the depths for which data is available. The image resolution is sufficient to clearly distinguish between pipes #2 and #3 spaced 3-in. center-to-center and having only 1.5 in. of concrete between them. Pipes #3 and #4 at a 4-in. depth and pipes #2 and #5 at an 8-in. depth are clearly visible in Figures 2.8(c) and (d), respectively. The horizontal and vertical sections (width is 2 in.) of the “F” target are clearly visible in Figure 2.8(e) at an 8-in. depth. As shown in Figure 2.8(f), all three of the 6-in.-diameter openings are clearly visible. The concrete/air interface for these openings is located 10 in. from the imaging surface.
2.2.4.4 Imaging Results for Test Wall #3 – High Density
Based on the results of holographic radar images created for test wall #3, it is concluded that radar signals cannot be used to image objects embedded in high-density concrete. The conductive nature of the aggregate type (typically hematite, magnetite, or steel) prevents electromagnetic signals from penetrating structures containing high-density concrete.
2.2.5 Conclusions of Holographic Radar Imaging Feasibility Study
The spiral antennas made it possible to detect, locate, and resolve objects of interest inside test walls #1 and #2. The imaging study results indicate that the location of small-diameter (1.5-in.) pipes can be successfully determined for depths up to 8 in., and that larger-diameter (3-in.) pipes can be located for depths up to 12 in. The presence of air voids was also detected for depths up to 10 in. Pipe structures were visible when imaging through a rebar grid for depths up to 8 in. Individual pipes were resolved at a 3-in. center-to-center spacing with 1.5 in. of concrete between them. Due to the conductive nature of the aggregate materials used in high-density concrete, holographic radar imaging is unable to penetrate and is therefore unable to provide details about embedded objects in high-density concrete.

2.12
Figure 2.8. Front Side Images of Test Wall #2
2.3 GSSI Radar Imaging System Evaluation
Figure 2.9 shows a commercially available concrete imaging system purchased from GSSI (SRI 3000 processing unit) and used to image test walls #1 and #2. The system uses an impulse transmitter that can drive antennas from 250 MHz to 3 GHz. For this image test, linear-polarized bowtie antennas were used, which contact the concrete surface.

2.13
Figure 2.9. GSSI Concrete Scanning System
2.3.1.1 Imaging Parameters
The parameters listed below define the key factors involved in the imaging of the test walls.
• Frequency range: 0.25–3.0 GHz
• Antennas: linear co-polarized bowtie
• Spatial sampling on concrete surface: 5.08-cm horizontal, 5.08-cm vertical
• Samples/scan: 512
• Dielectric constant, ε, of concrete: 10
2.3.1.2 Imaging Results for Test Walls #1 and #2
Imaging results from the GSSI system are shown in Figure 2.10. It can be seen that objects at 4-in. depth (pipes #3 and #4) are readily detected while deeper objects are not as clearly defined. Due to the use of linear polarization, data collection time is increased by a factor of two (as compared with PNNL’s holographic imaging system) because scans of a given area must be performed in the vertical as well as in the horizontal direction. Since it was established in prior measurements that electromagnetic waves cannot penetrate high-density concrete, no attempts were made to image test wall #3 with this system.

2.14
Figure 2.10. GSSI System Imaging Results
2.4 Acoustic Time-of-Flight Technique Evaluation
Acoustic inspection of concrete, wood, and other materials of construction is routinely performed in the construction and civil engineering industries to locate voids, cracks, and inclusions in these materials, as well as to analyze for material strength, structure, corrosion, and moisture. Commercial hand-held devices, such as the acoustic V-meter and acoustic transducers manufactured by James Instruments Inc., can be used to nondestructively inspect concrete and other coarse-grained materials for on-site measurements.
A series of measurements using the acoustic TOF technique were performed on concrete test walls #2 and #3 (see Figures 2.3 and 2.4 for reference) to determine if the technique is feasible for the inspection of high-density concrete. The first data taken were transmission TOF measurements through test blocks #2 and #3 (portions not containing obstructions) to compute phase velocity and to ensure sufficient acoustic signal strength to obtain useful data from the high-density concrete test block #3. The second set of data was taken on test block #3 using the “V-path pitch-catch” TOF method described in detail below. The V-path TOF measurements were performed at locations along the concrete wall samples with and without the pipe inclusions to determine if this technique can discriminate between the following

2.15
conditions: 1) no pipe, 2) a 3-in.-diameter pipe at a 6-in. depth, 3) a 3-in.-diameter pipe at a 9-in. depth, and 4) a 3-in.-diameter pipe at a 3-in. depth.
2.4.1 Acoustic Data Acquisition System
Acoustic TOF measurements were performed using two 54-kHz “exponential” acoustic transducers (i.e., transducers fitted with an exponential-profile horn, Figure 2.11). The advantage of using exponential transducers is the concentration of acoustic energy to a smaller surface area at the nose of the transducers. These transducers were selected based on availability and the demonstrated ability to traverse coarse sandstone samples during prior work on another project. The 54-kHz transducers were originally procured in 2009 from James Instruments Inc. (transmitter: model V-C-4911; receiver: model V-C-4905) for TOF measurements through 24-in.-thick dry and wet porous sandstone rock samples.
Figure 2.11. 54-kHz Exponential Acoustic Transducers (transmitter left and receiver right)
A James Instruments Inc. model V-C-4896 pre-amplifier (S/N: 40 05-20826) was placed in-line between the receiver transducer and the signal input of the Panametrics (Olympus NDT) pulser-receiver unit to provide additional signal amplification.
To obtain acoustic signals for the 12-in.-thick samples with good signal-to-noise ratios, a dry rubber acoustic couplant (James Instruments Inc. V-24145) was placed on the face of each transducer to enhance energy transmission into the samples (Figure 2.12). A small amount of water was also applied to the rubber couplant to maximize acoustic energy transmission into the samples.

2.16
Figure 2.12. 54-kHz Transducers with Dry Rubber Couplants
Acoustic signals were generated, amplified, filtered, and conditioned by a Panametrics (Olympus NDT) model 5058PR high-voltage ultrasonic pulser-receiver unit. The impulse-type spike pulser was used to excite the transmit transducer while the receiver was used to amplify and filter the receiver transducer signals. The waveforms were digitized and saved by a LeCroy WaveRunner 64Xi 600-MHz digital oscilloscope. The system hardware that was used for the measurements is similar to the equipment shown in Figure 2.13.
The pulser-receiver settings used for all of the measurements were:
• 200-Hz repetition rate
• 100-V pulse (negative impulse)
• 60 dB gain
• 0 dB attenuation
• Vernier attenuation: not engaged
• 0 damping
• High-pass filter: out (0.01 MHz)
• Low-pass filter: 0.5 MHz
• 0 degree phase (normal)

2.17
Figure 2.13. Acoustic Scoping Study Data Acquisition System
2.4.2 Acoustic Scoping Study Results
2.4.2.1 Transmission TOF Measurements
TOF acoustic measurements were performed in a straight through-transmission mode on those portions of the test walls #2 and #3 (see Figures 2.3 and 2.4) without pipe inclusions. In the straight through-transmission mode, the pair of transducers was positioned on the front and rear surfaces of the test wall. They were aligned vertically and horizontally with respect to one another such that the straight-line projection between the transducer centerlines was perpendicular to the test wall surface. TOF measurements with the transducers positioned in this manner allowed acoustic velocity to be calculated. Additionally, performing these measurements was necessary to confirm that acoustic energy from the transmitter transducer was penetrating and traversing the thickness of the concrete walls with sufficient signal strength to provide useful data in the follow-on set of V-path pitch-catch TOF measurements.
The measured TOF values, the time it took the acoustic signal to travel through test wall #2 (16-in. standard-density) and test wall #3 (12-in. high-density) were 150 microseconds (µs) and 120 µs, respectively. The waveforms that were analyzed to obtain these TOF values are shown in Figures 2.14 and 2.15. The abscissa in these figures represents the TOF of the waveform in seconds times 10-4 and the ordinate represents the amplitude of the waveform in volts. To account for electronic and transducer delays, a TOF measurement was also performed by placing the 54-kHz exponential transducers tip-to-tip. A time delay of 30 µs was measured (Figure 2.16) and for calibration purposes 30μs was subtracted from the straight through-transmission TOF measurements. The corrected TOF values for the standard-density and high-density concrete walls were therefore 120 µs and 90 µs, respectively. Acoustic velocity was calculated by dividing the measurement path length by the corrected TOF values. This resulted in acoustic velocities of 0.13 in./µs for both the standard-density and the high-density concrete samples.

2.18
Figure 2.14. Standard-Density Concrete, Straight Through-Transmission Measurement on Test Wall #2,
16-in.-thick Wall, No Pipe in Signal Pathway
Figure 2.15. High-Density Concrete, Straight Through-Transmission Measurement on Test Wall #3,
12-in.-thick Wall, No Pipe in Signal Pathway
Figure 2.16. Calibration Straight Through-Transmission Measurement with Exponential Transducers
Positioned Tip-to-Tip

2.19
A baseline measurement was performed with the receive transducer held in the air to measure the acoustic noise inherent in the receive transducer (Figure 2.17). The features observed in this baseline measurement can also be observed in waveforms in Figures 2.14 and 2.15.
Figure 2.17. Baseline Measurement of Air-Backed Receive Transducer, in Contact with Nothing
Performing a Fast Fourier transform (FFT) of these waveform signals showed that the peak frequency response is in the range of 70–80 kHz. Using the acoustic velocity and measured FFT values, the acoustic wavelengths λ in the concrete samples were calculated by dividing the acoustic velocity by the frequency. The resultant wavelength in the concrete is 1.6–1.9 in.
The ability to transmit acoustic energy across the 12-in.- and 16-in.-thick concrete walls using the straight through-transmission configuration established that further measurements on the concrete wall samples could be made to determine if acoustic TOF measurements could be used to discriminate between concrete containing no pipe inclusions and concrete with pipe inclusions. Because the primary interest is in the inspection of high-density concrete walls, those measurements are the focus of the data presented below.
2.4.2.2 V-Path Pitch-Catch TOF Measurements
To maintain a desired single-sided access measurement configuration (i.e., inspection from one side of a concrete wall), acoustic inspections were performed by placing two transducers side by side (2 in. apart), aligned vertically on the concrete wall samples. The acoustic signals received by the receiving transducer represent an average amplitude and velocity that results from the interaction of the transmitted acoustic pulse with the material under test. The transducers were operated in pitch-catch mode, with one transducer serving as the acoustic energy transmitter and the other as the acoustic energy receiver. This tandem V-path pitch-catch measurement configuration was selected to minimize acoustic energy attenuation effects by the concrete samples and to avoid transducer “ring-down” that is inherent with single-transducer pulse-echo measurement configurations.
Acoustic V-path pitch-catch TOF data were taken on test wall #3 (see Figure 2.4). The measurements were performed at locations along the front and rear sides of the test wall with and without the pipe

2.20
inclusions to determine if this technique can discriminate between the following conditions: 1) no pipe, 2) a 3-in.-diameter pipe at a 6-in. depth, 3) a 3-in.-diameter pipe at a 9-in. depth, and 4) a 3-in.-diameter pipe at a 3-in. depth.
Initial V-path pitch-catch acoustic time-of-flight measurements were performed on a portion of test wall #3 that contained no pipe inclusions (Figure 2.18). This waveform serves as the reference waveform against which other waveforms that represent concrete with pipe inclusions were compared. The time of flight for the initial wave packet is 56 µs and for the second wave packet it is 218 µs. The first wave packet is surface coupling between the transducers. The second wave packet at 218 µs represents the time-of-flight through the high-density concrete in the V-path pitch-catch configuration. The V-path TOF is about twice that for the straight through-transmission configuration because in the V-path configuration the sound energy has to traverse the thickness of the wall twice and at a slight angle. Because of the complexity of the signals, the zero crossing cannot be reliably located, and so the midpoint between the first two major peaks is chosen as a reference point. This is shown as a vertical red dotted line, and the TOF is taken as the distance between the dotted lines.
Figure 2.18. V-Path Pitch-Catch Measurement Made from the Rear Side of Test Wall #3 (high-density
concrete), 12-in.-thick Wall, No Pipe in Signal Pathway
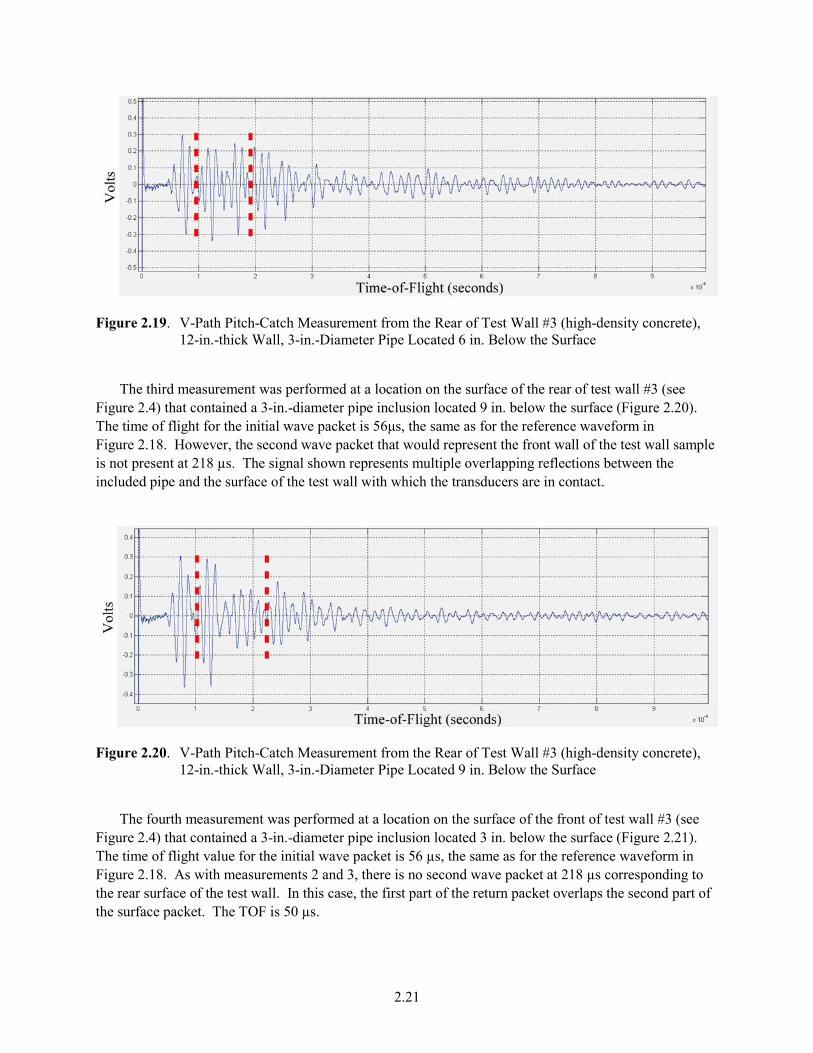
The second measurement was performed at a location on the surface of the rear of test wall #3 (see Figure 2.4) that contained a 3-in.-diameter pipe inclusion located 6 in. below the surface (Figure 2.19). The TOF value for the initial wave packet is 56 µs, the same as for the reference waveform in Figure 2.18. However, because of the presence of the pipe inclusion, the second wave packet that would represent a reflection from the front wall of the test block is not present at 218 µs. The signal shown represents multiple overlapping reflections between the included pipe and the surface of the test wall with which the transducers are in contact.
2.21
Figure 2.19. V-Path Pitch-Catch Measurement from the Rear of Test Wall #3 (high-density concrete),
12-in.-thick Wall, 3-in.-Diameter Pipe Located 6 in. Below the Surface
The third measurement was performed at a location on the surface of the rear of test wall #3 (see Figure 2.4) that contained a 3-in.-diameter pipe inclusion located 9 in. below the surface (Figure 2.20). The time of flight for the initial wave packet is 56μs, the same as for the reference waveform in Figure 2.18. However, the second wave packet that would represent the front wall of the test wall sample is not present at 218 µs. The signal shown represents multiple overlapping reflections between the included pipe and the surface of the test wall with which the transducers are in contact.
Figure 2.20. V-Path Pitch-Catch Measurement from the Rear of Test Wall #3 (high-density concrete),
12-in.-thick Wall, 3-in.-Diameter Pipe Located 9 in. Below the Surface
The fourth measurement was performed at a location on the surface of the front of test wall #3 (see Figure 2.4) that contained a 3-in.-diameter pipe inclusion located 3 in. below the surface (Figure 2.21). The time of flight value for the initial wave packet is 56 µs, the same as for the reference waveform in Figure 2.18. As with measurements 2 and 3, there is no second wave packet at 218 µs corresponding to the rear surface of the test wall. In this case, the first part of the return packet overlaps the second part of the surface packet. The TOF is 50 µs.

2.22
Figure 2.21. V-Path Pitch-Catch Measurement from the Front of Test Wall #3 (high-density concrete),
12-in.-thick Wall, 3-in.-Diameter Pipe Located 3 in. Below the Surface
A summary of the testing results is provided in Figure 2.22.
Figure 2.22. TOF versus Feature Depth for Full Wall and Three Pipes
2.4.3 Conclusions of Acoustic Technique Evaluation
Acoustic time-of-flight data obtained using a single-sided access V-path transducer configuration on the high-density concrete samples demonstrate the feasibility of using acoustic measurements to discriminate between 12-in.-thick high-density concrete walls that contain no pipe inclusions, and those that contain 3-in.-diameter pipes located at various depths from the surface (3-, 6-, and 9-in. depths). The

2.23
absence of the backwall signal in the waveforms representing the pipes is an indication of beam re-direction due to the presence of the pipe inclusions.
The transducers used for this scoping study were selected based upon availability and past success in the measurement of TOF in coarse sandstone material. Improvements to the acoustic measurement system for concrete inspection could be obtained with the procurement of transducers that are specified for this particular application and a transducer fixture that enables consistent transducer positioning and coupling.
2.5 Conclusions of Concrete Studies
Radar imaging techniques were able to detect and resolve inclusions such as pipes and air voids embedded in standard-density concrete, but not in high-density concrete.
PNNL’s Holographic Radar Imaging System was able to both detect and resolve inclusions embedded in the standard-density concrete test walls (#1 and #2). The combination of custom circularly polarized antennas designed to match the concrete impedance and advanced holographic imaging algorithms made it possible to achieve excellent results. The locations of small-diameter (1.5-in.) and large-diameter (3-in.) pipes were successfully determined for depths up to 8 in. and 12 in., respectively. The presence of air voids was also detected for depths up to 10 in. Pipe structures were visible when imaging through a rebar grid for depths up to 8 in. Individual pipes were resolved at a 3-in. center-to-center spacing with only 1.5 in. of concrete between them. Due to the conductive nature of the aggregate materials used in the high-density concrete of test wall #3, radar signals were highly attenuated and therefore the holographic radar imaging technique provided no images of embedded objects. It is concluded that radar signals cannot be used to image objects embedded in high-density concrete containing conductive aggregate materials.
The imaging results of the GSSI system showed that objects located 4 in. below the surface of standard-density concrete are readily detected, while deeper objects are not as clearly identifiable. Objects embedded in high-density concrete would not be detectable.
Acoustic transmit/receive transducer time-of-flight tests were performed on the high-density concrete test wall #3 using a single-sided access V-path pitch-catch transducer configuration. The results demonstrate that it is feasible to use acoustic measurements in this fashion to discriminate between portions of a 12-in.-thick high-density concrete wall without pipe inclusions, and portions that contain 3-in.-diameter pipes located at various depths (3, 6, and 9 in.) from the surface.


3.1
3.0 Ground-Penetrating Radar Imaging Studies
3.1 Ground-Penetrating Radar Imaging – Objectives
The objectives of the ground-penetrating radar (GPR) imaging studies were twofold: 1) assess the ability of PNNL’s holographic radar imaging array system, GSSI’s UtilityScan radar imaging system, and Sensor & Software’s Noggin 100 radar imaging system to detect and locate objects of interest made of various materials buried at multiple depths in low-moisture-content soil; and 2) assess PNNL’s system performance dependence on the distance between the antenna array and the ground or concrete surface.
3.2 Ground-Penetrating Radar Imaging – Systems Tested
3.2.1 GSSI UtilityScan System
GSSI’s portable UtilityScan system is shown in Figure 3.1. The technical highlights of the system are summarized below. This system collects data while it is pushed along a set of user-defined scan lines located directly over the region to be imaged such as the blue lines shown Figure 3.2. In this case, individual scans are made along the X direction and are repeated 21 times with start points at the black dots along the Y direction. Scan lines in the Y direction can also be collected and combined by GSSI’s application software with those collected in the X direction, but this added step was not taken in these tests.
• Frequency: 200–800 MHz (impulse)
• Antenna:
– 400-MHz module
– Linearly polarized bowtie
– co-polarized
• Nominal imaging depth: 0–4 m (0–12 feet)
• Images are obtained by processing data after collection on a personal computer using GSSI’s RADAN software application.
3.2.2 Sensors & Software Inc.’s Noggin 100 System
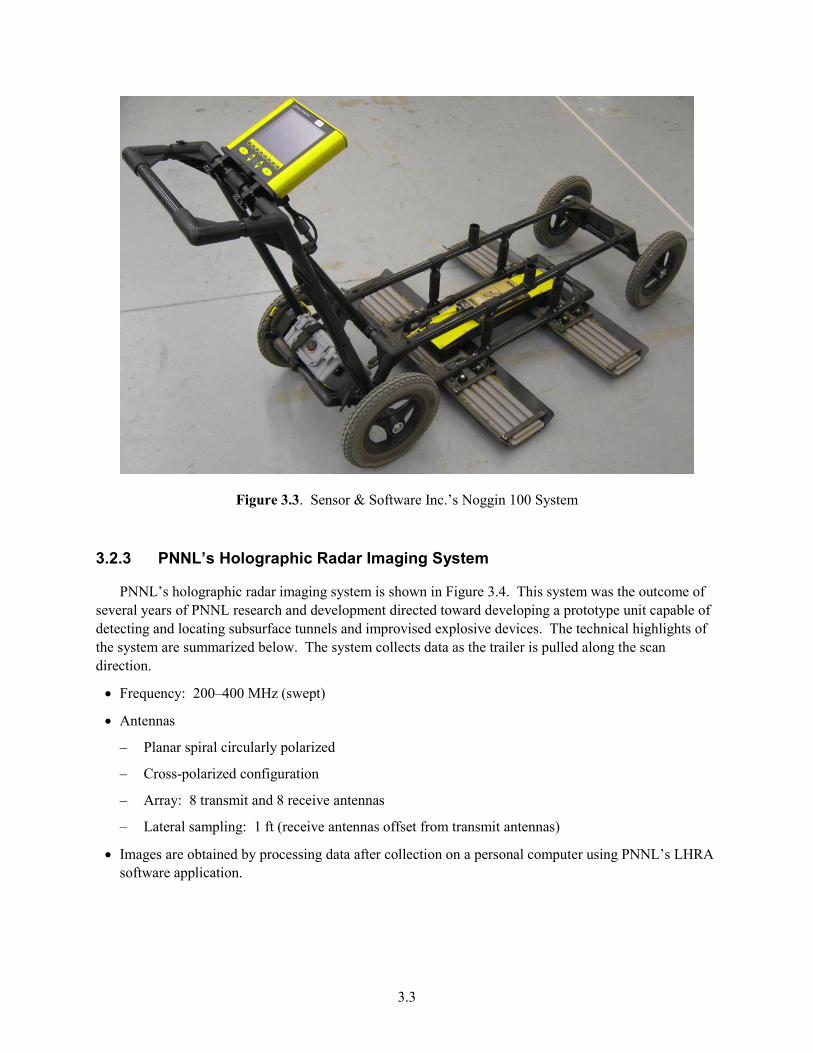
Sensors & Software Inc.’s Noggin 100 system is shown in Figure 3.3 and the technical highlights are summarized below. Data collection is the same as explained above for the GSSI system.
• Frequency: 100 MHz (impulse)
• Antenna: dipole
• Nominal imaging depth: about 0–6 m (calculated for soil with 5% moisture content)
• Images are obtained by processing data after collection on a personal computer using Sensors and Software Inc.’s EKKO software application.

3.2
Figure 3.1. GSSI UtilityScan
Figure 3.2. Scan Layout
3.3
Figure 3.3. Sensor & Software Inc.’s Noggin 100 System
3.2.3 PNNL’s Holographic Radar Imaging System
PNNL’s holographic radar imaging system is shown in Figure 3.4. This system was the outcome of several years of PNNL research and development directed toward developing a prototype unit capable of detecting and locating subsurface tunnels and improvised explosive devices. The technical highlights of the system are summarized below. The system collects data as the trailer is pulled along the scan direction.
• Frequency: 200–400 MHz (swept)
• Antennas
– Planar spiral circularly polarized
– Cross-polarized configuration
– Array: 8 transmit and 8 receive antennas
– Lateral sampling: 1 ft (receive antennas offset from transmit antennas)
• Images are obtained by processing data after collection on a personal computer using PNNL’s LHRA software application.

3.4
Figure 3.4. PNNL’s Prototype Holographic Radar Imaging System
3.3 Ground-Penetrating Radar Imaging – Buried Targets Test Site Development
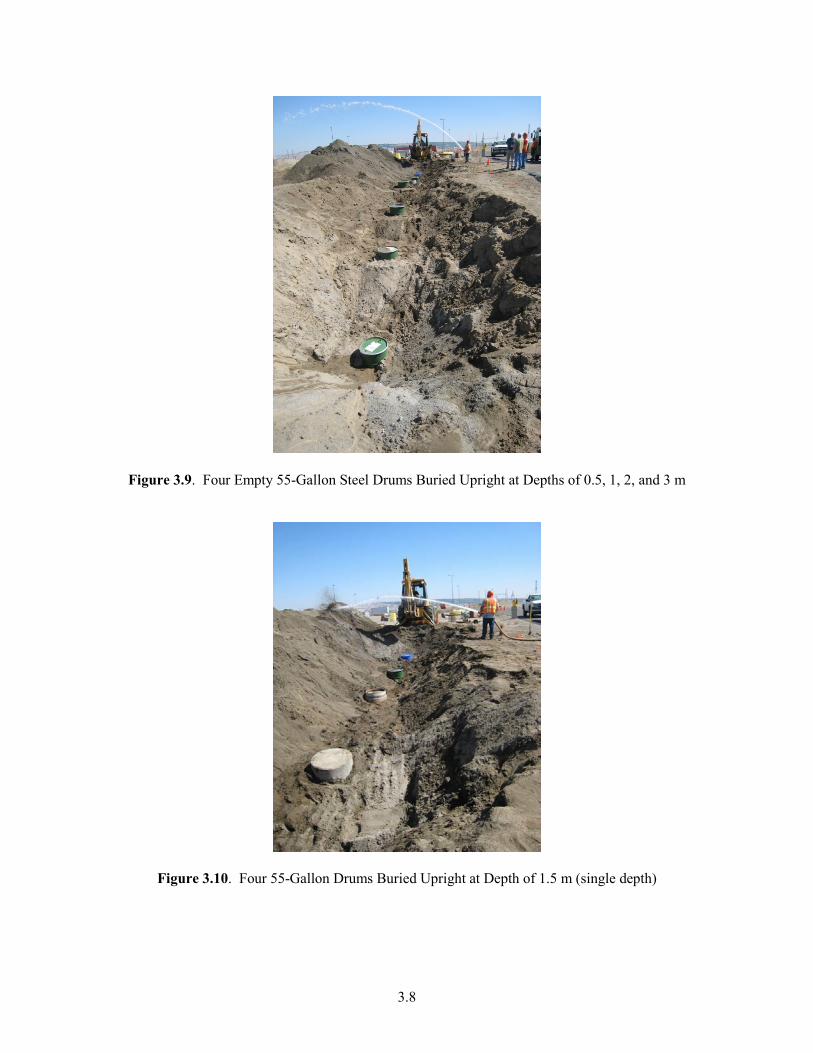
PNNL worked with the client to design the buried target test site plan shown in Figure 3.5 and Table 3.1. Subsequently, the test site was developed at Volpentest HAMMER Training and Education center on the Hanford Site at the location shown in Figure 3.6. Figures 3.7–3.11 provide detailed images of the test site construction. Figure 3.12 shows two additional targets buried at a 0.5-m depth later during testing (five-gallon plastic containers, target #8 filled with water, and target #9 filled with canola oil). Canola oil was selected because its dielectric constant is nearly the same as that for diesel fuel (approximately 3) over the temperature and frequency range of testing.

3.5
Figure 3.5. Design Plan for Buried Targets Test Site
Table 3.1. Dimensions for Buried Targets
Target Description Target Depth (m) Figure #1 Metal plate 1.2 m × 9.8 m (4 ft × 32 ft) 1.2 3.7 #2 Polyvinyl chloride (PVC) pipe 0.6 m OD ×
12.2 m (2 ft dia. × 40 ft) 1.5 3.8
#3 Metal barrels 55 gallon (0.6 m/2 ft dia.) 0.5, 1.0, 2.0, 3.0 3.9 #4 Concrete barrel 55 gallon (0.6 m/2 ft dia.) 1.5 3.10, 3.11 #5 Wood barrel (empty) 1.5 3.10, 3.11 #6 Metal barrel 1.5 3.10, 3.11 #7 PVC barrel (foam filled to prevent crushing) 1.5 3.10, 3.11 #8 PVC 5 gallon container (water-filled) 0.5 3.12 #9 PVC 5 gallon container (canola oil-filled) 0.5 3.12

3.6
Figure 3.6. Location of Buried Targets Test Site in Richland, Washington

3.7
Figure 3.7. 4-ft × 32-ft Plate Buried 4-ft Deep (4 metal grates, 4 ft × 8 ft each placed end to end)
Figure 3.8. Empty 2-ft-Diameter × 40-ft PVC Pipe Buried 1.5 m with Ends Closed Off
3.8
Figure 3.9. Four Empty 55-Gallon Steel Drums Buried Upright at Depths of 0.5, 1, 2, and 3 m
Figure 3.10. Four 55-Gallon Drums Buried Upright at Depth of 1.5 m (single depth)

3.9
Figure 3.11. 55-Gallon Drums (left to right: PVC, wood, metal, concrete)
Figure 3.12. 5-Gallon Containers, Target #8 Filled with Water and Target #9 Filled with Canola Oil,
Buried 0.5-m Deep
3.4 Ground-Penetrating Radar Imaging – Results
As is explained in detail below, higher levels of soil moisture content are known to interfere with the quality of imaging results. Therefore, the ideal time of year to conduct imaging studies in Richland, Washington (the location of the test bed), is at the end of the summer after several months of minimal rainfall. Due to delays in obtaining permission to access the HAMMER test site to conduct testing, the earliest opportunity to conduct the first round of image testing was in March 2010. Round 1 of testing was conducted on test bed targets using PNNL’s holographic imaging array system. Based on the lessons learned from this imaging, modifications were made to PNNL’s antenna array and the imaging approach was changed. Round 2 of testing was conducted with this modified system. GSSI’s system was used for

3.10
Round 3 of testing. Rounds 2 and 3 of testing were conducted in May and June 2011. Round 4 was conducted with Sensor & Software Inc.’s Noggin 100 system during October and November of 2011. Before presenting the results for these four rounds of testing, it is instructive to provide an overview of how soil moisture content impacts ground-penetrating radar signals.
3.4.1 Soil Moisture Content Testing
The achievable working distance or penetration depth of a ground-penetrating radar system is a strong function of the soil moisture content. Soils with higher moisture content can severely attenuate the electromagnetic energy as the signal propagates through the earth to the target and back up to the radar system antenna. The soil moisture content of the test bed was measured each time tests were performed. Prior to presenting the measured data, it is instructive to provide some context for the moisture content of soils that are representative of the kinds of sands expected to be encountered during IAEA inspections at declared facilities. Publications on the measured volumetric moisture content of desert sands list values between 0.3% and 7% (Williams and Greeley 2004). The moisture content of Saudi Arabian sand is listed as 0.3% and the moisture content of Sahara sand is listed at less than 1%. The moisture content of Mojave Desert sand ranged from 0.3–5% while Nevada desert sand moisture content ranged from 4–7%. Both the relative permittivity and dielectric loss tangent increase with moisture content.
One method for approximating the working distance is to calculate the skin depth in the soil, which includes the attenuation loss due to the moisture content. The skin depth is defined as the depth at which the signal has been attenuated to 37% of its initial value at the surface. The dielectric properties of sandy soil from Yuma Proving Ground in Arizona have been published for moisture contents of 0%, 5%, 10%, and 20% (Vitebskiy et al. 1997). Figure 3.13 shows the skin depths for the 0% and 5% cases. It can be seen that the skin depth at 100 MHz varies from 2–15 m over this range of moisture content while the skin depth at 200 MHz varies from 1.5–8 m.
Figure 3.13. Calculated Skin Depths for Sandy Soils from Yuma, Arizona, with 0% and 5% Volumetric
Moisture Content

3.11
Manufacturers of ground-penetrating radar equipment list estimated penetration depths as a guide to selecting appropriate antennas. GSSI, a major provider of GPR systems in the United States, lists penetration depths of 2–15 m for 100-MHz systems and 0–9 m for 200-MHz systems. These values are in agreement with the 0%–5% soil moisture content skin depths shown above. Users of GSSI GPR systems that have published their results provide another method to estimate working distances at various frequencies. It has been reported that a 200-MHz GSSI system was able to penetrate through 15 m of dry North Carolina sand dunes (Doolittle et al. 2006) and 4 m of dry farm soil in Tennessee (Yoder et al. 2001). A 120-MHz GSSI system was reportedly able to penetrate a maximum depth of 4 m in loamy North Carolina sand (Szuch et al. 2006).
There was record rainfall in Richland, Washington, during March 2010 and, as a result, moisture content for the first round of testing was high. A 564.5-ounce soil sample was taken from a depth of 40 cm below the surface and dried for several weeks in an oven. The sample weight was monitored until weight loss due to evaporation became negligible. The moisture content calculated was 5.3%. Similar measurements were made for rounds 2 and 3 of testing in July 2011 at a depth of 100 cm with a resulting moisture content of 5.8%. Measurements for Round 4 of testing made in October and November of 2011 at a depth of 100 cm yielded a moisture content of 4.5%. Given the published information listed above, it is concluded that the moisture content for all three rounds of testing in Richland, Washington, represent severe attenuation conditions for desert sands. The consequences of this high moisture content are: 1) higher signal attenuation, which makes it difficult to detect targets below approximately 2 m; and 2) increased signal scattering and reflections, which lead to poorer image quality. It is expected that dry sand conditions will significantly improve the working distance of the radar system.
3.4.2 Testing Round 1 – Suspended Design for PNNL’s Imaging Antenna Array
Round 1 of testing was performed with the first iteration of PNNL’s holographic radar imaging array system where the antenna array is suspended above the ground. Round 1 of testing made it possible to assess: 1) the ability of PNNL’s holographic radar imaging array system to detect and locate the targets shown in Figure 3.5 and 2) how the imaging results are impacted by changes to the distance between the ground and the imaging array. Understanding the second of these two system capabilities would help to confirm if it is feasible to fly an array above the ground to facilitate imaging and thereby avoid having to clear away ground clutter items, which interfere with having the array in constant contact with the ground. Note that the five-gallon containers filled with water and canola oil were added to the test bed in Round 2, and were not imaged in Round 1. Five tests designed to detect and locate the buried targets were conducted as follows.
3.4.2.1 Test #1, Imaging Metal Plate Through 1.2-m Sand
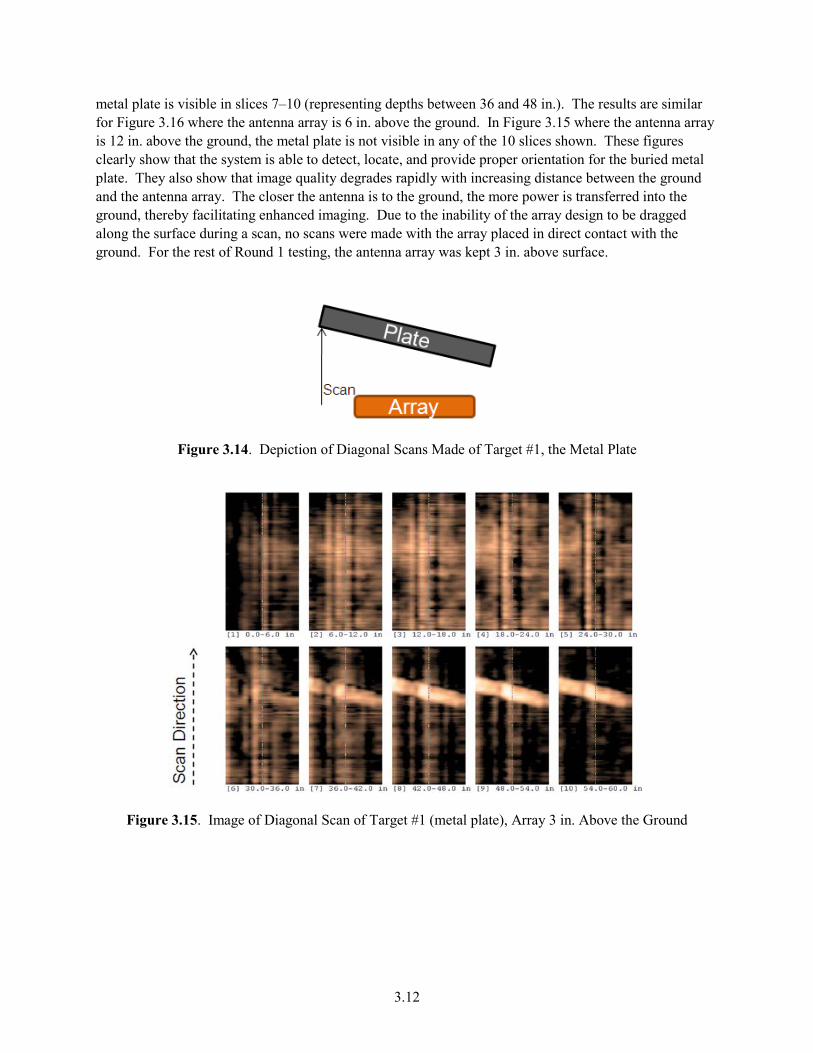
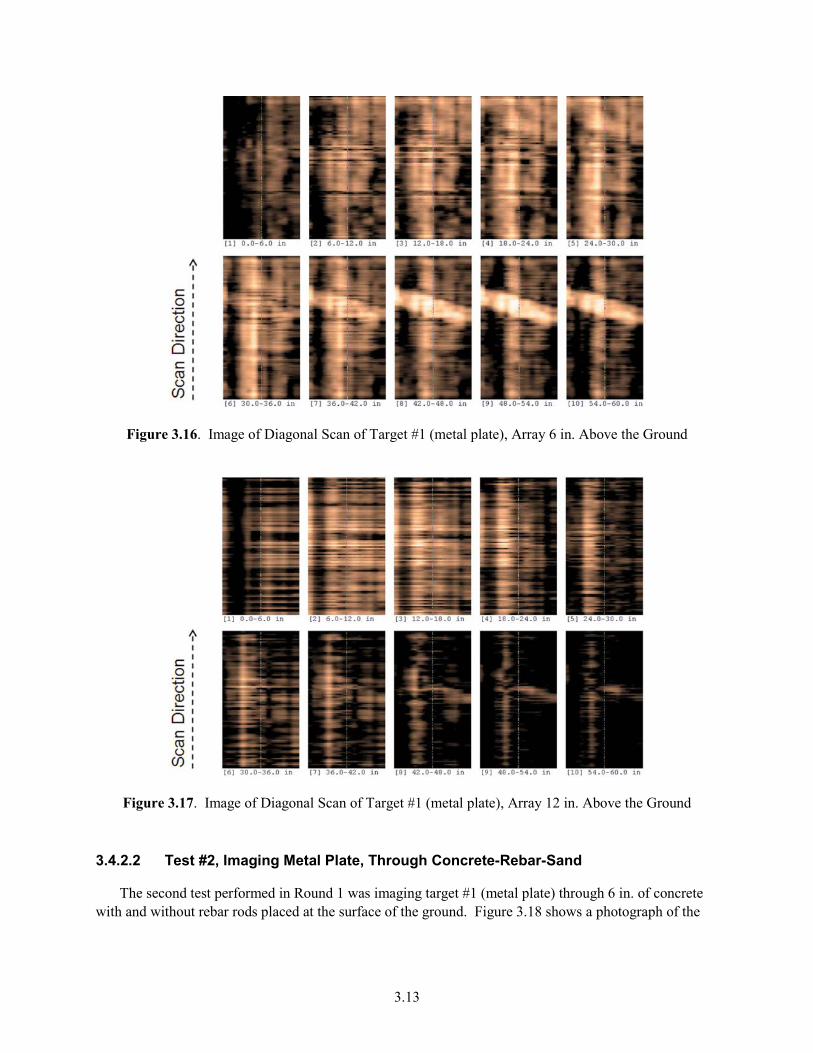
The first test in Round 1 was to image target #1, the 4-ft by 32-ft metal plate. The antenna array was passed diagonally over the metal plate as shown in Figure 3.14. Three passes were made to collect data with the array set at three heights above the ground: 3, 6, and 12 in. The imaging results are shown in Figures 3.15–3.17. In Figures 3.15–3.17, each of the ten numbered slices represents all the imaging information available in a 6-in.-deep volume (i.e., slice [1] 0–6 in.) processed through the LHRA algorithms. The surface of the sand is at 0 in. The depth range for each slice is given at the bottom of the image for that slice. In Figure 3.15 where the antenna array is 3 in. above the ground, the 48-in.-deep
3.12
metal plate is visible in slices 7–10 (representing depths between 36 and 48 in.). The results are similar for Figure 3.16 where the antenna array is 6 in. above the ground. In Figure 3.15 where the antenna array is 12 in. above the ground, the metal plate is not visible in any of the 10 slices shown. These figures clearly show that the system is able to detect, locate, and provide proper orientation for the buried metal plate. They also show that image quality degrades rapidly with increasing distance between the ground and the antenna array. The closer the antenna is to the ground, the more power is transferred into the ground, thereby facilitating enhanced imaging. Due to the inability of the array design to be dragged along the surface during a scan, no scans were made with the array placed in direct contact with the ground. For the rest of Round 1 testing, the antenna array was kept 3 in. above surface.
Figure 3.14. Depiction of Diagonal Scans Made of Target #1, the Metal Plate
Figure 3.15. Image of Diagonal Scan of Target #1 (metal plate), Array 3 in. Above the Ground
3.13
Figure 3.16. Image of Diagonal Scan of Target #1 (metal plate), Array 6 in. Above the Ground
Figure 3.17. Image of Diagonal Scan of Target #1 (metal plate), Array 12 in. Above the Ground
3.4.2.2 Test #2, Imaging Metal Plate, Through Concrete-Rebar-Sand
The second test performed in Round 1 was imaging target #1 (metal plate) through 6 in. of concrete with and without rebar rods placed at the surface of the ground. Figure 3.18 shows a photograph of the

3.14
½-in.-diameter rebar 16-in. square grid placed underneath the concrete. Figure 3.19 shows the antenna array suspended 3 in. above the concrete blocks. Figures 3.20 and 3.21 show the imaging results without rebar and with rebar, respectively. Each of the 10 numbered slices shown in these figures represents all the imaging information available in a 7.2-in.-deep volume (i.e., slice [1] 0–7.2 in.) processed through the LHRA algorithms. The surface of the concrete is at 0 in. The depth range for each slice is given at the bottom of the image for that slice.
Figure 3.18. Photograph of 16-in. × 16-in. Grid Made of ½-in.-Diameter Rebar
Figure 3.19. PNNL’s Holographic Radar Imaging Antenna Array Suspended 3 in. Above 6-in.-Thick
Concrete Blocks

3.15
Figure 3.20. Imaging Target #1 (metal plate) Through 6 in. of Concrete
Figure 3.21. Imaging Target #1 (metal plate) Through a 16-in. × 16-in. Grid of ½-in.-Diameter Rebar
and 6 in. of Concrete
In Figure 3.20, the metal plate can be clearly seen in slices 7–9 and the depth of these slices corresponds to the 48-in. depth of the metal plate, within the depth resolution the system is able to provide: approximately 33 cm [13 in.] in soil having a dielectric constant of 5, for this 200-MHz bandwidth system. In Figure 3.21 the metal plate is visible in slices 7–8, but due to the rebar interference, it is not as clear as Figure 3.20. These two slices show that even through concrete and rebar, the system is able to detect and locate the buried metal plate to a depth in the range of 43–57 in.

3.16
3.4.2.3 Test #3, Imaging Four 55-Gallon Metal Barrels (0.5-m, 1-m, 2-m, and 3-m Deep) Through Sand
The third test conducted in Round 1 was on target #3, the four 55-gallon metal barrels buried at depths of 0.5 m, 1 m, 2 m, and 3 m. The antenna array was 3 in. above the surface of the sand and the direction of scanning was as shown in Figure 3.22. The images obtained are shown in Figure 3.23.
Figure 3.22. Scan Configuration for Target #3 Buried Metal Barrels
Figure 3.23. Scan Results for Target #3 Buried Metal Barrels

3.17
In Figure 3.23, each of the ten numbered slices shown represents all the imaging information available in a 12-in.-deep volume (i.e., slice [1] 0–12 in.) processed through the LHRA algorithms. The surface of the antenna is at 0 in. The depth range for each slice is given at the bottom of the image for that slice. As shown by slices 2–5, the barrels buried at 0.5-m and 1-m depths were successfully detected and located. The 0.5-m-deep barrel first becomes visible in slice 2 (12–24-in. range) and the 1-m barrel first becomes visible in slice 4 (36–48 in.) as one would expect. The barrels buried 2-m and 3-m deep were not detected.
3.4.2.4 Test #4 – Imaging Four 55-Gallon Barrels (Plastic, Steel, Wood, Concrete) Through 1.5-m Sand
The fourth test conducted in Round 1 was on targets #4–#7 buried 1.5 m below the surface. The antenna array was 3 in. above the surface of the sand and the direction of scanning is as shown in Figure 3.24. The images obtained are shown in Figure 3.25.
Figure 3.24. Scan Configuration for Targets #4–#7 Buried 55-Gallon Barrels
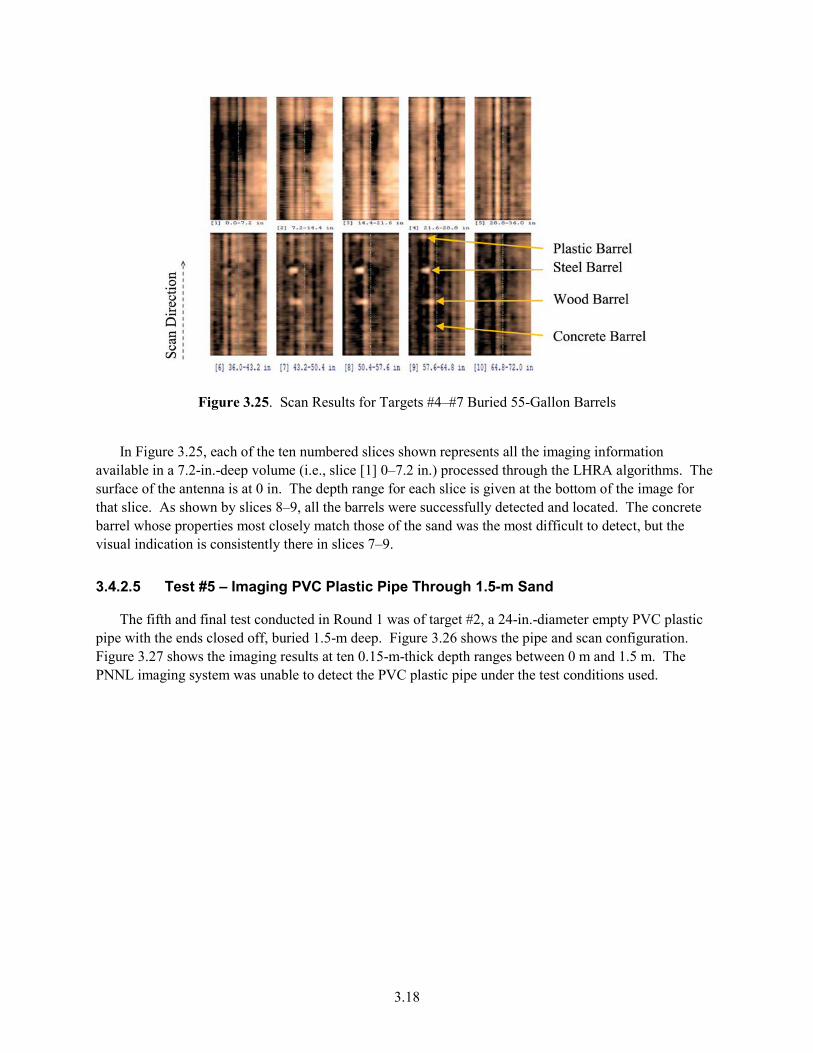
3.18
Figure 3.25. Scan Results for Targets #4–#7 Buried 55-Gallon Barrels
In Figure 3.25, each of the ten numbered slices shown represents all the imaging information available in a 7.2-in.-deep volume (i.e., slice [1] 0–7.2 in.) processed through the LHRA algorithms. The surface of the antenna is at 0 in. The depth range for each slice is given at the bottom of the image for that slice. As shown by slices 8–9, all the barrels were successfully detected and located. The concrete barrel whose properties most closely match those of the sand was the most difficult to detect, but the visual indication is consistently there in slices 7–9.
3.4.2.5 Test #5 – Imaging PVC Plastic Pipe Through 1.5-m Sand
The fifth and final test conducted in Round 1 was of target #2, a 24-in.-diameter empty PVC plastic pipe with the ends closed off, buried 1.5-m deep. Figure 3.26 shows the pipe and scan configuration. Figure 3.27 shows the imaging results at ten 0.15-m-thick depth ranges between 0 m and 1.5 m. The PNNL imaging system was unable to detect the PVC plastic pipe under the test conditions used.

3.19
Figure 3.26. Scan Configuration for Target #2 (PVC plastic pipe) Buried at a Depth of 1.5 m
Figure 3.27. Scan Results for Target #2 (PVC plastic pipe) Buried at a Depth of 1.5 m
3.4.2.6 Summary of Round 1 Tests #1–#5
The results of Test #1 show that the closer the antenna array is to the ground, the better the system is able to detect the 4-ft-deep buried metal plate. With the array 3 in. and 6 in. above the ground, the metal plate could be detected, but not at 12 in. As the antenna array nears the ground, more power is transferred into the ground and fewer reflections occur between the antenna and the surface of the ground. Both of these factors result in enhanced images and better detection. It is concluded from test #1 that it is not feasible to fly the current configuration of the antenna array above terrain to detect buried targets; conversely, the best detection and location of buried targets would occur if the antenna array were designed so that it could remain in direct contact with the surface during imaging.

3.20
The results of Test #2 showed that the metal plate could be detected and located when imaging through 6-in.-thick concrete with and without a 16-in. × 16-in. grid of ½-in.-diameter rebar placed beneath the concrete.
The results of Test #3 showed that the system was able to detect, locate, and determine the depths of the metal barrels buried at 0.5-m and 1-m depths, but not those buried at 2 m and 3 m. More power transmitted into the ground and fewer ground reflections by imaging with the antenna array on the ground would likely enhance the system’s ability to detect and locate the 2-m and 3-m deep barrels.
The results of Test #4 showed that the system was able to detect, locate, and determine the depths of the 1.5-m deep buried 55-gallon barrels made of wood, plastic, metal, and concrete. The concrete barrel was the most difficult to detect because its electromagnetic properties are similar to the surrounding sand.
The results of Test #5 showed that the system was not able to detect 1.5-m-deep buried PVC plastic pipe. The cause for this is thought to be that the pipe is air-filled and this minimizes the amount of reflected signal reaching the antenna array. If the PVC pipe were filled with water or another fluid, it would likely be more readily detected and located. Tests were conducted in Round 2 with targets #8 and #9 to confirm this.
The major takeaway for Round 1 came from the results of Test #1 and Test #3, where it was concluded that enhancements in the detection and location of buried targets could be made possible by imaging with the antenna on the ground. This gave rise to a design modification of the PNNL holographic antenna array and further confirmation testing conducted in Round 2.
3.4.3 Testing Round 2 – Sled Design for PNNL’s Imaging Antenna Array
The ground-penetrating radar antenna array was modified into the sled design shown in Figure 3.28. This design makes it possible to perform measurements with the array in direct contact with the ground or suspended above it. Data taken during Round 2 testing showed that when imaging the metal plate through 6 in. of concrete, the reflected signal strength increased by 9 dB when the antenna array was placed directly on the concrete as compared to 3 in. above it. This significant increase in sensitivity made it possible to detect the metal barrels buried at 2- and 3-m depths. Another benefit of the sled design is that for measurements made while the array is in contact with the ground, it eliminates horizontal “banding” (a result of dynamic elevation changes of the antenna array) that was seen in some images obtained during Round 1 testing. The enhancements were made with the objective of improving image quality, and detection and location of buried targets. The same five tests conducted in Round 1 with the antenna array raised 3 in. above the surface were conducted in Round 2 with the antenna directly on the surface. Additionally, the 5-gallon plastic containers filled with water and canola oil (targets #8 and #9, Figure 3.12) were scanned.

3.21
Figure 3.28. Ground-Penetrating Radar Antenna Array Modified with Sled-Style Skid Plate
Figure 3.29 consolidates the highlights of imaging results for Round 2. The results of imaging the metal plate in Round 2 with the antenna array on the ground (or on the concrete) and following the same processes as were used for Test #1 and Test #2 during Round 1, were nearly the same as for Round 1 (imaging through both concrete and rebar is not shown). Figure 3.29(c) shows that the metal plate was clearly detected. Similarly, imaging the PVC plastic pipe with the antenna array on the ground as was done in Test #5 for Round 1 yielded the same result as Round 1, the target could not be detected (not shown in Figure 3.29). The results of imaging the metal, plastic, wood, and concrete 55-gallon barrels as was done in Test #4 for Round 1 are shown in Figure 3.29(b). All barrels were detected except the concrete one. A contributing factor to this arises from the fact that during the 15 months between testing rounds 1 and 2, the moisture content of the cement barrel has likely come into equilibrium with the surrounding soil. This factor combined with the similarity between sand and concrete from an electromagnetic standpoint makes detection very difficult. Finally, four metal barrels were imaged in Round 2 in the same fashion as was done in Test #3 of Round 1, but with the antenna array on the ground for Round 2. Figure 3.29(a) shows that all four metal barrels were detected and located. Recall that in Round 1, the 2-m and 3-m deep metal barrels could not be detected.

3.22
Figure 3.29. Imaging Results for Ground-Penetrating Radar Array Modified with Sled-Style Skid Plate
with Antenna on the Sand: (a) metal barrels; (b) concrete, wood, steel, plastic barrels buried 1.5-m deep; (c) 4-ft × 32-ft metal plate buried 4-ft deep

3.23
3.4.3.1 Test #6 – 5-Gallon Plastic Containers, Filled With Water and Canola Oil
The imaging results for the 5-gallon plastic containers filled with water and canola oil and buried 0.5-m deep as shown in Figure 3.30 are presented in Figure 3.31. Both containers can be seen in the picture for slice 2 (depth range 11.2 in.–22.5 in.) as is appropriate for their burial depth of 0.5 m.
Figure 3.30. Scanning Configuration for 5-Gallon Plastic Containers Buried 0.5-m Deep, Filled with
Water and Canola Oil

3.24
Figure 3.31. Imaging Results for 5-Gallon Plastic Containers Buried 0.5-m Deep, Filled with Water and
Canola Oil
3.4.3.2 Summary of Round 2 Tests #1–#6
The results of Round 2 tests #1–#6 showed that PNNL’s holographic imaging ground-penetrating radar system was able to detect and correctly locate (position and depth) all the targets in the test bed except the concrete barrel and the PVC plastic pipe. Recall that the concrete barrel was detected in Round 1. It is thought that the concrete barrel was not detected in Round 2 because during the 15 months between Round 1 and 2, its moisture content increased to match the surrounding soil. This combined with the fact that the concrete’s material constituency is not so different from the surrounding soil makes the concrete barrel essentially electromagnetically indistinguishable from the soil. The change of the antenna array design from Round 1 testing with the antenna raised 3 in. above the ground to that with a skid-plate design for Round 2 testing with the antenna on the ground made it possible to detect the deep buried metal barrels at 2 m and 3 m. Recall that these two barrels were the only two targets not detected in Round 1 testing.
In Test #6, it was shown that PNNL’s imaging system is capable of detecting and locating 5-gallon containers filled with canola oil and water, buried 0.5-m below the surface. Recall that this test was performed to provide some confirmation of the theory postulated as to why Round 1 and Round 2 testing were unable to detect the PVC plastic pipe. It is known that an air-filled pipe will reflect less than one filled with a fluid such as water. Test #6 provides sufficient indication that this is indeed the case.

3.25
3.4.4 Testing Round 3 – GSSI System
The GSSI system shown previously in Figure 3.1 with the 400-MHz antenna was used to conduct tests #1, #3, #4, and #5 on the buried metal plate, metal barrels, 1.5-m-deep barrels (concrete, wood, metal, plastic), and PVC plastic pipe.
3.4.4.1 Test #1 – Imaging Metal Plate Through 1.2-m Sand
The results of imaging the metal plate through 4 ft of sand are shown in Figure 3.32. The image in the upper left corner is a representation of the 12 data collection scans taken along 40 ft in the X-direction at increments of 1 foot in the Y-direction. Each of the five slices shown represents all the imaging information available in the depth range shown for Z0-Z1 as processed through GSSI’s RADAN software. The lower left and upper right corner slices clearly show detection of the metal plate. Based on these images, one can estimate the length and width of the plate to be approximately 4 ft by 32 ft. GSSI’s system was able to detect, locate, and size the metal plate through 4 ft of sand.
Figure 3.32. Imaging Results for 4-ft × 32-ft Metal Plate Buried at a Depth of 4 ft (1.2 m)
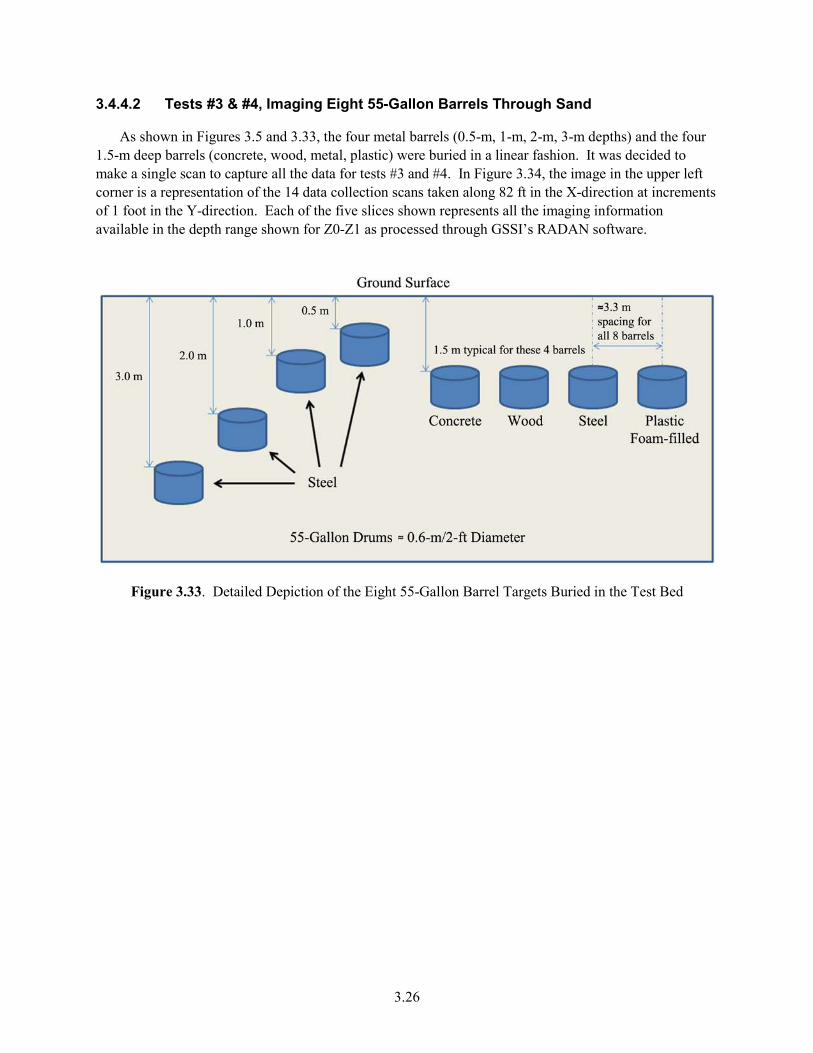
3.26
3.4.4.2 Tests #3 & #4, Imaging Eight 55-Gallon Barrels Through Sand
As shown in Figures 3.5 and 3.33, the four metal barrels (0.5-m, 1-m, 2-m, 3-m depths) and the four 1.5-m deep barrels (concrete, wood, metal, plastic) were buried in a linear fashion. It was decided to make a single scan to capture all the data for tests #3 and #4. In Figure 3.34, the image in the upper left corner is a representation of the 14 data collection scans taken along 82 ft in the X-direction at increments of 1 foot in the Y-direction. Each of the five slices shown represents all the imaging information available in the depth range shown for Z0-Z1 as processed through GSSI’s RADAN software.
Figure 3.33. Detailed Depiction of the Eight 55-Gallon Barrel Targets Buried in the Test Bed

3.27
Figure 3.34. Imaging Results for Eight Barrels: Four Metal (buried 0.5-m, 1-m, 2-m, and 3-m deep) and
Four Others (concrete, wood, metal, plastic) Buried 1.5-m Deep
Figure 3.35. Further Image Processing Reveals 3-m-Deep Metal Barrel

3.28
Test #3, Imaging Four 55-Gallon Metal Barrels (0.5-m, 1-m, 2-m, 3-m Deep) Through Sand
Slices 1–2 of Figure 3.34 show that the 0.5-m and 1-m-deep metal barrels were detected and located. Slice 5 shows that the 2-m-deep metal barrel was detected too, albeit a weak detection. Figure 3.35 shows that additional processing with RADAN software made it possible to detect and locate the 3-m-deep metal barrel. The signal response from the GSSI system correlates well with the data presented previously for the PNNL GPR array, confirming the location of the 3-m deep barrel. The GSSI system was able to detect and locate all four of the metal barrel targets.
Test #4 – Imaging Four 55-Gallon Barrels (Plastic, Steel, Wood, Concrete) Through 1.5-m Sand
Slice 3 in Figure 3.34 shows a blue circle where a concrete barrel should be located, but was not detected. The concrete barrel was not detected because from an electromagnetic standpoint, its moisture content and material constituency are not different enough from the surrounding soil. Further to the right of slice 3, the wood and metal barrels were detected and located. To the right-most side of slice 3, inside the blue circle, there should have been an indication of the plastic barrel. Notice the white uneven vertical line shown passing through the center of this circle (and through the right side of all five slices). This was caused by a metal tape measure which was left on the ground for later reference in images. It was inadvertently placed in the wrong location and obscured the image of the plastic barrel. Unfortunately, the error was discovered during post-test data processing and no further opportunity to retake the data came about. The GSSI system was able to detect the metal and wood barrels, and it is thought that it would also have detected the plastic barrel were it not for the metal tape obscuration issue.
3.4.4.3 Test #5, Imaging PVC Plastic Pipe Through 1.5-m Sand
Figure 3.36 shows the scan grid used to acquire imaging data and the test results for the PVC plastic pipe. The image on the left is a representation of the 20 data collection scans taken along 20 ft in the X-direction at increments of 1 ft in the Y-direction. The image on the right shows a 3D perspective view of the results of processing the scan data with the RADAN software. The slice shown shows the correct detection, depth, and location of a portion of the 40-ft-long PVC plastic pipe.

3.29
Figure 3.36. PVC Plastic Pipe Scan Configuration and Results
3.4.4.4 Summary of Round 3 Tests #1, #3, #4, and #5
The results of Round 3 tests showed that with the 400-MHz antenna, GSSI’s ground-penetrating radar system was able to detect and correctly locate (position and depth) all the targets imaged except the concrete and plastic barrels. The concrete barrel was not detected because from an electromagnetic standpoint, its moisture content and material constituency are not different enough from the surrounding soil. Had it not been for the inadvertent placement of a metal tape on the surface of the ground directly over the location of the plastic barrel, the GSSI system would likely have detected and located this barrel as well.
3.4.5 Testing Round 4 – Noggin 100 System
The Sensor & Software Inc.’s Noggin 100 system shown previously in Figure 3.3 was used to conduct tests #1, #3, #4, and #5 on the buried metal plate, metal barrels, 1.5-m-deep barrels (concrete, wood, metal, plastic), and PVC plastic pipe.
3.4.5.1 Test #1, Imaging Metal Plate Through 1.2-m Sand
The results of imaging the metal plate through 4 ft. (1.2m) of sand are shown in Figures 3.37 and 3.38. Figure 3.37 is a representation of 26 data collection scans taken along the X-direction (0 to 7.8 m) spaced 25 cm in the Y-direction (0 to 6.5 m). The scan was taken over one end of the 32-ft-long plate and shows the correct location and width (1.2 m). The depth used to construct Figure 3.37 was 1.2 m as this was the plate depth determined by the waterfall plot shown in Figure 3.38. The Noggin 100 system was able to detect, locate, and size the metal plate.
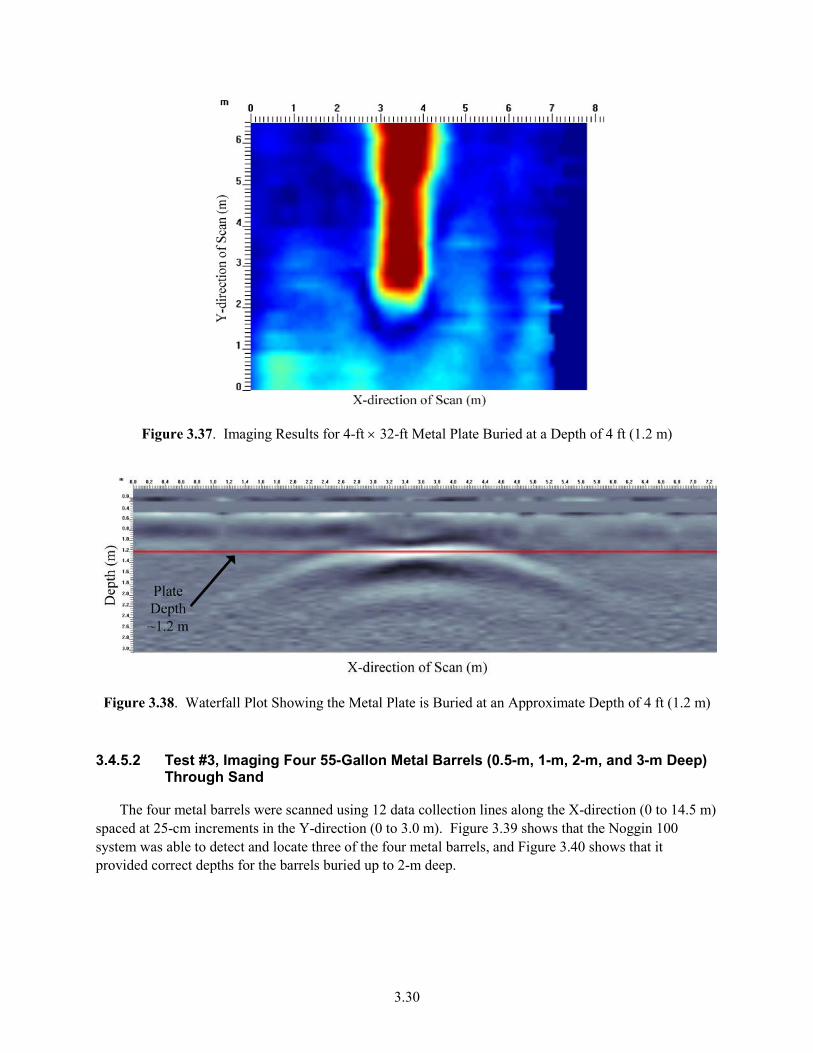
3.30
Figure 3.37. Imaging Results for 4-ft × 32-ft Metal Plate Buried at a Depth of 4 ft (1.2 m)
Figure 3.38. Waterfall Plot Showing the Metal Plate is Buried at an Approximate Depth of 4 ft (1.2 m)
3.4.5.2 Test #3, Imaging Four 55-Gallon Metal Barrels (0.5-m, 1-m, 2-m, and 3-m Deep) Through Sand
The four metal barrels were scanned using 12 data collection lines along the X-direction (0 to 14.5 m) spaced at 25-cm increments in the Y-direction (0 to 3.0 m). Figure 3.39 shows that the Noggin 100 system was able to detect and locate three of the four metal barrels, and Figure 3.40 shows that it provided correct depths for the barrels buried up to 2-m deep.

3.31
Figure 3.39. Imaging Results for the Four Metal Barrels Buried 0.5-m, 1-m, 2-m, and 3-m Deep
Figure 3.40. Waterfall Plot for the Four Metal Barrels Buried (right to left) 0.5-m, 1-m, 2-m, and 3-m
Deep
3.4.5.3 Test #4 – Imaging Four 55-Gallon Barrels (Plastic, Steel, Wood, Concrete) Through 1.5-m Sand
The four barrels were scanned using 12 data collection lines along the X-direction (0 to 15 m) spaced at 25-cm increments in the Y-direction (0 to 3 m). Figure 3.41 shows that the Noggin 100 system was able to detect and locate three of the four barrels, and Figure 3.42 shows that it provided approximately correct depths for the barrels detected (i.e., 1–1.3-m measured versus 1.5-m actual depth).
Figure 3.41. Imaging Results for Four Barrels (concrete, wood, metal, plastic) Buried 1.5-m Deep

3.32
Figure 3.42. Waterfall Plot for Four Barrels (left to right, concrete, wood, metal, plastic) Buried 1.5-m
Deep
3.4.5.4 Test #5 – Imaging PVC Plastic Pipe Through 1.5-m Sand
Figure 3.43 shows a perspective of the PVC pipe constructed using Sensor & Software Inc.’s Voxler-2 software. The plane of the red and green lines represents the ground’s surface and the blue line is pointing into the ground. Units shown are in meters. The green object represents the portion of the 40-ft-long, 24-in.-diameter PVC pipe imaged. The yellow contour on the pipe image corresponds to a depth of 1.2 m. The Noggin 100 system was able to detect and locate the PVC plastic pipe.
Figure 3.43. Sensor & Software Inc.’s Voxler-2 3D Perspective View of 1.5-m-Deep Buried PVC Pipe

3.33
3.4.5.5 Summary of Round 4 Tests #1, #3, #4, and #5
The results of Round 4 testing showed that Sensor & Software Inc.’s Noggin 100 ground-penetrating radar system was able to detect and correctly locate (position and depth) all the targets imaged except the concrete barrel and the 3-m deep metal barrel. The concrete barrel was not detected because, from an electromagnetic standpoint, its moisture content and material constituency are not different enough from the surrounding soil. It is believed that the detection of the 3-m-deep barrel was made difficult because of signal interference (masking). While the relatively large beam width of the antennas provide good coverage of the underground scene, test bed objects in the vicinity of a deep target can produce reflections with high enough amplitudes to mask the weaker signal of the deep target. An additional cause of signal masking could come from interfering signals in the air of the local environment. Such environmental signals were confirmed during previous testing with the GSSI system. At that time, a spectrum analyzer was taken out to the HAMMER test site and sporadic signals were detected in the frequency range of 50—100 MHz (within the operational frequency range of the Noggin 100). At the Noggin’s antenna, these unwanted environmental signals could potentially be stronger than the Noggin signal reflected from targets at depths past 1.5–2 m, thereby masking the 3-m-deep target.
3.4.6 Conclusions of Testing Rounds 1–4
From rounds 1 and 2 of testing, it is concluded that PNNL’s holographic radar imaging system is capable of detecting and locating all of the targets buried in the test bed, except the PVC plastic pipe. Testing showed that severe degradation of target image quality occurred as the distance between the antenna array and the soil surface was increased from 3 in. to 12 in. Testing also showed that detection of deep buried targets is enhanced when the antenna array is placed in direct contact with the surface (soil or concrete) being imaged into. Testing showed that the 4-ft-deep metal plate could be detected and located even when imaging through 6-in.-thick concrete with or without a 16-in. × 16-in. grid of ½-in.-diameter rebar placed beneath the concrete. Testing showed that concrete targets whose moisture content is similar to the surrounding soil are not detectable by PNNL’s system.
For Round 3 of testing, the GSSI system was able to detect all tested targets except the concrete and the plastic barrels. The inadvertent placement of a metal tape over the location of the plastic barrel interfered with its detection. For Round 4 of testing, the Sensor & Software Inc. Noggin 100 system was able to detect all targets tested except the 3-m-deep metal barrel and the concrete barrel. For both rounds 3 and 4 of testing, the difficulty detecting the concrete barrel is presumed to be a result of the moisture content of this barrel coming to equilibrium with that of the surrounding soil.
It is believed that during the year that elapsed between Round 1 of testing (where PNNL’s system detected the concrete barrel) and rounds 2–4 (where the concrete barrel was undetectable), the moisture content of the concrete barrel came into equilibrium with that of the surrounding soil. This would explain why none of the three systems tested could detect the concrete barrel after Round 1.


4.1
4.0 Recommendations – Design Concepts for Future Systems
4.1 Concept Designs for In-Concrete Inspection Systems
4.1.1 Design Concept for a Portable Holographic Radar Imaging System
A radar imaging system composed of a handheld sensor unit, display unit, and battery pack can be used to accomplish DIV of standard-density concrete structures. A sensor unit for a similar system and a concept for future systems are shown in Figure 4.1. The sensor unit contains a linear array of spiral antennas used in sequential-switched mode to rapidly scan along the array axis. The operator moves the system along the surface to collect the data needed to produce the three-dimensional image. A single power-over-Ethernet connection provides power and data transfer. It is envisioned that the dimensions of the sensor unit for this application can be approximately 36 in. × 12 in. × 6 in. and the weight can be less than 10 pounds. The display unit can be implemented as a laptop computer.
Figure 4.1. (a) Sensor Unit for Similar Imaging System; (b) Concept for Future Systems
4.1.2 Concept Design for Ultrasonic Synthetic Aperture Array System
Appendix B contains PNNL’s proposal for developing a complete ultrasonic synthetic aperture array system, which would be capable of producing images of the internal structure and inclusions contained in high-density concrete structures typified by test walls #1–#3 evaluated in this study.

4.2
4.2 Concept Designs for the In-Ground Inspection Systems
Based on the results obtained from the ground-penetrating radar studies, it is clear that holographic radar imaging technology is capable of being developed into a fieldable prototype tool for in-ground DIV inspections of declared facilities. The depth of penetration and the resolution of the systems are in part dependent on frequency. For objects buried just a few meters deep, testing conducted in this feasibility study shows that the 200–400-MHz frequency range provides sufficient penetration and resolution to detect and locate targets of interest. However, for objects buried in the 5–7-m range, a 100-MHz system frequency is recommended. To accommodate these two frequency ranges, it is necessary to use two different antenna configurations. The spiral antenna design is proposed for the 200–400-MHz system and a dipole antenna design is proposed for the 100-MHz system. Modularized systems are proposed such that they can be: 1) deployed in a fashion where a single transmit/receive antenna module is used to obtain multiple single scans that are combined to produce an image or 2) deployed in a fashion where multiple transmit/receive antennas are combined in an array to facilitate rapid scanning of larger areas of interest. To test the 100-MHz system, PNNL proposes to develop a new test site containing deeper-buried targets whose characteristics are reflective of items to be detected.
4.2.1 Concept Design for 200–400-MHz Ground-Penetrating Holographic Radar Imaging System
The concept design for the 200–400-MHz system is shown in Figures 4.2 to 4.4. The spiral antenna module shown in Figure 4.2 is 7-ft long, 3-ft wide, 1¼-ft high, and weighs about 35 pounds. The antennas slide over the surface being imaged into and are separated from it by the thin high-density plastic sheet shown in green. This module would have a small battery and laptop computer mounted onto its top surface and could be manually pushed by an operator to obtain multiple line scans, which would be combined to create an image for the scan area. Multiple modules can be connected together as illustrated by the 10 module antenna array shown in Figure 4.3. This array is 21-ft wide, weighs 250–300 pounds, and has a mounted battery and laptop computer. Depending on the nature of the surface being imaged into, this array could be towed across the scan area by either an individual or a powered vehicle. Figure 4.4 shows a concept for palletized shipping (container approaches could also be used).
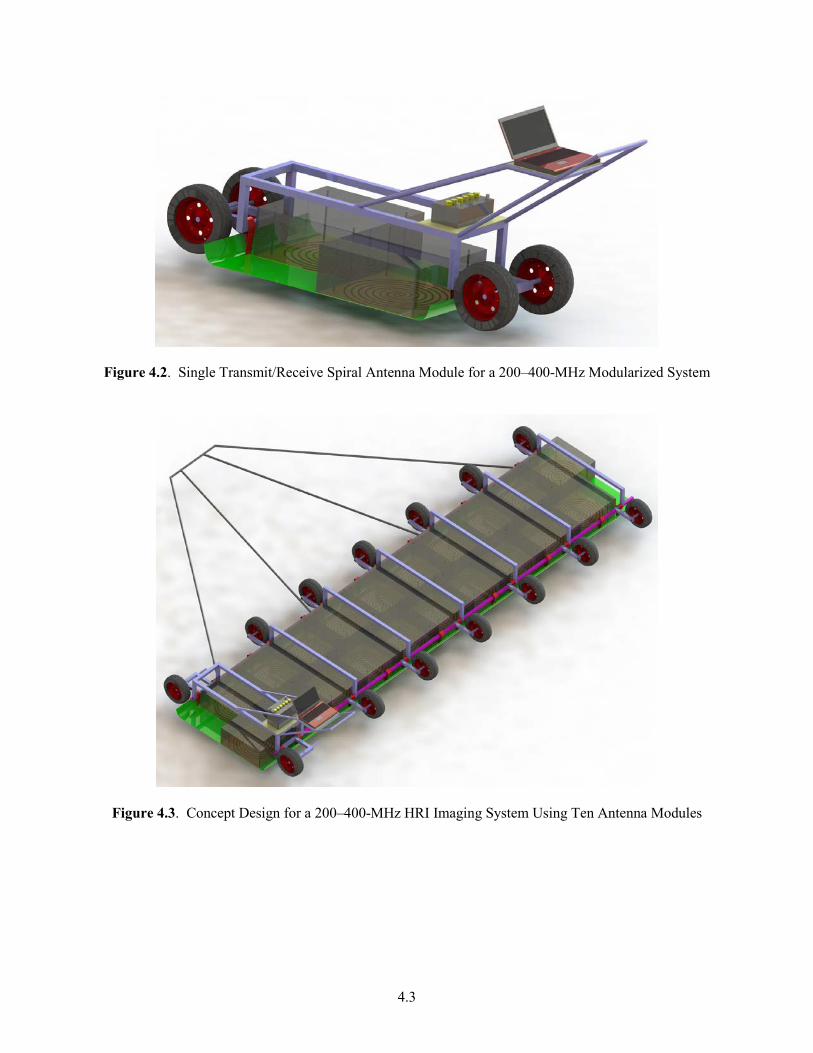
4.3
Figure 4.2. Single Transmit/Receive Spiral Antenna Module for a 200–400-MHz Modularized System
Figure 4.3. Concept Design for a 200–400-MHz HRI Imaging System Using Ten Antenna Modules

4.4
Figure 4.4. Shipping Concept for the 200–400-MHz HRI Imaging System Showing Ten Antenna
Modules
4.2.2 Concept Design for 100-MHz Ground-Penetrating Holographic Radar Imaging System
The concept design for the 100-MHz system is shown in Figures 4.5 through 4.7. The dipole antenna module shown in Figure 4.5 is 50-in. long, 24-in. wide, 9-in. high, and weighs about 30 pounds. The antennas slide over the surface and are separated from it by the thin high-density plastic sheet shown in green. Appendix C contains a detailed proposal to realize this concept as a mobile, manually operated, portable scanner, which includes a small battery and a laptop computer. Such a scanner would enable its user to obtain multiple line scans, which could be combined by the system software to create an image for the scan area. Multiple modules as shown in Figure 4.5 can be connected together as illustrated by the four-module antenna array shown in Figure 4.6. This array is 15-ft wide, weighs 150–175 pounds, and has a mounted battery and laptop computer. Figure 4.7 shows a concept for palletized shipping (container approaches could also be used).
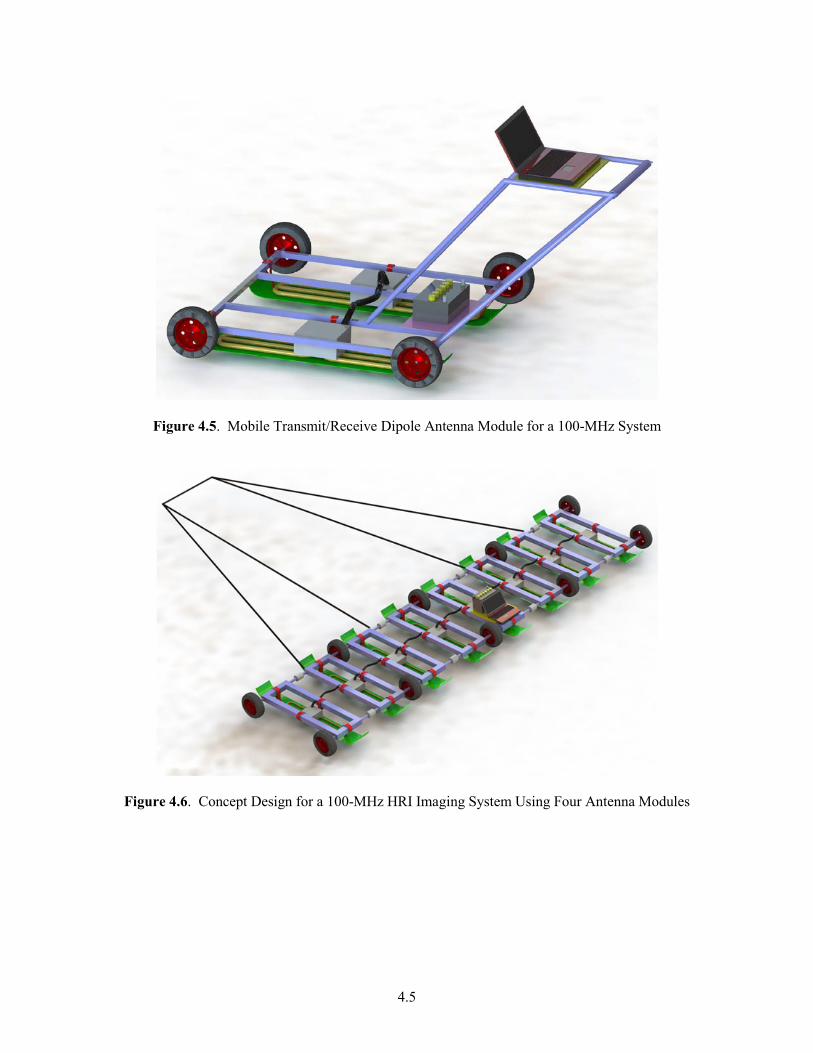
4.5
Figure 4.5. Mobile Transmit/Receive Dipole Antenna Module for a 100-MHz System
Figure 4.6. Concept Design for a 100-MHz HRI Imaging System Using Four Antenna Modules

4.6
Figure 4.7. Shipping Concept for a 100-MHz HRI Imaging System Using Four Antenna Modules
4.2.3 Deep Target Burial Test Site for 100-MHz Ground-Penetrating HRI System
To test the 100-MHz man-portable HRI system under conditions that simulate those expected to be inspected by the IAEA at declared facilities, the proposal in Appendix C recommends the development of a test site with deeply buried targets such as the one shown in Figure 4.8. The approach proposed is to create a containment volume (90-ft long, 30-ft wide, and 20-ft deep) of special soil (Quincy), which has characteristics like the soils expected to be encountered in practice. This soil would be isolated from surrounding soil by plastic barriers (indicated by the dotted lines) to ensure that moisture content levels are controlled and that they are independent of environmental factors. The test site shown contains two 1.22-m-diameter PVC pipes buried at a depth of 5 m—one pipe filled with water and the other with air. Each pipe would have three sections—one is bare PVC pipe, the second is enshrouded in gravel, and the third is encased in concrete. To calibrate the 100-MHz HRI system, three flat reflecting plates would be buried at different depths.

4.7
Figure 4.8. Deep Target Burial Test Site Concept Design for the 100-MHz PNNL HRI System


5.1
5.0 Conclusions
Several nondestructive evaluation technologies were tested to determine if it is feasible to use them as Design Information Verification (DIV) tools capable of performing in-wall inspections of concrete and in-ground inspections at declared facilities to verify that the existing construction matches information provided by a state to the IAEA. The conclusions provided for the in-concrete wall and in-ground testing follow a review of the testing objectives and test results. Recommendations to pursue further development of the technologies shown to be feasible DIV tools are provided in Section 4.0 of this report.
The first testing objective of this project was:
• DIV Tools for In-Concrete Inspections: To determine the feasibility of using holographic radar imaging (HRI), radar imaging, and acoustic time-of-flight (TOF) nondestructive evaluation technologies to detect, locate, and identify pipes and voids embedded in standard-density and high-density concrete walls that typify those the IAEA will need to verify during field inspections.
To address this objective, PNNL evaluated three technologies: 1) a prototype PNNL HRI system, 2) GSSI’s SRI-3000 commercial radar imaging system, and 3) acoustic TOF. They were tested on standard-density and high-density concrete walls containing pipes, air voids, and a large metallic letter “F”. These test walls were developed with the client and were considered to be representative of concrete walls at declared facilities.
The PNNL HRI and GSSI radar-based systems were able to detect concealed items in the standard-density concrete, but not the high-density concrete, because the conductive nature of the aggregate materials used in high-density concrete caused high attenuation of the radar signals and no useful images could be obtained. PNNL’s HRI system detected, correctly located, and displayed useful images for small-diameter (1.5-in.) pipes located up to 8 in. deep, larger-diameter (3-in.) pipes located up to 12 in. deep, air voids (6-in.-diameter) located up to 10 in. deep, and a large metal letter “F” located 8 in. deep. It resolved two 1.5-in.-diameter pipes spaced 3 in. center-to-center. The GSSI system performance was limited to being able to detect a 1.3-in.-diameter pipe located up to 4 in. deep. It could not detect pipes buried at 8-in. depths or air voids at 10-in. depths.
The acoustic TOF technology was tested in a V-path pitch-catch transmit/receive configuration with probes located on the same surface of the high-density concrete test wall. It was able to differentiate portions of the 12-in.-thick concrete wall containing no pipes from those portions containing 3-in.-diameter pipes located at 3-, 6-, and 9-in. depths. The acoustic TOF instrumentation configuration tested was not sophisticated enough to provide details about pipe location or to display images.
Based on these test results, it is concluded that for standard-density concrete walls, PNNL’s HRI technology is capable of meeting the functional requirements established for an IAEA DIV tool, but the GSSI (using the SRI 3000 imaging unit) radar imaging technology is not. It is concluded that radar signals cannot be used to image objects embedded in high-density concrete because this concrete contains conductive aggregate materials. Finally, the acoustic TOF approach performed equally well in standard- and high-density concrete and shows high promise (after further development) for becoming a viable technology capable of meeting the functional requirements established for an IAEA DIV tool.

5.2
The second testing objective of this project was:
• DIV Tools for In-Ground Inspections: To determine the feasibility of using holographic radar imaging and radar imaging nondestructive evaluation technologies to detect, locate, and identify objects buried at various depths made of various materials (metal, plastic, wood, and concrete) and representing geometries that typify those the IAEA will need to verify during field inspections.
To address this objective, PNNL evaluated three ground-penetrating radar imaging systems: 1) PNNL’s holographic radar imaging array (200–400 MHz), 2) GSSI’s UtilityScan (400-MHz antenna), and 3) Sensors & Software Inc.’s Noggin 100 (100-MHz). A test bed was developed containing plates, pipes, barrels, and containers buried at various depths and made of various materials (metal, plastic, wood, and concrete), some filled with air and others filled with liquids. The test bed was developed with the client and was considered to be representative of in-ground items of interest at declared facilities. The depth a radar system can penetrate the soil diminishes rapidly as the soil moisture content increases between zero and five percent. The soil moisture conditions for PNNL’s in-ground testing ranged 4.5–5.8%. Based on information available in the public literature about desert sands worldwide, 4.5–5.8% moisture content level is considered to be at the high end of levels expected to be encountered in actual field conditions.
PNNL’s holographic radar imaging system was able to detect and correctly locate (in position and depth) all of the targets buried in the test bed, except the PVC plastic pipe. Testing showed that a 4-ft-deep metal plate could be readily detected and located even when imaging through 6-in.-thick concrete (with or without a 16-in. × 16-in. grid of ½-in.-diameter rebar placed beneath the concrete). PNNL’s HRI system can detect buried plastic containers filled with liquids (water, canola oil), but under the conditions tested, it was unable to detect the air-filled container (i.e., empty PVC pipe). The concrete barrel, whose electromagnetic properties most closely match those of the surrounding soil (making it challenging to detect) was detected and correctly located. Testing showed that severe degradation of target image quality occurred as the distance between the antenna array and the soil surface was increased from 3 to 12 in. Subsequently, the antenna array was modified (sled design), which allowed the array to be placed in direct contact with the soil or concrete surface. This change made it possible to detect the most deeply buried targets (those which were undetectable when the array was limited to a 3-in. standoff).
GSSI’s UtilityScan system was able to detect and correctly locate (in position and depth) all of the targets imaged except the concrete barrel and plastic barrel. The reason the concrete barrel was not detected was probably that during the 15 months that elapsed between the time the PNNL HRI array was tested and the GSSI system was tested, the concrete’s moisture content came into equilibrium with the surrounding soil; thus, from an electromagnetic standpoint, it was not sufficiently different from the surrounding soil to be detected. Had it not been for the inadvertent placement of a metal tape on the surface of the ground directly over the location of the plastic barrel, it is probable that the GSSI system would have detected and located this barrel as well.
Sensor & Software Inc.’s Noggin 100 ground-penetrating radar system was able to detect and correctly locate (position and depth) all the targets imaged except the concrete barrel and the 3-m-deep metal barrel. The concrete barrel was not detected because, from an electromagnetic standpoint, its moisture content and material constituency are not different enough from the surrounding soil. It is believed that the detection of the 3-m-deep barrel was made difficult because of signal interference

5.3
coming from other targets in the test bed and from undesirable extraneous signals known to exist in the electromagnetic environment (in the air) at the test site (masking).
Although none of the systems tested was able to detect and locate all of the buried targets, they each successfully detected and located all but one or two targets. Reasonable explanations have been provided for the undetected targets, based on the physics of radar imaging, the particulars of the systems tested, and the environmental and human factors that were particular to the testing scenarios. Given ideal testing circumstances and sufficient testing time, it is believed that all of the systems tested could successfully detect and locate the undetected targets. On the other hand, it is believed that overall, the conditions encountered during testing are representative of real-world testing environments as would be encountered during IAEA inspections at declared facilities. Based on these test results, it is concluded that there is potential for the IAEA to use PNNL’s HRI system, GSSI’s UtilityScan system, and Sensors & Software Inc.’s Noggin 100 system as DIV tools to perform in-ground inspections at declared facilities.


6.1
6.0 References
Doolittle JA, B Jenkinson, DF Hopkins, M Ulmer and W Tuttle. 2006. "Hydropedological Investigations with Ground-Penetrating Radar (GPR): Estimating Water-Table Depths and Local Ground-Water Flow Pattern in Areas of Coarse-Textured Soils." Geoderma 131:317-329.
Szuch RP, JG White, MJ Vepraskas and JA Doolittle. 2006. "Application of Ground-Penetrating Radar to Aid Restoration Planning for a Drained Carolina Bay." Wetlands 26(1):205-216.
Vitebskiy S, L Carin, MA Ressler and FH Le. 1997. "Ultra-Wideband, Short-Pulse Ground-Penetrating Radar: Simulation and Measurement." IEEE Transactions on Geoscience and Remote Sensing 35(3):762-772.
Williams KK and R Greeley. 2004. "Laboratory and Field Measurements of the Modification of Radar Backscatter by Sand." Remote Sensing of Environment 89:29-40.
Yoder RE, RS Freeland, JT Ammons and LL Leonard. 2001. "Mapping Agricultural Fields with GPR and EMI to Identify Offsite Movement of Agrochemicals." Journal of Applied Geophysics 47:251-259.


Appendix A
Functions and Requirements for the Concrete Structure Inspection Holographic Radar Imaging System


A.1
Appendix A
Functions and Requirements for the Concrete Structure Inspection Holographic Radar Imaging System
Mark Jones and Doug McMakin February 2010
Contents A.1 Introduction ..................................................................................................................................... A.4
A.2 Pacific Northwest National Laboratory Radar Imaging Laboratory ............................................... A.4
A.3 PNNL Radar Imaging Facility ........................................................................................................ A.5
A.4 Overview of Holographic Radar Imaging System for CSI ............................................................. A.5
A.5 Document Purpose and Scope ......................................................................................................... A.7
A.5.1 Purpose ............................................................................................................................... A.7
A.5.2 Scope .................................................................................................................................. A.7
A.5.3 Definitions .......................................................................................................................... A.7
A.6 General Assumptions ...................................................................................................................... A.8
A.6.1 Application Strategy........................................................................................................... A.8
A.6.2 Facility Type ...................................................................................................................... A.8
A.6.3 Ancillary Equipment .......................................................................................................... A.8
A.6.4 Controls .............................................................................................................................. A.8
A.6.5 Power ................................................................................................................................. A.9
A.6.6 Interfaces ............................................................................................................................ A.9
A.7 CSI Radar Imaging System Functions ............................................................................................ A.9
A.7.1 System Function ................................................................................................................. A.9
A.7.2 Sensor Unit Function.......................................................................................................... A.9
A.7.3 Display Unit Function ........................................................................................................ A.9
A.7.4 Future Complementary Functions ...................................................................................... A.9
A.8 CSI Radar Imaging System Requirements .................................................................................... A.10
A.8.1 Detection Sensitivity ........................................................................................................ A.10
A.8.2 Size ................................................................................................................................... A.10
A.8.3 Weight .............................................................................................................................. A.10
A.8.4 Power ............................................................................................................................... A.10

A.2
A.8.5 Modular Design and Assembly ........................................................................................ A.11
A.8.6 Suitability ......................................................................................................................... A.11
A.8.7 Computer Equipment ....................................................................................................... A.11
A.8.8 Data Collection ................................................................................................................ A.11
A.8.9 Data Display ..................................................................................................................... A.12
A.8.10 Data Storage ..................................................................................................................... A.12
A.8.11 Quality .............................................................................................................................. A.12
A.8.12 Reliability ......................................................................................................................... A.12
A.8.13 Safety ............................................................................................................................... A.12
A.8.14 Failure of System ............................................................................................................. A.12
A.8.15 Environmental Conditions ............................................................................................... A.12
A.8.16 Interference ...................................................................................................................... A.13
A.8.17 Parts Availability .............................................................................................................. A.13
A.8.18 Maintainability ................................................................................................................. A.13
A.8.19 Self-diagnostics ................................................................................................................ A.13
A.8.20 Intended Design Life ........................................................................................................ A.13
A.8.21 Calibration ........................................................................................................................ A.13
A.8.22 Demonstration Testing ..................................................................................................... A.14
A.8.23 Test Plan and Procedures ................................................................................................. A.14
A.8.24 Test Documentation ......................................................................................................... A.14
A.8.25 System Documentation .................................................................................................... A.14
A.3
Acronyms
COTS commercial off-the-shelf CSI concrete structure inspection DIV design information verification GHz GigaHertz IAEA International Atomic Energy Agency MMIC monolithic microwave integrated circuit PC personal computer PNNL Pacific Northwest National Laboratory RADAR Radio Detection and Ranging SAR Synthetic Aperture Radar
A.4
A.1 Introduction
As part of a comprehensive safeguards program, the International Atomic Energy Agency (IAEA) conducts design information verification (DIV) inspections of nuclear facilities operating within its member states. The current methods used for these inspections do not allow for “seeing” into or through concrete structures to detect and identify objects of interest such as process piping routes, junctions, and manifolds. Agency inspectors are typically limited to the examination of objects which are visually or physically accessible.
A capability which could verify the presence of buried, embedded or otherwise concealed objects would enable a more complete assessment of the nuclear facility. In particular, a technique that could penetrate into the walls of concrete structures and inspect internal features could be used to determine if modifications have been made to the building structure in support of undeclared activities. A comparison of this type of data to the site plans and building blueprints could confirm that the member state is operating the facility according to its safeguards agreement.
A technology that has been demonstrated as a solution to this concrete structure inspection (CSI) application is active radar holographic imaging. Depending upon the frequency range selected, electromagnetic waves can readily penetrate various exterior and interior walls. Frequencies below 4 GHz are typically used for imaging into concrete since this wall construction material is generally opaque at higher frequencies.
A.2 Pacific Northwest National Laboratory Radar Imaging Laboratory
The Pacific Northwest National Laboratory (PNNL) has been performing innovative research and development on imaging radar systems for a wide variety of applications for the past 18 years. PNNL holds multiple patents on this radar technology. Research and development activities have included concealed weapon detection systems, radar cross-section imaging, inner-wall imaging, and the development of prototype real-time imaging systems for field applications. PNNL has developed laboratory, portable, and transportable active radar microwave and millimeter-wave-imaging systems with operating frequencies from 300 MHz to 350 GHz. PNNL has developed these imaging systems using transceivers designed with impulse, swept frequency, and continuous wave sources. The various imaging techniques developed at PNNL include focused lens, 2D single frequency holography, 3D wide-band holography, linear SAR, circular SAR, and 3D cylindrical holography.
PNNL not only has developed and implemented the innovative imaging systems listed above, but also possesses the capability and technical expertise to develop new radar imaging systems to meet client requirements. In addition, PNNL has demonstrated the ability to implement innovative holographic and synthetic-imaging algorithms for these systems using high-speed multiprocessor computers. Examples of radar imaging systems developed by PNNL over the last several years include concealed weapon detection, inner-wall-imaging studies, and real-time hand-held radar imaging guns.

A.5
A.3 PNNL Radar Imaging Facility
PNNL has a unique ability to conceptualize, develop, and implement real-time microwave imaging systems. PNNL’s radar imaging facility, located in Richland, Washington, is well-equipped for the development of new imaging concepts. A variety of high-resolution x-y scanners are available, including a 5-ft × 5-ft scanner, a 6-ft × 6-ft scanner, and a 70-ft × 20-ft scanner. Coupled to these scanners are compact microwave/millimeter-wave transceivers which can operate at 2–8 GHz, 8–20 GHz, 24–40 GHz, 40–60 GHz, and 90–100 GHz. This laboratory equipment allows PNNL to quickly develop and test imaging concepts for new applications.
A.4 Overview of Holographic Radar Imaging System for CSI
The concrete structure inspection application demands a detection system which can penetrate common concrete walls, is highly portable, allows rapid deployment, and has sufficient sensitivity and resolution to detect non-documented objects such as metal piping routes and junctions. The system must also be easy to use and relatively low-cost in production quantities. An approach which is capable of satisfying these requirements is a holographic imaging system utilizing a hand-held mechanical scanning apparatus for obtaining imaging aperture positional information. A conceptual design showing the system components is shown in Figure A.1.
Figure A.1. Conceptual Design of a Portable, Near Real-Time Holographic Radar Imaging Array that
could be used in IAEA Design Information Verification Inspections
The linear array imaging system should be deployed as near as possible to the structure under inspection and should preferably be in contact with the wall for better coupling of the radar waves into concrete. Due to the high dielectric constant of concrete, it is typically best to optimize the coupling of the radar energy into the wall by using antennas whose input impedance is well-matched to this medium.

A.6
The use of antennas which are in contact with the wall surface and well-matched to the concrete dielectric constant can significantly reduce front surface reflections. This improves the dynamic range of the imaging system and provides better detection of embedded objects. If the array antennas are in contact with the wall surface, a low frictional material such as Teflon can be integrated into the antenna design to improve lateral movement during the scanning process.
The holographic radar array shown in Figure A.1 can be mechanically scanned along the concrete wall surface in the vertical, horizontal, or diagonal direction. The manual mechanical scan provides one dimension of the imaging aperture and the length of linear array provides the other. The third dimension is provided by the wideband transceiver, which may be referred to as down-range information. The data captured from the sequential scans is digitally reconstructed into a focused 3D image which can be displayed in various formats. The image display can show the front, side, or top views of the 3D image. There can also be an image display feature, which is operationally selectable, that will show slices of the 3D image. These image reconstruction and display features have already been implemented in other imaging systems and will be modified for use with the holographic radar CSI system.
A block diagram of a holographic radar imaging system is shown in Figure A.2. The system will consist of a wideband microwave transceiver coupled through a switch matrix to a linear array of light-weight antennas. The transceiver outputs will be digitized and images will be reconstructed and displayed using a high speed PC. A mechanical scanning apparatus, which could be designed with rubber wheels, will be mounted on the array infrastructure and coupled to positional encoders to allow the operator to manually scan over the concrete surface while tracking imaging aperture positional information. This aperture positional information is used to form the reconstructed image. The system will be designed such that it is compact, lightweight, and easy to deploy.
Figure A.2. Block diagram of a holographic radar imaging array.

A.7
Production costs for this type of system could be reasonably low. The linear antenna arrays are constructed using printed circuit technology and are very low cost. The switch modules are integrated into the linear arrays which reduces assembly costs and radar connector costs. The radar transceiver can be designed to use a minimum number of costly microwave components. Furthermore, only one microwave transceiver is required for this system regardless of the size of the imaging array. The computer system will be a conventional laptop computer which could eventually take the form of a wearable computer with the holographic radar image displayed in virtual vision glasses. Careful optimization of the system components will allow for low production costs.
Another significant cost reduction strategy that will be investigated is the use of modern low-cost MMIC microwave switches and other components. These low-cost components are primarily available at frequencies up to 3 GHz. If this frequency range is shown to provide the best performance, the use of these components will dramatically reduce the ultimate production costs for this technology. However, even at frequencies up to 8 GHz, the costs of microwave components are reasonable.
Proper design of the linear array imaging system will allow for excellent portability and ease of deployment. The system may be fabricated in sub-sections which quickly snap together to form the full imaging array. All dimensions other than array length would be kept relatively small for maximum portability. The linear array would be enclosed in a rugged plastic case that would avoid a need for special handling. The computer system could be ruggedized and equipped with quick-connect cabling for rapid deployment and disassembly.
A.5 Document Purpose and Scope
Purpose A.5.1
This document defines the functions and requirements for a rapid concrete wall inspection system which can detect non-documented objects such as metal process piping in concrete building structures. The purpose of this document is to provide criteria for the selection of a CSI system concept and the design, fabrication, and application methodology. The document provides specifications for materials engineered, procured, and applied for rapid system setup and detection of non-documented objects in concrete structures.
Scope A.5.2
The scope of this document includes a description of the intended operation scenario of the CSI system and evaluation criteria for concept, design, fabrication, and application strategy.
Definitions A.5.3
An assumption is the basis for a requirement that is taken to be true without necessarily having proof or demonstration. Changes in assumptions may have significant impacts on related requirements.

A.8
A function is a description of the task that a system, subsystem, or component must perform. It is not a description of the device in any manner, but may establish some of the parameters governing the overall geometry of the device.
A requirement is a mandatory factor that must be applied or incorporated into the design of the device performing the specified function. It is not a preference and uses the word “shall.”
A.6 General Assumptions
Application Strategy A.6.1
The system will be utilized as a non-invasive inspection tool as part of design information verification inspections of nuclear facilities located within IAEA member states. The system will be deployed and applied by trained IAEA inspectors.
The system will be transportable and able to operate in any member state. The system will initially be applied to bare indoor concrete surfaces such as walls, floors, or ceilings. No permanent markings will be necessary for the system to scan the concrete structures. The system will be manually operated by a single operator.
Facility Type A.6.2
The system could be utilized in nuclear facilities which operate in various phases of the nuclear fuel cycle, are located within IAEA member states around the world, and are in varying stages of construction. Thus the concrete structures to which the system will be applied are expected to exhibit some variability due to their constituent materials and construction techniques.
It is known that the electromagnetic properties of concrete are a function of aggregate type, particle size, mixture density, moisture content, curing time, temperature, and frequency. In general, electromagnetic losses increase with moisture content and frequency and decrease with age. For best performance, the system will be designed to function when applied to dry concrete of typical density which has cured for at least 30 days.
Ancillary Equipment A.6.3
The system will be self-contained with all travel cases used and any other related items. No other system except for the possibility of external power will be required in order to perform surface scans.
Controls A.6.4
All control equipment will be highly portable to allow for quick setup and movement to other locations. If the equipment is operated outdoors, it will be protected from inclement weather.

A.9
Power A.6.5
The system will either be battery operated or utilize power available from international sources.
Interfaces A.6.6
The system controls will interface with all components and subsystems. The sensor unit will be compatible with control devices which are supplied as part of the system.
A.7 CSI Radar Imaging System Functions
System Function A.7.1
The function of the concrete wall imaging system is to provide detection and verification of the location of metal objects embedded in concrete walls, ceilings, or floors in near-real time. The system may consist of a sensor unit and display unit.
Sensor Unit Function A.7.2
The function of the sensor unit is to transmit and receive electromagnetic signals over the operating frequency band in order to provide data for the image reconstruction process.
Display Unit Function A.7.3
The function of the display unit is to create and display a near real-time three-dimensional depiction of the objects scanned by the system which is readable in normal indoor lighting conditions.
Future Complementary Functions A.7.4
Additional development of software processing routines could significantly enhance the functionality of the system. For example, image data produced from a facility scan could potentially be used in post-processing algorithms to create virtual maps depicting the layout of internal structures such as process piping routes. Used in conjunction with data generated from 3D laser-based range scanners, a virtual model of the facility could potentially be developed which would capture both external and internal features.
A second potential enhancement to the system would be to implement a change detection capability. In this scenario, the image data from multiple scans of a facility would be post-processed by additional software algorithms in order to automatically detect and highlight differences which have occurred during the interim. This would enable agency operators to easily compare results of a current scan with image data collected during a previous inspection.
A third potential enhancement would be to employ an automated scanning technique such as a robot-based approach. This would allow imaging scans to be performed in areas and environments which

A.10
present a health or safety hazard to human operators. It is expected that this type of automation may find use in containment chambers or other areas where radioactive material prevents human entry.
A.8 CSI Radar Imaging System Requirements
Detection Sensitivity A.8.1
The system shall be designed for a goal imaging resolution capable of detecting metal pipes or similar embedded objects which have a minimum characteristic dimension of 3 inches. It is expected that the presence of reinforcing steel bars will affect the imaging resolution. The nature of these impacts will be examined as part of the system testing activities.
The system shall be designed for a goal depth penetration capable of detecting metal objects located within 12 inches of the dry concrete structure being scanned. It is expected that the dielectric properties of the concrete structure will affect the attenuation of the electromagnetic signals used by the radar system to form the images. The maximum penetration depth will be studied as part of the system testing activities.
Size A.8.2
The sensor unit shall be designed to be as physically small as possible for the penetration depth and resolution goals. This portion of the system will be physically translated along the wall surface, approximately perpendicular to its longest dimension, and contains the linear array of antennas, encoder wheels, and transceiver circuits. This unit shall have a rectangular form factor with expected dimensions less than 36 in. × 12 in. × 6 in.
The display unit shall be a ruggedized laptop computer.
Weight A.8.3
The sensor unit shall be designed for a goal weight of no more than 10 lbs in order to minimize operator fatigue from extended usage of the system. The display unit shall have an expected weight of no more than 5 lbs.
Power A.8.4
The system shall be powered by self-contained rechargeable batteries or external international power sources. If an external power source is necessary, the system shall include power conditioning circuits to regulate the quality of the supplied voltage. I f powered by internal batteries, the battery life shall be a minimum of 4 hours.
A standby mode may be implemented in order to conserve power when the system is not actively acquiring data from a scanning operation.

A.11
Modular Design and Assembly A.8.5
Each system shall be designed for simple field assembly by an IAEA inspector. If necessary, the system shall be designed to snap together for rapid assembly by a single operator. The total time required to set up the system shall be a maximum of 10 minutes.
The sensor unit may include a boom arm attachment or similar mechanism to extend the reach of the operator and allow a floor or ceiling surface to be more easily scanned.
Any tools required for assembly shall be provided as part of the system and all connection points shall be clearly labeled. All cables shall be easily disconnected at both ends.
Suitability A.8.6
The system shall be designed on the basis of several selection criteria. These shall include, but are not limited to, the following:
• Speed of scan
• Production system cost
• Depth of penetration
• Ease of application
• Reliability
• Impact to routine operations
• Intended design life
Computer Equipment A.8.7
The system shall include a laptop computer containing the control and image processing software application. The system shall utilize the Microsoft Windows operating system. During the course of the system design, the use of an additional external workstation shall be evaluated to add the capability to process and analyze images at an offsite location.
All computer software supplied as part of the system shall be the latest available version at the time of final delivery. Any software updates performed after final delivery are not part of the system and shall not be supplied.
Data Collection A.8.8
The system shall be able to scan 8 linear feet in less than 5 seconds. The system shall be able to collect image scans with the sensor unit sequentially positioned along the surface of interest in a vertical, horizontal, or diagonal orientation.

A.12
Data Display A.8.9
The system shall create three-dimensional images of metal objects which are concealed inside concrete structures. Data collected from a scanned surface shall be displayed by the system software application in near-real time.
Data Storage A.8.10
The system shall be able to offload all image data files which are collected during scanning operations and are required for subsequent post-processing at an offsite location. This capability may be implemented via a removable hard drive or similar mechanism.
Quality A.8.11
All equipment shall be fabricated in accordance with engineering best practices. Any components delivered by subcontractors shall be inspected for quality assurance before integration into the system.
Reliability A.8.12
The system shall reliably perform the functions stated in this document for the lifetime of the system when utilized in the specified manner and operating conditions.
Safety A.8.13
Protection of the public, the system, the operator, the environment and other communication equipment shall be required for this system. The use of the system shall cause no harm to the operator. The system shall meet applicable flammability requirements.
Failure of System A.8.14
The system shall fail in a safe operating condition. Failure of the system shall not cause harm to the operator or environment.
Environmental Conditions A.8.15
The system shall survive the environmental conditions shown in Table A.1. The system shall be designed for primarily indoor use and occasional outdoor use if protected from the elements. The system shall not be immersed in water or other fluids. The values shown in Table A.1 are representative of typical conditions expected during inspections of various facilities.

A.13
Table A.1. Expected Environmental Conditions for Use of CSI System
Indoor Outdoor Temperature 55°–85°F 0°–100°F Humidity 30%–60% 20%–60%
Interference A.8.16
The system shall not interfere in any way with other electrical equipment or communication devices operating in the vicinity of the system. In addition, the system may be designed to transmit only when the encoder wheels on the sensor unit are engaged against a surface.
Parts Availability A.8.17
Commercial-off-the-shelf (COTS) materials and components shall be selected as much as possible during the design of the system.
Maintainability A.8.18
The system shall not contain any user-serviceable components. No spare parts shall be supplied as part of the system. Replacement systems may be ordered from PNNL at a cost to be determined at a later date.
The system shall support a remote diagnostics mode in which field support can be provided by PNNL via an Internet connection.
A detailed bill of materials shall be supplied for component traceability.
Self-diagnostics A.8.19
The system shall include a self-diagnostic function to report the health status of the system control software and sensor hardware.
Intended Design Life A.8.20
Any computer supplied as part of the system shall have a design life of 5 years.
Calibration A.8.21
The system shall be calibrated at PNNL to insure proper image formation before final delivery. A calibration procedure shall be developed for use in field operations. All necessary calibration targets shall be supplied as part of the system.

A.14
Demonstration Testing A.8.22
Testing shall be performed in order to demonstrate proper operation and performance. Testing prerequisites shall ensure that the system is set up and operational. As much as possible, all testing conditions shall be reflective of the actual operating environment.
The system shall be applied to concrete structures containing potential objects for DIV testing and training. If necessary, concrete walls shall be poured in order to test the system under realistic operating conditions. Studies shall be performed to determine the resolution and depth penetration of the system. Real-time operation of the system shall be demonstrated at the selected test conditions.
Test Plan and Procedures A.8.23
A test plan shall be developed for testing and selection of the system. The test plan shall identify all necessary equipment, procedures, and conditions for completing the tests.
Test Documentation A.8.24
The data produced by the test activity shall be analyzed to demonstrate proper operation of the system hardware and software. A test report of the results of the demonstration testing shall be published.
System Documentation A.8.25
An English-language operations manual containing detailed operating and troubleshooting instructions shall be provided for the system. The system software application shall also include help information within the user interface.

Appendix B
Proposal for Imaging Internal High-Density Concrete Structures by Ultrasonic Synthetic Aperture Array


B.1
Appendix B
Proposal for Imaging Internal High-Density Concrete Structures by Ultrasonic Synthetic Aperture Array
1. Proposed research and development is:
Continuing Project New Project 2. Project category:
Measurement Technology Containment, Surveillance, and Continuity of Knowledge Destructive Analysis for Safeguards Standards and Infrastructure Maintenance and Development Detector Materials for Safeguards Safeguards Data Authentication Safeguards Data Integration Design Information Verification Tools and Methods
3. Lead investigators (no bios necessary) and potential external collaborators: Principal Investigator: Wayne Lechelt Supporting Investigators: Morris Good, Mark Jones, Kayte Denslow, Tom Hall, and Doug McMakin 4. Clear description of safeguards need addressed and implementation path envisioned:
(or, where applicable, how proposal will support safeguards technology development infrastructure) The goal of this project is to identify the critical ultrasonic inspection parameters for designing an engineering prototype synthetic aperture scanning system to locate and image pipes and utilities embedded in high-density concrete (HDC) structures. The development of a prototype ultrasonic synthetic aperture array scanning system will be implemented as a two-phase process. The first phase will identify the critical acoustic parameters for maximum depth of material penetration. Clutter rejection methodologies will be evaluated to maximize the signals due to embedded pipes and utilities. Through modeling algorithms, laboratory simulation testing, and analysis of commercial technology, a system design will be generated for an ultrasonic synthetic aperture array engineering prototype. Phase two will consist of the fabrication and laboratory testing of the prototype array system. The imaging capability of the prototype will be documented and conduct-of-operation procedures will be developed for the inspection of HDC structures. Upon conclusion of phase two, a plan will be developed to transfer the engineering prototype technology to a deployable field system that the International Atomic Energy Agency (IAEA) can use as a design information verification (DIV) tool.
5. Overview of proposed research, including important milestones or deliverables: In phase one of this project, the technical team will gather inspection requirements, inspection conditions, and constraints (e.g., time limits, dimensions of scan areas, etc.), and real-world material properties of HDC in nuclear facilities. Data gathering will culminate in the development of HDC

B.2
sample specifications (e.g., aggregate size and concentration) for sample fabrication, a requirements document, and a test plan. The team will also evaluate the current state of ultrasonic inspection technology as it applies to concrete inspection. New synthetic aperture array technologies under development will also be evaluated. Based on the results from information gathering, modeling, and simulation studies, the appropriate ultrasonic inspection components will be acquired and integrated to produce a laboratory system that will be used to verify the predicted performance. The laboratory system will also be integrated with an existing laboratory rectilinear scanner. The ultrasound sensor will be mounted on the laboratory scanner shuttle. The HDC sample will be placed next to the scanner in contact with the ultrasound sensor. In this configuration, the fabricated HDC samples with and without embedded pipes will be scanned and culminate in the generation of pseudo-scan acoustic images. The results of the modeling, performance testing, and scanned image generation will be used to develop the design for the phase two engineering prototype ultrasonic array system and synthetic aperture image processing algorithm software. In phase two, a prototype acoustic array system will be fabricated, an existing advanced holographic imaging software program (AHIS) will be modified to process acoustic synthetic aperture data, and the engineering prototype array system will be tested on HDC samples. A plan will be generated describing the next steps necessary to advance the prototype design into a field deployable system that can be used in the DIV of nuclear facilities. Phase One Tasks: Task 1. Collect inspection requirements, HDC material properties, inspection conditions, and constraints; perform modeling and simulation studies.
Task 1.1 Milestone. Develop ultrasonic system design requirements for HDC inspection: 2 months after project start date (APSD). Task 1.2 Milestone. Identify pertinent acoustic parameters and transducer performance specifications; optimize acoustic transmit modalities and HDC /acoustic propagation optimization: 4 months APSD.
Task 2. Develop HDC test samples and a laboratory operating system based on task 1 results. Task 2.1 Milestone. Design and fabricate HDC samples with embedded pipes and utilities: 5 months APSD. Task 2.2 Milestone. Purchase ultrasonic transducers, amplifiers, signal generators and integrate into a working laboratory test system: 8 months APSD.
Task 3. Perform laboratory tests to validate the design performance of the test system. Task 3 Milestone. Generate a pseudo-scan image using the laboratory inspection system; document the HDC performance capability of the laboratory designed system: 10 months APSD.
Task 4. Project Management, technical reviews, quarterly status reports, final letter report, and document a design for an engineering prototype synthetic aperture array acoustic imaging system.
Task 4.1 Milestones. Technical meetings as client requests. Quarterly reports every 3 months. A final report 12 months APSD. Task 4.2 Milestones. Design document of hardware, software, and performance requirements for an engineering prototype synthetic aperture array acoustic imaging system: 11 months APSD.
Phase One Deliverable 1: Technical letter report containing pseudo-scan images obtained with the phase one laboratory inspection system. Phase One Deliverable 2: Draft design document containing the requirements and specifications for the phase two engineering prototype system. Phase Two Tasks: Task 5. Fabricate a prototype synthetic aperture array system.

B.3
Task 5 Milestone. Complete assembly of synthetic aperture array system: 6 months after phase two start.
Task 6. Modify the existing AHIS software for compatibility with ultrasound operating frequency, HDC acoustic velocity, array spatial sampling, and data acquisition.
Task 6 Milestone. Develop AHIS modifications for compatibility with the prototype system: 8 months after phase two start.
Task 7. Use the prototype synthetic aperture array system to conduct performance testing on the HDC samples.
Task 7 Milestone. Document the results of the image tests: 10 months after phase two start. Task 8. Project management, technical review meetings, quarterly reports, final letter report and generate a plan for advancing the prototype design to a field deployable HDC DIV tool.
Task 8.1 Milestones. Technical meetings as client requests. Quarterly reports every 3 months. A final report 12 months after phase two start. Task 8.2 Milestone. Develop a plan for field deployable HDC DIV synthetic aperture array system: 12 months after phase two start.
Phase Two Deliverable 1: Technical letter report containing scan images obtained with the phase two engineering prototype inspection system. Phase Two Deliverable 2: Final design document containing the requirements and specifications for the phase two engineering prototype system. Phase Two Deliverable 3: Plan for advancing HDC DIV synthetic aperture array system to a field-deployable system.
6. (For instrumentation projects only) Discussion of opportunities for domestic and/or international field tests, and comments on opportunities for technology transfer (e.g., directly to IAEA, CRADA, or via commercial vendor):
Developing the prototype acoustic synthetic aperture array system and HDC samples provides the IAEA with the capability of conducting simulated tests to evaluate equipment capabilities and to conduct operator training in a simulated environment prior to international field tests. If these prove to be of value to the IAEA, then a field deployable system development plan developed as part of phase two will provide the information that the IAEA needs to either commercialize the technology or will continue working with Pacific Northwest National Laboratory (PNNL) to further the development.
7. Description of past research, including (if applicable) history of funding under NGSI
Safeguards Technology Development subprogram: PNNL performed a series of ultrasound test measurements on normal concrete and HDC samples. The results of these tests demonstrated the feasibility of detecting embedded piping in HDC. PNNL is a leader in ultrasound testing, developing new systems to address client needs and integrating state of the art ultrasound test technologies with advanced image processing technology such as AHIS. Leveraging the technology advances of AHIS used with PNNL-developed radar array systems, it is possible to adapt this to ultrasound testing applications and generate high resolution ultrasound testing images of embedded objects in HDC.

B.4
8. Proposed budget: FY12 Item Cost [k$] Phase 1 tasks 1-4 Task 1: Requirements Definition and Modeling 80 Base tasks1 Task 2: Develop Samples and lab ultrasound test
system 135
Task 3: Perform tests to validate test system 50 Task 4: Project management, reporting, design
document 95
Phase 1 total 360 FY13 Phase 2 tasks 5-8 Task 5: Fabricate prototype array 330 Task 6: Modify imaging software 80 Task 7: Perform tests to validate prototype array 50 Task 8: Project management, reporting, and plan for
field array system 80
Phase 2 total 540 Total base tasks Phase 1&2 900 Expanded tasks2 Total expanded tasks Anticipated FY13 needs3 (assuming base case above) 540 Anticipated FY14 needs3 (assuming base case above) 1 Indicate minimum tasks necessary to conduct proposed project. 2 Indicate additional tasks that could be considered if additional funding becomes available. 3 For informational purposes only; no funding commitments will be made beyond FY12 under this call. 9. Pertinent references:

Appendix C
Proposal for Holographic Radar Imaging


C.1
Appendix C
Proposal for Holographic Radar Imaging
1. Proposed research and development is:
Continuing Project New Project 2. Project category:
Measurement Technology Containment, Surveillance, and Continuity of Knowledge Destructive Analysis for Safeguards Standards and Infrastructure Maintenance and Development Detector Materials for Safeguards Safeguards Data Authentication Safeguards Data Integration Design Information Verification Tools and Methods
3. Lead investigators (no bios necessary) and potential external collaborators: Principal Investigator: Doug McMakin Supporting Investigators: Dave Sheen, Jonathan Tedeschi, and Wayne Lechelt 4. Clear description of safeguards need addressed and implementation path envisioned:
The objective of this work is to develop a field deployable Low Frequency (50 - 200 MHz) holographic radar imaging (HRI) technology that could be readily used by the International Atomic Energy Agency (IAEA) as a design information verification (DIV) tool for objects buried 5 m or deeper. This novel DIV tool could be utilized by IAEA to verify that the construction of declared facilities matches information provided by a state or nation on its design information questionnaire. HRI technology operating at frequencies of 1.0 GHz - 30 GHz is ideally suited for in-wall inspection of low density concrete, wood, wallboard, and other low dielectric barriers for on-site verification that pipes and other concealed infrastructure are properly connected as documented in a facility’s blueprints. The low frequency (100 MHz) HRI system will be designed to address DIV of deep buried (5 m) utilities and transfer lines embedded in concrete or gravel.

C.2
5. Overview of proposed research, including important milestones or deliverables: To conduct deep buried HRI, a low frequency transmitter, receiver, and antenna system design are required. Modeling and simulations will be performed to optimize low frequency antenna design for ground penetration. The 100 MHz transceiver will associate each radio frequency data point with a relative scan position by means of integrating positional encoders on the human transportable system. The volumetric data set collected by transporting the 100 MHz transceiver system (Figure C.1) over the ground surface will be reconstructed into radio frequency images using existing Advanced Holographic Imaging Software (AHIS) modified to operate at 50 - 200 MHz.
Dual Antenna Pushcart
High mobilityAntenna elevation easily adjusted Able to accommodate multiple antenna designsCapable of creating holographic images by scanning a user defined grid
Figure C.1. 100 MHz Human Transportable System Once the low frequency transceiver system has been developed, it will be put through a series of simulated field tests to determine depth of penetration, object detection, and object location. A commercial ground-penetrating radar system will be purchased to analyze and compare to the HRI system developed by Pacific Northwest National Laboratory (PNNL). A deep buried test site will be constructed to conduct these simulated field tests. The test site (Figure C.2) will consist of two buried 1.22-m-diameter PVC pipes. These two large diameter pipes will be buried at a depth of 5 m. One pipe will be filled with water; the other will only contain air. Each pipe will be bedded in three sections of gravel, bare PVC, and concrete. To calibrate the low frequency HRI system, three flat reflecting plates will be buried at different depths. This burial test site will be isolated by plastic liners so environmental factors such as rain can be controlled.

C.3
Figure C.2. Proposed Test Site Task 1. Model antenna design and radio frequency propagation through soil types to optimize depth penetration and minimize radio frequency return clutter. Using the modeling data, develop a transceiver and antenna to deliver maximum power into the soil. Task 1 Milestone. Fabricate 50 - 200 MHz antenna and transceiver based on modeling studies: 4 months After Project Start Date (APSD). Task 2. Develop data acquisition, position, and control subsystem hardware and update AHIS software for holographic data processing. Task 2.1 Milestone. Fabricate and integrate operator/control computer, radio frequency data collection, and antenna position hardware: 6 months APSD.
Task 2.2 Milestone. Perform software updates to current AHIS software controlling scanning, data acquisition, data processing, and image generation consistent with the design of the 100 MHz holographic ground-penetrating imaging system: 7 months APSD.
Task 3. Conduct ground-penetrating holographic imaging studies at the shallow buried test site, 2 m; conduct imaging studies at the deep buried test site, 5 m.
Task 3 Milestone. Testing will be conducted using both the commercial system and the PNNL developed system: 10 months APSD.
Task 4. Project reporting, technical meetings, quarterly status reports, and a final letter report. Task 4 Milestones. Technical meetings as client requests. Quarterly reports every 3 months. A final report 12 months APSD. Task 5. Modify the current HRI array to increase field deploy-ability. Task 5 Milestone- Fieldable HRI array system: 10 months APSD.

C.4
6. (For instrumentation projects only) Discussion of opportunities for domestic and/or international
field tests, and comments on opportunities for technology transfer (e.g., directly to IAEA, CRADA, or via commercial vendor):
Developing the deep buried test site provides the IAEA with the capability to conduct simulated tests to evaluate equipment capabilities and to conduct operator training in a simulated environment prior to international field tests. This provides the IAEA the opportunity to generate conduct of operations procedures and to have their operators verify these procedures prior to deployments. Developing a low frequency HRI system specifically for deep buried objects and comparing it to commercial systems will clarify the technology transfer issues in relation to the maturity of the technologies.
7. Description of past research, including (if applicable) history of funding under NGSI
Safeguards Technology Development subprogram: In FY 11 a HRI array operating at 400 MHz was developed and tested on buried 55-gallon drums. The imaging tests showed promise at buried depths up to 2 m. The size and weight of the array made field testing a difficult proposition in any actual deployment scenarios. To address these shortcomings and increase the depth of penetration, our approach in this proposal is to lower the frequency and consolidate the design to two antennae mounted on a human portable wheeled cart as shown in Figure C.1.
8. Proposed budget: Base tasks1 Item Cost [k$] FY12 Task 1 125 FY12 Task 2 100 FY12 Task 3 75 FY12 Task 4 60 Total base tasks 360 Expanded tasks2 Task 5 100 Line item 2, etc. Total expanded tasks 100 Anticipated FY13 needs3 (assuming base case above) 400 Anticipated FY14 needs3 (assuming base case above) 1 Indicate minimum tasks necessary to conduct proposed project. 2 Indicate additional tasks that could be considered if additional funding becomes available. 3 For informational purposes only; no funding commitments will be made beyond FY12 under this call. 9. Pertinent references:


Related Documents