Clancy-Thompson et al., Supplemental Figure 1 C Supplemental Figure 1: Mice were given intravenous B16 injection on day 0. A) After bearing tumors for the time points indicated, lungs were harvested and mRNA levels of gp100 (normalized to GAPDH) were examined by qPCR. One-way ANOVA (p= 0.0002). B) Correlation between gp100 expression and CXCL9 production. C) Correlation between gp100 expression and CXCL10 production. Solid line represents linear regression.

Clancy-Thompson et al., Supplemental Figure 1 A B C Supplemental Figure 1: Mice were given intravenous B16 injection on day 0. A) After bearing tumors.
Dec 22, 2015
Welcome message from author
This document is posted to help you gain knowledge. Please leave a comment to let me know what you think about it! Share it to your friends and learn new things together.
Transcript
Clancy-Thompson et al., Supplemental Figure 1
A
B C
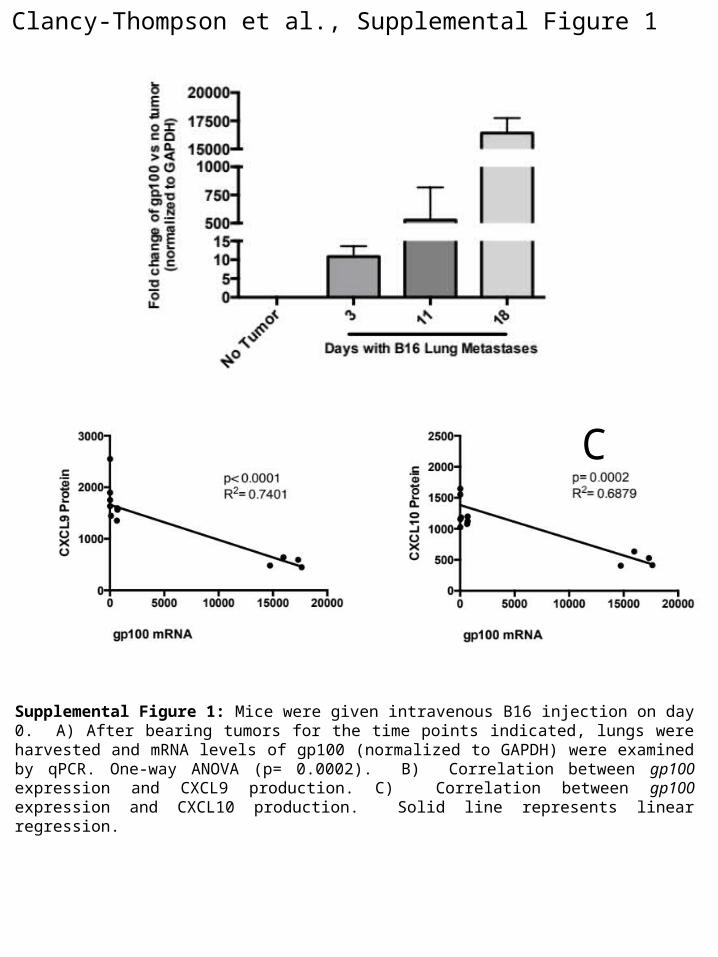
Supplemental Figure 1: Mice were given intravenous B16 injection on day 0. A) After bearing tumors for the time points indicated, lungs were harvested and mRNA levels of gp100 (normalized to GAPDH) were examined by qPCR. One-way ANOVA (p= 0.0002). B) Correlation between gp100 expression and CXCL9 production. C) Correlation between gp100 expression and CXCL10 production. Solid line represents linear regression.

Clancy-Thompson et al., Supplemental Figure 2
A
B
Supplemental Figure 2: Mice were given intravenous B16 injection on day 0. At the time points indicated, mice were sacrificed and lungs assessed for A) CXCL9 protein and B) CXCL10 protein. In all panels, differences were assessed by T-test (**p<0.01).

Clancy-Thompson et al., Supplemental Figure 3
Supplemental Figure 3: Induced Braf/Pten tumors were harvested at 25 days or 40 days post-induction, corresponding to early (~5mm2) or late (~25mm2) tumors. Gene expression was assessed by quantitative PCR using specific primers. Differences were assessed by T-test (*p<0.05, **p<0.01)
Gene Product
Days postTumor Induction
Fo
ld I
nc
rea
se i
n E
xpre
ssi
on
(N
orm
aliz
ed t
o G
AP
DH
)
*
**

Clancy-Thompson et al., Supplemental Figure 4
Supplemental Figure 4: Chemokine production in melanoma. A) CXCL10 production in vitro. 1x10⁵ B16 cells were plated in each well of a 24-well plate. After 24 hours, supernatants were removed and varying concentrations of IFN-g were added (0pg, 500pg, 2500pg, 5000pg). After 24 hours at 37°C/5%CO2, CXCL10 protein concentration was measured from the supernatant by ELISA. Differences were assessed by T-test (*p<0.05, **p<0.01, ****p<0.0001). B) CXCL9 production in situ. CXCL9 was assessed in CD45-CD31-FCShiSSC hi cells (consistent with melanoma cells) from tumor-infiltrated lungs. Differences were assessed by T-test (****p<0.0001).
IFN-g (pg)
A
B

Clancy-Thompson et al., Supplemental Figure 5
A
B
Supplemental Figure 5: Representative gating strategy for extracellular and intracellular staining. A) CXCL9 intracellular staining. B) IFN- g intracellular staining.

Clancy-Thompson et al., Supplemental Figure 6
CXCR
3
CD8
Supplemental Figure 6: Representative flow cytometry of Pmel CD8+ T cells stained for CD8 and CXCR3 after in vitro activation but before adoptive transfer.

Clancy-Thompson et al., Supplemental Figure 7
A
C
B
Supplemental Figure 7: Mice were given intravenous B16 injection on day 0. A-B) On day 3, B6 and IFN-g-/- mice were given 1x10⁶ Pmel CD8+ T cells. A) Pmel CD8+ T cell infiltration in the lung of B6 versus IFN-g-/- mice. B) Pmel CD8+ T cell infiltration of the lung and the spleen of IFN-g-/- mice. C) On day 3, B6 and Rag-/- mice were given 1x10⁶ Pmel or Pmel-CXCR3-/- CD8+ T cells. Shown is Pmel CD8+ T cell infiltration in the spleen. In all panels, differences were assessed by T -test (*p<0.05).

Clancy-Thompson et al., Supplemental Figure 8
A
B
C
Supplemental Figure 8: Splenocytes were harvested from Pmel and Pmel-CXCR3-/- mice. CD8+ T cells were enriched using magnetic separation (Miltenyi). T cells were plated for 24 hours with or without anti-CD3/anti-CD28 activating beads at 37°C/5%CO2. (A) Activated cells were plated at different concentrations with 1x10⁴ B16 cells and incubated for 4 hours at 37°C/5%CO2. Release of LDH (read at 490nm) determined percentage cytotoxicity. B) Activated and unactivated cells were stained for intracellular IFN-g and measured by flow cytometry. C) Activated cells were plated at 5x10⁴ cells/well in transwell plates with 5mM pore membranes with the indicated chemokines (1ng/ml) in the bottom well and antibodies (1mg/ml) in the top well. After 3h incubation at 37°C, migration was assessed using an automated cell counter. In all panels, differences were assessed by T-test (*p<0.05, **p<0.01)
Clancy-Thompson et al., Supplemental Figure 9
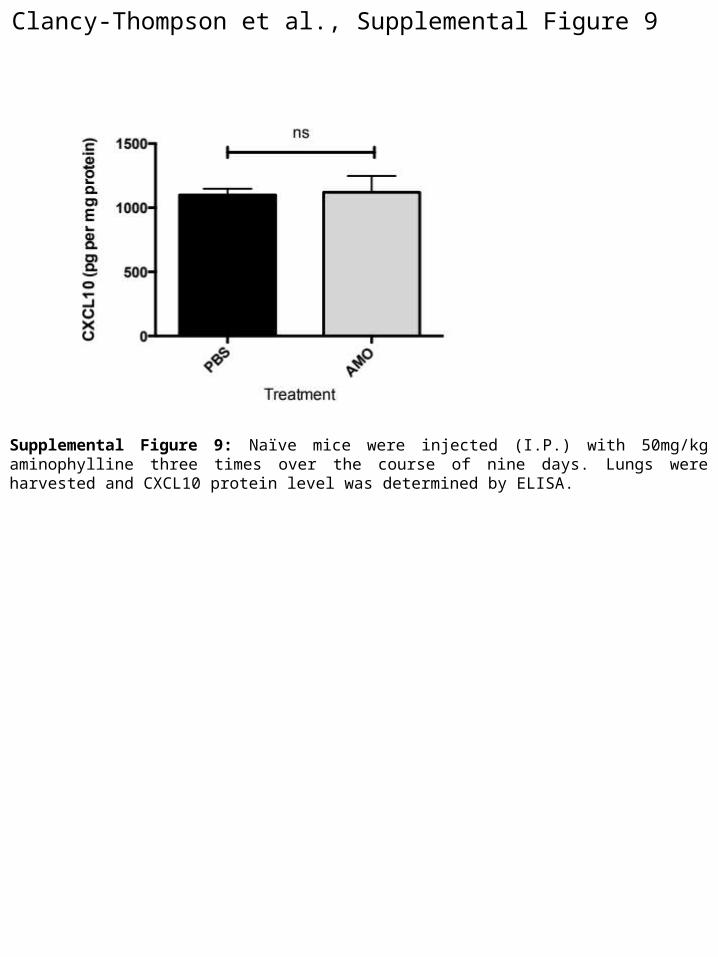
Supplemental Figure 9: Naïve mice were injected (I.P.) with 50mg/kg aminophylline three times over the course of nine days. Lungs were harvested and CXCL10 protein level was determined by ELISA.

Clancy-Thompson et al., Supplemental Figure 10
Supplemental Figure 10: Regulatory T cells in advanced melanomas express CD73. A) Proportion of regulatory (CD4+foxp3+) cells in the CD45+ gate of lungs. B) CD73 expression on CD4+foxp3+ cells.
A
B
CD73
CD4
foxp3
Perc
ent C
D4+ fo
xp3+ c
ells
in C
D45
+ gat
e
Related Documents