Civil Service People Survey 2017 Civil Service benchmark scores November 2017

Welcome message from author
This document is posted to help you gain knowledge. Please leave a comment to let me know what you think about it! Share it to your friends and learn new things together.
Transcript
Civil Service
People Survey 2017
Civil Service benchmark scores
November 2017
Cabinet OfficeCivil Service People Survey 2017: Civil Service benchmark results 2
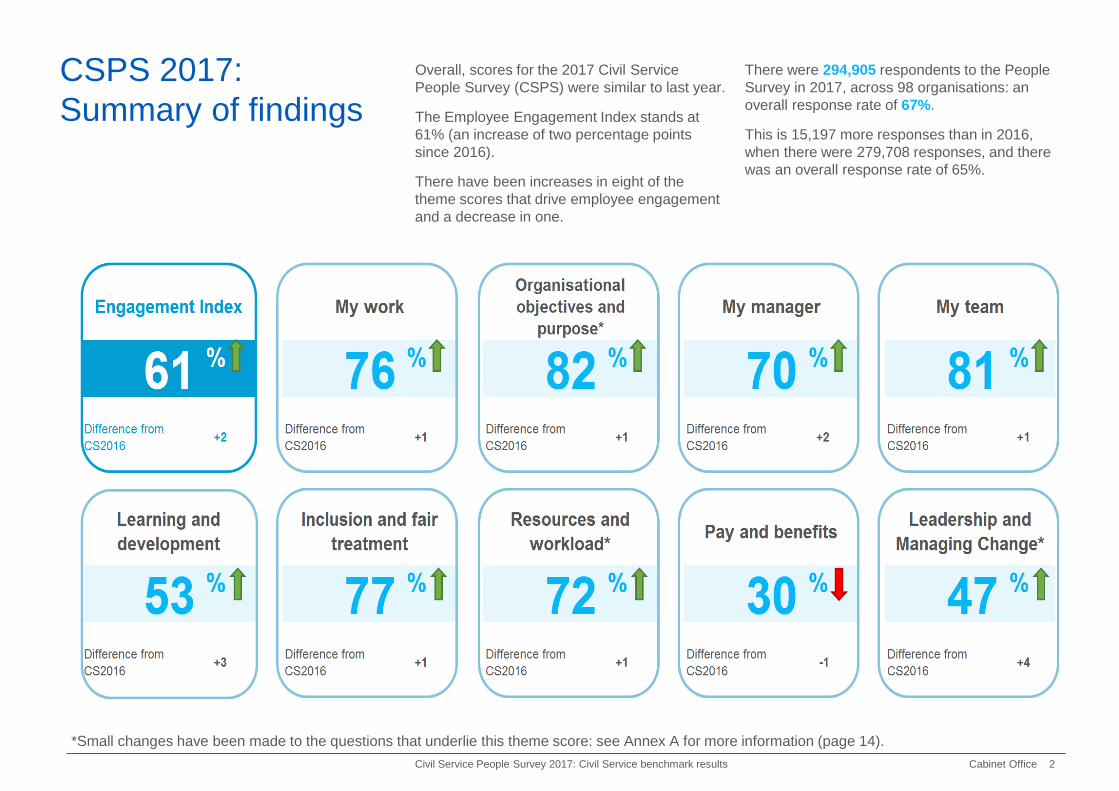
Overall, scores for the 2017 Civil Service
People Survey (CSPS) were similar to last year.
The Employee Engagement Index stands at
61% (an increase of two percentage points
since 2016).
There have been increases in eight of the
theme scores that drive employee engagement
and a decrease in one.
There were 294,905 respondents to the People
Survey in 2017, across 98 organisations: an
overall response rate of 67%.
This is 15,197 more responses than in 2016,
when there were 279,708 responses, and there
was an overall response rate of 65%.
CSPS 2017:
Summary of findings
*Small changes have been made to the questions that underlie this theme score: see Annex A for more information (page 14).
Cabinet OfficeCivil Service People Survey 2017: Civil Service benchmark results 3
Civil Service benchmark score 1 Change in benchmark score 2
2009
2010
2011
2012
2013
2014
2015
2016
2017
’09
to ‘1
0
‘10 t
o ‘1
1
‘11 t
o ‘1
2
‘12 t
o ‘1
3
’13
to ‘1
4
‘14 t
o ‘1
5
‘15 t
o ‘1
6
‘16 t
o ‘
17
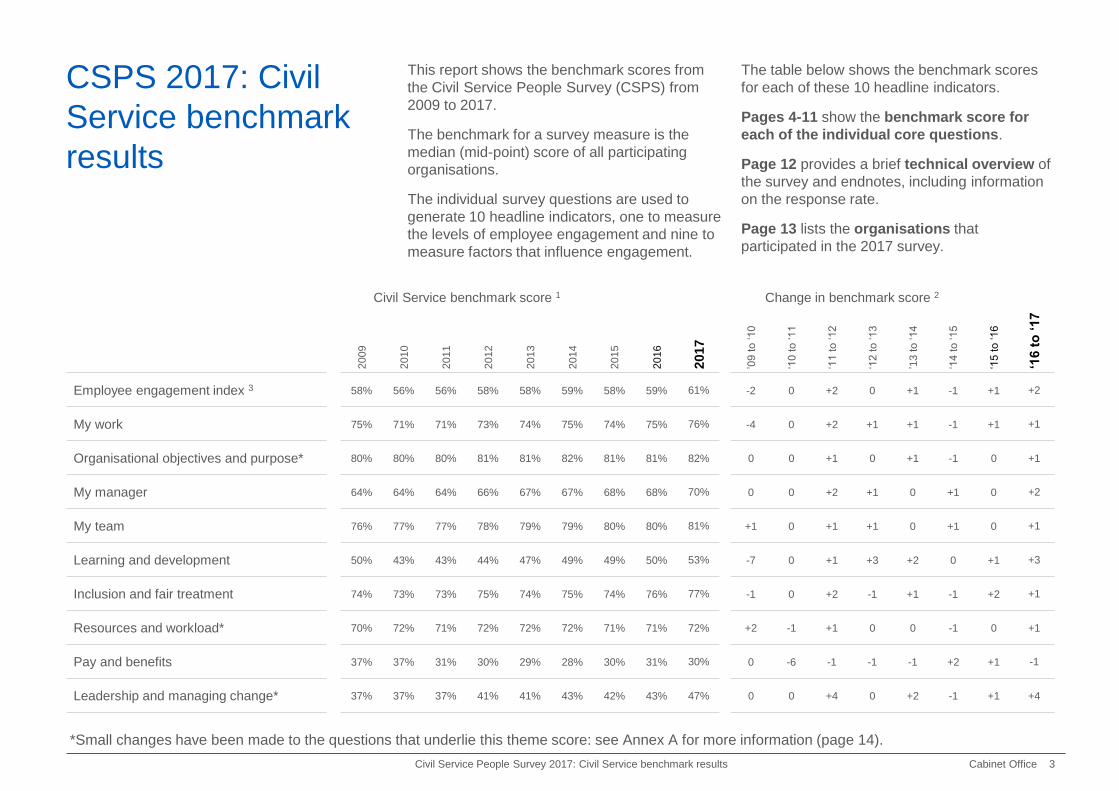
Employee engagement index 3 58% 56% 56% 58% 58% 59% 58% 59% 61% -2 0 +2 0 +1 -1 +1 +2
My work 75% 71% 71% 73% 74% 75% 74% 75% 76% -4 0 +2 +1 +1 -1 +1 +1
Organisational objectives and purpose* 80% 80% 80% 81% 81% 82% 81% 81% 82% 0 0 +1 0 +1 -1 0 +1
My manager 64% 64% 64% 66% 67% 67% 68% 68% 70% 0 0 +2 +1 0 +1 0 +2
My team 76% 77% 77% 78% 79% 79% 80% 80% 81% +1 0 +1 +1 0 +1 0 +1
Learning and development 50% 43% 43% 44% 47% 49% 49% 50% 53% -7 0 +1 +3 +2 0 +1 +3
Inclusion and fair treatment 74% 73% 73% 75% 74% 75% 74% 76% 77% -1 0 +2 -1 +1 -1 +2 +1
Resources and workload* 70% 72% 71% 72% 72% 72% 71% 71% 72% +2 -1 +1 0 0 -1 0 +1
Pay and benefits 37% 37% 31% 30% 29% 28% 30% 31% 30% 0 -6 -1 -1 -1 +2 +1 -1
Leadership and managing change* 37% 37% 37% 41% 41% 43% 42% 43% 47% 0 0 +4 0 +2 -1 +1 +4
This report shows the benchmark scores from
the Civil Service People Survey (CSPS) from
2009 to 2017.
The benchmark for a survey measure is the
median (mid-point) score of all participating
organisations.
The individual survey questions are used to
generate 10 headline indicators, one to measure
the levels of employee engagement and nine to
measure factors that influence engagement.
The table below shows the benchmark scores
for each of these 10 headline indicators.
Pages 4-11 show the benchmark score for
each of the individual core questions.
Page 12 provides a brief technical overview of
the survey and endnotes, including information
on the response rate.
Page 13 lists the organisations that
participated in the 2017 survey.
CSPS 2017: Civil
Service benchmark
results
*Small changes have been made to the questions that underlie this theme score: see Annex A for more information (page 14).
Cabinet OfficeCivil Service People Survey 2017: Civil Service benchmark results 4
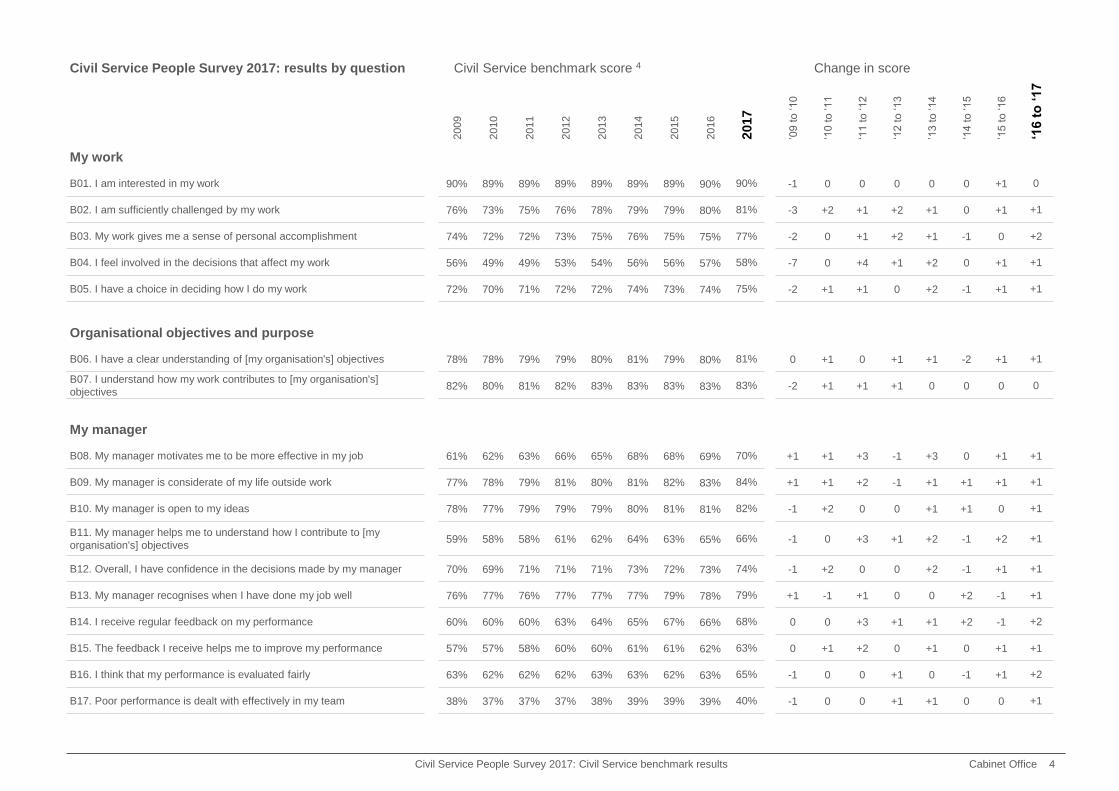
Civil Service People Survey 2017: results by question Civil Service benchmark score 4 Change in score
2009
2010
2011
2012
2013
2014
2015
2016
2017
’09
to ‘1
0
‘10 t
o ‘1
1
‘11 t
o ‘1
2
‘12 t
o ‘1
3
’13 t
o ‘1
4
‘14 t
o ‘1
5
’15 t
o ‘1
6
‘16 t
o ‘
17
My work
B01. I am interested in my work 90% 89% 89% 89% 89% 89% 89% 90% 90% -1 0 0 0 0 0 +1 0
B02. I am sufficiently challenged by my work 76% 73% 75% 76% 78% 79% 79% 80% 81% -3 +2 +1 +2 +1 0 +1 +1
B03. My work gives me a sense of personal accomplishment 74% 72% 72% 73% 75% 76% 75% 75% 77% -2 0 +1 +2 +1 -1 0 +2
B04. I feel involved in the decisions that affect my work 56% 49% 49% 53% 54% 56% 56% 57% 58% -7 0 +4 +1 +2 0 +1 +1
B05. I have a choice in deciding how I do my work 72% 70% 71% 72% 72% 74% 73% 74% 75% -2 +1 +1 0 +2 -1 +1 +1
Organisational objectives and purpose
B06. I have a clear understanding of [my organisation's] objectives 78% 78% 79% 79% 80% 81% 79% 80% 81% 0 +1 0 +1 +1 -2 +1 +1
B07. I understand how my work contributes to [my organisation's]
objectives82% 80% 81% 82% 83% 83% 83% 83% 83% -2 +1 +1 +1 0 0 0 0
My manager
B08. My manager motivates me to be more effective in my job 61% 62% 63% 66% 65% 68% 68% 69% 70% +1 +1 +3 -1 +3 0 +1 +1
B09. My manager is considerate of my life outside work 77% 78% 79% 81% 80% 81% 82% 83% 84% +1 +1 +2 -1 +1 +1 +1 +1
B10. My manager is open to my ideas 78% 77% 79% 79% 79% 80% 81% 81% 82% -1 +2 0 0 +1 +1 0 +1
B11. My manager helps me to understand how I contribute to [my
organisation's] objectives59% 58% 58% 61% 62% 64% 63% 65% 66% -1 0 +3 +1 +2 -1 +2 +1
B12. Overall, I have confidence in the decisions made by my manager 70% 69% 71% 71% 71% 73% 72% 73% 74% -1 +2 0 0 +2 -1 +1 +1
B13. My manager recognises when I have done my job well 76% 77% 76% 77% 77% 77% 79% 78% 79% +1 -1 +1 0 0 +2 -1 +1
B14. I receive regular feedback on my performance 60% 60% 60% 63% 64% 65% 67% 66% 68% 0 0 +3 +1 +1 +2 -1 +2
B15. The feedback I receive helps me to improve my performance 57% 57% 58% 60% 60% 61% 61% 62% 63% 0 +1 +2 0 +1 0 +1 +1
B16. I think that my performance is evaluated fairly 63% 62% 62% 62% 63% 63% 62% 63% 65% -1 0 0 +1 0 -1 +1 +2
B17. Poor performance is dealt with effectively in my team 38% 37% 37% 37% 38% 39% 39% 39% 40% -1 0 0 +1 +1 0 0 +1
Cabinet OfficeCivil Service People Survey 2017: Civil Service benchmark results 5
Civil Service People Survey 2017: results by question Civil Service benchmark score Change in score
2009
2010
2011
2012
2013
2014
2015
2016
2017
’09
to ‘1
0
‘10 t
o ‘1
1
‘11 t
o ‘1
2
‘12 t
o ‘1
3
‘13 t
o ’1
4
‘14 t
o ‘1
5
‘15 t
o ‘1
6
‘16 t
o 1
7
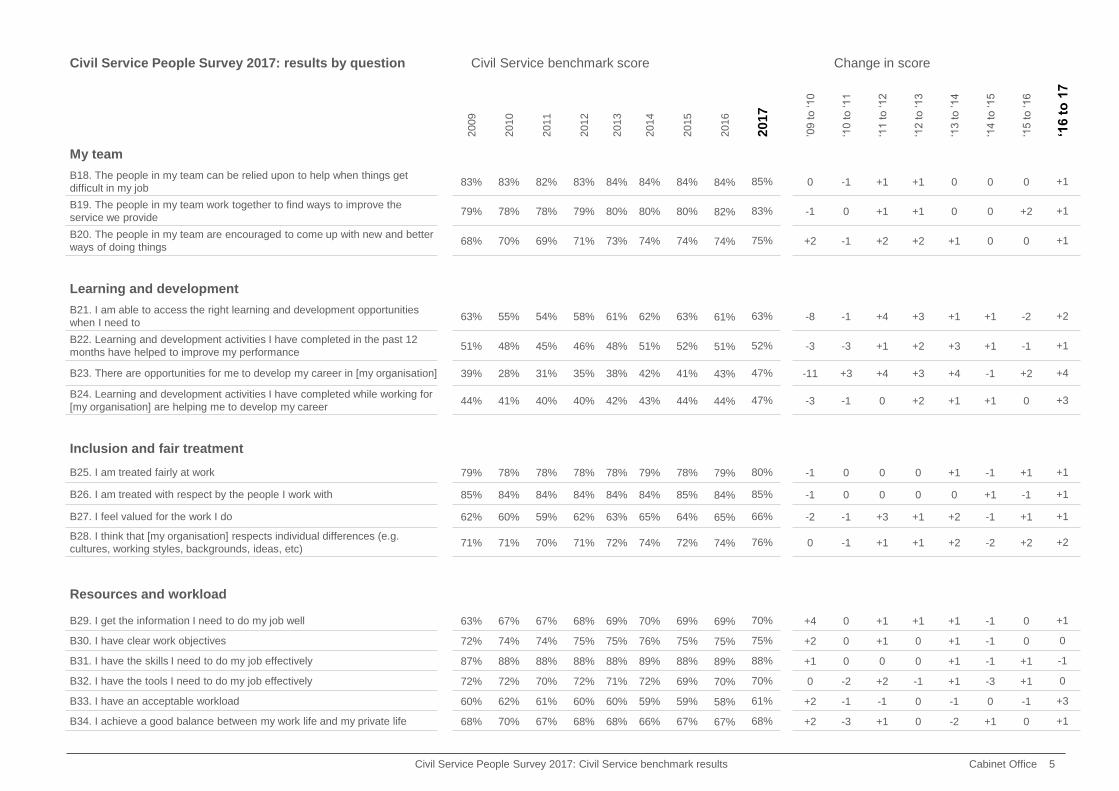
My team
B18. The people in my team can be relied upon to help when things get
difficult in my job83% 83% 82% 83% 84% 84% 84% 84% 85% 0 -1 +1 +1 0 0 0 +1
B19. The people in my team work together to find ways to improve the
service we provide79% 78% 78% 79% 80% 80% 80% 82% 83% -1 0 +1 +1 0 0 +2 +1
B20. The people in my team are encouraged to come up with new and better
ways of doing things68% 70% 69% 71% 73% 74% 74% 74% 75% +2 -1 +2 +2 +1 0 0 +1
Learning and development
B21. I am able to access the right learning and development opportunities
when I need to63% 55% 54% 58% 61% 62% 63% 61% 63% -8 -1 +4 +3 +1 +1 -2 +2
B22. Learning and development activities I have completed in the past 12
months have helped to improve my performance51% 48% 45% 46% 48% 51% 52% 51% 52% -3 -3 +1 +2 +3 +1 -1 +1
B23. There are opportunities for me to develop my career in [my organisation] 39% 28% 31% 35% 38% 42% 41% 43% 47% -11 +3 +4 +3 +4 -1 +2 +4
B24. Learning and development activities I have completed while working for
[my organisation] are helping me to develop my career44% 41% 40% 40% 42% 43% 44% 44% 47% -3 -1 0 +2 +1 +1 0 +3
Inclusion and fair treatment
B25. I am treated fairly at work 79% 78% 78% 78% 78% 79% 78% 79% 80% -1 0 0 0 +1 -1 +1 +1
B26. I am treated with respect by the people I work with 85% 84% 84% 84% 84% 84% 85% 84% 85% -1 0 0 0 0 +1 -1 +1
B27. I feel valued for the work I do 62% 60% 59% 62% 63% 65% 64% 65% 66% -2 -1 +3 +1 +2 -1 +1 +1
B28. I think that [my organisation] respects individual differences (e.g.
cultures, working styles, backgrounds, ideas, etc) 71% 71% 70% 71% 72% 74% 72% 74% 76% 0 -1 +1 +1 +2 -2 +2 +2
Resources and workload
B29. I get the information I need to do my job well 63% 67% 67% 68% 69% 70% 69% 69% 70% +4 0 +1 +1 +1 -1 0 +1
B30. I have clear work objectives 72% 74% 74% 75% 75% 76% 75% 75% 75% +2 0 +1 0 +1 -1 0 0
B31. I have the skills I need to do my job effectively 87% 88% 88% 88% 88% 89% 88% 89% 88% +1 0 0 0 +1 -1 +1 -1
B32. I have the tools I need to do my job effectively 72% 72% 70% 72% 71% 72% 69% 70% 70% 0 -2 +2 -1 +1 -3 +1 0
B33. I have an acceptable workload 60% 62% 61% 60% 60% 59% 59% 58% 61% +2 -1 -1 0 -1 0 -1 +3
B34. I achieve a good balance between my work life and my private life 68% 70% 67% 68% 68% 66% 67% 67% 68% +2 -3 +1 0 -2 +1 0 +1
Cabinet OfficeCivil Service People Survey 2017: Civil Service benchmark results 6
Civil Service People Survey 2017: results by question Civil Service benchmark score Change in score
2009
2010
2011
2012
2013
2014
2015
2016
2017
’09
to ‘1
0
‘10 t
o ‘1
1
‘11 t
o ‘1
2
‘12 t
o ‘1
3
‘13 t
o ‘1
4
‘14 t
o ‘1
5
’15 t
o ‘1
6
‘16 t
o ‘
17
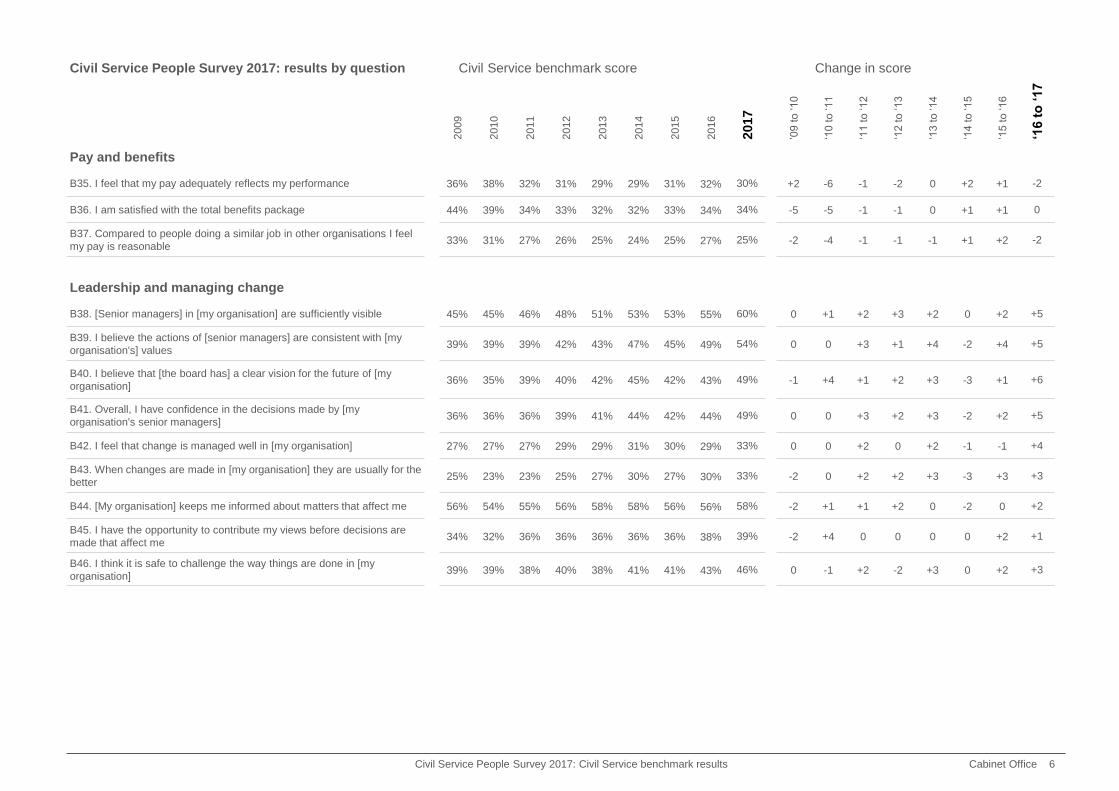
Pay and benefits
B35. I feel that my pay adequately reflects my performance 36% 38% 32% 31% 29% 29% 31% 32% 30% +2 -6 -1 -2 0 +2 +1 -2
B36. I am satisfied with the total benefits package 44% 39% 34% 33% 32% 32% 33% 34% 34% -5 -5 -1 -1 0 +1 +1 0
B37. Compared to people doing a similar job in other organisations I feel
my pay is reasonable33% 31% 27% 26% 25% 24% 25% 27% 25% -2 -4 -1 -1 -1 +1 +2 -2
Leadership and managing change
B38. [Senior managers] in [my organisation] are sufficiently visible 45% 45% 46% 48% 51% 53% 53% 55% 60% 0 +1 +2 +3 +2 0 +2 +5
B39. I believe the actions of [senior managers] are consistent with [my
organisation's] values39% 39% 39% 42% 43% 47% 45% 49% 54% 0 0 +3 +1 +4 -2 +4 +5
B40. I believe that [the board has] a clear vision for the future of [my
organisation]36% 35% 39% 40% 42% 45% 42% 43% 49% -1 +4 +1 +2 +3 -3 +1 +6
B41. Overall, I have confidence in the decisions made by [my
organisation's senior managers]36% 36% 36% 39% 41% 44% 42% 44% 49% 0 0 +3 +2 +3 -2 +2 +5
B42. I feel that change is managed well in [my organisation] 27% 27% 27% 29% 29% 31% 30% 29% 33% 0 0 +2 0 +2 -1 -1 +4
B43. When changes are made in [my organisation] they are usually for the
better25% 23% 23% 25% 27% 30% 27% 30% 33% -2 0 +2 +2 +3 -3 +3 +3
B44. [My organisation] keeps me informed about matters that affect me 56% 54% 55% 56% 58% 58% 56% 56% 58% -2 +1 +1 +2 0 -2 0 +2
B45. I have the opportunity to contribute my views before decisions are
made that affect me34% 32% 36% 36% 36% 36% 36% 38% 39% -2 +4 0 0 0 0 +2 +1
B46. I think it is safe to challenge the way things are done in [my
organisation]39% 39% 38% 40% 38% 41% 41% 43% 46% 0 -1 +2 -2 +3 0 +2 +3
Cabinet OfficeCivil Service People Survey 2017: Civil Service benchmark results 7
Civil Service People Survey 2017: results by question Civil Service benchmark score Change in score
2009
2010
2011
2012
2013
2014
2015
2016
2017
’09
to ‘1
0
‘10 t
o ‘1
1
‘11 t
o ‘1
2
‘12 t
o ‘1
3
‘13 t
o ‘1
4
‘14 t
o ‘1
5
’15 t
o ‘1
6
‘16 t
o ‘
17
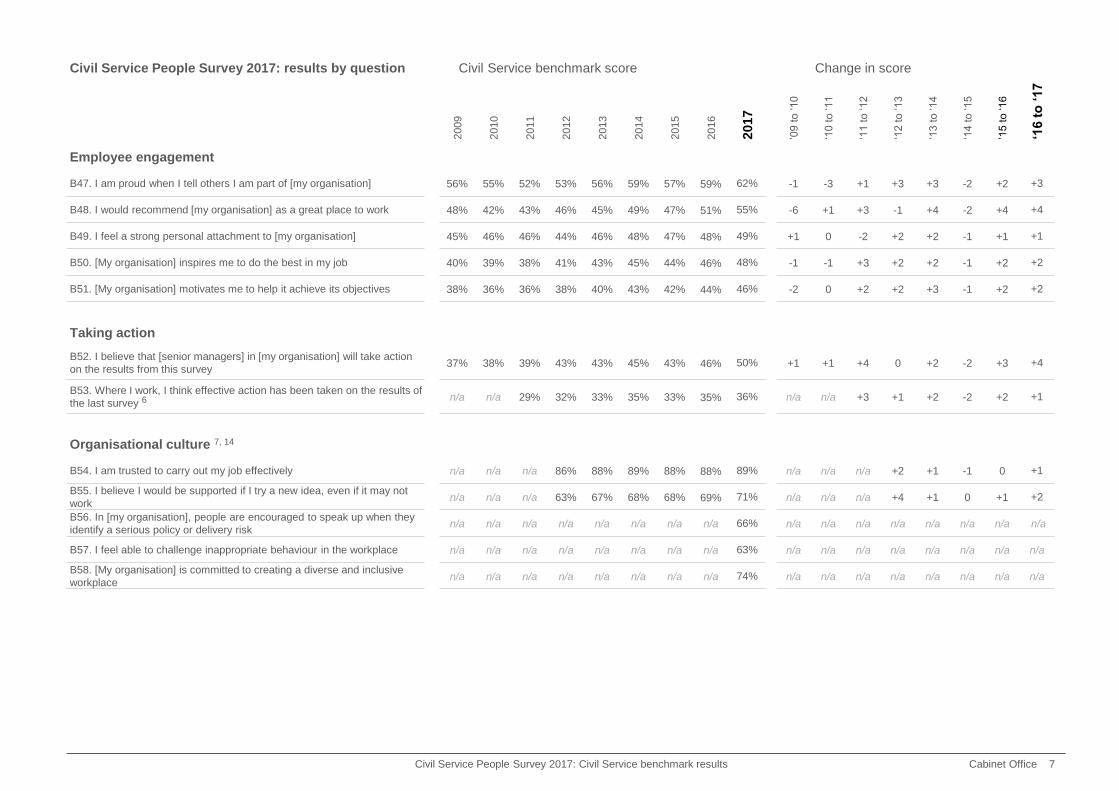
Employee engagement
B47. I am proud when I tell others I am part of [my organisation] 56% 55% 52% 53% 56% 59% 57% 59% 62% -1 -3 +1 +3 +3 -2 +2 +3
B48. I would recommend [my organisation] as a great place to work 48% 42% 43% 46% 45% 49% 47% 51% 55% -6 +1 +3 -1 +4 -2 +4 +4
B49. I feel a strong personal attachment to [my organisation] 45% 46% 46% 44% 46% 48% 47% 48% 49% +1 0 -2 +2 +2 -1 +1 +1
B50. [My organisation] inspires me to do the best in my job 40% 39% 38% 41% 43% 45% 44% 46% 48% -1 -1 +3 +2 +2 -1 +2 +2
B51. [My organisation] motivates me to help it achieve its objectives 38% 36% 36% 38% 40% 43% 42% 44% 46% -2 0 +2 +2 +3 -1 +2 +2
Taking action
B52. I believe that [senior managers] in [my organisation] will take action
on the results from this survey37% 38% 39% 43% 43% 45% 43% 46% 50% +1 +1 +4 0 +2 -2 +3 +4
B53. Where I work, I think effective action has been taken on the results of
the last survey 6n/a n/a 29% 32% 33% 35% 33% 35% 36% n/a n/a +3 +1 +2 -2 +2 +1
Organisational culture 7, 14
B54. I am trusted to carry out my job effectively n/a n/a n/a 86% 88% 89% 88% 88% 89% n/a n/a n/a +2 +1 -1 0 +1
B55. I believe I would be supported if I try a new idea, even if it may not
workn/a n/a n/a 63% 67% 68% 68% 69% 71% n/a n/a n/a +4 +1 0 +1 +2
B56. In [my organisation], people are encouraged to speak up when they
identify a serious policy or delivery riskn/a n/a n/a n/a n/a n/a n/a n/a 66% n/a n/a n/a n/a n/a n/a n/a n/a
B57. I feel able to challenge inappropriate behaviour in the workplace n/a n/a n/a n/a n/a n/a n/a n/a 63% n/a n/a n/a n/a n/a n/a n/a n/a
B58. [My organisation] is committed to creating a diverse and inclusive
workplacen/a n/a n/a n/a n/a n/a n/a n/a 74% n/a n/a n/a n/a n/a n/a n/a n/a
Cabinet OfficeCivil Service People Survey 2017: Civil Service benchmark results 8
Civil Service People Survey 2017: results by question Civil Service benchmark score Change in score
2009
2010
2011
2012
2013
2014
2015
2016
2017
’09
to ‘1
0
‘10 t
o ‘1
1
‘11 t
o ‘1
2
‘12 t
o ‘1
3
‘13 t
o ‘1
4
‘14 t
o ‘1
5
’15 t
o ‘1
6
‘16 t
o ‘
17
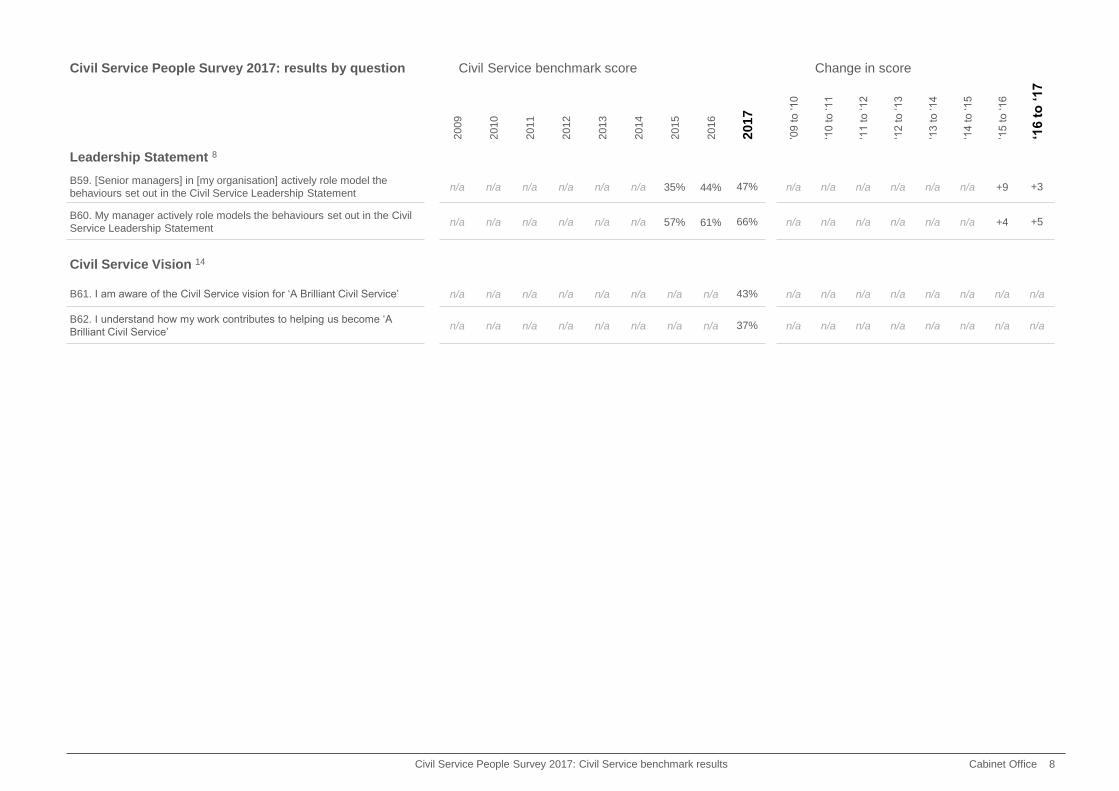
Leadership Statement 8
B59. [Senior managers] in [my organisation] actively role model the
behaviours set out in the Civil Service Leadership Statementn/a n/a n/a n/a n/a n/a 35% 44% 47% n/a n/a n/a n/a n/a n/a +9 +3
B60. My manager actively role models the behaviours set out in the Civil
Service Leadership Statementn/a n/a n/a n/a n/a n/a 57% 61% 66% n/a n/a n/a n/a n/a n/a +4 +5
Civil Service Vision 14
B61. I am aware of the Civil Service vision for ‘A Brilliant Civil Service’ n/a n/a n/a n/a n/a n/a n/a n/a 43% n/a n/a n/a n/a n/a n/a n/a n/a
B62. I understand how my work contributes to helping us become ‘A
Brilliant Civil Service’n/a n/a n/a n/a n/a n/a n/a n/a 37% n/a n/a n/a n/a n/a n/a n/a n/a
Cabinet OfficeCivil Service People Survey 2017: Civil Service benchmark results 9
Civil Service People Survey 2017: results by question Civil Service benchmark score Change in index score
2009
2010
2011
2012
2013
2014
2015
2016
2017
’09
to ‘1
0
‘10 t
o ‘1
1
‘11 t
o ‘1
2
‘12 t
o ‘1
3
‘13 t
o ‘1
4
‘14 t
o ‘1
5
‘15 t
o ‘1
6
‘16 t
o ‘
17
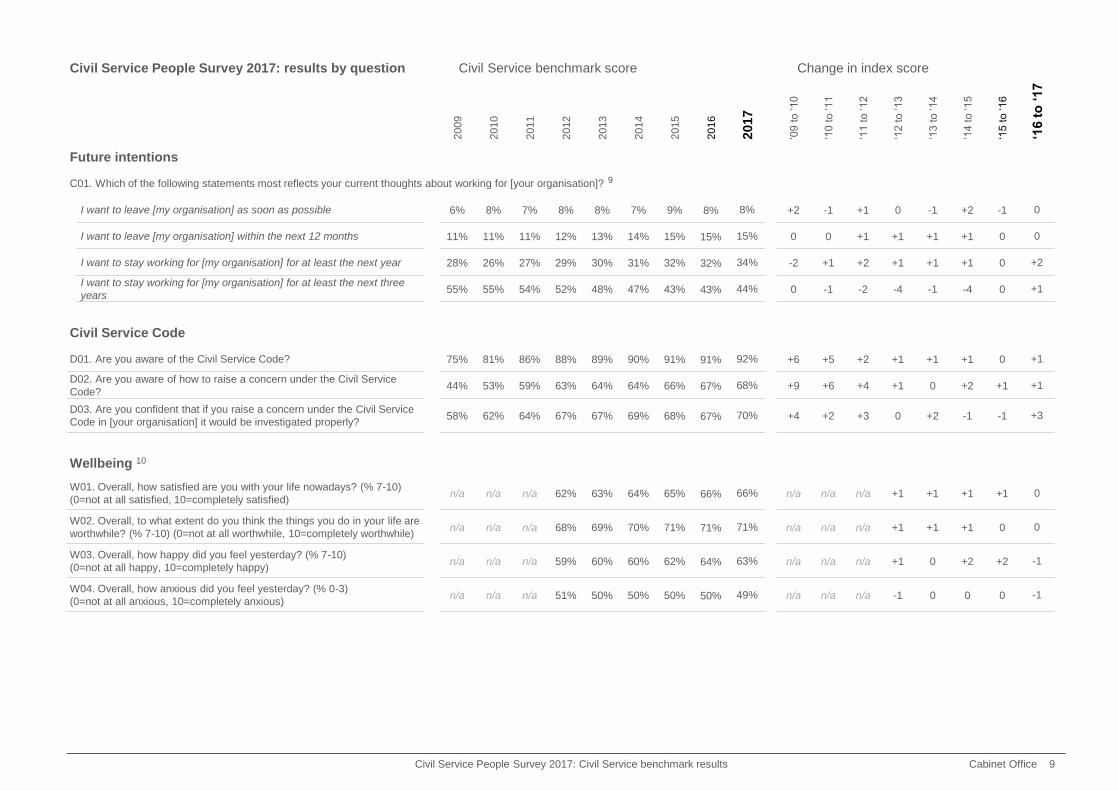
Future intentions
C01. Which of the following statements most reflects your current thoughts about working for [your organisation]? 9
I want to leave [my organisation] as soon as possible 6% 8% 7% 8% 8% 7% 9% 8% 8% +2 -1 +1 0 -1 +2 -1 0
I want to leave [my organisation] within the next 12 months 11% 11% 11% 12% 13% 14% 15% 15% 15% 0 0 +1 +1 +1 +1 0 0
I want to stay working for [my organisation] for at least the next year 28% 26% 27% 29% 30% 31% 32% 32% 34% -2 +1 +2 +1 +1 +1 0 +2
I want to stay working for [my organisation] for at least the next three
years55% 55% 54% 52% 48% 47% 43% 43% 44% 0 -1 -2 -4 -1 -4 0 +1
Civil Service Code
D01. Are you aware of the Civil Service Code? 75% 81% 86% 88% 89% 90% 91% 91% 92% +6 +5 +2 +1 +1 +1 0 +1
D02. Are you aware of how to raise a concern under the Civil Service
Code?44% 53% 59% 63% 64% 64% 66% 67% 68% +9 +6 +4 +1 0 +2 +1 +1
D03. Are you confident that if you raise a concern under the Civil Service
Code in [your organisation] it would be investigated properly?58% 62% 64% 67% 67% 69% 68% 67% 70% +4 +2 +3 0 +2 -1 -1 +3
Wellbeing 10
W01. Overall, how satisfied are you with your life nowadays? (% 7-10)
(0=not at all satisfied, 10=completely satisfied)n/a n/a n/a 62% 63% 64% 65% 66% 66% n/a n/a n/a +1 +1 +1 +1 0
W02. Overall, to what extent do you think the things you do in your life are
worthwhile? (% 7-10) (0=not at all worthwhile, 10=completely worthwhile)n/a n/a n/a 68% 69% 70% 71% 71% 71% n/a n/a n/a +1 +1 +1 0 0
W03. Overall, how happy did you feel yesterday? (% 7-10)
(0=not at all happy, 10=completely happy)n/a n/a n/a 59% 60% 60% 62% 64% 63% n/a n/a n/a +1 0 +2 +2 -1
W04. Overall, how anxious did you feel yesterday? (% 0-3)
(0=not at all anxious, 10=completely anxious)n/a n/a n/a 51% 50% 50% 50% 50% 49% n/a n/a n/a -1 0 0 0 -1
Cabinet OfficeCivil Service People Survey 2017: Civil Service benchmark results 10
Civil Service People Survey 2017: results by question Civil Service benchmark score Change in index score
2009
2010
2011
2012
2013
2014
2015
2016
2017
’09
to ‘1
0
‘10 t
o ‘1
1
‘11 t
o ‘1
2
‘12 t
o ‘1
3
‘13 t
o ’1
4
‘14 t
o ‘1
5
’15 t
o ‘1
6
‘16 t
o ‘
17
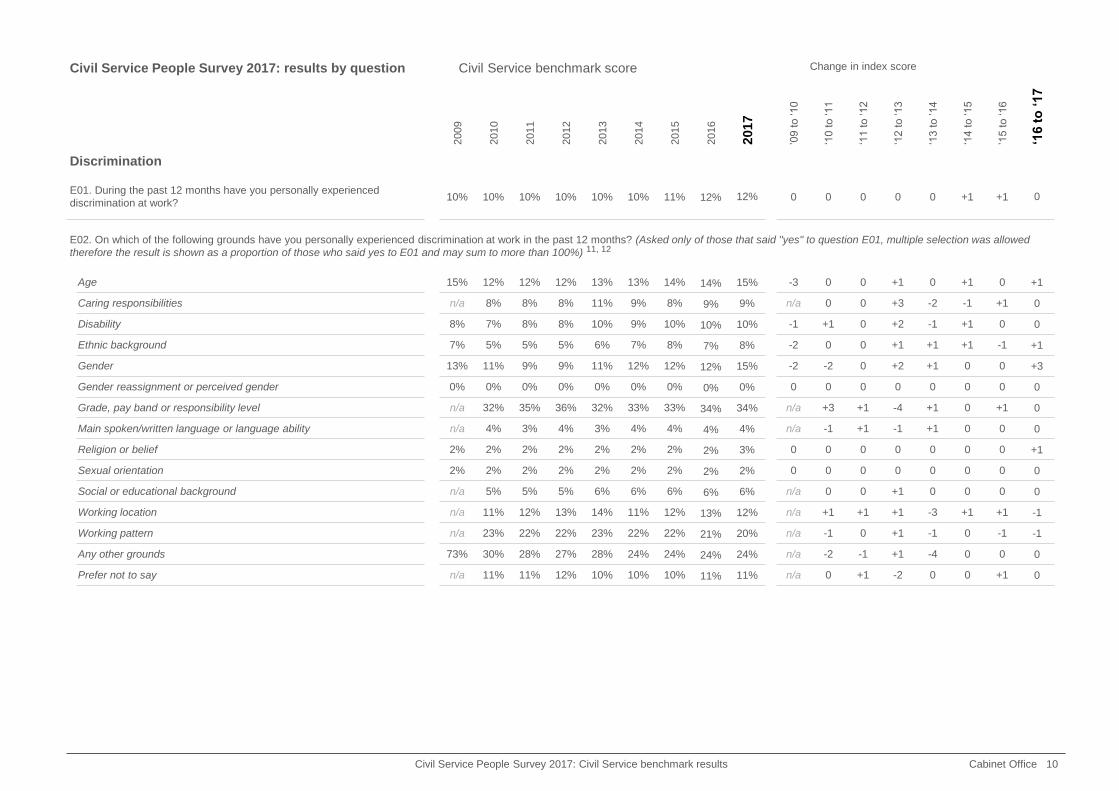
Discrimination
E01. During the past 12 months have you personally experienced
discrimination at work?10% 10% 10% 10% 10% 10% 11% 12% 12% 0 0 0 0 0 +1 +1 0
E02. On which of the following grounds have you personally experienced discrimination at work in the past 12 months? (Asked only of those that said "yes" to question E01, multiple selection was allowed
therefore the result is shown as a proportion of those who said yes to E01 and may sum to more than 100%) 11, 12
Age 15% 12% 12% 12% 13% 13% 14% 14% 15% -3 0 0 +1 0 +1 0 +1
Caring responsibilities n/a 8% 8% 8% 11% 9% 8% 9% 9% n/a 0 0 +3 -2 -1 +1 0
Disability 8% 7% 8% 8% 10% 9% 10% 10% 10% -1 +1 0 +2 -1 +1 0 0
Ethnic background 7% 5% 5% 5% 6% 7% 8% 7% 8% -2 0 0 +1 +1 +1 -1 +1
Gender 13% 11% 9% 9% 11% 12% 12% 12% 15% -2 -2 0 +2 +1 0 0 +3
Gender reassignment or perceived gender 0% 0% 0% 0% 0% 0% 0% 0% 0% 0 0 0 0 0 0 0 0
Grade, pay band or responsibility level n/a 32% 35% 36% 32% 33% 33% 34% 34% n/a +3 +1 -4 +1 0 +1 0
Main spoken/written language or language ability n/a 4% 3% 4% 3% 4% 4% 4% 4% n/a -1 +1 -1 +1 0 0 0
Religion or belief 2% 2% 2% 2% 2% 2% 2% 2% 3% 0 0 0 0 0 0 0 +1
Sexual orientation 2% 2% 2% 2% 2% 2% 2% 2% 2% 0 0 0 0 0 0 0 0
Social or educational background n/a 5% 5% 5% 6% 6% 6% 6% 6% n/a 0 0 +1 0 0 0 0
Working location n/a 11% 12% 13% 14% 11% 12% 13% 12% n/a +1 +1 +1 -3 +1 +1 -1
Working pattern n/a 23% 22% 22% 23% 22% 22% 21% 20% n/a -1 0 +1 -1 0 -1 -1
Any other grounds 73% 30% 28% 27% 28% 24% 24% 24% 24% n/a -2 -1 +1 -4 0 0 0
Prefer not to say n/a 11% 11% 12% 10% 10% 10% 11% 11% n/a 0 +1 -2 0 0 +1 0
Cabinet OfficeCivil Service People Survey 2017: Civil Service benchmark results 11
Civil Service People Survey 2017: results by question Civil Service benchmark score Change in index score
2009
2010
2011
2012
2013
2014
2015
2016
2017
’09
to ‘1
0
‘10 t
o ‘1
1
‘11 t
o ‘1
2
‘12 t
o ‘1
3
‘13 t
o ’1
4
‘14 t
o ‘1
5
’15 t
o ‘1
6
‘16 t
o ‘
17
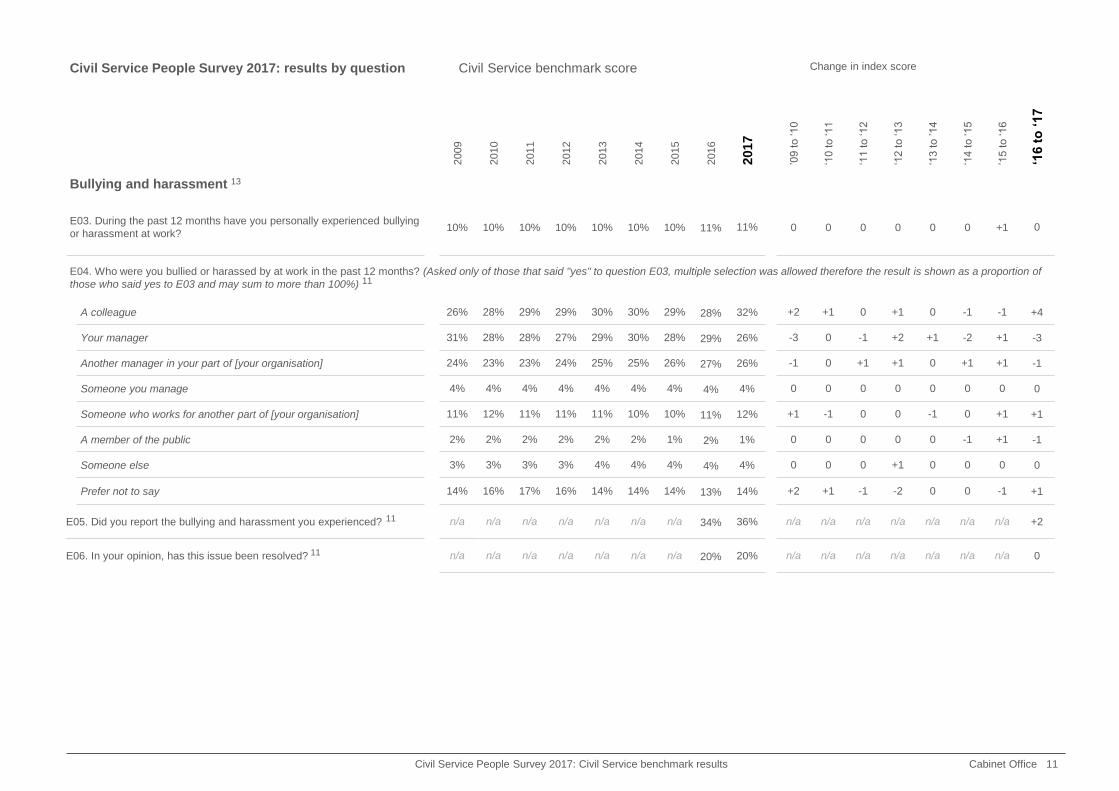
Bullying and harassment 13
E03. During the past 12 months have you personally experienced bullying
or harassment at work?10% 10% 10% 10% 10% 10% 10% 11% 11% 0 0 0 0 0 0 +1 0
E04. Who were you bullied or harassed by at work in the past 12 months? (Asked only of those that said "yes" to question E03, multiple selection was allowed therefore the result is shown as a proportion of
those who said yes to E03 and may sum to more than 100%) 11
A colleague 26% 28% 29% 29% 30% 30% 29% 28% 32% +2 +1 0 +1 0 -1 -1 +4
Your manager 31% 28% 28% 27% 29% 30% 28% 29% 26% -3 0 -1 +2 +1 -2 +1 -3
Another manager in your part of [your organisation] 24% 23% 23% 24% 25% 25% 26% 27% 26% -1 0 +1 +1 0 +1 +1 -1
Someone you manage 4% 4% 4% 4% 4% 4% 4% 4% 4% 0 0 0 0 0 0 0 0
Someone who works for another part of [your organisation] 11% 12% 11% 11% 11% 10% 10% 11% 12% +1 -1 0 0 -1 0 +1 +1
A member of the public 2% 2% 2% 2% 2% 2% 1% 2% 1% 0 0 0 0 0 -1 +1 -1
Someone else 3% 3% 3% 3% 4% 4% 4% 4% 4% 0 0 0 +1 0 0 0 0
Prefer not to say 14% 16% 17% 16% 14% 14% 14% 13% 14% +2 +1 -1 -2 0 0 -1 +1
E05. Did you report the bullying and harassment you experienced? 11 n/a n/a n/a n/a n/a n/a n/a 34% 36% n/a n/a n/a n/a n/a n/a n/a +2
E06. In your opinion, has this issue been resolved? 11 n/a n/a n/a n/a n/a n/a n/a 20% 20% n/a n/a n/a n/a n/a n/a n/a 0
Cabinet Office
Technical
notes
Civil Service People Survey 2017: Civil Service benchmark results 12
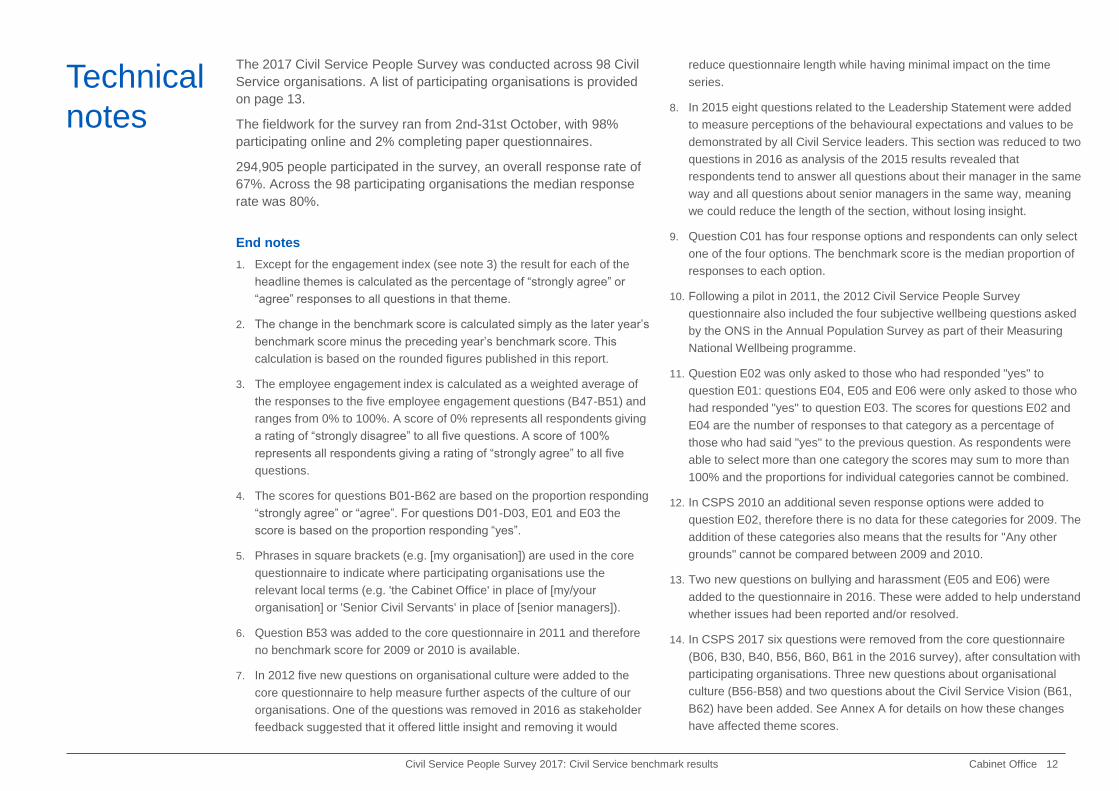
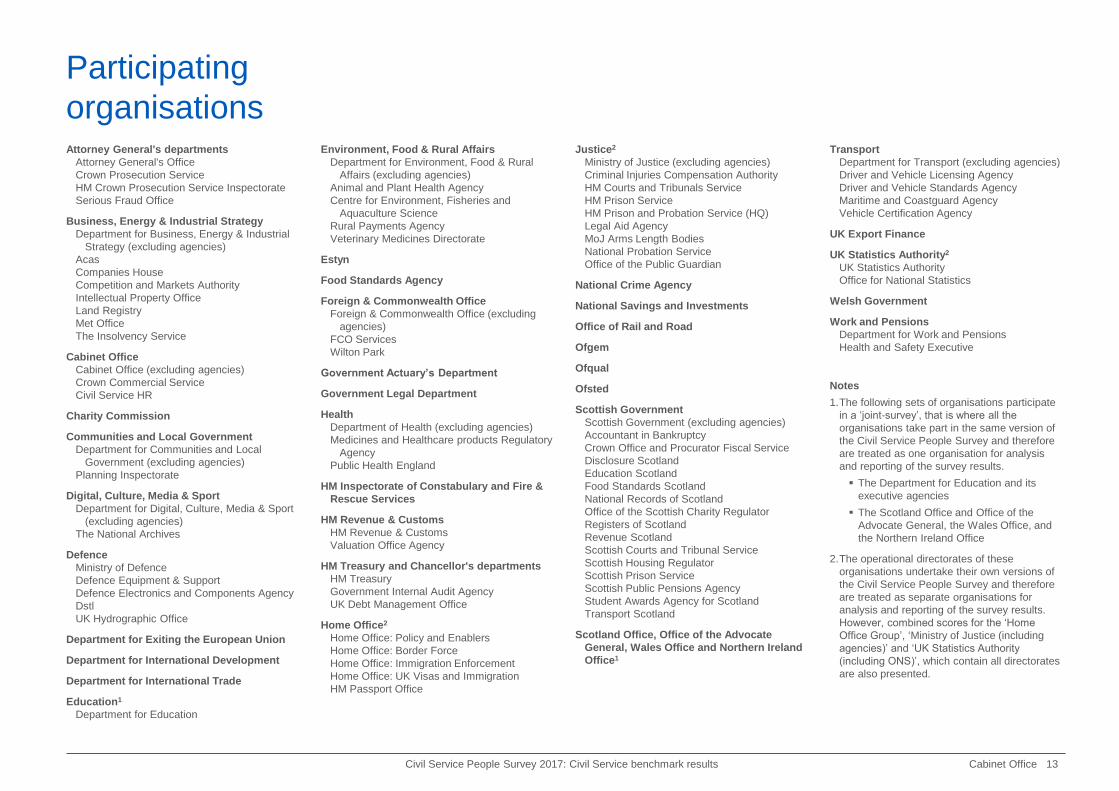
The 2017 Civil Service People Survey was conducted across 98 Civil
Service organisations. A list of participating organisations is provided
on page 13.
The fieldwork for the survey ran from 2nd-31st October, with 98%
participating online and 2% completing paper questionnaires.
294,905 people participated in the survey, an overall response rate of
67%. Across the 98 participating organisations the median response
rate was 80%.
End notes
1. Except for the engagement index (see note 3) the result for each of the
headline themes is calculated as the percentage of “strongly agree” or
“agree” responses to all questions in that theme.
2. The change in the benchmark score is calculated simply as the later year’s
benchmark score minus the preceding year’s benchmark score. This
calculation is based on the rounded figures published in this report.
3. The employee engagement index is calculated as a weighted average of
the responses to the five employee engagement questions (B47-B51) and
ranges from 0% to 100%. A score of 0% represents all respondents giving
a rating of “strongly disagree” to all five questions. A score of 100%
represents all respondents giving a rating of “strongly agree” to all five
questions.
4. The scores for questions B01-B62 are based on the proportion responding
“strongly agree” or “agree”. For questions D01-D03, E01 and E03 the
score is based on the proportion responding “yes”.
5. Phrases in square brackets (e.g. [my organisation]) are used in the core
questionnaire to indicate where participating organisations use the
relevant local terms (e.g. 'the Cabinet Office' in place of [my/your
organisation] or 'Senior Civil Servants' in place of [senior managers]).
6. Question B53 was added to the core questionnaire in 2011 and therefore
no benchmark score for 2009 or 2010 is available.
7. In 2012 five new questions on organisational culture were added to the
core questionnaire to help measure further aspects of the culture of our
organisations. One of the questions was removed in 2016 as stakeholder
feedback suggested that it offered little insight and removing it would
reduce questionnaire length while having minimal impact on the time
series.
8. In 2015 eight questions related to the Leadership Statement were added
to measure perceptions of the behavioural expectations and values to be
demonstrated by all Civil Service leaders. This section was reduced to two
questions in 2016 as analysis of the 2015 results revealed that
respondents tend to answer all questions about their manager in the same
way and all questions about senior managers in the same way, meaning
we could reduce the length of the section, without losing insight.
9. Question C01 has four response options and respondents can only select
one of the four options. The benchmark score is the median proportion of
responses to each option.
10. Following a pilot in 2011, the 2012 Civil Service People Survey
questionnaire also included the four subjective wellbeing questions asked
by the ONS in the Annual Population Survey as part of their Measuring
National Wellbeing programme.
11. Question E02 was only asked to those who had responded "yes" to
question E01: questions E04, E05 and E06 were only asked to those who
had responded "yes" to question E03. The scores for questions E02 and
E04 are the number of responses to that category as a percentage of
those who had said "yes" to the previous question. As respondents were
able to select more than one category the scores may sum to more than
100% and the proportions for individual categories cannot be combined.
12. In CSPS 2010 an additional seven response options were added to
question E02, therefore there is no data for these categories for 2009. The
addition of these categories also means that the results for "Any other
grounds" cannot be compared between 2009 and 2010.
13. Two new questions on bullying and harassment (E05 and E06) were
added to the questionnaire in 2016. These were added to help understand
whether issues had been reported and/or resolved.
14. In CSPS 2017 six questions were removed from the core questionnaire
(B06, B30, B40, B56, B60, B61 in the 2016 survey), after consultation with
participating organisations. Three new questions about organisational
culture (B56-B58) and two questions about the Civil Service Vision (B61,
B62) have been added. See Annex A for details on how these changes
have affected theme scores.
Cabinet Office
Participating
organisations
Civil Service People Survey 2017: Civil Service benchmark results 13
Attorney General's departments
Attorney General's Office
Crown Prosecution Service
HM Crown Prosecution Service Inspectorate
Serious Fraud Office
Business, Energy & Industrial Strategy
Department for Business, Energy & Industrial
Strategy (excluding agencies)
Acas
Companies House
Competition and Markets Authority
Intellectual Property Office
Land Registry
Met Office
The Insolvency Service
Cabinet Office
Cabinet Office (excluding agencies)
Crown Commercial Service
Civil Service HR
Charity Commission
Communities and Local Government
Department for Communities and Local
Government (excluding agencies)
Planning Inspectorate
Digital, Culture, Media & Sport
Department for Digital, Culture, Media & Sport
(excluding agencies)
The National Archives
Defence
Ministry of Defence
Defence Equipment & Support
Defence Electronics and Components Agency
Dstl
UK Hydrographic Office
Department for Exiting the European Union
Department for International Development
Department for International Trade
Education1
Department for Education
Environment, Food & Rural Affairs
Department for Environment, Food & Rural
Affairs (excluding agencies)
Animal and Plant Health Agency
Centre for Environment, Fisheries and
Aquaculture Science
Rural Payments Agency
Veterinary Medicines Directorate
Estyn
Food Standards Agency
Foreign & Commonwealth Office
Foreign & Commonwealth Office (excluding
agencies)
FCO Services
Wilton Park
Government Actuary’s Department
Government Legal Department
Health
Department of Health (excluding agencies)
Medicines and Healthcare products Regulatory
Agency
Public Health England
HM Inspectorate of Constabulary and Fire &
Rescue Services
HM Revenue & Customs
HM Revenue & Customs
Valuation Office Agency
HM Treasury and Chancellor's departments
HM Treasury
Government Internal Audit Agency
UK Debt Management Office
Home Office2
Home Office: Policy and Enablers
Home Office: Border Force
Home Office: Immigration Enforcement
Home Office: UK Visas and Immigration
HM Passport Office
Justice2
Ministry of Justice (excluding agencies)
Criminal Injuries Compensation Authority
HM Courts and Tribunals Service
HM Prison Service
HM Prison and Probation Service (HQ)
Legal Aid Agency
MoJ Arms Length Bodies
National Probation Service
Office of the Public Guardian
National Crime Agency
National Savings and Investments
Office of Rail and Road
Ofgem
Ofqual
Ofsted
Scottish Government
Scottish Government (excluding agencies)
Accountant in Bankruptcy
Crown Office and Procurator Fiscal Service
Disclosure Scotland
Education Scotland
Food Standards Scotland
National Records of Scotland
Office of the Scottish Charity Regulator
Registers of Scotland
Revenue Scotland
Scottish Courts and Tribunal Service
Scottish Housing Regulator
Scottish Prison Service
Scottish Public Pensions Agency
Student Awards Agency for Scotland
Transport Scotland
Scotland Office, Office of the Advocate
General, Wales Office and Northern Ireland
Office1
Transport
Department for Transport (excluding agencies)
Driver and Vehicle Licensing Agency
Driver and Vehicle Standards Agency
Maritime and Coastguard Agency
Vehicle Certification Agency
UK Export Finance
UK Statistics Authority2
UK Statistics Authority
Office for National Statistics
Welsh Government
Work and Pensions
Department for Work and Pensions
Health and Safety Executive
Notes
1.The following sets of organisations participate
in a ‘joint-survey’, that is where all the
organisations take part in the same version of
the Civil Service People Survey and therefore
are treated as one organisation for analysis
and reporting of the survey results.
The Department for Education and its
executive agencies
The Scotland Office and Office of the
Advocate General, the Wales Office, and
the Northern Ireland Office
2.The operational directorates of these
organisations undertake their own versions of
the Civil Service People Survey and therefore
are treated as separate organisations for
analysis and reporting of the survey results.
However, combined scores for the ‘Home
Office Group’, ‘Ministry of Justice (including
agencies)’ and ‘UK Statistics Authority
(including ONS)’, which contain all directorates
are also presented.
Cabinet OfficeCivil Service People Survey 2017: Civil Service benchmark results 14
Adjusted Civil Service benchmark scores for 2009-2016 Change in benchmark score
2009
2010
2011
2012
2013
2014
2015
2016
’09
to ‘1
0
‘10 t
o ‘1
1
‘11 t
o ‘1
2
‘12 t
o ‘1
3
’13
to ‘1
4
‘14 t
o ‘1
5
‘15 t
o ‘1
6
Organisational objectives and purpose 80% 80% 80% 81% 81% 82% 81% 81% 0 0 +1 0 +1 -1 0
Resources and workload 70% 72% 71% 72% 72% 72% 71% 71% +2 -1 +1 0 0 -1 0
Leadership and managing change 37% 37% 37% 41% 41% 43% 42% 43% 0 0 +4 0 +2 -1 +1
Benchmark scores reported in previous years Change in benchmark score
2009
2010
2011
2012
2013
2014
2015
2016
’09
to ‘1
0
‘10 t
o ‘1
1
‘11 t
o ‘1
2
‘12 t
o ‘1
3
’13
to ‘1
4
‘14 t
o ‘1
5
‘15 t
o ‘1
6
Organisational objectives and purpose 81% 81% 81% 82% 82% 83% 83% 83% 0 0 +1 0 +1 0 0
Resources and workload 72% 73% 73% 74% 74% 74% 73% 73% +1 0 +1 0 0 -1 0
Leadership and managing change 38% 37% 38% 41% 42% 43% 43% 43% -1 +1 +3 +1 +1 0 0
Difference between adjusted and previous scoresDifference between changes in benchmark
scores
Organisational objectives and purpose -1 -1 -1 -1 -1 -1 -2 -2 0 0 0 0 0 -1 0
Resources and workload -2 -1 -2 -2 -2 -2 -2 -2 +1 -1 0 0 0 0 0
Leadership and managing change -1 0 -1 0 -1 0 -1 0 +1 -1 +1 -1 +1 -1 +1
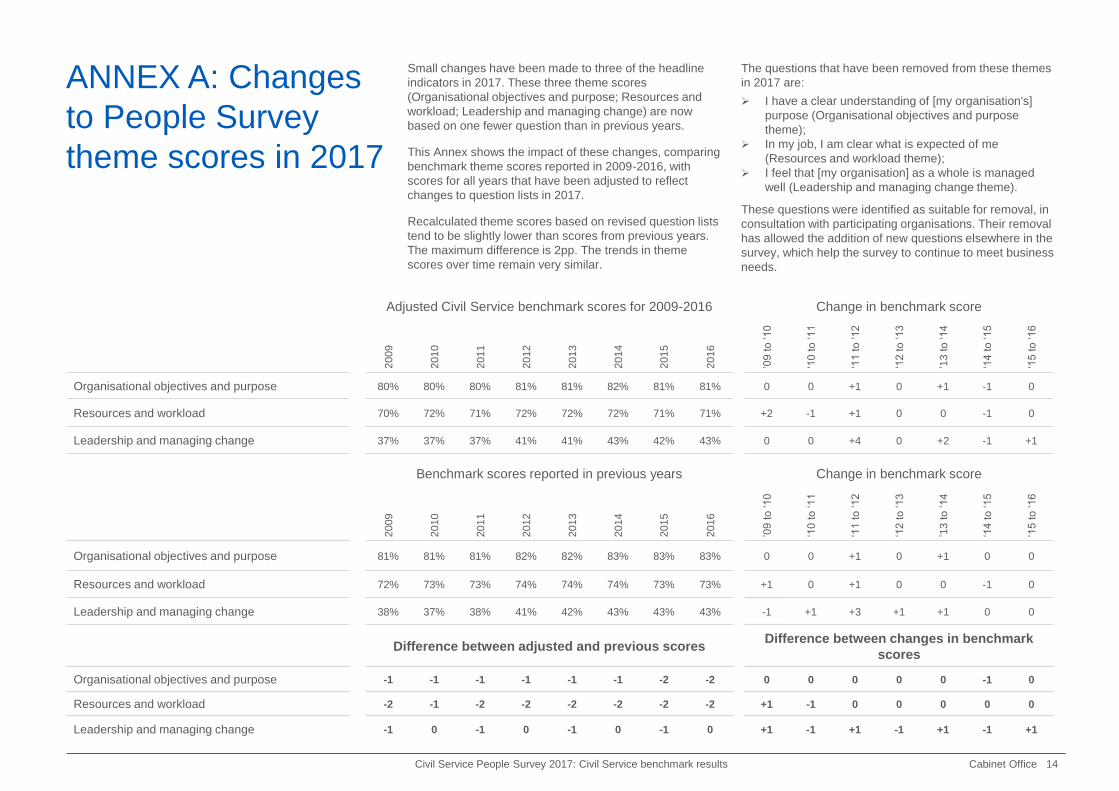
Small changes have been made to three of the headline
indicators in 2017. These three theme scores
(Organisational objectives and purpose; Resources and
workload; Leadership and managing change) are now
based on one fewer question than in previous years.
This Annex shows the impact of these changes, comparing
benchmark theme scores reported in 2009-2016, with
scores for all years that have been adjusted to reflect
changes to question lists in 2017.
Recalculated theme scores based on revised question lists
tend to be slightly lower than scores from previous years.
The maximum difference is 2pp. The trends in theme
scores over time remain very similar.
The questions that have been removed from these themes
in 2017 are:
I have a clear understanding of [my organisation's]
purpose (Organisational objectives and purpose
theme);
In my job, I am clear what is expected of me
(Resources and workload theme);
I feel that [my organisation] as a whole is managed
well (Leadership and managing change theme).
These questions were identified as suitable for removal, in
consultation with participating organisations. Their removal
has allowed the addition of new questions elsewhere in the
survey, which help the survey to continue to meet business
needs.
ANNEX A: Changes
to People Survey
theme scores in 2017
© Crown copyright 2017
You may re-use this information (not including logos) free of charge in any
format or medium, under the terms of the Open Government Licence.
To view this licence, visit www.nationalarchives.gov.uk/doc/open-government-
licence/ or write to the Information Policy Team, The National Archives, Kew,
London TW9 4DU, or email: [email protected]
Related Documents