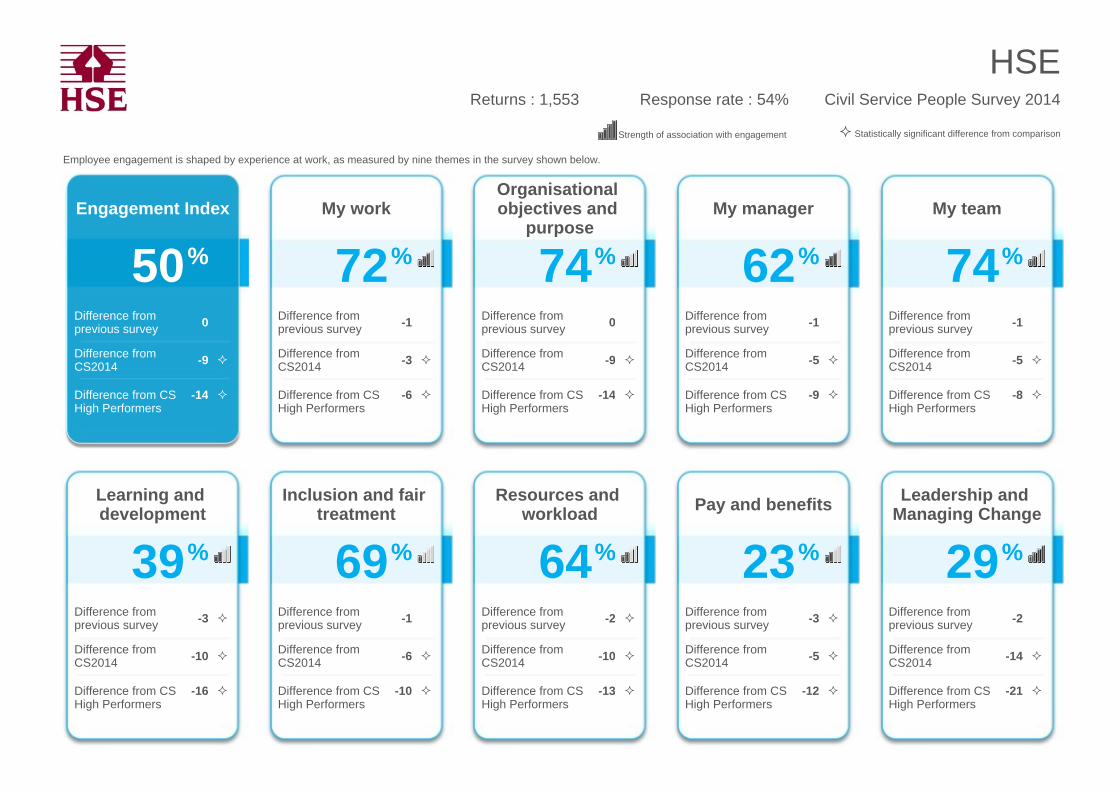
Engagement Index 50 % Difference from previous survey 0 Difference from CS2014 -9 Difference from CS High Performers -14 My work 72 % Difference from previous survey -1 Difference from CS2014 -3 Difference from CS High Performers -6 Organisational objectives and purpose 74 % Difference from previous survey 0 Difference from CS2014 -9 Difference from CS High Performers -14 My manager 62 % Difference from previous survey -1 Difference from CS2014 -5 Difference from CS High Performers -9 My team 74 % Difference from previous survey -1 Difference from CS2014 -5 Difference from CS High Performers -8 Learning and development 39 % Difference from previous survey -3 Difference from CS2014 -10 Difference from CS High Performers -16 Inclusion and fair treatment 69 % Difference from previous survey -1 Difference from CS2014 -6 Difference from CS High Performers -10 Resources and workload 64 % Difference from previous survey -2 Difference from CS2014 -10 Difference from CS High Performers -13 Pay and benefits 23 % Difference from previous survey -3 Difference from CS2014 -5 Difference from CS High Performers -12 Leadership and Managing Change 29 % Difference from previous survey -2 Difference from CS2014 -14 Difference from CS High Performers -21 Strength of association with engagement Statistically significant difference from comparison Employee engagement is shaped by experience at work, as measured by nine themes in the survey shown below. HSE Returns : 1,553 Response rate : 54% Civil Service People Survey 2014

Welcome message from author
This document is posted to help you gain knowledge. Please leave a comment to let me know what you think about it! Share it to your friends and learn new things together.
Transcript
Engagement Index
50%
Difference from previous survey 0
Difference from CS2014 -9
Difference from CS High Performers
-14
My work
72%
Difference from previous survey -1
Difference from CS2014 -3
Difference from CS High Performers
-6
Organisational objectives and
purpose
74%
Difference from previous survey 0
Difference from CS2014 -9
Difference from CS High Performers
-14
My manager
62%
Difference from previous survey -1
Difference from CS2014 -5
Difference from CS High Performers
-9
My team
74%
Difference from previous survey -1
Difference from CS2014 -5
Difference from CS High Performers
-8
Learning and development
39%
Difference from previous survey -3
Difference from CS2014 -10
Difference from CS High Performers
-16
Inclusion and fair treatment
69%
Difference from previous survey -1
Difference from CS2014 -6
Difference from CS High Performers
-10
Resources and workload
64%
Difference from previous survey -2
Difference from CS2014 -10
Difference from CS High Performers
-13
Pay and benefits
23%
Difference from previous survey -3
Difference from CS2014 -5
Difference from CS High Performers
-12
Leadership and Managing Change
29%
Difference from previous survey -2
Difference from CS2014 -14
Difference from CS High Performers
-21
Strength of association with engagement Statistically significant difference from comparison
Employee engagement is shaped by experience at work, as measured by nine themes in the survey shown below.
HSEReturns : 1,553 Response rate : 54% Civil Service People Survey 2014
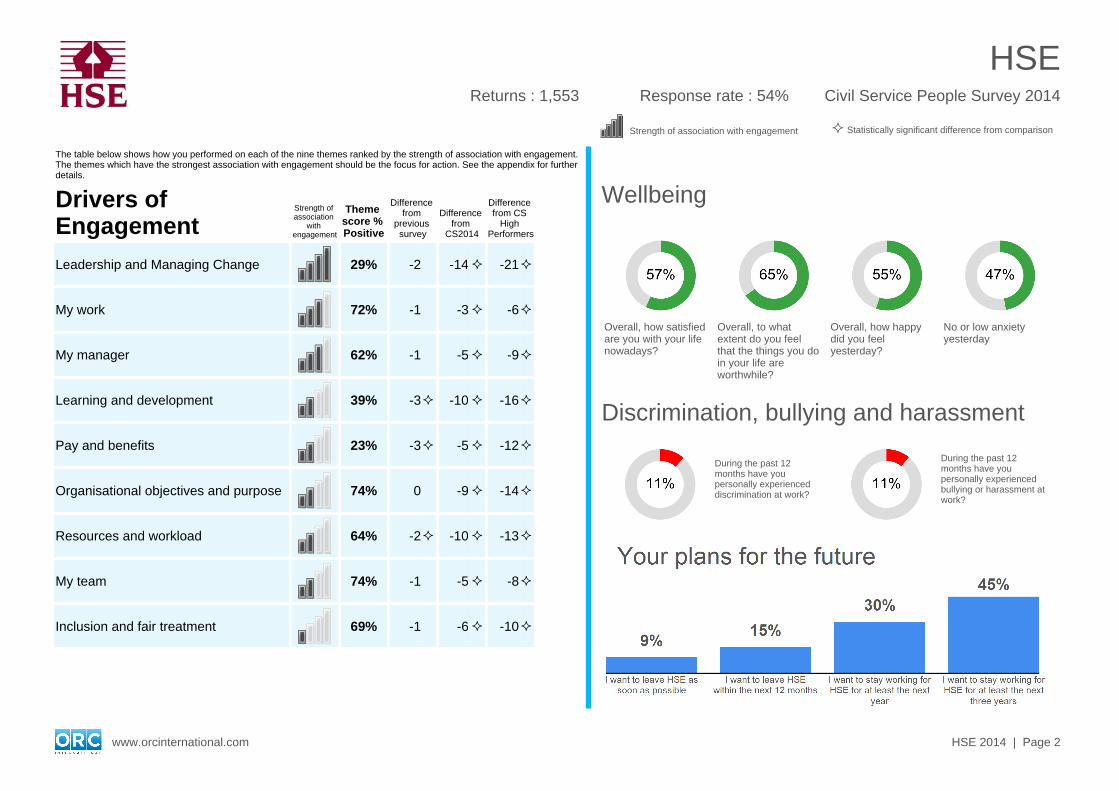
The table below shows how you performed on each of the nine themes ranked by the strength of association with engagement. The themes which have the strongest association with engagement should be the focus for action. See the appendix for further details.
Drivers of Engagement
Strength of association
with engagement
Theme score % Positive
Difference from
previous survey
Difference from
CS2014
Difference from CS
High Performers
Leadership and Managing Change 29% -2 -14 -21
My work 72% -1 -3 -6
My manager 62% -1 -5 -9
Learning and development 39% -3 -10 -16
Pay and benefits 23% -3 -5 -12
Organisational objectives and purpose 74% 0 -9 -14
Resources and workload 64% -2 -10 -13
My team 74% -1 -5 -8
Inclusion and fair treatment 69% -1 -6 -10
Strength of association with engagement Statistically significant difference from comparison
Overall, how satisfied are you with your life nowadays?
Overall, to what extent do you feel that the things you do in your life are worthwhile?
Overall, how happy did you feel yesterday?
No or low anxiety yesterday
During the past 12 months have you personally experienced discrimination at work?
During the past 12 months have you personally experienced bullying or harassment at work?
Discrimination, bullying and harassment
Wellbeing
www.orcinternational.com HSE 2014 | Page 2
HSECivil Service People Survey 2014Returns : 1,553 Response rate : 54%
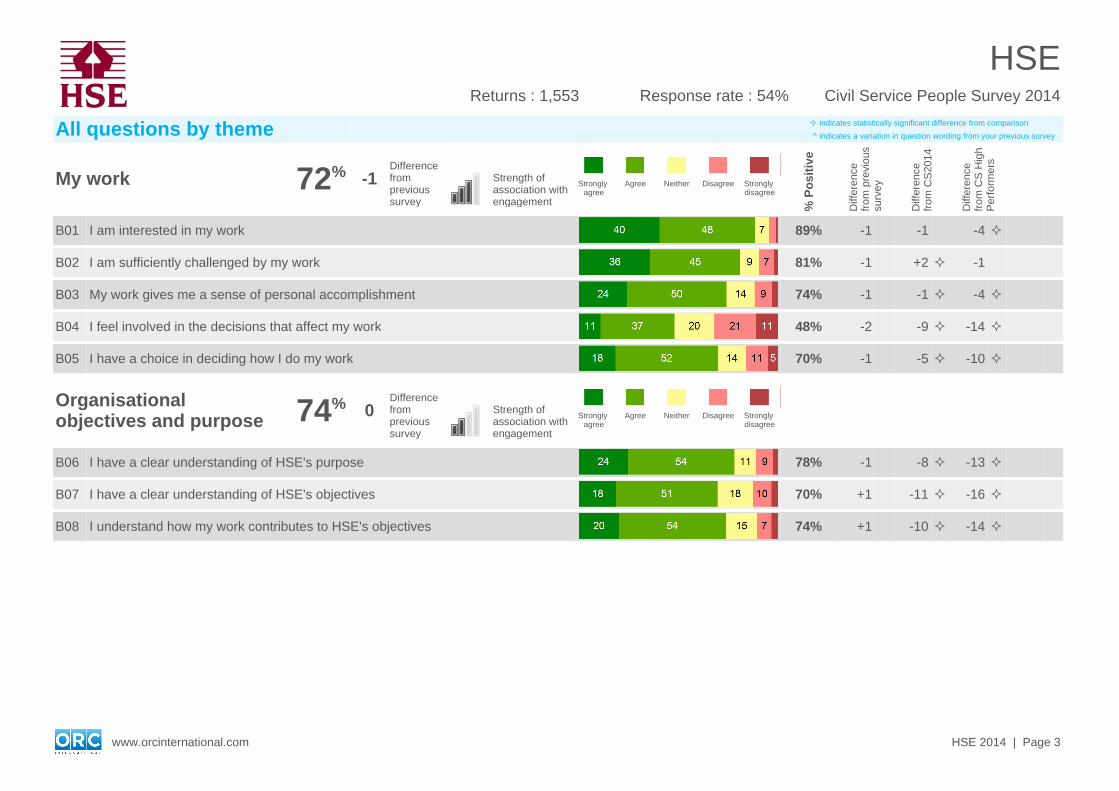
All questions by theme indicates statistically significant difference from comparison
^ indicates a variation in question wording from your previous survey
My work 72% -1Difference from previous survey
Strength of association with engagement
Strongly agree
Agree Neither Disagree Strongly disagree
% P
osi
tive
Diff
eren
ce
from
pre
viou
s su
rvey
Diff
eren
ce
from
CS
2014
Diff
eren
ce
from
CS
Hig
h P
erfo
rmer
s
B01 I am interested in my work 89% -1 -1 -4
B02 I am sufficiently challenged by my work 81% -1 +2 -1
B03 My work gives me a sense of personal accomplishment 74% -1 -1 -4
B04 I feel involved in the decisions that affect my work 48% -2 -9 -14
B05 I have a choice in deciding how I do my work 70% -1 -5 -10
Organisational objectives and purpose 74% 0
Difference from previous survey
Strength of association with engagement
Strongly agree
Agree Neither Disagree Strongly disagree
B06 I have a clear understanding of HSE's purpose 78% -1 -8 -13
B07 I have a clear understanding of HSE's objectives 70% +1 -11 -16
B08 I understand how my work contributes to HSE's objectives 74% +1 -10 -14
www.orcinternational.com HSE 2014 | Page 3
HSECivil Service People Survey 2014Returns : 1,553 Response rate : 54%
All questions by theme indicates statistically significant difference from comparison
^ indicates a variation in question wording from your previous survey
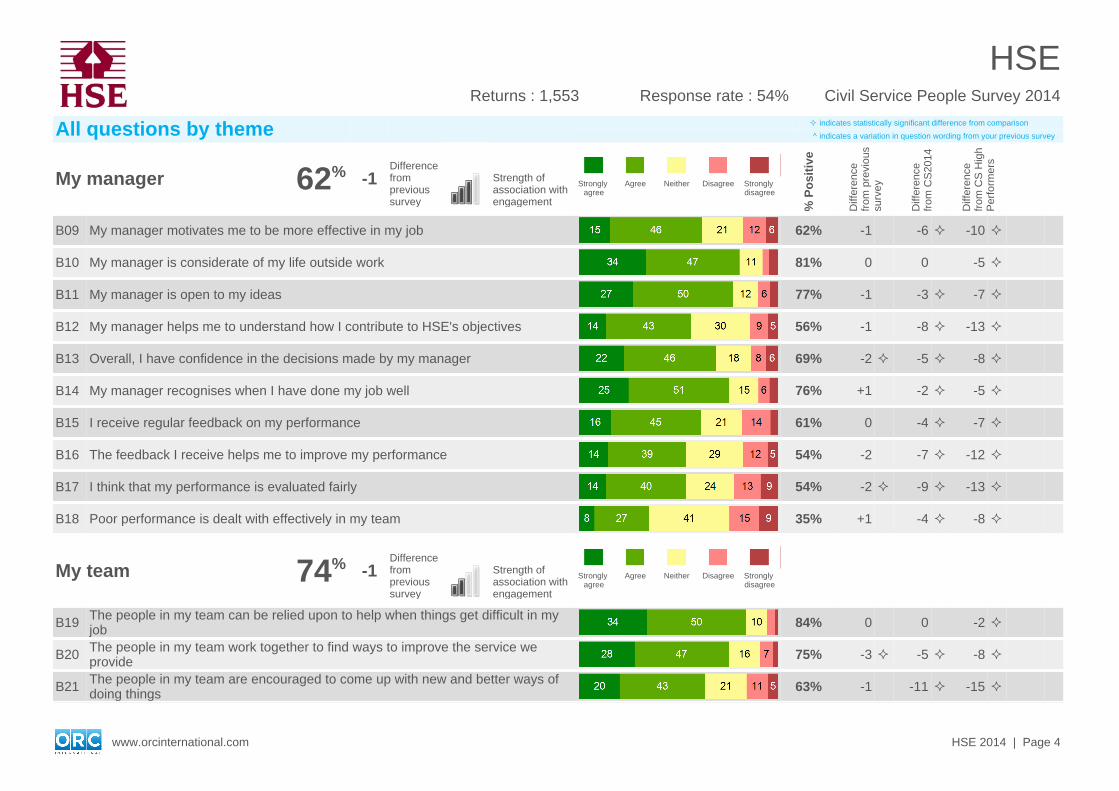
My manager 62% -1Difference from previous survey
Strength of association with engagement
Strongly agree
Agree Neither Disagree Strongly disagree
% P
osi
tive
Diff
eren
ce
from
pre
viou
s su
rvey
Diff
eren
ce
from
CS
2014
Diff
eren
ce
from
CS
Hig
h P
erfo
rmer
s
B09 My manager motivates me to be more effective in my job 62% -1 -6 -10
B10 My manager is considerate of my life outside work 81% 0 0 -5
B11 My manager is open to my ideas 77% -1 -3 -7
B12 My manager helps me to understand how I contribute to HSE's objectives 56% -1 -8 -13
B13 Overall, I have confidence in the decisions made by my manager 69% -2 -5 -8
B14 My manager recognises when I have done my job well 76% +1 -2 -5
B15 I receive regular feedback on my performance 61% 0 -4 -7
B16 The feedback I receive helps me to improve my performance 54% -2 -7 -12
B17 I think that my performance is evaluated fairly 54% -2 -9 -13
B18 Poor performance is dealt with effectively in my team 35% +1 -4 -8
My team 74% -1Difference from previous survey
Strength of association with engagement
Strongly agree
Agree Neither Disagree Strongly disagree
B19 The people in my team can be relied upon to help when things get difficult in my job 84% 0 0 -2
B20 The people in my team work together to find ways to improve the service we provide 75% -3 -5 -8
B21 The people in my team are encouraged to come up with new and better ways of doing things 63% -1 -11 -15
www.orcinternational.com HSE 2014 | Page 4
HSECivil Service People Survey 2014Returns : 1,553 Response rate : 54%
All questions by theme indicates statistically significant difference from comparison
^ indicates a variation in question wording from your previous survey
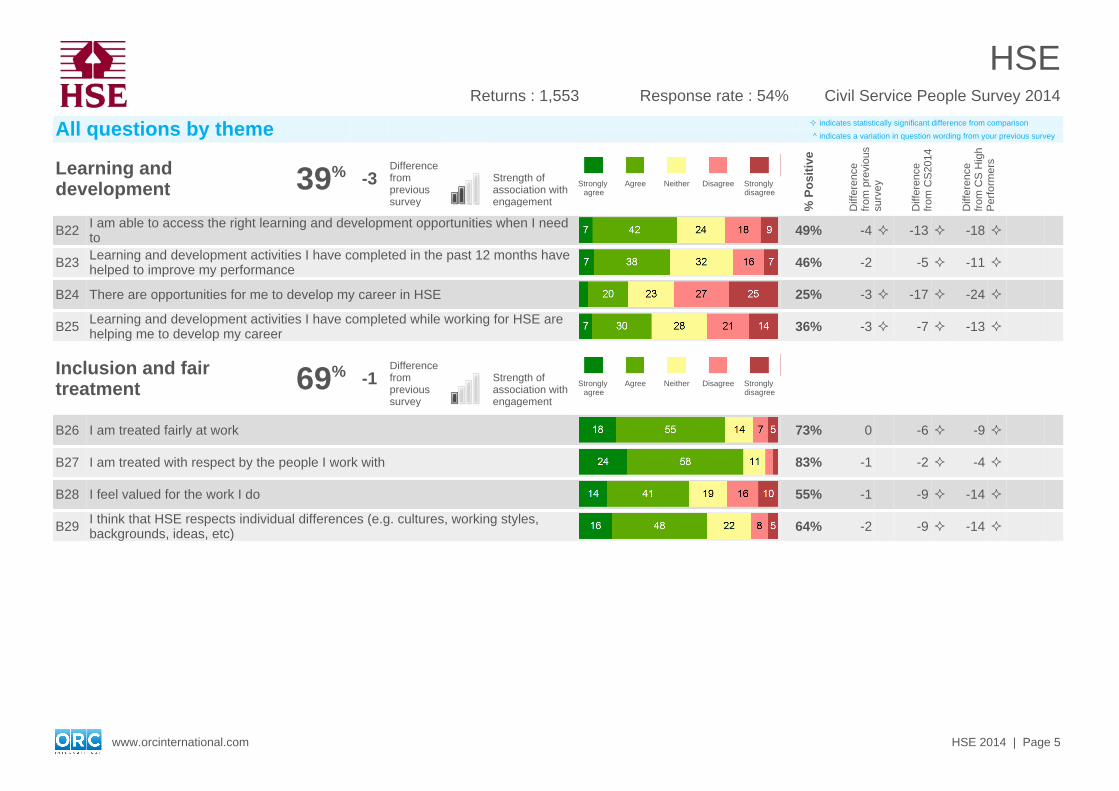
Learning and development 39% -3
Difference from previous survey
Strength of association with engagement
Strongly agree
Agree Neither Disagree Strongly disagree
% P
osi
tive
Diff
eren
ce
from
pre
viou
s su
rvey
Diff
eren
ce
from
CS
2014
Diff
eren
ce
from
CS
Hig
h P
erfo
rmer
s
B22 I am able to access the right learning and development opportunities when I need to 49% -4 -13 -18
B23 Learning and development activities I have completed in the past 12 months have helped to improve my performance 46% -2 -5 -11
B24 There are opportunities for me to develop my career in HSE 25% -3 -17 -24
B25 Learning and development activities I have completed while working for HSE are helping me to develop my career 36% -3 -7 -13
Inclusion and fair treatment 69% -1
Difference from previous survey
Strength of association with engagement
Strongly agree
Agree Neither Disagree Strongly disagree
B26 I am treated fairly at work 73% 0 -6 -9
B27 I am treated with respect by the people I work with 83% -1 -2 -4
B28 I feel valued for the work I do 55% -1 -9 -14
B29 I think that HSE respects individual differences (e.g. cultures, working styles, backgrounds, ideas, etc) 64% -2 -9 -14
www.orcinternational.com HSE 2014 | Page 5
HSECivil Service People Survey 2014Returns : 1,553 Response rate : 54%

All questions by theme indicates statistically significant difference from comparison
^ indicates a variation in question wording from your previous survey
Resources and workload 64% -2Difference from previous survey
Strength of association with engagement
Strongly agree
Agree Neither Disagree Strongly disagree
% P
osi
tive
Diff
eren
ce
from
pre
viou
s su
rvey
Diff
eren
ce
from
CS
2014
Diff
eren
ce
from
CS
Hig
h P
erfo
rmer
s
B30 In my job, I am clear what is expected of me 78% 0 -6 -9
B31 I get the information I need to do my job well 58% 0 -12 -15
B32 I have clear work objectives 71% 0 -5 -8
B33 I have the skills I need to do my job effectively 82% -3 -7 -9
B34 I have the tools I need to do my job effectively 48% -8 -24 -28
B35 I have an acceptable workload 48% -4 -11 -18
B36 I achieve a good balance between my work life and my private life 61% -2 -5 -13
Pay and benefits 23% -3Difference from previous survey
Strength of association with engagement
Strongly agree
Agree Neither Disagree Strongly disagree
B37 I feel that my pay adequately reflects my performance 24% -3 -5 -12
B38 I am satisfied with the total benefits package 26% -3 -6 -14
B39 Compared to people doing a similar job in other organisations I feel my pay is reasonable 20% -3 -5 -12
www.orcinternational.com HSE 2014 | Page 6
HSECivil Service People Survey 2014Returns : 1,553 Response rate : 54%
All questions by theme indicates statistically significant difference from comparison
^ indicates a variation in question wording from your previous survey
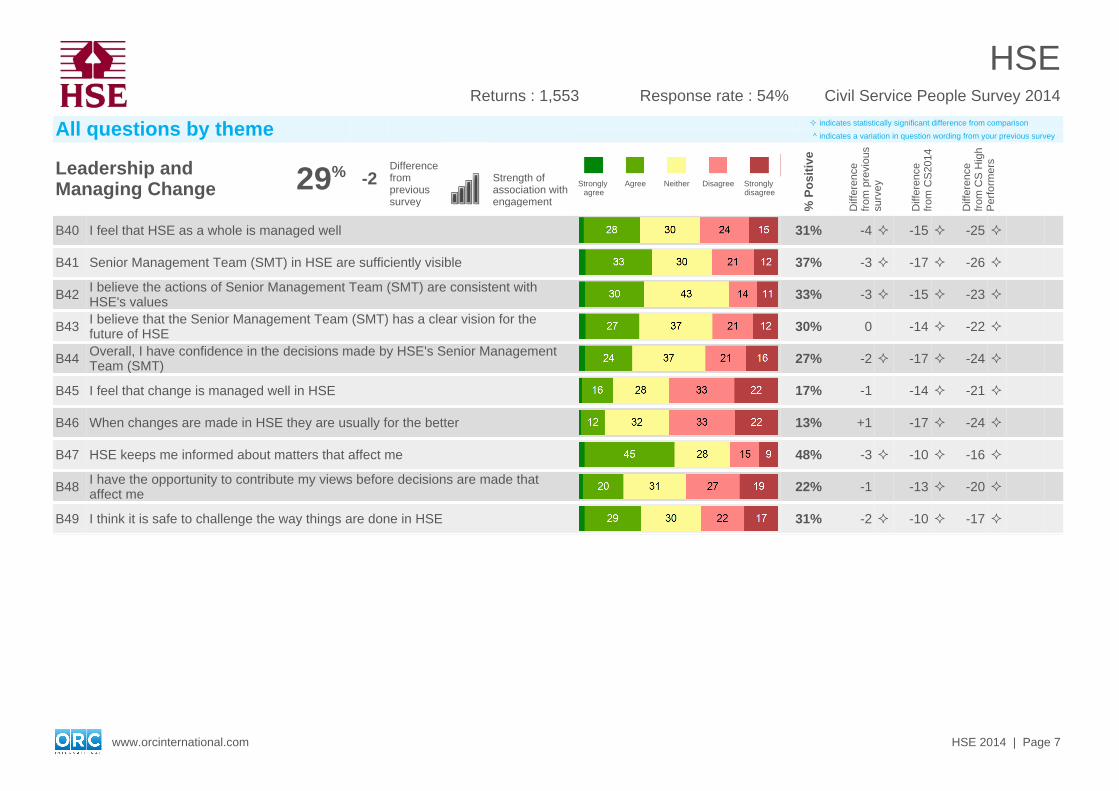
Leadership and Managing Change 29% -2
Difference from previous survey
Strength of association with engagement
Strongly agree
Agree Neither Disagree Strongly disagree
% P
osi
tive
Diff
eren
ce
from
pre
viou
s su
rvey
Diff
eren
ce
from
CS
2014
Diff
eren
ce
from
CS
Hig
h P
erfo
rmer
s
B40 I feel that HSE as a whole is managed well 31% -4 -15 -25
B41 Senior Management Team (SMT) in HSE are sufficiently visible 37% -3 -17 -26
B42 I believe the actions of Senior Management Team (SMT) are consistent with HSE's values 33% -3 -15 -23
B43 I believe that the Senior Management Team (SMT) has a clear vision for the future of HSE 30% 0 -14 -22
B44 Overall, I have confidence in the decisions made by HSE's Senior Management Team (SMT) 27% -2 -17 -24
B45 I feel that change is managed well in HSE 17% -1 -14 -21
B46 When changes are made in HSE they are usually for the better 13% +1 -17 -24
B47 HSE keeps me informed about matters that affect me 48% -3 -10 -16
B48 I have the opportunity to contribute my views before decisions are made that affect me 22% -1 -13 -20
B49 I think it is safe to challenge the way things are done in HSE 31% -2 -10 -17
www.orcinternational.com HSE 2014 | Page 7
HSECivil Service People Survey 2014Returns : 1,553 Response rate : 54%

All questions by theme indicates statistically significant difference from comparison
^ indicates a variation in question wording from your previous survey
Engagement Strongly agree
Agree Neither Disagree Strongly disagree
% P
osi
tive
Diff
eren
ce
from
pre
viou
s su
rvey
Diff
eren
ce
from
CS
2014
Diff
eren
ce
from
CS
Hig
h P
erfo
rmer
s
B50 I am proud when I tell others I am part of HSE 46% 0 -13 -20
B51 I would recommend HSE as a great place to work 31% 0 -17 -29
B52 I feel a strong personal attachment to HSE 43% 0 -5 -11
B53 HSE inspires me to do the best in my job 29% -2 -16 -22
B54 HSE motivates me to help it achieve its objectives 26% -1 -17 -23
Taking action Strongly agree
Agree Neither Disagree Strongly disagree
B55 I believe that Senior Management Team (SMT) in HSE will take action on the results from this survey 33% +2 -12 -21
B56 I believe that managers where I work will take action on the results from this survey 40% -1 -15 -21
B57 Where I work, I think effective action has been taken on the results of the last survey 22% +2 -13 -18
www.orcinternational.com HSE 2014 | Page 8
HSECivil Service People Survey 2014Returns : 1,553 Response rate : 54%
All questions by theme indicates statistically significant difference from comparison
^ indicates a variation in question wording from your previous survey
Organisational Culture Strongly agree
Agree Neither Disagree Strongly disagree
% P
osi
tive
Diff
eren
ce
from
pre
viou
s su
rvey
Diff
eren
ce
from
CS
2014
Diff
eren
ce
from
CS
Hig
h P
erfo
rmer
s
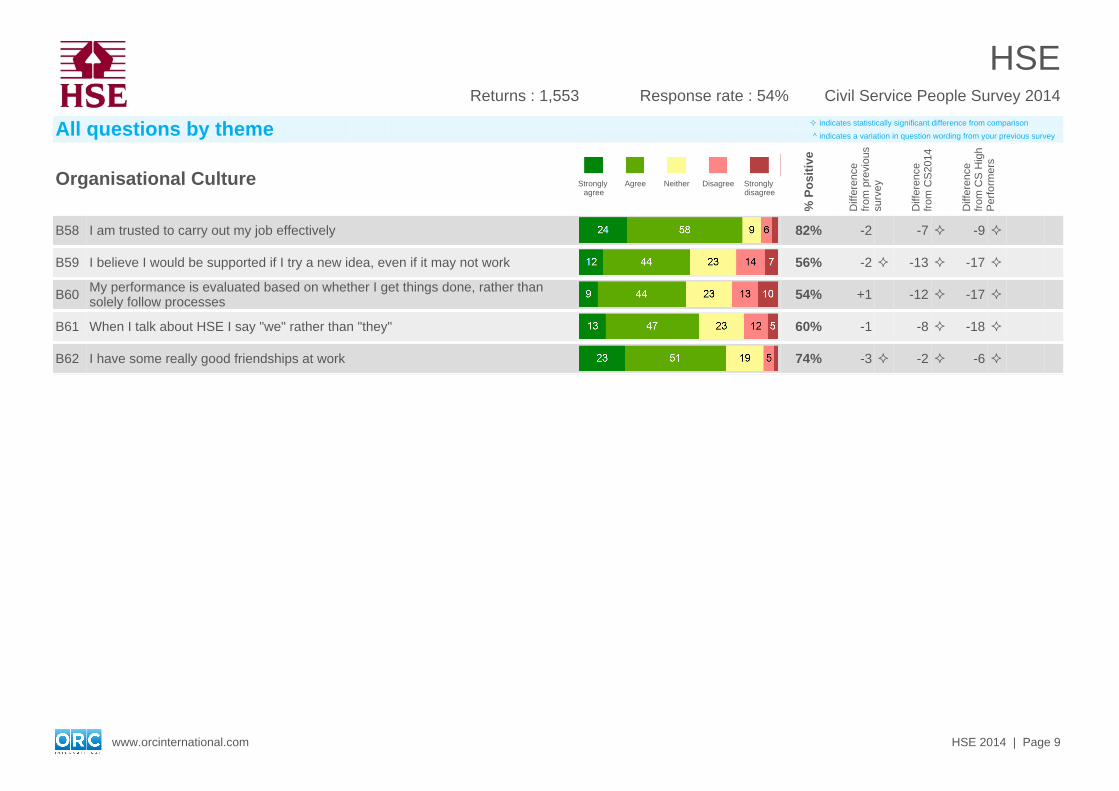
B58 I am trusted to carry out my job effectively 82% -2 -7 -9
B59 I believe I would be supported if I try a new idea, even if it may not work 56% -2 -13 -17
B60 My performance is evaluated based on whether I get things done, rather than solely follow processes 54% +1 -12 -17
B61 When I talk about HSE I say "we" rather than "they" 60% -1 -8 -18
B62 I have some really good friendships at work 74% -3 -2 -6
www.orcinternational.com HSE 2014 | Page 9
HSECivil Service People Survey 2014Returns : 1,553 Response rate : 54%
All questions by theme indicates statistically significant difference from comparison
^ indicates a variation in question wording from your previous survey
Wellbeing 0-4 5-6 7-8 9-10
% P
osi
tive
Diff
eren
ce
from
pre
viou
s su
rvey
Diff
eren
ce
from
CS
2014
Diff
eren
ce
from
CS
Hig
h P
erfo
rmer
s
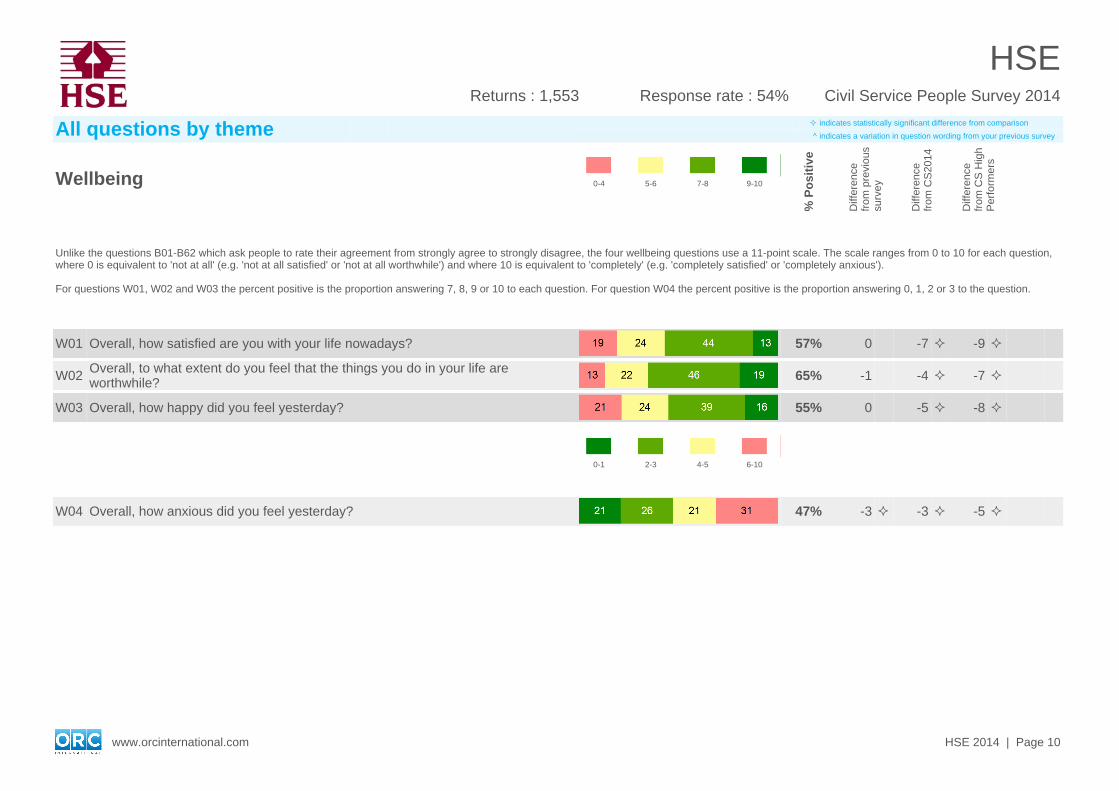
Unlike the questions B01-B62 which ask people to rate their agreement from strongly agree to strongly disagree, the four wellbeing questions use a 11-point scale. The scale ranges from 0 to 10 for each question, where 0 is equivalent to 'not at all' (e.g. 'not at all satisfied' or 'not at all worthwhile') and where 10 is equivalent to 'completely' (e.g. 'completely satisfied' or 'completely anxious').
For questions W01, W02 and W03 the percent positive is the proportion answering 7, 8, 9 or 10 to each question. For question W04 the percent positive is the proportion answering 0, 1, 2 or 3 to the question.
W01 Overall, how satisfied are you with your life nowadays? 57% 0 -7 -9
W02 Overall, to what extent do you feel that the things you do in your life are worthwhile? 65% -1 -4 -7
W03 Overall, how happy did you feel yesterday? 55% 0 -5 -8
0-1 2-3 4-5 6-10
W04 Overall, how anxious did you feel yesterday? 47% -3 -3 -5
www.orcinternational.com HSE 2014 | Page 10
HSECivil Service People Survey 2014Returns : 1,553 Response rate : 54%
All questions by theme indicates statistically significant difference from comparison
^ indicates a variation in question wording from your previous survey
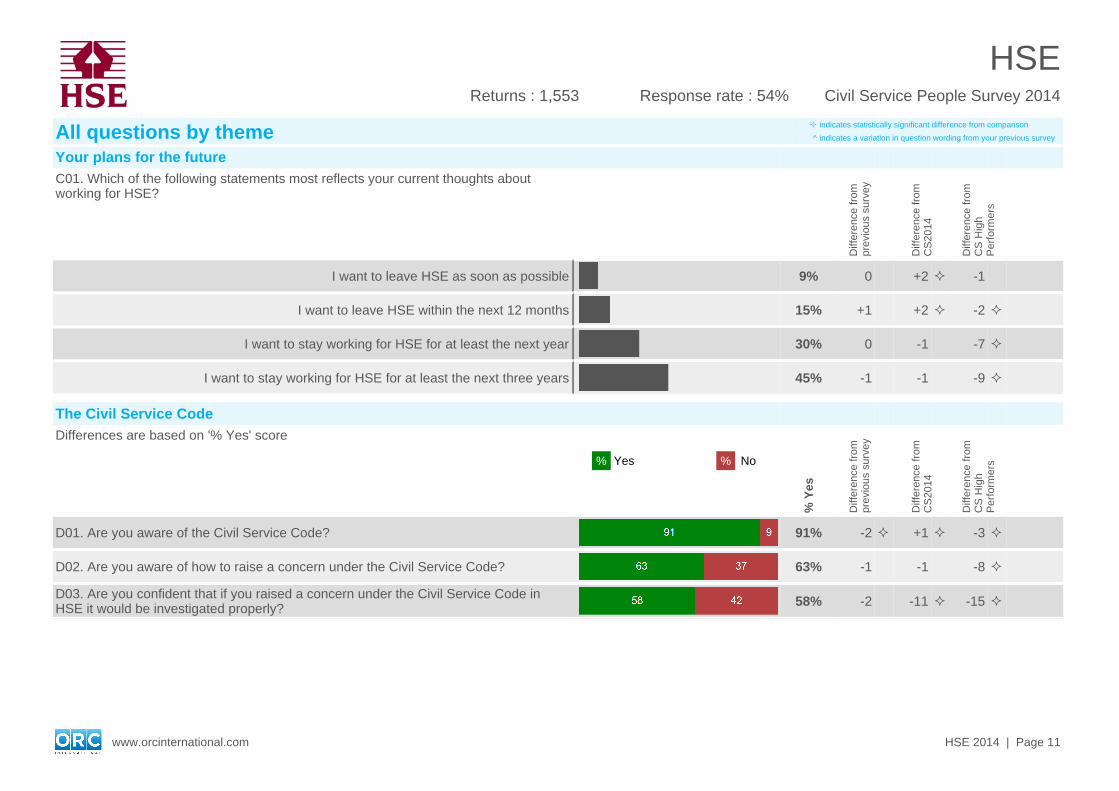
Your plans for the futureC01. Which of the following statements most reflects your current thoughts about working for HSE?
Diff
eren
ce fr
om
prev
ious
sur
vey
Diff
eren
ce fr
om
CS
2014
Diff
eren
ce fr
om
CS
Hig
h P
erfo
rmer
s
I want to leave HSE as soon as possible 9% 0 +2 -1
I want to leave HSE within the next 12 months 15% +1 +2 -2
I want to stay working for HSE for at least the next year 30% 0 -1 -7
I want to stay working for HSE for at least the next three years 45% -1 -1 -9
The Civil Service CodeDifferences are based on '% Yes' score
% Yes % No
% Y
es
Diff
eren
ce fr
om
prev
ious
sur
vey
Diff
eren
ce fr
om
CS
2014
Diff
eren
ce fr
om
CS
Hig
h P
erfo
rmer
s
D01. Are you aware of the Civil Service Code? 91% -2 +1 -3
D02. Are you aware of how to raise a concern under the Civil Service Code? 63% -1 -1 -8
D03. Are you confident that if you raised a concern under the Civil Service Code in HSE it would be investigated properly? 58% -2 -11 -15
www.orcinternational.com HSE 2014 | Page 11
HSECivil Service People Survey 2014Returns : 1,553 Response rate : 54%
All questions by theme indicates statistically significant difference from comparison
^ indicates a variation in question wording from your previous survey
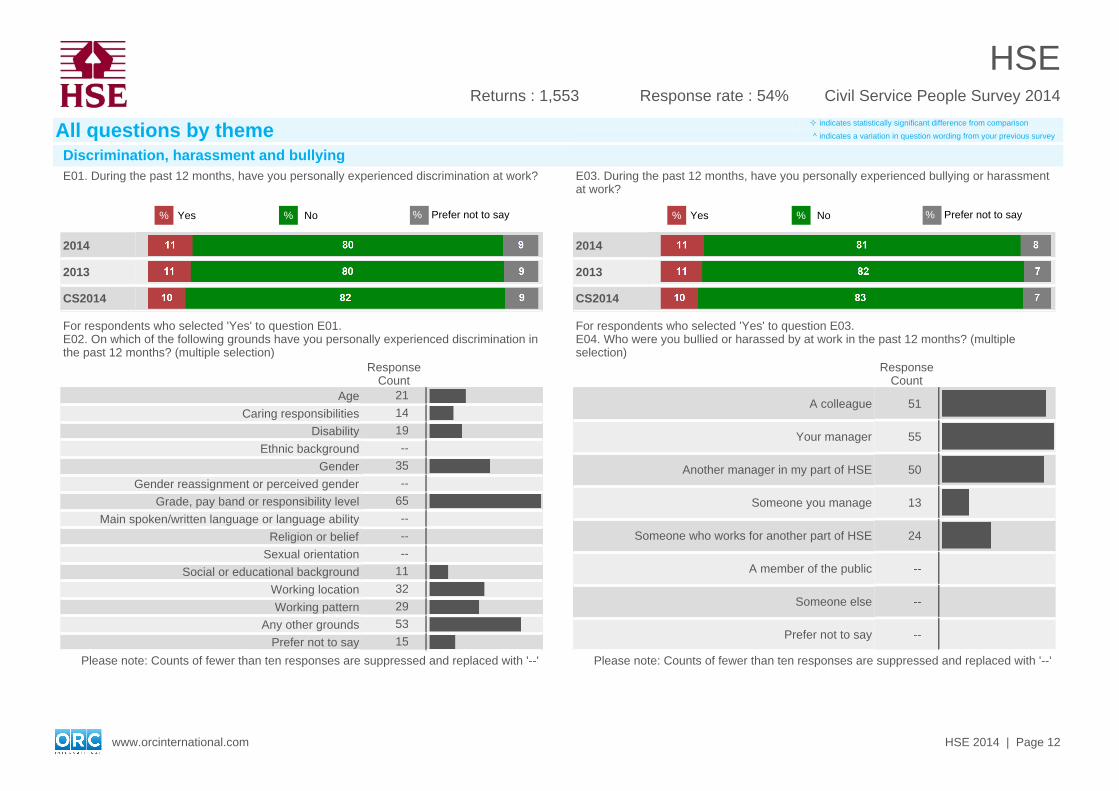
Discrimination, harassment and bullyingE01. During the past 12 months, have you personally experienced discrimination at work? E03. During the past 12 months, have you personally experienced bullying or harassment
at work?
% Yes % No % Prefer not to say % Yes % No % Prefer not to say
2014 2014
2013 2013
CS2014 CS2014
For respondents who selected 'Yes' to question E01.E02. On which of the following grounds have you personally experienced discrimination in the past 12 months? (multiple selection)
ResponseCount
Age 21
Caring responsibilities 14
Disability 19
Ethnic background --
Gender 35
Gender reassignment or perceived gender --
Grade, pay band or responsibility level 65
Main spoken/written language or language ability --
Religion or belief --
Sexual orientation --
Social or educational background 11
Working location 32
Working pattern 29
Any other grounds 53
Prefer not to say 15
Please note: Counts of fewer than ten responses are suppressed and replaced with '--'
For respondents who selected 'Yes' to question E03.E04. Who were you bullied or harassed by at work in the past 12 months? (multiple selection)
ResponseCount
A colleague 51
Your manager 55
Another manager in my part of HSE 50
Someone you manage 13
Someone who works for another part of HSE 24
A member of the public --
Someone else --
Prefer not to say --
Please note: Counts of fewer than ten responses are suppressed and replaced with '--'
www.orcinternational.com HSE 2014 | Page 12
HSECivil Service People Survey 2014Returns : 1,553 Response rate : 54%
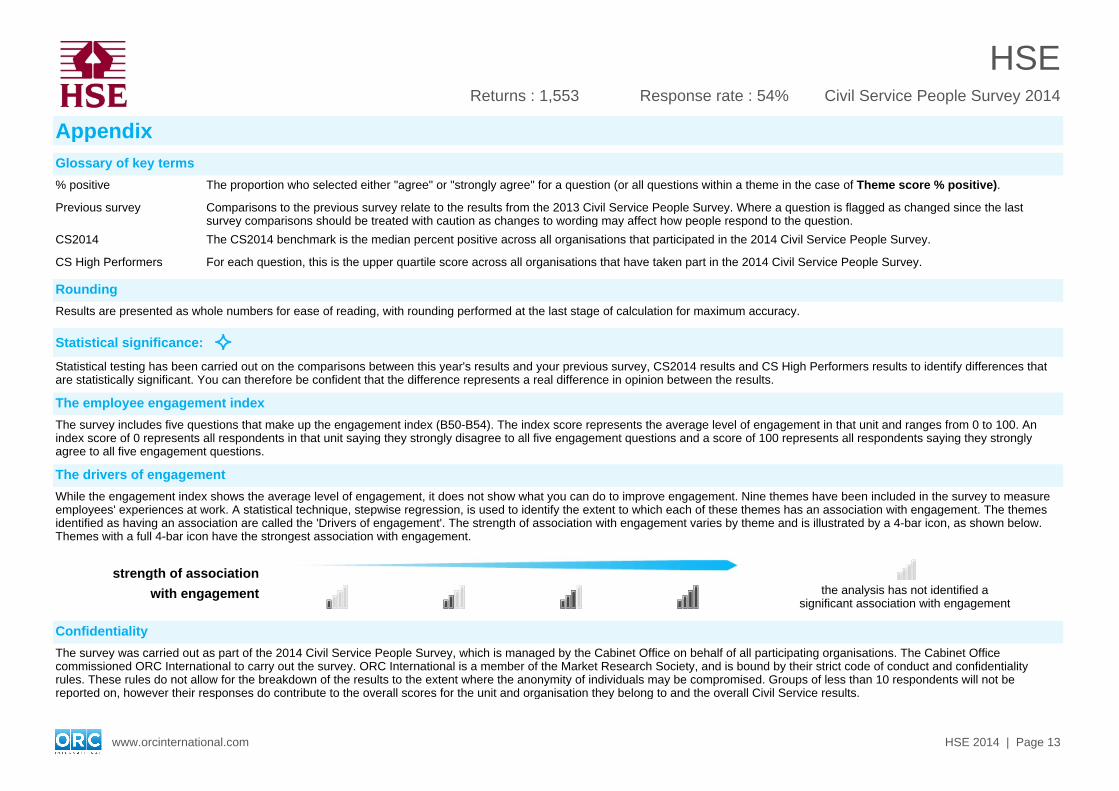
AppendixGlossary of key terms
% positive The proportion who selected either "agree" or "strongly agree" for a question (or all questions within a theme in the case of Theme score % positive).
Previous survey Comparisons to the previous survey relate to the results from the 2013 Civil Service People Survey. Where a question is flagged as changed since the last survey comparisons should be treated with caution as changes to wording may affect how people respond to the question.
CS2014 The CS2014 benchmark is the median percent positive across all organisations that participated in the 2014 Civil Service People Survey.
CS High Performers For each question, this is the upper quartile score across all organisations that have taken part in the 2014 Civil Service People Survey.
Rounding
Results are presented as whole numbers for ease of reading, with rounding performed at the last stage of calculation for maximum accuracy.
Statistical significance: Statistical testing has been carried out on the comparisons between this year's results and your previous survey, CS2014 results and CS High Performers results to identify differences that are statistically significant. You can therefore be confident that the difference represents a real difference in opinion between the results.
The employee engagement index
The survey includes five questions that make up the engagement index (B50-B54). The index score represents the average level of engagement in that unit and ranges from 0 to 100. An index score of 0 represents all respondents in that unit saying they strongly disagree to all five engagement questions and a score of 100 represents all respondents saying they strongly agree to all five engagement questions.
The drivers of engagement
While the engagement index shows the average level of engagement, it does not show what you can do to improve engagement. Nine themes have been included in the survey to measure employees' experiences at work. A statistical technique, stepwise regression, is used to identify the extent to which each of these themes has an association with engagement. The themes identified as having an association are called the 'Drivers of engagement'. The strength of association with engagement varies by theme and is illustrated by a 4-bar icon, as shown below. Themes with a full 4-bar icon have the strongest association with engagement.
Confidentiality
The survey was carried out as part of the 2014 Civil Service People Survey, which is managed by the Cabinet Office on behalf of all participating organisations. The Cabinet Office commissioned ORC International to carry out the survey. ORC International is a member of the Market Research Society, and is bound by their strict code of conduct and confidentiality rules. These rules do not allow for the breakdown of the results to the extent where the anonymity of individuals may be compromised. Groups of less than 10 respondents will not be reported on, however their responses do contribute to the overall scores for the unit and organisation they belong to and the overall Civil Service results.
strength of association
with engagement the analysis has not identified asignificant association with engagement
www.orcinternational.com HSE 2014 | Page 13
HSECivil Service People Survey 2014Returns : 1,553 Response rate : 54%
Related Documents