Available online at www.CivileJournal.org Civil Engineering Journal (E-ISSN: 2476-3055; ISSN: 2676-6957) Vol. 7, No. 04, April, 2021 614 Determination of Reinforced Concrete Rectangular Sections Having Plastic Moments Equal to all IPE Profiles Sayeh Beroual 1* , Mohamed Laid Samai 1 1 Department of Civil Engineering, University of Mentouri Brothers Constantine 1, Constantine 25017, Algeria. Received 02 January 2021; Revised 10 March 2021; Accepted 19 March 2021; Published 01 April 2021 Abstract The comparison between steel structures and reinforced concrete structures has always been governed by economy and response to earthquake. Steel structures being lighter and are thus more efficient to resist earthquake. On the other hand, they are more expensive (4 to 5 times). Theoretically, two structural elements having the same plastic moment have an equal failure or collapse load. Different profiles of IPE are realized in industry and all their characteristics are determined with a great precision (weight, geometrical characteristics and thus their plastic moment). Determining equivalent rectangular singly reinforced concrete cross-sections is not easy and seems impossible to be solved analytically. To a given profile it may be found a multitude of equivalent rectangular reinforced concrete cross-section (singly and doubly reinforced with different yield strengths and compositions of concrete). To take into consideration all these factors, it is absolutely necessary to construct three axis design charts with an appropriate choice of system of coordinates in order to cover all possible ranges of different parameters. The choice of all these possible rectangular reinforced concrete sections is governed by the plastic performance of these later. They must be under reinforced, allowing plastification of steel before failure in order to permit the redistribution phenomenon in plastic analysis. The exploitation of these different charts has revealed that the absolute majority of these rectangular reinforced concrete cross-section are reasonably well designed and are in conformity with the dimensions used in practice. The results of the present characterization using Eurocode 2 characteristics are compared to those of CP110. The impact does not seem to be very relevant. Keywords: Reinforced Concrete; IPE Profile; Equivalent Sections; Plastic Moments; Reduced Moments; Reinforcement Ratio. 1. Introduction The comparison between steel and reinforced concrete structures has been the subject of several studies which have generally focused on the economic aspect and seismic behaviour as well as the durability and strength of each material [1, 2]. Steel structures being lighter and thus more efficient to resist to earthquakes, but on the other hand they are more expensive (4 to 5 times). All structural elements made of steel or reinforced concrete follow the same load transfer law (material strength), but they differ in several aspects, such as the material itself and its behaviour, plastic bending resistance capacity (loads and failure modes), stability and durability, etc. However, each type of structure has advantages and disadvantages. The dimensioning of the cross-sections of these structural elements is directly affected by the safety margin adopted by the different codes, and therefore the change of code has been the subject of several comparative * Corresponding author: [email protected] http://dx.doi.org/10.28991/cej-2021-03091677 © 2021 by the authors. Licensee C.E.J, Tehran, Iran. This article is an open access article distributed under the terms and conditions of the Creative Commons Attribution (CC-BY) license (http://creativecommons.org/licenses/by/4.0/).

Welcome message from author
This document is posted to help you gain knowledge. Please leave a comment to let me know what you think about it! Share it to your friends and learn new things together.
Transcript
Available online at www.CivileJournal.org
Civil Engineering Journal (E-ISSN: 2476-3055; ISSN: 2676-6957)
Vol. 7, No. 04, April, 2021
614
Determination of Reinforced Concrete Rectangular Sections
Having Plastic Moments Equal to all IPE Profiles
Sayeh Beroual 1*, Mohamed Laid Samai 1
1 Department of Civil Engineering, University of Mentouri Brothers Constantine 1, Constantine 25017, Algeria.
Received 02 January 2021; Revised 10 March 2021; Accepted 19 March 2021; Published 01 April 2021
Abstract
The comparison between steel structures and reinforced concrete structures has always been governed by economy and
response to earthquake. Steel structures being lighter and are thus more efficient to resist earthquake. On the other hand,
they are more expensive (4 to 5 times). Theoretically, two structural elements having the same plastic moment have an
equal failure or collapse load. Different profiles of IPE are realized in industry and all their characteristics are determined
with a great precision (weight, geometrical characteristics and thus their plastic moment). Determining equivalent
rectangular singly reinforced concrete cross-sections is not easy and seems impossible to be solved analytically. To a
given profile it may be found a multitude of equivalent rectangular reinforced concrete cross-section (singly and doubly
reinforced with different yield strengths and compositions of concrete). To take into consideration all these factors, it is
absolutely necessary to construct three axis design charts with an appropriate choice of system of coordinates in order to
cover all possible ranges of different parameters. The choice of all these possible rectangular reinforced concrete sections
is governed by the plastic performance of these later. They must be under reinforced, allowing plastification of steel
before failure in order to permit the redistribution phenomenon in plastic analysis. The exploitation of these different
charts has revealed that the absolute majority of these rectangular reinforced concrete cross-section are reasonably well
designed and are in conformity with the dimensions used in practice. The results of the present characterization using
Eurocode 2 characteristics are compared to those of CP110. The impact does not seem to be very relevant.
Keywords: Reinforced Concrete; IPE Profile; Equivalent Sections; Plastic Moments; Reduced Moments; Reinforcement Ratio.
1. Introduction
The comparison between steel and reinforced concrete structures has been the subject of several studies which
have generally focused on the economic aspect and seismic behaviour as well as the durability and strength of each
material [1, 2]. Steel structures being lighter and thus more efficient to resist to earthquakes, but on the other hand they
are more expensive (4 to 5 times).
All structural elements made of steel or reinforced concrete follow the same load transfer law (material strength),
but they differ in several aspects, such as the material itself and its behaviour, plastic bending resistance capacity
(loads and failure modes), stability and durability, etc. However, each type of structure has advantages and
disadvantages. The dimensioning of the cross-sections of these structural elements is directly affected by the safety
margin adopted by the different codes, and therefore the change of code has been the subject of several comparative
* Corresponding author: [email protected]
http://dx.doi.org/10.28991/cej-2021-03091677
© 2021 by the authors. Licensee C.E.J, Tehran, Iran. This article is an open access article distributed under the terms and conditions of the Creative Commons Attribution (CC-BY) license (http://creativecommons.org/licenses/by/4.0/).
Civil Engineering Journal Vol. 7, No. 04, April, 2021
615
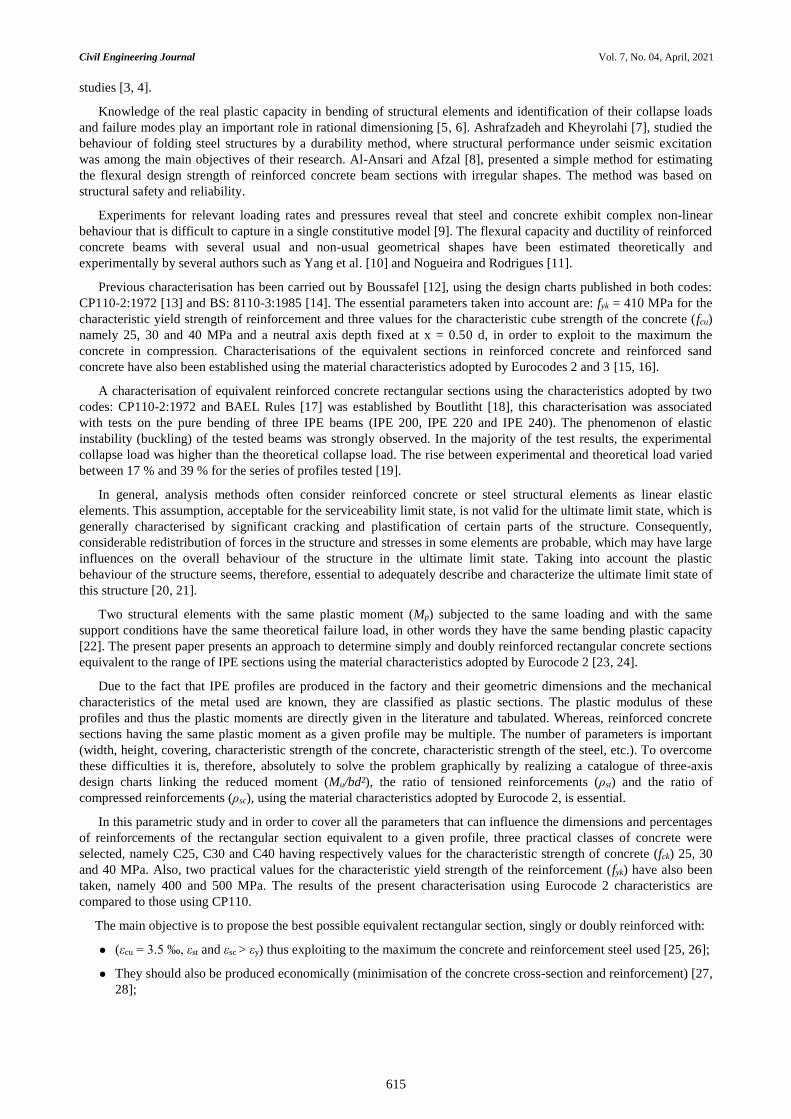
studies [3, 4].
Knowledge of the real plastic capacity in bending of structural elements and identification of their collapse loads
and failure modes play an important role in rational dimensioning [5, 6]. Ashrafzadeh and Kheyrolahi [7], studied the
behaviour of folding steel structures by a durability method, where structural performance under seismic excitation
was among the main objectives of their research. Al-Ansari and Afzal [8], presented a simple method for estimating
the flexural design strength of reinforced concrete beam sections with irregular shapes. The method was based on
structural safety and reliability.
Experiments for relevant loading rates and pressures reveal that steel and concrete exhibit complex non-linear
behaviour that is difficult to capture in a single constitutive model [9]. The flexural capacity and ductility of reinforced
concrete beams with several usual and non-usual geometrical shapes have been estimated theoretically and
experimentally by several authors such as Yang et al. [10] and Nogueira and Rodrigues [11].
Previous characterisation has been carried out by Boussafel [12], using the design charts published in both codes:
CP110-2:1972 [13] and BS: 8110-3:1985 [14]. The essential parameters taken into account are: fyk = 410 MPa for the
characteristic yield strength of reinforcement and three values for the characteristic cube strength of the concrete (fcu)
namely 25, 30 and 40 MPa and a neutral axis depth fixed at x = 0.50 d, in order to exploit to the maximum the
concrete in compression. Characterisations of the equivalent sections in reinforced concrete and reinforced sand
concrete have also been established using the material characteristics adopted by Eurocodes 2 and 3 [15, 16].
A characterisation of equivalent reinforced concrete rectangular sections using the characteristics adopted by two
codes: CP110-2:1972 and BAEL Rules [17] was established by Boutlitht [18], this characterisation was associated
with tests on the pure bending of three IPE beams (IPE 200, IPE 220 and IPE 240). The phenomenon of elastic
instability (buckling) of the tested beams was strongly observed. In the majority of the test results, the experimental
collapse load was higher than the theoretical collapse load. The rise between experimental and theoretical load varied
between 17 % and 39 % for the series of profiles tested [19].
In general, analysis methods often consider reinforced concrete or steel structural elements as linear elastic
elements. This assumption, acceptable for the serviceability limit state, is not valid for the ultimate limit state, which is
generally characterised by significant cracking and plastification of certain parts of the structure. Consequently,
considerable redistribution of forces in the structure and stresses in some elements are probable, which may have large
influences on the overall behaviour of the structure in the ultimate limit state. Taking into account the plastic
behaviour of the structure seems, therefore, essential to adequately describe and characterize the ultimate limit state of
this structure [20, 21].
Two structural elements with the same plastic moment (Mp) subjected to the same loading and with the same
support conditions have the same theoretical failure load, in other words they have the same bending plastic capacity
[22]. The present paper presents an approach to determine simply and doubly reinforced rectangular concrete sections
equivalent to the range of IPE sections using the material characteristics adopted by Eurocode 2 [23, 24].
Due to the fact that IPE profiles are produced in the factory and their geometric dimensions and the mechanical
characteristics of the metal used are known, they are classified as plastic sections. The plastic modulus of these
profiles and thus the plastic moments are directly given in the literature and tabulated. Whereas, reinforced concrete
sections having the same plastic moment as a given profile may be multiple. The number of parameters is important
(width, height, covering, characteristic strength of the concrete, characteristic strength of the steel, etc.). To overcome
these difficulties it is, therefore, absolutely to solve the problem graphically by realizing a catalogue of three-axis
design charts linking the reduced moment (Mu/bd²), the ratio of tensioned reinforcements (ρst) and the ratio of
compressed reinforcements (ρsc), using the material characteristics adopted by Eurocode 2, is essential.
In this parametric study and in order to cover all the parameters that can influence the dimensions and percentages
of reinforcements of the rectangular section equivalent to a given profile, three practical classes of concrete were
selected, namely C25, C30 and C40 having respectively values for the characteristic strength of concrete (fck) 25, 30
and 40 MPa. Also, two practical values for the characteristic yield strength of the reinforcement (fyk) have also been
taken, namely 400 and 500 MPa. The results of the present characterisation using Eurocode 2 characteristics are
compared to those using CP110.
The main objective is to propose the best possible equivalent rectangular section, singly or doubly reinforced with:
(εcu = 3.5 ‰, εst and εsc > εy) thus exploiting to the maximum the concrete and reinforcement steel used [25, 26];
They should also be produced economically (minimisation of the concrete cross-section and reinforcement) [27,
28];
Civil Engineering Journal Vol. 7, No. 04, April, 2021
616
The present analysis was carried out in order to achieve the following objectives:
Develop a catalogue of design charts similar to the one previously developed by British codes (CP110-2:1972
and BS: 8110-3:1985) [13, 14];
Carry out a comparative study between the use of the two codes (CP110 and Eurocode 2) in order to formulate
an opinion on the change of code;
Set up an expert mini-system to find the best possible equivalent section in singly or doubly reinforced concrete
from the point of view of economic and plastic performance.
The present paper is divided into seven sections. The introduction presents the problem that motivated this
research, an overview of previous work as well as a summary of the main objectives are given. The second section
presents the basic equations which are absolutely necessary for the graphical realisation of the design charts catalogue.
The plastic moments for all IPE profiles are tabulated in section 3. The fourth section describes the procedures used to
determine singly and doubly reinforced concrete sections equivalent to the various IPE profiles. The fifth section is
devoted to the tabular and graphical presentation of the results. The effect of the different influencing parameters on
the dimensioning of the equivalent sections is highlighted in section six. A comparative study between the use of two
codes is established in order to highlight the impact of the change of codes. The last section is devoted to the general
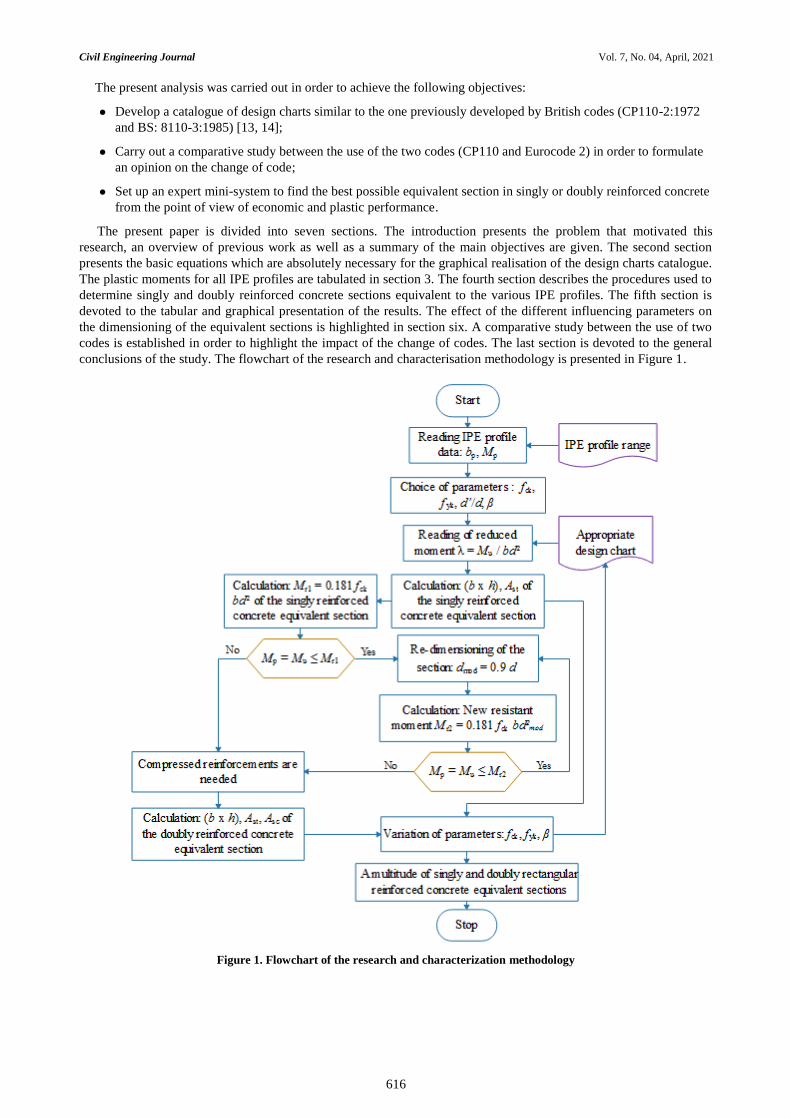
conclusions of the study. The flowchart of the research and characterisation methodology is presented in Figure 1.
Figure 1. Flowchart of the research and characterization methodology
Civil Engineering Journal Vol. 7, No. 04, April, 2021
617
2. Design and Graphic Development of a Catalogue of Design Charts
2.1. Designing Equations
The design charts, by using the characteristics of the materials adopted by Eurocode 2, are obtained by plotting the
reduced moment (Mu/bd²), the tensioned reinforcement ratio (ρst = 100Ast/bd) and the compressed reinforcement ratio
(ρsc = 100Asc/bd) for singly and doubly reinforced concrete rectangular beams and for different values of characteristic
steel strength (fyk), concrete cylinder strength (fck) and parameter d'/d. This catalogue of design charts is similar to the
one published in the British codes (CP110-2:1972 and BS: 8110-3:1985) and these design charts cannot be used to
obtain the complete detailed design of any member but they may be used as an aid when analysing the cross section of
a member at the ultimate limit state. The charts have been based on the assumptions laid down in BS EN 1992-1-
1:2004+A1:2014 [20], use being made of the simplified rectangular stress block based on the Whitney principle which
was previously been adopted by BAEL rules [17].
The plotting of this design charts is based on the digitization of the equations obtained by taking the balance of
moments about the neutral axis of the section:
𝑀u = 0.567 𝑓ck 0.8𝑥 (𝑥 − 0.8𝑥/2) + 𝑓sc 𝐴sc(𝑥 − 𝑑′) + 𝑓st 𝐴st(𝑑 − 𝑥) (1)
𝑓st 𝐴st = 0.454 𝑓ck 𝑏 𝑥 + 𝑓sc 𝐴sc (2)
The Equations 1 and 2 can be written as:
𝑀u
𝑏𝑑²= 0.454𝑓ck
𝑥²
𝑑²(1 − 0.40) + 𝑓sc
𝐴sc
𝑏𝑑(
𝑥
𝑑−
𝑑′
𝑑) + 𝑓st
𝐴st
𝑏𝑑(1 −
𝑥
𝑑) (1a)
𝑓st𝐴st
𝑏𝑑= 0.454𝑓ck
𝑥
𝑑+ 𝑓sc
𝐴sc
𝑏𝑑 (2a)
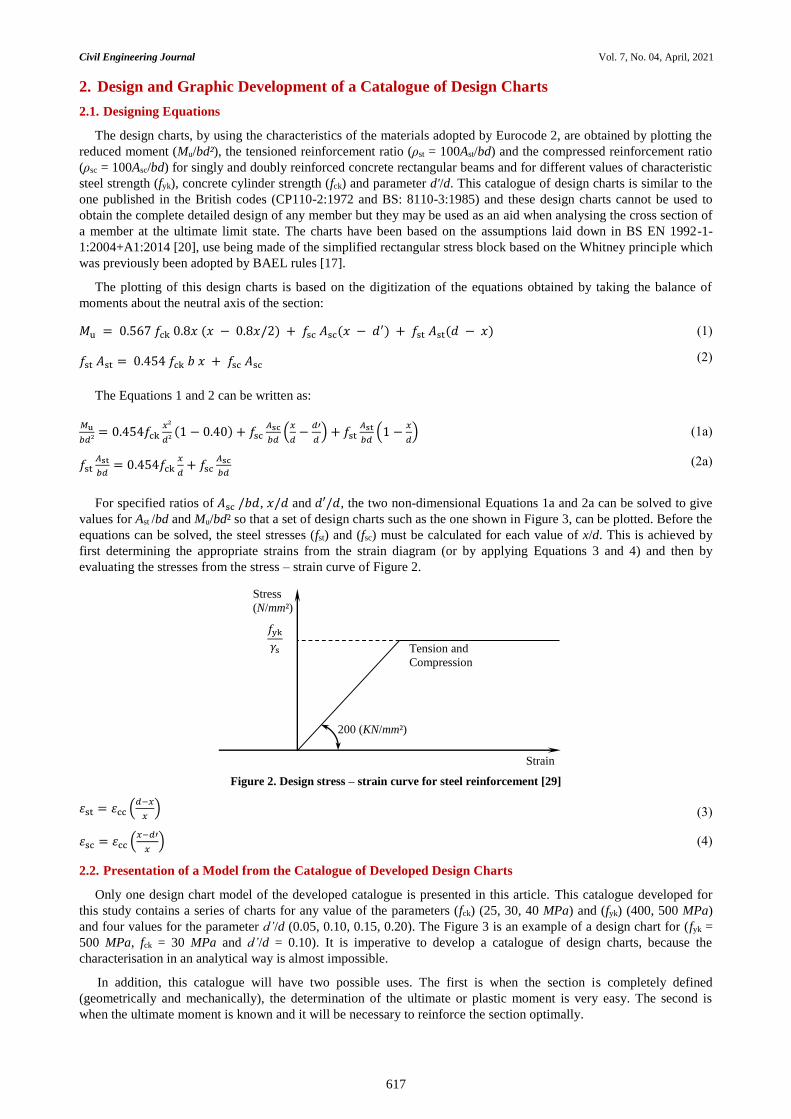
For specified ratios of 𝐴sc /𝑏𝑑, 𝑥/𝑑 and 𝑑′/𝑑, the two non-dimensional Equations 1a and 2a can be solved to give
values for Ast /bd and Mu/bd² so that a set of design charts such as the one shown in Figure 3, can be plotted. Before the
equations can be solved, the steel stresses (fst) and (fsc) must be calculated for each value of x/d. This is achieved by
first determining the appropriate strains from the strain diagram (or by applying Equations 3 and 4) and then by
evaluating the stresses from the stress – strain curve of Figure 2.
Figure 2. Design stress – strain curve for steel reinforcement [29]
𝜀st = 𝜀cc (𝑑−𝑥
𝑥) (3)
𝜀sc = 𝜀cc (𝑥−𝑑′
𝑥) (4)
2.2. Presentation of a Model from the Catalogue of Developed Design Charts
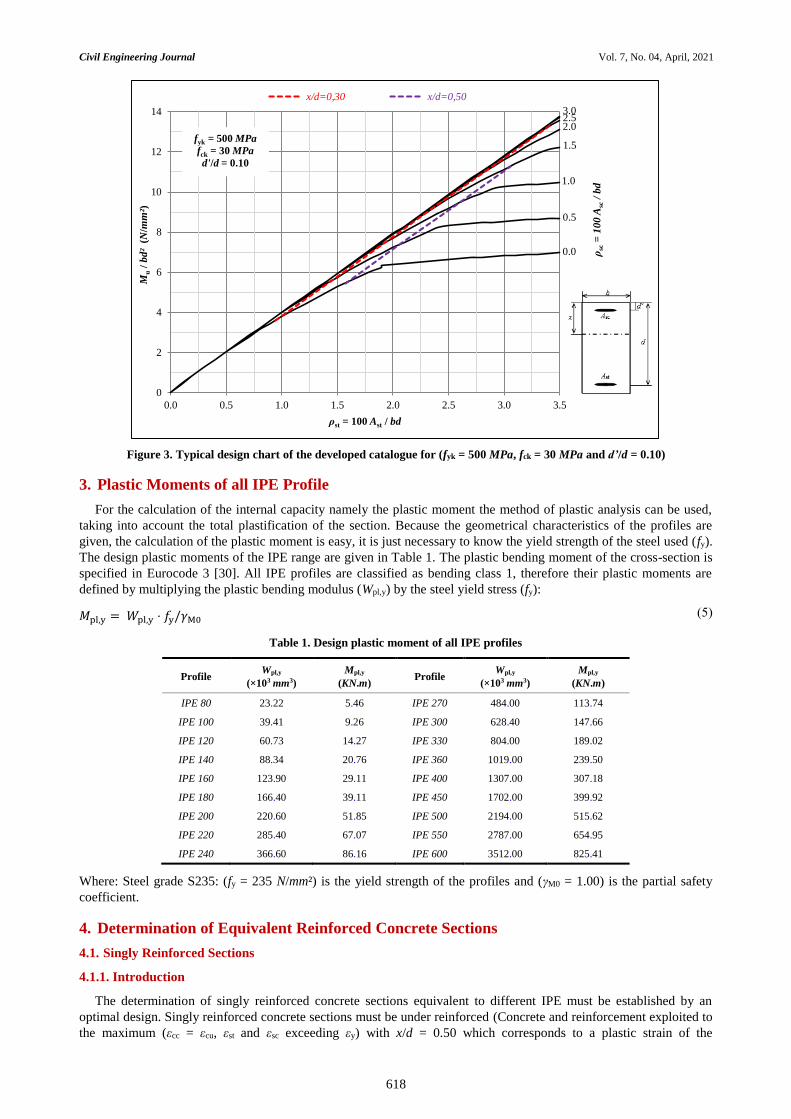
Only one design chart model of the developed catalogue is presented in this article. This catalogue developed for
this study contains a series of charts for any value of the parameters (fck) (25, 30, 40 MPa) and (fyk) (400, 500 MPa)
and four values for the parameter d’/d (0.05, 0.10, 0.15, 0.20). The Figure 3 is an example of a design chart for (fyk =
500 MPa, fck = 30 MPa and d’/d = 0.10). It is imperative to develop a catalogue of design charts, because the
characterisation in an analytical way is almost impossible.
In addition, this catalogue will have two possible uses. The first is when the section is completely defined
(geometrically and mechanically), the determination of the ultimate or plastic moment is very easy. The second is
when the ultimate moment is known and it will be necessary to reinforce the section optimally.
𝑓yk
𝛾s
Strain
Stress
(N/mm²)
200 (KN/mm²)
Tension and
Compression
Civil Engineering Journal Vol. 7, No. 04, April, 2021
618
Figure 3. Typical design chart of the developed catalogue for (fyk = 500 MPa, fck = 30 MPa and d’/d = 0.10)
3. Plastic Moments of all IPE Profile
For the calculation of the internal capacity namely the plastic moment the method of plastic analysis can be used,
taking into account the total plastification of the section. Because the geometrical characteristics of the profiles are
given, the calculation of the plastic moment is easy, it is just necessary to know the yield strength of the steel used (fy).
The design plastic moments of the IPE range are given in Table 1. The plastic bending moment of the cross-section is
specified in Eurocode 3 [30]. All IPE profiles are classified as bending class 1, therefore their plastic moments are
defined by multiplying the plastic bending modulus (Wpl,y) by the steel yield stress (fy):
𝑀pl,y = 𝑊pl,y ⋅ 𝑓y/𝛾M0 (5)
Table 1. Design plastic moment of all IPE profiles
Profile Wpl,y
(×103 mm3)
Mpl,y
(KN.m) Profile
Wpl,y
(×103 mm3)
Mpl,y
(KN.m)
IPE 80 23.22 5.46 IPE 270 484.00 113.74
IPE 100 39.41 9.26 IPE 300 628.40 147.66
IPE 120 60.73 14.27 IPE 330 804.00 189.02
IPE 140 88.34 20.76 IPE 360 1019.00 239.50
IPE 160 123.90 29.11 IPE 400 1307.00 307.18
IPE 180 166.40 39.11 IPE 450 1702.00 399.92
IPE 200 220.60 51.85 IPE 500 2194.00 515.62
IPE 220 285.40 67.07 IPE 550 2787.00 654.95
IPE 240 366.60 86.16 IPE 600 3512.00 825.41
Where: Steel grade S235: (fy = 235 N/mm²) is the yield strength of the profiles and (γM0 = 1.00) is the partial safety
coefficient.
4. Determination of Equivalent Reinforced Concrete Sections
4.1. Singly Reinforced Sections
4.1.1. Introduction
The determination of singly reinforced concrete sections equivalent to different IPE must be established by an
optimal design. Singly reinforced concrete sections must be under reinforced (Concrete and reinforcement exploited to
the maximum (εcc = εcu, εst and εsc exceeding εy) with x/d = 0.50 which corresponds to a plastic strain of the
0
2
4
6
8
10
12
14
0.0 0.5 1.0 1.5 2.0 2.5 3.0 3.5
Mu
/ b
d²
(N/m
m²)
ρst = 100 Ast / bd
x/d=0,30 x/d=0,50
ρsc
= 1
00
Asc
/ b
d
0.0
0.5
1.0
1.5
2.02.53.0
fyk = 500 MPa
fck = 30 MPa
d'/d = 0.10

Civil Engineering Journal Vol. 7, No. 04, April, 2021
619
reinforcement). It is a question of determining the dimensions of the equivalent rectangular section (b x h) and the
tensile reinforcement (Ast). This is an arduous and complex problem because it consists in determining several
unknowns at the same time.
This operation can be carried out by exploiting the catalogue of design charts developed. These design charts must
be designed according to the influential parameters, namely the reinforcement covering d’/d, the characteristic
compressive strength of concrete (fck), the characteristic yield strength of steels (fyk) and the position of the neutral axis
x/d, etc. (See Figure 3).
4.1.2. Determination Process
Principles
The process requires knowing and setting the following parameters (fck, fyk and d’/d) beforehand. It should be noted
that each of the design charts in the catalogue developed has been plotted for a combination of these parameters.
Thereafter, it is imperative to fix one of the geometric unknowns. For the present study, it was decided to fix the width
of the equivalent concrete section (b) in proportion to the width of a given profile (bp). This proportionality ratio is
noted (β = b/bp) and varies from 1.50 to 2.00 with a step of 0.25. This range corresponds to usual and practical
rectangular cross-sections. In addition, the useful depth of the equivalent rectangular section (d) must also be fixed. In
this study (d = 0.9 h).
Thus, the process of determining equivalent sections can be started and with an additional requirement for x/d. In
fact, for the steel strains to be plastic (x/d must be ≤ 0.50). As for the plastic equivalence, the ultimate moment of the
rectangular cross-section (Mu) is taken equal to the plastic moment (Mp) of the profile concerned.
Procedure
Taking the appropriate design chart for a given combination of (fck, fyk and d’/d). In this design chart, the
intersection of the straight line (x/d = 0.50) with the curve (ρsc = 0) gives a point where its horizontal projection gives
the value of the reduced moment (λ) and its vertical projection gives the value of (ρst).
𝑀u 𝑏. 𝑑2⁄ = 𝜆 (6)
From Equation 6 there is:
𝑑 = √𝑀u/𝜆. 𝑏 = √𝑀u/𝜆. 𝛽𝑏p (7)
So: h = d / 0.9;
𝜌st = 100 𝐴st 𝑏𝑑⁄ (8)
From Equation 8 there is:
𝐴st = 𝜌st𝑏.𝑑
100 (9)
All unknowns (b, h and Ast) are consequently determined. By varying the values of the geometric ratio (β), the
characteristic strength of concrete (fck) and the steel yield strength (fyk). The result is a series of singly reinforced
rectangular concrete sections for the IPE profile range.
Processing an Example
Taking an example, the case of the IPE 270 with (β = 1.50), the singly reinforced equivalent section is determined
as follows:
The data for IPE 270: Mu = Mp = 113.74 KN.m, bp = 13.5 cm
From the appropriate design chart, for example, (fck = 30 MPa, fyk = 500 MPa, d’/d = 0.10) and with (x/d = 0.50).
The values of the reduced moment (λ) and the tensile reinforcement ratio (ρst) can be deduced as follows:
λ = Mu / bd² = 5.416 N/mm² and ρst =100 Ast/bd = 1.60
The results for the equivalent singly reinforced concrete section for this example are:
b = β bp = 20.25 cm d = 32.2 cm
h = 35.8 cm Ast = 10.43 cm²
Civil Engineering Journal Vol. 7, No. 04, April, 2021
620
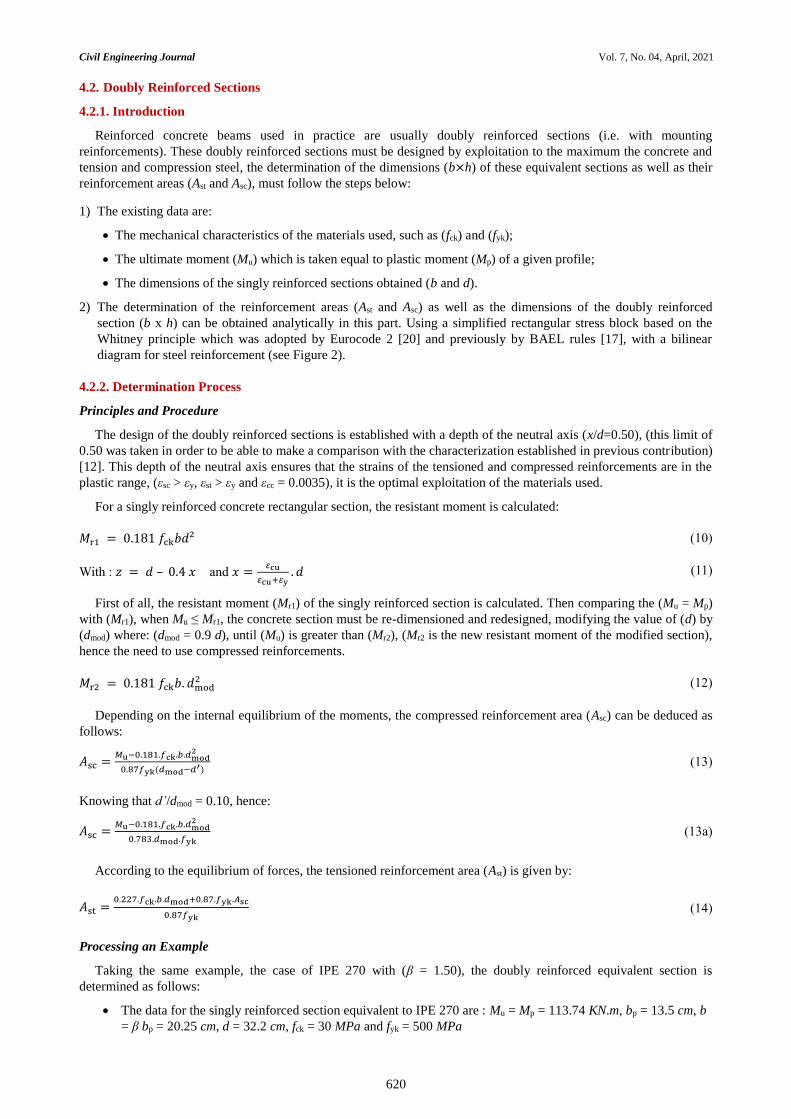
4.2. Doubly Reinforced Sections
4.2.1. Introduction
Reinforced concrete beams used in practice are usually doubly reinforced sections (i.e. with mounting
reinforcements). These doubly reinforced sections must be designed by exploitation to the maximum the concrete and
tension and compression steel, the determination of the dimensions (b×h) of these equivalent sections as well as their
reinforcement areas (Ast and Asc), must follow the steps below:
1) The existing data are:
The mechanical characteristics of the materials used, such as (fck) and (fyk);
The ultimate moment (Mu) which is taken equal to plastic moment (Mp) of a given profile;
The dimensions of the singly reinforced sections obtained (b and d).
2) The determination of the reinforcement areas (Ast and Asc) as well as the dimensions of the doubly reinforced
section (b x h) can be obtained analytically in this part. Using a simplified rectangular stress block based on the
Whitney principle which was adopted by Eurocode 2 [20] and previously by BAEL rules [17], with a bilinear
diagram for steel reinforcement (see Figure 2).
4.2.2. Determination Process
Principles and Procedure
The design of the doubly reinforced sections is established with a depth of the neutral axis (x/d=0.50), (this limit of
0.50 was taken in order to be able to make a comparison with the characterization established in previous contribution)
[12]. This depth of the neutral axis ensures that the strains of the tensioned and compressed reinforcements are in the
plastic range, (εsc > εy, εst > εy and εcc = 0.0035), it is the optimal exploitation of the materials used.
For a singly reinforced concrete rectangular section, the resistant moment is calculated:
𝑀r1 = 0.181 𝑓ck𝑏𝑑² (10)
With : 𝑧 = 𝑑 – 0.4 𝑥 and 𝑥 =𝜀cu
𝜀cu+𝜀y. 𝑑 (11)
First of all, the resistant moment (Mr1) of the singly reinforced section is calculated. Then comparing the (Mu = Mp)
with (Mr1), when Mu ≤ Mr1, the concrete section must be re-dimensioned and redesigned, modifying the value of (d) by
(dmod) where: (dmod = 0.9 d), until (Mu) is greater than (Mr2), (Mr2 is the new resistant moment of the modified section),
hence the need to use compressed reinforcements.
𝑀r2 = 0.181 𝑓ck𝑏. 𝑑mod2 (12)
Depending on the internal equilibrium of the moments, the compressed reinforcement area (Asc) can be deduced as
follows:
𝐴sc =𝑀u−0.181.𝑓ck.𝑏.𝑑mod
2
0.87𝑓yk(𝑑mod−𝑑′) (13)
Knowing that d’/dmod = 0.10, hence:
𝐴sc =𝑀u−0.181.𝑓ck.𝑏.𝑑mod
2
0.783.𝑑mod.𝑓yk (13a)
According to the equilibrium of forces, the tensioned reinforcement area (Ast) is given by:
𝐴st =0.227.𝑓ck.𝑏.𝑑mod+0.87.𝑓yk.𝐴sc
0.87𝑓yk (14)
Processing an Example
Taking the same example, the case of IPE 270 with (β = 1.50), the doubly reinforced equivalent section is
determined as follows:
The data for the singly reinforced section equivalent to IPE 270 are : Mu = Mp = 113.74 KN.m, bp = 13.5 cm, b
= β bp = 20.25 cm, d = 32.2 cm, fck = 30 MPa and fyk = 500 MPa
Civil Engineering Journal Vol. 7, No. 04, April, 2021
621
By applying the principles and procedure with the formulas of paragraph 4.2.2.1.
The results for the equivalent doubly reinforced concrete section for this example are:
b = β bp = 20.25 cm dmod = 29.0 cm h = 32.2 cm
Ast = 11.07 cm² Asc = 1.89 cm²
5. Results
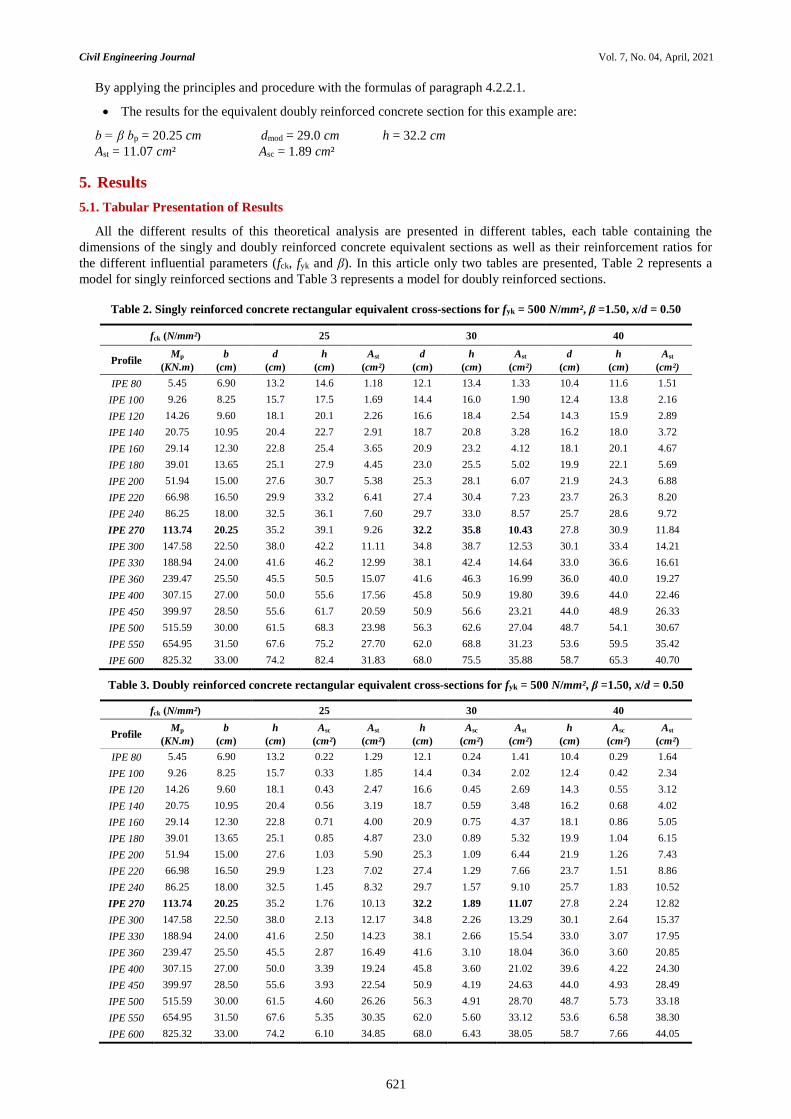
5.1. Tabular Presentation of Results
All the different results of this theoretical analysis are presented in different tables, each table containing the
dimensions of the singly and doubly reinforced concrete equivalent sections as well as their reinforcement ratios for
the different influential parameters (fck, fyk and β). In this article only two tables are presented, Table 2 represents a
model for singly reinforced sections and Table 3 represents a model for doubly reinforced sections.
Table 2. Singly reinforced concrete rectangular equivalent cross-sections for fyk = 500 N/mm², β =1.50, x/d = 0.50
fck (N/mm²) 25 30 40
Profile Mp
(KN.m)
b
(cm)
d
(cm)
h
(cm)
Ast
(cm²)
d
(cm)
h
(cm)
Ast
(cm²)
d
(cm)
h
(cm)
Ast
(cm²)
IPE 80 5.45 6.90 13.2 14.6 1.18 12.1 13.4 1.33 10.4 11.6 1.51
IPE 100 9.26 8.25 15.7 17.5 1.69 14.4 16.0 1.90 12.4 13.8 2.16
IPE 120 14.26 9.60 18.1 20.1 2.26 16.6 18.4 2.54 14.3 15.9 2.89
IPE 140 20.75 10.95 20.4 22.7 2.91 18.7 20.8 3.28 16.2 18.0 3.72
IPE 160 29.14 12.30 22.8 25.4 3.65 20.9 23.2 4.12 18.1 20.1 4.67
IPE 180 39.01 13.65 25.1 27.9 4.45 23.0 25.5 5.02 19.9 22.1 5.69
IPE 200 51.94 15.00 27.6 30.7 5.38 25.3 28.1 6.07 21.9 24.3 6.88
IPE 220 66.98 16.50 29.9 33.2 6.41 27.4 30.4 7.23 23.7 26.3 8.20
IPE 240 86.25 18.00 32.5 36.1 7.60 29.7 33.0 8.57 25.7 28.6 9.72
IPE 270 113.74 20.25 35.2 39.1 9.26 32.2 35.8 10.43 27.8 30.9 11.84
IPE 300 147.58 22.50 38.0 42.2 11.11 34.8 38.7 12.53 30.1 33.4 14.21
IPE 330 188.94 24.00 41.6 46.2 12.99 38.1 42.4 14.64 33.0 36.6 16.61
IPE 360 239.47 25.50 45.5 50.5 15.07 41.6 46.3 16.99 36.0 40.0 19.27
IPE 400 307.15 27.00 50.0 55.6 17.56 45.8 50.9 19.80 39.6 44.0 22.46
IPE 450 399.97 28.50 55.6 61.7 20.59 50.9 56.6 23.21 44.0 48.9 26.33
IPE 500 515.59 30.00 61.5 68.3 23.98 56.3 62.6 27.04 48.7 54.1 30.67
IPE 550 654.95 31.50 67.6 75.2 27.70 62.0 68.8 31.23 53.6 59.5 35.42
IPE 600 825.32 33.00 74.2 82.4 31.83 68.0 75.5 35.88 58.7 65.3 40.70
Table 3. Doubly reinforced concrete rectangular equivalent cross-sections for fyk = 500 N/mm², β =1.50, x/d = 0.50
fck (N/mm²) 25 30 40
Profile Mp
(KN.m)
b
(cm)
h
(cm)
Asc
(cm²)
Ast
(cm²)
h
(cm)
Asc
(cm²)
Ast
(cm²)
h
(cm)
Asc
(cm²)
Ast
(cm²)
IPE 80 5.45 6.90 13.2 0.22 1.29 12.1 0.24 1.41 10.4 0.29 1.64
IPE 100 9.26 8.25 15.7 0.33 1.85 14.4 0.34 2.02 12.4 0.42 2.34
IPE 120 14.26 9.60 18.1 0.43 2.47 16.6 0.45 2.69 14.3 0.55 3.12
IPE 140 20.75 10.95 20.4 0.56 3.19 18.7 0.59 3.48 16.2 0.68 4.02
IPE 160 29.14 12.30 22.8 0.71 4.00 20.9 0.75 4.37 18.1 0.86 5.05
IPE 180 39.01 13.65 25.1 0.85 4.87 23.0 0.89 5.32 19.9 1.04 6.15
IPE 200 51.94 15.00 27.6 1.03 5.90 25.3 1.09 6.44 21.9 1.26 7.43
IPE 220 66.98 16.50 29.9 1.23 7.02 27.4 1.29 7.66 23.7 1.51 8.86
IPE 240 86.25 18.00 32.5 1.45 8.32 29.7 1.57 9.10 25.7 1.83 10.52
IPE 270 113.74 20.25 35.2 1.76 10.13 32.2 1.89 11.07 27.8 2.24 12.82
IPE 300 147.58 22.50 38.0 2.13 12.17 34.8 2.26 13.29 30.1 2.64 15.37
IPE 330 188.94 24.00 41.6 2.50 14.23 38.1 2.66 15.54 33.0 3.07 17.95
IPE 360 239.47 25.50 45.5 2.87 16.49 41.6 3.10 18.04 36.0 3.60 20.85
IPE 400 307.15 27.00 50.0 3.39 19.24 45.8 3.60 21.02 39.6 4.22 24.30
IPE 450 399.97 28.50 55.6 3.93 22.54 50.9 4.19 24.63 44.0 4.93 28.49
IPE 500 515.59 30.00 61.5 4.60 26.26 56.3 4.91 28.70 48.7 5.73 33.18
IPE 550 654.95 31.50 67.6 5.35 30.35 62.0 5.60 33.12 53.6 6.58 38.30
IPE 600 825.32 33.00 74.2 6.10 34.85 68.0 6.43 38.05 58.7 7.66 44.05
Civil Engineering Journal Vol. 7, No. 04, April, 2021
622
5.2. Graphical Presentation of Results
5.2.1. Introduction
The cross-sectional dimensions equivalent to the individual IPE profiles obtained from this plastic analysis
represent rectangular cross-sections that are usual in practice. The adequate exposure of the different results is the
graphical presentation or more precisely the development of a series of curves by scanning the main influencing
parameters. Their exploitation makes it easy to determine the most appropriate equivalent sections.
5.2.2. Choice of the Adopted Coordinate System
The choice of the coordinate system obeys to major constraint, that of having all the results on the same graph. The
most judicious way is to opt for the logarithmic coordinate system. The best system that has proved successful is that
of presenting the results by means of curves with three systems of coordinates.
The entire range of IPE profiles is shown on the x-axis. On the left side of the y-axis, the values ln (Ac) and ln (Ap)
are shown, where: (Ac) is the area of the equivalent reinforced concrete section, (Ap) is the area of the IPE profile. On
the right side of the y-axis, the ratios of reinforcement (ρst = 100 Ast/bd and ρsc = 100 Asc/bd) are shown, hence the right
scale takes an independent reading from the left one.
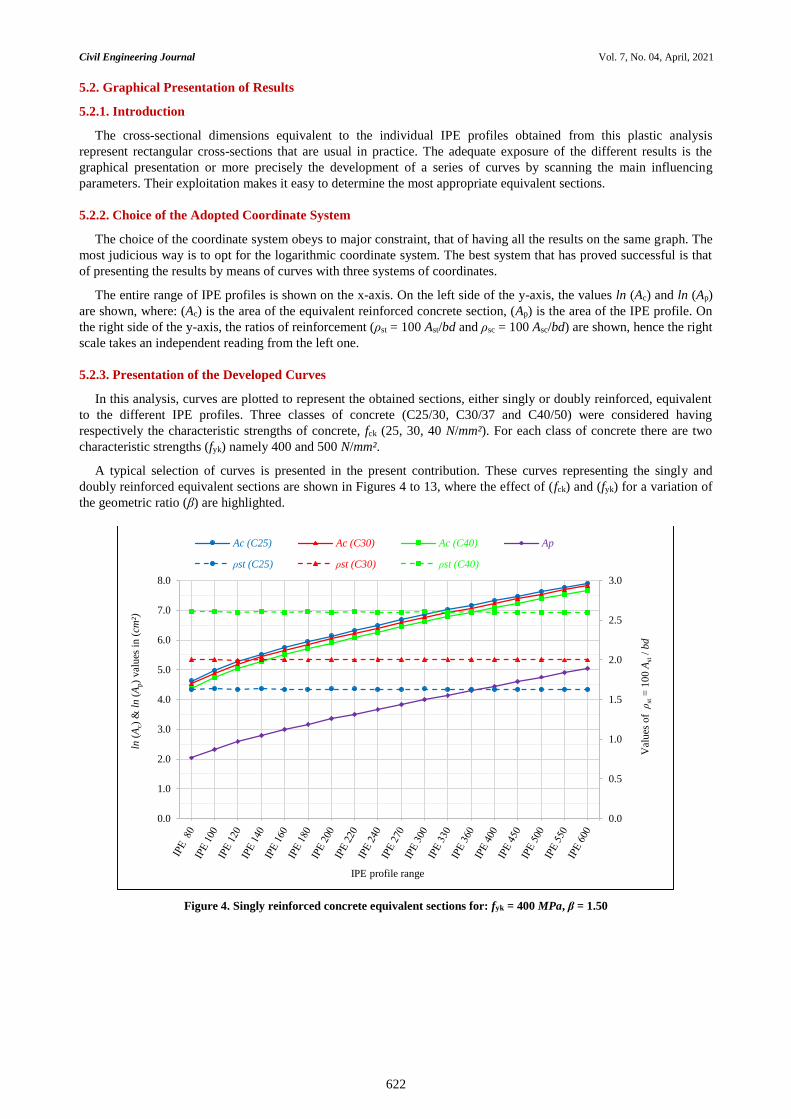
5.2.3. Presentation of the Developed Curves
In this analysis, curves are plotted to represent the obtained sections, either singly or doubly reinforced, equivalent
to the different IPE profiles. Three classes of concrete (C25/30, C30/37 and C40/50) were considered having
respectively the characteristic strengths of concrete, fck (25, 30, 40 N/mm²). For each class of concrete there are two
characteristic strengths (fyk) namely 400 and 500 N/mm².
A typical selection of curves is presented in the present contribution. These curves representing the singly and
doubly reinforced equivalent sections are shown in Figures 4 to 13, where the effect of (fck) and (fyk) for a variation of
the geometric ratio (β) are highlighted.
Figure 4. Singly reinforced concrete equivalent sections for: fyk = 400 MPa, β = 1.50
0.0
0.5
1.0
1.5
2.0
2.5
3.0
0.0
1.0
2.0
3.0
4.0
5.0
6.0
7.0
8.0
ln(A
c) &
ln
(Ap)
val
ues
in
(cm
²)
IPE profile range
Ac (C25) Ac (C30) Ac (C40) Ap
ρst (C25) ρst (C30) ρst (C40)
Val
ues
of
ρst
= 1
00
Ast
/ b
d

Civil Engineering Journal Vol. 7, No. 04, April, 2021
623
Figure 5. Singly reinforced concrete equivalent sections for: fyk = 400 MPa, β = 1.75
Figure 6. Singly reinforced concrete equivalent sections for: fyk = 400 MPa, β = 2.00
Figure 7. Singly reinforced concrete equivalent sections for: fyk = 500 MPa, β = 1.75
0.0
0.5
1.0
1.5
2.0
2.5
3.0
0.0
1.0
2.0
3.0
4.0
5.0
6.0
7.0
8.0
9.0
ln(A
c) &
ln
(Ap)
val
ues
in
(cm
²)
IPE profile range
Ac (C25) Ac (C30) Ac (C40) Ap
ρst (C25) ρst (C30) ρst (C40)
Val
ues
of
ρst
= 1
00
Ast
/ b
d0.0
0.5
1.0
1.5
2.0
2.5
3.0
0.0
1.0
2.0
3.0
4.0
5.0
6.0
7.0
8.0
9.0
ln(A
c) &
ln
(Ap)
val
ues
in
(cm
²)
IPE profile range
Ac (C25) Ac (C30) Ac (C40) Ap
ρst (C25) ρst (C30) ρst (C40)
Val
ues
of
ρst
= 1
00
Ast
/ b
d
0.0
0.5
1.0
1.5
2.0
2.5
3.0
0.0
1.0
2.0
3.0
4.0
5.0
6.0
7.0
8.0
9.0
ln (
Ac)
& l
n(A
p)
val
ues
in
(cm
²)
IPE profile range
Ac (C25) Ac (C30) Ac (C40) Ap
ρst (C25) ρst (C30) ρst (C40)
Val
ues
of
ρst
= 1
00
Ast
/ b
d

Civil Engineering Journal Vol. 7, No. 04, April, 2021
624
Figure 8. Singly reinforced concrete equivalent sections for: fyk = 500 MPa, β = 2.00
Figure 9. Doubly reinforced concrete equivalent sections for: fyk = 400 MPa, β = 1.50
Figure 10. Doubly reinforced concrete equivalent sections for: fyk = 400 MPa, β = 1.75
0.0
0.5
1.0
1.5
2.0
2.5
3.0
0.0
1.0
2.0
3.0
4.0
5.0
6.0
7.0
8.0
9.0
ln(A
c) &
ln
(Ap)
val
ues
in
(cm
²)
IPE profile range
Ac (C25) Ac (C30) Ac (C40) Ap
ρst (C25) ρst (C30) ρst (C40)
Val
ues
of
ρst
= 1
00
Ast
/ b
d
0.0
0.5
1.0
1.5
2.0
2.5
3.0
0.0
1.0
2.0
3.0
4.0
5.0
6.0
7.0
8.0
ln (
Ac)
& l
n(A
p)
val
ues
in
(cm
²)
IPE profile range
Ac (C25) Ac (C30) Ac (C40) Ap ρst (C25)
ρst (C30) ρst (C40) ρsc (C25) ρsc (C30) ρsc (C40)
Val
ues
of
ρst
& ρ
sc
0.0
0.5
1.0
1.5
2.0
2.5
3.0
0.0
1.0
2.0
3.0
4.0
5.0
6.0
7.0
8.0
ln(A
c) &
ln
(Ap)
val
ues
in
(cm
²)
IPE profile range
Ac (C25) Ac (C30) Ac (C40) Apρst (C25) ρst (C30) ρst (C40) ρsc (C25)ρsc (C30) ρsc (C40)
Val
ues
of
ρst
& ρ
sc
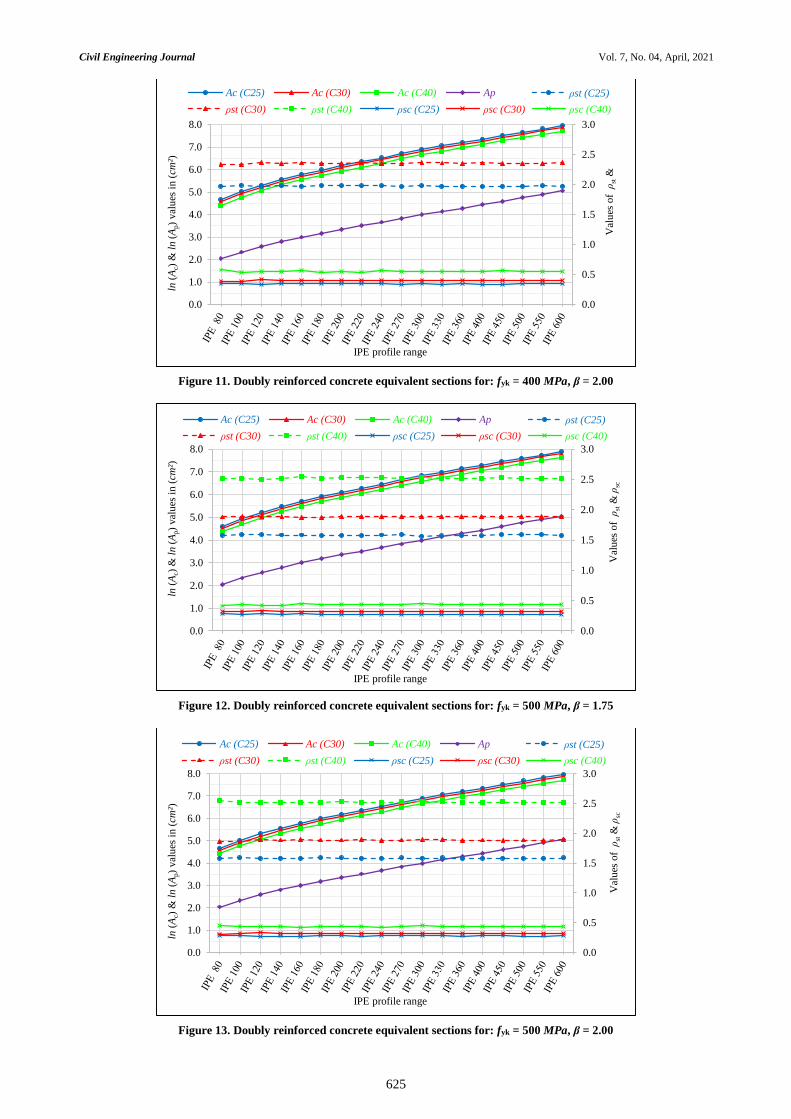
Civil Engineering Journal Vol. 7, No. 04, April, 2021
625
Figure 11. Doubly reinforced concrete equivalent sections for: fyk = 400 MPa, β = 2.00
Figure 12. Doubly reinforced concrete equivalent sections for: fyk = 500 MPa, β = 1.75
Figure 13. Doubly reinforced concrete equivalent sections for: fyk = 500 MPa, β = 2.00
0.0
0.5
1.0
1.5
2.0
2.5
3.0
0.0
1.0
2.0
3.0
4.0
5.0
6.0
7.0
8.0
ln(A
c) &
ln
(Ap)
val
ues
in
(cm
²)
IPE profile range
Ac (C25) Ac (C30) Ac (C40) Ap ρst (C25)
ρst (C30) ρst (C40) ρsc (C25) ρsc (C30) ρsc (C40)
Val
ues
of
ρst
&
0.0
0.5
1.0
1.5
2.0
2.5
3.0
0.0
1.0
2.0
3.0
4.0
5.0
6.0
7.0
8.0
ln(A
c) &
ln
(Ap)
val
ues
in
(cm
²)
IPE profile range
Ac (C25) Ac (C30) Ac (C40) Ap ρst (C25)
ρst (C30) ρst (C40) ρsc (C25) ρsc (C30) ρsc (C40)
Val
ues
of
ρst
& ρ
sc
0.0
0.5
1.0
1.5
2.0
2.5
3.0
0.0
1.0
2.0
3.0
4.0
5.0
6.0
7.0
8.0
ln(A
c) &
ln
(Ap)
val
ues
in
(cm
²)
IPE profile range
Ac (C25) Ac (C30) Ac (C40) Ap ρst (C25)
ρst (C30) ρst (C40) ρsc (C25) ρsc (C30) ρsc (C40)
Val
ues
of
ρst
& ρ
sc
Civil Engineering Journal Vol. 7, No. 04, April, 2021
626
6. Effects of the Different Variables
6.1. Effects of the Characteristic Compressive Strength of Concrete (fck) and the Ratio (β)
6.1.1. Introduction
Figures 4 to 13 clearly illustrate the effect of increasing the characteristic compressive strength of concrete (fck) on
the total height (h) of the equivalent rectangular section for both types of sections (singly and doubly reinforced). It
can also be seen that the curves for the three values of (fck) have the same shape in the same graph.
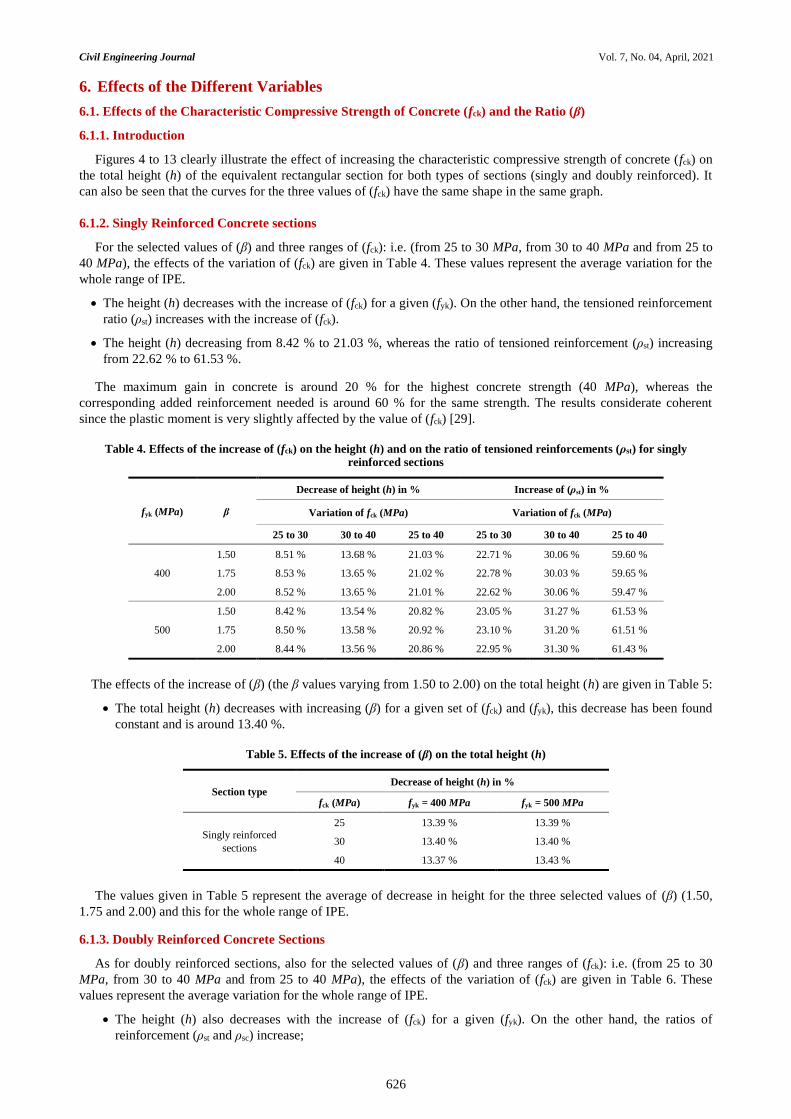
6.1.2. Singly Reinforced Concrete sections
For the selected values of (β) and three ranges of (fck): i.e. (from 25 to 30 MPa, from 30 to 40 MPa and from 25 to
40 MPa), the effects of the variation of (fck) are given in Table 4. These values represent the average variation for the
whole range of IPE.
The height (h) decreases with the increase of (fck) for a given (fyk). On the other hand, the tensioned reinforcement
ratio (ρst) increases with the increase of (fck).
The height (h) decreasing from 8.42 % to 21.03 %, whereas the ratio of tensioned reinforcement (ρst) increasing
from 22.62 % to 61.53 %.
The maximum gain in concrete is around 20 % for the highest concrete strength (40 MPa), whereas the
corresponding added reinforcement needed is around 60 % for the same strength. The results considerate coherent
since the plastic moment is very slightly affected by the value of (fck) [29].
Table 4. Effects of the increase of (fck) on the height (h) and on the ratio of tensioned reinforcements (ρst) for singly reinforced sections
fyk (MPa) β
Decrease of height (h) in % Increase of (ρst) in %
Variation of fck (MPa) Variation of fck (MPa)
25 to 30 30 to 40 25 to 40 25 to 30 30 to 40 25 to 40
400
1.50 8.51 % 13.68 % 21.03 % 22.71 % 30.06 % 59.60 %
1.75 8.53 % 13.65 % 21.02 % 22.78 % 30.03 % 59.65 %
2.00 8.52 % 13.65 % 21.01 % 22.62 % 30.06 % 59.47 %
500
1.50 8.42 % 13.54 % 20.82 % 23.05 % 31.27 % 61.53 %
1.75 8.50 % 13.58 % 20.92 % 23.10 % 31.20 % 61.51 %
2.00 8.44 % 13.56 % 20.86 % 22.95 % 31.30 % 61.43 %
The effects of the increase of (β) (the β values varying from 1.50 to 2.00) on the total height (h) are given in Table 5:
The total height (h) decreases with increasing (β) for a given set of (fck) and (fyk), this decrease has been found
constant and is around 13.40 %.
Table 5. Effects of the increase of (β) on the total height (h)
Section type Decrease of height (h) in %
fck (MPa) fyk = 400 MPa fyk = 500 MPa
Singly reinforced
sections
25 13.39 % 13.39 %
30 13.40 % 13.40 %
40 13.37 % 13.43 %
The values given in Table 5 represent the average of decrease in height for the three selected values of (β) (1.50,
1.75 and 2.00) and this for the whole range of IPE.
6.1.3. Doubly Reinforced Concrete Sections
As for doubly reinforced sections, also for the selected values of (β) and three ranges of (fck): i.e. (from 25 to 30
MPa, from 30 to 40 MPa and from 25 to 40 MPa), the effects of the variation of (fck) are given in Table 6. These
values represent the average variation for the whole range of IPE.
The height (h) also decreases with the increase of (fck) for a given (fyk). On the other hand, the ratios of
reinforcement (ρst and ρsc) increase;
Civil Engineering Journal Vol. 7, No. 04, April, 2021
627
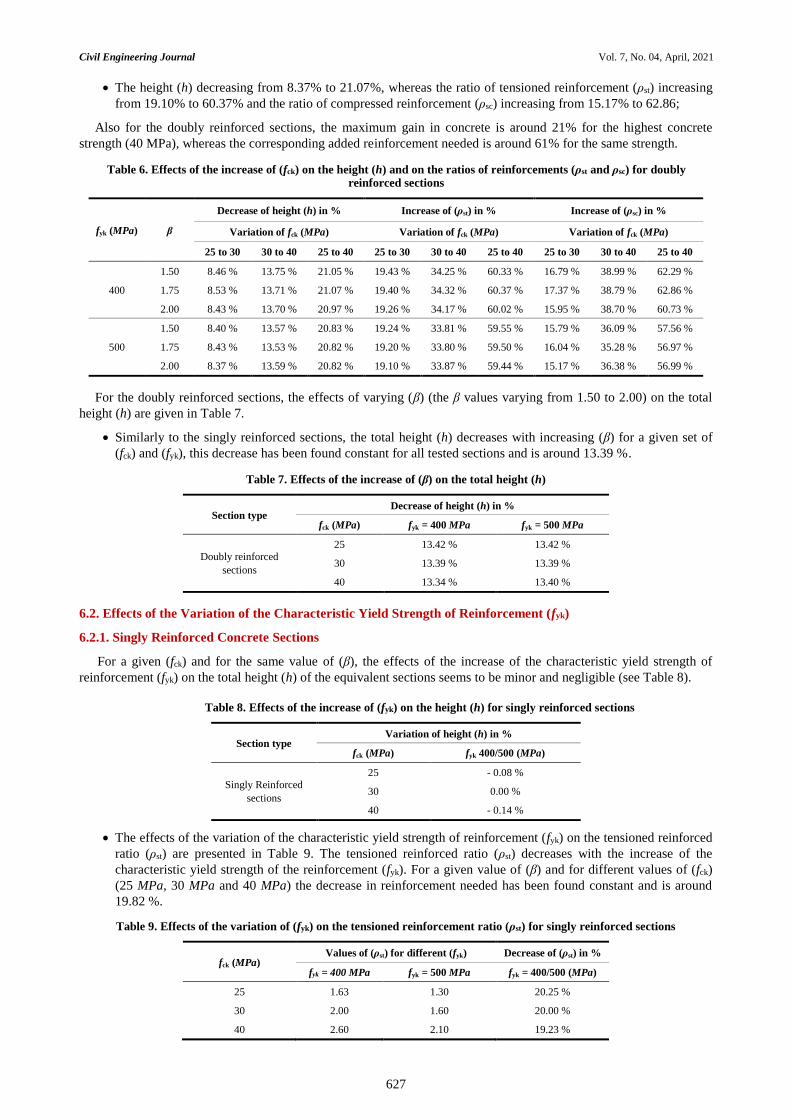
The height (h) decreasing from 8.37% to 21.07%, whereas the ratio of tensioned reinforcement (ρst) increasing
from 19.10% to 60.37% and the ratio of compressed reinforcement (ρsc) increasing from 15.17% to 62.86;
Also for the doubly reinforced sections, the maximum gain in concrete is around 21% for the highest concrete
strength (40 MPa), whereas the corresponding added reinforcement needed is around 61% for the same strength.
Table 6. Effects of the increase of (fck) on the height (h) and on the ratios of reinforcements (ρst and ρsc) for doubly reinforced sections
fyk (MPa) β
Decrease of height (h) in % Increase of (ρst) in % Increase of (ρsc) in %
Variation of fck (MPa) Variation of fck (MPa) Variation of fck (MPa)
25 to 30 30 to 40 25 to 40 25 to 30 30 to 40 25 to 40 25 to 30 30 to 40 25 to 40
400
1.50 8.46 % 13.75 % 21.05 % 19.43 % 34.25 % 60.33 % 16.79 % 38.99 % 62.29 %
1.75 8.53 % 13.71 % 21.07 % 19.40 % 34.32 % 60.37 % 17.37 % 38.79 % 62.86 %
2.00 8.43 % 13.70 % 20.97 % 19.26 % 34.17 % 60.02 % 15.95 % 38.70 % 60.73 %
500
1.50 8.40 % 13.57 % 20.83 % 19.24 % 33.81 % 59.55 % 15.79 % 36.09 % 57.56 %
1.75 8.43 % 13.53 % 20.82 % 19.20 % 33.80 % 59.50 % 16.04 % 35.28 % 56.97 %
2.00 8.37 % 13.59 % 20.82 % 19.10 % 33.87 % 59.44 % 15.17 % 36.38 % 56.99 %
For the doubly reinforced sections, the effects of varying (β) (the β values varying from 1.50 to 2.00) on the total
height (h) are given in Table 7.
Similarly to the singly reinforced sections, the total height (h) decreases with increasing (β) for a given set of
(fck) and (fyk), this decrease has been found constant for all tested sections and is around 13.39 %.
Table 7. Effects of the increase of (β) on the total height (h)
Section type Decrease of height (h) in %
fck (MPa) fyk = 400 MPa fyk = 500 MPa
Doubly reinforced
sections
25 13.42 % 13.42 %
30 13.39 % 13.39 %
40 13.34 % 13.40 %
6.2. Effects of the Variation of the Characteristic Yield Strength of Reinforcement (fyk)
6.2.1. Singly Reinforced Concrete Sections
For a given (fck) and for the same value of (β), the effects of the increase of the characteristic yield strength of
reinforcement (fyk) on the total height (h) of the equivalent sections seems to be minor and negligible (see Table 8).
Table 8. Effects of the increase of (fyk) on the height (h) for singly reinforced sections
Section type Variation of height (h) in %
fck (MPa) fyk 400/500 (MPa)
Singly Reinforced
sections
25 - 0.08 %
30 0.00 %
40 - 0.14 %
The effects of the variation of the characteristic yield strength of reinforcement (fyk) on the tensioned reinforced
ratio (ρst) are presented in Table 9. The tensioned reinforced ratio (ρst) decreases with the increase of the
characteristic yield strength of the reinforcement (fyk). For a given value of (β) and for different values of (fck)
(25 MPa, 30 MPa and 40 MPa) the decrease in reinforcement needed has been found constant and is around
19.82 %.
Table 9. Effects of the variation of (fyk) on the tensioned reinforcement ratio (ρst) for singly reinforced sections
fck (MPa) Values of (ρst) for different (fyk) Decrease of (ρst) in %
fyk = 400 MPa fyk = 500 MPa fyk = 400/500 (MPa)
25 1.63 1.30 20.25 %
30 2.00 1.60 20.00 %
40 2.60 2.10 19.23 %
Civil Engineering Journal Vol. 7, No. 04, April, 2021
628
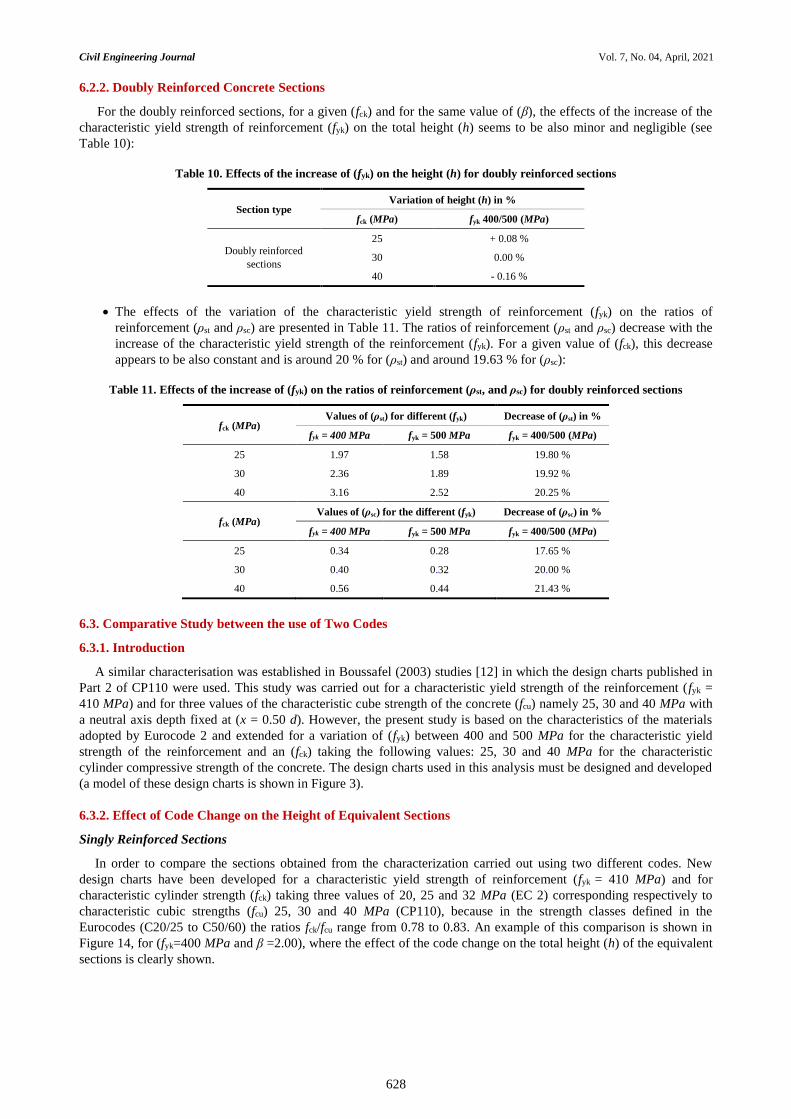
6.2.2. Doubly Reinforced Concrete Sections
For the doubly reinforced sections, for a given (fck) and for the same value of (β), the effects of the increase of the
characteristic yield strength of reinforcement (fyk) on the total height (h) seems to be also minor and negligible (see
Table 10):
Table 10. Effects of the increase of (fyk) on the height (h) for doubly reinforced sections
Section type Variation of height (h) in %
fck (MPa) fyk 400/500 (MPa)
Doubly reinforced
sections
25 + 0.08 %
30 0.00 %
40 - 0.16 %
The effects of the variation of the characteristic yield strength of reinforcement (fyk) on the ratios of
reinforcement (ρst and ρsc) are presented in Table 11. The ratios of reinforcement (ρst and ρsc) decrease with the
increase of the characteristic yield strength of the reinforcement (fyk). For a given value of (fck), this decrease
appears to be also constant and is around 20 % for (ρst) and around 19.63 % for (ρsc):
Table 11. Effects of the increase of (fyk) on the ratios of reinforcement (ρst, and ρsc) for doubly reinforced sections
fck (MPa) Values of (ρst) for different (fyk) Decrease of (ρst) in %
fyk = 400 MPa fyk = 500 MPa fyk = 400/500 (MPa)
25 1.97 1.58 19.80 %
30 2.36 1.89 19.92 %
40 3.16 2.52 20.25 %
fck (MPa) Values of (ρsc) for the different (fyk) Decrease of (ρsc) in %
fyk = 400 MPa fyk = 500 MPa fyk = 400/500 (MPa)
25 0.34 0.28 17.65 %
30 0.40 0.32 20.00 %
40 0.56 0.44 21.43 %
6.3. Comparative Study between the use of Two Codes
6.3.1. Introduction
A similar characterisation was established in Boussafel (2003) studies [12] in which the design charts published in
Part 2 of CP110 were used. This study was carried out for a characteristic yield strength of the reinforcement (fyk =
410 MPa) and for three values of the characteristic cube strength of the concrete (fcu) namely 25, 30 and 40 MPa with
a neutral axis depth fixed at (x = 0.50 d). However, the present study is based on the characteristics of the materials
adopted by Eurocode 2 and extended for a variation of (fyk) between 400 and 500 MPa for the characteristic yield
strength of the reinforcement and an (fck) taking the following values: 25, 30 and 40 MPa for the characteristic
cylinder compressive strength of the concrete. The design charts used in this analysis must be designed and developed
(a model of these design charts is shown in Figure 3).
6.3.2. Effect of Code Change on the Height of Equivalent Sections
Singly Reinforced Sections
In order to compare the sections obtained from the characterization carried out using two different codes. New
design charts have been developed for a characteristic yield strength of reinforcement (fyk = 410 MPa) and for
characteristic cylinder strength (fck) taking three values of 20, 25 and 32 MPa (EC 2) corresponding respectively to
characteristic cubic strengths (fcu) 25, 30 and 40 MPa (CP110), because in the strength classes defined in the
Eurocodes (C20/25 to C50/60) the ratios fck/fcu range from 0.78 to 0.83. An example of this comparison is shown in
Figure 14, for (fyk=400 MPa and β =2.00), where the effect of the code change on the total height (h) of the equivalent
sections is clearly shown.

Civil Engineering Journal Vol. 7, No. 04, April, 2021
629
Figure 14. Effect of the code change on the height (h) of the singly reinforced sections for (fyk = 410 MPa and β = 2.00)
According to the results, for a (fck) adopted by Eurocode 2 corresponding to a (fcu) adopted by CP110 and for the
same (fyk), the heights of the equivalent sections obtained using CP110 are greater than those obtained using Eurocode
2. The effect on the height of the sections (h) and on the tension reinforcement ratio (ρst) is summarised in Table 12.
Table 12. Effect of code change on height (h) and on the tensioned reinforcement ratio (ρst) for singly reinforced sections
fyk (MPa)
Variation of the height (h) in % Variation of (ρst) in %
fck / fcu
20/25 (MPa)
fck / fcu
25/30 (MPa)
fck / fcu
32/40 (MPa)
fck / fcu
20/25 (MPa)
fck / fcu
25/30 (MPa)
fck / fcu
32/40 (MPa)
410 + 2.00 % + 1.20 % + 1.90 % - 5.93 % - 3.77 % + 2.00 %
Doubly Reinforced Sections
As for the doubly reinforced sections, the total height (h) of the equivalent sections obtained using the CP110 code
compared with those obtained using Eurocode 2 is increasing by an average ratio of 2%, (see an example in Figure
15). On the other hand, the ratio of tensioned reinforcement (ρst) decreases by about 5.30 %, while the decrease is
about 23.80 % for the ratio of compressed reinforcement (ρsc).
Figure 15. Effect of the code change on the height (h) of the doubly reinforced sections for the case: (fyk=410 MPa, fck/fcu = 20/25 MPa and β = 2.00) with presentation of reinforcement ratios
0
10
20
30
40
50
60
70
80
Sec
tion
hei
gh
t (h
) in
(cm
)
IPE profile range
h (C20/25) EC2 h (C25/30) EC2 h (C32/40) EC2
h (C20/25) CP110 h (C25/30) CP110 h (C32/40) CP110
fyk = 410 MPa
β = 2.00
0.0
0.2
0.4
0.6
0.8
1.0
1.2
1.4
1.6
1.8
0
10
20
30
40
50
60
70
80
ln(A
c) v
alu
es i
n (
cm²)
IPE profile range
h (C20/25) EC2 h (C20/25) CP110 ρst (C20/25) EC2
ρst (C20/25) CP110 ρsc (C20/25) EC2 ρsc (C20/25) CP110
Va
lues
of ρ
st&
ρ
scfyk = 410 MPa
fck/fcu = 20/25 MPa
β = 2.00
Civil Engineering Journal Vol. 7, No. 04, April, 2021
630
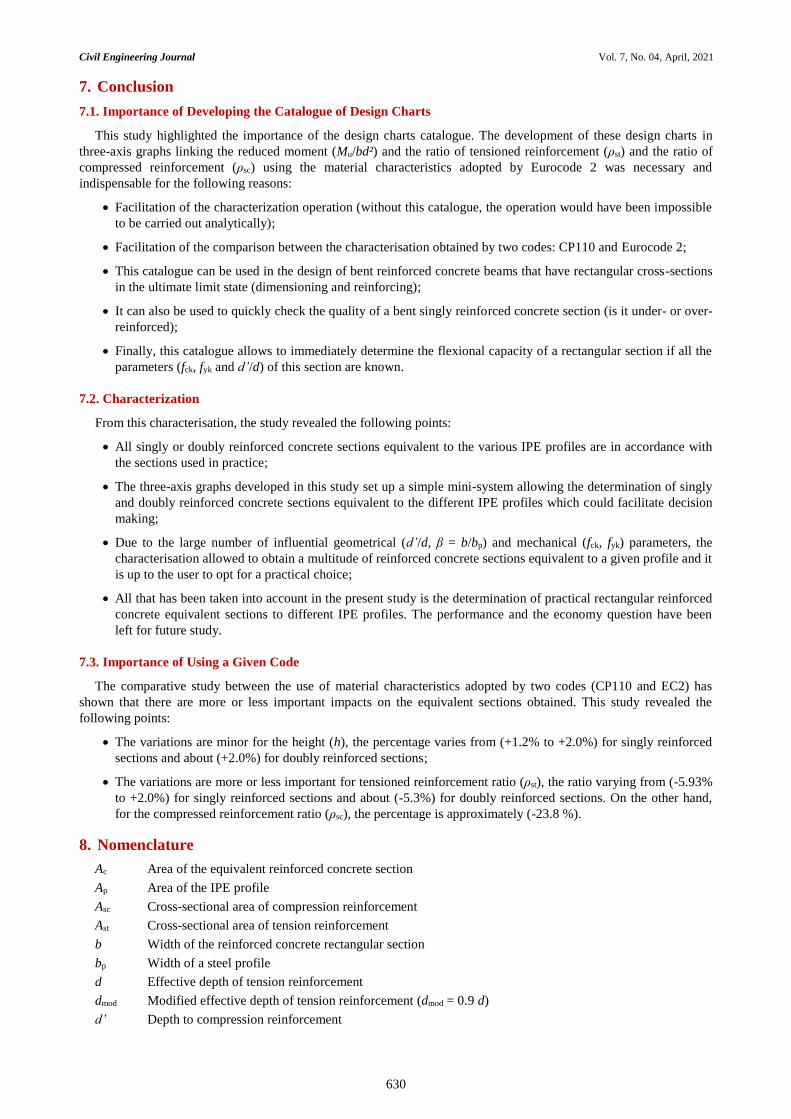
7. Conclusion
7.1. Importance of Developing the Catalogue of Design Charts
This study highlighted the importance of the design charts catalogue. The development of these design charts in
three-axis graphs linking the reduced moment (Mu/bd²) and the ratio of tensioned reinforcement (ρst) and the ratio of
compressed reinforcement (ρsc) using the material characteristics adopted by Eurocode 2 was necessary and
indispensable for the following reasons:
Facilitation of the characterization operation (without this catalogue, the operation would have been impossible
to be carried out analytically);
Facilitation of the comparison between the characterisation obtained by two codes: CP110 and Eurocode 2;
This catalogue can be used in the design of bent reinforced concrete beams that have rectangular cross-sections
in the ultimate limit state (dimensioning and reinforcing);
It can also be used to quickly check the quality of a bent singly reinforced concrete section (is it under- or over-
reinforced);
Finally, this catalogue allows to immediately determine the flexional capacity of a rectangular section if all the
parameters (fck, fyk and d’/d) of this section are known.
7.2. Characterization
From this characterisation, the study revealed the following points:
All singly or doubly reinforced concrete sections equivalent to the various IPE profiles are in accordance with
the sections used in practice;
The three-axis graphs developed in this study set up a simple mini-system allowing the determination of singly
and doubly reinforced concrete sections equivalent to the different IPE profiles which could facilitate decision
making;
Due to the large number of influential geometrical (d’/d, β = b/bp) and mechanical (fck, fyk) parameters, the
characterisation allowed to obtain a multitude of reinforced concrete sections equivalent to a given profile and it
is up to the user to opt for a practical choice;
All that has been taken into account in the present study is the determination of practical rectangular reinforced
concrete equivalent sections to different IPE profiles. The performance and the economy question have been
left for future study.
7.3. Importance of Using a Given Code
The comparative study between the use of material characteristics adopted by two codes (CP110 and EC2) has
shown that there are more or less important impacts on the equivalent sections obtained. This study revealed the
following points:
The variations are minor for the height (h), the percentage varies from (+1.2% to +2.0%) for singly reinforced
sections and about (+2.0%) for doubly reinforced sections;
The variations are more or less important for tensioned reinforcement ratio (ρst), the ratio varying from (-5.93%
to +2.0%) for singly reinforced sections and about (-5.3%) for doubly reinforced sections. On the other hand,
for the compressed reinforcement ratio (ρsc), the percentage is approximately (-23.8 %).
8. Nomenclature
Ac Area of the equivalent reinforced concrete section
Ap Area of the IPE profile
Asc Cross-sectional area of compression reinforcement
Ast Cross-sectional area of tension reinforcement
b Width of the reinforced concrete rectangular section
bp Width of a steel profile
d Effective depth of tension reinforcement
dmod Modified effective depth of tension reinforcement (dmod = 0.9 d)
d’ Depth to compression reinforcement
Civil Engineering Journal Vol. 7, No. 04, April, 2021
631
fck Characteristic cylinder strength of concrete [fck = (0.78 ÷ 0.83) fcu]
fcu Characteristic cube strength of concrete
fsc Compressive steel stress
fst Tensile steel stress
fy Steel yield stress of a profile
fyk Characteristic yield strength of reinforcement
h Overall depth of reinforced concrete rectangular section in plane of bending
Mpl,y Plastic moment of a steel profile
Mr1 Resistant moment of a reinforced concrete rectangular section
Mr2 Resistant moment of the modified section
Mu Ultimate moment of resistance or plastic moment of a reinforced concrete rectangular section
Wpl,y Plastic modulus of a steel profile along the axis of strong inertia (y-y)
x Neutral axis depth
β Equivalent section width to IPE profile width ratio (β = b / bp)
γM0 The partial safety coefficient (γM0 = 1.00)
εcc Compressive concrete strain
εcu Boundary compressive concrete strain
εsc Compressive steel strain
εst Tensile steel strain
εy Yield steel strain
λ Reduced moment (λ = Mu / bd²)
ρsc Reinforcement ratio for compression reinforcement
ρst Reinforcement ratio for tension reinforcement
9. Declarations
9.1. Author Contributions
Conceptualization, S.B. and M.L.S.; writing—original draft preparation, S.B. and M.L.S.; writing—review and
editing, S.B. and M.L.S. All authors have read and agreed to the published version of the manuscript.
9.2. Data Availability Statement
The data presented in this study are available in article.
9.3. Funding
The author(s) received no financial support for the research, authorship, and/or publication of this article.
9.4. Conflicts of Interest
The authors declare no conflict of interest.
10. References
[1] Karimizadeh Amirhossein. “Comparaison of steel and reinforced Concrete as a Sustainable Building Material in North Cyprus”
Master Dissertation, Eastern Mediterranean University (EMU)-Doğu Akdeniz Üniversitesi (DAÜ), 2015.
[2] Celik T. and Kamali S. “Multidimensional Comparison of Lightweight Steel and Reinforced Concrete Structures: A Case
Study.” Tehnicki Vjesnik-Technical Gazette 25, no. 4 (August 2018): 1234 – 1242. doi: 10.17559/TV-20160901185826.
[3] Okeniyi A.G., Alli O. O., Amusat T. A. and Akolade A.S. “British Standard and Euro Code: Model of Singly Reinforced
Rectangular Concrete under Actions.” Civil and Environmental Research 12, no.6 (June 2020): 55 – 63. doi:10.7176/cer/12-6-
05.
[4] AL-Eyssawi T. A. J. “Comparative Study on the Required Tension Reinforcement for Singly Reinforced Concrete Rectangular
Beams According to Different Codes.” Journal of Babylon University/Engineering Sciences 23, no.2 (2015).
[5] Beroual Sayeh, Tekkouk Abdelhadi and Samai Mohamed Laid. “The Theoretical Prediction of Collapse Mechanisms for
Masonry-Infilled Steel Frames.” Arabian Journal for Science and Engineering 43, no. 10 (April 17, 2018): 5615–5633.
doi:10.1007/s13369-018-3235-x.
[6] Moy Stuart S. J. “Plastic Methods for Steel and Concrete Structures, Second Edition” (1996). doi:10.1007/978-1-349-13810-4.
Civil Engineering Journal Vol. 7, No. 04, April, 2021
632
[7] Ashrafzadeh P. and Kheyrolahi A. “Seismic Design of Steel Structures with Special Flexural Frame Based on Performance by
Durability Method.” Civil Engineering Journal 4, no. 12 (December 02, 2018): 2926–2936. doi:10.28991/cej-03091209.
[8] Al-Ansari M. S. and Afzal M. S. “Simplified Irregular Beam Analysis and Design.” Civil Engineering Journal 5, no. 7 (July,
2019):1577–1589. doi:10.28991/cej-2019-03091354.
[9] Abedini M. and Zhang C. “Performance Assessment of Concrete and Steel Material Models in LS-DYNA for Enhanced
Numerical Simulation, A State of the Art Review.” Archives Computational Methods in Engineering (September 15, 2020).
doi:10.1007/s11831-020-09483-5.
[10] Yang K. H., Mun J. H., Hwang S. H. and Song J. K. “Flexural Capacity and Ductility of Lightweight Concrete T‐Beams".
Strctural Concrete 21 no. 6 (October 01, 2020): 2708-2721. doi:10.1002/suco.201900473.
[11] Nogueira C. G., Rodrigues I. D. “New Design Model of Reinforced Concrete Beams in Bending Considering the Ductility
Factor.” Revista IBRACON de Estruturas e Materiais 13 no.1 (March 27, 2020): doi:10.1590/s1983-41952020000100009.
[12] Boussafel S. “Analyse plastique d’éléments structuraux rectilignes en béton armé et en charpente métallique-Etude
comparative.” Magister Dissertation, Mentouri Brothers University (2003): Constantine, Algeria.
[13] CP110-2:1972. “Code of practice for the structural use of concrete. Design charts for singly reinforced beams, doubly
reinforced beams and rectangular columns.” (November 1972).
[14] BS 8110-3:1985. “Structural use of concrete. Design charts for singly reinforced beams, doubly reinforced beams and
rectangular columns.” (December 1985).
[15] Chaterbache R. “Caractérisation de sections en BOA et en BDSA équivalentes à la gamme de profilés IPE en utilisant les
caractéristiques des matériaux adoptées par les Eurocodes 2 et 3.” Magister Dissertation, Mentouri Brothers University (2017):
Constantine, Algeria.
[16] Boulaares S. “Comportement d'éléments structuraux en béton de sable armé.” Magister Dissertation, Mentouri Brothers
University (2009): Constantine, Algeria.
[17] BAEL Rules 91 revised 99, DTU P 18-702. “Règles techniques de conception et de calcul des ouvrages et constructions en
béton armé suivant la méthode des états limites.” (February 2000).
[18] Boutlikht M. and Samai M. L. “Contribution à l'étude du comportement des poutres en béton armé et en charpente métallique
(Caractérisation de sections en BA en utilisant les caractéristiques réelles et celles adoptées par deux codes: CP11O et
BAEL).” University Meetings of Civil Engineering (May 26, 2015): Bayonne, France.
[19] Boutlikht M. “Comportement d’éléments structuraux rectilignes en béton armé et en charpente métallique en flexion pure.”
Magister Dissertation, Hadj Lakhdar University (2005): Batna, Algeria.
[20] BS EN 1992-1-1:2004+A1:2014. Eurocode 2: Design of concrete structures - Part 1-1: General rules and rules for buildings
(July 2015).
[21] Bhatt P., MacGinley T. J. and Choo B. S. “Reinforced Concrete Design to Eurocodes Design Theory and Examples, Fourth
Edition” (December 10, 2013): 80 – 111. doi:10.1201/b15266.
[22] Beroual Sayeh. “Caractérisation de sections en béton armé équivalentes à la gamme des profilés (IPE) en utilisant les
caractéristiques des matériaux adoptées par les Eurocodes 2 et 3.” Magister Dissertation, University 20 August 1955 (July 03,
2008): Skikda, Algeria.
[23] Yew-Chaye Loo. “Reinforced and Prestressed Concrete, Third Edition” (December, 2018). doi:10.1017/9781108278263.
[24] Bayagoob K. H., Yardim Y. and Ramoda S. A. “Design Chart for Reinforced Concrete Rectangular Section.” 2nd International
Balkans Conference on Challenges of Civil Engineering, BCCCE, Epoka University (May 23-25, 2013): Tirana, Albania.
[25] Barros A. F. M., Barros M. H. F. M. and Ferreira C. C. “Optimal Design of Rectangular RC Section for Ultimate Bending
Strength.” Structural and Multidisciplinary Optimisation 45, no.6 (June 2012): 845 – 860. doi:10/1007/s00158-011-0717-9.
[26] Shehata I. A. E. M., Shehata L. C. D. and Garcia S. L. G. “Minimum steel ratios in reinforced concrete beams made of
concrete with different strengths – Theoretical approach.” Materials and Structures 36, no.1 (January 2003): 3 – 11.
doi:10.1007/bf02481565.
[27] Abdulsada A. A., Khalel R. I. and Sarsam K. F. “Influence of Minimum Tension Steel Reinforcement on behavior of singly
Reinforced Concrete Beams in Flexure.” Engineering and Technology Journal 38, no. 7A (July 25, 2020): 1034 – 1046.
doi:10.30684/etj.v38i7a.902.
[28] Okeniyi A. G., Alli O. O. and Ojedokun O. Y. “Predictive Model of Moment of Resistance for Rectangular Reinforced
Concrete Section under Actions.” Civil and Environmental Research 2, no.4 (2012): 1 – 9.
[29] Mosley Bill, Bungey John and Hulse Ray “Reinforced Concrete Design to Eurocode 2, Seventh Edition” (April 10, 2012).
[30] BS EN 1993-1-1:2005+A1:2014. Eurocode 3: Design of steel structures - Part 1-1: General rules and rules for buildings (June
2015).
Related Documents