Welcome message from author
This document is posted to help you gain knowledge. Please leave a comment to let me know what you think about it! Share it to your friends and learn new things together.
Transcript

CITY OF PEORIAUTILITIES DEPARTMENT
Arizona Power Authority Water-PowerConference
The Water-Power Nexusfor the Municipal Provider
Alan R. DulaneyWater Policy Administrator

Background
Peoria is a fast-growing,dynamic city in the northwestSalt River Valley
• Over 154,000 residents
• More than 176 square miles
• Ranked by Money magazine in2008 as among “100 BestPlaces to Live”
• Dedicated to excellent customerservice
Utilities Department
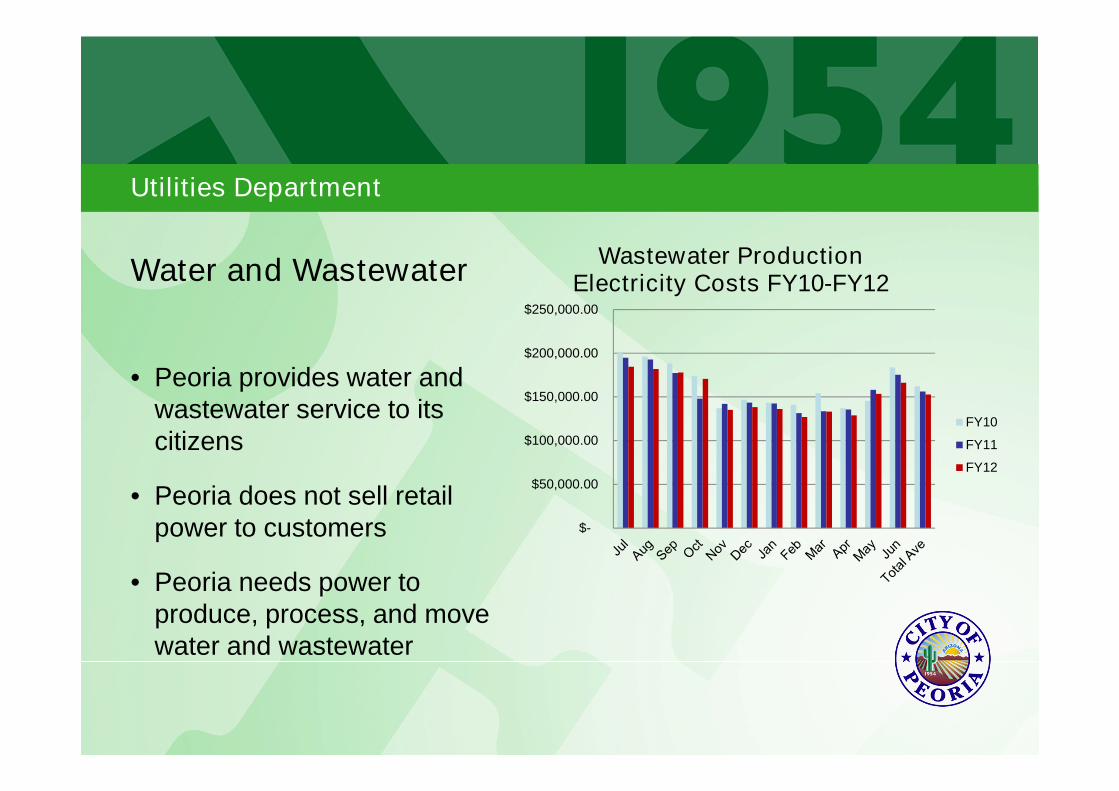
Water and Wastewater
• Peoria provides water andwastewater service to itscitizens
• Peoria does not sell retailpower to customers
• Peoria needs power toproduce, process, and movewater and wastewater
$-
$50,000.00
$100,000.00
$150,000.00
$200,000.00
$250,000.00
Wastewater ProductionElectricity Costs FY10-FY12
FY10
FY11
FY12

Utilities Department
Water and Wastewater
• Peoria operates two water treatment plants and threewastewater treatment plants
• Nineteen booster pump stations distribute water
• Forty-two wells pump water classified as recovered water
• Four recharge facilities operated by CAWCD and SRP, andtwo City-owned recharge facilities with more planned
• Pipes: 300 miles of wastewater collection pipes, 200 milesof water distribution pipes, and 50 miles of reclaimeddistribution pipes to move it all around the City
Water Resources
In 2012 the City of Peoria produced for its customers: 10,243 af of Salt-Verde River water from SRP 12,500 af of Colorado River water from CAP 6,489 af of stored water recovered from wells 487 af of reclaimed water directly deliveredTOTAL PRODUCED WAS 29,719 ACRE-FEET
CAP Water
SRP Water
Recovered Water
Reclaimed Water

Utilities Department
Water and Wastewater
• Peoria operates two water treatment plants and threewastewater treatment plants
• Nineteen booster pump stations distribute water
• Forty-two wells pump water classified as recovered water
• Four recharge facilities operated by CAWCD and SRP, andtwo City-owned recharge facilities with more planned
• Pipes: 300 miles of wastewater collection pipes, 200 milesof water distribution pipes, and 50 miles of reclaimeddistribution pipes to move it all around the City
Water Resources
Surface water in legally bounded amountsremains the basis of Peoria’s water supply
Recovery of stored water is Peoria’s droughtsupply, currently augmenting surface water
Recharge of extra surface water and reclaimedwater are critical to Peoria’s future water supply
Direct use of reclaimed water offers significantopportunities for the future and will grow
All of these operations require significant power
Utilities Department Infrastructure
Water and Wastewater Infrastructure is Extensive• Two water treatment plants: Greenway and Quintero
• Three wastewater treatment plants: Jomax, Beardsley, Butler
• Nineteen booster pump stations plus reservoirs
• Hundreds of miles of distribution, collection, reclaimed pipes
• Some 42 productions wells, with 17 active currently
• Recharge at six Underground Storage Facilities, two of whichare City-owned and operated with more planned
• Peoria holds a Designation of Assured Water Supply

kWH *Water
FY10 FY11 FY12 FY13Ytd**
Jul 1,850,088 1,889,379 1,678,514 1,703,004
Aug 1,908,564 1,531,523 2,117,622 1,317,986
Sep 1,699,375 1,623,639 1,774,115 1,473,265
Oct 1,382,429 1,535,094 1,574,232 1,555,817
Nov 1,548,831 1,398,880 1,324,030 1,306,915
Dec 1,240,224 1,051,438 1,095,450 1,035,385
Jan 1,318,733 967,191 1,262,245 1,412,840
Feb 1,095,398 1,006,100 1,243,428 909,557
Mar 838,502 924,774 1,049,760
Apr 1,441,294 1,049,095 1,123,254
May 1,385,850 1,292,898 1,413,681
Jun 2,051,659 1,531,063 2,111,867
Total Average 1,480,078.92 1,316,756.17 1,480,683.17 1,339,346.13
*Greenway, Wells, Quintero,Boosters
**YTD-Feb2013
Electrical Usage for Water Production
kWH *Water
FY10 FY11 FY12 FY13Ytd**
Jul 1,850,088 1,889,379 1,678,514 1,703,004
Aug 1,908,564 1,531,523 2,117,622 1,317,986
Sep 1,699,375 1,623,639 1,774,115 1,473,265
Oct 1,382,429 1,535,094 1,574,232 1,555,817
Nov 1,548,831 1,398,880 1,324,030 1,306,915
Dec 1,240,224 1,051,438 1,095,450 1,035,385
Jan 1,318,733 967,191 1,262,245 1,412,840
Feb 1,095,398 1,006,100 1,243,428 909,557
Mar 838,502 924,774 1,049,760
Apr 1,441,294 1,049,095 1,123,254
May 1,385,850 1,292,898 1,413,681
Jun 2,051,659 1,531,063 2,111,867
Total Average 1,480,078.92 1,316,756.17 1,480,683.17 1,339,346.13
*Greenway, Wells, Quintero,Boosters
**YTD-Feb2013
0
500,000
1,000,000
1,500,000
2,000,000
2,500,000
Water Production - KwhFY10 - FY13 Ytd-Feb
FY10 FY11 FY12 FY13Ytd**

Electrical Usage for Wastewater Treatment
kWH *Wastewater
FY10 FY11 FY12 FY13Ytd**
Jul 1,966,062 1,883,450 1,780,597 1,661,157
Aug 1,850,227 1,738,552 1,678,567 1,630,267
Sep 1,900,560 1,699,022 1,738,878 1,758,019
Oct 1,833,447 1,397,317 1,752,891 1,685,996
Nov 1,654,427 1,665,777 1,606,570 1,737,632
Dec 1,961,561 1,843,525 1,819,371 1,737,827
Jan 1,704,458 1,852,924 1,796,005 1,737,064
Feb 1,892,160 1,639,021 1,627,897 1,598,445
Mar 2,136,870 1,735,223 1,747,003
Apr 1,833,040 1,733,238 1,656,520
May 1,621,762 1,673,325 1,673,724
Jun 1,860,563 1,739,978 1,700,919
Total Ave 1,851,261.42 1,716,779.33 1,714,911.83 1,693,300.88
*Beardsley, Jomax, Butler, Lift Stations
**YTD-Feb2013
0
500,000
1,000,000
1,500,000
2,000,000
2,500,000
Kw
H
Wastewater Production- KwhFY10 - FY13 Ytd-Feb
FY10 FY11 FY12 FY13Ytd**

Electricity Needed for Water & Wastewater Operations
• The water-energy nexus is already clear toPeoria as Utilities Department is the largest userof electrical power in the City• Power costs are passed along to citizens

The Future
The water-energy nexus is most visible at the municipal level
Peoria has sufficient water resources to meet future growth
As the water resources portfolio is sustainable, so too must bethe power portfolio
It takes power to treat and move the water where it needs togo, and power is not getting cheaper
Peoria needs sustainable power to run its water andwastewater operations
Power from the 2017 Schedule D Hoover Dam Reallocation willprovide Peoria with a stable and sustainable means of operatingits water and wastewater infrastructure to serve its citizens
Related Documents