COMPREHENSIVE ANNUAL FINANCIAL REPORT CAFR CITY OF OREM FOR THE FISCAL YEAR ENDED JUNE 30, 2020 FY 2020

Welcome message from author
This document is posted to help you gain knowledge. Please leave a comment to let me know what you think about it! Share it to your friends and learn new things together.
Transcript

COMPREHENSIVE ANNUAL FINANCIAL REPORT
CAFRC I T Y O F O R E M
F O R T H E F I S C A L Y E A R E N D E D J U N E 3 0 , 2 0 2 0
F Y2 0 2 0
CITY OF OREM
STATE OF UTAH
COMPREHENSIVE ANNUAL FINANCIAL REPORT YEAR ENDED JUNE 30, 2020 Prepared by: City of Orem, Finance Department Brandon C. Nelson, CPA, Finance Director

City of Orem, Utah Comprehensive Annual Financial Report For the Fiscal Year Ended June 30, 2020
Table of Contents
INTRODUCTORY SECTION City Manager's Letter of Transmittal .............................................. ...................... ...... .
Page
Finance Director's Letter of Transmittal ... . .... . .. . ... . . . ... .. . ... . .. .. . . . . ..... .. . ... . . . ... . .. ... . .. ... •. . ... . 3 Listing of City Officials . . .. .. .• . .. . . . . . . . . .. . .. .. . .. . . .. .. . . .. .. . .. .. .. .. .. . .. .. .. . .. . . .. .. . .. . .. . .. . .. .. .. .. . .. . .. . . 9 Organizational Chart ......... .............. "........... .. ... ................... ........... ... ..... .. ... ..... .... .. . 1 o Certificate of Achievement for Excellence in Financial Reporting .... .. .. .... .. .. .. .. .. . .. .. . .. ... .. .. . 11
FINANCIAL SECTION Report of Independent Certified Public Accountants .. .. . . . . . .. .. . . .. .. . . ... .. .. . .. . . .. .. . .. .. . . . . .. . . .. .. 13 Management's Discussion and Analysis . .. . . . .. . . .. . .. . . . . .. . . . .. . .. . . .. .. . . . . .. . . . . .. . . .. .. . .. . .. . . . . . . . . . . . 15 Basic Financial Statements:
Government-wide Financial Statements: Statement of Net Position .. .. . . .. .. .. .. . . .. .. . .. • .. .. .. . .. . .. . . . ... . . . . .. . . . . .. . . . . .. .. .. .. . .. . 33 Statement of Activities ........... . ,... .................. ......................................... 34
Fund Financial Statements: Balance Sheet - Governmental Funds .. .. .. ... .... ...... .... .. ... ......... ... ... ... ... ... 37 Statement of Revenues, Expenditures, and Changes in
Fund Balances - Governmental Funds .. .. .. .. .. . .. .. .. .. .. .. .... .. .. .. .. . .. . . .. .. 38 Reconciliation of the Statement of Revenues, Expenditures, and
Changes In Fund Balances of Governmental Funds to the Statement of Activities .. . . .. . . . .. . .. .. . .. . . . . .. .. . . . .. .. . . .. . . . .. .. . . .. . . . . . .. .. . . .. .. . 39
Statement of Revenues, Expenditures, and Changes In Fund Balances • Budget and Actual - General Fund .. ....... .. .... ....... .. ... ...... .. . ... .. .. .. ... . 40
Statement of Revenues, Expenditures, and Changes in Fund Balances -Budget and Actual• Redevelopment Agency Speical Revenue Fund. ... 41
Statement of Net Position - Proprietary Funds .. .. .. .. . .. .. .. . .. .. .. .. . .. ... .. .. .. ...... .. . 42 Statement of Revenues, Expenses, and Changes in
Net Position - Proprietary Funds ..... ............................................. .. 44 Statement of Cash Flows - Proprietary Funds ............ . ............................. .. 46
Notes to the Financial Statements: Summary of Significant Accounting Policies:
Reporting Entity .. . . . . . .. . . . .. . . .. .. . . .. .. . .. . .. . .. . . .. .. . .. . .. • . .. . . . . . .. . . . . .. .. . .. . . . . . 49 Government-wide and Fund Financial Statements ... .... ........ .... .. .... .. .. 50 Measurement Focus. Basis of Accounting, & Financial
Statement Presentation . . . . .. .. . .. . . .. . . . . . . .. . . . . . . . . . . . . . . . . . . . . . . . . . 50 Assets, Liabilities, Deferred Outflows/Inflows of Resources,
and Net Position/Fund Balance .... .. .. .. .. .... .. . ... .. ... . .. .. . ..... 53 Estimates and Assumptions ... .. . .. .. .. . .. .. .. .. ... .. .... . .. .. .. .. .. .. . .. .. .. . .... ... 57
Reconciliation of Government-wide and Fund Financial Statements: Explanation of Certain Differences between the Governmental
Fund Balance Sheet and the Government-wide Statement of Net Position . .. . .. .. . ... .. . ... .. .. . . . .. . .. . .. . .. .. . . .. .. . . 57
Explanation of Differences between Governmental Fund Operating Statements and the Statement of Activities . . . . . . . . . . . . . . . . . . . . . . . 59
Stewardship, Compliance, and Accountability: Budgetary Information .. . ... . . . ... .. . .. . . .. . .. .. . .. . ... .. . ... . .. .. . .. . . .. . .. .. . .. .. .. . . 59
City of Orem, Utah Comprehensive Annual Financial Report For the Fiscal Year Ended June 30, 2020
Table of Contents (continued) Page
FINANCIAL SECTION (continued) Basic Financial Statements (continued):
Notes to the Financial Statements (continued): Detailed Notes for All Funds:
Deposits and Investments ............. ................ ......... . ..................... 61 External Investment Pools and Managed Investment Funds......... ....... . 65 Customer Deposits ... ... ..... .. ............. ..... .. ............................. . ,..... 68 Loans Receivable • CDBG and EDA Loans . . . . . . .. . . . ... . . .. . .. .. . .. . ... .. . . . . .. 68 Receivables ......... ... ... ... , .. . .. . . . . .. . . . .. . .. . .. .. .. . . . . . . . . . . . . .. . . . . . . . . .. . .. .. . .. .. 68 Capital Assets .. .. .. . .. .. . . . . . . . . .. . . . .. . .. . .. . . . . .. . .. .. .. . .. . .. . .. .. . . .. .. . .. . .. . .. .. .. . 70 lnterfund Receivables, Payables, and Transfers ... ... ... ... .. .......... .... .. . 73 Jointly Governed Organizations ............................... ............... ,.... .. 73 Capital Leases .. . .................. ............................................. .. . . ... .. 74 Long-term Debt ......... ................... .. ..................... ... ....... , . . . . .. . .. . .. 75 Equity Classification. ....................... ...... .. . ... ............ ... ..... . ...... ...... 81
Other Information: Risk Management .. . .. . . . . ... .. . . . . . . . . .. .. . . . . . .. . . . .. . .. . .. . .. . .. . .. . .. . .. . .. . . . . . .. . . 83 Contingent Liabilities ....... , ......... ...................... .................. .......... 84 Pension Plans .............................. ..... , .. . .. . ... .. . ... .. . .... . . .. . . . . .. . . ... . . . 87 Employee Retirement Systems other than Pension Plans . .. .. . .. . .. .. .. .. . . 96 Other Postemployment Benefits .................................. ............. , . . . . 97 Segment Information for Enterprise Funds .............. ,... ...... ............... 101 Redevelopment Agency of the City of Orem ...... .. .... .................. .... .. . 102
Required Supplementary Information: Schedule of the Proportionate Share of the Net Pension
Liability- URS Pension Benefits ............. . , .. ............... ............................... 104 Schedule of Contributions - URS Pension Benefits .. .. .. .... .. .... . .. .. .. . . .. .. . ... .. .. .. .. . .. .. . 106 Schedule of Changes in Total OPES Liability and Related Items ...... ...... ... .............. 108 Notes to Required Supplementary Information..... ... .. .......................................... . 109
Combining Financial Statements - Nonmajor Governmental Funds: Combining Balance Sheet - Non major Governmental Funds .. .. .. ... . .. .. . ... ... . .. .. .... ..• . 112 Combining Statement of Revenues, Expenditures, and Changes in Fund
Balances - Nonmajor Governmental Funds ... . ... .. .. ... .. ..... .. ... ... .... .. .. .. .. .. . .. .. 114 Schedules of Revenues, Expenditures, and Changes in Fund Balances - Budget and Actual:
Debt Service - Debt Service Fund ... .. .. .. ... ..... .. .. .. . ... ... ... .. . .. .. . . . .. .. .. .. .. .. .. .. . .. ... . . .. 117 Capital Projects - Capital Projects Fund ... . ..... ..... . .... .................... . ..................... , 118 Capital Projects - 2019 G.O. Bonds - Capital Projects Fund ... .. .. .. .... .. ... ... .. .. .. ... ... .. 119 Capital Projects - Impact Fees• Capital Projects Fund .... . . . . .... .. .. .. .. .... ... . .. . .. .... .. ... 120 CARE Tax - Special Revenue Fund ............. .......... . ................ ........................... 121 Telecommunication lBilling - Special Revenue Fund ... .. ....... ..... . ...... .. . ......... .. .... .... 122 Transportation Sales Tax· Special Revenue Fund ............ .............. . ......... ,....... ... 123 Community Development and Rehabilitation - Special Revenue Fund ..... ............ ..... 124 Friends of the Orem Public Library - Special Revenue Fund .. .... .. ...... .. . . .... . . .. . .. .... . . 125 Orem Foundation Trust - Special Revenue Fund ... .. ....... , . . . . . ... .. .... . . . ... . . . .. . .. . . .. . .. .. 126 Senior Citizens - Special Revenue Fund ........... . ............ ......... .......................... .. 127

City of Orem, Utah Comprehensive Annual Financial Report For the Fiscal Year Ended June 30, 2020
Table of Contents (continued)
FINANCIAL SECTION (continued) Combining Financial Statements - Nonmajor Proprietary Funds:
Page
Combining Statement of Net Position - Nonmajor Proprietary Funds . .. .. . .. .. .. . . .. .. .. . . .. 130 Combining Statement of Revenues, Expenses, and Changes in
Net Position - Non major Proprietary Funds . . . . . . . . . . . . . . . . . . ... . . .. . . . . . . . . . . . . . . . . . . . .. . . 132 Combining Statement of Cash Flows - Non major Proprietary Funds . . . . ... . . .. . .. . . .. ... . .. 134
Combining Statement of Net Position - Internal Service Funds . .. . . . . . . ... . . . . .. . . . . . . . . . .. . . . . . .. . . 137 Combining Statement of Revenues, Expenses, and Changes in
Net Position - Internal Service Funds ... .. . .. . .. . .. .... .. . .. .... ... . . . .. . .. .. .. . .. ... .. . ... . .. ... ... .. 138 Combining Statement of Cash Flows - Internal Service Funds ... .. . ... ... . . . .. . . ..... ... ... . .. .. . . . . 139 Schedules of Capital Assets Used in the Operation of Governmental Funds:
Comparative Schedules by Source .............................. ....... .. . .. ... ...... ...... ... .... .... 141 Schedule by Function and Activity . . . . . . . . . . . . . . . . . . . . . . . . . . . . . . . . . . . . . . . . . . . . . . . . . . . . . . . . . . . . . .. . . . . . . 142 Schedule of Changes by Function and Activity . .. .... .............. . ........ ... .... .. .. ........... . 144
STATISTICAL SECTION Financial Trends:
Net Position by Component ... ... ............ .... ..... ... ... ........................ ... ............... .. 146 Changes in Net Position ... ... .......... . ..... .. ......... .. . .. ...... ......... .. . ....... ..... ...... , . . . . . . 148 Fund Balances - Governmental Funds. ............ ..... .. ....... . ... .. ... ...... ............... .. .... 150 Changes in Fund Balances - Governmental Funds ................. ................... .... .. ..... 152
Revenue Capacity: Assessed Value and Estimated Actual Value of Taxable Property. .. ...... .............. . .. . 154 Direct and Overlapping Property Tax Rates ... .. .. .. ........ . ..... .... , . . . . . . . . . . . . . . . . . . . . . . . . .. . . . 156 Principal Property Tax Payers. ..... ... ......... ... .............. ............ .......... ..... .... ........ 157 Property Tax Levies and Collections .... . .... ........................... .. . .. .............. ........... 158 Sales Taxes by Category .............. . .. .. . ....... ... ..... ...... , ......... ...... ............... ,... . .... 160 Other Sales Tax Revenue Information by Category .. , .... ,.... ...... .................. ..... .... .. 162 Principal Sales Tax Payers ...... ... ... .. ..... .. ................ ......... ...... ................ .. ........ 163 Direct and Overlapping Sales Tax Rates ...... ........ ...... ............. ........... ...... ..... ...... 164
Debt Capacity and Other Debt Information: Pledged-Revenue Coverage .. . ............ .. , ... .. ....... ...... .. ...................... , . . ... . . . ... . . . . 165 Ratios of Outstanding Debt by Type . . . . . . . .. . .. . . . . .. . . . . . . . . . . . . . . . . . . . . . . . . .. . .• . . . . . . . . . . . . . .. . . . . 166 Ratios of Net General Obligation Bonded Debt Outstanding . . . . .. . . . . . . . . . . . . . . . . . . . . . .. . . . . . • 168 Direct and Overlapping Governmental Activities Debt . . . . . . . . . . . . . . . . . . . . . . . . . . . . . . . . . . . . . . . . . . . . 169 Legal Debt Margin Information . .. .. . . .. .. . .. . . .. .. . ... .. . . . . . .. ... . . . .. . ... . ...... .. ... . . . .. . ... ... . .. . 170 Long-term Bonded Indebtedness Paid by Primary Government ....... .. .. ....... ... .. ........ 172 Other Long-term Liabilities Paid by Primary Government .,. ... ...... ................. ... ,..... . 174
Demographic and Economic Information: Demographic and Economic Statistics ........... ...... ..... ....... .... . .. ... ...... ......... . ..... ... 175 Other Demographic Statistics - Census Data . . . . . .. . . . . . . . . . . . . . . . . . . . . . . . . . . . . . . . . . . . . . . . .. .. . . . . . 176 Principal Employers. . . . ... .. . . . . . . . .. . .. . .. . . .. . .. . . . . . . . . . . . . . . . ... . . . .. . . . . ... . . . . . . . . . . .. . . . .. . . . . . .. . . . 177 Full-Time-Equivalent City Government Employees by Function/ Program ......... .. ..... . 178
Operating and Other Information:
Operating Indicators by Function I Program . . . . . . .. . .. . . .. .. . .. . . ... .. ....... .. . . . . . . . . . . . . . . . ... . . 180 Capital Asset Statistics by Function / Program . . . . . . . . . . . . .. . . . . .. . . .. . .. . . . .. . . . . . . . . . . . . . . . . ... . . 182 General Fund - Revenues and Expenditures Chart ...... ...... .. , ....... .... ......... .. .. ...... ... 184

INTRODUCTORY SECTION

~ OREM
.,
December 8, 2020
To: Mayor and City Council
OFFICE OF THE CI T Y MANAGER
56 N . State Street I Orem, UT 84057
Subject: Comprehensive Annual Financial Report
In our ongoing efforts to provide more comprehensive financial information regarding the City, the Finance Department has now completed its thirty-third Comprehensive Annual Financial Report (CAFR).
The report contains critical financial information regarding the City's activities over the past fiscal year. The report of Gilbert & Stewart CPA, PC, resulting from their annual independent audit is included as a part of this annual report. Responsibility for both the accuracy of the presented data and the completeness and fairness of the presentation, including all disclosures, rests with City management.
We believe the data, as presented, is accurate in all material aspects and fa irly sets forth the financial position and results of operations of the City as measured by the financial activities of its various funds. Disclosures necessary to enable the reader to gain an understanding of the City's financial affairs have also been included.
The City concluded the year ended June 30, 2020, in sound financial condition. The following is an overview of the City's financial condition.
Operating Revenues
Sales Tax revenues grew 4.4% in Fiscal Year 2020. Sales taxes continue to be the City's single largest revenue source. Utility revenues are growing due to the cash funding rate structure approach for system replacement and expansion for each utility. This will provide the necessary capital funding to build master planned projects.
Revenues for other service areas such as residential solid waste collection and street lighting are stable. Recreation Fund revenues have suffered due to the reconstruction of the fitness center and to the COVlD-19 pande mic and thus, the fund received a $750,000 subsidy from the General Fund. However, this subsidy was anticipated and was better than budgeted by $237,000. These two impacts on the fitness center will continue to affect Recreation Fund revenues for a portion of the next fiscal year as well.
The City was awarded $6,978,967 in federal CARES Act CRF funding from Utah County. As of June 30, 2020, the City had received $4,011,796 of the total awarded amount. The City is act ively using these funds to improve city operations and facilities to provide a safer environment for individuals, customers, and citizens visiting city facilities during this pandemic and potential future events, while also providing employees with the tools necessary to continue to do their jobs in an effective, efficient, and safe manner.
C I TY OF OREM
-!
PHONE 8 0 1.229.7035 Fl\X 801.229 .70 31 WEB WWW.OREM.ORG

Expenditures
The City allocated $4,600,000 from General Fund reserves for general capital improvement projects. This was made possible by the City's steady economy resulting in revenue growth coupled with one-time building permit funds for one-time uses along with the City's policy of setting its available General Fund reserves at 15% of revenues.
The City's infrastructure is in a stable condition and with the recently adopted utility master plans and accompanying funding plans, the City's infrastructure will remain sound. Within the last year, the City has continued, initiated, and/or completed several significant capital improvement projects. These projects include:
• Continued street maintena nee plans of systematic preventative maintenance such as crack seals, seal coats, micro-surfacing, and overlays.
• Replacement of old four- inch ( 4") water lines. • Construction of a Library Hall & reconstruction of the Orem Family Fitness Center. • Construction of Utah County's first outdoor futsal courts. • Purchase of a new fire engine and ambulance. • Initial deployment of automated water meter reading infrastructure in portions of the
city.
Additional capital and operational funding is needed for:
• Completion of the storm water system (especially in relation to the West Union Canal abandonment).
• Installation of automated water meter reading infrastructure throughout the remainder of the city.
• Construction of a new 10-million gallon water storage tank. • Continued preventative road and sidewalk maintenance. • Improving transportation in the city through street improvements, mixed-use trails,
bike paths, and mass transit. • Identifying and addressing public safety staffing and operational concerns.
While many of these needs will be funded over the next several years through structured fee increases, many of these projects and issues rely on one-time monies, such as unanticipated revenues, grants, and other resources.
The preparation of this Comprehensive Annual Financial Report couJd not have been accompl ished without the dedicated efforts of many individuals. In particular, the efforts of the Finance Department staff who continue to upgrade and improve the City's accounting and financial reporting systems which improve the quality of information being reported to you, state oversight boards, and the citizens of the City of Orem.
If you have questions regarding the Comprehensive Annual Financial Report, please feel free to discuss them with Brandon Nelson or myself. ·
Respectfully Submitted,
~ v. DA','f\Jk-James P. Davidson City Manager
-2-

~ OREM
--
December 8, 2020
James P. Davidson City Manager
City of Orem, Utah
F I NAN C E DEPARTMENT
56 N. State Street I Orem , UT 84057
The State of Utah requires that all local gove1·nments publish, within six months of the close of each fiscal year, a complete set of financial statements presented in conformity with generally accepted accounting principles (GAAP) as prescribed in the Uniform Accounting Manual for Utah Cities and audited in accordance with generally accepted auditing standards by a firm of licensed certified public accountants. This Comprehensive Annual Financial Report (CAFR) of the City of Orem, Utah for the fiscal year ended June 30, 2020, is hereby submitted to you, in accordance with these requirements.
This financial report has been preparnd according to the guidelines set forth by the Governmental Accounting Standards Board's (GASB) Statement 34. This report consists of management's representations concerning the :finances of the City of Orem. Consequently, management assumes full responsibility for completeness and 1·eliability of all information presented in this report. To provide a reasonable basis fo1· making these representations, management has established an internal control framework designed to both protect the assets of the City from loss, theft, or misuse and to allow for the compiling of sufficient re liable information for the preparation of the City's financial statements in conformity with GAAP. Because the cost of internal controls should not outweigh their benefits, the City's internal control procedures have been designed to provide reasonable rather than absolute assurance that the financial statements will be free from material misstatement. To the best of management's knowledge and belief, this financial repor t i s complete and reliable in all material respects.
Gilbert & Stewart CPA, PC, a firm oflicensed certified public accountants have audited the City of Orem's financial records. The goal of the independent audit was to provide reasonable assurance that the financial statements of the City of O1·em for the fiscal year ended June 30, 2020, are free of material misstatement. The independent audit involved examining on a test basis, evidence supporting the amounts and disclosures in the financial statements; assessing the accounting principles used and significant estimates made by management; and evaluating the overall financial statement presentation. The independent auditor concluded based upon the audit, that there was a reasonable basis for rendering an unmodified opinion that the City of Orem's
-3-
C IT Y OF O Rt M PHON!; 801.229.70 10 f:AX 80 1.229.7049 WEB WWW.OREM.ORG

financial statements for the fiscal year ending June 301 2020, am fairly presented in conformity with GAAP. The independent auditor's report is pl'esented as the first component of the financial section of this repol't (see pages 13-14).
Gen01·ally accepted accounting p1·inciples require that management provide a narrative introduction, overview, and analysis to accompany the basic financial statements in the form of Management's Discussion and Analysis (MD&A). This letter of transmittal is designed to complement MD&A and should be read in conjunction with it.
Government Profile
The City of Orem is located in notth central Utah and is cuxrent ly the fifth largest city in the state with a 2010 census population of 88,328 and an estimated population at June 30, 2020, of 99,969. Orem is located 45 miles sou th of Salt Lake City.
City ope1·ations include public safety (police and fire), economic development, administration, recreation, libraTy, water, seweT, sto1·m water, traffic a nd streets, solid waste, and stre,et light ing.
The City of Orem has a Manager/Council form of government which allows for a full· t ime City Manage1· and a paTt·time Mayor. The City Council consists of t he Mayor and six Council members who are all elected "at large" and while the May01· leads the City Council, all members have only one vote. The Mayor and Council members serve staggered four-year terms on a paTt-time basis. Elections in th e City of Orem are non-partisan.
The City Manager must submit a proposed annual budget to the City Council for a ll funds no later than the first regularly scheduled meeting in May. The final adoption must be no later than June 22nd, unless a property tax increase is proposed. If a property tax is proposed, adoption must occur no later than August 31st_ The City Council is the administrator of t he legal level of budgetai·y control. Additional information can be found on pages 59·60.
Economic Condition and Outlook
The City is constan tly involved in driving economic development. The primary a1·ea of economic development has centered ai·ound U niversity Place. University Place is in t he midst of a transformation from a tradit ional "mall" to becoming an en tertainment , p1·ofessional business office, and residential living center. Currently, one large office building has been constructed along with underground parking as well as a new above ground parking structure. Three large upscale apartment complexes have been completed. Plans for the area include a multi-story hotel, a professional live performance theater and additional multi-story professional business office. This tr ansfo1·mation will ensure the area continues to be a growing and vibrant economic ancho1· for the community.
-4-

Utah Valley University (UVU) is a major employer in the City with 5,523 employees serving over 40,000 students . UVU is now the State's largest university and plays a pivotal role in the growth of the city.
Employment in Utah is doing relatively well despite the COVID· 19 pandemic, especially in Utah County. The county unemployment rate at June 30, 2020. was 4.5% compared to 5.7% for the state and 11.1% nationally (see page 32 for a historical comparison).
Sales tax revenues, the City's largest source of tax revenue) continue to grow despite the recent COVID-19 pandemic. They have increased from FY 2011 by 53% (see pages 160·161) and have increased every year since FY 2010. The housing industry continues to be st1·ong as building permit and associated development revenues have increased year over year, on average, since FY 2011. Although the City expects these major revenue souxces to con tinue to grow, the pace at which they grow is expected to decrease to a more sustainable rate.
Long·term Financial Planning & Policies
The City remains optimistic regarding the future and is pro-actively planning its financial future throug·h strategic plans and economic s ustainability models .
All three major enterprise funds will be completing master plan updates in order to reassess the cash funding option currently being employed by the City as was selected and approved by the Mayor and City Council. Various funding options are expected to be proposed which may include debt issuance for large utility projects.
Along with the master plan updates, the City's impact fees for police, fire, transportation, parks, water, sewer, and storm water will all be analyzed and updated.
The Mayor and City Council have targeted a 15% of revenues General F und assigned/unassigned fund balance (the State of Utah requfres municipalities have at least 5% but no more than 25%). Amounts exceeding this target are t ransferred to the City's Capital Projects Fund to complete capital purchases/projects identified by city staff and approved by the Mayor and City Council. This allows the City to cash fund one·time capital purchases/projects as well as providing sufficient ''reserves" in case of economic downturns.
Major Initiatives
F or the Y eal'
DU1·ing the year , the City has worked on several needed projects to benefit the residents and businesses of the community. These projects include, but were not limited to the following:
-5-
• Installation of automated water meter reading technology tlll'oughout the entire city.
• On-going preventive maintenance on City·owned streets. • Identifying ope1·ational and facility needs related to CARES Act CRF
funds to provide a safer environment for individuals, customers, citizens, and employees.
• Continued construction a new community library hall and reconstructing the forty year old fitness center.
For the Future
The City faces many challenges in the future. Some of the most significant are as follows:
• Continued road and sidewalk maintenance. • Completion of the storm water system (especially for areas
previously serviced by the West Union Canal which is being abandoned).
• Identifying and addressing public safety staffing and operational concerns.
• Completion of new automated water meter reading technology throughout the entire city.
• Completion of a new I O-million gallon water storage tank. • Maintaining levels of service for all General Fund operations.
Other Information
Awards
The Government Finance Officers Association of the United States and Canada (GFOA) awarded a Certificate of Achievement for Excellence in Financial Reporting to the City for its Comprehensive Annual Financial Report (CAFR) for the fiscal year ended June 30, 2019. This was the thirty-second consecutive year the City has received this prestigious award. In order to be awarded a Certificate of Achievement for Excellence in Financial Reporting, the City published an easily I'eadable and efficiently organized comprehensive annual financial report, the contents of which conform to program standards. This report must satisfy both generally accepted accounting principles (GAAP) and applicable legal requirements.
A Certificate of Achievement is valid for a period of one yeax only. We believe this current comprehensive annual financial report continues to conform to the Certificate of Achievement Program's requirements and we will be submitting it to the GFOA to determine its eligibility for another certificate.
-6-

Acknowledgments
The preparation of this report could not be accomplished without the efficient and dedicated services of the entire Finance Department staff. I would like to exp1·ess my appreciation to all members of the department who assisted and contI·ibuted to its preparation. I would like to thank the Mayor and City Council for their interest and support in planning and conducting the financial operations of the City in a responsible and prudent manner.
Respectfully Submitted,
~ ,_. -r ,1 J ~ , L :-
Brandon C. Nelson, CPA Finance Director
-7-

(This page left blank intentionally)
-8-

~ OREM
CITY OF OREM
LISTING OF OFFICIALS
ORGANIZED BY CLASSIFICATIONS
Chief Executive Officer I City Manager .................. ....... .... ................... .. ....... .... ..... ..... ... ...... .......... ... . J ames P . Davidson
Executive Staff I Assistant City Managei· ....... . ................... ............. ........................ ........... ............ .. Brenn Bybee
Deputy City Manager ....... ........... ................... ..... . ... .. ... ....... .... ... ... .. ... .......... .. Steven M. Downs
Finance Director ....... .... ... ... . ..... . .......................... .. .................. ............. .. .... Brandon C. Nelson
Director of Development Services ............. ........ .................................... ..... .... ........ Ryan L. Clark
Director of Legal Services ........................... ... .. .................. . ............ .......... ... ... Greg W. Stephens
Director of Library Services ....... .. ...... ... ... .. ... ..... .. .... ........... ............ ............. Charlene M. Crozier
Fi.re Chief ................................................................................. .. ................ Marc R. Sanderson
Police Chief ............................... .... ............. ...... ......... ... ..... .. ............. ........ ....... ... Josh T. Adams
Director of Public Works ............................ .......................... .. . ........................ Chris R. Tschi.rki
Director of Recreational Services ................. .. ....... ... ......... .. .. ............................. .... Karl R. Hirst
-9-

JUSTICE COURT
PUBLIC WOHKS ADVISORY COMMISSION
Hl::CHl::AI ION ADVISORY COMMISSION
- --·-·---~----BEAUTIFICATION
ADVISORY COMMISSION
HERITAGE ADVISORY COMMISSION
LIBRARY ADVISORY COMMISSION
CDBG ADVISORY COMMISSION
CARE ADVISORY COMMISSION
BOARD OF .C\DJUSTMENT
BOARD OF BUILDING & FIRE CODF APPFAI S
'
-10-
Hl::CHl::AI ION ALLOCAIION ADVISORY COMMISSION
SUMMFRFFST COMMITTEE
ARTS COUNCIL
HISTOf11C PRESERVATION COMMISSION
YOUTH CITY COUNCIL
TRANSPORTATION COMMISSION
SENIOR CITIZENS ADVISORY COMMISSION

-_ ... ,, ., ~·' ~ •
Government Finance Officers Association
Certificate of Achievement for Excellence
in Financial Reporting
Presented to . . City of Orem
Utah
For its Comprehensive Annual Financial Report
For the Fiscal Year Ended
June 30, 2019
Executive Director/CEO
-11-

0 50 miles
I 0 50 km
---.J..----;"'"""::""_~~----~~--__;~--+---i ' \)
f' Bear Lake
• Logan
UTAH
@ Pipe Spflng
G,and Canyon
1'te,
-12-

FINANCIAL SECTION

GILBERT & STEWART CERTIFIED PUBLIC ACCOUNTANTS A PROFESSIONAL CORPORATION ESTABLISHED 1974
INDEPENDENT AUDITOR'S REPORT
Honorable Mayor and Members of City Council City of Orem, Utah
Report on the Basic Financial Statements
RANOELAHEATON CPA LYNN A GILBERT. CPA
JAMES A GILBERT, CPA BEN H PROBST. CPA
RONALD J. STEWART, CPA
SIDNEY S. GILBERT, CPA JAMES E. STEWART. CPA
We have audited the accompanying financial statements of the governmental activities, business-type activities, each major fund, and the aggregate remaini_ng fund infonnation of the City of Orem, Utah (the City), as of and for the year ended June 30, 2020, and the related notes to the financial statements, which collectively comprise the City's basic financial statements as listed in the table of contents.
Mana{?ement's Responsibility.for the Financial Statements Management is responsible for the preparation and fair presentation of these financial statements in accordance with accounting principles generally accepted in the United States of America; this includes the design, implementation, and maintenance of internal control relevant to the preparation and fair presentation of financial statements that are free from material misstatement, whether due to fraud or error.
Auditor's Responsibility Our responsibility is to express opinions on these financial statements based on our audit. We conducted our audit in accordance with auditing standards generally accepted in the United States of America and the standards applicable to financial audits contained in Government Auditing Standards, issued by the Comptroller GeneraJ of the United States. Those standards require that we plan and perform the audit to obtain reasonable assurance about whether the financial statements are free from material misstatement.
An audit involves performing procedures to obtain audit evidence about the amounts and disclosures in the financial statements. The procedures selected depend on the auditor's judgment. including the assessment of the risks of material misstatement of the financial statements, whether due to fraud or error. In making those risk assessments, the auditor considers internal control relevant to the entity's preparation and fair presentation of the financial statements in order to design audit procedures that are appropriate in the circumstances, but not for the purpose of expressing an opinion on the effectiveness of the entity's internal control. Accordingly, we express no such opinion. An audit also includes evaluating the appropriateness of accounting policies used and the reasonableness of significant accounting estimates made by management, as well as evaluating the overall presentation of the financial statements.
We believe that the audit evidence we have obtained is sufficient and appropriate to provide a basis for our audit opinions.
Opinions In our opinion, the financial statements referred to above present fairly, in all material respects, the respective financial position of the governmental activities, business-type activities, each major fund, and the aggregate remaining fund information of the City of Orem, as of June 30, 2020 and the respective changes in ftnancial position and where applicable, cash flows and the respective budgetary comparison for the general and major Special revenue furtds thereof for the year then ended in accordance with accounting principles generally accepted in the United States of America.
AMERICAN FORK OFFICE 85 NORTH CENTER STREET AMERICAN FORK. UT 84003
(801) 756-9666 FAX (801) 756-9667
-13-
PROVO OFFICE 190 WE.ST 800 NORTH #100
PROVO. UT 84601 (801) 377-5300
FAX (801) 373-5622
WWW.GILBERTANDSTEWARTCOM
HEBER OFFICE 45 SOUTH MAIN ST HEBER, UT 84032
(435) 654-6477 FAX (801) 373-5622
Other Matters Required Supplementary Jr!formation Accounting principles generally accepted in the United States of America require that the management's discussion and analysis and budgetary comparison information, the OPEB schedule of funding progre.ss. and the required supplementary infonnation regarding pensions, as noted in the table of contents, be presented to supplement the basic financial statements. Such information, although not a part of the basic financial statements, is required by the Governmental Accounting Standards Board. who considers it to be an essential part of financial reporting for placing the basic financial statements Ln an appropriate operational, economic, or historicaJ context. We have applied certain limited procedures to the required supplementary infonnation in accordance with auditing standards generally accepted in the United States of America, which consisted of inquiries of management about the methods of preparing the infonnation and comparing the information for consistency with management's responses to our inquiries, the basic financial statements, and other knowledge we obtained during our audit of the basic financial statements. We do not express an opinion or provide any assurance on the information because the limited procedures do not provide us with sufficient evidence to express an opinion or provide any assurance.
Supplementmy and Other Information Our audit was conducted for the purpose of forming opinions on the financial statements that collectively comprise the City's basic financial statements. The mtroductory section, supplemental information, and the statistical section are presented for purposes of additional analysis and are not a required part of the basic financiaJ statements.
The combining statements, budgetary comparisons, and capital assets as listed as supplemental information in the table of contents are the responsibility of management and were derived from and relate directly to the underlying accounting and other records used to prepare the basic financial statements. Such infoimation has been subjected to the auditing procedures applied in the audit of the basic financial statements and certain additional procedures, including comparing and reconciling such information directly to the underlying accounting and other records used to prepare the basic financial statements or to the basic financial statements themselves, and other additionaJ procedures in accordance with auditing standards generally accepted in the United States of America. In our opinion, the combining statements, budgetary comparisons, and capital assets are fairly stated in aJI material respects in Telation to the basic financial statements as a whole.
The introductory and statistical sections have not been subjected to the auditing procedures applied to the audit of the basic financial statements and, accordingly we do not express an opinion or provide any assurance on them.
Other Reporting Required by Government Auditing Standards
In accordance with Government Auditing Standards, we have also issued our report dated December I, 2020, on our consideration of the City's internal control over financial reportLng and on our tests of its compliance with certain provisions of laws, regulations, contracts. and grant agreements and other matters. The purpose of that report is to describe the scope of our testing of internal control over financial reporting and compliance and the results of that testing, and not to provide an opinion on internal control over financial reporting or on compliance. That report is an integral part ofan audit perfom1ed in accordance with Government Auditing Standards in considering the City's internal control over financial reporting and compliance.
91/JN&S~ GILBERT & STEWART, CPA, PC Provo, Utah December I, 2020
-14-

MD & A

City of Orem Management's Discussion and Analysis
June 30, 2020
The City of Orem's management presents this overview and analysis of its financial activities for the fiscal year ended June 30, 2020. This discussion and analysis focuses on significant financial issues, provides an overview of the City's financial activity, highlights significant changes in the City's financial position, and identifies mate1·ial variances between the approved budget and actual spending.
The City encourages readers to conside1' the information presented here in conjunction with additional information furnished in the letter of transmittal and provided throughout this report.
Financial Highlights
• As of the end of the cunent fiscal year, the government-wide assets and deferred outflows of the City exceeded its liabilities and defened inflows by $344,147,520 (total net position). Of this amount, $97,726,518 (unrestricted net position) may be used to meet the government's ongoing obligations to citizens and creditors.
• Total government-wide net position consists of $212,810,310 in net investment in capital assets, $33,610,692 in restricted assets, and $97,726,518 in unrestricted assets. Total government·wide net position increased by 11.29%.
• As of the end of the current fiscal year, the City's governmental funds reported combined ending fund balances of $80,702,364. Of this amount, $12,376, 113 (15.34%) is available for spending at the City's discretion (unassigned fund balance).
• As of the end of the current fiscal year, the City's governmental funds reported a decrease in total fund balance of $6,543,394 compared to the prior year's increase of $37,567,826. The changes to fund balance are discussed in greater detail later in this overview and analysis.
• As of the end of the current fiscal year, the City's enterprise funds reported an inc1·ease in total net position of $18,849,150 compared to the prior year's increase of $16,557,290. The changes to fund balance are discussed in greater detail later in this overview and analysis.
• In FY 2019, the City sold $24.5 million in general obligation bonds to fund the construction of a new Library Hall and the reconstruction of the City's fitness center. During FY 2020, the City spent just over $14.9 million on these projects.
• The City continued installing automated meter reading technology on its water meters. In FY 2020, the City spent approximately $1.9 million and $3.4 million to date. The expected total cost of the project is approximately $11 million and is expected to be completed by FY 2024.
Overview of the Financial Statements
The following discussion and analysis serves as an introduction to the City's basic financial statements. The City's basic financial statements comprise of three components: 1) government·wide financial statements, 2) fund financial statements, and 3) notes to the financial statements.
-15-

City ofO.-em Management's Discussion and Analysis
June 30, 2020
This report a lso includes other supplementary information in addition to the basic :financial statements.
The government-wide .financial statements are designed to provide readers with a broad overview of the City of Orem's finances, in a manner similar to a private-sector business.
• The Statement of Net Position presents information on all of the City's assets, deferred outflows, liabilities, and deferred inflows, with the difference between the four reported as net position. Over time, increases or decreases in net position may serve as a useful indicator of whether the financial position of the City is improving or deteriorating. However, you will also need to consider other non-financial factors.
• The Statement of Activities pi-esents information showing how the City's net position changed during the fiscal year reported. All changes in net position are reported as soon as the underlying event giving rise to the change occurs, regardless of the timing of related cash flows. Thus all of the current year's 1·evenues and expenses are taken into account rega1·dless of when cash is Teceived or paid_
Both of the government·wide financial statements distinguish functions of the City that are principally supported by taxes and intergovernmental revenues (governmental activities) from other functions that are intended to recover all or a significant portion of their costs thxough user fees and service charges (business·type activities). The governmental activities of the City include the general gove1·nment, public safety, redevelopment, highways and public improvements, parks, recreation and arts (which includes the library), and economic and physical development. The business-type activities of the City include culinary water distribution, water reclamation (sewer) , storm water operations, recreation (fitness center and outdoor pool), solid waste disposal, and street lighting.
Fund financial statements. A fund is a grouping of related accounts that is used to maintain control over resources that have been segregated for specific activities 01· objectives. The City, like other state and local governments, uses fund accounting to ensure and demonstrate compliance with finance-related legal requirements. All of the funds of the City can be divided into two categories: governmental funds and proprietary funds.
• Governmental funds. These funds are used to account for essentially the same functions repol"ted as governmental activities in the government·wide financial statements. However, unlike the government-wide financial statements, govel•nmental fund financial statements focus on near-term inflows and outflows of spendable resources, as well as on balances of spendable resources available at the end of the fiscal year. Such information may be useful in evaluating the City's near-term financing requirements.
Because the focus of governmental funds is nanower than that of the government-wide financial statements, it is useful to compare the
-16-
City of Orem Management's Discussion and Analysis
.lune 30, 2020
information presented for governmental funds with similar information presented for governmental activities in the government-wide financial statements. By doing so, Teaders may better understand the long·term impact of t he City' s near term financing decisions. Both the governmental fund balance sheet and the governmental fund statement of revenues, expenditures, a nd changes in fund balances provide a reconciliation to facilitate this compa1·ison between goven1mental funds and governmental activities.
The City maintains thirteen individual governmental funds. Information is presented separately in the governmental fund balance sheet and in the governmental fund statement of revenues, expenditures, and changes in fund balances for the General, Debt Service, Capital Projects, 2019 G.O. Bonds Capital Projects funds, and Redevelopment Agency Special Revenue Fund which are considered major funds of the City. Data from the other eight goveTnmental funds are combined into a single, aggregated presentation. Individual fund data for each of these nonmajor governmental funds is provided in the form of combii1ing statements elsewhere in this Teport.
• Proprietary funds. The City of Orem maintains two different types of proprieta1·y funds. Enterprise funds are used to report the same functions presented as business-type activities in the government-wide financial statements. The City uses enterprise funds to account for its Water, Water Reclamation, Storm Water, Recreation, Solid Waste, and Street Lighting activities. Internal service funds are an accounting device used to accumulate and allocate costs internally among the City's various functions. The City uses internal service funds to account fo1' servicing its fleet of vehicles, providing insurance, procuring and waTehousing supplies and materials, and maintaining the City's technological needs. Because these services predominantly benefit governmental rathe1· than business-type functions, they have been included within governmental activities in the government-wide financial statements.
Proprietai·y funds provide the same type of information as the government-wide financial statements, only in more detail. The proprietary fund financial statements provide separate information fo1· the Water, Water Reclamation, and Storm Water funds, which are considered major funds of the City. The Recreation, Solid Waste, and the Street Lighting funds are classified as nonmajor and are included in the combining statements within this report. Conversely, the four internal service funds are combined into a single, aggregated presentation in the pl'Oprietary fund financial statements. Individual fund data for the internal service funds is provided in the form of combining statements within this repo1·t.
Notes to the financial statements. The notes to the financial statements provide additional information that is essential to a full understanding of the data provided in the government-wide and fund financial statements.
-17-

City of Orem Management's Discussion and Analysis
June 30, 2020
Government-wide Financial Analysis
As noted earlier, net position may serve over time as a useful indicator of the City's financial position. As mentioned in the highlights section, a ssets exceeded liabilities and defe:rred inflows by $344,147,520 at June 30, 2020.
By far the largest portion of the City's net position (61.84%) is its investment in capital assets (e.g. land, buildings, improvements other than buildings, machinery and equipment, and infrastructure assets) less any outstanding debt related to the acquisition of those assets. The City uses these capital assets to provide services to citizens. Consequently, these assets are not available for future spending. Although the City's investment in its capital assets is reported net of related debt, it should be noted that the resources needed to repay this debt must be provided from other sources, since the capital assets themselves cannot be used to liquidate these liabilities .
City of Orem's Total Net Position
Governmental Business-type Activities Activities Total
2020 2019 2020 2019 2020 2019
.Current Assets s 106.915.610 $ 113.07 4,156 $ 68,230.646 $ 54,613,070 $ 175, 146,256 $ 167,687,226
Noncurrent Assets: Capital Assets 167.998,819 148,8 11.085 94. 153,727 91,205,355 262, 152.546 240,0 16,440
Other 8,098.207 705.676 3,098.207 705,676
Total Assets 278,012,836 262,590,9 17 162.984,373 145,818,425 440,397,009 408.409,342
Deferred Outflows of Resources 6,419,401 11.ol9.033 1,692,066 2,856,508 8, 111.467 13,875,541
'T'otal Assets & Deferred Olltflows of Resou.rces $ 284,432.037 s: 273,609,950 S 164,076,439 $ 148,674,933 $ 448,508,476 $ '122,284,883
Long·term Liabilities Oittstanding $ 51,134.236 s 6 1,526,103 $ 22,353,604 $ 26,058,646 $ 73,487,840 $ 87,584,749
Other Liabllities 11.978,786 11,783,090 2,630,528 2,880,092 14,609,314 14,663,182
Total Liabilities 63,113,022 73,309, 193 24,984,132 28,938,738 88,097, 154 102,247.931
Deferred Inflows
of~sources 15,568,782 10,605,810 695,020 188,058 16,263.802 10,793,868
Net Positioll: Net Investment in
Capital Assets 188,676,061 134,356,643 74, 184,249 69,151,94 1 212,8 10,3 10 203,508,584
Restricted 30.395,628 25,416,987 3,215,064 3, 104,850 33,610,692 28,521.837
Unrestricted 36,678.544 29.92\,317 61,047,974 47,291,346 97,726,518 7'i,2 12,663
Total Net Position 205,750,238 189,694,9;17 138,397,287 119,548.137 344,147,520 309,243,084
Total Liabilities, Deferred
Inflows of Resources, and Net Position $ 284.432.037 $ 273,609,950 $ 164,076,439 S 148,674,933 ~ 448,508,476 s 422,284,883
A portion of the City of Orem's net position (9.77%) represent resources that are subject to external restrictions on how they may be used. The amoun t listed as unrestricted net position ($97,726,518) may be used to meet the City's ongoing obligations to citizens and credito1·s.
At the end of the current fis cal year, there were no funds reporting a deficit in unrestricted net position.
-18-

City of Orem Management's Discussion and Analysis
June 30, 2020
At the end of the current fiscal year, the City of Orem is able to report positive balances in all thi-ee categories of net position, for the City as a whole, as well as for its separate business-type activities.
Comparing the cunent fiscal year to the prior fiscal year , the City's net position increased by $34,904,436 (11.29%). Total 1·evenues increased by $9,894,630 (8.30%), primarily due to increases in sales taxes of $3,207,169 (12.86%), operating grants and contributions of $4,835,722 (347.18%), and charges for services of $2,965,371 (4.83%). Total expenses increased $448,871 (0.48%). Details related to these changes are described later in this section of the repor t under governmental and business-type activities. The following is a summary of the changes in n et position:
Revenues: Program Revenues:
Charges &,r Services Operating Gr>1.nl$ and
Contributions Capital Grants and
Contrilmtfons General Revenues:
Sales Taxes Property Truces Other 'faxes OtheT
Total Revenues
Expenses: General Government Public Safety Highways and Public
unprovemenls Par_ks, Recreation & Arts Economic and Physical
Development Red~velopment Interest on l..qng·rerm Debt Water Wat.er Reclamation Storm Wat.er Reol'eation Solid Was1,e Street Lighting
Total Expenses Change in Net Position
before Transfers Transfers f n (Out)
Change in Nel Position NeL Pos,uon · Beginning
Net Pos1lion · Ending
City of Orem's Change in Net Position
GoveramentaJ Activil.ies
2020
S 19,710,806 $
6,228,568
4,513,950
28, [51,590 10,432,989 8,831,580 2,384,028
80,253,511
15,221,97 J 26,294, 148
7,573,688 8,734,158
709,334 1,258,821 4,782,568
64,524,688
15,728,823 326,4'63
20l9
19,548,772
1.392,846
5,246,807
24,94.4,421 9,701,398 8,773,821 2.453,409
72,061,469
15,017,456 25,46-3,] 1 J
7,688,525· 9,6)3,483
887,655 l ,OOil,364 4,122,763
63,797,357
8,264,112 637,275
16,055,286 189,694,9-47
$ 206,750,2:33
8,901,387 I 80. 793,560
$ 189,694,947
-19-
13usiness·type Activities
2020
S 44. 701,569
3,179,941
1,011,784 48,893,294
13,039.211 71540,672 3,119,773 1,25/1,441 4,277.997
481,587 29,7 17,681
2019
$ 41.898,232
4,19G,701
1,095,773 47,190,706
13,361,446 7,517.084 2,837,289 2,041,021 3,764 859
474,442 29,996,l•ll
To(;al 2020
$ 64,4 l2,375 $
6,228,568
7,693,891
2S,l51,590 10,432,989 8,831,580 3,395,812
129,146,805
15,221,971 26,294,148
7,573,688 8,734,158
709,3:-14 1,258,821 4,732,568
13,039,211 7,540,672 3,119,773 1,258,441 4,277,997
481.587 94,242,369
2019
61,447,004
1,392,846
ll448,508
24,944,d2l 9,701,89$ 8,778,821 3,549,182
119,252,176
15.017.456 25,463, 111
7,688.526 9,613,483
887,656 1,004,364 4,122,763
13,361,446 7,517,084 2,837,289 2.D41,021 3,764,859
474,442 93,793,498
19,175,613 17,194,565 34,904,436 25,458,677
($26,463) __ ( .... 63""'7"",2""'75.._) --------,----18,849,150 16,557.290 84,904,436 25,458,677
119,548,137 102,990,847 309,243,084 283,784,407
S 138,397,287 S 119,548, 137 $ 344,147,520 S 309,243,084

City of Orem Management's Discussion and Analysis
June 30, 2020
Governmental activities. Governmental activities increased the City ofOrem's net position $16,055,286 (8.46%). This is an increase of $7,153,899 from the prior year. Total revenues increased $8,192,042 (11.37%). Sales tax revenues increased $3,207,169 (12.86%), operating grants and contributions increased $4,835,722 (347.18%), and property taxes increased $731,596 (7.54%). Total expenses increased $727,331 (1.14%).
The following gi·aph displays the goveTnmental activities reflected in the table "City of Orem's Change in Net Position". Note that the graph does not include general revenues of $49,794,202 because these revenues are not specific to a particular department.
Program Expenses & Revenues - Governmental Activities For Fiscal Year Ending June 30, 2020
$30,000,000
$25,000,000
$20,000,000
$15,000,000
$10,000,000
$5,000,000
$0
liiil Expenses a Revenues
Key elements affecting the change in governmental activities net position are as follows:
• Total rnvenues increased $8,192,042 (11.37%). • Operating grants and contributions increased $4,835,722 (347.18%).
The increase was due to receiving $4,011,796 in CARES Act ORF funds from Utah County as part of the COVID-19 pandemic relief. These funds were primarily used to cover the costs of public safety personnel who dealt with various aspects of the pandemic.
• General revenues increased $3,927,143 (8.56%). The increase was due, in large part, to sales tax revenues increasing by $3,207,169 (12.86%).
-20-

City of Orem Management's Discussion and Analysis
June 30, 2020
The benefits of having a strong retail base became evident as local sales tax revenues continued to be strong even during the COVID-19 pandemic. These revenues increased by $1,003,073 (4.4%). For the period of March to June 2020, sales tax revenues increased 5.51% while they only increased 3.8% for the July 2019 to February 2020 period of the fiscal year. Most of the remaining increase in sales tax revenues was due to a new ti·ansportation sales tax that became effective July 1, 2019, and is dedicated to transportation infrastructure improvements. The amount received in the cunent fiscal year for this new tax was $2,129,802. Property tax 1·evenues increased $731,596 (7.54%). The increase in these revenues was due, in large part, to receiving $366,841 in additional redevelopment (RDAJCDA) tax revenues. The City also increased its property tax rate in order to hire additional police officers. The rate increase resulted in a $237,536 increase in revenues.
• Total expenses inc1·eased by $727,331 (1.14%). • Salary and benefit costs across all expense categories increased, in total,
by approximately $1,567,000 in the current fiscal year due to general salary and benefit increases given at the beginning of the fiscal year. However, total personnel costs were decreased by approximately $590,000 in decreased pension costs due to improved investment performance.
• Various materials, supplies and contracted service costs decreased by approximately $395,000 as city departments curtailed spending in the last four months of the fiscal year due to the COVID· 19 pandemic.
The following graph displays the governmental activities revenues by source. The information reflected in this graph comes from the "City of Orem's Change in Net Position" table shown previously.
Revenues by Source - Governmental Activities For Fiscal Year Ending June 30, 2020
Property Taxes 13.0 °o
Capital Grants 5.62%
Operating Grants 7.76%
Services 24.56%
-21-
/
Sales Taxes 35.08%
Other Taxes 11.00%
Other 2.97%

City of Orem Management's Discussion and Analysis
June 30, 2020
Business-type activities. Business-type activities increased the City's net position by $18,849,150. The inc1·ease in net position represents a 15.77% inc1·ease for the current year. Total revenues increased $1,702,588 (3.61 %) and total expenses decreased $278,460 (0.93%). As of the end of th e cunent fiscal year, all of the City's b usiness-type activities reported a posit ive net position.
The following gTaph displays the business-type activities for enterprise funds reflected in the table "City of Orem's Change in Net Position".
Program Expenses & Revenues - Business-type Activities For Fiscal Year Ending June 30, 2020
$25,000,000 II Expenses 1.1 Revenues
$20,000,000
$15,000,000
$10,000,000
$5,000,000
$0
Key elements affecting the change in business-type activities net assets are as follows:
• Business-type activities reported an increase in total revenues over the prior year of $1,702,588 (3.61%). Total revenues increased or decreased as follows:
-22-

City of Orem Management's Discussion and Analysis
June 30, 2020
o Water fund total operating revenues increased $1,887,321 or 9.97%. There was a 8.02% increase in base 1·ates along with an 11.36% increase in the Tier 1 usage rate as well as increases in Tiers 2·4 usage rates. The RevenuesbySource-Buslness-typeAcUvlUes
City intends to use the For Fiscal Year Ending June 30, 2020 Gain on Sale
additional revenues from R~r::.:~::. Q~~!"',:1 Operating All Othe(S -0.1'¾
these higher wate1· rates for :.:~"~~~~' 1w4
future capital improvement 100""
needs rather than incurring additional debt. Thus, char ges for services r evenues inc1·eased by $1,539,562 or 9.27%. Other revenues increased by $347,759. The primary reason for the increase in other revenues was a $500,000 inc1·ease in t he funds received from the Metropolitan Water District of Orem for the purpose of
Reclamahon 22.3%
constructing a large wate1· storage tank.
Operating Revenues .
Water 42.3%
o Water Reclamation fund total operating revenues increased $1,551,647 or 13.47%. The increase in revenues is due to a 15.02% increase in the sewer base rate and a 16.06% increase in the sewer volume charge.
o Storm Water fund total operating revenues increased $275,105 or 5.76%. The increase was due to a $0.25 rate increase in the "equivalent sel'vice units (ESU)" rate. The rate went from $7.10/month/ESU to $7.35/month/ESU (3.52% increase).
The graph on the previous page displays the business -type activities revenues by source. The information reflected in this graph comes from the "City of Orem's Change in Net Position" table shown previously.
• Business-type activities reported a decrease in operating expenses from the prior year of $278,460 (0.93%). Operating expenses increased or decreased as follows:
o Personnel costs decreased $393,574 (5.49%). While salary and benefits costs increased, the total costs of personnel decreased due to decreases in pension costs.
-23-

City of Orem Management's Discussion and Analysis
June 30, 2020
o Utility electric costs decreased $350,102 (19.23%). The decrease was due p1·imarily to the closure/demolition of the City's fitness center for reconstruction.
o Contract services costs increased $623,420 (7.98%). The increase is due to increases in the City's solid waste (garbage) hauling contract as well as a can count audit which netted additional cans which had not been included in the monthly bill to t he City.
o Depreciation expense increased $187,625 (3.56%). The City's automated meter reading installation project also added approximately $1.9 million to the Water Fund's fixed assets along with corresponding depreciation for the fiscal year. Water Reclamation had two sewer line pl'Ojects totaling approximately $1.8 million which also added additional depreciation expense.
Financial Analysis of the Government's Funds
As noted earlier, the City of 01·em uses fund accounting to ensure and demonstrate compliance with finance-related legal requirements.
Governmental Funds The focus of the City's governmental funds is to provide information on near term inflows, outflows, and balances of spendable resources. Such information is useful in assessing the City's financing requirements. In particular, unassigned fund balance may serve as a useful measui-e of the government's net resources available for spending at fiscal year end.
As of the end of the current fiscal year, the City's governmental funds reported combined ending fund balances of $80,702,364. Of this total amount, $12,376, 113 (15.34%) constitutes unassigned fund balance, which is available for spending at the government's discretion. Unassigned fund balance decreased from the prior year by $1,571,995. The remaining fund balance of $68,326
1251 is "reserved" in one capacity 01· another indicating that it is not
available for new spending !because it has already been committed to pay for debt service, capital projects, or a variety of othe1· purposes.
The General Fund is the chief operating fund of the City. At the end of the current fiscal yeai-, unassigned fund balance of the general fund was $12,376,113 and total fund balance increased to $3,857,581. As a measure of the general fund's liquidity, it may be useful to compare both unassigned fund balance and total fund balance to total fund expenditures. Unassigned fund balance represents 22.42% (prior year was 23.34%) of total General Fund expenditures, while total fund balance represents 56.79% (prior year was 51.92%) of total General Fund expenditures.
-24-
City of Orem Management's Discussion and Analysis
June 30, 2020
General Fund· Total fund balance increased $3,857,581 in the current fiscal year (the prior year had an increase of $2,110,480). Thus, there was a positive variance from the prior year of $1,747,101. The following elements were key factors contributing to the tota l fund balance change:
• Total revenues of the fund increased $4,554,296 (7.35%). Taxes and special assessments increased $1,190,264 (3.18%), licenses and permits revenues decreased $903,012 (35.21 %), and intergovernmental revenues increased $4,654,180 (108.52%). Details about t hese variances a re as follows:
o Taxes and special assessments increased primarily due to sales tax revenues increasing $1,001,306 (4.40%). As mentioned previously, the City's strong retail base continued to do well despite the COVID-19 pandemic with significant gains in the general merchandise and gi·oceries, building materials and tools, recreational supplies, and auto dealers categories. While there were decreases in the home furnishings, amusement, clothing, and restaurant categories, the category increases mentioned were greater than these decreases. Transient room taxes related to hotels did decrease by $27,190 (15.98%) for the fiscal year due entirely to the pandemic.
o Licenses and pe1·mits revenues decreased due primarily to a decrease of $881,409 (50.25%) in building permit revenues. The decrease occurred primarily because a significant amount of development occurred in the prior fiscal year in an area annexed into the city a few years ago but not as much development in this ai·ea occurred in the current fiscal year. The COVID-19 pandemic also played a role in slowing down or delaying construction projects as the late winte1· and early spring a re when the city normally sees a significant amount of activity in building permits.
o Intergovernmental revenues increased due to receiving $4,011,796 in CARES Act CRF funds from Utah County as part of the federal relief package related to the COVID· 19 pandemic. These funds were primarily used to cover the costs of public safety personnel who dealt with various aspects of the pandemic.
• Total expenditures increased $2,258,767 (4.27%). General government expenditures increased $352,263 (2.45%), public safety expenditures increased $976,474 (4.14%), and capital outlay expenditures increased $917,006 (19.42%). D etails about these variances a re as follows:
o General Government expenditures increased as the result of higher personnel costs due to gener al wage and benefit increases of $502,058 (~.39~). Contracte~ ser vice? a lso increased $69,677 (13.83%) pnmai·ily due to the City's public safety assessment study which is analyzing and evaluating public safety operations.
o Public Safety expenditures increased as the result of higher personnel costs due to general wage and benefit increases of $965,920 (4.83%). Police department wages and benefits incr eased
-25-
City of Orem Management's Discussion and Analysis
June 30, 2020
$525,950 (4.19%) and fire department wages and benefits increased $439,970 (5.91%).
o Capital outlay expenditures increased due to the pm·ch~ise of vehicles for the additional police officers authorized as part of the City's property tax rate increase, the initial payment for a new fire engine, and additional street micro·sm-facing expenditures.
Deht Service Fund- Total fund balance is $2,761,715, all of which is to be used fOl' th,~ payment of debt service. There was a net dec1·ease in fund balance in the current year of $1, 116,615. The decrease was the 1·esult of using the 2019 General Obligation Bonds capitalized interest funds to make the 2019 GHne1·al Obligation Bonds payments for the fiscal year.
Capital Projects Fund- Total fund balance is $18,169,938, all of which is to be used for capital improvements and large equipment purchases. There was a net increase in fund balance in the cu1Tent yea1· of $2,154,589 (13.45%). The increase was due to a $4,600,000 transfer from the General Fund which will be used to improve several parks and streets as well as making improvements to various city facilities including the city center, cemetery buildings, liibrary, public safety buildings, fitness center, and outdoor pools.
2019 tJ. 0. Bonds Capital Proiects Fund· Total fond balance is $10,966,4,53, all of which is to be used for capital improvements and large equipment purchases for the new Library Hall and reconstructed Fitness Center. There was a net decreatse in fund balance in t he current year of $14,500,189 due to expending these bond funds for these two construction projects which are expected. to be compkited in the next fiscal year.
Redevelopment Agencv Special Revenue Fund - Total fund balance is $6,694,288, all of which is to be used for infrastructure or other projec;t area improvements within the city. There was a net increase in fund balance in the currertt year of $854,059 (14.62%) due to accumulating tax increment revenues within project areas for future use as projects are identified within the individual project ai-eas.
Proprietary Funds The City's proptietary funds provide the same type of information found in the government-wide financial statements, but in gi·eater detail.
Water Fimd - Unl'estricted net position at the end of the year amounted to $30, 7D6,634, an increase of $6,892,554 (28.83%). Total net position inct-eased by $9,1632,547 (16.51%) dul'ing the current fiscal year (prior fiscal year had an increase of $7,802,235 or 15.43%). Items affecting the change in total net position of the fund are as follows:
• Operating revenues increased $1,887,321 (9.97%). There was an :8.02% increase in base rates (from $18. 70/month to $20.20/month on a ¾" meter) and an 11.36% increase in Tier 1 water usage rates (from $0.88/1,000 gallons to $0.98/1,000 gallons). Tier 2 through 4 usage rates were a lso increased.
-26-

City of Orem Management's Discussion and Analysis
June 30, 2020
• Operating ex'J)enses increased $291,652 (2.50%) in comparison with the prior yeax. The increase includes $15 1,616 (4.33%) in increased contract services for water treatment and storage as well as increased depreciation expense of $147,600 (6.02%) due to additional automated meter rnading installation project costs were added.
Wate1· Reclamation Fund· Unrestricted net position at the end of the year amounted to $17,884,095, an increase of $4,539,444 (34.02%). Total net position incl'eased $6,130,290 (17.93%) dm·ing the current fiscal year (prior fiscal year had an increase of $5,582,922 or 19.52%). Items affecting t he change in total net position of t he fund are as follows:
• Operating revenues increased $1,551,647 (13.47%). The increase was due to a 16.06% increase in the seweT volume charge (from $2.18/1,000 gallons to $2.53/1,000 g·allons) and a base rate increase of 15.02% (from $10. 72/living unit to $12.33/living unit).
• Operating expenses increased $21,751 (0.30%) in comparison with the prior year. Personnel services increased $51,221 (2.32%) due to gene1·al wage and benefit inc1·eases. Administrative fee charges increased $91,125 (11.39%) primarily due to allocating a higher portion of administl'ative time associated with capital projects. Utilities expense decreased $121,383 (16.46%) primarily due to a reduction in an accrual for Provo City sewer treatment costs which has finally been resolved.
Storm Water Fund· Unrnstricted net position at the end of the year amounted to $8,393,071, anincl'ease of$1,707,181 (25.53%). Total net position increased $2,258,564 (10.78%) during the cunent fiscal year (prior fiscal year had an increase of $2,021,577 or 10.67%). Items affecting the change in total net position of the fund are as follows:
• Operating revenues increased $275,105 (5.76%), due to a $0.25 increase in the "equivalent service units (ESU)" rate which went from $7 .10/month/ESU to $7 .35/month/ESU,
• OpeTating expenses increased $281,929 (10.25%) in comparison with the prior year. Personnel services increased $136,642 (14.97%) due primarily to an increase in personnel costs due to general wage and benefit increases as well as an increase in the allocated pension costs related to this fund. Depreciation expenses inc1·eased $81,366 (10.65%) due to several large capital projects from the prior year having a full year of depreciation in the cw·rent fiscal year.
General Fund Budgetary Highlights
During the fiscal year. the General Fund's original budget was amended from an original budget expenditure total (including net ti·ansfers) of $61,031,733 to a final budget of $721300,098, an increase of $11,268,365 (18.46%). The changes to the Gener al Fund budget are briefly summarized as follows~
-27-

City of Orem Management's Discussion and Analysis
June 30, 2020
• Va1·ious public safety grants and donations received during thei year totaled $381,736 and various fines and forfeitures related to the• drug task force increased by $133,835.
• The library received several grants during the year totaling $7:2,956. Various other parks, recreation, and arts grants and donations were added to the budget totaling $51,842.
• Various capital project, equipmen t, and outstanding pm·chases were carried oveT from the prior year and, therefore, were added to the budget in the current year. This increased the budget by $3,967,885.
• Va1·ious outstanding road projects were carried over from the prim· year and, therefore, were added to the budget in the current year. This increased the budget by $1,753,430.
• The City transferred $4,600,000 to the Capital Projects Fund. The transfer was done as an appropriation of surplus funds in order to stay within the State of Utah's General Fund fund balance limitation.
Seve.t~u General Fund 1·evenue and expenditm·e categories wern significantly higher 01· lower than their final budgeted amounts. These variances are briefly summarized as follows:
• Intergovernmental - Revenues - Actual amount was higher tham the budgeted amount by $4,919,685 (122.28%). Actual revenues were higher t han budgeted revenues because the City was not able to amend its budget before the fiscal yearend for t he $4,861,276 of CARE,S Act funds it was awarded through Utah County.
• Investment Earnings - Revenues -Actual amount was higher than the budgeted amount by $498,997 (62.37%). The City's investmen ts saw significant improvements in the interest rates being paid compa:red to the prior year.
• General Government - Expenditures - Actual amounts were lowe1r than budgeted by $2,427,351 (14.00%). The following narrative provides details about this variance from budget:
o V ai·ious facility maintenance projects weTe n ot able t o be completed leaving $339,836 in unspent budget funds.
o vVages and employee benefit costs were lower than budget by $571,082. The variance is p1·imarily due to vacant positions that occur naturally throughout the fiscal year.
o PTofessional and technical services accounts were lower than budget by $438,676 as expected service costs were either delayed or determined to not be necessary.
o Election costs were lower than budget by $28,648 because a large part of these expected costs were covered by Utah County.
o Employee development costs were lowe1· than budgetHd by $63,409 primarily due to conference travel cancelations due to the COVID· 19 pandemic.
o Various contingency accounts were not used and thus, were lower t han budget by $406,193.
• Public Safety - Expenditm·es - Actual amounts were lower than budgeted by $2,910,694 (9.85%).
-28-

City of Orem Management's Discussion and Analysis
June 30, 2020
o Regula1· pay, overtime. and fringe benefits were lower than expected by $406,694 due to fully funding all positions in the budget even though employee turnove1· regularly occurs leaving gaps in positions being occupied.
o Various vehicle, equipment, and uniform costs totaling $349,778 did not get purchased by the end of the fiscal year but were budgeted.
o Fire apparatus totaling $1, 165,802 was budgeted but not spent because it is being accumulated until there are enough funds to pay for the equipment with cash.
o Employee development costs were lower than budgeted by $102,107 primarily due to conference travel cancelations due to the COVID-19 pandemic.
• Highways and Public Improvements - Expenditures - Actual amounts were lower than budgeted by $2,398,408 (27.31%). Most of this variance can be attributed to val'ious street overlay/reconstruction projects, sluny seal projects, micro-surfacing, and street striping projects that were not completed by fiscal year end but are expected to be completed in the next fiscal yea!'.
• Pru·ks, Recreation, and Arts - Expenditures - Actual amounts were lower than budgeted by $1,038,100 (12.72%). P ersonnel costs were lower than budgeted by $275,380 due primarily to several positions being vacant for some of the fiscal year and difficulties in finding enough temporary worke1·s to fill all of the City's open positions. There were also several budgeted equipment purchases and capital projects that had funds rnmaining totaling approximately $307,000.
Capital Assets and Debt Ad ministration
Capital assets. The City's investment in capital assets for its governmental and business-type activities as of June 30, 2020, amounts to $262,152,546 (net of accumulated depreciation). This investment in capital assets includes land. buildings, improvements other than buildings, machinery and equipment (including vehicles and office equipment), infrastructure, intangibles, and constTuction in progress.
Major capital asset events dm·ing the current fiscal year include the following:
• Public safety purchased sixteen new vehicles totaling $707,556, a new ambulance for $135,055, and a new fire engine for $1,208,422.
• The engineering division purchased new GPS units for $23,528. • The parks division purchased one new utility vehicle for $14,060 and
two new riding mowers totaling $42,183. They also began the Geneva PaTk & Westmore Park renovation projects spending $542,262 this fiscal year, completed rebuilding the tennis courts and adding shade structures at Bonneville Park for $363,180, and replaced the playground structure at Windsor Park for $140,000.
• The cemetery division pUl'chased one new vehicle for $36,132.
-29-

City of Orem Management's Discussion and Analysis
Jllne 30, 2020
• The streets division pm·chased a brine maker, tanks and buildi)(lg for $273,608, two message board trailers totaling $29,950, and various other equipment totaling $56,745.
• VaTious road, street light, and landscaping projects completed or added to construction in process were approximately $3,145,000.
• The Finance department purchased audio and video equipment for the City's Justice Court for $33,826, new fingerprint equipment for $2:4,973 and budgeting software for $17,000.
• Recreation replastered the lap pool at Scera PaTk for $184,349. Reconstruction costs added to construction in progress for thH n ew Fitness Center totaled $12,189,307.
• The library pm:chased a time management system for its print/scan stations for $13,562. Construction costs added to construction in ptogress for the new Library Hall facility totaled $5,421,290.
• Vehicle chaTging stations were added at the City Center for $197,728. • Seve1·al facility projects took place in the current fiscal yeaT at the ]public
safety building, city center. and library totaling $422,998. • The water division had several waterline projects completed or added to
con struct ion in process totaling approximately $700,000. They spent apptoximately $1.9 million on the automated meter read technology project that began near the end of FY 2018. They purchased fiv,e new vehicles totaling $161,870 and a new excavator for $225,050. Various equipment purchases totaled $85,985.
• The water reclamation division had several sewer line projects completed or added to construction in process totaling $2,045,816. They pm·chased three new vehicles totaling $61,269, a truck mounted high pressure sewer cleaner for $284,840, and various other equipment totaling approximately $62,000.
• The storm water division had several storm water line projects completed or added to construction in process totaling $328,452. A new regenerative sweeper was purchased for $220,364, two new vehicles totaling $45,158, and a riding mower totaling $15,688.
City of Orem's Capital Assets (Net ofDepreciatlon)
Governn1ental
ActJv1ties
Business~type
Activitie:,s Tola! 2020 2019 2020 2019 2020 '2019
L;:wd $ 65,195.83H ii 65.H3,637 S 3,888,751 $ 3,888,751 S 69,084,590' S 6'9,302.,188 Buildings mid Sy~lem;. !J,8!3:1,'.l:ll) I0.770.67ll fl l 0,5RI 90~.51>8 10,643,7!i1 l l ,674,237
1 mprovements other
than Bu·1ldu,gij Mnchinru·y a nd Eq,1.ir)lnent lnfrastrud,11re
CousLrucL·ioo m Prng:ress
Intangibles
1'olaJ Ca.pr.iaJ Assets $
l :j,892,•J~S
7,778)192 18,821,6:H
22,'177,683
167,998,819 $
14.44S.809 5 0<!4,102 7.520.342 4.903,597
-19 214 504 75,887,779 t,,J,j3 111 i , 104,277
l ,2 l~,690
I.JS 81 I OSi, s 91.153,727
5,666,716 18,936,H0 20,J 15,525 4.943,665 12,681.989 t2.464,007
7 J 680 197 124,709,4 16 12,Q,8,14,701 J,05,J,,178 24,881,960 1,497,1\9~
I , 117.~9{) Ul14,l,90 1.1 17.900 ,,; 9 1.205,355 $ 2ti2, 152,546 s :140,016.410
Additional informat ion on the City's capital assets can be found in the foo1motes to this, financial repm·t on pages 70·72.
-30-

City of Orem Management's Discussion and Analysis
June 30, 2020
Long·term debt. At the end of the current fiscal year, the City had total bonded debt outstanding of $50,514,000. Of this amount, $29,620,000 comprises debt backed by the full faith and credit of the government and $20,894,000 is debt (i.e. revenue bonds) secured solely by specific Tevenue sources such as sales taxes, franchise taxes, wateT revenues, water reclamation revenues, and/or storm water revenues.
Genertll Obligation Bonds s Re venue Bonds
Total Bonds $
City of Orem's Outstanding Bonded Debt General Obligation and Revenue Bonds
Government.al Activities
2020 2019
29.620.000 s 30,560,000
856,000 1,338,000
30,476,000 $ 31,898,000
$
$
B\lsiness·tnie Activi1,es
2020 2019 . $
20,038,000 22,091,000
20,038,000 s 22,091.000
1'otaJ 2020 2019
S 29,620,000 $ 30,560,000 20,894.000 23.429,000
$ 50,5] 4,000 S 53,989.000
The City1s total bonded debt decreased by $3,475,000 (6.44%) during the current fiscal year. The City made its final principal payment on the 2010 Northgate Village Special Assessment Revenue Bonds of $130,000. No new bonded debt was issued during the fiscal year.
The City of Orem maintains a ''AAA" rating from Fitch Ratings and a "AA" rating from Standard & Poor's for all bond issuances.
State statutes limit the amount of general obligation debt for general purposes a governmental entity may issue to 4% of its total taxable value. The cunent limitation for the City is $377,874,800, which is significantly in excess of the City's outstanding general obligation debt for general p urposes. In addition, state statutes allow for an additional 4% to be used for water, sewer, or electrical projects. Thus , the current limitation for general obligation debt for water, sewer, or electrical projects is $408,651,401. The City currently has no outstanding general obligation debt for these types of projects. Thus, the resulting total debt limit is 8% of total taxable value or $786,526,201. More detailed information can be found on pages 170· 17 l.
Additional information on the City's long·term debt can be found in the footnotes to this financial report on pages 75-80.
Economic F actors and Next Year's Budgets and Rates
• The unemployment rate foT the City of Orem at June 30, 2020 was 5.0%. The City's unemployment rate compares favorably to the national rate of 11.1 %. The City has a relatively high technology based workforce comparative to other areas of the county and state which can be impacted (for good or bad) to a slightly higher degree than many other workforce groups in the economy. This has been particularly beneficial dm'ing the current COVID· 19 pandemic as the need fo1· technology·
-31-

City of Orem Management's Discussion and Analysis
June 30, 2020
based solutions has been expedited. The table below provides current yea1· comparative information as well as a historical per spective. (Source : U.S. Bureau of Labor Statistics).
HISTORICAL ANNUAL UNEMPLOYMENT RATES
2016 2017 2018 2019 ~
City 3.9% 3.7% 3,3% 3.1 % 5.0%
Col:lilty 3.9% 3.6% 3.4% 3.1% 4.5%
State tl.2¾ 3.9% 3.5% 3.2% 57%
Nation 5.1% ,(.5% 4.2% 3 .8% 11.1%
• The General Fund budget for the fiscal year ending June 30, 2021 reflects a decrnase of $12,236,090 or 21.32% in r evenues1 excluding appropriations of surplus, compared to the final actual revenues for the fiscal yeai- ended June 30, 2020. The decrease in revenues is due primarily to expected negative COVID· 19 impacts on revenues such as sales tax revenues, building related permits and fees, justice court fines, recreation program foes, and interest earnings . Budgeted expendjtm·es decreased by $8,378,509 or 14.60% over the final fiscal year ended June 30, 2020, expenditures. Again, due to expected negative revenue impacts of COVID· 19, all departments decreased their budg·ets by 3% and no capital projects or acquisitions were included in next year's budget.
• Despite some negative impacts of the current pandemic, the state and t he city continue to compare favorably to national indices. Sales tax 1·evenues continue to increase in comparison to the prior year. Building permits and related fees continue to be better than expected. These revenue sources as well as others are monitored very closely so the City can identify what future spending may be able to be added s hould positive revenue trends continue.
All of these factors were considered in p1·epaTing the Citi s budget for the 2020· 2021 fiscal year.
Request For Information
This financia l report provides a general overview of the City of Ore m's finances for a ll those with an interest in the government's finances. Questions concerning any of the information provided in this report or requests for additional financial information should be addressed to:
Brandon C. Ne lson, CPA City of Orem Finance Director 56 North State Street, Orem, UT 84057 01· via email at [email protected]
-32-

BASIC FINANCIAL
STATEMENTS

City of Orem Statement of Net Position
June 30, 2020
Primary Government Government.al Busine&B·type
Activities Activttlos Total
ASSETS Cash and Ce•h E:qu1vtllenui s 37.284 014 s 60.222 611 $ 97,506,625
Ri!ceivables (Net of Allowance for Uncollecubles> 742,670 1,792,971 5,585,650
Property and Other Taxes Receivable 10,708,465 10,708,465
Special Assessments Rece1vablo 32.917 oil.917
Intergovernmental Rl.'ce1vables 5,096,996 5,096 995
lnveslrucnts 9 977 170 9977170
lnv~ntory 341,494 341,49~
Notes Receivable 188.829 188,829
Prepaid Expenses 80.111 80,lll Rest~icted Auets:
Cash and Ca•h Equ,valenuf Debt Service 2.460,366 2 l67,258 4,617,621
CapiUII lmprovemenl.l! 26,723,604 1,067,806 27,781,410
O~hrr Purposes 3.368.661 S.308.661
RPce1vables:
Debt Sel"Vlce I 474 796 1,474 796
Capital Improvement Project:B 2 960,740 2 960,740
Other Purposes 1,527,587 1,527,587
I nvestmonls, Debi Service 2,468,527 2,468,527
Capital I mprovl!mcnt Proiecls 2, 150,459 2 150,469
Net Pension ""-.sets 2,426,403 2.426,403
Capita I Al;set&:
Non·deprec1able Capital Assets 87,673,522 7,507,718 95,181,240
Depreciable Capital Assets (net) 80,325.297 86,646,009 166,971,306
Tota I Asaets 278.012,636 162 384,373 440,397,009
DEFERRED OUTFLOWS OF RESOURCES Deferred Losa on Debt Refundings 131,306 727,588 858,894
Pensions 6,288.095 964,478 7 252,573
Toto I Deferred Outllowa of Reeourcc~ 6,<119,401 I 692,066 8,111.467
1'otal Assel8 & Deft•rred Outflows or ResoiuceA s 284,432,037 s 164 076,439 s 448,508,476
LIABILITTES Accounts Payable s 1,016,560 s 1,820,879 s 21137 439
Customer Depos1ls 6,276,235 106,995 6,383,230
Accrued L1ab1hlle6 2 251.872 331 129 2,586,001 Unearned Revenues I .37t882 204.123 1,579,005
Acerued I ntc rest Payable 294,623 167,402 462,025
Liabilities Pnynble from Rastrict.ed Asset.!' 761.614 761,614
Noncurrent Llab1litie~-Due w11h!n OM Year 4,648.969 2,•190,126 7,139,096
Due m more than One YPar 46,485.267 19,863,478 66,348,745 'l'o~! L1Ab1Hties 63,113.022 2d,9M,132 88,097,155
DEFERRED INFLOWS OF RESOURCES
Deferred Revenues· Properly Ta~es 9,549 220 9,549 220
Pensions 6,019,562 695.020 6,714 582 To1al DPfPm,d lnflowa ofResou,·ccs lfi,568,782 695,020 16.263.802
NET POSITION Net lnvl'slment in Capital Assets 138.676.06l 71 134,249 212.810,310
Reslrictcd for Debt Service 4.928,893 !?, 167,258 7 ,086,151
Capitol I mp rove men ts 18,992,824 1,057,806 20,050 130
Pension~ 2,428,403 2,426,403
Commumly Developnien1 4,048 00 4,048,008
Unres1r1c1ed 36,678.514 61,047.974 97,726,518
Total Net Position 205. 700,233 138,397,287 344,147,520
1'otal Liabilit1ea, Defer,oed lnllow• or Reaou,·ccs, and Net Posil.lOn $ 284 432.037 s 16<1,076.439 s 448,508,476
The notes Lo Lhe financull statements are an integral partofthia ~tat.emenl
-33-

Functions/Programs Primary Government:
Governmental Activities: General Government
Public Safety Highways and Public 1mprovements Pa1·ks, Recreation and Arts
Economic and Physical Development Redevelopment Interest on Long·term Debt
Total Governmental Activities
Business-type Activities: Water Water Reclamation Storm Water Recreation Solid Waste Street Lighting
Total Business-type Activities Total Primary Government
City of Orem Statement of Activities
For The Year Ended June 30, 2020
Expenses
$ 15,221,971 $
26,294.148 7,573,688 8,734,.158
709,334 1,258,821 4.732,568
64,524,688
13,039,211 7,540,672 3,119,773 1,258,441
4,277,997 481,587
29,717,681 $ 94,242,369 $
Pro,gram Revenues Operating Capital
Charges for Grants and Grants and Services Contributions Contributions
10,198,818 $ 7,804,339
240,568 1,427,168
39,913
19,710,806
20,821,417 13,070,784
5,050,924 746,080
4,098,072 914,292
44,701,569 64,412,375 $
General Revenl.\es: Sales Taxes Property Taxes F1•anchise Taxes Vehicle Taxes
126,453 $
5,471,257
34,319 572,946
23,593
6,228.568
6,228,568 $
Other Taxes & Special Assessments Unl"est1.-icted Investment Earnings Gain (Loss) on Sale of Capital Assets
Transfers In (Out)
Total General Revenues and Transfers
Change in Total Net Position Total Net Position · Beginning
Total Net Position - Ending
132,774 3,447,050
535,034 399,092
4,513.950
2,125,400 540,985 513,556
3,179,941 7,693,891
The notes to the financial statements ai:e an integral part of this statement
-34-

Net (Expense) Revenue and Changes in Net Position
Primary Government Governmental Business·type
Activities Activities Total
$ (4,896,700) $ $ (4,896,700) (12,885,778) (12,885,778)
(3,886,070) (3,886,070) (6,737,637) (6,737,637)
302,617 302,617 (1,235,228) (1,235,228) (4,732,568) (4,732,568)
(34,071,364) (34,071,364)
9,907,606 9,907,606 6,071,097 6 ,071,097 2,444,707 2,444,707
(512,361) (512,361) (179,925) (179,925) 432,705 432,705
18,163,829 18,163.829 (34,071,364) 18,163,829 (15,907,535)
28,151.590 28,151,590 10,432,989 10,432,989 7,865,944 7,865,944
654,252 654,252 311,384 311,384
2,060,562 1,037,245 3,097,807 323,466 (25,461) 298,005 326,463 (326,463)
50,126,650 685,321 50,811,971 16,055,286 18,849,150 34,904,436
189,694,947 119,548,137 309,243,084 $ 205,750,233 $ 138,397,287 $ 344,147,520
-35-

(This page left blank intentionally)
-36-
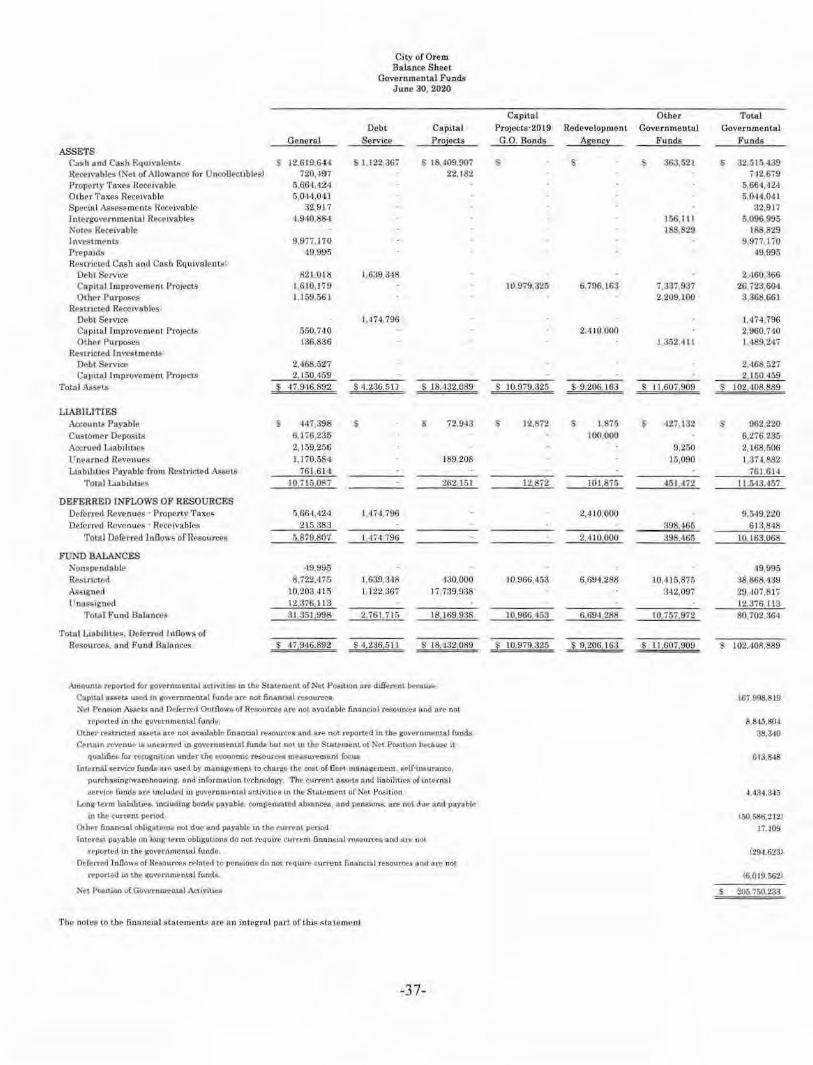
City or Orem Balance Sheet
Gove rnmental Funds June 30. 2020
Debt Capit al
Gene ral Ser vice P roject.,; ASSETS
Cash and Cash F.qu,valcnLs s 1:1,619,64"1 S l.122,36i S 18,409,00i Reej>1VObles (Ket of AllowanC<' foT llnoollccubles) 720,497 22. 182 Property Tax~s Rccc,vable 6,664,424 Oth er Taxes Receivable r.,044,041 Specui l M•essme nts Receivable 32,917 Intergovernmental Recrivables 1,9-10,&54 ~otes Receivable Investments 9,977.170 Prepaid~ 49.995 l'!.l,stncwrl. Cash und Cash Equivalealtw:
Debi Service 821,0 l R 1.639.,H8 Capata! lruprovemen1 l'roJecLS 1,610 179 Other Purpose& 1,159,561
Restricted Re<-eivables: Debt Servrne I , 174,796 Cuph a l Improvomena ProJetl:s 650,740 Other P1.1r(l()6es 136.8:JG
ResLrac1ed ln,..,s1menu: Debt S.,rv,ce 2,468,527 Cap11..n) lmprOv~mcnt ProJects 2, 150,459
Total Assets $ 17,9•16,892 S 4,236,51] $ 18,d321089
LlABlLIT IES Accounu Payable s H 7,398 s 72,943 Custorner Oeposit,a G.1i6,235
Accrued Liaba.lJtar~ 2, 159,2.56 LTnearned Reve,1ues 1,170,584 189,208 Liabilit ies Puyable from Restricted As&uls 761.614
1'ornl L,aba.lJties 10,715.087 262.151
DEFERRED L'I/FLOWS OF RESOURCES Oeferrt>,1 Rrvrn ues • l'roperiv Taxc• Jl,664,424 I •IH,796 Dere,·1·01I Reven<;eij · R.1•c••1vables 215,383
Total Deferred In Rowe of Resources !l,879.ll07 l 47<1.796
FUND BALANCES ],;onspPndable ,19,995 Rc,tnclCd 8.722.-175 1,639,3•18 J30.ooo A~••~neal l0,20il,415 l, 122,HG7 11nfl,938 tlnru;s,gned 12,376,11:3
Tornl Fund Balanc-es 31.351,998 2.iGl.715 18,169,938
1'olal l, 13b1lihPs, Deforr6d h,nows of Re~ourc:c~, and Fu nd lla l11nr.cs $ 47,946,892 $ 4,286,511 S 18,-132,089
Am.ounu l't'ported for tto~mrnental sctivllleR 1n lhe Sta_iement or Nel l'oe1uon ore d1fferen1 btta~ Cap1t.'il a.utft l.l.Sed m governmental rund.1-ort> not.fmaneu\l f\tfiOlu·ccs,
Net Pc,nr,,on As.se1.s nnd Deferred Outflows. of RPsourtes ar~ not Avait:abh.11 finonou:il rM0l.l.1~~• and nre not. n•µorted in th<' governmental fundt1.
Oth~r rt.klncted a Meli! art no1 avatlabk• financial i•eaource1 and tlre oot. rcpottcd 111 the govttrnme-nl..8,l funds Cf"na1n revenue le u.nco .. ned m govc-rnmtnt.al funda bu1 no, m the Swu~ruenl of Net Pc».1hon btca.u&e it
qwalifi.t!'s. fot" recocmt1on u1\der 1 M KOnomic -resoutces tnea.sw-elllemt focU6 fnl\!rnal servu:o fund}J 'ltt> used by manag(\rnent ro charga lht' cost of Oee1, management . sel(·1n~urnnce.
pur<:hsiEiing/warehouJJing, and 1nformot.ion C<'f:!hnotob')' The tut..,eh.t a8s1:H..e nnd 1ia.biJ1t1uR o( ln\H'('lal 11erv1ce- Cunds tl'tl!" uh;Judcc.l in governmrnuU aetivi1iu m the Statement o ( :~ct Position
Lcng·1nm U.-,.bilibe5 1t1cJud1ng bonrut payable. eumpern.atfld sb.sencea, and p~ns1onfi:. a.re not dul· a.nd payablr ,n the cut'l"ent l)(:'nod
Ot hfl'r financial obbJ{!lUOne not d1.1e and p•ya.ble 1n I he cur~n• period. fntc•·eet 1)8)'Able (In 1onga-tenn oblignunns do nol, t'c-quitt c'-'rrem financml ti•ftource$ :tnd tt.re 001
rPt)Ortt:'d In the 5eo,•ernmant1tl funds. Oefoi'l"ed l o0owe of Heaou:rce,s related to pem,ionado not. req_Ulrr- Clln~nL finartC:1aJ resourtl'.e and a,,. nor
ttported in. the ~vc-mmental fund.a.
:--:e-1 Poe,tion of Oon•rnmPn&al '"\ctwiuea
'!'he not•~ ln th" f,nanc,a l SLnlcment,; are"" integral pa,·t of ~his sea w uwnt
-37-
Capital Othe r Total
P rojecta·2019 Redevelopment Governmen ta l Gover nme ntal G.O. Bonds Age nc~ Funds Funds
s s s 363,521 s 32,515,.139 712,679
5,664,424 5,044,041
32,9IT 156, 111 6,096 995 188.829 188,829
9,977.170 -19,995
2,•160,,368 10,979.326 6.796, 163 7,337,937 26,723,604
2,209,100 3 368,661
l,•174,796 2,410.01111 2,960,740
1.352,411 I 489,247
2,,168,52i 2,150,459
s 10,979.32(, $ 9.:!0G, 163 $ 11,6071909 s 102,408.889
12,872 s I 876 s 127,132 s 962,220 1(1(),000 6,276,235
9,Ui0 2, 168,f>0G 15,090 1,:JN.882
761,614 12.872 101,8n 451.172 I l.5'13.457
2,4 10 ,000 !),5~9.220 398,465 6 13,848
2.4 10,000 398. 165 10.163,068
19,995 10.966.453 6.694.288 10,416,875 38.868.•139
3,12,097 20i l07,6l7 12,,176 113
10,966.453 6.694.288 10.757,972 80102 as,1
s '
l0,979.3.26 $ 9,206,163 $ 1 Ul07,909 s 102/108,889
167,998,819
8 815,80<1
38,340
613.818
4, t34.SJ5
160.686,2121 17, 109
(29-1,(,231
(6,019 562)
s 205 750,233

City of Orem St 11tement of Revenues, Expenditures, and Changes m Fund Balances
Governmental Funds For The Year Ended J1me 30, 2020
Capital Otber Total Debt Capital Projects·2019 Redevelopment Governmental Governmental
General Service Projects G.O. Bonds i\genc;r Funds Funds REVENUES
Tll.Xe;; and Special ,\s..c~~meots S 38.642, 143 S l ,5i8,201 s s $ 2 767,304 $ 4 ,JJ:l,867 S 47,401 ,515 Licenses and Permits 1,66 1,515 l ,06J.-i15 I nte rgovc rn mental 8,()42,825 i4, [48 972,038 9,989,011 Char~cs for Sewfoeij 8,648.65:3 53,588 8 ,702,243 Pines and Forfeiture& 1,;186,-174 1,386,47~ Charges for Services • Other Funds 5,039.118 5,039 118 Impact Fees 753,507 753,507 J nvcstment Earnings 1,298,997 44,973 403,948 129,330 [8,1,2111 2,061,4(;2 Mi$cellancous Revenue 936,1193 710,6!i0 l69,0::l l 1.8JG, J 74
Total Revenue~ 66,556,220 1.623.JN 784,798 403,948 2.896.634 6.546,245 78,811019
EXPENDITURES Current:
General Government 14,730,287 14,730,287 Publfo Safety 24,553.71t8 24,553. 1,1s Highways and Public lmprovement11 3.212 607 lll ,546 3,226. 153 Parks. Hecreation end Arts 6,93:J,63•1 1,006,503 7,9.J0, 137 Economic and Physical Development l•I0,279 33,171 ·128,$92 601.842 Redc\'Clopment 913,706 913,70(,
Debt Se rvice: Principal Retiremcnl I , 1!>2,961 75,000 1.527,96 1 Interest and Fiscal Charges 4.922.82/i 12,462 4 ,935,277 Capital Leases · Principal 4:35 000 435,000 Capital Leases - Inte rest I l7,,l5$ 117,353
Capit11J Outlay 5,640,066 •1.081,0!M H ,904,187 388,0:JS 2,4(;2,932 27,•176,266 Totol l!:xpenditure~
Excc~s (Deficiency> of Re,·enues 55.210,620 G.928. 139 4, 11'1.265 14,904.137 1.301.?•U 3.998,825 86, 157.730
over (under) Expendll ures 11.345,600 \5.304,965) (3,329,467) (J,t,500, 189) 1.594,890 2,547, 120 (7 646,71 ll
OTHER FLNANCJNG SOURCES (USES) Proceed~ from As~et Disposals 460,045 ~33,990 10,000 70•1.036 Transfer~ In 2,599,627 4. 188.3,50 5.283,681 12,071,658 Transfer., Out. O0.5-li ,69 t ) (33,615) (7 10.831) (350.239) (ll.6i2.376)
Total Other Financing Soun.'C8 (Uses) (7A88,0J9l ~.188.350 5..184.056 (740,831) (340,2a9) I , 10313 17 Net Change in Fund Balances 3,857,liSI (1, 1 lo,616) 2. 1114,589 (J<l,500, 189) 854,059 2,207, 18 I (6,5,1:3,39.1)
Fund Balance · 13cginnim; 27,494,1117 ;J,8i8,330 lG,0 15.:349 25.'166,642 5,840,229 8,550,79 1 87,245,758
Fund Balance - Ending S 31.351 998 5 2. 76 I. 7 15 S 18,169,938 S 10,966.~53 S 6,694.288 S 10,757 972 $80,702.364
The notes to the financial s tatements are an integrul part ofthJs statement
-38-

City of Orem Reconciliation of The Statement of Revenues,
Expenditures, and Changes in Fund Balances of Governmental Funds 'l'o The Statement of Activities
For The Year Ended June 30, 2020
Amounts reported for Gover nmental act ivities in the Statement of Activities are different because:
Net Change in Fund Balances · Total Governmental Funds
Governmental funds report capital outlays as expenditw·es. However, in the
Statement of Activities the cost of those assets is allocated over their
estimated useful lives and reported as depreciation expense.
Capital Asset Pmchases Capitalized Depreciation Expense
The issuance of long·term debt provides current financial Tesources to governmental funds, while the payment of the principal of long·term debt consumes the current financial resources of governmental funds.
Principal P ayments recorded as a reduction of the long·tetm liabilit;J
Governmental funds report the effect of premiums, discounts, and similar
items when debt is fu·st issued, whereas these amounts are amortized ln the Statement of Activities.
Amortization of Bond Refundings · Loss on Defeasance
Amortization of Bond Premiums (Discounts)
Some expenses 1·eported in the Statement of Activities do not require the
use of current financial resources and therefore, are not reported as expenditures in the government al funds.
Compensated Absences
Interest Expense
Pension Expense
Other Post Employment Benefits (OPEB) Expense
Revenues in the Statement of Activities that do not provide current financial resources are not reported as revenues in the funds.
Special Assessment Revenu es
Charges for Ser¥ices Revenues
Gain (Loss) on Sale of Capital Assets
Pension Revenues · Nonemployer Contributions-
Internal service funds are used by management to charge the costs of fleet
management, purchasing/warehousing and self·insurance t,o individual
funds. Tbe net revenue of certain activities of internal service funds is
rnported with governmental activities.
Change in Net Position of Governmental Activit'i.es
The notes to the financial statements are an integral part of this statement
-39-
$ 26,156,554
(6,643,634)
$ 1,962,961
$ (38,865)
209,650
$ (128, 549)
149,276 (283,786)
38,456
$ 13,744-
(58,830)
(380,569)
554,707
$ (6,543,394)
19,512,920
1,962,961
170,786
(224,553)
129,052
1,047,514
$ 16,055,286

City of Orem General Fund
Statement of Revenues, Expenditures, and Changes in Fund Balances · Budget and Actual For The Year Ended June 30, 2020
Budgeted Amounts Actual V a.riance with Original Final Amounts Final Budget
REVENUES Taxes and Special Assessments $ 38,644.768 $ 38,644,768 $ 38,642,143 $ (2,625) Licenses and Permits 1,515,000 1,515,000 1.661,515 146,515 Intergovernmental 3,598,500 4,023,140 8,942.825 4,9 19,685 Charges for Services 8 ,498.797 8,524.954 8,648,655 123,701 Fines and Forfeitui-es 1,426,300 1,560,135 1,386.474 (173,661) Charges for Services · Other Funds 5,039,118 5,039,118 5,039,118 Investment Earnings 800,000 800,000 1,298,997 498,997 Miscellaneous Revenues 593,900 770,275 936,493 166,218
Total Revenues 60,116,383 60,877,390 66,556,220 5,678,830 EXPENDITURES
General Government: Legislative 444,255 444,642 406,367 38,275 Executive 4,006,014 4,504,312 3,565,586 938,726 Finance 4.216, l 73 4.253,775 3,931,625 322,150 Development Ser vices 4,413,526 4 ,682,505 3,862,188 820,317 Legal Services 1,348,214 1,346,048 1,273,018 73,030 Other · Unclassified 2,604,704 2,108,917 1,874,064 234,853
Total General Government 17,032,886 17,340,199 14,912,848 2 ,427,351 Public Safety:
Police 15,922,008 17,415,215 16,328,313 1,086,902 Fire 10,663,532 12,147,216 10,328,424 1,823,792
Total Public Safety 26,585,540 29,562,431 26,651,737 2,910.694 Highways and Public Improvements:
Administration 524,328 545,619 508 ,728 36,891 Traffic and Streets 6,008,235 8,237,904 5,876,387 2,361,517
Total Highways and Public Improvements 6,532,563 8,783,523 6,385,115 2,398,408 Parks, Recreation and Arts 7,582,555 8,158,741 7,120,641 1,038,100 Economic and Physical Development 294,080 316,906 140,279 176,627
Total Expenditures 58,027,624 64,161,800 55,210,620 8,774,553 Excess of Revenues over Expenditures 2,088,759 (3,284,410) 11,345,600 14,630,010
OTHER FINANCING SOURCES (USES) Proceeds from Asset Disposals 25,000 25,000 460,045 435,045 Transfers In 2,646,901 2,646,393 2,599,627 (46,766) Transfers Out (5,651,010) (10,784,691) (10, 547,691) 237,000
Total Othe1· Financing Sources (Uses) (2,979,109) (8,i 13,298) (7,488,019) 625,279 Net Change in Fund Balance (890,350) (11,397,708) 3,857.581 15,255,289
Fund Balance · Beginning 27,494,417 27,494,417 27,494.417 Fund Balance · Ending $ 26,604,067 $ 16,096,709 $ 31,351,998 $ 15,255,289
The notes to the financial statements are an integral part of this statement.
-40-

City of Orem Redevelopment Agency - Special Revenue Fund
Schedule of Revenues, Expenditures and Changes in Fund Balances - Budget and Actual For The Year Ended June 30, 2020
Budgeted Amounts Actual Variance with Original Final Amounts Final Budget
REVENUES Proper ty Taxes s $ 1,223,6 1 I $ 1,193.526 $ (30,085)
Property Taxes - Tax Increment 2,410,000 1.573, 778 1,573,778
lnvestment. Eai-nings 130,000 129,330 (670)
Total Revenues 2,410,000 2,927,389 2,896,634 (30, 755)
EXPENDITURES Current:
Redevelopment 1.667,664 990,782 913,706 77,076
Capital Outlay 6,722.816 388.038 6,334.778
Total Expenditures 1,667,664 7.713.598 1,301.744 6,411,854
Excess (Deficiency) of Revenues over (under) Expendit\ll'eS 742,336 (4,786,209) 1,594,890 6,381,099
OTHER FINANCING SOURCES (USES)
Transfers In Tl'ansfers Out (742,336) (742,336) (740,831) 1,505
Total Other Financing Sow·ces (Uses) (742,336) (742,336) (740,831) 1,505
Net Change in Fund Balance (5.528,545) 854.059 6,382,604
Fund Balance · Beginning 5,840,229 5 ,840,229 5,840,229
Fund Balance · Ending $ 5,840,229 $ 311 ,684 $ 6,694,288 $ 6,382,604
The notes to the financial statements are an integral part of this statement
-41-

City of Orem Statement of Net Position
Proprietary Funds June 30, 2020
Business·type Activitleo • Enterpriae Funds
Water Water Water Water '.Recl11,nation Reclnmation Storm Water Storm Water Fund Fund Fund Fund Fund Fu nd
Current Year PT.ior; YeAr Current. Year PdorYear Cw:rentYear Prior Year ASSETS
Current Asset.,.
Ca•h und Cash E:quivalenu, 30,Sl8, 763 s 28,6H9·,374 s 17.~86.355 Accounta Receivohle CNe.t of A]lowi:t.ni;ie fot
s 13,048,909 s 8,836,490 $ 6,541,697
Do11btful Account.,! 2,488,379 2,210.167 l.327.4Vi 1.297,816 484,138 •ISB,531 lnventoriies 'Prcn!lld, Re•lri¢ted Cash & Cash ~;q~1valents:
Debt Service l,681.258 1,704.76) 1176~000 416,iiOO Capital trup1·oycment.s 289,880 250.058 614,79.4 588,240 153, 132 145,29]
ToU!I Cum,nt Asset• 34,128,280 27,110,1,860 l~.903,566 15,350.995 8,973.760 7,178,f,]9 Nonaurrent. As.~et.~=
C&p,tal A8seu-
Land 570,209 670,209 3,278,720 8,278,720 Bllildings ond Systems 903,086 903,086 3,097,885 3,097,885 679.293 679,293 hnprovements other than Bl1ild1ngli 9,26~.91G 9,262,91G 2,028,934 2,028,934 I 15,667 116,667 Mnchmet'Y and Equipment 3,278,rl85 3. 134,180 6,818,077 6,5011.753 215701729 2,479.978 r nfrnstruct.urei 63,651,782 fiR,476,549 48,4$4,57~ 16,724,780 19,453.~99 18.805, 721 ConatruCI ion in Probrress 753,294 2,006,870 1.232,152 697,608 4 lfi,232 360,000 lnutni;ible!i 997,276 997,276 195,900 99,200 2 1,514 21,5]<1
Less .i\ccumulatM Dc,prcciotion (33,228,924) (30,8lH.904J (33,94<1,279) (32,159,710) (9,378,388) (11,7$0.164\ Total C11pitsl As$el~ (Net of A<Clum~ated
Depreciation) 45,617,915 43,945.9?3 28,478,452 27,567,659 17,156,066 17,000,729 Total Nom:urrent Aueu1 45,617,915 ~3,945,973 28.478.452 27,567,659 17,156,066 17,000,729
Tots!Ass,ett, 80,346, L95 71.760,333 ,18,882,018 42,918,654 26,129,826 24,179,2~8
DEFERR ED OUTFLOWS OF RESOURCES
Oefem)<! Loss on Debt lwfuruhngs 589,·3116 683,008 138,152 165.554 Pensions 370,993 866.320 287.2511 601,894 io4.276 347,656
Total DeferrE>d Ou1.nowF. of Resources 960,429 1,5-19,328 287,258 60 1,894 342,428 013,210
Total Asi.-.l, & Deferred Out.flows of Rcsoutce• s 81,306,62-1 s 73,299,661 48,669,276 $ 1131520,548' $ 26,472.~54 s 24,692,458
LIABILITIES
Current Lia.blliues-
Accounu Pa,yable j ].000 150 ~ 907,774 s 40<1,722 $ 501,901 s 7•1,623 $ 41.065 CuatomQ.r Depoait-s 106,996 l 12,508 Ar..crMd Lia.bi btit::s 110,722 125,871 JOJ ,8:l9 78.5~3 46,377 36,008 Ae¢rued Vacation Le.a·ve 98,912 102.490 121,~37 113.188 6M78 ll2,936 Claims and Judgments
Unearned RevenuP l 16.~27 103.8<11! Acaued lntere•t P•yable IH./!fi7 162,889 25,545 29,570 Capitol Lesses Payable · Current Pottlon
Bunda P-a)'able · CW"rent. PonJ:on 1.148,969 J ,J45,S06 594,000 594,000 415.942 -115.GQG 'fotaJ Current Liabiliti~ 2 ,724,062 2,650,6f5 l,221,898 1,287,632 630,565 586,185
Noncurrent LiabWtie11:
Accrued Vacation Leave 5,207 .5.894 Clainls and Judgment•
6,3116 5,957 S,582 3,313
C11p1t11l Lea.i.f!s Pa)•able - lJOng•Lqrm PortJo:n.
Borlda Paytt.ble - Long·term Po11.ion 9.S89;t52 10,988,42 1 6.M3,000 7,137,000 2,206,703 2,621.646 Net Pens1ot1 Liability 483,857 l.219,879 JH,048 8-17,537 266,429 489.542
Total Noncurrent L,iabil1l,e• 10.:128.5 16 12,213.694 6,924.034 7,990,494 2,475,708 3, J M,501 Total l,1oblllties 1a,052,a18 H.86-1.869 8,14.5,932 9,27~.126 3,108,273 3,699,686
DEFERRED INFLOWS OF RESOURCES
Pff'tu.ions 267,344 81.187 207,003 56,371 147,205 32,660 Toto] Defern,d lntlow• oiR880u1-.•• 267,3-14 Ill, 137 207,003 56,3il 147,205 8~.560
NET POSITION
Net Investment. m Capital A.9seUI 35,218.930 32,<195,256 21.3'11,452 !9,836,660 til,672,67!:! 14. 129,03 l Rest ricted for Debt~l'1'lc,, 1,68l .2S8 1,704,7&1 476,000 416.500 Restricted for CE11)ita! lm.proveinehts 289,880 250,068 61'1,79•1 588.240 153,13i 145,291 UnresU'iOted 30.796,634 2a.904,o8o 17,88-1,095 l a.34•1.66 I 8,393,071 6.685.ll90
'l'ol•I Net Pooihon 67,986,702 58.36•1, 155 40,316.34] 34, 186,05] 28,2 18,776 20,960,212
Total Llabili\;les, Defo,r,d I nllo\Ys of Resourc,;.,,, & Net Position ;5 81.306,624 s 73,299.661 $ 48,669.276 s 43,520,548 0 26 472,254 $ 211,692/158
Tb«! nQtPrc to 1.he financial stat.ement.s art'! an mt.egrnl pan of this st.a.te.ment.
-42-

GovernmentaJ Otb,er Other Activitiee
Enterprise Ente.rpri.ee Internal Funds Pu.rub To<af Toca! Service Funds:
Current Year PnorYear Current Year Prior Year Current Year
$ 4,082,003 3,722.121 s 60,222,6 II s 46,!»55.101 s -1,768.576
543,037 557,075 -11 792,971 •.fl53,H 9
341,494
ao, us
2,157.258 2,l~ l ,261 1,057.806 983,589
<1,625,040 .J,279. 196 68,230.646 5 4,6 13,070 5,140,185
39,822 39.822 3.888.751 S,888,751 ~. 12Fi,955 1, 125,955 8.806,219 8.806,219 150,000 t.911,903 1,911,903 13,319,420 13,319,420
1621207 127,613 l~.82~,498 12,250,424 4~7,026 ~.902·.95 l !2, 5L7l096 18'1.102,606 126.524,'1<16
a ,599 2,404.277 3,054,478 5 1,229 1.214,690 l ,ll 7,990
{6,245,113) (6,031.2~5) (82,796,73•1) (77,756,073) (322,424)
2 ,901,294 l!.690,991 Hrna,121 91,205,355 315.831 2,901,294 2,690,994 94,153,727 9 1,205,355 3!5,831
7,526.334 6,970,190 162,384,873 145,818,420 5,456,016
727,588 848,562 101,951 192,076 96-1,478 !l,007,946 H9,032 l.01,951 192.076 l.692,066 2,666,508 119,032
s 7,628,285 $ 7,162,266 $ 164,076,439 s 148.674,933 5.870.048
3-11,38~ 1 335.585 $ 1,820,879 $ 1,786,325 s 54,340 !06,995 112j5oa
72,191 107,597 851,129 348,019 103.475 42,858 34,168 331.215 312, 782 152.239
372,592 87,696 ,J46,9•13 204.128 460,786
l 67,it02 182,o159
23,194 -2, 168,911 2.l.M,91 1
5~4. l.29 624,293 5,120,654 5,3,n 785 705.840
J!.265 1,799 17,430 .16,463 8,012
696,728 30,130
18,688,155 20,7t17,0G'1 Ja2,965 270,485 1,257,893 2,827,423 546,611 135,220 112,26• 19.863,•178 2a.,;9o.9sa 1,281.381 679,349 l ,096,557 24,984, 132 28.¼l88, i38 1,987,221
78,468 17,990 G95,020 188,058 801,963 73,468 17,990 695,020 188.058 301.963
2,901,294 2,690,994 74, JSiJ,249 69,J:H .941 262,507 2.167.258 2,121,261 1,057,806 983,589
3,974,174 3,356,725 GJ,047,974 47,2~ 1,346 8,323.357 6,875,468 6,047.719 138,397,287 119,548, 137 3,585,864
$ 7, 628,265 s 7 ,162,266 $ 161),076,439 148,674.933 s 5,875,0118
-43-

City of Orem Statement of Revenues, Expenses, and Changes in Net Position
Proprietary Funds For Tb.e Year Ended June 30, 2020
Buaineaa· type Activities · Enterprise Fu.ode
Water Water
Water Water Reclamation Reclamation Storm Water Fund Fund Fund Fund Fund
Current Year Prior Year Cu.neut Year Prior Year Current Year
OPERATING REVENUES
Charges for Sel'Vlccs $ 18.138,800 s 16.599,238 s 12.635.219 s 10,742,759 s 5,001,523
Other Revenues 2,682,617 2,334,858 435,565 776,378 49,401
Tota I Operating- Reven uea 20.821.4 I 7 18,934,096 13,070,784 ll ,519,137 5,050.924
OPERATING EXPENSES Personnt!I Services 2,446.818 2,536,949 2,255,001 2.203.780 1.0-19,671
Supplies and Maintenance 729,684 807,759 671,779 708,953 238,990
Administrative Fee l.,452.347 1.330.443 891.001 799,876 8811,669
Utilities 622,432 645.310 615,903 737,286 7.953
Contract Services 3.65'1.139 3,602,523 729.261 665, 190 330.961
EqU1pment Lease and Rentals 48,638 26,062 2 335 2.028 7,675
I.nsurance 178,740 158.740 132,580 117 580 56,180
Charges in Lieu of Property Ta.x 7 1,787 71.787 52,665 52,665 29,316
Depreciation E,cpensc ~.598,260 2, 150,650 t.83 l.040 1,878,848 815,661
Miscellaneous 164.805 145.765 162,2 19 155.527 83,395
Total Operating Expenses 11 967,640 11,675,988 7,343,784 7,322,033 3,0a3,37t Operating Income (Loss) 8,853,777 7,258,108 5,727,000 4.197, 104 2.017.553
NONOPERATING REVENUES AND EXPENSES
ln'"estment Earnings 542,809 593.920 290,071 270,382 130,790 Gain (Lo~R) on Sale of Capital Asaets (17,628) 5,346 (7.982) 1,769 100
Impact Fee Expenditures (767.866) (l,S60.o79) (196,888) (195,051) (15,597)
Interest Expense (303. 706) (325,379) (70,805)
Total Nonoperaring Revenues & Expenses (546,390) (l.086,192) 85.201 77,100 44,488 Income (Loss) before Transfers
and Contributions 8.307.387 6,171,916 5,812,201 4,274.204 2,062.0,11
Contnbutious · Impact Fees & Developers 2, 125,400 2,437,797 540,985 1.522. 17 I 513.656 Tnt.n8fcrs In 172,705 166,027
Transfers Out (972,945) (973,505) (222.896) (213,453) (317,033) Cbangc in Net PoAition 9,632,6t17 7,802,235 6,130,290 5,582,922 2,258.56,J Total Net Position · Beginning 58,354. 155 50,551.920 34,186,051 28,603.129 20,960,212 Total Net Position · Ending $ 67,986,702 s 58,354.155 s 40,316,341 s 34,186,051 s 23.218,776
The note~ to the -finsnciaJ statements are an integn1l part of this ,itotement
-44-

Govern.mental Other Other Activities
Storm Water Enterprise Enterprise Internal Fund Funds Funds Total Total Service Funds
Prior Year Current Year Prior Year Current Year Prior Year Current Year
$ 4,742,879 $ 5,697,036 $ 6,378,270 $ 41.472,578 $ 38.463.146 $ 5,604,778 32,910 61.408 290,910 3, 228,991 3,435,086 10,244
4,775,819 5,758,444 6,669,180 44,701.569 -H,898,232 6,615,022
913,029 1,021.331 1,51:!,637 6,772,821 7,166,395 2,226,590 233,831 394,538 372,248 2,034,991 2,122,786 2.240,278 335.342 326.09<1 324,396 3,054. 111 2.790,057
6,216 223.789 431,367 1,470,077 l ,820, 179 338,666 3,724.9:n 8,309,199 8,439.298 7,815,878
2,487 1,230 780 59,878 31.357 48,180 27,000 26,500 393,500 351,000 :m,:316 153.768 153,768
764,195 179.164 172,687 5,454,005 5,266,380 42,771 80, 180 119,952 180,6 13 530,371 511,985
2,751,442 6.018.02fi 6,280,322 28,362,820 28,029.785 4,509,639 2,024,377 (259.581) 388,858 16,338.749 18,868,447 l , 105,383
l •l0,308 73,€i7o 84,048 1,037,245 1,088,658 49 (25_461) 7,115 16,333
(6,252) (980,3fil) (1,661,382} (79,595) (374,510) (4(),1,974) (1,383) 54,4-61 73.624 84,048 (343,077} (870,583) ]4,960
2,078,838 (185.957) 472,906 15,995,672 12,997,864 1, l20,333
236,733 3,179,941 4,196,701 1,526,000 1.180,000 1,697.705 1,346,027
(293,994} (5 11,294) (502.350> (2,024,168) (1 ,983,302) (72,819) 2,021.577 827:749 1.150,556 l8,849, f60 16,657,290 1,047.514
18,938,635 6,047,719 4.8!li. 163 119,548,137 102,990,847 2,538,350 $ 20,960.212 $ 6,875,468 $ 6,047,719 $ )38,397,287 $ l19,548, 137 $ 3,585,864
-45-

City of Orem Statement of Cash Flows
Proprietary Funds For The Year Ended June 30, 2020
Business·type Activities · Enterprise Funds
Water Water Water Water Reclamation Reclamation Fund Fund Fund Fund
Current '\'ear P rior Year Current Year Prior Year CASH FLOWS FROM OPERATING ACTIVITIES:
.Receipts from Customers and Users s 20,605,769 $ 19,531.116 $ 13,040,7 13 $ 11,280,349 Receipts from Interfund Services Provided Payments to Suppliers (6,383,357) (6,997, 154) (2, 463,92 L) (3,002,467/ Payments for Personnel (2,520,190) (2,445,654) (2,230,748) (2,223, 106> Payments for lnterf'und Services lJsed (1,452,347) (1,330,443) (891, 00l) (799,87G)
Net Cash Provided <Used) by Operating Activities 11,249,895 9,757,866 7,455,043 5,254,901
CASH FLOWS FROM NON CAPITAL FINANCING AOTMT.IES Transfers f n 172,705 166,027 Transfers Out (972,945) (973,505) (222,896) (213,458)
Net Cash Provided \Used) by Noncapital Activat.iea (800,240) (807,478) (222,896) (213,453)
CASH FLOWS FlWM CAPITAL & RELATED FINANCING ACTMTIES Acquisition of Capital Assets <.:l.1,19,071) (4,870, 143) {2, 559.775) ( 1,378,936) Proceeds from Sales of Capital Assets 19,756 70,018 19,520 143,093 Receipts from Impact Fees Collected 966,895 1,610, 1!'17 331.425 629,291 Payments to Developers - lmpact Fees (767,866) (1,360,079) (196,888) ( 195,051) Principal paid on Outstanding Debt (1, 056.090) (969.38()) (594,000) (594,000) Interest paid on Outstandil:lg Debt (310,380) (331.261)
Net Cash Provided <usedl by Capital a11d Related Finai1cing Activlties (4,296,756) (5,350, 7 I 3) (2,999,718) (1,395,603)
OASH FLOW FROM INVESTING ACTMTIES Investment Earnings 542,809 593,920 290,07 l 270,38.2
Net Cash Provided (lJsedJ by Investing Activities 54-2,809 598.920 290,071 270,382 N~t Increase (Decrease) in Cash and Casn Equivalents 6,695,708 4 , 193,594 4,522,500 3,916,227 Cash and Cash Equwalents - Beginning of Year 25,594,193 21 ,400,599 14,053,649 IQ, 137,422 Cash aud Cash Equivalents End of Year 32,289,901 $ 25,594,193 $ 18, 576. 149 $ l4,053,649
Reconciliation of Operating Income (Loss) to Net Cash
Provided CUsedl by Operating Activities; Operating Income CLoss) s 8,853,i?i $ Adjustments to Reconcile Operating Income (Loss) to Net Cash
7.258, 108 s 6,727,000 $ ,U97, 104
Provided (Usedl by Operatin!l Activit-ies: Depreciation Expense 2,:398,250 s 2,450,650 $ 1,831,040 $ l ,878,848 (Increase) Decrease in Receivables (228,212) 572,990 (30,071) (238,788) CTncrease) Decrease in Tnvento1·y (Increase) Decrease in Pension Assets 495,327 (177,076) 314,636 (19,177) Increase (Decrease) in Accounts Payable 92,3i6 (648,355) (97, 179) (502,938) lnct•ease (Decrease) in Customer Deposit~ (5,508) 9, 147 I ncl'ease (Decrease) in Accrued Liabilities ( ii'>.149) 42,389 23,296 (2,242) Increase (Decrease) in Unearned Revenue 12,584 24,030 lncrease (Decrease) in Accrued Vacati011 Le,ive (3,735) (2, 104) 8,578 5 ,288 lncrease (Decrease) in Pension Liabilitie.s (549,815) 228,086 (322,257) (3,19~) lncrease (Decrease) in Claims and J·udgments
'l'otaJ Adju~tments 2,396,118 2 ,,199,757 1,728,0 ,13 1,057,797 Net Cash Provided (Used) t)y Operating Activi.ties 11,249,895 $ 9,757,865 $ 7,455,043 $ 5,254,901
Noncash Investing, Capital, and Financing Activities: Contributiona of Capital Asset.. from Developets $ 1. 158,505 $ 827,660 s 209.560 s 1!92,880
The notes to the financial stat.emen ts a.te an integral part of this st.atem!i'nl
A 6-
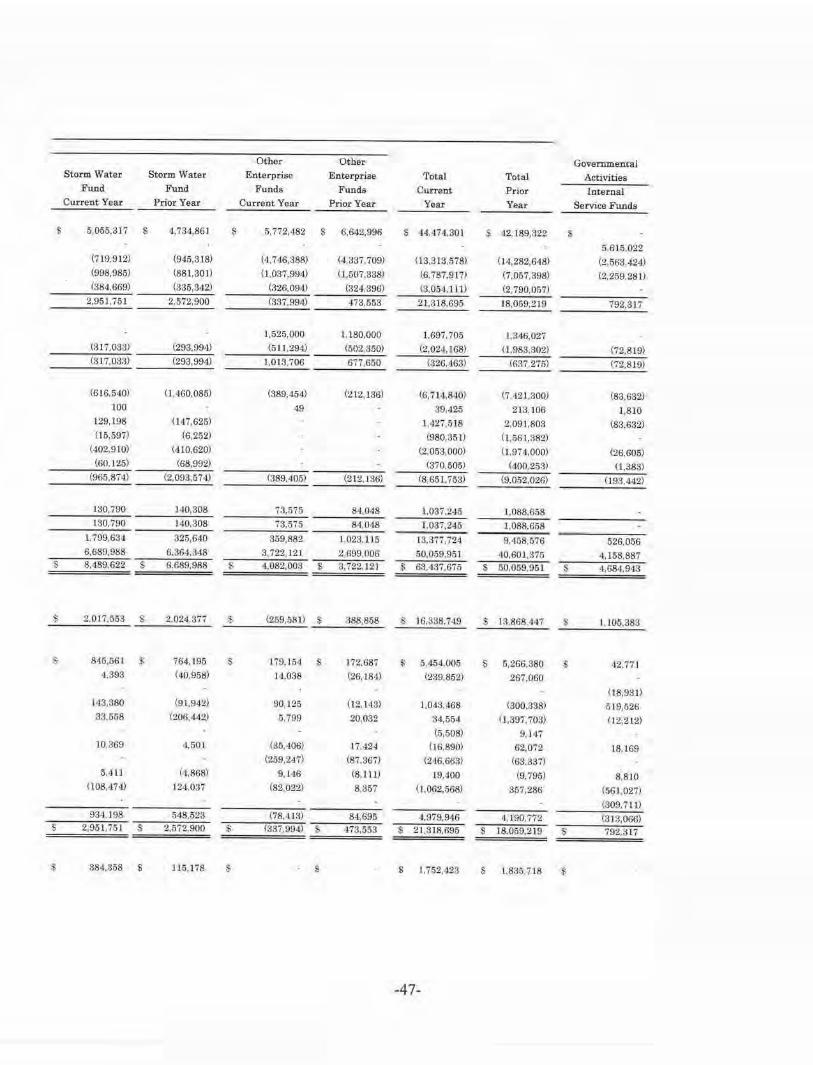
Other Other Govermnenral Storm Water Storm Water Enterprise Enterprise Total Total Acti,>;ties
Fund Fund Funds Funds Current Prior Internal Current Year Prior Year Current Year Prior Year Year Year Service Funds
$ 5,055,317 s 4,734,861 $ 5,772,482 $ 6,642,996 s 114,474,301 s 42. 189,322 $
5,615,022 (719,912) (945,318) (4,746,388). (4,337,709) 03,3 13,578) (14,282,648) (2,563,4.24) (998,985) (881,301) tl.037,994) ( 1.507 ,838) (6,787,917) (7,057,398) (2,259,28 I) (384,669) (835,842) (326,09<0 (324,896) (3,054.111) (2,790,057)
2,951,751 2,572,900 (337,994) 473,553 21,318,695 18,059,219 792,317
1,525,000 1,180,000 1,697,705 l ,346,027 (317,083) (293,994) (511,294) (502,350) (2,024,168) (1,983,302) (72,8 19) (817,033) (293,994) 1,013,706 677,650 (326.463) (637,275) (72,819)
(616,540) (l,460,085) (389,454) (2 12,136) (6,714,840) (7,42 I ,300) (83,632) 100 -19 39,425 213,106 1,8 10
129,198 (147,625) 1,427,518 2,091,803 (83,632) (16,597) (6,252) (980,351) (1,561,382)
(402.910) (410,620) (2,053,000) (1,971,000) (26,605) (60,125) (68,992) (370,505) (400,253) (1,383)
(965,874) (2,093,574) (389,405) (212,136) (8,651,753) {9,052,026) (193,442)
130.790 ]40,308 73,575 84,048 1,037.245 1,088,658 130,790 140,308 73,575 84,048 1.037,245 1,088,658
1,799,634 325,640 359,882 1,023, JJ.5 13,377,724 9,458,576 526,056 6,689,988 6.364,848 3,722,121 2,699,006 50,059,951 40,601,375 4,158,887
$ 8,489,622 $ 6,689,988 $ 4.,082,003 $ 3,722,121 $ 63,437,675 s 5(),059,951 $ 4,684.943
s 2,0 17,553 $ 2,024,377 $ (259,581) s 388,858 s 16.338,749 $ 13,868,447 s 1,105,38a
s 845,561 $ 764,195 s 179,164 $ 172,687 $ 5,454,005 $ 5,266,380 $ 12,77 1 4.393 (40,958) 14,038 (2s, 184) (239,852) 267,060
(18,931) 143,380 (91, 942) 90,125 (12, 143) L.043.468 (300,388) {; 19,526 33,558 (206,442) 5,799 20,032 34,554 (1,397,703) (12,212)
(5,508) 9, 147 10,369 4,501 (35,406) 17.424 (16,890) 62,072 18,169
(259,241} (87,367) (246,6(:i$) (63,337) 5,411 (4,868) 9,146 (8.111) 19.'i00 (9,79()) 8,810
(108,474) 124,037 (82,022) 8,357 (1,062,568) 357,286 (5(>1,027)
(309, 71 l) 934.,198 548,523 (78,413) 84,695 4,979,946 4,190,772 (313,066)
s 2,951,751 $ 2,572,900 $ (337,994) s 473,553 $ 21,318,695 $ 18,059,219 s 792,317
$ 384,858 $ 115,178 $ $ $ 1.752,423 $ l,835,718 $
-47-

(This page left blank intentionally)
-48-

NOTES TO THE
FINANCIAL STATEMENTS

City of Orem Notes to the Financial Statements
June 30, 2020
1. Summary of Significant Accounting Policies
A. Reporting Entity
The basic financial statements of the City of Orem (the City) have been prepared in conformity with accounting principles generally accepted in the U nited States of America (GAAP) as applicable to governmental units. The Governmental Accounting Standards Board (GASB) is the accepted standai·d· setting body for establishing accounting and financial reporting principles.
The City of Orem was incorporated in 1919 and covers approximately 18.66 square miles. The City operates under a Council-Manager form of government. As required by GAAP, the City and its component units (entities for which the City is considered to be financially accountable) present this Comprehensive Annual Financial Report (CAFR). The City is considered to be financially accountable for an organization if the City appoints a voting majority of the organization or there is a potential for the organization to provide specific financial benefits to or impose specific financial burdens on the City. The City is a lso considered to be financially accountable for an organization if the organization is fiscally dependent (i.e. , it is unable to adopt its budget, levy taxes, set rates or charges, or issue bonded debt without approval from the City).
The component units discussed below a1·e included as part of the City's reporting entity as blended component units within its gove1·nmental funds.
• The Redevelopment Agency of the City of Orem (RDA) was established to prepare and carry out plans to improve, rehabilitate and redevelop project areas within the City. The RDA is governed by a board of trustees composed of the Mayor and members of the City Council. Although it is a legally separate entity from the City, the RDA is reported as if it were part of the primary government because of the City's ability to impose its will upon tbe operations of the RDA. The RDA is included in these financial statements as the Redevelopment Agency Special Revenue Fund. Separate financial statements are not issued for the RDA.
• The City of Orem Foundation is a nonprofit charitable foundation. The Intel'nal Revenue Service (IRS) gave the City permission to form and operate the trust as an approved section 501(c)3 charitable foundation. This enables donors b1·oader chaTitable donation capabilities since all donations may be fully tax deductible. Although it is a legally separate entity from the City, the City of Orem Foundation is reported as if it were part of the primary government because of the City's ability to impose its will upon its operations, its board of directors is substantively the same as the City's, and all of its services are for the benefit of the City. It is included in these financial statements as the Orem Foundation Trust Special Revenue Fund. Separate financial statements are not issued for t his entity.
-49-

City of Orem Notes to the Financial Statements
June 30, 2020
1. Summary of Significant Accounting Policies (continued)
A. Reporting Entity (continued)
The component unit discussed below is included as part of the City's rep01·ting entity as a blended component unit within its proprietary funds.
• The Special Service Light ing District of the City of Orem (SSLD) was established to purchase, install, and maintain street lights, poles, and fixtures within the City. The SSLD collects fees to pay for the street lighting system and the electricity to opei·ate it. The SSLD is governed by a board of directors composed of the Mayor and members of the City Council. Although a legally separate entity from t he City, the SSLD is reported as if it were part of the primary government because of the City's ability to impose its will upon the operations of the SSLD. The SSLD is included in these financial statements as the Street Lighting Fund. Separate financial statements are not issued for the SSLD.
B. Government·wide and Fund Financial Statements
The government·wide financial statements (i.e., the Statement of Net Position and the Statement of Activities) 1·eport information on all activities of the City and its component units. For the most part, the effect ofinterfund activity has been removed from these statements. Governmental activities, which normally are supported by taxes and intergovernmentab·evenues, are reported separately from business·type activities, which rely to a significant extent on fees and charges for support.
C. Measurement Focus, Basis of Accounting and Financial Statement Presentation
The statement of activities demonstrates the degree to which the direct expenses of a given function or segment is offset by program revenues. Direct expenses are those which are clearly identifiable with a specific function or segment. Program revenues include 1) charges to customers OT applicants who purchase, use or directly benefit from goods, services or privileges provided by a given function or segment and 2) grants and cont1·ibutions that are restricted to meeting the operational or capital requirements of a particulai· function or segment. Taxes and other items not properly included among program revenues a1·e reported instead as general revenues.
Separate financial statements are provided for governmental funds and proprietary funds. Major individual governmental and enterprise funds are reported as separate columns in the fund financial statements. The government-wide financial statements are reported using the economic resources measurement focus and the accrual basis of accounting, as are the proprietary fund financial statements. Revenues arn recorded when earned and expenses are recorded when a liability is incurred, regardless of the timing of related cash flows. Prope1-ty taxes a1·e recognized as revenues in
-50-

City of Orem Notes to the Financial Statements
June 30, 2020
1. Summary of Significant Accounting Policies (continued)
C. Measurement Focus, Basis of Accounting and Financial Statement Presentation (continued)
the year for which they are levied. G1·ants and similar items are recognized as revenue as soon as all eligibility requirements imposed by the provider have been met.
The use of financial resources to acquire capital assets are capitalized as asse ts in the government·wide financial statements, rathe1· than reported as expenditures. Proceeds of long·term debt are recorded as liabilities in the government·wide financial statements, rather than an "other financing source". Amounts paid to reduce long·term debt of the City are reported as a reduction of the related liability, rather than an expense in the governmentwide financial statements.
Governmental fund financial statements aTe reported using the current financial resources measurement focus and the modified accrual basis of accounting. Revenues are recognized as soon as they are both measurable and available. Revenues are considered to be available when they are collectible within the current period or soon enough thereafter (within sixty days) to pay liabilities of the current period. Expenditures generally are 1·ecorded when a liability is incuned, as under accrual accotmting. Howeve1·, debt·service expenditures, as well as expenditures related to compensated absences and claims and judgments, are recorded only when payment is due.
Sales and use taxes, franchise taxes, and earned but unreimbursed state, federal, and other grants associated with the cunent fiscal period are all considered to be susceptible to accrual and therefore have been recognized as revenues of the current fiscal period. Property taxes are measm·able as of the date levied (assessed) and are recognized as revenues when they become av ailable. Available means when due, or past due, and received within the current period 01· collected soon enough thereafter to be used to pay liabilities of the current period. All other revenues are considered to be measm·able and available only when the City receives cash.
The City Teports the following major governmental funds:
• The General Fund is the government's primary operating fund . It accounts for all financial resources of the general government, except fo1· those 1·equired to be accounted for in another fund.
• The Debt Service Fund is used to account for all general obligation debt of the City of Orem. Operating tran sfers are made from the General Fund to service the debt payments made by this fund. The source of fund revenue for retiring the general obligation debt is principally the power of the City to levy general p1·operty tax; however, certain debt is serviced by sales tax revenues .
-51-

City of Orem Notes to the Financial Statements
June 30, 2020
1. Summary of Significant Accounting Policies (continued)
C. Measurement Focus, Basis of Accounting and Financial Statement Presentation (continued)
• The Capital Projects Fund is used to account fo1· the acquisition or construction of major capital facilities and equipment of the City of Orem (other than those financed by proprietary funds) as well as the use of1·esources for the improvement, rehabilitation, or construction of roads (including sidewalks and intersections) and paTks.
• The 2019 G.O. Bonds Capital Projects Fund is used to account for the expenditure of general obligation bond funds for the construGtion of two new city facilities (Libra1·y Hall and Fitness Center).
• The Redevelopment Agency Special Revenue Fund is used improve, rehabilitate and Tedevelop various project areas within the City.
The City rnports the following major proprietary funds:
• The Water Fund accounts for the activities of the City's water prnduction, treatment, and distribution operations.
• The Water Reclamation Fund accounts for the City's sewer collection, treatment, and maintenance operations.
• The Storm Water Fund accounts for the operation and maintenance of the City's storm water system.
The City reports the following internal service funds:
• The Self-insurance Fund accounts for the insurance activities of the various funds th roughout the City.
• The Fleet Maintenance Fund accounts for the costs of operating and maintaining vehicles and equipment owned by the City.
• The Purchasing/Warehousing Fund accounts for the centralized purchasing and warehousing operations of the City.
• The Information Technology Fund accounts for the technological needs of the City primarily related to computers, networks, servers, software programs, and phones.
The effect of inte.rfund activity has, generally, been eliminated from the government·wide financial statements. Exceptions to this are payments to the General Fund by various enterprise funds for providing administrative and billing services. Elimination of these charges would distort the direct costs and program revenues reported for the various functions concerned.
Proprietary funds distinguish ope1·ating revenues and expenses from non· operating items. Operating Tevenues and expenses generally result from providing services and producing and delivering goods in connection with a proprietary fund1s principal ongoing ope1·ations. The principal operating revenues of all enterprise funds a re chru.·ges to customers for sales and services.
-52-

City of Orem Notes to the Financial Statements
June 30, 2020
I. Summary of Significant Accounting Policies (continued)
C. Measurement Focus, Basis of Accounting and Financial Statement Presentation (continued)
Operating expenses fo1· enterprise funds include the cost of sales and services, administrative expenses, and depreciation on capital assets . All revenues and expenses not meeting this definition are reported as non-operating revenues and expenses.
When both 1·estricted and unrestricted resources are available for use, it is the City's policy to use restricted resources first , then unresti·icted 1·esources as they are needed.
D. Assets, Liabilities, Deferred Outflows/Inflows of Resources, and Net Position/Fund Balance
1. Cash and Cash Equivalents
Cash includes cash on hand, demand deposits with banks and other financial institutions, and deposits in other types of accounts or cash management pools that have the general characteristics of demand deposit accounts. City policy allows for the investment of funds in the following types of investments (in compliance with the State of Utah's Money Management Act):
• Time certificates of deposit witb federally insured depositories.
• Investment in the Utah Public Treasurer's Investment Fund (PTIF).
• Open·end managed money maI'ket mutual funds. • Qualified repurchase agreements with qualified
depositories, ceTtified dealers, or ce1-ti.fied depositories . • Other investments allowed by the State of Utah's Money
Management Act.
Investments aTe reported at fair value in accordance with GASE Statement No. 72, Fair Value Measurement and Application. The Utah Public Treasurer's Investment Fund (PTIF), Zions Bank Institutional Liquidity Management Fund (ILM), and Moreton Asset Management Fund all operate in accordance with state laws and regulations.
Cash equivalents are defined as short·term, highly liquid investments that are both readily convertible to known amounts of cash and so near maturity that they present insignificant risk of changes in value because of changes in interest Tates. Investments with matm·ities of three months or less when purchased meet this definition.
-53-
City of Orem Notes to the Financial Statements
June 301 2020
1. Summary of Significant Accounting Policies (continued)
D. Assets, Liabilities, Deferred Outflows/Inflows of Resources, and Net Position/Fund Balance (continued)
2. Receivables and Pa vahles
Activities between funds that are representative of lending/borrowing anangements outstanding at the end of the fiscal year are referred to as 11due to'' or "due from" other funds.
In the Water, Water Reclamation, Storm Water, Solid Waste, and Street Lighting funds, the City records utility revenues billed to customers on a monthly basis. Unbilled service accounts receivable at fiscal year-end have been accrued as revenues and receivables.
3. Inventories and Prepaid Items
Inventories of materials and supplies in the Purchasing/Warehousing internal service fund consist principally of materials used to repair the transmission, distribution, collection and treatment systems of the City's proprietary type services. These inventories are valued at cost and accounted for on a first·in, first·out basis (FIFO). The inventory of materials and supplies are charged to both enterprise and governmental funds when they are used/consumed by the specific fund.
Certain payments to vendors 1·eflect costs applicable to future accounting peTiods and are reco1·ded as prepaid items, using the consumption method, in both government-wide and fund financial statements,
4. Restricted Assets
Restricted assets are primarily comprised of cash and receivables restricted for futu1·e payments of principal and interest on debt service, unexpended portions of bonds issued for capital construction purposes, and unexpended taxes and/or appropriations collected for very specific uses under state law.
5. Net Pension Assets
The Net Pension Assets of the City were determined by Utah Retirement Systems (URS) actuarial valuations and roll-forwards using generally accepted actuarial procedures and were based upon actual historical contributions and census data provided to URS. Net Pension Assets rep1·esent the net difference between assets of the plan and the actuarially determined liabilities.
-54-
City of Orem Notes to the Financial Statements
June 30, 2020
1. Summary of Significant Accounting Policies (continued)
D. Assets, Liabilities, Deferred Outflows/Inflows of Resources, and Net Position/Fund Balance (continued)
6. Capital Assets
The City's capital assets, which includes property, plant, equipment, and infrastructure assets (i.e. roads, bridges, sidewalks, and similai· items), are reported in the applicable governmental or business·type activities columns in the gove1·nment·wide financial statements.
The City defines capital assets as assets with an individual cost of more than $5,000 and an estimated useful life in excess of three years. Such assets are recorded at historical cost or estimated historical cost if purchased or constructed. Donated capital assets are recorded at acquisition value at the date of donation. The costs of no1·mal maintenance and repairs that do not a dd to the value of the asset or materially extend assets lives are not capitalized.
P1·operty, plant, and equipment are depreciated using the straight-line method over the following estimated useful lives:
Assets
Infras tructure
Buildings and Systems
Machinery, Equipment, & VehicJes
Furn;iture and Equipment.
Improvements other than Buildings
7 Deferred Outflows of Resow·ces
Yea.ts
33 - 50
25 · 3i/3
5 • 20
5 · 20
5 · 10
These deferred amounts represent a consumption of net position that applies to a future period and so will not be recognized as an outflow of resources (expense/expenditure) until that time.
8. Compensated Absences
For governmental funds, vested or accumulated vacation leave and compensatory time·off are not expected to be liquidated with expendable available financial resources and are t hus excluded as a liability in each fund's balance sheet and as an expenditure in the Statement of Revenues, Expenditures, and Changes in Fund Balance. These balances would only be reported in a governmental fund's financial statements as a liability and expenditlu-e if they have matured (are due).
-55-

City of Orem Notes to the Financial Statements
June 30, 2020
1. Summary of Significant Accounting Policies (continued)
D. Assets, Liabilities, Deferred Outflows/Inflows of Resources, and Net Position/Fund Balance (continued)
8. Compensated Absences (continued)
For proprietru·y funds, vested or accumulated vacation leave and compensatory time·off is recorded as an expense and a liability of those funds as the benefits accrue to the employees.
The government-wide financial statements reflect the entire amount of vested and/or accumulated vacation leave and compensatory time-off for all governmental and proprietary funds and are thus recorded as a liability in the Statement of Net Position and as an expense in the Statement of Activities.
Employees are limited to two years of accumulated vacation leave. Employees eru·n twelve days of sick leave per yeaT. While sick leave may be accumulated without limitation, no benefits accrue to the employees. Therefore, no liability exists and the costs of accumulated sick leave are charged to expenditures only when used.
9. Pensions
For purposes of measuring the net pension liability, deferred outflows of resources and deferred inflows of resources related to pensions, and pension expense, information about the :fiduciary net position of the Utah Retirement Systems (URS) Pension Plan and additions to/deductions from URS's fiduciary net position have been determined on the same basis as they a1·e reported by URS. For this purpose, benefit payments (including refunds of employee contributions) are recognized when due and payable in accordance with the benefit terms. Investments are reported at fair value.
10.Long·term Obhgations
In the government-wide and proprietary fund financial statements, long-term debt, net pension liabilities, and other long-term obligations are reported as liabilities in the applicable governmental activities, business·type activities, or proprietary fund type Statement of Net Position. Bond p1·emiums, discounts, and losses on bond refundings are deferred and amortized over the life of the applicable debt. In the fund financial statements, governmental fund types recognize bond premiums and discounts during the current period. The face amount of debt issued is reported as other financing sou1·ces while discounts on debt issuances ar-e reported as other financing uses. Bond issuance costs, whether or not withheld from the actual debt prnceeds received, are reported as debt service expenditures.
-56-

City of Orem Notes to the Financial Statements
June 30, 2020
1. Summary of Significant Accounting Policies (continued)
D. Assets, Liabilities, Deferred Outflows/Inflows of Resources, and Net Position/Fund Balance (continued)
11. Deferred Inflows of Resources
These defened amounts represent an acquisition of net position that applies to a future p eriod and so will not be recognized as an inflow of resources (revenue) until t hat time.
12. Fund Balance I Net Position
Fund Balance In the governmental fund financial statements, classifications comprising a hierarchy based primarily on the extent to which the City is bound to honor constraints on the specific purposes for which amounts in these funds can be spent.
Net Position In the government·wide and propi-ietary fund financial statements, classifications are based upon the accessibility of the underlying resouTces. Restricted items, while generally expendable, are legally 1·estricted by outside parties for a specific purpose.
13. Contri'butions from Develope1·s
Contributions from developers in the proprietary fund financial statements arise from outside contributions of capital assets, or from grants or outside contributions of resources restricted to capital acquisition and construction.
E. Estimates and Assumptions
The preparation of financial statements in conformity with generally accepted accounting principles requires management to make estimates and assumptions affecting the reported amounts of assets and liabilities and disclosui-e of contingent assets and liabilities at the date of the financial statements and the r epot'ted amounts of revenues, expenditures and expenses during the reporting period. Actual results could differ from those estimates.
2. Reconciliation of Government·wide and Fund Financial Statements
A. Explanation of certain differences between the Governmental Fund Balance Sheet and the Government-wide Statement of Net Position
The governmental fund balance sheet includes a reconciliation between total governmental fund balances and net position of governmental activities as reported in the government-wide Statement of Net Position. This difference
-57-
City of Orem Notes to the Financial Statements
June 30, 2020
2. Reconciliation of Government-wide and Fund Financial Statements (continued)
A. Explanation of certain differences between the Governmental Fund Balance Sheet and the Government-wide Statement of Net Position (continued)
primarily results from the long·term economic focus of the Statement of Net Position ve1·sus the current financial resources focus of the governmental fund balance sheets.
Capital Related Items When capital assets used in governmental activities are purchased or constructed, the cost of these capital assets are reported as expenditutes in gove1·nmental funds. However, the Statement of Net P osition includes these capital assets among the assets of the City as a whole.
Cost of Capital Assets Accumulated Depreciation
Net adjustment to increase fund balance - total governmental funds to arrive at net position -governmental activities
$ 308,330,553 (140,331,734)
$ 167,998,819
Long·term Liability Transactions Long·te1·m liabilities applicable to th e City's governmental activities are not due and payable in the current period and accordingly are not reported as fund liabilities in the governmental fund financial statements. All liabilities (both cunent and long·term) are reported in the Statement of Net Position.
Long·term liability balances a t June 30, 2020 were as follows:
Long·term Liability Type
General Obligation Bonds Capital Leases
Less: Internal Sel'vioe Funds · Current Portion Sales Tax Revenue Bonds Notes Payable Bond Premiums Deferred Compensated Absences
Less: lnternal Service Funds - CUTrent Portion Net Pension Obligations Net OPEB Obligations Claims and Judgments
Less: Internal Service Funds · Current Portion Net adjustment to reduce fzmd balance -total governmental funds to arrive at net position · governmental activities
-58-
$ 29,620,000 5,513,323
(23,194) 856,000 562,186
3,881,880 2,218,836 (152,239)
7,255,064 157,627
1,069,320 (372,592)
$ 50,586,212

City of Orem Notes to the Financial Statements
June 30, 2020
2. Reconciliation of Government-wide and Fund Financial Statements (continued)
B. Explanation of differences between Governmental Fund Operating Statements and the Statement of Activities
The governmental fund statement of l'evenues, expenditures, and changes in fund balances includes a reconciliation between net changes in fund balance · total governmental funds and changes in net position of governmental activities as reported in the government·wide Statement of Activities. One of these differences is explained here in gre.ate1· detail.
The second element of the reconciliation states that "the issuance of long·term debt provides current financial resources to governmental funds, while the payment of the principal of long·term debt consumes the cunent financial resources of governmental funds. Neither transaction, however, has any effect on net position.''
The details of this difference are as follows:
Principal payments: Genetal Obligation Bonds Sales Tax Revenue Bonds Capital Leases Notes Payable Special Improvement District Bonds
Subtotal Net adjustment to increase net changes in fund balance · total governmental funds to arrive at changes in net position of govez'Dmental activities
3. Stewardship, Compliance and Accountability
A. Budgetary Information
$ 940,000 352,000 435,000 105,961 130,000
1,962,961
$ 1,962,961
Prior to the fu·st regularly scheduled meeting of the City Council in May, the City Manager and appointed Budget Officer, submits to the City Council a proposed operating budget for the fiscal year commencing the following July 1st . The operating budget includes proposed expenditU1·es and the proposed sou1·ces of revenues.
Between May } st and June 22nd, the City Council reviews and adjusts the proposed budget. On or befme June 22nd, a public hearing is held and the budget is legally adopted through passage of an mdinance, unless a property tax increase is proposed. If a property tax increase is proposed, a hearing must be held on or before August 31,~t, which does not conflict with other taxing entities that have proposed a property tax increase. At this time the final balanced budget is adopted.
-59-

City of Orem Notes to the Financial Statements
June 30, 2020
3. Stewardship, Compliance and Accountability (continued)
A. Budgetary Information (continued)
The City Manager, in conjunction with the Budget Officer and the appropriate department head, has the budget authority to transfer budget appropriations within and between any divisions of any budgetary fund. However, the 1'fund level" is the legal level of control and the City Manager must obtain approval from the City Council to increase 1·evenues or expenditures for any fund.
An individual depa1·tment is composed of several divisions. Budget transfers may be made between divisions within a fund as long as t hey ~u-e in the same department. However, they may not transfer from one fund to another fund without City Council approval.
The City Council (administrators of the legal level of contTol\ by resolution, have the authority to transfer budget appropriations between individual budgetary funds. A public heaTing must be held to increase the total appropriations of any one governmental fund type; however, after the original public hearing, operating and capital budgets of proprietary fund types may be increased by resolution without an additional hearing.
Annual budgets for the General Fund, all Special Revenue Funds, Debt Service Funds, and Capital Projects Funds were legally adopted by the City and are prepared on the modified-accrual method of accounting. Although Utah State law requires the initial preparation of budgets for all City funds (both governmental and proprietary), it only requires the reporting of actual versus such budgets for governmental funds.
Tax Revenues Property taxes are collected by the Utah County Treasurer and remitted to the City in two to three installments in December, January, and a final settlement generally in Ma1·ch of the new calendar year. Taxes are levied and are due and payable on November 1st and delinquent after November 30th of each year at which time they become liens if not paid. An accrual of uncollected current and prior year's property taxes beyond those 1·eceived within 60 days after the fiscal year end has not been made, as the amounts a1·e not deemed to be material.
Sales taxes are collected by the Utah State Tax Commission and remitted to the City monthly. An accrual has been made for all taxes received by the State for the period ended June 30 and thus are due and payable to the City.
Franchise taxes are charged to various utility companies doing business within the City including telephone, cable television, gas utility, and electric utility companies. The fees are remitted on a monthly, quarterly, or annual basis. All fees due and payable to the City at June 30 have been accrued.
-60-

City of Orem Notes to the Financial Statements
June 30, 2020
4. Detailed Notes for all Funds
A. Deposits and Investments
The City's deposit and investment activities are governed by the Utah Money Management Act (Utah Code, Title 51, Chapter 7). The State of Utah Money Management Council has t he responsibility to advise the Utah State Treasurer about investment policies, promote measures and rules that will assist in strengthening the banking and credit structure of the State of Utah, and review the rules adopted under the authority of the Utah Money Management Act that relate to the deposit and investment of public funds.
The Money Management Act requires deposits be in a qualified deposito1-y. The Act defines a qualified depository as any financial institution whose deposits ai·e insured by an agency of the federal government and which has been certified by the State Commissioner of Financial Institutions as meeting the requirements of the Act and adhering to the rules of the Utah Money Management Council.
Deposits The City's deposits (including cash on hand) at June 30, 2020, ai·e as follows:
Cash on Hand & On Deposit
Cash on Hand Cash on Deposit · Checking
Cash on Deposit - Payroll
Total Cash on Hand & On Deposit
Custodial Credit Risk
$
$
Fair
Value
77,248
2,020,219
1,044,100
3,141,5(;7
The custodial credit risk for deposits is the risk that in the event of a bank failure, the City's deposits may not be recovered. Deposits in the bank in excess of the insured amount are uninsured and uncollateralized. Deposits are not collateralized nor are they required to be by state statute. The City has no formal policy regarding custodial credit risk for these deposits. As of June 30, 2020, $3,903, 127 of the City's bank balance of $4,265,300 is exposed to custodial credit risk as uninsured and uncollateralized. The carrying amount of the deposits at June 30, 2020, is $3,141,567.
Investments The Money Management Act defines the types of secui·ities authorized as appropriate investments and the conditions for making investment transactions. Investment transactions may be conducted only thrnugh qualified depositories, certified dealers, or directly with issue1·s of investment securities.
The Act authorizes investments in both negotiable and non-negotiable deposits of qualified depositories and permitted negotiable depositories;
-61-

City of Orem Notes to th e Financial Statements
June 30, 2020
4. Detailed Notes for all Funds (continued)
A. Deposits and Investments (continued)
Investments (continued) repurchase and reverse repurchase agreements; commercial paper that is classified as ufirst tier" by two nationally recognized statistical rating organizations; banke1·s' acceptances; obligations of the United States Treasury including bills, notes, and bonds; obligations, other than mortgage derivative p1·oducts, issued by U.S. government sponsored enterprises (U.S. Agencies) such as the Federal Home Loan Bank System, Federal Home Loan Mortgage Corporation (Freddie Mac), and Federal National Mortgage Association (Fannie Mae); bonds, notes, and other evidence of indebtedness of political subdivisions of the State; fixed rate corporate obligations and variable rate secUI·ities rated "A" or higher, or the equivalent of "A:' or higher, by two nationally recognized statistical rating organizations; shares or certificates in a money market mutual fund as defined in the Money Management Act; and the Utah State Public Treasurers' Investment Fund.
Fair Value of Investments
The City measures and records its investments using fair value measurement guidelines established by generally accepted accounting principles. These guidelines recognize a three-tie1·ed fair value hierarchy, as follows:
• Level 1: Quoted prices for identical investments in active markets; • Level 2: Observable inputs other than quoted market prices; and, • Level 3: Unobservable inputs.
At June 30, the City had the following recurring fair value measurements:
Investments by Fair Value Level
Debt Securities:
Utah Public Treasurer's
Investment Fund
Zions Bank Inst. Liquidity
Management Fund
Moreton Asset
Management Fund
Total Debt Securities
Tot,al Investments by Fair Value Level
Total Investments Measured
at Fair Value
$
Fair
Value
122,020,683
10,781,822
12,251,110
145, 053.565
$ 145.053,565
$ 145, 053,5<-i5
-62-
Fair Value Measurements Using
Level 1 Level 2 Level 3
$ $ 122,020,633 $
10,781,822
12,251,110
23,032,932 122,020,633
$ 23,032,932 $ 122,020,633 $

City of Orem Notes to the Financial Statements
June 30, 2020
4. Detailed Notes for all Funds (continued)
A. Deposits and Investments (continued)
Investments (continued) Debt and equity securities classified in Level 1 are valued using prices quoted in active markets for those securities. Debt and equity securities classified in Level 2 are valued using th e following approaches:
• Utah Public Trnasurers' Investment Fund -Application of t he J une 30, 2020, fau.· value factor, as calculated by the Utah State T1·easurer, to t h e City's ending balance in the Fund.
Interest Rate Risk
Interest rate risk is t he r isk that chan ges in interest rates will adversely affect the fair value of an inves,tment.
The City's policy for managing intet·est rate risk is to comply with the State's Money Management Act. Section 51·7-11 of the Act requu.·es that the remaining term to maturity of investmen ts may not exceed the period of availability of the funds to be invested. The Act limits the remaining term to maturity on all investme nts in commercial paper, bankers' acceptances, fixed rate negotiable deposits, and fixed rate corporate obligations to 270·365 days or less. The Act further limits t he remaining term to maturity on all investments in obligations of the U.S. Treasuryi obligations issued by U.S. government sponsored enterprises; and bonds, n otes, and other evidence of indebtedness of polit ical subdivisions of t he State of Utah to five (5) years.In addition, variable l'ate negotiable deposits and variable rate securit ies may not have a remaining term to final maturity exceedin g t h1·ee (3) yeai·s.
The City's investments at June 30, 2020, are presented below:
Investment Type Debt Secui'itie.s:
Utah Public Treasurer's
Fair Value
Less
Than l
Investment Maturities (in yeru.'s)
l - 5 6 - 10
Investment Fund $ 122,020,633 $ 122,020,633 $ $
Zions Bank Inst. Liquidity
Management Fund
Moreton Asset Management Fund
Total Debt Securities
10,781,822 8,255,340 2,526,482
12,251.110 3, 308,295 8,942,815
$ 145,053,565 $ 133,584,268 $ 11,469,297 $ =======
-63-
More Than 10
$
$

City of Orem Notes to the Financial Statements
June 30, 2020
4. Detailed Notes for all Funds (continued)
A. Deposits and Investments (continued)
Investments (continued)
Credit Risk
Credit risk is the risk that an issuer· or other counterparty to an investment will not fulfill its obligations. The City follows the. Money Management Act as prnviously discussed as its policy for reducing exposure to investment credit risk.
The City's debt investments ratings at June 30, 2020, a1·e presented below:
~ua lity Ratini:s Fai1·
Investment 1'J!e Value AAA AA A Unrated Debt Secu,·ities'
Utah Public 1'reasui:er's Investmen t F und $ 122,020.6l!3 $ $ :ji :j; 122,020.633
Zions Bank Inst. Liquidity Management Fund l 0.781,822 1,443 427,484 2,7 17,588 7.635,357
Moreton Asset Management Fund 12,251, 110 413,307 3,260,684 7,220,586 1.356,683
Tc,tnl Debt Secui•ities $ 145,053,565 $ 41,1,75() s 3,688,168 $ 9,938,074 $ 131,0 12,573
Custodial Credit Risk
Custodial credit risk for investments is the risk that, in the event of a failure of the. counterparty, the City will not be able to recover the value of the investment or collateral securities that are in the possession of an outside party:. The City does not have a formal policy for custodial credit r isk.
Most of the City's investments at June 30, 2020, wer e with th e Utah Public Treasurer's Investment Fund (PTIF) and therefore, are not categorized as to custodial credit risk. The investments in the Zions Bank Institutional Liquidity Management Fund (ILM) have custodial credit risk exposure. Of the $10,781,822 invested in the ILM Fund, none of the related secm·ities a re uninsured or unregistered. The investments in the Moreton Asset Management Fund have custodial credit risk exposm·e. Of the $12,251,110 invested in th e Moreton Asset Management Fund, none of the related securities are uninsured or uru·egistered.
Additional information r,egarding the Utah PTIF, Zions Bank ILM Fund, and Moreton Asset Management Fund is available in footnote 4.B. of these notes to the financial statements.
-64-

City of Orem Notes to the Financial Statements
June 30, 2020
4. Det ailed Notes for all Funds (continued)
A. Deposits and Investments (continued)
Investments (continued)
Concentration of Credit Risk
Th(~ City's policy for reducing this risk ofloss is to comply with the Rules of the Money Management Council. Rule 17 of th e Money Management Council limits investments in a single issuer of commercial paper and corpo1·ate obligations to between five percen t (5%) and ten percent (10%) depending upon the total dollru· amount held in the portfolio. The Money Management Council lim itations do not apply to securities issued by the U.S. Government and its agEmcies. Most of the City's investments at June 30, 2020, we1·e with the Utah PTIF and therefore, are not categorized as to concentration of credit risk.
There aTe no amounts invested directly in Zions Bank securities i~ither as corporate notes or as securities within the ILM Fund. There are no amounts invested direct ly in Moreton securities either as corporate notes or as securities within the Moreton Asset Management Fund.
Additional information regarding the Utah PTIF, Zions Bank ILM Fund, and Moreton Asset Management Fund is available in footnote 4.B. of th1:'lse notes to the financial statements.
B. External Investment Pools and Managed Investment Funds
Ex1.;ernal Investment Pools
Public Treasurer's Investment Fund (PTIF)
The City invests in this external investment pool which is administer,ed by the Treasurer of the State of Utah. State agencies, municipalities, counties, and local governments within the state are allowed to invest in the PTIF. The1·e is no required pa1.-ticipation and no minimum balance or minimum/ma..ximum transaction requirements.
Thi~ PTIF is not registered with the SEC as an investment company. The PTIF is authorized and regulated by the Money Management Act, Chapter 51·7, Utah Code Annotated, 1953, as amended. The Act establishes th e Money Management Council which ove1·sees the activities of the State Treasurer and the PTIF. The Act details the investments that are a uthorized, which are high· grade sec1uities, and therefore, there is very little credit risk except in the most unusual and unforeseen circumstances.
D e1posits in the PTIF are not insured or otherwise guaranteed by the State of Utah and participants share proportionally in any realized gains or losses on investments.
-65-

City of Orem Notes to the Financial Statements
June 30, 2020
4. Detailed Notes for all Funds (continued)
B. External Investment Pools and Managed Investment Funds (continued)
External Investment Pools (continued)
Thie PTIF allocates income and issues statements on a monthly basis. The PTIF operates and reports to participants on an amortized cost basis. The participants' balance is their investment deposited in the PTIF plus theiT share of income, gains and losses, net of ::idmioistration fees, which ru·e a llocated to eac:h participant on the ratio of each pa rt icipant's share to the total funds in the, PTIF.
Twice a year, at June 30 and December 31, the investments are valued at fair value to enable part icipants to adjust their investments in this po1ol at fair value. The Bank of New York and the State of Utah separately determine each security's fair value in accordance with GASB 31 (i.e. for almost all pool investments the quoted market price as of June 30, 2020) and then compare th0tse values to come up with an agreed upon fair value of the securities.
As of June 30, 2020, the City had $121,581,325 invested in the PTIF which had a fair value of $122,020,633 for an unrealized gain of $439,308.
Th19 following table sh ows statistical information about this investment pool:
InvestmenL Type Co1-porate Bonds and Notes Money Market Accounts and CeTtificates of Deposit U.S. Gove1·nment Securities
Total
Managed Investment Funds
Investment Petcentage
77.74 % 16.02 %
6.24 % 100.00 %
Zions Bank Institutional Liquidity Management Fund (JLM)
Th•3 City invests in this managed investment fund which is adminiBtered by the Investment Management and Capital Mru·kets Division of Zions Baincorporation. The required minimum balance is $5,000,000. There are no minimum/maximum transaction requirements.
Th•:! ILM is not registered with the SEC as an investment company. The ILM is a registered investment advisor and is certified by the Utalo. Money Management Council. The Utah Money Management Act de1bails the investments that are authorized, which are high·g1.'ade securit,ies, and therefore, there is very litt le credit risk except in the most unusual and unforeseen circumstances.
De1posits in the ILM are not insured or otherwise guaranteed by Zions Bank. Th•3 ILM issues statements on a monthly basis. It operates and reports on an amortized cost basis. The ILM balance i s the City's investment plus income
-66-

City of Orem Notes to the Financial Statements
June 30, 2020
4. De1tailed Notes for all Funds (continued)
B. External Investment Pools and Managed Investment Funds (continued)
Managed Investment Funds (continued)
and gains less losses and administration fees.
As of June 30, 2020, the City had $10,806,379 invested in the ILM which had a fair value of $10,781,822 for an unTealized loss of $24,557.
ThB following table shows statistical information about this fund:
Investment Type Corpotate Bonds and Notes Money Market Accounts and Certificates of Deposit U.S. Gove.mment Securities
Total
Mo:reton Asset Management Fund
Investment Percentage
29.17 %
70.83 %
0.00 % 100.00 %
The City invests in this managed investment fund which is administered by the Moreton Advisors group. The required minimum balance is $5,000,000. There are no minimum/maximum transaction 1·equirements.
The Moreton Asset Management Fund is not 1·egistered with the SEC as an investment company. The Moreton Asset Management Fund is a n3gistered investment advisor and is cert ified by the Utah Money Management Council. The Utah Money Management Act details the investments that are authorized, wh:ich are h:igh·grade secuxities, and therefore, there is very lit tle credit r isk except in the most unusual and unforeseen cfrcumstances.
Deposits in the Moreton Asset Management Fund are not insured or o,thei-wise guaranteed by Moreton. The l\lforeton Asset Management Fund issues statements on a monthly basis. It opei·ates and reports on an amortized cost basiis. The Mornton Asset Management Fund balance is the City's investment plus income and gains less losses and administration fees.
As of June 30, 2020, the City had $12,127,230 invested in the Moreton Asset Management Fund which had a fair value of $12,251,109 for an unrealized gain of $123,879.
The following table shows statistical informat ion about this fund:
Investment Type Corpornte Bonds and Notes Money Market Accounts and Certificates of Deposit U .S. Government Secw-ities
Total
-67-
Investment, Percentage
61.24 %
35-.88 % 2.88 %
100.00 %
City of Orem Notes to the Financial Statements
June 30, 2020
4. Detailed Notes for all Funds (continued)
C. Customer Deposits
Enterprise fund deposits are deposits the City requires from 1·esidential or business customers who are receiving a utility connection but have a b ankruptcy on reco1·d or have had their water turned off (or about to be turned off) for a third time in a twelve month period of time. The deposit is refundable after one year of satisfactory payment history.
D. Loans Receivable · CDBG and EDA Loans
The City uses monies from the Community Development Block Grant (CDBG) program to create housing rehabilitation and business development loans. Additional funds from the Economic Development Agency (EDA) and the Utah Revolving Loan Fund are used to supplemen t the business development loan program. The principal balance of the loans at June 30, 2020, as summarized below, has been shown in the government-wide Statement of Net Position as follows:
E. Receivables
Housing Rehabilitation Loans Business Development Loans
Total
$ 188,829 209,636
$ 398,465
All receivables are expected to be collected within one year except fox $671,804 of notes receivable in the nonmajor funds.
Governmental funds report deferred revenues in connection with receivables for revenues that a1·e not considered to be available to liquidate liabilities of the cunent period. Governmental funds also report uneanied revenues when revenue recognition is delayed in connection with resources that have been received, but not yet earned.
As of June 30, 2020, the various components of defe1Ted and unea.J:·ned revenues reported in the governmental funds we1·e as follows:
Property 1'a1-es Receiva ble
Accounts and Not es Rece ivable
Donations a nd Ot her F unds to be Used for Specific Program;;
G1·an t & Othe r Money Used in Revolving Loan P rogr a ms
Special Ai,ses1:1ments aot ye t Due
Total Oe.ierl'ed & Unearned Revenues for Governmental f unds
-68-
Unavailable Une11J'ned
$ 9,549,220 $ 9,549,220
182,466
:398,465
32,91 7
1,371,883
$ 10,1G3,068 $ 10,924, 103

City of Orem Notes to the Financial Statements
June 30, 2020
4. Detailed Notes for all Funds (continued)
E. Receivables (continued)
Receivables as of June 30, 2020, for the government's individual major funds, as well as nonmaJor funds 1n the aggregate, including the applicable allowances for uncollect ible accounts, are as follows:
Governmental Activities
General:
Property Taxes
Other Taxes
Special Assessments
Intergovernmental
Accounts
Debt Service:
Pl'Operty Taxes
Notell Receivable
Capital Projects:
Accounts
Redevelopment Agency:
Property Taxes
Nonmajor Funds:
Other Ta.xes
lntei·govermnental
Notes Receivable
Subtotal· Governmental Activities
Businesa·type Activities
Water:
Accounts
Water Reclamation:
Accounts
Storm Water:
Accounts
Nomnajor Funds,
Accounts
Subtotal· Business·type Activities
Totals
$
$
Receivables
5,664,424 $
5,0H041
32,917
5,628,460
1,331,964
17,701,806
1,474,796
32,808,822
34,28:3,618
22,182
22,182
2.410,000
2.410.000
794,333
194,451
844,016
1,832,800
56,250,406
:.!,461 ,732
1,339.911
489,115
548,669
4,839,427
61 ,089.833 $
-69-
Allowance ior
Uncollectible~
(611,467}
(611,467)
(32,808,822)
(32,808,822)
(97.109)
(97,109)
(33,517,398)
(23,353)
(12.49,1)
(4,978)
(5,631)
(46.456)
$
Net Total
Receivables
5,664,424
5,044,041
32,917
5,628.460
720,497
17,090,339
1,474,796
l.474, 796
22,182
22,182
2,410,000
2.410,000
794,333
194.451
746,907
1,735,691
22,733,008
2.438.379
1,327,-117
484, t37
543,038
4,792.971
(33,563,854) $ 27,525,979 =======
City of Orem Notes to the Financial Statements
June 30, 2020
4. Detailed Notes for all Funds (continued)
F. Capital Assets
Govern.mental activities capital asset activity for the year ended June 30, 2020, was as follows:
Beginning Ending
Balance Increases Decreases Balance
Governmental Acti'i'itiea
Capital Assets, not being depreciated:
Land $ 65,•11 3.637 $ 13,992 $ (231.790) s 65,195,839
Construction i1l Progi·ess l,•1•13.114 24,588,667 (3,554,098) 2:l,477,683
Total Capital Assets. not being depreciated 66,856,751 24,602,659 l/3, 785,888) 87,673,522
Capital Assets, being depreciated:
Buildings and Systems 32,881,587 32,881,587
fmprovements other than Building:. 38,053,390 919,204 38,972.594
Machinery and 8quipment 23,424.020 2,212,750 (1,230,291) 2-l,•106,479
r nfrastructure 122, L99,943 2,196.428 124,396.371
Total Capital Assets, being depreciated 216,558,940 5,328,382 (1,230.291) 220,657.031
Less Accum ulated Depreciation for:
Buildings and Systems (22.110,908) (943,449) (23,054,357)
Improvements other than Buildings (28,604,581) (1,475,975) (25,080,556)
Machinery and IJ:quipmem ( [5,903,678) (1,677,686) 959,277 ( LG,622,087)
I nfrastruatut•e (72,985,439) (2,589,295) (75,574,734)
Total Accumulated Depreciation (134,604,606) (G,686/toii) 959,277 (140,331,734)
Total Capital Assets, being dep!'eciau:!d, net 81,954,334 (1,358,023) (2'i 1.01/J) 80,325,297
O0\lernmental Act1vit1es Capital Assets, net $ 148,8 11,085 $ 23,244,636 $ (4,056,902) $ 167,998,819
-70-

City of Orem Notes to the Financial Statements
June 30, 2020
4. Detailed Notes for all Funds (continued)
F. Capital Assets (continued)
Business-type activities capital asset activity for the yeru· ended June :30, 2020, was as follows:
Beginning Ending
Balance Increases Decreases .Balance
Busi ness·iype Activities
Capital Assets. not being depreciated:
Land $ 3,888,751 $ $ $ 3,888,751
fn l;angibles l,ll7,9!JO 96,700 l,21'!,690
Construction in Prngress 3,054.478 5,559,988 (H.210.189) 2,404,277
Tota I Capital Assets. not bemg depreciated 8,061,219 5,656,688 (6,210,189) 7,507.718
Capital Assets, being depreciated:
BLJ1Hdings and Systems 8,806,219 8,806,2H)
lm provements other than Buildings l 3,319,420 13,319,420
Machinery and Equipme nt 12,250,424 1,086,999 (512,925) 12,824,498
Lnll'rast.ructure 126,524,146 7,968,460 l 34,'192,606
'J'o~ I Capital Assets, being depreciated 160,900,209 9,055,459 (512,925) 1-69,442,743
I ,ess Accumulated Depreciation for:
Bmldings and Systems (7,902.66 \) (93,027) (7,995.688)
Improvements othe r than Bui.ldrngs (7,652, 7Q<t) (622,614) (8,275,318)
Maclunery 11nd Equipme n~ (7,306,759) (1,027,486) 41.3,3'14 (7,920,901)
I nJ[rastructu re (54,893,949) (3,7 10.878) (58,004,827)
Total Accumulat.ed Depreciation {77,756.073) (5,454,005) 413,344 {82,796,734)
'l'ota I Capital Assets. berng depi-eciaLed, nel 83,144,136 3,601.4il'1 {99,58U 86,646.009
Busi ness·Lype .'\ctivjt1es Capital Assets, net s 91,205,355 $ 9,258,142 $ (6,309,770) $ 9•1, 153,727
-71-

City of Orem Notes t o the Financial Statements
J une 30, 2020
4. Detailed Notes for all Funds (continued)
F. Capital Assets (continued)
Depreciation expense was charged to functions/programs of the primary government as follows:
Governmental Activities
Gene1·al Government
Public Safety
Highway and Streets
Parks. Recreat1011 and Arts
Redevelopment
Economic and Physical Development
Depreciation
E>.l)ense
s 347,l2'7
1,449,888
3,170,:l.'H
1,476,803
95. l 15
104,267
Capital assets held by the gove1·nment's internal
sei·vice funds are ,.:narged to various functions
based on then· usage of the assets 42,771
Subtor.al · Governmental Activities 6,686,405
Bu1:1iness·type Activities
Water lt,598.250 Water Rt!c lamation 1,831,040
Storm Wfl.ter 845,561
Recreation 111,462 Street Lighting 67,692
Subtotal · Busmess·type Activities 5,454.005
Tot.al Depreciation Expense s 12,1-10,410
Construction Commitments The City has active construction projects as of June 30, 2020. The projects include stI·eet construction in arnas with newly developed housing, widening and construction of existing streets and sidewalks, water, water reclamation, and storm water system improvements, and new construction and improvements to various p ublic facilities. At yearend, the City's commitments with contractors and others are as follows:
Spent.·to· Remaining
Projec:t Date Commitment Water Systems Jmpl'o~•ements $ 3,599,822 $ 6,505,573 Street Construction and Improvements 2,487.243 i ,915,-l3G Public F'aciJjcy Constr1.tction & 1mprovementa 3, 104,054 4,198,357 Park and Recreation Imptovemcnts 694,94,5 I, 180,754
Water lteclamation improvements J, 785.774 2,692.188 Sto!'m '\later Tmproveruents 359,000 2,885.000
Total $ 12,030,838 $ 19,877,308
-72-

City of Orem Notes to the Financial Statements
June 30, 2020
4. Detailed Notes for all Funds (continued)
G. Inter fund Receivables, Payables and Transfers
The composition of interfund balances as of June 30, 2020, is as follows:
Interfund Transfers Transfers between funds occur primarily to finance programs accounted for in one fund with resources collected in other funds in accordance with budgetary authorizations. Fiscal year intel"fund transfers are as follows:
Ma.,o r Fund!<:
General
Debt Service Fund
Capital Project.s Fund
Wat.er Fund
Water .Reclamation Fund
Storm W11ter Fund
Nonmajor Gove rnmenta l Funi;ls
$
In
2 ,699,627
4 .188, 350
5 ,28 3,681
172,705
Non major Enterprise F1mds 1,525,000
lntomal Service Funcl6
$ 13.769.363
H. Jointly Governed Organizations
Out
$ 10.~47,691
33.615
972,945
222,896
317,033
1,091,070
511,294
72,819
$ 13,769,363
The City in conjunction with other governmental entities, jointly governs several organizations. Each organization's boaTd is comprised of one member from each participating entity. A brief description of the City's relationship with each organization follows:
Utah Risk Management Mutual Association (URMMA) · The City provides for its general liability risks and worker's compensation through a joint protection agreement with URMMA. During the year ended June 30, 2020, the City paid premiums of approximately $223,000 to URMMA.
North Pointe Solid Waste Special Service District (NPSWSSD) - The district is a component unit of Utah County and represents thirteen cities in the northern part of the county. NPSWSSD was created to process and dispose of municipal solid waste. The City disposes of its solid waste through an agreement with NPSWSSD, which operates a solid waste transfer station. The City is represented on the NPSWSSD board and has voting rights related to the operations and financing of NPSWSSD. NPSWSSD has a service contract for the ultimate disposal of waste at a landfill located in an adjacent county. During the year ended June 30, 2020, the City paid solid waste tipping fees of approximately $1,165,000 to NPSWSSD. The City's waste, by weight, represents approximately 25% of all of the solid waste p1·ocessed by NPSWSSD.
-73-

City of Orem Notes to the Financial Statements
June 30, 2020
4. Deitailed Notes for all Funds (continued)
H. Jointly Governed Organizations (continued)
Nrnrth Utah Valley Animal Setvices Special Service District (NUVAS) · The Utah County Board of Commissioners (''The Commission) created thH district. Thi~ Commission delegated all powers to manage the district to an Administrative Control Board which has thTee members appointed by the Commission and a member from each of the fourteen participating cities. Each pat'ticipating city delivers stray, homeless, endangel'ed, injured or other animals to the district's shelter facility. NUVAS is charged with identifying ancl/or locating the animal's rightful owner. Personnel of the district also evaluate, house, treat and/or humanely dispose of any animal brought to them by the City. NUV AS also handles all licensing and licensing renewals.. During the year ended June 30, 2020, the City paid participation fees of approximately $14W,000 to NUVAS.
Utah Telecommunication Open Infrastructure Agency (UTOPW - UTOPIA was formed under the Utah Interlocal Cooperation Act by its eighteen founding cit ies, of which , the City of Orem is a member. This agency has the assignment to design, finance, build, operate and maintain a fiberto·home and fiber-to· business fiber optic communication network. UTOPIA will build the infrastructm·e but private companies will deliver the services ove1· the network. Duxing the year ended June 30, 2020, the City paid UTOPIA approximately $18,000 in customer service fees. The City also paid $8,225,045 in pledge funds into a debt seTvice reserve fund which was used to pay UTOPIA debt obligations for the fiscal year. A corresponding long·term note ri~ceivable was also increased by this amount. See footnote 5.B. (Other information, contingent liabilities) for additional information.
Utah Infrastructure Agency (UIA) - UIA was formed undeT the Utah Interlocal Cooperation Act by its nine member cities, of which, the City of Orem is a m ember. This agency was organized to provide for the acquisition, construction, and installation of telecommunication and cable television lines to a customer's premises using a demand utility model. During the ye,ar ended June 30, 2020, the City forwarded Contract Utility Enhancement (CUE) agreement receipts of approximately $68,000 to UIA and paid approximately $9,000 in customer se1·vice fees.
I . Capital Leases
ThH City has entered into certain lease agreements under which th e related equipment will become the property of the City when the te1·ms of ithe lease agreement are met. All City lease contracts contain a fiscal non-funding clause that allows the City Council the option of terminating the lease agreement at the end of any fiscal year. In the opinion of City management, the likelihood of this clause being exercised is remote.
The following is a schedule , by year. of future minimum lease payments of all
-74-

City of Orem Notes to the Financial Statements
June 30, 2020
4. Detailed Notes for all Funds (continued)
I . Capital Leases (continued)
capital leases as well as the present value of the net minimum lease payments as of June 30, 2020:
Year ending June 30, 2021 2022
202a
2024
2025 2026·2030
2031 ·2035 2036·2040
T otal tninimuim lease payments
Less: Amo1.1nt rt-presenting interest
rresent value of net minimum lease payments
Governmen t;al
Activities $ 576,0\8
563,374
555,689
555, 183
556,314
2,787,008
563,983 3,024
6,161,493
(648, 170)
$ 5,513,323
Equipi:µent and i-elated accumulated depreciat ion under capital leases is as follows:
Cost of Equipment Accumulated Depreciation
Difference
J. Long·term Debt
General Obligation Bonds
Governmen tal Activities
$ 6,292,775 (729,546)
$ 5,563,229
The City issues general obligation bonds to provide funds for the acquisition and construction of major capital p1·ojects. All general obligation bonds issued are fOI' goveI"nmental activities . The original amount of general obligation bonds issued in prior years was $34,145,000.
Gene1·al obligation bonds are direct obligations and pledge the full faith and credit of the government.
General obligation bonds outstanding at June 30, 2020, a re as follows:
Purpose Interest Rates Governmental activities:
2014 Road Construction-Refunding 0.25% to 3.00% 2019 Public Facilities Construction 3.625% to 5.00%
Total
-75-
Amount
$ 5,120,000 24,500.000
$ 29,620,000
City of Orem Notes to the Financial Statements
June 30, 2020
4. Detailed Notes for all Funds (continued)
J. Long·term Debt (continued)
General Obligation Bonds (continued) Annual debt se1·vice requirements to maturity for the above reflected general obligation debt i s as follows:
Year Ended Governmental Activities June 30, Princi)2al Interest Totals
2021 $ 965,000 $ 1,316.713 $ 2,281,713 2022 1,000,000 1,287,237 2,287,237 2023 1,025,000 1,259,425 2,284,425 2024 1,050.000 1,230,863 2,280,863 2025 1,080,000 1,201 ,613 2,281,613
2026·2030 2,610,000 5,638,087 8,248,087 2031 ·2035 3,765,000 4,903,938 8,668,938 2036·2040 5,330.000 3.779,313 9.109,313 2041-2045 7.375,000 2,201.437 9.576,437 2046·2050 5,420,000 345,656 5,765,656
Totals $ 29,620,000 $ 23,164,282 $ 52,784,282
Revenue Bonds All of the City's water and s torm sewer/water, water quality, franchise tax, and sales tax revenue bonds are payable solely by a pledge and assignment of their associated revenue sources. For additional information regarding the City's pledged-revenue coverage, see the table on page 165.
The City has the following reven ue bonds outstanding at June 30, 20~20:
Water and Sto1w Sewer Revenue Bonds - Series 2005 B In March of 2005, the City entered into an agreement to issue revenue bonds through the Utah State Department of Drinki][lg Water of $3.000,000. The p1·oceeds of th e bonds were u sed for tlhe completion of improvements to the city's water and storm water systems. The terms of the bond contract require p1·incipal payable annually commencing in July 2006 with interest payable semi· annually in January and July through July 2025. The interest rate is fixed at 1.48%. Outstanding principal at June 30, 2020, is $994,000.
-76-

City of Orem Notes to the Financial Statements
June 30, 2020
4. Detailed Notes for all Funds (continued)
J. Long·term Debt (continued)
Revenue Bonds (continued)
Water Quah·tvRevenue Bonds-Sen·es 2010 In February of 2010, the City entered into an agreement to issue $11,889,000 in revenue bonds through the State of Utah's Department of Environmental Quality. The proceeds of the bonds were used to construct and expand facilities at the Water Reclamation Plant. The bond contract terms require principal payable annually beginning in February 2013 and continuing through Februa1·y 2032. Payments on the bonds are paid from sewer charges to customers. The interest rate is fixed at 0.00%. Outstanding principal at June 30, 2020, is $7,137,000.
Water and Storm Sewer Revenue R efunding Bonds -Series 2013 In July of 2013, the City issued revenue refunding bonds of $12,801,000 tb.l'Ough private placement. The proceeds were placed in an irrevocable t rust for the purpose of generating resources for futU1·e debt service payments of the Series 2005A water and storm sewer revenue bonds. The terms of the bond contract require principal payable annually commencing in July 2014 and interest payable semi-annually in January and July t lll'ough July 2025. The interest rate is fixed at 2.18%. Outstanding principal at June 30, 2020, is $7,627,000.
Water and Storm Sewer Revenue Refunding Bonds -Series 2016 In Octobe1· of 2016, the City issued revenue refunding bonds of $4,380,000 through a public offering. The proceeds were placed in an irrevocable trust for the purpose of generating resources for future debt service payments of the Series 2008 water and storm sewer revenue bonds. The terms of the bond contract require principal payable a nnually commencing in July 2019 and interest payable beginning in Janmuy 2017 and payable semi-annually through July 2028. The interest rate varies between 2.00% and 4.50%. Outstanding principal at June 30, 2020, is $4,280,000.
Sales Tax Revenue Refunding Bonds - Series 2017 In February of 2017, the City issued sales tax revenue refunding bonds of $2,898,000 tlu-ough a public offering. The proceeds were placed in a trust account and used to pay the remaining outstanding principal balance of the Series 2007 sales tax 1·evenue refunding bonds. The terms of the bond contract require principal payable annually commencing in April 2018 with interest payable semi-annually in April and October through April 2023. The interest rate is fixed at 1.94%. Outstanding principal at June 30, 2020, is $856,000.
-77-

City of Orem Notes to the Financial Statements
June 30, 2020
4. Detailed Notes for all Funds (continued)
J. Long-term Debt (continued)
Revenue Bonds (cont inued)
Revenue bonds currently outstanding at June 30, 2020, are as follows:
PurEose Interest Rates Amount Governmental Activities:
Recreation Projects 1.94% $ 856,000
Business-type Activities: Water 1.48%·4.50% 10,344,429 Wastewater Treatment 0.00% 7.137,000 Storm Water 1.48%·4.50% 2,556,571
20.038,000
Total $ 20,894,000
Annual debt service requirements to maturity for the above reflected revenue bond debt is as follows:
Year Ended Government al Activities Business· type Activities Ju11e 30, PTincipa! Interest Principal Interest Totals
2021 $ 360,000 $ 16,606 $ 2,057,000 $ 336 ,417 $ 2 ,770.0 23 2022 243,000 9 ,622 2 ,084,000 305.551 2,642.173 2023 253,000 4.908 2, 113,000 273,089 2,643,997 2024 2, l47,000 238,976 2,385,976 2025 2 ,177,000 204, 186 2,381,186
2026·2030 8,270,000 354,809 8,624,809 2031 ·2035 1,190.000 1, 190,000
Totals $ 856,000 $ 31.136 $ 20,038,000 $ 1.713,028 $ 22,6 38,164
Notes Payable
HUD Section 108 Loan In November of 2005, the City entered into a loan agreement with the Department of H ousing and Urban Development (HUD) in the amount of $1,320,000 to promote, facilitate, and encourage industrial and business development within the City. The terms of the loan agreement require principal payable annually commencing in August 2006 and interest payable semi-annually in Feb1·uary and Augl,lSt through August 2025. The interest rate is va1·iable. Outstanmng principal at June 30, 2020, is $534,930.
-78-

City of Orem Notes to the Financial Statements
June 30, 2020
4. Detailed Notes for all Funds (continued)
J . Long-term Debt (continued)
Notes Payable (continued)
.!Vhner Property L ong-term Note Pavable In J une of 2000, the City entered into a long·term note payable with Dean and Blanche 1VIiner in the amount of $391,000 for the purchase of prnperty for a new softball and soccer complex. The terms of the note require principal and interest payable monthly commencing in May 2001 and continuing tlu.>ough Apr il 2021. The interest 1·ate is fixed at 6.00%. Outstanding principal at June 30, 2020, .is $27,256.
Notes payable currently ou tstanding at June 30, 2020, aTe as follows:
Purpose Governmen tal Activities: HUD Section 108 Loan -
Economic Development Land Pw·chase - Park
'T'otal
Interest Rates
Vatiable 6.00%
$
$
Amount
534,930 27,256
562,186
Annual debt service requirements to maturity for the above reflected notes payable is as follows:
Year Ended Governmental Activities June 30, PrinciEal Interest Totals
2021 $ l 07,256 $ 26,744 $ 134.000 2022 80,000 21.788 10 L, 788 2023 85,000 17.456 102,456 2024 95,000 6,516 101.516 2025 95,000 l ,005 99,005
2026-2030 99.930 1 369 101,299 TotaJs $ 562, 186 $ 77,878 $ 640,064
Changes in Long-term Liabilities Ch a,nges in bonds payable, deferred items, cap.ital leases, and compensated absences during the fiscal year ended June 30, 2020, are as follows:
-79-

4.
City of Orem Notes to the Financial Statements
June 30, 2020
Deitailed Notes for all Funds (continued)
J. Long·term Debt (continued)
Changes in Long-term Liabilit ies (con tinued)
Beginning End.mg Due Within
Balance Additions Reductions Balance One Year
Gcivernmental Activities
B<lnds Payable:
General Obligation Bonds s 30,560,000 s s (940,000) $ 29,620,000 s 965,000
/Special Assessment Bonds 130,000 (130,000)
Revenue Bonds 1,208,000 (352,000) 856,000 360,000
IPhts lssuance Premiums 4,091,531 (209,651) 3,881,880 209,650
Total Bonds Payable 35,989,531 (1,631,651) 3-l,357,880 1,534,650
Notes Payable 668,147 (106,961) 562,186 107.256
Capital Leases 5,974,929 (461,606) 5,513,323 467,194
Compensated Absences 2,081 ,-176 339,U7 (201,787) 2,218,836 2,107,895
Ne!t Pension Liabilities 15,276,459 (8,021,395) 7,255,064
Other Leng-term Llabilites 1,535,561 212.090 (520,704) 1.226,947 431.974
Governmental Activities
Long- term Liabilities $ 61,526,103 $ 551.237 $ (10,943,1011) $ 61,13•1,236 $ 4,64-8,969
B\11ainess·t:me Activities Bonds Payable:
lRevenue Bonds $ 22.091,000 $ $ (2,053,000) $ 20.038,000 $ 2,057,000
JPlus Issuance Premiums 810,978 (101,911) 709,067 101,91 l
Total Bonds Payable 22,901 ,978 (2,154,911) 20,747,067 2,158,911
Compensated Absences 329,245 57,247 (37,84-7) 348,645 331,215
Ne,t Pension Liabilities 2,827,-123 (1,569,530) 1,257,893
1!3usiness·type Activities
Long-term Liabilities $ 26,058,646 $ 57.247 $ (3. 762,288) $ 22,353,605 s 2,490,126
Compensated Absences City employees earn vacation based upon the employee's years of service. Employees, upon termination, may be paid up to 336 hours of earned vacation. Amounts of vacation vested a nd not paid have been accrued as a liability at June 30, 2020. The General Fund has typically been used in prior years to liquidate this liability for governmental funds.
While an employee may accumulate. an unlimited number of sick holllrs , these hm.u·s a re not paid out upon termination.
-80-

City of Orem Notes to the Financial Statements
June 30, 2020
4. Detailed Notes for all Funds (continued)
K. Equity Classification
Gove1·nment·wide and Proprietary Fund Financial Statements Equity is classified in the government-wide and proprietary fund financial statements as net position and is displayed in three components:
1) Net Investment in Capital Assets - consists of capital assets including restricted capital assets, net of accumulated depreciation and reduced by the outstanding balances of any bonds, mortgages, notes, 0 1· other borrowings that a1·e attributable to the acquisition, construction, ot improvement of those capital assets.
2) Restricted Net Pos ition - resources with constraints placed on their use either by (a) external groups such as creditors, grantors, contributors, or laws or regulations of other govetnments, or (b) are imposed by law through constitutional provisions or enabling legislation.
3) Unrestricted Net Position - consists of all other resources that do not meet the definition of "restricted" or "net investment in capital assets" as defined above.
Governmental Fund Financial Statements Equity is classified in the governmental fund financial statements as fund balance. Governmental fund balances are further classified as Nonspendable, Restricted, Committed, Assigned, or Unassigned.
1) Nonspendable Fund Balance - this classification includes amounts that cannot be spent because they are either (a) not in spendable form, 01· (b) ai·e legally or con tractually required to be maintained intact.
2) Restricted Fund Balance - this classification includes amounts that are restricted by enabling legislation. Other amounts are also reported in this classification if they are (a) externally imposed by creditor s, grantors, contl'ibutor s, or laws or regulations of other governments, or (b) are imposed by law through constitutional provisions or enabling legislation.
3) Committed Fund Balance - this classification includes amounts that can only be used for specific purposes pursuant to constraints imposed by formal action (ordinance) of the City Council, which is the City's highest level of decision making authority. It also includes contractual obligations to the extent that existing resources are specifically committed for use in satisfying those contractual requirements.
-81-

City of Orem Notes to the Financial Statements
June 30, 2020
4. Detailed Notes for all Funds (continued)
K. Equity Classification (continued)
Governmental Fund Financial Statements (continued)
4) Assigned Fund Balance - this classification includes amounts that are constrained by the City's intent to use the funds for specific purposes, but are neither restricted nor committed, as established by the City Manager. The City Manager received the authority to place constraints on city funds through an ordinance created by the City Council. It also includes a ll remaining amounts that are reported in governmental funds (other than the General Fund) which have specific purposes and that axe not classified in one of the previous classifications.
5) Unassigned Fund Balance - this classification is generally the residual classification for the General Fund. However, it may be necessary to report a negative unassigned fund balance for other governmental funds if expenditures incurred for specific purposes exceeds the amounts restricted, committed, or assigned for t hose pluposes, Thus, this classification is normally a positive amount within the General Fund and represents fund balance that has not been Tesb.·icted, committed, 01· assigned for any specific purposes.
When restricted and unrestricted resources are available, it is the City's accounting policy to use resti·icted l'esources first.
When committed, assigned, or unassigned resources are available for use, it is the City's accounting policy to use committed resources first, followed by assigned resow·ces, and then unassigned resources as they are needed.
The City has not formally a dopted any minimum fund balance policy. However, the State of Utah does require th e City to maintain 5% of the current fiscal year's actual revenues as a minimum fund balance. The City is cognizant of and adheres to this requirement.
The following page pTovides great.er detail of the ftmd balance classifications and categories for all governmental funds for the fiscal year ended June 30, 2020_ The governmental fund balance classifications and categoTjes at the end of the current fiscal year are as follows:
-82-

City of Orem Notes to the Financial Statements
June 30, 2020
4. Detailed Notes for all Funds (continued)
K. Equity Classification (continued)
Governmental Fund Financial Statements (continued)
2019 G .O. Bonds Debt Csp1tnl Capital
Gone.r~l Service Projac:ts Projects Fund Fund Fund Fund
Fund Balances: Noospendable:
Prepaids $ .,19 ~195 s $ s 49,905
Restricied: C lt>!!S "C" Roads 4, 189,717 l.itopia Ple~e :'1, 289,545 rnsk Force 1,212.734 Parka/Rec/Ar"" F'itties.a Ct!nte,. 10,639,964 L;brary H..,U 285,l. 70 Debt Servioe 1,639,348 C npital lmp. •130,000 41,319 O~her Pur pose• 30.479
8 ,722,475 1 ,639,348 ,,so,ooo 10,966,453 Assigned:
VQhicleA 5 18,074 P. Safety l!:qulp. 507,310 89,827 Library lV!edia 105,267 H!oonornic Dev. 611,156 Facility J n,p, 1,886.767 CARES Act Fuuda 4 74'1,696 Street/Light 1,np, 2 ,419,2 16 Park Imp. 1,568,324 Fitnesa Cen ter 1..099, 249 Library ~faU 896,074 Debt. Service I , 122.367 C apital Imp ,196,333 10,278,481 O ilier PurpoijeB 3.220,579
1.0,203,J.15 1,122,367 17,739.938
Una,...igned 12,a-16,1 1 a
Total FUl'\d Balances .$ 31,351,998 $2,761 ,715 $' 18 ,169,938 .'!; 10,966.453
1 S00 p~ges U2-J 13 for a breakdown b_y individual fund
5. Other Information
A. Risk Management
Nonm3jor T otal ROA G overnm.eot.a.l Govt1rnm.ent:a.l Fund Funds 1 Funds
.$ $ $ .!9,995 49,995
4, 189,717 3,289,;';4i) 1. 212, 78d,
2 1S02,24f! l!,802,2 48 3.009,625 13,649,589
25,669 310,839 1,639,348
6 ,694,288 4,645,8 97 U ,811,504 -132 -~36 462 91.5
6,694. 288 10,•115.875 '38,868,-139
518,074 597,137 105,267 611 l<i6
1,886,767 4 ,744,696 2,419, 216 1,668,324 1,099,249
398,074 l , 122,367
10,774,81.4 342 097 3,562.676 3 42,097 29,407,817
12.376, 113
$ 6 ,694,288 $ 10,757,972 .$ 80,70.:2, :164
The City is exposed to various risks of loss related to tol"ts; theft of, damage to and destruction of assets; errors and omissions; injuries t o employees; and natural disast e1·s . The City maintains this fund to account for and finance its risk s of loss. The City -provides coverage for worker's compensation claims through the Worke1·s Compensation Fund of Utah which was effective as of January 1, 2019. The Self·insurance fund also provides coverage up to $15,000 for general liability and $10,000 for property damage. The City is
-83-
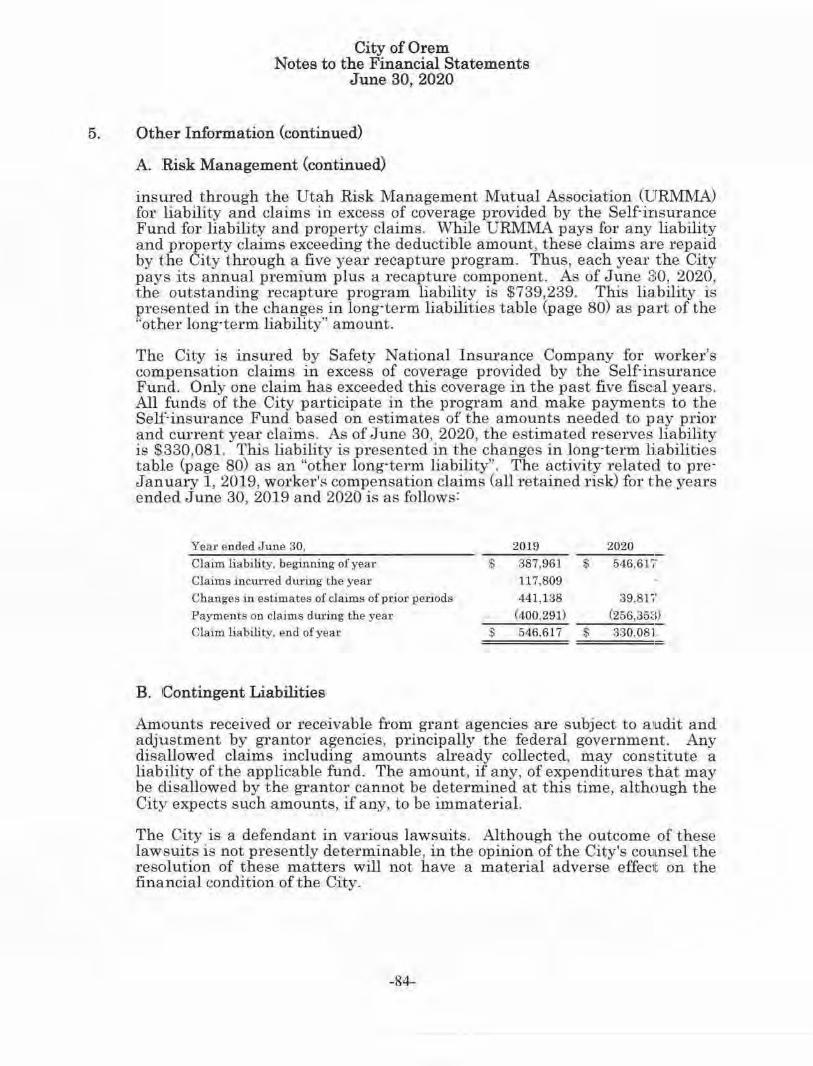
City of Orem Notes to the Financial Statements
June 30, 2020
5. Other Information (continued)
A. Risk Management (continued)
insured through the Utah Risk Management Mutual Association (URMMA) for liability and claims in excess of coverage provided by the Self-insurance Fumd for liability and property claims. While URMMA pays for any liability and property claims exceeding the deductible amount, these claims are repaid by the City through a five year recapture program. Thus, each yeal' t he City pays its annual premium plus a 1·ecaptU1·e component. As of June 3:0, 2020, the outstanding recapture p1·ogram liability is $739,239. This liability is presented in the changes in long-term liabilities table (page 80) as paxt of the "other long-term liability" amount.
The City is insured by Safety National Insutance Company for worker's compensation claims in excess of coverage provided by the Self-insurance Fumd. Only one claim has exceeded this coverage in the past five fisc:al years. All funds of the City participate in the program and make payments to the Self-insurance Fund based on estimates of the amounts needed to pay prior and current year claims. As of June 30, 2020, the estimated reserves liability is $330,081. This liability is presented in the changes in long-term liabilities table (page 80) as an "other long-term liability". The activity r e lated to preJanuary 1, 2019, worker's compensation claims (all retained risk) fOl" the years ended June 30, 2019 and 2020 is as follows:
Year ended June 30, 2019 2020
Claim liabiHty. beginning of year $ 387,961 $ 546,61'i'
Claims mew-red during the yea1· 117,809
Changes in estimates of claims of prior periods 441,138 39.817
Payments ou claims during the year (400,291) (256,358)
Claim liability, end of year $ 546,617 $ 330,081
B. Contingent Liabilities
Amounts received or receivable. from grant agencies are s ubject to alLldit and adjustment by g1·antor agencies, principally the federal government. Any disallowed claims including amounts already collected, may constitute a liability of the applicable fund. The am ount, if any, of expenditures t hat may be disallowed by the gr·antor cannot be determined at this time, although the City expects such amounts, if any, to be immaterial.
The City is a defendant in various lawsuits. Although the outcome of these lawsuits is not presently determinable, in the opinion of the City's coumsel the resolution of these matters will not have a material adver se effect on the financial condition of the City.
-84-

City of Orem Notes to the Financial Statements
June 30, 2020
5. Other Information (continued)
B. Contingent Liabilities (continued)
Utah Telecommunication Open Infrastructure Agency (UTOPIA) The City is a member of UTOPIA, an intedocal, nonprofit agency. UTOPIA was foI'med under the Utah Inter local Cooperation Act by its eighteen founding cihes, of which the City is one of the eleven pledged members. This agency has the assignment to design, finance, build, operate and maintain a fiber·to·home and fiber-to-business fiber optic communication netwmk. UTOPIA will build the infrastructure but private companies will deliver the services over the network. UTOPIA acts as the wholesaler, not the 1·etailer.
In ,July 2004, UTOPIA issued an $85,000,000 revenue bond. In June 2008, UTOPIA issued $185,000,000 in new revenue bonds to pay and cancel the 2004 rev,enue bonds, pay and cancel other related debt, pay outstanding lllnfunded construction commitments, provide two years of capitalized interest and LOC payments, provide approximately $10,000,000 in operational and construction funds, and to pay the costs of issuing the 2008 bonds.
In December 2011, UTOPIA refinanced the existing 2008 variable rate bonds andl replaced them with a long·term relatively fixed rate debt structur1a (SWAP arrangement). The new debt structtu-e eliminated the letter of credit fee and wiU result in an estimated savings of $117 million over the life of the bonds. ThB new 2011 Tevenue bonds still have principal payments due quarterly commencing in December 2013 and cont inuing through June 2040 with intEirest payments due monthly commencing in January 2012 and continuing through June 2040.
Net. revenues from the communication network will reimburse a debt service resnrve fund for payments on the bond debt. To the extent that there are insufficient net revenues to pay the debt service, the eleven pledged members are required to 1·eimburse the UTOPIA debt service reserve fund of any shortfall by their respective pe1·centages up to a specific dollar amount. Each member city has pledged sales tax revenues to pay their 1·espective pe:l'centage of any shortfall amount. None of the pledge requirements were modified by the 2011 bond refinancing. The City's liability limit (pledge) for the current fisc:al year was set at a maximum of $3,225,045. The pledge limit has an annual increase which is not to exceed 2%. The City's total remaining maKimum pledge amount for all fiscal years through 2040 (end of the bond tetrn) is $79,520,645.
-85-
City of Orem Notes to the Financial Statements
June 30, 2020
5. Other Information (continued)
B. Contingent Liabilities (continued)
Utah Infrastructure Agency (UIA) The City is a member of UIA, an intedocal , nonpTofit agency. UIA was formed under the Utah Interlocal Cooperation Act by its nine member cities, of which the City is one of the eight contracting members.
This agency was organized to provide for the acquisition, construction , and installation of telecommunication and cable television lines to a customer's premises using a demand utility model.
The UIA network will be connected to the fiber optic network of UTOPIA (see previous page) pursuant to an Indefeasible Right of Use (IRU) agreement which provides UIA access to certain facilities of and capacity in the UTOPIA network, Construction of the UIA network began in May of 2011.
In May 2011, UIA issued $29,390,000 in revenue bonds ($20.275,000 tax exempt and $9,115.000 taxable). In J uly 2013, UIA issued $11,205,000 (all tax exempt) of revenue bonds. In October 2015, UIA issued $24,295,000 (all tax exempt) of revenue bonds. The total of these bond issuances is $64,890,000 and they were all refunded with the Series 2017 refunding bonds described below.
In December 2017, UIA issued $77,405,000 ($73,905,000 tax exempt and $3,500,000 taxable) of revenue and refunding bonds. The bonds were issued to refund th e Series 2011, 2013. and 2015 bonds and to obtain additional funding for infrastructure. The Series 2017 bonds have principal payments due annually commencing in October 2018 and continuing through October 2040 with interest payments due semi-annually in April and October beginning in April 2018. The interest rate on these bonds varies between 2% and 5%.
Service fee revenues from the UIA network will be used to make the debt service payments. To the extent there a re insufficient service fee revenues to pay a debt service payment, the eight contracting members are required to pay to UIA any shortfall by thefr respective percentages up to a specific dollar a mount. Each contracting city has pledged franchise tax revenues to pay th e.fr r espective percentage of any shortfall amount. The City's liability limit (pledge) is set at $1,223,786. The City did not have to make any pledge payments in Fiscal Yea1· 2020.
-86-

City of Orem Notes to the Financial Statements
June 30, 2020
5. Other Information (continued)
C. Pension Plans
General Information and Plan Desc1·iption The City is an eligible plan participant whose pension p lans are administered by and provided through the Utah Retirement Systems (URS). URS administers the following pension trust funds (collectively referred to as ''The Systems''):
• Public Employees Noncontributory Retirement System (Noncon t ributory System); Public Employees Contributory Retirement System (Contributory System); and the Firefighters Retirement System (Firefighters System). Each of these systems is a cost·sharing, multiple· employer, public employee retirement system.
• Public Safety Retirement System (Public Safety System). This plan is a mixed agent and cost·sharing. multiple-employer public employee retirement system.
• Tier 2 P ublic Employees Contribu tory Retirement System (Tier 2 P ublic Employees System) and Tier 2 Public Safety an d Firefighter Contributory Retirement System (Tier 2 Public Safety and Firefighter System). Both of t hese systems arn cost-sharing, multiple-employer, public employee retirement systems.
The Tier 2 Retirement Systems became effective July 1, 2011. All eligible employees hired on or after July 1, 2011, who h ad no previous service credit with any of the Utah Retirement Systems, are members of the Tier 2 Retirement System.
The Systems are established and governed by th e l'espective sections of Title 49 of the Utah Code Annotated 1953, as amended. The Systems' defined benefit plans are amended statutorily by t he Utah State Legislature. The Utah State Ret irement Office Act in Title 49 provides for the administration of the Systems under the direction of the Utah State Retirement Board (Board), whose members are appointed by the Governor. The Systems are fiduciary funds defined as pension (and other employee benefit) t1·ust funds. URS is a component unit of th e State of Utah. Title 49 of the Utah Code grants the authority to establish and amend the benefit terms.
U RS issues a publicly available financial r eport which includes financial statements and -required supplementa.i-y information for the Systems. The financial report may be obtained by writing to the Utah Retirement Systems, 560 East 200 South, Salt Lake City, UT 84102 or by visiting the URS website at www.m·s.org/gene1·al/publications.
Summary of Retirement Benefits by System The Systems current ly provide retirement benefits, annual cost of living adjustments, disability benefits, and death benefits.
-87-

City of Orem Notes to the Financial Statements
June 30, 2020
5. Other Informat ion (continued)
C. Pension Plans (continued)
Summarv of Retiremen t Benefits by System (continued) A su mmary of Tetirement benefits are as follows:
Final Ye!lrs of Se1·vice
Average reguired and/or Age Benefit Percentage
Retirement System Salary Eligible for Benefit Per Year of Service
Nonc:ontributory System Highest 30 Years - Any Age 2% /Yr· All Years
3 Years 25Years · An;y Age*
20 Years · Age 60 * 10 Years· Age 62 *
4 Years · Age G5
Contributory Systen1 Highest 30 Years · Any Age 1.25% I Yr to J une 1975
5 Years 20 Years· Age 60 * Or
10 Years· Age 62" 2% / Yr from July
4 Years · Age 65 1975 to the Present
Publ ic Safety System Highest 20 Years· Any Age 2.5% I Yr up to 20 Yrs
3 Years 10 Years· Age 60 and
4 Years· Age 65 2% /Yr over 20 Yrs
Firefighters System Highest 20 Years · Any Age 2.5% / Yr up to 20 Yrs
3 Years 10 Years · Age 60 and 4 Years · Age 65 2% I Yr over 20 Yrs
Tier 2 Public Employees Highest 3o Years · Any Age l.fi% I Yr · All Years
Sy1,tem 5Years 20 Years · Age 60 * 10 Years· Age 62 *
4 Yen.rs· Age 65
Tier 2 Public Safety and Highest 25 Yea1•s -Any Age 1.5% / Yr to June 2020
Firefighter System 5 Years 20 Ye,n·s · Age 60"' 01'
10 Years · Age 62 * 2% /Yr from J uly
4 Years · Age 65 2020 to the Present
.. Actuanal reductions apply.
COLA** Up to4%
Up to4%
Up to 2.5%
or 4.0%
Depending
Oil
Employer
Up 1,0 4%
Up to 2.5%
Up to 2.5%
"*All.post-retirement. cost-of-Jiving adjustments arn non-compounding and are hased on the original bl!netit except
for Ju.dges (compounded benefit). Cost·of·bving adjustments am a lso limited to the actual Consumet' P r iCE• Index (CPI)
increase for the year. However, unused CPI increases maJ be can-ied forward to su bsequent years.
-88-

City of Orem Notes to the Financial Statements
June 30, 2020
5. Other Information (continued)
C. Pension Plans (continued)
Contributions As :a condition of participation in the Systems, the City and/or its eIJ11ployees are required to contribute certain percentages of sala ries and wages as a uth orized by statute and specified by the URS Board. Contributions a1·e actuarially determined as an amount that, when combined with employee contributions (where applicable), is expected to finance the costs of benefits earned by employees dul'ing the year with an additional am ount to finance any unfunded actuarial accrued liability. Contribution rates are as follows:
Employer Employer E1mployer
Employee Paid for Contribution Rate for
Retii-ement System Paid Employee Rates 40:L(k) Plan
Non con l.ributOIT System Local Governmental · Tie1' 1 NIA NIA 18.47% NIA
Co1atl·ibutorv System Local Governmental· Tier 1 6.00% NIA 14.46% NIA
Local Govei·nmental · Tier 2 NIA NIA 15.66% 1.03%
Pulblic Safety System Noncontributo1·y · Tier 1 NIA NIA 38.97% NIA
Contributory (74) · Tiet• 1 10.50% NIA 28.98% NIA
Contributory (122) · Tier 2 NIA NIA 27.32% 0.70%
Firefighters System Division B · Tier I NIA 16.71% 7.24% NIA
Division B · Tier 2 NIA NIA 11.38% 0.70%
Tie•t 2 DC Only
Local GoverDltlemal NIA NIA 6.69% l.0.00%
Public Safety NIA NIA 16.02% 1.2.00%
Firefighters NIA NIA 0.08% 1-2.00%
Tieir 2 rates include a sta tutory required contribut ion to finance the unfunded actuarial accrued liability of the Tier 1 plans.
-89-
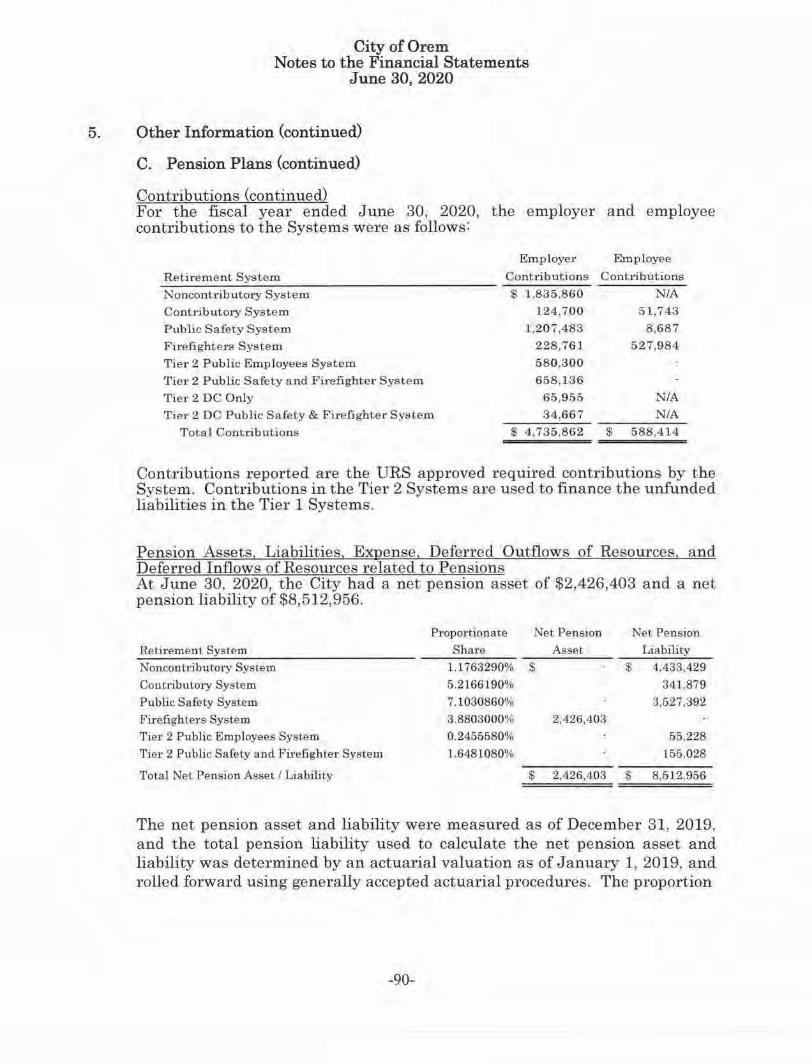
City of Orem Notes to the Financial Statements
June 30, 2020
5. Other Informat ion (continued)
C. Pension Plans (continued)
Contributions (continued) For the fiscal year ended June 30, 2020, th e employer and employee contributions to the Systems wel'8 as follows'.
Employer Em ployee
Retirement System Contributions Contributions
Noncontributory System $ 1 ,835,860 NIA Cont1·ibutory Syste m 124,700 51,743
Public SaJety Syste01 1,207,4'83 8,687
Firefighters System 228,761 527,984
Tier 2 Public Employees System 580,300
Tier 2 Public Safety and Firefighter System 658,136
Tier 2 DC Only 65,955 NIA Tier 2 DC P ublic Safe1;y & Firefight;er System 34.667 NIA
Total Contributions $ 4,735,862 $ 588,414
Cont ributions reported are the URS approved required contributions by the System. Contributions in the Tie1· 2 Systems a.re used to finance the unfunded liabilit ies in the Tier 1 Systems.
Pension Assets, Liabilit ies, Expense, Deferred Outflows of Resources. and Deferred Inflows of Resources related to P ensions At June 30, 2020, the City had a net pension asset of $2,426,403 a nd a net pension liability of $8,512,956.
Proportionate Net Pension Net. Pension
Retirement System Share Asset Liability
Noncontributory System 1.1763290% $ $ 4.433,429
Contributory System 5.2166190% 341,879
Public Safety System 7.1030860% 3,527,392
Firefigb ters System 3.8803000% 2,426,403
T ier 2 Public Employees System 0.2455580% 55, 228
Tier 2 Public Safet.y and. firefighter System 1.6481080% 155,028
Total Net. Pension Asset I Liability $ 2,426,403 $ 8,512,956
The net pension asset and liability were measured as of December 31, 2019, and t he total pension liability used to calculate the n et pension asset and liability was determined by an actuarial valuation as of January 1, 2019, and r olled forward using generally accepted actuarial procedm·es. The proportion
-90-
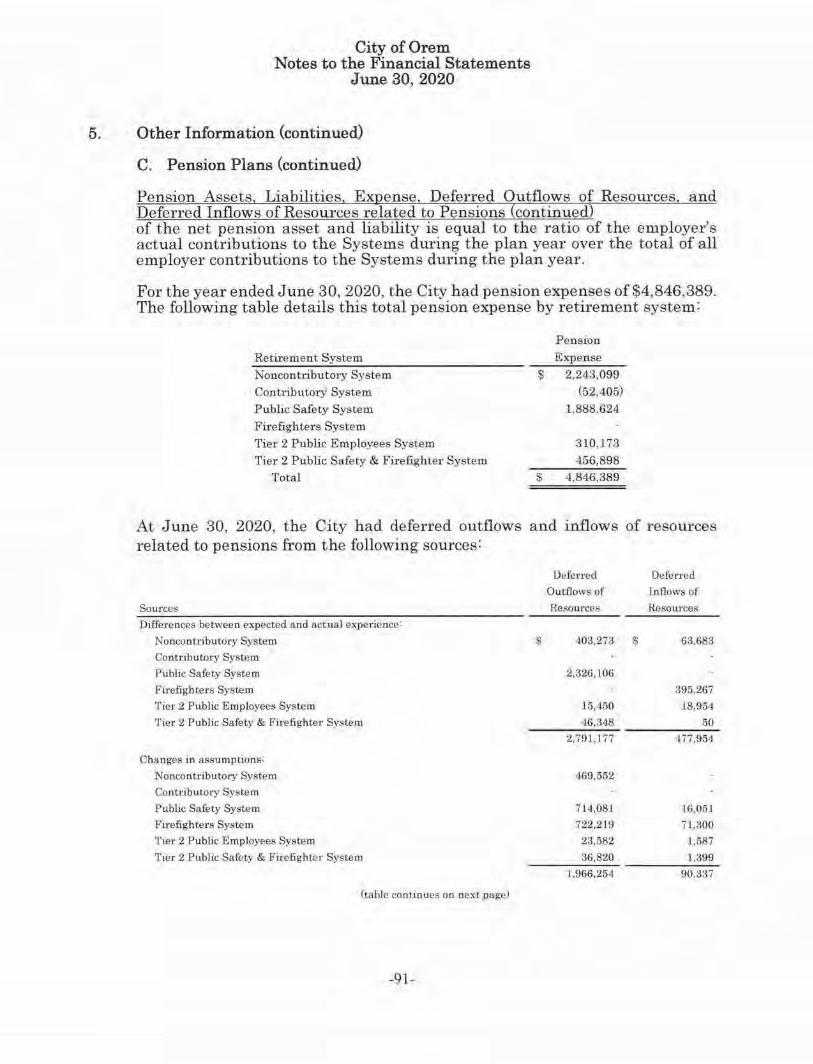
City of Orem Notes to the Financial Statements
June 30, 2020
5. Other Information (continued)
C. Pension Plans (continued)
Pension Assets Liabilities Ex ense Deferred Outflows of Resources and Deferred Inflows of Resources related to Pensions continued of the net pension asset a nd liability is equal to the ratio of the employe1·'s actual contributions to the Systems during t he plan year over the total of all employer contributions to the Systems during the plan yeru·.
For the year ended June 30, 2020, the City had pension expenses of $4,846,389. The following table details this total pension expense by retirement system:
Retixemeut System Noncontributory System Contl'ib\tt.ory System Public Safety System Fil'efigbters System Tiet 2 Public Employees System Tier 2 P·ublic Safety & Firefighter System
Total
Pension Expense
$ 2,243,099 (52,405)
1,888.624
310,173 456,898
$ 4,846,389
At June 30, 2020, the City had deferred outflows and inflows of resources related to pensions from the following sources:
Sources
Differenc;es between expected and actual expe1·ience:
Noncontributory System
Contributory System
Public Safety System
Firefighters System
Tier 2 Public E; mployees System
'l'iel' 2 Public Safety & Firefighter Syiitem
Changes in assumptions;
Noncontributoi·y System
Contributory System
Public Snfety System
Pi.refight.ers Sy.stem
Tier 2 Public Employees System
Ti.er 2 Public Saftc>ty & Firefighter System
(table continues on next Pfll?'eJ
-91-
$
Defened
Out0owa of
Resoul'ces
403,273
2,32G,l06
15,450
16,348
2,791,177
469,552
714,081
722.219
23,582
36,820
1,966,25•1
$
Deterred
lnffows of
Resources
6~.683
.395,267
18,954
50 4i7,954
16,051
71.300
l,5R7
l ,<$99
90,337
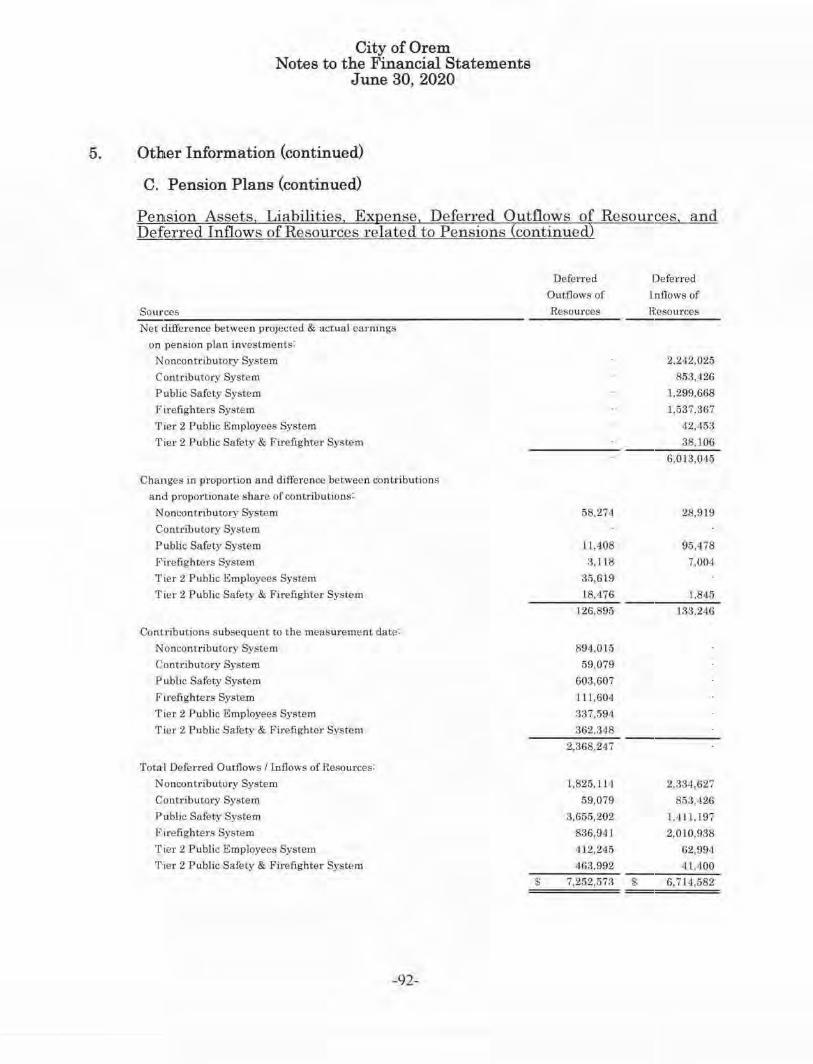
City of Orem Notes to the Financial Statements
June 30, 2020
5. Other Information (continued)
C. Pension Plans (continued)
Pension Assets Liabilit ies Ex ense Deferred Outflows of Resources. and Deferi-ed Inflows of Resources related to P ensions continued
Sources --------------------------Net difference between prnJected & actual ea1·nmgs
on pension p lan investments:
Noncontributo1y System
Contributory System
Public Safety System
Firefighters System
'Pier 2 Public Employees System
Tier 2 PubUc Safety & PiJ·efighter System
Changes in propor1.,on and difterenoe between contributions
and propol't1onate share of contributions:
Nont.:on tnbutory System
Contt•jbutory Syst1c:m
Public Safety System
r'irefighte,·s System
Tier 2 Public Employees System
Tier 2 Public Safot)' & Firefighter System
Contributions subsequent to the measu,·ement date:
Noncontributory System
Contributory System
Public Safety System
f?it'efighters System
T'ier 2 Public E:mployees System
'rillr 2 Public Safety & Firefighter System
'fota I Deferred Outflows/ inflows of Resources:
Noncontributory System
C,ontrihuto1•y System
P•ublk SuJety System
F'irefighter~ System
Tier 2 Public Employees System
T:ier 2 Public Safety & Firefighter System
-92-
$
Defe1Ted
Outflows of
Resources
58,274
1 t,408
3,118
31\,619
18,476
126,895
894,015
59,079
603,607
111,604
337,594
aG2 .. H8
2,368.247
1,825,111
59,079
3,655,202
8,36,941
ill 2,215
463.992
7,252,573 $
Deferred
lnflows of
R:esounes
2,242,025
853,426
l.299,668
1,537,.367
42,453
38,106
G,01:3,045
28,919
95,478
7,004
l,845
133.246
2,33.J,<:;27
853,426
1,,111. 197
2,010,!J38
62,994 I( l,400
6,714,582

City of Orem Notes to the Financial Statements
June 30, 2020
5. Other Information (continued)
C. Pension Plans (continued)
PeDLsion Assets Liabilities E. ense. Deferred Outflows of Resources and Deferred Inflows of Resources related to Pensions continued
Contributions made by the City to URS prior to our fiscal year end but after t he measurement date of December 31, 2019, are reported as deferred outflows of resources related to pensions in the amount of $2,368,247 (see breakdown by retirement system in the previous table). These contributions will be recognized as a reduction of the net pension liability in the following fiscal year.
Other amounts reported as deferred outflows of 1·esources and deferred inflows of resources 1·elated to pensions will be recognized in pension expense as follows:
Year Ended December 31,
2020
2021
2022
2023 2024
Thereaaer
Net Deferred
Outflows (In.flows)
of Resources
$ 68,889 (248,741)
514,578 (2,270,961)
11,620
94,859
The following table outlines the net deferred outflows (inflows) of resources that will be recognized in pension expense for each Tetii·ement system:
Tier 2 Tier 2
Year Non· Public Public lPubLc Safet;y
Ended ContribuLory Cont r iburory Safety F ,re-fighters Employees & P'irefighte"
De,c. a1, System System System System System System
2:020 $ (167,163) $ (302,058) $ l .017.520 $ ('199.1177) $ (6,209) $ (3,723)
2:021 vl53, 142} (248,610) 714.878 (253.119) (5,383) (3,065)
2:022 69, 155 15,634 37G,2•16 48,868 l,871 2,804
W23 (852,378) (3 18,392) (498,246) (581,572) (Jl,736) (8,637)
2:02.1 5,249 6,371
Thernafter 27,8134 66,495
-93-

City of Orem Notes to the Financial Statements
June 30, 2020
5. Other Information (continued)
C. Pension Plans (continued)
Actuarial Assumptions The total pension liability in the December 31, 2019, actuarial valuation was determined using the following actuarial assumptions, applied to alll periods included in th e measurement period:
lnflatio11
Salary Increases
investment Rate of Return
2.50%
3.25% to 9.75%. Average. including Inflation
6.95%, Net of Pension Plan Investment.Expense, including Inflation
Mmrtality rates were developed from actual experience and mortality tables, bas,ed on the member's gender, occupation, and age, as appropriate, with adj1.1stments for fut1ue improvement in mortality based on Scale AA, a model developed by the Society of ActuaTies.
The actuarial assumptions used in the January 1, 2019, valuation were based on t he results of an actuarial experience study for the five (5) year period ending December 31, 2016.
Thei long·term expected rate of return on pension plan investments was determined using a building·block method in which best-estimate ranges of expected future real rates of return (expected returns, net of pension plan invi~stment expense and inflation) are developed for each major asa,et class. Theise ranges are combined to produce the long·te rm expected 1·ate of ret tlTn by weighting the expected future real rates of return b y the target asset allocation percentage and by adding expected inflation. The target allocation and best estimates of arithmetic 1·eal rates of retm·n for each m ajor asset c:lass are summarized in the following table:
Asset Class
Equity Securities Debt Securities Real Assets Pl'ivate Eqwty Absolute Retm·n Cash and Cash Equivalents Totals
Inflation
Target Asset
Allocation 40%
20% 15%
9%
16% 0%
100%
Expected Arithmetic Nominal Ret\Jl'Il
-94-
Real Return Long·term E>.1>ected Arithmetic Portfolio Real
Basis Rate of Return 6.15% 2.46%
0.40% 0.08%
5.75% 0.86%
9.95% 0.139%
2.85% 0.46%
0.00% 0.1:>0%
4.'75%
2.:50%
7.:25%
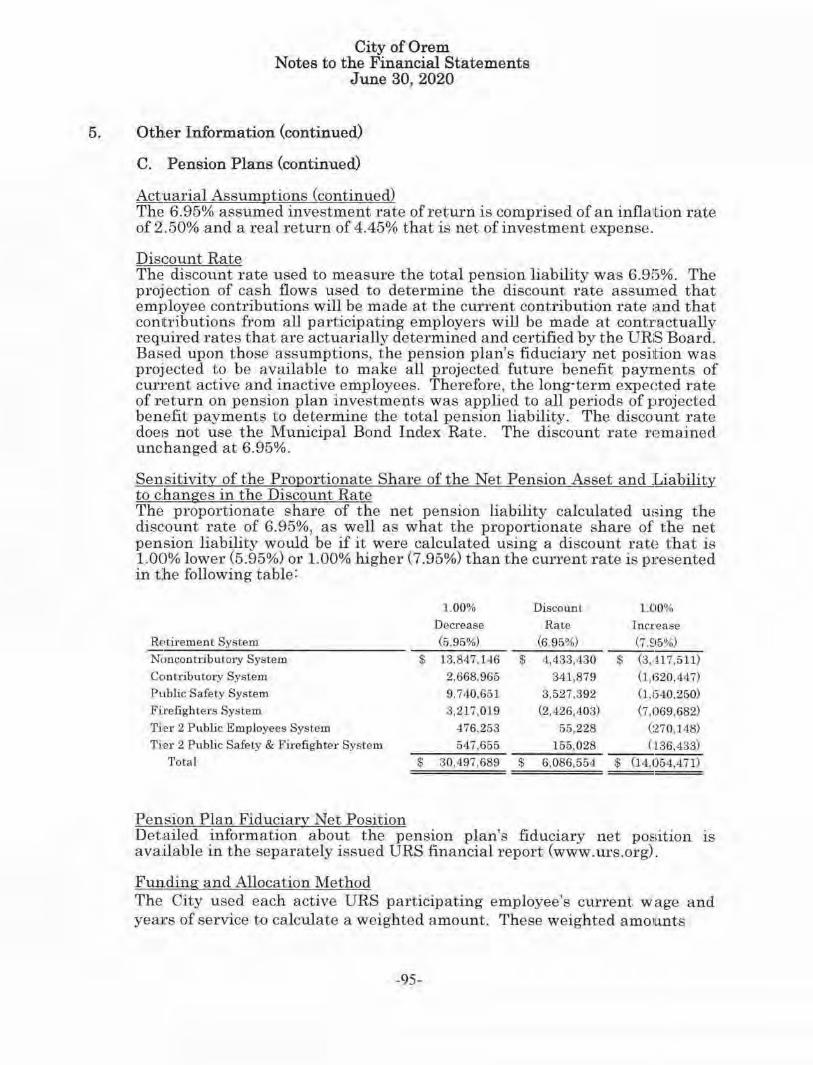
City of Orem Notes to the Financial Statements
June 30, 2020
5. Other Information (continued)
C. Pension Plans (continued)
Actuarial Assumptions (continued) The 6.95% assumed investment rate of return is comprised of an inflation rate of 2.50% and a real return of 4.45% that is net of investment expense.
Discount Rate The discount rate used to measure the total pension liability was 6.915%. The projection of cash flows used to determine the discount rate assumed that employee con tributions will be made at the cunent contribution Tate ;::1.nd that contributions from all participating employers will be made at contractua lly requiTed 1·ates that are actuarially determined and certified by the URS Boru·d. Based upon those assumption s, the pension plan's fiduciary net position was projected to be available to make all projected future benefit payments of current active and inactive employees. Therefore, the long-term expected rate of r,eturn on pension plan investments was applied to all periods of projected benefit payments to determine the total pension liability. The discount rate doeB n ot use the Municipal Bond Index Rate. The discount rate ri~mained unchanged at 6.95% .
Sensitivity of the Proportionate Share of the Net Pension Asset and Liability to c:hanges in the Discount Rate The proportionate shaTe of the net pension liability calculated using the discount rate of 6.95%, as well as what the proportionate share of the net pension liability would be if it were calculated using a discount rat,~ that is 1.00% lower (5.95%) or 1.00% higher (7.95%) than the current rate is p1resented in tlhe following table:
1.00% Discount L(Jl0% Decrease Rate Increase
Re,tirement System (5.95%) (6.95%) (7.915%) Noncontributory System $. 13.847.146 $ 4,433.430 $ (3,,U7,511) Cc,ntribu to1y System 2,668,965 34.1,879 (J ,G20,447) Putblic Safety System 9,740,651 3,527,392 ( 1, /540.250) Fit'efighters System 3,217,019 (2,426,403) (7,069,682) Ti,er 2 Public Employees System 476.253 55,228 (!~70.148) Ti.er 2 Pt1blic Safety & Firefighter System 547,655 155,028 (136,433)
'l'otal $ 30,497,689 $ 6,086,554 $ (14,054.471)
Pension Plan Fiduciary Net Position Detailed information about the pension plan's fiduciary net pos;ition 1s avaiilable in the separately issued URS financial report (www.m·s.org).
Funding and Allocation Method The City used each active URS participating employee's current wage and yea1rs of service to calculate a weighted amount. These weighted amounts
-95-

City of Orem Notes to the Financial Statements
June 30, 2020
5. 0th.er Information (continued)
C. Pension Plans (continued)
Funding and Allocation Method (continued) were used to establish a percentage of each system's total applicable net liability or asset (as provided by URS). Each employee is then assigIJted their applicable amount based upon the prio1· calculations and grouped accc)rding to thei.1· job assignment. The total amount for all employees associated with a gov•:!rnmental fund is recorded as a governmental activity in the government· wide statements. Obligations for these employees are generally liquidated through the General Fund. Amounts for all employees associated with a propTietary fund are identified and all associated transactions a re irecorded within the applicable proprietary fund. Each proprietary fund is responsible to liquidate its own pension obligations.
D. Employee Retirement Plans other than Pension Plans
401 k Defined Contribution Plan The City's 401 k defined contribution plan is administernd by ICMA Retirement Corporation (ICMA·RC). The payroll covered by the defined conb:ibution plan for the year ended June 30, 2020, was $30,426,9133. The City's expense for this plan for the year ended June 30, 2020 was approximately $439,000 or 1.44% of the total paTticipants' salary .
The contribution rates were pteviously fixed by t he City Council and the contI·ibutions were remitted on a timely basis. All employees are fully vested for the contributions made by the City.
In t.he early 1980's, the City elected to withdraw from the Utah Retirement Systems (URS) pension plan and contr ibute these funds to each employee's 40l(k) account. Howeve1·, State lawmake1·s soon mandated that all employees were requiTed to join the URS except certain classes of employees. ~rhe City Council was allowed to identify which employees qualified. They elected to allow department heads, the City Manager, and City Council mem-bers the option of whether or not to participate in the URS. There are currently thTee employees, the Mayor, and all six City Council members who have eilected to not pai·ticipate in the URS.
The City also participates in the URS 40l(k) defined contribution savings plan which is generally a s upplemental plan to the basic pension benefits of the URS, but may be used as a primary retiTement plan. Employee and employer con1~Tibutions to the URS 401(k) defined contribution savings plan for the fiscal yea;rs ended June 30 were as follows:
Conti·ibution Type
Employe1· Contributions Employee Contributions
2020 2019 2018
$ 267,198 $ 235,362 $ 243,039
$ $ $
-96-
City of Ore m Notes to the Financial Statements
June 30, 2020
5. Other Information (continued)
D. Employee Retirement Plans other than Pension Plans (continued)
457 Deferred Compensation P lan The deferred compensation plan was created in 1981 as a Social Security replacement program for the employees of the City. The deferred compensation is not available to employees until termination, retirement, death , or unforeseeable emergency. The City participates in four pl.ans. The assets associated with these plans are not inclu ded in the basic financial sta.tements, as they are not l egal assets of t he City.
All elected officials and permane nt employees may also elect to participate in thei City's deferred compensation plan and all temporary employees are required to participate in a deferred compensation plan. Under this plan, par ticipants defer a percentage of their compensation up to 7.5% for 1executive management personnel and up to 5.5% for all other employees (exceipt for the City Manager, whose participation in the plan is determined through negotiation with the City Council, and employees required to pay Medicare ins,urance premiums) for employees hired prior to March 1986. For those hired after March 1986 the percentage is 6.0% and 4.0% respectively. The City matches t he amount deferred by the participants, not to exceed the maximums listed previously or the IRS legal limit. The payroll covered by the deferred compensation plan for the yeru· ended June 30, 2020, was $30,426,993. The City's expense for this plan for th e year ended June 30, 2020, was app1·oximately $1,174,000 or 3.86% of the total pai'ticipants' salary. The coutribution rates were determined by t h e City Council and the conti·ibutions were remitted on a timely basis.
The City also participates in the URS 457 defined contribution saviings plan which is generally a supplemental plan to t h e basic pension benefits of the U RS, but may be used as a primary retirement plan. Employee and ,employer contributions to the URS 457 defined contribution savings plan for the fiscal ye~irs ended June 30 were as follows:
Contribution 'l'ype
E:mployer Contributions E:mployee Contribution ..
2020 2019
$ 88,353 $ 106,355
$ lOG.929 $ 127,678
E. Other Postemployment Benefits
Ge:ne1·al I nformation about the OPEB Plan
Pl~1n Descl'iption
2018
$ 110.682
$ 126,5(;1
Thie City provides postemployment healthcare benefits through a single· employer defined benefit plan to all employees who retired from the City prior to tTanuary 1, 2007, and who were qualified to retire from any of the Utah State Retirement Systems. The benefit, benefit level, employee and
-97-

City of Orem Notes to the Financial Statements
June 30, 2020
5. Other Information (continued)
E. Other Postemployment Benefits (continued)
Pltzn Description (continued)
employer contributions are governed by City policy and can be amend,ed at any time. The plan is not accounted for as a trust fund and no assets are being accumulated in a trust that meet the criteria in paragraph 4 of Statement 75. Th,e plan does not issue a sepal'ate financial report.
Employees who retire(d) on or after January 1, 2007, are not elligible to participate in this plan unless retiI·ee health insurance is offered as an option to an employee under a volunta1·y separation plan which ate unusu a l and infrequent. Otherwise no new entrants to the plan will occur. As of June 30, 2mw, there are nine (9) retirees or retirees spouses participating in tlhe plan.
Th,e City currently pays for postemployment benefits other than pensions on a "pa.y·as·you·go" basis. Contribution amounts for t he City and t he plan members may be amended at any time and for any reason. For the fiscal year ended June 30, 2020, total plan premiums paid were $95,858. 1r h e City contributed $38,233 (39.89% of total premiums) and retfree plan members receiving benefits contl'ibu.ted $57,625 (60.11% of total premiums). The activity of the plan is reported in the City's General Fund a nd all obligations a1'e1 liquidated through the General Fund.
Total OPEB Liability
Thie City's total OPEB liability of $157,627 was determined by an actuarial valuation as of January 1, 2020, and measurement date of December 31, 2019.
Actuarial Assumptions and Othe1· Inputs
Th,3 total OPEB liability in the January 1, 2020, actuarial valuation was determined using the following actuarial assumptions and othe1r inputs. a pplied to all periods included in the measurement, unless otherwise noted:
Inflation
Salary loci-eases
Discount Rate
Healthcare Cost Trend Rates
Ret.,irees' Share of Benefit-
Related Costs
2.20%
NIA
2.21%
4.10% scaling down to 3.70% over 54years.
55% of projected health insurance premiums
Th,e discount rate was based on the 20 year Bond Buyer General Obligation Mumicipal Index as of June 30, 2020.
-98-

City of Orem Notes to the Financial Statements
June 30, 2020
5. Other Information (continued)
.E. Other Postemployment Benefits (continued)
Actuarial Assumption s a.nd Oth er Inputs (con tin ued)
Mortality rates were based on 2010 Pub General Healthy Retiree with 100% of MP Ultimate scale for retirees and 2010 Pub Gen eral Disabled Retiree with 100% of MP illt imate scale for disabled part icipants.
The actuarial assumptions used in the J anuary 1, 2020, valuation were based on t he results of an actuarial experience study for the period J anuary 1, 2019 to December 31, 2019.
Changes in the Total OPEB Liability
The following table shows the changes in the City's total OPEB liability:
Total O PEB Liability as of January 1. 2019
Changes for the Year:
Service Cost
Interest on Total OPEB Liability
Effect of Economic/Demographic Gains/Losses
Changes in Assumptions 01.· Othel' Inputs
Expected Benefit Payments Net Changes
Total OPEB Liability as of January 1. 2020
Total
OPEB
Liability
$ 156,530
$
4,716
8.233
37,530 (49,382)
1,097 157,627
S en sitivity- of th e Total OPEB Liability to Changes in the Discount Rate
The following table presents the total OPEB liability of the City, calculated using the discount r a te of 2.21 %, as well as what the City's total OPEB liability would be if i t were calcula ted using a discount rate that is 1.00% lower (1.21%) or 1.00% higher (3.21%) t han the current rate:
1.00% Discmm t 1.00%
Decrease Ra te Increase (1.2 L¾) (2.21%) (3.21%)
Total OPEB Liability at January 1, 2020 $ 160,031 $ 157,627 $ 155,305
-99-

City of Orem Notes to the Financial Statements
June 30, 2020
5. Other Information (continued)
E. Other Postemployment Benefits (continued)
Sensitivity of the Total OPEB Liability to Changes in the Healthcru·e Cost Trend Rates
The following table presents the total OPEB liability of the City, calculated using the cunent healthcare cost trend rates, as well as what the City's total OPEB liability would be if it were calculated using trend rates that are 1.00% lower or 1.00% higher than the cmTent rate:
Cmrent 1.00% Trend 1.00%
Decrease Rate Increase Total. OPEB Liability at January l. 2020 $ 156.088 $ 157,627 $ 159,189
OPEB Expense and Deferred Outflows of Resources and Deferred Inflows of Resources related to OPEB
For the year ended June 30, 2020, the City had OPEB expenses of $24,442. The following table details this total OPEB expense:
Description Service Cosl Interest on Total OPEB Liability
Effect of Plan Changes Recognition of Deferred Ouflows/lnflows of Resources'.
Recognition of Eco11omic/Demographic Gains/Losses Recognition of Assumption Changes or Inputs
Total
-iOO-
$
$
OPEB Expense
4,716
3,549 16, 177 24,442

City of Orem Notes to the Financial Statements
June 30, 2020
5. Other Information (continued)
E. Other Postemployment Benefits (continued)
OPEB Ex ense and Deferred Outflows of ResouTces and Deferred Inflows of Resources related to OPEB continued
At June 30, 2020, the City reported the following deferred outflows of1•esolu-ces or inflows of resomces Telated to OPEB:
OPEB Deferred Outflows / Inflows of Resources
Differences between expect.ed and actual experience
Changes in a,isu.mptions
Total OPEB Defoned Outflows/ Inflows C>f Resources
$
$
Defei-red
Outflows of
Re sou rues
Deferred
lnflo~-vs of
Resources
$ 4,684
21,35:3
$ 26.037
Amounts reported as deferred outflows of resources and deferred inflows of resources related to OPEB will be recognized in OPEB expense as follows:
Year Ended December 31, 2020 2021 2022 2023 2024
Thereafter
Net Deferred Outflows (Inflows)
of Resources $ 19,726
6,31 1
F. Segment Information for Enterprise Funds
The City has issued revenue bonds to finance certain improvements to its culina.I-y water dist1:ibution system, water reclamation plant, and storm sewer system. Because each of these activities is accounted for in separate funds and all of those funds are reported as major funds in the fund financial statements, segment disclosures herein are not required.
-101-

City of Orem Notes to the Financial Statements
June 30, 2020
5. Other Information (continued)
G. Redevelopment Agency of the City of Orem
The following Redevelopment Agency information is p1·esented as required by Utah State Code Section 17A·2·1217(3).
For the yea!' ended June 30, 2020, the following activity occurred in the City's Redevelopment Agency:
Tax Increment Collected From Othe r 'raxing Agencies For The Ptoject Area
Orem 85·01: Orem Tek Development Orem 85·02: Timpanogos Technological Cente1· Orem 85·03A University Parkway Development Orem 85·03B: Univel'Sity Patkway Developmeut
Orem 85·04: Economic Zone in Central Ornm Orem 87· lQ: Boye1· Project on Center and State Street
Orelll 90·08: 800 Nol'tb and State Street Economic Zone Orem CDA: University Place
Total
Outstanding Loans to Finance RDA Projects
Total Received
$ 451,231
146,760
249,111
339,822
124,533
223,787
262,144 969,915
$ 2,767,303
$
Orem City's Portion
237,624
85,691
130,681
178,251
65.411 117,511
50,532
145,955
$ 1,011,656
During the year ending June 30, 2020, the RDA expended monies in the categories below as follows:
Ecouomic Development
Capital Outlay Total
$
$
913,706
388,038 l ,.'301,744
The Redevelopment Agency did not pay tax increment funds to any taxing agencies for projects during the current fiscal year.
The Redevelopment Agency has one contractual arrangemen t in the Univer sity Place CDA area. The contract was entered into to help fund infrastructm·e improvements being made as part of an economic development p lan for the area. The agreement specifies that 90% of the propeTty taxes collected for t his prnject area a1·e to be remitted to the property owner, 5% to be held within the RDA for future improvements in the project area, and 5% to be paid to the city for administration costs. The agreement term is for twenty year s and ends in Fiscal Year 2038. The amount remitted to the property owner for the current fiscal year was $872,923.
-102-
REQUIRED SUPPLEMENTARY
INFORMATION
-103-

System
Noncontributory 8),'stem
As of December 31. 20 19
As of December 31. 2018
As of December 31. 2017
.\ s of December 31, 2016
A s of December 31, 2015
As of December 31, 2014
Contributorv System
As of December 31, 2019
As of December 3 J. 2018
Ais of December 31, 2017
As of December 31, 2016
As of December 31, 2015
As of Decembe1· 31. 2014
Public Safetv Svstem
As of December 31, 2019
As of December 31, 2018
As of December 31., 2017
As or December 31, 201G
As ofDecernber 31, 2015
As of December 3J, 20H
REQUIRED SUPPLEMENTARY INFORMATION
City of Orem Schedule of the Proportionate Share
of the Net Pension Liability
Utah Retirement Systems (URS)
Last Ten Fiscal Years 1
Proportion Proportionate
of the Share of the
Net Pension Net Pension
Liability/ Liability Covered
Asset (Asset) Payroll
l.1763291% $ 4, -133,430 $ 10,490,803
1.1710300% $ 8,623, l 41 $ 10,235,192
1.14801111% $ 5,()29,925 $ 9,994,622
1.1669202% $ 7,493,056 $ 10,377,805
1.1507910% $ G,fi Jl ,735 $ l0,141 ,076
l. 1640325% $ 5,054,508 $ 10.427,520
5.2 l66185% $ 341,879 $ 934,782
5.0759551% $ 2,059,837 $ 950,067
<1.5962283% $ 374,0 14 $ 932,647
4.2142704% $ 1,382,749 $ l,0 11, l68
2.3846854% $ l,G76,087 $ 1,016,082
1.970073 l % $ 568,255 $ 1,055,247
7.1030859% $ 3,527,392 $ :i,397,985
7.304-4 190'¾ $ 5,755,853 $ 3,474,822
7.409471 I% $ 3,580,282 $ 3,G,ta,056
7.8307470% $ 4,880.882 s 4, 11-1.120
7.6878583% $ 3,751.301 $ d,04!i,837
7.8553996% $ 3,106,282 $ 11,163,687
(continued on next page)
-104-
Proportionate Plan
Share of the Fiduciary
Net Pension Net Position
Liability <Asset) asa%of
as a% of its the Total
Covered Pension
Payroll Liability
42.3% 93.7%
84.2% 1)7.0%
50.3% 91.9%
72.2% 87.3%
64.2% 87.8%
48.5% 90.2%
36.6% 98.6%
:.ll6.8% 91.2%
40.1% 98.2%
136.7% 92.9%
165.0% 85.7%
53.9% 94.0%
103.8% 91.7%
165.6% 85.6%
98.3°A, 90.5%
118.6% 86.1%
92.8% 87.6%
74.6% 89.0%

System
Firefigb t.ers System
As of December 31, 2019
As ofDe.:embe 1· 31, 2018
As of'December 31, 2017
As ofDecembel' 3 I, 20)6
As ofDecembel' 3l. 2015
As of Dece mber 31. 201,1
Tigr 2 Public Emi;ilovees Svstem
As of December 31 . 2019
As of December 31. 2018
As of December 31, 2017
t\s of December 31, 2016
.\s of December 3 l , 2015
A~ of December 3 1.. :.!014
'1'1e.r l! Pubhr. Safety
and Firefighters Svstem
As of December 31, 2019
As of December 31. 2018
.'\s of December 3 I, 2017
As of December 31, 2016
As of December '.H , 2015
As of Decembe r :n. 2014
Total· As of December 3 J. 20 l9
Total· As of December 31. 2018
'I'otal - As of December 3 I. 2017
Total · As of December :H, 2016
Total· As of Deoornber 31. 2015
Total· r\s of December 31. 2014
REQUIRED
SUPPLEMENTARY INFORMATION
City of Orem Schedule of the Proportionate Share
of the Net Pension Liability
Utah Retirement Systems (URS)
Last Ten Fiscal Years 1
Proportion Proportionate
Proportionate
Share of the
Net Pension
of the Share of the Liability <Asset)
Net Pension Net Pension as a% of its
Liability I Liability Covered Covered
Asset <Asset) Payroll Payroll
3.8802995% $ (2,426,403) $ 3,191,512 ·76.0%
3.7318322% $ 1,508,227 $ 3,051,512 49.-1%
3.7993255% $ (852,323) $ 3,178,325 -26Jlo/o
3.8179852% $ 564,747 $ 3,300,053 17.1%
3.9201431 % $ 667,045 $ 3,306,160 20.2%
4. 126471:1% $ (45,1, 109) $ 3,468,618 ·13.1%
0,2,155577% $ 65.228 $ 3,,Jl3,09J J.6%
0.2706777% $ 115,925 $ 3,H:>1.8t9 3.7%
0.2959959% $ 26,097 $ 2,894.899 0.9%
0.3019157% $ :13,678 $ 2.1175,959 1.4%
0.2589627% $ (565) $ 1,673,317 0.0%
0.1982677% $ (Ci,008) $ 972,771 ·0.6%
1.6481079% $ 155,028 $ 2,716,402 5.7%
1.6322111% s 40,896 $ 2,183,063 l.9%
l.6337586% $ ( 18,904) s 1,724,051 ·1,1%
1.3680971'¼ $ ( I 1,876) $ l, 130,354 ·I.1%
1.2593445¾ $ (18,39!)) $ 749,142 ·2.5%
1.1227061 % $ ( 16,608) s ,1G11.,01,1 ·3.6%
$ 6.086,554 $ 24,144.575 25.2%
$ 18,103.879 $ 23,056,475 78.5%
$ 8,139,09) $ 22,367,600 36.4%
$ ] ,i,343,236 $ 22,409,459 64.0%
$ 12,587,204 $ 20,929,9[4 60.1%
$ 8,252,315 $ 20,551,857 4-0.2%
Plan
Fiduciary
Net Positiot:1
asa%of
the Total
Pension
Liabili~
105.8%
96.1%
102.3%
!)8.4%
98. 1%
101.3%
96.5%
90.8%
97.4%
95.1%
l0U.2%
103.5%
89.6%
95.6%
103.0%
103.6%
110.7%
120.5%
1 In acc01·dance with paragraph 8 t.a of GAS.B 68, t,he City will need to dJsclose a ten (10) yeru· history of their propottionate sha,-e of the Net Pension Liability or Asset in this schedule. However. Lb.is schedule will be populated prospectively.
-105-
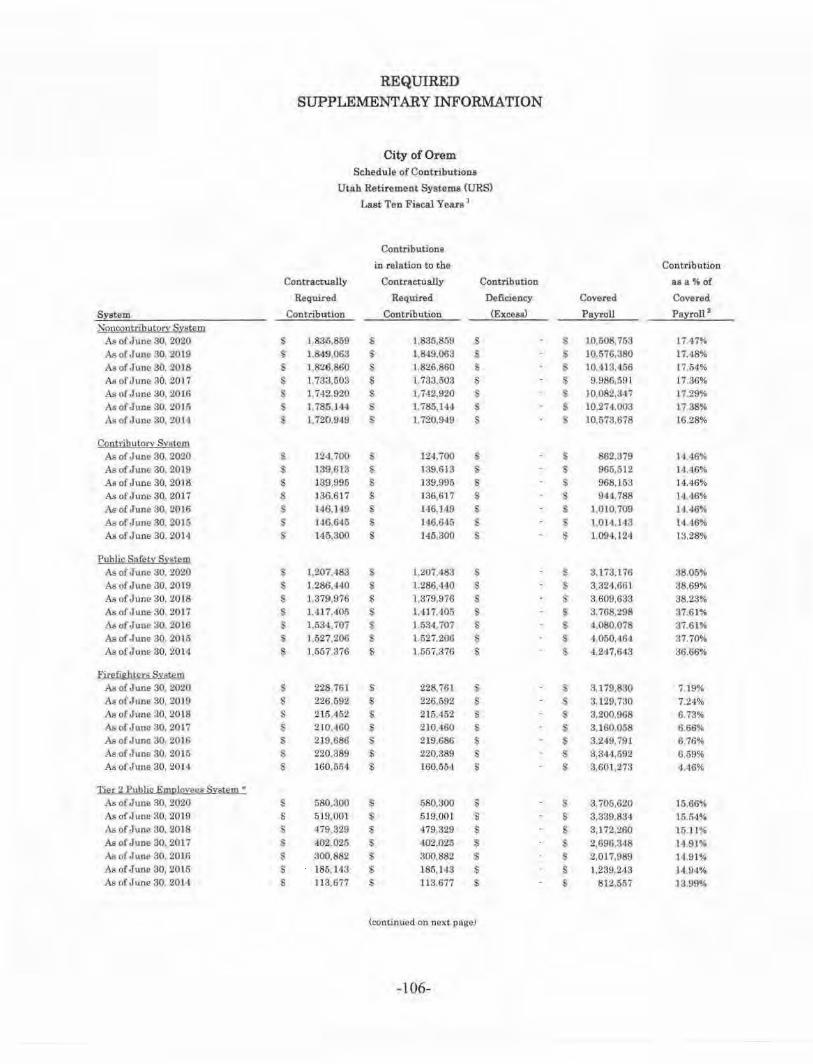
Si:::stem NQ!!QQlltci!lY!,Q!'.Y Sxstgw
Aa of June 30, 2020
As of June 30, 2019 As of June 30, 2018
As of June 30, 20l 7 As or June 30, 2016
As of June 30, 2016 As of June 30, 2014
ConttibutmJ! Sy§t2m As of June 30, 2020
As of June 30, 2019 As of Jnne 30, 2018
As of' June 30, 2017
AB of June 30 2016
As of June 30. 201& As of June 30 2014
Public. Sn[~tv Si:~l~lll As of June 30, 2020
As of June 30, 2019 As of June 30, 2018 As of June 30, 2017
As of June 30. 2016 As of June 30 2015
As of J11ne 30, 2014
F'irefieilii:r~ S,·stem AB of June 30, 2020
AB ,it June 30, 20J 9
As of June 30, 2018 A,, of June 30, 2017
As of June 30, 2016 As of June 30. 2015
As of June 30. 201•1
Tier i Public Em11l11:i:£e,, Svst~l!l • As of June 30, 202()
As of June ::lO, 2019
As of June 30. 2018 Aa of June 30. 2017
As of J "ne 30. 20Hi As of ,Tune 30, 2015
As o[ June 30, 201'1
REQUIRED SUPPLEMENTARY INFORMATION
City of Orem Schedule of ContributiOllS
Utah Retirement Systems (URS}
Last Teo Fiacal Years 1
ContributioM
in relation to the
Contracnially Contractually Contribution
Required Required Deficiency
Contribution Contribution (Excess)
s 1,835,859 s 1,835,859 s s 1 .849,063 s 1,849,063 s s 1 ,826,860 s 1.826,860 $
$ l, 733,503 $ l ,7$3.503 $ $ 1,742,920 $ 1,742.920 $
s 1,785,144 s 1,785.11<1 s s l.720.9 19 s 1,720,949 $
s 124,700 $ 124,700 s $ 139,6 13 $ 139,613 s s 139,995 s 139,995 $
$ 136,6 17 $ 136,617 $
s 146,149 s 146,149 s s 146,645 s I ~6,6 15 s
145,300 s 145,300 $
s 1,207 183 s l.:.!07.183 s s l ,286.•J40 s l.286,440 $
$ 1,379.976 $ 1,379,976 $ $ 1.41 'i.405 s 1,417,405 s s 1,534,707 s 1534.707 s s 1,527,206 s 1,527,206 $
$ 1,557,376 $ l ,li57,37ll $
s 228. 761 s 228,761 s $ 226,692 $ 226.692 s $ 215,45:l $ 215.452 s s 210,,160 s 210.460 s s 2 19,686 s 219.686 s $ 220,389 $ 220,389 $
$ Hi0,6M $ 160,55'1 s
s 580.30() $ 580,300 s $ 519,001 $ 519,001 $ $ l79,329 s 479,329 $
s -102.025 $ -102.025 s $ 300,882 s 300,882 s s 185.1'13 s 185.143 $
s 113,677 s 113,677 $
(cootint1ed on next p11geJ
-106-
Contribution
ae a% of
Covered Covered
Pa~oll Payroll 2
$ 10.508,763 17.47%
s 10,576,380 17.48%
s 10,413,456 17,54%
$ 9,986,5!)1 17.36%
$ 10,082,347 17.29'/o $ 10.27•1.003 17.38%
II 10,573,678 16.28%
s 862.379 14.46%
s 965,512 14.46%
$ 968, 153 14.46%
$ 941,788 14.46%
s 1.010, 709 11.46%
s 1,014,113 1,1.46%
$ 1,094,124 J:i.28%
$ 3,173,176 38.05%
s 3,324,(iG l 38.69% $ 3,609,633 38.23%
s 3,768,298 37.61%
s 4,080,Q78 37.61% $ 4,050,<164 37.70%
$ 4,2•17,643 <16.66%
s 3,179.830 7 19%
$ J, 129. 730 7.24% $ 3,200.968 6.73%
s 3.160,058 6.66%
s 3,249,791 6 76% $ 3,344,602 6,59%
s 3,601,27:J 4.46%
$ 3,705,620 15.66% $ 3.330,tl34 15.54%
s 3,172,260 15.11%
s 2,696,348 14.91% $ 2,0J 7,989 14.91% $ t.239,243 14.94% $ 812,557 1399%

REQUIRED SUPPLEMENTARY INFORMATION
City of Orem Schedule of Cont ribution s
Utah Retirement Systems (URS)
Last 'fen Fiscal Years 1
Con tributions
io relation to the
Contractually Contractually Coo tributioo
Required Required Deficiency
System Contribution Contdbution (Excess) Tier 2 Publi~ Sa:fet~ & Fir1ifight~rs Svst~m "
As of June 30, 2020 $ 658,136 s 658,136 $
As vf J1.t11e 30, 2019 $ 521,389 s 521,389 $
As of Jwie 30, 2018 $ 412,572 ~ 412,5i2 $
As or June 30, 2017 $ 275,9M $ 275,954 $
All of June 30, 2016 $ 156,487 $ 156,•187 $
A8 of June 30, 2015 s 103,4.9:l $ 103,493 $ A& of June 30, 2014 $ 70,564 $ 70,564 $
'l'isir 2 Pub!ic Em11IQY11e11 DC Onlv fo:stem • A$ of June 80, 2020 $ 65,955 $ 65,95ii ;li
AsofJ,rne 30, 2019 :I; '
51,752 $ 51.752 $
As of June 30, 2018 $ 42,785 $ 4.2 , 785 $
As of June 30 2017 $ 31,690 $ 31,690 $
As of June 30, 20Hi $ 27,955 $ 27,955 $
As of Jwie 30, 20 l5 $ 20,253 $ 20,263 s As of J w1a 30, 2014 $ 9,-492 $ 9, 192 s
Tier Z P11l!IJ&:. S,iJgty ,& £iritfigJ1tar DC OnJy System* ,\a of June 30, 2020 s 34,667 s 34,667 $
AsofJune30, 20H) $ 28,973 $ 28,973 s A.s of June 30. 2018 s 33,792 s 33,792 $
A.~ofJune30. 2017 :0 35,81,1 s 35,81•1 $
As of June 30, 2016 $ 34,387 s 34 337 $
As of June 30, 2015 s 20,091 s 20,094 $ As of Jwie 30, 2014 $ $ $
Total · As of June 30, 2020 $ 4,735,861 $ 4,735,861 $
'l'otal · As of June 30 :2019 $ t,6i2,823 $ 4,622,823 $ 'l'otnl · As of June 31l, 20 l8 $ ,),fi;J0,761 $ 4,530,761 $
Total · As of June 30, 2017 ,'Ii 1,243.<168 $ 4,243,-1-68 $ •rotal · AsoJ'June30 20 l6 $ 1, 16:3,123 $ 4,163,123 $ -Total · As of'June 30, 2015 $ t ,008,367 $ 4,008,367 $
Total - As or J "ne JO 2014 $ 3.777,912 $ 3,777,912 $
Contribution
as a% of
Covered Covered
P:!lro.11 Payroll"
$ 3,056,839 21.53% $ 2, 134,086 21.42% s 2,002.958 20.60% $ 1,415.167 19.50% i 867,688 18.04%
s 585.142 17.69% s 366.223 1!1.27%
$ 988,073 6.68% $ 773,571 6.69% $ 6:39,540 fi.69% $ -173,700 6.60% $ 417,869 6.69% -$ 300,-142 6.74% $ 170, Hl 5.57%
$ 317,640 10.91% $ 30!),371 9.37<rt $ 307,332 11.00¾ $ 272,236 13.16% s 260.874 1'.l.16% s 137,956 14.67% s 0.00%
s 25,792,310 18.36% $ 24,858.145 18.60% s 24,314,800 18.63% $ 22,717,186 18.68% $ 21,987,:140 18.93% $ 20,945,!)85 19.14% $ 20,865,939 JS.II¾
~ Contribution• i1n Tior 2 include an amorw,ation rote to help fund the unfunrl~d hsl)llities 1t1 the Tie,· I ~ysw111~. 1'1N' 2 systems w~re cn10Led effective ,J uly I , ~011
In 11ooordance with GASB 68 (paragraph 81.b), th!, C,ty w,11 need lo disclose a ten (10) ycur b!4toi,• 111 1,his-schedule. However, this ~¢heduJe will be populated prospectively
" Contrtbuuc,ns as a pereentag~ of cove,•ed payroll may be different than the Boar(! ce1tified rate due (o rounding or other u<,lmm1sL'Tat1ve i.ssue,; ..
-107-

REQUIRED SUPPLEMENTARY INFORMATION
City of Orem Schedule of Changes in
Total OPEB Liability & Related Ratios
Last Ten Fiscal Years 1
FY
Total OPEB Liability 2018
Se~·vice Cost $
Interest on Total OPEB Liability 7.070
Changes of Benefit Terms
Effect of Econom.icillemographic Gains or Losses
Changes in Assumptions or Other Inputs
Expected Bene.fit Payments (91.311)
Net Change in Total OPEB Liability (84,241)
Total OPEB Liability - Beginning $ 250,771
Total OPEB Liability - Ending $ 166,530
Covered-Employee Payroll NIA
Total OPE.B Liability us a % of Covered-~mployee Payroll NIA
1 In accordance with GASB 75, the City will need to disclose a ten (10) year history in this schedule. However. this ~chedule will be populated prospectively.
-108-
$
$
$
FY
2019
5,892
(15,892)
(10,000)
166,630
156,530
NIA
NIA
FY 2020
$
4. 716
8,233
37,530
(49,382)
1,097
$ 156,530
$ 157,627
NIA
NIA

NOTES TO REQUIRED
SUPPLEMENTARY INFORMATION
JUNE 30, 2020
Utah Retirement Systems Pensions
Changes in Assumptions
As a resulL of Lhe passage of SB 129, the retirement rates for members an the 'Pier 2 Pubhc Safety and Firefighter Hybtid Syatem have been modified to be the same as the a;;sumption used to model the retirement pattern in the Tier I Public Safety and ll'irefighter Systems, except for a IQ% load at first eligibility for unreduced retirement prior to age 65.
Other Post Employment Benefits (OPEB)
Cbaages in J.lt~sumptions
Healthcarn cu:st trend -rates were updaled from an anit,ial rate of 6. 1% sL'tlling down to 4.1% over 74 years to an initial rate of 4.1% scaling down to 8.7% over 5-1 years.
Mortality was updated from SOA RP·2014 White Collar Mortal ity with Scale MP-2017 to 2010 Pub General Healthy Retiree with 100% ofJ\.1P Ultimate scale for retirees and 2010 'Pub General Disabled Retiree with 100% of MP Ultimate scale for diFiabled part11::-ipants. 'Phe plan does not have enough credible data to develop a mortality assumption. As a l'e.sult, the plan must rely on p,ublicaUy available mortality tables. 'l'he Society of Actuaries published and recommends using both of Lhe tables now being used for this assumption.
'fhc discount rate was changed to 2.21 % .since tbil! 1s the discount rate that will be used to mea$ure the Total OPF.Il Liahilit.y for purposes of OASB 75.
-109-

(This page left blank intentionally)
-I I 0-

OTHER STATEMENTS
& SCHEDULES

Combining Financial Statements Nonmajor Governmental Funds
Capital Projects Funds
Capital projects funds are used to account for the acq wsition and construction of major capital facilities and equipment other than those financed by proprietary funds,
Capital Projects-Impact Fees Fund - This fund is used to account for the acquisition, constl'Uction, and/or improvement of major capital facilities of the City as part of funding provided by impact fees collected from developers.
Special Revenue Funds
Special revenue funds are used to account for specific revenues that are legally restricted to expenditU1·es for particular purposes.
CARE Tax Fund - This fund is used to account for the preparation and implementation of plans to improve, rehabilitate and/or develop cultural arts and recreation facilities within the City.
Telecommunication Billing Fund-This fund is used to account for billing activities related to the Utopia Infrastructure Agency (UIA) contract utility enhancement agreements.
Transportation Sales Tax Fund - This fund is used to account for revenues and expenditures related to permissible transportation needs such as streets, sidewalks, curb and gutters, traffic safety features, traffic signs and signals, street lighting, and trails for non-motorized vehicles connecting an origin with a destination.
Community Development & Rehabilitation Fund-This fund is used to account for a vaxiety of efforts to assist development. It is financed principally by federal entitlements from the U.S. Department of Housing and Urban Development, Community Development Block Grants. Grants and loans are made from this fund to assist housing rehabilitation, business development, and equipment and services that aid the indigent, handicapped, eldei-Iy, etc.
Friends of the Oi-em Public Library Fund - This fund is used to support various librnry and community oi-iented programs.
Orem Foundation Trust Fund-This fund is used to account for the financial transactions of the Orem Foundation Trust, an approved IRS Section 501(c)3 charitable organization. All funds received are used to support and enhance services and programs provided by the City.
Senior Citizens Fund - This fund is used to account for the financial transactions of those activities related to the Senior Citizen Friendship Center and its senior citizen patrons.
-1 11-

City of Orem Combining Balance Sheet
Nonmajor Governmental Funds June 30, 2020
Capital Project.s Funds Special Revenue Funds
Capital Projecta · Tele·
Impact Communication Transportation Fees CARE Tax Billing Sales Tax Fund Total Fund Fund Fund
ASSETS Cash and Cash Equivalent.s $ $ $ $ 29,670 $ Intergovernmental Receivables Notes Receivable Restricted Cash and Cash Equivalents:
Capital Improvement P1'0jects 2,637,793 2,637,793 3,) 12,541 l ,687,G03 Other P ut'Poses 1,868,969
Restricted Receivables: Capital Impl'Ovement Pl'oject.s Other Pu.rposes 414,927 348,442 379,406
Total Assets $ 2.637,793 $ 2,637,793 s 5,396,437 $ 378,112 $ 1,967,009
LIABILITIES Accounts Payable s $ $ 16,898 s 321,187 $ Customer Oepo$itll Accrued Liabilities 902 Unearned Revenues 15,090
Total Liabilities 16,898 336,277 902
DEFERRED INFLOWS OF RESOURCES Deferred Revenues · Prnpe1·ty Tru<es Defert'ed Revenues · Receivables
Total Deferred l nflows of Resources
FUND BALANCES Restricted:
Parks. Recteation, & Arts 2,266,998 25.250 Land Acquisit.ioo 10,0QO Fitness Center 3,009,625 Library Hall 25,669 Capital l mprnvemenis 2,637,793 2,G37,7!J3 67,247 1,940,857 Other Purposes
Assigned: Community Promotion Other Pu1'Poses 41,835
Total Fund Balances 2,637,793 2,637,793 5.379,539 41,835 1,966,107
Total Liabilities, Deferred Inflows of Resources, and Fund Balances $ 2,637,793 $ 2,637,793 $ 5,396,•137 $ 378, .112 $ 1,967,009
-112-

Special Revenue Funds
Community Friends 0£ Orem Development & the Orem Foundation Rehabilitation Public Library Trust
Fllnd F und F und
$ 33,589 $ l.30J $ 1.150 156,111 188,829
340,131
209,636 $ 928,296 $ 1,301 $ 1.150
$ 89.047 $ $
8.348
97,395
398,465 398,4(]5
432,436
1,301 1.150
432,436 1,301 1,150
$ 928,296 $ 1,30 1 $ 1.150
Senior Citizens
Fund
$ 297,811
$ 297,811
$
297,81 J
297.BU
$ 297,811
-113-
Total
$ 363,521 156,111 188,829
4,700,144. 2.209.100
1,352,411 $ 8,970,116
$ 427,13:.!
s
9,250 Hl.090
451,472
398,465 398,465
2,292,248 10,000
3,009,625 25,669
2,008.104 432,436
2,451 339,646
8,120,179
8,970, 116
$
$
$
$
Total Non.major
Governmental Funda
363.521 156,111 188,829
7,337,937 2,209,100
1..352,41 l 11,607,909
427,132
9,250 15,090
451.472
398,465 398.465
2,292,248 10,000
3,009,625
25,669 4,645.897
432.436
2,451 339,646
10,757,972
11.607,909

City of Orem Combining Statement of Revenues, Expenditures, and Changes in Fund Balances
Nonmajor Governmental Funds For The Year Ended June 30, 2020
Capital Projects Funds Special Revenue Fundir
Capital Projects· Tele·
Impact Communication Transportation Fees CARETax Billing Sales Tax Fund Total Fund .Fund Fund
REVENUES P1•operty Taxes s ~ $ $ $ Sales '!'axes 2,284,065 2,129,802 l ntergoverumental Charges for Services Impact Fees 753,507 753,507 Investment Earnings 55,961 55,951 76,455 29,584 11.914 Miscellaneous Revenues 1 ,238
'l'oial Revenue$ 809,458 809,458 2,360,520 80,822 2,141,716
EXPENDITURES Current:
Highways and Public hnprovements 13,546 Parks, Rec,·eation and Arts 993,165 Economic and Physical Development 59,4,13 59,443 27.220 Redevelopment
Debt Service: Principal Retirement Interest and Fiscal Charges
Capital Outlay 1,901,777 162,063 'l'otal Expenditures 59,,143 59,443 2,894,942 27,220 175,609
Excess (,Deficiency) of Revenues over (und~·) Expenditures Ui0,015 750.0 15 (534,422) 3,602 1,966, l07
OTHER FINANCING SOURCES (USES) Proceeds from Asset Disposals Transfer$ Out (34,316)
Total Other f'ina,1cing Sources and (lJsei;) (34,3 16)
Net Chang-e m Fund Balances 750,015 750,015 (568,738) 3.G02 1,966,107
Fund Balances· Dcginning 1,887,778 1,887.778 5,948,277 88,233
Fund Balances · Ending $ 2,637,793 s 2,637,793 $ 5,379,559 $ 41,835 $ l,966,107
-114-

Special Revenue Funds
Community Friends of Orem Total Development & the Orem Foundation Senior Nonmajor Rehabilitation Public Library Truat Citizens Gover.nmental
Fund Fund Fund .Fund Total Funds
$ $ $ $ s s 4,413,867 4,418,867
972,038 972,088 972,038 39,913 13.675 53,588 53,588
753,507 4,5!)8 58 5.654 l28,263 184,214
320 163,650 13,823 169,031 169,031 1,016,549 378 153,650 33,152 5,736,787 6,546,245
13,5•16 13,54.6 1,429 11,909 1,006,503 1,006,503
341)29 ::!68,949 428,392
75,000 76,000 75,000 12,452 12,452 12,452
399,092 2,462,932 2,462,932 828,273 1.429 11,909 3,939,382 3,998,825
188,276 U,051) .153,650 21,24-3 1.797,405 2,547,420
10,000 10,00() 10,000 (161.4111) (154-,442) (350,239) (350,230) (151,481) (154,442) (340,239) (340,.239)
36,795 (1,051) (792) 21,243 1,457, 166 2,207, 181
395,641 2,352 1.942 276,668 6,663,013 8,550,791
$ 432,436 $ 1,301 $ 1,150 s 297,811 $ 8,120,179 s l0,757,972
-1 15-

GOVERNMENTAL FUNDS SCHEDULES OF REVENUES, EXPENDITURES
AND CHANGES IN FUND BALANCE -BUDGET AND ACTUAL
DEBT SERVICE FUNDS DEBT SERVICE FUND
CAPITAL PROJECTS FUNDS CAPITAL PROJECTS FUND
CAPITAL PROJECTS-2019 G.O. BOND FUND CAPITAL PROJECTS-IMPACT FEES FUND
SPECIAL REVENUE FUNDS CARE TAX FUND
TELECOl\flv.lUNICATION BILLING FUND TRANSPORTATION SALES TAX FUND
COMMUNITY DEVELOPMENT & REHABILITATION FUND FRIENDS OF THE OREM PUBLIC LIBRARY FUND
OREM FOUNDATION TRUST FUND SENIOR CITIZENS FUND
-116-

City of Orem Debt Service - Debt Service Fund
Schedule of Revenues, Expenditures and Changes in Fund Balances - Budget and Actual For The Year Ended June 30, 2020
Budgeted Am.01,liltS Actual Variance with
Original Final Amounts Final Budget
REVENUES Property Taxes $ 1,578,201 $ 1,578,201 $ 1,578, 201 $
Special Assessments 25,075 25,075 (25.075)
Investment Earnings 44,973 44,973
Total Revenues 1,603,276 1,603,276 1.623, 174 19,898
EXPENDITURES Debt Service:
Principal Retirement 1,337,961 1,452,961 1.452,961
Interest and Fiscal Charges 3,901,312 4,928,381 4,922,825 5.556
Capital Lease Payments - P rincipal 435,000 435,000 435.000
Capital Lease Payments - Interest 117.354 117,354 117,353 1
Total Expenditmes 5,791.627 6,933,696 6,928, 139 5,557
Excess (Deficiency) of Revenues over (under ) Expenditures (4, 188,351) (5,330,420) (5,304,965) 25,455
OTHER FINANCING SOURCES (USES)
Transfers In 4,188,351 4,188,351 4.188.350 (1)
Transfers Out Tota l Other Financing Sources (Uses) 4,188,351 4, 188,351 4,188,350 (1)
Net Change in Fund Balance (1, 142,069) (1,116,6 15) 25,454
Fund Balance - Beginning 3,878,330 3,878,330 3,878,330
Fund Balance · Ending $ 3,878,330 $ 2,736,261 $ 2,761,715 $ 25,454
-11 7-

City of Orem Capital Projects · Capital Projects Fund
Schedule of Revenues, Expenditures and Changes in Fund Balances· Budget and Actual For The Year Ended June 30, 2020
Budgeted Amounts Actual Variance with
Original Final Amounts Final Budget
REVENUES Intergovernmental $ $ 1,406,087 $ 74,148 $ (1,331,939)
Miscellaneous Revenues 275,000 527,292 710,650 183,358
Total Revenues 275,000 1,933,379 784,798 (1,148,581)
EXPENDITURES Current:
Capital Outlay 231,385 21,827,332 4,081,094 17,746,238
Economic and Physical Development 10,000 926,149 33,171 892,978
Total Expenditures 241,385 22,753,481 4,114,265 18,639,216
Excess (Deficiency) of Revenues over (under) Expenditm·es 33,615 (20,820, 102) (3.329,467) 17,490,635
OTHER FINANCING SOURCES (USES)
Proceeds from Asset Disposals 233,990 233,990
Transfers In 5,283,681 5,283,681
Transfers Out. (33,615) (33,615) (33,615)
Total Other Financing Sources (Uses) (33,615) 5, 250,066 5,484,056 233,990
Net Change in Fund Balance (15,570,036) 2,154,589 17,724,625
Fund Balance · Beginning 16,015,349 16,015,349 16,015,349
Fund Balance · Ending $ 16,015,349 $ 445,313 $ 18, 169,938 $ 17.724,625
-118-

City of Orem Capital Projects-2019 G.O. Bonds· Capital Projects Fund
Schedule of Revenues, Expenditures and Changes in Fund Balances · Budget and Actual For The Year Ended June 30, 2020
Budgeted Amounts Actual Variance with
Original Final Amounts Final Budget
REVENUES Investment Ea1·uings $ $ 472.100 $ 403,948 (68,152)
Total Revenues 472,100 403,948 (68,152)
EXPENDITURES Current:
Capital Outlay 25,829,272 14,904,137 10,925, 135
Total Expenditures 25.829,272 14,904,137 10,925,135
Excess (Deficiency) of Revenues
over (under) Expenditures (25,357,172) (14,500.189) 10,856,983
OTHER FINANCING SOURCES (USES)
Transfers ln Transfers Out
Total Other Financing Sources (Uses)
Net Change in Fund Balance (25,357,172) (14.500,189) 10,856,983
Fund Balance · Beginning 25,466,642 25,466,642 25,466,642
Fund Balance· Endin:g $ 25,466,642 $ 109,470 $ 10,966,453 $ 10,856,983
-119-

City of Orem CapitalProjects·lmpact Fees· Capital Projects Fund
Schedule of Revenues, Expenditures and Changes in Fund Balances · Budget and Actual For The Year Ended June 30, 2020
Budgeted Amounts Actual Variance with
Original Final Amounts Final Budget
REVENUES Impact Fees $ 535,000 $ 535,000 $ 753,507 218.507
Investment Eal'nings 55,951 55,951
Total Revenues 535,000 535,000 809,458 274,458
EXPENDITURES Current:
Capital Outlay 535,000 551,218 551,218
Economic and Physical Development 59,443 59,443
Total Ex-penditw·es 535,000 610,661 59,443 551,218
Excess (Deficiency) of Revenues over (under) Expenditures (75,661) 750,015 825,676
OTHER FINANCING SOURCES (USES) 'l'ransfers In Transfers Out
Total Othe,r Financing Sources (Uses) Net Change in F ttnd Balance (75,661) 750,015 825,676
Fund Balance · Beginning 1,887,778 1,887,778 1,887,778
Fund Balance · Ending $ 1.887,778 $ 1,812,117 $ 2,637,793 $ 825,676
-120-

City of Orem CARE Tax · Special Revenue Fund
Schedule of Revenues, Expenditures and Changes in Fund Balances · Budget and Actual For The Year Ended June 30, 2020
Budgeted Amounts Actual Variance with
Original Final Amounts Final Budget
REVENUES Sales Taxes $ 2,235,000 $ 2,235,000 $ 2,284,065 $ 49,065
Investment Earnings 65,000 65,000 76,455 11,455
Total Revenues 2,300,000 2,800,000 2,360,520 60,520
EXPENDITURES Current:
Arts and Recreation Development 2,264,976 1,052,674 993,165 59.509
Capital Outlay 5,014,318 1,901,777 3,112,541
Total Expenditures 2,264,976 6,066,992 2,894,942 3,172,050
Excess (Deficiency) of Revenues over (under) ExpenditU1·es 35,024 (3,766,992) (534,422) 3,232,570
OTHER FINANCING SOURCES (USES) Transfers In Transfers Out (35,024) (34,316) (34,316)
Total Other Financing Sources (Uses) (35,024) (34,316) (34,316)
Net Change in Fund Balance (3,801,308) (568,738) 3,232,570
Fund Balance · Beginning 5,948,277 5,948,277 5,948,277
Fund Balance • Ending $ 5,948,277 $ 2,146,969 $ 5,379,539 $ 3,232,570
-121-

City of Orem Telecommunication Billing Fund· Special Revenue Fund
Schedule· of Revenues, Expenditures and Changes in Fund Balances· Budget and Actual For The Year Ended June 30, 2020
Budgeted Amounts Actual
Original Final Amounts
REVENUES Investment Earnings $ 51,000 $ 51,000 $ 29,584 $
Miscellaneous Revenues 4,000 4,000 1,238
Total Revenues 55,000 55,000 30 ,822
EXPENDITURES Current:
Miscellaneous Expenditures 55,000 56,000 27,220
Total Expenditures 56,000 55,000 27,220
Excess (Deficiency) of Revenues
over (under) E>epeoditures 3,602
OTHER FINANClNG SOURCES (USES) Transfer$ In
Transfers Out 'l'otal Other F inancing Sources (Uses)
Net Change in Fund Balance 3,602
l<'und Bala nce - Beginning 38,233 38,233 38,233
Variance with Final Budget
(21,416) (2,762)
(24, 178)
27,780 27,780
3,602
3,602
Fund Balance · Ending $ 38,233 $ 38,233 $ 41,835 $ 3,602
-122-
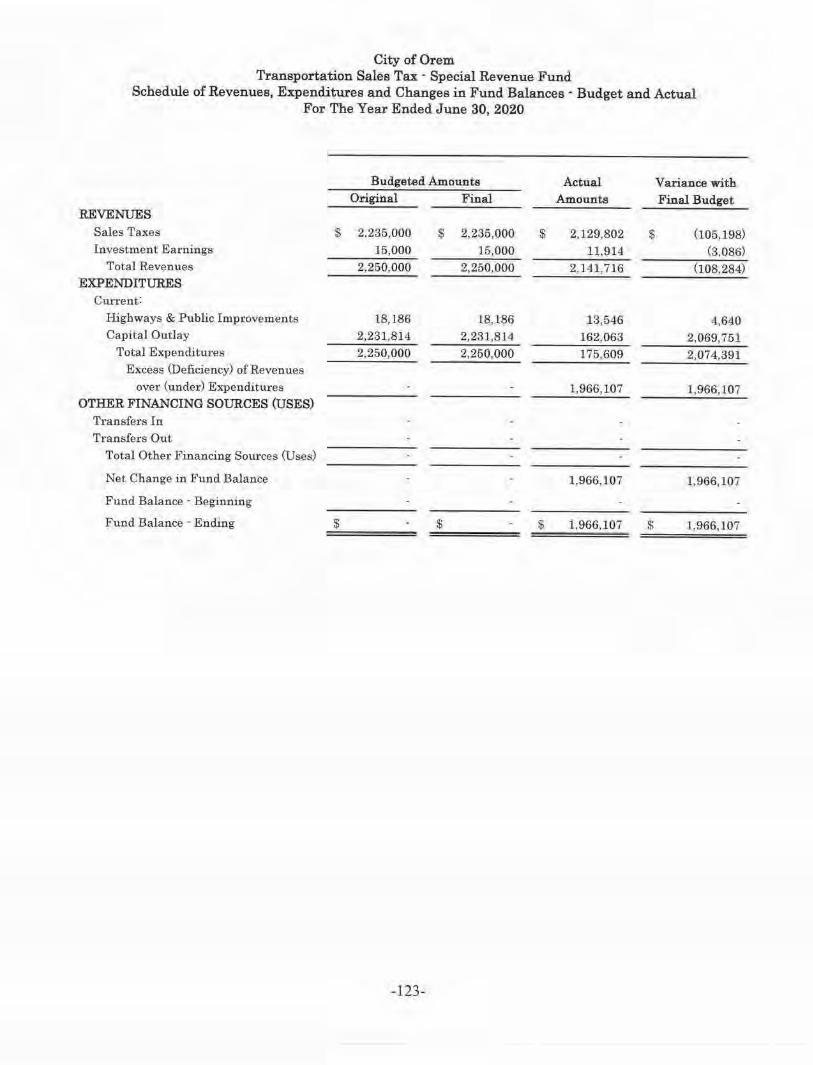
City of Orem Transportation Sales Tax · Special Revenue Fund
Schedule of Revenues, Expenditures and Changes in Fund Balances · Budget and Actual For The Year Ended June 30, 2020
Budgeted Amounts Actual Variance with Original Final Amounts Final Budget
REVENUES
Sales Taxes $ 2,235,000 $ 2,235,000 $ 2,129,802 $ (105,198) Investment Earnings 15,000 15,000 11,914 (3,086)
Total Revenues 2,250,000 2,250,000 2, 141,716 (108,284) EXPENDITURES
Cm·rent: Highways & Public Improvements 18,186 18,186 13,546 4,640 Capital Outlay 2,231,814 2,231,814 162,063 2 ,069,751
Total Expenditures 2,250,000 2,250,000 175,609 2,074,391 Excess (Deficiency) of Revenues
over (under) ExpenditlU'es J ,966,107 1,966,107 OTHER FINANCING SOURCES (USES)
Transfers In Transfers Out
Total Other Financing Sources (Uses)
Net Change in Fund Balance 1,966, 107 1,966,107
Fund Balance · Beginning
Fund Balance · Ending $ $ $ 1,966,107 $ 1.966,107
-123-

City of Orem Community Development and Rehabilitation - Special Revenue Fund
Schedule of Revenues, Expenditures and Changes in Fund Balances • Budget and Actual For The Year Ended June 30, 2020
Budgeted Amounts Actual Variance with Original Final Amounts Final Budget
REVENUES Intergovernmental $ 779,120 $ 908,253 $ 972,038 $ 63,785 Charges for Services 165,000 179)750 39,913 (139,837) Investment Earnings 2,000 2,000 4,598 2,598
Total Revenues 946, 120 1,090,003 1,016,549 (73,454) EXPENDITURES
Current:
Economic and Physical Development 450,079 485,344 341,729 143,615 Capital Outlay 200,000 636,704 399,092 237,612
Debt Ser vice:
Pl'incipal Retirement 75,000 75,000 75,000 Interest and Fiscal Charges 30,057 12,452 12,452
Total Expenditures 755,136 1,209,500 828,273 381,227 Excess (Deficiency) of Revenues
over (under) Expenditures 190,984 ( 119.497) 188,276 307,773 OTHER F INANCING SOURCES (USES)
Proceeds from Asset Disposals 10,000 10,000 Transfers !rt
Transfers Out (190,984) (190,984) (161,481) 29,503 Total Other Financing Sources (Uses) (190,984) (190,984) (151,481) 39,503
Net Change in Fund Balance (310,481) 36,795 347,276
Fund Balance - Beginning 396,641 395,641 395,641
Fund Balance - Ending $ 395,641 $ 85,160 $ 432,436 $ 347,276
-124-
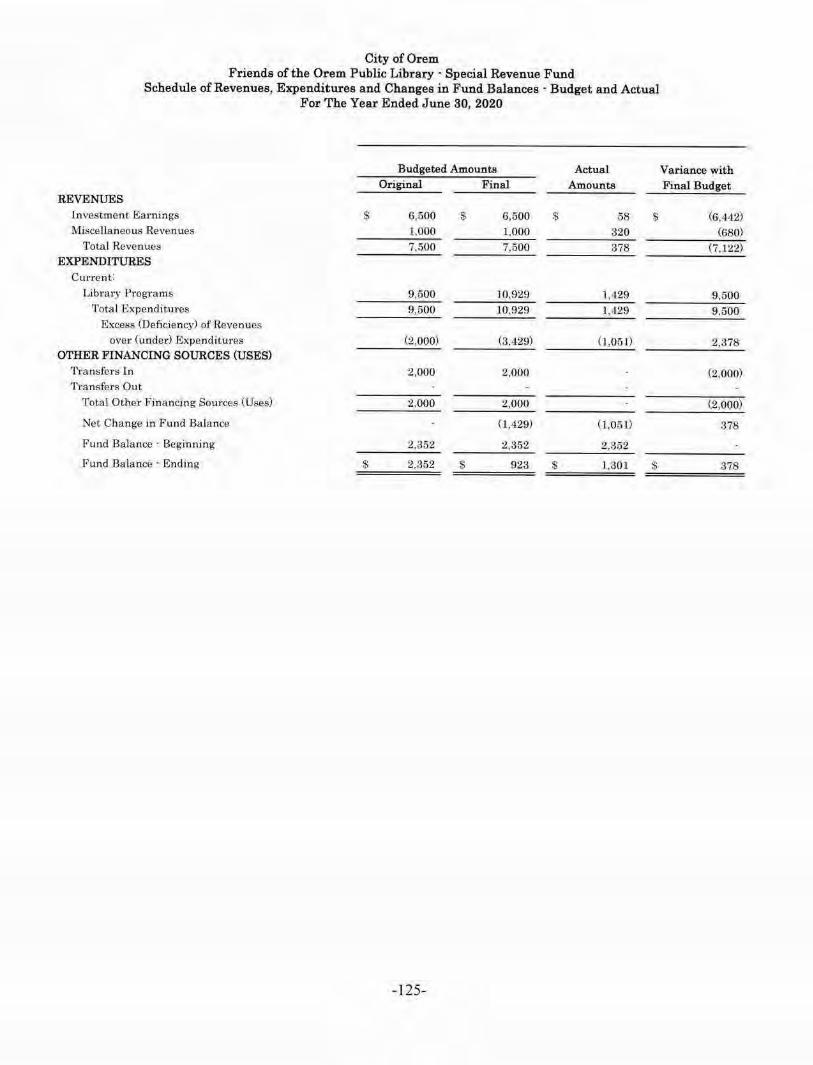
City of Orem Friends of the Orem Public Library · Special Revenue Fund
Schedule of Revenues, Expenditures and Changes in Fund Balances· Budget and Actual For The Year Ended June 30, 2020
Budgeted Amounts Actual Variance· with Original Final Amounts Final Budget
REVENUES Investment Earnings $ 6,500 $ G,500 $ 58 $ (6 ,442) Miscellaneous Revenues l ,000 1,000 320 (680)
Total Revenues 7.500 7,500 a 78 (7. l 22) EXPENDITURES
Current:
Library Programs 9,500 10,929 1,429 9 ,500 'l'ota l Expendituro15 9,500 10,929 1,429 9,500
Excess (Deficiency) of Revenues over (under) Expenditures {2,000) (3.429) (1,0 51) 2,378
OTHER FINANCING SOURCES (USES) 'l'ra nsfers ln 2,000 2,000 (2,000) Transfers Out
'l'ota l Other Fina ncing Sources (Uses) 2,000 2,000 (2,000)
Net Change in Fund Balance (1 ,429) (1,050 378
Fund Balance · Beginning 2,352 2,352 2 ,352
Fund Ba la nce - Ending $ 2,352 $ 923 $ 1,301 $ 378
-125-

City of Orem Orem Foundation Trust - Special Revenue Fund
Schedule of Revenues, Expenditures and Changes in Fund Balances - Budget and Actual For The Year Ended June 30, 2020
Budgeted A.mounts Actual Original Final Amounts
REVENUES Miscellaneous Revenues $ 22,000 $ 172,200 $ 153.650 $
Total Revenues 22,000 172,200 153,650 EXPENDITURES
Curre nt:
City Programs
Total F,xpenditures Excess (Deficiency) of Revenues
over (under) Expenditures- 22,000 172,200 153,650 OTHER FINANCING SOURCES (USES)
Transfers ln
Transfers Oul- (22,000) (172,200) (]5,J,,142)
Total Other F inancing Sources (Uses) (22,000) (172,200) (15,J,442)
Net Change in Fund Balance (792)
.l<'und Balance - Beginning 1,942 1,942 1,942
Fund Balance - E nding $ 1,94,2 $ 1,942 $ 1,150 $
-126-
Variance with Final Budget
(18,550) (18,550)
( 18,550)
17.758 17.758
(792)
(792)

City of Orem Senior Citizens · Special Revenue Fund
Schedule of Revenues, Expenditures and Changes in Fund Balances · Budget and Actual For The Year Ended June 30, 2020
Budgeted Amounts Actual Original Final Amounts
REVENUES Charges for Services $ 2-5,600 $ 26,600 $ 13,675 $
Investment Earnings 1,800 1,800 5,654 M_iscellaneous Revenues 22,100 22,100 13,823
Total Revenues 49,500 50,500 33,152 EXPENDITURES
Current :
Dances 8,900 8, 512 2,556 Tours 20,000 20,000 3,876 Miscella neous Expenditures 20,600 21,988 5,477
Total Expenditures 49,500 50,500 11,909 Excess (Deficiency) of Revenues
over (under) Expenditu .. es 21,211,3 OTHER FINANCING SOURCES (USES)
Transfers ln Transfers Out
Total Other Financing Sources (Uses)
Net Change i11 Fund n a lance 2 1.,243
Fund Balance · Beginning 276,568 276,5{:i8 276,568
Fund Balance · Ending $ 276,568 $ 276,568 $ 297,81 l $
-127-
Variance with Final Budget
( 12,925)
3,854 (8,277)
(17,348)
5,956 16,124
16,511
38,591
21,243
21,243
21,243

(This page left blank intentionally)
-128-

Combining Financial Statements Nonmajor Proprietary Funds
Recreation Fund - This fund is to account for the services provided by the City's Fitness Center. The Fitness Center complex includes an indoor swimming pool, indoor track, basketball court, handball courts, racquetball courts, an outdoor swimming pooVwater park (Scera Park), and other facilities. A variety of classes and open play are made available to residents and non-residents on a fee basis.
Solid Waste Fund - This fund is to account for the collection of 1·esidential garbage within the City. Residential garbage collection services are provided by a private contractor through a cont1·act with the City. Businesses and commercial concerns within the City are not serviced, but may contract with private firms for these same services.
Street Lighting Fund - This fund is to account for providing the residents and businesses of the City with a new street lighting system. Lease Revenue Bonds were issued to cover the purchase and installation of the system. Payment and costs of these bonds a1·e not accounted for here, but are in the Debt Service Fund.
-129-

City of Orem Combining Statement of Net Position
Nonmajor Proprietary Funds June 30, 2020
Recreation Recreation Fund Fund
Current Year Prior Year ASSETS
Current Assets: Cash and Cash Equivalents $ 988,172 $ 982,333 Accounts Receivable (Net of
Allowance for Doubtful Accounts) 500 19,458 Total Current Assets 988.672 1,001.791
Noncurren t Assets: Capital Assets:
Land 39,822 39,822 Buildings a nd Systems 4,125,955 4,125,955 Improvements other than Buildings. 1,911,903 1,911,903 Machinery and E quipment 5,780 5,780 Infrastructure Constr uction in Progress
Less Accumulated Depreciation (5,597,909) (5,486,447) Total Capital Assets (Net of
Accumulated Depreciation) 485,551 597,013 Total Noncurrent Assets 485,551 597,013
Total Assets 1,474,223 1,598,804
DEFERRED OUTFLOWS OF RESOURCES Pensions 84,100 164,577
Total Deferred Outflows of Resources 84,100 164,577
Total Assets & Deferred Outflows of Resources $ 1.558,323 $ 1,763,381
LIABILITIES Current Liabilites:
Accounts Payable $ 28,760 $ 47,893 Accrued Liabilities 64,674 99,600 Accrued Vacation Leave 30,246 22,487 Unearned Revenues 87,696 346,943
Total Curren t Liabilites 211,376 516,923 Noncurren t Liabilities:
Accrued Vacation Leave 1,592 1,184 Net Pension Liability 109,685 231.744
Total Noncun-ent Liabilities 111,277 232,928 Total Liabilities 322,653 749,851
DEFERRED INFLOWS OF RESOURCES Pensions 60,604 15,414
Total Deferred Inflows of Resources 60,604 15.414
NET POSITION Net Investment in Capital Assets 485,551 697,013 Um estricted 689,515 401, 103
Total Net Position 1,175,066 998,116
Total Lia bilities, Deferred Inflows of Resou1·ces, & Net Position $ 1,558,323 $ l ,'763,381
-130-
Solid Waste Solid Waste Fund Fund
Current Year Prior Year
$ 902,484 $ 1.109,613
457,004 445,523 1,359,488 1.555,136
1,359,488 1,555,136
$ 1.359,488 $ 1,555,136
$ 311,360 $ 276,466
311,360 276,466
311,360 276,466
1,048,128 1,278,670 1,048, 128 1,278,670
$ 1,359,488 $ 1,555,136

Total Total Nonmajor Nonmajor
Street Lighting Street Lighting Proprietary Proprietary Fund Fund Funds Funds
Current Year Prior Year Current Year Prior Year
$ 2,191.347 $ 1.630, 175 $ 4,082,003 $ 3,722,121
85,533 92,094 543,037 557,075 2,276,880 1,722,269 4,625,040 4,279,196
39,822 39,822 4,125,955 4, 125,955 1,911,903 1,911,903
156,427 121,733 162,207 127,513 2,902,951 2,517,096 2,902,951 2,517,096
3,599 3,599 (647,234) (544,848) (6,245,143) (6,031,295)
2,415,743 2,093,981 2,901,294 2,690,994 2,415,743 2,093,981 2,901,294 2,690,994
4,692,623 3,816,250 7,526,334 6,970, 190
17,851 27,499 101,951 192,076 17,851 27,499 101,951 192, 076
$ 4,710,474 $ 3,843,749 $ 7,628,285 $ 7,162,266
$ 1,264 $ 11,226 $ 341,384 $ 335,585 7,517 7,997 72,191 107,597
12,612 11,681 42,858 34,168 87,696 346,943
21,393 30,904 544,129 824,293
663 615 2,255 1.799 23,280 38,721 132,965 270,465 23,943 39,336 135,220 272,264 45,336 70,240 679,349 1,096,557
12,864 2,576 73,468 17,990 12,864 2,576 73,468 17,990
2,415,743 2,093,981 2,901,294 2,690,994 2,236,531 1,676!952 3,974,174 3,356,725 4,652,274 3,770, 933 6,875,468 6,047,719
$ 4,710,474 $ 3.843,749 $ 7,628,285 $ 7,162,266
-131-
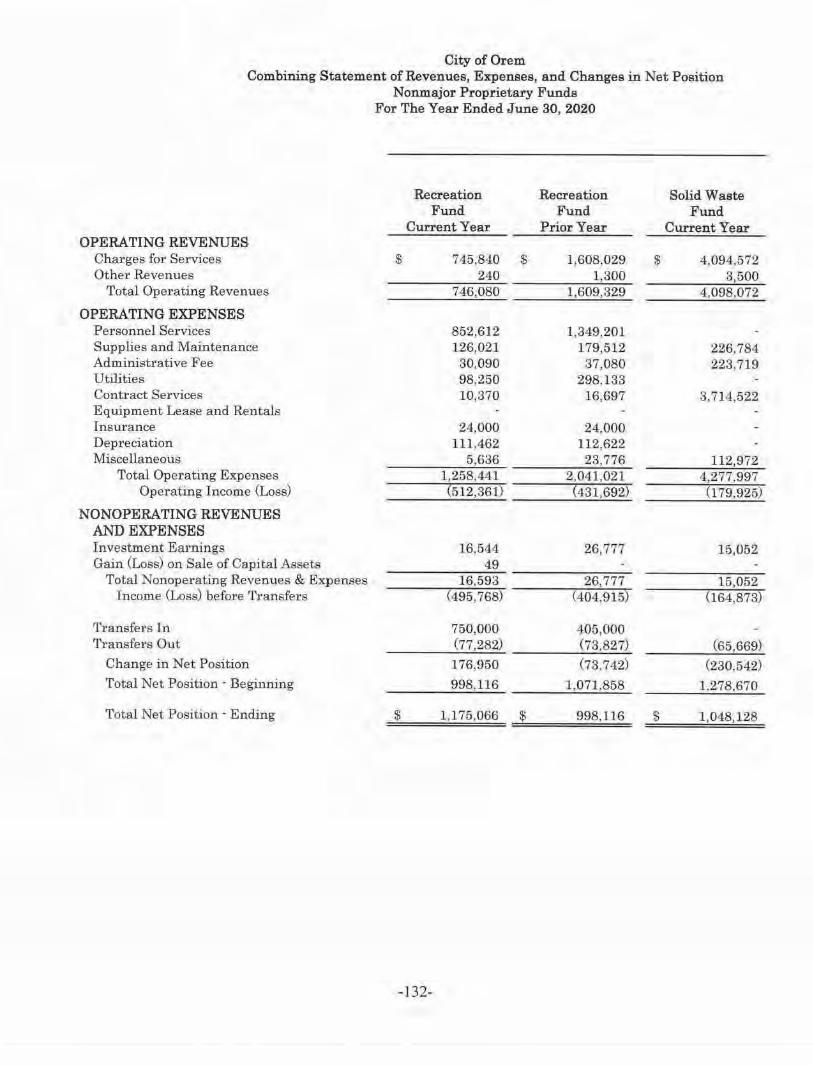
City of Orem Combining Statement of Revenues, Expenses, and Changes in Net Position
Non.major Proprietary Funds For The Year Ended June 30, 2020
Recreation Recreation Solid Waste Fund Fund Fund
Current Year Prior Year Current Year OPERATING REVENUES
Charges for Services $ 745,840 $ 1,608,029 $ 4,094,572 Other Revenues 240 1,300 3,500
Total Operating Revenues 746,080 1,609,329 4,098,072
OPERATING EXPENSES Personnel Services 852,612 1,349.201 Supplies and Maintenance 126,021 179,512 226,784 Administrative Fee 30,090 37,080 223,719 Utilities 98,250 298 ,133 Contract Services 10,370 16,697 3,714,522 Equipment Lease and Rentals Insurance 24,000 24.000 Dep1·eciation 111,462 112,622 Miscellaneous 5,636 23,776 112,972
Total Operating Expenses 1,258,441 2,041,021 4,277,997 Operating Income (Loss) (512,361) (431,692) (179,925)
N ONOPERATING REVENUES AND EXPENSES Investment Eru·nings 16,544 26,777 15,052 Gain. (Loss) on Sale of Capital Assets 49
Total Nonoperating Revenues & Expenses 16,593 26,777 15,052 Income (Loss) befo1·e Transfers (495,768) (404,915) (164.873)
Transfers In 750,000 405,000 Transfers Out (77,282) (73,827) (65,669)
Change in Net Posjtion 176,950 (73,742) (230.542) Total Net Position - Beginning 998,116 1,071,858 1,278,670
Total Net Position - Ending $ 1,175,066 $ 998,116 $ 1,048,128
-132-

Total Total Nonmajor Nonmajor
Solid Waste Street Lighting Street Ligh ting Proprietary Proprietary Fund Fund Fund Funds Funds
Prior Year Curren t Year Prior Year Current Year Prior Year
$ 3,845,141 $ 856,624 $ 925,100 $ 5,697,036 $ 6,378,270 57,668 289,610 61,408 290,910
3,845,141 914,292 1,214,710 5,758,444 6,669,180
168,719 163,436 1,021,331 1,512,637 148,817 41,733 43,914 394,538 372,243 219,717 72,285 67,599 326,094 324,396
125,539 133,234 223,789 431,367 3,292,402 45 100 3,724,937 3,309,199
1,230 780 1,230 780 3,000 2,500 27.000 26,500
67,692 60,065 179,154 172,687 103,923 1,344 2,814 119,952 130,513
3,764,859 481,587 474,442 6,018,025 6,280,322 80,282 432.705 740,268 (259.581) 388,858
21,507 41,979 35,764 73,575 84,048 49
21,507 41,979 35,764 73,624 84,048 101,789 474,684 776,032 (185,957) 472,906
775,000 775,000 1,525,000 1,180,000 (58,130) (368,343) (370,393) (511,294) (502,350)
43,659 881,341 1,180,639 827,749 1,150,556 1,235,011 3,770,933 2,590,294 6,047,719 4,897,163
$ 1,278,670 $ 4,652,274 $ 3.770,933 $ 6,875,468 $ 6,047,719
-133-

City of Orem Combining Statement of Cash Flows
Non.major Propretary Funds For The Year Ended June 30, 2020
Recreation Recreation Fund Fund
Current Year Prior Year CASH FLOWS FROM OPERATING
ACTMTIES Receipts from Customers and Users $ 766,038 $ 1,600,325 P ayments to S uppliers (544~151) (620,288) P ayments for Personnel (874,269) (1,352,121) Payments for Interfund Services Used (30,090) (37,080)
Net Cash Provided (Used) by Operating Activities (683,472) (409,164)
CASH FLOWS FROM NONCAPITAL FINANCING ACTIVITIES Transfers In 750,000 405,000 Transfers Out (77,282) (73,827)
Net Cash Provided (Used) by Noncapital Activities 672,718 331,173
CASH FLOWS FROM CAPITAL & RELATED FINANCING ACTIVITIES Acquisition of Capital Assets
N et Cash Provided (Used) by Capital and Related Financing Activities 49
CASH FLOW FROM INVESTING ACTIVITIES Investment Earnings 16.544 26,777
Net Cash Provided (Used) by Investing Activities 16,544 26,777
Net I ncrease <Decrease) in Cash and Cash Equivalents 5,839 (51,214)
Cash and Cash Equivalents · Beginning of Year 982,333 1,033,547
Cash and Cash Equivalents· End of Year $ 988,172 $ 982,333
Reconciliation of Operating Income <Loss) to Net Cash Provided (Used) by Operating Activities: Operating Income (Loss) $ (512,361) $ (431,692) Adjustmeuts to Reconcile Operating Income
to Net Cash Provided (Used) by Operating Activities: Depreciation Expense $ 111,462 $ 112,622 tlncrease) Decrease in Receivables 18.958 (9,004) (Increase) Decrease in Pension Assets 80,477 (4,980) Increase (Decrease) in Accounts Payable (19.133) 8,969 Increase (Decrease) in Accrued Liabilities (34,926) 13,972 Increase (Decrease) in Une:uned Revenue (259,247) (87,367) Increase (Decrease) in Accrued Vacation Leave 8, 167 (l0,401) Increase (Decrease) in Pension Liabilities (76,869) (1,283)
Total Adjustments Net Cash Provided ffised) by Operating
(171, 111) 22,528
Activities $ (683,472) $ (409,164)
-134-
Solid Waste Solid Waste Fund Fund
Current Year Prior Year
$ 4,086,591 $ 3,818,944 (4,019,384) (3,530,309)
(223,719) (219,717)
(156,512) 68,918
(65,669) (58,130)
(65,669) (58,130)
15,052 21,507
15,052 21,507
(207,129) 32,295
1,109,613 1,077,318 $ 902,484 $ 1,109,613
$ (J 79,925) $ 80,282
$ $ (11.481) (26,197)
34,894 14,833
23,413 (11,364)
$ (156,512) :s 68,918

Total Total Nonmajor Nonmajor
Street Lighting Street Lighting Proprietary Proprietary Fund Fund Funds Funds
Current Year Prior Year Current Year Prior Year
$ 920,853 $ 1,223,727 $ 5,772,482 $ 6,642,996 (182,853) (187,112) (4,746,388) (4,337,709) (163,725) (155,217) (1,037,994) (1,507,338)
(72,285) (67,599) (326,094) (324,396)
501,990 813,799 (337,994) 473,553
775,000 775,000 1,525,000 1,180,000 (368,343) (370,393) (511,294) (502,350)
406,657 404,607 1.013, 706 677,650
(389,454) (212,136) (389,454) (212. 136)
(389,454) (212, 136) (389,405) (212,136)
41,979 35,764 73,575 84,048
41,979 35,764 73,575 84,048
561.172 1,042,034 359,882 1.023, 115
1,630,175 588,141 3,722,121 2,699,006 $ 2, 191,347 $ 1,630,175 $ 4,082,003 $ 3,722, 121
$ 432,705 $ 740,268 ------- (259,581) 388,858
$ 67,692 $ 60,065 179,154 172,687 6,561 9,017 14,038 (26,184) 9,648 (7,163) 90,125 (12, 143)
(9,962) (3,770) 5,799 20,032 (480) 3,4,52 (35,406) 17,424
(259,247) (87,367) 979 2,290 9,146 (8,111)
(5,153) 9,640 (82,022) 8,357 69,285 73,531 (78,413) 84,695
$ 501,990 $ 813,799 $ (337,994) $ 473,553
-135-

Internal Service Funds
Inte1·nal service funds are used to account for the financing of goods or services provided by one department 01· agency to other departments or agencies of the government and to other government units, on a cost reimbm·sement basis.
Fleet Maintenance Fund - This fund accounts for the repair and maintenance of vehicles and equipment fOT all City operations. It is financed by charges made to other funds for use of its services. Supplies and materials are charged at cost to the specific fund. Personnel, administration and overhead costs are chai·ged on an estimated basis established at the beginning of each fiscal year.
Purchasing/Warehousing Fund - This fund accounts for the central purchasing and warehousing functions for the City. It provides the service to all governmental and proprietary funds. It is financed by chru·ges made to the other funds. Funds are charged for supplies and mate1'ials at cost. Personnel, administrative and overhead costs are charged on an estimated allocation basis established at the beginning of each fiscal year.
Self-Insurance Fund - This fund accounts for the costs of insurance premiums and claims made against the City. Monies are accumulated in this fund to pay premiums fot liability and property damage insurance and other claims. The City participates in the Utah Risk Management Mutual Association for its liability and prope1·ty damage insurance. Insurance for large vehicles and equipment is purchased from private insurers. The fund also accounts for the insurance benefits of employees (i.e., state unemployment insurance, worke1·s compensation insurance). The fund is financed by allocated charges made to the other funds for liability and property damage insurance. Charges for employee insurance benefits are made directly to each fund as a part of the pay1·oll system. See footnote 5.A. for additional information regarding this fund.
Information Technology Fund - This fund accounts for the technological needs of the City including, but not limited to, computers, servers, networks, telephone systems, cell phone services, software, internet services, and all maintenance needs related thereto. It provides these services to all governmental and proprietary funds. It is financed by charges made to the other funds. Funds arn ch arged for supplies and materials at cost. Personnel, administrative and overhead costs are charged on an estimated allocation basis established at the beginning of each fiscal year.
-136-

City of Orem Internal Service Funds
Combining Statement of Net Position June 30, 2020
Fleet Purchasing/ SeJf· Information Maintenance Warehousing ln.surance "Technology Total
.ASSETS Current Assets:
Cash and Cash EquivaJents $ 459,724 $ 94, 178 $ 2,874,653 $ l.340,020 $ 4,768,575 fnvent-0ries 341,494 341,494 Prepaids 30,116 30,116
Total Cunent Assets 459,724 435,672 2,874,653 1,370,136 5,140,185
Noncurrent Assets: Capital A5sets:
Buildings 150,000 150,000 Machinery and Equipment l96,584 ~9.442 201,000 437,026 Construction in Pl'Ogress 51,229 51,229
Less Aocumulated Depreeiation (156, 167) (104,123) (62, J 34) (322,424) Total Capital Assets (Net of
Accumulated Depreciation) 40.417 85,319 190,095 31.5,831 'rota) Noncurrent Assets 40,417 85,319 l!l0,0!)5 315,831
Total Assets 500,141 520,991 2,874,653 1,560,231 5,456,016
DEFERRED OUTFLOWS OF RESOURCES Pensions 64,306 45,789 19.005 289,932 419,032
TotaJ Deferred Outflows of Resources 64,306 45,789 19,005 289,932 419,032
'l'otal Assets & Defen-ed Outflows of Resom·ce.s $ 5G4,447 s 566,780 $ 2,893,658 $ 1,850,163 $ 5.8?5,048
LIABILITIES Current Liabilities:
Accounts Payable $ 3,583 $ 1,046 $ 28,96,! $ 20,747 $ 54.340 Accrued Llabilities 24,611 10,993 4,967 62,904 l03,475 Accrued Vacation Leave 40,370 12,505 4,235 95,129 152,239 Claims and Judgments 372.592 372,592 CapitaJ Lease Payable - Cun-ent Portion 1,100 22,094 23,194
Total Cunent Llabilities 69,664 24.544 410,758 200,874 705,840
Noncurrent Liabilities: Accrued Vacation Leave 2,125 658 222 5,007 8,012 Claims and Judgments 696,728 696,728 Capital Lease Payable · Long-tenn Portion 21,949 8,181 30,130 Net Pension Liability 8<1,869 59,719 24,788 378,135 546,511
Total Noncunent Liabilities 107,943 60,377 721,738 39 l ,323 1,281.381 Total Liabilities 177,607 84,921 1,132,496 592,197 1,987,221
DEFERRED INFLOWS OF RESOURCES Peni;ions 46,340 32,997 13,696 208,930 301,963
'I'otal Deferred Inflows of Resources 46,340 32.997 13,696 208,930 301,963
NET POSITION Net Investment in Capital Assets 17.368 85,319 159,820 262,507 Uru·estrkted 323,132 363,543 1,747,466 889,216 3,323,357
Total Net Position 340,500 448,862 1,747,466 1,049,036 3,585,864
Total Liabilities, Deferred Tnflows of Resoul'Ces, & Net Position $ 564.447 $ 566,780 $ 2,893,658 $ 1,850,163 $ 5,875,048
-137-

City of Ore:m Internal Service Funds
Combining Statemen t of Revenues, Expenses, and Changes in Net Position For The Year Ended June 30, 2020
F leet P urchasing / Self· Information Maintenance Warehousing lqsurance Technology Total
OPERATING REVENUES: Chl\rges for Sen,icee to Othe1· Funds $ 830,000 $ 395,000 $ 1,949,778 $ 2, 430.000 $ 5.604.778 Other Revenues 180 10,06,1 10,244
l'ol,a l Operating Revenues 830,000 395.180 1,949,778 2.440.064 5,615,022
OPERATING EXPENSES:
Pexsonnel Services 621,034 223,02 1 118,442 Ul64,093 2,226,590 Supplie,;, M:Jintenance and Claims 190,266 88,908 1,225,087 736,0l? 2, 240,278 Dep1·eciation Ex_pense 9,667 6,704 26,400 42.77 1
Total Opernting Expenses 720.967 318,633 1,343,529 2, J 26,510 4,509.639 Operating Income (Loss) 109,033 76,547 606,249 313,554 l , 105.383
NONOPERATING REVENUES (EXPENSES): Gain (Loss) on Sales of Fixed Assets 1.810 14.523 16,333 lnterest E xpense and Fiscal Charges (1,383) 0.383)
Tota 1 Nonoperattnl\ Revenues (Expenses) 1,810 14.523 (1,383) 14,950 I ncoTIJe (Loss) before Operating
Tninsfei·s 110,843 91.070 606,249 312,17 1 I, 120,333 l'ra nsfers In Transfers Out (72.819) (72,819)
Change in Net Posit.10n 38,024 91.070 606,249 312.171 1,047,514
Total Net Position · Beginning 302.476 357,792 1,141,217 736.865 2,538.350
Total Net Positton · Encling i 340,500 $ 448.862 $ 1.747,466 s 1.049.036 $ 3,585.864
-138-

City of Orem Internal Service F unds
Combining Statement of Cash Flows For The Year Ended June 30, 2020
Fleet Purchasing I Self· Information Maintenance Warehousing Insurance Technology Total
CASH FLOWS FROM OPERATING ACTIVITIES
Receipts from lnterfund Services Provided $ 830,000 $ 395,180 $ 1,949,778 $ 2,4.40,064 $ 5 ,615,022
Payments to Suppliers (186,451) (107,948) (1 ,496,013) (773,012) (2,563,424)
Payments for Personnel (501,266) (242,629) (! 24,239) (1, 391.14. 7) (2,259,281)
Net Cash Provided (Used) by Operating Activities 14.2.283 44.603 329,526 27F>.905 792,317
CASH FLOWS FROM NONCAPITAL FINANCING
ACTMTIES:
Transfers Out (72,819) (72,819)
Net (.;ash Pi-ovided (Used) by Noncapital
Pinancing Activities (72.SJ 9) (72,819)
CASH FLOWS FROM CAPITAL & RELA.TED
FINANCING ACTIVITIES: Acq u.isition of Capital Assets (83.632) (83,632)
Proceeds from the Sale of Capital Assets 1,810 1,8)0
Principal paid on Outstanding Debt (1,240) (25,865) (26 ,605)
Interest pald on Out.standing Debt ( J ,883) (1, 383)
Net Cash Provided (Used) in Capital
Financing Activities 1170 (110,380) (109,810)
CASH FLOW FROM INVESTING ACTIVITIES
Investment Earnings Net Cash Provided (Used) by lnv.eeting
Activitie11
Net T ncrease (Decrease) in Cash and Cash
Equ.ivalents 70,034 -14,603 329,526 165,525 609,688
Cash and Cash Equivalents · Beginning of Year 389,690 49,575 2,545,127 l.174,495 4,158,887
Cash and Cash Equivalents - End of Year $ 459,724 $ 94,178 $ 2,874,653 s l.340,020 $ 4,768,575
Reconciliation of Operating Income (Loss) to Net
Cash Provided (Used) by Opera ting Activities: Operating Income <Loss) $ 109,033 $ 76,5,17 $ 606,249 $ 313.55:J $ 1,105,383 Adjustments to Reconcile 01)e1·ating Income (Loss)
to Net Cash Provided (Used) hy Operating Activities:
Depreciation Expense 9 ,667 6,704 26,400 42,771 Clncrease) Decrease in Inventory (18,981) (18,931) (l ncrease) Decrease in Prepaids 8,871 (9,332) (461) (lncrease) Decrease in Pension Assets 4 ],931 77,855 11,727 388,013 519,526 Increase (Decrease) in Accounta Payable 1,307 (692) 28,907 (41,73'1) (12,212) 1 ocrease (Dec1·ease) in Accrued J..iabilities 2,508 583 1,007 14,071 18,169 Increase (Decrnase) in Accrued Vacation Leave 7,171 (4,494.) (9,854) 15,987 8,810 Increase (Decr-ease) in Pension Liabilities (29.334) (92.969) (7,670) (4,31,054) (561,027) Increase (Decrease) in Claims and Judgments (309,711) (309,711)
Total Adjustments 33,250 (31.944) <276,728) (37,6119) (313,066) Net Cash P•·oyi.ded (Used) by Operating Activities $ 142,288 s 44,603 $ 329,526 $ 275,905 $ 792,Sl 7
-139-

SCHEDULES OF CAPITAL ASSETS
USED IN THE OPERATION OF GOVERNMENTAL FUNDS
- 140-
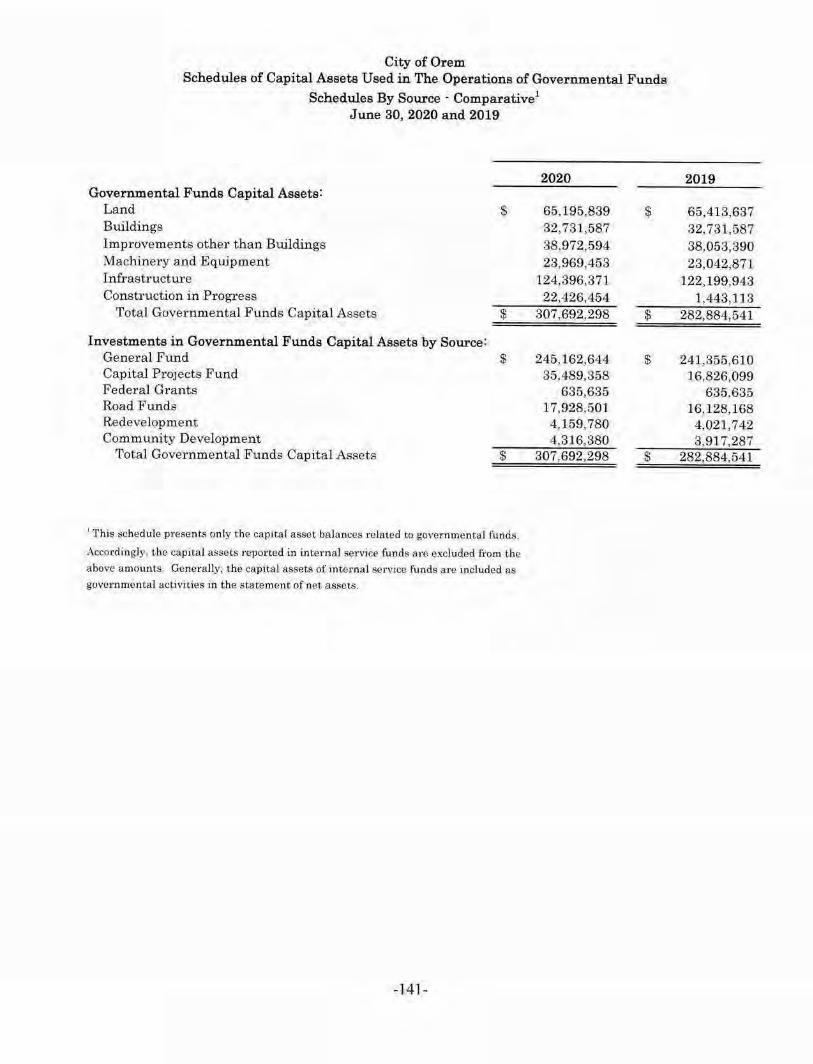
City of Orem Schedules of Capital Assets Used in The Operations of Governmental Funds
Schedules By Source - Comparative1
June 30, 2020 and 2019
Governmental Funds Capit al Assets: Land $ Buildings Improvements othel' than Buildings Machinery and Equip ment Infrastructure Construction in Progress
Total Governmental Funds Capital Assets $
Investme.nts in Governmental Funds Capital Assets by Source : General Fund $ Capital Projects Fund Federal Grants Road Funds Redevelopment Comm unity Development
Total Governmental Funds Capital Assets $
'This schedule presents on.ly the cap,tal asset balance.s related to governmental fund$_
Acco,,a ing}y, the capital assets reported in internal service funds a re excluded from the
above amounts. GeneraJly, the capital assets of internal service funds a.re included as
governmental activities in the statement of net assets.
-I 41-
2020
65,195,839 32,731,587 38,972,594 23,969,453
124,396,37 1 22,426,454
307,692,298
245, 162,644 35,489,358
635,635 17,928,501
4,159,780 4,316,380
307,692,298
$
$
$
$
2019
65,413,637 32,731,587 38,053,390 23,042,871
122,199,943 1,443,118
282,884,541
241,355,610 16,826,099
635,635 16,128,168
4,021,742 3,917,287
282,884,541

City of Orem Schedules of Capital Assets Used in The Operations of Governmental Funds
Schedule By Function and Activity1
June 30, 2020
Improvements Other Than
Function and Activity Land Buildings Building:s General Government:
Executive $ $ 2,075 $ 81,479 Pe1·sonnel Administration Finance 26,263 Legal Development Services General Government 1,710,203 3,841,058 4,597,421 Enginee1·ing Redevelop roent 1,714,040 85,080 Community Development 8,105 1,673,454
Total General Government 3,424,243 3,851,238 6,463,697
Public Safety: Administration 5.377,906 28,407 Police Protection 145,296 Fi.re Protection 174,096 2,486,089 935,128 Emergency Se1'Vices 1,580
Total Public Safety 174,096 7,865,575 1,108,831
Highways and Streets: Administration & Engineering 33,550 7,874,114 363,324 Street System 5 1,190,789 69.298 3,841,879 Street Lighting 1,421,854
Total Highways- and Streets 51,224,339 7,943,412 5,627,057
Parks and Recre at ion 10,150,816 8,252,592 24,435,375 Library 222,345 4,818,770 1,337,634
Total Governmental Funds Capital Assets $ 65,195,839 $ 32,731,587 $ 38,972,594
1 This schedule presents only the capital asset balances related to governmental funds.
Accordingly, the capital assets reported in internal service funds are excluded from the above amounts. Generally, t.he capital assets of internal service funds are included as governmental activities in the statement of net assets.
-142-

Machinery Construction and in
Equipment Infrastructure Progress Total
$ 747,392 $ $ $ 830,946 8,013 8,013
327,393 353,656 21.498 21,498
179,778 179,778 176,997 291,428 10,617,107 385,392 385,392
2,283,820 76,840 4,159,780 2,234,831 399,988 4,316,378
1,846,463 4,810,079 476,828 20,872,548
1,236,792 6,643.105 6,316,919 6,462,215 6 ,984,069 253,496 1,283,144 12,ll6,022
77,072 78,652 14,614,852 253,496 1,283,144 25,299,994
349,734 8,620.722 3,484,123 Ll7,356,706 8,408,600 179,351,395
1,136,156 2,558,010 3,833,857 118,492,862 3,408,600 190,530,127
2,987,309 839,934 12,622,760 59,288,786 686,972 4,635,122 11,700,843
$ 23,969,453 $ 124,396,371 $ 22,426,454 $ 307,692,298
-143-

City of Orem Schedules of Capital Assets Used in The Operations of Governmental Funds
Schedule of Changes By Function and Activity1
For The Year Ended June 30, 2020
Governmental Funds Capital
Assets Function and Activity June 30, 2019 Additions Deductions
General Government: Executive $ 830.946 $ $
Personnel Administration 8,013 Finance 305.647 62,299 (14,290) Legal 21.498
Development Services 167,977 11,800
General Government 10,547,108 69,999 Engineering 332,709 52,683 Redevelopment 4,021,742 138,038 Community Development 3,917,287 399,092
Total General Government 20,152,927 733,911 (14,290)
Public Safety: Administration 6,643.105 Police Protection 6,091,298 702,630 (331,713) Fire Protection 11,136,322 1,381,593 (401,892) Emergency Services 78,652
Total Public Safety 23,949,377 2,084,223 (733,605)
Highways and Streets: Administration & Engineering 8,636,218 (15,496) Street System 173,907,054 G,515,452 (1,071,111) Street Lighting 2,558, 010
Total Highways and Streets 185,101,282 6,515,452 (1,086,607)
Parks and Recreation 46,374,270 13,019,220 (104,705) Library 7,306,685 4,394,158
Total Governmental Funds Capital Assets $ 282,884,541 $ 26,746,964 $ (1,939,207)
1 This schedtile present,g only the capital asset balance& !'elated to governmental funds.
Accordingly, the capital asset.s reported in internal service funds a.te excluded frolll the
above ai.noll,Jlts. Genera]IY. the capital assets ol' internal service funds are included as
governmental activities in Lbe statement of net assets.
- 144-
Governmental Funds Capital
Assets June 30, 2020
$ 830.946 8,013
353,656
21,498 179,777
10,617,107
385,392
4 ,159,780 4,316,379
20,872,548
6,643,105
6,462,215
12,116,023
78,652 25,299,995
8,620,722 179,351,395
2,558,010
190,530,127
59,288,785 11,700,843
$ 307,692,298

STATISTICAL SECTION
STATISTICAL SECTION (Unaudited)
This section. of the City of Orem's comprehensive annual financial report presents detailed information as a context for understanding what the info1·mation in the financial statements, note disclosures, and required supplementary information says about the City's overall financial health.
Contents
Financial Trends
These schedules contain trend information to help the reader understand bow the city's financial performance and well-being have chane-ed over time.
Revenue Capacity
'I'hese schedules contain information to help the reader assess the factors affecting the City's ability to generate its property and sales taxes.
Debt Capacity and Other Debt Information
The-se schedules present information to help the reader assess the affordability of the City's current levels of outstanding debt and the Citv's abilitv to issue additional debt in the future.
Demographic and Economic Information
'l'hese schedules offer demographic and economic indicatm;s to help the reader understand the environment within which the City's financial activities take place and to help make comparisons over time and with other Emvernments.
Operating and Other 1nformation
These schedules contain information about the City's operations and resources to help the reader understand how the City's financial information relates to the services the city provides and the activities it oe1'forms.
Page
146
154
165
175
178
Sources: Unless otherwise noted, the infol'mation in these schedules is derived from the comprehensive annual financial rep01·ts for the relevant year. Information related to any new GASB pronounc,ements required to be included within these statements is shown prospectively except in those cases in which pri.or yeat information was readily available.
-145-

2011
Governmental Activities:
Net Investment in Capital Assets $ 120,200,518 $
Restricted:
Debt Service 5,213,847
Capital Improvements 11,343,346
Pensions
Community Development 4.511,078
Subtotal - Restricted 21,068,271
Unrestricted 11.301,287
Total Governmental Activities Net Positfon 152,570,076
Business-type Activities:
Net Investment in Capital Assets 50,282,917
Restricted:
Debt Se1·vice 3,696,467
Capital improvemen ts 372,691
Pensions
Su btotal - Restricted 4,069,158
Unrestricted 8,249,952
Total Business-type Activities Net Position 62,602,027
Primary Government:
Net Investment in Capital Assets 170.483,435
Restricted:
Debt Ser vice 8,9 10,314
Capital Improvements 11,716,037
Pensions
Community Development 4,511,078
Subtotal - Restricted 25,137,429
Umestricted 19,551,239
Total Primary Government Net Position $ 215.172,103 $
-146-
City of Orem
Net Position by Component
Last Ten Fiscal Years
(Accrual Basis of Accounting)
(Unaudited)
Fiscal Year
2012 2013
118,628,873 $ 116,156,331
5,243,669 3,321,577
12,514,381 14,939,254
4,969,244 5,238,370
22,727.294 23,499,201
12,619,271 15,467,624
153,975,438 155,123,156
51,205,188 52,401,013
2,140,970 2,035,413
103,510
2,244,480 2,035,413
11.483,226 13,503.553
64,932,894 67,939,979
169,834,061 168,557,344
7,384,639 5,356,990
12,617,891 14,939,254
4,969,244 5,238,370
24,971,774 25,534,614
24,102,497 28,971, 177
218,908,332 $ 223,063.135
2014
$ 119,632,622
3,962,783
13,182,105
2,077,923
19,222,8 11
18,050,956
156,906,389
51,205,76]
2,415,159
44,000
2,459,159
17,867,439
71,532,359
170,838,383
6,377.942
13,226,105
2,077,923
21,681,970
35,918,395
$ 228,438,748

Fiscal Year
2015 2016 2017 2018 2019 2020
$ 125,400,639 $ 126,818,760 $ 131,968,221 $ 133,402,160 $ 134.356,643 $ 138,676.061
4,397,812 3,276,616 3, 124,343 3,344,100 5,845,268 4,928,893
13,746,082 14,968,717 12,172,402 12,037,092 15,739,000 18,992,324
474,700 18,819 11,876 871,227 2,426,403
2,325,070 1,966,450 2,465,412 3,609,728 3,832,719 4,048,008
20,943,664 20,230,602 17,774,033 19,862,147 25,416,987 30,395,628
14,694,051 22,000,259 23.803,593 27,529,253 29,921.317 36,678,544
161,038,354 169,049,621 178,545,847 180,793,560 189,694,947 205,750,233
55,221,666 56,904,569 59,715,600 63,143,175 69, 151,941 7 4, 134,24,9
1,658.404 2,448,592 1,860,333 1,995,491 2,121,261 2, 157,258
66,000 88,000 110,000 194,727 983,589 1,057,806
2,025 145
1,726.429 2,536,737 1,970,333 2,190,218 3, 104,850 3,215,064
18.391.654- 20,298,964 27,455,917 37,657,454 47,291,346 61,047,974
75,339,749 79,740,270 89,141,850 102,990,847 119,548,137 138,397, 287
180,622,305 183,723,329 191,683,821 196,545,335 203.508,584 212,810,310
6,056,216 5,725,208 4,984,676 5,339,591 7,966,529 7,086,151
13,812,082 15,056,717 12,282,402 12,231,819 16,722,589 20,050,130
476,725 18,964 11,876 871,227 2,426,403
2,325,070 1,966,450 2,465,412 3,609,728 3,832,719 4,048,008
22,670,093 22,767,339 19,744,366 22,052,365 28,521,837 33,610,692
33,085,705 42,299,223 51,259,510 65,186,707 77,212,663 97,726,518
$ 236.378,103 $ 248,789,891 $ 262,687,697 $ 283.784,407 $ 309,243,084 $ 344,147,520
-147-
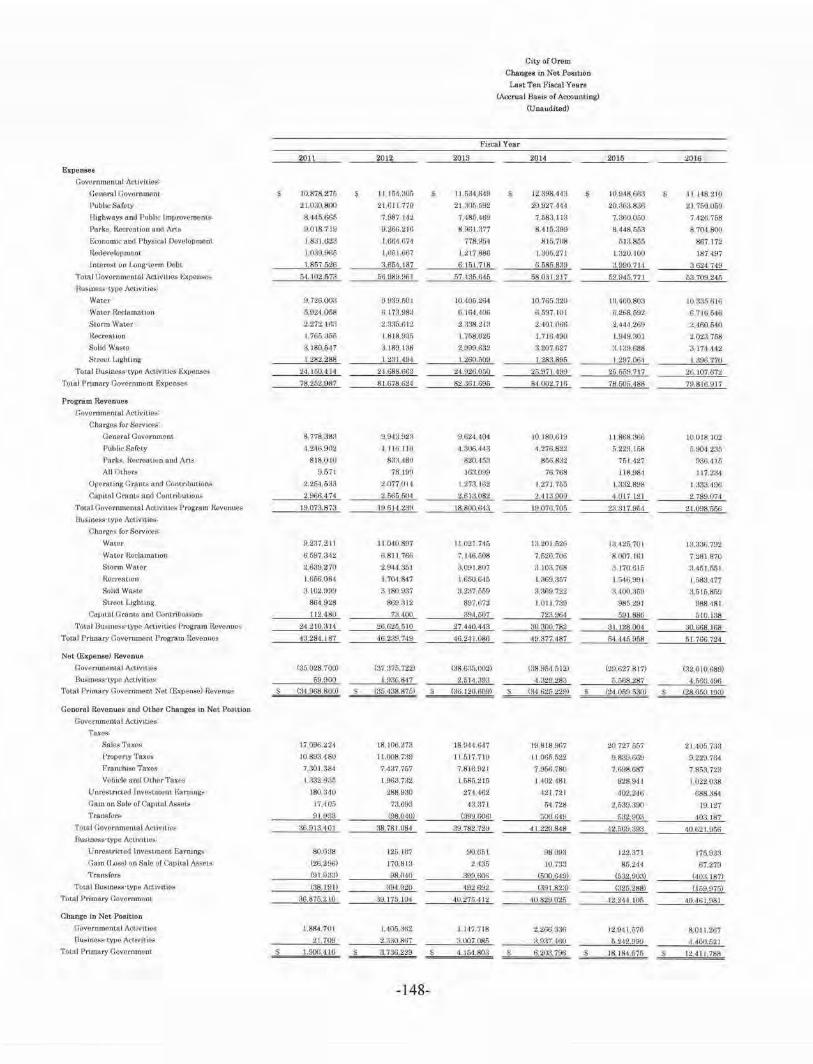
City of Orem
Chabge:s in Not Poi'Dtion
La.11t Ten Fi8('.al Yea~
<Accrual Basis of Accounting)
(Uoa4dit<>d)
Fiaca.J Vear
2011 2012 2'019 2014 2015 20)6
E'Kpenses
Governmt:!tlt.ul At:1.witles:
Concral Govornment t 10.a1a,~;n II IM,:101, s 1 l ,6i!-l,Ci41! s 12 :J98 4d3 10.948.61,3 s ll, 14R,2J0
l'ubllc Sateiy il,Otl(l,800 21,611 770 21.:toft,592 209:.17 H4 20,3R3,838 21,760.0m:J
lJ1gbw~ orul Public l.mlJrt;lvt1 rocntt 8,445 /;65 7,087 142 7,,l85.•t!1J ? ,683, lltJ 7,;!60,0.',0 M26,768
Parks. t<acrcrnion Qnd .\rtFi il,0 18 719 9,266,216 8 ~61,:l77 8 416.399 8.'148,658 8,70•1 ,$00
Economic aDd Pbys1cnl Oovoloprn,mt l,8:JU;23 1,664,r,74 778.96'1 815,708 51~,855 867, ln IW<levclo1,mflnr I 0!49,966 t ,651,067 1,217,886 I 306,27 J 1.320, 100 187,497 tnuarcsl uu Loog·w.rm Ucln 1.857 G26 3-6M, 187 6.1[11,718 fl 1;86.8~9 :rnoo.11i 3,624,749
Tota) Govcrnm.t1nt.al (\r.uvll10~ EXJlr.n~ 64, !02.573 56 ~~9.961 67.435,C><l5 58.031.217 52.945.77 1 53,709,245 Jlu~1nil5.J>·t)')l0 AN 1Y1111!,»
Wuwr }J,726.00a ~M9fi01 10.40&.26'4 10, 76fi.~20 ICJ,4611,80.1 10,ss:;,i;rn Wst.er rWCht.mut 1011 6,92•,0liB 6 173.98;! Ii, 164,4116 6 597, 101 G,26ll ~92 6,716,546
Slorm W,ner lo 27i, Lfi!I 2.9!15.6"12 2.:138.21:l 2.,tOi.OOli 2,444.;169 2.1fi0,fi4Q
ltecrt'~\ LQn l ,16fi,::l5C\ 1818,Mo 1 76ll,U26 l,7 IG•l9cl l,9•H,:I01 2,023,768 &ihrl w • .,, ;l,180,!•17 ;l, 189, 1:!8 :l.999.Hii2 !l,2-07 G27 :1.1att ll88 3,17-1\ ,1,t2
Su•t~• l,,ghtini; 1.28Z,288 1.2:ll,4Ud I 26U.6(~J 1.283 895 1.:197.00. 1,396 770
1'otal Busint.~·ty()o Acuvllllls Expcn.~ 24, 151),4_J,.I 24.688.66g 24.926.060 2'>.~171 1199 ~o 659.717 26, 107.672
Tt)t.al Primary Oovoromonl Expt>,nsc~ 7B.25i,987 8 l.678,6'l •l 82,aGl.695 8• IJ02. 71fi ,S.5(15.488 79.8HL917
Prog:ra.-m Revcoues Govcrnmcmtal Acli\'iticS.:
Charges ftlr Scrv1~:i-:
(.1~nahll Co\lOrrummt s,11a.Jss 9.94~.92~ 9,1124 404 10 180,619 11.l!Gs,;J6& 10018.102
Pll~lic Sa roly 1.2,u;,9oi 1.116, llli 4,306.~43 4,276,822 6,229 HiR f,.:!0-1 235 Parks,, k1,tt'Ul&Uun :t11.1d Arts 818.010 Bil/1,48\t 8lll!,•lr.~ 8;,6,832 761 427 986.1 l l'i All 0Lhcr. 9.&11 78Hm 163.099 76.768 JJ8.981 117,23'1
(J5>('1ral.1n,g_ Granu 11nd r'..ontribu1io~ i ,i54,6!1~ 2,077.01, \ 273, )62 1.271,71)5 \,;!:!2.898 I 333.4~6 Caµ1lel Crantij end Contnbultons 2,966,,174 2 666,604 ~.6 lll,08~ 2.1 J;J,f)()9 4,017 Iii :!. 789.07•
Tot.al Guvernmemal J\clivitim;;- Program RPvt.inuel.i 19.073.87:1 W,614.2W 18.8!!0.&1~ 19.07/l,701\ 23 $J7 96'1 21,U98,566 Bu~ln~~-typo Acti\llties:
Char-grs (or Sorv,c.,!tl'
Wau.,r 9.23i.2l1 11,010.897 I LO~ I.74fi l!l.:!Ol.n26 13120,iill Ja.336,792 Watot Reclmnntion 6 597,342 tl,811.iW 7,1<16,liU8 7,620.700 8,0()7, lff l i 1281.870
Storm Waler :!.da9,Z70 2.944,:lfil 8.091.807 II IU:l,7f,8 ano,s11; 3,05l,ool n~Cl'etlLlt.111 l.tif,6.081 1.7(),J,8~7 1.tl50.ti46 1 l69.957 !, 6,l«,991 1,583,1177 Solid Wa~te 3 102,t,tm 3 ,180,937 a.2:118(19 3,M9.722 ,J,40(),Ji;U :l,615.8fi9 Stl't\OL Llghung 861 ~2~ 869,,H2 so,.lm 1,011 739 985,291 Hllll-'181
t)ai),U.I l.Han,~ ,tn(t (\.mlrU)ul 1um; 112.480 73.400 :-m,1.507 7~3.~ 59118&6 510,188 TUlal Ousiueslf•\.YfW J\i~"ivit.ios Ptogram Rcve11u011 :M.210.:ui 26.625 5IO ~7.440,443 30,300,782 31, 128,004 30.668,1611
Tow! Pl'bnary Govtimmt1nt Progrftm f'OOvcm.1c1t ;g 2ll4. I 87 46.239 7-19 46.24 I.081.5 19.377.•187 f,'1,'1115,968 51 ,uG.n;
Not (ExpeDAe) Rovonue
no..,crnme.n1a1 A~twittcs (85,028, 7"00) (37 :Hf>. 72:!l (38,6:lS.002) (a8,9M,512) C2n G27,817) (~2.6 IO 689) Bus1noss·cypo At.:uvit1os i,9,90() 1.nas.11•1 2.51ili39J •.ats.,8a 6.fi68,287 4.6S0,1J96
Tola! Primary Covi•mment Net (~~1>ensc) lte,.,enl.lr s (3•1,968,B,OO) s (35.438,875) s (86. 120,flO!J) s 1114.6:!5.:!29} tM.059.5(1()) s l28.050.I9;i)
General Revenues nnd Othet Change• Jn Net Poait.ion Govcrmnental AcLiviues.
1"'8,.¥"~)'1·
Sales Taxes 17,0!)6.224 18. 1()6,273 18.~H.6•7 l!:11818,9')7 l!() 727,fifi';' 21 •106,73:1 1..1ro1>eny TRXt:18 111.893.460 I l ,(l(J8.7:l9 11617710 I 1,006,/i22 8, a;1G. C16.~ 9 22!:J.71-M F'rnnchiiso 'l':ixcs 7 !IOI.M4 7.4:171757 7,81~.~2] 7,900.78U 7,698.687 7 853, 723 V(lbirl('-aru.l. Othor 1'aJ<c-a 1,332.~36 I 003,TJ2 I n86.2 l5 1,,102 481 828,941 1,022,038
Unrc8t.ncted l11vcstmont f.ammg?L 180,:140 288.930 274,462 421,72[ 402.2•JG 6118 :SR,1 (~otn on Sa lt- urCi-111itHl ;\~JUi 17.406 7:l.69~ a:J,:171 6-1,728 2,i;a<J,;190 19.127 1'.ramfol"S 91.U:l:l !98,040) (ll9~.6o6) Fi00,619 532.00S 103. 187
TIJtnl Govc.rnmonlal AfL,vi11c.s ;l6,fll3AOI :l8.781 IJ81 :19. 782.720 <I l ,:!20.848 42.669,39~ 40,(121, 05Ei Bu~IOOJl~•LylH! Acl1vitie~:
UnrCNt.rn.,ad lt\\t't$ll'tlOnl Ettrning;s 80.0!!8 120, lb'1 .90661 as.09a 122.37] 176,93:l r.a1n (U:~) cm Sr1IA orCaoJt~•J Asi;(!t.., (26,200) 170.81:J 2.435 l0,753 8{,,24• 67,279 Transftirs (Ul n:ml !)8,0•0 1199,606 1500 649) (532,9o3) (,10~.187)
Torn I Ou~ane6!.·t.y1,e Ac11v II let,; \38 l~I) ~94.020 192.692 (391.82/J) ins 21!8l (159,97f,) T,,rnl Primary Govcrn:mona 3(;_ij75.2 10 39, 17S, lU4 10,275.112 ,IO 829.0~6 ,2.2•14. lOS <OA61.981
0l1ilf!ge in Net -Position
Oovornmo.nu,1 Acl 1v1twd" 1.884,7(11 l,405,att2- I 147718 2,266 !l:l~ 12.1),11 ,576 8.011,267 nu~tru"Ab ..... t..}'JJO Atfiv1t1C." :!.! 1,709 ,rn~n.a11, :1.1107.0~5 a.9a7 .100 6242.999 4.d00,521
Total Pnmary 1 :ovornruem s 1,9011,410 ~.736.2:!9 s 4.15'1.8()3 !, 6.2oU96 s 18, 184.676 s l:!.411,788
-148-

FisCR.1 Year
2017 2018 2019 2020
1:1, lflO, lfi:l 5 19, l~3.2(i2 $ 16.1)17.-lf>/l s Lfi l!tl U71
'l!i.578 :.?6:l ll,1,211.al!O 26,46.1.lll 21J.20< H8
71135.621 70J2058 7,ti88,625 7 573.6S8
9.,111.86:J I0,66).3117 9,61~,483 8 7:14 168
9so.mm 1.r,01.HZ 1387,8.55 709.334
l.2sn.,1e8 756, 175 I.O!H.3414 pr,S,ij21
a.59t::.gss J,605.8Gf) 4 1:!2,7~H 4 73j Ml8
5U, lll9 915 69.707 363 6:i, 7H7, :J57 Bil .624.H88
11021.on• I 2, f\7(),9~8 I :t,:JA\I ;;(; llk03!/:!I I
ff 723.:t~M 7, 117.l&s 7.o l 7.U'"1 i ,MQ,r,72
2 371.1>47 2.r,67.G34 , .837,169 :-t1n•n:1.
l.962.99n I 99~ 090 2,1111 021 1.268,411
3.21!,'l.:iJO ,!,617M1 '.l 764.869 t "J.77 H97
1 IH 1110 !)81.777 '74,442 481.587
20.5:JIJ.J;25 28.SH.931 29 !lfl6 MI 29 717.681
85,666,440 8K55fi.28• 9:l,793.498 91 242 :JG<J
9 . 718.116 10, 147,59~ Ll,286.060 10. 198.8 18
5 ,7~.l\15 (1,01~;,r,:llj fl,40S,<07 r w1.m 2.ll08.:177 J.19f\,408 1,606,624 :!,IQ,!i6R
186,321 332,0:14 360,681 I 4G7,081
l.19!i.fj6~ 1,637,09:1 1,:t92.Ril6 11,228 f>GS
3.171 938 a.s,a.9,1~ 5.246.807 4 .513,950
22,048 610 :Ja.395,749 is. 1ss.a25 :J0.463, :J2•
16,M7,544 18.3558<l(l IR.9:~t 096 2()821.417
8.llt9f)99 ~.b"187fi8 11 519137 13,070, 78•1
4 ,~it 9n 1,~fiO l:!,j ,, 776 8 19 r •. 05<>.!.1211
l(ll7,27a 1.66~.021 1,009,:\29 746,llSO
3 671 ,H:W :l.!;92,673 3.ls46, IH •l.<¥.l8.07" 996 481) I OiJ.:J® l ,:! l d 7lll ~lll.::!~)'i
1.a83.926 :!.97:1.808 4.100 701 ::1.170,9 11
% .737.22t •12, H4.349 •IG.09•1,933 47 881 61(1
57,785.832 66 140.0~8 72,283.368 7R.33•1.8M
(37CJ8J.31\5l (30 31 I (1nsl (,j7 008 9321 (3·1,071,~84)
9.200,697 lJ.800.118 16.0~8 7~~ 18. 16l829
' <27 ssu ~u!I> s (2;?.d\fd8G) s (21.&I0. 140\ s tt&,907,6~t5)
22,760.7110 24,:!61,70•1 :!4.914,421 t8 161,61>0
9. Ml.82il ~.,mf,.111 ~.70l.~9~ lll ,4a2,!189
7,B~H,110 7.mil,936 7 .887,331 7.!:i<J5,tl'14
881, 179 1.11:11.83'3 88ti.489 9<I6,6:IG
603,500 778,978 2.28H,679 ~,000fi62
10:l.!18~ 39,69\1 163,7!.IO ~23.•G6 -l02,2:l0 ;15 HOO a:11.215 a26,,16it
41.577,fi.:H ,a 059.311 io.510.319 fiO. I 26, GSO
286,761 r,ss, inr, 1.088,(l5/! 1.on21r,
IJ7.Sn2 79, 77,1 7 116 (26 ,l(lJ)
1:102.23{)) (715,990) (6$7 27(;) (328.'163)
10088:! ( 111,121) 458.'1~)8 686,!.J2l
-11,778,4 14 4:J.611,tiOO 16 9ti8,8l7 1i,,.s 11.9ir
1,400,2211 7 ,247713 8 901,387 lfl,065 286
9.401.:\80 13, 84 M, :i97 16.667.s9o 18.849 150
s ia.s.n.soa s ~t.<½J6.7I0 s 25,458,677 :W,90,J,436
-149-

General Fund
Nonspendable $
Restricted
Committed
Assigned
Unassigned
Total General Fund
All Other Governmental Funds
Non spendable
Restricted
Committed
Assigned
11'otal All Other Governmental Funds
Total Governmental Funds
Nonspendable
Restricted
Committed
Assigned
Unassigned
Total Governmental Funds $
City of Orem
Fund Balances, Governmental Funds
Last Ten Fiscal Years
(Modified Accrual Basis of Accounting)
(Unaudited)
Fiscal Year
2011 2012 2013
107,041 $ 97,590 $ 183,807 $
5,439,904 6,367,461 5,721,516
497,768 75,000 75,000
1,226,527 2,145,703 1,500,374
3,471,493 3.396,016 6,092,838
10,742,733 11,081,770 13,573,535
3,406,170 4,341,351 2,473,532
12,115,156 12,920,892 15, 120,346
109,753
1,158,818 2,487,021 3,518,562
16,789,897 19,749,264 21.112,440
3.513,211 4,438,941 2,657,339
17,555,060 18,288,353 20,841,862
607,52) 75,000 75,000
2,385,345 4,632,724 5,018,936
3,471,493 3,396,016 6,092,838
27,532,630 $ 30,831,034 $ 34,685,975 $
-150-
2014
146,343
5,554.462
75,000
t,893, 107
10,073,358
17,742,270
13,522,006
2,380,417
15,902,423
146,343
19,076,468
75,000
l.273.524
10,073.358
33.644,693
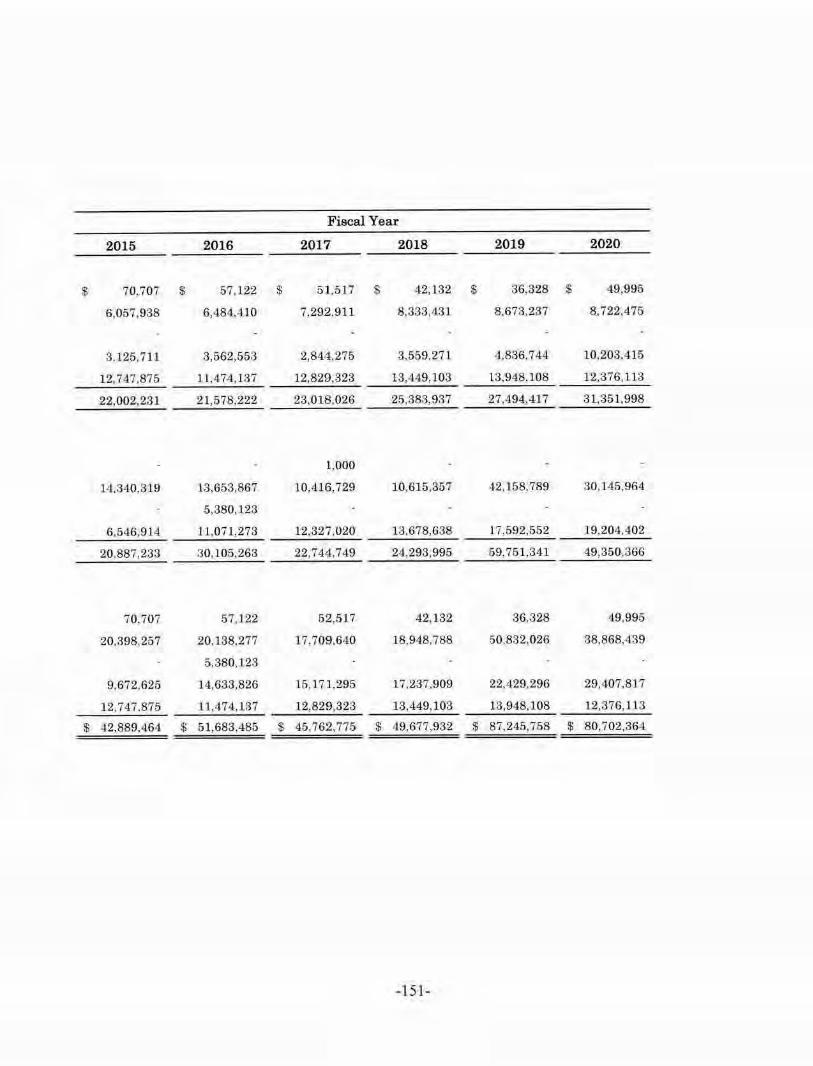
Fiscal Year
2015 2016 2017 2018 2019 2020
$ 70,707 $ 57, 122 $ 51,517 $ 42,132 $ 36,328 $ 49,995
6,057,938 6,484,410 7.292.911 8,333,431 8,673, 237 8, 722,475
3,125,711 3,562,553 2,844.275 3,559,271 4,836,744 10,203,415
12,7d7,875 11.474, 137 12,829,323 1.3,449,103 13,948, 108 12,376,113
22,002,231 21,578,222 23,018,026 25,383,937 27,494, 417 31,351,998
1,000
14,340,319 13,653,867 10,416,729 10,615.357 42, 158,789 30,145,964
5,380, 123
6,546,914 11.071,273 12,327,020 13.678,638 17,592,552 19.204,402
20,887,233 30,105,263 22,744,749 24,293,995 59,751,341 49,350,366
70,707 57.122 52,517 42,132 36,328 49,995
20,398,257 20,138.277 17,709,640 18,948,788 50 ,832,026 38,868,439
5,380,123
9.672,625 14,633,826 15,171.295 17,237,909 22,429, 296 29,407,817
12,747,875 11,474,137 12,829,323 13,449,103 13,948,108 12,376,113
$ 42,889,464 $ 51,683,485 $ 45,762,775 $ 49,677,932 $ 87,245,758 $ 80,702,364
-1 51-

Revenues
Taxes and Special Assessments $
Licenses and Permits
Intergovernmental
Charges for Services
Fines and Forfeitures
Charges for Services - Other Funds
Impact Fees
Investment Earmngs
MiscelJaneous Revenue
Total Revenues
Expenditures
General Government
Public Safet_y
Hi~hwaya and Public frnproveruents
Parks, Recreation and Arts
Economic and. l'hysical Development
Re.development
Debt Service:
Principal Retirement
interest and Fiscal Charges
Capital Leaae Payments - Principal
Capital .Lease Payments - interest
Capital Outlay
'l'otal Expenditure,s
Excess of Re.venues over
(under) Expenditures
Other Financing Sources (Uses)
ls,iuance of Bonds & Other Debt
Payment to Bond Refunding Agent
Proceeds from Asset Ois-prn,als
Proceeds from Lease Relinquishments
Capital Lease~
'l'ransfers In
Transfers Out
Total Other Financing Sources (Uses)
Net Change in Fund Balances s
Debt Service aa a percentage
of Noncapital Expenditures
City of Orem
Changes in Fund Balances, Governmental Funds
Last Ten Fiscal Years
2011
(Modified Accrual Basis of Accounting)
(Unaudited)
Fiscal Year
2012 2013 2014
36,999.164 $ 40,286.108 $ 40,595,860 $ 40,004,715
1,212,994 1,093,859 1,147,855 1,437, 173
5,22),007 4,642,518 8,886.244 8,685,660
5,744,989 5. 789,061 6,026.996 6,387.452
1,073.523 1.343,329 1,35$,345 1,587,870
4,239,346 '1,478,369 4,447,898 4,498.'106
259,815 340.125 274,439 4.20,619
1,892.299 2,256,723 1,889,61';9 1,557,414
56,644,187 60,230,092 59,627.296 59,579,313
11,562,870 10,348.586 l J,093,324 11,609,569
20,098,983 20,:371,289 20,332,951 19,951,315
4,285,166 3,707,727 2,974.00R 2,934,326
7.510.159 7. 730,925 7,558.171 7.016,106
630,073 1.588,ll6 707,403 707,759
950,536 1,562.238 1.128,457 I,2lo,842
4,877.352 3,834,833 3, 130.714 -3,814,621
i.983,792 3,821,259 6,233,296 6,706.815
34,028 31.132 98.213 108.318
1,718 1.989 12.099 to,218
4,712,497 4,435,299 1,963,153 7,180,569
56,£;4-7,l 74 57,433,393 55,231,789 61,255,,l58
(3,037) 2,796,699 4,395,507 (1,676,145)
1,916,000 1,814,000
(1,785.000)
26.0()I) 45,598 48,275 107. 760
73.078 525.147 26,4511
4,018.147 5,933,470 7,199,980 7,452,857
(3,925,610) (6,031,510) (7,788,821) (6,952,208)
2,105.616 501,705 (540.566) 634,863
2,102,578 $ 3.298,404 $ 3,854,941 $ (1 ,041,282)
12.9% 14.3% 17.4% \ 9.2%
-152-
2015
$ 43,54-9,348
2,524.. 794
5.850,019
7,624,838
1,792,829
4,042.299
397,648
1,587.285
66.869.060
11,589,358
19,847.226
2.828.824
7,485,247
886.286
1,231,600
5,4S6.955
4 ,201.272
108.376
9,177
7,573.606
61,197,877
5,671 183
JO, 174,381
(9. 792,760)
42.869
2,500,000
64.113
11,483,900
(10,898,865)
a.57:.1.588
$ 9,244,771
17.7%

Fiscal Year
2016 2017 2018 2019 2020
$ 39,473,431 $ 40,804,822 $ 41,982,483 s 43,735,686 $ 47.401,(H5
1,745,483 1,815,943 1,813,030 2,564,527 1,66l,o15
4,122,(i70 4,367,601 5,326,785 4,827,536 9,989,011
7,H71,80t 7.9-14,803 8,049.206 8,912,692 8,702,243
1,588,994 1,699,609 1,839,251 1,736.445 1,386,474
3,666,672 3. 739,141 4 ,283,205 4,813,925 5,039,118
87,291 1,812, ll 7 753,507
691,037 602,736 776,059 2,286.685 2.061,462
1,670,552 2,254.504 1,887,641 1,362,254 l ,816, 174
60,630,540 6:~,229,159 66,044,951 72,05J.8J 7 1s.tm.(n9
l2,143.7fi0 12,810,872 13,245,295 14-,378,024 14,730,287
21,144,586 21,762,711 22.539,915 23,577,274 24-,553, 748
2.922, 708 3,029,415 3,053,824 3,195.426 3,226,153
7,512,284 7,593.094 7,466,177 7,889.131 7,940,137
788.526 862.-178 1,056,219 792,806 GOt.842
99.182 I, 195,421 761,151 911,069 913,706
4.369,370 8,515,873 3,095,833 1,820,799 1,527,961
3,802,678 3,5511,590 3.473,151 3,694,732 4-,935,277
114,178 109,494 546,506 426.000 435.000
7,037 4,540 3 11 ,092 126,221 117,353
6,044,338 15,109,224 7,426,441 6,743,516 27.476,266
58,948,642 69,5:'!7, 712 62,974,604 63,654,528 86,,t57, 730
1,681.898 (6,308,553) 3,070,347 8,497,289 (7,646, 71 J)
2,898,000 28,209,763
(2,861.199)
19.127 )08,983 77,614 155,0.55 704,035
6,739.000
12,998,035 11,857,495 13,220,391 14,702,520 12,071,658
(12,644,039) (11.610,4!!6) (12,453, 19n) (13,996,801) (11,672,876)
7.112.123 387,843 84-4,810 29,070,537 1.103,317
$ 8,794,021 $ (6,920, 71 O) $ 3,915,157 s 37,667,826 $ (6,548,394)
15,3% 12,8% 12,8% J0,0% 11.6%
-153-

City of Orem
Assessed Value and Estimated Actual Value of Taxable Property
Last Ten Calendar Years
(Unaudited)
Taxable Assessed Value
Primary Other Commercial
Calendar Residential Residential & Industrial Agricultural
Year1 Property Property Proeerty Property
2010 $ 2,442,893,252 $ 69,047.883 $ 1,665,301,399 $ 477,597
2011 2.319, 187,515 60,784,441 1,551,035,553 446,286
2012 2,284,573,816 4,073.304 1,451,256,784 544,039
2013 2,.372,218,303 4,459,944 1.455,891,528 528,035
2014 2,625,764,385 7,388,684 1,540,311.362 486,609
2015 2,843,531,994 8 ,234,684 1 ,591,591.049 496,907
2016 3,107,389,501 11,331,034 1,666,181,801 936,304
2017 3,410,863,935 12,024,179 1,792,344,368 837,724
2018 3,775,842,951 12,752,600 l,888,362,910 931.418
2019 4,166,790,367 15,841,000 2,053,671.086 904,733
Source: Utah State Tax Commission · Propel'ty Tax Division
Notes: Property in the Cit)' of Orem is reassessed once every five years, on average. The county assesses property at approximately 55 percent o f actual value for residential property and 100 percent of actual value for all other categories. .Estimated actue l taxable value is calet11ated by di'1"iding taxab1e assessed value by those percentages.
1 Assessed values are reported by the county on a calendar year basis rather th.an July 1 to June 110 fiscal year.
-154-
Unimprove d
Real
Property
$ 3,li3,671
3,599,142
136,586,644
127,808,953
147,878,177
145,565,291
160,189,356
156,979,408
164,540,170
173,954.008

Taxable
Total Total Estimated Assessed Value
Taxable Direct Actual as a Percentage
Personal Fee in Lieu Assessed Tax Taxable of Actual
Property Property Value Rate Value Taxable Value
$ 275,721,406 $ 33,596,021 $ 4,490,211,229 0.001739 $ 6,545,435,794 68.60%
294,715,129 43,727,917 4,273,495.983 0.001879 6,220,745,765 68.70%
310,397,550 43,171,491 4,230,603,628 0.001921 6,103,133,090 69.32%
328,234,567 44,814,165 4,333,955,495 0.001871 6,278,510,424 69.03%
322,456,519 43,654,474 4,687,940,210 0.001716 6,842,338, 176 68.51%
299,822,251 45,221,895 4,934,464,071 0.001652 7,267,727,717 67.90%
302,375,000 46,114,051 5,294,517,047 0.001550 7,846,197,485 67.48%
316,299,118 44,919,303 5,734, 268,035 0.001346 8,534,812,856 67.19%
319,419,105 44,102,879 6,205,952,033 0.001281 9,305,712,029 66.69%
339,452,728 43,518,173 6, 794,132,095 0.001260 10,216,285,032 66.50%
Taxable Assessed Value as a % of Actual Taxable Value
75% -,-----------------------------,
73%
71% -r-----------------------------1
69% t---.:::::::===r--~==--=::::::;:::-----------------i
67% ·r--------------=-===::::!:::::::=--:===.:====:;--1 65% r------------------------------1
63% ---,-----,------r---- --.,..--------.,...---.,..----1 2010 2011 2012 2013 2014 2015 2016 2017 2018 2019
Calendar Year
-155-
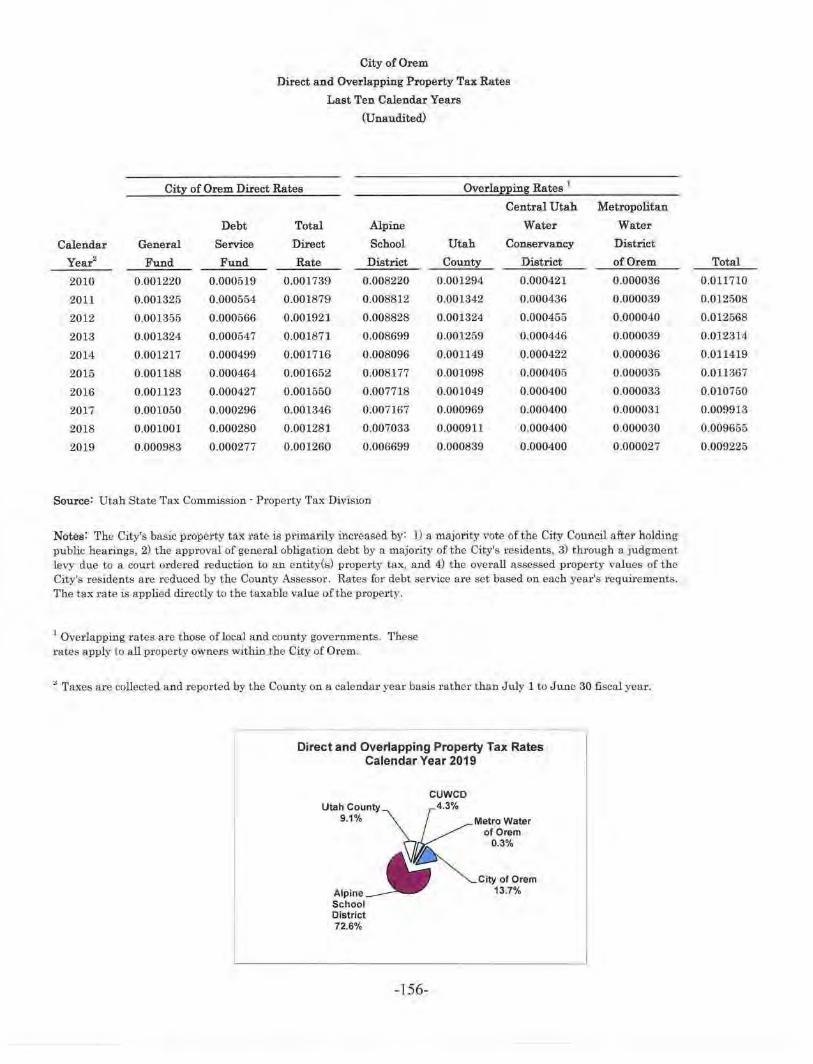
Calendar
Year2
2010
2011
2012
2013
2014
2015
2016
2017
2018
2019
City of Orem
Direct and Overlapping Property Tax Rates
Last Ten Calendar Years
(Unaudited)
City of Orem Direct Rates Overlapping Rates 1
Central Utah
Debt Total Alpine Water
General Service Direct School Utah Conservancy
Fund Fund Rate District County District
0.001220 0.000519 0.001739 0.008220 0.001294 0.000421
0.001325 0.000554 0.001879 0.008812 0.001342 0.000436
0.001355 0.000566 0.001921 0.008828 0.001324 0.000455
0.001324 0.000547 0.001871 0.008699 0.001259 0.000446
0.001217 0.000499 0.001716 0.008096 0.001149 0.000422
0.001188 0.000464 0.001652 0.008177 0.001098 0.000405
0.001123 0.000427 0.001550 0.007718 0.001049 0.000400
0.001050 0.000296 0.001346 0.007167 0.000969 0.000400
0.001001 0.000280 0.001281 0.007033 0.000911 0.000400
0.000983 0.000277 0.001260 0.006699 0.000839 0.000400
Source: Ut.ah State Tax Com.mission· Pl'operty Tax Division
Metropolitan
Water
District
of Orem
0.000036
0.000039
0.000040
0.000039
0,000036
0.000035
0.000033
0.00003]
0.000030
0.000027
Notes: The City's basic property tax rate is primarily increa.sed by: 1) a majority vote of the City Council afte1• holding public hearings, 2) the approval of general obligation debt by a majority of the City's residents, 3) through a Judgment levy due to a cout'! ordered reduction to an entity(s) property tax, and 4) the overall assessed prope1ty values of the City's residents are reduced by the County Assessor. Rates for debt service are set based on each year's requirements. The tax rate is applied dit-ectly to the taxable value of the property.
1 Overlapping rates are those of local and county governments. These rates apply to all property owners within the City of Orem.
• Taxes are collected and reported by the County on a calendar year basis rather than July 1 to June 30 fiscal year.
Direct and Overlapping Property Tax Rates Calendar Year 2019
CUWCD Utah County 4.3%
9.1% 1 ~MetroWater of Orem
0.3%
~ ~ City of Orem Alpine___., 13.7% School District 72.6%
-156-
Total
0.011710
0.012508
0.012568
0.012314
0.011419
0.011367
0.010750
0.009913
0.009655
0.009225

Taxpayer
University Place $
Pacificorp
Woodtusk LLC
TCU Properties
Midtown360 LLC
Timpanogos Regional Hospital
Parkway Lofts LLC
Dominion Energy ( Questar Gas)
Pinnacle Apartments
Wolverine Crossing LLC
University Crossing Shopp ing Ctr
Carillon Square LLC
CenturyLlnk (Qwest Corp.)
Greater Growth Properties (GGP)
Retail Trust IJI (Walmart)
Orem Eastpointe LLC
Dayton Hudson Corpor ation
Canyon River Partnership LLC
Total $
City of Orem
Principal Property Tax Payers
Current Year and Nine Years Ago
(Unaudited)
Calendar Year
2019
Percentage
of Total
Taxable Taxable
Assessed Assessed
Value1 Rank Value
211.635,900 3.11%
66,814,547 2 0.98%
66,118,300 3 0.97%
57,562,000 4 0.85%
54,703,568 5 0.81%
46,479,600 6 0.68%
42,220,200 7 0.62%
40,689,800 8 0.60%
34,943,200 9 0.51%
30,175,300 10 0.44%
28,242,900 11 0.42%
25,817,600 12 0.38%
705,402,915 10.38%
Calendar Year
2010
Taxable
Assessed
Value1 Rank
$ 120,206,350 1
48,836,943 4
61,339,865 2
49,741,991 3
16,568,169 9
19,401.808 7
23,368,370 5
20,751,706 6
16,796,051 8
14, 553,007 10
14,268,829 11
13,367,672 12
$ 4 19,200,761
1 Assessed values are reported by the County on a calendar year basis rather than July l to June 30 fiscal year.
-157-
Percentage
of Total
Taxable
Assessed
Value
2.68%
1.09%
1.11%
0.37%
0.43%
0.52%
0.46%
0.37%
0.32%
0,32%
0.30%
9.34%
Calendar Total
Year1 Tax Levy
2010 $ 7,075,315
2011 7,301,643
2012 7,370,522
2013 7,374,914
2014 7,387,198
2015 7,529,322
2016 7,586,065
2017 7,204,690
2018 7,252,003
2019 7,480,867
City of Orem
Property Tax Levies and Collections
Last Ten Calendar Years
(Unaudited)
Percent of
Current Tax CWTent Taxes
Collections Collected
$ 6,381,759 90.20%
6,644,493 91.00%
6,788,600 92.10%
6,815,131 92.41%
6,793,773 91.97%
6,935,505 92.11%
7,059,043 93.05%
6,754,817 93.76%
6, 740,722 92.95%
6,825,355 91.24%
Delinquent
Tax
Collections
by Tax
Levy Year
$ 594,240
558,514
480,274
439,124
493,765
513,438
484,862
415,580
394, 179
539,380
1 Taxes are levied, collected, a.ud repo,·ted by the County on a calenda1· or tax levy year basis
rather than a July l to June 30 fiscal year.
-158-
Total Tax
Collections
$ 6,975,999
7,203,007
7,268,874
7,254,255
7,287,538
7,448,943
7,543,905
7,170,397
7,134,901
7,364,735

Outstanding Ratio of
Ratio of Delinquent Outstanding
Total Tax Taxes Delinquent
Collections to by Tax Taxes to
Total Tax Levy Le~Year Total Tax Levy
98.60% $ 99,316 1.40%
98.65% 98,636 1.35%
98.62% 101,648 1.38%
98.36% 120,659 1.64%
98.65% 99,660 1.35%
98.93% 80,379 1.07%
99.44% 12,160 0.56%
99.52% 34,293 0.48%
98.39% 117,102 1.61%
98.45% 1 l6, 132 1.55%
-159-

City of Orem
Sales Taxes by Category
Last Ten Fiscal Years
(Unaudited)
Fiscal Year
2011 2012 2013
General Merchandise and Grnceries $ 4,712,411 $ 4,959,192 $ 5,030,506
Building Materials, Hardware, and Tools 1,499,525 1,589,790 1,576,835
Auto Dealers, Supplies, and Accessories 2,141.910 2,338,347 2,769,371
Home Furnishings. Appliances. & Electronics 1,428,452 1,560,747 1,6 14.843
Eating and Drinking Establishments 1,097,571 1,200,356 1,104,646
Clothing, Apparel, and Accessories 1,352,740 1,435,943 1,397,682
Professional Equipment and Supplies 933,040 1,031,773 1,207,903
Arts, Crafts, and Specialty Items 338,630 312,424 291,241
Amusement and Recreation 540,342 559,763 551 ,462
All Other Categories 1,494,365 1,465,414 1,688,683
Subtotal - City Local Sales Tax l.5,538,986 16,453,749 17,233,172
Cultural Arts & Recreation Enhancement (CARE) 1,557,238 1,652,524 1,711,475
Transportation Infrastructure
Mass Transit · Additional
Total City Sales Taxes $ 17,096,224 $ 18,106,273 $ 18,944,647
Total City Sales Tax Rate 1 1.10% 1.10% 1.10%
% Increase (Decrease) from prior year, All 1.89% 5.91% 4.63%
% Increase (Decl'ease) from prior year, City Local Sales Tax Only 1.71% 5.89% 4.74%
Source: lnte1·nally generated, but based upon sales tax amounts rep01-ted to the City by the Utah State Tax Commission.
t See sales tax rate breakdown on page 164 for additional information regarding this rate.
-160-
2014
$ 5,140,689
1.661.997
2,874,555
1,685,399
1,168.448
1,464,384
1,378,551
322,670
5'78, 775
1,732,104
18,007,572
1,811,395
$ 19,818,967
1.10%
4.62%
4.49%

$
$
2015 2016
5,277,987 $ 5,333,279
1,801,399 1,952,417
2,899,382 2,979,991
1,786,258 1,822,364
1,245,543 1,314,508
1,528,112 1,573,936
1,429,657 1,526,283
359,128 382,199
650,710 656,716
1,852,879 1,921,222
18,831,055 19,462,915
1,888,230 1,934, 153
8,272 8,665
20,727,557 $ 21,405,733
1.10% 1.10%
4.58% 3.27%
4.57% 3.36%
$28,000,000
$26,000,000
$24,000,000
$22,000,000
$20,000,000
$18,000,000
$16,000,000
$14,000,000
Fiscal Year
2017 2018
$ 5,637,951 $ 5,934,245 $
2,299,711 2,585,913
3,151,370 3,410,522
1,964,207 2,101,318
1,499,483 1,749,330
1,552,018 1,582,714
1,554,830 1,596,802
377,497 387,574
674,845 683,181
2,002,205 2,166,357
20,714,117 22,197,956
2,028,528 2,163,259
8,062 489
$ 22,750,707 $ 24,361,704 $
1.10% 1.10%
6.28% 7.08%
6.43% 7.16%
Total Sales Taxes by Fiscal Year (City Local Sales Taxes Only)
-161-
2019 2020
6.105,107 $ 6,578,582
3,028,016 3,479,383
3,694,537 3,802,737
2,082,860 1,807, 145
1,809,424 1,664,412
1,299,340 1.129,901
1,602,008 1,893,016
358.450 367,346
726,998 743,740
2,027,097 2,270,648
22,733,837 23,736,910
2,208,004 2,284.064
2,129,802
2,580 814
24,944,421 $ 28,151,590
1.20% 1.20%
2.39% 12.86%
2.41% 4.41%

City of Orem
Other Sales Tax Revenue Information by Category
Current Year and Nine Years Ago
(Unaudited)
Fiscal Year 2020
Local
Number Percentage Sales Tax
of Filers of Total Revenue
General Merchandise and Groceries 1,4.28 17.12% $ 6,578,582
Building Materials, Hardware., and Tools 394 4.72% $ 3,479,383
Auto Dealers, Supplies, and Accessories 485 5.82% $ 3,802,737
Home Furnishings, Appliances, & Electa-onics 346 4.15% $ 1,807,145
Eating and Drinking Establishments 334 4.00% $ 1,664,412
Clotbjog, Apparel, and Accessories 545 6.53% $ 1,129,901
Professional Equipment and Supplies 1,461 17.52% $ 1,893,016
Arts, Crafts, and Specialty items 420 5.04% $ 367,346
Amusement and Recreation 487 5.84% $ 743,740
All Other Catego,·ies 2,440 29.26% $ 2,270,648
Total 8,340 100.00% $ 23,736,910
Fiscal Year 2011
Local
Number Percentage Sales Tax
of Filers of Total Revenue
General Merchandise a nd Groceries 260 10.53% $ 4,712,411
Building Mate.rials, Ha,·dware, and Tools 149 6 .03% $ 1,499,525
Auto Dealers, Supplies, and Accessories 24.Z 9.80% $ 2,141,910
Home Furnishings, Appliances, & Electrnnics 201 8.14% $ l ,428,452
Eating and Drinking Establishments 184 7.45% $ 1,097,571
Clothing, Apparel, and Accessories 164 6.64% $ 1,352,740
Professional Equipment and Supplies 281 11.38% $ 933,040
Arts, Crafts, and Specialty Items 277 11.21% $ 338,630
Amusement and Recreation 126 5.10% $ 540,342
All Othel' Categories 586 23.72% $ 1,494.865
Total 2,470 100.00% $ 15,538,986
Source: Internally generated, but based upon sales tax amounts reported to the City by the Utah State Tax Commission.
-162-
Percentage
of Total
27.71%
14.66%
16.02%
7.61%
7.01%
4.76%
7.97%
1.55%
3.13%
9.57%
100.00%
Percentage
of Total
30.33%
9.65%
13.78%
9.19%
7.06%
8.71%
6.00%
2,18%
3.48%
9.62%
100.00%

City of Orem
Principal Sales Tax Payers
C=ent Year and Nine Years Ago
(Unaudited)
Fiscal Year Fiscal Year
2020
Percentage
of Total
Local Local Local
Sales Sales Sales
Taxpayer Taxes i Rank Taxes 1 Taxes 1
Costco Wholesale Corporation NIA 1 NIA NIA
Wal·Mart Supe1·center NIA 2 NIA NIA
Brent Brown Toyota NIA 3 NIA NIA
Target NIA 4 NIA NIA
Winco Foods NIA 5 NIA NIA
RC Willey Home Furnishings NIA 6 NIA NIA
Pacificorp (Utah Power & Light) NIA 7 NIA NIA
Mountainland Supply Company NIA 8 NIA
Ken Garff Honda of Orem NIA 9 NIA NIA
BMC Holdings Inc. NIA 10 NIA
Lowes Home Centers LLC NIA 11 NIA
Smith's Food & Drug NIA 12 NIA
Ken Garff Nissan of Orem NIA
U.S. Synthetic Corporation NIA
Best Buy Stores LP NIA
Dominion Energy (Questar Gas) NIA
Total $ 6,821,497 28.74% $ 5,630,760
Source: Utah State Tax Commission.
1 Due to confidentiality issues, the amoun ts and percentages of the twelve largest revenue payers cannot be displayed. However, the aggregate total is displayed along with the individual rankings in an effort to provide the reader with information as to where the City's sales tax base originates.
-163-
2011
Rank
1
2
6
3
10
4
5
11
7
8
9
12
Perce.ntage
of Total
Local
Sales
Taxes 1
NIA
NIA
NIA
NIA
NIA
NIA
NIA
NIA
NIA
NIA
NIA
NIA
31.27%

Fiscal
Year
2011
2012
2013
2014
2015
2016
2017
2018
2019
2020
Fiscal
Year
2011
2012
2013
2014
2015
2016
2017
2018
2019
2020
City
Direct
Rate
1.00%
LOO 1.00
1.00
1.00
l.00
1.00
1.00
1.00
1.00
County
Direct
Rate
0.25%
0.25
0,25
0.25
0.25
0,25
0.25
0.25
0.25
0.25
City of Orem
Direct and Overlapping Sales Tax Rates
Last Ten Fiscal Years
(Unaudited)
City'Dlrect Sales Tax Rates
City City Total
Cultural Transportation City
Arts & Rec J nfrastructure Direct
Rate 1 Rate 2 Rate
0.10% 0.00% 1.10%
0.10 0.00 1.10
0.10 000 1.10
0.10 0.00 1.10
0.10 0.00 1.10
0.10 0.00 I.JO
0.10 0.00 LIO
0.10 0.00 1.10
0.10 0.10 l.20
0.10 OJO 1.20
Overlapping Sales Tax Rates
County
County County Airport,
Transportation Mass Highway, & State
Infrastructure Transit Public Transit Direct
Rate 2 Rate Rat e Rate 8
0.00% 0.30% 0.25% 4.70%
0.00 0.30 0.25 4.70
0.00 0.30 0.25 4.70
0.00 0.30 0.25 4..70
0.00 0.30 0.25 4.70
0.00 0.30 0.25 4.70
0.00 0.30 0.25 4.70
0.00 0.30 0.25 ~.70
0.15 0.30 0.25 4.85
0.lS 0.30 0.25 4.85
Source: Utah State Tax Commission
1 This additional sales tax rate, titled CARE tax, was voted on by the citir..ens of Orem and went into effect on April L, 2006. It was i·eauthorized by citizen vote in November 2013 to continue for another ten years.
2 Th.is new sales tax i-ate was approved by Utah County. The new tax went into effect on April I, 2019. The City diJ:ectly receives a share of the ne,v ta.ic but d.oes not begin to receive these funds until July l , 2019, due to an agreement with Utah County. The additional tax is t.o be used to fund eligible transportation projects.
3 'T'he State of Utah direct sales tax rate was increased effective April 1. 2019.
4 The total sales tax rate foi· non-prepared food and food ingredients was set at 3.00% ijtatewide (1.00% City DiJ:ect Rate, 0.25% County Direct Rate, and 1.75% State Direct Rate) and went into effect on Januru-y l, 2008.
-164-
State
Mass Total
Transit Sales Tax
Rate Rate 4
0.25% 6.85%
0.25 6.85
0.25 6.85
0.25 6.85
0.25 6.85
0.25 6.85
0.25 6.85
0.25 6.85
0.25 7.25
0.25 7.25

City of Orem
Pledged-Revenue Coverage
Last Ten Fiscal Years
(Unaudited)
Sales Tax Revenue Bon.de
Local
Fiscal Sales Debt Service
Year T!L'XeS Principal Interest Coverage
2011 $ 15.538.986 $ 675,000 $ 396,907 14.50
2012 16,453, 749 710,000 367,619 15.27
2013 17,233.172 746.000 268,182 16.99
2014 18,007,572 840,000 256,669 16.42
2015 18,831.055 853,000 243,•14(\ 17.17
2016 19,462,915 1,065,000 21(:l,274 HU9
2017 20,714,117 1,125.000 106.824 16.82
2018 22,197,956 1,231,000 64.34.2 17.H
2019 22,733,837 459,000 32.340 46.27
2020 23,736,910 352,000 23,435 63.23
Water & Storm Sewer Revenue Bonds
Utility Leas: Net
Fiscal Service Operating Available Debt Service
Year Charges Expenses 1 Reven ue Principal Interest
20ll $ ll,745,056 s 8.586,094 $ 3, 158,962 s 853,000 $ 988,788
2012 12,544,643 8,851,011 3,693, 632 890.000 972,772
2013 12.864.,859 9,2;;6,350 3,608 ,509 917,000 940,512
2014 13,927.292 9,!:lM,494 4..112, 798 944,000 792, 256
2015 14,141.179 9,588,439 4,552,740 1,228,000 619,984
2016 14 ,847.40] 9.468,250 5.379, Hi] 1,267.000 678,638
2017 17.169.942 10,000,616 7, l69,32fi 1,326,000 412,0ll
2018 20,133,406 10,509.666 9,623,740 1,279.000 424,593
2019 21,342,117 l 1,212,585 J0.129,532 1,380,000 896, 703
2020 23,140,323 [1,557,200 11,683, )23 1.-159,000 fJ66,956
Water Quality Revenue Bonds
Utility Less: Net
Fiscal Service Operating Available Debt Service
Year Charges Expenses 1 Revenue Principal
2011 $ 5,857.655 $ 4,905.989 $ 951.66Ei $ 200,000
2012 6,201,588 4,872,165 1,329.423 207,000
2013 6,380,841 5,014.836 1,366,005 816,000
2014 6,449,8~~ 5,016,388 1,433.461 824,000
2015 6.444,fl75 4.700.320 1,744.655 831,757
2016 6,437,198 6',086,210 1,350,988 594,000
2017 7,858,574 5, 019,509 2,839,065 594, 000
2018 8,946,217 5,196.452 3,749,765 594, 000
2019 10.742,759 5,443.185 5,299,574 594,000
2020 12,635,219 5,512.744 7,122,475 594,000
Notes: Details regarding the city's outstanding debt can be found in the notes to the financial statements.
1 Operating expenses do not include depreciation, interest, or amortization
e,q,enses. -165-
Interest
s 45,912
35.893
24,142
16.372
8.321
Coverage
1.72
1.98
1.9,1
2.37
2.46
2.91
4.13
5,65
5.70
6.34
Coverage
3.87
5.47
l.63
1.71
2.08
2 .. 27
4_75
6-31
8.92
ll.99

City of Orem
Ratios of Outstanding Debt by Type
Last Ten Fiscal Years
(Unaudited)
Governmental Activities
Sales Franchise General G.O. Bonds Special Tax Tax
Fiscal Obligation Issuance Assessment Revenue Revenue
Year Bonds Premiums Bonds Bonds Bonds 2011 $16,460,000 $ 318,566 $ 7,229,000 $ 8,115,000 $ 3,875,000
2012 15,210,000 288,101 5,925,000 7,434,000 3,375,000
2013 13,900,000 257,636 5,444.000 6,688,000 2,850,000
2014 12,550,000 227,170 4,446,000 5,848,000 2,300,000
2015 11,830,000 695,160 1, 155,000 4,995,000 1,750,000
2016 10, 200,000 611,762 165,000 3,930,000 1,150,000
2017 8,535,000 528,364 155,000 2,898,000 525,000
2018 7,310,000 452,969 140,000 1,667,000
2019 30,560,000 4,050,044 130,000 1,208,000
2020 29,620,000 3,851,333 856,000
Business·type Activities
Water Water & Revenue Total
Quality Storm Sewer Bonda Business· Fiscal Revenue Revenue Issuance type Year Bonda Bonds Premiums Activities 2011 $10,312,757 $ 22,190,000 $ 602,009 $ 33,104,766
2012 12,578.757 21,300,000 560,200 34.438,957
2013 11,762,757 20,383,000 518,391 32,664,148
2014 10,938,757 21,535,000 476,585 32,950.342
2015 10,107,000 20,307,000 434,776 30,848,776
2016 9,513,000 19,040,000 392,965 28,945,965
2017 8,919,000 17,019,000 1,014,797 26,952,797
2018 8,325,000 15,740,000 912,889 24,977,889
2019 7,731,000 14,360,000 810,978 22,901,978
2020 7.137,000 12,901,000 709,067 20,747,067
Notes: Details regarding the city's outstanding debt can be found in the notes to the financial statements.
-166-
Revenue
Bonds
Issuance Notes
Premiums Payable
$ 493,615 $ 1,339,146
428,323 1,268,313
363-,031 1,199,599
297,740 1,122,977
232,449 1.045,022
167,158 960,652
101.867 869,779
52,426 769,946
41,487 668,147
30,547 562,186

Governmental Activities
Total
Capital Governmental
Leases Activities
$ 82,497 $ 37,912,824
576,512 34,505,249
478,299 3] .180,565
396,436 27,188,323
352,173 22,054,804
6,977,000 24,161,572
6,893,313 20,506,323
6,345,670 16,738,011
5,974,929 42,632,607
5,5 13,323 40,433,389
Total Primary Government
Percentage Direct
Total of City Debt
Primary Personal Per
Government Income Capita
$ 71,017,590 4.75% $801
68,944,206 4.42 772
63,844, 713 3.67 713
60,138,665 3.47 667
52,903,580 2.84 565
53,107,537 2.65 554
47,459,120 2.) 9 487
41,715,900 1.85 426
65,534,585 2 .69 666
61,180,456 2 .31 612
-167-

City of Orem
Ratios of Net General Obligation Bonded Debt Outstanding
Last Ten Fiscal Years
(Unaudited)
Taxable Gross Debt Service
Fiscal Assessed Bonded Monies
Year Population 1 Value Debt Available 2
2011 88,697 $ 4,490,211,229 $16,778.566 $ 49,299
2012 89,279 4,490,211,229 16, 498,101 1,282,169
2013 89,584 4,273,495,983 14,157,636 1,654,406
2014 90,154 4,230,603,628 12,777,170 399,982
2015 93,601 4,333,955,495 12,525,160 1,557,040
2016 95,788 4,687,940,210 10,811,762 861,873
2017 97,499 4,934,464,071 9,063,364 1,098,713
2018 97,839 5,294,517,047 7,762,969 916,971
2019 98,328 5,734,268,035 34,610,044 3,789,092
2020 99,969 6,794,132,095 33,471,333 2,694,732
1 Population estimates were based upon census data and building activity within the City,
~ Debt service monies avaiJabl~ are net of reserves dedicated to other debt issues, i.e., revenue
bouds nnd capital leases .
-168-
Net
Bonded
Debt
$ 16,729,267
14,215,932
12,503,230
12,377,188
10,968,120
9,949,889
7,964,651
6,845,998
30,820,952
30,776,601
Ratio of Net
Bonded Debt Net
To Taxable Bonded
Assessed Debt Per
Value CaEita
0.37% $189
0.33 159
0.30 140
0.29 137
0.23 117
0.20 104
0.15 82
0.12 70
0.49 313
0.45 308

City of Orem
Direct and Overlapping Governmental Activities Debt
June 30, 2020
(Unaudited)
Total Percentage
Governmental Applicable to
Activities the Citizens
Debt of the
Jurisdiction Outstanding City of Orem 1
Direct Debt:
City of Orem $ 40,433,389 100.0000%
Overlapping Debt:
Alpine School District 565,645,000 20.8336%
Utah County 13.6567%
Central Utah Water Conservan cy District 192,855,487 4. 1008%
'l'otal Overlapping Debt 758,500,487
Total Direct and Overlapping Debt $ 798,933,876
Total Direct and Overlapping Debt Per Capita
Sources: Assessed value data used to calculate applicable percentages was provided by the Utah State Tax Commission.
Notes: Overlapping governments are those that coincide with the geographic boundaries of the city. This schedule estimates the portion of the outstanding debt of those overlapping governments that is borne by the residents and businesses of the City of Orem. This process recognizes t hat, when considering the City's ability to issue and repay long·term debt, the entire debt bluden borne by the residents and businesses should be taken into accow1t. However, this does not imply that ever y ta::-;payer is a resident (and therefore 1·esponsible for repaying the debt) of each overlapping government.
1 This percentage uses taxable assessed property vaJues. Applicable percentages were calculated by determining the portiou of another govei·nmental unit's taxable assessed value that is within the City's boundaries and dividing it by each unit's total taxable assessed value.
-169-
Amount
Applicable to
the Citizens
of the
City of Orem
$ 40,433,389
117,844,399
7,908,585
125,752,984
$ 166,186,373
$ 1,662

General Pl,!!lloses (4%)
Debt Limit $
Tot.al Net Debt Applicable to Limit
Legal Debt Margin $
Total Net Debt Applicable to Limit as a Percentage of Debt Limit
Water, Sewer, & Lighting (4%)
Debt Limit $
Total Net Debt Applicable to Limit
Legal Debt Margin $
Total Net Debt Applicable to Lir:n.it as a .Percentage of Debt Limit
Total (8%)
Debt Limit $
Total Net Debt Applicable to Limit
Legal Debt Mar~n s
Total Net Debt Applicable to Limit as a Percentage of Debt Limit
City of Orem
Legal Debt Margin Information
Last Ten Fiscal Years
(Unaudited)
Fiscal Year
2011 2012
26L817,432 $ 248,829,831 $
(16,410,701) (13,927,831)
245,406,731 $ 234,902,000 $
6.27% 5.60%
261,817,432 $ 248,829,831 $
261,817,432 $ 248,829,831 $
0.00% 0.00%
523,634,864 $ 497,659,662 $
(16,410,701) (13,927,831)
507,224,163 s 483,731,831 s
3.13% 2.80%
2013
244.125,324
(12,418,290)
231,707,034
5.09%
244,125,324
244.125,324
0.00%
1J88,250,648
(12,418,290)
475.832,358
2.54%
1 The 8% debt limitation applies only to general obligation bonded debt. The City is limited to 4% for general purposes with the other 4% a nd any remaining unused general purpose$ portion being availabe for use for water, sewer, and lighting purposes.
~ Debt service monies available are net of.reserves dedicated to other debt issues (i.e. revenue bonds and capital leases).
-170-
2014
$ 251,1110,417
(15,781,433)
$ 235,358,984
6.28%
s 251,140,417
$ 2{H, 140,417
0.00%
$ 502,280,834
(15,781,433)
$ 486,499.401
3.14%
Fiscal Year
2015 2016 2017
$ 273,693,527 $ 290,709,109 $ 3 13,847,899
(8,722,156) (7,964,651) (7,964,651)
s 264,971,37L $ 282,744,458 $ 305,883,248
3.19% 2.74% 2.54%
$ 273,693.527 $ 290,709, 109 $ 313,847.899
:s 273,69:3.527 $ 290. 70ll, l 09 $ 313.847.899
0.00% 0.00% 0.00%
:ti 547,::!87,054 :ti 581,418,218 $ 627,695,798
(8,122.156) (7,964,651) (7,[)64,661}
$ 538,664,898 s 573,453,567 $ 619.731, 1,17
1.59% 1.37% 1.27%
Legal Debt Margin Calculation for Fiscal Year 2020
Assessed Valuations:
Taxable Value
Estimated Market Value
Legal Debt Margin:
Debt Limitation· 8% of Estimated Market Value 1
Debt Applicable to Limitation:
Total General Obligation Bondec,i. Debt
Less:
Assets in Debt Serviae Funds Available
for payment of Principal 2
Total Debt Applicable to Limitation
Legal Debt Margin
$
$
$
$
$
$
-171-
2018 2019
341,392,514 $ 372,228,481
(6. 845,998) (30,859,318)
334,546,516 $ 341,369,163
2.01% 8.29%
341,392.514 $ 372,228,481
341,392,514 $ 372, 228-481
0.00% 0.00%
682,785,028 $ 744,456,962
(6,845,998) (30,859,318)
675,939,030 $ 718,597,644
1.00% 4. 15%
$ (33,471,333)
2,694,732
2020
$ 408,651,40 L
(30,776.60 I)
$ 377,874.800
7.53%
$ 408,651.401
$ 408,651.401
0.00%
$ 817.302.802
(30,776.601)
$ 786,526,201
3.77%
$ 6,794,132,095
$ 10.216,285,032
$ 817,302,803
(30,776,601)
$ 786,526,202

City of Orem
Loog·term Bonded Indebtedness Paid By Primary Government
Schedule of Bonded Indebtedness
June 30, 2020
(Unaudited)
Issue
Interest Rate Date
Governmental Activities:
General Obligation Bonds:
Series 2014 Road Bonds - Refunding 0.25% - 3.00% 11/05/14
Series 2019 Bonds 3.625% · 5.00% 02/26/19
Total General Obligation Bonds
Special Assessment Bonds:
Nortbgate - Special Improvement District
Bonds - Ser ies 2010 7.75% 11/02/10
Total Special Assessment Bonds
Revenue Bonds:
Sales Tax Revenue Refunding Bonds · Series 2017 1.94% 02/23/17
Total Revenue Bonds
Total Governmental Activities
Business·type Activities:
Revenue Bonds:
2005B Water and Storm Sewer Revenue Bonds 1.48% 03/17/05
Water Quality Revenue Bonds 0_00% 02/16/10
2013 Water and Storm Sewer Revenue Refunding Bonds 2.18% 07/02/13
2016 Water and Storm Sewe,r Revenue Refunding Bonds 2.00% · 4.50% 10/25/16
Total Revenue Bonds
Total Business-type Activities
Total Primary Government Long·te1·m Bonded Indebtedness
~172-
Annual
Term of Terms of
Bonds Serial Bonds
2014-2024 Vanous
2019-2048 Various
2010·2025 Various
2017·2023· Various
2005·2025 Various
2010·2032 Various
2013·2025 Various
2016·2028 Various

Principal
Retired
Original Balance Year Ended
Amount 06/30/20 06/30/20
$ 9,645,000 $ 5,120,000 $ 940,000
$ 24,500,000
$ 1,915,000
$ 2,898,000
$ 3,000,000
$ 11,889,000
$ 12,801,000
$ 4,380,000
$
24,500,000
29,620,000
856 000
856,000
30,476,000
994,000
7,137.000
7,627,000
4,280,000
20,038,000
20,038,000
50,514,000
940,000
130,000
130.000
352!000
352.000
1,422.000
157,000
594,000
1,202,000
100,000
2,053,000
2,053,000
$ 3,475,000
Interest
Expense
Year Ended
06/30/20
$ 157,175 $
1,601,642
1,658,817
10,075
10,075
23,435
23,435
1,692,327
17,035
179,371
170,550
366,956
366,956
$ 2,059,283 $
-173-
Payable
In Future
Years
355,288
22,808,994
23,164,282
31,136
31,136
23,195,418
52,111
509,542
1,151,375
1,713,028
1,713,028
24,908,446

City of Orem
Other Long·tenn Liabilities Paid by Primary Government
Last Three Fiscal Years
(Unaudited)
Fiscal Year
2018 2019
Governmental Activities:
Compensated Absences $ 2,076,015 $ 2,081,476
Net Pension Liabilities 7,461,221 15.276,459
Claims and Judgments 1.320,075 1,379,031
Other Post-employment Benefits (OPEB) 166,530 156,530
Total Governmental Activities 11,023,841 18,893,496
Business-type Activities:
Compensated Absences 339,040 329.245
Net Pension Liabilities 1,54-9,102 2,827,423
Total Business-type Activities 1,888.142 3,156,668
Primary Government:
Compensated Absences 2,415,055 2,410,721
Net Pension Liabilities 9,010,323 18,103,882
Claims and Judgments 1,320,075 1,379,031
Other Post-employment Ben efits (OPEB) 166,530 156,530
Total Prima.ry Government $ 12,9 11,983 $ 22,050 .164
-174-
2020
$ 2,218,836
7,255,064
1,069,320
157,627
10,700,847
348.645
1,257,893
1,606.538
2,567,481
8,512,957
1,069,320
157,627
$ 12,307,385

City of Orem
Demographic and Economic Statistics
Last Ten Fiscal Years
(Unaudited)
Per Per
Capita Household
Fiscal Personal Personal
Year Population 1 Households 2 Income Income 2'
2011 88,697 26,970 $ 1,495,165,329 $ 16,857 $
2012 89,279 27,533 1,559,347,014 17,466
2013 89,584 27,515 1,738,556,688 19,407
2014 90,154 27,486 1,734,833,422 19,243
2015 93,601 28,520 1,863,502,309 19,909
2016 95,788 29,534 2,005,130,204 20 ,933
2017 97,499 29,594 2,170,912,734 22,266
2018 97,839 30,009 2,256,754,374 23,066
2019 98,328 30,705 2,437,747,776 24,792
2020 99,969 31,233 2,649,878,283 26,507
City K·12 uvu Fiscal Median Unemployment Student FTE Student
Year A~e Rate Population 3 Population 4
2011 26.2 8.50% 16,304 21,825
2012 26.3 6.40 16,359 22,448
2013 26.3 5.30 16,437 21,617
2014 26.4 3.90 16,275 20,697
2015 26.5 3.50 15,757 2 1,335
2016 26.5 3.90 15.787 22,591
2017 26.6 3.70 15,668 23,706
2018 26.6 3.30 15,644 25,037
2019 26.6 3.10 15,608 26,574
2020 26.5 5.00 14,595 27,531
1 Population esti111ates were based upon census data and building activity within the City.
~ Data is based upon federal income tax 1·eturn data provided by the Utah State Tax Commission. 'l'he data for
the current fiscal yeal" is based on the most recent ca,Jendar year data.
a Data was p,·ovided by the Alpine School Disirict. 1 Data rnpresents fall semeste1· counts based <1n the Utah Valley University (UVU) fact book.
-175-
Personal
Income
55,438
56,636
63,186
63,117
65,340
67,892
73,357
75,203
79,393
84,842
City of Orem
Other Demographic Statistics
(Unaudited)
Census Population Count
Percent Year Population Increase Increase 1890 435 1900 ,592 257 37.14% 1910 1,064 372 34.96 1920 1,664 600 36.06 1930 1,915 251 13.11 1940 2,914 999 34.28 1950 8,338 5,424 65.05 1960 18,394 l0,056 54.67 1970 25,760 7,366 28.59 1980 52,399 26,639 50.84 1990 67,561 15,162 22.44 2000 84,324 16,763 19.88 2010 88,328 4,004 4.53
Age Distribution of Population 1
Total Male Female A~e Number Percent Number Percent Number Percent 0-4 8,940 10.12% 4,822 5.46% 4,118 4.66% 5 - 9 8,314 9.41 4,685 5.30 3,629 4.11
10 - 14 6,512 7.37 3,421 3.87 3,091 3.50 15 · 19 7,145 8.09 3,457 3.91 3,688 4.18 20 - 24 10,694 12.11 5,211 5.90 5,483 6.21 25 · 29 10,485 11.87 5,106 5.78 5,379 6 .09 30 - 34 5,453 6.17 2,879 3.26 2,574 2.91 35 · 39 5,360 6.07 2,702 3.06 2,658 3.01 40 - 44 3,326 3 .77 1,660 1.88 1,666 1.89 45 - 49 3,771 4.27 1,893 2.14 1,878 2.13 50 - 54 3,728 4.22 1,797 2.03 1,931 2.19 55 - 59 3,884 4.40 1,697 1.92 2,187 2.48 60 · 64 3,359 3.80 1,498 1.70 1,861 2.11 65 - 69 2 ,332 2.64 1,097 1.24 1,235 1-40 70 · 74 2,025 2.29 1,020 1.15 1,005 1.14 75 · 79 1,269 1.44 492 0.56 777 0.88 80 · 84 1,037 1.17 298 0.34 739 0.84 85 · 89 466 0.53 264 0.30 202 0.23
90+ 228 0.26 70 0.08 158 0 .18 TOTAL 88,328 100.00% 44,069 49.89% 44,259 50.11%
1 Source: 2010 Census
-176-

Taxpayer
Utah Valley University
Alpine School District
City of Orem
Timpanogos Regional Hospital
Wal·Mart
Target Stores
United Parcel Service, Inc.
Mity·Lite, Inc.
Wayfair
U.S. Synthetic Corporation
Convergys Corporation
Omniture, [nc.
Security One International Inc.
Dialogue Marketing West
Total
City of Orem
Principal Employers
Current Year and Nin.e Years Ago
(Unaudited)
Fiscal Year
2020
Percentage
Number of
of Total City
Employees Rank Employment
2,998 5.91%
1,358 2 2.68%
528 3 1.04%
505 4 1.00%
375 5 0.74%
361 G 0.71%
356 7 0.70%
355 8 0.70%
352 9 0.69%
347 lO 0.68%
7,535 14..86%
Number
of
Employees
1,902
1,864
544
584
360
430
624
538
384
360
7,590
Source: Orem City's business licensing database and personal communications with certain governmental entities by Orem City personnel.
-177-
Fiscal Year
2011
Percentage
of
Total City
Rank Em;eloiment
1 3.94%
2 3.87%
5 1.13%
4 1.21%
9 0.75%
7 0.89%
3 1.29%
6 1.12%
8 0.80%
10 0,75%
15.74%

General Government
Public Safety:
Police Protection
Fire Protection
Highways and Public improvements
Parks and Rec1·eation:
Parks and Recreation
Library
Cemetery
Economic and Physical Development
Water
Water Reclamation
Storm Water
Recreation
Street Lighting
Total
City of Orem
Full-Time-Equivalent City Government Employees
by Function/Program
Last Ten Fiscal Years
(Unaudited)
Fiscal Year
2011 2012 2013
115 110 102
140 136 131
70 70 65
1 0 0
36 36 29
50 43 45
5 5 5
2 3 4
26 27 26
30 30 29
10 10 10
56 49 53
3 2 2
544 521 501
Source: City of Orem - H uman ResouTce Department
N otes: A full-time employee is scheduled to work 2,080 hours per year (including vacation and sick leave). Full-time equivalent employment is calculated by dividing total labor hours by 2,080.
-1 78-
2014
107
130
68
0
35
45
5
4
27
30
11
53
2
517
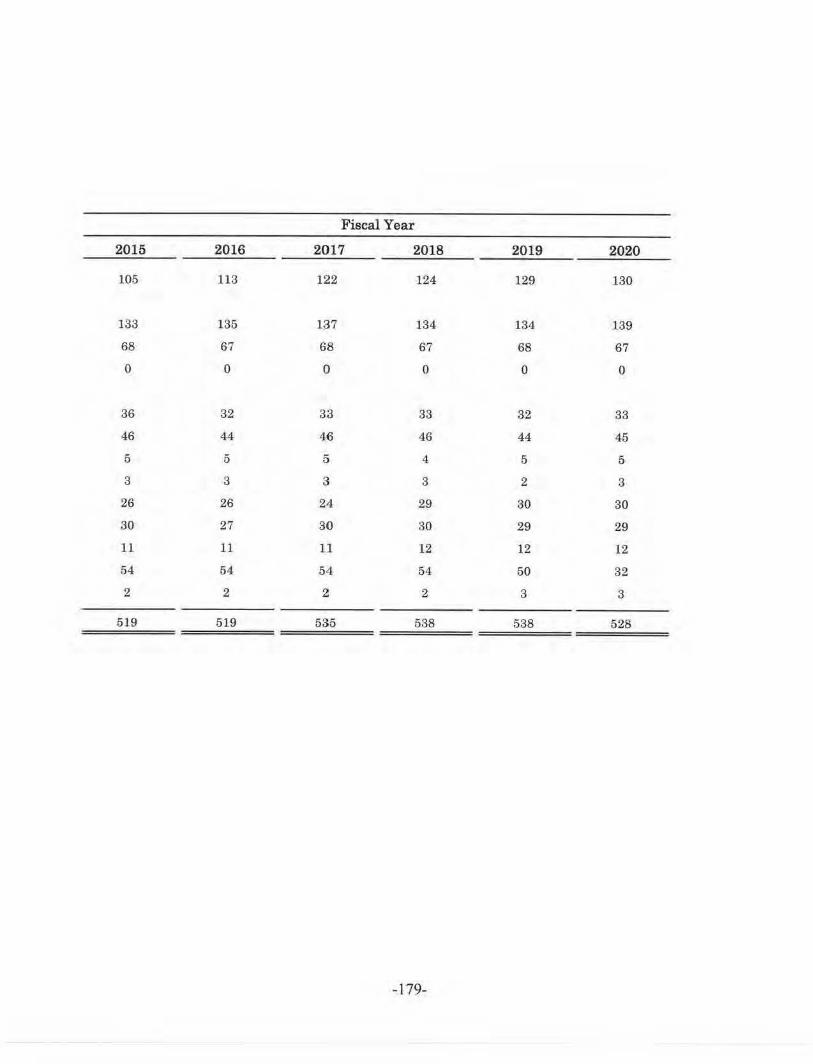
Fiscal Year
2015 2016 2017 2018 2019 2020
105 113 122 124 129 130
133 135 137 134 134 139
68 67 68 67 68 67
0 0 0 0 0 0
36 32 33 33 32 33
46 44 46 46 44 45
5 5 5 4 5 5
3 3 3 3 2 3
26 26 24- 29 30 30
30 27 30 30 29 29
11 11 u 12 12 12
54 54 54 54 50 32
2 2 2 2 3 3
519 519 535 538 538 528
-179-

General Government:
Building Permits Issued
Public Safety:
Police Protection:
Physicnl Arrests
Traffic Cilations
Fi re 'f>rotection:
Emergency Responses
Ambulance Transpor ts
Other Public Safety Services:
Emergency Dispatch Call a
Highways and Public Ul'.\Provernent.~:
Asph al t Used · Streets (Tona)
Concrete Used - Sidewalks (Yards)
Parks a nd Recreation-
Recreation Programs Participan ts
Libr ary - Volumes in Collection (approx.)
Cemetery· Interments
!Bconomic and Physical Development:
Public Service Organizations Assisted
Housing Rehab/RLF Loa1;1s/Grants Added
Major Project Improvements Completed
Water '
Number of C,:,nsumers
Avorage Daily Consumption (MGD)
Water Reclamation:
Number of Service Connection~
Average Daily Tm.ated (MOO)
Storm Water:
Number of S umps Added
New !nfrastructu:re CFeet)
Rec.reation:
Fitnes• Cen ter Admissions
Fitness Center Class Participants
Scera Park Pool Admissions
Scera Park Pool Class Pru·ticipants
Solid Waste:
Annual Waste Tonnage
Avg Annual Waste per Ho1,1sebold (Tons)
Street l,igbting:
Number of Street Lights Added
Source: Various city depart ments
City of Orem
Operating Indicators by Function / Program
Last Ten Fiscal Years
CUnaudited)
Fiscal Year
2011 2012 2013 2014
945 89!) 817 1,064
5,439 6.016 4,338 3,335
15,009 10,042 16,042 18,116
6,556 7,628 9,058 8, 105
2,500 2,320 2,434 2,461
39.44:J 39,405 37,867 24,906
5,903 5,965 5,287 4,725
1,134 1,020 796 821
l6,790 16,700 12,276 12,984
313,001 820,703 326,253 329,204
297 294 252 322
14 16 16 16
14 11 6 6
l 0
21 .807 21,965 22,107 22,176
24.2 26.7 26.9 24.7
20,678 21,088 21,226 23,232
8.2 8.2 7.9 7.9
() 8 4 3 0 40,656 29,040 0
378,543 38•1.895 369,068 953,667
4,231 3,926 4,236 5,051
46,999 43,183 39,545 39,286
1,768 1,661 3,180 2,912
25,436 24,832 26,527 28,503
l,44 1.25 1.39 l.36
93 88 29
- 180-
2015
1.301
8,621
12, 487
9,448
2.709
27,251
4,332
805
]2,486
866,500
323
16
4
2
22,492
24,7
23,670
7.9
0
250
804,020
3,188
47.785
2 ,786
27,636
1.38
13

Fiscal Year
2016 2017 2018 2019 2020
l,•129 1,518 L,473 1.190 U23
a.s,12 ,1, 145 4,277 3,539 3,60'1
12,064 12.022 lfi,616 12,17-1. 8,768
l0,442 10,471 6,726 6,680 6,36 1
2,963 2,949 3,09!) 2,972 2,813
28.023 27.024 27,768 30.396 32,380
·~,060 3,633 3,771 3,077 :J,6 13
750 575 818 651 670
12,702 13.974 12,915 12.659 6,818
374,190 368,754 390,030 407,744 472,283
333 3'-14 352 323 319
22 16 16 17 10
2 ~ 2 2 8
0 0 2 0 2
22.771 22,949 23, l03 23,517 23.023
24. 5 25.1 25.0 23.l 25.0
24,723 24,422 24,647 24,970 25,065
8.2 8,6 8.6 8.5 8.3
1 2 31 (7) (16)
450 0 3, 168 ::l, 167 H,600
826,726 361.575 370,350 345.929 200,733
2,596 2,822 3,573 3,421 2,957
42,434 40,517 51 ,051 40,444 133.060
1,360 1,481 1,559 L,255 1,176
29.008 28.986 28.942 27,409 28,258
1.46 1.45 L44 l.315 1.39
36 409 10 412 39
-181-

General Governmen~
Vehicles
Pubhc Safety:
Police Protection:
Stations
Vehicles
Fire Protection:
Stations
Vehicles
Highways and Public Improvements:
Streets (miles)
Traffic Signals
Parks and Recreation:
Parks
Parks Acreage
Playgrounds
Walking/Jogging Trails (miles)
Libraries
Cemeteries
Water:
Water Mains (miles)
Water Service Linea (miles)
Wells
Storage Capacity (thousands of gallons)
Water Reclamation:
Sewer Lines (m.i.le8)
Treatment Capacity (MGD)
Storm Water:
Storm Water Lines (mi.Jes)
Sumps
Recreation:
Fitness Centers
Pools
Baseball / Softball Diamonds
Soccer / Football Fields
St.i:eet Lighting:
Street Ligh ts
Source: Various city departments
City of Orem
Capital Asset Statistics by Function / Program
Last Ten Fiscal Years
(Unaudited)
Fiscal Year
2011 2012 2013 2014
171 1i0 165 172
115 us 122 107
4 4 4 4
29 29 30 28
2111 241 241 242
34 3,J 34 34
22 22 22 25
383 350 350 363
18 18 18 18
,=m.s 40,0 40.0 40.0
l l
1
351 a5J 374 3'1'1
101 101 103 10~
8 9 9 9
22,440 22.440 22,1140 22,440
280 281 286 288
12.3 13.5 13,5 13,5
70.8 78.5 8'1.0 8,l.O
1,732 1, 783 1.755 1,759
2 2 2 2
18 18 18 18
18 18 18 18
5,086 5,174 5,175 6,204
-182-
2015
169
127
•1
29
242
34
26
385
19
40.8
l
374
103
9
22,4.90
291
13.5
87.J
I , 759
2
18
21
5,217

2016
168
125
4
28
243
34
2u
385
19
40,8
382
103
9
Zl,990
294
13.5
88,5
1.746
2
18
21
5,253
2017
168
1
127
4
29
243
3H
27
388
20
•10.8
382
103
9
21,950
331
13,5
88,5
1,748
2
18
21
5,662
Fiscal Year
2018
lo9
122
4
29
243
36
27
388
20
40 ,8
384
103
9
21,950
336
l:.l.ii
90.1
1,779
2
18 21
5,672
2019
167
121
4
30
244
36
29
392
20
40.8
388
10/J
9
21,950
343
l :l .5
90.7
1,772
2
18
21
6,084
2020
169
125
4
27
24~1
86
30
S92
20
40.8
388
104
9
21,950
343
13.5
92,0
1,756
2
18
21
6, )23
-183-

Fines & Forfeitures 2. 1%
City of Orem
General Fund · Revenues and Expenditures
For The Year Ended June 30, 2020
(Unaudited)
11 GENERAL FUND . REVENUES I Charges for Services ·
Other Funds 7.5%
Investment Earnings 1.9%
~scellaneous Revenues 2.1%
Charges for Services 9.9%
Ambulance Services 3.0%
fn tergovernmental 13.3% Franchise & Other
Taxes 12.0%
Business Licenses 1.2%
Building Permits
Capital Outlay 10.2%
Contract Services 2.7%
1.3%
I GENERAL FUND . EXPENDITURES I
Debt Service 0.0%
Materials, Supplies, & Other Operational Costs
20.5%
-1 84-
Personnel Services 66.6%
Property Taxes 10.3%
5 6 N . S T A T E S TO R E M , U T 8 4 0 5 7
O R E M . O R G
8 0 1 - 2 2 9 - 7 0 1 0
Related Documents


![Orem[1] by Orem](https://static.cupdf.com/doc/110x72/577d35321a28ab3a6b8fcae7/orem1-by-orem.jpg)