FINANCIAL SECTION COMPREHENSIVE ANNUAL FINANCIAL REPORT JUNE 30, 2020

Welcome message from author
This document is posted to help you gain knowledge. Please leave a comment to let me know what you think about it! Share it to your friends and learn new things together.
Transcript

F I N A N C I A L S E C T I O N
C O M P R E H E N S I V E A N N U A L F I N A N C I A L R E P O R T J U N E 3 0 , 2 0 2 0


INDEPENDENT AUDITOR
To the Honorable City Council of the City of Pasadena Pasadena, California
Report on the Financial Statements
We have audited the accompanying financial statements of the governmental activities, the business-type activities, the aggregate discretely presented component units, each major fund, and the aggregate remaining fund information of the City of Pasadena, California (the City), as of and for the year ended June 30, 2020, and the related notes to the financial statements, which collectively
ents as listed in the table of contents.
Management is responsible for the preparation and fair presentation of these financial statements in accordance with accounting principles generally accepted in the United States of America; this includes the design, implementation, and maintenance of internal control relevant to the preparation and fair presentation of financial statements that are free from material misstatement, whether due to fraud or error.
Our responsibility is to express opinions on these financial statements based on our audit. We did not audit the financial statements of the Pasadena Fire and Police Retirement System, a Fiduciary Pension Trust Fund of the City of Pasadena, which represent 17.83 percent, 24.14 percent, and 9.41 percent, respectively, of the assets, fund balance/net position, and revenues/additions of the aggregate remaining fund information opinion unit. Those statements were audited by other auditors whose report has been furnished to us, and our opinion, insofar as it relates to the amounts included for the Pasadena Fire and Police Retirement System, a Fiduciary Pension Trust Fund of the City of Pasadena is based solely on the report of the other auditors. We conducted our audit in accordance with auditing standards generally accepted in the United States of America and the standards applicable to financial audits contained in Government Auditing Standards, issued by the Comptroller General of the United States. Those standards require that we plan and perform the audit to obtain reasonable assurance about whether the financial statements are free from material misstatement.
An audit involves performing procedures to obtain audit evidence about the amounts and disclosures in the financial statements. The procedures selectedassessment of the risks of material misstatement of the financial statements, whether due to fraud or error. In making those risk assessmepreparation and fair presentation of the financial statements in order to design audit procedures that are appropriate in the circumstances, but not for the purpose of expressing an opinion on the effectiveness
rdingly, we express no such opinion.

An audit also includes evaluating the appropriateness of accounting policies used and the reasonableness of significant accounting estimates made by management, as well as evaluating the overall presentation of the financial statements.
We believe that the audit evidence we have obtained is sufficient and appropriate to provide a basis for our audit opinions.
Opinions
In our opinion, based on our audit and the report of the other auditors, the financial statements referred to above present fairly, in all material respects, the respective financial position of the governmental activities, the business-type activities, the aggregate discretely presented component units, each major fund, and the aggregate remaining fund information of the City of Pasadena, California, as of June 30, 2020, and the respective changes in financial position and, where applicable, cash flows thereof for the year then ended in accordance with accounting principles generally accepted in the United States of America.
Emphasis of Matter
As discussed in Note 21 to the financial statements, the net position of the governmental activities, and the fund balance of the non-major governmental funds as of July 1, 2019 were restated. Our opinions are not modified with respect to this matter.
Other Matters
Required Supplementary Information
Accounting principles generally accepted in the United States of America require that the tary Comparison Schedules - General and Major
Special Revenue Funds, the schedules of changes in net pension liability and related ratios and the ion plans, the schedule of changes in the net other
post-employment benefit (OPEB) liability and related ratios, the schedule of OPEB plan contributions, and the schedule of OPEB plan investment returns, identified as Required Supplementary Information (RSI) in the accompanying table of contents, be presented to supplement the basic financial statements. Such information, although not a part of the basic financial statements, is required by the Governmental Accounting Standards Board, who considers it to be an essential part of financial reporting for placing the basic financial statements in an appropriate operational, economic or historical context. We and the other auditors have applied certain limited procedures to the RSI in accordance with auditing standards generally accepted in the United States of America, which consisted of inquiries of management about the methods of preparing the information and comparing
es, the basic financial statements, and other knowledge we obtained during our audit of the basic financial statements. We do not express an opinion or provide any assurance on the RSI because the limited procedures do not provide us with sufficient evidence to express an opinion or provide any assurance.

Other Matters (Continued)
Other Information
Our audit was conducted for the purpose of forming opinions on the financial statements that atements. The introductory section, combining and
individual non-major fund financial statements and schedules (supplementary information), and statistical section, as listed in the table of contents, are presented for purposes of additional analysis and are not a required part of the basic financial statements.
The supplementary information is the responsibility of management and was derived from and relates directly to the underlying accounting and other records used to prepare the basic financial statements. Such information has been subjected to the auditing procedures applied in the audit of the basic financial statements and certain additional procedures, including comparing and reconciling such information directly to the underlying accounting and other records used to prepare the basic financial statements or to the basic financial statements themselves, and other additional procedures in accordance with auditing standards generally accepted in the United States of America. In our opinion, the supplementary information is fairly stated in all material respects in relation to the basic financial statements as a whole.
The introductory and statistical sections have not been subjected to the auditing procedures applied in the audit of the basic financial statements and, accordingly, we do not express, an opinion or provide any assurance on them.
Other Reporting Required by Government Auditing Standards
In accordance with Government Auditing Standards, we have also issued our report dated internal control over financial reporting and on our
tests of its compliance with certain provisions of laws, regulations, contracts and grant agreements and other matters. The purpose of that report is solely to describe the scope of our testing of internal control over financial reporting and compliance and the results of that testing, and not to provide an opinion on
financial reporting or on compliance. That report is an integral part of an audit performed in accordance with Government Auditing Standards in
l over financial reporting and compliance.
CliftonLarsonAllen LLP
Irvine, California February 8, 2021
3

(This page intentionally left blank)
4

CITY OF PASADENA
Comprehensive Annual Financial Report | June 30 , 2020 5
FINANCIAL SECTION
MANAGEMENT’S DISCUSSION AND ANALYSIS
As management of the City of Pasadena, we offer this narrative overview and analysis of the financial activities of the City of Pasadena for the fiscal year ended June 30, 2020 (FY 2020). We encourage readers to consider the information presented here in conjunction with additional information that has been furnished in the letter of transmittal, which can be found on pages v-xv of this report.
OVERVIEW OF THE FINANCIAL STATEMENTS
This discussion and analysis is intended to serve as an introduction to the City of Pasadena’s basic financial statements. The City of Pasadena’s basic financial statements are comprised of three components: 1) government-wide financial statements, 2) fund financial statements, and 3) notes to the basic financial statements. This report also contains other required supplementary information.
Government-Wide Financial Statements
The government-wide financial statements are designed to provide readers with a broad overview of the City of Pasadena’s finances, in a manner similar to a private-sector business.
The statement of net position presents information on all of the City’s assets and deferred outflows of resources and liabilities and deferred inflows of resources, with the difference reported as net position. Over time, increases or decreases in net position may serve as a useful indicator of whether the financial position of the City of Pasadena is improving or deteriorating.
The statement of activities presents the most recent fiscal year changes in the City’s net position. All changes in net position are reported as soon as the underlying event giving rise to the change occurs, regardless of the timing of related cash flows. Thus, revenues and expenses are reported in this statement for some items that will only result in cash flows in future fiscal periods (e.g., uncollected taxes and earned but unused vacation leave).
Both of the government-wide financial statements distinguish functions of the City that are principally supported by taxes and intergovernmental revenues (governmental activities) from other functions that are intended to recover all or a significant portion of their costs through user fees and charges (business-type activities). The governmental activities of the City of Pasadena include general government, public safety, transportation, utility, sanitation, health, culture and leisure, and community development. The business-type activities of the City of Pasadena include electric, water, refuse, parking, and telecommunication operations.
The basic government-wide financial statements can be found on pages 20-23 of this report.
Fund Financial Statements
A fund is a grouping of related accounts that is used to maintain control over resources that have been segregated for specific activities or objective. The City of Pasadena, like other state and local governments, uses fund accounting to ensure and demonstrate compliance with finance-related legal requirements. All of the funds of the City can be divided into three categories: governmental funds, proprietary funds, and fiduciary funds.
Governmental Funds
Governmental funds are used to account for essentially the same functions reported as governmental activities in the government-wide financial statements. However, unlike the government-wide financial statements, governmental funds financial statements focus on near-term inflows and outflows of spendable resources, as well as on balances of spendable resources available at the end of the fiscal year. Such information may be useful in evaluating a government’s near-term financing requirements.

Comprehensive Annual Financial Report | June 30 , 2020
CITY OF PASADENA
6
FINANCIAL SECTION
Because the focus of governmental funds is narrower than that of the government-wide financial statements, it is useful to compare the information presented for governmental funds with similar information presented for governmental activities in the government-wide financial statements. By doing so, readers may better understand the long-term impact of the government’s near-term financing decisions. Both the governmental funds balance sheet and the governmental funds statement of revenues, expenditures, and changes in fund balances provide a reconciliation to facilitate this comparison between governmental funds and governmental activities.
The City of Pasadena maintains thirty-one individual governmental funds. Information is presented separately in the governmental funds balance sheet and in the governmental funds statement of revenues, expenditures, and changes in fund balances for the General Fund, the Project Management Capital Project Fund, the General Debt Service Fund, and the Housing Successor Fund, all four of which are considered to be major funds. Data from the other twenty-seven governmental funds are combined into a single, aggregated presentation. Individual fund data for each of these non- major governmental funds is provided in the form of combining statements elsewhere in this report.
The City of Pasadena adopts an annual appropriated budget for its General Fund and Special Revenue Funds. Budgetary comparison statements have been provided for the General Fund and Special Revenue Funds to demonstrate compliance with this budget.
The basic governmental fund financial statements can be found on pages 24-27 of this report.
Proprietary Funds
The City of Pasadena maintains two different types of proprietary funds. Enterprise funds are used to report the same functions presented as business-type activities in the government-wide financial statements. The City uses enterprise funds to account for its electric, water, refuse, parking, and telecommunication operations. Internal service funds are an accounting device used to accumulate and allocate costs internally among the City’s various functions. The City of Pasadena uses internal service funds to account for its computing and communication, building maintenance, fleet maintenance, fleet replacement, benefits, workers’ compensation, general liability, printing services, and 311 call center services. Because each of these services predominantly benefits governmental rather than business-type functions, they have been included within governmental activities in the government-wide financial statements.
Proprietary funds provide the same type of information as the government-wide financial statements, only in more detail. The proprietary fund financial statements provide separate information for the Light and Power, Water, and Off Street Parking Funds, each of which are considered to be major funds of the City of Pasadena. Conversely, each of the internal service funds are combined into a single, aggregated presentation in the proprietary fund financial statements. Individual fund data for the internal service funds is provided in the form of combining statements elsewhere in this report. Data from the other two proprietary funds are combined into a single, aggregated presentation. Individual fund data for each of these non-major proprietary funds is provided in the form of combining statements elsewhere in this report.
The basic proprietary fund financial statements can be found on pages 28-35 of this report.
CITY OF PASADENA
Comprehensive Annual Financial Report | June 30 , 2020 7
FINANCIAL SECTION
Fiduciary Funds
Fiduciary funds are used to account for resources held for the benefits of parties outside the government. Fiduciary funds are not reflected in the government-wide financial statement because the resources of those funds are not available to support the City of Pasadena’s own programs. The activities of the Successor Agency to the Pasadena Community Development Commission are also reported with the City’s fiduciary funds as a private purpose trust fund. Individual fund data for each of these fiduciary funds is provided in the form of combining statements elsewhere in this report. The accounting used for fiduciary funds is much like that used for proprietary funds.
The basic fiduciary fund financial statements can be found on pages 36-37 of this report.
Notes to the Basic Financial Statements
The notes provide additional information that is essential to a full understanding of the data provided in the government-wide and fund financial statements. The notes to the basic financial statements can be found on pages 42-117 of this report.
Other Information
In addition to the basic financial statements and accompanying notes, this report also presents certain required supplementary information (RSI) concerning budgetary practices and budget to actual comparisons for the general fund and the major special revenue funds. Additional RSI includes pension and Other Post-Employment Benefits (OPEB) information on net pension and OPEB liabilities and plan contributions. RSI can be found on pages 119-129 of this report.
The combining statements referred to earlier in connection with non-major governmental funds and internal service funds are presented immediately following the required supplementary information. Combining and individual fund statements and schedules can be found on pages 132-181 of this report.
FINANCIAL HIGHLIGHTS
New Significant Accounting Standards Implemented
In FY 2020, the City adopted two new statements of financial accounting standards issued by the Government Accounting Standards Board (GASB) that relates to various accounting matters:
• Statement No. 95, “Postponement of the Effective Dates of Certain Authoritative Guidance”
Statement No. 95 provides temporary relief to governments and other stockholders in light of the COVID-19 pandemic. It does not result in changes for the City of Pasadena financial reporting.
• Statement No. 97, “Certain Component Unit Criteria, and Accounting and Financial Reporting for Internal Revenue Code Section 457 Deferred Compensation Plans—an amendment of GASB Statements No. 14 and No. 84”
Statement No. 97 requires that for purposes of determining whether a primary government is financially accountable for a potential component unit, except for a potential component unit that is a defined contribution pension plan, a defined contribution OPEB plan, or an other employee benefit plan (for example, certain Section 457 plans), the absence of a governing board should be treated the same as the appointment of a voting majority of a governing board if the primary government performs the duties that a governing board typically would perform.

Comprehensive Annual Financial Report | June 30 , 2020
CITY OF PASADENA
8
FINANCIAL SECTION
This Statement also requires that the financial burden criterion in paragraph 7 of Statement No. 84, Fiduciary Activities, be applicable to only defined benefit pension plans and defined benefit OPEB plans that are administered through trusts that meet the criteria in paragraph 3 of Statement No. 67, Financial Reporting for Pension Plans, or paragraph 3 of Statement No. 74, Financial Reporting for Postemployment Benefit Plans Other Than Pension Plans, respectively. It does not result in changes for the City of Pasadena financial reporting.
Restatement of Beginning Net Position and Fund Balances
As disclosed in Footnote 21 on page 116, the beginning net position of the Governmental Activities was restated from $175,340,818 to $173,912,602 as of July 1, 2019, a reduction of $1,428,216. The same adjustment was applied to the Housing and Community Development Fund’s beginning fund balance due to the revenue adjustments in the fund.
There was no restatement of the beginning net position of the Business Activities.
GOVERNMENT-WIDE FINANCIAL ANALYSIS
As noted earlier, net position may serve over time as a useful indicator of a government’s financial position. In the case of the City of Pasadena, assets and deferred outflows exceed liabilities and deferred inflows by $1,021.7 million at the close of the most recent fiscal year.
$929.3 million of the City of Pasadena’s net position reflects its investment in capital assets (e.g., land, buildings, machinery, and equipment), less any related outstanding debts used to acquire those assets. The City of Pasadena uses these capital assets to provide services to citizens; consequently, these assets are not available for future spending. Although the City of Pasadena’s investment in its capital assets is reported net of related debt, it should be noted that the resources needed to repay this debt must be provided from other sources, since the capital assets themselves cannot be used to liquidate these liabilities.
City of Pasadena’s Net Position (in millions) Governmental Activities Business-Type Activities Total 2020* 2019* 2020 2019 2020* 2019*Current and other assets $ 369.5 350�6 496�4 498�2 865�9 $ 848.8Capital assets 513�1 508�1 787�8 765�7 1,300.9 1,273.8
Total Assets 882�6 858�7 1,284.2 1,263.9 2,166.8 2,122.6 Deferred outflows 108�3 90�2 16�1 20�4 124�4 110�6 Long-term debt outstanding 289�2 181�5 316�4 333�6 605�6 515�1Net pension liability 410�9 411�6 87�6 85�5 498�5 497�1Other liabilities 80�8 160�0 60�4 52�8 141�2 212�8
Total Liabilities 780�9 753�1 464�4 471�9 1,245.3 1,225.0 Deferred inflows 19�9 20�5 4�3 4�4 24�2 24�9 Net position:
Net investment in capital assets 470�7 458�3 458�6 434�4 929�3 892�7Restricted 84�0 79�2 128�2 142�8 212�2 222�0Unrestricted (364.6) (362.2) 244�8 230�7 (119.8) (131.5)
Total Net Position $ 190.1 175�3 831�6 807�9 1,021.7 $ 983.2 * As restated

CITY OF PASADENA
Comprehensive Annual Financial Report | June 30 , 2020 9
FINANCIAL SECTION
A portion of the City of Pasadena’s net position, $212.2 million or 20.8 percent resources that are subject to external restrictions on how they may be used. The remaining balance is a deficit in unrestricted net position of, $119.8 million, or 11.7 percent is for unrestricted uses in accordance with finance-related legal requirements. This deficit reflects liabilities which exceed assets on hand, and is related to implementation of GASB 68 and GASB 75 regarding Pension Plan and OPEB reporting.
At the end of FY 2020, the City of Pasadena is able to report positive balances in all categories of net position for the government as a whole except for unrestricted net position.
During FY 2020, the primary government’s net position increased by $39.9 million. Approximately $16.2 million of this is an increase in the City’s Governmental Activities and $23.7 million of this increase is in the City Business-Type Activities. The increase in the Governmental activities reflects increases in spending offset by increases in revenues. The increase in Business-Type activities was less than FY 2019 due to a slight decrease in revenue because of the pandemic.
City of Pasadena’s Changes in Net Position (in millions) Governmental Activities Business-Type Activities Total 2020* 2019 2020 2019 2020* 2019Revenues:
Program Revenues: Charges for services $ 85.3 85�1 303�7 304�6 389�0 $ 389.7Operating grants and contributions 56�8 59�8 1�8 1�5 58�6 61�3Capital grants and contributions 36�7 8�6 2�9 3�6 39�6 12�2
General revenues: Taxes:
Property taxes, levied for general purpose 70�7 68�3 - - 70�7 68�3Sales taxes 57�5 44�6 - - 57�5 44�6Utility users’ tax 27�0 27�0 - - 27�0 27�0Other taxes 28�5 39�4 6�1 5�8 34�6 45�2
Other revenues 29�1 31�3 10�9 15�1 40�0 46�4Misc revenues 7�7 8�3 3�0 3�3 10�7 11�6
Total revenues 399�3 372�4 328�4 333�9 727�7 706�3
Expenses: General government 67�4 49�7 - - 67�4 49�7Public safety 152�9 145�9 - - 152�9 145�9Transportation 55�4 52�2 - - 55�4 52�2Culture and leisure 37�2 37�1 - - 37�2 37�1Community development 52�0 47�3 - - 52�0 47�3Interest and other fiscal charges 6�4 7�9 - - 6�4 7�9Electric - - 197�1 196�8 197�1 196�8Water - - 59�0 56�7 59�0 56�7Other expenses 26�1 17�5 34�3 31�2 60�4 48�7
Total expenses 397�4 357�6 290�4 284�7 687�8 642�3
Increase (decrease) in net position before transfers 1�9 14�8 38�0 49�2 39�9 64�1
Transfers 14�3 14�0 (14.3) (14.0) - -
Increase (decrease) in net position 16�2 28�8 23�7 35�2 39�9 64�1
Net position at beginning of year, as restated 173�9 146�5 807�9 772�7 981�8 919�2
Net position at end of year $ 190.1 175�3 831�6 807�9 1,021.7 $ 983.2 * As restated
Comprehensive Annual Financial Report | June 30 , 2020
CITY OF PASADENA
10
FINANCIAL SECTION
Governmental Activities
Governmental activities increased the City of Pasadena’s net position by $16.2 million or 40.6 percent of the primary government’s net position increase. Key elements of this increase are a combination of factors as follows:
• The revenue components of governmental activities increased by $26.9 million or 7.2 percent from prior year revenues. The following categories showed changes: Capital grants and contributions increased by $28.1 million, sales taxes increased by $12.9 million, property taxes increased by $2.4 million. Other taxes decreased by $10.9 million, operating grants and contributions decreased by $3.0 million, and other revenues decreased by $2.6 million.
• Capital grants and contributions increased by $28.1 million. The change was attributable to the sale of Concord property. The City received the property as a contribution, and subsequently sold it in May 2020. The transaction resulted in $27.5 million of developer contribution upon execution of a quitclaim deed turning improvements over to the City just prior to the sale.
• Sales taxes increased by $12.9 million. Although the regular sales taxes decreased by $5.6 million, from $39.3 million in FY 2019 to $33.7 million in FY 2020, the City received $18.5 million more of Measure I sales tax in FY 2020 than in FY 2019. In November 2018, the City voters approved the sales tax Measure I enacted a 0.75 percent sales tax to fund the general city services. The City started receiving Measure I sales taxes in May 2019.
• Property taxes increased by $2.4 million due to appreciation of property value in Pasadena.
• The other taxes decreased by $10.9 million mainly due to the pandemic:
• $5.7 million reduction in light and power surtax – The City suspended collection of the surtax in April 2020, and provided a direct rebate of the surtax paid by each current Pasadena Water and Power customer during 24 months prior to April 2020. Therefore, the City received no light and power surtax revenue in FY 2020.
• $3.9 million million reduction in transient occupancy taxes – The hospitality industry was heavily impacted by the pandemic in the last quarter of FY 2020.
• $0.9 million reduction in construction taxes
• $0.2 million reduction in business license taxes
• Operating grants and contributions decreased by $3.0 million, including $3.1 million less in residential impact fee. Parsons paid an $8.3 million of residential impact fee for five new buildings in FY 2019.
• Other revenues decreased by $2.6 million primarily due to $1.3 million less in investment earnings and $0.9 million less in revenues received from the State and Los Angeles County.
• The expense components of Governmental Activities increased by $39.8 million or 11.1 percent. The changes in expenses were: general government increased by $17.7 million, other expenses increased by $8.6 million, public safety increased by $7.0 million, community development increased by $4.7 million, transportation increased by $3.2 million. The other categories have a net decrease of $1.4 million.
• General government expenses increased by $17.7 million or 35.6 percent. There was $6.1 million more in sales taxes that the City passed to Pasadena Unified School District (PUSD) according to Measure J, a $3.4 million increase in general liability insurance and benefit expenses, and $2.0 million more in other general expenses due to the pandemic.

CITY OF PASADENA
Comprehensive Annual Financial Report | June 30 , 2020 11
FINANCIAL SECTION
Program Revenues and Expenses - Governmental Activities
Program Revenue Expenses
Genera
l Gov
ernmen
t
Public
Safety
Trans
porta
tion
Utility
Sanita
tion
Health
Culture
and L
eisure
Commun
ity D
evelo
pmen
t
Intere
st on
Long
-Term
Deb
t$ 0
$ 50,000,000
$ 100,000,000
$ 150,000,000
• The other expenses increased by $8.6 million, including $6.1 million increase in utility expenses and $1.7 million increase in health expenses. The City suspended collection of the surtax in April 2020 and provided a direct rebate of the surtax paid by each customer of Pasadena Water and Power during 24 months prior to April 2020. Therefore, the net expense due to light and power surtax rebate was $6.1 million in FY 2020. The $1.7 million increase in health expenses was attributable to activities related to COVID-19 response, including response management, threat mitigation and enforcement.
• Public safety expenses increased by $7.0 million or 4.8 percent mainly due to $4.0 million increases in the City’s GASB 68 pension expenses and a $3.3 million increase in general liability insurance and benefit expenses for both the police and fire departments.
• Community development expenses increased by $4.7 million or 9.9 percent mainly due to $1.1 million in Concord sale expenses, $3.1 million increase in capital asset additions, and $0.5 million increase in general liability insurance and benefit expenses.
• Transportation expenses increased by $3.2 million, including increases of $1.3 million in general liability and benefit expenses, $0.8 million in capital asset additions, and $0.8 million in pension costs.
Comprehensive Annual Financial Report | June 30 , 2020
CITY OF PASADENA
12
FINANCIAL SECTION
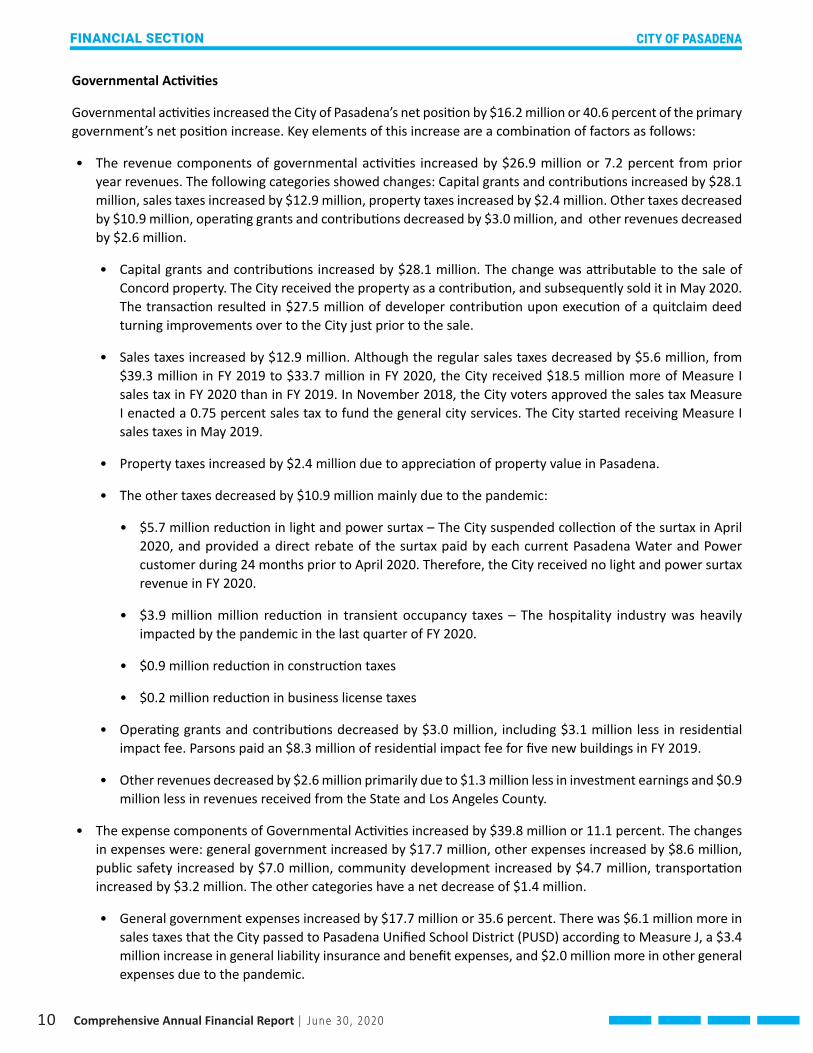
Revenues by Sources - Governmental Activities
Motor Vehicle In Lieu: 5.07%Motor Vehicle In Lieu: 5.07%Motor Vehicle In Lieu: 5.07%
Other Intergovernmental: 0.15%Other Intergovernmental: 0.15%Other Intergovernmental: 0.15%
Investment Earnings: 2.06%Investment Earnings: 2.06%Investment Earnings: 2.06%
Other Other : 1.38%: 1.38%Other : 1.38%
Charges for Services: 21.35%Charges for Services: 21.35%Charges for Services: 21.35%
Operating Grants andOperating Grants andContributions: 14.24%Contributions: 14.24%Operating Grants andContributions: 14.24%
Capital Grants andCapital Grants andContributions: 9.18%Contributions: 9.18%Capital Grants andContributions: 9.18%
Propery Taxes, Levied forPropery Taxes, Levied forGeneral Purpose: 17.70%General Purpose: 17.70%Propery Taxes, Levied forGeneral Purpose: 17.70%
Sales Taxes: 14.40%Sales Taxes: 14.40%Sales Taxes: 14.40%
Gain on Sale of CapitalGain on Sale of CapitalAssets: 0.57%Assets: 0.57%Gain on Sale of CapitalAssets: 0.57%
Utility Users Taxes: 6.75%Utility Users Taxes: 6.75%Utility Users Taxes: 6.75%
Transient Occupancy Taxes: 3.28%Transient Occupancy Taxes: 3.28%Transient Occupancy Taxes: 3.28%
Other Taxes: 3.87%Other Taxes: 3.87%Other Taxes: 3.87%
(Balance of page intentionally left blank)

CITY OF PASADENA
Comprehensive Annual Financial Report | June 30 , 2020 13
FINANCIAL SECTION
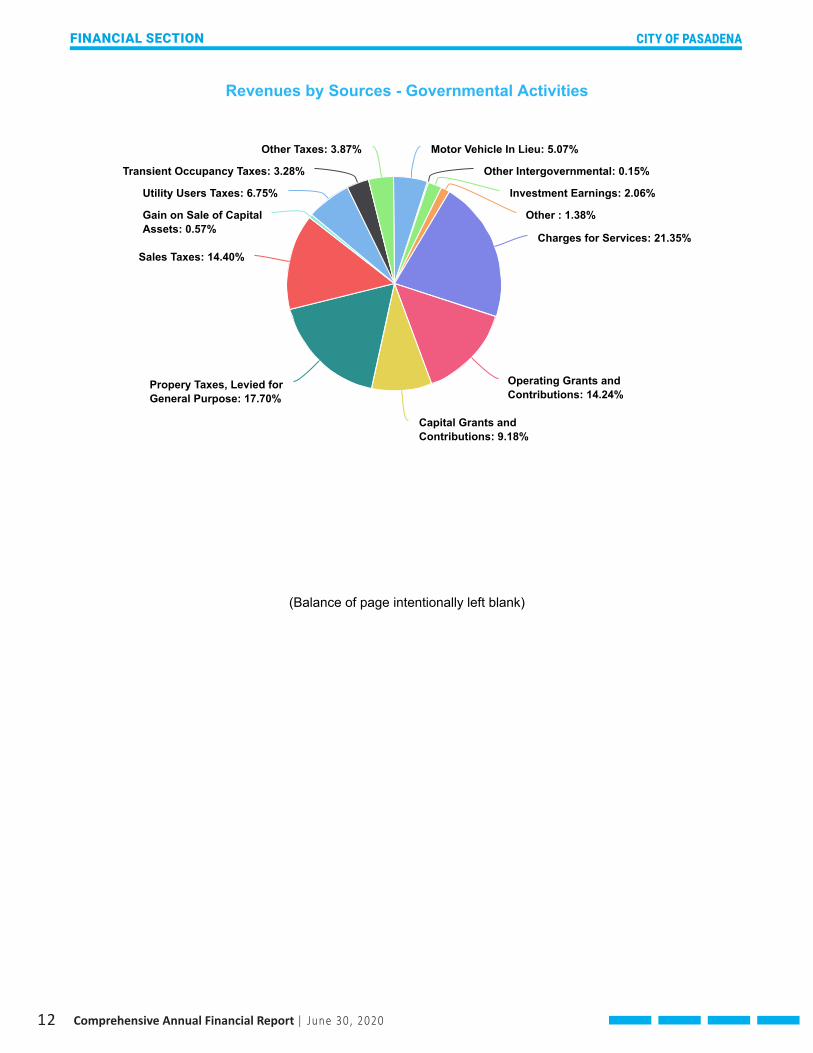
Program Revenues and Expenses - Business-Type Activities
Program Revenue Expenses
Electric Water Refuse Parking Telecommunication$0
$50,000,000
$100,000,000
$150,000,000
$200,000,000
$250,000,000
Business-Type Activities
Business-type activities increased the City of Pasadena’s net position by almost $23.7 million. Key elements of this year’s increase are as follows:
• Net income/(loss) of the Light and Power, Water, Off Street Parking, and Non-Major Enterprise Funds were $20.5 million, $7.1 million, ($3.2) million, and ($0.7) million respectively.
• Electric charges for services decreased $0.2 million or 0.1 percent from the prior fiscal year.
• Electric expenses increased $0.7 million or 0.4 percent from the prior year mainly due to increases in administrative and general expense, overhead and depreciation. These increases were offset by decreases in purchased power, fuel and gas expenses.
• Water charges for services increased $2.3 million or 3.8 percent over the prior year mainly due to the approved Distribution and Customer (“D&C”) rate increase. This increase was offset by a decrease of 213 thousand billing units in retail water sales. Retail revenues generated from customers located inside city limits increased by approximately $2.0 million or 5.3%.
• Water expenses increased $2.4 million or 4.5 percent from the prior year mostly due to increased purchased water, transmission, and distribution expenses.
• Off Street Parking operating revenues decreased $2.7 million or 19.6 percent and expenses decreased $186 thousand or 1.4 percent.
• Off Street Parking net loss of $3.2 million was primarily a result of pandemic reduced parking activity and suspended enforcement.

Comprehensive Annual Financial Report | June 30 , 2020
CITY OF PASADENA
14
FINANCIAL SECTION
Revenues by Sources - Business-Type Activities
Charges for Services: 92.46%Charges for Services: 92.46%Charges for Services: 92.46%
Operating Grants andOperating Grants andContributions: 0.54%Contributions: 0.54%Operating Grants andContributions: 0.54%
Capital Grants andCapital Grants andContributions: 0.89%Contributions: 0.89%Capital Grants andContributions: 0.89%
Franchise taxes: 1.85%Franchise taxes: 1.85%Franchise taxes: 1.85%
Investment earnings, netInvestment earnings, netof change in fair value ofof change in fair value ofinvestments: 3.33%investments: 3.33%
Investment earnings, netof change in fair value ofinvestments: 3.33%
Other Other : 0.93%: 0.93%Other : 0.93%
FINANCIAL ANALYSIS OF THE GOVERNMENT’S FUNDS
As noted earlier, the City of Pasadena uses fund accounting to ensure and demonstrate compliance with finance-related legal requirements.
Governmental Funds
The focus of the City’s governmental funds is to provide information on near-term inflows, outflows, and balances of spendable resources. Such information is useful in assessing the City of Pasadena financing requirements. In particular, unassigned fund balance may serve as a useful measure of a government’s net resources available for spending at the end of the fiscal year.
Governmental Funds report the difference between their assets and liabilities as fund balance, which is divided into non-spendable, restricted, committed, assigned, and unassigned portions. City Council may commit a portion of the fund balance by formal action, per the current policy of increasing the commitment up to 20 percent of the General Fund annual appropriations. The 20 percent comprised of 15 percent General Fund Emergency Contingency and 5 percent General Fund Operating Reserve. On June 22, 2020, the City Council committed the full 15 percent or $42,427,200 for FY 2020 Emergency Contingency and up to 5 percent or $12,692,400 for Operating Reserve. The City Operating Reserve was $12,692,400 as a result of the General Fund financial position at the end of FY 2020.
At the end of FY 2020, the City’s governmental funds reported combined ending fund balances of $292.9 million, an increase of $9.2 million in comparison with the prior year. The non-spendable fund balance of $16.4 million represents assets generated by prepayments, permanent trust fund balances and receivables in funds, net of allowances. The restricted fund balance of $84.0 million represents resources that are subject to externally enforceable legal restrictions, such as the restrictions on the use of Special Revenue funding and Capital Improvement contracts. The committed fund balance of $170.6 million represents resources whose use is constrained by limitations that the

CITY OF PASADENA
Comprehensive Annual Financial Report | June 30 , 2020 15
FINANCIAL SECTION
City imposes upon itself through decisions made by the City Council. The assigned fund balance of $26.7 million describes the portion of fund balance that reflects the City’s intended use of resources. The unassigned fund balance of ($4.7) million represents the deficit amount of that non-spendable, restricted, committed, and assigned in excess of total fund balance.
The General Fund is the chief operating fund of the City of Pasadena. At the end of FY 2020, total fund balance equaled $107.6 million, versus $98.7 million in the prior year. The fund balance increased by $8.9 million or 9.0 percent, during FY 2020. Key factors for this change are as follows:
Total revenues increased by $14.5 million due to increases in four categories of revenue and decrease in one category, as explained below:
• Taxes increased by net $10.1 million primarily due to an increase of $12.9 million in sales taxes. Property tax revenue increased by $2.4 million while Transient Occupancy tax revenue decreased by $3.9 million. The other taxes had a net decrease of $1.3 million. The decreases were pandemic driven.
• Rental income increased by $7.0 million mainly due to $7.1 million of the ground lease revenue received as part of the Concord property’s sale.
• Intergovernmental revenues increased by $1.6 million, primarily due to an increase of $1.1 million in Motor Vehicle in-lieu tax.
• Charges for services decreased by $2.4 million as many outside jobs including filming and Rose Bowl related events have been cancelled due to the pandemic in the last quarter of the fiscal year. The City collected less General Fund revenues, including $1.4 million less in Police billable services.
• The remaining differences were smaller and covered several categories: fines and forfeits up by $0.1 million, investment earnings down by $0.5 million, licenses and permits down by $0.5 million, and miscellaneous revenues down by $0.9 million.
Total expenditures increased by $41.1 million or 18.0 percent. Four of the five components increased as follows: $33.8 million in general government, $5.9 million in public safety, $1.4 million in community development, and $1.0 million in transportation. Culture and leisure decreased by $0.9 million.
• General government expenditures increased by $33.8 million mainly due to the contributions of $23.1 million from the City to FPRS. Also, there were $6.1 million more in sales taxes that the City passed to PUSD in FY 2020 and $2.0 million more in other general expenses due to the pandemic.
• Public safety expenditures increased by $5.9 million primarily due to filled vacancies, increased salaries, pension cost, position coverage, and overtime expenses of both the police and fire departments.
• Community development expenditures increased by $1.4 million primarily due to $1.1 million of expenses related to the sale of Concord property.
In FY 2020, the General Fund made a one-time transfer of $5.0 million to the General Liability Fund, a one-time transfer of $4.5 million to the Printing Fund to close the fund, $1.2 million to the Housing Successor Fund due to the Concord sale, and $2.7 million less to the Debt Service Funds as 2008B Certificate of Participation was paid off in FY 2019. The other transfers-out decreased by $0.2 million. Therefore, the net General Fund transfer-out increased by $7.8 million in FY 2020.
The City received the Concord property and sold it in May 2020. The transaction resulted in $31.8 million of sale proceeds in other financial sources.

Comprehensive Annual Financial Report | June 30 , 2020
CITY OF PASADENA
16
FINANCIAL SECTION
The Housing Successor Fund has a fund balance of $7.0 million, which is an increase of $1.0 million from the prior year. The key factors contributing to this increase are as follows:
• Total revenue increased to $0.2 million, mainly from loan repayments.
• Total expenditures decreased to $0.4 million, mainly because a program - Rehabilitation of Villa Los Robles had less expenses in FY 2020, and the program ended in FY 2020.
• Moreover, there is a transfer of $1.2 million from the General Fund due to the Concord Sale.
Proprietary Funds
The City of Pasadena’s proprietary funds provide the same type of information found in the government-wide financial statements, but in more detail.
Unrestricted net position of the Light and Power Fund at the end of the year amounted to $203.2 million and those for the Water, Off Street Parking Fund, and Non-Major Enterprise Funds amounted to $29.2 million, $1.8 million, and $10.6 million respectively. The total net income/ (loss) for each fund was $20.5 million, $7.1 million, ($3.2) million, and ($0.7) million respectively.
Light and Power operating revenues decreased by $182 thousand from prior year. Total retail electric energy sold decreased by 28,993 megawatt hours, a 2.8 percent decrease compared to the prior fiscal year. Total operating expenses increased slightly by $0.7 million to $188 million.
Water Fund operating revenues increased $2.3 million from prior year primarily due to higher distribution charges, sales of water rights and leases to other agencies. Total retail water sales decreased by 213 thousand or 1.9 percent billing units in retail water sales. Operating expenses increased $2.4 million or 4.5 percent primarily due to $1.3 million increase in transmission and distribution expenses and $1 million increase in purchased water and production expenses.
The Off Street Parking Fund had a net loss of $3.2 million in FY 2020, as compared to $1.5 million net income in FY 2019. Primarily due to the reduction of parking revenues from all parking structures triggered by COVID-19 pandemic since mid-March 2020 and suspension of parking enforcement and citations.
Implementation of GASB 68 has resulted in showing a “GASB 68 Net Pension Liability” in the Proprietary Funds. At June 30, 2020, the GASB 68 Net Pension Liability is $58.5 million, $20.2 million, $1.1 million, and $7.7 million for Light and Power, Water, Off Street Parking, and Non-Major Enterprise funds respectively.
Implementation of GASB 75 has resulted in showing a “GASB 75 Net OPEB Liability” in the Proprietary Funds. At June 30, 2020, the GASB 75 Net OPEB Liability is $11.0 million, $5.4 million, $0.1 million, and $2.8 million for Light and Power, Water, Off Street Parking, and Non-Major Enterprise funds respectively.
CAPITAL ASSETS AND DEBT ADMINISTRATION
Capital Assets
The City City of Pasadena’s investment in capital assets for its governmental and business-type activities as of June 30, 2020 amounts to $1,290 million, net of accumulated depreciation. This investment in capital assets includes land, buildings and systems, improvements, machinery and equipment, park facilities, roads, highways, and bridges. The net increase in the City of Pasadena’s investment in capital assets for the current fiscal year was $16.2 million (a $5 million increase for governmental activities and $11 million increase for business-type activities.)
Major capital asset related events during the 2020 fiscal year included the following:

CITY OF PASADENA
Comprehensive Annual Financial Report | June 30 , 2020 17
FINANCIAL SECTION
• A variety of street maintenance and construction, technology, traffic control and parks and landscape projects continue City-wide. During the 2020 fiscal year the City spent $32.8 million on capital projects in governmental activities. Costs for projects that are not completed are shown as Construction in Progress. The amount of Construction in Progress for the governmental activities as of June 30, 2020 is $34.5 million and for the business-type activities is $71.2 million.
• In the area of technology upgrade projects, the City spent nearly $1.2 million towards new and replacement servers, routers, networks, and data centers, $7.8 million for radio communication equipment and upgrades, and $590 thousand toward replacement of its Land Management System.
• Improvement of city-owned facilities continues. The City spent $6 million for parks and landscape projects, $5.5 million for streets and sidewalks, $1.9 million was spent for preventive maintenance and repairs for the City buildings, and facilities.
• Transportation acquired two Fixed Route busses for $1.1 million and 4 Dial-A-Ride busses for $315 thousand.
• The City spent nearly $2.3 million for traffic safety and control programs and improvements.
• As of June 30, 2020, the business-type activities net assets amounted to $776.9 million, an increase of $11.1 million over the prior year.
• Water and Power utility plant net assets amounted to $727.8 million, an increase of $10.0 million. During the fiscal year, the City spent $73.69 million on various water and power projects and moved $22.0 million into completed projects.
• Some of the major power projects are Power Distribution Capacity and Reliability $2.5 million, Distribution System Expansion $3.3 million, Customer Information System $3.2 million, and Installation of Low & High Voltage Electrical Services $5.3 million.
• Some of the major Water projects are Customer Driven Meters and Services $1.9 million, Distribution Mains $10.0 million, and Booster Improvements $2.1 million.
City of Pasadena’s Capital Assets(Net of Depreciation, in millions)
Governmental Activities Business-Type Activities Total 2020 2019 2020 2019 2020 2019Land $ 87.3 87�9 14�7 14�7 102�0 $ 102.6Buildings and improvements 157�1 163�4 77�5 80�4 234�6 243�8Machinery and equipment 37�3 26�8 613�6 630�4 650�9 657�2Infrastructure 196�9 193�5 0�0 0�0 196�9 193�5Construction in progress 34�5 36�4 71�2 40�3 105�7 76�7
Totals $ 513.1 508�0 777�0 765�8 1,290.1 $ 1,273.8
Additional information on the City of Pasadena’s capital assets can be found in note 7 on pages 65-66 of this report.

Comprehensive Annual Financial Report | June 30 , 2020
CITY OF PASADENA
18
FINANCIAL SECTION
Long-Term Debt
At year-end, the City has a number of debt issues outstanding. These include $136.7 million of taxable pension bonds, $311.6 million of revenue bonds, $55.5 million of certificate of participation, $5.3 million of notes payable, and $9.6 million of capitalized lease obligations. Long-term debt increased by a net amount of $3.5 million as a result of normal scheduled principal maturities, refunding of debts, and new capital lease acquired for radio equipment. Operational liabilities decreased by a net amount of $4.3 million due to increase in compensated absences, and decrease in insurance claims payable. The net pension obligation increased by $1.4 million and the net Other Post-Employment Benefits (OPEB) increased $6.7 million. The City was assigned an AAA issuer rating by Standard and Poor’s and AA+ rating by Fitch Rating Agency.
City of Pasadena’s Outstanding Long-Term Liabilities (in millions) Governmental Activities Business-Type Activities Total 2020 2019 2020 2019 2020 2019Long-term debt (including premium/discount):
Notes payable $ 5.3 5�6 0�0 0�1 5�3 $ 5.7Bonds 136�7 117�5 311�6 330�3 448�3 447�8Certificates of participation 55�5 57�6 0�0 0�0 55�5 57�6Capitalized lease obligations 6�8 0�8 2�8 3�3 9�6 4�1
Total long-term debt 204�3 181�5 314�4 333�7 518�7 515�2 Operational Liabilities:
Compensated absences 12�1 11�2 0�0 0�0 12�1 11�2Insurance Claims Payable 40�2 45�4 0�0 0�0 40�2 45�4
Total operational liabilities 52�3 56�6 0�0 0�0 52�3 56�6Totals $ 256.6 238�1 314�4 333�7 571�0 $ 571.8
Net pension obligation $ 410.9 411�6 87�6 85�5 498�5 $ 497.1Net OPEB $ 64.5 61�8 19�2 15�2 83�7 $ 77.0
Additional information on the City of Pasadena’s long-term debt can be found in note 9 on pages 69 to 83 of this report. Information on Insurance Claims Payable can be found in note 16 on pages 96 to 97, Net Pension Obligation in note 18 on pages 99 to 110, and Other Post-Employment Benefits can be found in note 19 on pages 111 to 114.
The City reports three items of significant economic importance in its subsequent event note 22 on page 117�
REQUEST FOR INFORMATION
This financial report is designed to provide a general overview of the City of Pasadena’s finances for all those with an interest in the government’s finances. Questions concerning any of the information provided in this report or requests for additional financial information should be addressed to the office of the Director of Finance, 100 North Garfield Avenue, Room S348, Pasadena, California, 91109.

(This page intentionally left blank)
19

Comprehensive Annual Financial Report | June 30 , 2020
CITY OF PASADENA
20
FINANCIAL SECTION
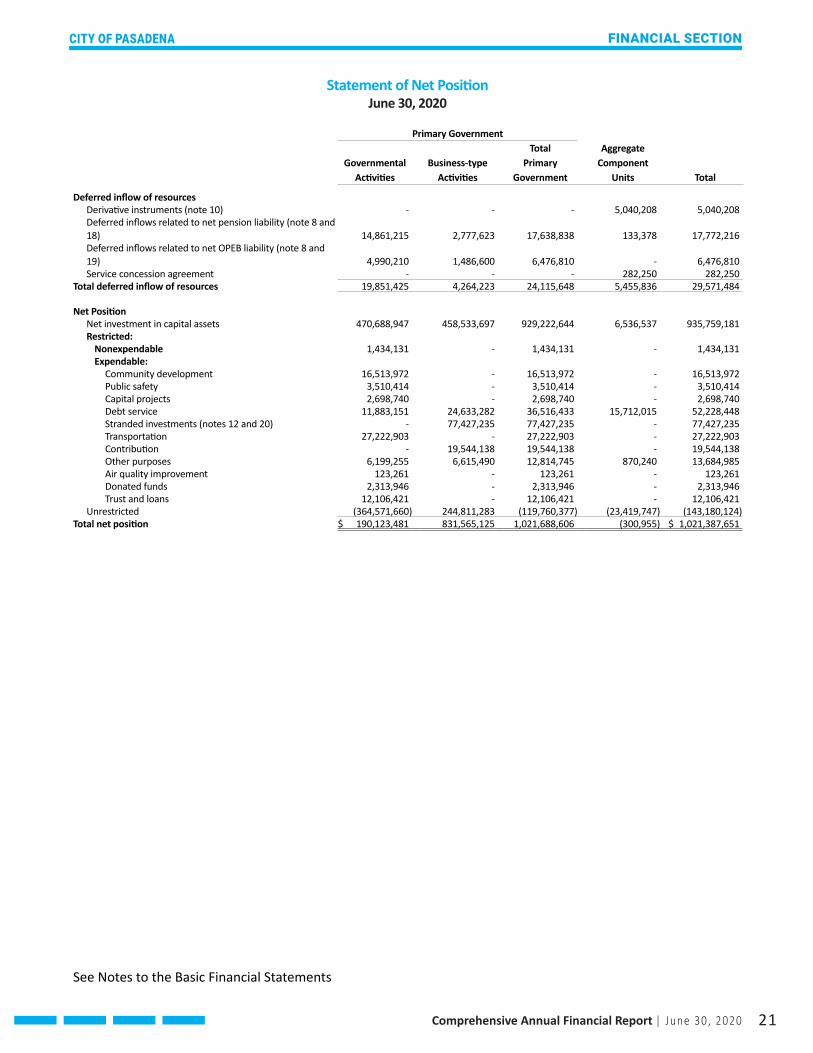
Statement of Net PositionJune 30, 2020
Primary Government Total Aggregate Governmental Business-type Primary Component Activities Activities Government Units TotalAssets Current assets:
Cash and investments (note 2) $ 292,336,240 328,212,351 620,548,591 36,552,402 $ 657,100,993Accounts receivable, net (note 3) 39,633,758 38,382,694 78,016,452 3,961,650 81,978,102Notes receivable, net (note 4) 13,505,395 6,583,333 20,088,728 - 20,088,728Internal balances (1,073,784) 1,073,784 - - -Inventories 424,893 27,360,711 27,785,604 10,674 27,796,278Prepaids and other assets 1,130,493 1,197,420 2,327,913 175,711 2,503,624Advances to component units (note 6) 167,208 - 167,208 - 167,208Due from City - - - 504,008 504,008Property held for resale 275,566 - 275,566 - 275,566
Total current assets 346,399,769 402,810,293 749,210,062 41,204,445 790,414,507Noncurrent restricted assets:
Restricted assets - cash and investments (note 2) 23,090,057 85,508,320 108,598,377 27,377,928 135,976,305Restricted assets - others - 8,046,667 8,046,667 - 8,046,667
Total noncurrent restricted assets 23,090,057 93,554,987 116,645,044 27,377,928 144,022,972Other noncurrent assets:
Long term prepaid and other assets - 10,883,146 10,883,146 471,481 11,354,627Land (note 7) 87,336,607 14,676,030 102,012,637 - 102,012,637Construction in progress (note 7) 34,458,339 71,153,143 105,611,482 7,461,662 113,073,144Other capital assets, net (note 7) 391,291,429 691,055,267 1,082,346,696 299,824,775 1,382,171,471Total other noncurrent assets 513,086,375 787,767,586 1,300,853,961 307,757,918 1,608,611,879
Total assets 882,576,201 1,284,132,866 2,166,709,067 376,340,291 2,543,049,358 Deferred outflow of resources
Accumulated decrease in fair value of hedging derivatives - - - 33,406,950 33,406,950Deferred charges - bond refunding (note 8) 23,398,699 908,797 24,307,496 3,604,641 27,912,137Deferred outflows related to net pension liability (note 8 and 18) 76,322,562 12,685,459 89,008,021 1,085,090 90,093,111Deferred outflows related to net OPEB liability (note 8 and 19) 8,545,788 2,545,817 11,091,605 - 11,091,605
Total deferred outflow of resources 108,267,049 16,140,073 124,407,122 38,096,681 162,503,803 Liabilities
Current Liabilities Accounts payable and accrued liabilities 40,432,710 19,872,020 60,304,730 8,277,313 68,582,043Deposits 5,117,407 14,145,193 19,262,600 1,596,300 20,858,900Due to primary government - - - 583,417 583,417Due to other governments 21,467 - 21,467 1,282,531 1,303,998Long term advance due within one year - - - 100,000 100,000Unearned revenues 3,163,968 9,247,877 12,411,845 - 12,411,845Compensated absences due within one year (note 9) 9,308,011 - 9,308,011 239,899 9,547,910Insurance claims payable within one year (note 9 and 16) 17,597,972 - 17,597,972 - 17,597,972Long-term debt due within one year (note 9) 5,117,032 17,160,044 22,277,076 8,967,818 31,244,894
Total current liabilities 80,758,567 60,425,134 141,183,701 21,047,278 162,230,979Non-current liabilities:
Derivative instrument liability (note 10) - - - 33,406,950 33,406,950Long-term advances from primary government - - - 700,000 700,000Non-current liabilites due in more than one year:
Net pension liability (note 18) 410,922,713 87,571,286 498,493,999 2,788,864 501,282,863Net OPEB liability (note 19) 64,533,863 19,224,840 83,758,703 - 83,758,703Compensated absences due in more than one year (note 9) 2,828,880 - 2,828,880 55,013 2,883,893Insurance claims payable due in more than one year (note 9 and 16) 22,641,266 - 22,641,266 - 22,641,266Long-term debt due in more than one year (note 9) 199,183,055 297,222,331 496,405,386 351,283,986 847,689,372
Total non-current liabilities 700,109,777 404,018,457 1,104,128,234 388,234,813 1,492,363,047Total liabilities 780,868,344 464,443,591 1,245,311,935 409,282,091 1,654,594,026
CITY OF PASADENA
Comprehensive Annual Financial Report | June 30 , 2020 21
FINANCIAL SECTION
Statement of Net PositionJune 30, 2020
Primary Government Total Aggregate Governmental Business-type Primary Component Activities Activities Government Units Total
Deferred inflow of resources Derivative instruments (note 10) - - - 5,040,208 5,040,208Deferred inflows related to net pension liability (note 8 and 18) 14,861,215 2,777,623 17,638,838 133,378 17,772,216Deferred inflows related to net OPEB liability (note 8 and 19) 4,990,210 1,486,600 6,476,810 - 6,476,810Service concession agreement - - - 282,250 282,250
Total deferred inflow of resources 19,851,425 4,264,223 24,115,648 5,455,836 29,571,484 Net Position
Net investment in capital assets 470,688,947 458,533,697 929,222,644 6,536,537 935,759,181Restricted:
Nonexpendable 1,434,131 - 1,434,131 - 1,434,131Expendable:
Community development 16,513,972 - 16,513,972 - 16,513,972Public safety 3,510,414 - 3,510,414 - 3,510,414Capital projects 2,698,740 - 2,698,740 - 2,698,740Debt service 11,883,151 24,633,282 36,516,433 15,712,015 52,228,448Stranded investments (notes 12 and 20) - 77,427,235 77,427,235 - 77,427,235Transportation 27,222,903 - 27,222,903 - 27,222,903Contribution - 19,544,138 19,544,138 - 19,544,138Other purposes 6,199,255 6,615,490 12,814,745 870,240 13,684,985Air quality improvement 123,261 - 123,261 - 123,261Donated funds 2,313,946 - 2,313,946 - 2,313,946Trust and loans 12,106,421 - 12,106,421 - 12,106,421
Unrestricted (364,571,660) 244,811,283 (119,760,377) (23,419,747) (143,180,124)Total net position $ 190,123,481 831,565,125 1,021,688,606 (300,955) $ 1,021,387,651 See Notes to the Basic Financial Statements

Comprehensive Annual Financial Report | June 30 , 2020
CITY OF PASADENA
22
FINANCIAL SECTION
Statement of ActivitiesFor the Fiscal Year Ended June 30, 2020
Program Revenues Operating Capital Charges for Grants and Grants andFunctions/Programs Expenses Services Contributions Contributions Primary government:
Governmental activities: General government $ 67,355,324 20,245,086 7,639,434 27,416,781Public safety 152,889,149 13,656,268 3,956,392 -Transportation 55,429,014 26,933,183 14,453,181 9,246,640Utility 6,133,741 - - -Sanitation 4,599,564 7,727,766 - -Health 15,366,671 2,497,177 8,155,860 -Culture and leisure 37,224,271 1,724,910 296,300 -Community development 52,019,315 12,486,736 22,335,894 -Interest and other fiscal charges 6,425,402 - - -
Total governmental activities 397,442,451 85,271,126 56,837,061 36,663,421 Business-type activities:
Electric 197,138,305 217,872,892 293,670 1,897,395Water 58,973,403 62,466,496 1,050,879 1,037,022Refuse 19,429,153 11,643,977 439,299 -Parking 14,713,358 11,229,039 - -Telecommunication 164,009 438,686 - -
Total business-type activities 290,418,228 303,651,090 1,783,848 2,934,417Total primary government $ 687,860,679 388,922,216 58,620,909 39,597,838Aggregate Component Units $ 69,249,218 38,025,301 - 58,025 General revenues: Taxes: Property taxes, levied for general purpose Sales taxes Utility users’ taxes Transient occupancy taxes Construction taxes Business license taxes Franchise taxes Other taxes Other intergovernmental, unrestricted Motor Vehicle In Lieu, unrestricted Use of Money - Investment earnings Miscellaneous revenues Gain on sale of capital assets Total general revenues Transfers Total general revenues and transfers Change in net position Net position - beginning of year, as restated (note 21) Net position - end of year
See Notes to the Basic Financial Statements

CITY OF PASADENA
Comprehensive Annual Financial Report | June 30 , 2020 23
FINANCIAL SECTION
Net (Expenses) Revenues and Changes in Net Position
Primary Government Total Aggregate
Governmental Business-type Primary Component Activities Activities Government Units Total
(12,054,023) - (12,054,023) - $ (12,054,023) (135,276,489) - (135,276,489) - (135,276,489) (4,796,010) - (4,796,010) - (4,796,010) (6,133,741) - (6,133,741) - (6,133,741) 3,128,202 - 3,128,202 - 3,128,202 (4,713,634) - (4,713,634) - (4,713,634) (35,203,061) - (35,203,061) - (35,203,061) (17,196,685) - (17,196,685) - (17,196,685) (6,425,402) - (6,425,402) - (6,425,402) (218,670,843) - (218,670,843) - (218,670,843) - 22,925,652 22,925,652 - 22,925,652 - 5,580,994 5,580,994 - 5,580,994 - (7,345,877) (7,345,877) - (7,345,877) - (3,484,319) (3,484,319) - (3,484,319) - 274,677 274,677 - 274,677 - 17,951,127 17,951,127 - 17,951,127 (218,670,843) 17,951,127 (200,719,716) - $ (200,719,716) - - - (31,165,892) $ (31,165,892) $ 70,688,693 - 70,688,693 - 70,688,693 57,512,896 - 57,512,896 - 57,512,896 26,965,342 - 26,965,342 - 26,965,342 13,090,167 - 13,090,167 8,683,933 21,774,100 4,090,824 - 4,090,824 - 4,090,824 6,900,051 - 6,900,051 - 6,900,051 2,827,262 6,083,162 8,910,424 - 8,910,424 1,613,856 - 1,613,856 2,960,623 4,574,479 599,311 - 599,311 101,217 700,528 20,231,939 - 20,231,939 - 20,231,939 8,231,284 10,939,608 19,170,892 1,920,437 21,091,329 5,493,318 3,069,209 8,562,527 6,189,715 14,752,242 2,287,680 - 2,287,680 - 2,287,680 220,532,623 20,091,979 240,624,602 19,855,925 260,480,527 14,349,099 (14,349,099) - - - 234,881,722 5,742,880 240,624,602 19,855,925 260,480,527 16,210,879 23,694,007 39,904,886 (11,309,967) 28,594,919 173,912,602 807,871,118 981,783,720 11,009,012 992,792,732 $ 190,123,481 831,565,125 1,021,688,606 (300,955) $ 1,021,387,651
See Notes to the Basic Financial Statements

Comprehensive Annual Financial Report | June 30 , 2020
CITY OF PASADENA
24
FINANCIAL SECTION
Balance SheetGovernmental Funds
June 30, 2020
Project Non-Major Management General Housing Governmental General Fund Debt Service Successor Funds TotalAssets:
Pooled cash and investments (note 2) $ 65,842,920 4,044,217 3,507,568 7,045,181 169,580,439 $ 250,020,325Accounts receivable, net (note 3) 23,261,631 3,299,402 14,798 4,624 12,698,704 39,279,159Notes receivable (note 4) 18,350,000 - - 21,296,344 52,992,731 92,639,075Allowance for uncollectible notes recievable (note 4) (4,844,605) - - (21,296,344) (52,992,731) (79,133,680)Due from other funds (note 5) 12,532,404 - - - - 12,532,404Prepaids and other assets 93,678 - - - 119,973 213,651Restricted assets:
Cash and investments (note 2) 11,706,397 - - - 2,240,412 13,946,809Cash with fiscal agent (note 2) - - - - 9,143,248 9,143,248
Advances to other funds (note 6) 1,087,067 - - - - 1,087,067Advances to component units (note 6) 167,208 - - - - 167,208Property held for resale - - - - 275,566 275,566
Total assets $ 128,196,700 7,343,619 3,522,366 7,049,805 194,058,342 $ 340,170,832 Liabilities:
Accounts payable and accrued liabilities $ 15,341,450 3,656,805 - 16,624 4,817,500 $ 23,832,379Deposits 4,443,395 - - - 674,012 5,117,407Due to other funds (note 5) - - - - 8,618,964 8,618,964Due to other governments 21,467 - - - - 21,467Unearned revenue 22,458 - - - 3,141,510 3,163,968Advances from other funds (note 6) 330,000 - - - - 330,000
Total liabilities 20,158,770 3,656,805 - 16,624 17,251,986 41,084,185 Deferred inflow of resources:
Unavailable revenues (note 8) 431,665 1,397,527 - - 4,331,544 6,160,736Total deferred inflow of resources 431,665 1,397,527 - - 4,331,544 6,160,736 Fund balances:
Nonspendable 14,853,348 - - - 1,554,104 16,407,452Restricted 12,106,421 637,147 3,522,366 7,033,181 60,654,755 83,953,870Committed 55,119,600 - - - 115,445,636 170,565,236Assigned 25,081,699 1,652,140 - - - 26,733,839Unassigned 445,197 - - - (5,179,683) (4,734,486)
Total fund balances 107,606,265 2,289,287 3,522,366 7,033,181 172,474,812 292,925,911Total liabilities, deferred inflow of resources and fund balances $ 128,196,700 7,343,619 3,522,366 7,049,805 194,058,342 $ 340,170,832
See Notes to the Basic Financial Statements

CITY OF PASADENA
Comprehensive Annual Financial Report | June 30 , 2020 25
FINANCIAL SECTION
Reconciliation of the Balance Sheet of Governmental Fundsto the Statement of Net Position
June 30, 2020 Fund balances of governmental funds $ 292,925,911 Amounts reported for governmental activities in the Statement of Net Position are different because: Capital assets net of depreciation have not been included as financial resources in governmental fund activity. 496,678,735 Long-term debt not included in governmental fund activity.
Notes payable $ (5,271,481) Pension bonds (136,820,000) Certificates of participation (50,850,000) Capitalized lease obligations (6,811,926) Unamortized premium (discount) (4,546,680) (204,300,087)
Accrued interest payable for the current portion of interest due on long-term debt has not been reported in the governmental funds. (1,742,509) Unavailable revenue related to GASB 33 requirement, which consisted primarily of intergovernmental receivables not collected within the availability period.
Revenues not available General Fund $ 431,665 Project Management Capital Project Fund 1,397,527 Non-Major Governmental Funds 4,331,544 6,160,736
The substance of an advanced refunding is reported as deferring the difference and amortizing it over future periods. 23,398,699 The City implemented GASB 68. The following related items have been reflected in the Statement of Net Position.
Net pension liability $ (310,807,946) Net pension liability - deferred inflows (11,313,832) Net pension liability - deferred outflows 59,080,054 (263,041,724)
The City implemented GASB 75. The following related items have been reflected in the Statement of Net Position.
Net OPEB liability $ (57,581,192) Net OPEB liability - deferred inflows (4,452,579) Net OPEB liability - deferred outflows 7,625,093 (54,408,678)
Internal service funds are used by management to charge the costs of certain activities, such as equipment management and self-insurance, to individual funds. The Net Position and Liabilities of the Internal Service Funds must be added to the Statement of Net Position (105,547,602)
Net position of governmental activities $ 190,123,481
See Notes to the Basic Financial Statements

Comprehensive Annual Financial Report | June 30 , 2020
CITY OF PASADENA
26
FINANCIAL SECTION
Statement of Revenues, Expenditures and Changes in Fund BalancesGovernmental Funds
For the Fiscal Year Ended June 30, 2020 Project Non-Major Management General Housing Governmental General Funds Debt Service Successor Funds TotalRevenues:
Taxes $ 180,097,469 - - - 3,591,622 $ 183,689,091Licenses and permits 4,107,219 - - - 9,190,273 13,297,492Intergovernmental revenues 22,023,659 5,668,134 - - 50,783,176 78,474,969Charges for services 39,789,367 363,277 - - 12,913,825 53,066,469Fines and forfeits 6,519,735 - - - - 6,519,735Investment earnings 2,743,724 - 100,691 34,932 4,656,533 7,535,880Rental income 7,617,455 - - 61,741 3,069,108 10,748,304Miscellaneous revenues 3,139,644 - - 141,538 3,801,010 7,082,192Contributions 27,620 368,864 - - 7,706,032 8,102,516
Total revenues 266,065,892 6,400,275 100,691 238,211 95,711,579 368,516,648 Expenditures:
Current: General government 72,955,954 993,439 3,200 - 5,600 73,958,193Public safety 136,522,404 112,861 - - 2,306,547 138,941,812Transportation 30,784,573 4,828,776 - - 14,684,592 50,297,941Utility - - - - 6,133,741 6,133,741Sanitation - 274,925 - - 4,218,482 4,493,407Health - - - - 14,250,373 14,250,373Culture and leisure 20,091,786 410,779 - - 13,763,043 34,265,608Community development 9,417,666 1,262,079 - 397,337 34,049,235 45,126,317Capital outlay - 23,794,984 - - - 23,794,984
Debt service: Principal retirement - - 3,376,583 - 2,195,000 5,571,583Interest - - 3,558,370 - 2,522,825 6,081,195Bond issuance costs - - 561,583 - - 561,583
Total expenditures 269,772,383 31,677,843 7,499,736 397,337 94,129,438 403,476,737Excess (deficiency) of revenues over (under) expenditures (3,706,491) (25,277,568) (7,399,045) (159,126) 1,582,141 (34,960,089) Other financing sources (uses):
Proceeds from issuance of debt - - 6,800,000 - - 6,800,000Proceeds from issuance of refunding debt - - 131,805,000 - - 131,805,000Payment to refunded bond escrow agent (note 9) - - (131,153,973) - - (131,153,973)Proceeds from sale of capital assets 31,818,965 - - - - 31,818,965Transfers in (note 15) 19,656,583 27,107,815 6,933,543 1,204,797 17,491,032 72,393,770Transfers out (note 15) (38,863,033) (264,735) (6,800,000) - (21,602,485) (67,530,253)
Total other financing sources (uses) 12,612,515 26,843,080 7,584,570 1,204,797 (4,111,453) 44,133,509 Change in fund balances 8,906,024 1,565,512 185,525 1,045,671 (2,529,312) 9,173,420Fund balances at beginning of year, as restated (note 21) 98,700,241 723,775 3,336,841 5,987,510 175,004,124 283,752,491Fund balances at end of year $ 107,606,265 2,289,287 3,522,366 7,033,181 172,474,812 $ 292,925,911
See Notes to the Basic Financial Statements

CITY OF PASADENA
Comprehensive Annual Financial Report | June 30 , 2020 27
FINANCIAL SECTION
Reconciliation of the Statement of Revenues,Expenditures, and Changes in Fund Balances of Governmental Funds
to the Statement of ActivitiesFor the Fiscal Year Ended June 30, 2020
Net change in fund balances - total governmental funds $ 9,173,420 Amounts reported for governmental activities in the statement of activities differs from the amounts reported in the statement of activities because: Governmental funds report capital outlays as expenditures. However, in the statement of activities, the cost of these assets is allocated over their estimated useful lives and reported as depreciation expense. This is the amount by which capital outlays exceed depreciation in the current period.
Capital outlay 23,794,984 Donation of capital assets 27,416,781 Sale of capital assets (30,716,781) Depreciation (16,572,137)
Gain/(loss) on sale of capital assets
756,681
Bond proceeds are reported as financing sources in governmental funds and thus contribute to the change in fund balance. In the statement of net position, however, issuing debt increases long-term liabilities and does not affect the statement of activities. Similarly, repayment of principal is an expenditure in the governmental funds but reduces the liability in the Statement of Net Position. Debt issued:
Pension Bonds $ (131,805,000) Capitalized lease obligations (6,800,000) Bond premiums/discounts/deferred refund charges 19,248,973
Repayments: Principal repayments 117,476,583 Amortization of bond premiums/discounts (1,627,649)
Net adjustment
(3,507,093) Revenues in the statement of activities that do not provide current financial resources are not reported as revenue in the funds. 20,066 Bond deferred charges and similar items are recorded as expenditures in governmental funds when debt is first issued, whereas these payments are deferred and amortized in the statement of activities. This amount is the net offset of the difference. (434,581) Interest payable related to debt services or long-term liabilities. This is the net change in interest payable expense for the current period. 217,376 Pension expense reported in the governmental funds includes the annual required contributions. In the Statement of Activities, pension expense includes the change in the net pension liability, and related changes in pension amounts for deferred outflows of resources and deferred inflows of resources. 3,572,453 OPEB expense reported in the governmental funds includes payment of premiums for the current year. In the Statement of Activities, OPEB expense includes the change in the OPEB liability, and OPEB related deferred outflows of resources and deferred inflows of resources. 182,084 Internal service funds are used by management to charge the costs of certain activities, such as computing and communication, building maintenance, fleet maintenance, fleet replacement, benefits, workers’ compensation, general liability, printing services, and 311 call center, to individual funds. The net revenue (expense) of certain activities of internal service funds is reported with governmental activities. 2,307,626 Change in net position of governmental activities $ 16,210,879
See Notes to the Basic Financial Statements

Comprehensive Annual Financial Report | June 30 , 2020
CITY OF PASADENA
28
FINANCIAL SECTION
Statement of Net PositionProprietary Funds
June 30, 2020 Light Off Street and Power Water ParkingAssets
Current assets: Cash and investments (note 2) $ 251,501,968 43,076,104 4,980,831Accounts receivable, net (note 3) 25,627,795 10,100,250 343,676Notes receivable, restricted (note 4) 6,583,333 - -Due from other funds (note 5) 1,830,851 - -Inventories 19,334,971 8,025,740 -Prepaids and other assets 674,188 344,403 178,829
Total current assets 305,553,106 61,546,497 5,503,336Noncurrent restricted assets:
Cash and investments (note 2) 15,663,384 2,316 923,753Cash and investments - stranded investments reserve (note 12) 60,774,869 - -Cash with fiscal agent (note 2) 29 6,143,188 2,000,781Notes receivable (note 4) 8,046,667 - -
Total noncurrent restricted assets 84,484,949 6,145,504 2,924,534Other non-current assets:
Advances to other funds (note 6) 330,000 - -Deposit with Independent System Operator (ISO) 200,000 - -Prepaid long-term assets 10,683,146 - -Capital assets – net of accumulated depreciation (note 7) 514,891,691 212,863,000 44,344,407
Total other non-current assets 526,104,837 212,863,000 44,344,407Total assets 916,142,892 280,555,001 52,772,277Deferred outflow of resources
Deferred charges - bond refunding 710,313 198,484 -Deferred outflows related to net pension liability 7,993,153 3,270,541 192,941Deferred outflows related to net OPEB liability 1,445,934 722,954 12,358
Total deferred outflow of resources 10,149,400 4,191,979 205,299Liabilities
Current liabilities: Accounts payable and accrued liabilities 9,925,389 7,948,304 1,254,237Deposits 3,098,747 520,171 250,723Insurance claims payable - current (note 16) - - -Due to other funds (note 5) - - -Unearned revenues 7,181,654 2,066,223 -Compensated absences due within one year - - -Revenue bonds - current (note 9) 13,380,000 2,540,000 800,000Capitalized lease obligations - current (note 9) - - 440,044
Total current liabilities 33,585,790 13,074,698 2,745,004Non-current liabilities:
Insurance claims payable - long-term (note 16) - - -Compensated absences due in more than one year - - -Advances from other funds (note 6) - - 1,087,067Net pension liability (note 18) 58,506,286 20,235,992 1,135,543Net OPEB liability (notes 19) 11,012,143 5,366,301 93,324Revenue bonds - long-term (note 9) 218,657,536 54,980,672 21,200,000Capitalized lease obligations - long-term (note 9) - - 2,384,123
Total non-current liabilties 288,175,965 80,582,965 25,900,057Total liabilities 321,761,755 93,657,663 28,645,061Deferred inflow of resources:
Deferred inflows related to net pension liability 1,750,190 716,121 42,247Deferred inflows related to net OPEB liability 844,746 421,750 7,217
Total deferred inflow of resources 2,594,936 1,137,871 49,464Net Position Net investment in capital assets 281,146,799 153,081,316 19,520,240Restricted:
Debt Service 15,563,244 6,145,504 2,924,534Contribution 18,000,000 1,544,138 -Stranded investments (notes 12 and 20) 77,427,235 - -Other purposes 6,615,490 - -
Unrestricted 203,182,833 29,180,488 1,838,277Total net position $ 601,935,601 189,951,446 24,283,051 See Notes to the Basic Financial Statements

CITY OF PASADENA
Comprehensive Annual Financial Report | June 30 , 2020 29
FINANCIAL SECTION
Governmental Non-Major Total Activities- Enterprise Enterprise Internal
Funds Funds Service Funds Total 28,653,448 328,212,351 42,315,915 $ 370,528,266 2,310,973 38,382,694 354,599 38,737,293 - 6,583,333 - 6,583,333 - 1,830,851 - 1,830,851 - 27,360,711 424,893 27,785,604 - 1,197,420 916,842 2,114,262 30,964,421 403,567,360 44,012,249 447,579,609 - 16,589,453 - 16,589,453 - 60,774,869 - 60,774,869 - 8,143,998 - 8,143,998 - 8,046,667 - 8,046,667 - 93,554,987 - 93,554,987 - 330,000 - 330,000 - 200,000 - 200,000 - 10,683,146 - 10,683,146 4,785,342 776,884,440 16,407,640 793,292,080 4,785,342 788,097,586 16,407,640 804,505,226 35,749,763 1,285,219,933 60,419,889 1,345,639,822 - 908,797 - 908,797 1,228,824 12,685,459 17,242,508 29,927,967 364,571 2,545,817 920,695 3,466,512 1,593,395 16,140,073 18,163,203 34,303,276 744,090 19,872,020 14,857,822 34,729,842 10,275,552 14,145,193 - 14,145,193 - - 17,597,972 17,597,972 - - 5,744,291 5,744,291 - 9,247,877 - 9,247,877 - - 9,308,011 9,308,011 - 16,720,000 - 16,720,000 - 440,044 - 440,044 11,019,642 60,425,134 47,508,096 107,933,230 - - 22,641,266 22,641,266 - - 2,828,880 2,828,880 - 1,087,067 - 1,087,067 7,693,465 87,571,286 100,114,767 187,686,053 2,753,072 19,224,840 6,952,671 26,177,511 - 294,838,208 - 294,838,208 - 2,384,123 - 2,384,123 10,446,537 405,105,524 132,537,584 537,643,108 21,466,179 465,530,658 180,045,680 645,576,338 269,065 2,777,623 3,547,383 6,325,006 212,887 1,486,600 537,631 2,024,231 481,952 4,264,223 4,085,014 8,349,237 4,785,342 458,533,697 16,394,733 474,928,430 - 24,633,282 - 24,633,282 - 19,544,138 - 19,544,138 - 77,427,235 - 77,427,235 - 6,615,490 - 6,615,490 10,609,685 244,811,283 (121,942,335) 122,868,948 15,395,027 831,565,125 (105,547,602) $ 726,017,523
See Notes to the Basic Financial Statements

Comprehensive Annual Financial Report | June 30 , 2020
CITY OF PASADENA
30
FINANCIAL SECTION
Statement of Revenues, Expenses and Changes in Net PositionProprietary Funds
For the Fiscal Year Ended June 30, 2020
Light Off Street and Power Water ParkingOperating revenues:
Utilities $ 217,872,892 62,466,496 -Offstreet parking - - 11,221,094Refuse collection - - -Telecommunication - - -Computing and communication services - - -Building maintenance - - -Fleet maintenance - - -Employee benefits - - -Insurance - - -Printing - - -311 Call Center - - -
Total operating revenues 217,872,892 62,466,496 11,221,094 Operating expenses:
Utility production 108,491,899 29,273,973 -Utility transmission and distribution 17,748,074 6,810,196 -Utility commercial and general 29,797,593 11,354,073 -Offstreet parking - - 12,231,112Refuse collection - - -Telecommunications - - -Computing and communication services - - -Building maintenance - - -Fleet maintenance - - -Benefits - - -Insurance - - -Printing - - -311 Call Center - - -Depreciation 31,955,010 8,694,776 1,707,290
Total operating expenses 187,992,576 56,133,018 13,938,402Operating income (loss) 29,880,316 6,333,478 (2,717,308) Non-operating revenues (expenses):
Taxes - - -Intergovernmental revenues 293,670 1,050,879 -Investment earnings 8,412,499 1,435,025 366,596Miscellaneous - - -Interest expense (9,129,374) (2,885,893) (646,449)Gain (loss) on disposal of assets (16,355) 45,508 (128,507)Other 1,085,218 1,983,991 7,945
Total nonoperating revenues (expenses) 645,658 1,629,510 (400,415)Income (loss) before transfers and contributions 30,525,974 7,962,988 (3,117,723)
Capital contributions 1,897,395 1,037,022 -Transfers in (note 15) 5,436,527 - -Transfers out (note 15) (17,314,625) (1,894,138) (108,248)
Changes in net position 20,545,271 7,105,872 (3,225,971)Net position (deficit) at beginning of year 581,390,330 182,845,574 27,509,022Net position (deficit) at end of year $ 601,935,601 189,951,446 24,283,051
See Notes to the Basic Financial Statements

CITY OF PASADENA
Comprehensive Annual Financial Report | June 30 , 2020 31
FINANCIAL SECTION
Governmental Activities-
Non-Major Total Internal Enterprise Enterprise Service
Funds Funds Funds Total - 280,339,388 - $ 280,339,388 - 11,221,094 - 11,221,094 11,643,977 11,643,977 - 11,643,977 438,686 438,686 - 438,686 - - 17,063,450 17,063,450 - - 13,188,811 13,188,811 - - 12,547,146 12,547,146 - - 32,986,686 32,986,686 - - 21,394,785 21,394,785 - - 1,076,327 1,076,327 - - 791,329 791,329 12,082,663 303,643,145 99,048,534 402,691,679 - 137,765,872 - 137,765,872 - 24,558,270 - 24,558,270 - 41,151,666 - 41,151,666 - 12,231,112 - 12,231,112 18,739,184 18,739,184 - 18,739,184 32,689 32,689 - 32,689 - - 18,344,597 18,344,597 - - 12,716,967 12,716,967 - - 9,241,910 9,241,910 - - 42,537,091 42,537,091 - - 20,324,698 20,324,698 - - 1,633,683 1,633,683 - - 921,698 921,698 851,936 43,209,012 2,634,952 45,843,964 19,623,809 277,687,805 108,355,596 386,043,401 (7,541,146) 25,955,340 (9,307,062) 16,648,278 6,083,162 6,083,162 - 6,083,162 124,365 1,468,914 - 1,468,914 725,488 10,939,608 695,404 11,635,012 - - 369,794 369,794 - (12,661,716) - (12,661,716) 30,647 (68,707) 57,083 (11,624) 314,934 3,392,088 - 3,392,088 7,278,596 9,153,349 1,122,281 10,275,630 (262,550) 35,108,689 (8,184,781) 26,923,908 - 2,934,417 - 2,934,417 159,659 5,596,186 11,394,243 16,990,429 (628,274) (19,945,285) (901,836) (20,847,121) (731,165) 23,694,007 2,307,626 26,001,633 16,126,192 807,871,118 (107,855,228) 700,015,890 15,395,027 831,565,125 (105,547,602) $ 726,017,523
See Notes to the Basic Financial Statements

Comprehensive Annual Financial Report | June 30 , 2020
CITY OF PASADENA
32
FINANCIAL SECTION
Statement of Cash FlowsProprietary Funds
Year Ended June 30, 2020
Light Off Street
and Power Water ParkingCash Flows from Operating Activities:
Cash received from customers $ 215,248,713 60,990,376 11,261,835Cash payments to suppliers for goods and services (113,170,694) (30,196,198) (10,088,413)Cash payments to employees for services (32,239,809) (12,502,201) (899,489)Cash payments to other funds for services (6,501,867) (3,727,126) (1,122,651)Miscellanous revenue/(expenses) 1,085,218 1,983,991 7,968
Net cash provided by (used for) operating activities 64,421,561 16,548,842 (840,750) Cash Flows from Noncapital Financing Activities:
Cash transfers in 3,605,673 - -Cash transfers out (17,314,625) (1,894,138) (108,248)Advances (to)/from other funds 110,000 - -Taxes received - - -Intergovernmental revenues 293,670 1,050,879 -
Net cash provided by (used for) noncapital financing activities (13,305,282) (843,259) (108,248) Cash Flows from Capital and Related Financing Activities:
Acquisition and construction of capital assets (27,779,541) (18,666,020) (2,222,439)Proceeds from long-term debt 11,575,000 - -Amount paid to bond escrow agents (261,081) - -Proceeds from sale of capital assets 20,998 46,434 -Payments on capital leases - - (428,526)Capital Contributions 3,271,656 1,370,060 -Bond premiums received from debt issuance 1,311,081 - -Unspent cost of issuance 36,095 - -Principal paid on capital debt (25,630,000) (2,475,000) (801,224)Interest paid on capital debt (10,248,925) (3,114,465) (646,449)
Net cash used for capital and related financing activities (47,704,717) (22,838,991) (4,098,638) Cash Flows from Investing Activities:
Purchase of investments (36,003,396) - -Proceeds from sale of investments 66,126,311 1,109,222 -Investment earnings 8,735,565 1,478,160 366,585Payments received from loans made to suppliers 6,014,167 - -
Net cash provided by (used for) investing activities 44,872,647 2,587,382 366,585Net increase (decrease) in cash and cash equivalents 48,284,209 (4,546,026) (4,681,051)Cash and cash equivalents at beginning of year 230,365,711 48,851,822 12,586,416Cash and cash equivalents at end of year $ 278,649,920 44,305,796 7,905,365 Reconciliation of cash and cash equivalents to amounts reported on the Statement of Net Position:
Cash and Investments $ 251,501,968 43,076,104 4,980,831Restricted:
Cash and stranded investments reserve 60,774,869 - -Cash and investments 15,663,384 2,316 923,753Cash with fiscal agent 29 6,143,188 2,000,781Less non-cash equivalents (49,290,330) (4,915,812) -
Cash and cash equivalents at end of year $ 278,649,920 44,305,796 7,905,365
See Notes to the Basic Financial Statements
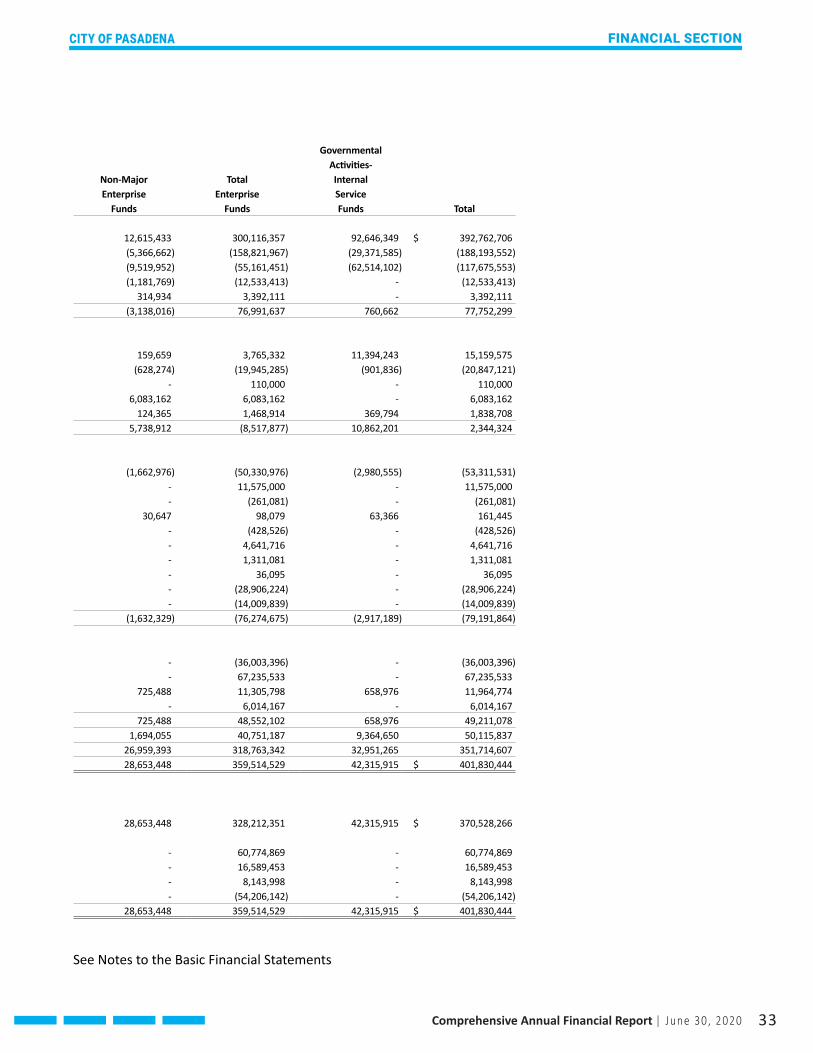
CITY OF PASADENA
Comprehensive Annual Financial Report | June 30 , 2020 33
FINANCIAL SECTION
Governmental Activities-
Non-Major Total Internal Enterprise Enterprise Service
Funds Funds Funds Total 12,615,433 300,116,357 92,646,349 $ 392,762,706 (5,366,662) (158,821,967) (29,371,585) (188,193,552) (9,519,952) (55,161,451) (62,514,102) (117,675,553) (1,181,769) (12,533,413) - (12,533,413) 314,934 3,392,111 - 3,392,111 (3,138,016) 76,991,637 760,662 77,752,299 159,659 3,765,332 11,394,243 15,159,575 (628,274) (19,945,285) (901,836) (20,847,121) - 110,000 - 110,000 6,083,162 6,083,162 - 6,083,162 124,365 1,468,914 369,794 1,838,708 5,738,912 (8,517,877) 10,862,201 2,344,324 (1,662,976) (50,330,976) (2,980,555) (53,311,531) - 11,575,000 - 11,575,000 - (261,081) - (261,081) 30,647 98,079 63,366 161,445 - (428,526) - (428,526) - 4,641,716 - 4,641,716 - 1,311,081 - 1,311,081 - 36,095 - 36,095 - (28,906,224) - (28,906,224) - (14,009,839) - (14,009,839) (1,632,329) (76,274,675) (2,917,189) (79,191,864) - (36,003,396) - (36,003,396) - 67,235,533 - 67,235,533 725,488 11,305,798 658,976 11,964,774 - 6,014,167 - 6,014,167 725,488 48,552,102 658,976 49,211,078 1,694,055 40,751,187 9,364,650 50,115,837 26,959,393 318,763,342 32,951,265 351,714,607 28,653,448 359,514,529 42,315,915 $ 401,830,444 28,653,448 328,212,351 42,315,915 $ 370,528,266 - 60,774,869 - 60,774,869 - 16,589,453 - 16,589,453 - 8,143,998 - 8,143,998 - (54,206,142) - (54,206,142) 28,653,448 359,514,529 42,315,915 $ 401,830,444
See Notes to the Basic Financial Statements

Comprehensive Annual Financial Report | June 30 , 2020
CITY OF PASADENA
34
FINANCIAL SECTION
Statement of Cash FlowsProprietary Funds
Year Ended June 30, 2020 Light Off Street and Power Water ParkingReconciliation of operating income (loss) to net cash provided by (used for) operating activities:
Operating income (loss) $ 29,880,316 6,333,478 (2,717,308) Adjustments to reconcile operating income (loss) to net cash provided by (used for) operating activities:
Depreciation and amortization 31,955,010 8,694,776 1,707,290Miscellaneous revenue (expense) 1,085,218 1,983,991 7,968(Increase) decrease in accounts receivable (3,708,259) (1,870,426) 40,728Increase (decrease) in allowance for uncollectible accounts 1,084,080 394,306 -Increase (decrease) in due to other funds - - -(Increase) decrease in inventories (730,324) 105,191 -(Increase) decrease in prepaids and other assets 1,074,831 11,073 (6,622)Increase (decrease) in accounts payable and accrued liabilities 28,572 (847,311) 73,326Increase (decrease) in unearned revenue (402,795) - -Increase (decrease) in insurance claims payable - - -Increase (decrease) in OPEB liability - - 6,436Increase (decrease) in compensated absences - - -Increase (decrease) in deposits payable 210,948 61,305 (8,745)Increase (decrease) in deferred inflows (399,728) 21,777 12,531(Increase) decrease in deferred outflow 2,070,072 701,766 30,432Increase (decrease) in net OPEB liability 1,612,241 796,693 (18,233)Increase (decrease) in Net Pension Liability 661,379 162,223 31,448Total adjustments 34,541,245 10,215,364 1,876,559
Net cash provided by (used for) operating activities $ 64,421,561 16,548,842 (840,749) Non-Cash Investing, Capital, and Financing Activities
Gain/(Loss) on disposition of capital assets $ (16,355) 45,508 (128,507)Amortization of deferred charges (271,500) (66,161) -Amortization of premiums (discounts) 858,945 285,037 -Changes in fair value of investments $ 2,437,671 360,732 39,942
See Notes to the Basic Financial Statements

CITY OF PASADENA
Comprehensive Annual Financial Report | June 30 , 2020 35
FINANCIAL SECTION
Governmental Activities-
Non-Major Total Internal Enterprise Enterprise Service
Funds Funds Funds Total (7,541,146) 25,955,340 (9,307,062) $ 16,648,278 851,936 43,209,012 2,634,952 45,843,964 314,934 3,392,111 - 3,392,111 462,290 (5,075,667) (9,770) (5,085,437) 70,475 1,548,861 - 1,548,861 - - 1,270,898 1,270,898 - (625,133) 48,286 (576,847) - 1,079,282 (10,311) 1,068,971 (185,434) (930,847) 4,416,070 3,485,223 - (402,795) - (402,795) - - (5,203,236) (5,203,236) - 6,436 - 6,436 - - 955,176 955,176 1,707,157 1,970,665 - 1,970,665 92,661 (272,759) (875,756) (1,148,515) 94,800 2,897,070 1,836,507 4,733,577 744,602 3,135,303 1,418,887 4,554,190 249,709 1,104,759 3,586,021 4,690,780 4,403,130 51,036,298 10,067,724 61,104,022
(3,138,016) 76,991,638 760,662 $ 77,752,300 30,647 (68,707) (6,283) $ (74,990) - (337,661) - (337,661) - 1,143,982 - 1,143,982 - 2,838,345 181,356 $ 3,019,701
See Notes to the Basic Financial Statements

Comprehensive Annual Financial Report | June 30 , 2020
CITY OF PASADENA
36
FINANCIAL SECTION
Statement of Net PositionFiduciary Funds
June 30, 2020 Employee
Benefit Private Purpose Trust Funds Agency Funds Trust Funds
Assets: Cash and cash equivalents (note 2) $ 332,750,032 $ 457,779 $ 663,129Receivables:
Accounts receivable - 665,908 -Contribution 2,419,005 - -Interest 115,554 - -Notes receivable - - 515,000Allowance for uncollectible long-term receivables - - (515,000)
Other assets - 839,193 -Investments, at fair value (note 2)
Government and agencies 12,716,435 - -Corporate obligations 21,687,948 - -Fixed income mutual fund 16,244,067 - -Real estate 11,175,291 - -Corporate stocks 44,159,164 - -
Total investments 105,982,905 - -
Capital assets, net (note 7) - - 214,261Total assets 441,267,496 $ 1,962,880 877,390 Liabilities:
Accounts payable and accrued liabilities 21,310 658,629 12,412Due to other governments - 309,016 -Due to bondholders - 995,235 -Bonds payable - due within one year - - 210,000Bonds payable - due in more than one year - - 225,000Pending purchases 5,366,983 - -
Total liabilities 5,388,293 $ 1,962,880 447,412 Net Position:
Held in trust for other post retirement benefits 2,215,925 -Restricted for pensions 433,663,278 -Held in trust for other purposes - 429,978
Total Net Position $ 435,879,203 $ 429,978
See Notes to the Basic Financial Statements

CITY OF PASADENA
Comprehensive Annual Financial Report | June 30 , 2020 37
FINANCIAL SECTION
Statement of Changes in Net Position Fiduciary Funds For the Fiscal Year Ended June 30, 2020 Employee Benefit Private Purpose Trust Funds Trust Funds Additions: Contributions: Employer $ 23,137,382 $ - Plan members 16,286,969 - Property taxes - 9,842,655 Total contributions 39,424,351 9,842,655 Net investment income: Investment earnings 15,091,779 5,253 Interest 901,682 - Dividends 1,764,478 - Gross investment income 17,757,939 5,253 Less investment expenses (400,280) - Total net investment income 17,357,659 5,253 Miscellaneous revenues - 20,827 Total additions 56,782,010 9,868,735 Deductions: Benefits paid to participants 35,770,995 - Fiscal agency expenses - 5,217 Interest expense - 21,210 Statutory pass-through expenses - 8,941,010 Administrative expenses 550,734 - County administrative expenses - 836,564 Successor agency administrative cost allowance - 126,786 Total deductions 36,321,729 9,930,787 Change in net position 20,460,281 (62,052) Net Position held in trust - beginning 415,418,922 492,030 Net Position held in trust - ending $ 435,879,203 $ 429,978
See Notes to the Basic Financial Statements

Comprehensive Annual Financial Report | June 30 , 2020
CITY OF PASADENA
38
FINANCIAL SECTION
See Notes to the Basic Financial Statements in the Discretely Presented Component Units audited standalone financial statements
Combining Statement of Net PositionDiscretely Presented Component Units
June 30, 2020 Rose Bowl Pasadena Center Pasadena Operating Operating Community Company Company Access Corp. TotalAssets
Current assets: Cash and investments $ 19,348,222 16,915,616 288,564 $ 36,552,402Accounts receivable, net 3,609,605 350,232 1,813 3,961,650Inventory 10,674 - - 10,674Due from the City of Pasadena - 504,008 - 504,008Prepaids and other assets 42,410 118,053 15,248 175,711
Total current assets 23,010,911 17,887,909 305,625 41,204,445Non-current assets:
Restricted assets - cash and investmetns 15,712,015 11,489,706 176,207 27,377,928Due from the City of Pasadena 471,481 - - 471,481Capital Assets:
Construction in progress 4,737,926 2,723,736 - 7,461,662Other capital assets, net 173,619,550 126,025,111 180,114 299,824,775
Total non-current assets 194,540,972 140,238,553 356,321 335,135,846Total assets 217,551,883 158,126,462 661,946 376,340,291
Deferred outflow of resources: Accumulated decrease in fair value of hedging derivatives (note 10) - 33,406,950 - 33,406,950Deferred refunding charges 2,538,189 1,066,452 - 3,604,641Outflows related to pension liability 1,085,090 - - 1,085,090
Total deferred outflow of resources 3,623,279 34,473,402 - 38,096,681
Liabilities Current liabilities:
Accounts payable and accrued liabilities 3,581,193 969,897 28,217 4,579,307Interest payable 3,172,160 525,846 - 3,698,006Due to the City of Pasaena 583,417 - - 583,417Deposits 317,046 1,279,254 - 1,596,300Due to other governments 1,106,324 - 176,207 1,282,531
Current portion of long-term advance 100,000 - - 100,000Current portion of compensated absences 207,608 - 32,291 239,899Current portion of long-term debt (note 9) 3,361,769 5,606,049 - 8,967,818
Total current liabilities 12,429,517 8,381,046 236,715 21,047,278Non-current liabilities:
Derivative instrument liability (note 10) - 33,406,950 - 33,406,950Long-term advance 700,000 - - 700,000Compensated absences 55,013 - - 55,013Long-term debt, net of current portion (note 9) 206,250,640 145,033,346 - 351,283,986Net pension liability 2,788,864 - - 2,788,864
Total non-current liabilities 209,794,517 178,440,296 - 388,234,813Total liabilities 222,224,034 186,821,342 236,715 409,282,091
Deferred inflow of resources: Deferred refunding charge (note 10) - 5,040,208 - 5,040,208Service concession agreement - 282,250 - 282,250Inflows related to net pension liability 133,378 - - 133,378
Total deferred inflow of resources 133,378 5,322,458 - 5,455,836
Net Position: Net Investment in capital assets 2,324,793 4,031,630 180,114 6,536,537Restricted 15,712,015 870,240 - 16,582,255Unrestricted (19,219,058) (4,445,806) 245,117 (23,419,747)
Total net position $ (1,182,250) 456,064 425,231 $ (300,955)

CITY OF PASADENA
Comprehensive Annual Financial Report | June 30 , 2020 39
FINANCIAL SECTION
See Notes to the Basic Financial Statements in the Discretely Presented Component Units audited standalone financial statements
Combining Statement of Revenues, Expenses and Changes in Net PositionDiscretely Presented Component Units
For the Fiscal Year Ended June 30, 2020
Rose Bowl Pasadena Center Pasadena Operating Operating Community Company Company Access Corp. TotalOperating revenues:
Charges for services: Rose Bowl $ 26,823,588 - - $ 26,823,588Golf course 1,680,182 - - 1,680,182Pasadena Center Operating Company - 8,506,912 - 8,506,912Pasadena Community Access Corporation - - 1,014,619 1,014,619
Total operating revenues 28,503,770 8,506,912 1,014,619 38,025,301 Operating expenses:
Rose Bowl 21,442,946 - - 21,442,946Golf course 1,600,921 - - 1,600,921Pasadena Center Operating Company - 9,924,972 - 9,924,972Pasadena Community Access Corporation - - 1,014,154 1,014,154Depreciation 12,263,992 4,158,709 40,784 16,463,485
Total operating expenses 35,307,859 14,083,681 1,054,938 50,446,478Operating income (loss) (6,804,089) (5,576,769) (40,319) (12,421,177) Non-operating revenues (expenses):
Transient occupancy taxes, net - 8,683,933 - 8,683,933Tourism business improvement district tax - 2,960,623 - 2,960,623Facility restoration fee - 101,217 - 101,217Investment earnings 960,391 960,008 38 1,920,437Interest expense (12,327,400) (6,272,340) - (18,599,740)Public, education, and government (PEG) revenue - - 300,050 300,050PEG expense - - (203,000) (203,000)Other nonoperating revenues 5,889,665 - - 5,889,665
Total non-operating revenues (5,477,344) 6,433,441 97,088 1,053,185Income (loss) before transfers (12,281,433) 856,672 56,769 (11,367,992)Capital contributions - 58,025 - 58,025Change in net position (12,281,433) 914,697 56,769 (11,309,967)Net position at beginning of year 11,099,183 (458,633) 368,462 11,009,012Net position at end of year $ (1,182,250) 456,064 425,231 $ (300,955)

(This page intentionally left blank)
40
Related Documents