Comprehensive Annual Financial Report City of Glendale, California T H E JEW E L CIT Y INCORPORATED 1906 Fiscal Year Ended June 30, 2019

Welcome message from author
This document is posted to help you gain knowledge. Please leave a comment to let me know what you think about it! Share it to your friends and learn new things together.
Transcript
Comprehensive Annual Financial ReportCity of Glendale, California
GLENDALE CITY HALLGLENDALE CITY HALL
THE JEWEL CITY
I N C O R P O R A T E D
1 9 0 6
Fiscal Year Ended June 30, 2019

Today’s Glendale City Hall was designed by Alfred Hansen and built in three stages by the Works Progress Administration (W.P.A.) as part of a national program that produced hundreds of local landmarks nationwide, while stimulating the design and construction industries. Glendale’s City Hall is a typical example of the style that evolved from the program, a hybrid of Art Deco design, overlaid with Beaux Arts regularity, symmetry and monumentality. It is a highly recognizable look, which instantly places a building in the decade prior to World War II.
Construction was finally completed in 1942, and was dedicated on June 13th while celebrating General MacArthur Day. Since that day, City Hall has served as the seat of government for the City of Glendale. The building also hosted visits by famous celebrities, world leaders, and government officials throughout its life. As the City grew, the building underwent several remodels including one in 1955. Yet, while the building was updated with the times, the beautiful and historic facade remains much the same from its dedication day in 1942.
The construction of the Municipal Services Building in 1966 and Parcher Plaza in 1983 led to the development of the Civic Center campus we know today. Both of these additions reflect the changes Glendale has faced over its long history - From a hidden valley away from the bustle of Los Angeles, to a newly incorporated city, and now as an expanding center for arts, technology, and leisure.
Throughout it all, the Glendale City Hall has remained a steadfast reminder of Glendale’s long history and bright future.
Comprehensive Annual Financial ReportFiscal Year Ended June 30, 2019
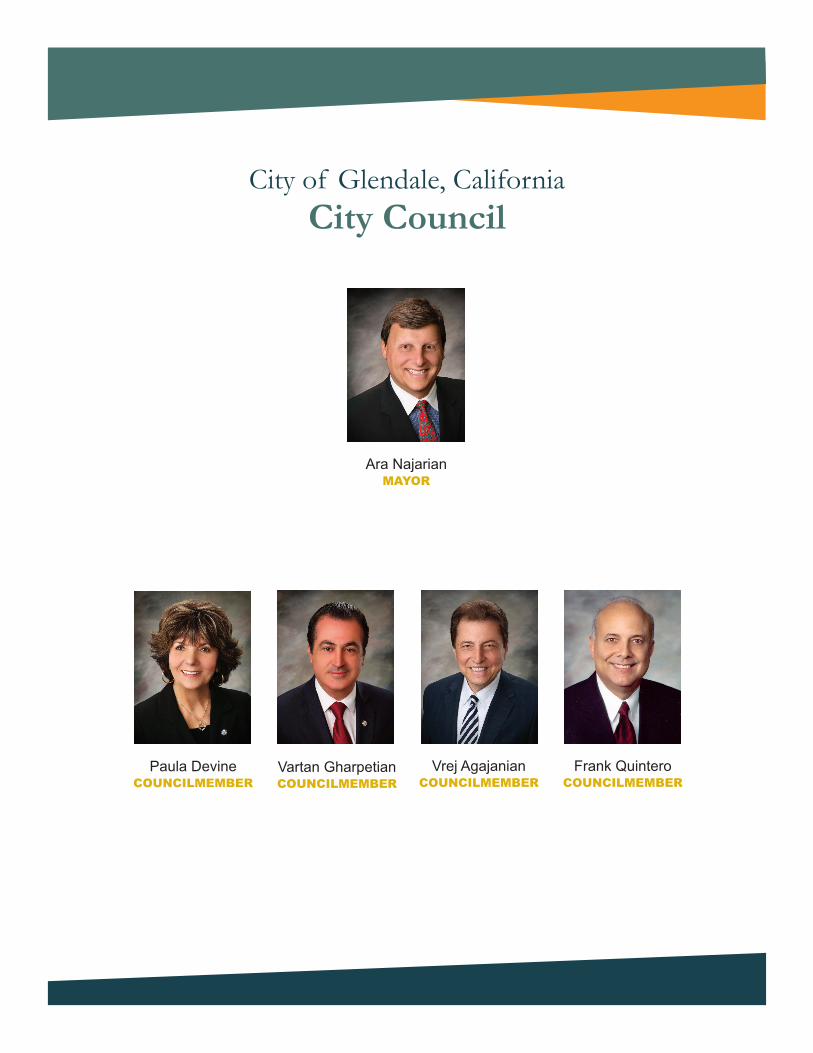
Vrej AgajanianCOUNCILMEMBER
Paula DevineCOUNCILMEMBER
Frank QuinteroCOUNCILMEMBER
Vartan GharpetianCOUNCILMEMBER
Ara NajarianMAYOR
City of Glendale, CaliforniaCity Council
City of Glendale, California
Comprehensive AnnualFinancial Report
Fiscal Year Ended June 30, 2019
Prepared by the Finance Department - Accounting Section
Michele Flynn, CPA, CIA, CGAP, Director of Finance

City of Glendale, California
Table of Contents Exhibit Page
INTRODUCTORY SECTION (Not Covered by Independent Auditor’s Report) Letter of Transmittal .......................................................................... i Officials of the City of Glendale ........................................................ xi Organizational Chart of the City of Glendale .................................... xii Certificate of Achievement for Excellence in Financial Reporting ... xiii
FINANCIAL SECTION Independent Auditor’s Report ........................................................... 1 Management’s Discussion and Analysis .......................................... 5 Basic Financial Statements: Government-wide Financial Statements: Statement of Net Position .................................................... Exhibit A-1 23 Statement of Activities ......................................................... Exhibit A-2 25 Fund Financial Statements: Balance Sheet – Governmental Funds ............................... Exhibit B-1 26
Reconciliation of Balance Sheet to the Statement of Net Position ....................................................................... Exhibit B-2 28 Statement of Revenues, Expenditures, and Changes in Fund Balances – Governmental Funds ....................... Exhibit C-1 29 Reconciliation of the Statement of Revenues, Expenditures, and Changes in Fund Balances to the Statement of Activities ............................................. Exhibit C-2 30 Statement of Revenues, Expenditures, and Changes in Fund Balances – Budget and Actual – General Fund ................................................................ Exhibit D-1 31 Statement of Revenues, Expenditures, and Changes in Fund Balances – Budget and Actual – Housing Assistance Fund ............................................. Exhibit D-2 32 Statement of Net Position – Proprietary Funds .................. Exhibit E-1 33 Statement of Revenues, Expenses, and Changes in Net Position – Proprietary Funds ................................. Exhibit E-2 35 Statement of Cash Flows – Proprietary Funds ................... Exhibit E-3 36 Statement of Fiduciary Net Position ..................................... Exhibit F-1 38 Statement of Changes in Fiduciary Net Position ................ Exhibit F-2 39
Notes to the Basic Financial Statements .................................... 41
Required Supplementary Information ............................................... 100

Exhibit Page Combining and Individual Fund Statements: Combining Governmental Balance Sheet – Nonmajor Governmental Funds ................................................ Exhibit G-1 105 Combining Statement of Revenues, Expenditures, and Changes in Fund Balances – Nonmajor Governmental Funds ................................................. Exhibit G-2 106 Combining Balance Sheet – Nonmajor Special Revenue Funds ............................................. Exhibit H-1 109 Combining Statement of Revenues, Expenditures, and Changes in Fund Balances – Nonmajor Special Revenue Funds ............................................. Exhibit H-2 119 Schedule of Revenues, Expenditures, and Changes in Fund Balances – Budget and Actual – Nonmajor Special Revenue Funds ............................................. Exhibit H-3 129 Combining Balance Sheet – Nonmajor Debt Service Funds .................................................. Exhibit I-1 149 Combining Statement of Revenues, Expenditures, and Changes in Fund Balances – Nonmajor Debt Service Funds ................................................... Exhibit I-2 150 Schedule of Revenues, Expenditures, and Changes in Fund Balances – Budget and Actual – Nonmajor Debt Services Funds .................................................. Exhibit I-3 151 Combining Balance Sheet – Nonmajor Capital Projects Funds ............................................... Exhibit J-1 155 Combining Statement of Revenues, Expenditures, and Changes in Fund Balances – Nonmajor Capital Projects Funds ............................................... Exhibit J-2 157 Combining Statement of Net Position – Nonmajor Enterprise Funds ........................................................ Exhibit K-1 161 Combining Statement of Revenues, Expenditures, and Changes in Net Position – Nonmajor Enterprise Funds ........................................................ Exhibit K-2 162 Statement of Cash Flows – Nonmajor Enterprise Funds ........................................................ Exhibit K-3 163 Combining Statement of Net Position – Internal Service Funds ................................................................ Exhibit L-1 167 Combining Statement of Revenues, Expenditures and Changes in Net Position – Internal Service Funds ................................................................ Exhibit L-2 171 Statement of Cash Flows – Internal Service Funds ................................................................ Exhibit L-3 175
Schedule Page
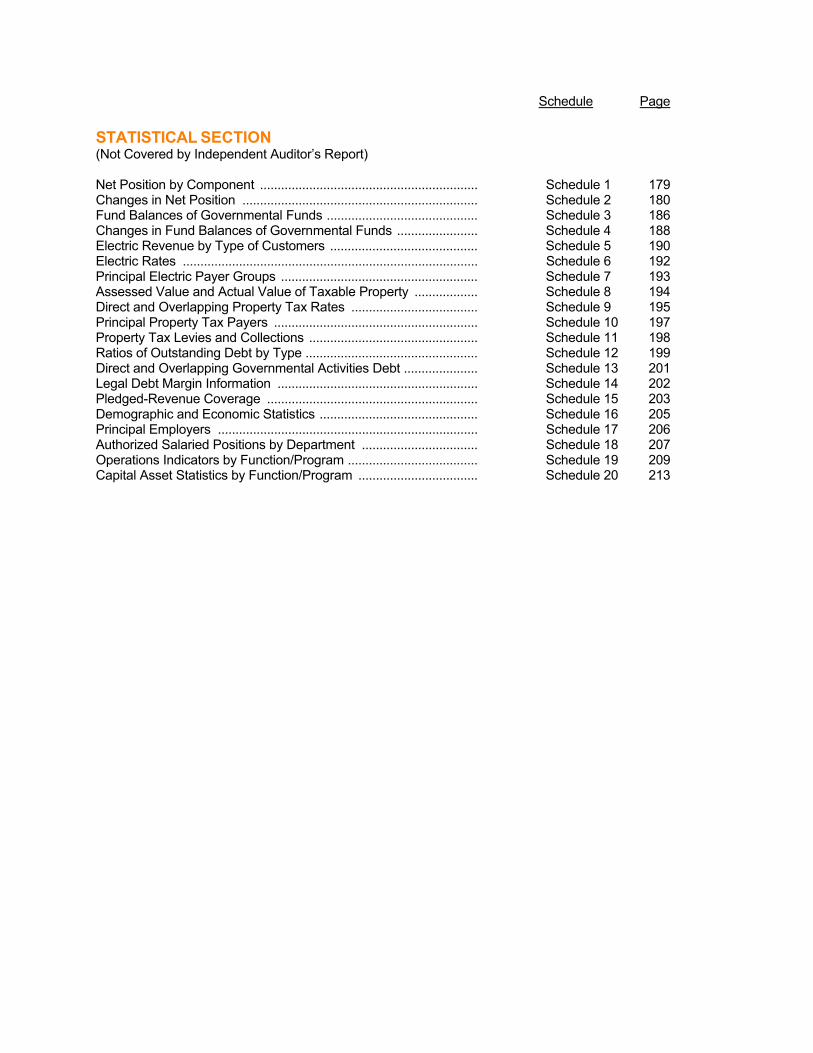
STATISTICAL SECTION (Not Covered by Independent Auditor’s Report) Net Position by Component .............................................................. Schedule 1 179 Changes in Net Position ................................................................... Schedule 2 180 Fund Balances of Governmental Funds ........................................... Schedule 3 186 Changes in Fund Balances of Governmental Funds ....................... Schedule 4 188 Electric Revenue by Type of Customers .......................................... Schedule 5 190 Electric Rates .................................................................................... Schedule 6 192 Principal Electric Payer Groups ........................................................ Schedule 7 193 Assessed Value and Actual Value of Taxable Property .................. Schedule 8 194 Direct and Overlapping Property Tax Rates .................................... Schedule 9 195 Principal Property Tax Payers .......................................................... Schedule 10 197 Property Tax Levies and Collections ................................................ Schedule 11 198 Ratios of Outstanding Debt by Type ................................................. Schedule 12 199 Direct and Overlapping Governmental Activities Debt ..................... Schedule 13 201 Legal Debt Margin Information ......................................................... Schedule 14 202 Pledged-Revenue Coverage ............................................................ Schedule 15 203 Demographic and Economic Statistics ............................................. Schedule 16 205 Principal Employers .......................................................................... Schedule 17 206 Authorized Salaried Positions by Department ................................. Schedule 18 207 Operations Indicators by Function/Program ..................................... Schedule 19 209 Capital Asset Statistics by Function/Program .................................. Schedule 20 213

Introductory Section
Introductory Section
The Introductory Section of the Comprehensive Annual Financial Report providesgeneral information of the City of Glendale, California’s structure and its personnel,as well as information useful in assessing the City’s financial condition. This sectionincludes the:
• Letter of Transmittal
• City’s Organizational Chart and List of Principal Officials
• Government Finance Officer Association Certificate of Achievement for Excellence in Financial Reporting
GLENDALE CITY HALLGLENDALE CITY HALL
THE JEWEL CITY
I N C O R P O R A T E D
1 9 0 6
CITY OF GLENDALE, CALIFORNIA Fin an ce
141 N . Glen dale Ave., Su it e 346
Glen dale, CA 91206-4975
Tel. (818) 548-2085
Fax (818) 956-3286
glen daleca.go v
i
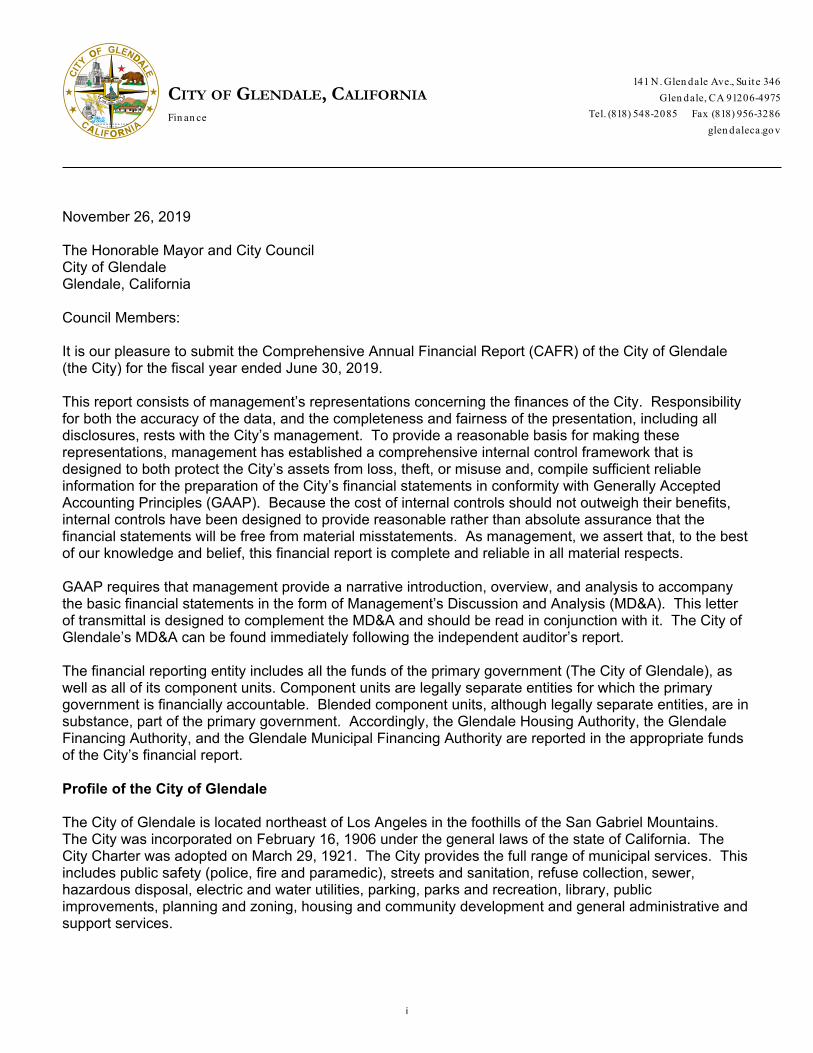
November 26, 2019 The Honorable Mayor and City Council City of Glendale Glendale, California Council Members: It is our pleasure to submit the Comprehensive Annual Financial Report (CAFR) of the City of Glendale (the City) for the fiscal year ended June 30, 2019. This report consists of management’s representations concerning the finances of the City. Responsibility for both the accuracy of the data, and the completeness and fairness of the presentation, including all disclosures, rests with the City’s management. To provide a reasonable basis for making these representations, management has established a comprehensive internal control framework that is designed to both protect the City’s assets from loss, theft, or misuse and, compile sufficient reliable information for the preparation of the City’s financial statements in conformity with Generally Accepted Accounting Principles (GAAP). Because the cost of internal controls should not outweigh their benefits, internal controls have been designed to provide reasonable rather than absolute assurance that the financial statements will be free from material misstatements. As management, we assert that, to the best of our knowledge and belief, this financial report is complete and reliable in all material respects. GAAP requires that management provide a narrative introduction, overview, and analysis to accompany the basic financial statements in the form of Management’s Discussion and Analysis (MD&A). This letter of transmittal is designed to complement the MD&A and should be read in conjunction with it. The City of Glendale’s MD&A can be found immediately following the independent auditor’s report. The financial reporting entity includes all the funds of the primary government (The City of Glendale), as well as all of its component units. Component units are legally separate entities for which the primary government is financially accountable. Blended component units, although legally separate entities, are in substance, part of the primary government. Accordingly, the Glendale Housing Authority, the Glendale Financing Authority, and the Glendale Municipal Financing Authority are reported in the appropriate funds of the City’s financial report. Profile of the City of Glendale The City of Glendale is located northeast of Los Angeles in the foothills of the San Gabriel Mountains. The City was incorporated on February 16, 1906 under the general laws of the state of California. The City Charter was adopted on March 29, 1921. The City provides the full range of municipal services. This includes public safety (police, fire and paramedic), streets and sanitation, refuse collection, sewer, hazardous disposal, electric and water utilities, parking, parks and recreation, library, public improvements, planning and zoning, housing and community development and general administrative and support services.
ii
Noted for its high quality of life and fiscal stability, Glendale is the fourth largest city in Los Angeles County, encompassing 30.6 square miles and serving over 206,000 residents. The City operates under a council-manager form of government, with a five-member council elected at large to four-year overlapping terms, in addition to an elected City Clerk and City Treasurer. The mayor is elected by the City Council for a one-year term and is the presiding officer of the Council. The City Council is responsible for passing ordinances, adopting the budget, appointing various boards and commissions, and hiring the City Manager and City Attorney. The City Manager is responsible for carrying out the policies and ordinances of the Council, for overseeing the day-to-day operations of the City, and for appointing the heads of the various departments. Factors Affecting the Glendale Economy The information presented in the financial statements is perhaps best understood when it is considered from the broader perspective of the specific environment within which the City of Glendale operates. The Local Economy – Continued capital investment is seen throughout the City in the form of business expansion as well as business attraction to Glendale’s central location, public safety record, and robust business environment. Of particular note is the entertainment industry, which remains rooted in Southern California, with the Verdugo Region (Glendale/Burbank) particularly known for production (pre & post), animation, visual effects, and digital distribution. Glendale continues to benefit from growth in this sector through companies co-locating with powerhouses Disney and DreamWorks, and hundreds of ancillary production and equipment firms. The implementation of the Glendale Tech Strategy continues to strengthen local tech firms such as Service Titan, Legal Zoom, and Beyond Limits. It was announced this year that Service Titan would be opening a second location in Glendale, occupying the former Nestle space. Also of note are Glendale’s regional shopping centers, the Glendale Galleria, Americana at Brand and Brand Boulevard of Cars. Several large development projects either recently completed or underway in Glendale will provide approximately 3,500 new residential units and thousands of square feet of commercial development. Hotel development and tourism are also on the rise. The Hyatt Place, Hampton Inn, Tribute Hotel and Hotel Louise join top performing hotels like Embassy Suites and Hilton. Such investments by the business community indicate continued confidence in Glendale. Hotels are supported by strong corporate presence and the three local hospitals. Overall, Glendale’s economy is one of the most diverse within the Los Angeles region largely due to a healthy mix of business and industry that operates within its borders. Economic Development Highlights – The City focuses on collaborative strategies to create jobs, generate revenue, support entrepreneurs, and improve the quality of life for residents, the business community, and visitors of Glendale. Throughout the years, the City has encouraged economic development through proactive efforts to target and attract businesses; reduce Class A office vacancies; provide support to existing businesses through concierge services; support workforce development program that is operated by the Verdugo Jobs Center; promote City-wide branding and marketing efforts; and adopt strategic planning methods. Economic Development accomplishments for FY 2018-19 were focused around three main goals:
1. Asset Management: Glendale actively employs ways to provide additional value of City assets through proactive, profitability-focused management practices. The priority was to achieve the highest and best use of City facilities through an effective asset management strategy. Accomplishments include: Successfully commenced the Armenian American Museum and Cultural Center negotiations
and Central Park Block redesign.

iii
Advanced the imagination of the Arts & Entertainment District by approving a contract with urban design firm Studio111 and completing the first phase of the project. This included a successful stakeholder outreach campaign and selection of a one-way design concept.
Entered into an Exclusive Negotiating Agreement with Avalon Investment Group for the
rehabilitation of the historic Rockhaven Sanitarium.
2. Business Attraction: The City is committed to attracting business and investment to Glendale in an effort to create a diverse economy. This is done through Business Concierge services and fast-track permitting, broker relationships, site selection assistance, utility consultation, and connecting potential businesses with resource marketing campaigns and support. The priorities were to establish an 18-Hour City and the furtherance of the Tech Strategic Plan. Accomplishments in business attraction include:
Further developed broker relationships through events, such as the Brokers Reception and attendance at conferences, such as the International Council of Shopping Centers.
Received $1 million grant from the State of California to implement the Glendale Tech Start-Up Accelerator.
Successfully hosted the fourth Glendale Tech Week in September 2019, attracting more than 5,000 people across 50 events. A $43,000 prize package was raised for a Pitchfest in an effort to support local entrepreneurs and $40,000 was raised in sponsorship.
Created more jobs and generated sales tax through public investment of the following: Service Titan, Laemmle Theatre and Lofts, and Hyatt Place.
Established a 1.9% retail vacancy rate, and continued to build on the 18-hour city concept by adding new businesses such as: Mr. Furley’s Bar, Crazy Rock’N Sushi, Panda Inn, Electric Pussycat Club, the Void, Dunkin’, Muragame Udon, Forward Medical, Five Below, Undefeated, Chess Park Tavern, and Studio Move Grill, with many more in the pipeline.
Lowered the Office Vacancy rate to 15.6% by successfully attracting tenants such as Children’s Hospital of Los Angeles, WeWork and Industrious.
3. Business Services: Recognizing that a majority of job growth in any community is generated by
the businesses already located there, Glendale focuses on services to businesses to propel economic growth. Harnessing the power of the thousands of businesses in the City and the nearly 100,000 employees, the City’s priority was to strengthen neighborhood districts and the businesses within them. Accomplishments related to this effort include:
Continued GRIT, the Glendale Relationship Initiation Team, to gauge satisfaction in doing business with the City, County, and the State. More than 100 businesses were visited. Survey results found that 64% of firms who will be expanding will stay in Glendale, and 61% of firms are aggressively hiring.
Assisted nearly 2,000 current and expanding businesses with resources to further drive business in the community.

iv
In collaboration with the Business Concierge team, the Economic Development Division assisted in the expansion of current tenants, including DISQO, Age of Learning, and Beyond Limits.
Supported neighborhood business districts, including assisting the Greater Downtown Glendale Association in its efforts to expand its service area to now include greater portions of Central Avenue and to extend to Stocker Avenue on Brand Boulevard.
Supported local businesses on Artsakh Avenue through the implementation of a Business
Impact Grant, allocated to businesses impacted by the street name change from Maryland to Artsakh Avenue. Twenty businesses took advantage of the no more than $2,000 per business reimbursement grant.
Supported the local manufacturers by establishing a 0.8% industrial vacancy rate through effective relationship-building efforts such as hosting the Hong Kong International Trade Manufacturers Conference.
Received a grant from METRO to host the City’s second CicLAvia event. Planning is underway now to host the event in June 2020.
Employment – According to the data obtained from the California State Department of Finance Demographic Research Unit, the population for the City of Glendale as of January 1, 2019 is 206,283. The Glendale labor force includes 103,200 residents as of May 2019 (16 years of age or over), according to the Employment Development Department Labor Market Information Division (EDD-LMID). Census data also shows that there are 29,153 businesses located in Glendale (2017). According to Census data, occupational employment data shows the following results based on 2013-2017 American Consumer Survey (ACS) Five-Year Estimates: 42,405 people in Glendale were employed in management, business, arts, or science occupations (the single largest group) with median annual earnings of $66,475; 24,289 were employed in sales and office occupations (second largest) with median annual earnings of $43,780; and 15,767 were employed in service occupations (the third largest group) with median annual earnings of $28,738. Median household income for Glendale residents recorded at $58,657, and the poverty rate was 15.6%, according to ACS. The information provided below includes additional employment statistics pertaining to the City of Glendale and the surrounding region.
Unemployment Levels – In December 2007, at the start of the Great Recession, the Glendale unemployment rate was 4.8%; by the (reported) end of the Recession in June 2010, the rate had peaked to 10.1% and declined to 8.1% in June 2013, demonstrating the recovery period following the Recession. The Glendale unemployment rate again measured 4.8% in June 2018, equaling its pre-recession level and as of June 2019, the unemployment rate recorded at 4.4%.
Industry Employment Status – According to Dunn & Bradstreet, by employment, the top six
Glendale industries in 2018 were:
1. Healthcare with 16,764 employed across 2,011 establishments, earning an average salary of $46,017 and recording a Location Quotient (LQ) for the industry of 1.29. An industry recording an LQ of 1.00 or more, demonstrates a local concentration of the industry located in the City of Glendale that is equal to or higher than the national average.

v
2. The Retail industry recorded 15,476 employed across 1,660 establishments, earning an average salary of $38,085 and an LQ of 1.38.
3. Public Administration and Education with 10,762 employees across 329 establishments, earning an average salary of $70,294 and an LQ of 0.64.
4. Professional Services recorded 8,401 employed across 1,827 establishments, with an
average salary of $105,480 and an LQ of 1.07.
5. Finance recorded 6,757 employed across 518 establishments, earning an average salary of $146,536 and an LQ of 2.14.
6. Eating and Drinking with 7,458 employed across 675 establishments, earning an average salary of $24,021 and an LQ of 1.01.
Large Employers – Walt Disney Imagineering, Time Warner, Glendale Adventist, and Allied
Universal were among the City’s largest employers in FY 2018-19.
Fastest Growing Occupations – Current EDD projections indicate that through 2024 the fastest growing occupations in Los Angeles County include:
1. Home Health Aides 2. Personal Care Aides 3. Physician Assistants 4. Statisticians 5. Nurse Practitioners 6. Software Developers Applications 7. Physical Therapists Assistants 8. Physical Therapists Aides 9. Occupational Therapist Assistants 10. Medical & Health Service Managers 11. Mathematicians 12. Physical Therapists 13. Respiratory Therapists 14. Athletic Trainers 15. Medical Assistants 16. Floor Layers, Except Carpet, Wood, and Hard Tiles 17. Refuse & Recyclable Material Collectors 18. Paving, Surfacing, and Tampering Equipment Operators

vi
Top 10 Industry Sectors
Industry Sector Base
Employment Estimate 2016
Numeric Change
2016-2026
Percent Change
2016-2026 Individual & Family Services 206,500 80,700 39.1%
Nonstore Retailers 14,100 5,300 37.6%
Social Assistance 237,600 82,100 34.6%
Warehousing & Storage 18,300 5,300 29.0%
Management, Scientific, & Technical Consulting Services
49,400 14,400 29.0%
General Merchandise Stores, including Warehouse Clubs and Centers
40,800 11,700 28.7%
Offices of Other Healthcare Practitioners 21,900 6,200 28.3%
Ambulatory Healthcare Services 210,300 53,400 25.4% Data Processing Hosting & Related Services
7,200 1,800 25.0%
Healthcare & Social Assistance 645,700 161,500 25.0% Trends – The EDD-LMID also reports that industry employment in Los Angeles County, which includes self-employment, private household workers, farm, and non-farm employment in Los Angeles County, is expected to reach 5,175,900 by 2026, an increase of 10.1% over the 10-year projections period. 12 of 13 non-farm industry sectors are projected to grow between 2016 and 2026.
Total non-farm employment is projected to grow by nearly 440,900 jobs by 2026, with Self-Employment increasing by 32,600 (11%) to a total 330,100 jobs and Private Household Workers increasing by 1,700 (13%) to a total of 14,500 jobs. Top 10 Industry Sectors are shown in the above table. Housing – Based on the “2018 Annual Report” issued by the Los Angeles Office of the Assessor, Glendale experienced a net taxable property value increase of 4.8%, which was less than the increase experienced countywide at 6.6%. According to the City’s property tax consultant, HdL, Glendale’s single-family housing market fell in sales volume (number of units sold) and showed an increase in an average home price of $1,007,802 in FY 2018-19, compared to $991,636 in FY 2017-18. The condominium sales also showed a decline in sales volume and an increase in an average price of $542,810 in FY 2018-19, compared to $513,976 in FY 2017-18.

vii
Local Government Finance The legal challenges to the long-standing and charter-mandated General Fund Transfer from Glendale Water & Power, escalating pension rates, and low investment returns for CalPERS have all combined to make these past few years some of the most difficult for City government budgeting in recent history. In spite of the difficulty involved in preparing the FY 2019-20 budget, the City Council has set the tone to allow managers and staff to approach challenges in a professional and constructive manner. The City’s focus clearly remains on developing a structurally balanced financial plan that best serves the needs of the City’s diverse community. Through the vision of the Glendale City Council, the City is able to balance new growth while preserving a rich and honored heritage. The City will continue to aggressively pursue exceptional customer service, balance value propositions, and invest in the future to ensure continuity of high-quality City services.
In November 2018, Glendale voters approved the Quality of Life and Essential Services Protection Measure (Measure S), which took effect on April 1, 2019, and added 0.75% to the sales tax rate in the City. This additional sales tax rate revenue is estimated to generate $30.0 million in FY 2019-20, of which $6.5 million will be received in the General Fund and $23.5 million in the Capital Improvement Fund to fund various new affordable housing developments and infrastructure needs. Positive indicators, such as increased spending and income, steady improvements in the housing market, and reduced rates of unemployment, align with the City’s forecasted revenue growth, which averages to 3.3% for FY 2019-20 across all General Fund revenues (excluding Measure S). Long-term growth rates for General Fund revenues are projected to grow by an average of 1.9% annually over the next five years.
$513,976 $542,810
$991,636 $1,007,802
2018 2019
Home/Condo Sales (in dollars)(Ending June 30)
Condos
Single Family
452385
832763
2018 2019
Home/Condo Sales (in units)(Ending June 30)
Condos
Single Family

viii
Although the City of Glendale continues to face challenges such as increased pension costs, a deficit in the Compensation Insurance Fund, and aging infrastructure, the City is confident that its team will embrace these challenges and move its community forward with a focus on its purpose and goals.
Long-term Financial Planning Financial Challenges – Despite the fact that the economy has been improving and the economic indicators are all trending positive, the City still faces notable challenges in the coming years. The General Fund remains highly dependent on sales taxes generated, in particular, from automobile sales. Revenues from auto sales have steadily risen over the past decade since the Great Recession; however, an economic downturn could place that revenue stream in jeopardy. In order to diversify the City’s potential revenue stream opportunities, staff and City Council have been and continue to be working diligently to attract new hotels that would generate considerable occupancy tax revenue for the City.
The possible loss of the voter-approved General Fund Transfer (GFT) from Glendale Water & Power’s electrical operations still looms. Currently at about $20.0 million per year, the transfer has been a feature of the City’s General Fund revenue stream since the 1940s. At the time it was established, the water and power utility was meant to help the City grow, as well as to bring revenue into the City’s General Fund. This inflow of funding helped City Councils through the years keep Glendale a low-tax city. Additionally, although the City Charter allows for a maximum transfer of up to 25% of gross operating revenues from the electrical operations, the GFT has never risen to that level; in fact, the current transfer is at approximately 10% of electrical retail operating revenues.
What does the potential loss of the GFT mean to our organization? For the time being, we will continue to move forward with the status quo. After having experienced deep cuts across all departments in recent years, this organization is currently running as lean as it ever has. The loss of the transfer would, without a doubt, mean cuts directly to the essential programs and services our community depends on daily. Hence, there would be no alternative but to make cuts that would drastically impact the quality of life for our community. Specifically, the City Council would be asked to consider cuts to Libraries, Parks, Fire, and Police Departments. The effects of these cuts would be experienced in the form of reduced hours at libraries and parks, the closing of libraries and parks, or the contracting out of Police and Fire services with the County of Los Angeles.
Moving forward, our continuing challenge is to minimize the negative impact on the community and customers from past restructuring efforts and ensure the City adds ongoing value to taxpayers. Glendale’s vision is accomplished through a combination of the City Council’s priorities, the City’s strategic goals, and key performance indicators. With the FY 2019-20 budget process, the City Council has reaffirmed the following priorities:
Fiscal Responsibility Exceptional Customer Service Economic Vibrancy Informed & Engaged Community Safe & Healthy Community
Balanced, Quality Housing Community Services & Facilities Infrastructure & Mobility Arts & Culture Sustainability

ix
Cash Management – To obtain flexibility in cash management, the City employs a pooled cash system. Under the City's pooling concept, all available cash is invested daily in various securities, while still maintaining reasonable liquidity to meet maturing obligations and maximizing return through the use of competitive rate comparisons from various investment sources. The City manages its pooled idle cash and investments under a formal investment policy that follows the guidelines of the State of California Government Code, which is then reviewed by the Investment Committee and adopted by the City Council. The following table presents a comparison of the City's cash and investments for previous four fiscal years.
Fiscal year ended June 30,
2019 2018 2017 2016
Cash and investments $ 923,902,000 815,777,000 765,797,000 682,529,000 Risk Management – The City is self-insured up to $2 million for claims filed under the comprehensive general liability and Workers’ Compensation insurance programs. The City purchases excess liability insurance policies for general liability claims to cover losses up to $25 million, and an amount up to statutory limits for the Workers’ Compensation program. The City also purchases Property/Casualty, Aviation, Employment Practices, Directors and Officers, Cyber Security, and other smaller insurance policies for specific activities. Insurance coverage and the associated premiums are reviewed annually to ensure the City is properly covered. The City’s Risk Management program is comprised of Insurance Services and Employee Safety. The primary goal of Insurance Services is to effectively address potential risk factors that affect both the City and its employees. The Safety Section works with City Departments to evaluate and mitigate workplace hazards, assist in providing safety training, conduct accident investigations, and ensure compliance with Cal/OSHA regulations. Risk Management staff, in conjunction with the Finance Department, annually reviews internal funding levels to address claims costs. Internal insurance costs are charged to each department and based on analysis of recent claims costs, as well as the outstanding reserves. Input from an actuarial study, performed annually, is considered in assessing the charges. Independent Audit The City’s financial statements have been audited by the firm of Eide Bailly LLP, a public accounting firm fully licensed and qualified to perform audits of local governments within the State of California. The goal of the independent audit was to provide an opinion on whether the financial statements of the City of Glendale, California for the fiscal year ended June 30, 2019, are free of material misstatement. The independent audit involved examining, on a test basis, evidence supporting the amounts and disclosures in the financial statements; assessing the accounting principles used and significant estimates made by management; and evaluating the overall financial statement presentation. The independent auditor concluded, based upon the audit, that there was a reasonable basis for rendering an unmodified opinion that the City of Glendale, California’s basic financial statements for the fiscal year ended June 30, 2019, are fairly presented in conformity with GAAP. The independent auditor’s report is presented as the first component of the financial section of this report. Their unmodified opinion on the City’s basic financial statements is included within this report.
x
The independent audit of the financial statements of the City was part of a broader, federally mandated “Single Audit” designed to meet the special needs of Federal grantor agencies. The standards governing Single Audit engagements require the independent auditor to report not only on the fair presentation of the financial statements, but also on the audited government’s internal controls and other financial reporting and compliance with legal requirements, and on compliance and internal control over compliance for each major federal program selected. These reports are available in the City’s separately issued Single Audit Report. Award The Government Finance Officers Association (GFOA) awarded a Certificate of Achievement for Excellence in Financial Reporting to the City for its comprehensive annual financial report for the past twenty four fiscal years ended June 30, 1995 through June 30, 2018. The Certificate of Achievement is a prestigious national award recognizing conformance with the highest standards for preparation of state and local government financial reports. In order to be awarded a Certificate of Achievement, a government unit must publish an easily readable and efficiently organized comprehensive annual financial report, whose contents conform to program standards. Such CAFR must satisfy both Generally Accepted Accounting Principles and applicable legal requirements. This award is valid for a period of one year. The City believes the current comprehensive annual financial report continues to meet the Certificate of Achievement for Excellence requirements and will be submitting it to GFOA to determine its eligibility for another certificate. Acknowledgments The preparation of this Comprehensive Annual Financial Report was made possible by the dedicated service of the entire staff of the Finance Department. Each member of the department has my sincere appreciation for their contribution in the preparation of this report. In closing, without the leadership and support of the Glendale City Council, City Manager, and the Assistant City Manager, the preparation of this report, as well as the favorable financial results of the past year, would not have been possible.
RESPECTFULLY SUBMITTED,
MICHELE FLYNN, CPA, CIA, CGAP DIRECTOR OF FINANCE

City of Glendale, California
Officials of the City of GlendaleJune 30, 2019
Administration and Executive Management Team
City Manager Yasmin K. Beers
Assistant City Manager Roubik Golanian
Deputy City Manager John Takhtalian
Director of Innovation, Performance, & Audit Elena Bolbolian
Chief Information Officer Jason Bradford
Director of Community Services & Parks Onnig Bulanikian
Director of Human Resources Matthew Doyle
Director of Public Works Yazdan Emrani
Director of Finance Michele Flynn, CPA, CIA, CGAP
City Attorney Michael J. Garcia
City Clerk Ardashes Kassakhian
Director of Community Development Philip Lanzafame
Fire Chief Silvio Lanzas
City Treasurer Rafi Manoukian, CPA
Police Chief Carl Povilaitis
Director of Library, Arts & Culture Gary Shaffer
General Manager of Glendale Water & Power Stephen Zurn
xi

Fire
Boards and Commissions
Community Services & Parks
Community Development
Administrative Services Finance
GlendaleWater & Power Human Resources Information
Services
Police Public WorksLibrary, Arts & Culture
City Manager
City Attorney
City ClerkCity CouncilCity Treasurer
Electorate
City of Glendale, California
Organizational Chart
Innovation, Performance
& Audit
xii

Certificate of Achievement forExcellence in Financial Reporting
The Government Finance OfficersAssociation of the United States andCanada (GFOA) awarded a Certificate ofAchievement for Excellence in FinancialReporting to the City of Glendale for itscomprehensive annual financial report forthe fiscal year ended June 30, 2018. Thiswas the 24th consecutive year that theCity of Glendale has achieved thisprestigious award. In order to beawarded a Certificate of Achievement, agovernment must publish an easilyreadable and efficiently organizedcomprehensive annual financial report.This report must satisfy both generallyaccepted accounting principles andapplicable legal requirements.
A Certificate of Achievement is valid fora period of one year only. We believethat our current comprehensive annualfinancial report continues to meet theCertificate of Achievement Program’srequirements and we are submitting it tothe GFOA to determine its eligibility foranother certificate.
xiii

This page is left blank intentionally.
xiv
Financial Section
Financial Section
The Financial Section of the Comprehensive Annual Financial Report contains the following:
• Independent Auditor's Report
• Required Supplementary Information-Management’s Discussion and Analysis (MD & A)
• City’s basic financial statement, which includes the following:- The Government-wide Financial Statements- Fund Financial Statements- Notes to the Basic Financial Statements

1
Independent Auditor’s Report
To the Honorable Mayor and Members of City Council of the City of Glendale, California
Report on the Financial Statements We have audited the accompanying financial statements of the governmental activities, the business-type activities, each major fund and the aggregate remaining fund information of the City of Glendale, California (City), as of and for the year ended June 30, 2019, and the related notes to the financial statements, which collectively comprise the City’s basic financial statements as listed in the table of contents.
Management’s Responsibility for the Financial Statements Management is responsible for the preparation and fair presentation of these financial statements in accordance with accounting principles generally accepted in the United States of America; this includes the design, implementation, and maintenance of internal control relevant to the preparation and fair presentation of financial statements that are free from material misstatement, whether due to fraud or error.
Auditor’s Responsibility Our responsibility is to express opinions on these financial statements based on our audit. We conducted our audit in accordance with auditing standards generally accepted in the United States of America and the standards applicable to financial audits contained in Government Auditing Standards, issued by the Comptroller General of the United States. Those standards require that we plan and perform the audit to obtain reasonable assurance about whether the financial statements are free from material misstatement.
An audit involves performing procedures to obtain audit evidence about the amounts and disclosures in the financial statements. The procedures selected depend on the auditor’s judgment, including the assessment of the risks of material misstatement of the financial statements, whether due to fraud or error. In making those risk assessments, the auditor considers internal control relevant to the entity’s preparation and fair presentation of the financial statements in order to design audit procedures that are appropriate in the circumstances, but not for the purpose of expressing an opinion on the effectiveness of the entity’s internal control. Accordingly, we express no such opinion. An audit also includes evaluating the appropriateness of accounting policies used and the reasonableness of significant accounting estimates made by management, as well as evaluating the overall presentation of the financial statements.
We believe that the audit evidence we have obtained is sufficient and appropriate to provide a basis for our audit opinions.
What inspires you, inspires us. | eidebailly.com10681 Foothill Blvd., Ste. 300 | Rancho Cucamonga, CA 91730-3831 | T 909.466.4410 | F 909.466.4431 | EOE

2
Opinions In our opinion, the financial statements referred to above present fairly, in all material respects, the respective financial position of the governmental activities, the business-type activities, each major fund, and the aggregate remaining fund information of the City, as of June 30, 2019, and the respective changes in financial position and, where applicable, cash flows thereof, and the respective budgetary comparison statements for the General Fund and the Housing Assistance Special Revenue Fund for the year then ended in accordance with accounting principles generally accepted in the United States of America.
Other Matters
Required Supplementary Information Accounting principles generally accepted in the United States of America require that the management’s discussion and analysis, the schedule of changes in net pension liability and related ratios, the schedule of pension plan contributions and the schedule of changes in total OPEB liability and related ratios, as listed in the table of contents, be presented to supplement the basic financial statements. Such information, although not a part of the basic financial statements, is required by the Governmental Accounting Standards Board, who considers it to be an essential part of financial reporting for placing the basic financial statements in an appropriate operational, economic, or historical context. We have applied certain limited procedures to the required supplementary information in accordance with auditing standards generally accepted in the United States of America, which consisted of inquiries of management about the methods of preparing the information and comparing the information for consistency with management’s responses to our inquiries, the basic financial statements, and other knowledge we obtained during our audit of the basic financial statements. We do not express an opinion or provide any assurance on the information because the limited procedures do not provide us with sufficient evidence to express an opinion or provide any assurance.
Other Information Our audit was conducted for the purpose of forming opinions on the financial statements that collectively comprise the City’s basic financial statements. The introductory section, combining and individual nonmajor fund financial statements and other schedules, and statistical section are presented for purposes of additional analysis and are not a required part of the basic financial statements. The combining and individual nonmajor fund financial statements and other schedules are the responsibility of management and were derived from and relate directly to the underlying accounting and other records used to prepare the basic financial statements. Such information has been subjected to the auditing procedures applied in the audit of the basic financial statements and certain additional procedures, including comparing and reconciling such information directly to the underlying accounting and other records used to prepare the basic financial statements or to the basic financial statements themselves, and other additional procedures in accordance with auditing standards generally accepted in the United States of America. In our opinion, the combining and individual nonmajor fund financial statements are fairly stated, in all material respects, in relation to the basic financial statements as a whole.
The introductory and statistical sections have not been subjected to the auditing procedures applied in the audit of the basic financial statements and, accordingly, we do not express an opinion or provide any assurance on them.
3
Other Reporting Required by Government Auditing Standards In accordance with Government Auditing Standards, we have also issued our report dated November 26, 2019, on our consideration of the City’s internal control over financial reporting and on our tests of its compliance with certain provisions of laws, regulations, contracts, and grant agreements and other matters. The purpose of that report is solely to describe the scope of our testing of internal control over financial reporting and compliance and the results of that testing, and not to provide an opinion on the effectiveness of the City’s internal control over financial reporting or on compliance. That report is an integral part of an audit performed in accordance with Government Auditing Standards in considering the City’s internal control over financial reporting and compliance.
Rancho Cucamonga, California November 26, 2019

This page is left blank intentionally.
4
CITY OF GLENDALE Management’s Discussion and Analysis June 30, 2019 (in thousands) As management of the City of Glendale (the City), we offer readers of the City’s financial statements this narrative overview and analysis of the financial activities of the City for the fiscal year ended June 30, 2019. We encourage readers to consider the information presented here in conjunction with additional information that we have furnished in our letter of transmittal, which can be found on pages i – x of this report. Financial Highlights
The assets and deferred outflows of resources of the City exceeded its liabilities and deferred inflows of resources at the close of FY 2018-19 by $1,654,226 (net position), which was comprised of net investment in capital assets of $1,319,231, restricted net position of $181,423 and unrestricted net position of $153,572. The unrestricted net position consisted of a negative $166,779 for governmental activities and $320,351 for business-type activities. The negative unrestricted net position for governmental activities was primarily due to the recognition of net pension liability.
The City’s total net position increased by $59,147. Most of this increase was attributable to an
increase in charges for services, investment income and one-time transfer of 2011 Tax Allocation Bond proceeds from Glendale Successor Agency to fund the City’s low and moderate income housing projects and capital improvement projects.
As of the close of FY 2018-19, the City’s governmental funds reported combined ending fund
balances of $394,711, an increase of $62,863 in comparison with the prior year. About 13.0% of this total amount, $51,185 was unassigned and available for spending at the government’s discretion.
At the end of FY 2018-19, City Charter Article XI Section 15 general reserve of $30,769, and
unassigned fund balance of $57,534 for the General Fund totaled $88,303, representing about 38.8% of the original FY 2018-19 budget of $227,784. The minimum General Fund reserve level is 25.0% of the annual operating budget, and the targeted General Fund reserve level is at 35.0% of the annual operating budget.
Overview of the Financial Statements This discussion and analysis are intended to serve as an introduction to the City’s basic financial statements. The City’s basic financial statements are comprised of three components: 1) government-wide financial statements, 2) fund financial statements, and 3) notes to the basic financial statements. This report also contains other supplementary information in addition to the basic financial statements. Government-wide financial statements. The government-wide financial statements are designed to provide readers with a broad overview of the City’s finances, in a manner similar to a private-sector business. The statement of net position presents information on all of the City’s assets and deferred outflows of resources, and liabilities and deferred inflows of resources, with the difference reported as net position. Over time, increases or decreases in net position may serve as a useful indicator of whether the financial position of the City is improving or deteriorating.
5

CITY OF GLENDALE Management’s Discussion and Analysis June 30, 2019 (in thousands) The statement of activities presents information showing how the government’s net position changed during the recent fiscal year. All changes in net position are reported as soon as the underlying event giving rise to the change occurs, regardless of the timing of related cash flows. Thus, revenues and expenses are reported in this statement for some items that will only result in cash flows in future fiscal periods (e.g., uncollected taxes and earned but unused vacation leave). Both of the government-wide financial statements distinguish functions of the City that are principally supported by taxes and intergovernmental revenues (governmental activities) from other functions that are intended to recover all or a significant portion of their costs through user fees and charges (business-type activities). The governmental activities of the City include general government, police, fire, public works, transportation, housing, health, and community development, employment programs, public service, parks, recreation, and community services, library, and interest and fiscal charges. The business-type activities of the City include fire communications, sewer, refuse disposal, electric, and water. The government-wide financial statements include not only the City itself (known as the primary government), but also a legally separate housing authority, financing authority, and municipal financing authority for which the City is financially accountable. The housing authority, the financing authority and the municipal financing authority, although legally separate, function for all practical purposes as departments of the City, and therefore have been included as an integral part of the primary government. The government-wide financial statements can be found on pages 23-25 of this report. Fund financial statements. A fund is a grouping of related accounts that is used to maintain control over resources that have been segregated for specific activities or objectives. The City, like other state and local governments, uses fund accounting to ensure and demonstrate compliance with finance-related legal requirements. All of the funds of the City can be divided into three categories: governmental funds, proprietary funds, and fiduciary funds. Governmental funds. Governmental funds are used to account for essentially the same functions reported as governmental activities in the government-wide financial statements. However, unlike the government-wide financial statement, governmental fund financial statements focus on near-term inflows and outflows of spendable resources, as well as on balances of spendable resources available at the end of the fiscal year. Such information may be useful in evaluating a government’s near-term financing requirements. Because the focus of governmental funds is narrower than that of the government-wide financial statements, it is useful to compare the information presented for governmental funds with similar information presented for governmental activities in the government-wide financial statements. By doing so, readers may better understand the long-term impact of the government’s near-term financing decisions. Both the governmental fund balance sheet and the governmental fund statement of revenues, expenditures, and changes in fund balances provide a reconciliation to facilitate this comparison between governmental funds and governmental activities. The City maintains 49 individual governmental funds. Information is presented separately in the governmental fund balance sheet and in the governmental fund statement of revenues, expenditures, and changes in fund balances for General Fund, Housing Assistance Fund and Capital Improvement Fund, all of which are reported as major funds. Data from the other 46 governmental funds are combined into a single, aggregated presentation. Individual fund data for each of these non-major governmental funds is provided in the form of combining statements elsewhere in this report.
6
CITY OF GLENDALE Management’s Discussion and Analysis June 30, 2019 (in thousands) Effective June 30, 2019, Recreation Fund, Special Events Fund and Filming Fund were closed, and the fund balances were transferred to the General Fund. The operations of these three funds will be recorded in the General Fund starting FY 2019-20. The City adopts an annual budget for its General Fund, special revenue and debt service fund types. Budgetary comparison information has been provided for the above fund types to demonstrate compliance with the budget. The basic governmental fund financial statements can be found on pages 26-32 of this report. Proprietary funds. The City maintains two different types of proprietary funds. Enterprise funds are used to report the same functions presented as business-type activities in the government-wide financial statements. The City uses enterprise funds to account for its refuse disposal, fire communications, sewer, and electric and water utility operations. Internal service funds are an accounting device used to accumulate and allocate costs internally among the City’s various functions. The City uses internal service funds to account for its fleet of vehicles, information services and infrastructure, joint helicopter operation, building maintenance, uninsurable litigation, employee benefits, and various other insurances. Proprietary funds provide the same type of information as the government-wide financial statements, only in more detail. The proprietary fund financial statements provide separate information for the sewer, electric, and water operations, all of which are considered to be major funds of the City. Conversely, all internal service funds are combined into a single, aggregated presentation in the proprietary fund financial statements. Individual fund data for the non-major enterprise and internal service funds is provided in the form of combining statements elsewhere in this report. The basic proprietary fund financial statements can be found on pages 33-37 of this report. Fiduciary funds. A fiduciary fund is used to account for resources held for the benefit of parties outside the City. The City maintains one fiduciary fund – Glendale Successor Agency Trust Fund, a Private-Purpose Trust Fund. Since the resources of fiduciary fund are not available to support the City’s own programs, it is not reflected in the government-wide financial statements. The accounting used for fiduciary funds is much like that used for proprietary funds. The basic fiduciary fund financial statement can be found on pages 38-39 of this report. Notes to the basic financial statements. The notes provide additional information that is essential to a full understanding of the data provided in the government-wide and fund financial statements. The notes to the financial statements can be found on pages 41-99 of this report. The combining statements referred to earlier in connection with nonmajor governmental and enterprise funds and internal service funds are presented immediately following the required supplementary information, which can be found on pages 100-104 of this report. Combining and individual fund statements can be found on pages 105-178 of this report.
7

CITY OF GLENDALE Management’s Discussion and Analysis June 30, 2019 (in thousands) Government-wide Financial Analysis The government-wide financial analysis contains comparative information from the prior year. As noted earlier, net position may serve over time as a useful indicator of a government’s financial position. In the case of the City, assets and deferred outflows of resources exceeded liabilities and deferred inflows of resources by $1,654,226 at the close of the most recent fiscal year. By far the largest portion of the City’s net position (79.7%) reflected its net investment in capital assets (e.g., infrastructure, land, buildings, machinery, and equipment) less any related debt used to acquire those assets that was still outstanding. The City uses these capital assets to provide services to citizens; consequently, these assets are not available for future spending. Although the City’s net investment in its capital assets is reported as net of related debt, it should be noted that the resources needed to repay this debt must be provided from other sources, since the capital assets themselves cannot be used to liquidate these liabilities.
City of Glendale’s Net Position
As of June 30,
Governmental activities
Business-type
activities
Total 2019 2018 2019 2018 2019 2018
Current and other assets $ 605,136 532,548
449,505 413,756
1,054,641 946,304 Capital assets 962,440 958,831 619,941 641,740 1,582,381 1,600,571 Total assets 1,567,576 1,491,379 1,069,446 1,055,496 2,637,022 2,546,875 Deferred outflows of resources 84,238 114,414 22,788 32,598 107,026 147,012
Total assets and deferred outflows of resources 1,651,814 1,605,793
1,092,234 1,088,094
2,744,048 2,693,887
Current liabilities 63,405 55,156
44,607 40,060
108,012 95,216 Noncurrent liabilities 629,078 628,775 331,704 348,370 960,782 977,145 Total liabilities 692,483 683,931 376,311 388,430 1,068,794 1,072,361 Deferred inflows of resources 18,168 21,956 2,860 4,491 21,028 26,447
Total liabilities and deferred inflows of resources 710,651 705,887
379,171 392,921
1,089,822 1,098,808
Net investment in capital assets 932,188 926,357
387,043 401,010
1,319,231 1,327,367 Restricted 175,754 168,556 5,669 5,669 181,423 174,225 Unrestricted (166,779) (195,007) 320,351 288,494 153,572 93,487
Total net position $ 941,163 899,906
713,063 695,173
1,654,226 1,595,079
As noted earlier, 11.0% of the City’s net position represents resources that are subject to external restrictions on how they may be used. The remaining balance of unrestricted net position of $153,572 may be used to meet the government’s ongoing obligations to citizens and creditors. Of this total, $320,351 is in business-type activities such as electric, water, and sewer utilities.
8

CITY OF GLENDALE Management’s Discussion and Analysis June 30, 2019 (in thousands) Governmental activities. Governmental activities increased the City’s net position by $41,257. Key elements of this increase are as follows:
Compared to prior fiscal year, property tax revenue increased by $3,878 (6.6%), primarily due to the growth in home values and the strong real estate market in the City.
Sales tax revenue decreased by $3,466 (5.6%) compared to prior fiscal year. The decrease is mainly driven by a $9,000 one-time adjustment in FY 2017-18 from California Department of Tax and Fee Administration (CDTFA). CDTFA conducted a sales tax audit; as a result, the City closed a liability account and recognized the revenues in the General Fund in FY 2017-18. On the other hand, the City received the 1st quarter (April to June 2019) Measure S sales tax revenue in the amount of $5,184, when Glendale’s total sales tax rate increased from 9.5% to 10.25%, effective April 1, 2019.
Investment income increased by $12,811 (705.8%) compared to prior fiscal year. The increase is mainly driven by the increase in the fair market value of investments.
Transfer increased by $9,527 (44.7%) during the current fiscal year. The City received one-time transfer of 2011 Tax Allocation Bond proceeds from Glendale Successor Agency to fund the City’s low and moderate income housing projects and capital improvement projects.
Governmental activities expense increased by $17,582 (5.4%) during the current fiscal year. The increase is mainly due to the following items: $3,309 for salaries from cost of living adjustments and vacancies being filled; $1,533 for compensation insurance from higher rates for police and fire sworn employees; $5,243 for PERS from higher required employer contribution; $1,409 for additional Scholl Canyon landfill post closure liability; $1,094 for Parking Fund from parking enforcement services contractual contract. In FY 2018-19, various sections of Housing, Health and Community Development were reclassified from General Government to Housing, Health and Community Development to better align with the appropriate function.
9

CITY OF GLENDALE Management’s Discussion and Analysis June 30, 2019 (in thousands) Expenses and Program Revenues – Governmental Activities
Revenues, Transfers, Special items, and Other increases by Source – Governmental Activities
$0
$10,000
$20,000
$30,000
$40,000
$50,000
$60,000
$70,000
$80,000
$90,000
Generalgovernment
Police Fire Publicworks
Transportation Housing,health &
communitydevelopment
Employmentprograms
Publicservice
Parks,recreation &community
services
Library Interest &fiscal
charges
Expenses Program Revenues
Charges for services20.42%
Operating grants & contributions
15.19%
Utility users tax6.91%
Other3.84%
Other taxes5.85%
Investment income3.79%
Reinstatement of loan0.10%
Capital grants & contributions
4.53%
Transfers5.23%
Sales taxes15.22%
Property taxes16.16%
Special item2.76%
10

CITY OF GLENDALE Management’s Discussion and Analysis June 30, 2019 (in thousands)
City of Glendale’s Change in Net Position For the Fiscal Year Ended June 30,
Governmental
activities
Business-type
activities
Total 2019 2018 2019 2018 2019 2018
Revenues: Program revenues:
Charges for services $ 78,735 73,492 312,318 309,820 391,053 383,312 Operating grants and contributions 58,580 55,448 200 72 58,780 55,520 Capital grants and contributions 17,458 9,447 8 12 17,466 9,459
General revenues: Taxes:
Property taxes 62,323 58,445 - - 62,323 58,445 Sales taxes 58,692 62,158 - - 58,692 62,158 Utility users tax 26,655 27,805 - - 26,655 27,805 Other taxes 22,563 21,784 - - 22,563 21,784
Investment income 14,626 1,815 16,040 1,315 30,666 3,130 Other 14,831 15,748 8,778 9,693 23,609 25,441 Reinstatement of loans 323 328 - - 323 328
Total revenues 354,786 326,470
337,344 320,912
692,130 647,382 Expenses:
General government 24,272 33,037 - - 24,272 33,037 Police 92,931 92,679 - - 92,931 92,679 Fire 65,484 67,285 - - 65,484 67,285 Public works 40,720 30,072 - - 40,720 30,072 Transportation 15,863 13,196 - - 15,863 13,196 Housing, health and community development 57,379 44,349
- -
57,379 44,349
Employment program 7,550 5,848 - - 7,550 5,848 Public service 6,190 5,999 - - 6,190 5,999 Parks, recreation and community
services 20,204 19,697
- -
20,204 19,697 Library 12,650 12,485 - - 12,650 12,485 Interest and fiscal charges 1,125 2,139 - - 1,125 2,139 Fire communications - - 4,286 4,126 4,286 4,126 Sewer - - 21,448 20,383 21,448 20,383 Refuse disposal - - 21,566 20,844 21,566 20,844 Electric - - 202,232 188,573 202,232 188,573 Water - - 49,750 48,458 49,750 48,458 Total expenses 344,368 326,786 299,282 282,384 643,650 609,170
Excess before transfers and special item 10,418 (316)
38,062 38,528
48,480 38,212
Transfers 20,172 21,312 (20,172) (21,312) - - Special items from Successor Agency: Transfer of bond proceeds 10,667 -
- -
10,667 -
Transfer of capital assets - 2,744 - - - 2,744 Change in net position 41,257 23,740 17,890 17,216 59,147 40,956
Net position – Beginning of the year 899,906 876,166
695,173 677,957
1,595,079 1,554,123
Net position – End of the year $ 941,163 899,906
713,063 695,173
1,654,226 1,595,079
11

CITY OF GLENDALE Management’s Discussion and Analysis June 30, 2019 (in thousands) Business-type activities. Business-type activities net position increased by $17,890. Key elements of this increase are as follows:
Charges for services increased by $2,498 (0.8%) during the current fiscal year. The increase is mainly attributable to higher Sewer rates. Cost of Service Analysis (COSA) for Sewer rates was approved in April 2018 and the new rates took effect in July 2018.
Investment income increased by $14,725 (1,119.8%) during the current fiscal year as a result of an increase in the fair market value of investments.
Business-type activities expense increased by $16,898 (6.0%). The increase is mainly due to the
following items: $10,431 due to higher purchased power expenses as a result of higher cost of energy and natural gas; $1,405 for PERS from higher required employer contribution.
Expenses and Program Revenues – Business-type Activities
$0
$25,000
$50,000
$75,000
$100,000
$125,000
$150,000
$175,000
$200,000
$225,000
Firecommunications
Sewer Refuse disposal Electric Water
Expenses Program Revenues
12

CITY OF GLENDALE Management’s Discussion and Analysis June 30, 2019 (in thousands) Revenues by Source – Business-type Activities
Financial Analysis of the Government’s Funds As noted earlier, the City uses fund accounting to ensure and demonstrate compliance with finance-related legal requirements. Governmental funds. The focus of the City’s governmental funds is to provide information on near-term inflows, outflows, and balances of spending resources. Such information is useful in assessing the City’s financing requirements. In particular, unassigned fund balance may serve as a useful measure of a government’s net resources available for spending at the end of the fiscal year. As of the end of the current fiscal year, the City’s governmental funds reported combined ending fund balances of $394,711, an increase of $62,863 in comparison with the prior year. About 13% of this total amount, $51,185, constituted unassigned fund balance, which was available for spending at the government’s discretion. The remainder of fund balance in the amount of $343,526 was not available for new spending because it was either nonspendable, restricted, committed or assigned. Nonspendable fund balance was $3,049. Restricted fund balance was $235,364, which was constrained by external creditors, grantors, laws or regulations of other governments and enabling legislation. Committed fund balance was $97,861, and the assigned fund balance was $7,252. The General Fund is the chief operating fund of the City. At the end of the current fiscal year, unassigned fund balance and the City Charter Article XI Section 15 general reserve of the General Fund were $57,534 and $30,769 respectively, while total fund balance was $125,274. As a measure of the General Fund’s liquidity, it may be useful to compare the total of City Charter Section Article XI 15 general reserve and unassigned fund balance to total fund expenditures. City Charter Article XI Section 15 general reserve and unassigned fund balance, totaling $88,303, represented about 38.7% of FY 2018-19 General Fund expenditures plus transfers, $228,436.
Charges for services92.58%
Operating grants & contributions
0.06%Capital grants & contributions
0.01%
Investment income4.75%
Other2.60%
13
CITY OF GLENDALE Management’s Discussion and Analysis June 30, 2019 (in thousands) The fund balance of the City’s General Fund had a net increase of $18,204 during the current fiscal year. This net increase is primarily due to the following reasons: Compared to the prior fiscal year, property tax revenue increased by $3,878, primarily due to the
growth in home values and strong real estate market in the City.
Compared to the prior fiscal year, interfund revenue increased by $2,038, due to higher cost allocation rates for receiving departments.
Compared to the prior fiscal year, sales tax revenue decreased by $4,401. The decrease is mainly driven by a $9,000 one-time adjustment in FY 2017-18 from California Department of Tax and Fee Administration (CDTFA). CDTFA conducted a sales tax audit; as a result, the City closed a liability account and recognized the revenues in the General Fund in FY 2017-18. On the other hand, the City received the 1st quarter (April to June 2019) Measure S sales tax revenue in the amount of $5,184, when Glendale’s total sales tax rate increased from 9.5% to 10.25%, effective April 1, 2019
Compared to the prior fiscal year, other taxes revenue increased by $1,189, primarily due to higher transient occupancy tax ($545) and property transfer tax ($207), both of which are driven in part by economic factors.
It’s worthwhile to mention the City’s General Fund expenses had a net increase of $9,644 as well, which is mainly driven by increases in workers’ compensation rates and the required PERS employer contribution.
The Housing Assistance Fund (Section 8 grant) had a fund balance of $6,213, an increase of $659 during the current fiscal year. The main reason was that the City spent less administrative expenditures than the earned administrative revenue due to efficient and effective administrative operations. The Capital Improvement Fund had a fund balance of $27,896. During the current fiscal year, the fund balance increased by $3,979, primarily due to a one-time transfer from the General Fund to the Capital Improvement Fund. The transfer was to fund for new and existing projects that would be carried over from the Recreation Fund and the Filming Fund into the Capital Improvement Fund, because the Recreation Fund and the Filming Fund are closed to the General Fund as of June 30, 2019. Proprietary funds. The City’s proprietary funds provide the same type of information found in the government-wide financial statements, but in more detail. At the end of the year, net position was composed of $209,001 for the Sewer Fund, $336,158 for the Electric Fund, $126,969 for the Water Fund, and $41,176 for the nonmajor enterprise funds. The net position of the Sewer Fund increased by $4,328 during the current fiscal year. The increase was mainly attributable to new higher wastewater rates effective in July 2018, which were approved after conducting a Cost of Service Analysis (COSA) and rate study. The operating expenses are generally on par with the prior fiscal year level. The net position of the Electric Fund increased by $4,371 during the current fiscal year. The increase in net position was mainly attributable to the net increase in the electric sales and fair market value of investments. On the other hand, there was an increase in the production expense due to higher cost of energy and natural gas.
14

CITY OF GLENDALE Management’s Discussion and Analysis June 30, 2019 (in thousands) The net position of the Water Fund increased by $1,694 during the current fiscal year. The increase in net position was due to relatively stable water retail sales which were mainly on par compared to prior fiscal year. The operating expenses slightly increased compared to the prior fiscal year level due to increase in transmission, distribution and customer services activities. The net position of nonmajor enterprise funds increased by $2,088 during the current fiscal year. The increase was mainly attributable to the recognition of the unclaimed Refuse Disposal Fund deposits and the increase in the fair market value of investments. The operating expenses were on par with the prior year level as a result of stable operations of Refuse Disposal Fund in providing residents refuse collection and disposal services, as well as Fire Communication Fund in providing residents of its member cities an emergency coordinated assistance services. General Fund Budgetary Highlights In comparison to the FY 2018-19 final General Fund revenue budget, the actual revenue and transfers in has a net increase of $20,122. The increase is mostly coming from several one-time or special items that were not included in the FY 2018-19 final revenue budget: $5,184 of Measure S sales tax, $1,821 of interest received on the Section 115 trust, $1,455 and $3,875 of transfers for closing out the Filming Fund and the Recreation Fund to the General Fund. Excluding these items, the remaining net variance is $7,787. The major revenue categories that ended the fiscal year higher than the budgeted estimate were sales tax (excluding Measure S: $3,433), use of money and property (excluding Section 115 Trust interest: $3,107), charges for services ($1,857), licenses and permits ($1,043), and property tax ($785). The additional sales tax receipts are partly due to higher than anticipated sales in the last two quarters of the fiscal year, while the higher use of money and property category is primarily due to an unanticipated GASB 31 interest gain ($2,663). In contrast to these increases, two revenue categories ended the fiscal year lower than the budgeted estimate: utility users tax ($1,800) and interfund revenue ($134). The decrease in utility users tax is primarily due to the following factors: (1) telecommunication customers continue to shift from conventional contracts to prepaid wireless services; (2) electric consumption is lower due to cooler weather and conservation; and (3) water consumption is lower as a result of local precipitation exceeding the average precipitation by nearly 100%. In FY 2018-19, the final expense and transfers out budget increased by $11,814 in comparison to the original expense budget. The increase is largely driven by the following items: $4,878 for budget carryovers, $4,307 of the General Fund transfer to the Capital Improvement Fund to provide funding for current and future Recreation Fund and Filming Fund projects, $804 for firefighter recruit academy, $485 for special elections, $359 for the Glendale Fire Fighter Association memorandum of understanding adjustments, $163 for Fire department’s purchase of defibrillators, $175 for Renter’s Rights Program, and $150 for Urgency Rent Control outreach. Compared to the FY 2018-19 final General Fund expense budget, the actual expenditures and transfers out were underspent by $11,162. The variance is mainly due to salaries and benefits savings in the amount of $7,311 as a result of vacancies. Although many vacant positions have been eliminated in the General Fund in previous years, vacancies still exist across almost every department as a result of employee turnover. In addition to this, there were savings in contractual services throughout various departments in the amount of $4,253, and in the capital outlay category in the amount of $412 due to purchases that were not completed by the end of the fiscal year. In the transfers category however, the
15
CITY OF GLENDALE Management’s Discussion and Analysis June 30, 2019 (in thousands) actual General Fund transfer to the Capital Improvement Fund was $1,113 higher than anticipated largely for the transfer of the Recreation Fund and Filming Fund balances that were shifted into the General Fund at the end of the fiscal year. Capital Asset and Debt Administration Capital assets. The City’s investment in capital assets for its governmental and business-type activities, as of June 30, 2019, is $1,582,381 (net of $935,184 accumulated depreciation, $12,039 accumulated gas depletion and $52,678 accumulated amortization). This investment in capital assets includes land, natural gas reserve, buildings and improvements, machinery and equipment, infrastructure, intangible assets, and construction in progress. The total decrease in the City’s investment in capital assets for the current fiscal year was 0.6%, and this represents a 0.6% increase for governmental activities and a 3.5% decrease for business-type activities. Major capital asset events during the current fiscal year included the following:
In FY 2018-19, the Fleet/Equipment Management Fund added $4,962 of mobile equipment to its inventory: $788 for fire equipment, $542 for motorcycles, $1,097 for SUVs and $1,294 for trucks.
The ISD Wireless Fund purchased $1,756 of equipment that would enhance City’s regional interoperable communication system. This equipment was funded by Homeland Security grants.
City purchased Glendale Successor Agency’s land and building property, which is located at 117-131 Artsakh Avenue, in the amount of $1,530.
The following capital improvement projects contributing to the capital assets increased in
government wide: $2,215 for Pennsylvania Avenue and Kenneth Road Rehabilitation, $1,129 for Street Reconstruction and Resurfacing Program, $800 for Jail Security System Upgrade and Fire Department Building Upgrade.
The following projects contributed to the increase in the intangible assets in the Sewer Fund: $1,360 for Los Angeles-Glendale Water Reclamation Plant and $3,769 for Hyperion Wastewater System. The City is upgrading the Los Angeles –Glendale Water Reclamation Plant and Hyperion Wastewater Treatment Plant and Conveyance System Facilities to meet federal and state mandates.
The increase in the Electric Fund capital assets is mostly driven by capital improvement projects, such as $337 Perkins Building Renovation, $664 Grayson Power Plant, $578 Feeder Tropico and $826 Electric Vault and Cable Replacements.
16

CITY OF GLENDALE Management’s Discussion and Analysis June 30, 2019 (in thousands)
City of Glendale’s Capital Assets
Governmental
Activities
Business-type
Activities
Total 2019 2018 2019 2018 2019 2018
Land $ 422,904 421,820 9,557 9,557 432,461 431,377 Natural gas reserve - - 22,161 22,150 22,161 22,150 Buildings and improvements 419,110 413,513 278,290 276,064 697,400 689,577 Machinery and equipment 132,839 127,426 586,228 583,019 719,067 710,445 Infrastructure 327,433 325,498 158,445 156,433 485,878 481,931 Construction in progress 44,342 36,617 64,258 60,827 108,600 97,444 Intangible assets 6,979 1,001 109,736 105,661 116,715 106,662
Total capital assets 1,353,607 1,325,875 1,228,675 1,213,711 2,582,282 2,539,586 Less: Accumulated depreciation (390,759) (367,014) (544,425) (511,450) (935,184) (878,464) Less: Accumulated gas depletion - -
(12,039) (11,025)
(12,039) (11,025)
Less: Accumulated amortization (408) (30) (52,270) (49,496) (52,678) (49,526) Net of depreciation, depletion and amortization $ 962,440 958,831
619,941 641,740
1,582,381 1,600,571
Additional information on the City’s capital assets can be found in Note 6 on pages 62-63. Long-term debt. The City's total debt decreased by $10,502 (3.8%) in FY 2018-19. The decrease was mainly due to the regular annual debt retirements.
City of Glendale’s Long-Term Debt
Governmental
Activities
Business-type
Activities
Total
2019 2018 2019 2018 2019 2018
Certificates of Participation (COPs) $ - 31,880 - - - 31,880
Other debt:
2011 HUD Section 108 Loan 696 908 - - 696 908 Loans payable - 594 - - - 594
Total other debt 696 1,502 - - 696 1,502
Bonds payable:
GMFA lease revenue bonds, 2019 refunding 30,252 - - - 30,252 - Electric revenue bonds, 2013 refunding - - 20,227 21,403 20,227 21,403 Electric revenue bonds, 2013 series - - 58,688 60,020 58,688 60,020 Electric revenue bonds, 2016 refunding - - 81,509 85,127 81,509 85,127 Water revenue bonds, 2008 series - - 42,170 43,655 42,170 43,655 Water revenue bonds, 2012 series - - 34,639 35,096 34,639 35,096
Total bonds payable 30,252 - 237,233 245,301 267,485 245,301
Total debt $ 30,948 33,382
237,233 245,301
268,181 278,683 The COPs were refunded on June 25, 2019 with Glendale Municipal Financing Authority 2019 Lease Revenue Refunding Bonds. See Note 7 for more information.
17
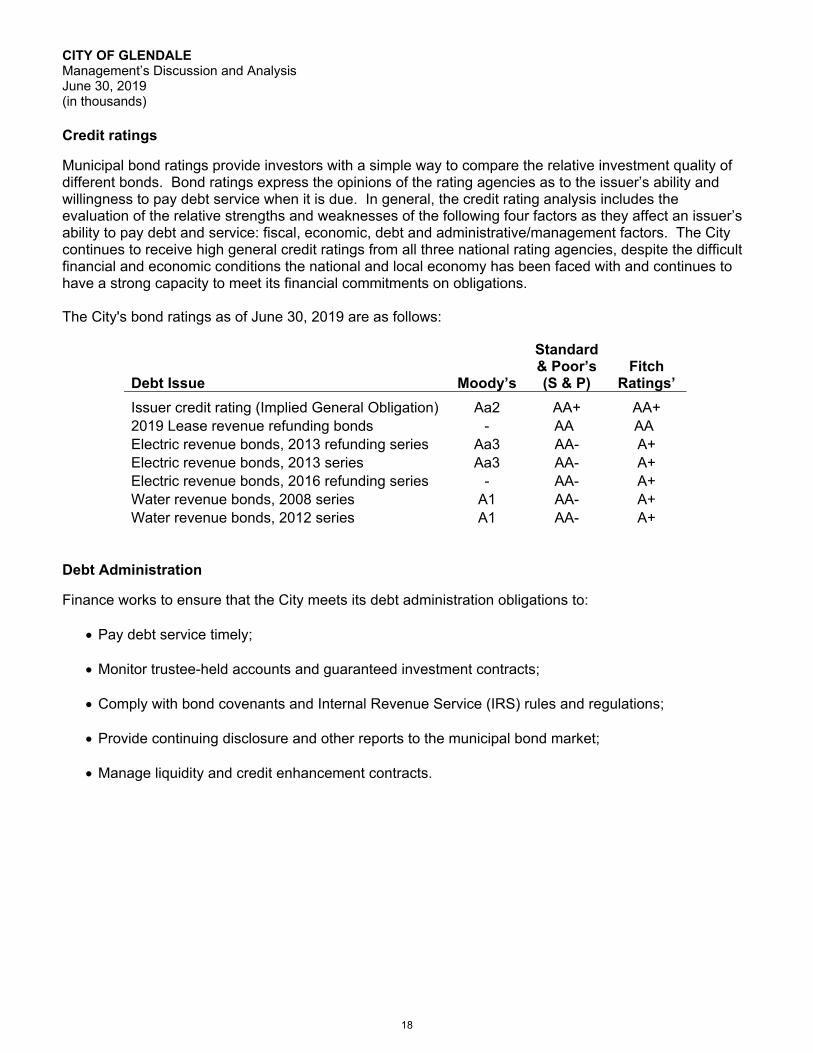
CITY OF GLENDALE Management’s Discussion and Analysis June 30, 2019 (in thousands) Credit ratings
Municipal bond ratings provide investors with a simple way to compare the relative investment quality of different bonds. Bond ratings express the opinions of the rating agencies as to the issuer’s ability and willingness to pay debt service when it is due. In general, the credit rating analysis includes the evaluation of the relative strengths and weaknesses of the following four factors as they affect an issuer’s ability to pay debt and service: fiscal, economic, debt and administrative/management factors. The City continues to receive high general credit ratings from all three national rating agencies, despite the difficult financial and economic conditions the national and local economy has been faced with and continues to have a strong capacity to meet its financial commitments on obligations. The City's bond ratings as of June 30, 2019 are as follows:
Debt Issue Moody’s
Standard & Poor’s (S & P)
Fitch Ratings’
Issuer credit rating (Implied General Obligation) Aa2 AA+ AA+ 2019 Lease revenue refunding bonds - AA AA Electric revenue bonds, 2013 refunding series Aa3 AA- A+ Electric revenue bonds, 2013 series Aa3 AA- A+ Electric revenue bonds, 2016 refunding series - AA- A+ Water revenue bonds, 2008 series A1 AA- A+ Water revenue bonds, 2012 series A1 AA- A+
Debt Administration
Finance works to ensure that the City meets its debt administration obligations to:
Pay debt service timely; Monitor trustee-held accounts and guaranteed investment contracts; Comply with bond covenants and Internal Revenue Service (IRS) rules and regulations; Provide continuing disclosure and other reports to the municipal bond market;
Manage liquidity and credit enhancement contracts.
18

CITY OF GLENDALE Management’s Discussion and Analysis June 30, 2019 (in thousands) Continuing Disclosure On November 10, 1994, the Securities and Exchange Commission (“SEC”) adopted amendments to existing federal regulations (“Rule 15c-12” or the “Rule”) under which municipalities issuing securities on or after July 3, 1995 are required to:
Prepare official statements meeting current requirements of the Rule;
Annually file certain financial information and operating data with national and state repositories;
Prepare announcements of the significant events enumerated in the Rule.
As of June 30, 2019, the City had 6 series of bonds subject to Continuing Disclosure requirements. The City prepares the Continuing Disclosure (financial and operating information) for its 5 Electric and Water series bonds, and engaged a financial advisor, Harrell & Company Advisors, LLC to prepare the Continuing Disclosure for the GMFA bonds. The City also engaged Harrell & Company Advisors, LLC as dissemination agent to post all 6 series of bonds’ Continuing Disclosure Annual Reports and the City financial statements on the MSRB’s Electronic Municipal Market Access (“EMMA”) website. The dissemination agent will also prepare any notices of material events and post such notices on EMMA. Timely and accurate communication with the municipal marketplace is vital in retaining the City’s creditworthiness and market access. Continuing Disclosure and compliance reporting constitute a significant part of Debt Management’s compliance activity for the life of each series of bonds. Additional information on the City’s long-term debt can be found in Note 7 on pages 64-69 of this report. Economic Factors and Next Year’s Budget and Rates Even with the economy being more cautious this year than previous years, the outlook for the upcoming years is promising. Within this past year, the City experienced the longest Federal government shutdown in U.S. history. The result of the shutdown created a significant loss, upwards of approximately $11,000,000 nationwide. However, even with these events, the U.S. economy is expected to remain on a fairly steady growth with continued job advancement and low unemployment rates. Consumer spending is expected to stay on an upward trail for FY 2019-20.
Even with the challenges that are raised by the uncertainty of federal policy, the proliferation of debt, and political gridlock, economists project that personal consumption will increase to 2.7% and that the Gross Domestic Product (GDP) will grow by 2.2% this year, which is considerably lower than the 2.8% increase in GDP in 2018. With this, economists predict an increase of almost 3,000 additional jobs by the next couple of years, thus decreasing the unemployment rate from 3.9% in 2018 to 3.5% in 2019.
California remains the largest economy when compared to any other state in the U.S. and it is forecasted to grow an additional 3.0% during 2019, which is faster than the nation’s projected growth of 2.2%. However, even with the stable growth in GDP, California’s economy has slowed down from 2014 and 2015, when the growth rate was close to 4.0%. Over the duration of 2018, almost all major industry sectors in California have increased in number of jobs. Industries at the forefront of private sector job growth are utilities, education, healthcare, hospitality, and construction. In consideration to these assumptions, California’s unemployment rate is expected to continue its gradual decline from 3.7% in 2018 to 3.4% in 2019. With continued improvements in the labor market, personal income should increase by 2.9% with persistent growth forecasted for 2020.
19

CITY OF GLENDALE Management’s Discussion and Analysis June 30, 2019 (in thousands) More locally, Los Angeles County is expected to experience further improvements to its unemployment rate, dropping from 4.6% in 2018 to 4.4% in 2019. It is forecasted that all industry sectors will be adding jobs over the upcoming two years. A likely shift will occur in the private sector from the manufacturing and logistic industries being the strongest to the healthcare, administrative, and retail trade being the forerunners. With this, total personal income across the County is expected to increase by 2.6% in 2019, a large increase from 1.4% in 2018. As for the housing market, the median home price in Los Angeles County has experienced an increase of 4.3% in 2018 and is forecasted to see an additional increase of 2.8% in 2019.
Given all that, the demand for affordable housing remains a top priority in California. There has been a large increase in the number of renters compared to homeowners, which can be attributed to the continued escalation of housing costs. This is making way for the continued demand of new construction to accommodate the need for affordable housing units. What is important to remember is that there is no simple solution to this issue and that it is more complicated than a single solution capable of satisfying everyone. In other words, there is more to consider than just rent. A variety of forces have played a role in this statewide crisis, and it will take a variety of forces to alleviate it. In Glendale, this growth can be witnessed first-hand. The state budget has allocated approximately $1,300,000 for grants and loans to help with funding new housing developments.
The City’s FY 2019-20 Budget incorporates the policy direction of the City Council for services and programs to address the needs of the community, which is structurally balanced with projected resources available to support all projected expenditures. The total budget for FY 2019-20 is $938,340 and includes all City funds, departments and programs. The General Fund’s total budget, including Measure S funds, is $243,300, from which the City pays for services commonly associated with local government: police and fire services, libraries, parks, public works, economic development, and administration. The FY 2019-20 adopted General Fund budget, not inclusive of Measure S funding, reflects an increase of $9,200 when compared to FY 2018-19. When including Measure S funding, the increase is $15,500 compared to FY 2018-19.
From the increase of $15,500, $6,300, is Council approved appropriations for various Measure S programs that include, $4,200 for the Monthly Housing Rental Subsidy Program, $750 for the First Time Home Buyer Program, $560 for the Aquatics Program Expansion, $458 for the Holiday Ice Rink and $410 for the Rental Rights Program. The remaining $9,200 increase is explained below.
The increase in the Salaries and Benefits category includes approximately $3,000 due to the Recreation Fund moving from Special Revenue Fund to the General Fund, $1,100 due to the Filming Funds moving from Special Revenue Fund to the General Fund, $6,200 increase in PERS costs (net of employee cost sharing), and various cost of living adjustments, salary step progressions, and position reallocations of employees. CalPERS sustained significant investment losses during the Great Recession, the impacts of which continue to reverberate through just about every government agency in the State. Hence, Glendale is not alone in seeing higher employer costs from CalPERS due to the City’s obligation to pick up the partial tab for those investment losses and CalPERS’s subsequent decrease in their estimated rate of returns on their investments. Due to the recent adoption of more conservative actuarial and investment policies by the CalPERS Board, the City has been advised by its outside actuary to continue expecting increases in annual costs going forward. These risk mitigation policies will eventually rebuild the CalPERS fund and lower the burden on local governments that have committed to provide reasonable retirements for their employees.
With rising PERS costs, the City Council took a proactive step to address the matter by voting to establish a Section 115 Pension Rate Stabilization Trust at the time of the FY 2017-18 budget adoption, and
20

CITY OF GLENDALE Management’s Discussion and Analysis June 30, 2019 (in thousands) approved a funding deposit in July 2017. Glendale joined a group of more than 80 public agencies across the State to adopt this rate-stabilization strategy. Since the establishment of the Trust, the City Council has authorized the deposit of $26,500 of one-time surplus revenues. This decision demonstrates the City Council’s commitment to keep rising PERS costs at a containable level. City staff is actively assessing other strategies to address the trend in rising PERS costs and will work to implement more solutions in the coming years.
For FY 2019-20, the adopted budget for the Special Revenue Funds reflects a decrease of $1,800 when compared to the FY 2018-19 adopted budget. The most notable of the decreases is due to three Special Revenue Funds that were recategorized into the General Fund: Filming Fund, Recreation Fund, and Special Events Fund. The total net decrease of these three funds is approximately $6,000. There is also a decrease of $4,500 in the Measure R Regional Return Fund due to less project appropriations relative to last fiscal year. However, the decrease is offset by increases in various funds, such as an increase of $4,200 in the Parking Fund due to an increase in contractual services and capital projects, a $1,300 increase in the Housing Assistance Fund due to an increase in anticipated revenue to be received, and an appropriation of $1,200 for the new Measure W Fund that was established to account for the storm water maintenance and management program.
As for the City’s Capital Improvement Fund, there is an increase of $11,400 compared to FY 2018-19 primarily due to the $23,500 in appropriations for the Capital Improvement Fund in FY 2019-20 because of additional Measure S funding. The majority of the appropriation ($20,000) was approved by Council for new Affordable Housing developments, and the remainder ($3,500) was approved for infrastructure needs for seismic upgrades. At the same time, the increase is offset by a decrease of $11,700 in the Capital Improvement Fund due to fewer appropriations for regular projects relative to last fiscal year. Some of the major and necessary projects that are in store for the City of Glendale include an electrical upgrade for the Montrose Parking Lot, resurfacing the Dunsmore Park parking lot, placing artificial turf at the Sports Complex Field 3, the pavement rehabilitation project for La Crescenta Avenue, and the Street Tree Maintenance Program.
For the Internal Service Funds, there is a net decrease of $5,900 compared to FY 2018-19. This is mainly attributable to a $2,300 decrease in the ISD Infrastructure Fund and a $2,400 decrease in the ISD Applications Fund, due to a decrease in capital outlay, contractual services, and hourly wages. There is also a decrease of $1,700 in the Fleet/Equipment Management Fund due to a decrease in capital outlay. The decrease is offset by an increase in the Joint Helicopter Operation Fund due to the purchase of a helicopter. The cost reflects half of the helicopter purchase, as the remaining cost will be paid for by the City of Burbank. There was also an increase of $634 in excess insurance premium and cost allocation charges in the Compensation Insurance Fund.
Requests for Information This financial report is designed to provide a general overview of the City’s finances for all those with an interest in the government’s finances. Questions concerning any of the information provided in this report or requests for additional financial information should be addressed to Director of Finance, 141 North Glendale Avenue, Suite 346, Glendale, CA 91206.
21

This page is left blank intentionally.
22

Exhibit A-1CITY OF GLENDALEStatement of Net Position June 30, 2019(amounts expressed in thousands)
Governmental Activities
Business-type Activities Total
ASSETSCurrent assets:
Pooled cash and investments $ 466,085 $ 239,958 $ 706,043 Cash and investments with fiscal agent - 8,896 8,896 Investment-gas/electric commodity - 1,365 1,365 Interest receivable 2,541 1,883 4,424 Accounts receivable, net 43,612 36,609 80,221 Loans receivable - 25 25 Internal balances 241 (241) - Inventories 373 6,875 7,248 Prepaid items 5,099 13,066 18,165
Total current assets 517,951 308,436 826,387 Noncurrent assets:
Capital assets, not being depreciated 467,246 73,815 541,061 Capital assets, net 495,194 546,126 1,041,320 Designated cash and investments - 135,400 135,400 Restricted cash and investments 66,529 5,669 72,198 Loans receivable 20,656 - 20,656
Total noncurrent assets 1,049,625 761,010 1,810,635 Total assets 1,567,576 1,069,446 2,637,022
DEFERRED OUTFLOWS OF RESOURCESDeferred outflows related to pensions 83,762 18,453 102,215 Loss on refunding - 4,335 4,335 Deferred outflows related to OPEB 476 - 476
Total deferred outflows of resources 84,238 22,788 107,026 Total assets and deferred outflows of resources 1,651,814 1,092,234 2,744,048
LIABILITIESCurrent liabilities:
Accounts payable 21,020 23,650 44,670 Accrued wages and withholding 12,240 3,693 15,933 Interest payable 7 4,227 4,234 Claims payable 16,485 - 16,485Compensated absences 3,333 - 3,333Bonds payable 2,314 8,368 10,682Other debt 222 - 222Unearned revenues 564 - 564 Deposits 7,220 4,669 11,889
Total current liabilities $ 63,405 $ 44,607 $ 108,012
Primary Government
See accompanying notes to basic financial statements(Continued)
23

Exhibit A-1CITY OF GLENDALEStatement of Net Position June 30, 2019(amounts expressed in thousands)
Governmental Activities
Business-type Activities Total
Primary Government
Noncurrent liabilities:Claims payable $ 41,863 $ - $ 41,863 OPEB liability 15,214 - 15,214Compensated absences 27,096 - 27,096Landfill postclosure 51,574 - 51,574Net pension liability 464,919 102,839 567,758Bonds payable 27,938 228,865 256,803Other debt 474 - 474
Total noncurrent liabilities 629,078 331,704 960,782 Total liabilities 692,483 376,311 1,068,794
DEFERRED INFLOWS OF RESOURCESDeferred inflows related to pensions 16,219 2,860 19,079 Deferred inflows related to OPEB 1,949 - 1,949
Total deferred inflows of resources 18,168 2,860 21,028 Total liabilites and deferred inflows of resources 710,651 379,171 1,089,822
NET POSITIONNet investment in capital assets 932,188 387,043 1,319,231 Restricted for:
Air quality improvement 635 - 635 Cable access 4,044 - 4,044Capital projects 45,773 - 45,773City Charter - Article XI Sec. 15 general reserve 30,769 - 30,769Electric public benefit AB1890 5,903 - 5,903Federal and state grants 8,547 - 8,547Landscaping district 239 - 239 Low and moderate housing 30,515 - 30,515Public safety 3,600 - 3,600SCAQMD emission controls - 5,669 5,669State gas tax mandates 8,473 - 8,473Transportation 37,223 - 37,223Youth employment 33 - 33
Unrestricted (166,779) 320,351 153,572
Total net position $ 941,163 $ 713,063 $ 1,654,226
See accompanying notes to basic financial statements
24
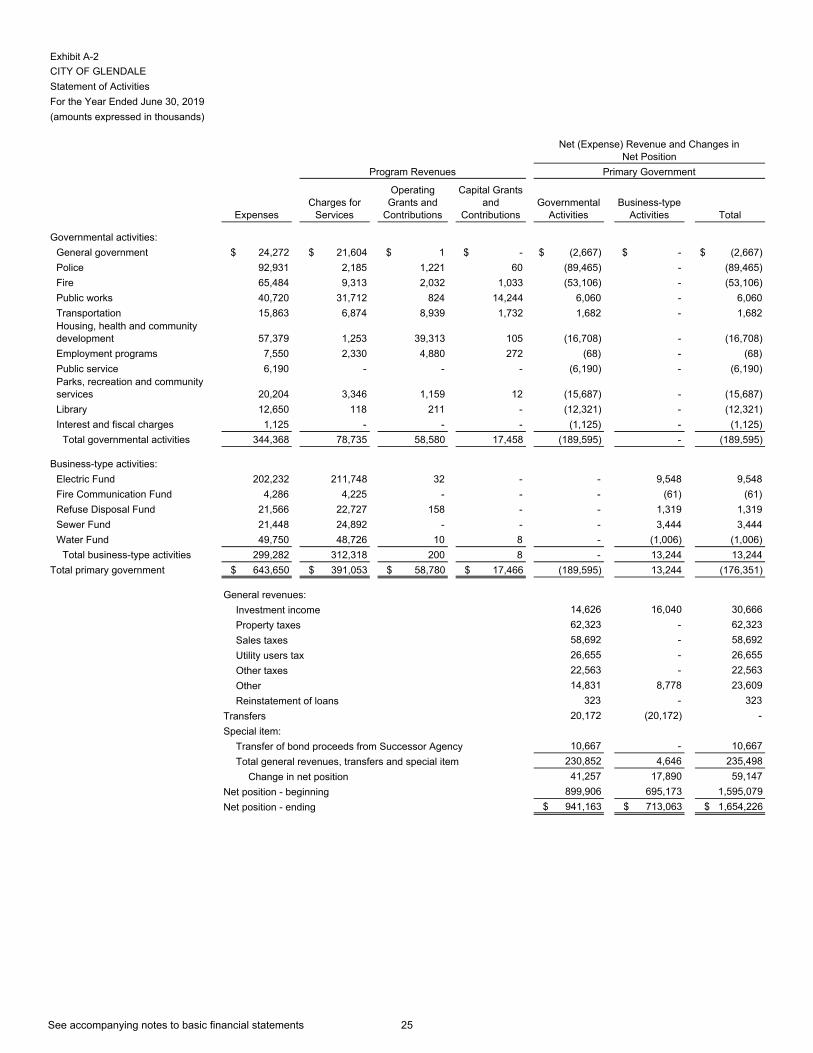
Exhibit A-2
CITY OF GLENDALE
Statement of Activities
For the Year Ended June 30, 2019
(amounts expressed in thousands)
ExpensesCharges for
Services
Operating Grants and
Contributions
Capital Grants and
ContributionsGovernmental
ActivitiesBusiness-type
Activities Total
Governmental activities:
General government $ 24,272 $ 21,604 $ 1 $ - $ (2,667) $ - $ (2,667)
Police 92,931 2,185 1,221 60 (89,465) - (89,465)
Fire 65,484 9,313 2,032 1,033 (53,106) - (53,106)
Public works 40,720 31,712 824 14,244 6,060 - 6,060
Transportation 15,863 6,874 8,939 1,732 1,682 - 1,682Housing, health and community development 57,379 1,253 39,313 105 (16,708) - (16,708)
Employment programs 7,550 2,330 4,880 272 (68) - (68)
Public service 6,190 - - - (6,190) - (6,190)Parks, recreation and community services 20,204 3,346 1,159 12 (15,687) - (15,687)
Library 12,650 118 211 - (12,321) - (12,321)
Interest and fiscal charges 1,125 - - - (1,125) - (1,125)
Total governmental activities 344,368 78,735 58,580 17,458 (189,595) - (189,595)
Business-type activities:
Electric Fund 202,232 211,748 32 - - 9,548 9,548
Fire Communication Fund 4,286 4,225 - - - (61) (61)
Refuse Disposal Fund 21,566 22,727 158 - - 1,319 1,319
Sewer Fund 21,448 24,892 - - - 3,444 3,444
Water Fund 49,750 48,726 10 8 - (1,006) (1,006)
Total business-type activities 299,282 312,318 200 8 - 13,244 13,244
Total primary government $ 643,650 $ 391,053 $ 58,780 $ 17,466 (189,595) 13,244 (176,351)
14,626 16,040 30,666
62,323 - 62,323
58,692 - 58,692
26,655 - 26,655
22,563 - 22,563
14,831 8,778 23,609
323 - 323
20,172 (20,172) -
10,667 - 10,667
230,852 4,646 235,498
41,257 17,890 59,147
899,906 695,173 1,595,079
$ 941,163 $ 713,063 $ 1,654,226
Net position - beginning
Net position - ending
Reinstatement of loans
Transfers
Transfer of bond proceeds from Successor Agency
Total general revenues, transfers and special item
Change in net position
Special item:
Property taxes
Sales taxes
Utility users tax
Other taxes
Other
Net (Expense) Revenue and Changes in Net Position
Program Revenues Primary Government
General revenues:
Investment income
See accompanying notes to basic financial statements
25
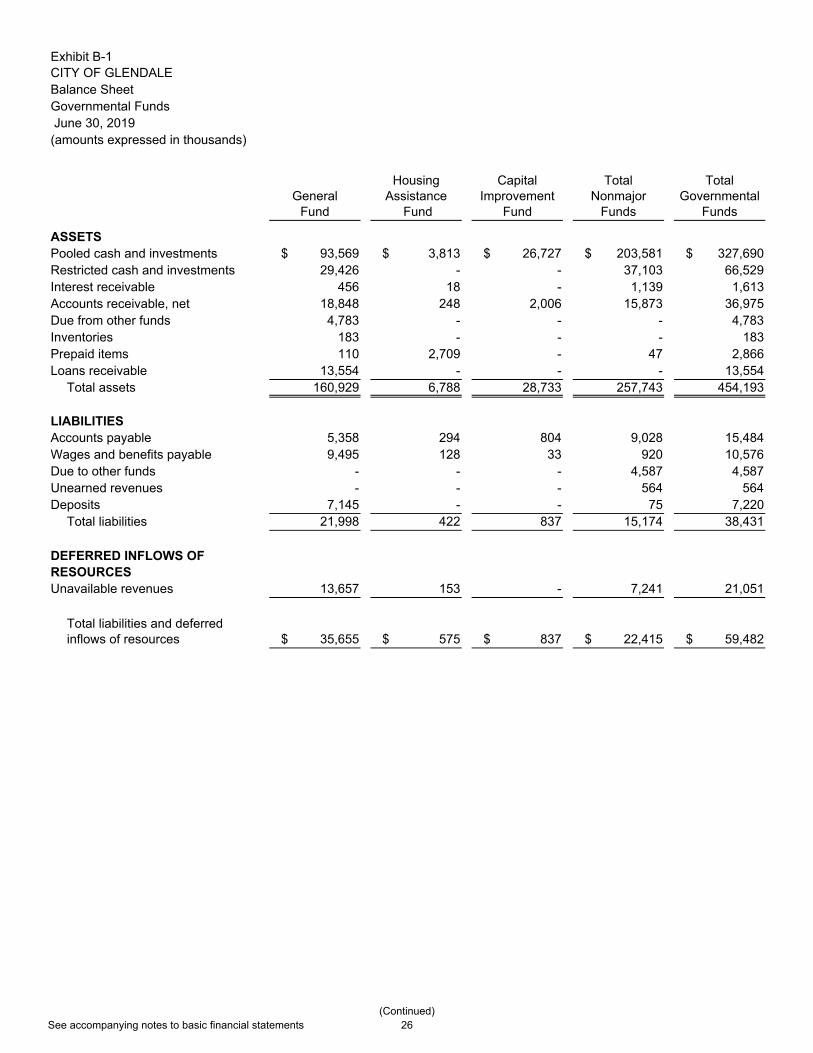
Exhibit B-1CITY OF GLENDALEBalance SheetGovernmental Funds June 30, 2019(amounts expressed in thousands)
GeneralFund
Housing Assistance
Fund
Capital Improvement
Fund
Total Nonmajor
Funds
Total Governmental
Funds
ASSETSPooled cash and investments $ 93,569 $ 3,813 $ 26,727 $ 203,581 $ 327,690 Restricted cash and investments 29,426 - - 37,103 66,529 Interest receivable 456 18 - 1,139 1,613 Accounts receivable, net 18,848 248 2,006 15,873 36,975 Due from other funds 4,783 - - - 4,783 Inventories 183 - - - 183 Prepaid items 110 2,709 - 47 2,866 Loans receivable 13,554 - - - 13,554
Total assets 160,929 6,788 28,733 257,743 454,193
LIABILITIESAccounts payable 5,358 294 804 9,028 15,484 Wages and benefits payable 9,495 128 33 920 10,576 Due to other funds - - - 4,587 4,587 Unearned revenues - - - 564 564 Deposits 7,145 - - 75 7,220
Total liabilities 21,998 422 837 15,174 38,431
DEFERRED INFLOWS OF RESOURCESUnavailable revenues 13,657 153 - 7,241 21,051
Total liabilities and deferred inflows of resources $ 35,655 $ 575 $ 837 $ 22,415 $ 59,482
See accompanying notes to basic financial statements(Continued)
26

Exhibit B-1CITY OF GLENDALEBalance SheetGovernmental Funds June 30, 2019(amounts expressed in thousands)
GeneralFund
Housing Assistance
Fund
Capital Improvement
Fund
Total Nonmajor
Funds
Total Governmental
Funds
FUND BALANCES (DEFICITS)Nonspendable
Inventory $ 183 $ - $ - $ - $ 183 Prepaid 110 2,709 - 47 2,866
RestrictedAir quality improvement - - - 635 635 Cable access - - - 4,044 4,044 Capital projects - - - 45,773 45,773 City Charter - Article XI Sec. 15 general reserve 30,769 - - - 30,769 Electric public benefit AB1890 - - - 5,903 5,903 Federal and state grants - 3,504 - 5,043 8,547 Landfill postclosure - - - 37,286 37,286 Landscaping district - - - 239 239 Low and moderate housing - - - 23,413 23,413 Pension stabilization 29,426 - - - 29,426 Public safety - - - 3,600 3,600 State gas tax mandates - - - 8,473 8,473 Transportation - - - 37,223 37,223 Youth employment - - - 33 33
CommittedCapital projects - - 27,896 1,976 29,872 Debt service - - - 15,372 15,372 Hazardous materials - - - 3,294 3,294 Impact fee funded projects - - - 27,668 27,668 Parking - - - 13,077 13,077 Public safety - - - 448 448 Urban art - - - 8,130 8,130
AssignedEconomic development 2,068 - - - 2,068 Quality of Life - affordable housing, infrastructure improvements, and other essential services 5,184 - - - 5,184
Unassigned 57,534 - - (6,349) 51,185 Total fund balances (deficits) 125,274 6,213 27,896 235,328 394,711
Total liabilities, deferred inflows of resources and fund balances (deficits) $ 160,929 $ 6,788 $ 28,733 $ 257,743 $ 454,193
See accompanying notes to basic financial statements
27

394,711$
$ 422,904
238,483
15,132
209,604
293
39,485925,901
(222)
(2,314)(2,536)
(474)
(27,938)(28,412)
(51,574)
(7)
21,051
7,102
83,762
(16,219)
(464,919)
476
(1,949)
(15,214)
88,990
941,163$
Buildings and improvements
CITY OF GLENDALEReconciliation of Balance Sheet To the Statement of Net PositionJune 30, 2019(amounts expressed in thousands)
Fund balances of governmental funds
Amounts reported for governmental activities in the statement of net position are different because:
Capital assets are not included as financial resources in the governmental funds:
Land
Equipment
Infrastructure
Intangible
Construction in progress
Long-term debt not included in the governmental funds (due within one year):
2011 HUD Section 108 loan
Net position of governmental activities
Deferred inflows of resources related to pensions
Net pension liability
Deferred outflows of resources related to OPEB
Deferred inflows of resources related to OPEB
OPEB Liability
Internal service funds are used to charge the cost of certain activities to individual funds, such as self insurance, and post employment benefits. The assets and liabilities of the internal service funds are included in the governmental activities in the statement of net position
Exhibit B-2
Landfill postclosure liability not included in the governmental funds
Accrued interest payable is not included in the governmental funds:
2011 HUD Section 108 loan
Unavailable revenue in the governmental funds is revenue in the statement of activities
Loans receivable housing long term - non-forgiven portion
Deferred outflows of resources related to pensions
2019 GMFA lease revenue refunding bonds
Long-term debt not included in the governmental funds (due in more than one year):
2011 HUD Section 108 loan
2019 GMFA lease revenue refunding bonds
See accompanying notes to basic financial statements
28
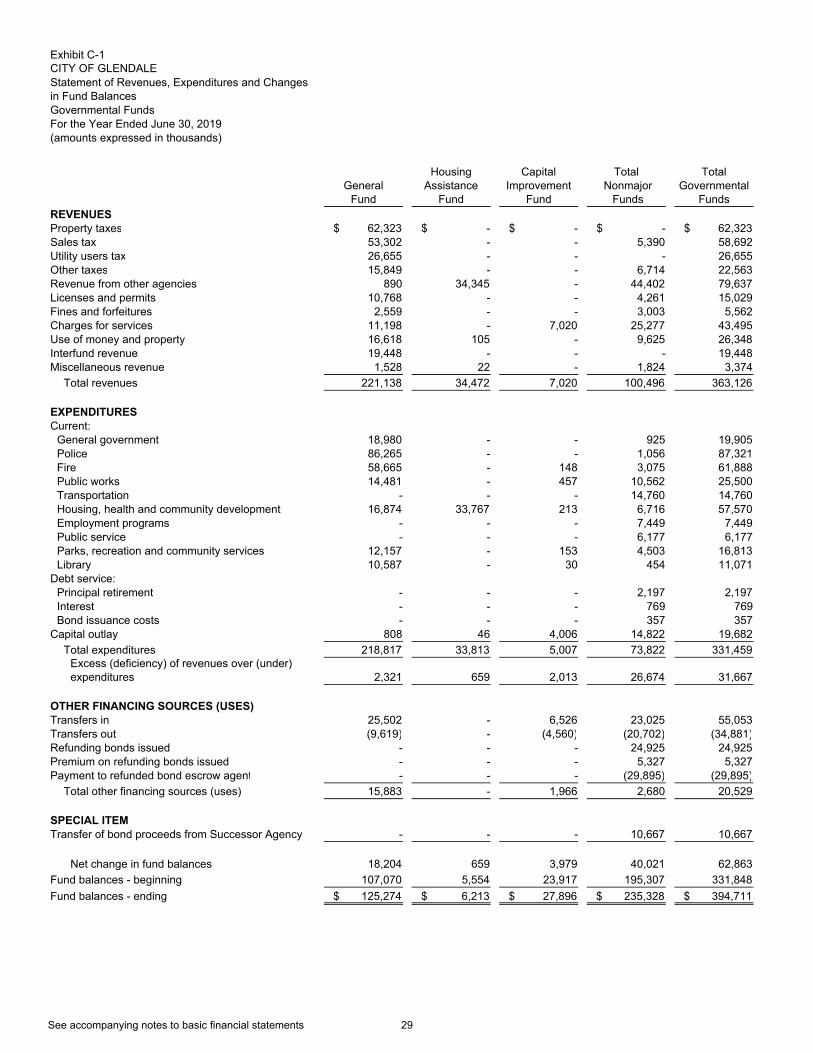
Exhibit C-1CITY OF GLENDALEStatement of Revenues, Expenditures and Changes in Fund BalancesGovernmental FundsFor the Year Ended June 30, 2019 (amounts expressed in thousands)
GeneralFund
Housing Assistance
Fund
Capital Improvement
Fund
Total Nonmajor
Funds
Total Governmental
FundsREVENUESProperty taxes $ 62,323 $ - $ - $ - $ 62,323 Sales tax 53,302 - - 5,390 58,692 Utility users tax 26,655 - - - 26,655 Other taxes 15,849 - - 6,714 22,563 Revenue from other agencies 890 34,345 - 44,402 79,637 Licenses and permits 10,768 - - 4,261 15,029 Fines and forfeitures 2,559 - - 3,003 5,562 Charges for services 11,198 - 7,020 25,277 43,495 Use of money and property 16,618 105 - 9,625 26,348 Interfund revenue 19,448 - - - 19,448 Miscellaneous revenue 1,528 22 - 1,824 3,374
Total revenues 221,138 34,472 7,020 100,496 363,126
EXPENDITURESCurrent:
General government 18,980 - - 925 19,905 Police 86,265 - - 1,056 87,321 Fire 58,665 - 148 3,075 61,888 Public works 14,481 - 457 10,562 25,500 Transportation - - - 14,760 14,760 Housing, health and community development 16,874 33,767 213 6,716 57,570 Employment programs - - - 7,449 7,449 Public service - - - 6,177 6,177 Parks, recreation and community services 12,157 - 153 4,503 16,813 Library 10,587 - 30 454 11,071
Debt service:Principal retirement - - - 2,197 2,197 Interest - - - 769 769 Bond issuance costs - - - 357 357
Capital outlay 808 46 4,006 14,822 19,682
Total expenditures 218,817 33,813 5,007 73,822 331,459 Excess (deficiency) of revenues over (under) expenditures 2,321 659 2,013 26,674 31,667
OTHER FINANCING SOURCES (USES)Transfers in 25,502 - 6,526 23,025 55,053 Transfers out (9,619) - (4,560) (20,702) (34,881)Refunding bonds issued - - - 24,925 24,925 Premium on refunding bonds issued - - - 5,327 5,327 Payment to refunded bond escrow agent - - - (29,895) (29,895)
Total other financing sources (uses) 15,883 - 1,966 2,680 20,529
SPECIAL ITEMTransfer of bond proceeds from Successor Agency - - - 10,667 10,667
Net change in fund balances 18,204 659 3,979 40,021 62,863
Fund balances - beginning 107,070 5,554 23,917 195,307 331,848
Fund balances - ending $ 125,274 $ 6,213 $ 27,896 $ 235,328 $ 394,711
See accompanying notes to basic financial statements
29

Exhibit C-2
62,863$
20,153
(22,118)
$ 1,985
212
(357)1,840
(2,962)
1,380
137
(16,135)
1
323
(10,040)
5,815
41,257$
Governmental funds report OPEB benefits paid to retirees as expenditures. However, in the statement of activities, OPEB expense is measured as the change in total OPEB liability and the amortization of deferred outflows and inflows related to OPEB. This amount represents the net change in OPEB related amounts
CITY OF GLENDALEReconciliation of the Statement of Revenues, Expenditures and Changes inFund Balances to the Statement of ActivitiesFor the Year Ended June 30, 2019(amounts expressed in thousands)
Net change in fund balances - total governmental funds
Amounts reported for governmental activities in the statement of net position are different because:
Governmental funds report capital outlays as expenditures
In the statement of activities, the cost of capital assets is allocated over their estimated useful lives as depreciation and amortization expenses
Repayment of principal is an expenditure in the governmental funds, but the repayment reduces long-term liabilities in the statement of net position:
Certificates of participation
2011 HUD Section 108
2019 GMFA lease revenue refunding bonds - costs of issuance
Landfill postclosure care liability increased from prior year
Unavailable revenue in the governmental funds are recognized as revenues in the statement of activities
Change in net position of governmental activities
Governmental funds report pension contributions as expenditures. However, in the statement of activities, pension expense is measured as the change in net pension liability and the amortization of deferred outflows and inflows related to pensions. This amount represents the net change in pension related amounts
Accrued interest 2011 Section 108 loan
Reinstatement of loans from former Redevelopment Agency to the City
Payment of loans from former Redevelopment Agency to the City
Change in net position of internal service funds allocated to governmental activities
See accompanying notes to basic financial statements
30

Exhibit D-1CITY OF GLENDALEStatement of Revenues, Expenditures, and Changes in Fund Balances – Budget and ActualGeneral FundFor the Year Ended June 30, 2019 (amounts expressed in thousands)
Variance withOriginal Final Actual Final Budget
REVENUESProperty taxes $ 61,538 $ 61,538 $ 62,323 $ 785 Sales tax 44,685 44,685 53,302 8,617 Utility users tax 29,855 28,455 26,655 (1,800)Other taxes 16,279 15,170 15,849 679 Revenue from other agencies 100 539 890 351 Licenses and permits 9,725 9,725 10,768 1,043 Fines and forfeitures 2,500 2,500 2,559 59 Charges for services 9,341 9,341 11,198 1,857 Use of money and property 11,690 11,690 16,618 4,928 Interfund revenue 19,582 19,582 19,448 (134)Miscellaneous revenue 929 1,107 1,528 421
Total revenues 206,224 204,332 221,138 16,806
EXPENDITURESCurrent:
City Clerk 1,452 2,262 1,149 1,113 City Manager 4,619 4,968 4,428 540 City Treasurer 793 832 817 15 Finance 5,787 5,808 5,198 610 Innovation, Performance and Audit 1,384 1,384 1,220 164 Legal 3,802 3,869 3,850 19 Personnel 3,187 3,187 2,318 869 Police 87,315 87,193 86,265 928 Fire 59,415 61,170 58,665 2,505 Public Works 15,248 16,151 14,481 1,670 Community Development 17,465 19,494 16,874 2,620 Community Services and Parks 12,831 12,987 12,157 830 Library, Arts and Culture 10,560 10,567 10,587 (20)
Total current 223,858 229,872 218,009 11,863 Capital outlay:
Police - 459 79 380 Fire - 664 652 12 Library, Arts and Culture - 97 77 20
Total capital outlay - 1,220 808 412 Total expenditures 223,858 231,092 218,817 12,275
Excess (deficiency) of revenues over (under) expenditures (17,634) (26,760) 2,321 29,081
OTHER FINANCING SOURCES (USES)Transfers in 22,186 22,186 25,502 3,316 Transfers out (3,926) (8,506) (9,619) (1,113)
Total other financing sources (uses) $ 18,260 $ 13,680 $ 15,883 $ 2,203
Net change in fund balances 626 (13,080) 18,204 31,284 Fund balances - beginning 107,070 107,070 107,070 - Fund balances - ending $ 107,696 $ 93,990 $ 125,274 $ 31,284
Budgeted Amounts
See accompanying notes to basic financial statements
31

Exhibit D-2CITY OF GLENDALE
Statement of Revenues, Expenditures, and Changes in Fund Balances – Budget and ActualHousing Assistance FundFor the Year Ended June 30, 2019(amounts expressed in thousands)
Variance withOriginal Final Actual Final Budget
REVENUESRevenue from other agencies $ 37,933 $ 38,090 $ 34,345 $ (3,745)Use of money and property 10 10 105 95 Miscellaneous revenue 13 13 22 9
Total revenues 37,956 38,113 34,472 (3,641)
EXPENDITURESCurrent:
Housing, health and community development 37,998 38,297 33,767 4,530 Capital outlay 31 61 46 15
Total expenditures 38,029 38,358 33,813 4,545
Net change in fund balances (73) (245) 659 904 Fund balances - beginning 5,554 5,554 5,554 - Fund balances - ending $ 5,481 $ 5,309 $ 6,213 $ 904
Budgeted Amounts
See accompanying notes to basic financial statements
32

Exhibit E-1
CITY OF GLENDALE
Statement of Net Position
Proprietary Funds
June 30, 2019
(amounts expressed in thousands)
SewerFund
ElectricFund
WaterFund
Total Nonmajor
Funds
Total Enterprise
Funds
Internal Service Funds
ASSETS
Current assets:
Pooled cash and investments $ 29,866 $ 138,827 $ 23,868 $ 47,397 $ 239,958 $ 138,395
Cash with fiscal agent - 2,251 4,247 - 6,498 -
Investment with fiscal agent - 2,398 - - 2,398 -
Interest receivable 154 1,338 162 229 1,883 924
Investment-gas/electric commodity - 1,365 - - 1,365 -
Accounts receivable, net 3,324 23,187 7,447 2,651 36,609 6,640
Loans receivable - - - 25 25 -
Inventories - 6,875 - - 6,875 190
Prepaid items - 12,977 - 89 13,066 2,232
Total current assets 33,344 189,218 35,724 50,391 308,677 148,381
Noncurrent assets:
Designated cash and investments - 124,100 11,300 - 135,400 -
Restricted cash and investments - 5,669 - - 5,669 -
Capital assets, not being depreciated 25,306 33,606 12,414 2,489 73,815 4,857
Capital assets, net 157,937 211,831 168,058 8,300 546,126 31,682
Total noncurrent assets 183,243 375,206 191,772 10,789 761,010 36,539
Total assets 216,587 564,424 227,496 61,180 1,069,687 184,920
DEFERRED OUTFLOWS OF RESOURCES
Deferred outflows related to pensions 1,050 10,946 3,462 2,995 18,453 -
Loss on refunding - 4,335 - - 4,335 -
Total deferred outflows of resources 1,050 15,281 3,462 2,995 22,788 -
Total assets and deferred outflows of resources $ 217,637 $ 579,705 $ 230,958 $ 64,175 $ 1,092,475 $ 184,920
Business-type Activities
See accompanying notes to basic financial statements(Continued)
33

Exhibit E-1
CITY OF GLENDALE
Statement of Net Position
Proprietary Funds
June 30, 2019
(amounts expressed in thousands)
SewerFund
ElectricFund
WaterFund
Total Nonmajor
Funds
Total Enterprise
Funds
Internal Service Funds
Business-type Activities
LIABILITIES
Current liabilities:
Accounts payable $ 2,072 $ 12,776 $ 5,304 $ 3,498 $ 23,650 $ 5,533
Wages and benefits payable 214 2,152 641 686 3,693 1,665
Due to other funds - - - - - 196
Interest payable - 2,904 1,323 - 4,227 -
Claims payable - - - - - 16,485
Compensated absences - - - - - 3,333
Bonds payable - 6,337 2,031 - 8,368 -
Deposits 624 2,408 1,157 480 4,669 -
Total current liabilities 2,910 26,577 10,456 4,664 44,607 27,212
Noncurrent liabilities:
Claims payable - - - - - 41,863
Compensated absences - - - - - 27,096
Bonds payable - 154,087 74,778 - 228,865 -
Net pension liability 5,569 61,278 18,206 17,786 102,839 -
Total noncurrent liabilities 5,569 215,365 92,984 17,786 331,704 68,959
Total liabilities 8,479 241,942 103,440 22,450 376,311 96,171
DEFERRED INFLOWS OF RESOURCES
Deferred inflows related to pensions 157 1,605 549 549 2,860 -
Total liabilities and deferred inflows of resources 8,636 243,547 103,989 22,999 379,171 96,171
NET POSITION
Net investment in capital assets 183,243 89,348 103,663 10,789 387,043 36,539
Restricted for:
SCAQMD emission controls - 5,669 - - 5,669 -
Unrestricted 25,758 241,141 23,306 30,387 320,592 52,210
Total net position $ 209,001 $ 336,158 $ 126,969 $ 41,176 713,304 $ 88,749
Some amounts reported for business-type activities in the statement of net position are different
because the net adjustment pertains to items on the statement of net position of certain
internal service funds reported with business-type activities. (241)Total net position of business-type activities $ 713,063
See accompanying notes to basic financial statements
34

Exhibit E-2
CITY OF GLENDALEStatement of Revenues, Expenses, and Changes in Net Position
Proprietary Funds
For the Year Ended June 30, 2019
(amounts expressed in thousands)
SewerFund
ElectricFund
WaterFund
Total Nonmajor
Funds
Total Enterprise
Funds
InternalServiceFunds
OPERATING REVENUES
Charges for services $ 24,892 $ 211,748 $ 48,726 $ 26,952 $ 312,318 $ 98,296
Miscellaneous revenue 54 5,944 2,134 566 8,698 2,707
Total operating revenues 24,946 217,692 50,860 27,518 321,016 101,003
OPERATING EXPENSES
Maintenance and operation 16,027 173,729 40,661 24,937 255,354 43,851
Claims and settlement - - - - - 50,684
Depreciation 3,079 24,845 6,816 1,456 36,196 3,691
Gas depletion - 1,014 - - 1,014 -
Amortization 2,774 - - - 2,774 86
Total operating expenses 21,880 199,588 47,477 26,393 295,338 98,312
Operating income (loss) 3,066 18,104 3,383 1,125 25,678 2,691
NON OPERATING REVENUES (EXPENSES)
Use of money and property 1,262 11,472 1,432 1,955 16,121 5,773
Intergovernmental grants - 32 10 158 200 42
Interest expense - (6,215) (3,139) - (9,354) -
Total nonoperating revenues (expenses) 1,262 5,289 (1,697) 2,113 6,967 5,815
Income (loss) before capital grants and contributions and transfers 4,328 23,393 1,686 3,238 32,645 8,506
Capital grants and contributions - - 8 - 8 2,718
Transfers in - - - - - 1,550
Transfers out - (19,022) - (1,150) (20,172) (1,550)
Change in net position 4,328 4,371 1,694 2,088 12,481 11,224
Total net position - beginning 204,673 331,787 125,275 39,088 77,525 Total net position - ending $ 209,001 $ 336,158 $ 126,969 $ 41,176 $ 88,749
Some amounts reported for business-type activities in the statement of activities are different
because the net revenue (expense) of certain internal service funds are reported with business-type activities. 5,409
Changes in net position of business-type activities $ 17,890
Business-type Activities
See accompanying notes to basic financial statements
35

Exhibit E-3CITY OF GLENDALEStatement of Cash FlowsProprietary FundsFor the Year Ended June 30, 2019(amounts expressed in thousands)
SewerFund
ElectricFund
WaterFund
Nonmajor Enterprise
Funds
Total Enterprise
Funds
Internal Service Funds
CASH FLOWS FROM OPERATING ACTIVITIES
Cash receipts from customers $ 23,895 $ 220,937 $ 50,917 $ 27,460 $ 323,209 $ 97,909 Payments to employees (3,394) (33,377) (10,545) (10,837) (58,153) (20,621)Payments to suppliers (16,397) (133,868) (27,287) (10,332) (187,884) (66,497)
Net cash provided (used) by operating activities 4,104 53,692 13,085 6,291 77,172 10,791
CASH FLOWS FROM NONCAPITALFINANCING ACTIVITIES
Amounts paid to other funds - - - - - (20)Transfers in (out) - (19,022) - (1,150) (20,172) - Operating grants received - 32 10 158 200 42 Loans receivable - - - (25) (25) -
Net cash provided (used) by noncapital financing activities - (18,990) 10 (1,017) (19,997) 22
CASH FLOWS FROM CAPITAL AND RELATED FINANCING ACTIVITIES
Acquisition of property, plant, equipment and gas reserves (5,611) (5,264) (5,059) (2,252) (18,186) (9,348)Capital grants received - - 8 - 8 2,718 Interest on long-term debt - (6,079) (3,176) - (9,255) - Principal payments and premiums - (6,126) (1,941) - (8,067) - Proceed from sales of capital assets 1 14 - 66 81 98
Net cash provided (used) by capital and related financing activities (5,610) (17,455) (10,168) (2,186) (35,419) (6,532)
CASH FLOWS FROM INVESTING ACTIVITIES
Investment - gas/electric commodity - 135 - - 135 - Interest received 1,227 11,152 1,387 1,833 15,599 5,536
Net cash provided (used) by investing activities 1,227 11,287 1,387 1,833 15,734 5,536
Net increase (decrease) in cash and cash equivalents (279) 28,534 4,314 4,921 37,490 9,817
Balances - beginning of year 30,145 242,313 35,101 42,476 350,035 128,578
Balances - end of the year $ 29,866 $ 270,847 $ 39,415 $ 47,397 $ 387,525 $ 138,395
Business-type Activities - Enterprise Funds
See accompanying notes to basic financial statements(Continued)
36

Exhibit E-3CITY OF GLENDALEStatement of Cash FlowsProprietary FundsFor the Year Ended June 30, 2019(amounts expressed in thousands)
SewerFund
ElectricFund
WaterFund
Nonmajor Enterprise
Funds
Total Enterprise
Funds
Internal Service Funds
Business-type Activities - Enterprise Funds
Reconciliation of operating income (loss) to net cash provided (used) by operating activities:
Operating Income $ 3,066 $ 18,104 $ 3,383 $ 1,125 $ 25,678 $ 2,691 Adjustments to reconcile operating income (loss) to net cash provided (used) by operating activities:
Depreciation 3,079 24,845 6,816 1,456 36,196 3,691 Amortization 2,774 - - - 2,774 86 Depletion - 1,014 - - 1,014 -
Changes in assets and liabilities:Pension expense 235 2,785 1,171 1,199 5,390 - (Increase) Decrease Accounts receivable, net (1,336) 3,958 37 (111) 2,548 (3,094)Decrease Inventories - 80 - - 80 20 (Increase) Prepaid expenses - (1,507) - (89) (1,596) (404)Increase Accrued wages payable 46 143 47 32 268 1,400 Increase Compensated absences - - - - - 378Increase (Decrease) Accounts payable (4,045) 4,983 1,611 2,626 5,175 942 Increase (Decrease) Deposits 285 (713) 20 53 (355) -Increase Claims payable - - - - - 5,081
Net cash provided (used) by operating activities 4,104 53,692 13,085 6,291 77,172 10,791
Reconciliation of Statement of Cash Flows to Statement of Net Position:
Pooled cash and investments 29,866 138,827 23,868 47,397 239,958 138,395 Cash with fiscal agent - 2,251 4,247 - 6,498 - Designated cash and investments - 124,100 11,300 - 135,400 - Restricted cash and investments - 5,669 - - 5,669 -
Cash and cash equivalents at June 30 $ 29,866 $ 270,847 $ 39,415 $ 47,397 $ 387,525 $ 138,395
See accompanying notes to basic financial statements
37

Exhibit F-1
CITY OF GLENDALE
Statement of Fiduciary Net Position
June 30, 2019
(amounts expressed in thousands)
Glendale Successor Agency Private-Purpose
Trust Funds
ASSETS
Current assets:
Cash and investments $ 63,126
Cash and investments with fiscal agent 11,649
Restricted cash and investments 29
Loans receivable 988
Total current assets 75,792
DEFERRED OUTFLOWS OF RESOURCES
Loss on refunding 1,651
Total assets and deferred outflows of resources 77,443
LIABILITIES
Current liabilities:
Accounts payable and accrued liabilities 41
Interest payable 367
Bonds payable 10,606
Loans payable to the City 3,733
Total current liabilities 14,747
Noncurrent liabilities:
Bonds payable 63,632
Loans payable to the City 9,821
Total noncurrent liabilities 73,453
Total liabilities 88,200
Net position (deficit) held in trust $ (10,757)
See accompanying notes to basic financial statements
38

Exhibit F-2
CITY OF GLENDALE
Statement of Changes in Fiduciary Net Position
For the Year Ended June 30, 2019
(amounts expressed in thousands)
Glendale Successor Agency Private-Purpose
Trust Funds
ADDITIONS
Property tax $ 19,542
Gain on sale of property 1,453
Interest income 1,555
Total additions 22,550
DEDUCTIONS
Operating expenses 1,151
Depreciation 123
Interest and amortization expense on bonds 4,195
Transfer of bond proceeds to the City 10,667
Total deductions 16,136
Change in net position 6,414
Net Position - beginning of the year (17,171)
Net Position - end of the year $ (10,757)
See accompanying notes to basic financial statements
39

This page is left blank intentionally.
40

Notes to the Basic
Financial Statements
Notes to the BasicFinancial Statements

CITY OF GLENDALE
Notes to the Basic Financial Statements
Fiscal Year Ended June 30, 2019
Note Page
(1) Summary of Significant Accounting Policies 42
(2) Stewardship, Compliance and Accountability 51
(3) Cash and Investments 52
(4) Loans Receivable 58
(5) Interfund Transactions 61
(6) Capital Assets 62
(7) Long-term Debt 64
(8) Pension Plans 70
(9) Other Post Employment Benefits Than Pensions (OPEB) 80
(10) Net Deficits of Individual Funds 83
(11) Risk Management 84
(12) Contingent Liabilities and Commitments 85
(13) Jointly Governed Organizations 87
(14) Successor Agency Trust for Assets of Former Redevelopment Agency 90
(15) Pronouncements Issued But Not Yet Implemented 98
(16) Implementation of Pronouncements 99
41

CITY OF GLENDALE Notes to the Basic Financial Statements Fiscal Year Ended June 30, 2019 (in thousands) NOTE 1 – SUMMARY OF SIGNIFICANT ACCOUNTING POLICIES
Reporting Entity
These financial statements present the financial results of the City of Glendale, California (the City) and its component units as required by generally accepted accounting principles in the United States of America. Component units are legally separate entities for which the primary government is financially accountable. The City has three component units: the Glendale Housing Authority (the Housing Authority), the Glendale Financing Authority (the Financing Authority), and the Glendale Municipal Financing Authority (the Municipal Financing Authority). The City Council serves as the Board of the Housing Authority, the Financing Authority and the Municipal Financing Authority. Management of the City has operational responsibility for the Housing Authority, the Financing Authority and the Municipal Financing Authority as these component units are essentially managed in the same manner as other City departments. Also, the Financing Authority and the Municipal Financing Authority provide financial services entirely to the City. Therefore, these entities are reported as blended component units within the City’s comprehensive annual financial report (CAFR). Both the City and its blended component units have a June 30 year-end.
Component Units
The Housing Authority was established by the Glendale City Council in 1975. The Housing Authority administers seven affordable housing program funds on behalf of the City, including (1) the Department of Housing and Urban Development (HUD) Housing Assistance Fund (often called “Section 8”), (2) the HUD HOME Grant Fund, (3) the HUD Continuum of Care Grant Fund, (4) the Affordable Housing Trust Fund that receives density bonus, inclusionary and other local affordable housing funds, (5) the state funded BEGIN Affordable Homeownership Fund, (6) the Low and Moderate Income Housing Asset Fund, and (7) 2011 TABs Housing Fund. The Housing Authority’s mission is to provide decent, safe, and sanitary dwellings for low to moderate income families, to preserve existing affordable housing, and to increase the supply and quality of new affordable housing. The Housing Authority's financial data and transactions are included within the special revenue funds, and no separate financial report is issued for the Authority. The Financing Authority was established on December 7, 1999, by a joint powers authority between the City of Glendale and the former Glendale Redevelopment Agency. The stated purpose was to provide financial assistance to the City in connection with the construction and improvement of a Police Services Building located at west side of Isabel Street between Wilson and Broadway in the City of Glendale. On July 11, 2000, the Financing Authority issued $64,200 in variable rate demand certificates of participation for the construction of the Police Services Building. On June 25, 2019, the certificates of participation were paid off. The Financing Authority’s financial data and transactions are included within the debt service funds, and no separate financial report is issued for the Financing Authority. The Municipal Financing Authority was established on April 9, 2019, by a joint powers authority between the City of Glendale and the Housing Authority. The stated purpose was to assist in refinancing the 2000 Variable Rate Demand Certificates of Participation under the Financing Authority. On June 25, 2019, the Municipal Financing Authority issued $24,925 fixed-rate bonds to refinance the 2000 Variable Rate Demand Certificates of Participation. The Municipal Financing Authority’s financial data and transactions are included within the Police Building 2019 Lease Revenue Refunding Bonds Fund, and no separate financial report is issued for the Municipal Financing Authority.
Government-wide and Fund Financial Statements
The government-wide financial statements (i.e., the statement of net position and the statement of activities) report information on all of the activities of the City except for the fiduciary fund. The effect of interfund activity has been removed from these statements except for the interfund services provided and used. Governmental activities, which normally are supported by taxes and intergovernmental revenues, are reported separately from business-type activities, which rely to a significant extent on fees and charges for services.
42

CITY OF GLENDALE Notes to the Basic Financial Statements Fiscal Year Ended June 30, 2019 (in thousands) The statement of activities demonstrates the degree to which the direct expenses of a given function are offset by program revenues. Direct expenses are clearly identifiable with a specific function. Program revenues include 1) charges to customers or applicants who purchase, use, or directly benefit from goods, services, or privileges provided by a given function, and 2) grants and contributions that are restricted to meeting the operational or capital requirements of a particular function. Taxes and other items not included in program revenues are reported as general revenues.
Separate fund financial statements are provided for governmental, proprietary, and the fiduciary funds. Major individual governmental and enterprise funds are reported as separate columns in the fund financial statements.
The accounts of the City are organized by funds, each of which is considered to be a separate accounting entity. The operations of each fund are accounted for by providing a separate set of self-balancing accounts which comprise of its assets, deferred outflows of resources, liabilities, deferred inflows of resources, fund balance or net position, revenues, and expenditures or expenses, as appropriate. The City reports a total of 70 funds, which are comprised of the General Fund, 1 fiduciary fund, 37 special revenue funds, 2 debt service funds, 9 capital project funds, 5 enterprise funds and 15 internal service funds.
Governmental Fund Types
Governmental fund types are those funds through which most governmental functions typically are financed. Governmental fund reporting focuses on the sources, uses, and balances of current financial resources. Expendable assets are assigned to the various governmental funds according to the purposes for which they may or must be used, current liabilities are assigned to the fund from which they are paid, and the difference between governmental fund assets and deferred outflows, and liabilities and deferred inflows is the fund balance.
The following comprise the City's major governmental funds:
General Fund: Used to account for all financial resources, except those required to be accounted for in another fund.
Housing Assistance - Special Revenue Fund: Used to account for monies received and expended by the City under Section 8 of the Federal Housing and Urban Development Act for housing assistance to low and moderate income families.
Capital Improvement - Capital Project Fund: Used to account for financial resources used for major capital projects of the general government operations. The City has categorized the capital improvement fund as a major fund for public interest reasons. The City believes that this judgmentally determined major fund is particularly important to the financial statements users.
Other governmental funds consist of debt service funds which are used to account for the accumulation and disbursement of financial resources that will be used to make principal and interest payments on long-term debt of the City of Glendale, special revenue funds which account for revenue derived from specific sources as required by law, regulation or commitment, and capital projects funds which are used to account for financial resources used for the acquisition of major capital facilities other than those financed by special revenue and proprietary funds. Effective June 30, 2019, Recreation Fund, Special Events Fund and Filming Fund were closed, and the fund balances were transferred to the General Fund. The operations of these three funds will be recorded in the General Fund starting FY 2019-20.
43
CITY OF GLENDALE Notes to the Basic Financial Statements Fiscal Year Ended June 30, 2019 (in thousands) Proprietary Fund Types
Proprietary fund types are used to account for a government's ongoing organizations and activities which are similar to those often found in the private sector.
Enterprise funds are used to finance and account for the acquisition, operation, and maintenance of the City's facilities and services which are supported primarily by user charges. The following comprise the City's major enterprise funds:
Sewer Fund – Used to account for operations and maintenance of the sewer system. This service is
primarily contracted with the City of Los Angeles.
Electric Fund – Used to account for the operations of the City-owned electric utility services.
Water Fund – Used to account for the operations of the City-owned water utility services.
Other nonmajor enterprise funds consist of Refuse Disposal and Fire Communication Funds. The Refuse Disposal Fund is used for the operations of the City-owned refuse collection and disposal services. The Fire Communication Fund is used for the monies received and expended, for the tri-city (Burbank, Glendale, and Pasadena) fire communication operations as the lead City.
Additionally, Internal service funds account for fleet management, technology and wireless equipment management and replacement, building maintenance, compensated absences, retiree health savings plan, other post-employment benefits, and risk management services (including claims for workers’ compensation, general liability, medical, dental, vision, and unemployment) provided to other departments or agencies of the government, or to other governments on a cost-reimbursement basis.
Fiduciary Fund Type
The fiduciary fund is used to account for resources held for the benefit of parties outside the City. The City maintains one fiduciary fund, the Glendale Successor Agency Private Purpose Trust Fund.
Since the resources of the fiduciary fund are not available to support the City’s programs, it is not reflected in the City’s government-wide financial statements. The accounting used for the fiduciary fund is based on the economic measurement focus and the accrual basis of accounting.
Effective February 1, 2012, due to AB 1x 26, the dissolution of Redevelopment Agencies throughout California, the activities of the dissolved Glendale Redevelopment Agency are recorded in the Glendale Successor Agency Private Purpose Trust Fund.
Measurement Focus and Basis of Accounting
The government-wide financial statements are reported using the economic resources measurement focus and the accrual basis of accounting, as are the proprietary and fiduciary fund financial statements. Revenues are recorded when earned, and expenses are recorded when a liability is incurred, regardless of the timing of related cash flows. Property taxes are recognized as revenues in the year for which they are levied. Grants and similar items are recognized as revenue as soon as all eligibility requirements imposed by the provider have been met.
Amounts reported as program revenues include 1) charges to customers or applicants for goods, services, or privileges provided, 2) operating grants and contributions, and 3) capital grants and contributions, including special assessments. Internally dedicated resources are reported as general revenues rather than as program revenues. Likewise, general revenues include all taxes.
Governmental fund financial statements are reported using the current financial resources measurement focus and the modified accrual basis of accounting. Revenues are recognized as soon as they are both measurable and
44
CITY OF GLENDALE Notes to the Basic Financial Statements Fiscal Year Ended June 30, 2019 (in thousands) available. Revenues are considered to be available when they are collectible within the current period or soon after to pay liabilities of the current period. For this purpose, the City considers revenues to be available if they are collected within 60 days of the end of the current fiscal period, except for the landfill host assessment and landfill loyalty tipping fee that are collected within 90 days. Under the modified accrual basis of accounting, expenditures are generally recorded when a liability is incurred. However, debt service expenditures, as well as expenditures related to compensated absences, other post employment benefits (OPEB), claims and judgments, are recorded only when payment is due.
Intergovernmental revenues are recognized in the period when all eligibility requirements imposed by the provider are met, and amounts are available. Licenses and permits, fines and forfeitures, and miscellaneous revenues are recorded as revenue when received in cash because they are generally not measurable until actually received. In the category of use of money and property, property rentals are recorded as revenue when received in cash. However, since investment earnings are measurable and available, they are recorded as earned. All property taxes are collected and allocated by the County of Los Angeles to the various taxing entities. Property taxes are determined annually on January 1st and assessed as enforceable liens on real property as of July 1st. Taxes are levied on both secured and unsecured property as it exists on record as of January 1st. The tax levy covers the fiscal period July 1 to June 30. The secured property taxes are due November 1st and February 1st and are delinquent if not paid by December 10th and April 10th, respectively. Property taxes on the unsecured roll are due upon receipt and become delinquent if unpaid on August 31st. Property tax revenues are recognized in the fiscal period for which they are levied and collected. Proprietary funds distinguish operating revenues and expenses from non-operating items. Operating revenues and expenses generally result from providing services and producing and delivering goods in connection with the proprietary funds’ principal ongoing operations. The principal operating revenues of the City's enterprise and internal service funds are charges to customers for sales and services. Operating expenses for enterprise and internal service funds include the cost of sales and services, administrative expenses, and depreciation on capital assets. All revenues and expenses not meeting this definition are reported as non-operating revenues and expenses.
Assets, Deferred Outflows of Resources, Liabilities, Deferred Inflows of Resources, and Fund Balance or Net Position
Pooled Cash and Investments
The City combines the cash and investments of all funds into a pool except for funds required to be held by outside fiscal agents under the provisions of bond indentures. Each fund’s portion of the pooled cash and investments is displayed on the governmental funds’ balance sheets, the proprietary funds’ statement of net position, or the fiduciary fund’s statement of net position. The City values its cash and investments at fair value in the statement of net position and recognizes the corresponding change in the fair value of investments in the year in which the change occurred. The City categorizes the fair value measurements of its investments based on the hierarchy established by generally accepted accounting principles. The fair value hierarchy, which has three levels, is based on the valuation inputs used to measure an asset’s fair value: Level 1 inputs are quoted prices in active markets for identical assets; Level 2 inputs are significant other observable inputs; Level 3 inputs are significant unobservable inputs.
The City manages its pooled idle cash and investments under a formal investment policy that is reviewed by the Investment Committee, adopted by the City Council and follows the guidelines of the State of California Government Code. Individual investments cannot be identified with any single fund because the City may be required to liquidate its investments at any time to cover large outlays required more than normal operating needs.
45

CITY OF GLENDALE Notes to the Basic Financial Statements Fiscal Year Ended June 30, 2019 (in thousands) Interest income from the pooled cash and investments is allocated to all funds, except the Capital Improvement Fund, on a monthly basis based upon the prior month-end cash balance of the fund and as a percentage of the month-end total pooled cash balance.
For purposes of the statement of cash flow of the proprietary fund types, cash and cash equivalents include all pooled cash and investments, restricted cash, designated cash, and cash with fiscal agents with an original maturity of three months or less. The City considers the cash and investments pool to be a demand deposit account where funds may be withdrawn and deposited at any time without prior notice or penalty. Cash and Investments with Fiscal Agents The City hired Bank of New York Mellon as its trustee or fiscal agent to oversee the implementation of a bond or trust indenture for the City’s Certificates of Participation, which was fully refunded on June 25, 2019, Glendale Municipal Financing Authority 2019 Lease Revenue Bonds, Electric Revenue Bonds and Water Revenue Bonds. Restricted Cash and Investments
Governmental Activities have $66,529 in restricted cash and investments as of June 30, 2019. $29,426 in the General Fund is for the investments for the pension rate stabilization program that is invested in an Internal Revenue Code Section 115 Trust Fund and $37,103 in the Landfill Postclosure capital project fund is for the postclosure maintenance cost of Scholl Canyon landfill. Electric Fund has $5,669 in restricted cash and investments for the environmental compliance funds mandated by South Coast Air Quality Management District (SCAQMD) as of June 30, 2019. $4,978 is in SCAQMD restricted cash dedicated for environmental projects in compliance with reductions in nitrogen oxides for the utility boilers and the gas turbines, and $691 is in SCAQMD restricted cash for environmental projects dedicated to the reduction of emission and improvement of public health in Glendale. Investments-Gas/Electric Commodity Investment-gas/electric commodity represents the City’s implementation of a program to purchase and sell options, calls and puts, in natural gas futures contracts at strike prices. These transactions allow the City to stabilize the ultimate purchase price of natural gas for the City’s power plant. These, and other transactions, also give the City the ability to manage its overall exposure to fluctuations in the purchase price of natural gas. The options are carried at fair market value. Designated Cash and Investments
The cash reserve policies for the Electric Fund and Water Fund were adopted by the City Council in 2003 and subsequently revised in 2006 to ensure long-term sustainable financial health for electric and water operations. Its provisions call for an annual review of the cash reserves to determine if the recommended levels are sufficient. The currently approved cash reserve levels are $124,100 for the Electric Fund and $11,300 for the Water Fund as adopted by the City Council on August 29, 2006. As of June 30, 2019, $124,100 was designated for the Electric Fund in the following categories: $57,700 for operating reserve, $40,400 for contingency reserve; $10,000 for rate stabilization reserve, and $16,000 for gas reserve project. As of June 30, 2019, $11,300 was designated for the Water Fund in the following categories: $3,800 for operating reserve, $6,500 for contingency reserve, and $1,000 for rate stabilization reserve. As part of the Electric and Water cost of service and rate studies conducted in FY 2017-18, the consultants determined the existing cash reserve funding levels are sufficient in the five year rate plan effective on July 1, 2018. GWP management also reviews the funding level annually and determined that the reserve levels are sufficient for FY 2018-19.
46

CITY OF GLENDALE Notes to the Basic Financial Statements Fiscal Year Ended June 30, 2019 (in thousands) Receivables
Interest Receivable – The City accrues interest earned but not received. Accounts Receivables – These are comprised primarily of revenues that have been earned but not yet received by the City as of June 30th from individual customers, private entities, and government agencies. This account includes accrued revenues due from other agencies for expenditure driven types of grants whereby the City accrues grant revenues for expenditures or expenses incurred but not yet reimbursed by the grantors. Also, included in this amount are property taxes, sales taxes, to name a few, are earned but not received as of June 30th of each year. In addition, it includes charges for utility and other services provided to customers prior to year-end but not billed as of June 30th because of the billing cycle timing. Management determines the allowance for doubtful accounts by evaluating individual customer accounts. Utility customer closed accounts are written off when deemed uncollectible. Recoveries to utility customer receivables previously written off are recorded when received. For non-utility accounts receivable, delinquent notices are sent out to customers with outstanding balances after 30 days. Outstanding accounts over 60 days are forwarded to a collection agency. Loans Receivable – The City currently has three types of loans receivable: (1) from City of Burbank, City of Alhambra and Burbank-Glendale-Pasadena Airport Authority for the purchase of alerting system (2) from Glendale Successor Agency for enforceable obligations with the City after the dissolution of Glendale Redevelopment Agency, and (3) from various Glendale residents and organizations for affordable housing assistance. See Note 4 for more information.
Interfund Transactions
Interfund services provided and used would be treated as revenues and expenditures or expenses if the funds are involved. External organizations to the City’s government are accounted for as revenues, referred to as seller funds, and expenditures or expenses, referred to as purchaser funds, in the funds involved. For the fiscal year ended June 30, 2019, the General Fund recorded $19,448 as interfund revenue for general government services provided to other funds.
Due to/from Other Funds are used when a fund has a temporary cash overdraft. Any residual balances outstanding between the governmental activities and business-type activities are reported in the government-wide financial statements as “internal balances.”
Transfers in or out are authorized budgetary exchanges of cash between funds.
Inventories and Prepaid Items
Inventories, consisting primarily of construction and maintenance materials as well as tools held by the Electric Fund, are stated at cost, using the weighted average cost method or disposal value. Inventory shown in the General Fund and the Fleet/Equipment Management Fund consists of expendable supplies held for consumption. The consumption method of accounting is used where inventory acquisitions are recorded in inventory accounts initially and charged as expenditures when used. Certain payments to vendors reflect costs applicable to future accounting periods and are recorded as prepaid items in both government-wide and fund financial statements using the consumption method, such as insurance, energy purchases, rent, etc.
Capital Assets
Capital assets including land, buildings, improvements, mobile equipment, equipment, intangible, and infrastructure assets (e.g. roads, sidewalks, traffic lights and signals, street lights, etc.), are reported in the applicable governmental or business-type activities columns in the government-wide and respective proprietary fund financial statements. Capital assets are defined by the City as assets with an initial, individual cost of $5 or more and an estimated useful life more than one year. Such assets are recorded at historical cost or estimated historical cost if purchased or constructed. Donated capital assets are recorded at acquisition value at the date of donation. Capital outlay is recorded as expenditures of the General Fund, special revenue and capital project funds, and as assets in the
47
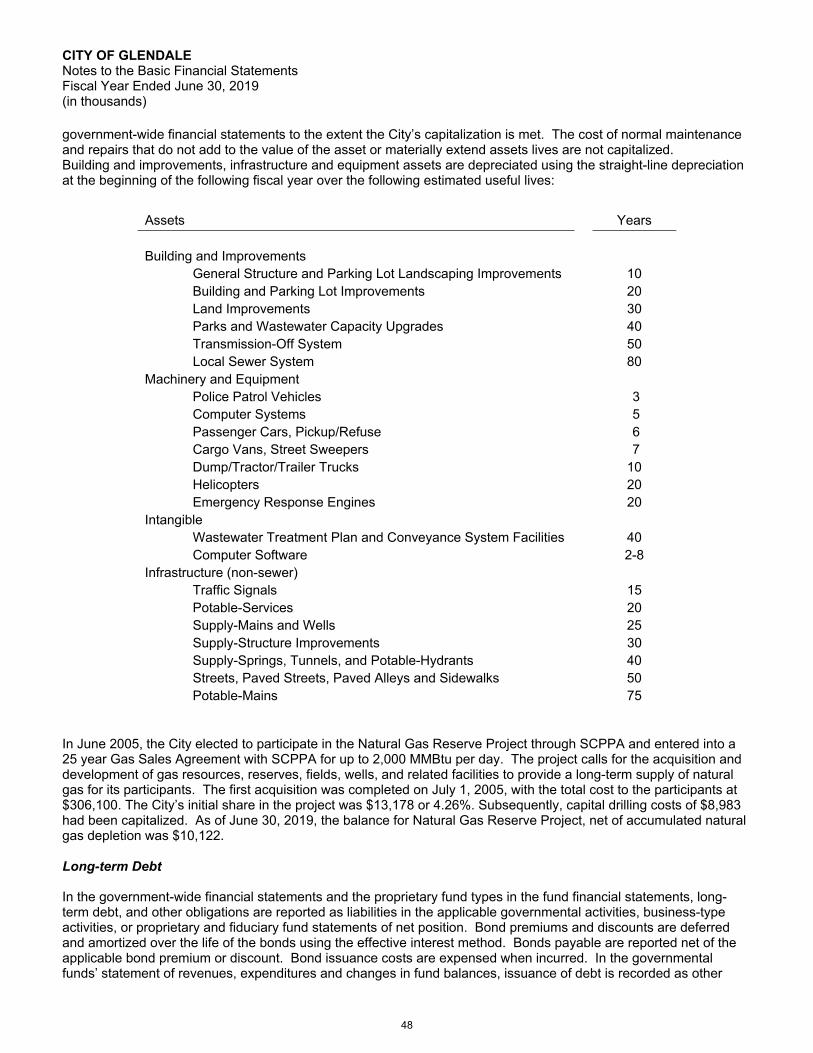
CITY OF GLENDALE Notes to the Basic Financial Statements Fiscal Year Ended June 30, 2019 (in thousands) government-wide financial statements to the extent the City’s capitalization is met. The cost of normal maintenance and repairs that do not add to the value of the asset or materially extend assets lives are not capitalized. Building and improvements, infrastructure and equipment assets are depreciated using the straight-line depreciation at the beginning of the following fiscal year over the following estimated useful lives:
Assets
Years Building and Improvements General Structure and Parking Lot Landscaping Improvements 10 Building and Parking Lot Improvements 20 Land Improvements 30 Parks and Wastewater Capacity Upgrades 40 Transmission-Off System 50 Local Sewer System 80 Machinery and Equipment Police Patrol Vehicles 3 Computer Systems 5 Passenger Cars, Pickup/Refuse 6 Cargo Vans, Street Sweepers 7 Dump/Tractor/Trailer Trucks 10 Helicopters 20 Emergency Response Engines 20 Intangible Wastewater Treatment Plan and Conveyance System Facilities 40 Computer Software 2-8 Infrastructure (non-sewer) Traffic Signals 15 Potable-Services 20 Supply-Mains and Wells 25 Supply-Structure Improvements 30 Supply-Springs, Tunnels, and Potable-Hydrants 40 Streets, Paved Streets, Paved Alleys and Sidewalks 50 Potable-Mains 75
In June 2005, the City elected to participate in the Natural Gas Reserve Project through SCPPA and entered into a 25 year Gas Sales Agreement with SCPPA for up to 2,000 MMBtu per day. The project calls for the acquisition and development of gas resources, reserves, fields, wells, and related facilities to provide a long-term supply of natural gas for its participants. The first acquisition was completed on July 1, 2005, with the total cost to the participants at $306,100. The City’s initial share in the project was $13,178 or 4.26%. Subsequently, capital drilling costs of $8,983 had been capitalized. As of June 30, 2019, the balance for Natural Gas Reserve Project, net of accumulated natural gas depletion was $10,122.
Long-term Debt
In the government-wide financial statements and the proprietary fund types in the fund financial statements, long-term debt, and other obligations are reported as liabilities in the applicable governmental activities, business-type activities, or proprietary and fiduciary fund statements of net position. Bond premiums and discounts are deferred and amortized over the life of the bonds using the effective interest method. Bonds payable are reported net of the applicable bond premium or discount. Bond issuance costs are expensed when incurred. In the governmental funds’ statement of revenues, expenditures and changes in fund balances, issuance of debt is recorded as other
48

CITY OF GLENDALE Notes to the Basic Financial Statements Fiscal Year Ended June 30, 2019 (in thousands) financing source or use in the respective fund. Issuance costs and payment of principal are reported as debt service expenditures. Pension
For purposes of measuring the net pension liability and deferred outflows or inflows of resources related to pensions, and pension expense, information about the fiduciary net position of the City’s California Public Employees’ Retirement System (CalPERS) plans (Plan’s) and additions to or deductions from the Plan’s fiduciary net position have been determined on the same basis as they are reported by CalPERS. For this purpose, benefit payments, including refunds of employee contributions, are recognized when due and payable by the benefit terms. Investments are reported at fair value. See Note 8 for more information.
Compensated Absences
The total compensated absences liability for the City is $30,429, which comprises of liabilities from two internal service funds: Employee Benefits Fund and Retiree Health Savings Plan Benefits Fund.
The City records the expense and liability for its employees’ earned but unused accumulated vacation and overtime in the Employee Benefits Fund. As of June 30, 2019, the liability is $15,476, and the City has $17,405 available in cash dedicated to this liability in the fund.
The City also provides sick leave conversion benefits through the Retiree Health Savings Plan (RHSP). Employees earn one day of sick leave per month and the unused sick leave hours are converted to a dollar amount and deposited in the employee’s RHSP account at retirement or termination with 15 or 20 years of City service, based on the memoranda of understanding agreements between the City and the unions. The account is used to pay healthcare premiums for the retiree and beneficiaries. After the account is exhausted, the retirees can terminate coverage or elect to continue paying from personal funds. The sick leave conversion rates range from $.022 to $0.031 for each hour of sick leave balance, based on the memoranda of understanding agreements between the City and the unions. The sick leave conversions related expense and liability are recorded in the Retiree Health Savings Plan Benefits Fund. As of June 30, 2019, the actuarial accrued liability is $14,953, and the City has $17,621 available in cash dedicated to this liability in the Fund. The actuarial accrued liability of June 30, 2019 is estimated based on most recent actuarial valuation report dated June 30, 2017, and the actual benefit payments made in FY 2017-18 and FY 2018-19, assuming no gains/losses and no changes in methods or assumption. For the governmental activities, compensated absences are primarily liquidated by the respective internal service funds. Other Post Employment Benefits (OPEB)
The City’s defined benefit OPEB plan, City of Glendale Retiree Benefits Plan (Plan), provides OPEB for all permanent full-time general and public safety employees of the City. The Plan is a single-employer defined benefit OPEB plan administered by the City and governed by the City Council. No assets are accumulated in a trust that meets the criteria in paragraph 4 of GASB Statement No. 75. See Note 9 for more information. Unearned Revenue
The unearned revenue liability reports amounts received in advance of providing goods or services. When the goods or services are provided, this account balance is reduced, and revenue is recognized.
Property Held for Resale
Land and buildings acquired for future sale to developers have been capitalized and are shown as real property held for resale in the accompanying financial statements. Property held for resale is carried at the lower of cost or net realizable value (realizable value less cost to sell).
49

CITY OF GLENDALE Notes to the Basic Financial Statements Fiscal Year Ended June 30, 2019 (in thousands) Fund Balance
Fund balance classifications for governmental fund types comprise a hierarchy based primarily on the extent to which a government is bound to observe constraints imposed upon the use of the resources reported in governmental funds. In the fund financial statements, the governmental funds may report nonspendable, restricted, committed, assigned, and unassigned fund balances to show the level of constraint governing the use of the funds.
Nonspendable fund balances cannot be spent because they are in a nonspendable form, or are required to
be maintained intact.
Restricted fund balances are restricted for specific purposes by third parties or enabling legislation.
Committed fund balances include amounts that can be used only for specific purposes determined by the formal action through a resolution of the City Council, as they are the highest level of decision-making authority. Council must have at least a 3 to 2 vote to pass a resolution for the specific purpose. These committed amounts cannot be used for any other purpose unless the City Council removes or changes the specified use through the same type of formal action taken to establish the commitment.
Assigned fund balances comprise amounts intended to be used by the City for specific purposes but are not
restricted or committed. The City Council, in the City’s most recently adopted budget resolutions, has delegated the authority to assign fund balances to the City Manager or his/her designee. The financial policies of the City are also updated to reflect this delegation of authority.
Unassigned fund balances are residual positive net resources of the General Fund in excess of what can
properly be classified in one of the other four categories and include all deficit amounts in all other governmental funds.
When both restricted and unrestricted resources are available for an incurred expenditure, it is the City's policy to spend restricted resources first then unrestricted resources as necessary. When unrestricted resources are available for incurred expenditures, it is the City's policy to use committed amounts first, followed by assigned amounts, and then unassigned amounts. Net Position
The net position represents the difference between assets and deferred outflows of resources, and liabilities and deferred inflows of resources. Net investment in capital assets, consists of capital assets, net of accumulated depreciation, and deferred outflows of resources, and is reduced by the outstanding balances of any borrowings used for the acquisition, construction, or improvement of those assets, excluding unspent debt proceeds. The net position is reported as restricted when there are limitations imposed on its use either through the enabling legislation externally adopted by the citizens of the City or through external restrictions imposed by creditors, grantors, or laws and regulations of other governments.
When both restricted and unrestricted resources are available for use, it is the City’s policy to use restricted resources first, then the unrestricted resources as they are needed. The government-wide statement of net position reports $181,423 of restricted net position, of which $61,284 is restricted by enabling legislation. The City Charter Article XI Section 15 requires $30,769 in restricted net position to be set aside to meet the legal demands against the treasury during the beginning of the new budget period prior to the receipt of ad valorem taxes. Pursuant to redevelopment laws of the State of California, $30,515 is restricted for low and moderate housing.
50

CITY OF GLENDALE Notes to the Basic Financial Statements Fiscal Year Ended June 30, 2019 (in thousands) Deferred Outflows and Inflows of Resources
In addition to assets, the statements of net position report a separate section for deferred outflows of resources. This separate financial statement element represents a consumption of net position that applies to a future period and will not be recognized as an outflow of resources or expenses until then. For current or advance refunding resulting in defeasance of debt, the difference between the reacquisition price and the net carrying amount of the old debts (i.e., deferred charges) is reported as a deferred outflow of resources and amortized to interest expense based on the effective interest method over the remaining life of the old debt or the life of the new debt, whichever is shorter. When the City makes the pension contributions and OPEB payments after the measurement date, the City reports deferred outflows of resources. When there is an increase in pension expense arising from the recognition of change in assumptions and of differences between projected and actual earnings on pension plan investments, the City reports a deferred outflow of resources until the increase is recognized in expense. The City’s deferred outflows of resources as of June 30, 2019 is $107,026, which consists of $4,335 loss on refunding, $102,215 related to pensions and $476 related to OPEB.
In addition to liabilities, the statement of net position and the governmental fund financial statements report a separate section for deferred inflows of resources. This separate financial statement element represents an acquisition of net position that applies to a future period and will not be recognized as an inflow of resources or revenues until then. When there is a decrease in pension and OPEB expense arising from the recognition of changes in assumptions and of differences between expected and actual experience, the City reports a deferred inflow of resources until the decrease is recognized in expense. The City’s deferred inflows of resources as of June 30, 2019 is $21,028, which consists of $19,079 related to pensions and $1,949 related to OPEB. When a receivable is recorded in governmental fund financial statements but the revenue is not available, the City reports a deferred inflow of resources until the revenue becomes available. The City has recorded deferred inflows of resources – unavailable revenues of $13,657 in the General Fund, $153 in the Housing Assistance Fund, and $7,241 in the nonmajor governmental funds. NOTE 2 – STEWARDSHIP, COMPLIANCE, AND ACCOUNTABILITY
Budgets and Budgetary Accounting
The City Council is required to adopt an annual budget for the general, debt service, special revenue, enterprise, and internal service fund types. The City Council annually adopts the capital improvement program for the capital projects funds. The City of Glendale budget presents the Capital Improvement Projects on a ten-year plan basis, with the "Future Years" column representing a cumulative five-year projection. The City Council only approves and authorizes one year of the Capital Improvement Projects. Unspent Capital Improvement Projects in the prior years’ budget is carried forward into the new fiscal year. Therefore, an annual budget comparison on multi-year projects is impractical. All proprietary fund types are accounted for on a cost of service method (net income); therefore, budget comparisons are impractical. Also, the City is not legally mandated to report the results of operations for these enterprise and internal service fund types on a budget comparison basis, and so budgetary data related to these funds have not been presented.
The City utilizes an “encumbrance system.” Under this procedure, encumbrance accounting is used to the extent necessary to assure effective budgetary control and accountability and to facilitate effective cash planning and control. Encumbrances outstanding at year-end do not constitute expenditures or liabilities and appropriations in the General Fund lapse at the end of the year. Therefore, encumbrances are not reserved for commitments made, and budget carryovers may be submitted for the remaining encumbrance. All commitments incurred in the General Fund will be paid with the new budget and approved budget carryovers in the following year, and open capital project appropriations carry over to the next year.
51

CITY OF GLENDALE Notes to the Basic Financial Statements Fiscal Year Ended June 30, 2019 (in thousands) The City, in establishing the budgetary data reflected in the basic financial statements and supplementary information, utilizes the following procedures:
The City Charter requires that the City Manager submits to the City Council a proposed budget for the
coming year on or before June 1st. The operating budget includes both the sources and types of funds for the proposed expenditures.
In May or June, a public hearing is conducted to obtain citizen input, with the final budget being adopted no
later than July 1st.
The budget is amended during the fiscal year to reflect all transfers and amendments.
The level of appropriated budgetary control is at the fund level except for the General Fund, which is at the department level. The appropriation may exist across different categories including, salary and fringe benefits, maintenance and operation, and capital outlay. There is no limit as to how much can be shifted between categories as long as the total appropriation does not exceed what Council approved at the department level for General Fund and the fund level for all other funds.
The following funds over expended their appropriations as of June 30, 2019:
Funds
Amounts Over Expended
Filming Fund $ 1,426 Recreation Fund 1,116 Fire Mutual Aid Fund 759 Police Building Project Debt Service Fund 15,496 Police Building 2019 Lease Revenue Refunding Bonds Fund 357
Filming Fund and Recreation Fund were closed in FY 2018-19, and the remaining fund balances were transferred to the General Fund.
Police Building Project Debt Service Fund was closed in FY 2018-19, and the remaining fund balance was transferred to the Police Building 2019 Lease Revenue Refunding Bonds Fund.
Police Building 2019 Lease Revenue Refunding Bonds Fund incurred a bond issuance cost of $357 in FY 2018-19.
NOTE 3 – CASH AND INVESTMENTS
Governmental and business-type activities:
Cash and investments as of June 30, 2019 consist of the following:
Investments $ 867,778 Cash and investments with fiscal agents 8,896 876,674 Cash held in financial institutions 47,228 Total $ 923,902
52

CITY OF GLENDALE Notes to the Basic Financial Statements Fiscal Year Ended June 30, 2019 (in thousands) The following amounts are reflected in the government-wide statement of net position:
Pooled cash and investments $ 706,043 Restricted cash and investments 72,198 Cash and investments with fiscal agents 8,896 Investment – gas/electric commodity 1,365 Designated cash and investments 135,400 Total $ 923,902
Authorized Investments Allowable investments for the portfolio of the City of Glendale are limited by California State Government Code Sections 53600 et seq. They are further restricted by the City Treasurer’s investment strategy. Percentages of Investment Participation and percentages of Maximum Participation apply at the time of purchase. Purchase transactions may not exceed $10,000, nor exceed five-year maturities. Exceptions can only be approved by the City Council. The City Treasurer may invest or deposit in the following types of investments:
Maximum Maturity
Maximum Investment
Participation
Maximum Investment Exposure
U.S. Treasury Notes 5 years 100% None Federal Agencies Securities 5 years 100% None State of California and California Local Agencies N/A 15% 5% per issuer Obligation of Other States N/A 10% 5% per issuer Medium Term Notes 5 years 30% 5% per issuer Commercial Paper (A1, P1, F1 min. rating) 270 days 25% 10% per issuer Bankers’ Acceptances (A1, P1, F1 min. rating) 180 days 30% 10% per bank Time Deposits (FDIC Insured) 1 year 10% 5% per issuer Negotiable Certificates of Deposit (A1, P1, F1 min. rating)
1 year 30% 5% per issuer
Local Agency Investment Fund (State Pool) N/A LAIF maximum ($65 MM per
account)
None
Money Market Mutual Funds 90 days 20% 10% per mutual fund
Los Angeles County Treasury Pool N/A 10% None Investments Authorized by Debt Agreements
The provisions of debt agreements, rather than the general provisions of the California Government Code or the City’s investment policy, govern investments of debt proceeds and reserve funds held by fiscal bond agents. Permitted investments are specified in related trust agreements.
No maximum percentage of the related debt issue or maximum investment in one issuer is specified.
53
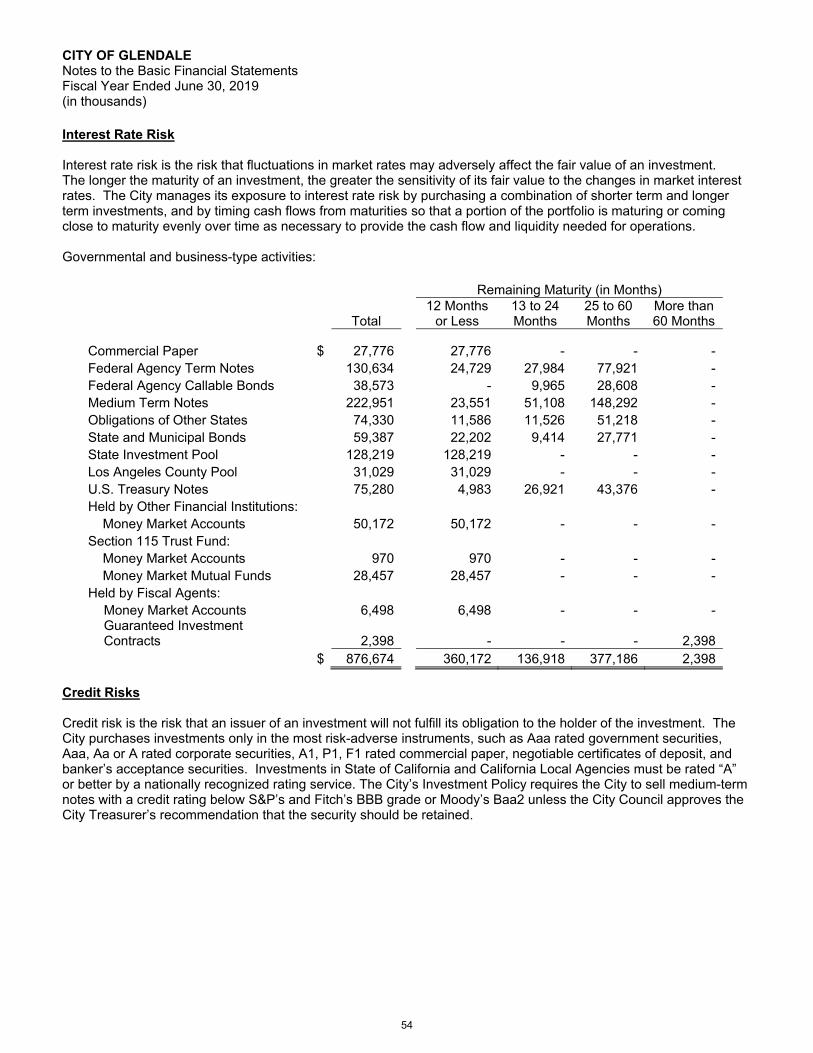
CITY OF GLENDALE Notes to the Basic Financial Statements Fiscal Year Ended June 30, 2019 (in thousands) Interest Rate Risk
Interest rate risk is the risk that fluctuations in market rates may adversely affect the fair value of an investment. The longer the maturity of an investment, the greater the sensitivity of its fair value to the changes in market interest rates. The City manages its exposure to interest rate risk by purchasing a combination of shorter term and longer term investments, and by timing cash flows from maturities so that a portion of the portfolio is maturing or coming close to maturity evenly over time as necessary to provide the cash flow and liquidity needed for operations. Governmental and business-type activities:
Remaining Maturity (in Months)
Total 12 Months
or Less 13 to 24 Months
25 to 60 Months
More than 60 Months
Commercial Paper $ 27,776
27,776 - - - Federal Agency Term Notes 130,634 24,729 27,984 77,921 - Federal Agency Callable Bonds 38,573 - 9,965 28,608 - Medium Term Notes 222,951 23,551 51,108 148,292 - Obligations of Other States 74,330 11,586 11,526 51,218 - State and Municipal Bonds 59,387 22,202 9,414 27,771 - State Investment Pool 128,219 128,219 - - - Los Angeles County Pool 31,029 31,029 - - - U.S. Treasury Notes 75,280 4,983 26,921 43,376 - Held by Other Financial Institutions: Money Market Accounts 50,172 50,172 - - - Section 115 Trust Fund: Money Market Accounts 970 970 - - - Money Market Mutual Funds 28,457 28,457 - - - Held by Fiscal Agents: Money Market Accounts 6,498 6,498 - - -
Guaranteed Investment Contracts 2,398
- - - 2,398
$ 876,674 360,172 136,918 377,186 2,398 Credit Risks
Credit risk is the risk that an issuer of an investment will not fulfill its obligation to the holder of the investment. The City purchases investments only in the most risk-adverse instruments, such as Aaa rated government securities, Aaa, Aa or A rated corporate securities, A1, P1, F1 rated commercial paper, negotiable certificates of deposit, and banker’s acceptance securities. Investments in State of California and California Local Agencies must be rated “A” or better by a nationally recognized rating service. The City’s Investment Policy requires the City to sell medium-term notes with a credit rating below S&P’s and Fitch’s BBB grade or Moody’s Baa2 unless the City Council approves the City Treasurer’s recommendation that the security should be retained.
54

CITY OF GLENDALE Notes to the Basic Financial Statements Fiscal Year Ended June 30, 2019 (in thousands) Governmental and business-type activities:
Moody’s Rating as of June 30, 2019
Total A1 A2 Aa1 Aa2 Aa3 Aaa P1 Unrated
Commercial Paper $ 27,776 - - - - - - 27,776 - Federal Agency Term Notes 130,634 - - - - - 130,634 - - Federal Agency Callable Bonds 38,573 - - - - - 38,573 - - Medium Term Notes 222,951 9,225 9,008 33,185 67,037 31,907 62,601 - 9,988 Obligations of Other States 74,330 - - 25,543 8,744 - 12,094 - 27,949 State and Municipal Bonds 59,387 - 1,272 - 9,084 15,168 483 - 33,380 State Investment Pool 128,219 - - - - - - - 128,219 Los Angeles County Pool 31,029 - - - - - - - 31,029 U.S. Treasury Notes 75,280 - - - - - 75,280 - - Held by Other Financial Institutions: Money Market Accounts 50,172 - - - - - 40,000 - 10,172 Section 115 Trust Fund: Money Market Accounts 970 - - - - - - - 970 Money Market Mutual Funds 28,457 - - - - - - - 28,457 Held by Fiscal Agents: Money Market Accounts 6,498 - - - - - 6,498 - - Guaranteed Investment Contracts 2,398 - - - - - - - 2,398
$ 876,674 9,225 10,280 58,728 84,865 47,075 366,163 27,776 272,562
Concentration Risk
The investment policy of the City limits the amounts that may be invested in any one issuer to 5%, 10% per bank for bankers’ acceptances, 10% per issuer for commercial paper, or 10% per fund for money market mutual fund. This limit excludes investments in U.S. treasury securities, federal agencies securities, Local Agency Investment Fund and Los Angeles County Pool. Investments in any one issuer that represent 5% or more of total City investments are as follows:
Issuer
Investment Type Reported Amount
FHLB Federal Agency Callable Bonds $ 15,002 Federal Agency Term Notes 93,114 Total $ 108,116
Custodial Credit Risk
Custodial credit risk for deposits is the risk that in the event of the failure of a depository financial institution, a government agency will not be able to recover its deposits or will not be able to recover investment securities that are in possession of an outside party. All of a depositor’s accounts at an insured depository institution, including non-interest-bearing transaction accounts, will be insured by the FDIC up to the standard maximum deposit insurance amount of $250 for each deposit insurance ownership category. The amounts of deposits are collateralized under California law. The Code requires that a financial institution secures deposits made by state or local governmental units by pledging securities in an undivided collateral pool held by a depository regulated under state law unless waived by the governmental unit.
55

CITY OF GLENDALE Notes to the Basic Financial Statements Fiscal Year Ended June 30, 2019 (in thousands) The custodial risk for investments is also twofold. An investment trade transaction occurs between a government agency and counterparty, such as a broker or a dealer. Counterparty risk is the risk that in the event of the failure of a brokerage or dealer to deliver securities after government agency has made payment. The City of Glendale prevents counterparty risk by requiring all trade transactions to be done on a delivery versus payment arrangement.
A government agency uses an independent third-party custodian or safe-keeper to domicile the securities in its portfolio. The City of Glendale uses Bank of America as its third-party safekeeping servicer, and prevents custodial or safekeeping risk by having all securities purchased and owned by the City of Glendale registered in the name of the City, separated from other client securities portfolios, and segregated from securities owned by the bank.
Investment in State Investment Pool
The City is a voluntary participant in the Local Agency Investment Fund (LAIF) that is regulated by California Government Code Section 16429 under the oversight of the Treasurer of the State of California. The City’s investment in this pool is reported in the accompanying financial statements at fair value based upon the City’s pro-rata share of the amortized cost basis provided by LAIF for the entire LAIF portfolio, in relation to the amortized cost of that portfolio. The balance available for withdrawal is based on the accounting records maintained by LAIF. LAIF is not registered with the Securities and Exchange Commission (SEC) and is not rated.
Investment in Los Angeles County Pool
The City is a voluntary participant in the Los Angeles County Pooled Investment Fund (LACPIF) that is regulated by California Government Code Section 27136 and managed by the Los Angeles County Treasurer. The City’s investment in this Pool is reported in the accompanying financial statements of net position and prepared using the accrual basis of accounting. Investments are reported at fair value. The cash flow needs of the participants are monitored daily to ensure that sufficient liquidity is maintained to meet the needs of participants. The balance available for withdrawal is based on the accounting records maintained by LACPIF. LACPIF is not registered with the Securities and Exchange Commission (SEC) and is not rated. Investment in Internal Revenue Code Section 115 Trust Fund The City reviewed the City’s obligation to fund the pension obligations and determined that it served the City’s interests to prefund those benefits. In July 2017, the City Council approved and adopted the funding for a Pension Rate Stabilization Program IRC Section 115 Trust. The Pension Stabilization Trust is a tax-qualified irrevocable trust, organized under Internal Revenue Code (IRC) Section 115, established to pre-fund pension obligations. The Plan Discretionary Trustee is U.S. Bank and U.S. Bank has delegated investment management responsibilities to High Mark Capital Management, and Public Agencies Retirement Services (PARS) is the Trust Administrator. The City elected the ‘Moderately Conservative HighMark Plus’ investment approach with a blended investment objective strategy. The primary objective is to provide current income with capital appreciation as secondary objective. The Plan’s target rate of return is 5 percent. The asset target allocations for this objective are 3% cash source, 50% equity and 47% fixed income. The City’s Section 115 trust fund account is reported as restricted assets and fund balance in the General Fund. The value of the trust as of June 30, 2019 was $29,426 of which all was placed in cash, money market and money market mutual fund accounts. Fair Value Measurement
The City categorizes its fair value measurements within the fair value hierarchy established by generally accepted accounting principles. The hierarchy is based on the valuation inputs used to measure the fair value of the asset. The hierarchy gives the highest priority to unadjusted quoted prices in active markets for identical assets or liabilities (Level 1 measurements) and the lowest priority to unobservable inputs (Level 3 measurements). The three levels of the fair value hierarchy are described as follows:
56

CITY OF GLENDALE Notes to the Basic Financial Statements Fiscal Year Ended June 30, 2019 (in thousands) Level 1 – Inputs to the valuation methodology are unadjusted quoted prices for identical assets or liabilities in active markets that the City has the ability to access. Level 2 – Inputs to the valuation methodology include:
• Quoted prices for similar assets or liabilities in active markets; • Quoted prices for identical or similar assets or liabilities in inactive markets; • Inputs other than quoted prices that are observable for the asset or liability; • Inputs that are derived principally from or corroborated by observable market data by correlation
or other means.
Level 3 – Inputs to the valuation methodology are unobservable and significant to the fair value measurement. Unobservable inputs reflect the City’s own assumptions about the inputs market participants would use in pricing the asset or liability (including assumptions about risk). Unobservable inputs are developed based on the best information available in the circumstances and may include the City's own data.
The asset's level within the hierarchy is based on the lowest level of input that is significant to the fair value measurement. Valuation techniques used need to maximize the use of observable inputs and minimize the use of unobservable inputs. The determination of what constitutes observable requires judgment by the City's management. City management considers observable data to be that market data, which is readily available, regularly distributed or updated, reliable, and verifiable, not proprietary, and provided by multiple independent sources that are actively involved in the relevant market. The categorization of an investment within the hierarchy is based upon the relative observability of the inputs to its fair value measurement and does not necessarily correspond to City management's perceived risk of that investment.
In instances where inputs used to measure fair value fall into different levels in the above fair value hierarchy, fair value measurements in their entirety are categorized based on the lowest level input that is significant to the valuation. The City’s assessment of the significance of particular inputs to these fair value measurements requires judgment and considers factors specific to each asset or liability.
Deposits and withdrawals in governmental investment pools, such as LAIF and LACPIF are made on the basis of $1 and not fair value. Accordingly, the City’s proportionate share in these types of investments is an uncategorized input not defined as a Level 1, Level 2, or Level 3 input.
The following is a description of the valuation methods and assumptions used by the City to estimate the fair value of its investments. There have been no changes in the methods and assumptions used at June 30, 2019. The methods described may produce a fair value calculation that may not be indicative of net realizable value or reflective of future fair values. City management believes its valuation methods are appropriate and consistent with other market participants. The use of different methodologies or assumptions to determine the fair value of certain financial instruments could result in a different fair value measurement at the reporting date.
The City’s treasury pools asset market prices are derived from closing bid prices as of the last business day of the month as supplied by Interactive Data, Bloomberg or Telerate. Where prices are not available from generally recognized sources, the securities are priced using a yield-based matrix system to arrive at an estimated market value. Prices that fall between data points are interpolated. Non-negotiable FDIC-insured bank certificates of deposit are priced at par.
When available, quoted prices are used to determine fair value. When quoted prices in active markets are available, investments are classified within Level 1 of the fair value hierarchy.
For investments classified within Level 2 of the fair value hierarchy, the City's custodians generally uses a multi-dimensional relational model. Inputs to their pricing models are based on observable market inputs in active markets. The inputs to the pricing models are typically benchmark yields, reported trades, broker-dealer quotes, issuer spreads and benchmark securities, among others.
57

CITY OF GLENDALE Notes to the Basic Financial Statements Fiscal Year Ended June 30, 2019 (in thousands) The City does not have any investments that are measured using Level 3 inputs.
As of June 30, 2019, the City has the following fair value measurements:
Fair Value Measurements
Balance at June 30,
2019
Quoted Prices in Active
Markets for Identical Assets
(Level 1)
Significant Other
Observable Inputs
(Level 2)
Significant Unobservable
Inputs (Level 3)
Investments by fair value level: Commercial Paper $ 27,776 - 27,776 - Federal Agency Term Notes 130,634 - 130,634 - Federal Agency Callable Bonds 38,573 - 38,573 - Medium Term Notes 222,951 - 222,951 - Obligations of Other States 74,330 - 74,330 - State and Municipal Bonds 59,387 - 59,387 - U.S. Treasury Notes 75,280 - 75,280 - Section 115 Trust Fund: Money Market Mutual Funds 28,457 28,457 - -
Total investments by fair value level 657,388
28,457 628,931 - Investments measured at amortized costs or not subject to fair value hierarchy:
Los Angeles County Pool 31,029 State Investment Pool 128,219 Held by Other Financial Institutions: Money Market Accounts 50,172 Section 115 Trust Fund: Money Market Accounts 970 Held by Fiscal Agents: Guaranteed Investment Contracts 2,398 Money Market Accounts 6,498
Total investments measured at amortized costs or not subject to fair value hierarchy 219,286
$ 876,674
NOTE 4 – LOANS RECEIVABLE
Verdugo Fire Communications
The Verdugo Fire Communications Center (Verdugo Fire) is a regional dispatch center that was established by the cities of Burbank, Glendale, and Pasadena. Verdugo Fire received a grant in June 2011 to implement WestNet Inc.’s First-In Fire Station Alerting System. At the time of the grant purchase, all but four (City of Alhambra, City of Burbank, City of Montebello, and Burbank-Glendale-Pasadena Airport Authority) of Verdugo Fire’s dispatch agencies chose to buy into the WestNet Inc. station alerting system. Due to Verdugo Fire’s CAD upgrade project, the technology needed to connect the fire station alerting systems in each of Verdugo Fire’s agencies will change and the four agencies need to implement a fire station alerting system to be compatible with Verdugo Fire. City of
58

CITY OF GLENDALE Notes to the Basic Financial Statements Fiscal Year Ended June 30, 2019 (in thousands) Montebello upgraded to use WestNet Inc’s station alerting system. Three Agencies (City of Alhambra, City of Burbank, and Burbank-Glendale-Pasadena Airport Authority), however, elected to purchase the Phoenix G2 Fire Station Alerting System from US Digital Designs Inc. (USDD). As Verdugo Fire currently does not use USDD’s fire station alerting system, Verdugo Fire procured the necessary hardware and software from USDD and Northrop Grumman’s interface to be able to connect to the three Agencies. As it was the decision of the three Agencies to use USDD’s fire station alerting solution and not the solution Verdugo Fire already has in place for its other agencies, it was agreed upon by the Tri-City Fire Chief’s and each of the three Agencies, that Verdugo Fire would only be responsible for a portion of the cost of the USDD equipment and Northrop Grumman’s interface needed in the dispatch center to connect to the three Agencies’ respective fire stations. In May 2019, Verdugo Fire executed a loan agreement with the City of Alhambra, City of Burbank, and Burbank-Glendale-Pasadena Airport Authority for the purchase of USDD’s station alerting system. The loan receivable amount was estimated to be $46, with agreed upon terms of no loan fee or accruing interest, and is required to be repaid within the first quarter of Fiscal Year 2019-20. As of June 30, 2019, the loan receivable is $25. Successor Agency
In February 2012, the Dissolution Act (Assembly Bill x1 26; amended by AB 1484 in June 2012 and SB 107 in September 2015) dissolved California redevelopment agencies and directed their wind-down activities. In Glendale, the City chose to serve as the Glendale Successor Agency (“Agency”). This action impacted the reporting entity of the City of Glendale that had previously reported the redevelopment agency within it and as a blended component unit. Commencing on February 1, 2012, the assets and activities of the dissolved redevelopment agency were reported in a fiduciary fund (private-purpose trust fund) in the financial statements of the City. The transfer of the assets and liabilities of the former redevelopment agency from governmental funds of the City to the fiduciary fund was reported in the governmental funds as an extraordinary loss (gain) in its financial statements. The receipt of these assets and liabilities as of January 31, 2012 was reported in the private-purpose trust fund as an extraordinary gain (or loss).
Since February 2012, the Agency has completed a series of reports, audits and reviews, and approvals with approval from the Oversight Board and state Department of Finance (“DOF”). These have included two detailed Due Diligence Reviews to determine unobligated fund balances available for transfer to the affected taxing entities. Once the excess funds were distributed to the taxing entities, Glendale received a Finding of Completion (FOC) in May 2013. Following the FOC, Glendale needed to address its real property assets. Thus, Glendale prepared a Long Range Property Management Plan (LRPMP) which was approved by DOF on April 16, 2014. On May 24, 2016, the DOF approved a revision to Glendale’s LRPMP to reflect the property at 300 E. Broadway as government use.
With the passage of Senate Bill 107, the requirement to prepare biannual payment schedules known as Recognized Obligation Payment Schedules (ROPS) was replaced with an annual ROPS.
As of June 30, 2019, the reinstated loan amount is $13,554, which includes $323 of interest accrued in FY 2018-19. Housing
The Housing Authority has offered various housing loans to the residents of the City to create and maintain affordable housing for low and moderate income households. Four different types of housing loans are currently or were formerly funded from Community Development Block Grant (CDBG grant), HOME grant, Low and Moderate Income Housing Asset Fund (LMIHA) program income, and Building Equity and Growth in Neighborhoods Grant (BEGIN grant) funds. Certain Housing Authority loans will be forgiven or restructured when all requirements are met. Because of the uncertainty of collectability, the City has established a policy not to record forgivable and contingent loans on the financial statements. The non-forgivable loans are recorded on the financial statements.
59

CITY OF GLENDALE Notes to the Basic Financial Statements Fiscal Year Ended June 30, 2019 (in thousands) • Single Family Home Rehabilitation Loan
The program was funded by the CDBG grant, HOME grant, and LMIHA. It provided funds for moderate rehabilitation of owner-occupied homes for low and moderate income households. The deferred payment loan is interest-bearing with simple interest rates ranging from 0% to 4% annually for up to 10 years, and with a loan amount up to $25. Generally, the loan is repaid at the time of sale or transfer of the property and is secured by a deed of trust on the property. This program was eliminated in February 2012; however, there are existing loans receivable. As of June 30, 2019, $1,511 is outstanding, which is recorded in governmental activities in the government-wide financial statement.
• First Time Home Buyer Loan
The program is funded by the HOME grant, LMIHA, and BEGIN grant, and has two categories.
Down Payment Assistance – Resale Homes Purchase. The program provided funds for down payment and affordability gap assistance for the purchase of a resale home by a low or moderate income first time home buyer household. Loan terms varied from 30 to 45 years and required either a 5% simple annual interest rate paid monthly, or a 0% simple annual interest rate with no monthly payments. All loans are second mortgage deferred payment and forgivable up to $75. If the property is sold, transferred, or no longer owner-occupied before the term expires, the borrower must repay the original principal amount plus an appreciation share. This program was eliminated in February 2012; however, there are existing loans receivable. As of June 30, 2019, $3,018 is outstanding. As of June 30, 2019, the non-forgivable amount is $0.
Down Payment Assistance – New Construction Homes Purchase. For new construction units, the amount of the loan is based on the amount of the affordability gap. The loan is secured by a deed of trust on the property and affordable housing covenants. Loans fall into two types. One type is the deferred payment forgivable loan with a loan term of 30 to 45 years; the loan is forgiven at the end of the loan term. If the property is sold, transferred, or no longer owner-occupied before the term expires, the borrower must repay the original principal amount plus an appreciation share. A small set of loans funded through the American Dream Down Payment Assistance Program are forgiven at a set percentage of the principal amount each year. A second type of loan is a deferred payment loan with resale restrictions. This includes the most recent HOME funded loans that are subject to resale restrictions and must be resold to low-income home buyers if sold before the end of the term. As of June 30, 2019, the forgivable loan amount at the end of the term is $4,110, and is not recorded on the financial statements. The Doran Gardens project loans funded through the BEGIN grant are deferred loans and are to be repaid at the end of the 30-year term. As of June 30, 2019, the non-forgivable amount is $5,591 and is recorded in governmental activities in the government-wide financial statement.
• New Construction and Acquisition/Rehabilitation Rental Development Loan
The program is funded by the HOME grant and LMIHA and provides funds for new construction, acquisition or rehabilitation of affordable rental housing. Loan terms and loan underwriting requirements are negotiated with the developer on a project-by-project basis. The loan is secured by a deed of trust and affordable housing covenants on the property. Loans provide gap assistance to make housing units affordable to low and moderate income households, and units must be rented at an affordable rent. Leveraging of funds with other sources and contribution of developer equity is required. Loans may be second mortgage deferred payment loans, which require loan principal plus interest to be repaid at the end of the loan term, and residual receipt payments are required on some deferred loans. Also, loans may be permanent financing first mortgage loans at below-market interest rates, and monthly amortized payments are required. Such loans would be provided when credit conditions or loan costs are not feasible for the project. As of June 30, 2019, the amount of forgivable or contingent loans is $97,972, which is not recorded on the financial statements.
60

CITY OF GLENDALE Notes to the Basic Financial Statements Fiscal Year Ended June 30, 2019 (in thousands) NOTE 5 – INTERFUND TRANSACTIONS
The composition of interfund balances consists of due to/from other funds, advances to/from other funds, and transfers. Due to/from other funds are temporary cash overdrafts between funds. Advances to/from other funds represent an interfund loan extending beyond one year and some advances are formal lending agreements between funds. Due to/from other funds as of June 30, 2019 consist of the following:
Due to General Fund from: Nonmajor governmental funds $ 4,587 Internal service funds 196 Total $ 4,783
The City reports transfers between many of its funds. The sum of all transfers presented in the following table agrees with the sum of interfund transfers presented in the government-wide, governmental and proprietary fund financial statements. Transfers are used to (1) subsidize the activities of other funds and (2) move revenues from the fund that budget requires to collect them to the fund that budget requires to expend them.
Amount Purpose Transfers to General Fund from: Electric Fund $ 19,022 Fund General Fund operations per Charter Refuse Disposal Fund 1,150 Fund General Fund operations Filming Fund 1,455 Close Filming Fund to General Fund Recreation Fund 3,875 Close Recreation Fund to General Fund 25,502 Transfers to Capital Improvement Fund from: General Fund 6,526 Fund capital improvement projects Transfers to nonmajor governmental funds from: General Fund 2,008 20% of City GSA loan payment General Fund 85 Nutritional Meals Grant matching General Fund 1,000 Fund Police Building Project debt service Capital Improvement Fund 4,560 Fund Scholl Canyon Landfill reserve
Police Building Project Debt Service Fund 15,372
Close Police Building Project Debt Service Fund to Police Building 2019 Lease Revenue Refunding Bonds Fund
23,025 Transfers to Internal Service Funds from: Unemployment Insurance Fund 700 Fund Compensation Insurance Fund Dental Insurance Fund 600 Fund Medical Insurance Fund Vision Insurance Fund 250 Fund Medical Insurance Fund 1,550 Total Interfund Transfers $ 56,603 Special item - Transfer of bond proceeds from:
Successor Agency Private Purpose Trust Fund $ 8,691
Transfer of 2011 Tax Allocation Bond proceeds (housing portion)
Successor Agency Private Purpose Trust Fund 1,976 Transfer of 2011 Tax Allocation Bond
proceeds (non-housing portion)
$ 10,667
61

CITY OF GLENDALE Notes to the Basic Financial Statements Fiscal Year Ended June 30, 2019 (in thousands) NOTE 6 – CAPITAL ASSETS Capital asset for Governmental activities for the year ended June 30, 2019 was as follows:
Balance at
July 1 Increases Decreases Reclass Balance at June 30*
Capital assets, not being depreciated: Land $ 421,820 1,084 - - 422,904 Construction in progress 36,618 17,114 - (9,390) 44,342 Total assets not being depreciated 458,438 18,198 - (9,390) 467,246 Depreciable capital assets: Building and improvements 413,511 2,120 - 3,479 419,110 Machinery and equipment 127,430 6,784 (1,426) 51 132,839 Infrastructure 325,498 1,682 (347) 600 327,433 Total other capital assets at cost 866,439 10,586 (1,773) 4,130 879,382
Amortizable intangible assets: Intangible assets 1,001 718 - 5,260 6,979**
Less accumulated depreciation: Building and improvements 169,752 10,726 - - 180,478 Machinery and equipment 87,450 6,429 (1,426) - 92,453 Infrastructure 109,814 8,361 (347) - 117,828 Total accumulated depreciation 367,016 25,516 (1,773) - 390,759 Less amortization: Intangible assets 29 379 - - 408
Total assets being depreciated and amortized, net 500,395 (14,591) - 9,390 495,194
Governmental activities capital assets, net $ 958,833 3,607 - - 962,440 *$61,441 and $69,926 of buildings, improvements, machinery, equipment, construction in progress and intangible assets for FY2018 and FY2019 respectively from internal service funds are included in governmental activities. $30,472 and $33,387 of accumulated depreciation and amortization for FY2018 and FY2019 respectively from internal service funds are included in governmental activities. **$6,979 of intangible assets is software. Depreciation and amortization expense was charged to functions of the City’s governmental activities for the year ended June 30, 2019 as follows:
Depreciation and amortization General Government $ 2,422 Police 2,211 Fire 861 Public Works 15,341 Parks, Recreation and Community Services 2,888 Library 1,184 Housing, Health and Community Development 988 Total depreciation and amortization expense $ 25,895
62

CITY OF GLENDALE Notes to the Basic Financial Statements Fiscal Year Ended June 30, 2019 (in thousands) Capital asset for Business-type activities for the year ended June 30, 2019 was as follows:
Balance at July 1 Increases Decreases Reclass
Balance at June 30
Capital assets, not being depreciated: Land $ 9,557 - - - 9,557 Construction in progress 60,827 8,508 - (5,077) 64,258
Total assets not being depreciated 70,384 8,508 - (5,077) 73,815
Depreciable capital assets: Building and improvements 276,064 1,547 - 679 278,290 Machinery and equipment 583,019 4,044 (3,221) 2,386 586,228 Infrastructure 156,433 - - 2,012 158,445
Total other capital assets at cost 1,015,516 5,591 (3,221) 5,077 1,022,963
Depletable capital assets: Natural gas reserve 22,150 11 - - 22,161
Amortizable intangible assets: Intangible assets 105,661 4,075 - - 109,736
Less accumulated depreciation: Building and improvements 105,052 6,041 - - 111,093 Machinery and equipment 350,719 26,620 (3,221) - 374,118 Infrastructure 55,679 3,535 - - 59,214 Total accumulated depreciation 511,450 36,196 (3,221) - 544,425
Less accumulated natural gas depletion: Natural gas reserve 11,025 1,014 - - 12,039
Less amortization: Intangible assets 49,496 2,774 - - 52,270
Total assets being depreciated, depleted, and amortized, net 571,356 (30,307) - 5,077 546,126
Business-type activities capital assets, net $ 641,740 (21,799) - - 619,941
Depreciation, depletion and amortization expense was charged to functions of the City’s business-type activities for the year ended June 30, 2019 as follows:
Depreciation Sewer $ 3,079 Electric 24,845 Water 6,816 Refuse Disposal 1,324 Fire Communication 132 Total depreciation expense 36,196 Depletion - Electric 1,014 Amortization - Sewer 2,774 Total depreciation, depletion, and amortization expense $ 39,984
63
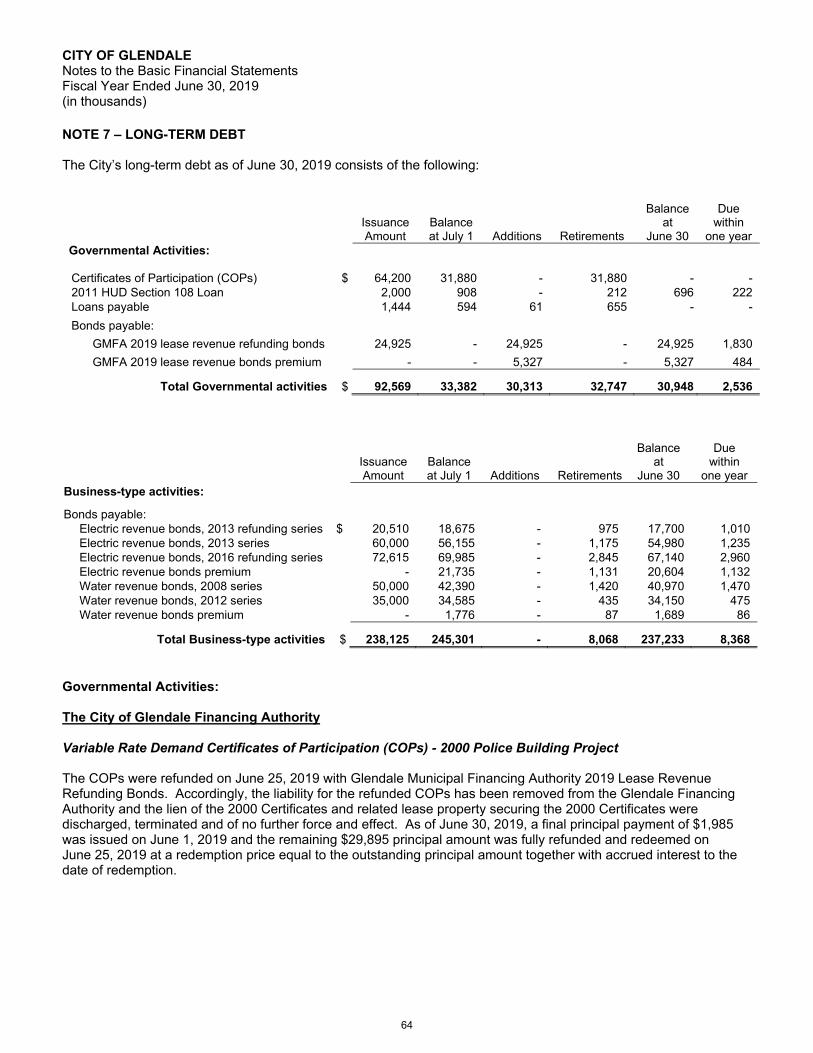
CITY OF GLENDALE Notes to the Basic Financial Statements Fiscal Year Ended June 30, 2019 (in thousands) NOTE 7 – LONG-TERM DEBT The City’s long-term debt as of June 30, 2019 consists of the following:
Issuance Amount
Balance at July 1 Additions Retirements
Balance at
June 30
Due within
one year Governmental Activities:
Certificates of Participation (COPs) $ 64,200 31,880 - 31,880 - - 2011 HUD Section 108 Loan 2,000 908 - 212 696 222 Loans payable 1,444 594 61 655 - -
Bonds payable:
GMFA 2019 lease revenue refunding bonds 24,925 - 24,925 - 24,925 1,830
GMFA 2019 lease revenue bonds premium - - 5,327 - 5,327 484
Total Governmental activities $ 92,569 33,382 30,313 32,747 30,948 2,536
Issuance Amount
Balance at July 1 Additions Retirements
Balance at
June 30
Due within
one year Business-type activities:
Bonds payable: Electric revenue bonds, 2013 refunding series $ 20,510 18,675 - 975 17,700 1,010 Electric revenue bonds, 2013 series 60,000 56,155 - 1,175 54,980 1,235 Electric revenue bonds, 2016 refunding series 72,615 69,985 - 2,845 67,140 2,960 Electric revenue bonds premium - 21,735 - 1,131 20,604 1,132 Water revenue bonds, 2008 series 50,000 42,390 - 1,420 40,970 1,470 Water revenue bonds, 2012 series 35,000 34,585 - 435 34,150 475 Water revenue bonds premium - 1,776 - 87 1,689 86
Total Business-type activities $ 238,125 245,301 - 8,068 237,233 8,368
Governmental Activities: The City of Glendale Financing Authority Variable Rate Demand Certificates of Participation (COPs) - 2000 Police Building Project The COPs were refunded on June 25, 2019 with Glendale Municipal Financing Authority 2019 Lease Revenue Refunding Bonds. Accordingly, the liability for the refunded COPs has been removed from the Glendale Financing Authority and the lien of the 2000 Certificates and related lease property securing the 2000 Certificates were discharged, terminated and of no further force and effect. As of June 30, 2019, a final principal payment of $1,985 was issued on June 1, 2019 and the remaining $29,895 principal amount was fully refunded and redeemed on June 25, 2019 at a redemption price equal to the outstanding principal amount together with accrued interest to the date of redemption.
64
CITY OF GLENDALE Notes to the Basic Financial Statements Fiscal Year Ended June 30, 2019 (in thousands) The City of Glendale Municipal Financing Authority Glendale Municipal Financing Authority (GMFA) 2019 Lease Revenue Refunding Bonds The GMFA 2019 Lease Revenue Refunding Bonds were issued pursuant to a resolution adopted by the City Council and Joint Exercise of Powers Agreement with the Glendale Housing Authority to establish the Glendale Municipal Financing Authority on April 9, 2019 and a resolution adopted by the City Council authorizing GMFA to issue bonds to refinance the City’s 2000 Variable Rate Certificates of Participation on April 16, 2019. The City of Glendale Municipal Financing Authority issued $24,925 in lease revenue bonds on June 25, 2019 to refinance the existing lease relating to the City’s outstanding Variable Rate Demand Certificates of Participation (2000 Police Building Project). The bond proceeds were deposited in an escrow account and were used to refund and redeem all of the outstanding COPs on June 25, 2019 at a redemption price equal to 100% of the principal amount plus accrued interest up to the redemption date. There was no difference between the reacquisition price of the refunding bonds and the net carrying amount of the refunded bonds. The refunding also resulted in cash flow savings of $3,710 which is the difference between the cash flows required to service the old COPs and the cash flows required to service the new 2019 bonds. The GMFA does not require the trustee to establish and maintain a reserve fund for the bonds. The bonds mature in regularly increasing amounts ranging from $1,830 to $2,850 annually from FY2019-20 to FY2029-30. The bonds are not subject to optional redemption prior to their respective stated maturities. The bonds are payable and secured from the revenues pledged under the Indenture of Trust, dated June 1, 2019. Pursuant to a Site Lease, dated June 1, 2019, by and between the GMFA and the City, the City has leased the Police building to GMFA. GMFA has subleased the Police building back to the City under the Lease Agreement, dated June 1, 2019, by and between the City and GMFA. The revenues consist primarily of lease payments to be made by the City under the terms of the Lease Agreement. The annual lease payments from the City are to be made at a rate sufficient to meet the debt service requirements of the outstanding bond indebtedness on the leased property. The bonds payable contain a provision that Glendale Municipal Financing Authority will not pledge to collateral any assets owned by the City, but the Lease Agreement permits the Glendale Municipal Financing Authority and its Trustee to take possession of and re-lease the Police Building in the event of a default by the City. The governmental activities bonds payable has no remedy of acceleration of any lease payments which has not come due and payable in accordance with the Lease Agreement. The governmental activities bonds payable contain an event of default that changes the timing of repayment of outstanding principal and interest to become immediately due if the City is unable to make payment. The City of Glendale Housing Authority HUD Section 108 Loan (Series 2011-A) Section 108 Loan of $2,000 was used to acquire and rehabilitate an Emergency Shelter and Homeless Access Center at 1948 Gardena Avenue, Glendale for the S.H. Ho Hope and Compassion Center, a non-profit organization. HUD administers the Section 108 Loan Guarantee program, and the program’s purpose is to fill funding gaps on major community / economic development projects throughout the country. The Section 108 Loan Guarantee program was created as part of the original Housing and Community Development Act of 1974. Section 108 obligations are permanently financed through underwritten public offerings. This was the City’s second time receiving a Section 108 loan. The City received the loan in November 2011. The term of the loan is ten years with an interest rate of 2.56% and the total interest is $210. The City has pledged current and future CDBG funds as principal security for the loan. The principal amounts range from $222 to $242 annually from FY 2019-20 to FY 2021-22. The Section 108 loan payment is budgeted as a CDBG project each year based on the payment schedule.
65
CITY OF GLENDALE Notes to the Basic Financial Statements Fiscal Year Ended June 30, 2019 (in thousands) The governmental activities HUD Section 108 guaranteed loan contain a provision that the City obtain as collateral a sole first priority lien on the real property S.H. Hope and Compassion Center used as a homeless shelter. The guaranteed loan also contains a subjective acceleration clause that allows the HUD Secretary to accelerate payment with respect to principal amount subject to optional redemption. The guaranteed loan contain an event of default that all rights, title and interest of the City in the loan shall vest immediately to HUD Secretary for use in making payment and changes the timing of repayment of outstanding amounts to become immediately due if the City is unable to make payment. The City of Glendale Loans Payable In December 2014, the City entered into an agreement with Modern Parking, Inc. (“Agreement”) for the procurement and installation of a modernized Parking Access and Revenue Control System (PARCS) for City-owned downtown parking garages. This PARCS replacement contains new automated vehicle exits, updated payment acceptance options (primarily credit card), more thorough auditing reports for improved revenue controls, and an updated camera and intercom system. The total cost of the equipment was $1,851 with an effective annual interest rate of 6.0%. Subject to the terms of the Agreement, once substantial completion has occurred, the City will pay Modern Parking the monthly amortization payment amount. The substantial completion occurred in November 2017. The City made a deposit of $406 upon execution of the “Agreement” and made total payments of $655 as of June 30, 2019. The outstanding balance of the loan agreement as of June 30, 2019 was $0 and fully paid. The City has outstanding long-term debt of $30,948 and has no direct borrowings and no direct placements related to governmental activities as of June 30, 2019. The City also has no outstanding or unused line of credit related to long-term debt of governmental activities as of June 30, 2019. Business-type Activities: Enterprise Fund – Electric utility Electric Revenue Bonds, 2013 Refunding Series The Electric utility of Glendale Water & Power issued $20,510 in revenue bonds in March 2013 to provide funds to refund all of the City’s outstanding Electric Revenue Bonds, 2003 Series and pay cost of issuance. The bond proceeds were deposited in an escrow account and were used to refund the Electric Revenue Bonds, 2003 Series through a legal defeasance. The current refunding resulted in the recognition of a deferred loss on refunding of $104 as of June 30, 2019, and is being amortized through FY 2031-32. The refunding also resulted in cash flow savings of $3,699 which is the difference between the cash flows required from the prior debt service and the cash flows required for the new refunding debt service. As of June 30, 2019, the reserve requirement of the bond issue is satisfied by a cash reserve fund with a minimum funding requirement of $4,649 on parity with other Electric revenue bonds. The 2013 Refunding Bonds mature in regularly increasing amounts ranging from $1,010 to $1,805 annually from FY 2019-20 to FY 2031-32. The 2013 Refunding Bonds has an optional redemption on and after February 1, 2024. Electric Revenue Bonds, 2013 Series The Electric utility of Glendale Water & Power issued $60,000 in revenue bonds in December 2013 to finance the costs of acquisition and construction of certain improvements to the City’s electric public utility including the rebuilding of Grandview substation and other reliability improvements to the distribution system. The terms of the 2013 Bonds indenture require the trustee to establish and maintain a parity reserve fund. The parity reserve fund means, as of any date on which it is calculated with respect to any issue of Parity Lien Bonds, the least
66
CITY OF GLENDALE Notes to the Basic Financial Statements Fiscal Year Ended June 30, 2019 (in thousands) of (a) 10% of the principal amount of said Parity Lien Bonds, (b) the maximum annual debt service for the current or any subsequent year on all Parity Lien Bonds or (c) 125% of the average annual debt service on all Parity Lien Bonds. As of June 30, 2019, the City has outstanding $17,700 aggregate principal amount of 2013 Refunding Bonds which is payable on parity with the outstanding $54,980 aggregate principal amount of 2013 Bonds. The 2013 Bonds mature in regularly increasing amounts ranging from $1,235 to $3,795 annually from FY 2019-20 to FY 2042-43. The 2013 Bonds has an optional redemption on and after February 1, 2024. The 2013 Bonds maturing on February 1, 2039 and February 1, 2043 are subject to mandatory sinking fund redemption from mandatory sinking account payments set aside in the Parity Obligation Payment Fund. Electric Revenue Bonds, 2016 Refunding Series The Electric utility of Glendale Water & Power issued $72,615 in revenue bonds in May 2016 to provide moneys for the refunding of all of the City’s outstanding Electric Revenue Bonds, 2006 Refunding Series, a portion of the City’s outstanding Electric Revenue Bonds, 2008 Series, and paying the costs of issuance of the 2016 Bonds. The bond proceeds were deposited in an escrow account and were used to refund the Electric Revenue Bonds, 2006 Refunding Series and a portion of the outstanding Electric Revenue Bonds, 2008 Series through a legal defeasance. The advance refunding resulted in the recognition of a deferred loss on refunding of $4,231 as of June 30, 2019, and is being amortized through FY 2037-38. The refunding also resulted in cash flow savings of $13,026 which is the difference between the cash flows required from the prior debt service and the cash flows required for the new refunding debt service. The terms of the 2016 Refunding Bonds indenture require the trustee to establish and maintain a parity reserve fund. The parity reserve fund means, as of any date on which it is calculated with respect to any issue of Parity Lien Bonds, the least of (a) 10% of the principal amount of said Parity Lien Bonds, (b) the maximum annual debt service for the current or any subsequent year on all Parity Lien Bonds or (c) 125% of the average annual debt service on all Parity Lien Bonds. As of June 30, 2019, the City has outstanding $17,700 aggregate principal amount of 2013 Refunding Bonds and outstanding $54,980 aggregate principal amount of 2013 Bonds which are payable on parity with the outstanding $67,140 aggregate principal amount of 2016 Refunding Bonds. The 2016 Refunding Bonds mature in regularly increasing amounts ranging from $2,700 to $4,715 annually from FY 2019-20 to FY 2037-38. The 2016 Refunding Bonds has an optional redemption on and after February 1, 2027. The 2016 Refunding Bonds maturing on February 1, 2038 are subject to mandatory sinking fund redemption from mandatory sinking account payments set aside in the Parity Obligation Payment Fund. The Electric utility has pledged future electric customer revenues, net of specified operating expenses, to pay the remaining total principal and interest on the Electric revenue bonds of $217,824 through FY 2042-43. The bonds are payable solely from Electric utility’s net income and is expected to require the net income to be at least equal to 1.10 times the amount of the annual debt services as it become due each fiscal year. The rates to be charged for services furnished by the Electric utility should incorporate the debt service requirements to provide revenues sufficient to pay, as the principal and interest become due. Total debt service paid and total net available revenues for debt service coverage for FY 2018-19 were $12,205 and $53,334, respectively. Enterprise Fund – Water utility Water Revenue Bonds, 2008 Series The Water utility of Glendale Water & Power issued $50,000 in revenue bonds in February 2008 to finance the costs of acquisition and construction of certain improvements to the City’s water public utility including Chevy Chase 968 reservoir and pump station replacement, Grandview pump station third unit upgrade, Verdugo-Metro pump station upgrade and main cleaning, lining and replacement projects. As of June 30, 2019, the reserve requirement of the bond issue is satisfied by a cash reserve fund with a minimum funding requirement of $2,889. The 2008 bonds mature in regularly increasing amounts ranging from $1,470 to $3,060 annually from FY 2019-20 to FY 2037-38.
67

CITY OF GLENDALE Notes to the Basic Financial Statements Fiscal Year Ended June 30, 2019 (in thousands) The 2008 Bonds has an optional redemption on and after February 1, 2019. The 2008 Bonds maturing on February 1, 2032 and February 1, 2038 are subject to mandatory sinking fund redemption from mandatory sinking account payments set aside in the Parity Obligation Payment Fund. Water Revenue Bonds, 2012 Series The Water utility of Glendale Water & Power issued $35,000 in revenue bonds in December 2012 to finance the costs of certain improvements to the City’s water public utility including construction and development of Rockhaven Well, construction of a new energy and asset management system, Supervisory Control and Data Administration (SCADA),Glorietta Well improvements and pump station and water quality improvements. As of June 30, 2019, the reserve requirement of the bond issue is satisfied by a cash reserve fund with a minimum funding requirement of $1,358. As of June 30, 2019, the outstanding $40,970 aggregate principal amount of 2008 Bonds which are payable on parity with the outstanding $34,150 aggregate principal amount of 2012 Bonds. The bonds mature in regularly increasing amounts ranging from $475 to $4,945 annually from FY 2019-20 to FY 2041-42. The 2012 Bonds has an optional redemption on and after February 1, 2023. The 2012 Bonds maturing on February 1, 2042 are subject to mandatory sinking fund redemption from mandatory sinking account payments set aside in the Parity Obligation Payment Fund. The Water utility has pledged future water customer revenues, net of specified operating expenses, to pay the remaining total principal and interest on the Water revenue bonds of $119,410 through FY 2041-42. The bonds are payable solely from Water utility’s net revenues and is expected to require the net revenues to be at least equal to 1.25 times the amount of the annual debt services as it become due each fiscal year. The rates to be charged for services furnished by the Water utility should incorporate the debt service requirements to provide revenues sufficient to pay, as the principal and interest become due. Total debt service paid and total net available revenues for debt service coverage for FY 2018-19 were $5,117 and $11,027, respectively. The City has outstanding long-term debt of $237,233 and has no direct borrowings and no direct placements related to business-type activities as of June 30, 2019. The City also has no outstanding or unused line of credit related to long-term debt of business-type activities as of June 30, 2019. The business-type activities bonds payable contain a provision that none of the electric utility and water utility assets owned by the City will be sold or leased if the City is unable to satisfy the debt service requirement. The business-type activities bonds payable contain a provision that in an event of default, the owners of 25% in aggregate Bond Obligations of Bonds then outstanding may call a meeting of the bond owners for the purpose of electing a bondowners’ committee. The business-type activities bonds payable contain a subjective acceleration clause that allows the bondowners’ committee to accelerate payment of the entire principal and interest amounts to become immediately due in an event of default by the City, with the exception of Water Revenue Bonds, 2008 Series that has bond insurance with Assured Guaranty Municipal Corporation to guarantee scheduled payment of principal and interest on the 2008 Bonds when due as set forth in the bond insurance policy. Legal Debt Margins Under the City Charter, the total bonded debt of the city shall at no time exceed 15% of the net assessed value of all real and personal property within the City limits (“debt limit”). General obligation debt is debt secured by the City’s property tax revenues. As of June 30, 2019, the City’s net assessed value of taxable property was $25.5 billion and has no general obligation debt.
68

CITY OF GLENDALE Notes to the Basic Financial Statements Fiscal Year Ended June 30, 2019 (in thousands) Annual Debt Service Requirement Schedule The annual debt service requirement schedule for governmental and business-type activities is as follows:
Governmental Activities
GMFA 2019 Lease Revenue
Refunding Bonds
Section 108 Loan
(HUD 2011 Series)
Fiscal Year Interest Principal Interest Principal 2020 $ 1,163 1,830 14 222 2021 1,155 1,835 9 232 2022 1,063 1,930 3 242 2023 967 2,025 - - 2024 865 2,125 - -
2025-2029 2,621 12,330 - - 2030-2034 143 2,850 - -
$ 7,977 24,925 26 696
Business-type Activities
Electric Revenue Bonds Water Revenue Bonds
Fiscal Year Interest
Principal
Interest
Principal 2020 $ 6,866 5,205 3,134 1,945 2021 6,611 5,460 3,039 2,040 2022 6,339 5,710 2,948 2,135 2023 6,047 5,995 2,853 2,225 2024 5,741 6,300 2,749 2,325
2025-2029 23,561 36,420 12,084 13,265 2030-2034 14,405 32,540 9,265 16,410 2035-2039 6,919 28,060 6,305 20,435 2040-2044 1,515 14,130 1,913 14,340
$ 78,004 139,820 44,290 75,120
Total Governmental Activities Total Business-type Activities Total Debt Service Fiscal Year Interest Principal Interest Principal
2020 $ 1,177
2,052
10,000
7,150
20,379 2021 1,164 2,067 9,650 7,500 20,381 2022 1,066 2,172 9,287 7,845 20,370 2023 967 2,025 8,901 8,220 20,113 2024 865 2,125 8,491 8,625 20,106
2025-2029 2,621 12,330 35,645 49,685 100,281 2030-2034 143 2,850 23,669 48,950 75,612 2035-2039 - - 13,223 48,495 61,718 2040-2044 - - 3,428 28,470 31,898
$ 8,003 25,621 122,294 214,940 370,858
69
CITY OF GLENDALE Notes to the Basic Financial Statements Fiscal Year Ended June 30, 2019 (in thousands) NOTE 8 – PENSION PLANS California Public Employees’ Retirement System General Information about the Pension Plans Plan Description All eligible employees participate in the City’s defined benefit pension plans, either Safety (police and fire sworn members) or Miscellaneous (all other members), administered by the California Public Employees’ Retirement System (CalPERS), which acts as a common investment and administrative agent for its participating member employers. Benefit provisions under the Plans are established by State statute and City resolution. CalPERS issues publicly available reports that include a full description of the pension plans regarding benefit provisions, assumptions, and membership information that can be found on the CalPERS website at http://www.calpers.ca.gov. Benefits Provided CalPERS provides service retirement and disability benefits, annual cost of living adjustments, and death benefits to plan members, who must be public employees and beneficiaries. Benefits are based on years of credited service, equal to one year of full time employment. Members with five years of total service are eligible to retire at age 50 for Classic members and age 52 for PEPRA members, with statutorily reduced benefits. All members are eligible for non-duty disability benefits after 5 years of service. The cost of living adjustments for each plan are applied as specified by the Public Employees’ Retirement Law. The death benefit is as follows: If eligible to retire, the Pre-retirement Option 2W Death Benefit; or the Basic Death Benefit of a refund of contributions, plus interest; and up to six months’ pay (one month’s salary rate for each year of current service to a maximum of six months); and 1959 Survivor Benefit Program Level 4* (may not be payable if the Special Death Benefit is elected). If not eligible to retire, the Basic Death Benefit of a refund of contributions, plus interest; and up to six months’ pay (one month’s salary rate for each year of current service to a maximum of six months); and 1959 Survivor Benefit Program Level 4* (may not be payable if the Special Death Benefit is elected). *1959 Survivor Benefit Program Level 4 may not be applicable if there is no eligible Spouse/Registered Domestic Partner and an unmarried eligible dependent child under age 22. An eligible surviving spouse/registered domestic partner may be entitled to the 1959 Survivor Benefit Program Level 4 benefits as long as they have care of an eligible child (unmarried dependent child of the member living with the member in a parent-child relationship, while under age 22) or the surviving spouse/registered domestic partner is at least age 62 (age 60 at Level 4 and under the Indexed Level). An eligible surviving spouse/registered domestic partner may remarry and continue to receive the allowance.
70

CITY OF GLENDALE Notes to the Basic Financial Statements Fiscal Year Ended June 30, 2019 (in thousands) The Plans’ provisions and benefits in effect at June 30, 2019, are summarized as follows:
Miscellaneous
Hire date Prior to
January 1, 2011
Between January 1, 2011 and December 31, 2012
On or after January 1, 2013
Benefit formula 2.5% @ 55 2% @ 55 2% @ 62 Benefit vesting schedule 5 years of service 5 years of service 5 years of service Benefit payments monthly for life monthly for life monthly for life Retirement age 50-55+ 50-63+ 52-67+
Monthly benefits, as a % of eligible compensation 2.0% to 2.5% 1.426% to 2.418% 1.0% to 2.5%
Safety
Hire date Prior to
January 1, 2011
Between January 1, 2011 and December 31, 2012
On or after January 1, 2013
Benefit formula 3% @ 50 3% @ 55 2.7% @ 57 Benefit vesting schedule 5 years of service 5 years of service 5 years of service Benefit payments monthly for life monthly for life monthly for life Retirement age 50-55+ 50-55+ 50-57+
Monthly benefits, as a % of eligible compensation 3.0% 2.4% to 3.0% 2.0% to 2.7%
Employees Covered At June 30, 2019, the following employees were covered by the benefit terms for each plan:
Miscellaneous Safety
Inactive employees or beneficiaries currently receiving benefits 1,725 608 Inactive employees entitled to but not yet receiving benefits 1,722 97 Active employees 1,424 384 Total 4,871 1,089
Contributions Section 20814(c) of the California Public Employees’ Retirement Law requires that the employer contribution rates for all public employers are determined on an annual basis by the actuary and shall be effective on the July 1 following notice of a change in the rate. The total plan contributions are determined through CalPERS’ annual actuarial valuation process. The actuarially determined rate is the estimated amount necessary to finance the costs of benefits earned by employees during the year, with an additional amount to finance any unfunded accrued liability. The City is required to contribute the difference between the actuarially determined rate and the contribution rates of employees. Employer contribution rates may change if plan contracts are amended. Payments made by the employer to satisfy contribution requirements are identified by the pension plan terms as plan member contribution requirements are classified as plan member contributions. Starting for FY 2017-18, the contribution for the unfunded liability is a fixed amount, rather than a rate of the payroll. The City converts the fixed amount into a rate based on the payroll, and combines it with the normal cost rate to calculate the total employer contribution rate.
71

CITY OF GLENDALE Notes to the Basic Financial Statements Fiscal Year Ended June 30, 2019 (in thousands) In FY 2018-19, for the Miscellaneous Plan, the normal cost rate is 8.599%, the amount for the unfunded liability is $20,296, and the prepayment amount for the unfunded liability is $19,586. The City chose the prepayment option to pay the $19,586 in July 2018, instead of paying 1/12th of $20,296 on a monthly basis. For FY 2018-19, the City calculates the rate for the unfunded liability to be 20.613%. The City’s Miscellaneous Plan member contribution rates and employer contribution rates for FY 2018-19, including the employees’ cost sharing toward the employer rates, are shown in the table below:
Miscellaneous Plan
Employee Group
CalPERS Membership
Retirement Formula
Member Contribution
Rate
Employer Contribution
Rate
Employees'
Cost Sharing City Portion Total
Council Member
Classic (1st Tier) 2.5% @ 55 8.00% 3.00% 26.212% 29.212% Classic (2nd Tier) 2.0% @ 55 7.00% 3.00% 26.212% 29.212%
PEPRA (3rd Tier) 2.0% @ 62 5.75% 3.00% 26.212% 29.212%
Executive
Classic (1st Tier) 2.5% @ 55 8.00% 4.00% 25.212% 29.212% Classic (2nd Tier) 2.0% @ 55 7.00% 4.00% 25.212% 29.212%
PEPRA (3rd Tier) 2.0% @ 62 5.75% 4.00% 25.212% 29.212%
GCEA
Classic (1st Tier) 2.5% @ 55 12.00% 0.00%* 25.212% 25.212% Classic (2nd Tier) 2.0% @ 55 11.00% 0.00%* 25.212% 25.212%
PEPRA (3rd Tier) 2.0% @ 62 9.75% 0.00%* 25.212% 25.212%
IBEW
Classic (1st Tier) 2.5% @ 55 8.00% 3.00% 26.212% 29.212% Classic (2nd Tier) 2.0% @ 55 7.00% 3.00% 26.212% 29.212%
PEPRA (3rd Tier) 2.0% @ 62 5.75% 3.00% 26.212% 29.212%
GMA
Classic (1st Tier) 2.5% @ 55 12.00% 0.00%** 25.212% 25.212% Classic (2nd Tier) 2.0% @ 55 11.00% 0.00%** 25.212% 25.212%
PEPRA (3rd Tier) 2.0% @ 62 9.75% 0.00%** 25.212% 25.212% GCEA - Glendale City Employee Association IBEW - International Brotherhood of Electrical Workers GMA - Glendale Management Association *Effective May 2013, GCEA members' cost sharing rate (3%-4%) became part of their member contribution rate. **Effective November 2018, GMA members' cost sharing rate (4%) became part of their member contribution rate.
72

CITY OF GLENDALE Notes to the Basic Financial Statements Fiscal Year Ended June 30, 2019 (in thousands) In FY 2018-19, for the Safety Plan, the normal cost rate is 19.589%, the amount for the unfunded liability is $15,858, and the prepayment amount for the unfunded liability is $15,304. The City chose the prepayment option to pay the $15,304 in July 2018, instead of paying 1/12th of $15,858 on a monthly basis. For FY 2018-19, the City calculates the rate for the unfunded liability to be 29.068%.
The City’s Safety Plan member contribution rates and employer contribution rates for FY 2018-19, including the employees’ cost sharing toward the employer rates, are shown in the table below:
Safety Plan
Employee Group
CalPERS Membership
Retirement Formula
Member Contribution
Rate
Employer Contribution
Rate
Employees'
Cost Sharing City Portion Total
Executive - Fire
Classic (1st Tier) 3.0% @ 50 9.00% 4.00% 44.657% 48.657% Classic (2nd Tier) 3.0% @ 55 9.00% 4.00% 44.657% 48.657%
PEPRA (3rd Tier) 2.7% @ 57 10.75% 4.00% 44.657% 48.657%
Executive - Police
Classic (1st Tier) 3.0% @ 50 9.00% 4.00% 44.657% 48.657% Classic (2nd Tier) 3.0% @ 55 9.00% 4.00% 44.657% 48.657%
PEPRA (3rd Tier) 2.7% @ 57 10.75% 4.00% 44.657% 48.657%
GMA - Fire
Classic (1st Tier) 3.0% @ 50 13.00% 0.00%* 44.657% 44.657% Classic (2nd Tier) 3.0% @ 55 13.00% 0.00%* 44.657% 44.657%
PEPRA (3rd Tier) 2.7% @ 57 14.75% 0.00%* 44.657% 44.657%
GMA - Police
Classic (1st Tier) 3.0% @ 50 12.50% 0.00%* 45.157% 45.157% Classic (2nd Tier) 3.0% @ 55 12.50% 0.00%* 45.157% 45.157%
PEPRA (3rd Tier) 2.7% @ 57 14.25% 0.00%* 45.157% 45.157%
GFFA
Classic (1st Tier) 3.0% @ 50 9.00% 4.00% 44.657% 48.657% Classic (2nd Tier) 3.0% @ 55 9.00% 4.00% 44.657% 48.657%
PEPRA (3rd Tier) 2.7% @ 57 10.75% 3.50% 45.157% 48.657%
GPOA
Classic (1st Tier) 3.0% @ 50 9.00% 3.50% 45.157% 48.657% Classic (2nd Tier) 3.0% @ 55 9.00% 3.50% 45.157% 48.657%
PEPRA (3rd Tier) 2.7% @ 57 10.75% 1.75% 46.907% 48.657% GMA - Glendale Management Association GFFA - Glendale Fire Fighter Association GPOA - Glendale Police Officer Association *Effective November 2018, GMA members' cost sharing rate (3.5%-4%) became part of their member contribution rate.
73

CITY OF GLENDALE Notes to the Basic Financial Statements Fiscal Year Ended June 30, 2019 (in thousands) As shown in the rates tables, in addition to the required member contributions, the City employees also contribute a portion of the required employer contribution, based on bargaining units’ MOUs. The required employer contributions to the Miscellaneous and Safety plans were $27,791 and $25,487, respectively, for the year ended June 30, 2019. The breakdown of the required employer contribution between the City portion and the employee portion is as follows:
Plan Annual Required
Employer Contribution
City Contribution Employees’
Cost Sharing
Miscellaneous $ 27,791 24,078 3,713 Safety Police 14,962 13,955 1,007 Fire 10,525 9,682 843 Total Safety 25,487 23,637 1,850
Total $ 53,278 47,715 5,563 Net Pension Liability The City’s net pension liability for each plan was measured as of June 30, 2018, and the total pension liability used to calculate the net pension liability was determined by an actuarial valuation as of June 30, 2017. Actuarial Assumptions The June 30, 2017 valuation was rolled forward to measure the June 30, 2018 total pension liability, based on the following actuarial methods and assumptions:
Valuation date June 30, 2017 Measurement date June 30, 2018 Actuarial cost method Entry Age Normal Cost Method Actuarial assumptions:
Discount rate 7.15% Inflation 2.50% Salary increase Varies by Entry Age and Service Mortality rate table Derived using CalPERS' Membership Data for all Funds
Post retirement benefit increase
Contract COLA up to 2.0% until Purchasing Power Protection Allowance Floor on Purchasing Power applies, 2.50% thereafter
The mortality table used was developed based on CalPERS-specific data. The table includes 15 years of mortality improvements using Society of Actuaries Scale 90% of scale MP 2016. For more details on this table, please refer to the December 2017 experience study report (based on CalPERS demographic data from 1997 to 2015) that can be found on the CalPERS website.
74

CITY OF GLENDALE Notes to the Basic Financial Statements Fiscal Year Ended June 30, 2019 (in thousands) Long-term Expected Rate of Return The long-term expected rate of return on pension plan investments was determined using a building-block method in which expected future real rates of return (expected returns, net of pension plan investment expense and inflation) are developed for each major asset class. In determining the long-term expected rate of return, CalPERS took into account both short-term and long-term market return expectations as well as the expected pension fund cash flows. Using historical returns of all the funds’ assets classes, expected compound (geometric) returns were calculated over the short-term (first 10 years) and the long-term (11+ years) using a building-block approach. Using the expected nominal returns for both short-term and long-term, the present value of benefits was calculated for each fund. The expected rate of return was set by calculating the rounded single equivalent expected return that arrived at the same present value of benefits for cash flows as the one calculated using both short-term and long-term returns. The expected rate of return was then set equal to the single equivalent rate calculated above and adjusted to account for assumed administrative expenses. The expected real rates of return by asset class are as followed:
Asset Class*
Assumed Target
Allocation
Real Return
Years 1-10 **
Real Return
Years 11+ ***
Global equity
50.00%
4.80%
5.98% Fixed income 28.00% 1.00% 2.62% Inflation assets - 0.77% 1.81% Private equity 8.00% 6.30% 7.23% Real assets 13.00% 3.75% 4.96% Liquidity 1.00% - (0.92%)
Total 100.00%
*In the System’s CAFR, Fixed Income is included in Global Debt Securities; Liquidity is included in Short-term Investments; Inflation Assets are included in both Global Equity Securities and Global Debt Securities. **An expected inflation of 2.00% used for this period. ***An expected inflation of 2.92% used for this period.
Discount Rates The discount rate used to measure the total pension liability was 7.15%. The projection of cash flows used to determine the discount rate assumed that contributions from plan members will be made at the current member contribution rates and that contributions from employers will be made at statutorily required rates, actuarially determined. Based on those assumptions, the Plan’s fiduciary net position was projected to be available to make all projected future benefit payments of current plan members. Therefore, the long-term expected rate of return on plan investments was applied to all periods of projected benefit payments to determine the total pension liability.
75

CITY OF GLENDALE Notes to the Basic Financial Statements Fiscal Year Ended June 30, 2019 (in thousands) Changes in the Net Pension Liability
The changes in the Net Pension Liability measured as of June 30, 2018 for each plan is as follows: Miscellaneous Plan:
Increase (Decrease)
Total Pension
Liability (a)
Plan Fiduciary Net Position
(b)
Net Pension Liability/(Asset) (c) = (a) – (b)
Balance at June 30, 2018 $ 1,098,040 801,698 296,342 Changes in the year: Service cost 15,956 - 15,956 Interest on the total pension liability 76,746 - 76,746 Changes of assumptions (6,403) - (6,403)
Differences between actual and expected experience
1,240
-
1,240 Net plan to plan resource movement - (2) 2 Contribution from the employer - 22,006 (22,006) Contribution from the employees - 8,996 (8,996) Net investment income - 67,307 (67,307)
Benefit payments, including refunds of employee contributions
(54,969)
(54,969)
-
Administrative expense - (1,249) 1,249 Other miscellaneous income/(expense) - (2,372) 2,372 Net changes 32,570 39,717 (7,147) Balance at June 30, 2019 $ 1,130,610 841,415 289,195
Safety Plan:
Increase (Decrease)
Total Pension
Liability (a)
Plan Fiduciary Net Position
(b)
Net Pension Liability/(Asset) (c) = (a) – (b)
Balance at June 30, 2018 $ 827,494 543,661 283,833 Changes in the year: Service cost 14,872 - 14,872 Interest on the total pension liability 57,734 - 57,734 Changes of assumptions (3,509) - (3,509)
Differences between actual and expected experience
(3,943)
-
(3,943) Net plan to plan resource movement - (1) 1 Contribution from the employer - 22,548 (22,548) Contribution from the employees - 4,602 (4,602) Net investment income - 45,731 (45,731)
Benefit payments, including refunds of employee contributions
(40,017)
(40,017)
-
Administrative expense - (847) 847 Other miscellaneous income/(expense) - (1,609) 1,609 Net changes 25,137 30,407 (5,270) Balance at June 30, 2019 852,631 574,068 278,563 Total for both plans at June 30, 2019 $ 1,983,241 1,415,483 567,758
76

CITY OF GLENDALE Notes to the Basic Financial Statements Fiscal Year Ended June 30, 2019 (in thousands) Sensitivity of the Net Pension Liability to Changes in the Discount Rate The following presents the net pension liability of each Plan, calculated using the discount rate of 7.15%, as well as what the City’s net pension liability would be if it were calculated using a discount rate that is 1-percentage point lower or 1-percentage point higher than the current rate:
Miscellaneous
Safety
Total
1% Decrease 6.15%
6.15%
6.15% Net Pension Liability $ 440,304 396,268 836,572
Current Discount Rate 7.15%
7.15%
7.15% Net Pension Liability $ 289,195 278,563 567,758
1% Increase 8.15%
8.15%
8.15% Net Pension Liability $ 164,667 182,142 346,809
Pension Expense and Deferred Outflows/Inflows of Resources Related to Pensions As of June 30, 2019, the City reported net pension liability, deferred outflows of resources and deferred inflows of resources for both Miscellaneous and Safety Plans as follows:
Governmental activities: Net Pension
Liability
Deferred Outflows
of Resources
Deferred Inflows
of Resources
Pension Expense
Miscellaneous plan $ 186,356
32,284
4,988
24,952
Safety plan 278,563
51,478
11,231
33,547
Total $ 464,919
83,762
16,219
58,499
Business-type activities: Net Pension
Liability
Deferred Outflows
of Resources
Deferred Inflows
of Resources
Pension Expense
Miscellaneous plan $ 102,839
18,453
2,860
14,649 Miscellaneous Plan: At June 30, 2019, the City reported deferred outflows of resources and deferred inflows of resources related to pensions from the following sources:
Deferred Outflows of Resources
Deferred Inflows of Resources
Pension contributions subsequent to measurement date $ 27,791
- Changes of assumptions 19,292 4,337 Differences between expected and actual experience 840 3,511 Net differences between projected and actual earnings on plan investments 2,814
-
Total $ 50,737
7,848
77

CITY OF GLENDALE Notes to the Basic Financial Statements Fiscal Year Ended June 30, 2019 (in thousands) The amount of $27,791 reported as deferred outflows of resources related to contributions subsequent to the measurement date will be recognized as a reduction of the net pension liability in the year ended June 30, 2020. Other amounts reported as deferred outflows/(inflows) of resources related to pensions will be recognized as pension expense as follows:
Year ended June 30, Amounts
2020 $ 24,883 2021 859 2022 (8,426) 2023 (2,218)
Total $ 15,098 Safety Plan: At June 30, 2019, the City reported deferred outflows of resources and deferred inflows of resources related to pensions from the following sources:
Deferred Outflows of Resources
Deferred Inflows of Resources
Pension contributions subsequent to measurement date $ 25,487
- Changes of assumptions 23,852 3,279 Differences between expected and actual experience - 7,952 Net differences between projected and actual earnings on plan investments 2,139
-
Total $ 51,478
11,231 The amount of $25,487 reported as deferred outflows of resources related to contributions subsequent to the measurement date will be recognized as a reduction of the net pension liability in the year ended June 30, 2020. Other amounts reported as deferred outflows/(inflows) of resources related to pensions will be recognized as pension expense as follows:
Year ended June 30, Amounts
2020 $ 13,862 2021 9,838 2022 (7,274) 2022 (1,666)
Total $ 14,760 Pension Plan Fiduciary Net Position Detailed information about each pension plan’s fiduciary net position is available in the separately issued CalPERS financial reports.
78

CITY OF GLENDALE Notes to the Basic Financial Statements Fiscal Year Ended June 30, 2019 (in thousands) Supplemental Retirement Plan In May 2012, in an effort to substantially reduce staffing levels to address a projected $15,400 General Fund shortfall for FY 2012-13, the City contracted with Public Agency Retirement Services (PARS) to offer an early retirement incentive plan to provide supplemental retirement benefit payments to eligible employees in addition to the benefit payments the employees will receive from the California Public Employees’ Retirement System (CalPERS). To be eligible to participate in the plan, the employees must have been a Glendale City Employee Association (GCEA) or Glendale Management Association (GMA) employee, be at least 50 years of age as of September 1, 2012, and have a minimum 5 years of CalPERS service credit. The employees needed to resign from the City by August 31, 2012. The plan offered 5% of the employees’ final pay, which the employees could choose various options to receive the payment, such as unmodified lifetime monthly payment, or higher fixed monthly payment for a fixed number of years. There were 122 employees who participated in the plan. In October 2012, the City provided the same early retirement incentive plan to the employees represented by International Brotherhood of Electrical Workers Association (IBEW), and also offered an extension of the incentive program to employees represented by GCEA and GMA. The same parameters were applied for the extension of the incentive program, with the exception of the retirement eligibility date and date of separation advancing to October 31, 2012. There were 30 additional employees participating in the second phase. The plan is closed, and $45 was paid to PARS in FY 2018-19. Public Agency Retirement Services (PARS) The PARS Trust, created in 1991, is a trust arrangement established to provide economies of scale and efficiencies of administration to public agencies that adopt it to hold the assets of their agency retirement plans maintained for the benefit of their employees. The Omnibus Budget Reconciliation Act of 1990 (OBRA 90) amended the Internal Revenue Code to mandate that employees of public agencies, who are not members of their employer’s existing retirement system as of January 1, 1992, be covered under Social Security or an alternate plan. The PARS ARS Plan satisfies the OBRA 90 Federal Requirements. It is intended that this plan and the trust established to hold the assets of the plan shall be qualified under Section 401(a) and tax-exempt under Section 501(a) of the Internal Revenue Code of 1986, as amended, and meet the requirements of California Government Code Sections 53215 through 53224 providing how pension trusts must be established by public agencies. Through PARS, agencies have the ability to design and control retirement plans according to their own specific needs, including specific collective bargaining requirements. The City adopted the PARS ARS Plan, effective September 1, 1999 as an alternate plan to Social Security for the hourly employees who are not eligible for participation in the City’s CalPERS retirement plan. Any City hourly employee who is not eligible to enroll in the CalPERS retirement plan is enrolled in PARS-ARS instead of social security. After completing 1,000 work hours within a fiscal year, hourly employees are eligible to enroll in CalPERS retirement plan. For each pay period, employees contribute 6.2%, and the City contributes 1.3% of employee earnings into employees’ PARS account. Both contributions are made on pre-tax basis. For FY 2018-19, PARS payments were $92 and $19 for employee portion and employer portion, respectively. Since the plan is a 401(a) Defined Contribution, there is no unfunded liability to the City. A participant in the PARS ARS Plan (or their beneficiary in the event of death) becomes eligible to receive their funds when one of the following events occurs: Separation of Employment, Retirement, Permanent and Total Disability, or change of employment status to a position covered by another retirement system. For active employees, if there are no contributions into their PARS ARS account for two years, they may be eligible for a distribution of their account.
79

CITY OF GLENDALE Notes to the Basic Financial Statements Fiscal Year Ended June 30, 2019 (in thousands) NOTE 9 – Other Post Employment Benefits Than Pensions (OPEB) Plan Description
The City’s defined benefit OPEB plan, City of Glendale Retiree Benefits Plan (Plan), provides OPEB for all permanent full-time general and public safety employees of the City. The Plan is a single-employer defined benefit OPEB plan administered by the City and governed by the City Council. No assets are accumulated in a trust that meets the criteria in paragraph 4 of GASB Statement No. 75. Benefits Provided The City provides Medicare Part A reimbursements to retirees and their spouses if the retirees were hired in the City prior to April 1, 1986, and ineligible for premium-free Medicare Part A. The City also provides cash subsidy for medical insurance premiums to three groups of retirees: (1) retirees who retired before July 1, 2001, and the length of the subsidy was pre-determined based on the retirees’ sick leave balances at the time of retirement. The subsidy is capped by the actual premium, and the unreduced city-paid amount continues to surviving spouses if the retirees die prior to the pre-determined payment period; (2) retirees who retired before June 1, 2016 with a minimum of 10 years of City service, enroll in a City sponsored medical plan and meet the annual income requirement. The eligibility and subsidy amount are evaluated on an annual basis. This is a lifetime subsidy for the eligible retirees except it will discontinue at age 65 for the retirees with enhanced pension benefits. The benefit will continue to surviving spouses, if applicable; (3) the surviving spouses and dependents of deceased retirees if the retirees retired before June 1, 2008 and enrolled in Anthem Blue Cross PPO at the time of the death, and the length of subsidy is two years. The City also provides cash subsidy for medical insurance premium to surviving spouses and dependents of active non-safety employees who pass away during their employment with the City. The subsidy is two years for the City Council, the Executives and the GMA employees, regardless of the medical insurance plans enrolled at the time of the death. The subsidy is two years for GCEA and IBEW employees if enrolled in Anthem Blue Cross PPO at the time of the death. The subsidy is two years for GCEA and IBEW employees if enrolled in HMO plans at the time of the death and if the employees’ death is a result of injuries incurred in the performance of his/her assigned duties. At the same time, the City provides cash subsidy for dental insurance premium to surviving spouses and dependents of active safety employees who pass away during their employment with the City. The subsidy continues until the spouses turn 65 and the children turn 26 (if applicable). The above benefits offered to retirees are no longer available to new entrants because of the restriction of the retirement dates. Benefits payments made by the City for the year ended June 30, 2019 were $476. Employees Covered by Benefit Terms At June 30, 2018, the most recent valuation date, the following current and former employees were covered by the benefit terms under the Plan:
Inactive employees or beneficiaries currently receiving benefit payments 85 Inactive employees entitled to but not yet receiving benefit payments 226 Active employees 1,399 Total 1,710
Total OPEB Liability The City’s total OPEB liability of $15,214 was measured as of June 30, 2018, and was determined by an actuarial valuation as of June 30, 2017. A summary of principal assumptions and methods used to determine the total OPEB liability is shown below.
80

CITY OF GLENDALE Notes to the Basic Financial Statements Fiscal Year Ended June 30, 2019 (in thousands) Actuarial Assumptions and Other Inputs The total OPEB liability in the June 30, 2017 actuarial valuation was determined using the following actuarial assumptions and other inputs, applied to all periods included in the measurement, unless otherwise specified: Actuarial valuation date June 30, 2017
Measurement date June 30, 2018
Discount rate 3.87%
General inflation 2.75% annually
Medicare Part A trend 3.75% annually (inflation + 1%) Not related to health care trend
Medical Trend Non-Medicare – 7.5% for 2019, decreasing to an ultimate rate of 4.0% in 2076 Medicare – 6.5% for 2019, decreasing to an ultimate rate of 4.0% in 2076
The discount rate was based on the Bond Buyer 20-Bond GO index. Mortality information was derived from data collected during 1997 to 2015 CalPERS Experience Study. Post-retirement mortality was projected fully generational using Society of Actuaries (SOA) Scale MP-2017. Changes in the Total OPEB Liability The changes in the total OPEB liability measured as of June 30, 2018 is as follows:
Total OPEB Liability
Balance at June 30, 2018 $ 15,738 Changes in the year: Service cost 46 Interest 556 Assumption changes (619) Benefit payments (507) Net changes (524)
Balance at June 30, 2019 $ 15,214 Sensitivity of the Total OPEB Liability to Changes in the Discount Rate The following presents the total OPEB liability of the City, as well as what the City’s total OPEB liability would be if it were calculated using a discount rate that is 1-percentage-point lower or 1-percentage-point higher than the current discount rate:
2.87% 3.87% 4.87%
Total OPEB Liability $ 17,524 15,214 13,343
81

CITY OF GLENDALE Notes to the Basic Financial Statements Fiscal Year Ended June 30, 2019 (in thousands) Sensitivity of the Total OPEB Liability to Changes in the Healthcare Cost Trend Rates The following presents the total OPEB liability of the City, as well as what the City's total OPEB liability would be if it were calculated using healthcare cost trend rates that are 1-percentage-point lower or 1-percentage-point higher than the current healthcare cost trend rates:
1% Decrease (Trend -1%)
Current Healthcare Cost
Trend Rates
1% Increase (Trend +1%)
Total OPEB Liability $ 15,009
15,214
15,458 Non-Medicare trend rate of 7.5%, decreasing to an ultimate rate of 4.0% in 2076. Medicare trend rate of 6.5%, decreasing to an ultimate rate of 4.0% in 2076. OPEB Expense and Deferred Outflows/Inflows of Resources Related to OPEB For the year ended June 30, 2019, the City recognized OPEB expense of $339. At June 30, 2019, the City reported deferred outflows of resources and deferred inflows of resources related to OPEB from the following sources:
Deferred Outflows of Resources
Deferred Inflows of Resources
OPEB payments made subsequent to the measurement date $ 476
Changes of assumptions $ 1,949
The amount of $476 reported as deferred outflows of resources related to OPEB payments subsequent to the measurement date will be recognized as a reduction of the total OPEB liability in the year ended June 30, 2020. Other amounts reported as deferred inflows of resources related to OPEB will be recognized in OPEB expense as follows:
Year ended June 30, Amounts
2020 $ (263) 2021 (263) 2022 (263) 2023 (263) 2024 (263) Thereafter (634) Total $ (1,949)
82

CITY OF GLENDALE Notes to the Basic Financial Statements Fiscal Year Ended June 30, 2019 (in thousands) NOTE 10 – NET DEFICITS OF INDIVIDUAL FUNDS As of June 30, 2019, the following funds have negative fund balances or net position: Governmental funds:
Special revenue funds: CDBG Fund $ 198 Continuum of Care Grant Fund 396 Measure H Fund 56 PW Special Grants Fund 36 Measure R Regional Return Fund 2,074 Fire Grant Fund 44
Capital projects funds: CIP Reimbursement Fund $ 3,498
Proprietary funds:
Internal service funds: Compensation Insurance Fund $ 4,771 Post Employment Benefits Fund 179
The CDBG Fund, Continuum of Care Grant Fund, Measure H Fund, PW Special Grants Fund, Measure R Regional Return Fund, Fire Grant Fund and CIP Reimbursement Fund are reimbursement type funds. The City requests reimbursement of actual expenditures. As such, there will always be a timing difference between revenues and expenditures resulting in a deficit, as revenues do not represent available resources. Compensation Insurance Fund – The deficit has decreased in FY 2018-19 due to the premium increases. The City will continue to increase future premiums to eliminate the deficit. Post Employment Benefits Fund – The deficit has decreased in FY 2018-19 due to the premium increases. The City will continue to increase future premiums to eliminate the deficit.
83

CITY OF GLENDALE Notes to the Basic Financial Statements Fiscal Year Ended June 30, 2019 (in thousands) NOTE 11 – RISK MANAGEMENT The City is exposed to various risks of loss related to torts, theft of, damage to and destruction of assets, errors and omissions, injuries to employees, and natural disasters. The City retains risks for the following types of liabilities: workers’ compensation, unemployment insurance, general auto, dental, medical and vision as well as public liability through separate internal service funds. The City purchased several commercial insurance policies from third-party insurance companies for errors and omissions of its officers and employees, and destruction of assets as well as excess workers’ compensation and general public liability claims. The City also purchases property, aviation and employee dishonesty insurance. There were no significant settlements or reductions in insurance coverage from settlements for the past three years. The insurance schedule for FY 2018-19 is as follows:
Insurance Type Program
Limits
Deductible/SIR (self-insured retention)
Excess Liability Insurance $ 25,000
$2,000 SIR per occurrence D & O Employment Practices 2,000 $250 SIR non-safety; $500 SIR safety Excess Workers’ Comp Employer’s Liability Insurance Statutory $2,000 SIR per occurrence Property Insurance (GWP) 250,000 Various deductibles up to $250 Property Insurance (Non-GWP) 500,000 $25 deductible all locations Aviation Insurance (Police Helicopter) 50,000 Various deductibles Employee Dishonesty – Crime Policy 5,000 $25 Cyber Insurance 5,000 $100
Operating funds are charged a premium and the internal service funds recognize the corresponding revenue. Claims expenses are recorded in the internal service funds. Premiums are evaluated periodically and increases are charged to the operating funds to reflect recent trends in actual claims experience and to provide sufficient reserve for catastrophic losses. Claims payable liability has been established in these funds based on estimates of incurred but not reported and litigated claims. Management believes that provisions for claims at June 30, 2019 are adequate to cover the cost of claims incurred to date. However, such liabilities are, by necessity, based upon estimates and there can be no assurance that the ultimate cost will not exceed such estimates. A reconciliation of the changes in the aggregate liabilities for Liability Insurance Fund, Compensation Insurance Fund and Medical Insurance Fund for claims for the current fiscal and the prior fiscal year are as follows:
The City has numerous claims and pending legal proceedings that generally involve accidents regarding its citizens on City property and employment issues. These proceedings are, in the opinion of management, ordinary routine matters incidental to the normal business conducted by the City. In the opinion of management, such proceedings are substantially covered by insurance, and the ultimate disposition of such proceedings are not expected to have a material adverse effect on the City's financial position, results of operations, or cash flows. For the governmental activities, claims payable is primarily liquidated by the respective internal service funds.
Fiscal Year Beginning Balance
Claims and Charges
Claim Payments
Ending Balance
Due within One Year
2017-18 $ 51,394 42,708 40,834 53,268 14,369 2018-19 $ 53,268 46,706 41,626 58,348 16,485
84

CITY OF GLENDALE Notes to the Basic Financial Statements Fiscal Year Ended June 30, 2019 (in thousands) NOTE 12 – CONTINGENT LIABILITIES AND COMMITMENTS Power Purchase Agreements The City first participated in the Boulder Canyon Project for electric service from the Hoover Power Plant in 1937 for a term of 50 years, which expired on May 31, 1987. In January 1987, the City renewed the contract with the United States Bureau of Reclamation providing for the advancement of funds for the Hoover Uprating Project and Western Area Power Administration for the purchase of power from the project. The renewed contract is for a term of 30 years from 1987 to 2017. In September 2016, the Boulder Canyon Project agreement was amended and restated to extend the term through September 30, 2067. The City is entitled to 20.198 megawatts. In August 2003, the City entered into a 25-year contract, cancelable after 20 years, with PPM Energy, Inc. for the purchase of 9 megawatts of capacity from wind-powered resources in California. The City began taking delivery of the energy on September 1, 2003. In June 2005, the City entered into a 25-year power sales agreement with the Southern California Public Power Authority (SCPPA) for the Ormat Geothermal Energy Project for purchase of up to 3 megawatts of the project electric energy. The project began commercial operation in January 2006. In October 2006, the City entered into a 16-year contract with PPM Energy, Inc. for the purchase of 10 megawatts of capacity from wind-powered resources in Wyoming. The City began taking delivery of the energy under WSPP master agreement from July 1, 2006 through September 30, 2006. The contract term started on October 1, 2006. In November 2007, City Council approved a purchase power agreement with SCPPA for the purchase of 20 megawatts of renewable energy from Pebble Springs Wind Generation Facility for a term of 18-years. The project began commercial operation in January 2009. In September 2014, the City entered into a 25-year contract with Skylar Resources LP for the procurement of 50 megawatts of firmed renewable solar. At least fifty percent of 50 megawatts/hour is guaranteed by the seller to qualify as Portfolio Content Category 1 (PCC1) renewable energy on an annual basis. In November 2015, the transaction was bifurcated into 2 separate renewable energy transactions, one with a term of December 1, 2015 through December 31, 2019, and the other with a term of January 1, 2020 through November 20, 2040. The 4-year transaction was subsequently novated to Morgan Stanley Capital Group. The City began taking delivery of the energy on December 2015. In June 2017, the 21-year contract with Skylar was terminated and replaced concurrently with a new power purchase agreement with a higher percentage of renewable and zero-carbon energy. Under the new agreement, Skylar is obligated to deliver at least 55% PCC1 renewable and 20% zero-carbon energy. Landfill Postclosure Care Pursuant to Assembly Bill 2448 and the regulations established by the California Integrated Waste Management Board (Board), landfill operators are required to submit an initial cost estimate of postclosure maintenance and to establish a financial mechanism to demonstrate the availability of funding to conduct postclosure maintenance activities. The City selected a trust fund as the financial mechanism and the Board approved this. The City Treasurer was designated as the trustee to ensure that the City set aside annual required deposits. The City subcontracts with Los Angeles County Sanitation District (Sanitation District) to operate Scholl Canyon and as part of this contract, the County is responsible for the closure cost of Scholl Canyon. The City is responsible for the postclosure maintenance cost of Scholl Canyon. According to Los Angeles County Sanitation District's records, the permitted capacity filled between August 18, 1989 and July 10, 2018 was 11.81 million tons. The permitted capacity filled between July 11, 2018 and July 10, 2019 was 0.43 million tons. The total permitted capacity as of August 18, 1989 remains 14.75 million tons. Therefore, the City has 2.51 million tons unfilled capacity remaining. Using an inflation factor from the Sanitation Districts of 1.022, the total estimated care postclosure cost is $62,150. Using the data above, the amount of $51,574 is recognized as a long-term liability on the Statement of Net Position. Accordingly, the portion of the estimated total obligation for landfill postclosure costs that has not been recognized in the financial statements is $10,576. The City records the annual provision for the required landfill deposits as restricted cash in the Landfill Postclosure Fund. At the end of June 30, 2019, the City has set aside $37,103 of this
85

CITY OF GLENDALE Notes to the Basic Financial Statements Fiscal Year Ended June 30, 2019 (in thousands) in the Landfill Postclosure Fund. The total current cost of landfill postclosure care is an estimate subject to changes resulting from inflation, deflation, technology, or changes in applicable laws or regulations. General Fund Transfer Litigation The City is currently litigating two related cases regarding its 2013 electric rates and transfer from the Electric Fund to the General Fund, which were filed in the Los Angeles Superior Court in 2014 (together, the “2014 lawsuits”). In July 2018, the Glendale Coalition for a Better Government filed a petition for writ of mandate challenging the City’s adopted 2018 electric rates on similar grounds, and the lawsuit has been set for trial in February 2020. The 2014 lawsuits challenged the City’s electric rate plan which includes transfers of electric revenue from the Glendale Water & Power Electric Fund to the General Fund (the “GFT”). The City Charter provides that the City may transfer 25% of electric operating revenues to the General Fund. The City has made the GFT under the authority of its City Charter since it was approved in 1921, although not recently for the fully authorized 25%. The 2013 electric rates were challenged primarily on the grounds they violated Proposition 26, in that they constituted a “tax”. The trial court concluded that the 2013 electric rates violated Proposition 26 and ordered that the City credit ratepayers for the GFT in the cumulative amount of the transfer beginning with FY 2013-14, plus interest. Lastly, the trial court ordered that credits for any subsequent years would accrue. The trial court has also issued a writ of mandate commanding the City to cease to include the GFT in the electric rates charged to consumers unless and until a majority of the Glendale electorate approves the tax in the rates. On appeal, the appellate court reversed the trial court and remanded the judgments to the trial court. Among other things, the appellate court found that any invalid “tax” in the 2013 rates was not necessarily equivalent to the GFT. Rather, the appellate court found that there is an unlawful tax only to the extent that rate revenues exceed lawful expenses of the utility, whether or not electric rates actually cover all lawful expenses identified when setting rates. The appellate court also found that to the extent the City maintained a "tax" - in the proportion of excess revenues to costs - prior to Propositions 26's adoption in 2010, and it could continue to maintain said “tax” at the same rate going forward. The appellate court reversed the portion of the trial court’s judgement declaring the 2013 rates invalid and requiring rebates in the amount of the annual transfers, and remanded the cases to the trial court to make certain factual determinations regarding the amount of the tax, if any. The City believes it will be able to demonstrate that the amount of the "tax" has not increased for the rate plan years at issue and thus no refunds/credits will be required. Under a decision rendered in a separate case, Citizens for Fair REU Rates v. City of Redding, Proposition 26 has been held not to limit the use of revenues raised from sources other than rates and charges levied on users of the enterprise, such as wholesale revenues and sales to other utilities ("non-rate revenues"). To the extent the GFT can be allocated to such non-rate revenues, the amount of the GFT would not be precluded by Proposition 26. The City believes that it will be able to demonstrate that the amount of such non-rate revenues is sufficient to offset amounts that would otherwise be required to be rebated to ratepayers. The City adopted a new electric rate plan in 2018, which it believes complies with the appellate court's conclusion that the GFT is not a tax if it is less than non-rate revenues (and in some cases, amounts to recover the capital replacement reserves and other expenses not fully funded in prior years). The adoption of the 2018 electric rate plan ends the accrual of any new potential refund of the GFT (but not interest) under the original trial court decision, which would now be limited to transfers made during the period FY 2013-14 to FY 2017-18 plus interest. As noted above, the GFT component of the 2018 electric rate plan is also being challenged. No assurances can be given that the General Fund Transfer will be permitted in the future, or that any amount of the prior GFT will not be subject to rebate. However, the City expects to defend the foregoing litigation vigorously and believes that it has a sound factual basis to establish that the GFT can continue to be made, and that no rebates of prior GFTs will be required, as a result of the allowable treatment of non-rate revenues. Further, the General Fund would have the ability to repay any refund to the electric utility over the same period of time that the original transfers were made (5 years).
86

CITY OF GLENDALE Notes to the Basic Financial Statements Fiscal Year Ended June 30, 2019 (in thousands) NOTE 13 – JOINTLY GOVERNED ORGANIZATIONS Joint Power Agreement for San Fernando Valley Council of Governments The San Fernando Valley Council of Governments (SFVCOG) was created through a Joint Power Agreement in 2010. The City is an active member of the SFVCOG. Other member jurisdictions currently participating include the City of Los Angeles with seven board representatives for each City Council district located entirely or partially in the San Fernando Valley, two board representatives from each of the Los Angeles County Supervisorial Districts located entirely or partially in the San Fernando Valley, and one representative each from the Cities of Burbank, Glendale, San Fernando and Santa Clarita. In its official capacity, the SFVCOG acts as a planning sub-region for the Southern California Association of Governments (SCAG) and focuses on promoting better regional coordination of planning and transportation planning efforts in the San Fernando Valley. The SFVCOG also engages in local, regional, state and federal grant development programming for the region. Joint Power Agreement for Arroyo Verdugo Communities The Arroyo Verdugo Communities was created through a Joint Power Agreement in 2017. The City is an active member of the Arroyo Verdugo Communities. Other members include City of Burbank, City La Canada Flintridge, City of Pasadena, City of South Pasadena and County of Los Angeles. The purpose of the creation of the Joint Power Authority is to provide a vehicle for the members to coordinate regional and cooperative planning, primarily in the area of transportation and determining how to prioritize regional transportation projects and allocation of Measure M sub-regional funds and other public monies, including building a more connective transportation system between the member agencies. “Take or Pay” Contracts The City has entered into twelve “Take or Pay” contracts, which require payments to be made whether or not projects are completed or operable, or whether output from such projects is suspended, interrupted or terminated. Such payments represent the City’s share of current and long-term obligations. Payment for these obligations is expected to be made from operating revenues received during the year that payment is due. These contracts provide for current and future electric generating capacity and transmission of energy for City residents. Through these contracts, the City purchased approximately 51% of its total energy requirements during FY 2018-19. With a few exceptions, the City is obligated to pay the amortized cost of indebtedness regardless of the ability of the counterparty to provide electricity. The original indebtedness will be amortized by adding the financing costs to purchase energy over the life of the contract. All of these agreements contain “step-up” provisions obligating the City to pay a share of the obligations of any defaulting participant.
• The Intermountain Power Agency (IPA), a subdivision of the State of Utah, was formed in January 1974 to finance the construction of a 1,400 megawatt coal-fired generating plant, consisting of two generating units located near Delta, Utah and associated transmission lines, called the Intermountain Power Project (IPP). The project began uprating of the two generating units in early 2003. When the uprating was finished in March 2004, it increased the capacity of the plant from 1,400 megawatts to 1,800 megawatts. The City through contract is obligated for 30 megawatts or 1.70% of the generation. In addition, the City entered into an “Excess Power Sales Agreement” with the IPA, agent for the Utah Municipal Purchasers and the Cooperative Purchasers, which entitles the City to additional shares that can vary from year to year. As of June 30, 2019, Glendale’s excess entitlement share is 0.46%. The City’s total obligation from IPP is between 35 and 38 megawatts.
87

CITY OF GLENDALE Notes to the Basic Financial Statements Fiscal Year Ended June 30, 2019 (in thousands) The City joined the Southern California Public Power Authority (SCPPA) on November 1, 1980. This authority, consisting of the California cities of Anaheim, Azusa, Banning, Burbank, Cerritos, Colton, Glendale, Los Angeles, Pasadena, Riverside, Vernon, and the Imperial Irrigation District, was formed for the purpose of financing future power resources. The City has entered into eleven projects with SCPPA.
• The first of the SCPPA projects is a 3,810 megawatt nuclear fuel generation plant in Arizona. The Palo Verde (PV) nuclear project consists of 3 units, each having an electric output of approximately 1,270 megawatts. SCPPA has purchased approximately 225 megawatts of capacity and associated energy (approximately 5.91% of total Palo Verde output), of which the City receives 9.9 megawatts or 4.40% of SCPPA’s entitlement. As of June 30, 2019, Glendale’s share is 4.40%.
• The second project financed through SCPPA is the Southern Transmission System (STS) that transmits power
from the coal-fired IPP to Southern California. The 500 kV DC line is currently rated at 2,400 megawatts. The City’s share of the line is 2.27% or approximately 55 megawatts. As of June 30, 2019, Glendale’s share is 2.27%.
• The third project financed through SCPPA is the acquisition of 41.80% ownership interest in a coal-fired 497
megawatt unit in San Juan Generating Station, Unit 3 (SJ), located in New Mexico. SCPPA members are entitled to 208 megawatts. The City is obligated for 20 megawatts or 9.80% of the SCPPA entitlement. In July 2015, the City Council authorized the SCPPA to execute, on Glendale’s behalf, a set of three agreements that collectively shut down Unit 3 at the coal-fired San Juan Power Plant in New Mexico at the end of December 2017. The termination of operations at San Juan Unit 3 will help GWP achieve California state goals regarding the reduction of greenhouse gas emissions. Under the Mine Reclamation and Plant Decommissioning Agreements, Glendale shares the responsibility for any liability arising from operations after the December 2017 exit date. As such a liability for decommissioning the power plant cannot be determined at this time. As of June 30, 2019, Glendale’s share is 9.80%.
• The fourth project financed through SCPPA is Mead-Adelanto Project (MA). The project consists of a 202-mile
500 kV AC transmission line extending between the Adelanto Substation in Southern California and the Marketplace Substation in Nevada, and the development of the Marketplace Substation at the southern Nevada terminus approximately 17 miles southwest of Boulder City, Nevada. The initial transfer capability of the Mead-Adelanto Project is estimated at 1,200 megawatts. SCPPA members in the project are entitled to 815 megawatts. The City is obligated for 90 megawatts or 11.04% of the SCPPA entitlement. As of June 30, 2019, Glendale’s share is 11.04%.
• The fifth project financed through SCPPA is Mead-Phoenix Project (MP). The project consists of a 256-mile
long 500 kV AC transmission line from the Westwing Substation in the vicinity of Phoenix, Arizona to the Marketplace Substation approximately 17 miles southwest of Boulder City, Nevada with an interconnection to the Mead Substation in southern Nevada. The project consists of three separate components: the Westwing-Mead Component, the Mead Substation Component, and the Mead-Marketplace Component. The City’s participation shares in the components range from 11.76% to 22.73%. The Mead-Phoenix Project in conjunction with the Mead-Adelanto Project provides an alternative path for the City’s purchases from the Palo Verde Nuclear Generating Station, San Juan Generating Station and Hoover Power Plant. These transmission lines also provide access to the southwest U.S. where economical coal energy is readily available. As of June 30, 2019, Glendale’s share is 14.80%.
• The sixth project financed through SCPPA is the Magnolia Power Project (MPP) located on Burbank Water and
Power’s generation station complex adjacent to Magnolia Boulevard in Burbank, California. The project consists of a combined cycle natural gas-fired generating plant with a nominally rated net base capacity of 242 megawatts. The City is obligated for 40 megawatts or 16.53% of the project’s output. As of June 30, 2019, Glendale’s generation cost share is 16.53% and indenture cost share is 17.25%.
88

CITY OF GLENDALE Notes to the Basic Financial Statements Fiscal Year Ended June 30, 2019 (in thousands)
• The seventh project financed through SCPPA is Natural Gas Prepaid Project (NGPP). In August 2007, the City entered into a 30-year Prepaid Natural Gas Agreement with the SCPPA. The agreement will provide a secure and long-term supply of natural gas up to 3,500 MMBtu per day at a discounted price below a spot market price index. The delivery of natural gas started in July 2008. As of June 30, 2019, Glendale’s share is 23.00%.
• The eighth project financed through SCPPA is the Linden Wind Energy Project (LIN) located in Klickitat County
in the state of Washington. The facility is a 50 megawatts capacity wind farm. The 25 year purchase power agreement with SCPPA is for the purchase of 10.00% (approximately 5 megawatts) of the capacity of the project. The City has sold its output entitlement share to Los Angeles Department of Water and Power (LADWP) but remains responsible for all the obligations associated with its participation in the Power Sales Agreements in the event LADWP should default. As of June 30, 2019, Glendale’s share is 10.00%.
• The ninth project financed through SCPPA is the Tieton Hydropower Project (THP) located near the town of
Tieton in Yakima County, Washington. The Project has a maximum capacity of approximately 20 megawatts. The Project includes a 115 kV transmission line, approximately 22-miles long, connecting the generating station with PacifiCorp’s Tieton Substation. The City is obligated for approximately 6.8 megawatts or 50.00% of the project’s output. As of June 30, 2019, Glendale’s share is 50.00%.
• The tenth project financed through SCPPA is Windy Point/Windy Flats project (WP) located in Klickitat County
in the state of Washington. The Project has a maximum capacity of approximately 262.2 megawatts. The City Council approved a 20 year purchase power agreement with SCPPA for the purchase of approximately 20 megawatts or 7.63% of the renewable energy output from the Project. The City has sold its output entitlement share to Los Angeles Department of Water and Power (LADWP) but remains responsible for all the obligations associated with its participation in the Power Sales Agreements in the event LADWP should default. As of June 30, 2019, Glendale’s share is 7.63%.
• The eleventh project financed through SCPPA is the Milford II Wind Project (MIL2) located near Beaver and
Millard County, Utah. The Project has a capacity of approximately 102 megawatts. The City Council approved a 20 year purchase power agreement with SCPPA for the purchase of approximately 5 megawatts or 4.90% of the Project’s output. The City has sold its output entitlement share to Los Angeles Department of Water and Power (LADWP) but remains responsible for all the obligations associated with its participation in the Power Sales Agreements in the event LADWP should default. As of June 30, 2019, Glendale’s share is 4.90%.
Take-or-Pay commitments expire upon contract expiration date or final maturity of outstanding bonds for each project, whichever is later. Final fiscal year contract expirations are as follows:
Project
Contract Expiration
Date
Glendale’s
Share
Intermountain Power Project (IPP)
2027
2.16% Palo Verde Project (PV) 2030 4.40% Southern Transmission System (STS) 2027 2.27% San Juan Project (SJ) 2018 9.80% Mead-Adelanto Project (MA) 2030 11.04% Mead-Phoenix Project (MP) 2030 14.80% Magnolia Power Project (MPP) 2036 17.25% Natural Gas Prepaid Project (NGPP) 2035 23.00% Linden Wind Energy Project (LIN) 2035 10.00% Tieton Hydropower Project (THP) 2040 50.00% Windy Point/Windy Flats Project (WP) 2030 7.63% Milford II Wind Project (MIL2) 2031 4.90%
89

CITY OF GLENDALE Notes to the Basic Financial Statements Fiscal Year Ended June 30, 2019 (in thousands) A summary of the City’s “Take or Pay” debt service commitment and the final maturity date as of June 30, 2019:
Fiscal Year IPP STS MA MP MPP NGPP LIN THP WP MIL2 Total
2020 $ 4,273 1,533 2,339 941 2,589 4,858 1,005 1,667 3,090 622 22,917 2021 3,825 1,736 1,747 698 20,954 5,066 1,007 1,667 3,089 622 40,411 2022 2,324 2,096 - - 2,216 5,245 1,004 1,666 3,085 622 18,258 2023 2,296 1,585 - - 1,940 5,309 1,003 1,665 3,081 621 17,500 2024 239 1,594 - - 1,817 5,537 1,003 1,661 3,079 620 15,550 2025-2029 - 2,913 - - 9,232 30,813 5,002 9,063 15,351 3,092 75,466 2030-2034 - - - - 9,523 36,025 4,923 8,217 6,118 1,846 66,652 2035-2039 - - - - 10,295 8,697 1,861 8,182 - - 29,035 2040-2044 - - - - - - - 4,903 - - 4,903 Total $ 12,957 11,457 4,086 1,639 58,566 101,550 16,808 38,691 36,893 8,045 290,692
In addition to debt service, the City’s entitlement requires the payment for fuel costs, operating and maintenance (O&M), administrative and general (A&G), and other miscellaneous costs associated with the generation and transmission facilities discussed above. These costs do not have a similar structured payment schedule as debt service and vary each year. The costs incurred for fiscal year 2019 and 2018 are as follows:
Fiscal Year IPP PV STS SJ MA MP MPP NGPP LIN THP WP MIL2 Total
2019 $8,380 2,919 1,058 15 388 111 4,045 3,669 - 1,380 - - 21,965 2018 $8,044 2,975 808 2,498 247 206 4,652 1,831 - 1,372 - - 22,633
NOTE 14 – SUCCESSOR AGENCY TRUST FOR ASSETS OF FORMER REDEVELOPMENT AGENCY In February 2012, the Dissolution Act (Assembly Bill x1 26; amended by AB 1484 in June 2012 and SB 107 in September 2015) dissolved California redevelopment agencies and directed their wind-down activities. In Glendale, the City chose to serve as the Glendale Successor Agency (“Agency”). This action impacted the reporting entity of the City of Glendale that had previously reported the redevelopment agency within it and as a blended component unit. Commencing on February 1, 2012, the assets and activities of the dissolved redevelopment agency were reported in a fiduciary fund (private-purpose trust fund) in the financial statements of the City. The transfer of the assets and liabilities of the former redevelopment agency from governmental funds of the City to the fiduciary fund was reported in the governmental funds as an extraordinary loss (gain) in its financial statements. The receipt of these assets and liabilities as of January 31, 2012 was reported in the private-purpose trust fund as an extraordinary gain (or loss). Since February 2012, the Agency has completed a series of reports, audits and reviews, and approvals with approval from the Oversight Board and state Department of Finance (“DOF”). These have included two detailed Due Diligence Reviews to determine unobligated fund balances available for transfer to the affected taxing entities. Once the excess funds were distributed to the taxing entities, Glendale received a Finding of Completion (FOC) in May 2013. Following the FOC, Glendale needed to address its real property assets. Thus, Glendale prepared a Long Range Property Management Plan (LRPMP) which was approved by DOF on April 16, 2014. On May 24, 2016, the DOF approved a revision to Glendale’s LRPMP to reflect the property at 300 E. Broadway as government use.
90

CITY OF GLENDALE Notes to the Basic Financial Statements Fiscal Year Ended June 30, 2019 (in thousands) With the passage of Senate Bill 107, the requirement to prepare biannual payment schedules known as Recognized Obligation Payment Schedules (ROPS) was replaced with an annual ROPS. On February 6, 2013, and again on February 11, 2014, Glendale received approval from its Oversight Board to reinstate its City-Agency loans, however, the DOF refused to approve the Oversight Board’s action contending that the Agency had incorrectly calculated the interest earned on the loans. Following unsuccessful efforts to informally resolve the disagreement by meeting and conferring with the DOF, on August 14, 2014, the City and Agency filed suit against the DOF for a determination that the Agency had correctly calculated interest on the loans. On April 16, 2015, the Sacramento Superior Court issued an order and judgment finding for the Agency and City and holding the DOF had abused its discretion when it rejected the Oversight Board’s action reinstating the City-Agency loans using the historic Local Agency Investment Fund (LAIF) rates for calculating the interest earned thereon. The Oversight Board subsequently approved a Recognized Obligation Payment Schedule (ROPS) that included the reinstated City-Agency loans using the interest rate calculation recognized by the Court’s 2015 order and judgment, but DOF denied the entire balance of the reinstated loans. Following another round of unsuccessful efforts to informally resolve the dispute by meeting and conferring with the DOF, on July 28, 2015, the City and Agency filed another lawsuit against the DOF seeking to overturn the DOF’s decision to reject the reinstated loans. On February 18, 2016, the Sacramento Superior Court entered its Judgment granting the City’s and Agency’s writ and reversing the DOF’s decision to deny the reinstated loans as enforceable obligations. The annual loan payment amount is determined by a formula specified in the Dissolution Act. In 2011, the Agency issued $50,000 in Subordinate Taxable Tax Allocation Bonds, the proceeds of which were to be deposited with the Trustee pursuant to the Indenture of Trust. The Dissolution Act initially froze all the 2011 Bond Proceeds, including the Agency’s $50,000, but subsequently authorized redevelopment agencies to spend a sliding-scale percentage of the proceeds for housing and non-housing purposes established by the Bonds depending on when the agency bonds were issued. With respect to 2011 Bonds, Glendale is authorized to spend 30% of non-housing bond proceeds (5% immediately and an additional 25% upon approval of the Agency’s Last and Final ROPS) and 100% of the housing proceeds. On January 18, 2018, the Oversight Board approved a resolution authorizing a bond expenditure agreement which would transfer bond proceeds to the City and Housing Authority, respectively, in amounts authorized by law subject to the DOF approval of the Agency’s Last and Final ROPS. Although the bond expenditure agreement did not specify any amounts and was expressly contingent of the DOF’s approval of the Last and Final ROPS, the DOF nonetheless disapproved the Agency’s Bond Expenditure Agreement alleging that the Agreement was premature, and that the Agreement would also impermissibly authorize transfer of bond reserves. On January 24, 2018, the Oversight Board approved the ROPS with line items authorizing transfer of 5% of the non-housing bond proceeds and 100% of the housing bond proceeds, but the DOF also disapproved these ROPS line items because DOF disagreed as to how the percentage of “proceeds” should be calculated. The Agency had calculated the percentage based on the commonly understood meaning of what constitutes bond “proceeds,” in this case $50,000, which is the aggregate principal amount delivered to the trustee for application to the payment of costs, deposited into the required reserve account, and transferred to the redevelopment and housing funds. DOF believed that the percentage of “proceeds” should be calculated only after reducing the proceeds by the amount of the required reserves. The Agency and DOF attempts to informally resolve the disagreement over the meaning of “proceeds” were unsuccessful and on June 28, 2018, the City and Agency filed a Petition for Writ of Mandate to overturn the DOF’s rejection of the bond transfer agreement and the ROPS line items authorizing transfer of a certain percentages of the bond proceeds. On April 8, 2019, the courts ruled the Successor Agency had correctly calculated the percentage of expendable housing and non-housing bond proceeds. The Ruling also reversed DOF’s disapproval of the Bond Expenditure Agreement and ordered DOF to approve the agreement. In FY 2018-19, DOF approved $10,667 transfer to the City: $1,976 transfer of 2011 Tax Allocation Bonds non-housing proceeds to the 2011 TABs Project Fund, and $8,691 of 2011 Tax Allocation Bonds housing proceeds to the 2011 TABs Housing Fund.
91
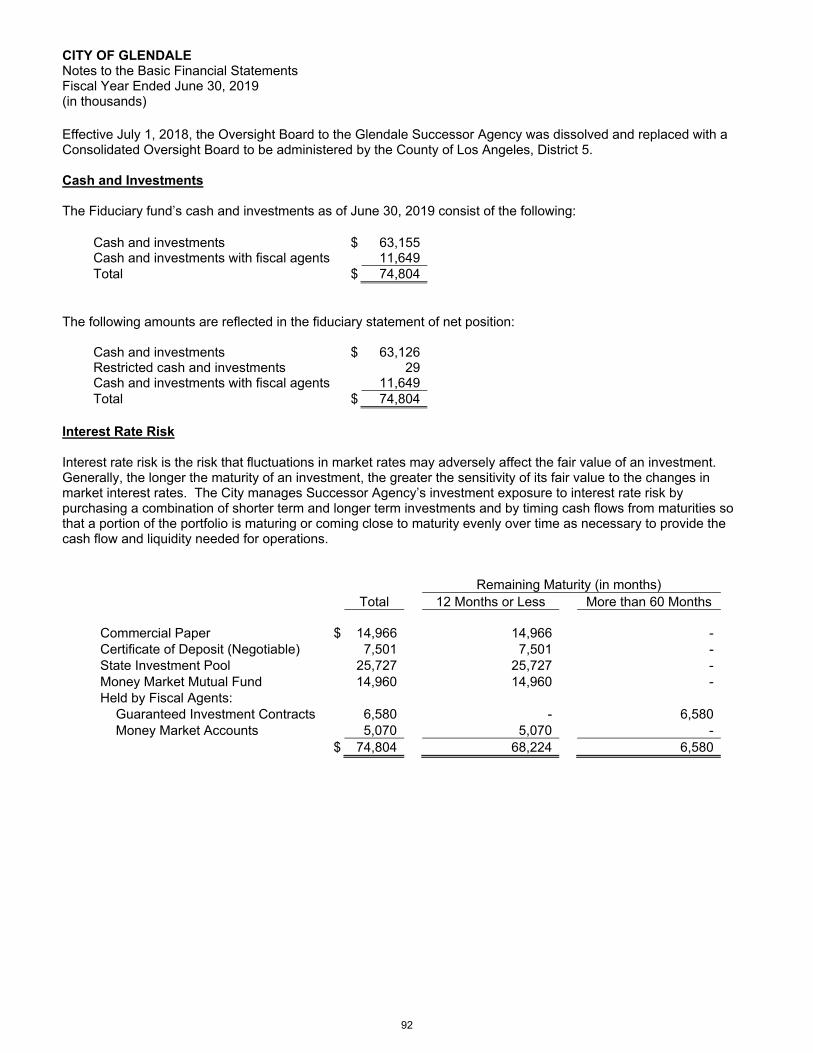
CITY OF GLENDALE Notes to the Basic Financial Statements Fiscal Year Ended June 30, 2019 (in thousands) Effective July 1, 2018, the Oversight Board to the Glendale Successor Agency was dissolved and replaced with a Consolidated Oversight Board to be administered by the County of Los Angeles, District 5. Cash and Investments The Fiduciary fund’s cash and investments as of June 30, 2019 consist of the following:
Cash and investments $ 63,155 Cash and investments with fiscal agents 11,649 Total $ 74,804
The following amounts are reflected in the fiduciary statement of net position:
Cash and investments $ 63,126 Restricted cash and investments 29 Cash and investments with fiscal agents 11,649 Total $ 74,804
Interest Rate Risk
Interest rate risk is the risk that fluctuations in market rates may adversely affect the fair value of an investment. Generally, the longer the maturity of an investment, the greater the sensitivity of its fair value to the changes in market interest rates. The City manages Successor Agency’s investment exposure to interest rate risk by purchasing a combination of shorter term and longer term investments and by timing cash flows from maturities so that a portion of the portfolio is maturing or coming close to maturity evenly over time as necessary to provide the cash flow and liquidity needed for operations.
Remaining Maturity (in months) Total 12 Months or Less More than 60 Months
Commercial Paper $ 14,966
14,966
- Certificate of Deposit (Negotiable) 7,501 7,501 - State Investment Pool 25,727 25,727 - Money Market Mutual Fund 14,960 14,960 - Held by Fiscal Agents: Guaranteed Investment Contracts 6,580 - 6,580 Money Market Accounts 5,070 5,070 - $ 74,804 68,224 6,580
92

CITY OF GLENDALE Notes to the Basic Financial Statements Fiscal Year Ended June 30, 2019 (in thousands) Credit Risks Generally, credit risk is the risk that an issuer of an investment will not fulfill its obligation to the holder of the investment. The City invests Successor Agency’s investments only in the most risk-adverse instruments, such as Aaa rated government securities, Aaa, Aa, or A rated corporate securities, and A1, P1, F1 rated commercial paper, negotiable certificates of deposit and banker’s acceptance securities. The City’s Investment Policy requires the City to sell medium term notes with a credit rating below S&P’s and Fitch’s BBB grade or Moody’s Baa2, unless the City Council approves the City Treasurer’s recommendation that the security should be retained.
Moody’s Rating as of June 30, 2019 Total Aaa P1 Unrated Commercial Paper $ 14,966 - 14,966 - Certificate of Deposit (Negotiable) 7,501 - 7,501 - State Investment Pool 25,727 - - 25,727 Money Market Mutual Fund 14,960 14,960 - - Held by Fiscal Agents: Guaranteed Investment Contracts 6,580 - - 6,580 Money Market Accounts 5,070 - 5,070 - $ 74,804 14,960 27,537 32,307
Concentration Risk The investment policy of the City covers the Glendale Successor Agency and limits the amounts that may be invested in any one issuer to 5%, 10% per bank for bankers’ acceptances, 10% per issuer for commercial paper or 10% per fund for money market mutual fund. This limit excludes investments in U.S. Treasury securities, federal agencies securities, Local Agency Investment Fund and Los Angeles County Pool. Investments in any one issuer that represents 10% or more for commercial paper of total Successor Agency investments are as follows:
Reported Issuer Investment Type Amount
MUFG Bank LDT NY Commercial Paper $ 14,966
Certificate of Deposit (Negotiable) 7,501 $ 22,467
93

CITY OF GLENDALE Notes to the Basic Financial Statements Fiscal Year Ended June 30, 2019 (in thousands) Fair Value Measurements The City categorizes Successor Agency’s fair value measurements within the fair value hierarchy established by generally accepted accounting principles. The hierarchy is based on the valuation inputs used to measure the fair value of the asset. The hierarchy gives the highest priority to unadjusted quoted prices in active markets for identical assets or liabilities (Level 1 measurements) and the lowest priority to unobservable inputs (Level 3 measurements). See note 3 for additional information on the three levels of the fair value hierarchy. As of June 30, 2019, the Successor Agency has the following fair value measurements:
Fair Value Measurements
Balance at June 30,
2019
Quoted Prices in Active
Markets for Identical Assets
(Level 1)
Significant Other
Observable Inputs
(Level 2)
Significant
Unobservable Inputs
(Level 3)
Investments by fair value level
Commercial Paper $ 14,966 - 14,966 - Certificate of Deposit (Negotiable) 7,501 - 7,501 - Total investments by fair value level 22,467 - 22,467 - Investments measured at amortized costs or not subject to fair value hierarchy:
State Investment Pool 25,727 Money Market Mutual Funds 14,960 Held by Fiscal Agents: Guaranteed Investment Contracts 6,580 Money Market Accounts 5,070
Total investments measured at amortized costs or not subject to fair value hierarchy 52,337
$ 74,804
Capital Assets
Balance at July 1 Increases Decreases
Balance at June 30
Fiduciary fund: Capital assets, not being depreciated: Land $ 33 - (33) - Depreciable capital assets: Building and improvements 377 - (377) - Less accumulated depreciation: Building and improvements 254 123 (377) -
Total assets being depreciated, net 123 (123) - -
Fiduciary fund capital assets, net $ 156 (123) (33) -
Glendale Successor Agency sold the land and building located at 117-131 Artsakh Avenue to the City in the amount of $1,530.
94

CITY OF GLENDALE Notes to the Basic Financial Statements Fiscal Year Ended June 30, 2019 (in thousands) Long-Term Debt The Glendale Successor Agency’s (Fiduciary Fund) bond ratings as of June 30, 2019 are as follows:
Debt Issue
Standard & Poor’s (S & P)
2011 GRA subordinate taxable tax allocation bonds A+ 2013 GSA tax allocation bonds, refunding series A- 2016 GSA tax allocation bonds, refunding series A-
Continuing Disclosure On November 10, 1994, the Securities and Exchange Commission (“SEC”) adopted amendments to existing federal regulations (“Rule 15c-12” or the “Rule”) under which municipalities issuing securities on or after July 3, 1995 is required to:
• Prepare official statements meeting current requirements of the Rule; • Annually file certain financial information and operating data with national and state repositories; • Prepare announcements of the significant events enumerated in the Rule.
As of June 30, 2019, the Glendale Successor Agency (Agency) had 2 tax-exempt tax allocation bond and 1 subordinate taxable tax allocation bonds. The Agency engages a consultant to prepare and disseminate continuing disclosure for its 2 tax-exempt tax allocation bonds and 1 subordinate taxable tax allocation bonds. These disclosures are disseminated through the use of Electronic Municipal Market Access (“EMMA”), the Municipal Securities Rulemaking Board’s (“MSRB”) disclosure website. Timely and accurate communication with the municipal marketplace is vital in retaining the City’s creditworthiness and market access. Continuing Disclosure and compliance reporting constitute a significant part of Debt Management’s compliance activity for the life of each series of bonds. The Fiduciary fund’s long-term debts as of June 30, 2019 consist of the following:
Issuance Amount
Balance at July 1 Additions Retirements
Balance at June 30
Due within one year
Fiduciary Activities Bonds payable:
2011 GRA Subordinate Taxable Tax Allocation Bonds $ 50,000 35,980 - 3,560 32,420 3,835
2013 GSA Tax Allocation Refunding Bonds 44,985 24,205 - 5,685 18,520 5,910 2016 GSA Tax Allocation Refunding Bonds 20,810 20,810 - - 20,810 -
GSA Tax Allocation Bonds Premium / Discount - 3,349 - 861 2,488 861
Reinstatement of Loans Payable to the City 40,133 23,271 323 10,040 13,554 3,733
Total Fiduciary Activities $ 155,928 107,615 323 20,146 87,792 14,339
95

CITY OF GLENDALE Notes to the Basic Financial Statements Fiscal Year Ended June 30, 2019 (in thousands) Subordinate Taxable Tax Allocation Bonds, 2011 Series The former Glendale Redevelopment Agency (the “Agency”) issued $50,000 in 2011 subordinate taxable tax allocation bonds with an average rate of 6.75% for 14 years. The Bonds were issued to finance redevelopment projects and low and moderate income housing activities; to fund the reserve requirement for the Bonds; and to provide for the costs of issuing the Bonds. For the security of the non-housing portion of the Bonds, the Agency grants a first pledge of and lien on all of the subordinate tax revenues consisting of non-housing tax revenues on parity with the pledge and lien which secure any parity debt. For the security of the housing portion of the Bonds, the Agency grants a first pledge of and lien on all of the subordinate tax revenues consisting of housing tax revenues, on parity with the pledge and lien which secures any parity debt. Subordinate tax revenues are pledged to the payment of principal, interest and discounts on the Bonds pursuant to the Indenture until the Bonds are paid, or until moneys are set-aside irrevocably for that purpose. The property tax derived from the former Agency’s Central Project Area is pledged to repay these Bonds until they are paid in full. The funds are distributed by the County of Los Angeles semi-annually through the ROPS process, subject to the approval by the Successor Agency’s Oversight Board and the DOF. As of June 30, 2019, the principal balance is $32,420. The bonds mature in amounts ranging from $3,835 to $7,210 from FY 2019-20 to FY 2024-25. The reserve requirement of the bond issue is satisfied by a cash reserve fund with a minimum funding requirement of $5,051 as of June 30, 2019. The 2011 Bonds has no optional redemption prior to maturity. The 2011 Bonds maturing on December 1, 2021 and December 1, 2024 are term bonds and subject to mandatory sinking fund redemption from mandatory sinking account payments. Tax Allocation Bonds, 2013 Refunding Series The Glendale Successor Agency (the “GSA”) issued $44,985 in 2013 tax allocation bonds with an average rate of 4.81% for the refunding of the former Glendale Redevelopment Agency’s (the “Agency”) outstanding Central Glendale Redevelopment Project Tax Allocation Bonds, 2002 Series and the Tax Allocation Bonds, 2003 Refunding Series (the “Prior Bonds”), and to pay the cost of issuance of the 2013 Bonds. The advance refunding of Tax Allocation Bonds, 2002 Series and the Tax Allocation Bonds, 2003 Refunding Series resulted in a difference between the reacquisition price of refunding bonds and the net carrying amount of the refunded bonds. The deferred loss on refunding as of June 30, 2019 for $652 is recognized and reported in the financial statements as a deferred outflows of resources and is being amortized through FY 2020-22. The refunding also resulted in cash flow savings of $6,583 which is the difference between the cash flows required to service the prior debt service and the cash flows required to service the new 2013 refunding bonds. The refunding of the 2002 and 2003 Tax Allocation Bonds were approved by the Oversight Board and the DOF, to provide savings until the Refunding Bonds are repaid. The property tax derived from the former Agency’s Central Project Area is pledged to repay these Bonds until they are paid in full. The funds are distributed by the County of Los Angeles semi-annually through the ROPS process, subject to the approval by the Successor Agency’s Oversight Board and the DOF. As of June 30, 2019, the principal balance is $18,520. The 2013 Bonds mature in regularly increasing principal amounts ranging from $5,910 to $6,455 from FY 2019-20 to FY 2021-22. The reserve requirement of the bond issue is satisfied by a cash reserve fund with a minimum funding requirement of $4,504 as of June 30, 2019. The 2013 Refunding Bonds are not subject to redemption prior to their stated maturities. Subordinate Tax Allocation Bonds, 2016 Refunding Series The Glendale Successor Agency (the “GSA”) issued $20,810 in 2016 tax allocation refunding bonds with an average rate of 1.74% to refinance the former Glendale Redevelopment Agency’s (the “Agency”) outstanding Central Glendale Redevelopment Project Tax Allocation Bonds, 2010 Series. The advance refunding of Tax Allocation Bonds, 2010 Series resulted in a difference between the reacquisition price of refunding bonds and the net carrying amount of the refunded bonds. The deferred loss on refunding as of June 30, 2019 for $999 is recognized and reported in the financial statements as a deferred outflows of resources and is being amortized through FY 2024-25. The refunding also resulted in cash flow savings of $5,231 which is the difference between the cash flows required to service the prior debt service and the cash flows required to service the new 2016 refunding bonds.
96

CITY OF GLENDALE Notes to the Basic Financial Statements Fiscal Year Ended June 30, 2019 (in thousands) The refunding of the 2010 Tax Allocation Bonds was approved by the Oversight Board and the DOF, to provide savings until the Refunding Bonds are repaid. The property tax derived from the former Agency’s Central Project Area is pledged to repay these Bonds until they are paid in full. The funds are distributed by the County of Los Angeles semi-annually through the ROPS process, subject to the approval by the Successor Agency’s Oversight Board and the DOF. As of June 30, 2019, the principal balance is $20,810. The 2016 Bonds mature in regularly increasing principal amounts ranging from $6,665 to $7,210 from FY 2022-23 to FY 2024-25. The reserve requirement of the bond issue is satisfied by a cash reserve fund with a minimum funding requirement of $2,094 as of June 30, 2019. The 2016 Refunding Bonds are not subject to redemption prior to their stated maturities. Loans Payable On February 6, 2013, and again on February 11, 2014, Glendale received approval from its Oversight Board to reinstate its City-Agency loans; however, the DOF refused to approve the Oversight Board’s action contending that the Agency had incorrectly calculated the interest earned on the loans. Following unsuccessful efforts to informally resolve the disagreement by meeting and conferring with the DOF, on August 14, 2014, the City and Agency filed suit against the DOF for a determination that the Agency had correctly calculated interest on the loans. On April 16, 2015, the Sacramento Superior Court issued an order and judgment finding for the Agency and City and holding the DOF had abused its discretion when it rejected the Oversight Board’s action reinstating the City-Agency Loans using the historic LAIF rates for calculating the interest earned thereon. The Oversight Board subsequently approved a Recognized Obligation Payment Schedule (ROPS) that included the reinstated City-Agency loans using the interest rate calculation recognized by the Court’s 2015 order and judgment, but DOF denied the entire balance of the reinstated loans. Following another round of unsuccessful efforts to informally resolve the dispute by meeting and conferring with the DOF, on July 28, 2015, the City and Agency filed another lawsuit against the DOF seeking to overturn the DOF’s decision to reject the reinstated loans. On February 18, 2016, the Sacramento Superior Court entered its Judgment granting the City’s and Agency’s writ and reversing the DOF’s decision to deny the reinstated loans as enforceable obligations. The annual loan payment amount is determined by a formula specified in the Dissolution Act. The DOF has approved, and the County Auditor-Controller has paid Glendale $10,040 via the ROPS process in FY 2018-19. Furthermore, 20% of any loan repayment is required to be deducted and transferred to the City’s Low and Moderate Income Housing Asset Fund. $2,008 was transferred in FY 2018-19 to the Low and Moderate Income Housing Asset Fund. As of June 30, 2019, the reinstated loan amount is $13,554 which includes $323 of capitalized interest for FY 2018-19. The Successor Agency has outstanding long-term debt of $74,238, and has direct borrowing of $13,554 with the City, and no direct placements related to fiduciary activities as of June 30, 2019. The Successor Agency also has no outstanding or unused line of credit related to long-term debt of fiduciary activities as of June 30, 2019. The fiduciary activities bonds payable do not contain a provision to pledge as collateral for debt any assets or properties owned by the Successor Agency in the event of default by the Successor Agency. The fiduciary activities bonds payable contain a provision that in an event of default, the majority owners in aggregate principal amount of the Bonds at the time outstanding can accelerate payment of the entire principal and interest amounts to become immediately due if the Successor Agency is unable to make payment, with the exception of Tax Allocation Bonds, 2013 Refunding Series and Subordinate Tax Allocation Bonds, 2016 Refunding Series that have bond insurance with Assured Guaranty Municipal Corporation and Build America Mutual Assurance Company, respectively, these bond insurers may elect at its sole discretion to pay the accelerated principal and interest payments to the extent unpaid by the Successor Agency. The fiduciary activities bonds payable contain a provision to comply with the requirements of the Redevelopment Law and shall take all actions required to prepare and file the Recognized Obligation Payment Schedules in order for the Los Angeles County Auditor-Controller to distribute from the Redevelopment Property Tax Trust Fund to Redevelopment Obligation Retirement Fund all amounts required to enable the Successor Agency to pay timely principal and interest on the 2016 Bonds, 2013 Bonds and 2011 Bonds when due including any amounts due to Bond insurers in respect of the Bond Insurance Policy.
97

CITY OF GLENDALE Notes to the Basic Financial Statements Fiscal Year Ended June 30, 2019 (in thousands) Glendale Successor Agency annual debt service requirement schedule:
Fiduciary Activities
GSA Tax Allocation Bonds
Loans Payable Total Fiduciary Activities
Fiscal Year Interest Principal
Interest Principal
Interest Principal Total Debt
Service
2020 $ 4,137 9,745
- 3,733
4,137 13,478
17,615 2021 3,557 10,280 - 4,911 3,557 15,191 18,748 2022 2,909 10,905 - 4,910 2,909 15,815 18,724 2023 2,185 12,810 - - 2,185 12,810 14,995 2024 1,380 13,590 - - 1,380 13,590 14,970
2025-2029 481 14,420 - - 481 14,420 14,901
$ 14,649 71,750 - 13,554 14,649 85,304 99,953 Net Position (Deficits) A $10,757 deficit in net position is reported in fiduciary fund as of June 30, 2019. The primary reason for the deficit is due to the outstanding tax allocation bonds and outstanding Agency loan to the City. NOTE 15 – PRONOUNCEMENTS ISSUED BUT NOT YET IMPLEMENTED The Governmental Accounting Standards Board (GASB) has issued several pronouncements that may impact future financial presentations. Management has not currently determined what, if any, impact implementation of the following statements may have on the financial statements of the City.
• GASB Statement No. 84 – Fiduciary Activities. The objective of this Statement is to improve guidance
regarding the identification of fiduciary activities for accounting and financial reporting purposes and how those activities should be reported. The statement is effective for periods beginning after December 15, 2018.
• GASB Statement No. 87 – Leases. The objective of this Statement is to better meet the information needs of
financial statement users by improving accounting and financial reporting for leases by governments. The Statement is effective for periods beginning after December 15, 2019.
• GASB Statement No. 90 – Majority Equity Interests—an amendment of GASB Statements No. 14 and No. 61.
The objective of this Statement is to improve the consistency and comparability of reporting a government’s majority equity interest in a legally separate organization and to improve the relevance of financial statement information for certain component units. The Statement is effective for periods beginning after December 15, 2018.
• GASB Statement No. 91 – Conduit Debt Obligations. The objective of this Statement is to provide a single
method of reporting conduit debt obligations by issuers and eliminate diversity in practice associated with (1) commitments-extend by issuers, (2) arrangements associated with conduit debt obligations, and (3) related note disclosures. The Statement is effective for periods beginning after December 15, 2020.
98

CITY OF GLENDALE Notes to the Basic Financial Statements Fiscal Year Ended June 30, 2019 (in thousands) NOTE 16 – IMPLEMENTATION OF PRONOUNCEMENTS The City has adopted and implemented, where applicable, the following GASB Statements during the year ended June 30, 2019:
• GASB Statement No. 83 – Certain Asset Retirement Obligations. The objective of this Statement is to address accounting and financial reporting for certain asset retirement obligations. This statement was implemented effective July 1, 2018, and did not have a material effect on the financial statements.
• GASB Statement No. 88 – Certain Disclosures Related to Debt, Including Direct Borrowing and Direct
Placements. The objective of this Statement is to improve the information that is disclosed in notes to government financial statements related to debt, including direct borrowings and direct placements. It also clarified which liabilities government should include when disclosing information related to debt. This statement was implemented effective July 1, 2018.
99

CITY OF GLENDALERequired Supplementary InformationLast Ten Fiscal Years(in thousands)
2019 2018 2017 2016 2015
Total pension liabilityService cost $ 15,956 15,513 13,413 14,372 14,951 Interest on the total pension liability 76,746 74,508 73,104 71,411 69,351 Differences between expected and actual experience 1,240 (11,313) (12,487) (8,835) - Changes of assumptions (6,403) 62,163 - (17,578) - Benefit payments, including refunds of employee contributions (54,969) (52,599) (51,297) (50,059) (47,552)
Net change in total pension liability 32,570 88,272 22,733 9,311 36,750 Total pension liability - beginning 1,098,040 1,009,768 987,035 977,724 940,974
Total pension liability - ending (A) 1,130,610 1,098,040 1,009,768 987,035 977,724
Plan fiduciary net positionPlan to plan resource movement (2) 2 - (25) - Contributions from the employer 22,006 18,558 16,517 13,344 14,431 Contributions from employees 8,996 8,518 8,092 8,142 8,202 Net investment income 67,307 82,439 3,709 17,215 117,615 Benefit payments, including refunds of employee contributions (54,969) (52,599) (51,297) (50,059) (47,552) Administrative expense (1,249) (1,101) (469) (881) - Other miscellaneous income/(expense) (2,372) - - - -
Net change in fiduciary net position 39,717 55,817 (23,448) (12,264) 92,696 Plan fiduciary net position - beginning 801,698 745,881 769,329 781,593 688,897
Plan fiduciary net position - ending (B) 841,415 801,698 745,881 769,329 781,593
Net pension liability - ending (A) - (B) $ 289,195 296,342 263,887 217,706 196,131
Plan fiduciary net position as a percentage of the total pension liability 74.42% 73.01% 73.87% 77.94% 79.94%
Covered payroll $ 92,799 90,627 86,558 91,786 91,275
Net pension liability as a percentage of covered payroll 311.64% 326.99% 304.87% 237.19% 214.88%
Measurement date June 30, 2018 June 30, 2017 June 30, 2016 June 30, 2015 June 30, 2014
Note:
FY 2015 is the first year of implementation of GASB 68; therefore, only five years of data are shown.
Schedule of Changes in Net Pension Liability and Related Ratios - Miscellaneous Plan
Fiscal Year
100

CITY OF GLENDALERequired Supplementary InformationLast Ten Fiscal Years(in thousands)
2019 2018 2017 2016 2015
Total pension liabilityService cost $ 14,872 14,641 12,975 13,038 13,249 Interest on the total pension liability 57,734 56,003 54,489 52,434 50,558 Differences between expected and actual experience (3,943) (7,654) (3,055) (5,684) - Changes of assumptions (3,509) 47,703 - (13,128) - Benefit payments, including refunds of employee contributions (40,017) (38,186) (36,522) (34,522) (32,654)
Net change in total pension liability 25,137 72,507 27,887 12,138 31,153 Total pension liability - beginning 827,494 754,987 727,100 714,962 683,809
Total pension liability - ending (A) 852,631 827,494 754,987 727,100 714,962
Plan fiduciary net positionPlan to plan resource movement (1) (2) - - - Contributions from the employer 22,548 19,843 18,266 16,789 14,887 Contributions from employees 4,602 4,305 4,517 4,394 4,716 Net investment income 45,731 55,289 2,584 11,489 77,826 Benefit payments, including refunds of employee contributions (40,017) (38,186) (36,522) (34,522) (32,654) Administrative expense (847) (743) (314) (579) - Other miscellaneous income/(expense) (1,609) - - - -
Net change in fiduciary net position 30,407 40,506 (11,469) (2,429) 64,775 Plan fiduciary net position - beginning 543,661 503,155 514,624 517,053 452,278
Plan fiduciary net position - ending (B) 574,068 543,661 503,155 514,624 517,053
Net pension liability - ending (A) - (B) $ 278,563 283,833 251,832 212,476 197,909
Plan fiduciary net position as a percentage of the total pension liability 67.33% 65.70% 66.64% 70.78% 72.32%
Covered payroll $ 49,624 48,322 48,245 48,174 47,373
Net pension liability as a percentage of covered payroll 561.35% 587.38% 521.99% 441.06% 417.77%
Measurement date June 30, 2018 June 30, 2017 June 30, 2016 June 30, 2015 June 30, 2014
Note:
Schedule of Changes in Net Pension Liability and Related Ratios - Safety Plan
FY 2015 is the first year of implementation of GASB 68; therefore, only five years of data are shown.
Fiscal Year
101

CITY OF GLENDALERequired Supplementary InformationLast Ten Fiscal Years(in thousands)
2019 2018 2017 2016 2015
Actuarially determined contributions $ 27,791 23,741 18,972 16,519 13,357 Contributions in relation to the actuarially determined contribution (27,791) (23,741) (18,972) (16,519) (13,357)
Contribution deficiency (excess) - - - - -
Covered payroll $ 95,021 92,799 90,627 86,558 91,786
Contributions as a percentage of covered payroll 29.247% 25.583% 20.934% 19.084% 14.552%
Notes to Schedule:
Valuation date:Actuarially determined contribution rates are calculated as of June 30th, three years prior to the end of fiscal year in which contributionare reported.
Actuarial cost method Entry age normal cost method
Amortization method
Asset valuation method
Discount rate 7.375% (net of investment and administrative expenses)
Projected salary increases
Inflation 2.75%
Payroll growth 3.00%
Retirement age 59
Note:
FY 2015 is the first year of implementation of GASB 68; therefore, only five years of data are shown.
Schedule of Plan Contributions - Miscellaneous Plan
Direct rate smoothing. Beginning with the 2013 actuarial valuation, the market value method was used.
3.30% to 14.20%, depending on age, service, and type of employment. Beginning with the 2014 actuarial valuation, 3.20% to 12.20%, depending on age, service, and type of employment.
Level percentage of payroll. Beginning with the 2013 actuarial valuation, new gains or losses are amortized over a fixed 30-year period with a 5 year ramp up at the beginning and a 5 year ramp down at the end of the amortization period. All changes in liability due to plan amendments (other than golden handshakes) over a 20 year period with no ramp. Changes in actuarial assumptions, or changes in actuarial methology over a 20-year period with a 5 year ramp up at the beginning and a 5 year ramp down at the end of the amortization period. Changes in liability due to a golden handshake over a period of 5 years.
Fiscal Year
102

CITY OF GLENDALERequired Supplementary InformationLast Ten Fiscal Years(in thousands)
2019 2018 2017 2016 2015
Actuarially determined contributions $ 25,487 22,470 19,984 18,257 16,772 Contributions in relation to the actuarially determined contribution (25,487) (22,470) (19,984) (18,257) (16,772)
Contribution deficiency (excess) - - - - -
Covered payroll $ 52,647 49,624 48,322 48,245 48,174
Contributions as a percentage of covered payroll 48.411% 45.281% 41.356% 37.842% 34.815%
Notes to Schedule:
Valuation date:Actuarially determined contribution rates are calculated as of June 30th, three years prior to the end of fiscal year in which contributionare reported.
Actuarial cost method Entry age normal cost method
Amortization method
Asset valuation method
Discount rate 7.375% (net of investment and administrative expenses)
Projected salary increases
Inflation 2.75%
Payroll growth 3.00%
Retirement age 54
Note:
Schedule of Plan Contributions - Safety Plan
FY 2015 is the first year of implementation of GASB 68; therefore, only five years of data are shown.
Level percentage of payroll. Beginning with the 2013 actuarial valuation, new gains or losses are amortized over a fixed 30-year period with a 5 year ramp up at the beginning and a 5 year ramp down at the end of the amortization period. All changes in liability due to plan amendments (other than golden handshakes) over a 20 year period with no ramp. Changes in actuarial assumptions, or changes in actuarial methology over a 20-year period with a 5 year ramp up at the beginning and a 5 year ramp down at the end of the amortization period. Changes in liability due to a golden handshake over a period of 5 years.
Direct rate smoothing. Beginning with the 2013 actuarial valuation, the market value method was used.
3.30% to 14.20%, depending on age, service, and type of employment. Beginning with the 2014 actuarial valuation, 3.40% to 20.00%, depending on age, service, and type of employment.
Fiscal Year
103

CITY OF GLENDALERequired Supplementary InformationLast Ten Fiscal Years(in thousands)
2019 2018
Total OPEB liabilityService cost $ 46 57 Interest on the total OPEB liability 556 493 Changes of assumptions (619) (1,790) Benefit payments (507) (487)
Net change in total OPEB liability (524) (1,727) Total OPEB liability - beginning 15,738 17,465
Total OPEB liability - ending 15,214 15,738
Covered-employee payroll $ 156,117 150,107
Total OPEB liability as a percentage of covered employee payroll 9.75% 10.48%
Measurement date June 30, 2018 June 30, 2017
Note:
FY 2018 is the first year of implementation of GASB 75; therefore, only two years of data is shown.
Schedule of Changes in Total OPEB Liability and Related Ratios
Fiscal Year
104

Nonm
ajor Governm
ental Funds
Nonmajor Governmental Funds
This section of the CAFR provides information on each individual governmentalfund, except for those major governmental funds reported in the basic financialstatements: General Fund, Housing Assistance Fund and Capital ImprovementFund. This section includes special revenue funds, debt service funds, and capitalprojects funds.

Exhibit G-1CITY OF GLENDALECombining Governmental Balance Sheet Nonmajor Governmental Funds June 30, 2019(amounts expressed in thousands)
Special revenue funds
Debt service funds
Capital projects funds
Total Nonmajor Governmental
FundsASSETSPooled cash and investments $ 104,780 $ 15,303 $ 83,498 $ 203,581 Restricted cash and investments - - 37,103 37,103 Interest receivable 498 74 567 1,139 Accounts receivable, net 10,616 - 5,257 15,873 Prepaid items 47 - - 47
Total assets 115,941 15,377 126,425 257,743
LIABILITIESAccounts payable 6,026 5 2,997 9,028 Wages and benefits payable 834 - 86 920 Due to other funds 2,743 - 1,844 4,587 Unearned revenues 564 - - 564 Deposits 60 - 15 75
Total liabilities 10,227 5 4,942 15,174
DEFERRED INFLOWS OF RESOURCESUnavailable revenues 3,436 - 3,805 7,241
Total liabilities and deferred inflows of resources 13,663 5 8,747 22,415
FUND BALANCES (DEFICITS) Nonspendable
Prepaid 47 - - 47 Restricted
Air quality improvement 635 - - 635 Cable access 4,044 - - 4,044 Capital projects - - 45,773 45,773 Electric public benefit AB1890 5,903 - - 5,903 Federal and state grants 5,043 - - 5,043 Landfill postclosure - - 37,286 37,286 Landscaping district 239 - - 239 Low and moderate housing 23,413 - - 23,413 Public safety 3,600 - - 3,600 State gas tax mandates - - 8,473 8,473 Transportation 37,223 - - 37,223 Youth employment 33 - - 33
Committed Capital projects - - 1,976 1,976 Debt service - 15,372 - 15,372 Hazardous materials 3,294 - - 3,294 Impact fee funded projects - - 27,668 27,668 Parking 13,077 - - 13,077 Public safety 448 - - 448 Urban art 8,130 - - 8,130
Unassigned (2,851) - (3,498) (6,349)Total fund balances (deficits) 102,278 15,372 117,678 235,328
Total liabilities, deferred inflows of resources and fund balances (deficits) $ 115,941 $ 15,377 $ 126,425 $ 257,743
105

Exhibit G-2 CITY OF GLENDALE Combining Statement of Revenues, Expenditures, and Changes in Fund Balances Nonmajor Governmental Funds For the Year Ended June 30, 2019 (amounts expressed in thousands)
Special revenue funds
Debt service funds
Capital projects funds
Total Nonmajor Governmental
FundsREVENUES Sales tax $ 5,390 $ - $ - $ 5,390 Other taxes 6,714 - - 6,714 Revenue from other agencies 26,799 - 17,603 44,402 Licenses and permits 919 - 3,342 4,261 Fines and forfeitures 3,003 - - 3,003 Charges for services 25,277 - - 25,277 Use of money and property 4,977 687 3,961 9,625 Miscellaneous revenue 1,780 - 44 1,824
Total revenues 74,859 687 24,950 100,496 EXPENDITURES Current:
General government 925 - - 925 Police 1,048 8 - 1,056 Fire 3,075 - - 3,075 Public works 8,736 - 1,826 10,562 Transportation 14,760 - - 14,760 Housing, health and community development 6,681 - 35 6,716 Employment programs 7,449 - - 7,449 Public service 6,177 - - 6,177 Parks, recreation and community services 4,341 - 162 4,503 Library 438 - 16 454
Debt service: Principal retirement 212 1,985 - 2,197 Interest 18 751 - 769 Bond issuance costs - 357 - 357
Capital outlay 5,112 - 9,710 14,822 Total expenditures 58,972 3,101 11,749 73,822
Excess (deficiency) of revenues over (under) expenditures 15,887 (2,414) 13,201 26,674
OTHER FINANCING SOURCES (USES) Transfers in 2,093 16,372 4,560 23,025 Transfers out (5,330) (15,372) - (20,702)Refunding bonds issued - 24,925 - 24,925 Premium on refunding bonds issued - 5,327 - 5,327 Payment to refunded bond escrow agent - (29,895) - (29,895)
Total other financing sources (uses) (3,237) 1,357 4,560 2,680 SPECIAL ITEMTransfer of bond proceeds from Successor Agency 8,691 - 1,976 10,667
Net change in fund balances 21,341 (1,057) 19,737 40,021
Fund balances - beginning 80,937 16,429 97,941 195,307
Fund balances - ending $ 102,278 $ 15,372 $ 117,678 $ 235,328
106

Special Revenue Funds
Special Revenue Funds are used to account for the proceeds of specific revenueresources that are restricted or committed to expenditures for specified purposes,as required by law or administrative regulation.
Special Revenue Funds

SPECIAL REVENUE FUNDS 2010 - CDBG Fund - To account for monies received and expended by the City as a participant in the Federal
Community Development Block Grant (CDBG) Program.
2030 - Home Grant Fund - To account for monies received and expended by the City under the HOME Investment Partnerships Program to strengthen public-private partnerships and to preserve and provide affordable housing.
2040 - Continuum of Care Grant Fund - To account for monies received and expended by the City under the Continuum of Care Grant Program to address the homeless needs of the City.
2050 - Emergency Solutions Grant Fund - To account for monies received and expended by the City under the Emergency Solutions Grant Program to address the homeless needs of the City.
2060 - Workforce Innovation and Opportunity Act Fund - To account for monies received and expended for the federal, state and local-funded job training programs.
2090 - Affordable Housing Trust Fund - To account for monies received from inclusionary housing fees in the San
Fernando Road Corridor Redevelopment Project Area, from affordable housing density bonus fees and miscellaneous program income, and expended for affordable housing development, monitoring, and administration.
2100 - Urban Art Fund - To account for the art fees collected from the City developments that are committed to support the public art installation and maintenance, in accordance with the City’s Urban Art Program Guidelines.
2110 - Glendale Youth Alliance Fund - To account for monies received and expended in the youth employment programs.
2120 - BEGIN Affordable Homeownership Fund - To account for monies received and expended by the City under the Building Equity and Growth in Neighborhoods (BEGIN) grant to provide down payment assistance or homeowner rehabilitation loans to low and moderate income homebuyers
2130 - Low & Moderate Income Housing Asset Fund - To account for monies received and expended for low and
moderate income housing activities pursuant to AB1484.
2160 - Grant Fund - To account for miscellaneous grant monies received and expended by the City that are not accounted for in other specific grant funds.
2170 - Filming Fund - To account for monies received and expended by the City relating to filming activities.
2180 - Recreation Fund - To account for the user fees collected from the recreation programs of the Community
Services and Parks department that are committed to provide variety of recreational opportunities, enrichment programs, and social service programs for all ages and abilities.
2190 - Hazardous Disposal Fund - To account for the revenues from hazardous permits and waste disposal fees
that are committed to recycle household hazardous waste, in order to divert this waste from landfill.
2210 - Parking Fund - To account for the parking revenues collected from the operations of City owned public parking lots and garages that are committed to operate City owned parking structures, public parking lots and the administration of the residential preferential parking program.
2220 – Measure M Local Return Fund - To account for monies received from the ½ cent sales tax increase
approved in November 2016 by Los Angeles County voters and the related transportation and traffic congestion expenses.
2240 - Measure H Fund - To account for monies received from the ¼ cent sales tax increase approved in March 2017 by Los Angeles County voters and the related homeless services and prevention expenses.
107

2250 - 2011 TABs Housing Fund - To account for housing expenses funded by the Glendale Successor Agency 2011 Tax Allocation Bonds (housing portion).
2510 - Air Quality Improvement Fund - To account for monies received from South Coast Air Quality Management
District and expended on air pollution reduction.
2520 - PW Special Grants Fund - To account for various grants received and expended by the City in the Public Works (PW) department.
2530 - San Fernando Landscape District Fund - To account for assessments and expenditures associated with the San Fernando Road Corridor (SFRC) Landscape & Maintenance District Project.
2540 - Measure R Local Return Fund - To account for monies received from the ½ cent sales tax increase approved in November 2008 by Los Angeles County voters, and the related transportation and street expenses.
2550 - Measure R Regional Return Fund - To account for monies received from the various grants that are funded by the Measure R, which is the ½ cent sales tax increase approved in November 2008 by Los Angeles County voters, and the related transportation and street project expenses.
2560 - Transit Prop A Local Return Fund - To account for monies received from a portion of the sales tax via Prop A which is restricted to transportation-related activities.
2570 - Transit Prop C Local Return Fund - To account for monies received from a portion of the sales tax via Prop C which is restricted to transportation-related activities.
2580 - Transit Utility Fund - To capture the revenues and expenses associated with the operation of fixed route and demand response transit services for reporting to state and federal regulators.
2600 - Asset Forfeiture Fund - To account for the proceeds of money or property seized as a result of illegal activity which is restricted to law enforcement uses.
2610 - Police Special Grants Fund - To account for various grants received and expended by the City in the Police department.
2620 - Supplemental Law Enforcement Fund - To account for monies received from the State of California to provide funding for local agencies for the Citizen’s Option for Public Safety Program (COPS).
2650 - Fire Grant Fund - To account for grant monies received and expended for fire prevention programs.
2660 - Fire Mutual Aid Fund - To account for the reimbursements received from either the Federal government or the State of California that are committed for the City’s fire strike team labor costs, fire equipment charges as well as overhead costs incurred by the City in assisting fire incidents outside of the City’s jurisdiction.
2670 - Special Events Fund - To account for the monies received from the Police and Fire special events that are committed for the related personnel and operation costs.
2700 - Nutritional Meals Grant Fund - To account for monies received from Federal assistance programs for senior citizen services.
2750 - Library Fund - To account for the various grant monies and donations received from Federal, State and local agencies that are restricted for library services.
2800 - Cable Access Fund - To account for the cable access fee that is restricted to provide for resources to broadcast the City Council meetings and other various commissions, forums, etc.
2910 - Electric Public Benefit Fund - To account for the fee assessed on the electric customers to fund public benefit programs such as low income projects, research and development and demonstration program as mandated by State of California, AB 1890.
108
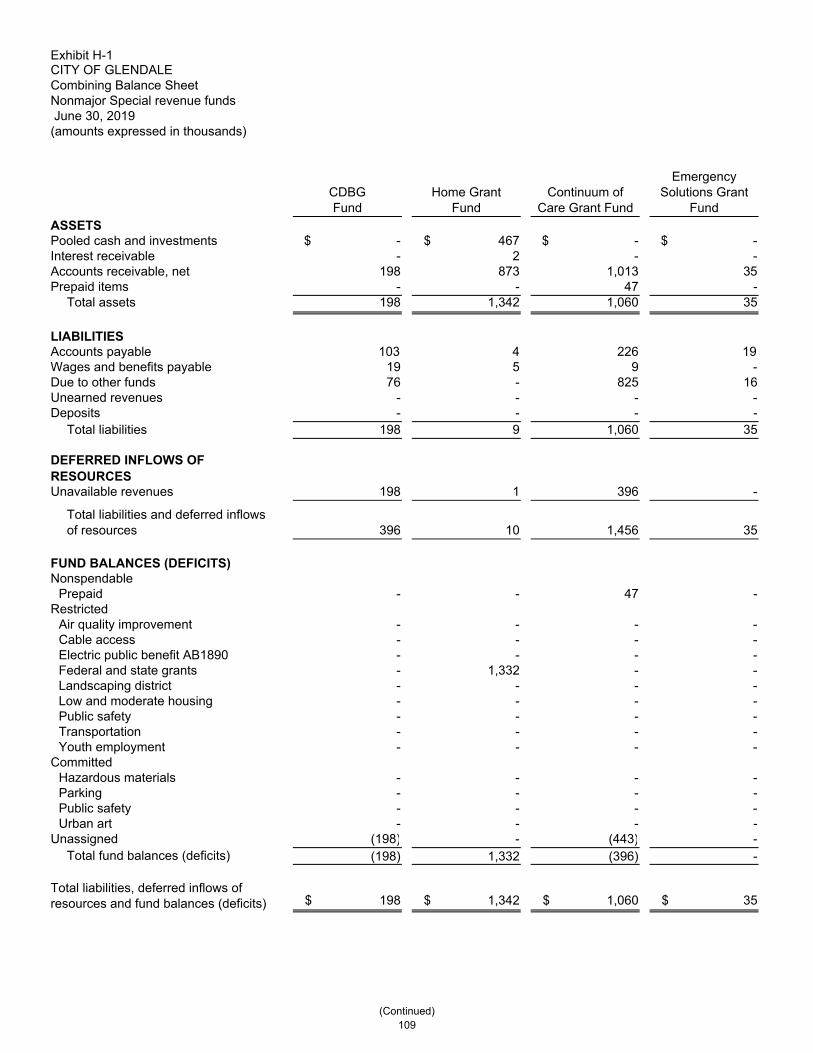
Exhibit H-1 CITY OF GLENDALE Combining Balance Sheet Nonmajor Special revenue funds June 30, 2019 (amounts expressed in thousands)
CDBGFund
Home GrantFund
Continuum of Care Grant Fund
Emergency Solutions Grant
FundASSETS Pooled cash and investments $ - $ 467 $ - $ - Interest receivable - 2 - - Accounts receivable, net 198 873 1,013 35 Prepaid items - - 47 -
Total assets 198 1,342 1,060 35
LIABILITIES Accounts payable 103 4 226 19Wages and benefits payable 19 5 9 - Due to other funds 76 - 825 16 Unearned revenues - - - - Deposits - - - -
Total liabilities 198 9 1,060 35
DEFERRED INFLOWS OFRESOURCES Unavailable revenues 198 1 396 -
Total liabilities and deferred inflowsof resources 396 10 1,456 35
FUND BALANCES (DEFICITS) Nonspendable
Prepaid - - 47 - Restricted
Air quality improvement - - - - Cable access - - - - Electric public benefit AB1890 - - - - Federal and state grants - 1,332 - - Landscaping district - - - - Low and moderate housing - - - - Public safety - - - - Transportation - - - - Youth employment - - - -
Committed Hazardous materials - - - - Parking - - - - Public safety - - - - Urban art - - - -
Unassigned (198) - (443) - Total fund balances (deficits) (198) 1,332 (396) -
Total liabilities, deferred inflows ofresources and fund balances (deficits) $ 198 $ 1,342 $ 1,060 $ 35
(Continued) 109

Exhibit H-1 CITY OF GLENDALE Combining Balance Sheet Nonmajor Special revenue funds June 30, 2019 (amounts expressed in thousands)
ASSETS Pooled cash and investments Interest receivable Accounts receivable, net Prepaid items
Total assets
LIABILITIES Accounts payable Wages and benefits payable Due to other funds Unearned revenues Deposits
Total liabilities
DEFERRED INFLOWS OFRESOURCES Unavailable revenues
Total liabilities and deferred inflowsof resources
FUND BALANCES (DEFICITS) Nonspendable
Prepaid Restricted
Air quality improvement Cable access Electric public benefit AB1890 Federal and state grants Landscaping district Low and moderate housing Public safety Transportation Youth employment
Committed Hazardous materials Parking Public safety Urban art
Unassigned Total fund balances (deficits)
Total liabilities, deferred inflows ofresources and fund balances (deficits)
Workforce Innovation and Opportunity Act
Fund
Affordable Housing Trust
FundUrban Art
FundGlendale Youth Alliance Fund
$ 1,146 $ 2,555 $ 8,098 $ - 5 12 39 -
1,179 - - 239 - - - -
2,330 2,567 8,137 239
578 - 7 1 162 - - 124
- - - 80 - - - - - - - -
740 - 7 205
- - - 1
740 - 7 206
- - - -
- - - - - - - - - - - -
1,590 - - - - - - - - 2,567 - -
- - - - - - - - - - - 33
- - - - - - - - - - - - - - 8,130 -
- - - - 1,590 2,567 8,130 33
$ 2,330 $ 2,567 $ 8,137 $ 239
(Continued) 110

Exhibit H-1 CITY OF GLENDALE Combining Balance Sheet Nonmajor Special revenue funds June 30, 2019 (amounts expressed in thousands)
ASSETS Pooled cash and investments Interest receivable Accounts receivable, net Prepaid items
Total assets
LIABILITIES Accounts payable Wages and benefits payable Due to other funds Unearned revenues Deposits
Total liabilities
DEFERRED INFLOWS OFRESOURCES Unavailable revenues
Total liabilities and deferred inflowsof resources
FUND BALANCES (DEFICITS) Nonspendable
Prepaid Restricted
Air quality improvement Cable access Electric public benefit AB1890 Federal and state grants Landscaping district Low and moderate housing Public safety Transportation Youth employment
Committed Hazardous materials Parking Public safety Urban art
Unassigned Total fund balances (deficits)
Total liabilities, deferred inflows ofresources and fund balances (deficits)
BEGIN Affordable Homeownership
Fund
Low & Moderate Income Housing
Asset FundGrantFund
FilmingFund
$ 11 $ 12,065 $ 680 $ - - 59 3 - - - 165 - - - - -
11 12,124 848 -
- 188 65 - - 24 7 - - - - - - - - - - - - - - 212 72 -
- - 68 -
- 212 140 -
- - - -
- - - - - - - - - - - -
11 - 708 - - - - - - 11,912 - -
- - - - - - - - - - - -
- - - - - - - - - - - - - - - - - - - -
11 11,912 708 -
$ 11 $ 12,124 $ 848 $ -
(Continued) 111
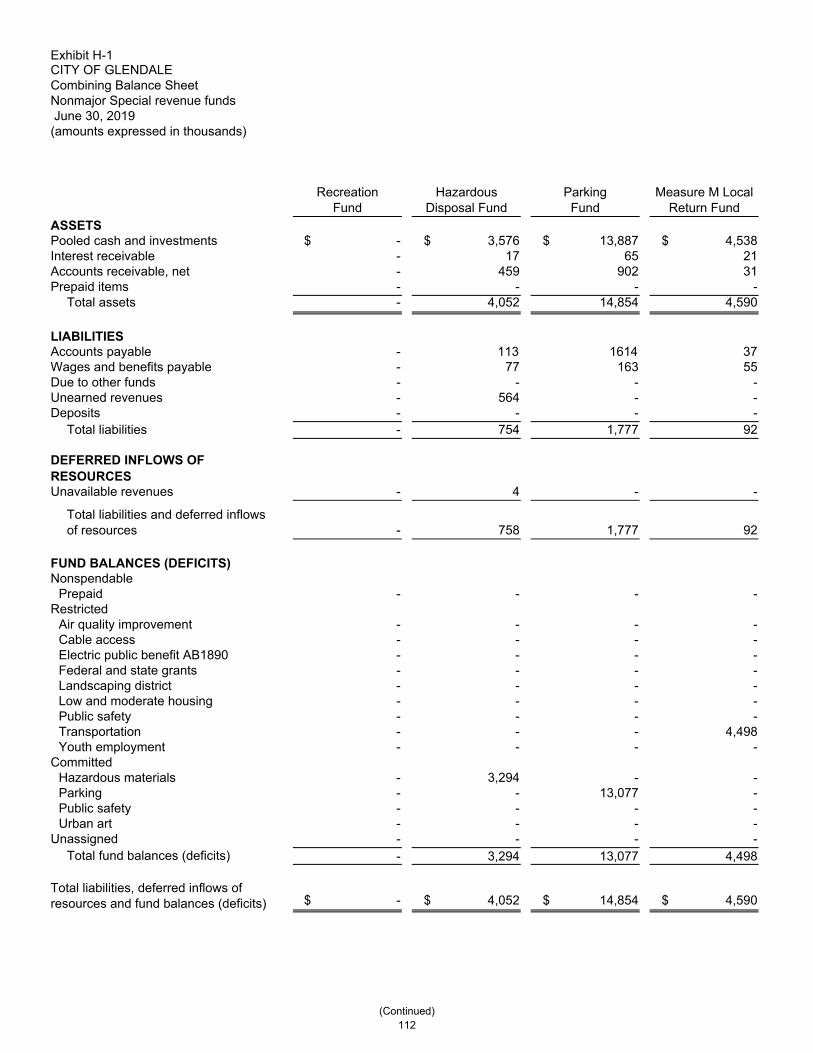
Exhibit H-1 CITY OF GLENDALE Combining Balance Sheet Nonmajor Special revenue funds June 30, 2019 (amounts expressed in thousands)
ASSETS Pooled cash and investments Interest receivable Accounts receivable, net Prepaid items
Total assets
LIABILITIES Accounts payable Wages and benefits payable Due to other funds Unearned revenues Deposits
Total liabilities
DEFERRED INFLOWS OFRESOURCES Unavailable revenues
Total liabilities and deferred inflowsof resources
FUND BALANCES (DEFICITS) Nonspendable
Prepaid Restricted
Air quality improvement Cable access Electric public benefit AB1890 Federal and state grants Landscaping district Low and moderate housing Public safety Transportation Youth employment
Committed Hazardous materials Parking Public safety Urban art
Unassigned Total fund balances (deficits)
Total liabilities, deferred inflows ofresources and fund balances (deficits)
RecreationFund
Hazardous Disposal Fund
ParkingFund
Measure M Local Return Fund
$ - $ 3,576 $ 13,887 $ 4,538 - 17 65 21 - 459 902 31 - - - - - 4,052 14,854 4,590
- 113 1614 37 - 77 163 55 - - - - - 564 - - - - - - - 754 1,777 92
- 4 - -
- 758 1,777 92
- - - -
- - - - - - - - - - - - - - - - - - - - - - - - - - - - - - - 4,498 - - - -
- 3,294 - - - - 13,077 -
- - - - - - - - - - - - - 3,294 13,077 4,498
$ - $ 4,052 $ 14,854 $ 4,590
(Continued) 112

Exhibit H-1 CITY OF GLENDALE Combining Balance Sheet Nonmajor Special revenue funds June 30, 2019 (amounts expressed in thousands)
ASSETS Pooled cash and investments Interest receivable Accounts receivable, net Prepaid items
Total assets
LIABILITIES Accounts payable Wages and benefits payable Due to other funds Unearned revenues Deposits
Total liabilities
DEFERRED INFLOWS OFRESOURCES Unavailable revenues
Total liabilities and deferred inflowsof resources
FUND BALANCES (DEFICITS) Nonspendable
Prepaid Restricted
Air quality improvement Cable access Electric public benefit AB1890 Federal and state grants Landscaping district Low and moderate housing Public safety Transportation Youth employment
Committed Hazardous materials Parking Public safety Urban art
Unassigned Total fund balances (deficits)
Total liabilities, deferred inflows ofresources and fund balances (deficits)
Measure HFund
2011 TABs Housing Fund
Air Quality Improvement
FundPW Special Grants Fund
$ - $ 8,896 $ 590 $ - - 38 3 -
38 - 69 86 - - - -
38 8,934 662 86
18 - 25 - - - 2 -
62 - - 36 - - - - - - - -
80 - 27 36
14 - - 86
94 - 27 122
- - - -
- - 635 - - - - - - - - - - - - - - - - - - 8,934 - -
- - - - - - - - - - - -
- - - - - - - - - - - - - - - -
(56) - - (36)(56) 8,934 635 (36)
$ 38 $ 8,934 $ 662 $ 86
(Continued) 113

Exhibit H-1 CITY OF GLENDALE Combining Balance Sheet Nonmajor Special revenue funds June 30, 2019 (amounts expressed in thousands)
ASSETS Pooled cash and investments Interest receivable Accounts receivable, net Prepaid items
Total assets
LIABILITIES Accounts payable Wages and benefits payable Due to other funds Unearned revenues Deposits
Total liabilities
DEFERRED INFLOWS OFRESOURCES Unavailable revenues
Total liabilities and deferred inflowsof resources
FUND BALANCES (DEFICITS) Nonspendable
Prepaid Restricted
Air quality improvement Cable access Electric public benefit AB1890 Federal and state grants Landscaping district Low and moderate housing Public safety Transportation Youth employment
Committed Hazardous materials Parking Public safety Urban art
Unassigned Total fund balances (deficits)
Total liabilities, deferred inflows ofresources and fund balances (deficits)
San Fernando Landscape District
FundMeasure R Local
Return Fund
Measure R Regional Return
FundTransit Prop A
Local Return Fund
$ 260 $ 13,874 $ - $ 12,009 1 68 - 50 3 2 2,354 325 - - - -
264 13,944 2,354 12,384
25 592 797 475 - - 15 24 - - 1,418 -
- - - - - - - -
25 592 2,230 499
- - 2,198 22
25 592 4,428 521
- - - -
- - - - - - - - - - - - - - - -
239 - - - - - - - - - - - - 13,352 - 11,863
- - - -
- - - - - - - - - - - - - - - - - - (2,074) -
239 13,352 (2,074) 11,863
$ 264 $ 13,944 $ 2,354 $ 12,384
(Continued) 114

Exhibit H-1 CITY OF GLENDALE Combining Balance Sheet Nonmajor Special revenue funds June 30, 2019 (amounts expressed in thousands)
ASSETS Pooled cash and investments Interest receivable Accounts receivable, net Prepaid items
Total assets
LIABILITIES Accounts payable Wages and benefits payable Due to other funds Unearned revenues Deposits
Total liabilities
DEFERRED INFLOWS OFRESOURCES Unavailable revenues
Total liabilities and deferred inflowsof resources
FUND BALANCES (DEFICITS) Nonspendable
Prepaid Restricted
Air quality improvement Cable access Electric public benefit AB1890 Federal and state grants Landscaping district Low and moderate housing Public safety Transportation Youth employment
Committed Hazardous materials Parking Public safety Urban art
Unassigned Total fund balances (deficits)
Total liabilities, deferred inflows ofresources and fund balances (deficits)
Transit Prop C Local Return Fund
Transit Utility Fund
Asset Forfeiture Fund
Police Special Grants Fund
$ 7,785 $ - $ 2,777 $ 354 43 - 13 1
307 - - 404 - - - -
8,135 - 2,790 759
605 - - 67 11 - - 47
- - - - - - - - - - - 60
616 - - 174
9 - - 198
625 - - 372
- - - -
- - - - - - - - - - - - - - - - - - - - - - - - - - 2,790 387
7,510 - - - - - - -
- - - - - - - - - - - - - - - - - - - -
7,510 - 2,790 387
$ 8,135 $ - $ 2,790 $ 759
(Continued) 115
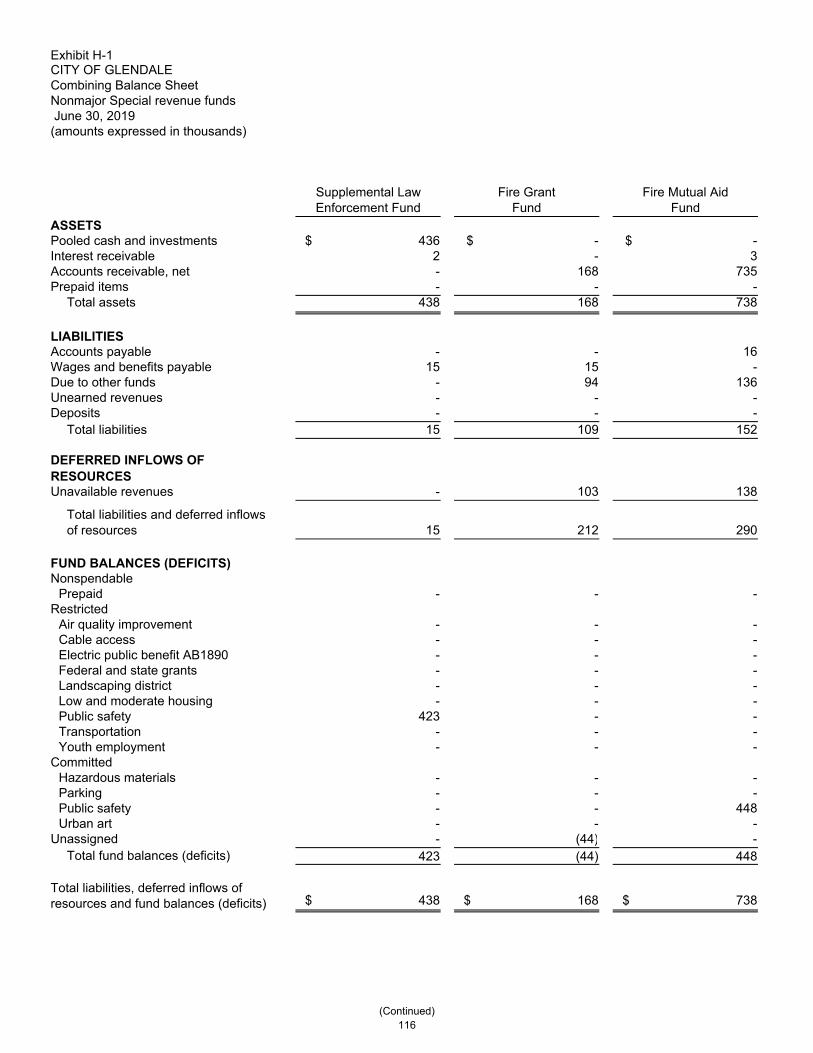
Exhibit H-1 CITY OF GLENDALE Combining Balance Sheet Nonmajor Special revenue funds June 30, 2019 (amounts expressed in thousands)
ASSETS Pooled cash and investments Interest receivable Accounts receivable, net Prepaid items
Total assets
LIABILITIES Accounts payable Wages and benefits payable Due to other funds Unearned revenues Deposits
Total liabilities
DEFERRED INFLOWS OFRESOURCES Unavailable revenues
Total liabilities and deferred inflowsof resources
FUND BALANCES (DEFICITS) Nonspendable
Prepaid Restricted
Air quality improvement Cable access Electric public benefit AB1890 Federal and state grants Landscaping district Low and moderate housing Public safety Transportation Youth employment
Committed Hazardous materials Parking Public safety Urban art
Unassigned Total fund balances (deficits)
Total liabilities, deferred inflows ofresources and fund balances (deficits)
Supplemental Law Enforcement Fund
Fire GrantFund
Fire Mutual AidFund
$ 436 $ - $ - 2 - 3 - 168 735 - - -
438 168 738
- - 16 15 15 -
- 94 136 - - -
- - - 15 109 152
- 103 138
15 212 290
- - -
- - - - - -
- - - - - -
- - - - - -
423 - - - - -
- - -
- - - - - -
- - 448 - - -
- (44) - 423 (44) 448
$ 438 $ 168 $ 738
(Continued) 116

Exhibit H-1 CITY OF GLENDALE Combining Balance Sheet Nonmajor Special revenue funds June 30, 2019 (amounts expressed in thousands)
ASSETS Pooled cash and investments Interest receivable Accounts receivable, net Prepaid items
Total assets
LIABILITIES Accounts payable Wages and benefits payable Due to other funds Unearned revenues Deposits
Total liabilities
DEFERRED INFLOWS OFRESOURCES Unavailable revenues
Total liabilities and deferred inflowsof resources
FUND BALANCES (DEFICITS) Nonspendable
Prepaid Restricted
Air quality improvement Cable access Electric public benefit AB1890 Federal and state grants Landscaping district Low and moderate housing Public safety Transportation Youth employment
Committed Hazardous materials Parking Public safety Urban art
Unassigned Total fund balances (deficits)
Total liabilities, deferred inflows ofresources and fund balances (deficits)
Special EventsFund
Nutritional Meals Grant Fund
LibraryFund
$ - $ 83 $ 1,405 - - 7 - 30 3 - - -
- 113 1,415
- 102 9 - 11 4 - - -
- - - - - -
- 113 13
- - -
- 113 13
- - -
- - - - - -
- - - - - 1,402 - - -
- - - - - -
- - - - - -
- - - - - -
- - - - - -
- - - - - 1,402
$ - $ 113 $ 1,415
(Continued) 117
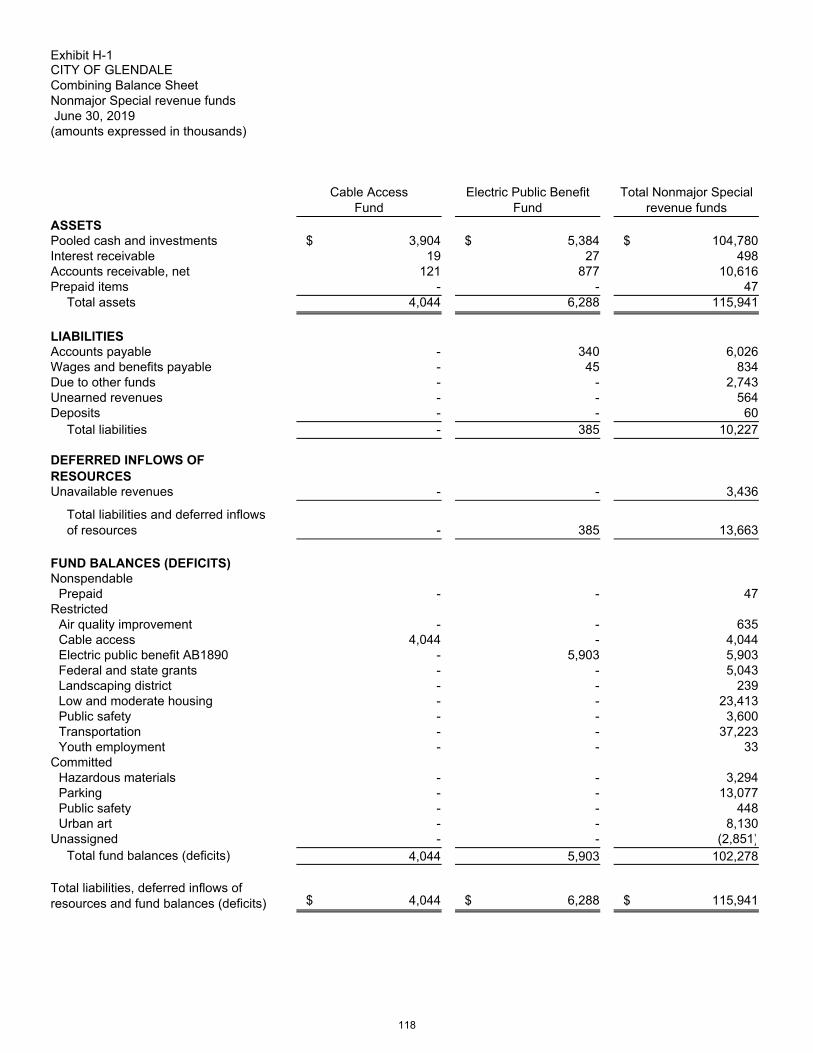
Exhibit H-1 CITY OF GLENDALE Combining Balance Sheet Nonmajor Special revenue funds June 30, 2019 (amounts expressed in thousands)
ASSETS Pooled cash and investments Interest receivable Accounts receivable, net Prepaid items
Total assets
LIABILITIES Accounts payable Wages and benefits payable Due to other funds Unearned revenues Deposits
Total liabilities
DEFERRED INFLOWS OFRESOURCES Unavailable revenues
Total liabilities and deferred inflowsof resources
FUND BALANCES (DEFICITS) Nonspendable
Prepaid Restricted
Air quality improvement Cable access Electric public benefit AB1890 Federal and state grants Landscaping district Low and moderate housing Public safety Transportation Youth employment
Committed Hazardous materials Parking Public safety Urban art
Unassigned Total fund balances (deficits)
Total liabilities, deferred inflows ofresources and fund balances (deficits)
Cable AccessFund
Electric Public Benefit Fund
Total Nonmajor Special revenue funds
$ 3,904 $ 5,384 $ 104,780 19 27 498
121 877 10,616 - - 47
4,044 6,288 115,941
- 340 6,026 - 45 834 - - 2,743 - - 564 - - 60 - 385 10,227
- - 3,436
- 385 13,663
- - 47
- - 635 4,044 - 4,044
- 5,903 5,903 - - 5,043 - - 239 - - 23,413 - - 3,600 - - 37,223 - - 33
- - 3,294 - - 13,077 - - 448 - - 8,130 - - (2,851)
4,044 5,903 102,278
$ 4,044 $ 6,288 $ 115,941
118

Exhibit H-2 CITY OF GLENDALE Combining Statement of Revenues, Expenditures, and Changes in Fund Balances Nonmajor Special revenue funds For the Year Ended June 30, 2019 (amounts expressed in thousands)
CDBGFund
Home GrantFund
Continuum of Care Grant
Fund
Emergency Solutions Grant
FundREVENUES Sales tax $ - $ - $ - $ - Other taxes - - - - Revenue from other agencies 922 1,893 1,880 140 Licenses and permits - - - - Fines and forfeitures - - - - Charges for services - - - - Use of money and property - 11 - - Miscellaneous revenue - 312 - -
Total revenues 922 2,216 1,880 140
EXPENDITURES Current:
General government - - - - Police - - - - Fire - - - - Public works - - - - Transportation - - - - Housing, health and community development 888 1,726 2,179 140 Employment programs - - - - Public service - - - - Parks, recreation and community services - - - - Library - - - -
Debt service: Principal retirement 212 - - - Interest 18 - - -
Capital outlay: Capital outlay - 981 - -
Total expenditures 1,118 2,707 2,179 140 Excess (deficiency) of revenues over (under) expenditures (196) (491) (299) -
OTHER FINANCING SOURCES (USES) Transfers in - - - - Transfers out - - - -
Total other financing sources (uses) - - - -
SPECIAL ITEMTransfer of bond proceeds from Successor Agency - - - -
Net change in fund balances (196) (491) (299) - Fund balances - beginning (2) 1,823 (97) -
Fund balances - ending $ (198) $ 1,332 $ (396) $ -
(Continued) 119

Exhibit H-2 CITY OF GLENDALE Combining Statement of Revenues, Expenditures, and Changes in Fund Balances Nonmajor Special revenue funds For the Year Ended June 30, 2019 (amounts expressed in thousands)
REVENUES Sales tax Other taxes Revenue from other agencies Licenses and permits Fines and forfeitures Charges for services Use of money and property Miscellaneous revenue
Total revenues
EXPENDITURES Current:
General government Police Fire Public works Transportation Housing, health and community development Employment programs Public service Parks, recreation and community services Library
Debt service: Principal retirement Interest
Capital outlay: Capital outlay
Total expenditures Excess (deficiency) of revenues over (under) expenditures
OTHER FINANCING SOURCES (USES) Transfers in Transfers out
Total other financing sources (uses)
SPECIAL ITEMTransfer of bond proceeds from Successor Agency
Net change in fund balances Fund balances - beginning
Fund balances - ending
Workforce Innovation and Opportunity Act
Fund
Affordable Housing Trust
FundUrban Art
FundGlendale Youth Alliance Fund
$ - $ - $ - $ - - - - -
5,053 - - - - - 883 - - - - -
259 - - 2,070 34 103 318 -
- 250 - 15,346 353 1,201 2,071
- - - - - - - - - - - - - - - - - - - - - 9 - -
5,267 - - 2,082 - - - - - - - - - - 45 -
- - - - - - - -
- - - - 5,267 9 45 2,082
79 344 1,156 (11)
- - - - - - - - - - - -
- - - -
79 344 1,156 (11)1,511 2,223 6,974 44
$ 1,590 $ 2,567 $ 8,130 $ 33
(Continued) 120

Exhibit H-2 CITY OF GLENDALE Combining Statement of Revenues, Expenditures, and Changes in Fund Balances Nonmajor Special revenue funds For the Year Ended June 30, 2019 (amounts expressed in thousands)
REVENUES Sales tax Other taxes Revenue from other agencies Licenses and permits Fines and forfeitures Charges for services Use of money and property Miscellaneous revenue
Total revenues
EXPENDITURES Current:
General government Police Fire Public works Transportation Housing, health and community development Employment programs Public service Parks, recreation and community services Library
Debt service: Principal retirement Interest
Capital outlay: Capital outlay
Total expenditures Excess (deficiency) of revenues over (under) expenditures
OTHER FINANCING SOURCES (USES) Transfers in Transfers out
Total other financing sources (uses)
SPECIAL ITEMTransfer of bond proceeds from Successor Agency
Net change in fund balances Fund balances - beginning
Fund balances - ending
BEGIN Affordable
Homeownership Fund
Low & Moderate
Income HousingAsset Fund
GrantFund
FilmingFund
$ - $ - $ - $ - - - - - - - 1,654 - - - - 36
- - - - - - - 673 - 497 5 381
10 870 - - 10 1,367 1,659 1,090
- - - 580 - - - - - - - - - - - - - - - - - 1,494 183 -
- - - - - - - - - - 148 - - - - -
- - - - - - - -
- - - - - 1,494 331 580
10 (127) 1,328 510
- 2,008 - - - - - (1,455)- 2,008 - (1,455)
- - - -
10 1,881 1,328 (945)1 10,031 (620) 945
$ 11 $ 11,912 $ 708 $ -
(Continued) 121

Exhibit H-2 CITY OF GLENDALE Combining Statement of Revenues, Expenditures, and Changes in Fund Balances Nonmajor Special revenue funds For the Year Ended June 30, 2019 (amounts expressed in thousands)
REVENUES Sales tax Other taxes Revenue from other agencies Licenses and permits Fines and forfeitures Charges for services Use of money and property Miscellaneous revenue
Total revenues
EXPENDITURES Current:
General government Police Fire Public works Transportation Housing, health and community development Employment programs Public service Parks, recreation and community services Library
Debt service: Principal retirement Interest
Capital outlay: Capital outlay
Total expenditures Excess (deficiency) of revenues over (under) expenditures
OTHER FINANCING SOURCES (USES) Transfers in Transfers out
Total other financing sources (uses)
SPECIAL ITEMTransfer of bond proceeds from Successor Agency
Net change in fund balances Fund balances - beginning
Fund balances - ending
RecreationFund
Hazardous Disposal Fund
ParkingFund
Measure M Local Return
Fund
$ - $ - $ - $ 2,870 - - - - 7 89 - - - - - - - - 2,282 -
3,222 1,755 9,067 - 641 139 530 140 20 1 91 -
3,890 1,984 11,970 3,010
- - - - - - - - - 1,573 - - - - 8,319 -
- - - 624 - - - - - - - - - - - -
3,762 - - - - - - -
- - - - - - - -
28 2 212 - 3,790 1,575 8,531 624
100 409 3,439 2,386
- - - - (3,875) - - - (3,875) - - -
- - - -
(3,775) 409 3,439 2,386 3,775 2,885 9,638 2,112
$ - $ 3,294 $ 13,077 $ 4,498
(Continued) 122

Exhibit H-2 CITY OF GLENDALE Combining Statement of Revenues, Expenditures, and Changes in Fund Balances Nonmajor Special revenue funds For the Year Ended June 30, 2019 (amounts expressed in thousands)
REVENUES Sales tax Other taxes Revenue from other agencies Licenses and permits Fines and forfeitures Charges for services Use of money and property Miscellaneous revenue
Total revenues
EXPENDITURES Current:
General government Police Fire Public works Transportation Housing, health and community development Employment programs Public service Parks, recreation and community services Library
Debt service: Principal retirement Interest
Capital outlay: Capital outlay
Total expenditures Excess (deficiency) of revenues over (under) expenditures
OTHER FINANCING SOURCES (USES) Transfers in Transfers out
Total other financing sources (uses)
SPECIAL ITEMTransfer of bond proceeds from Successor Agency
Net change in fund balances Fund balances - beginning
Fund balances - ending
Measure HFund
2011 TABs Housing Fund
Air Quality Improvement
FundPW Special Grants Fund
$ - $ - $ - $ - - - - -
158 - 267 49 - - - - - - - - - - - - - 243 22 -
- - - - 158 243 289 49
- - - - - - - - - - - - - - - 1 - - 172 -
62 - - - 100 - - -
- - - - - - - - - - - -
- - - - - - - -
- - - - 162 - 172 1
(4) 243 117 48
- - - - - - - - - - - -
- 8,691 - -
(4) 8,934 117 48 (52) - 518 (84)
$ (56) $ 8,934 $ 635 $ (36)
(Continued) 123

Exhibit H-2 CITY OF GLENDALE Combining Statement of Revenues, Expenditures, and Changes in Fund Balances Nonmajor Special revenue funds For the Year Ended June 30, 2019 (amounts expressed in thousands)
REVENUES Sales tax Other taxes Revenue from other agencies Licenses and permits Fines and forfeitures Charges for services Use of money and property Miscellaneous revenue
Total revenues
EXPENDITURES Current:
General government Police Fire Public works Transportation Housing, health and community development Employment programs Public service Parks, recreation and community services Library
Debt service: Principal retirement Interest
Capital outlay: Capital outlay
Total expenditures Excess (deficiency) of revenues over (under) expenditures
OTHER FINANCING SOURCES (USES) Transfers in Transfers out
Total other financing sources (uses)
SPECIAL ITEMTransfer of bond proceeds from Successor Agency
Net change in fund balances Fund balances - beginning
Fund balances - ending
San Fernando Landscape
District Fund
Measure RLocal Return
Fund
Measure R Regional Return
Fund
Transit Prop A Local Return
Fund
$ - $ 2,520 $ - $ - - - - - - - 2,678 4,050
- - - - - - - - - - - 14
10 546 - 43583 - - - 93 3,066 2,678 4,499
- - - - - - - - - - - -
61 - 355 - - 20 - 3,606
- - - - - - - - - - - - - - - - - - - -
- - - - - - - -
- 1,217 2,551 - 61 1,237 2,906 3,606
32 1,829 (228) 893
- - - - - - - - - - - -
- - - -
32 1,829 (228) 893207 11,523 (1,846) 10,970
$ 239 $ 13,352 $ (2,074) $ 11,863
(Continued) 124
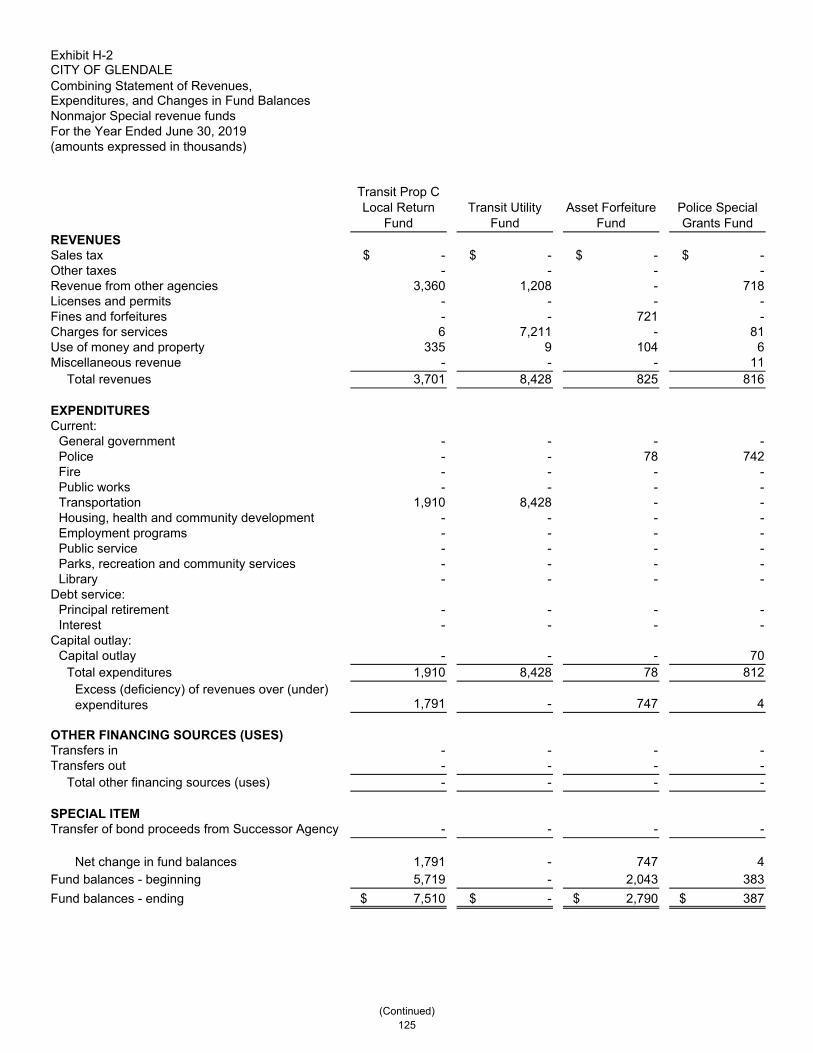
Exhibit H-2 CITY OF GLENDALE Combining Statement of Revenues, Expenditures, and Changes in Fund Balances Nonmajor Special revenue funds For the Year Ended June 30, 2019 (amounts expressed in thousands)
REVENUES Sales tax Other taxes Revenue from other agencies Licenses and permits Fines and forfeitures Charges for services Use of money and property Miscellaneous revenue
Total revenues
EXPENDITURES Current:
General government Police Fire Public works Transportation Housing, health and community development Employment programs Public service Parks, recreation and community services Library
Debt service: Principal retirement Interest
Capital outlay: Capital outlay
Total expenditures Excess (deficiency) of revenues over (under) expenditures
OTHER FINANCING SOURCES (USES) Transfers in Transfers out
Total other financing sources (uses)
SPECIAL ITEMTransfer of bond proceeds from Successor Agency
Net change in fund balances Fund balances - beginning
Fund balances - ending
Transit Prop C Local Return
FundTransit Utility
FundAsset Forfeiture
FundPolice Special Grants Fund
$ - $ - $ - $ - - - - -
3,360 1,208 - 718- - - - - - 721 - 6 7,211 - 81
335 9 104 6- - - 11
3,701 8,428 825 816
- - - - - - 78 742 - - - - - - - -
1,910 8,428 - - - - - - - - - - - - - - - - - - - - - -
- - - - - - - -
- - - 70 1,910 8,428 78 812
1,791 - 747 4
- - - - - - - - - - - -
- - - -
1,791 - 747 4 5,719 - 2,043 383
$ 7,510 $ - $ 2,790 $ 387
(Continued) 125
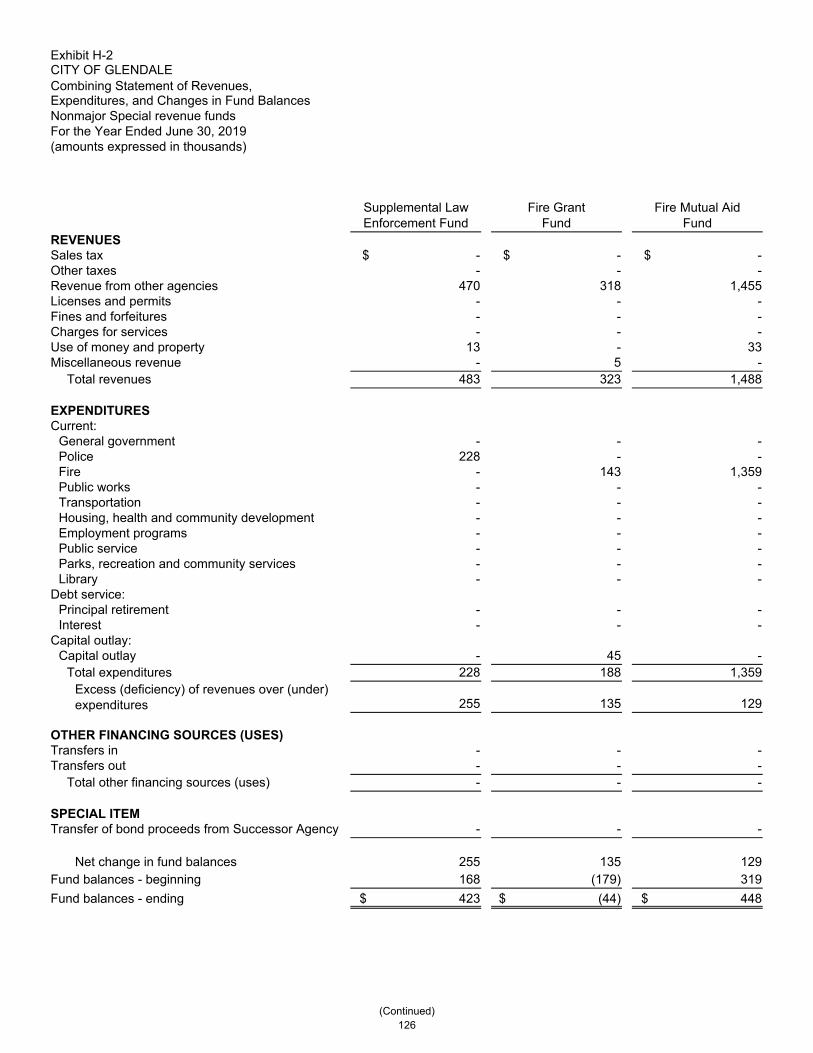
Exhibit H-2 CITY OF GLENDALE Combining Statement of Revenues, Expenditures, and Changes in Fund Balances Nonmajor Special revenue funds For the Year Ended June 30, 2019 (amounts expressed in thousands)
REVENUES Sales tax Other taxes Revenue from other agencies Licenses and permits Fines and forfeitures Charges for services Use of money and property Miscellaneous revenue
Total revenues
EXPENDITURES Current:
General government Police Fire Public works Transportation Housing, health and community development Employment programs Public service Parks, recreation and community services Library
Debt service: Principal retirement Interest
Capital outlay: Capital outlay
Total expenditures Excess (deficiency) of revenues over (under) expenditures
OTHER FINANCING SOURCES (USES) Transfers in Transfers out
Total other financing sources (uses)
SPECIAL ITEMTransfer of bond proceeds from Successor Agency
Net change in fund balances Fund balances - beginning
Fund balances - ending
Supplemental Law Enforcement Fund
Fire GrantFund
Fire Mutual AidFund
$ - $ - $ - - - -
470 318 1,455 - - -
- - - - - -
13 - 33 - 5 -
483 323 1,488
- - - 228 - -
- 143 1,359 - - -
- - - - - -
- - - - - -
- - - - - -
- - - - - -
- 45 - 228 188 1,359
255 135 129
- - - - - -
- - -
- - -
255 135 129 168 (179) 319
$ 423 $ (44) $ 448
(Continued) 126

Exhibit H-2 CITY OF GLENDALE Combining Statement of Revenues, Expenditures, and Changes in Fund Balances Nonmajor Special revenue funds For the Year Ended June 30, 2019 (amounts expressed in thousands)
REVENUES Sales tax Other taxes Revenue from other agencies Licenses and permits Fines and forfeitures Charges for services Use of money and property Miscellaneous revenue
Total revenues
EXPENDITURES Current:
General government Police Fire Public works Transportation Housing, health and community development Employment programs Public service Parks, recreation and community services Library
Debt service: Principal retirement Interest
Capital outlay: Capital outlay
Total expenditures Excess (deficiency) of revenues over (under) expenditures
OTHER FINANCING SOURCES (USES) Transfers in Transfers out
Total other financing sources (uses)
SPECIAL ITEMTransfer of bond proceeds from Successor Agency
Net change in fund balances Fund balances - beginning
Fund balances - ending
Special EventsFund
Nutritional Meals Grant Fund
LibraryFund
$ - $ - $ - - - -
- 306 124 - - -
- - - 331 - 93
- - 48 - 40 86
331 346 351
345 - - - - -
- - - - - -
- - - - - -
- - - - - -
- 431 - - - 393
- - - - - -
- - - 345 431 393
(14) (85) (42)
- 85 - - - -
- 85 -
- - -
(14) - (42)14 - 1,444
$ - $ - $ 1,402
(Continued) 127

Exhibit H-2 CITY OF GLENDALE Combining Statement of Revenues, Expenditures, and Changes in Fund Balances Nonmajor Special revenue funds For the Year Ended June 30, 2019 (amounts expressed in thousands)
REVENUES Sales tax Other taxes Revenue from other agencies Licenses and permits Fines and forfeitures Charges for services Use of money and property Miscellaneous revenue
Total revenues
EXPENDITURES Current:
General government Police Fire Public works Transportation Housing, health and community development Employment programs Public service Parks, recreation and community services Library
Debt service: Principal retirement Interest
Capital outlay: Capital outlay
Total expenditures Excess (deficiency) of revenues over (under) expenditures
OTHER FINANCING SOURCES (USES) Transfers in Transfers out
Total other financing sources (uses)
SPECIAL ITEMTransfer of bond proceeds from Successor Agency
Net change in fund balances Fund balances - beginning
Fund balances - ending
Cable AccessFund
Electric Public Benefit Fund
Total Nonmajor Special revenue funds
$ - $ - $ 5,390 - 6,714 6,714 - - 26,799 - - 919 - - 3,003
495 - 25,277154 220 4,977
- - 1,780 649 6,934 74,859
- - 925 - - 1,048 - - 3,075 - - 8,736 - - 14,760 - - 6,681 - - 7,449 - 6,177 6,177 - - 4,341 - - 438
- - 212 - - 18
6 - 5,112 6 6,177 58,972
643 757 15,887
- - 2,093 - - (5,330)- - (3,237)
- - 8,691
643 757 21,341 3,401 5,146 80,937
$ 4,044 $ 5,903 $ 102,278
128
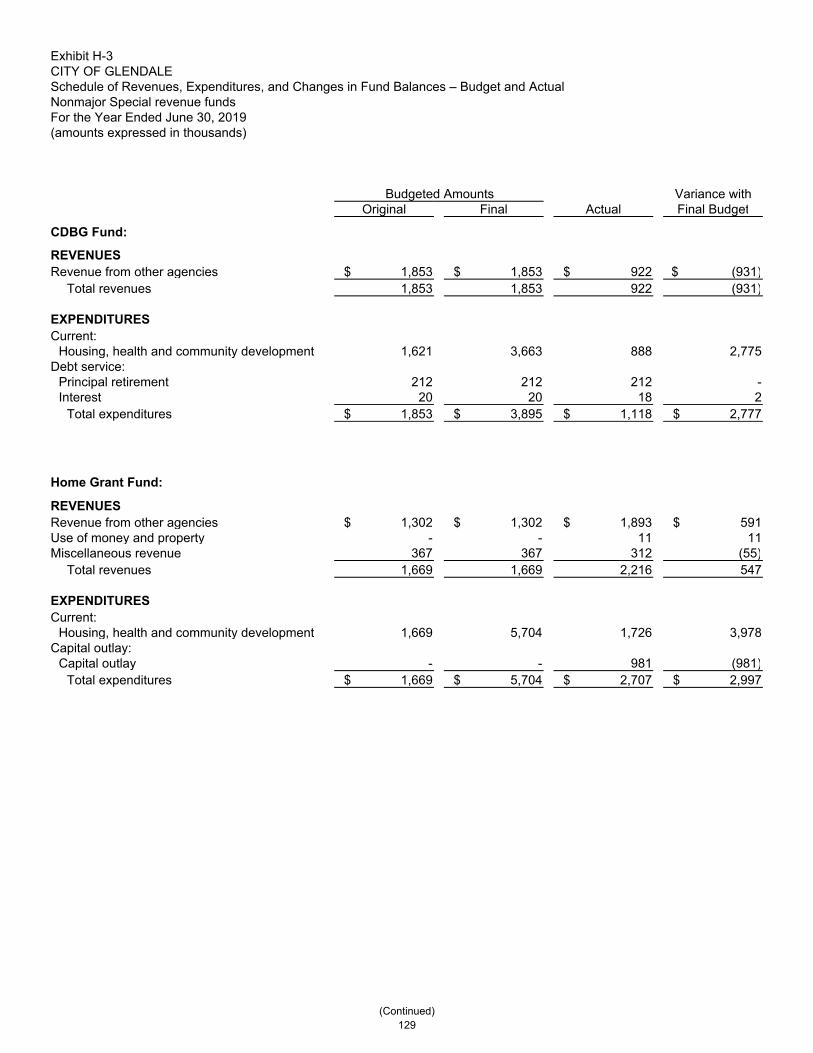
Exhibit H-3 CITY OF GLENDALE Schedule of Revenues, Expenditures, and Changes in Fund Balances – Budget and Actual Nonmajor Special revenue funds For the Year Ended June 30, 2019 (amounts expressed in thousands)
Budgeted Amounts Variance withOriginal Final Actual Final Budget
CDBG Fund:
REVENUES Revenue from other agencies $ 1,853 $ 1,853 $ 922 $ (931)
Total revenues 1,853 1,853 922 (931)
EXPENDITURES Current:
Housing, health and community development 1,621 3,663 888 2,775 Debt service:
Principal retirement 212 212 212 - Interest 20 20 18 2
Total expenditures $ 1,853 $ 3,895 $ 1,118 $ 2,777
Home Grant Fund:
REVENUES Revenue from other agencies $ 1,302 $ 1,302 $ 1,893 $ 591 Use of money and property - - 11 11 Miscellaneous revenue 367 367 312 (55)
Total revenues 1,669 1,669 2,216 547
EXPENDITURES Current:
Housing, health and community development 1,669 5,704 1,726 3,978 Capital outlay:
Capital outlay - - 981 (981)Total expenditures $ 1,669 $ 5,704 $ 2,707 $ 2,997
(Continued) 129

Exhibit H-3 CITY OF GLENDALE Schedule of Revenues, Expenditures, and Changes in Fund Balances – Budget and Actual Nonmajor Special revenue funds For the Year Ended June 30, 2019 (amounts expressed in thousands)
Budgeted Amounts Variance withOriginal Final Actual Final Budget
Continuum of Care Grant Fund:
REVENUES Revenue from other agencies $ 2,416 $ 2,416 $ 1,880 $ (536)
Total revenues 2,416 2,416 1,880 (536)
EXPENDITURES Current:
Housing, health and community development 2,416 3,716 2,179 1,537 Total expenditures $ 2,416 $ 3,716 $ 2,179 $ 1,537
Emergency Solutions Grant Fund:
REVENUES Revenue from other agencies $ 148 $ 148 $ 140 $ (8)
Total revenues 148 148 140 (8)
EXPENDITURES Current:
Housing, health and community development 148 203 140 63 Total expenditures $ 148 $ 203 $ 140 $ 63
(Continued) 130

Exhibit H-3 CITY OF GLENDALE Schedule of Revenues, Expenditures, and Changes in Fund Balances – Budget and Actual Nonmajor Special revenue funds For the Year Ended June 30, 2019 (amounts expressed in thousands)
Budgeted Amounts Variance withOriginal Final Actual Final Budget
Workforce Innovationand Opportunity Act Fund:
REVENUES Revenue from other agencies $ 6,094 $ 7,294 $ 5,053 $ (2,241)Charges for services - - 259 259 Use of money and property - - 34 34 Miscellaneous revenue 186 186 - (186)
Total revenues 6,280 7,480 5,346 (2,134)
EXPENDITURES Current:
Employment programs 6,123 9,831 5,267 4,564 Total expenditures $ 6,123 $ 9,831 $ 5,267 $ 4,564
Affordable Housing Trust Fund:
REVENUES Use of money and property $ 13 $ 13 $ 103 $ 90 Miscellaneous revenue 12 12 250 238
Total revenues 25 25 353 328
EXPENDITURES Current:
Housing, health and community development 25 50 9 41 Total expenditures $ 25 $ 50 $ 9 $ 41
(Continued) 131

Exhibit H-3 CITY OF GLENDALE Schedule of Revenues, Expenditures, and Changes in Fund Balances – Budget and Actual Nonmajor Special revenue funds For the Year Ended June 30, 2019 (amounts expressed in thousands)
Budgeted Amounts Variance withOriginal Final Actual Final Budget
Urban Art Fund:
REVENUES Licenses and permits $ 500 $ 500 $ 883 $ 383 Use of money and property 75 75 318 243
Total revenues 575 575 1,201 626
EXPENDITURES Current:
Library 90 896 45 851 Total expenditures $ 90 $ 896 $ 45 $ 851
Glendale Youth Alliance Fund: REVENUES Charges for services $ 2,088 $ 2,088 $ 2,070 $ (18)Miscellaneous revenue - - 1 1
Total revenues 2,088 2,088 2,071 (17)
EXPENDITURES Current:
Employment programs 2,088 2,124 2,082 42 Total expenditures $ 2,088 $ 2,124 $ 2,082 $ 42
(Continued) 132

Exhibit H-3 CITY OF GLENDALE Schedule of Revenues, Expenditures, and Changes in Fund Balances – Budget and Actual Nonmajor Special revenue funds For the Year Ended June 30, 2019 (amounts expressed in thousands)
Budgeted Amounts Variance withOriginal Final Actual Final Budget
BEGIN Affordable Homeownership Fund: REVENUES Miscellaneous revenue $ 300 $ 300 $ 10 $ (290)
Total revenues 300 300 10 (290)
EXPENDITURES Current:
Housing, health and community development 300 300 - 300Total expenditures $ 300 $ 300 $ - $ 300
Low & Moderate Income HousingAsset Fund:
REVENUES Revenue from other agencies $ 213 $ 213 $ - $ (213)Use of money and property 25 25 497 472 Miscellaneous revenue - - 870 870
Total revenues 238 238 1,367 1,129
EXPENDITURES Current:
Housing, health and community development 1,660 2,393 1,494 899 Total expenditures 1,660 2,393 1,494 899
OTHER FINANCING SOURCES (USES) Transfers in 2,008 2,008 2,008 -
Total other financing sources (uses) $ 2,008 $ 2,008 $ 2,008 $ -
(Continued) 133

Exhibit H-3 CITY OF GLENDALE Schedule of Revenues, Expenditures, and Changes in Fund Balances – Budget and Actual Nonmajor Special revenue funds For the Year Ended June 30, 2019 (amounts expressed in thousands)
Budgeted Amounts Variance withOriginal Final Actual Final Budget
Grant Fund:
REVENUES Revenue from other agencies $ 367 $ 1,480 $ 1,654 $ 174 Use of money and property - - 5 5
Total revenues 367 1,480 1,659 179
EXPENDITURES Current:
Public works - 2,143 - 2,143Housing, health and community development - 1,136 183 953Parks, recreation and community services 367 1,249 148 1,101
Total expenditures $ 367 $ 4,528 $ 331 $ 4,197
Filming Fund:
REVENUES Licenses and permits $ - $ - $ 36 $ 36 Charges for services 546 546 673 127 Use of money and property 315 315 381 66
Total revenues 861 861 1,090 229
EXPENDITURES Current:
General government 609 609 580 29 Total expenditures 609 609 580 29
OTHER FINANCING SOURCES (USES) Transfers out - - (1,455) (1,455)
Total other financing sources (uses) $ - $ - $ (1,455) $ (1,455)
(Continued) 134

Exhibit H-3 CITY OF GLENDALE Schedule of Revenues, Expenditures, and Changes in Fund Balances – Budget and Actual Nonmajor Special revenue funds For the Year Ended June 30, 2019 (amounts expressed in thousands)
Budgeted Amounts Variance withOriginal Final Actual Final Budget
Recreation Fund:
REVENUES Revenue from other agencies $ 179 $ 179 $ 7 $ (172)Charges for services 3,215 3,215 3,222 7 Use of money and property 491 491 641 150 Miscellaneous revenue 14 14 20 6
Total revenues 3,899 3,899 3,890 (9)
EXPENDITURES Current:
Parks, recreation and community services 4,217 4,217 3,762 455 Capital outlay:
Capital outlay - 2,332 28 2,304 Total expenditures 4,217 6,549 3,790 2,759
OTHER FINANCING SOURCES (USES) Transfers out - - (3,875) (3,875)
Total other financing sources (uses) $ - $ - $ (3,875) $ (3,875)
Hazardous Disposal Fund:
REVENUES Revenue from other agencies $ - $ - $ 89 $ 89 Charges for services 1,509 1,509 1,755 246 Use of money and property 20 20 139 119 Miscellaneous revenue 13 63 1 (62)
Total revenues 1,542 1,592 1,984 392
EXPENDITURES Current:
Fire 1,761 1,761 1,573 188 Capital outlay:
Capital outlay - 85 2 83 Total expenditures $ 1,761 $ 1,846 $ 1,575 $ 271
(Continued) 135

Exhibit H-3 CITY OF GLENDALE Schedule of Revenues, Expenditures, and Changes in Fund Balances – Budget and Actual Nonmajor Special revenue funds For the Year Ended June 30, 2019 (amounts expressed in thousands)
Budgeted Amounts Variance withOriginal Final Actual Final Budget
Parking Fund:
REVENUES Fines and forfeitures 2,600$ 2,600$ 2,282$ (318)$ Charges for services 6,435 6,435 9,067 2,632 Use of money and property 150 150 530 380 Miscellaneous revenue - - 91 91
Total revenues 9,185 9,185 11,970 2,785
EXPENDITURES Current:
Public works 9,561 10,654 8,319 2,335 Capital outlay:
Capital outlay - 2,654 212 2,442 Total expenditures 9,561$ 13,308$ 8,531$ 4,777$
Measure M Local Return Fund:
REVENUES Sales tax 2,400$ 2,400$ 2,870$ 470$ Use of money and property 15 15 140 125
Total revenues 2,415 2,415 3,010 595
EXPENDITURES Current:
Transportation 2,043 3,374 624 2,750 Capital outlay:
Capital outlay - 711 - 711 Total expenditures 2,043$ 4,085$ 624$ 3,461$
(Continued) 136

Exhibit H-3 CITY OF GLENDALE Schedule of Revenues, Expenditures, and Changes in Fund Balances – Budget and Actual Nonmajor Special revenue funds For the Year Ended June 30, 2019 (amounts expressed in thousands)
Budgeted Amounts Variance withOriginal Final Actual Final Budget
Measure H Fund:
REVENUES Revenue from other agencies $ 278 $ 378 $ 158 $ (220)
Total revenues 278 378 158 (220)
EXPENDITURES Current:
Housing, health and community development 278 511 62 449 Employment programs - - 100 (100)
Total expenditures $ 278 $ 511 $ 162 $ 349
2011 TABs Housing Fund:
REVENUES Use of money and property $ - $ - $ 243 $ 243
Total revenues - - 243 243
SPECIAL ITEMTransfer of bond proceeds fromSuccessor Agency - - 8,691 8,691
Total special item $ - $ - $ 8,691 $ 8,691
(Continued) 137

Exhibit H-3 CITY OF GLENDALE Schedule of Revenues, Expenditures, and Changes in Fund Balances – Budget and Actual Nonmajor Special revenue funds For the Year Ended June 30, 2019 (amounts expressed in thousands)
Budgeted Amounts Variance withOriginal Final Actual Final Budget
Air Quality Improvement Fund:
REVENUES Revenue from other agencies $ 250 $ 250 $ 267 $ 17 Charges for services 6 6 - (6)Use of money and property 5 5 22 17
Total revenues 261 261 289 28
EXPENDITURES Current:
Transportation 334 334 172 162 Total expenditures $ 334 $ 334 $ 172 $ 162
PW Special Grants Fund:
REVENUES Revenue from other agencies $ - $ - $ 49 $ 49
Total revenues - - 49 49
EXPENDITURES Current:
Public works - 16 1 15 Capital outlay:
Capital outlay - 41 - 41Total expenditures $ - $ 57 $ 1 $ 56
(Continued) 138

Exhibit H-3 CITY OF GLENDALE Schedule of Revenues, Expenditures, and Changes in Fund Balances – Budget and Actual Nonmajor Special revenue funds For the Year Ended June 30, 2019 (amounts expressed in thousands)
Budgeted Amounts Variance withOriginal Final Actual Final Budget
San Fernando Landscape District Fund:
REVENUES Use of money and property $ 2 $ 2 $ 10 $ 8 Miscellaneous revenue 90 90 83 (7)
Total revenues 92 92 93 1
EXPENDITURES Current:
Public works 91 91 61 30 Total expenditures $ 91 $ 91 $ 61 $ 30
Measure R Local Return Fund:
REVENUES Sales tax $ 2,346 $ 2,346 $ 2,520 $ 174 Use of money and property 60 60 546 486
Total revenues 2,406 2,406 3,066 660
EXPENDITURES Current:
Transportation - - 20 (20)Capital outlay:
Capital outlay 340 9,291 1,217 8,074 Total expenditures $ 340 $ 9,291 $ 1,237 $ 8,054
(Continued) 139

Exhibit H-3 CITY OF GLENDALE Schedule of Revenues, Expenditures, and Changes in Fund Balances – Budget and Actual Nonmajor Special revenue funds For the Year Ended June 30, 2019 (amounts expressed in thousands)
Budgeted Amounts Variance withOriginal Final Actual Final Budget
Measure R Regional Return Fund:
REVENUES Revenue from other agencies $ 2,051 $ 4,829 $ 2,678 $ (2,151)
Total revenues 2,051 4,829 2,678 (2,151)
EXPENDITURES Current:
Public works - - 355 (355)Capital outlay:
Capital outlay 4,520 12,051 2,551 9,500 Total expenditures $ 4,520 $ 12,051 $ 2,906 $ 9,145
Transit Prop A Local Return Fund:
REVENUES Revenue from other agencies $ 3,800 $ 3,800 $ 4,050 $ 250 Charges for services 100 100 14 (86)Use of money and property 75 75 435 360
Total revenues 3,975 3,975 4,499 524
EXPENDITURES Current:
Transportation 3,856 3,856 3,606 250 Capital outlay:
Capital outlay - 3,942 - 3,942Total expenditures $ 3,856 $ 7,798 $ 3,606 $ 4,192
(Continued) 140

Exhibit H-3 CITY OF GLENDALE Schedule of Revenues, Expenditures, and Changes in Fund Balances – Budget and Actual Nonmajor Special revenue funds For the Year Ended June 30, 2019 (amounts expressed in thousands)
Budgeted Amounts Variance withOriginal Final Actual Final Budget
Transit Prop C Local Return Fund:
REVENUES Revenue from other agencies $ 3,150 $ 3,150 $ 3,360 $ 210 Charges for services 25 25 6 (19)Use of money and property 31 31 335 304
Total revenues 3,206 3,206 3,701 495
EXPENDITURES Current:
Transportation 4,147 4,147 1,910 2,237 Capital outlay:
Capital outlay - 383 - 383Total expenditures $ 4,147 $ 4,530 $ 1,910 $ 2,620
Transit Utility Fund:
REVENUES Revenue from other agencies $ 1,180 $ 1,180 $ 1,208 $ 28 Charges for services 9,148 9,148 7,211 (1,937)Use of money and property 5 5 9 4 Miscellaneous revenue 1 1 - (1)
Total revenues 10,334 10,334 8,428 (1,906)
EXPENDITURES Current:
Transportation 10,334 10,334 8,428 1,906 Total expenditures $ 10,334 $ 10,334 $ 8,428 $ 1,906
(Continued) 141

Exhibit H-3 CITY OF GLENDALE Schedule of Revenues, Expenditures, and Changes in Fund Balances – Budget and Actual Nonmajor Special revenue funds For the Year Ended June 30, 2019 (amounts expressed in thousands)
Budgeted Amounts Variance withOriginal Final Actual Final Budget
Asset Forfeiture Fund:
REVENUES Fines and forfeitures $ - $ - $ 721 $ 721 Use of money and property - - 104 104
Total revenues - - 825 825
EXPENDITURES Current:
Police 727 770 78 692 Total expenditures $ 727 $ 770 $ 78 $ 692
Police Special Grants Fund:
REVENUES Revenue from other agencies $ 495 $ 1,983 $ 718 $ (1,265)Charges for services 90 90 81 (9)Use of money and property - - 6 6 Miscellaneous revenue 135 135 11 (124)
Total revenues 720 2,208 816 (1,392)
EXPENDITURES Current:
Police 776 3,390 742 2,648 Capital outlay:
Capital outlay - 73 70 3 Total expenditures $ 776 $ 3,463 $ 812 $ 2,651
(Continued) 142
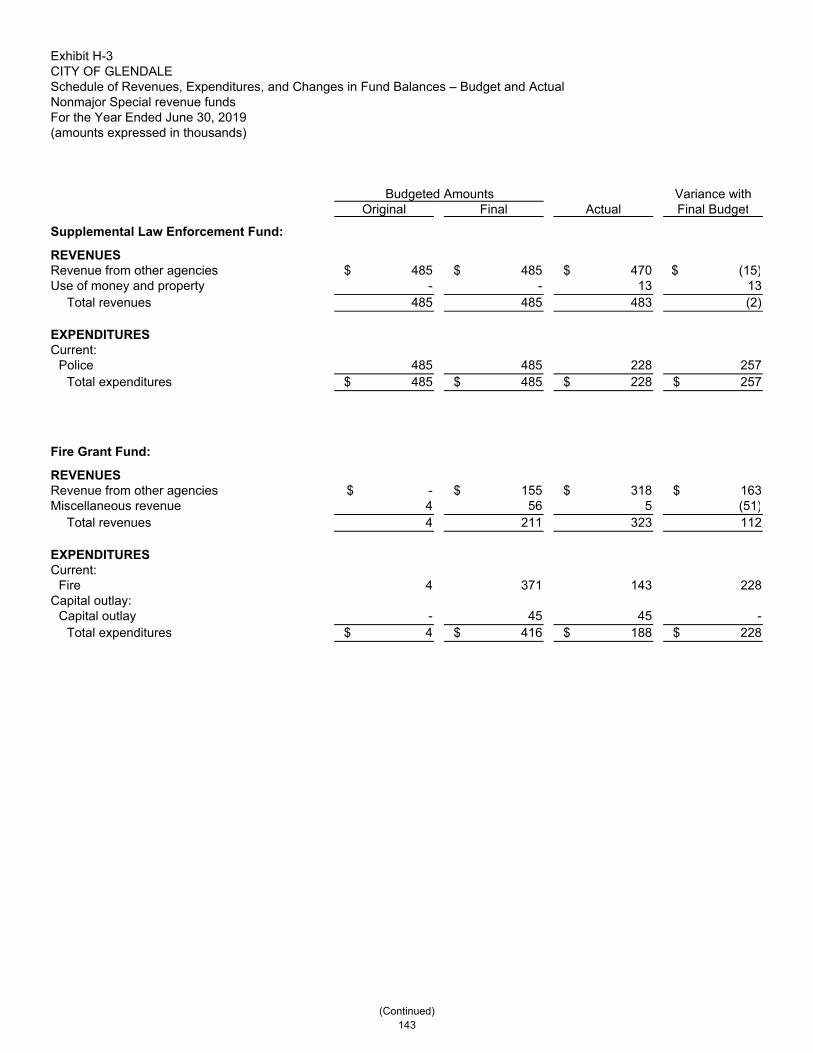
Exhibit H-3 CITY OF GLENDALE Schedule of Revenues, Expenditures, and Changes in Fund Balances – Budget and Actual Nonmajor Special revenue funds For the Year Ended June 30, 2019 (amounts expressed in thousands)
Budgeted Amounts Variance withOriginal Final Actual Final Budget
Supplemental Law Enforcement Fund:
REVENUES Revenue from other agencies $ 485 $ 485 $ 470 $ (15)Use of money and property - - 13 13
Total revenues 485 485 483 (2)
EXPENDITURES Current:
Police 485 485 228 257 Total expenditures $ 485 $ 485 $ 228 $ 257
Fire Grant Fund:
REVENUES Revenue from other agencies $ - $ 155 $ 318 $ 163 Miscellaneous revenue 4 56 5 (51)
Total revenues 4 211 323 112
EXPENDITURES Current:
Fire 4 371 143 228 Capital outlay:
Capital outlay - 45 45 - Total expenditures $ 4 $ 416 $ 188 $ 228
(Continued) 143
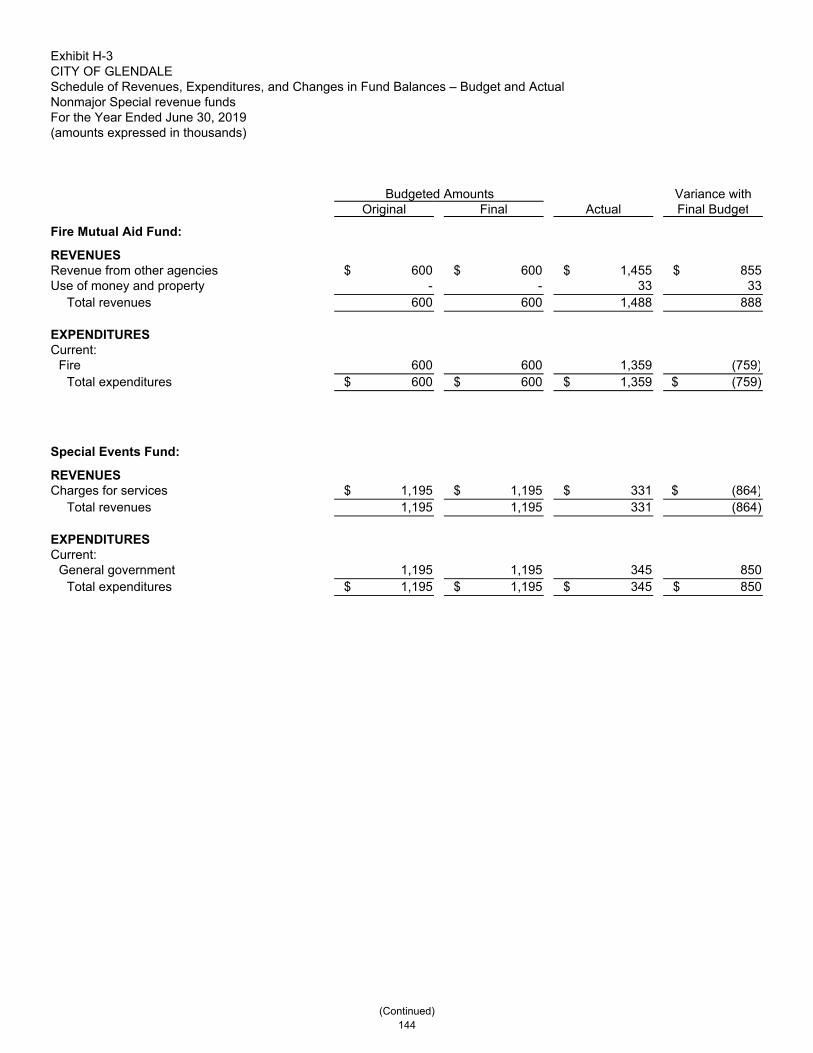
Exhibit H-3 CITY OF GLENDALE Schedule of Revenues, Expenditures, and Changes in Fund Balances – Budget and Actual Nonmajor Special revenue funds For the Year Ended June 30, 2019 (amounts expressed in thousands)
Budgeted Amounts Variance withOriginal Final Actual Final Budget
Fire Mutual Aid Fund:
REVENUES Revenue from other agencies $ 600 $ 600 $ 1,455 $ 855 Use of money and property - - 33 33
Total revenues 600 600 1,488 888
EXPENDITURES Current:
Fire 600 600 1,359 (759)Total expenditures $ 600 $ 600 $ 1,359 $ (759)
Special Events Fund:
REVENUES Charges for services $ 1,195 $ 1,195 $ 331 $ (864)
Total revenues 1,195 1,195 331 (864)
EXPENDITURES Current:
General government 1,195 1,195 345 850 Total expenditures $ 1,195 $ 1,195 $ 345 $ 850
(Continued) 144

Exhibit H-3 CITY OF GLENDALE Schedule of Revenues, Expenditures, and Changes in Fund Balances – Budget and Actual Nonmajor Special revenue funds For the Year Ended June 30, 2019 (amounts expressed in thousands)
Budgeted Amounts Variance withOriginal Final Actual Final Budget
Nutritional Meals Grant Fund:
REVENUES Revenue from other agencies $ 321 $ 351 $ 306 $ (45)Miscellaneous revenue 52 52 40 (12)
Total revenues 373 403 346 (57)
EXPENDITURES Current:
Parks, recreation and community services 458 488 431 57 Total expenditures 458 488 431 57
OTHER FINANCING SOURCES (USES) Transfers in 85 85 85 -
Total other financing sources (uses) $ 85 $ 85 $ 85 $ -
Library Fund:
REVENUES Revenue from other agencies $ - $ 82 $ 124 $ 42 Charges for services 99 99 93 (6)Use of money and property 12 12 48 36 Miscellaneous revenue 37 37 86 49
Total revenues 148 230 351 121
EXPENDITURES Current:
Library 185 500 393 107 Total expenditures $ 185 $ 500 $ 393 $ 107
(Continued) 145

Exhibit H-3 CITY OF GLENDALE Schedule of Revenues, Expenditures, and Changes in Fund Balances – Budget and Actual Nonmajor Special revenue funds For the Year Ended June 30, 2019 (amounts expressed in thousands)
Budgeted Amounts Variance withOriginal Final Actual Final Budget
Cable Access Fund:
REVENUES Charges for services $ 500 $ 500 $ 495 $ (5)Use of money and property 25 25 154 129
Total revenues 525 525 649 124
EXPENDITURES Current:
General government 15 15 - 15Capital outlay:
Capital outlay 850 1,843 6 1,837 Total expenditures $ 865 $ 1,858 $ 6 $ 1,852
Electric Public Benefit Fund:
REVENUES Other taxes $ 7,700 $ 7,700 $ 6,714 $ (986)Use of money and property 50 50 220 170
Total revenues 7,750 7,750 6,934 (816)
EXPENDITURES Current:
Public service 9,243 9,243 6,177 3,066 Total expenditures $ 9,243 $ 9,243 $ 6,177 $ 3,066
146
Debt Service Funds
Debt Service Funds are used to account for financial resources that are restricted,committed or assigned to expenditures for principal and interest on generallong-term debt of the City of Glendale.
Debt Service Funds

DEBT SERVICE FUND 3030 - Police Building Project Debt Service Fund - To accumulate monies for the payment of interest and principal
of the 2000 Police Building Project Variable Rate Demands Certificates of Participation. The debt service is financed via lease payments from the City to the Financing Authority.
3031 - Police Building 2019 Lease Revenue Refunding Bonds Fund - To accumulate monies for the payment of interest and principal of the 2019 lease revenue refunding bonds. The debt service is financed via lease payments from the City to the Municipal Financing Authority.
147

This page is left blank intentionally.
148

Exhibit I-1 CITY OF GLENDALE Combining Balance Sheet Nonmajor Debt service funds June 30, 2019 (amounts expressed in thousands)
Police Building Project Debt Service Fund
Police Building 2019 Lease Revenue
Refunding Bonds FundTotal Nonmajor Debt
service fundsASSETS Pooled cash and investments $ - $ 15,303 $ 15,303 Interest receivable - 74 74
Total assets - 15,377 15,377
LIABILITIES Accounts payable - 5 5
FUND BALANCES (DEFICITS) Committed
Debt service - 15,372 15,372 Total liabilities and fund balances (deficits) $ - $ 15,377 $ 15,377
149
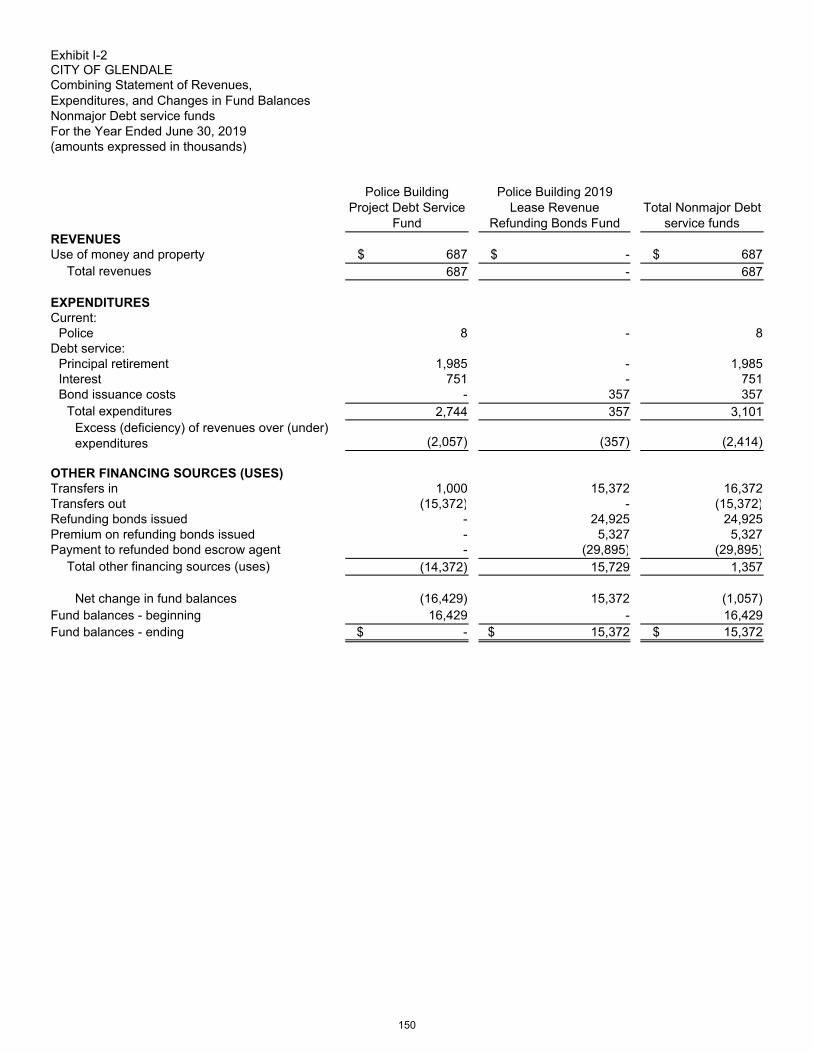
Exhibit I-2 CITY OF GLENDALE Combining Statement of Revenues,Expenditures, and Changes in Fund Balances Nonmajor Debt service funds For the Year Ended June 30, 2019 (amounts expressed in thousands)
Police Building Project Debt Service
Fund
Police Building 2019 Lease Revenue
Refunding Bonds FundTotal Nonmajor Debt
service fundsREVENUES Use of money and property $ 687 $ - $ 687
Total revenues 687 - 687
EXPENDITURES Current:
Police 8 - 8 Debt service:
Principal retirement 1,985 - 1,985 Interest 751 - 751 Bond issuance costs - 357 357
Total expenditures 2,744 357 3,101 Excess (deficiency) of revenues over (under) expenditures (2,057) (357) (2,414)
OTHER FINANCING SOURCES (USES) Transfers in 1,000 15,372 16,372 Transfers out (15,372) - (15,372)Refunding bonds issued - 24,925 24,925 Premium on refunding bonds issued - 5,327 5,327 Payment to refunded bond escrow agent - (29,895) (29,895)
Total other financing sources (uses) (14,372) 15,729 1,357
Net change in fund balances (16,429) 15,372 (1,057)Fund balances - beginning 16,429 - 16,429 Fund balances - ending $ - $ 15,372 $ 15,372
150

Exhibit I-3 CITY OF GLENDALE
Schedule of Revenues, Expenditures, and Changes in Fund Balances – Budget and Actual Nonmajor Debt service funds For the Year Ended June 30, 2019 (amounts expressed in thousands)
Variance withOriginal Final Actual Final Budget
Police Building Project Debt Service Fund:
REVENUES Use of money and property $ 200 $ 200 $ 687 $ 487
Total revenues 200 200 687 487
EXPENDITURES Current:
Police 3 3 8 (5)Debt service:
Principal retirement 1,985 1,985 1,985 - Interest 632 632 751 (119)
Total expenditures 2,620 2,620 2,744 (124)
OTHER FINANCING SOURCES (USES) Transfers in 1,000 1,000 1,000 - Transfers out - - (15,372) (15,372)
Total other financing sources (uses) $ 1,000 $ 1,000 $ (14,372) $ (15,372)
Police Building 2019 Lease Revenue Refunding Bonds Fund:
EXPENDITURES Debt service:
Bond issuance costs $ - $ - $ 357 $ (357)Total expenditures - - 357 (357)
OTHER FINANCING SOURCES (USES) Transfers in - - 15,372 15,372 Refunding bonds issued - - 24,925 24,925 Premium on refunding bonds issued - - 5,327 5,327 Payment to refunded bond escrow agent - - (29,895) (29,895)
Total other financing sources (uses) $ - $ - $ 15,729 $ 15,729
Budgeted Amounts
151

This page is left blank intentionally.
152

Capital Projects Funds
Capital Projects Funds are used to account for financial resources that arerestricted, committed, or assigned to expenditures for capital outlays of majorcapital facilities other than those financed by Proprietary Funds.
Capital Projects Funds

CAPITAL PROJECTS FUNDS
4020 - State Gas Tax Fund - To account for monies received and expended from state gas tax allocations and
Senate Bill 1 for street improvement purposes. 4030 - Landfill Postclosure Fund - To account for monies reserved for the post-closure maintenance cost of Scholl
Canyon landfill. Development Impact Fee Funds:
City Council adopted Ordinance No. 5575 on September 11, 2007, in accordance with California AB1600 later on codified under State Government Code section 66006, allowing the City to impose development impact fees on new residential, commercial, office and industrial developments to mitigate the cost of developing new or rehabilitating existing parks and recreational facilities, developing new libraries and/or adding to existing collections in order to maintain adequate parks and library services for those new residents. The Development Impact Fees are broken down into the following three funds:
4050 - Parks Mitigation Fee Fund - To account for the parks revenue collected as impact fees and usage of
these funds for allowed projects. In addition, this fund will also be used to guarantee adequate interest accumulation and disbursements of unused funds.
4070 - Library Mitigation Fee Fund - To account for the library revenue collected as impact fees and usage of
these funds for allowed projects. In addition, this fund will also be used to guarantee adequate interest accumulation and disbursement of unused funds.
4080 - Parks Quimby Fee Fund - To account for the fees imposed for park or recreational purposes as a
condition to the approval of a tentative map or parcel map and usage of these funds for allowed projects. In addition, this fund will also be used to guarantee adequate interest accumulation and disbursements of unused funds.
4090 - CIP Reimbursement Fund - To account for monies received and expended for CIP projects that are funded by
non-City money, such as grants and joint ventures. 4100 - SF Corridor Tax Share Fund - County of Los Angeles' contribution (passback) to City of Glendale of 60% of
County’s share of tax increment (pass through) funds from the San Fernando Road Corridor Redevelopment Project Area to be used by the City to construct regional public improvement projects benefiting the County.
4120 – 2011 TABs Projects Fund - To account for capital improvement project expenses funded by the Glendale
Successor Agency 2011 Tax Allocation Bonds (non-housing portion).
153

This page is left blank intentionally.
154
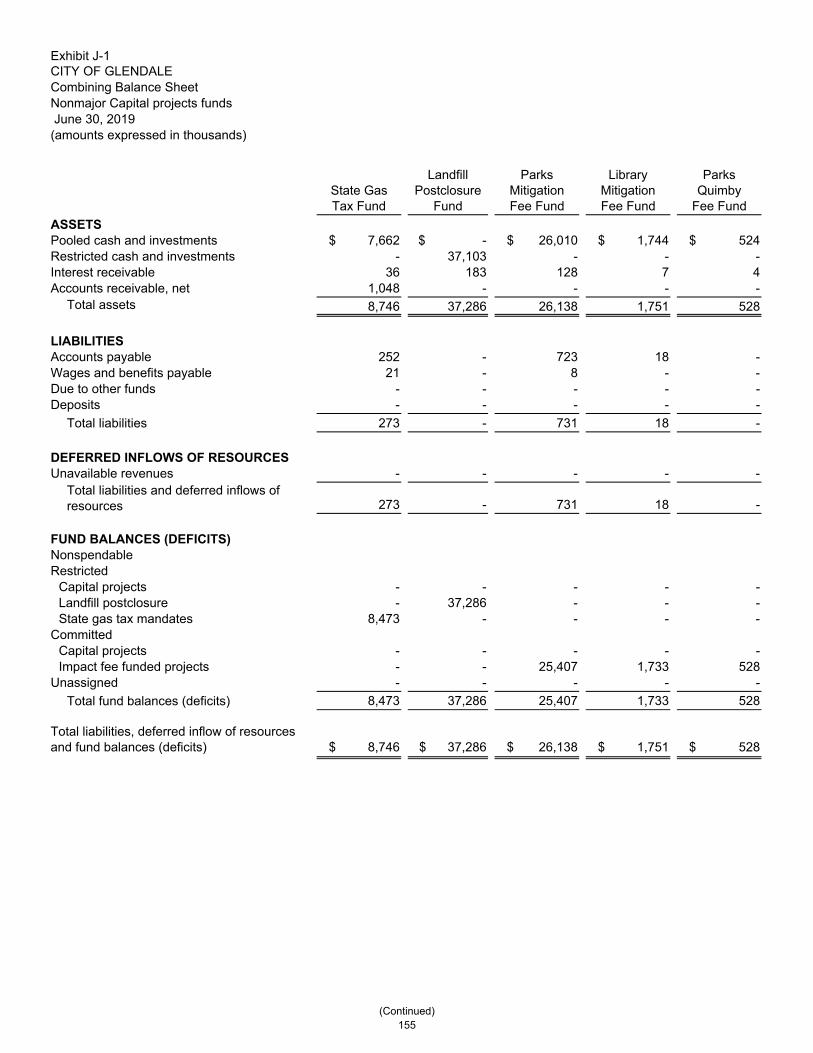
Exhibit J-1 CITY OF GLENDALE Combining Balance Sheet Nonmajor Capital projects funds June 30, 2019 (amounts expressed in thousands)
State GasTax Fund
Landfill Postclosure
Fund
Parks MitigationFee Fund
Library MitigationFee Fund
ParksQuimby
Fee Fund
ASSETS Pooled cash and investments $ 7,662 $ - $ 26,010 $ 1,744 $ 524 Restricted cash and investments - 37,103 - - - Interest receivable 36 183 128 7 4 Accounts receivable, net 1,048 - - - -
Total assets 8,746 37,286 26,138 1,751 528
LIABILITIES Accounts payable 252 - 723 18 - Wages and benefits payable 21 - 8 - - Due to other funds - - - - - Deposits - - - - -
Total liabilities 273 - 731 18 -
DEFERRED INFLOWS OF RESOURCES Unavailable revenues - - - - -
Total liabilities and deferred inflows of resources 273 - 731 18 -
FUND BALANCES (DEFICITS) Nonspendable Restricted
Capital projects - - - - - Landfill postclosure - 37,286 - - - State gas tax mandates 8,473 - - - -
Committed Capital projects - - - - - Impact fee funded projects - - 25,407 1,733 528
Unassigned - - - - -
Total fund balances (deficits) 8,473 37,286 25,407 1,733 528
Total liabilities, deferred inflow of resources and fund balances (deficits) $ 8,746 $ 37,286 $ 26,138 $ 1,751 $ 528
(Continued) 155
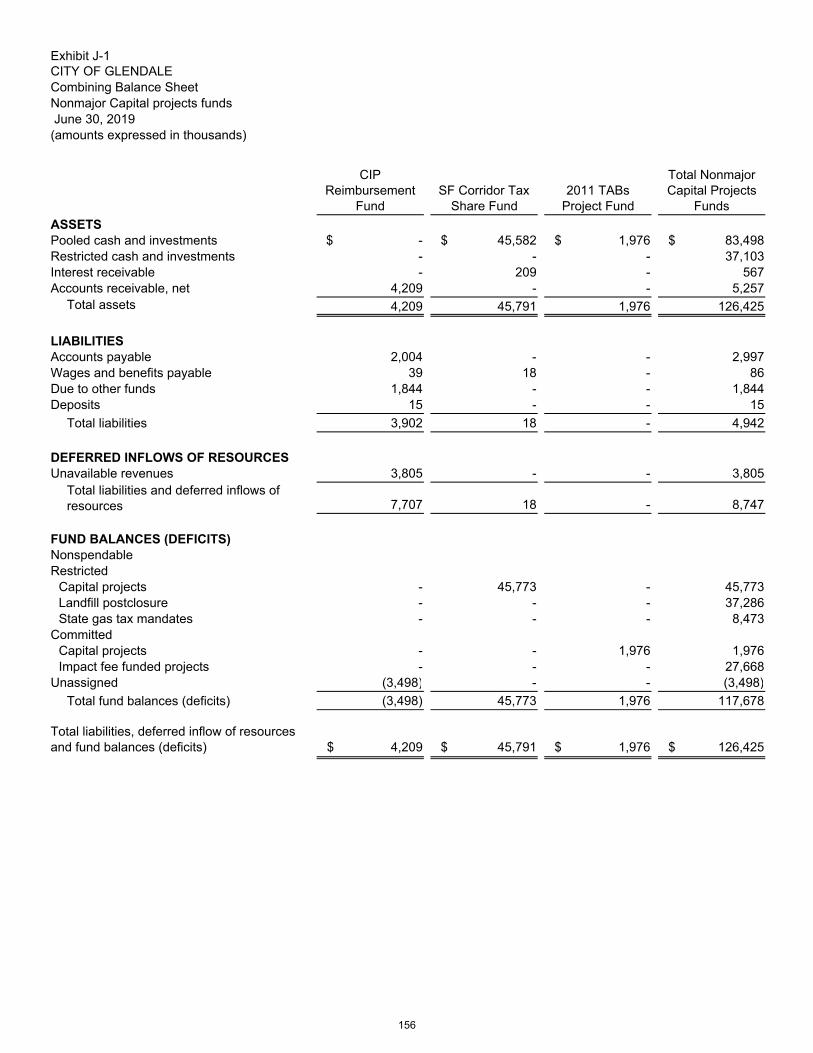
Exhibit J-1 CITY OF GLENDALE Combining Balance Sheet Nonmajor Capital projects funds June 30, 2019 (amounts expressed in thousands)
ASSETS Pooled cash and investments Restricted cash and investments Interest receivable Accounts receivable, net
Total assets
LIABILITIES Accounts payable Wages and benefits payable Due to other funds Deposits
Total liabilities
DEFERRED INFLOWS OF RESOURCES Unavailable revenues
Total liabilities and deferred inflows of resources
FUND BALANCES (DEFICITS) Nonspendable Restricted
Capital projects Landfill postclosure State gas tax mandates
Committed Capital projects Impact fee funded projects
Unassigned
Total fund balances (deficits)
Total liabilities, deferred inflow of resources and fund balances (deficits)
CIP Reimbursement
FundSF Corridor Tax
Share Fund2011 TABs
Project Fund
Total Nonmajor Capital Projects
Funds
$ - $ 45,582 $ 1,976 $ 83,498 - - - 37,103 - 209 - 567
4,209 - - 5,257
4,209 45,791 1,976 126,425
2,004 - - 2,997 39 18 - 86
1,844 - - 1,84415 - - 15
3,902 18 - 4,942
3,805 - - 3,805
7,707 18 - 8,747
- 45,773 - 45,773- - - 37,286 - - - 8,473
- - 1,976 1,976 - - - 27,668
(3,498) - - (3,498)
(3,498) 45,773 1,976 117,678
$ 4,209 $ 45,791 $ 1,976 $ 126,425
156

Exhibit J-2 CITY OF GLENDALE Combining Statement of Revenues,Expenditures, and Changes in Fund BalancesNonmajor Capital projects funds For the Year Ended June 30, 2019 (amounts expressed in thousands)
State Gas Tax Fund
Landfill Postclosure
Fund
ParksMitigationFee Fund
Library MitigationFee Fund
ParksQuimby
Fee Fund
REVENUES Revenue from other agencies $ 7,921 $ - $ - $ - $ - Licenses and permits - - 2,580 272 490 Use of money and property 258 876 1,030 73 12 Miscellaneous revenue - - - 4 -
Total revenues 8,179 876 3,610 349 502
EXPENDITURES Current:
Public works 1,221 - - - - Housing, health and community development - - - - - Parks, recreation and community services - - 158 - - Library - - - 16 -
Capital outlay 2,890 - 972 212 -
Total expenditures 4,111 - 1,130 228 - Excess (deficiency) of revenues over (under) expenditures 4,068 876 2,480 121 502
OTHER FINANCING SOURCES (USES) Transfers in - 4,560 - - -
Total other financing sources (uses) - 4,560 - - -
SPECIAL ITEMTransfer of bond proceeds fromSuccessor Agency - - - - -
Net change in fund balances 4,068 5,436 2,480 121 502
Fund balances - beginning 4,405 31,850 22,927 1,612 26 Fund balances - ending $ 8,473 $ 37,286 $ 25,407 $ 1,733 $ 528
(Continued) 157

Exhibit J-2 CITY OF GLENDALE Combining Statement of Revenues,Expenditures, and Changes in Fund BalancesNonmajor Capital projects funds For the Year Ended June 30, 2019 (amounts expressed in thousands)
REVENUES Revenue from other agencies Licenses and permits Use of money and property Miscellaneous revenue
Total revenues
EXPENDITURES Current:
Public works Housing, health and community development Parks, recreation and community services Library
Capital outlay
Total expenditures Excess (deficiency) of revenues over (under) expenditures
OTHER FINANCING SOURCES (USES) Transfers in
Total other financing sources (uses)
SPECIAL ITEMTransfer of bond proceeds fromSuccessor Agency
Net change in fund balances
Fund balances - beginning Fund balances - ending
CIP Reimbursement
FundSF Corridor Tax
Share Fund2011 TABs
Project Fund
Total Nonmajor Capital Projects
Funds
$ 4,386 $ 5,296 $ - $ 17,603 - - - 3,342 1 1,711 - 3,961
40 - - 44
4,427 7,007 - 24,950
487 118 - 1,826
35 - - 35 4 - - 162 - - - 16
5,636 - - 9,710
6,162 118 - 11,749
(1,735) 6,889 - 13,201
- - - 4,560
- - - 4,560
- - 1,976 1,976
(1,735) 6,889 1,976 19,737
(1,763) 38,884 - 97,941
$ (3,498) $ 45,773 $ 1,976 $ 117,678
158

Nonmajor Enterprise Funds
This section of the CAFR provides information on nonmajor enterprise funds,which are used to account for operations that provide goods or services to thegeneral public that are financed primarily by a user charge or where the periodicmeasurement of net income is deemed appropriate.
Nonm
ajor Enterprise Funds
NONMAJOR ENTERPRISE FUNDS
5300 - Refuse Disposal Fund - To account for operations of the City-owned refuse collection and disposal service. 5800 - Fire Communication Fund - To account for monies received and expended, as the lead city, for the tri-city
(Burbank, Glendale and Pasadena) Verdugo Fire Communication operations.
159

This page is left blank intentionally.
160

Exhibit K-1 CITY OF GLENDALE Combining Statement of Net Position Nonmajor Enterprise funds June 30, 2019 (amounts expressed in thousands)
Refuse DisposalFund
Fire Communication Fund
Total Nonmajor Enterprise Funds
ASSETS Current assets:
Pooled cash and investments $ 38,763 $ 8,634 $ 47,397 Interest receivable 187 42 229 Accounts receivable, net 2,651 - 2,651 Loans receivable - 25 25 Prepaid items - 89 89
Total current assets 41,601 8,790 50,391 Noncurrent assets:
Capital assets, not being depreciated 1,692 797 2,489 Capital assets, net 7,685 615 8,300
Total noncurrent assets 9,377 1,412 10,789 Total assets 50,978 10,202 61,180
DEFERRED OUTFLOWS OF RESOURCES Deferred outflows related to pensions 2,364 631 2,995
Total assets and deferred outflows of resources 53,342 10,833 64,175
LIABILITIES Current liabilities:
Accounts payable 3,463 35 3,498 Wages and benefits payable 504 182 686 Deposits 480 - 480
Total current liabilities 4,447 217 4,664 Noncurrent liabilities:
Net pension liability 14,551 3,235 17,786 Total liabilities 18,998 3,452 22,450
DEFERRED INFLOWS OF RESOURCES Deferred inflows related to pensions 392 157 549
Total liabilities and deferred inflows of resources 19,390 3,609 22,999
NET POSITION Net investment in capital assets 9,377 1,412 10,789 Unrestricted 24,575 5,812 30,387
Total net position $ 33,952 $ 7,224 $ 41,176
161

Exhibit K-2 CITY OF GLENDALE Combining Statement of Revenues, Expenditures, and Changes in Net Position Normajor Enterprise funds For the Year Ended June 30, 2019 (amounts expressed in thousands)
Refuse DisposalFund
Fire Communication Fund
Total Nonmajor Enterprise funds
OPERATING REVENUES Charges for services $ 22,727 $ 4,225 $ 26,952 Miscellaneous revenue 564 2 566
Total operating revenues 23,291 4,227 27,518
OPERATING EXPENSES Maintenance and operation 20,675 4,262 24,937 Depreciation 1,324 132 1,456
Total operating expenses 21,999 4,394 26,393 Operating income (loss) 1,292 (167) 1,125
NONOPERATING REVENUES (EXPENSES) Use of money and property 1,595 360 1,955 Intergovernmental grants 158 - 158
Total nonoperating revenues (expenses) 1,753 360 2,113 Income (loss) before transfers 3,045 193 3,238
Transfers out (1,150) - (1,150)Change in net position 1,895 193 2,088
Total net position - beginning 32,057 7,031 39,088 Total net position - ending $ 33,952 $ 7,224 $ 41,176
162

Exhibit K-3 CITY OF GLENDALE Statement of Cash Flows Nonmajor Enterprise funds For the Year Ended June 30, 2019 (amounts expressed in thousands)
Refuse Disposal Fund
Fire Communication
Fund
Total Nonmajor Enterprise
FundsCASH FLOWS FROM OPERATING ACTIVITIES
Cash receipts from customers $ 23,233 $ 4,227 $ 27,460 Payments to employees (7,751) (3,086) (10,837)Payments to suppliers (9,437) (895) (10,332)
Net cash provided (used) by operating activities 6,045 246 6,291
CASH FLOWS FROM NONCAPITAL FINANCING ACTIVITIES Transfers in (out) (1,150) - (1,150)Operating grants received 158 - 158 Loans receivable - (25) (25)
Net cash provided (used) by noncapital financing activities (992) (25) (1,017)
CASH FLOWS FROM CAPITAL AND RELATED FINANCING ACTIVITIES
Acquisition of property, plant, equipment and gas reserves (2,227) (25) (2,252)Proceed from sales of capital assets 66 - 66
Net cash provided (used) by capital and related financing activities (2,161) (25) (2,186)
CASH FLOWS FROM INVESTING ACTIVITIES Interest received 1,480 353 1,833
Net increase (decrease) in cash and cash equivalents 4,372 549 4,921 Balances - beginning of year 34,391 8,085 42,476 Balances - end of the year 38,763 8,634 47,397
Reconciliation of operating income (loss) to net cash provided (used) by operating activities:
Operating Income (loss) 1,292 (167) 1,125 Adjustments to reconcile operating income (loss) to net cash provided (used) by operating activities:
Depreciation 1,324 132 1,456 Changes in assets and liabilities:
Pension expense 850 349 1,199 (Increase) Decrease Accounts receivable, net (111) - (111)(Increase) Decrease Prepaid expenses - (89) (89)Increase (Decrease) Accrued wages payable 33 (1) 32 Increase (Decrease) Accounts payable 2,604 22 2,626 Increase (Decrease) Deposits 53 - 53
Net cash provided (used) by operating activities $ 6,045 $ 246 $ 6,291
163

This page is left blank intentionally.
164

Internal Service Funds
This section of the CAFR provides information on each individual internal servicefund. Internal service funds are used by the City to centralize certain services and thenallocate the cost of those services to the user departments on a cost reimbursementbasis. User fund charges from internal service funds with capital assets typicallyconsist of two components: a maintenance/service component and a capitalreplacement component. User fund charges from self-insurance internal servicefunds generally are based on claims experience of the user department.
Internal Service Funds

INTERNAL SERVICE FUNDS 6010 - Fleet/Equipment Management Fund - To account for equipment replacement resources which are derived
from periodic charges to governmental operations to ensure timely replacement of equipment. 6020 - Joint Helicopter Operation Fund - To account for resources and expenses for the operation of the Joint Law
Enforcement Air Support Unit between City of Glendale and City of Burbank. 6030 - ISD Infrastructure Fund - To account for technological equipment replacement resources which are derived
from periodic charges to governmental operations to ensure timely replacement of the technological equipment. 6040 - ISD Applications Fund - To account for major ISD Applications resources which are derived from periodic
charges to governmental operations to ensure timely replacement of the major application software.
6070 - Building Maintenance Fund - To account for maintenance, repairs or services necessary to sustain facility operations at approximately one hundred City owned facilities.
6100 - Unemployment Insurance Fund - To finance and account for unemployment claims. Resources are derived
from unemployment insurance charges to various City operations. Unemployment claims are reimbursed to the State Employment Department which disburses the unemployment claims.
6120 - Liability Insurance Fund - To account for financing and disbursement of City self-insurance funds for
uninsurable litigation activities, general liability and auto liability claims. Charges, in lieu of insurance premiums, are made periodically to City operations to provide the self-insurance resources.
6140 - Compensation Insurance Fund - To finance and account for the City's workers' compensation claims.
Funding is derived from charges in lieu of actual premiums to various City operations to provide the self-insurance resources.
6150 - Dental Insurance Fund - To finance and account for the City's dental insurance program for its employees.
Funding is derived from charges in lieu of actual premiums to various City operations to provide the self-insurance resources.
6160 - Medical Insurance Fund - To finance and account for the City's medical insurance program for its employees.
Funding is derived from charges in lieu of actual premiums to various City operations to provide the self-insurance resources.
6170 - Vision Insurance Fund - To finance and account for the City's vision insurance program for its employees.
Funding is derived from charges in lieu of actual premiums to various City operations to provide the self-insurance resources.
6400 - Employee Benefits Fund - To account for the resources and the liability for employees’ compensated
absences (vacation and comp time). 6410 - Retiree Health Savings Plan (RHSP) Benefits Fund - To account for the resources and the liability for
employees’ sick leave conversion under RHSP plan. 6420 - Post Employment Benefits Fund - To account for the resources and the liability for all the benefits provided
after the employees’ separation from the City. 6600 - ISD Wireless Fund - To account for the operation of the citywide radio system, including maintenance,
replacement and acquisition of equipment.
165

This page is left blank intentionally.
166
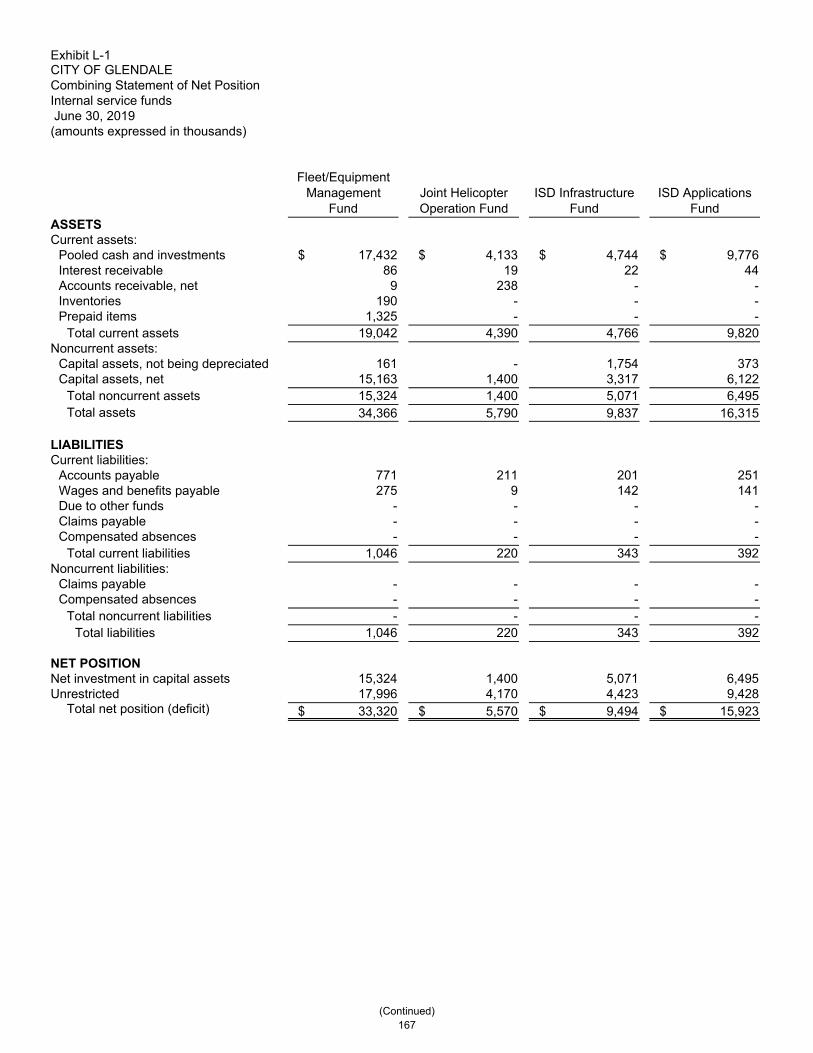
Exhibit L-1CITY OF GLENDALECombining Statement of Net Position Internal service funds June 30, 2019 (amounts expressed in thousands)
Fleet/Equipment Management
FundJoint Helicopter Operation Fund
ISD Infrastructure Fund
ISD Applications Fund
ASSETS Current assets:
Pooled cash and investments $ 17,432 $ 4,133 $ 4,744 $ 9,776 Interest receivable 86 19 22 44 Accounts receivable, net 9 238 - - Inventories 190 - - - Prepaid items 1,325 - - -
Total current assets 19,042 4,390 4,766 9,820 Noncurrent assets:
Capital assets, not being depreciated 161 - 1,754 373 Capital assets, net 15,163 1,400 3,317 6,122
Total noncurrent assets 15,324 1,400 5,071 6,495 Total assets 34,366 5,790 9,837 16,315
LIABILITIES Current liabilities:
Accounts payable 771 211 201 251 Wages and benefits payable 275 9 142 141 Due to other funds - - - - Claims payable - - - - Compensated absences - - - -
Total current liabilities 1,046 220 343 392 Noncurrent liabilities:
Claims payable - - - - Compensated absences - - - -
Total noncurrent liabilities - - - - Total liabilities 1,046 220 343 392
NET POSITION Net investment in capital assets 15,324 1,400 5,071 6,495 Unrestricted 17,996 4,170 4,423 9,428
Total net position (deficit) $ 33,320 $ 5,570 $ 9,494 $ 15,923
(Continued) 167

Exhibit L-1CITY OF GLENDALECombining Statement of Net Position Internal service funds June 30, 2019 (amounts expressed in thousands)
ASSETS Current assets:
Pooled cash and investments Interest receivable Accounts receivable, net Inventories Prepaid items
Total current assets Noncurrent assets:
Capital assets, not being depreciated Capital assets, net
Total noncurrent assets Total assets
LIABILITIES Current liabilities:
Accounts payable Wages and benefits payable Due to other funds Claims payable Compensated absences
Total current liabilities Noncurrent liabilities:
Claims payable Compensated absences
Total noncurrent liabilities Total liabilities
NET POSITION Net investment in capital assets Unrestricted
Total net position (deficit)
Building Maintenance Fund
Unemployment Insurance Fund
Liability Insurance Fund
Compensation Insurance Fund
$ 3,938 $ 187 $ 18,997 $ 40,045 19 1 350 196
- 3 1,680 1,120 - - - - - - - -
3,957 191 21,027 41,361
316 - - - 10 - - 7
326 - - 7 4,283 191 21,027 41,368
430 56 452 206 214 - 14 360
- - - - - - 6,761 8,885 - - - -
644 56 7,227 9,451
- - 5,175 36,688 - - - - - - 5,175 36,688
644 56 12,402 46,139
326 - - 7 3,313 135 8,625 (4,778)
$ 3,639 $ 135 $ 8,625 $ (4,771)
(Continued) 168
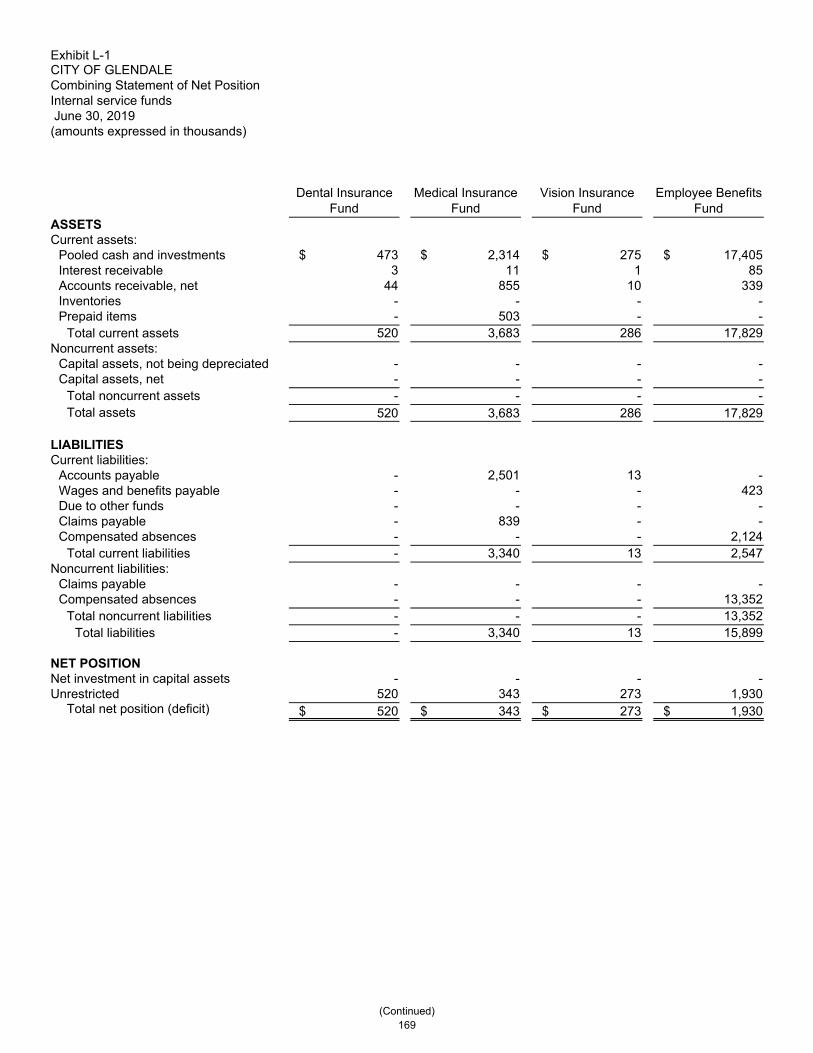
Exhibit L-1CITY OF GLENDALECombining Statement of Net Position Internal service funds June 30, 2019 (amounts expressed in thousands)
ASSETS Current assets:
Pooled cash and investments Interest receivable Accounts receivable, net Inventories Prepaid items
Total current assets Noncurrent assets:
Capital assets, not being depreciated Capital assets, net
Total noncurrent assets Total assets
LIABILITIES Current liabilities:
Accounts payable Wages and benefits payable Due to other funds Claims payable Compensated absences
Total current liabilities Noncurrent liabilities:
Claims payable Compensated absences
Total noncurrent liabilities Total liabilities
NET POSITION Net investment in capital assets Unrestricted
Total net position (deficit)
Dental Insurance Fund
Medical Insurance Fund
Vision Insurance Fund
Employee Benefits Fund
$ 473 $ 2,314 $ 275 $ 17,405 3 11 1 85
44 855 10 339 - - - - - 503 - -
520 3,683 286 17,829
- - - - - - - - - - - -
520 3,683 286 17,829
- 2,501 13 - - - - 423
- - - - - 839 - - - - - 2,124 - 3,340 13 2,547
- - - - - - - 13,352 - - - 13,352 - 3,340 13 15,899
- - - - 520 343 273 1,930
$ 520 $ 343 $ 273 $ 1,930
(Continued) 169

Exhibit L-1CITY OF GLENDALECombining Statement of Net Position Internal service funds June 30, 2019 (amounts expressed in thousands)
ASSETS Current assets:
Pooled cash and investments Interest receivable Accounts receivable, net Inventories Prepaid items
Total current assets Noncurrent assets:
Capital assets, not being depreciated Capital assets, net
Total noncurrent assets Total assets
LIABILITIES Current liabilities:
Accounts payable Wages and benefits payable Due to other funds Claims payable Compensated absences
Total current liabilities Noncurrent liabilities:
Claims payable Compensated absences
Total noncurrent liabilities Total liabilities
NET POSITION Net investment in capital assets Unrestricted
Total net position (deficit)
Retiree Health Savings Plan
(RHSP) Benefits Fund
Post Employment Benefits Fund
ISD Wireless Fund
Total Internal service funds
$ 17,621 $ - $ 1,055 $ 138,395 86 - 1 924
103 44 2,195 6,640 - - - 190 - - 404 2,232
17,810 44 3,655 148,381
- - 2,253 4,857 - - 5,663 31,682 - - 7,916 36,539
17,810 44 11,571 184,920
- 27 414 5,533 24 - 63 1,665
- 196 - 196- - - 16,485
1,209 - - 3,333 1,233 223 477 27,212
- - - 41,863 13,744 - - 27,096 13,744 - - 68,959 14,977 223 477 96,171
- - 7,916 36,539 2,833 (179) 3,178 52,210
$ 2,833 $ (179) $ 11,094 $ 88,749
170

Exhibit L-2 CITY OF GLENDALE Combining Statement of Revenues, Expenditures, and Changes in Net Position Internal service funds For the Year Ended June 30, 2019 (amounts expressed in thousands)
Fleet/Equipment Management
FundJoint Helicopter Operation Fund
ISD Infrastructure Fund
ISD Applications Fund
OPERATING REVENUES Charges for services $ 11,834 $ 1,308 $ 7,516 $ 6,838 Miscellaneous revenue 30 - - -
Total operating revenues 11,864 1,308 7,516 6,838
OPERATING EXPENSES Maintenance and operation 9,969 954 7,431 7,160 Claims and settlement - - - - Depreciation 1,650 103 853 - Amortization - - 11 75
Total operating expenses 11,619 1,057 8,295 7,235 Operating income (loss) 245 251 (779) (397)
NONOPERATING REVENUES (EXPENSES) Use of money and property 895 156 209 407 Intergovernmental grants 39 - 1 -
Total nonoperating revenues (expenses) 934 156 210 407 Income (loss) before capital grants and contributions and transfers 1,179 407 (569) 10
Capital grants and contributions - - - - Transfers in - - - - Transfers out - - - -
Change in net position 1,179 407 (569) 10Total net position - beginning 32,141 5,163 10,063 15,913Total net position - ending $ 33,320 $ 5,570 $ 9,494 $ 15,923
(Continued) 171

Exhibit L-2 CITY OF GLENDALE Combining Statement of Revenues, Expenditures, and Changes in Net Position Internal service funds For the Year Ended June 30, 2019 (amounts expressed in thousands)
OPERATING REVENUES Charges for services Miscellaneous revenue
Total operating revenues
OPERATING EXPENSES Maintenance and operation Claims and settlement Depreciation Amortization
Total operating expenses Operating income (loss)
NONOPERATING REVENUES (EXPENSES) Use of money and property Intergovernmental grants
Total nonoperating revenues (expenses) Income (loss) before capital grants and contributions and transfers
Capital grants and contributions Transfers in Transfers out
Change in net position Total net position - beginning Total net position - ending
Building Maintenance
FundUnemployment Insurance Fund
Liability Insurance Fund
Compensation Insurance Fund
$ 7,442 $ 52 $ 6,425 $ 18,409 - - 2,664 -
7,442 52 9,089 18,409
7,409 5 2,139 3,672 - 121 6,682 12,564 - - - 3 - - - -
7,409 126 8,821 16,239 33 (74) 268 2,170
164 23 752 1,572 - - - -
164 23 752 1,572
197 (51) 1,020 3,742 - - - - - - - 700 - (700) - -
197 (751) 1,020 4,442 3,442 886 7,605 (9,213)
$ 3,639 $ 135 $ 8,625 $ (4,771)
(Continued) 172

Exhibit L-2 CITY OF GLENDALE Combining Statement of Revenues, Expenditures, and Changes in Net Position Internal service funds For the Year Ended June 30, 2019 (amounts expressed in thousands)
OPERATING REVENUES Charges for services Miscellaneous revenue
Total operating revenues
OPERATING EXPENSES Maintenance and operation Claims and settlement Depreciation Amortization
Total operating expenses Operating income (loss)
NONOPERATING REVENUES (EXPENSES) Use of money and property Intergovernmental grants
Total nonoperating revenues (expenses) Income (loss) before capital grants and contributions and transfers
Capital grants and contributions Transfers in Transfers out
Change in net position Total net position - beginning Total net position - ending
Dental Insurance Fund
Medical Insurance Fund
Vision Insurance Fund
Employee Benefits Fund
$ 1,321 $ 23,595 $ 226 $ 6,498 - 8 - -
1,321 23,603 226 6,498
58 1,208 14 67 1,204 22,380 200 5,151
- - - - - - - -
1,262 23,588 214 5,218 59 15 12 1,280
34 74 17 688 - - - -
34 74 17 688
93 89 29 1,968 - - - - - 850 - -
(600) - (250) - (507) 939 (221) 1,9681,027 (596) 494 (38)
$ 520 $ 343 $ 273 $ 1,930
(Continued) 173

Exhibit L-2 CITY OF GLENDALE Combining Statement of Revenues, Expenditures, and Changes in Net Position Internal service funds For the Year Ended June 30, 2019 (amounts expressed in thousands)
OPERATING REVENUES Charges for services Miscellaneous revenue
Total operating revenues
OPERATING EXPENSES Maintenance and operation Claims and settlement Depreciation Amortization
Total operating expenses Operating income (loss)
NONOPERATING REVENUES (EXPENSES) Use of money and property Intergovernmental grants
Total nonoperating revenues (expenses) Income (loss) before capital grants and contributions and transfers
Capital grants and contributions Transfers in Transfers out
Change in net position Total net position - beginning Total net position - ending
Retiree Health Savings Plan
(RHSP) Benefits Fund
Post Employment Benefits Fund
ISD Wireless Fund
Total Internal service funds
$ 1,724 $ 688 $ 4,420 $ 98,296 - - 5 2,707
1,724 688 4,425 101,003
29 19 3,717 43,851 1,763 619 - 50,684
- - 1,082 3,691- - - 86
1,792 638 4,799 98,312 (68) 50 (374) 2,691
720 - 62 5,773 - - 2 42
720 - 64 5,815
652 50 (310) 8,506- - 2,718 2,718 - - - 1,550 - - - (1,550)
652 50 2,408 11,224 2,181 (229) 8,686 77,525
$ 2,833 $ (179) $ 11,094 $ 88,749
174

Exhibit L-3 CITY OF GLENDALE Statement of Cash Flows Internal service funds For the Year Ended June 30, 2019 (amounts expressed in thousands)
Fleet/Equipment Management
FundJoint Helicopter Operation Fund
ISD Infrastructure
Fund
ISD Applications
FundCASH FLOWS FROM OPERATING ACTIVITIES
Cash receipts from customers $ 11,861 $ 1,208 $ 7,516 $ 6,838 Payments to employees (4,165) (147) (2,551) (2,656)Payments to suppliers (5,741) (632) (5,026) (4,517)
Net cash provided (used) by operating activities 1,955 429 (61) (335)
CASH FLOWS FROM NONCAPITAL FINANCING ACTIVITIES
Amounts paid to other funds - - - - Transfers in (out) - - - - Operating grants received 39 - 1 -
Net cash provided (used) by noncapital financing activities 39 - 1 -
CASH FLOWS FROM CAPITAL AND RELATED FINANCING
Acquisition of property, plant, equipment and gas reserves (5,234) - (845) (607)Capital grants received - - - - Proceed from sales of capital assets 98 - - -
Net cash provided (used) by capital and related financing activities (5,136) - (845) (607)
CASH FLOWS FROM INVESTING ACTIVITIES Interest received 792 149 210 405
Net increase (decrease) in cash and cash equivalents (2,350) 578 (695) (537)
Balances - beginning of year 19,782 3,555 5,439 10,313Balances - end of the year 17,432 4,133 4,744 9,776
Reconciliation of operating income (loss) to net cash provided (used) by operating activities:
Operating Income (loss) 245 251 (779) (397)Adjustments to reconcile operating income (loss) to net cash provided (used) by operating activities:
Depreciation 1,650 103 853 - Amortization - - 11 75
Changes in assets and liabilities: (Increase) Decrease Accounts receivable, net (5) (101) - - (Increase) Inventories 20 - - - (Increase) Decrease Prepaid expenses - - - - Increase (Decrease) Accrued wages payable 61 1 14 3 Increase Compensated absences - - - - Increase (Decrease) Accounts payable (16) 175 (160) (16)Increase Claims payable - - - -
Net cash provided (used) by operating activities $ 1,955 $ 429 $ (61) $ (335)
(Continued) 175

Exhibit L-3 CITY OF GLENDALE Statement of Cash Flows Internal service funds For the Year Ended June 30, 2019 (amounts expressed in thousands)
CASH FLOWS FROM OPERATING ACTIVITIES Cash receipts from customers Payments to employees Payments to suppliers
Net cash provided (used) by operating activities
CASH FLOWS FROM NONCAPITAL FINANCING ACTIVITIES
Amounts paid to other funds Transfers in (out) Operating grants received
Net cash provided (used) by noncapital financing activities
CASH FLOWS FROM CAPITAL AND RELATED FINANCING
Acquisition of property, plant, equipment and gas reserves Capital grants received Proceed from sales of capital assets
Net cash provided (used) by capital and related financing activities
CASH FLOWS FROM INVESTING ACTIVITIES Interest received
Net increase (decrease) in cash and cash equivalents
Balances - beginning of year Balances - end of the year
Reconciliation of operating income (loss) to net cash provided (used) by operating activities:
Operating Income (loss) Adjustments to reconcile operating income (loss) to net cash provided (used) by operating activities:
Depreciation Amortization
Changes in assets and liabilities: (Increase) Decrease Accounts receivable, net (Increase) Inventories (Increase) Decrease Prepaid expenses Increase (Decrease) Accrued wages payable Increase Compensated absences Increase (Decrease) Accounts payable Increase Claims payable
Net cash provided (used) by operating activities
Building Maintenance
FundUnemployment Insurance Fund
Liability Insurance Fund
Compensation Insurance Fund
$ 7,442 $ 52 $ 8,279 $ 18,423 (3,146) - (385) (2,166)(4,042) (67) (5,725) (11,238)
254 (15) 2,169 5,019
- - - - - (700) - 700- - - -
- (700) - 700
(326) - - - - - - - - - - -
(326) - - -
161 25 728 1,512
89 (690) 2,897 7,231 3,849 877 16,100 32,814 3,938 187 18,997 40,045
33 (74) 268 2,170
- - - 3 - - - -
- - (809) 16 - - - - - - - -
42 3 (107) 61- - - -
179 56 301 174 - - 2,516 2,595
$ 254 $ (15) $ 2,169 $ 5,019
(Continued) 176

Exhibit L-3 CITY OF GLENDALE Statement of Cash Flows Internal service funds For the Year Ended June 30, 2019 (amounts expressed in thousands)
CASH FLOWS FROM OPERATING ACTIVITIES Cash receipts from customers Payments to employees Payments to suppliers
Net cash provided (used) by operating activities
CASH FLOWS FROM NONCAPITAL FINANCING ACTIVITIES
Amounts paid to other funds Transfers in (out) Operating grants received
Net cash provided (used) by noncapital financing activities
CASH FLOWS FROM CAPITAL AND RELATED FINANCING
Acquisition of property, plant, equipment and gas reserves Capital grants received Proceed from sales of capital assets
Net cash provided (used) by capital and related financing activities
CASH FLOWS FROM INVESTING ACTIVITIES Interest received
Net increase (decrease) in cash and cash equivalents
Balances - beginning of year Balances - end of the year
Reconciliation of operating income (loss) to net cash provided (used) by operating activities:
Operating Income (loss) Adjustments to reconcile operating income (loss) to net cash provided (used) by operating activities:
Depreciation Amortization
Changes in assets and liabilities: (Increase) Decrease Accounts receivable, net (Increase) Inventories (Increase) Decrease Prepaid expenses Increase (Decrease) Accrued wages payable Increase Compensated absences Increase (Decrease) Accounts payable Increase Claims payable
Net cash provided (used) by operating activities
Dental Insurance Fund
Medical Insurance Fund
Vision Insurance Fund
Employee Benefits Fund
$ 1,321 $ 23,603 $ 226 $ 6,498 - - - (4,376)
(1,349) (22,808) (216) (40)(28) 795 10 2,082
- - - - (600) 850 (250) -
- - - -
(600) 850 (250) -
- - - - - - - - - - - -
- - - -
37 65 17 665
(591) 1,710 (223) 2,7471,064 604 498 14,658
473 2,314 275 17,405
59 15 12 1,280
- - - - - - - -
- - - - - - - - - - - - 1 (30) - 424 - - - 378
(88) 840 (2) - - (30) - -
$ (28) $ 795 $ 10 $ 2,082
(Continued) 177

Exhibit L-3 CITY OF GLENDALE Statement of Cash Flows Internal service funds For the Year Ended June 30, 2019 (amounts expressed in thousands)
CASH FLOWS FROM OPERATING ACTIVITIES Cash receipts from customers Payments to employees Payments to suppliers
Net cash provided (used) by operating activities
CASH FLOWS FROM NONCAPITAL FINANCING ACTIVITIES
Amounts paid to other funds Transfers in (out) Operating grants received
Net cash provided (used) by noncapital financing activities
CASH FLOWS FROM CAPITAL AND RELATED FINANCING
Acquisition of property, plant, equipment and gas reserves Capital grants received Proceed from sales of capital assets
Net cash provided (used) by capital and related financing activities
CASH FLOWS FROM INVESTING ACTIVITIES Interest received
Net increase (decrease) in cash and cash equivalents
Balances - beginning of year Balances - end of the year
Reconciliation of operating income (loss) to net cash provided (used) by operating activities:
Operating Income (loss) Adjustments to reconcile operating income (loss) to net cash provided (used) by operating activities:
Depreciation Amortization
Changes in assets and liabilities: (Increase) Decrease Accounts receivable, net (Increase) Inventories (Increase) Decrease Prepaid expenses Increase (Decrease) Accrued wages payable Increase Compensated absences Increase (Decrease) Accounts payable Increase Claims payable
Net cash provided (used) by operating activities
Retiree Health Savings Plan
(RHSP) Benefits Fund
Post Employment
Benefits FundISD Wireless
FundTotal Internal service funds
$ 1,724 $ 688 $ 2,230 $ 97,909 - - (1,029) (20,621)
(780) (668) (3,648) (66,497)944 20 (2,447) 10,791
- (20) - (20)- - - - - - 2 42
- (20) 2 22
- - (2,336) (9,348)- - 2,718 2,718 - - - 98
- - 382 (6,532)
698 - 72 5,536
1,642 - (1,991) 9,817 15,979 - 3,046 128,578 17,621 - 1,055 138,395
(68) 50 (374) 2,691
- - 1,082 3,691 - - - 86
- - (2,195) (3,094)- - - 20 - - (404) (404)
1,012 (30) (55) 1,400 - - - 378 - - (501) 942 - - - 5,081
$ 944 $ 20 $ (2,447) $ 10,791
178

Statistical Section (Unaudited)Statistical Section (UNAUDITED)
The statistical section provides mostly trend data and nonfinancial information usefulin assessing the City’s financial condition. Because of the special character of thedata presented in the statistical section (i.e., data of prior years, nonfinancial data),the section does not fall within the scope of the independent audit.
• Financial Trends – These schedules contain trend information to help the reader understand how the City's financial performance and well-being have changed over time.
• Revenue Capacity – These schedules contain information to help the reader assess the City's two most significant local revenue sources, the electric revenue and the property tax.
• Debt Capacity – These schedules present information to help the reader assess the affordability of the City's current levels of outstanding debt and the City's ability to issue additional debt in the future.
• Demographic and Economic Information – These schedules offer demographic and economic indicators to help the reader understand the environment within which the City's financial activities take place.
• Operation Information – These schedules contain service and infrastructure data to help the reader understand how the information in the City's financial report relates to the services the City provides and the activities it performs.

Schedule 1CITY OF GLENDALENet Position by ComponentLast Ten Fiscal Years (in thousands)(accrual basis of accounting)
2019 2018 2017 2016 2015
Governmental activities $Net investment in capital assets 932,188 926,357 922,498 888,998 882,741 Restricted 175,754 168,556 124,491 110,281 74,413 Unrestricted (166,779) (1) (195,007) (1) (162,510) (1) (153,423) (1) (315,057) (1)
Total governmental activities net position 941,163 899,906 884,479 845,856 642,097
Business-type activities:Net investment in capital assets 387,043 401,010 409,287 422,656 437,125 Restricted 5,669 5,669 5,669 5,669 5,669 Unrestricted 320,351 288,494 263,001 222,463 159,220
Total business-type activities net position 713,063 695,173 677,957 650,788 602,014
Primary government:Net investment in capital assets 1,319,231 1,327,367 1,331,785 1,311,654 1,319,866 Restricted 181,423 174,225 130,160 115,950 80,082 Unrestricted 153,572 93,487 100,491 69,040 (155,837)
Total primary government net position $ 1,654,226 1,595,079 1,562,436 1,496,644 1,244,111
2014 2013 2012 (2) 2011 2010
Governmental activitiesNet investment in capital assets $ 829,862 816,785 802,729 814,946 806,721 Restricted 73,323 70,047 40,119 53,953 56,854 Unrestricted 47,188 62,419 104,152 85,930 91,582
Total governmental activities net position 950,373 949,251 947,000 954,829 955,157
Business-type activities:Net investment in capital assets 484,467 516,774 545,511 526,011 476,440 Restricted 5,669 5,669 5,669 15,474 13,864 Unrestricted 210,397 159,224 140,283 159,353 208,562
Total business-type activities net position 700,533 681,667 691,463 700,838 698,866
Primary government:Net investment in capital assets 1,314,329 1,333,559 1,348,240 1,340,957 1,283,161 Restricted 78,992 75,716 45,788 69,427 70,718 Unrestricted 257,585 221,643 244,435 245,283 300,144
Total primary government net position $ 1,650,906 1,630,918 1,638,463 1,655,667 1,654,023
Notes:
(1)
(2)
Source: City Finance Department
Not covered by independent auditor's report
In FY2012, only seven months of the Glendale Redevelopment Agency transactions was included in the governmental activities due to ABx1 26 - Redevelopment Agencies Dissolution on February 1, 2012. The transactions for the remainder of the fiscal year were recorded in the Glendale Successor Agency Private Purpose Trust Fiduciary Fund.
From FY2015 to FY2019, the negative unrestricted net position for governmental activities was due to the recognition of net pension liability pursuant to GASB Statement No. 68.
Fiscal Year
Fiscal Year
179

Schedule 2CITY OF GLENDALEChanges in Net PositionLast Ten Fiscal Years (in thousands)(accrual basis of accounting)
2019 2018 2017 2016 2015 (1)
Expenses
Governmental activities:General government $ 24,272 33,037 29,958 20,335 47,822 Police 92,931 92,679 80,687 72,274 74,596 Fire 65,484 67,285 59,228 51,386 48,796 Public works 40,720 30,072 28,021 31,925 26,558 Transportation 15,863 13,196 14,215 14,367 15,222 Housing, health, and community development 57,379 44,349 41,831 39,860 42,472 Employment programs 7,550 5,848 6,099 5,265 5,557 Public service 6,190 5,999 6,751 6,230 5,895 Parks, recreation and community services 20,204 19,697 18,710 15,889 13,325 Library 12,650 12,485 9,590 8,222 8,392 Interest and fiscal charges 1,125 2,139 2,763 2,203 1,398
Total governmental activities expenses 344,368 326,786 297,853 267,956 290,033
Business-type activities:Recreation - - - - 2,584 Hazardous disposal - - - - 1,511 Fire communications 4,286 4,126 3,399 3,149 2,965 Parking - - - - 7,702 Sewer 21,448 20,383 16,697 15,327 17,421 Refuse disposal 21,566 20,844 19,448 18,518 18,519 Electric 202,232 188,573 186,772 172,647 187,864 Water 49,750 48,458 43,400 42,017 45,068
Total business-type activities expenses 299,282 282,384 269,716 251,658 283,634
Total primary government expenses $ 643,650 609,170 567,569 519,614 573,667
Notes:
(1)
Source: City Finance Department
Not covered by independent auditor's report
Fiscal Year
Effective FY 2015, Recreation, Hazardous Disposal and Parking Funds were reclassified from enterprise funds to special revenue funds.
(Continued) 180

Schedule 2CITY OF GLENDALEChanges in Net PositionLast Ten Fiscal Years (in thousands)(accrual basis of accounting)
2019 2018 2017 2016 2015 (1)
Program Revenues
Governmental activities:Charges for services:
General government $ 21,604 20,810 16,601 17,554 18,554 Police 2,185 1,487 1,282 1,229 1,087 Fire 9,313 9,672 8,405 8,242 6,330 Public works 31,712 29,117 23,629 20,732 14,469 Transportation 6,874 7,115 10,632 9,882 6,849 Housing, health, and community development 1,253 177 118 68 55 Employment programs 2,330 1,691 1,711 1,509 1,401 Parks, recreation and community services 3,346 3,285 2,984 2,999 11 Library 118 138 83 156 174
Operating grants and contributions 58,580 55,448 56,317 56,398 55,415 Capital grants and contributions 17,458 9,447 8,776 8,083 6,969
Total governmental activities program revenues 154,773 138,387 130,538 126,852 111,314
Business-type activities:Charges for services:
Recreation - - - - 2,773 Hazardous disposal - - - - 1,632 Fire communications 4,225 3,984 3,794 3,515 3,253 Parking - - - - 9,303 Sewer 24,892 13,806 13,859 14,273 15,790 Refuse disposal 22,727 22,417 22,319 21,769 21,989 Electric 211,748 218,842 218,686 217,467 215,956 Water 48,726 50,771 48,601 49,972 47,520
Operating grants and contributions 200 72 207 54 120 Capital grants and contributions 8 12 61 305 2,306
Total business-type activities program revenues 312,526 309,904 307,527 307,355 320,642
Total primary government program revenues 467,299 448,291 438,065 434,207 431,956
Net (Expense) / RevenueGovernmental activities (189,595) (188,399) (167,315) (141,104) (178,719)Business-type activities 13,244 27,520 37,811 55,697 37,008Total primary government net expense $ (176,351) (160,879) (129,504) (85,407) (141,711)
Notes:
(1)
Source: City Finance Department
Not covered by independent auditor's report
Fiscal Year
Effective FY 2015, Recreation, Hazardous Disposal and Parking Funds were reclassified from enterprise funds to special revenue funds.
(Continued) 181
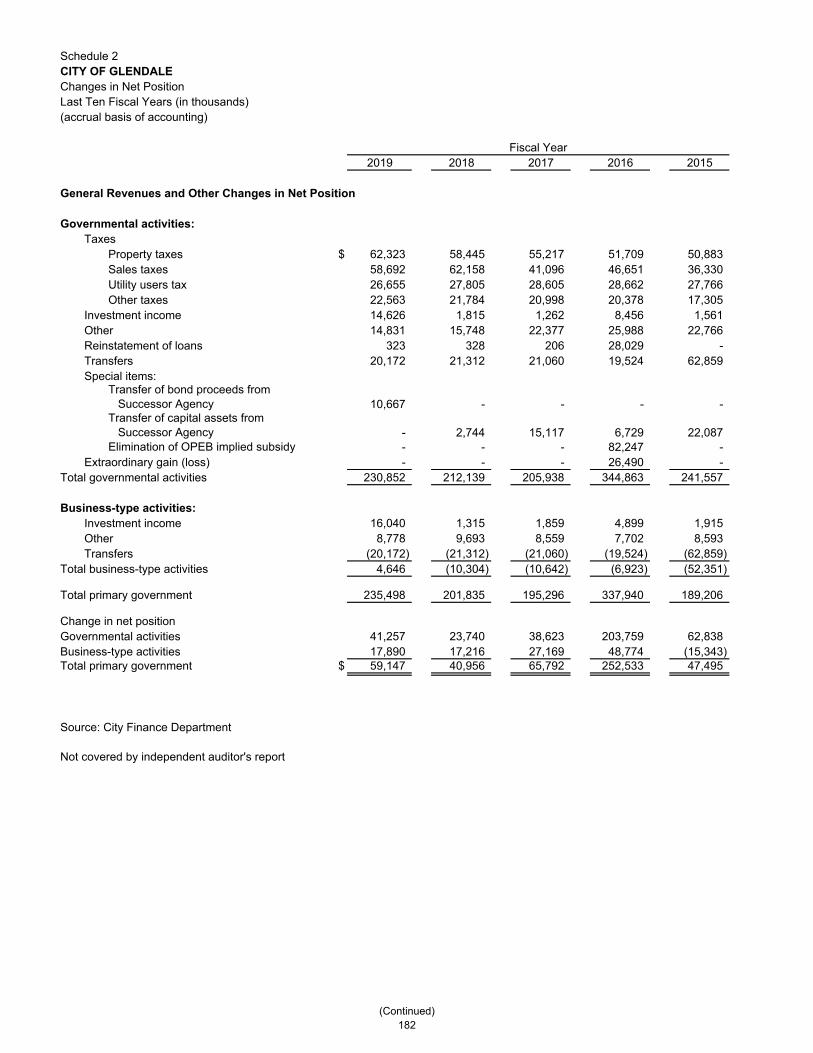
Schedule 2CITY OF GLENDALEChanges in Net PositionLast Ten Fiscal Years (in thousands)(accrual basis of accounting)
2019 2018 2017 2016 2015
General Revenues and Other Changes in Net Position
Governmental activities:Taxes
Property taxes $ 62,323 58,445 55,217 51,709 50,883 Sales taxes 58,692 62,158 41,096 46,651 36,330 Utility users tax 26,655 27,805 28,605 28,662 27,766 Other taxes 22,563 21,784 20,998 20,378 17,305
Investment income 14,626 1,815 1,262 8,456 1,561 Other 14,831 15,748 22,377 25,988 22,766 Reinstatement of loans 323 328 206 28,029 - Transfers 20,172 21,312 21,060 19,524 62,859 Special items:
Transfer of bond proceeds from Successor Agency 10,667 - - - - Transfer of capital assets from Successor Agency - 2,744 15,117 6,729 22,087
Elimination of OPEB implied subsidy - - - 82,247 - Extraordinary gain (loss) - - - 26,490 -
Total governmental activities 230,852 212,139 205,938 344,863 241,557
Business-type activities:Investment income 16,040 1,315 1,859 4,899 1,915 Other 8,778 9,693 8,559 7,702 8,593 Transfers (20,172) (21,312) (21,060) (19,524) (62,859)
Total business-type activities 4,646 (10,304) (10,642) (6,923) (52,351)
Total primary government 235,498 201,835 195,296 337,940 189,206
Change in net positionGovernmental activities 41,257 23,740 38,623 203,759 62,838 Business-type activities 17,890 17,216 27,169 48,774 (15,343) Total primary government $ 59,147 40,956 65,792 252,533 47,495
Source: City Finance Department
Not covered by independent auditor's report
Fiscal Year
(Continued) 182

Schedule 2CITY OF GLENDALEChanges in Net PositionLast Ten Fiscal Years (in thousands)(accrual basis of accounting)
2014 2013 2012 (1) 2011 2010
Expenses
Governmental activities:General government $ 64,776 33,432 22,151 25,700 24,157 Police 71,299 72,997 72,160 69,926 66,923 Fire 47,370 50,880 61,917 57,138 55,743 Public works 41,126 39,349 42,192 41,598 38,529 Housing, health, and community development 38,536 44,534 45,387 69,965 70,813 Employment programs 5,642 6,080 6,197 5,925 7,397 Public service 5,173 4,490 6,369 8,029 8,249 Parks, recreation and community services 12,372 12,326 12,804 16,449 15,578 Library 7,893 8,338 8,209 9,127 9,241 Interest and fiscal charges on bonds 2,553 1,932 10,871 12,696 17,232
Total governmental activities expenses 296,740 274,358 288,257 316,553 313,862
Business-type activities:Recreation 2,338 2,820 2,754 2,622 2,645 Hazardous disposal 1,170 1,709 1,507 1,745 1,848 Fire communications 2,521 3,291 3,528 3,289 3,306 Parking 6,317 7,683 7,674 7,763 7,609 Sewer 14,353 14,585 15,148 15,756 17,874 Refuse disposal 16,143 19,197 18,794 18,893 18,101 Electric 179,322 172,509 200,120 188,569 170,423 Water 42,927 41,862 40,937 35,790 34,953
Total business-type activities expenses 265,091 263,656 290,462 274,427 256,759
Total primary government expenses $ 561,831 538,014 578,719 590,980 570,621
Notes:
(1)
Source: City Finance Department
Not covered by independent auditor's report
Fiscal Year
In FY2012, only seven months of the Glendale Redevelopment Agency transactions were included in the governmental activities due to ABx1 26 - Redevelopment Agencies Dissolution on February 1, 2012. The transactions for the remainder of the fiscal year were recorded in the Glendale Successor Agency Private Purpose Trust Fiduciary Fund.
(Continued) 183

Schedule 2CITY OF GLENDALEChanges in Net PositionLast Ten Fiscal Years (in thousands)(accrual basis of accounting)
2014 2013 2012 (1) 2011 2010
Program Revenues
Governmental activities:Charges for services:
General government $ 17,895 16,249 16,738 17,276 13,922 Police 759 746 758 779 1,136 Fire 2,206 8,327 15,553 13,774 12,070 Public works 19,544 18,647 13,401 11,685 10,170 Housing, health, and community development 57 67 58 51 37 Employment programs 1,486 1,512 1,831 1,631 1,427 Parks, recreation and community services 11 15 8 13 9 Library 171 170 201 226 239
Operating grants and contributions 63,195 59,855 61,877 63,166 69,905 Capital grants and contributions 11,134 17,949 6,103 9,040 6,905
Total governmental activities program revenues 116,458 123,537 116,528 117,641 115,820
Business-type activities:Charges for services:
Recreation 2,813 2,645 2,648 2,640 2,353 Hazardous disposal 1,598 1,559 1,547 1,530 1,533 Fire communications 3,191 3,288 3,223 3,337 3,199 Parking 8,897 8,699 8,303 7,853 8,944 Sewer 15,576 16,143 15,716 14,977 14,709 Refuse disposal 21,195 21,704 20,457 20,776 19,941 Electric 196,263 173,701 196,007 187,801 176,903 Water 43,069 44,605 41,359 36,637 35,716
Operating grants and contributions 299 223 96 161 421 Capital grants and contributions 796 1,203 6,590 16,238 7,440
Total business-type activities program revenues 293,697 273,770 295,946 291,950 271,159
Total primary government program revenues 410,155 397,307 412,474 409,591 386,979
Net (Expense) / RevenueGovernmental activities (180,282) (150,821) (171,729) (198,912) (198,042) Business-type activities 28,606 10,114 5,484 17,523 14,400 Total primary government net expense $ (151,676) (140,707) (166,245) (181,389) (183,642)
Notes:
(1)
Source: City Finance Department
Not covered by independent auditor's report
In FY2012, only seven months of the Glendale Redevelopment Agency transactions was included in the governmental activities due to ABx1 26 - Redevelopment Agencies Dissolution on February 1, 2012. The transactions for the remainder of the fiscal year were recorded in the Glendale Successor Agency Private Purpose Trust Fiduciary Fund.
Fiscal Year
(Continued) 184

Schedule 2CITY OF GLENDALEChanges in Net PositionLast Ten Fiscal Years (in thousands)(accrual basis of accounting)
2014 2013 2012 (1) 2011 2010
General Revenues and Other Changes in Net Position
Governmental activities:Taxes
Property taxes $ 47,623 45,943 59,197 79,714 80,422 Sales taxes 35,408 33,789 31,874 30,030 27,594 Utility users tax 27,018 26,968 26,632 26,802 27,827 Other taxes 15,512 14,594 14,181 13,857 13,891
Investment income 1,776 (85) (2) 2,953 4,066 5,806 Other 30,097 13,401 21,370 17,948 18,077 Transfers 23,970 25,299 24,007 26,167 25,167 Gain on exchange of land - - - - 1,978 Special items:Extraordinary gain (loss) - (6,423) (16,314) - -
Total governmental activities 181,404 153,486 163,900 198,584 200,762
Business-type activities:Investment income 2,725 231 1,927 2,089 4,770 Other 11,505 8,270 7,221 8,527 4,274 Transfers (23,970) (25,299) (24,007) (26,167) (25,167)
Total business-type activities (9,740) (16,798) (14,859) (15,551) (16,123)
Total primary government 171,664 136,688 149,041 183,033 184,639
Change in net positionGovernmental activities 1,122 2,665 (7,829) (328) 2,720 Business-type activities 18,866 (6,684) (9,375) 1,972 (1,723) Total primary government $ 19,988 (4,019) (17,204) 1,644 997
Notes:(1)
(2)
Source: City Finance Department
Not covered by independent auditor's report
In FY2013, the negative investment income was due to the net decrease in the fair value of investments pursuant to GASB Statement No. 31.
In FY2012, only seven months of the Glendale Redevelopment Agency transactions were included in the governmental activities due to ABx1 26 - Redevelopment Agencies Dissolution on February 1, 2012. The transactions for the remainder of the fiscal year were recorded in the Glendale Successor Agency Private Purpose Trust Fiduciary Fund.
Fiscal Year
185
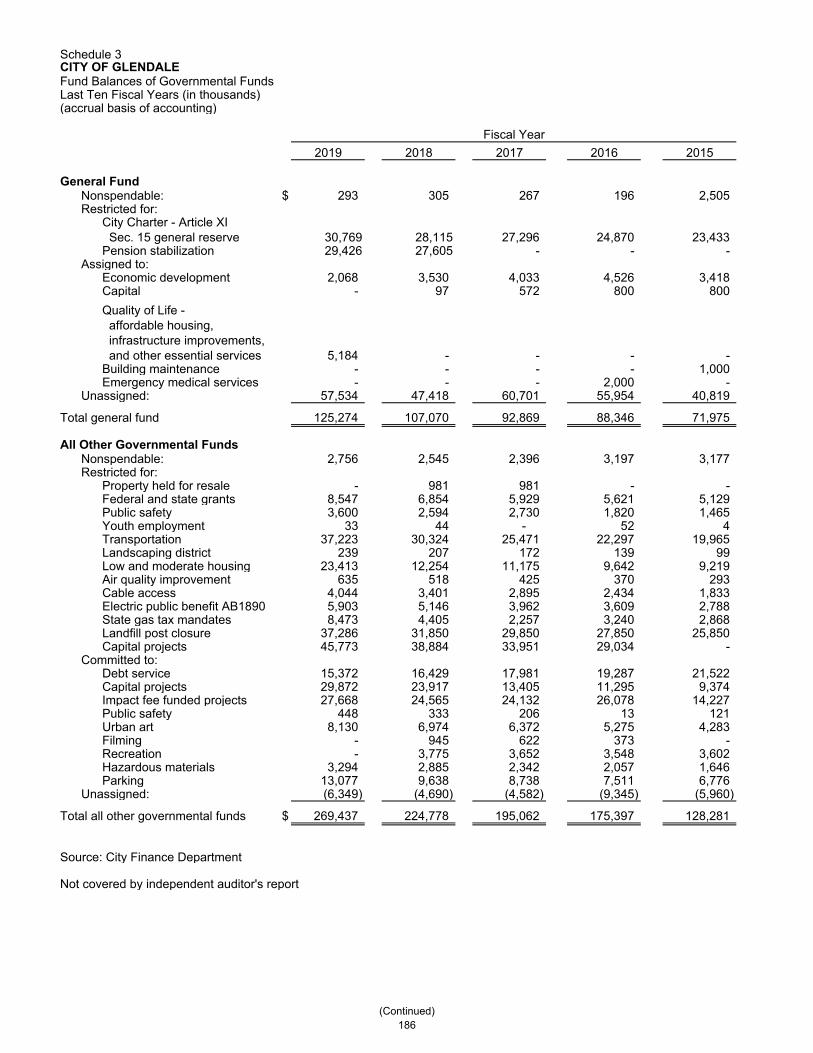
Schedule 3CITY OF GLENDALEFund Balances of Governmental FundsLast Ten Fiscal Years (in thousands)(accrual basis of accounting)
2019 2018 2017 2016 2015
General FundNonspendable: $ 293 305 267 196 2,505 Restricted for:
City Charter - Article XI Sec. 15 general reserve 30,769 28,115 27,296 24,870 23,433 Pension stabilization 29,426 27,605 - - -
Assigned to:Economic development 2,068 3,530 4,033 4,526 3,418 Capital - 97 572 800 800
Quality of Life - affordable housing, infrastructure improvements, and other essential services 5,184 - - - - Building maintenance - - - - 1,000 Emergency medical services - - - 2,000 -
Unassigned: 57,534 47,418 60,701 55,954 40,819
Total general fund 125,274 107,070 92,869 88,346 71,975
All Other Governmental FundsNonspendable: 2,756 2,545 2,396 3,197 3,177 Restricted for:
Property held for resale - 981 981 - -Federal and state grants 8,547 6,854 5,929 5,621 5,129 Public safety 3,600 2,594 2,730 1,820 1,465 Youth employment 33 44 - 52 4 Transportation 37,223 30,324 25,471 22,297 19,965 Landscaping district 239 207 172 139 99 Low and moderate housing 23,413 12,254 11,175 9,642 9,219 Air quality improvement 635 518 425 370 293 Cable access 4,044 3,401 2,895 2,434 1,833 Electric public benefit AB1890 5,903 5,146 3,962 3,609 2,788 State gas tax mandates 8,473 4,405 2,257 3,240 2,868 Landfill post closure 37,286 31,850 29,850 27,850 25,850 Capital projects 45,773 38,884 33,951 29,034 -
Committed to:Debt service 15,372 16,429 17,981 19,287 21,522 Capital projects 29,872 23,917 13,405 11,295 9,374 Impact fee funded projects 27,668 24,565 24,132 26,078 14,227 Public safety 448 333 206 13 121 Urban art 8,130 6,974 6,372 5,275 4,283 Filming - 945 622 373 - Recreation - 3,775 3,652 3,548 3,602 Hazardous materials 3,294 2,885 2,342 2,057 1,646 Parking 13,077 9,638 8,738 7,511 6,776
Unassigned: (6,349) (4,690) (4,582) (9,345) (5,960)
Total all other governmental funds $ 269,437 224,778 195,062 175,397 128,281
Source: City Finance Department
Not covered by independent auditor's report
Fiscal Year
(Continued) 186

Schedule 3CITY OF GLENDALEFund Balances of Governmental FundsLast Ten Fiscal Years (in thousands)(accrual basis of accounting)
2014 2013 2012 (1) 2011 (2) 2010
General FundNonspendable: $ 2,584 2,579 558 49,425 71,521 Restricted for:
City Charter - Article XI Sec. 15 general reserve 22,593 22,228 21,156 21,105 20,619
Committed to:Capital projects 7,000 - - -
Assigned to:Economic development - - - 117 -
Unassigned: 36,480 38,082 37,852 63,408 28,331
Total general fund 68,657 62,889 59,566 134,055 120,471
All Other Governmental FundsNonspendable: 2,212 2,275 2,257 14,459 22,311 Restricted for:
Federal and state grants 4,745 4,571 3,395 4,735 4,915 Private endowments - - 1,400 1,759 - Public safety 1,197 1,127 1,295 - 6,101 Youth employment 18 - 52 10,606 - Transportation 17,019 15,569 12,927 53 9,854 Landscaping district 63 48 43 9,419 55 Low and moderate housing 9,820 15,605 18,963 286 13,964 Air quality improvement 276 269 214 792 280 Cable access 1,237 783 379 862 650 Electric public benefit AB1890 1,960 1,308 186 14,435 1,641 State gas tax mandates 7,044 8,539 12,466 22,100 - Landfill post closure 23,850 22,350 22,100 24,071 - Debt service - - - - 49,286 Capital projects - - - 12,856 37,341
Committed to:Debt service 23,841 31,590 34,087 52,330 - Capital projects 1,991 2,213 - - - Impact fee funded projects 5,562 5,830 4,457 2,209 - Public safety 116 116 179 170 - Urban art 2,437 1,893 984 18 -
Assigned to:Capital projects - - 8,020 - -
Unassigned: (10,327) (8,167) (9,520) (7,393) (16,833)
Total all other governmental funds $ 93,061 105,919 113,884 163,767 129,565
Notes:
(1)
(2)
Source: City Finance Department
Not covered by independent auditor's report
In FY2012, only seven months of the Glendale Redevelopment Agency transactions was included in the governmental activities due to ABx1 26 - Redevelopment Agencies Dissolution on February 1, 2012. The transactions for the remainder of the fiscal year were recorded in the Glendale Successor Agency Private Purpose Trust Fiduciary Fund.
Effective FY2011, pursuant to GASB Statement No. 54, this schedule has been modified to establish the following classifications: nonspendable, restricted, committed, assigned and unassigned.
Fiscal Year
187

Schedule 4CITY OF GLENDALEChanges in Fund Balances of Governmental FundsLast Ten Fiscal Years (in thousands)(accrual basis of accounting)
2019 2018 2017 2016 2015Revenues:
Property taxes $ 62,323 58,445 55,217 51,709 50,883 Sales tax 58,692 62,158 41,096 46,651 36,330 Utility users tax 26,655 27,805 28,605 28,662 27,766 Other taxes 22,563 21,784 20,998 20,378 17,305 Revenue from other agencies 79,637 70,304 71,590 61,332 69,677 Licenses and permits 15,029 13,740 14,053 23,263 21,592 Fines and forfeitures 5,562 5,300 5,317 4,299 1,413 Charges for services 43,495 39,962 37,012 35,876 21,741 Use of money and property 26,348 10,166 17,244 11,820 5,970 Interfund revenue 19,448 17,410 13,996 14,950 16,577 Miscellaneous revenue 3,374 4,324 9,235 4,105 6,542
Total revenues 363,126 331,398 314,363 303,045 275,796
Expenditures: Current:
General government 19,905 28,866 29,286 25,767 27,250 Police 87,321 82,573 76,908 73,196 71,599 Fire 61,888 60,176 56,598 53,425 47,901 Public works 25,500 23,544 23,351 28,518 20,038 Transportation 14,760 14,271 13,251 13,341 13,780 Housing, health and community development 57,570 40,979 40,102 39,865 42,464 Employment programs 7,449 5,680 6,254 5,603 5,589 Public service 6,177 5,951 6,720 6,381 5,896 Parks, recreation and community services 16,813 16,643 16,511 14,139 10,451 Library 11,071 11,229 9,660 8,655 8,452 Capital outlay 19,682 16,190 30,208 13,433 16,054 Debt service:
Interest 769 583 374 268 242 Principal 2,197 2,108 2,014 2,981 2,973 Bond issuance costs 357 (1) - - - -
Total expenditures 331,459 308,793 311,237 285,572 272,689
Excess of revenues over (under) expenditures 31,667 22,605 3,126 17,473 3,107
Other financing sources (uses):Transfers in 55,053 35,378 32,302 25,165 43,650 Transfers out (34,881) (14,066) (11,240) (5,641) (8,219) Refunding bonds issued 24,925 (1) - - - -Premium on refunding bonds issued 5,327 (1) - - - -Payment to refunded bond escrow agent (29,895) (1) - - - -
Total other financing sources (uses) 20,529 21,312 21,062 19,524 35,431
Extraordinary gain (loss) - - - 26,490 -
10,667 - - - -
Net change in fund balances $ 62,863 43,917 24,188 63,487 38,538
Debt service as a percentage of noncapital expenditures 1.0% 0.9% 0.9% 1.2% 1.3%
Notes: (1)
Source: City Finance Department
Not covered by independent auditor's report
The variable rate demand certificates of participation (COPs) - 2000 Police building project were refunded on June 25, 2019 with Glendale Municipal Financing Authority 2019 lease revenue refunding bonds.
Fiscal Year
Special Item - transfer of bond proceeds from Successor Agency
(Continued) 188
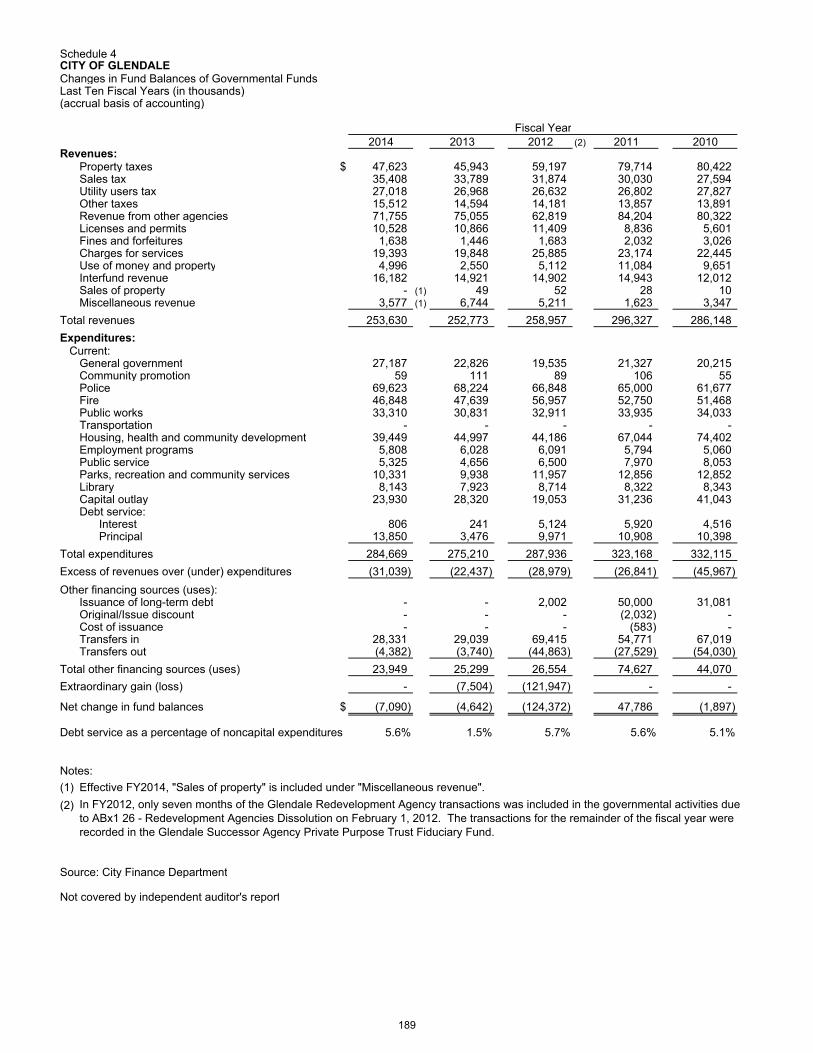
Schedule 4CITY OF GLENDALEChanges in Fund Balances of Governmental FundsLast Ten Fiscal Years (in thousands)(accrual basis of accounting)
2014 2013 2012 (2) 2011 2010Revenues:
Property taxes $ 47,623 45,943 59,197 79,714 80,422 Sales tax 35,408 33,789 31,874 30,030 27,594 Utility users tax 27,018 26,968 26,632 26,802 27,827 Other taxes 15,512 14,594 14,181 13,857 13,891 Revenue from other agencies 71,755 75,055 62,819 84,204 80,322 Licenses and permits 10,528 10,866 11,409 8,836 5,601 Fines and forfeitures 1,638 1,446 1,683 2,032 3,026 Charges for services 19,393 19,848 25,885 23,174 22,445 Use of money and property 4,996 2,550 5,112 11,084 9,651 Interfund revenue 16,182 14,921 14,902 14,943 12,012 Sales of property - (1) 49 52 28 10 Miscellaneous revenue 3,577 (1) 6,744 5,211 1,623 3,347
Total revenues 253,630 252,773 258,957 296,327 286,148
Expenditures: Current:
General government 27,187 22,826 19,535 21,327 20,215 Community promotion 59 111 89 106 55 Police 69,623 68,224 66,848 65,000 61,677 Fire 46,848 47,639 56,957 52,750 51,468 Public works 33,310 30,831 32,911 33,935 34,033 Transportation - - - - - Housing, health and community development 39,449 44,997 44,186 67,044 74,402 Employment programs 5,808 6,028 6,091 5,794 5,060 Public service 5,325 4,656 6,500 7,970 8,053 Parks, recreation and community services 10,331 9,938 11,957 12,856 12,852 Library 8,143 7,923 8,714 8,322 8,343 Capital outlay 23,930 28,320 19,053 31,236 41,043 Debt service:
Interest 806 241 5,124 5,920 4,516 Principal 13,850 3,476 9,971 10,908 10,398
Total expenditures 284,669 275,210 287,936 323,168 332,115
Excess of revenues over (under) expenditures (31,039) (22,437) (28,979) (26,841) (45,967)
Other financing sources (uses):Issuance of long-term debt - - 2,002 50,000 31,081 Original/Issue discount - - - (2,032) -Cost of issuance - - - (583) -Transfers in 28,331 29,039 69,415 54,771 67,019 Transfers out (4,382) (3,740) (44,863) (27,529) (54,030)
Total other financing sources (uses) 23,949 25,299 26,554 74,627 44,070
Extraordinary gain (loss) - (7,504) (121,947) - -
Net change in fund balances $ (7,090) (4,642) (124,372) 47,786 (1,897)
Debt service as a percentage of noncapital expenditures 5.6% 1.5% 5.7% 5.6% 5.1%
Notes:
(1)
(2)
Source: City Finance Department
Not covered by independent auditor's report
Fiscal Year
In FY2012, only seven months of the Glendale Redevelopment Agency transactions was included in the governmental activities due to ABx1 26 - Redevelopment Agencies Dissolution on February 1, 2012. The transactions for the remainder of the fiscal year were recorded in the Glendale Successor Agency Private Purpose Trust Fiduciary Fund.
Effective FY2014, "Sales of property" is included under "Miscellaneous revenue".
189

Schedule 5CITY OF GLENDALEElectric Revenue by Type of CustomersLast Ten Fiscal Years
2019 2018 2017 2016 2015
Electric Fund:Number of customers:
Residential 76,256 75,589 (3) 74,783 74,176 73,678 Commercial 13,092 13,043 12,967 12,938 12,869 Industrial 195 196 211 212 214 Public street and highway lighting 21 21 21 21 21
Total number of customers 89,564 88,849 87,982 87,347 86,782
Megawatt-hour units sold:Residential 371,625 369,703 (3) 372,746 383,783 372,426 Commercial 329,429 337,282 334,185 335,019 337,388 Industrial 316,244 331,859 346,427 362,867 361,719 Public street and highway lighting 9,207 9,205 9,247 9,182 8,543
Total retail megawatt-hour sales 1,026,505 1,048,049 1,062,605 1,090,851 1,080,076
Sales to other utilities 464,482 404,785 (2) 521,782 461,124 (1) 512,846 Wholesale - - - - (1) 173,938
Total megawatt-hour sales 1,490,987 1,452,834 1,584,387 1,551,975 1,766,860
Revenue from energy sales:Residential $ 72,591,228 (4) 74,609,549 (3) 73,139,123 73,924,071 67,754,324 Commercial 63,254,909 (4) 66,961,824 64,986,543 64,213,540 61,746,578 Industrial 54,120,104 (4) 59,813,317 60,766,034 63,310,702 59,626,227 Public street and highway lighting 5,809 6,366 6,401 6,413 3,465 Sales to other utilities 21,775,844 (4) 17,451,139 (2) 19,788,257 16,012,599 (1) 19,041,456 Wholesale - - - - (1) 7,783,689
Total energy sales $ 211,747,894 218,842,195 218,686,358 217,467,325 215,955,739
Notes:
(1)
(2)
(3)
(4)
Source: Glendale Water & Power Department
Not covered by independent auditor's report
Fiscal Year
Reductions in the purchases and sales of MWHs correlates to the decrease in wholesale revenue and sales to other utility revenue and fluctuations in wholesale sales volume and revenue were due to changing market demand and price volatility.
Effective FY2016, wholesale and sales to other utilities have been combined into one account.
In FY2018, there was an increase in customers due to recently completed residential developments. Even though megawatt-hour sales decreased, due to weather, conservation and solar installations, revenue has increased due to a 2% rate increase effective July 1, 2017.
In FY2019, reduction in retail energy sales revenues was due to weather, conservation and solar installations. Reduction of retail revenues were partially offset by increase in sales to other utilities due to higher volume.
(Continued) 190

Schedule 5CITY OF GLENDALEElectric Revenue by Type of CustomersLast Ten Fiscal Years
2014 2013 2012 2011 2010
Electric Fund:Number of customers:
Residential 72,975 72,625 72,220 72,030 71,866 Commercial 12,801 12,769 12,898 12,698 12,690 Industrial 218 217 222 216 226 Street lights 18 18 18 18 18
Total number of customers 86,012 85,629 85,358 84,962 84,800
Megawatt-hour units sold:Residential 352,861 393,136 368,237 357,604 378,460 Commercial 327,660 335,404 319,478 305,908 322,377 Industrial 370,321 389,872 397,144 377,698 392,273 Public street and highway lighting 8,530 9,284 9,335 9,240 9,200
Total retail megawatt-hour sales 1,059,372 1,127,696 1,094,194 1,050,450 1,102,310
Sales to other utilities 351,348 61,407 (1) 493,511 487,753 108,731 Wholesale 331,831 235,847 (1) 404,319 396,933 76,934
Total megawatt-hour sales 1,742,551 1,424,950 1,992,024 1,935,136 1,287,975
Revenue from energy sales:Residential $ 59,905,509 58,412,020 54,282,734 53,557,580 59,515,595 Commercial 55,750,676 51,393,589 49,217,022 47,557,202 52,574,031 Industrial 52,437,492 49,396,516 50,624,670 49,084,732 54,368,173 Public street and highway lighting 6,145 9,553 7,010 4,288 3,022 Sales to other utilities 13,032,317 1,686,183 (1) 23,049,142 17,437,568 6,942,319 Wholesale 15,130,477 12,802,646 (1) 18,826,834 20,159,819 3,500,143
Total energy sales $ 196,262,616 173,700,508 196,007,412 187,801,189 176,903,283
Notes:
(1)
Source: Glendale Water & Power Department
Not covered by independent auditor's report
In FY2013, reductions in the purchases and sales of MWHs correlates to the decrease in wholesale revenue and sales to other utility revenue.
Fiscal Year
191
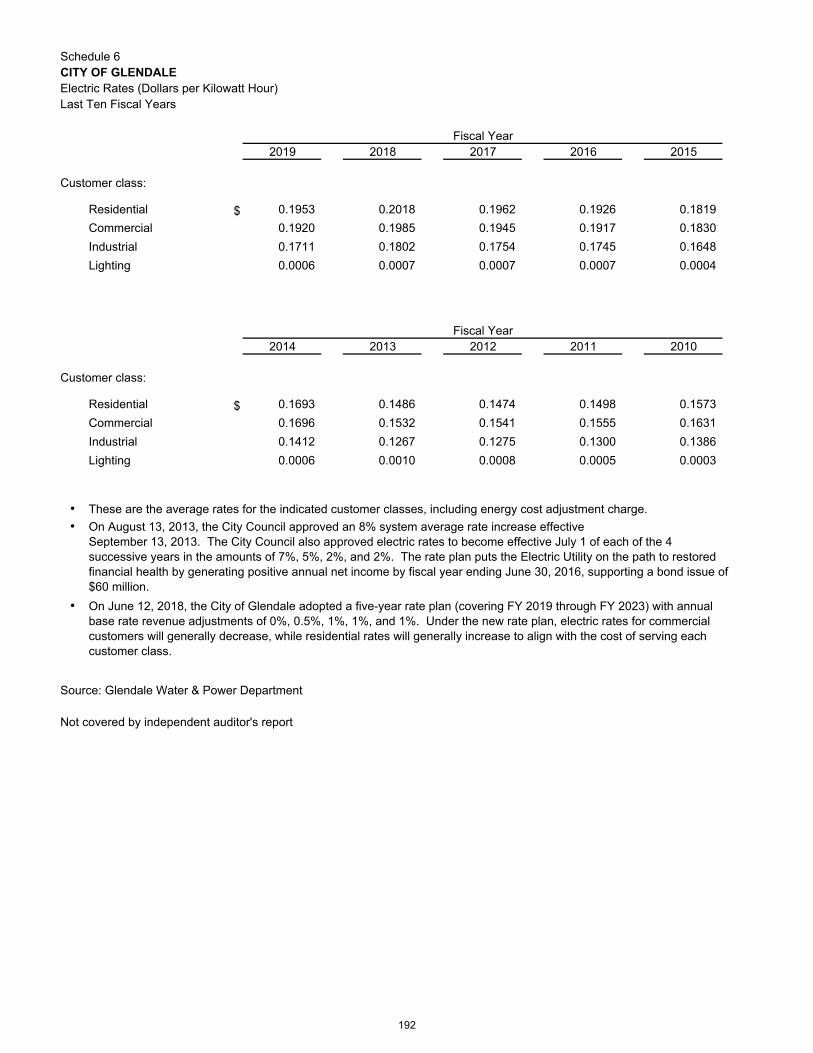
Schedule 6CITY OF GLENDALEElectric Rates (Dollars per Kilowatt Hour)Last Ten Fiscal Years
2019 2018 2017 2016 2015
Customer class:
Residential $ 0.1953 0.2018 0.1962 0.1926 0.1819
Commercial 0.1920 0.1985 0.1945 0.1917 0.1830
Industrial 0.1711 0.1802 0.1754 0.1745 0.1648
Lighting 0.0006 0.0007 0.0007 0.0007 0.0004
2014 2013 2012 2011 2010
Customer class:
Residential $ 0.1693 0.1486 0.1474 0.1498 0.1573
Commercial 0.1696 0.1532 0.1541 0.1555 0.1631
Industrial 0.1412 0.1267 0.1275 0.1300 0.1386
Lighting 0.0006 0.0010 0.0008 0.0005 0.0003
Source: Glendale Water & Power Department
Not covered by independent auditor's report
These are the average rates for the indicated customer classes, including energy cost adjustment charge.
On August 13, 2013, the City Council approved an 8% system average rate increase effective September 13, 2013. The City Council also approved electric rates to become effective July 1 of each of the 4 successive years in the amounts of 7%, 5%, 2%, and 2%. The rate plan puts the Electric Utility on the path to restored financial health by generating positive annual net income by fiscal year ending June 30, 2016, supporting a bond issue of $60 million.
Fiscal Year
Fiscal Year
On June 12, 2018, the City of Glendale adopted a five-year rate plan (covering FY 2019 through FY 2023) with annual base rate revenue adjustments of 0%, 0.5%, 1%, 1%, and 1%. Under the new rate plan, electric rates for commercial customers will generally decrease, while residential rates will generally increase to align with the cost of serving each customer class.
192

Schedule 7CITY OF GLENDALEPrincipal Electric Payer GroupsCurrent Year and Nine Years Ago
Electric Charges Rank
Percentage of Total City Electric Charges
Electric Charges Rank
Percentage of Total City Electric Charges
Entertainment Industry $ 9,149,491 1 4.32% $ 9,788,689 2 5.53%
High-Rise Buildings 8,898,426 2 4.20% 5,217,756 5 2.95%
Retail Stores/Malls 8,169,334 3 3.86% 9,560,001 3 5.40%
Hospitals/Medical Facilities 7,796,289 4 3.68% 10,422,463 1 5.89%
Government Agencies 5,864,529 5 2.77% 7,054,020 4 3.99%
Manufacturing 5,140,569 6 2.43% 2,960,531 8 1.67%
Grocery Stores 2,343,785 7 1.11% 4,103,978 7 2.32%
Schools/Colleges 2,319,178 8 1.10% 4,507,620 6 2.55%
Hotels/Motels 1,570,838 9 0.74% 1,410,819 10 0.80%
Utilities 1,094,583 10 0.52% 2,258,772 9 1.28%
$ 52,347,022 24.72% $ 57,284,649 32.38%
Source: Glendale Water & Power Department
Not covered by independent auditor's report
Fiscal Year 2010Fiscal Year 2019
Individual customer's information is not public record and cannot be released without customer's permission. Therefore, top ten electric payer group is presented instead of top ten customers.
Electric Payer Groups
193

Schedule 8CITY OF GLENDALEAssessed Value and Actual Value of Taxable PropertyLast Ten Fiscal Years (in thousands)
Fiscal YearResidential
Property (1)
Commercial Property (1)
Industrial Property (1)
Other Property (1)
2010 $ 15,588,384 $ 4,649,949 $ 774,196 $ 2,318,317 2011 15,706,014 4,574,190 777,581 2,379,814 2012 16,233,512 4,785,127 761,299 2,047,080 2013 16,484,941 4,914,713 792,069 2,098,219 2014 17,201,465 5,110,372 794,497 2,158,685 2015 18,011,191 5,478,688 793,977 2,303,967 2016 19,174,809 5,654,668 819,354 2,382,344 2017 20,120,531 5,931,797 834,016 2,523,204 2018 21,469,246 6,378,762 956,811 2,578,659 2019 22,854,771 6,489,934 984,484 2,521,480
Fiscal Year
Less: Tax-Exempt
Property (2)
Total Taxable Assessed
ValueTotal Direct Tax Rate (3)(4)
2010 $ 741,047 $ 22,589,799 0.26915 2011 544,780 22,892,818 0.27303 2012 538,972 23,288,046 0.27112 2013 788,151 23,501,791 0.27241 2014 761,935 24,503,084 0.13096 2015 803,077 25,784,746 0.13108 2016 807,012 27,224,163 0.13128 2017 687,939 28,721,609 0.13152 2018 915,228 30,468,250 0.13097 2019 1,015,009 31,835,660 0.13144
Notes:
(1)
(2)
(3)
(4)
Source: HdL Coren & Cone
Not covered by independent auditor's report
"Assessed" values are reflected.
Total Direct Tax Rate is the weighted average of all individual direct rates applied by the government preparing the statistical section information.
In FY2011, as a result of moving all data to a different database/system, HdL's revenue calculations were revised and refined, resulting in changes to prior year total direct rates. Nevertheless, HdL encourages users of its data to leave prior year data unchanged on their schedules.
Both the Homeowners' Exemption and Exempt Use Code categories are reflected.
In 1978 the voters of the State of California passed Proposition 13 which limited taxes to a total maximum rate of 1%, based upon the assessed value of the property being taxed. Each year, the assessed value of property may be increased by an "inflation factor" (limited to a maximum of 2%). With few exceptions, property is only reassessed as a result of new construction activity or at the time it is sold to a new owner. At that point, the property is reassessed based upon the added value of the construction or at the purchase price (market value) or economic value of the property sold. The assessed valuation data shown above represents the only data currently available with respect to the actual market value of taxable property and is subject to the limitations described above.
194

Schedule 9CITY OF GLENDALEDirect and Overlapping Property Tax Rates (Rate Per $100 of Taxable Value)Last Ten Fiscal Years
Fiscal YearCity's Share of 1% Levy Per Prop 13
Redevelopment Rate
Total Direct Tax Rate (1)
2010 0.13573 1.00430 0.269152011 0.13573 1.00370 0.273032012 0.13573 1.00370 0.271122013 0.13573 N/A (2) 0.272412014 0.13573 N/A 0.130962015 0.13573 N/A 0.131082016 0.13573 N/A 0.131282017 0.13573 N/A 0.131522018 0.13573 N/A 0.130972019 0.13573 N/A 0.13238
Fiscal Year Basic LevyGlendale
Community CollegeGlendale Unified School District
La Canada Unified School District
2010 1.00000 0.02366 0.04603 0.070432011 1.00000 0.02344 0.03541 0.073292012 1.00000 0.02452 0.04551 0.070862013 1.00000 0.02466 0.04395 0.069742014 1.00000 0.02341 0.03917 0.067222015 1.00000 0.02220 0.05974 0.064772016 1.00000 0.02123 0.05062 0.061732017 1.00000 0.02119 0.05699 0.061052018 1.00000 0.03489 0.05285 0.059132019 1.00000 0.03245 0.05045 0.05792
Notes:
(1)
(2)
Source: HdL Coren & Cone
Not covered by independent auditor's report
Total Direct Rate is the weighted average of all individual direct rates applied by the government preparing the statistical section information.
Effective FY2013, due to the dissolution of the Glendale Redevelopment Agency (GRA) on February 1, 2012, the redevelopment rate is not applicable going forward.
In 1978, California voters passed Proposition 13 which set the property tax rate at a 1% fixed amount. This 1% is shared by all taxing agencies for which the subject property resides within. In addition to the 1% fixed amount, property owners are charged taxes as a percentage of assessed property values for the payment of any voter approved bonds.
Overlapping rates are those of local and county governments that apply to property owners within the City. Not all overlapping rates apply to all city property owners.
City's Share of 1% Levy is based on the City's share of the general fund tax rate area with the largest net taxable value within the city. ERAF general fund tax shifts may not be included in tax ratio figures.
Redevelopment rate is based on the largest RDA tax rate area (TRA) and includes only rate(s) from indebtedness adopted prior to 1989 per California State statute. RDA direct and overlapping rates are applied only to the incremental property values.
Direct & Overlapping Rates
(Continued) 195

Schedule 9CITY OF GLENDALEDirect and Overlapping Property Tax Rates (Rate Per $100 of Taxable Value)Last Ten Fiscal Years
Fiscal Year
LACC District Debt Service 2008, 2012
Series F LACC District
LAUSD Measure K
2010 Series Ky LAUSD
2010 0.00000 0.02311 0.00000 0.151812011 0.00000 0.04031 0.00000 0.186962012 0.00000 0.03530 0.00000 0.168192013 0.01119 0.03756 0.00001 0.175602014 0.00000 0.04454 N/A 0.146442015 N/A N/A N/A N/A2016 N/A N/A N/A N/A2017 N/A N/A N/A N/A2018 N/A N/A N/A N/A2019 N/A N/A N/A N/A
Fiscal YearMetropolitan Water
District
Pasadena Community College District Debt Service 2002, 2006 Series D
Pasadena Community College
District
Total Direct & Overlapping Tax
Rates
2010 0.00430 0.00000 0.02300 1.342342011 0.00370 0.00000 0.01986 1.382972012 0.00370 0.00000 0.01956 1.367632013 0.00350 0.00225 0.01830 1.386762014 0.00350 N/A 0.01899 1.343272015 0.00350 N/A 0.01032 1.160532016 0.00350 N/A 0.00872 1.145802017 0.00350 N/A 0.00885 1.151582018 0.00350 N/A 0.00819 1.158562019 0.00350 N/A 0.00767 1.15200
Source: HdL Coren & Cone
Not covered by independent auditor's report
Overlapping rates are those of local and county governments that apply to property owners within the City. Not all overlapping rates apply to all city property owners.
City's Share of 1% Levy is based on the City's share of the general fund tax rate area with the largest net taxable value within the city. ERAF general fund tax shifts may not be included in tax ratio figures.
RDA rate is based on the largest RDA tax rate area (TRA) and includes only rate(s) from indebtedness adopted prior to 1989 per California State statute. RDA direct and overlapping rates are applied only to the incremental property values.
Direct & Overlapping Rates
In 1978, California voters passed Proposition 13 which set the property tax rate at a 1% fixed amount. This 1% is shared by all taxing agencies for which the subject property resides within. In addition to the 1% fixed amount, property owners are charged taxes as a percentage of assessed property values for the payment of any voter approved bonds.
Direct & Overlapping Rates
196

Schedule 10CITY OF GLENDALEPrincipal Property Tax PayersCurrent Year and Nine Years Ago (in thousands)
Taxpayer
Taxable Assessed
Value Rank
Percentage of Total City
Taxable Assessed
Value
Taxable Assessed
Value Rank
Percentage of Total City
Taxable Assessed
Value
Walt Disney World Company $ 630,385 1 1.98%
Glendale Mall Associates LLC 603,987 2 1.90%
Americana at Brand LLC 227,974 3 0.72% $ 166,078 5 0.74%
CP IV Glendale LLC 200,120 4 0.63%
La Hana Ow LLC Lessor 195,409 5 0.61%
GPI 500 Brand Limited 185,544 6 0.58%
DWF V 655 North Central LLC 182,580 7 0.57%
Omni 700 Brand LP 170,748 8 0.54%
Camden USA INC 149,012 9 0.47%
BCSP 800 North Brand Property LLC 148,800 10 0.47%
GGP Homart II 446,065 1 1.97%
ABC Inc./Walt Disney World Company 365,561 2 1.62%
Maguire Properties LLC 245,369 3 1.09%
PR Glendale Plaza Office California LLC 223,168 4 0.99%
Wells Reit Glendale California LLC 163,081 6 0.72%
Legacy Partners II Glendale N Brand LLC 146,000 7 0.65%
Metropolitan Life Insurance Company 129,194 8 0.57%
SPUSV5 500 Brand LP 111,000 9 0.49%
Napi Glendale I LLC 101,000 10 0.45%
Total $ 2,694,559 8.46% $ 2,096,516 9.28%
Source: HdL Coren & Cone
Not covered by independent auditor's report
Fiscal Year 2019 Fiscal Year 2010
197

Schedule 11CITY OF GLENDALEProperty Tax Levies and CollectionsLast Ten Fiscal Years (in thousands)
Fiscal Year
Taxes Levied for the Fiscal
Year AmountPercentage
of Levy
Collections in Subsequent
Years (5) AmountPercentage
of Levy
2010 $ 23,814 $ 22,698 95% $ 902 $ 23,600 99%2011 24,737 23,811 96% 620 24,431 99%2012 25,402 24,726 97% 554 25,280 100%2013 24,839 25,612 103% (2) 528 26,140 105%2014 26,846 26,823 100% 197 27,020 101%2015 27,703 27,227 98% 160 27,387 99%2016 29,323 28,789 98% (44) (3) 28,745 98%2017 31,075 30,455 (4) 98% 372 (4) 30,827 99%2018 33,511 32,932 98% 268 33,200 99%2019 34,905 33,902 97% - 33,902 97%
Fiscal Year
Taxes Levied for the Fiscal
Year AmountPercentage
of Levy
Collections in Subsequent
Years (5) AmountPercentage
of Levy
2010 $ 41,442 $ 39,884 96% $ 383 $ 40,267 97%2011 39,048 37,801 97% 265 38,066 97%2012 37,958 16,643 (6) 44% - 16,643 44%2013 - 42,203 (7) - - 42,203 - 2014 - 20,039 (7) - - 20,039 - 2015 - 10,709 (7) - - 10,709 - 2016 - 22,457 (7) - - 22,457 - 2017 - 16,407 (7) - - 16,407 - 2018 - 28,290 (7) - - 28,290 - 2019 - 19,542 (7) - - 19,542 -
Notes:
(1)
(2)
(3)
(4)
(5)
(6)
(7)
Sources:(I)(II) City Finance Department
Not covered by independent auditor's report
The amount collected during this fiscal year exceeded the Levy amount, which was mainly due to property tax (tax increment) collection timing for a few huge parcels in the Central Project Area.
County of Los Angeles Department of Auditor-Controller
Education Revenue Augmentation Fund (ERAF) III payment to State, ERAF in lieu of Vehicle License Fee, SB211 Proposition Share for Central Project, supplemental property tax, and property tax penalty are excluded from property tax collections when compared to property tax levied in this schedule.
The negative collection is due to refunds to property owners for overpayment in prior years, which mainly resulted from lower property values.
Delinquent taxes should be reported by levy year rather than by collection year. [GASB-S44: 21c; 2005 GAAFR, page 307].
This amount only includes Property Tax Increment collections from July 2011 through January 2012 due to ABx1 26 - Redevelopment Agencies Dissolution effective February 1, 2012.
Effective February 1, 2012, the Property Tax receipts from the County of LA to pay the former Redevelopment Agency's obligations are recorded in the Glendale Successor Agency Private Purpose Trust Fiduciary Fund.
Revised since FY2017 CAFR release, due to updated numbers.
CityCollected Within the Fiscal
Year of the Levy Total Collections to Date (1)
Redevelopment Agency/Successor AgencyCollected Within the Fiscal
Year of the Levy Total Collections to Date (1)
198

Schedule 12CITY OF GLENDALERatios of Outstanding Debt by TypeLast Ten Fiscal Years (in thousands)
Fiscal Year
Certificates of
Participation (COPs)
Capital Leases
HUD Section 108 (2002-A)
HUD Section 108 (2011-A)
Loans Payable
Residential Development Loan Program
(RDLP)
2019 GMFA Lease
Revenue Bonds
Total Government
Activities
2010 $ 54,000 8,866 690 - - 4,643 - 68,199 2011 52,400 7,121 470 - - 4,643 - 64,634 2012 50,700 5,302 240 2,000 - 4,643 - 62,885 2013 48,900 3,405 - 1,839 - 4,643 - 58,787 2014 41,195 1,426 - 1,669 - - - 44,290 2015 38,400 757 - 1,491 - - - 40,648 2016 35,605 514 - 1,305 - - - 37,424 2017 33,785 262 - 1,111 - - - 35,158 2018 31,880 - (3) - 908 594 - - 33,382 2019 - (6) - - 696 - (5) - 30,252 (6) 30,948
Fiscal Year
2003Electric
RevenueBond
2006Electric
RevenueBond
2008Electric
RevenueBond
2013Electric
RefundingBond
2013Electric
RevenueBond
2010 $ 26,533 33,515 61,573 - - 2011 25,718 32,481 61,516 - - 2012 24,811 31,371 61,459 - - 2013 - (1) 31,484 61,403 24,276 (1) - 2014 - 30,106 61,342 24,042 64,490 2015 - 28,726 61,284 23,841 63,766 2016 - - (2) 1,880 (2) 23,640 62,565 2017 - - 1,880 22,539 61,307 2018 - - - (4) 21,403 60,020 2019 - - - 20,227 58,688
Fiscal Year
2016Electric
RefundingBond
2008 Water
RevenueBond
2012Water
RevenueBond
Total Business-
type Activities
2010 $ - 51,787 - 173,408 2011 - 51,722 - 171,437 2012 - 51,657 - 169,298 2013 - 50,418 35,617 203,198 2014 - 49,138 35,595 264,713 2015 - 47,829 35,575 261,021 2016 89,303 (2) 46,479 35,554 259,421 2017 87,085 45,089 35,533 253,433 2018 85,127 43,655 35,096 245,301 2019 81,509 42,170 34,639 237,233
Notes:(1)
(2)
(3)
(4) In FY2018, the 2008 Electric Revenue Bond was fully redeemed.
(5)
(6)
Source: City Finance Department
Not covered by independent auditor's report
In FY2013, the 2003 Electric Revenue Bond was refunded by 2013 Electric Refunding Bond.
In FY2016, the 2006 Electric Revenue Bond and the majority of 2008 Electric Revenue Bond were refunded by 2016 Electric Refunding Bond.
In FY2018, the 2009 fire equipment lease from Wells Fargo was paid in full.
In FY2019, the Parking Access and Revenue Control System (PARCS) loan was paid in full.
Business-type Activities
Governmental Activities
Business-type Activities
In FY2019,The COPs were refunded on June 25, 2019 with Glendale Municipal Financing Authority 2019 Lease Revenue Refunding Bonds.
(Continued) 199

Schedule 12CITY OF GLENDALERatios of Outstanding Debt by TypeLast Ten Fiscal Years (in thousands)
Fiscal Year
Government Activities
Business-type
ActivitiesTotal Primary Government
Total Personal Income
Percentage of Personal
Income Population Per Capita
2010 $ 68,199 173,408 241,607 5,572,397 4.34% 208 1.162 2011 64,634 171,437 236,071 5,390,591 4.38% 192 1.227 2012 62,885 169,298 232,183 5,731,457 4.05% 193 1.205 2013 58,787 203,198 261,985 5,782,449 4.53% 194 1.353 2014 44,290 264,713 309,003 5,736,724 5.39% 196 1.577 2015 40,648 261,021 301,669 5,758,750 5.24% 199 1.515 2016 37,424 259,421 296,845 5,726,902 5.18% 202 1.470 2017 35,158 253,433 288,591 5,883,577 4.91% 202 1.430 2018 33,382 245,301 278,683 6,241,717 4.46% 206 1.353 2019 30,948 237,233 268,181 6,584,347 4.07% 206 1.302
For Successor Agency debt by types:
Fiscal Year
2002GRA TaxAllocation
Bond
2003GRA TaxAllocation
Bond
2010GRA TaxAllocation
Bond
2011GRA TaxAllocation
Bond
2013GRA TaxAllocation
Bond
2010 $ 35,355 43,658 26,621 - - 2011 33,008 40,758 26,644 50,000 - 2012 30,583 37,708 26,667 47,967 - 2013 28,078 34,563 26,691 46,528 - 2014 - - 26,563 44,883 49,062 2015 - - 26,312 43,163 43,020 2016 - - - (1) 40,713 37,376 2017 - - - 38,119 31,577 2018 - - - 34,964 25,564 2019 - - - 31,549 19,335
Fiscal Year
2016GRA TaxAllocation
Bond
Low & Mod
LoansPayable
Loans Payable Total
2010 $ - 10,716 - 116,350 2011 - 7,991 - 158,401 2012 - 5,171 - 148,096 2013 - 2,254 - 138,114 2014 - - 13,613 134,121 2015 - - 12,104 124,599 2016 24,742 (1) - 40,133 142,964 2017 24,279 - 27,828 121,803 2018 23,816 - 23,271 107,615 2019 23,354 - 13,554 87,792
Notes:(1)
Source: City Finance Department
Not covered by independent auditor's report
In FY2016, the 2010 GRA Tax Allocation Bond was refunded by 2016 GRA Tax Allocation Bond.
Due to the dissolution of the Glendale Redevelopment Agency (GRA) on February 1, 2012, all of the GRA's debt have been moved to Glendale Successor Agency Private Purpose Trust Fiduciary Fund.
Fiduciary Activities
Fiduciary Activities
200

Schedule 13CITY OF GLENDALEDirect and Overlapping Governmental Activities DebtAs of June 30, 2019 (in thousands)
Gross Bonded Debt
Balance
Percentage Applicable to
Glendale
Amount Applicable to
GlendaleDirect debt:
Section 108 (Series 2011-A) $ 696 100% $ 696 Bonds Payable 24,925 100% 24,925
Total direct debt 25,621
Overlapping debt:Metropolitan Water District 23,317 2.160% 504 Glendale CCD DS 2002 Series C 5,927 89.113% 5,282 Glendale CCD 2002, 2011 Series E 3,535 89.113% 3,150 Glendale CCD DS 2002, 2013 Series F 13,225 89.113% 11,785 Glendale CCD DS 2014 REF Bonds 23,515 89.113% 20,955 Glendale CCD DS 2016 Series A 115,575 89.113% 102,992 Pasadena CCD DS 2002, 2006 Series D 1,840 0.153% 3 Pasadena CCD DS 2002, 2009 Series E (BABS) 25,295 0.153% 39 Pasadena CCD DS 2014 REF Series A 13,900 0.153% 21 Pasadena CCD DS 2016 REF Series A 32,395 0.153% 49 Glendale USD DS 2009 REF Bonds 3,785 89.113% 3,373 Glendale USD DS 2010 REF Bonds 3,650 89.113% 3,253 Glendale USD DS 2010 REF Bonds Series B 13,970 89.113% 12,449 Glendale USD DS 2011 Series A Bonds 21,820 89.113% 19,445 Glendale USD DS 2011 REF Bonds 2,069 89.113% 1,843 Glendale USD DS 2011 Series A1 CREB 4,300 89.113% 3,832 Glendale USD DS 2012 Refund Bonds 61,595 89.113% 54,889 Glendale USD DS 2015 Ref Bonds Series A 101,851 89.113% 90,762 Glendale USD DS 2011 Series C 60,405 89.113% 53,829 Glendale USD DS 2011 Series D 38,000 89.113% 33,863 La Canada USD DS 1995 SD 948 1.798% 17 La Canada USD DS 1999 Series A 1,500 1.798% 27 La Canada USD DS 2004 Series C 75 1.798% 1 La Canada USD DS 2011 Refund Bond 9,695 1.798% 174 La Canada USD DS 2017 Refund Bond 36,465 1.798% 656
Total overlapping debt 423,193
Total direct and overlapping debt $ 448,814
Sources:(I) City Finance Department(II) HdL Coren & Cone
Not covered by independent auditor's report
Overlapping governments are those that coincide, at least in part, with the geographic boundaries of the city. The percentage of overlapping debt applicable is estimated by using taxable assessed values. Applicable percentages were estimated by determining the portion of another governmental unit's taxable assessed value that is within the city's boundaries and dividing it by each unit's total taxable assessed value.
201

Schedule 14CITY OF GLENDALELegal Debt Margin InformationLast Ten Fiscal Years (in thousands)
Legal Debt Margin Calculation for Fiscal Year 2019
Assessed value $ 25,475,913 (1)
Debt limit (15% of assessed value) 3,821,387 (2)
Less debt applicable to limit -
Legal debt margin $ 3,821,387
2019 (1) 2018 (1) 2017 (1) 2016 (1) 2015 (1)
Debt limit $ 3,821,387 3,636,704 3,442,765 3,251,258 3,085,271 Total net debt applicable to limit - - - - -
Legal debt margin $ 3,821,387 3,636,704 3,442,765 3,251,258 3,085,271
Total net debt applicable to the limitas a percentage of debt limit 0.00% 0.00% 0.00% 0.00% 0.00%
2014 (1) 2013 (1) 2012 (1) 2011 2010
Debt limit $ 2,945,332 2,829,443 2,809,769 3,433,923 3,388,470 Total net debt applicable to limit - - - 147,872 107,985
Legal debt margin $ 2,945,332 2,829,443 2,809,769 3,286,051 3,280,485
Total net debt applicable to the limitas a percentage of debt limit 0.00% 0.00% 0.00% 4.31% 3.19%
Notes: (1)
(2)
Sources:(I) City Finance Department(II) HdL Coren & Cone
Not covered by independent auditor's report
Fiscal Year
Fiscal Year
Under City Charter, the total bonded debt of the city shall at no time exceed a total of 15 percent of the assessed valuation of all property taxable for city purposes.
As a result of ABx1 26, the Net Assessed Value calculation does not include the assessed valuations for the former Glendale Redevelopment Agency's project areas (Central District: $3,815,568; San Fernando Corr. District: $2,407,990). Accordingly, the debt associated with the Glendale Redevelopment Agency became obligations of the Successor Agency, which is a separate legal entity. As such, this debt will no longer be included in the Legal Debt Margin calculation.
202
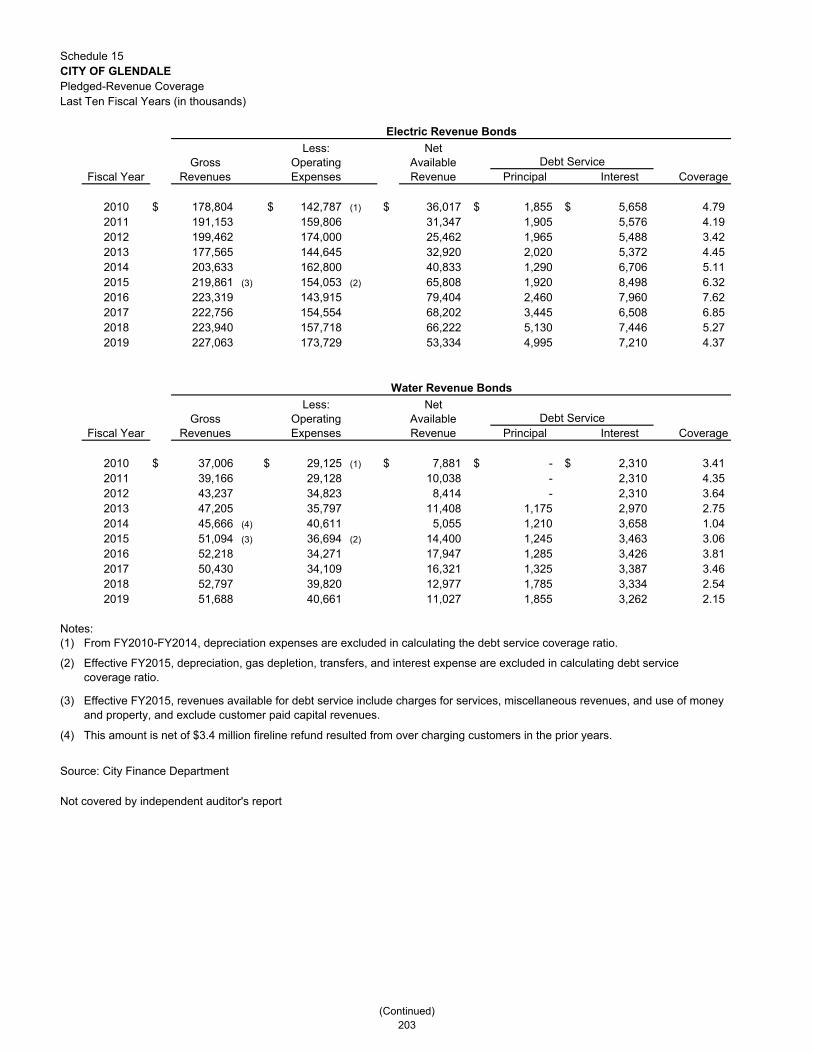
Schedule 15CITY OF GLENDALEPledged-Revenue CoverageLast Ten Fiscal Years (in thousands)
Principal Interest Coverage
2010 $ 178,804 $ 142,787 (1) $ 36,017 $ 1,855 $ 5,658 4.79 2011 191,153 159,806 31,347 1,905 5,576 4.19 2012 199,462 174,000 25,462 1,965 5,488 3.42 2013 177,565 144,645 32,920 2,020 5,372 4.45 2014 203,633 162,800 40,833 1,290 6,706 5.11 2015 219,861 (3) 154,053 (2) 65,808 1,920 8,498 6.32 2016 223,319 143,915 79,404 2,460 7,960 7.62 2017 222,756 154,554 68,202 3,445 6,508 6.85 2018 223,940 157,718 66,222 5,130 7,446 5.27 2019 227,063 173,729 53,334 4,995 7,210 4.37
Principal Interest Coverage
2010 $ 37,006 $ 29,125 (1) $ 7,881 $ - $ 2,310 3.41 2011 39,166 29,128 10,038 - 2,310 4.35 2012 43,237 34,823 8,414 - 2,310 3.64 2013 47,205 35,797 11,408 1,175 2,970 2.75 2014 45,666 (4) 40,611 5,055 1,210 3,658 1.04 2015 51,094 (3) 36,694 (2) 14,400 1,245 3,463 3.06 2016 52,218 34,271 17,947 1,285 3,426 3.81 2017 50,430 34,109 16,321 1,325 3,387 3.46 2018 52,797 39,820 12,977 1,785 3,334 2.54 2019 51,688 40,661 11,027 1,855 3,262 2.15
Notes:(1)
(2)
(3)
(4)
Source: City Finance Department
Not covered by independent auditor's report
This amount is net of $3.4 million fireline refund resulted from over charging customers in the prior years.
From FY2010-FY2014, depreciation expenses are excluded in calculating the debt service coverage ratio.
Effective FY2015, revenues available for debt service include charges for services, miscellaneous revenues, and use of money and property, and exclude customer paid capital revenues.
Effective FY2015, depreciation, gas depletion, transfers, and interest expense are excluded in calculating debt service coverage ratio.
Fiscal Year
Fiscal Year
Electric Revenue Bonds
Water Revenue Bonds
Debt Service
Debt Service
Gross Revenues
Less: Operating Expenses
Net Available Revenue
Gross Revenues
Less: Operating Expenses
Net Available Revenue
(Continued) 203
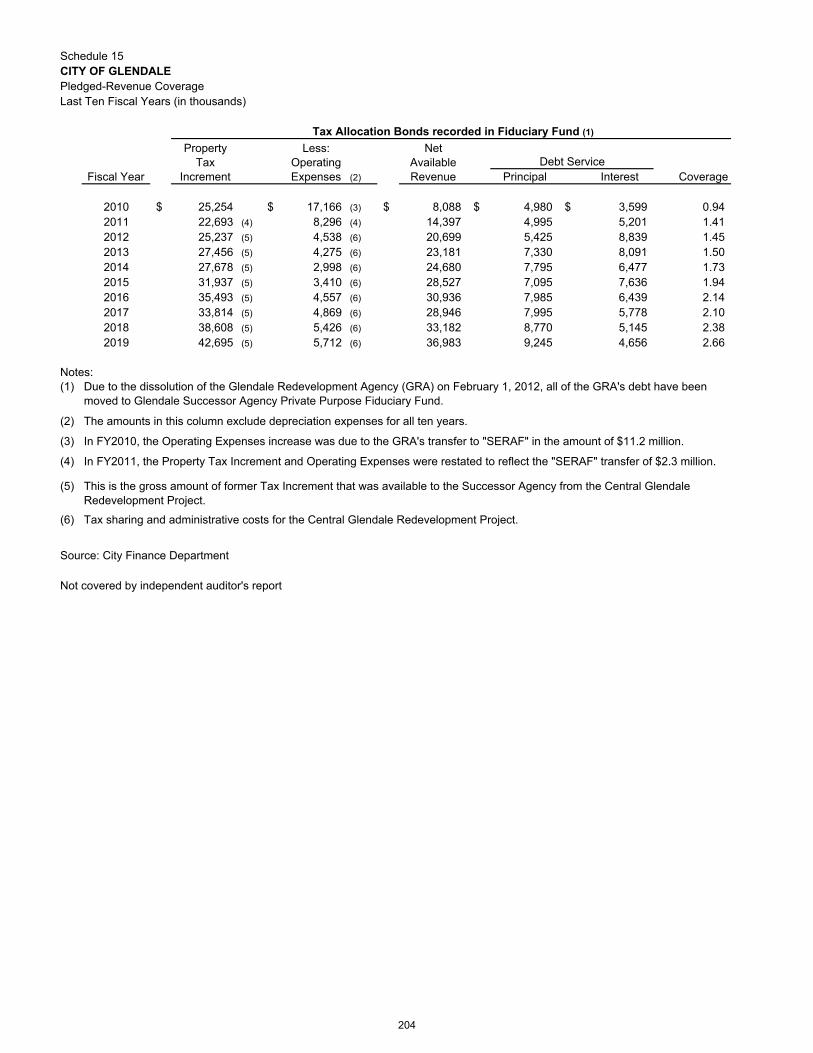
Schedule 15CITY OF GLENDALEPledged-Revenue CoverageLast Ten Fiscal Years (in thousands)
(2) Principal Interest Coverage
2010 $ 25,254 $ 17,166 (3) $ 8,088 $ 4,980 $ 3,599 0.94 2011 22,693 (4) 8,296 (4) 14,397 4,995 5,201 1.41 2012 25,237 (5) 4,538 (6) 20,699 5,425 8,839 1.45 2013 27,456 (5) 4,275 (6) 23,181 7,330 8,091 1.50 2014 27,678 (5) 2,998 (6) 24,680 7,795 6,477 1.73 2015 31,937 (5) 3,410 (6) 28,527 7,095 7,636 1.94 2016 35,493 (5) 4,557 (6) 30,936 7,985 6,439 2.14 2017 33,814 (5) 4,869 (6) 28,946 7,995 5,778 2.10 2018 38,608 (5) 5,426 (6) 33,182 8,770 5,145 2.38 2019 42,695 (5) 5,712 (6) 36,983 9,245 4,656 2.66
Notes:(1)
(2)
(3)
(4)
(5)
(6)
Source: City Finance Department
Not covered by independent auditor's report
This is the gross amount of former Tax Increment that was available to the Successor Agency from the Central Glendale Redevelopment Project.
Tax sharing and administrative costs for the Central Glendale Redevelopment Project.
Due to the dissolution of the Glendale Redevelopment Agency (GRA) on February 1, 2012, all of the GRA's debt have been moved to Glendale Successor Agency Private Purpose Fiduciary Fund.
In FY2010, the Operating Expenses increase was due to the GRA's transfer to "SERAF" in the amount of $11.2 million.
In FY2011, the Property Tax Increment and Operating Expenses were restated to reflect the "SERAF" transfer of $2.3 million.
The amounts in this column exclude depreciation expenses for all ten years.
Tax Allocation Bonds recorded in Fiduciary Fund (1)
Fiscal Year
Property Tax
Increment
Less: Operating Expenses
Net Available Revenue
Debt Service
204

Schedule 16CITY OF GLENDALEDemographic and Economic StatisticsLast Ten Fiscal Years
Fiscal Year Population (I)
Per Capita Personal Income (II)
Total Personal Income Median Age (II)
2010 207,902 $ 26,803 $ 5,572,397,306 39.02011 192,473 28,007 5,390,591,311 40.02012 192,654 29,750 5,731,456,500 40.62013 193,652 29,860 5,782,448,720 41.02014 195,799 29,269 5,730,840,931 41.12015 199,182 28,912 5,758,749,984 40.72016 201,668 28,351 5,717,489,468 41.02017 201,748 29,163 5,883,576,924 41.22018 205,536 30,368 6,241,717,248 41.02019 206,283 31,919 6,584,347,077 41.2
Fiscal Year
Percent High School
Graduate or Higher (II)
Percent Bachelor's
Degree or Higher (II)
School Enrollment (III)
Unemployment Rate (II)
2010 83.2% 36.0% 51,139 10.1%2011 84.4% 37.2% 48,582 11.1%2012 85.2% 38.8% 48,146 10.7%2013 85.1% 39.0% 47,892 8.1%2014 84.6% 38.3% 48,488 6.6%2015 84.4% 38.2% 45,723 8.0%2016 84.2% 37.9% 46,180 6.5%2017 84.4% 37.9% 45,671 5.1%2018 85.1% 39.0% 45,720 4.8%2019 85.9% 39.6% 44,112 4.4%
Sources:
(I)
(II)
(III)
Not covered by independent auditor's report
Population data are based on data obtained from the California State Department of Finance Demographic Research Unit, Population Estimates for California Cities, January 1 of every year (E-1).
Enrollment data are based on Glendale Unified School District and Glendale Community College District school attendance reports.
Data are based on information provided by HdL Coren & Cone on calendar year basis. For example, fiscal year 2019 data is from calendar year 2018.
205

Schedule 17CITY OF GLENDALEPrincipal EmployersCurrent Year and Nine Years Ago
Employees(I)(1) Rank
Percentage of Total City Employment (2) Employees (1) Rank
Percentage of Total City Employment (2)
Glendale Unified School District (4) 2,629 1 2.55% 1,894 3 2.38%
Glendale Adventist Med Center (3) 2,610 2 2.53% 2,023 2 2.54%
City of Glendale 2,051 3 1.96% 2,310 1 2.90%
Dream Works Animation Skg Inc/NBC Universal 1,868 4 1.81%
Glendale Community College (3) 1,619 5 1.57% 1,169 8 1.47%
Glenair Inc 1,600 6 1.55%
Dignity Health - Glendale Memorial Hospital (5) 1,075 7 1.04% 1,500 5 1.88%
USC Verdugo Hills Hospital 850 8 0.82%
Age of Learning 650 9 0.63%
Service Titan 430 10 0.42%
Acco Engineered Systems 1,350 7 1.69%
Nestle Company 1,520 4 1.91%
Disney Consumer & Interactive 1,400 6 1.76%
Compensation Insurance Fund 850 9 1.07%
KABC 800 10 1.00%
Notes:
(1)
(2)
(3)
(4)
(5)
Sources:(I)
Not covered by independent auditor's report
Includes permanent full time employees only.
Includes part time and per diem.
2019 2010
Employer
Both actual full-time and hourly employees are included.
In FY2019, the percentage of total employment is calculated using a baseline of 103,200 workers employed in Glendale, data provided by EDD. In FY2010, the percentage of total employment was calculated using a baseline of 79,722 workers employed in Glendale.
Starting in FY2012, companies that have requested a confidentiality waiver from the state to block the release of employment data are not included.
In FY2019, Glendale Memorial Hospital renamed to Dignity Health Glendale Memorial Hospital.
FY2019 data, with the exception of the City of Glendale, Age of Learning and Service Titan data, is from MuniServices LLC. FY2019 City of Glendale, Age of Learning and Service Titan data is from the City of Glendale.
206
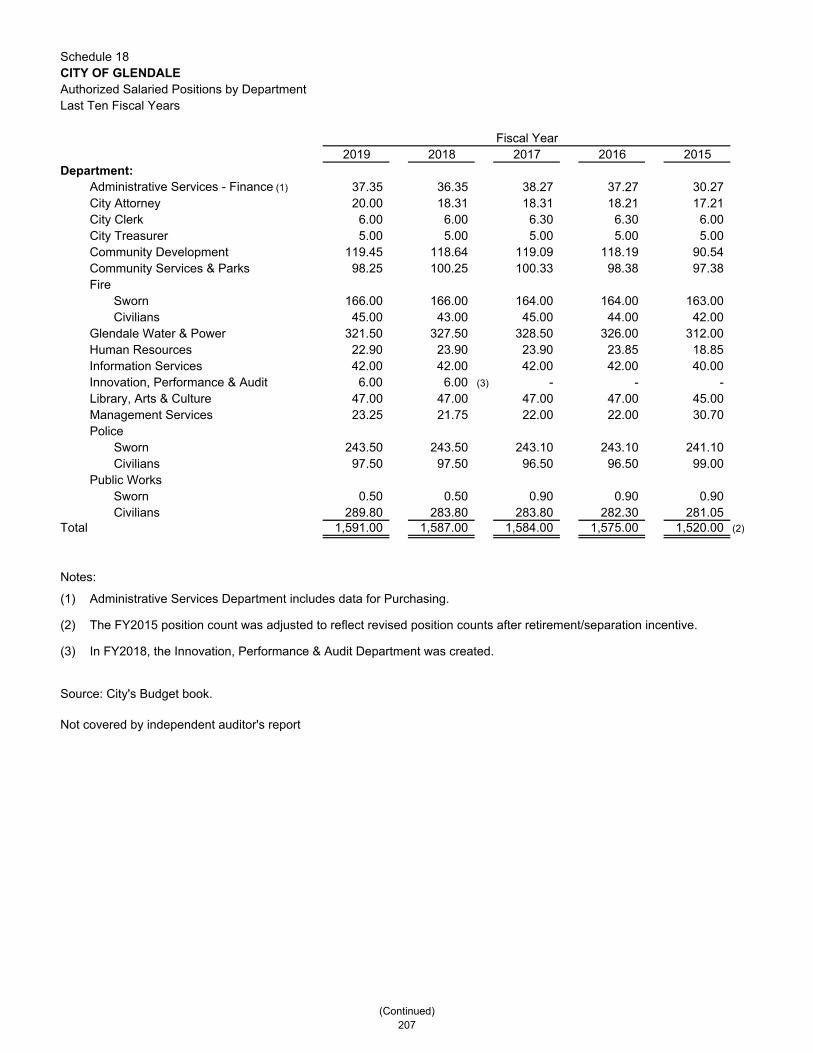
Schedule 18CITY OF GLENDALEAuthorized Salaried Positions by DepartmentLast Ten Fiscal Years
2019 2018 2017 2016 2015Department:
Administrative Services - Finance (1) 37.35 36.35 38.27 37.27 30.27 City Attorney 20.00 18.31 18.31 18.21 17.21 City Clerk 6.00 6.00 6.30 6.30 6.00 City Treasurer 5.00 5.00 5.00 5.00 5.00 Community Development 119.45 118.64 119.09 118.19 90.54 Community Services & Parks 98.25 100.25 100.33 98.38 97.38 Fire Sworn 166.00 166.00 164.00 164.00 163.00 Civilians 45.00 43.00 45.00 44.00 42.00 Glendale Water & Power 321.50 327.50 328.50 326.00 312.00 Human Resources 22.90 23.90 23.90 23.85 18.85 Information Services 42.00 42.00 42.00 42.00 40.00 Innovation, Performance & Audit 6.00 6.00 (3) - - - Library, Arts & Culture 47.00 47.00 47.00 47.00 45.00 Management Services 23.25 21.75 22.00 22.00 30.70 Police Sworn 243.50 243.50 243.10 243.10 241.10 Civilians 97.50 97.50 96.50 96.50 99.00 Public Works Sworn 0.50 0.50 0.90 0.90 0.90 Civilians 289.80 283.80 283.80 282.30 281.05
Total 1,591.00 1,587.00 1,584.00 1,575.00 1,520.00 (2)
Notes:
(1)
(2)
(3)
Source: City's Budget book.
Not covered by independent auditor's report
Fiscal Year
In FY2018, the Innovation, Performance & Audit Department was created.
Administrative Services Department includes data for Purchasing.
The FY2015 position count was adjusted to reflect revised position counts after retirement/separation incentive.
(Continued) 207
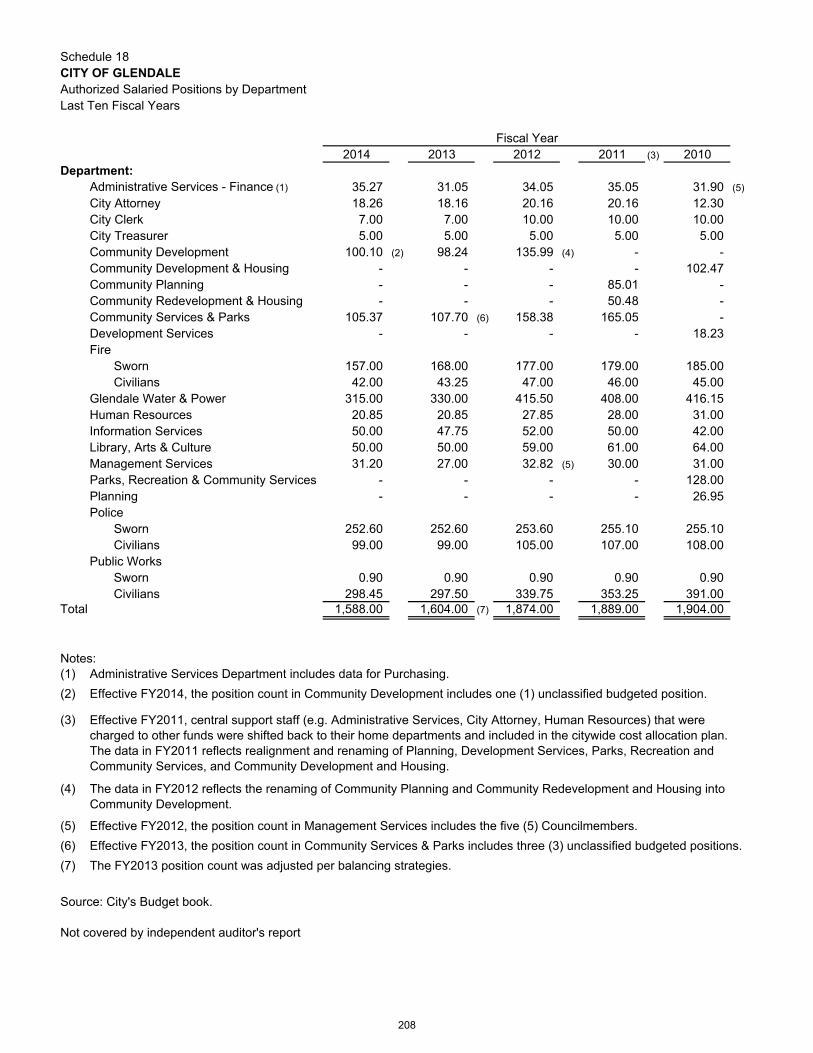
Schedule 18CITY OF GLENDALEAuthorized Salaried Positions by DepartmentLast Ten Fiscal Years
2014 2013 2012 2011 (3) 2010Department:
Administrative Services - Finance (1) 35.27 31.05 34.05 35.05 31.90 (5)
City Attorney 18.26 18.16 20.16 20.16 12.30 City Clerk 7.00 7.00 10.00 10.00 10.00 City Treasurer 5.00 5.00 5.00 5.00 5.00 Community Development 100.10 (2) 98.24 135.99 (4) - - Community Development & Housing - - - - 102.47 Community Planning - - - 85.01 - Community Redevelopment & Housing - - - 50.48 - Community Services & Parks 105.37 107.70 (6) 158.38 165.05 - Development Services - - - - 18.23 Fire Sworn 157.00 168.00 177.00 179.00 185.00 Civilians 42.00 43.25 47.00 46.00 45.00 Glendale Water & Power 315.00 330.00 415.50 408.00 416.15 Human Resources 20.85 20.85 27.85 28.00 31.00 Information Services 50.00 47.75 52.00 50.00 42.00 Library, Arts & Culture 50.00 50.00 59.00 61.00 64.00 Management Services 31.20 27.00 32.82 (5) 30.00 31.00 Parks, Recreation & Community Services - - - - 128.00 Planning - - - - 26.95 Police Sworn 252.60 252.60 253.60 255.10 255.10 Civilians 99.00 99.00 105.00 107.00 108.00 Public Works Sworn 0.90 0.90 0.90 0.90 0.90 Civilians 298.45 297.50 339.75 353.25 391.00
Total 1,588.00 1,604.00 (7) 1,874.00 1,889.00 1,904.00
Notes:(1)
(2)
(3)
(4)
(5)
(6)
(7)
Source: City's Budget book.
Not covered by independent auditor's report
Effective FY2013, the position count in Community Services & Parks includes three (3) unclassified budgeted positions.
The FY2013 position count was adjusted per balancing strategies.
Fiscal Year
Administrative Services Department includes data for Purchasing.
Effective FY2014, the position count in Community Development includes one (1) unclassified budgeted position.
The data in FY2012 reflects the renaming of Community Planning and Community Redevelopment and Housing into Community Development.
Effective FY2012, the position count in Management Services includes the five (5) Councilmembers.
Effective FY2011, central support staff (e.g. Administrative Services, City Attorney, Human Resources) that were charged to other funds were shifted back to their home departments and included in the citywide cost allocation plan. The data in FY2011 reflects realignment and renaming of Planning, Development Services, Parks, Recreation and Community Services, and Community Development and Housing.
208

Schedule 19CITY OF GLENDALEOperations Indicators by Function/ProgramLast Ten Fiscal Years
2019 2018 2017 2016 2015Function/Program
Police:Physical arrests 4,549 4,749 4,751 5,555 5,515 Parking violations 70,320 72,553 (1) 63,644 63,137 69,376 Traffic violations 17,521 17,508 (2) 20,533 (5) 14,776 15,747
Fire:Emergency responses 19,424 19,728 19,420 19,574 18,798 Fires extinguished 223 293 266 239 290
Refuse collection:Refuse collected (tons per day) 221 222 217 201 195 Recyclables collected (tons per day) 21 22 (3) 27 30 30
Inert waste recycling (tons per year) Public Works 1,718 1,814 (4) 2,337 2,663 2,182 Glendale Water and Power 386 (11) 460 478 443 1,281
Other public works:Street resurfacing (miles) (10) 9.74 4.35 (6) 7.51 (6) 5.28 (6) 19.99 (6)
Street reconstructing (miles) (10) - - (6) - (6) - (6) 0.30 (6)
Potholes repaired (square feet per year) 15,739 (9) 8,897 10,227 (7) 9,923 14,553
Wastewater:Average daily sewage treatment (millions of gallons) 13 13 13 13 (8) 15
Notes: (1)
(2)
(3)
(4)
(5)
(6)
(7)
(8)
(9)
(10)
(11)
Sources: Various city departments
Not covered by independent auditor's report
Fiscal Year
In FY2018, increased downtown, special, and scofflaw parking enforcements, in particular enforcements of night time parking around Glendale Community College, have generated more citations.
In FY2018, low staffing combined with reprioritizations to assist school enforcement and to address more citizen complaints have led to a decrease in citations of traffic violations.
In FY2017, law enforcement was provided electronic citation books, which made the process of entering citations in the system more efficient.
Since FY2018, foreign markets made the recyclable processing market more strict by only accepting materials that meet strict grade and cleanliness standards. As a result, more of Glendale’s recyclables have been thrown away causing a decrease in diversion.
Since FY2018, the Public Works Department is taking inert waste to the same location that processes bulky item debris. As a result, Public Works' inert material recycling is more difficult to track separately.
In FY2017, Maintenance Services crews concentrated their efforts on repairing potholes as an effective measure of maintaining the City streets infrastructure and responding to greater community need for well-maintained streets. The "square feet of potholes repaired" is contingent upon various factors, including level of staffing, weather, and other citywide street improvement projects, such as paving, curb, and gutter maintenance.
In FY2019, the reduction in inert waste recycling by Glendale Water and Power can be attributed to smaller water main breaks. Even though the City observed more water main breaks this year, the size, scope and magnitude of failures has decreased.
Revised figures for FY2014 through FY2018 based on updated information.
Since FY2016, the reduction in average daily sewage treatment from previous years was due to water conservation efforts.
In FY2019, above average rainfall has led to a significant increase in potholes. With staffing levels at full capacity, the City was able to fix a significant amount of the potholes.
The City generally focuses on street resurfacing rather than street reconstructing, due to the time consuming and cost prohibitive nature of reconstructing, since it involves building from the ground up. The City has only resorted to reconstructing on rare occasions over the past decade, which showcases the durable quality of the streets of Glendale.
(Continued) 209

Schedule 19CITY OF GLENDALEOperations Indicators by Function/ProgramLast Ten Fiscal Years
2019 2018 2017 2016 2015Function/Program
Electric:Average daily consumption (MWH) 2,812 2,871 2,911 2,980 2,959 Electricity generated (MWH) 667,475 826,830 876,062 914,556 918,314 Electricity purchased (MWH) 942,543 739,880 834,432 768,632 1,131,229 Electricity sold - Retail (MWH) 1,026,505 1,048,049 1,062,605 1,090,851 1,080,077 Electricity sold - Wholesale (MWH) 464,482 404,785 521,782 461,124 686,784 Peak demand (MW) 332 344 293 (6) 332 337
Water:Average daily consumption (millions of gallons) 21 21 21 20 23 Water mains breaks 20 11 3 14 12 Water purchased (AF) 14,184 16,177 14,111 13,992 17,045 Water sold (AF) 23,171 24,074 23,396 22,927 25,175
Transit:Total route miles (1) 760,585 761,251 747,108 746,026 741,287 Passengers 1,411,254 1,504,383 (7) 1,703,360 1,828,547 1,884,454
Parks and recreation:Athletic field permits issued 8,627 8,331 7,755 6,523 3,485 (2)
Community center admissions 52,477 (8) 3,888 (5) 5,294 5,555 5,643 (3)
Library:Volumes in collections 515,101 521,739 520,708 521,247 521,389 Total volumes borrowed 1,554,077 1,067,667 921,163 1,000,355 1,310,873 (4)
Notes: (1)
(2)
(3)
(4)
(5)
(6)
(7)
(8)
Sources: Various city departments
Not covered by independent auditor's report
Fiscal Year
Since FY2018, decreased ridership is due to increased car ownership and usage of alternative transportation methods.
In FY2018, the total number of pass members has decreased. Although there was a decrease in the number of pass members, the overall number of visits by all pass members is only slightly less than last year.
Route miles vary every year depending on the day of the week holiday service operates.
Since March 2015, Community Services and Parks upgraded the permitting and registration system. Permits issued prior to March 2015 may contain multiple field reservations on one permit. Beginning March 2015, individual permits were issued for each field reservation,which resulted in a significant increase in the number of permits issued between FY2015 and FY2019.
In FY2015, the increase in community center admissions may be attributed to a system upgrade that required scanning of activity cards for admission. As a result, all patrons were required to obtain new scannable activity cards. The new system allowed for improved tracking of activity card sales and renewals, in addition to increasing controls over community center admissions.
Estimates were used for unavailable data from May 18, 2015 to June 30, 2015. In FY2015, reshelves, which are books that were removed from the shelf by the patron, and then found elsewhere in the library, were counted in the total volumes borrowed. In prior years, reshelves were not included in the count.
Revised number based on updated information.
In FY2019, the method of counting community center admissions was changed to capture each single visit separately.
(Continued) 210

Schedule 19CITY OF GLENDALEOperations Indicators by Function/ProgramLast Ten Fiscal Years
2014 2013 2012 2011 2010Function/Program
Police:Physical arrests 5,768 5,886 5,829 5,652 5,857 Parking violations 71,958 72,879 74,572 81,843 87,621 Traffic violations 20,076 17,197 18,566 25,667 23,990
Fire:Emergency responses 17,825 17,253 16,591 15,447 15,424 Fires extinguished 393 382 372 349 333
Refuse collection:Refuse collected (tons per day) 188 185 184 (1) 195 197 Recyclables collected (tons per day) 30 29 29 31 32
Inert waste recycling (tons per year) Brand Park landfill - (4) 3,607 3,545 2,500 (2) 3,000 (2)
Public Works 2,923 - - - - Glendale Water and Power 1,829 - - - -
Other public works:Street resurfacing (miles) 8.96 (5) 6.60 (3) 5.85 (3) 5.56 (3) 5.30 (3)
Street reconstructing (miles) - (5) - 0.68 0.70 0.50 Potholes repaired (square feet per year) 10,909 16,592 21,962 21,012 16,449
Wastewater:Average daily sewage treatment (millions of gallons) 15 15 15 20 20
Notes: (1)
(2)
(3)
(4)
(5)
Sources: Various city departments
Not covered by independent auditor's report
In FY2012, the reduction in tonnage of refuse collected was due to a regional economic slowdown and free recycling programs offered to residential and commercial customers.
Revised figures for FY2014 through FY2018 based on updated information.
Effective FY2014, each department contracted out to private haulers to dispose of citywide inert wastes after the official closing of the Brand Park Landfill.
Some departments diverted inert wastes to an outside recycling company instead of using the Brand Park Landfill.
Between FY2010 and FY2013, more street resurfacing was done in an effort to take advantage of the low street resurfacing costs due to the economic downturn.
Fiscal Year
(Continued) 211
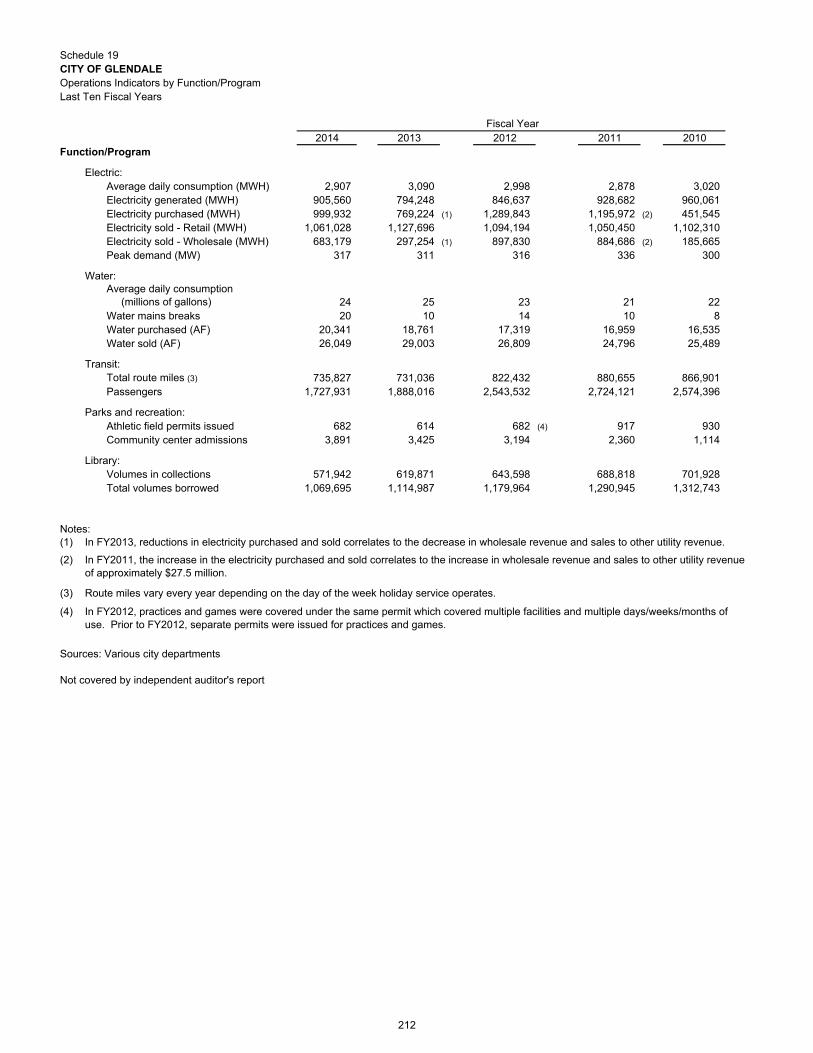
Schedule 19CITY OF GLENDALEOperations Indicators by Function/ProgramLast Ten Fiscal Years
2014 2013 2012 2011 2010Function/Program
Electric:Average daily consumption (MWH) 2,907 3,090 2,998 2,878 3,020 Electricity generated (MWH) 905,560 794,248 846,637 928,682 960,061 Electricity purchased (MWH) 999,932 769,224 (1) 1,289,843 1,195,972 (2) 451,545 Electricity sold - Retail (MWH) 1,061,028 1,127,696 1,094,194 1,050,450 1,102,310 Electricity sold - Wholesale (MWH) 683,179 297,254 (1) 897,830 884,686 (2) 185,665 Peak demand (MW) 317 311 316 336 300
Water:Average daily consumption (millions of gallons) 24 25 23 21 22 Water mains breaks 20 10 14 10 8 Water purchased (AF) 20,341 18,761 17,319 16,959 16,535 Water sold (AF) 26,049 29,003 26,809 24,796 25,489
Transit:Total route miles (3) 735,827 731,036 822,432 880,655 866,901 Passengers 1,727,931 1,888,016 2,543,532 2,724,121 2,574,396
Parks and recreation:Athletic field permits issued 682 614 682 (4) 917 930 Community center admissions 3,891 3,425 3,194 2,360 1,114
Library:Volumes in collections 571,942 619,871 643,598 688,818 701,928 Total volumes borrowed 1,069,695 1,114,987 1,179,964 1,290,945 1,312,743
Notes: (1)
(2)
(3)
(4)
Sources: Various city departments
Not covered by independent auditor's report
In FY2012, practices and games were covered under the same permit which covered multiple facilities and multiple days/weeks/months of use. Prior to FY2012, separate permits were issued for practices and games.
Route miles vary every year depending on the day of the week holiday service operates.
In FY2011, the increase in the electricity purchased and sold correlates to the increase in wholesale revenue and sales to other utility revenue of approximately $27.5 million.
In FY2013, reductions in electricity purchased and sold correlates to the decrease in wholesale revenue and sales to other utility revenue.
Fiscal Year
212

Schedule 20CITY OF GLENDALECapital Asset Statistics by Function/ProgramLast Ten Fiscal Years
2019 2018 2017 2016 2015Function/Program
Police:Stations (1) 3 3 3 3 3 Patrol units 64 64 64 64 63 Helicopters (2) 1.5 1.5 2 2 2 Motorcycles 54 (5) 25 25 25 25
Fire:Stations 9 9 9 9 9
Refuse collection:Collection trucks (3) 58 47 47 47 48
Other public works:Streets (miles) (6) 365 365 365 365 365 Traffic signals 238 235 235 234 234
Parks and recreation:Open space acres 5,034 5,034 5,034 5,034 5,034 Developed parkland acres 286 286 286 (4) 286 286 Parks and other facilities 44 44 44 (4) 43 43 Community centers 4 4 4 4 4 Baseball/softball diamonds 16 16 16 16 16 Soccer/football fields 3 3 3 3 3 Golf course 1 1 1 1 1 Community pool 1 1 1 1 1
Notes:(1)
(2)
(3)
(4)
(5)
(6)
Sources: Various city departments
Not covered by independent auditor's report
Fiscal Year
There is one main facility located at 131 N. Isabel and one substation located in the Glendale Galleria. In FY2015, the Montrose Substation was added.
Since FY2007, three helicopters have been shared with the City of Burbank for the operation of the Joint Law Enforcement Air Support Unit. Effective FY2015, four helicopters have been shared by the City of Glendale and the City of Burbank. In August 2017, the oldest Helicopter not in service belonging to Glendale and Burbank was sold.
This number does not include the small bin trucks or light duty vehicles.
In FY2017, the Central Park project was completed, which increased the park count to 44. However, its acreage is combined with Adult Recreational Center, so the total acreage for Parks and Facilities remained the same.
Revised figures based on updated information.
The increase is due to 21 new purchases and 8 motorcycles on reserve that were not reported in prior years.
(Continued) 213
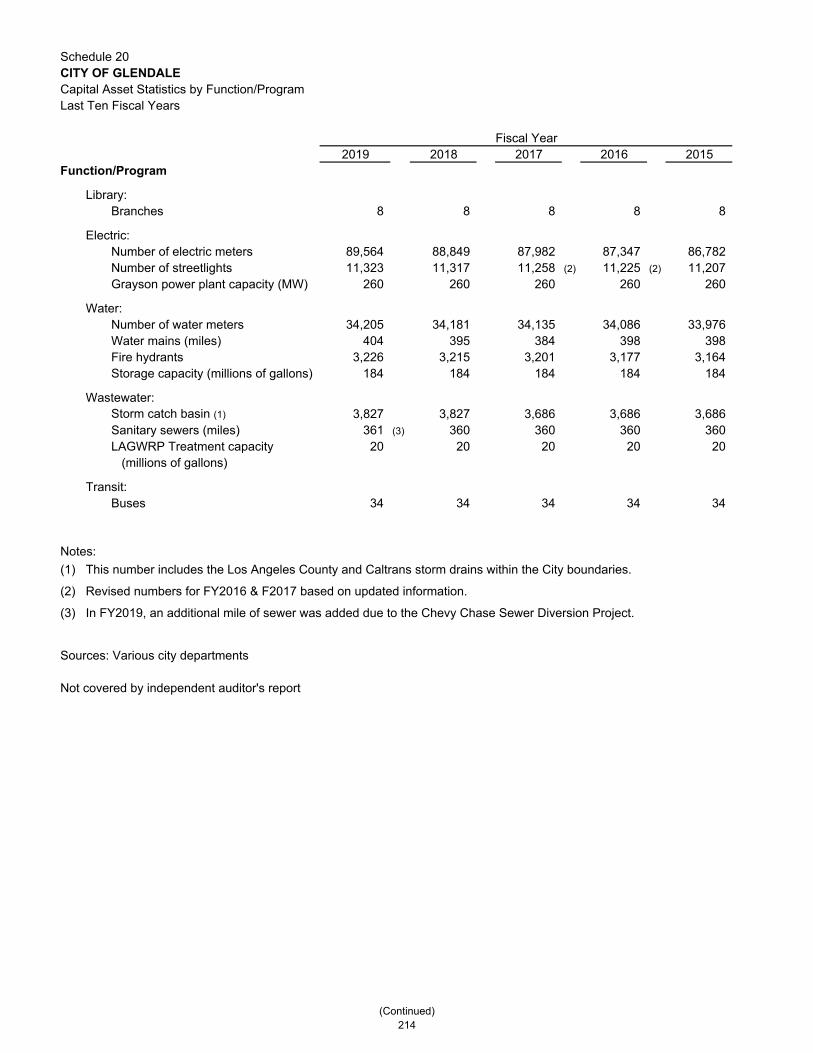
Schedule 20CITY OF GLENDALECapital Asset Statistics by Function/ProgramLast Ten Fiscal Years
2019 2018 2017 2016 2015Function/Program
Library:Branches 8 8 8 8 8
Electric:Number of electric meters 89,564 88,849 87,982 87,347 86,782 Number of streetlights 11,323 11,317 11,258 (2) 11,225 (2) 11,207 Grayson power plant capacity (MW) 260 260 260 260 260
Water:Number of water meters 34,205 34,181 34,135 34,086 33,976 Water mains (miles) 404 395 384 398 398 Fire hydrants 3,226 3,215 3,201 3,177 3,164 Storage capacity (millions of gallons) 184 184 184 184 184
Wastewater:Storm catch basin (1) 3,827 3,827 3,686 3,686 3,686 Sanitary sewers (miles) 361 (3) 360 360 360 360 LAGWRP Treatment capacity 20 20 20 20 20 (millions of gallons)
Transit:Buses 34 34 34 34 34
Notes:
(1)
(2)
(3)
Sources: Various city departments
Not covered by independent auditor's report
Fiscal Year
This number includes the Los Angeles County and Caltrans storm drains within the City boundaries.
Revised numbers for FY2016 & F2017 based on updated information.
In FY2019, an additional mile of sewer was added due to the Chevy Chase Sewer Diversion Project.
(Continued) 214

Schedule 20CITY OF GLENDALECapital Asset Statistics by Function/ProgramLast Ten Fiscal Years
2014 2013 2012 2011 2010Function/Program
Police:Stations (1) 2 2 2 2 2 Patrol units 61 62 74 70 70 Helicopters (2) 1.5 1.5 1.5 1.5 1.5 Motorcycles 24 27 23 25 25
Fire:Stations 9 9 9 9 9
Refuse collection:Collection trucks (3) 49 50 48 50 50
Other public works:Streets (miles) (7) 365 365 365 365 365 Traffic signals 234 234 234 233 233
Parks and recreation:Open space acres 5,034 5,034 5,034 5,034 5,029 Developed parkland acres 286 (5) 286 (4) 282 281 281 Parks and other facilities 43 (5) 42 (4) 41 (6) 39 39 Community centers 4 4 4 (6) 8 8 Baseball/softball diamonds 16 16 16 16 16 Soccer/football fields 3 3 3 3 3 Golf course 1 1 1 1 1 Community pool 1 1 1 1 -
Notes:
(1)
(2)
(3)
(4)
(5)
(6)
(7)
Sources: Various city departments
Not covered by independent auditor's report
Fiscal Year
Revised figures based on updated information.
There is one main facility located at 131 N. Isabel and one substation located in the Glendale Galleria.
Since FY2007, three helicopters have been shared with the City of Burbank for the operation of the Joint Law Enforcement Air Support Unit. Effective FY2015, four helicopters have been shared by the City of Glendale and the City of Burbank. In August 2017, the oldest Helicopter not in service belonging to Glendale and Burbank was sold.
This number does not include the small bin trucks or light duty vehicles.
Beginning FY2012, community buildings are not separately accounted for as community centers. Instead, they are included in the parks and facilities count as part of the park in which they reside.
In FY2013, the Glendale Narrows Riverwalk Park project was completed, which increased the park count to 42, and park acreage by 3.94 acres (285.56 in total acres).
In FY2014, the Maryland Avenue Park project was completed, which increased the park count to 43, and park acreage by 0.48 acres (286.04 in total acres).
(Continued) 215

Schedule 20CITY OF GLENDALECapital Asset Statistics by Function/ProgramLast Ten Fiscal Years
2014 2013 2012 2011 2010
Function/ProgramLibrary:
Branches 8 8 8 8 8 Electric:
Number of electric meters 86,012 85,629 85,358 84,962 84,800 Number of streetlights 11,192 10,740 10,735 10,725 10,714 Grayson power plant capacity (MW) 260 260 260 260 260
Water:Number of water meters 33,900 33,801 33,744 33,374 33,509 Water mains (miles) 397 397 397 397 397 Fire hydrants 3,149 3,146 3,134 3,134 3,133 Storage capacity (millions of gallons) 184 184 184 184 185
Wastewater:Storm catch basin (1) 3,686 3,686 3,686 3,686 3,679 Sanitary sewers (miles) 360 360 360 360 360 LAGWRP Treatment capacity 20 20 20 20 20 (millions of gallons)
Transit:Buses 34 34 34 34 34
Notes:(1)
Sources: Various city departments
Not covered by independent auditor's report
Fiscal Year
This number includes the Los Angeles County and Caltrans storm drains within the City boundaries.
216

Comprehensive Annual Financial ReportFiscal Year Ended June 30, 2019
www.Glendaleca.gov
@MyGlendale #MyGlendale
Related Documents