CITY OF GLENDALE MAY 10, 2011 CHRIS FISHER PIERCE ROSSUM GREGG TOBLER Comprehensive User Fee Study

Welcome message from author
This document is posted to help you gain knowledge. Please leave a comment to let me know what you think about it! Share it to your friends and learn new things together.
Transcript

C I T Y O F G L E N D A L EM AY 1 0 , 2 0 1 1
C H R I S F I S H E RP I E R C E R O S S U MG R E G G T O B L E R
Comprehensive User Fee Study

2
Overview
Project Team IntroductionStudy ObjectivesScope of the StudyProject Approach and MethodologyFindings and ResultsQuestions & Answers

3
Project Team
Chris Fisher – Consulting Services Group Manager Leading expert in cost of service studies Understands regulatory, political and implementation issues
Pierce Rossum – Project Manager Acted as City’s day-to-day contact Cost of service expert Familiar with City (Water Nexus and Rate Redesign)
Gregg Tobler – Senior Project Analyst Lead data collection and analysis efforts Also working on the Water Rate Redesign

4
Study Objectives
Identify the true cost of providing user fee servicesDetermine fee subsidies and overall revenue impactsIdentify new fees and cost recovery strategiesFairly and appropriately distribute indirect and
overhead costsDevelop a strong, defensible, fee schedule

5
Full review and calculation of the user fees charged by:
City Clerk’s Office Community Services Community Development
Building & Safety Neighborhood Services Planning Division
Fire Department Hazardous Materials Library Police Department Public Works Parking Fund
Scope of the Study

6
Project Approach and Methodology
Data Analysis
Time Estimates
Non-Labor Costs
Labor
Overhead Costs
Building Cost Layers
Direct Services
Indirect Services
Department Overhead
City-Wide Overhead
Set Fees
Define the Full Cost of Services
Set Cost Recovery Policy

7
Two Methodologies
Case Study Method: This approach estimates the
actual labor and material costs associated with providing a unit of service to a single user.
This analysis is suitable when City staff time requirements vary dramatically for a service, or for special projects where the time and cost requirements are not easy to identify at the project’s outset.
Programmatic Approach: This methodology utilizes a
cost/revenue analysis approach that establishes the cost recovery performance of the department at various sub-levels Calculate the full cost of each
program, using staff allocation estimates and full costs
Compare the annual revenues to the full costs to establish the percent of cost recovery for each program.
Identified program-wide potential fee changes that the department can use to address the cost recovery goals of the department.

8
Police Department – Time Survey Sample
PositionPD - Offi ce Services
Specialist IIPD - Crime Analyst
PD - Community Service Offi cer
PD - Police Offi cer
Fully Burdened Hourly Rate 45.22 61.58 58.53 137.79
Service TitleFull Cost Recovery Fee Current Fee
Communications Recorded Reproduction 20 15 54 15.00 Data Analysis Services 60 62 53.00
False Alarm-Alarm Response Permit 1st 50 53 158 No chargeFalse Alarm-Alarm Response Permit 2nd 50 53 158 No chargeFalse Alarm-Alarm Response Permit 3rd 50 53 158 100.00 False Alarm-Alarm Response Permit 4th 50 53 158 150.00
False Alarm-Alarm Response Permit 5th and subsequent 50 53 158 200.00 False Alarm-Alarm Response No Permit 1st 50 53 158 150.00
False Alarm-Alarm Response No Permit 2nd 50 53 158 175.00 False Alarm-Alarm Response No Permit 3rd 50 53 158 200.00 False Alarm-Alarm Response No Permit 4th 50 53 158 225.00
False Alarm-Alarm Response No Permit 5th and subsequent 50 53 158 250.00 Removed - Fingerprints - 15.00
Local Criminal History Letter 35 34 25.00
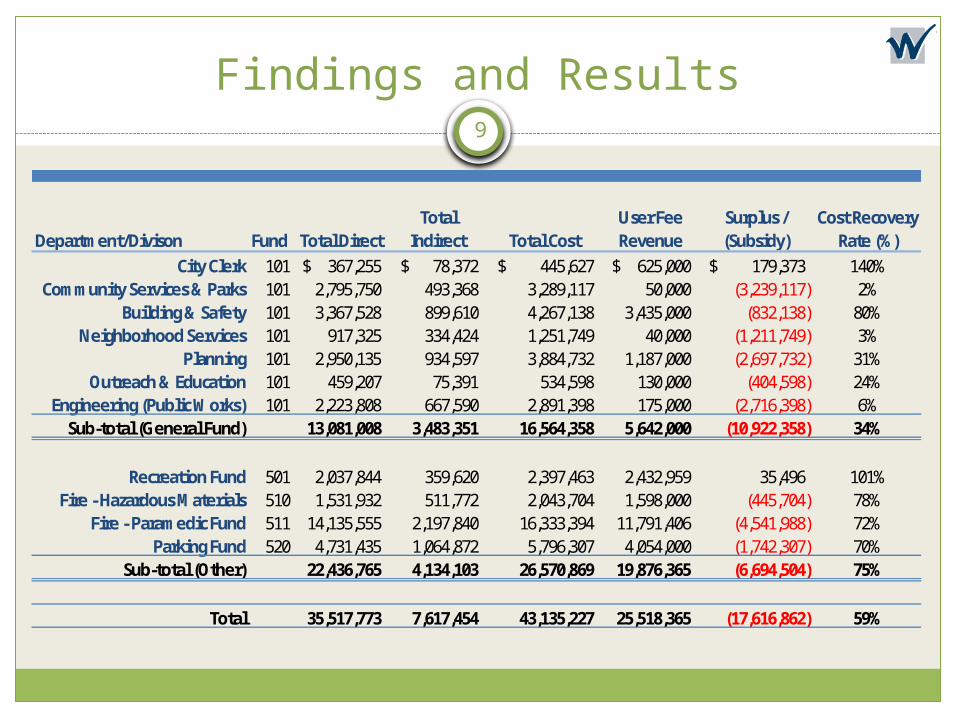
9
Findings and Results
Department/Divison Fund Total DirectTotal
Indirect Total CostUser Fee Revenue
Surplus / (Subsidy)
Cost Recovery Rate (%)
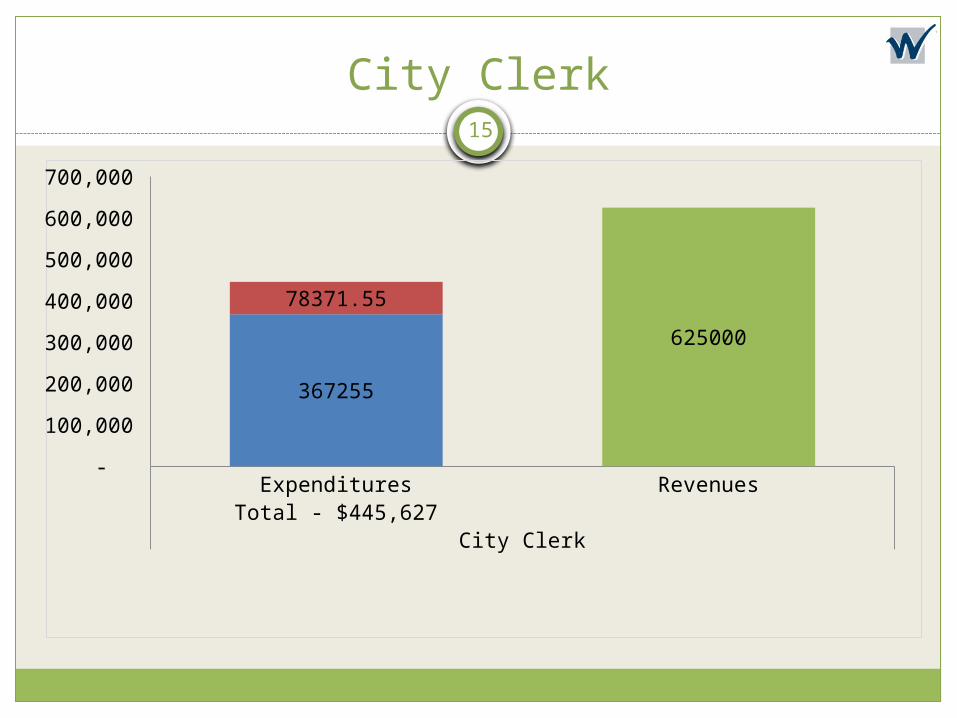
City Clerk 101 367,255$ 78,372$ 445,627$ 625,000$ 179,373$ 140%Community Services & Parks 101 2,795,750 493,368 3,289,117 50,000 (3,239,117) 2%
Building & Safety 101 3,367,528 899,610 4,267,138 3,435,000 (832,138) 80%Neighborhood Services 101 917,325 334,424 1,251,749 40,000 (1,211,749) 3%
Planning 101 2,950,135 934,597 3,884,732 1,187,000 (2,697,732) 31%Outreach & Education 101 459,207 75,391 534,598 130,000 (404,598) 24%
Engineering (Public Works) 101 2,223,808 667,590 2,891,398 175,000 (2,716,398) 6%Sub-total (General Fund) 13,081,008 3,483,351 16,564,358 5,642,000 (10,922,358) 34%
Recreation Fund 501 2,037,844 359,620 2,397,463 2,432,959 35,496 101%Fire - Hazardous Materials 510 1,531,932 511,772 2,043,704 1,598,000 (445,704) 78%
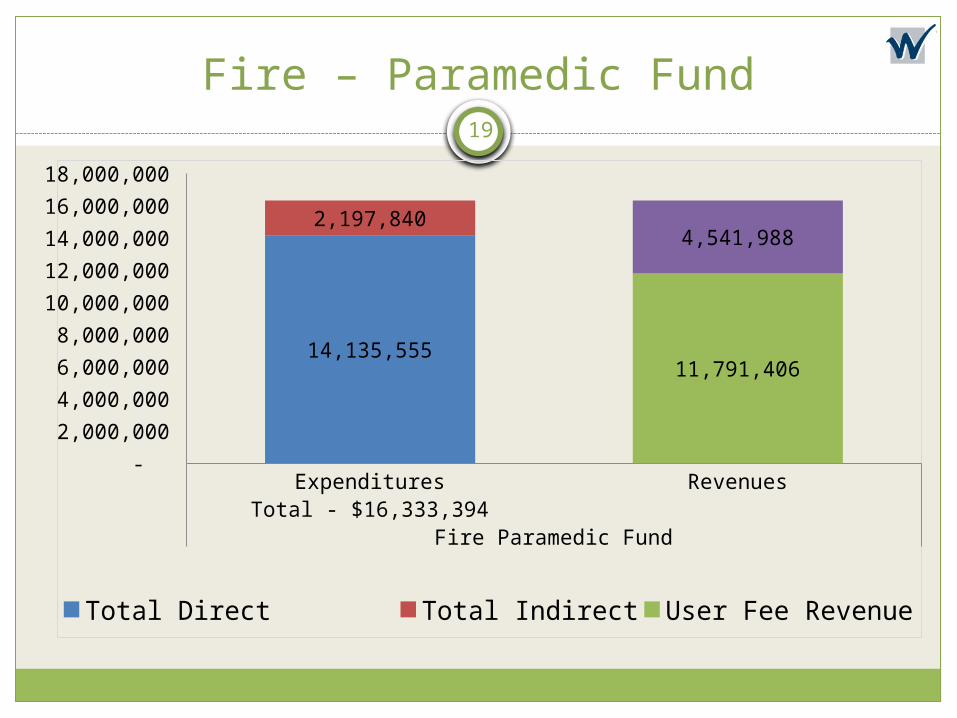
Fire - Paramedic Fund 511 14,135,555 2,197,840 16,333,394 11,791,406 (4,541,988) 72%Parking Fund 520 4,731,435 1,064,872 5,796,307 4,054,000 (1,742,307) 70%
Sub-total (Other) 22,436,765 4,134,103 26,570,869 19,876,365 (6,694,504) 75%
Total 35,517,773 7,617,454 43,135,227 25,518,365 (17,616,862) 59%

10
Community Development - Planning
ExpendituresTotal - $3,884,732
Revenues
Planning
-
500,000
1,000,000
1,500,000
2,000,000
2,500,000
3,000,000
3,500,000
4,000,000
4,500,000
2950135.14242933
934596.6
1187000
2697731.74242933
Total Direct Total Indirect User Fee Revenue General Fund Subsidy

11
Technology Surcharge
Long-Range Planning Surcharge
Purpose: Direct cost recovery of ISD related expenditures
Current surcharge: 6.7% Recommended full cost recovery
rate of 17.5% fee surcharge Impact: $520,000 of additional
cost recovery
Purpose: Cost recovery of Long-Range Planning services
No existing fee Targeted cost recovery of 10%
equals 3% fee surcharge Impact: $145,000 of new cost
recovery
New & Revised Surcharges

12
Community Development – Building & Safety
ExpendituresTotal - $4,267,138
Revenues
Building & Safety
-
500,000
1,000,000
1,500,000
2,000,000
2,500,000
3,000,000
3,500,000
4,000,000
4,500,000
3367528
899610.2
3435000
832138.2
Total Direct Total Indirect User Fee Revenue General Fund Subsidy

13
Neighborhood Services
ExpendituresTotal - $1,251,749
Revenues
Neighborhood Services
-
200,000
400,000
600,000
800,000
1,000,000
1,200,000
1,400,000
917325
334423.75
40000
1211748.75
Total Direct Total Indirect User Fee Revenue General Fund Subsidy

14
RENTAL HOUSING INSPECTION PROGRAM
MANDATORY POINT OF SALE INSPECTION
The State of California requires local cities to ensure that housing units meet minimum standards of habitability.
The City of Glendale has operated and subsidized the code enforcement program for many years.
The proposed $28 fee would be charged on the property tax bill, annually. Neighborhood services may recover up to an estimated $1.2 million annually.
The Division finds that such a program is needed so that residential and commercial properties are adequately inspected before ownership of such property is transferred.
The cost analysis, calculated the full cost to provide such a service at $400 per inspection.
Neighborhood Services – New Fees
15
City Clerk
ExpendituresTotal - $445,627
Revenues
City Clerk
-
100,000
200,000
300,000
400,000
500,000
600,000
700,000
367255
78371.55
625000
Total Direct Total Indirect User Fee Revenue General Fund Subsidy

16
Public Works - Engineering
ExpendituresTotal - $2,891,398
Revenues
Public Works - Engineering
-
500,000
1,000,000
1,500,000
2,000,000
2,500,000
3,000,000
3,500,000
2223807.89757067
667589.789757066
175000
2716397.68732773
Total Direct Total Indirect User Fee Revenue General Fund Subsidy

17
Community Services – General Fund
ExpendituresTotal - $3,289,117
Revenues
Community Services
-
500,000
1,000,000
1,500,000
2,000,000
2,500,000
3,000,000
3,500,000
2795749.7645
493367.6055
50000
3239117.37
Total Direct Total Indirect User Fee Revenue General Fund Subsidy

18
Community Services – Recreation Fund
ExpendituresTotal - $2,397,463
Revenues
Recreation Fund
1,800,000
1,900,000
2,000,000
2,100,000
2,200,000
2,300,000
2,400,000
2,500,000
2037843.907
359619.513
2432959
Total Direct Total Indirect User Fee Revenue General Fund Subsidy
19
Fire – Paramedic Fund
ExpendituresTotal - $16,333,394
Revenues
Fire Paramedic Fund
-
2,000,000
4,000,000
6,000,000
8,000,000
10,000,000
12,000,000
14,000,000
16,000,000
18,000,000
14,135,555
2,197,840
11,791,406
4,541,988
Total Direct Total Indirect User Fee Revenue General Fund Subsidy

20
Fire – Hazardous Materials
ExpendituresTotal - $2,043,704
Revenues
Hazardous Materials
-
500,000
1,000,000
1,500,000
2,000,000
2,500,000
1531932
511771.84
1598000
445703.84
Total Direct Total Indirect User Fee Revenue General Fund Subsidy

21
Public Works - Parking Fund
ExpendituresTotal - $5,796,307
Revenues
Parking Fund
-
1,000,000
2,000,000
3,000,000
4,000,000
5,000,000
6,000,000
7,000,000
4731435
1064872.2
4054000
1742307.2
Total Direct Total Indirect User Fee Revenue General Fund Subsidy

22
General Fund Contribution
Department/Divison Fund Total DirectTotal
Indirect Total CostUser Fee Revenue
General Fund Contribution /
SubsidyCost Recovery
Rate (%)Library 101 4,441,961 1,199,329 5,641,290 125,000 5,516,290 2%
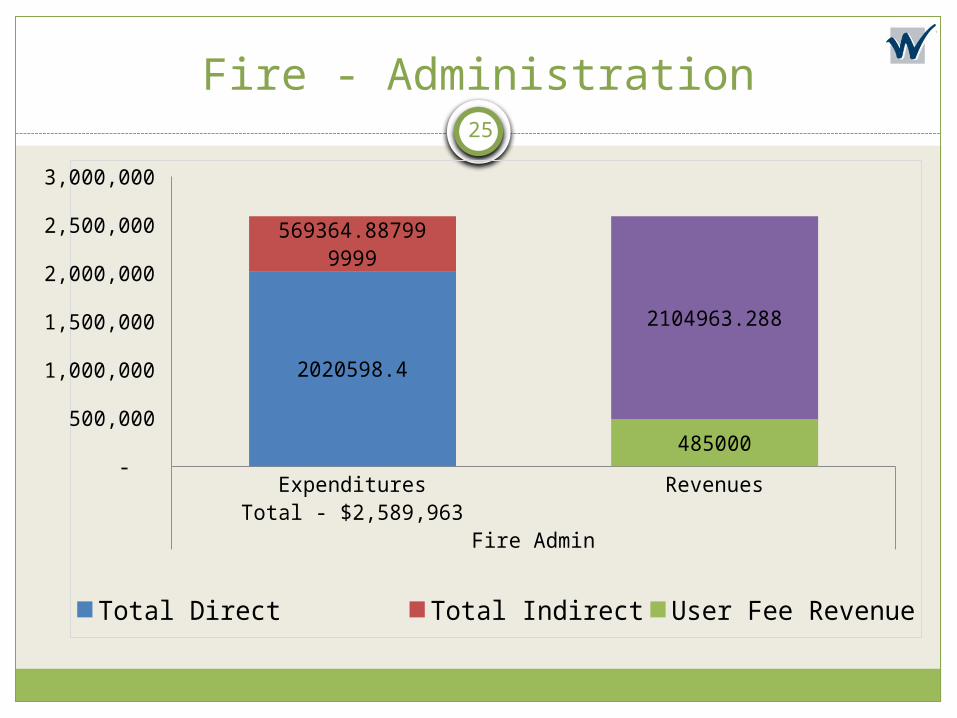
Police - Admin 101 6,939,448 6,286,958 13,226,406 1,010,000 12,216,406 8%Fire - Admin 101 2,020,598 569,365 2,589,963 485,000 2,104,963 19%
General Benefit Functions 13,402,007 8,055,653 21,457,660 1,620,000 19,837,660 8%

23
Library
ExpendituresTotal - $5,641,290
Revenues
Library
-
1,000,000
2,000,000
3,000,000
4,000,000
5,000,000
6,000,000
4441961
1199329.47
125000
5516290.47
Total Direct Total Indirect User Fee Revenue General Fund Subsidy

24
Police - Administration
ExpendituresTotal - $13,226,406
Revenues
Police Admin
-
2,000,000
4,000,000
6,000,000
8,000,000
10,000,000
12,000,000
14,000,000
6939448
6286958.44
1010000
12216406.44
Total Direct Total Indirect User Fee Revenue General Fund Subsidy
25
Fire - Administration
ExpendituresTotal - $2,589,963
Revenues
Fire Admin
-
500,000
1,000,000
1,500,000
2,000,000
2,500,000
3,000,000
2020598.4
569364.888
485000
2104963.288
Total Direct Total Indirect User Fee Revenue General Fund Subsidy

26
Fee Setting Considerations
SubsidizationConsistency with Existing Policy and ObjectivesImpact on Demand (elasticity)Social Impact / AffordabilityLegal Compliance

27
Fee Comparisons Issues
Fees may be based upon historical or other subjective
factors unrelated to cost
Often no way to know whether cost
subsidies exist
Services included in fees may be
combined in some and separated in
others
The methodology used to determine the fees may be designed to recover less than
full cost
Different policy goals and considerations
that affect the desired level of cost recovery

28
Macro Level Fee Benchmarking Analysis (in relation to the City of Glendale)
Burbank’s
fees are Long Beach’s
fees are Pasadena’s
fees are
Santa Monica’s fees are
Torrance’s fees are
City Clerk Higher Higher Higher Higher Higher
Community Planning Inline Inline Higher Higher Inline
Film Permits Higher Lower Higher Higher Higher
Finance Higher Higher Lower Inline Inline
Fire Lower Lower Lower Lower Higher
Library Higher Higher Higher Higher Inline
Parks Higher Higher Higher Higher Lower
Police Lower Higher Lower Higher Lower
Public Works Lower Higher Lower Lower Lower
Reproductions Higher Higher Higher Higher Higher

29
Community Services Fee Benchmarking
Garden
a
Pasad
ena
Long Bea
ch
Santa
Monica
Redondo B
each
Burban
k
Anaheim
Glendale
Carso
n
Culver
City
Torra
nce
Huntingto
n Bea
ch$0.00
$20.00 $40.00 $60.00 $80.00
Adult Basketball Leagues
Garden
a
Santa
Monica
Huntingto
n Bea
ch
Long Bea
ch
Torra
nce
Carso
n
Burban
k
Pasad
ena
Redondo B
each
Glendale
Man
hattan
Bea
ch
Culver
City
Anaheim
$0.00 $10.00 $20.00 $30.00 $40.00
Adult Swim Lessons
Carso
n
Culver
City
Garden
a
Glendale
Redondo B
each
Torra
nce
Burban
k
Anaheim
Santa
Monica
Man
hattan
Bea
ch$0.00 $2.00 $4.00 $6.00 $8.00
Fun Camp
Torra
nce
Burban
k
Huntingto
n Bea
ch
Long Bea
ch
Glendale
Anaheim
Santa
Monica
Culver
City$0.00 $5.00
$10.00 $15.00 $20.00 $25.00
Introduction to Mixed Media

30
RecommendationsFor all private benefit services, Willdan recommends pursuing a full-cost recovery strategy.
For public benefit services, it is recommended the City develop a formal policy on desired subsidy levels.
100%
0%100%
PrivateBenefit
SomePublic
Benefit
SomePrivateBenefit
100%Public
Benefit
Sources of Service Funding
User Fees
General Fund
(Subsidy)General
Fund(Subsidy) General
Fund(Subsidy)
User Fees
User Fees

31
Next Steps
Discussion and determination of cost recovery goalsCity Staff to develop “Recommended” Fees for the
Council’s Consideration (based on determined goals)July Implementation of Recommended Fees

T H A N K YO U
Questions?
Related Documents