Circle Graphs (a.k.a. Pie Charts) Goal: I am learning to construct & interpret circle graphs.

Circle Graphs (a.k.a. Pie Charts) Goal: I am learning to construct & interpret circle graphs.
Dec 13, 2015
Welcome message from author
This document is posted to help you gain knowledge. Please leave a comment to let me know what you think about it! Share it to your friends and learn new things together.
Transcript
Circle Graphs(a.k.a. Pie Charts)
Goal: I am learning to construct & interpret circle graphs.

Definition: Circle Graph
Def: Circle Graph: a type of graph used to compare parts of a whole. The entire graph represents the whole.

Ex1: The table shows when tornadoes occurred in the US from 1999 to 2001. Make a pie chart using this info.
Tornadoes in US, 1999-2001
January - March 15%
April - June 53%
July - September 21%
October - December
11%
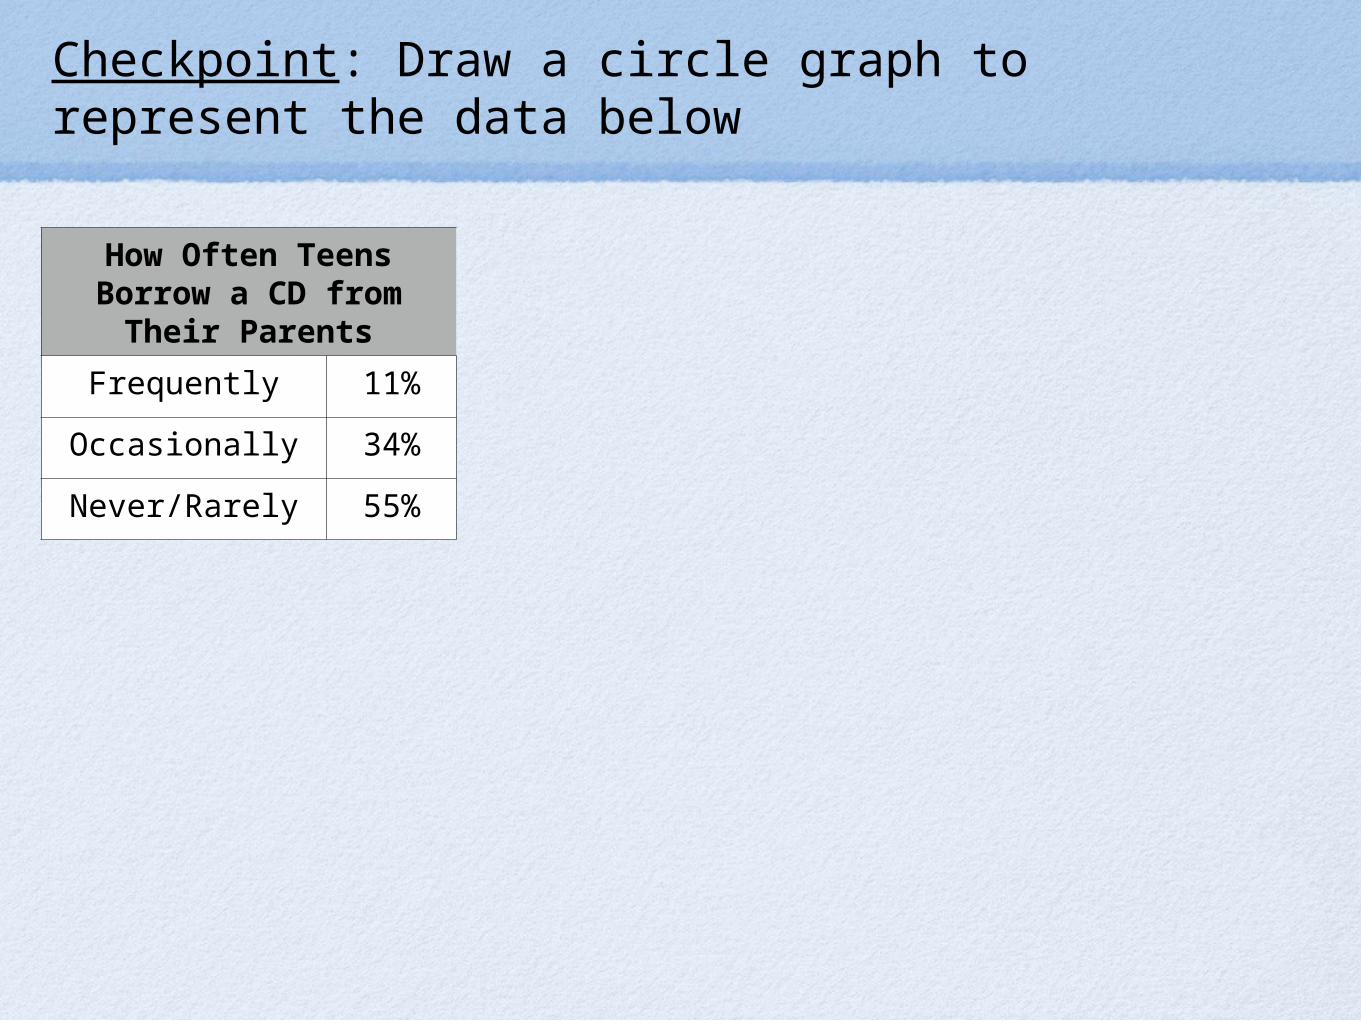
Checkpoint: Draw a circle graph to represent the data below
How Often Teens Borrow a CD from Their Parents
Frequently 11%
Occasionally 34%
Never/Rarely 55%
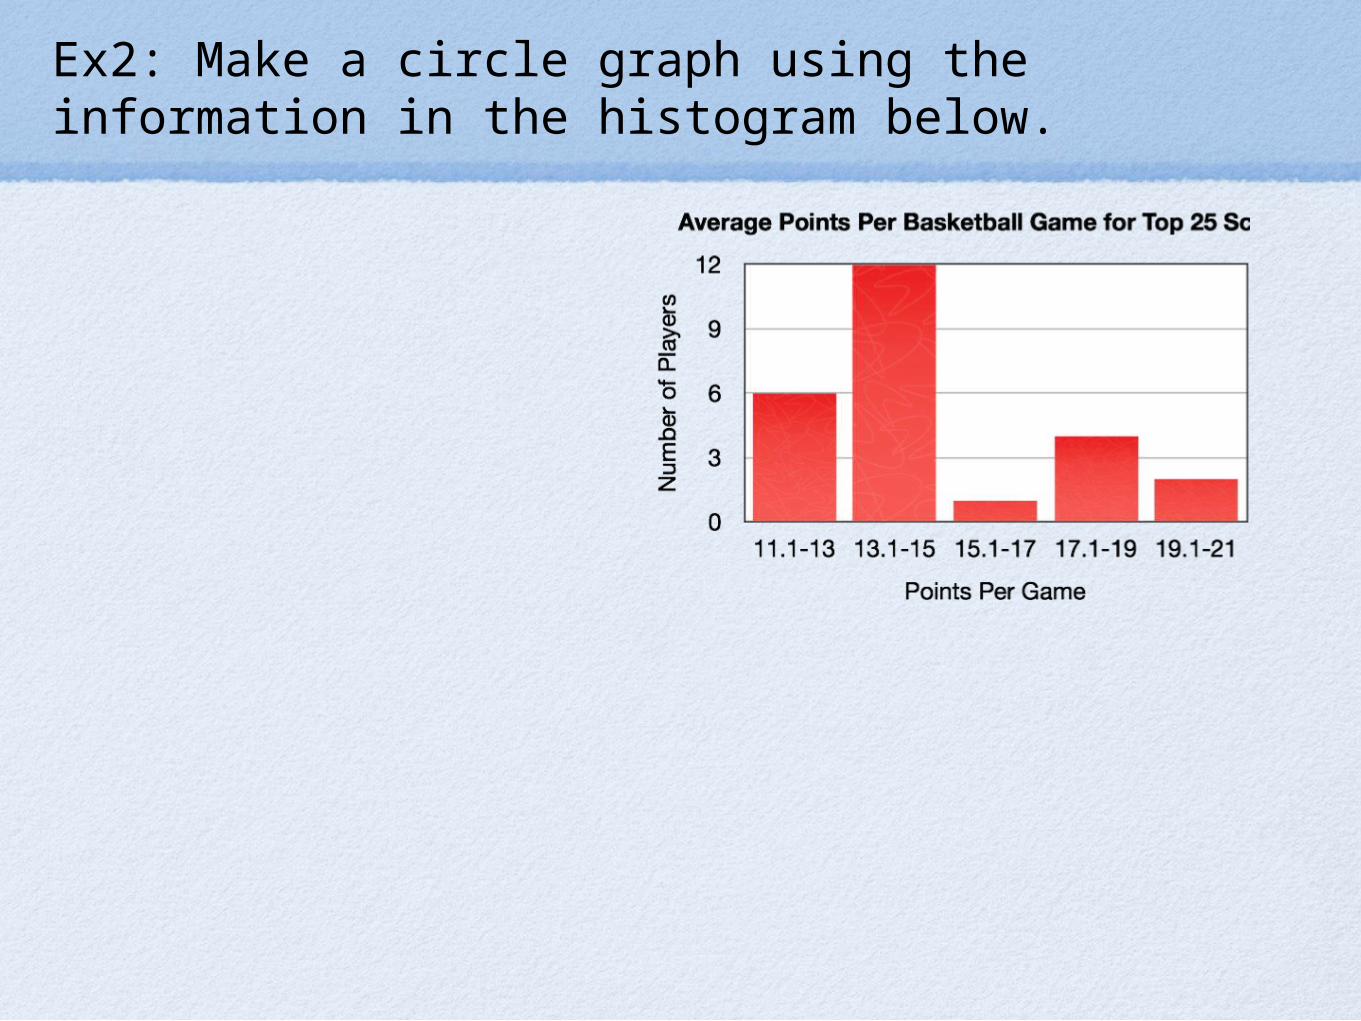
Ex2: Make a circle graph using the information in the histogram below.

Ex3: Make a circle graph using the data in the table below. Round answers to nearest tenth.
Area (square miles) of the 5 Counties of Hawaii
Hawaii 4,028
Honolulu 600
Kalawao 13
Kauai 623
Maui 1,159
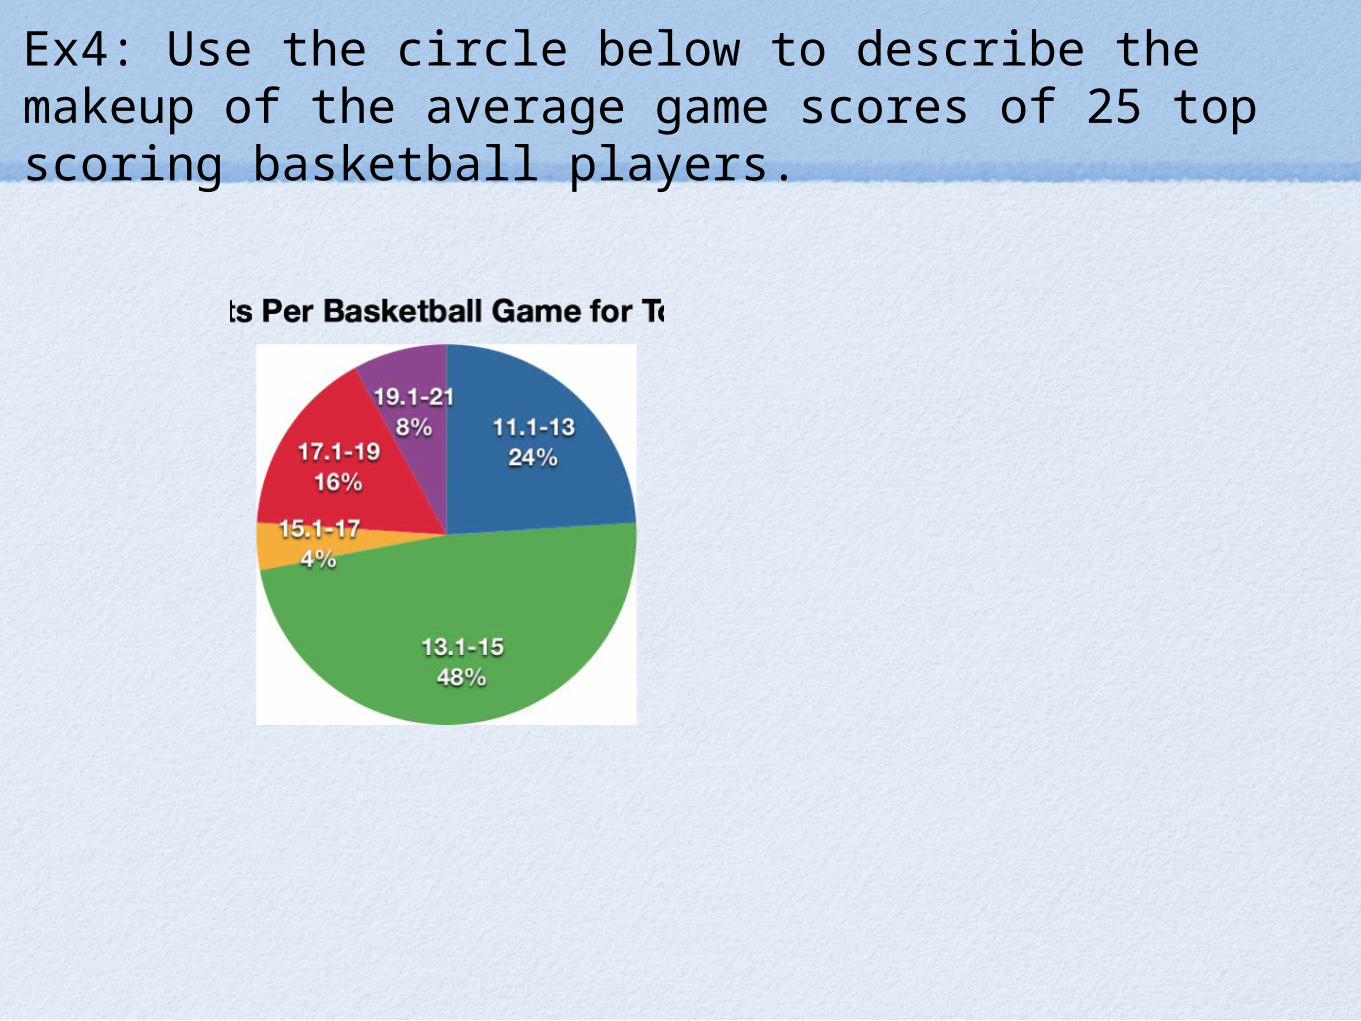
Ex4: Use the circle below to describe the makeup of the average game scores of 25 top scoring basketball players.
Homework & Closure Q
HW: p. 428-429, #6-15all, 17
Closure Q: Make the circle graph for the data from our Do Now Data
Related Documents