Section 5.4 More Trigonometric Graphs Chapter 5 – Trigonometric Functions: Unit Circle Approach 5.4 - More Trigonometric Graphs

Welcome message from author
This document is posted to help you gain knowledge. Please leave a comment to let me know what you think about it! Share it to your friends and learn new things together.
Transcript

5.4 - More Trigonometric Graphs
Section 5.4 More
Trigonometric Graphs
Chapter 5 – Trigonometric Functions: Unit Circle Approach
Cosecant
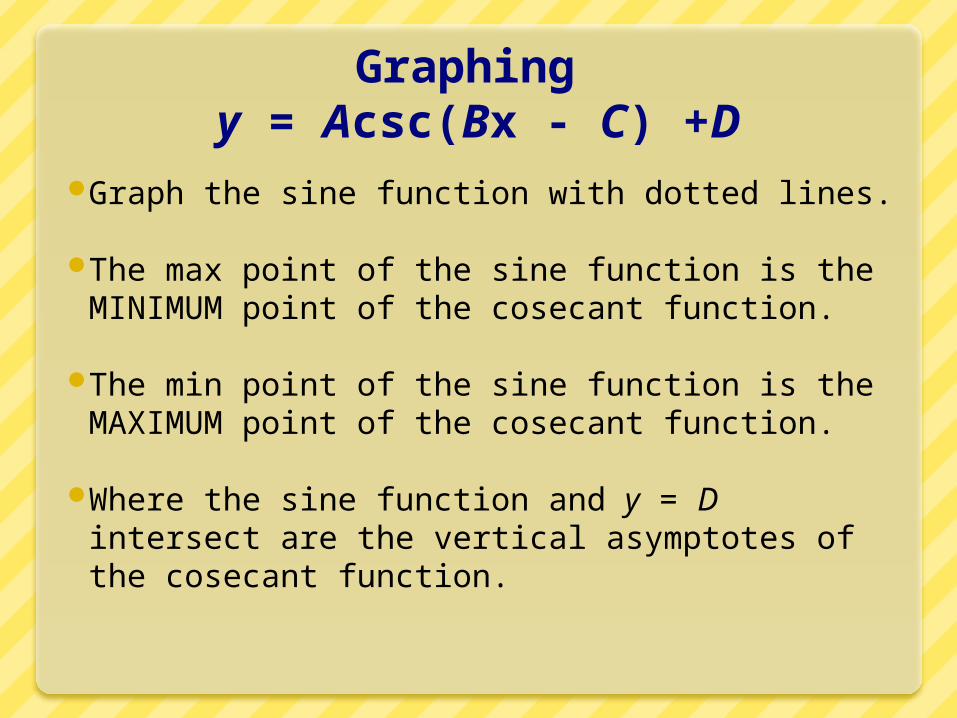
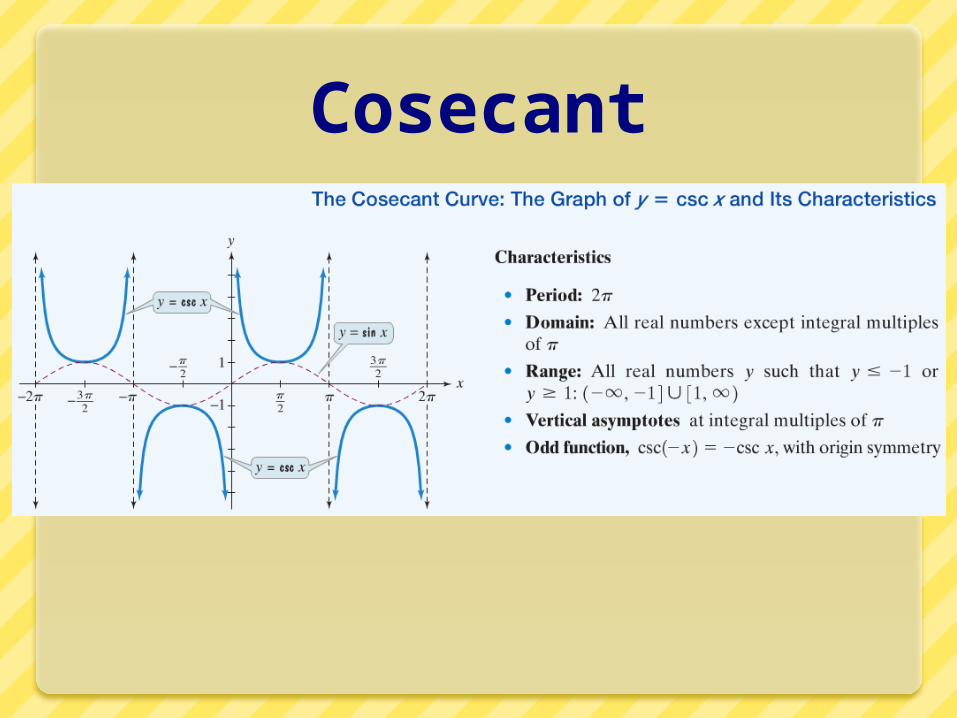
Graphing y = Acsc(Bx - C) +D
Graph the sine function with dotted lines.
The max point of the sine function is the MINIMUM point of the cosecant function.
The min point of the sine function is the MAXIMUM point of the cosecant function.
Where the sine function and y = D intersect are the vertical asymptotes of the cosecant function.
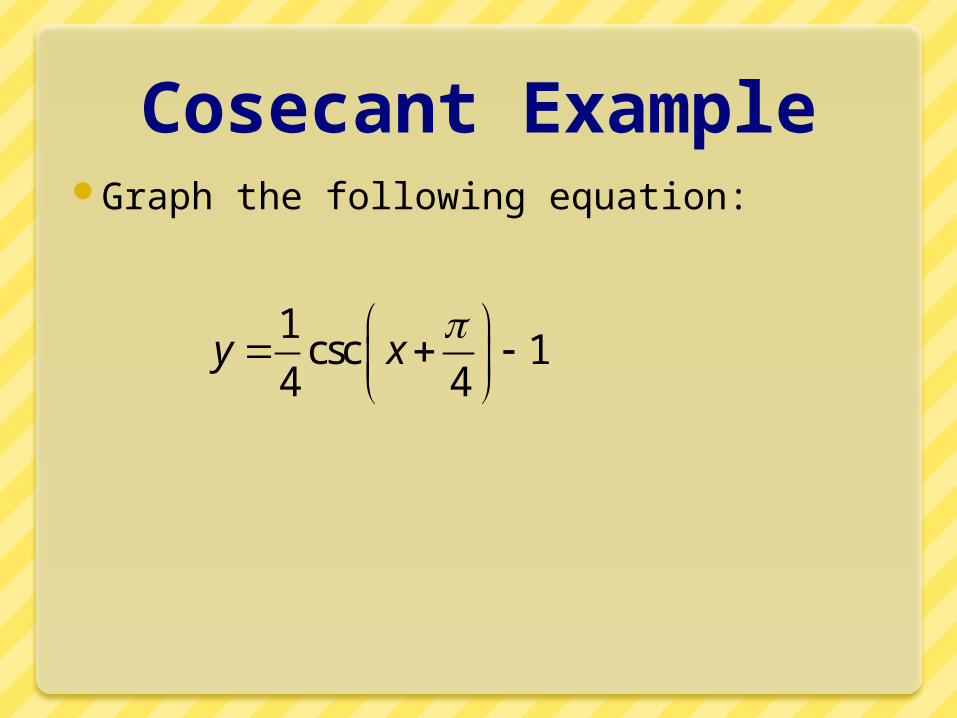
Cosecant ExampleGraph the following equation:
1csc 1
4 4y x
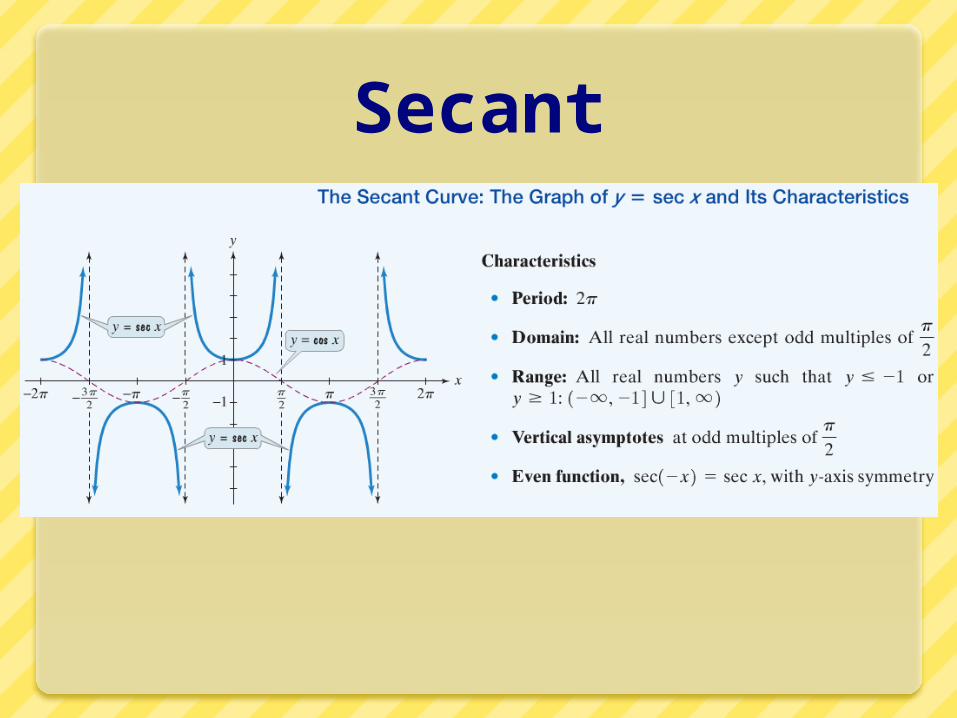
Secant
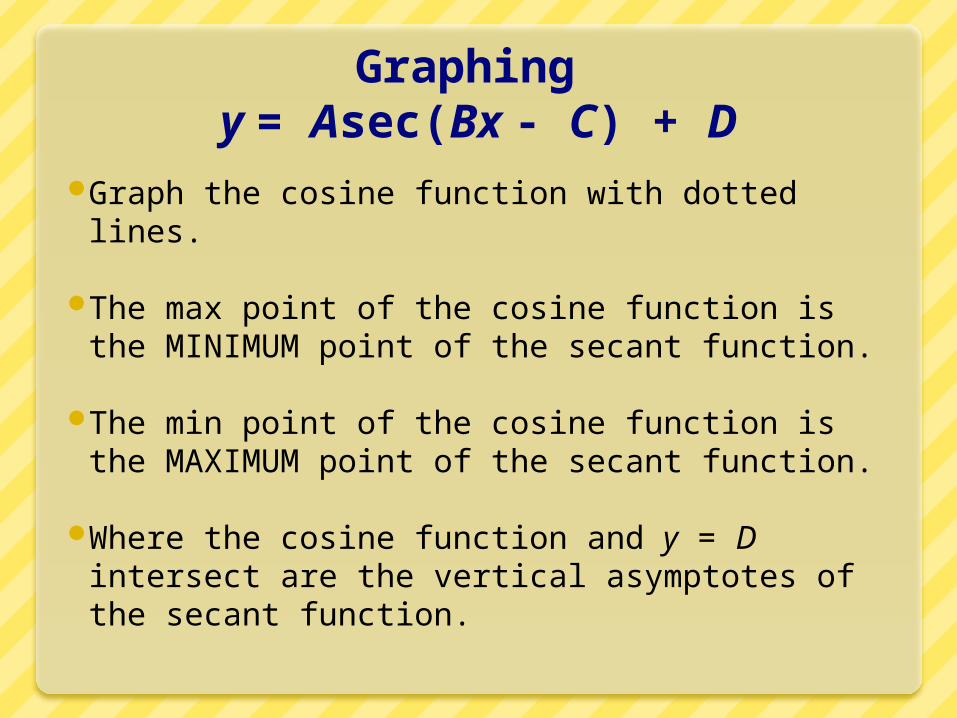
Graphing y = Asec(Bx - C) + D
Graph the cosine function with dotted lines.
The max point of the cosine function is the MINIMUM point of the secant function.
The min point of the cosine function is the MAXIMUM point of the secant function.
Where the cosine function and y = D intersect are the vertical asymptotes of the secant function.

Secant ExampleGraph the following equation:
33sec 1
4y x

Tangent

Graphing y = Atan(Bx - C) + D
Find two consecutive asymptotes
A pair of consecutive asymptotes occur at
Find the point midway between the asymptotes (this is the x-intercept if there is no vertical shift; the y-value is the D).
Find the points on the graph that are ¼ and ¾ of the way between the asymptotes. These points will have the y-values of D+A and D-A respectively.
2 2Bx C
2 2Bx C and Bx C
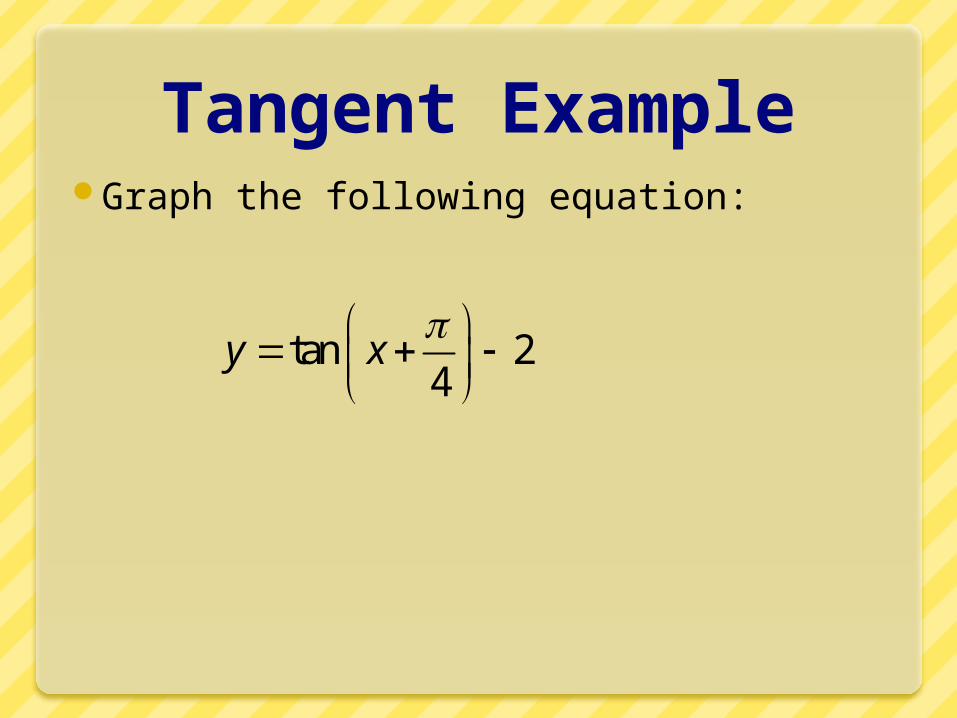
Tangent ExampleGraph the following equation:
tan 24
y x
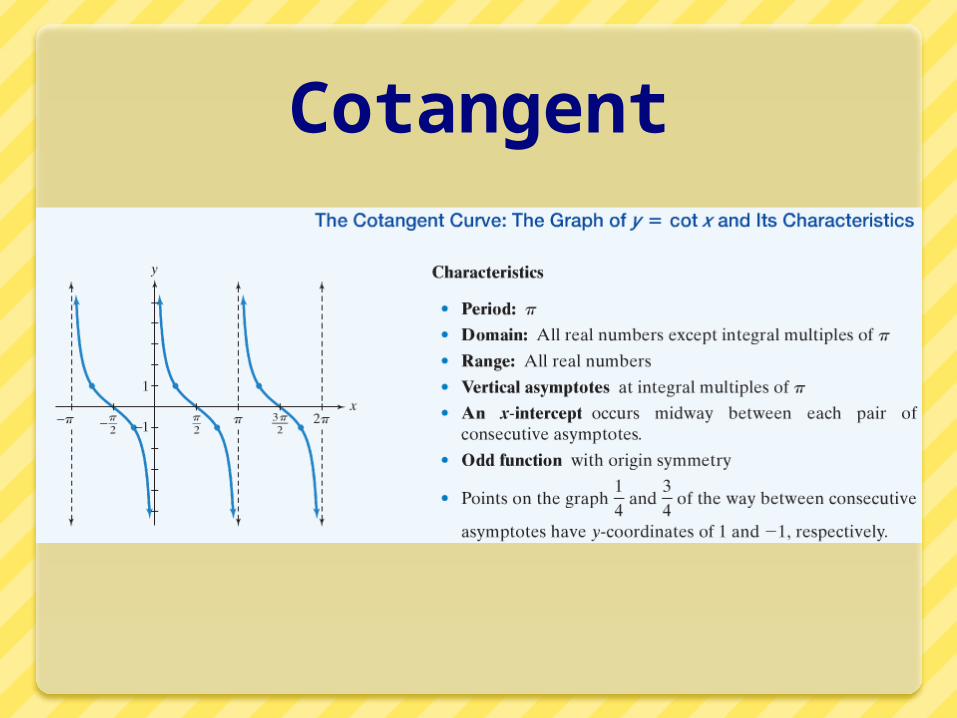
Cotangent

Graphing y = Acot(Bx - C) + D
Find two consecutive asymptotes
A pair of consecutive asymptotes occur at
Find the point midway between the asymptotes (this is the x-intercept if there is no vertical shift; the y-value is the D).
Find the points on the graph that are ¼ and ¾ of the way between the asymptotes. These points will have the y-values of –A+ D and A+D respectively.
0 Bx C
0Bx C and Bx C
Cotangent ExampleGraph the following equation:
3cot 2y x

Graphing Summary
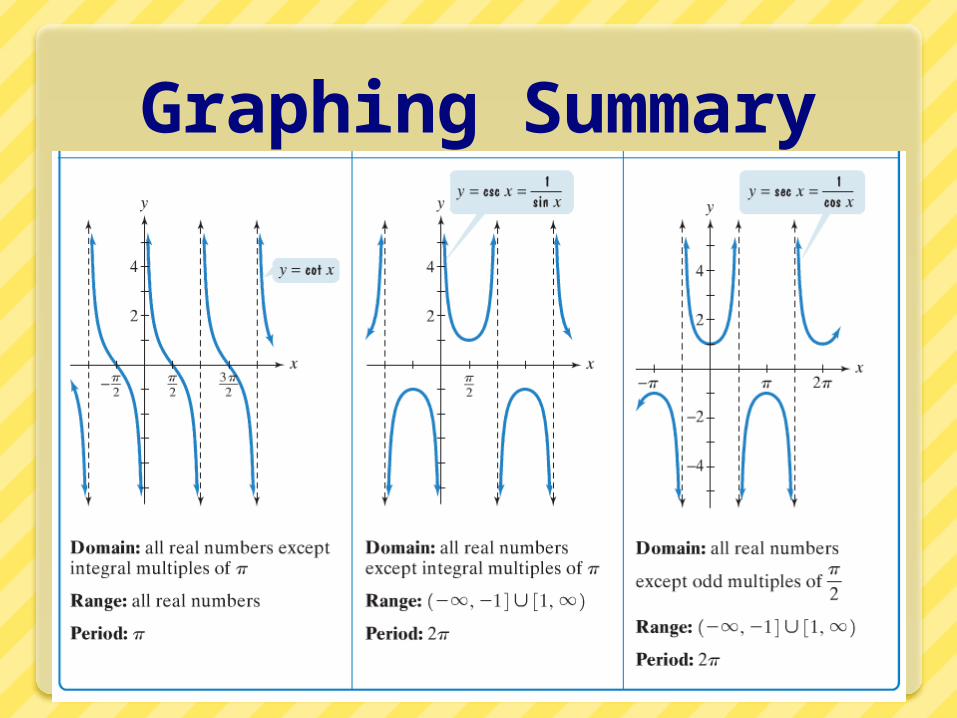
Graphing Summary
Related Documents