Welcome message from author
This document is posted to help you gain knowledge. Please leave a comment to let me know what you think about it! Share it to your friends and learn new things together.
Transcript


STATE OF CONNECTICUTOffi ce of the State Treasurer
The State Motto “Qui Transtulit Sustinet,” (He Who Transplanted Still Sustains), has been associated with the various versions of the state seal from the creation of the Saybrook Colony Seal.

2010
COMBINED INVESTMENT FUNDS COMPREHENSIVE ANNUAL FINANCIAL REPORT
For the fi scal year ended June 30, 2010
STATE OF CONNECTICUTOFFICE OF THE TREASURER
Prepared by: State of Connecticut Offi ce of the Treasurer 55 Elm Street Hartford, CT 06106-1773
STATE OF CONNECTICUTOffi ce of the State Treasurer
The State Motto “Qui Transtulit Sustinet,” (He Who Transplanted Still Sustains), has been associated with the various versions of the state seal from the creation of the Saybrook Colony Seal.

STATE OF CONNECTICUT, OFFICE OF THE TREASURER, DENISE L. NAPPIER 1
Table of ContentsINTRODUCTORY SECTION
Letter from the Treasurer ........................................................................................................................3Management’s Report .............................................................................................................................5Certifi cate of Achievement for Excellence in Financial Reporting ...........................................................6The Connecticut State Treasury .............................................................................................................7Pension Funds Management Administration ..........................................................................................8List of Principal Offi cials ..........................................................................................................................9Investment Advisory Council ................................................................................................................10List of External Advisors ........................................................................................................................ 11
FINANCIAL SECTION
Report of Auditors of Public Accounts ...................................................................................................15Management’s Discussion and Analysis ...............................................................................................17
BASIC FINANCIAL STATEMENTS Statement of Net Assets ..........................................................................................................20 Statements of Changes in Net Assets .....................................................................................21 Notes to Financial Statements .................................................................................................23
INVESTMENT SECTION
Pension Funds Management Division ..................................................................................................41 Division Overview ....................................................................................................................41 The Year in Review ..................................................................................................................45 Total Fund Performance ....................................................................................................45 2010 Management Initiatives .............................................................................................47 Proxy Voting and Corporate Governance ..........................................................................47 Asset Recovery and Loss Prevention ................................................................................49Liquidity Fund ......................................................................................................................... 54Mutual Equity Fund ......................................................................................................................... 58Core Fixed Income Fund ..................................................................................................................... 62Infl ation Linked Bond Fund .................................................................................................................. 67Emerging Market Debt Fund ................................................................................................................ 71High Yield Debt Fund ......................................................................................................................... 75Developed Market International Stock Fund ........................................................................................ 79Emerging Market International Stock Fund .......................................................................................... 83Real Estate Fund ..................................................................................................................................87Commercial Mortgage Fund .................................................................................................................92Private Investment Fund .......................................................................................................................96
COMBINED INVESTMENT FUNDS
COMPREHENSIVE ANNUAL FINANCIAL REPORTFOR FISCAL YEAR ENDED JUNE 30, 2010

2 COMBINED INVESTMENT FUNDS 2010 COMPREHENSIVE FINANCIAL ANNUAL REPORT
TABLE OF CONTENTS
Schedule of Investment Advisors and Fees in Excess of $5,000 .......................................................102Combined Investment Funds Schedule of Brokerage Commissions ..................................................106Schedule of Net Assets ....................................................................................................................... 110Schedules of Changes in Net Assets .................................................................................................. 112Combined Investment Funds Schedule of Investment Activity by Pension Plan ................................ 116Combined Investment Funds Schedule of Investment Activity by Trust .............................................120Combined Investment Funds Total Net Asset Value by Pension Plans and Trusts .............................126Combined Investment Funds List of Investment Advisors and Net Assets Under Management ........127Schedule of Consulting Services in Excess of $5,000 ........................................................................131Combined Investment Funds Top Ten Holdings ..................................................................................132Combined Investment Funds Glossary of Investment Terms..............................................................135Understanding Investment Performance ............................................................................................139
STATISTICAL SECTION
Overview .........................................................................................................................................141Combined Investment Funds Financial Highlights ..............................................................................142Pension and Trust Funds Balances in Combined Investment Funds .................................................145Combined Investment Funds Investment Summary ...........................................................................146Condensed Financial Schedules .......................................................................................................149

IntroductorySection


STATE OF CONNECTICUT, OFFICE OF THE TREASURER, DENISE L. NAPPIER 3
LETTER FROM THE TREASURER
December 30, 2010
To the State of ConnecticutCombined Investment FundsFellow Benefi ciaries
I am pleased to submit this Comprehensive Annual Financial Report (CAFR) for the State of Connecticut Combined Investment Funds (CIF) for the fi scal year ended June 30, 2010. During 2010, the Connecticut Retirement Plans and Trust Funds (CRPTF) rebounded strongly from 2009, a year of unprecedented down-turn in the global economy. The value of the CRPTF assets increased by $1.5 billion earning an average net return of 12.88% as noted under Financial Information below.
Responsibility for both the accuracy of the data and the completeness and fairness of this report rests with Treasury management. All disclosures necessary and required to enable fellow benefi ciaries and the fi nancial community to gain an understanding of CIF’s fi nancial activities have been included.
We believe the enclosed fi nancial statements and data are presented fairly in all material respects and are reported in a manner designed to present the fi nancial position and results of CIF’s operations accurately.
The CIF were established pursuant to Connecticut General Statutes Section 3-31b to provide a means for investing pension and other trust fund assets entrusted to the Treasurer in a variety of investment classes. The Funds are separate, legally-defi ned open-end portfolios consisting of: the Liquidity Fund, the Mutual Equity Fund, the Core Fixed Income Fund, the Emerging Market Debt Fund, the High Yield Debt Fund, the Infl ation Linked Bond Fund, the Developed Markets International Stock Fund, the Emerging Markets International Stock Fund, the Real Estate Fund, the Commercial Mortgage Fund, and the Private Investment Fund.
The units of the Funds are owned by six pension funds, which include: the Teachers’ Retirement Fund; State Employees’ Retirement Fund; Connecticut Municipal Employees’ Retirement Fund; State Judges Re-tirement Fund; Probate Judges and Employees’ Retirement Fund; and State’s Attorney Retirement Fund. In addition, there are eight trust funds which include: the Soldiers’ Sailors’ and Marines’ Fund; Policemen and Firemen Survivors’ Benefi t Fund; Arts Endowment Fund; School Fund; Ida Eaton Cotton Fund; Hopemead State Park Fund; Andrew C. Clark Fund; and the Agricultural College Fund.
Financial InformationThe CIF assets in 2010 were $21.9 billion and are valued at fair value. The CIF is in full compliance with
the standards of the Governmental Accounting Standards Board. To meet CIF’s obligations for investing pension plans and other trust funds, CIF’s assets are diversifi ed over a number of investments, and a host of different investment strategies are employed to control risk. In the past year, the three largest retirement plans, Teachers’ Retirement Fund, State Employees’ Retirement Fund and the Municipal Employees’ Retire-ment Fund, representing 99% of the State’s retirement assets, posted net total returns (after all expenses) of -17.14%, -18.25% and -14.90%, respectively, compared to the three funds’ customized benchmarks, of 12.87%, 12.93% and 12.57%, respectively. Additional information on the Combined Investment Funds can be found in the Notes to the Financial Statements.

4 COMBINED INVESTMENT FUNDS 2010 COMPREHENSIVE FINANCIAL ANNUAL REPORT
LETTER FROM THE TREASURER
Internal Control Structure Management is responsible for maintaining a system of adequate internal accounting controls de-
signed to provide reasonable assurance that transactions are executed in accordance with management’s general or specifi c authorization, and are recorded as necessary to maintain accountability for assets and to permit preparation of fi nancial statements in accordance with generally accepted accounting principles. We believe the internal controls in effect during the fi scal year ended June 30, 2010, adequately safeguard CIF’s assets and provide reasonable assurance regarding the safekeeping of assets and reliability of all fi nancial records.
Independent AuditThe State of Connecticut’s independent Auditors of Public Accounts conducted an annual audit of this
Comprehensive Annual Financial Report in accordance with generally accepted auditing standards. The auditors’ report on the basic fi nancial statements is included in the Financial Section of this report.
Management Discussion and AnalysisThe Government Accounting Standards Board requires that CIF provide a narrative introduction, over-
view and analysis to accompany the basic fi nancial statements in the form of a Management’s Discussion and Analysis (MD&A). This letter of transmittal is designed to complement the MD&A and should be read in conjunction with it. The MD&A can be found in the Financial Section immediately following the report of the independent auditors.
AwardsThe Government Finance Offi cers Association of the United States and Canada awarded the Fund a
Certifi cate of Achievement for Excellence in Financial Reporting for its Comprehensive Annual Financial Report for the Fiscal Year ended June 30, 2009. The Certifi cate is a prestigious national award recognizing conformance with the highest standards for preparation of state and local government fi nancial reports.
Requests for InformationThis Comprehensive Annual Financial Report is designed to provide a general overview of the CIF for
all those with an interest in the funds’ investment activities. Questions concerning any of the information provided in this report or requests for additional fi nancial information should be addressed to the Offi ce of the Treasurer, 55 Elm Street, Hartford, Connecticut 06106-1773, or by telephone to (860) 702-3000. Copies of the Report will also be available on the Internet at www.state.ct.us/ott.
Sincerely,
Denise L. NappierTreasurerState of Connecticut

STATE OF CONNECTICUT, OFFICE OF THE TREASURER, DENISE L. NAPPIER 5
December 30, 2010
To the State of Connecticut Combined Investment FundsFellow Benefi ciaries
This report was prepared by the Offi ce of the Treasurer, which is responsible for the accuracy of the data, the completeness and fairness of the presentation and all disclosures. We present the fi nancial statements and data as being accurate in all material respects and prepared in conformity with generally accepted ac-counting principles and such fi nancial statements are audited annually by the State of Connecticut Auditors of Public Accounts.
To carry out this responsibility, the Offi ce of the Treasurer maintains fi nancial policies, procedures, account-ing systems and internal controls that management believes provide reasonable, but not absolute, assurance that accurate fi nancial records are maintained and investments and other assets are safeguarded.
It is our belief that the contents of this Combined Investment Funds Comprehensive Annual Financial Report make evident the State of Connecticut Offi ce of the Treasurer support of the safe custody and con-scientious stewardship of the State’s property and money held by the State.
In management’s opinion, the internal control structure of the Offi ce of the Treasurer is adequate to ensure that the fi nancial information is this report presents fairly the fi nancial condition and results of opera-tions of the funds that follow.
Sincerely,
Howard G. RifkinDeputy Treasurer
MANAGEMENT’S REPORT

6 COMBINED INVESTMENT FUNDS 2010 COMPREHENSIVE FINANCIAL ANNUAL REPORT
Certificate of
Presented to
Connecticut State Treasurer's
For its Comprehensive Annual
June 30, 2009
President
Executive Director
Financial Report
for the Fiscal Year Ended
Reportingin Financial
for ExcellenceAchievement
Text38:Combined Investment Funds
A Certificate of Achievement for Excellence in FinancialReporting is presented by the Government Finance Officers
Association of the United States and Canada togovernment units and public employee retirement
systems whose comprehensive annual financialreports (CAFRs) achieve the higheststandards in government accounting
and financial reporting.
CERTIFICATE OF ACHIEVEMENT FOR EXCELLENCE IN FINANCIAL REPORTING
STATE OF CONNECTICUT, OFFICE OF THE TREASURER, DENISE L. NAPPIER 7
THE CONNECTICUT STATE TREASURY
Mission StatementTo serve as the premier State Treasurer’s Offi ce in the nation through effective management of public
resources, high standards of professionalism and integrity, and expansion of opportunity for the citizens and businesses of Connecticut.
Statutory ResponsibilityThe Offi ce of the Treasurer was established following the adoption of the fundamental orders of Con-
necticut in 1638. The Treasurer shall receive all funds belonging to the State and disburse the same only as may be directed by law, as described in Article Fourth, Section 22 of the Connecticut Constitution and in Title 3 of the Connecticut General Statutes.
The Treasurer, as Chief Fiscal Offi cer for the State, oversees the prudent preservation and management of State funds, including the administration of a $21.9 billion portfolio of pension assets and over $4.7 billion in State and local short-term investments.
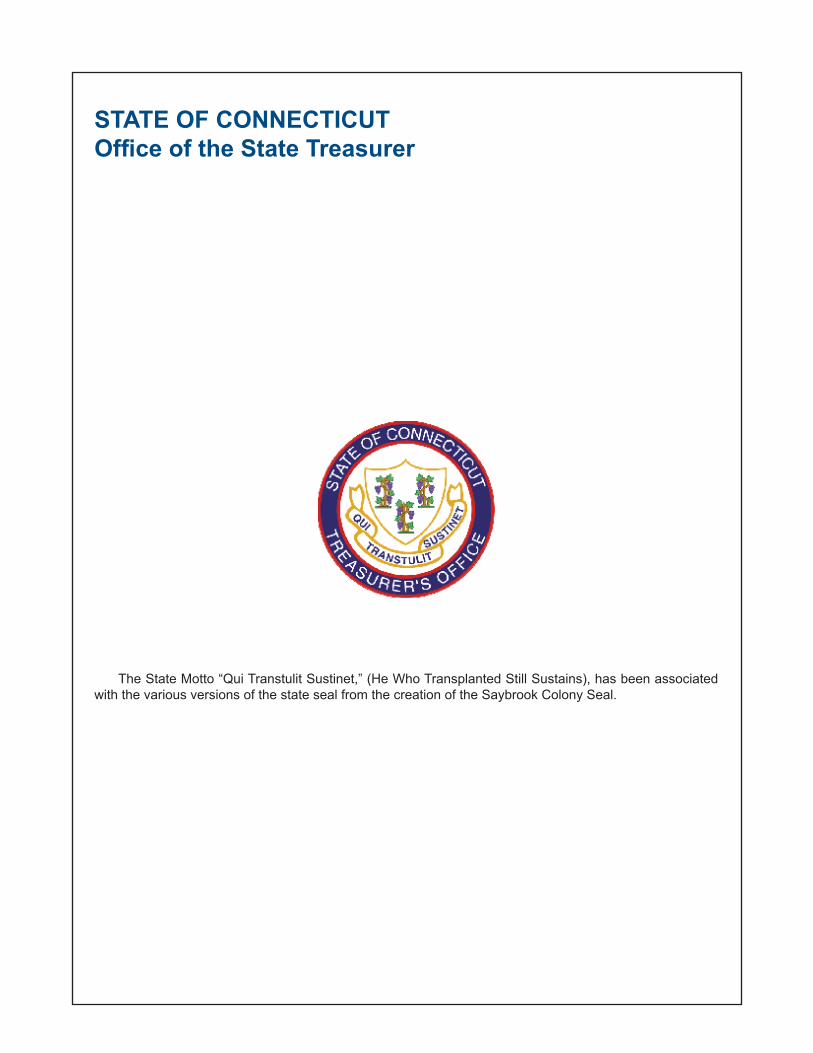
Public ServiceThe Offi ce of the Treasurer includes an Executive Offi ce as well as fi ve distinct divisions, each with
specifi c responsibilities: Pension Funds Management, Cash Management, Debt Management, Unclaimed Property, and the Second Injury Fund.
Treasurer
Executive Offi ce
Pension Funds
Management
Debt Management
Cash Management
Unclaimed Property
Second Injury Fund

� � � � � � � � � � � � � � � � � � � � � � � � � � � � � � � � � � � � � � � � � � � � � � � � � � � � � � � � �
� � � � � � ! � � " # $ � � $ % & � ! # ' ! � � � � # $ ( ' $ � � �) * + , - * . / + 0 1 1 , * 23 4 5 6 7 8 4 5 4- 9 : 9 ; < = > < ? ? ; @ 9 A @ B 9, + C * - D E * + D 0 ) C , - F 2 G> F H + > , .I < J ; K L ) / 2 < M ;D L < N : J O : P ? ; JE A @ L : ; Q R P ; ; N : ?) : S A T U A N N ; Q P ; A @ L- 9 : ? Q ; V E < P 9 ; ?W A Q Q A : N E B P P : V) ; ? A J ; . / + : K K A ; P- L : P < ? E / 1 : Q N ; P) : S A T E / 2 < 9 LO P ; ? T : . / - A J @ <> : P < Q E / D L < N : J1 ; 9 ; P D L < P. * * 0 + + 1 0 . . 0 ) , + FX 5 Y 8 Z [ \ ] ^ 5 _ ` a b 5 7 Z c 5 a Zd _ e f 5 4> U 2 , - D , + 0 E > g , + + , -h i 5 f 8 Z ^ b 5 j 5 f 4 5 Z 6 4 [
E , > U * . . * 2 / O / U 0 . *` a b 5 7 Z c 5 a Z d _ e f 5 4k f f l 8 a Z ^ a m n \ l a Z 4 l o
p p q r s t u q � v u q w x q y z { | } ~ z ~ �
C 0 > 0 + D� 4 ^ a f ^ Y 6 o ` a b 5 7 Z c 5 a Zd _ e f 5 4 � � 5 6 o h 7 Z 6 Z 5g 2 * g F 2 G ) / R 2 0 + � . , +k 7 7 ^ 7 Z 6 a Z3 4 5 6 7 8 4 5 4
- F + , 0 G / 1 * 2 F + *k � c ^ a ^ 7 Z 4 6 Z ^ b 5k 7 7 ^ 7 Z 6 a Z W , + , R 2 * ) - > 0 . F 2 0k � c ^ a ^ 7 Z 4 6 Z ^ b 5k 7 7 ^ 7 Z 6 a Z
> 0 D U * 2 , + * * / . 0 E 0 2 2� 5 a 5 4 6 o \ l 8 a 7 5 o2 F O * 2 D - > F D Dk 7 7 l f ^ 6 Z 5 \ l 8 a 7 5 o- U * . 0 g U 1 / E > > . H 2 *` a b 5 7 Z c 5 a Z \ l c Y o ^ 6 a f 5d _ e f 5 4C 0 > 0 + Dk 7 7 ^ 7 Z 6 a Z 3 4 5 6 7 8 4 5 4� l o ^ f [
C 0 > 0 + D� 4 ^ a f ^ Y 6 o ` a b 5 7 Z c 5 a Zd _ e f 5 4 � h � 8 ^ Z ^ 5 7 . , + ) 0 D / D H ) 0 +h i 5 f 8 Z ^ b 5 k 7 7 ^ 7 Z 6 a Zd Y 5 4 6 Z ^ l a 7 � 6 a 6 m 5 c 5 a Zn \ 8 7 Z l � ^ 6 a � ^ 6 ^ 7 l a0 ) 2 , 0 + � , + g - U F D D� 4 ^ a f ^ Y 6 o ` a b 5 7 Z c 5 a Zd _ e f 5 4 � � 4 ^ b 6 Z 5 h � 8 ^ Z ^ 5 7
O 2 , + ) 0 E 0 D D , * 0 - - , E� 5 a 7 ^ l a � 8 a �k f f l 8 a Z 6 a Z- * * + H ) * C 0 1 1 0� 5 a 7 ^ l a � 8 a �k f f l 8 a Z 6 a Z- 0 . C 0 D F 2 * . , - 0 D 0 + F` a b 5 7 Z c 5 a Z 3 5 f ] a ^ f ^ 6 a ` `R * . , > , 0 g * + > 0j 5 f 8 4 ^ Z ^ 5 7 k a 6 o [ 7 Z
I F 0 + + * O / ) F E O 2 F - � G� 4 ^ a f ^ Y 6 o ` a b 5 7 Z c 5 a Zd _ e f 5 4 � � ^ i 5 � ` a f l c 5 2 F + + , * 2 F ) 2 , g H * �` a b 5 7 Z c 5 a Z d _ e f 5 4� 5 4 _ l 4 c 6 a f 5 n k a 6 o [ 7 ^ 7
E / D , E F D U G > F 2 O * D D\ ] ^ 5 _ ` a b 5 7 Z c 5 a Z d _ e f 5 4
2 * g , + 0 . ) D H > � * 2` a b 5 7 Z c 5 a Z d _ e f 5 4k o Z 5 4 a 6 Z ^ b 5 ` a b 5 7 Z c 5 a Z 7

STATE OF CONNECTICUT, OFFICE OF THE TREASURER, DENISE L. NAPPIER 9
COMBINED INVESTMENT FUNDS55 Elm Street, 6th FloorHartford, CT. 06106-2773
Telephone: (860) 702-3155Facsimile: (860) 702-3042
World Wide Web: www.state.ct.us/ott
Treasurer, State of Connecticut DENISE L. NAPPIER (860) 702-3010
Deputy Treasurer, State of Connecticut HOWARD G. RIFKIN (860) 702-3292
Chief Investment Offi cerM. TMOTHY CORBETT (860)702-3005
Deputy Chief Investment Offi cerLEE ANN PALLADINO (860) 702-3229
Assistant TreasurerGREGORY D. FRANKLIN, CFA (860) 702-3162
Principal Investment Offi cerJOANNE B. DOMBROSKY (860) 702-3066
Investment Offi cerMICHELLE R. B. HALE, CPA (860) 702-3275
Investment Offi cerRONNIE RODRIGUEZ (860) 702-3167
Investment Offi cerREGINALD TUCKER (860) 702-3101
Investment Compliance Offi cerSHELAGH P. MCCLURE (860) 702-3280
General CounselCATHERINE E. LAMARR (860) 702-3018
LIST OF PRINCIPAL OFFICIALS

10 COMBINED INVESTMENT FUNDS 2010 COMPREHENSIVE FINANCIAL ANNUAL REPORT
INVESTMENT ADVISORY COUNCIL
The Investment Advisory Council (IAC) consists of The State Treasurer and Secretary of the Offi ce of Policy and Management (as ex-offi cio members of the council), fi ve public members all of whom shall be experienced in matters relating to investments appointed by the Governor and legislative leadership, and three representatives of the teachers’ unions and two representatives of the state employees’ unions (CGS Sec. 3-13b).
Pursuant to C.G.S. Sec.3-13b, the IAC annually reviews the Investment Policy (IPS) Statement recommended by the Treasurer which includes an outline of the standards governing investment of the plan and trust funds by the Treasurer. The IPS includes, with respect to each plan and trust fund, (A) investment objectives; (B) asset allocation policy and risk tolerance; (C) asset class defi nitions, including specifi c types of permissible investments within each asset class and any specifi c limitations or other considerations governing the investment of any funds; (D) investment and money manager guidelines; (E) investment performance evaluation guidelines; (F) guidelines for the selection and termination of providers of investment related services who shall include, but not be limited to, external investment and money managers, investment consultants, custodians, broker-dealers, legal counsel, and similar investment industry professionals; and (G) proxy voting guidelines. The Treasurer shall thereafter adopt the IPS, including any such changes recommended by the IAC the Treasurer deems appropriate, with the approval of a majority of the members appointed to the IAC. The current IPS was adopted by the Treasurer and approved by the IAC in October 2007. Subsequently in May 2008, the IAC approved the Treasurer’s adopted asset allocation modifi cations for various plans to increase the allocations to the Liquidity Fund and subsequently in February 2009, the IAC approved the Treasurer’s adopted revision to set forth guidelines for the Connecticut Retirement Plans and Trust Funds’ (“CRPTF”) new Alternative Investment Fund (“AIF”)
All plan and trust fund investments by the State Treasurer shall be reviewed by the Investment Advisory Council along with all information regarding such investments provided to the IAC which the Treasurer deems relevant to the council’s review and such other information as may be requested by the council. The IAC shall also review the report provided by the Treasurer at each regularly scheduled meeting of the IAC as to the status of the plan and trust funds and any signifi cant changes which may have occurred or which may be pending with regard to the funds. The council shall promptly notify the Auditors of Public Accounts and the Comptroller of any unauthorized, illegal, irregular or unsafe handling or expenditure of plan and trust funds or breakdowns in the safekeeping of plan and trust funds or contemplated action to do the same within their knowledge.
At the close of the fi scal year, the IAC shall make a complete examination of the security investments of the State and determine as of June thirtieth, the value of such investments in the custody of the Treasurer and report thereon to the Governor, the General Assembly and benefi ciaries of plan and trust fund assets administered, held or invested by the Treasurer (CGS Sec. 3-13b(c)(2)).
Council members who contributed their time and knowledge to the IAC during fi scal 2010 include:
JOSEPH D. ROXE, Chairman, as appointed by the Governor. Chairman, Bay Holdings LLC.
THOMAS BARNES, Branch Manager, Riverside Investment Services.
MICHAEL FREEMAN, Representative of State Teachers’ unions, Teacher, Stonington High School.
ROBERT L. GENUARIO, Secretary, State Offi ce of Policy and Management (Ex-offi cio member). (Served until May 10, 2010.)
DAVID HIMMELREICH, Principal, Hynes, Himmelreich, Glennon & Company.
STANLEY MORTEN, Independent consultant, CitiGroup/Smith Barney.
WILLIAM MURRAY, Representative of State Teachers’ unions, NEA, Danbury.
DENISE L. NAPPIER, Treasurer, State of Connecticut (Ex-offi cio member) and council secretary.
SHARON M. PALMER, Representative of State Teachers’ unions, President, AFT Connecticut.
DAVID M. ROTH, Principal and Managing Director, WLD Enterprises, Inc. BRENDA L. SISCO, Acting Secretary, State Offi ce of Policy and Management (Ex-offi cio member).
CAROL M. THOMAS, Representative of State Employees’ unions, Retiree, Department of Developmental Services.
PETER THOR, Representative of State Employees’ unions, Coordinator, Policy & Planning, AFSCME Council 4.

� � � � � � � � � � � � � � � � � � � � � � � � � � � � � � � � � � � � � � � � � � � � � � � � � �
� � � � � � � � � � � � � � ! � " � � �# $ % $ & ' ( ) * # + * ( , - . + ) / ( 0 1 # & 0 0 ( 2 3 / 2 4 35 ) + 0 6 7 / 0 8 + ) 6 % * * & 2 / + 3 ( * - # & 0 * 9 & 9 & 2 6 ( 0 1 8 ( 0 0 * , 7 : + 0 / +; ( ) 2 ( ) < 0 : ( * 3 = ( 0 3 # & 0 * 4 7 3 / 0 ' - > ( ? @ & ) 6 1 > ( ? @ & ) 6> ( ? A 0 ' 7 + 0 B 8 ( 0 * / & 0 # & 0 * 4 7 3 + 0 3 * - # + = C ) / B ' ( 1 ; + * * + 2 9 4 * ( 3 3 *D 9 ( D & ? 0 * ( 0 B E ) & 4 F - # 7 ( : ( 7 + 0 B 1 G 9 / &� " � � � H � � � � I � " �J 3 + 3 ( J 3 ) ( ( 3 K + 0 6 + 0 B D ) 4 * 3 # & L - K & * 3 & 0 1 ; + * * + 2 9 4 * ( 3 3 *" I � � � H �% 4 B / 3 & ) * & M 8 4 C 7 / 2 % 2 2 & 4 0 3 * - N + ) 3 M & ) B 1 # & 0 0 ( 2 3 / 2 4 3� � � � � � � � � � " I � � � � H �O P Q R P S P T U V R W S% = C + * * + B & ) # + F / 3 + 7 ; + 0 + ' ( = ( 0 3 - . ( 3 ) & / 3 1 ; / 2 9 / ' + 0# & 7 2 9 ( * 3 ( ) E 7 & C + 7 < 0 : ( * 3 & ) * X 3 B L - X & 0 B & 0 1 A 0 ' 7 + 0 BX + Y + ) B % * * ( 3 ; + 0 + ' ( = ( 0 3 X X # - > ( ? @ & ) 6 1 > ( ? @ & ) 68 + , B ( 0 Z $ , ' ( 7 - X & * % 0 ' ( 7 ( * 1 # + 7 / M & ) 0 / +8 + 2 / [ 2 < 0 : ( * 3 = ( 0 3 ; + 0 + ' ( = ( 0 3 # & = F + 0 , - > ( ? F & ) 3 K ( + 2 9 1 # + 7 / M & ) 0 / +J 3 + 3 ( J 3 ) ( ( 3 E 7 & C + 7 % B : / * & ) * - K & * 3 & 0 1 ; + * * + 2 9 4 * ( 3 3 *\ R T R ] O ^ Q R P T U V R W SO _ ` a b c _ dK E < K + ) 2 7 + , * E 7 & C + 7 < 0 : ( * 3 & ) * 1 > L % L - J + 0 5 ) + 0 2 / * 2 & 1 # + 7 / M & ) 0 / +J 3 + 3 ( J 3 ) ( ( 3 E 7 & C + 7 % B : / * & ) * - K & * 3 & 0 1 ; + * * + 2 9 4 * ( 3 3 *D L $ & ? ( 8 ) / 2 ( % * * & 2 / + 3 ( * - K + 7 3 / = & ) ( 1 ; + ) , 7 + 0 B] e f g h b ^ i f b j k g l j% m % $ & * ( 0 C ( ) ' < 0 : ( * 3 = ( 0 3 ; + 0 + ' ( = ( 0 3 - G ) / 0 B + 1 # + 7 / M & ) 0 / +> 4 = ( ) / 2 < 0 : ( * 3 & ) * X X # - K & * 3 & 0 1 ; + * * + 2 9 4 * ( 3 3 *8 , ) + = / * E 7 & C + 7 % B : / * & ) * - K & * 3 & 0 1 ; + * * + 2 9 4 * ( 3 3 *] n n c _ d# + F / 3 + 7 8 ) & * F ( 2 3 * 1 X X # - J 3 + = M & ) B 1 # & 0 0 ( 2 3 / 2 4 35 < J E ) & 4 F 1 < 0 2 L - 8 9 / 7 + B ( 7 F 9 / + 1 8 ( 0 0 * , 7 : + 0 / +o p _ n n q \ g r c _ d s _ k k g h b ^ j t _ j e b% m % $ & * ( 0 C ( ) ' < 0 : ( * 3 = ( 0 3 ; + 0 + ' ( = ( 0 3 - G ) / 0 B + 1 # + 7 / M & ) 0 / +o p _ n n q \ g r c _ d ] e f g h bK / : / 4 = # + F / 3 + 7 8 + ) 3 0 ( ) * - J + 0 5 ) + 0 2 / * 2 & 1 # + 7 / M & ) 0 / +c u v ^ V P w ^ S P W c u \ ^ V R W Ss _ k k g h bJ 3 + 3 ( J 3 ) ( ( 3 E 7 & C + 7 % B : / * & ) * - K & * 3 & 0 1 ; + * * + 2 9 4 * ( 3 3 *] e f g h bK 7 + 2 6 $ & 2 6 5 / 0 + 0 2 / + 7 ; + 0 + ' ( = ( 0 3 1 < 0 2 L - > ( ? @ & ) 6 1 > ( ? @ & ) 68 9 & ( 0 / x < 0 : ( * 3 = ( 0 3 # & 4 0 * ( 7 - N + ) 3 M & ) B 1 # & 0 0 ( 2 3 / 2 4 38 ) & ' ) ( * * < 0 : ( * 3 = ( 0 3 ; + 0 + ' ( = ( 0 3 # & = F + 0 , - J + 0 5 ) + 0 2 / * 2 & 1 # + 7 / M & ) 0 / +y ( 7 7 / 0 ' 3 & 0 - K & * 3 & 0 1 ; + * * + 2 9 4 * ( 3 3 *P W V O ] T P u W O P W z ^ S { u W S V R W SK ) & ? 0 K ) & 3 9 ( ) * N + ) ) / = + 0 - > ( ? @ & ) 6 1 > ( ? @ & ) 6N + ) 3 M & ) B < 0 : ( * 3 = ( 0 3 ; + 0 + ' ( = ( 0 3 # & = F + 0 , - N + ) 3 M & ) B 1 # & 0 0 ( 2 3 / 2 4 3
O P o T u V ^ w T ^ v W ] O ] S | P o u v o

12 COMBINED INVESTMENT FUNDS 2010 COMPREHENSIVE FINANCIAL ANNUAL REPORT
EMERGING MARKET DEBT FUNDAshmore Emerging Markets Debt Fund - London, England
ING Investment Management - Hartford, ConnecticutPyramis Global Investors - Boston, Massachusetts
Stone Harbor Investment Partners - New York, New YorkUBS Global Asset Management - Chicago, Illinois
HIGH YIELD INCOME FUNDLoomis Sayles & Co., Inc. - Boston, Massachusetts
Oaktree Capital Management, L.L.C. - Los Angeles, CaliforniaShenkman Capital Management - Stamford, ConnecticutStone Harbor Investment Partners - New York, New York
DEVELOPED MARKET INTERNATIONAL STOCK FUND (1)
IndexState Street Global Advisors - Boston, Massachusetts
CoreAcadian Asset Management - Boston, MassachusettsAQR Capital Management - Greenwich, Connecticut
Artio Global Management - New York, New YorkInvesco Global Asset Management - Denver, Colorado
Progress Investment Management Company - San Francisco, California
Active - GrowthMFS Institutional Advisors, Inc. - Boston, Massachusetts
Active - ValueGrantham, Mayo, Van Otterloo & Co. - Boston, Massachusetts
Small CapDimensional Fund Advisors - Austin, Texas
Schroder Investment Management - New York, New YorkWilliam Blair & Company - Chicago, Illinois
Risk ControlledBlackRock Investment Management - New York, New York
Pyramis Global Advisors Trust - Boston, Massachusetts
EMERGING MARKET INTERNATIONAL STOCK FUND (1)
Aberdeen Asset Management, Inc. - Philadelphia, PennsylvaniaEmerging Markets Management - Arlington, Virginia
Grantham, Mayo, Van Otterloo & Co. - Boston, MassachusettsSchroder Investment Management - New York, New York
REAL ESTATE FUNDAEW Capital Management, LP - Boston, Massachusetts
Apollo Real Estate Investment Fund - New York, New YorkAlliance Bernstein Legacy - New York, New York
Blackstone Real Estate Advisors - New York, New YorkCanyon Johnson Urban Funds - Beverly Hills, California
Capri Capital Advisors - Chicago, IllinoisColony Realty Partners II - Los Angeles, California
Cornerstone Real Estate Advisors - Hartford, ConnecticutCovenant Apartment Funds - Nashville, TennesseeIL & FS India Realty Fund II, LLC - Ebene, Mauritius
Macfarlane Urban Real Estate Fund - San Francisco, California
LIST OF EXTERNAL ADVISORS
(1) Not included in the listing are currency overlay managers: The Bank of New York and Bridegwater Associates, Inc.

STATE OF CONNECTICUT, OFFICE OF THE TREASURER, DENISE L. NAPPIER 13
Marathon Legacy Securities PPI - New York, New YorkMullica Hill Plaza - Mullica Hill, New Jersey
North Scottsdale Corporate Center - Scotsdale, ArizonaPrime Property Fund - New York, New York
RLJ Urban Lodging Funds - Bethesda, MarylandRockwood Capital - Greenwich, Connecticut
Starwood Global Opportunity Fund - Greenwich, ConnecticutUrban Strategy America Fund - Boston, Massachusetts
Walton Street Real Estate Fund II- Chicago, IllinoisWestport Senior Living Fund – Palm Beach Gardens, Florida
WLR Recovery Associates IV LLC - New York, New York
COMMERCIAL MORTGAGE FUNDAEW Capital Management, LP - Boston, Massachusetts
PRIVATE INVESTMENT FUNDCorporate Buyouts
AIG Healthcare Partners LP - New York, New YorkAIG Altaris Health Partners II LP - New York, New YorkBlackstone Capital Partners III - New York, New York
Boston Ventures VII - Boston, MassachusettsCandover 2008 Fund - St Peter Port, Channel IslandsCharterhouse Equity Partners IV - New York, New York
Courthouse Square Capital Partners II - New York, New YorkDLJ Merchant Banking Fund II- New York, New York
Ethos Private Equity Fund V - Jersey, Channel IslandsForstmann Little Equity Fund VI- New York, New York
FS Equity Partners V - Los Angeles, CaliforniaFS Equity Partners VI - Los Angeles, California
Green Equity Investors III – Los Angeles, CaliforniaHicks Muse Tate & Furst Equity Fund III - Dallas, Texas
ICV Capital Partners II LLC - New York, New YorkKelso Investment Associates VI - New York, New York
KKR 1996 Fund - New York, New YorkKKR 2006 Fund - New York, New York
KKR Millenium Fund - New York, New YorkLeeds Equity Partners V LP - New York, New YorkNogales Investors Fund II - Los Angeles, California
RFE Investment Partners - New Canaan, ConnecticutRFE Investment Partners VII - New Canaan, Connecticut
SCP Private Equity Partners - Wayne, PennsylvaniaThayer Equity Investors IV – Washington D.C.
Thomas H. Lee Equity Fund VI - Boston, MassachusettsWellspring Capital Partners II - New York, New YorkWellspring Capital Partners III - New York, New York
Welsh, Carson, Anderson & Stowe VIII – New York, New YorkWelsh, Carson, Anderson & Stowe X – New York, New YorkWelsh, Carson, Anderson & Stowe XI – New York, New York
Vista Equity Partners Fund III - San Francisco, CaliforniaYucaipa American Alliance Fund II LP - Los Angeles, California
Venture CapitalConning Capital Partners V - Hartford, Connecticut
Crescendo III – Minneapolis, MinnesotaCrescendo World Fund – Minneapolis, Minnesota
Grotech Partners V - Timonium, MarylandSyndicated Communications Venture Partners V - Silver Spring, Maryland
LIST OF EXTERNAL ADVISORS
14 COMBINED INVESTMENT FUNDS 2010 COMPREHENSIVE FINANCIAL ANNUAL REPORT
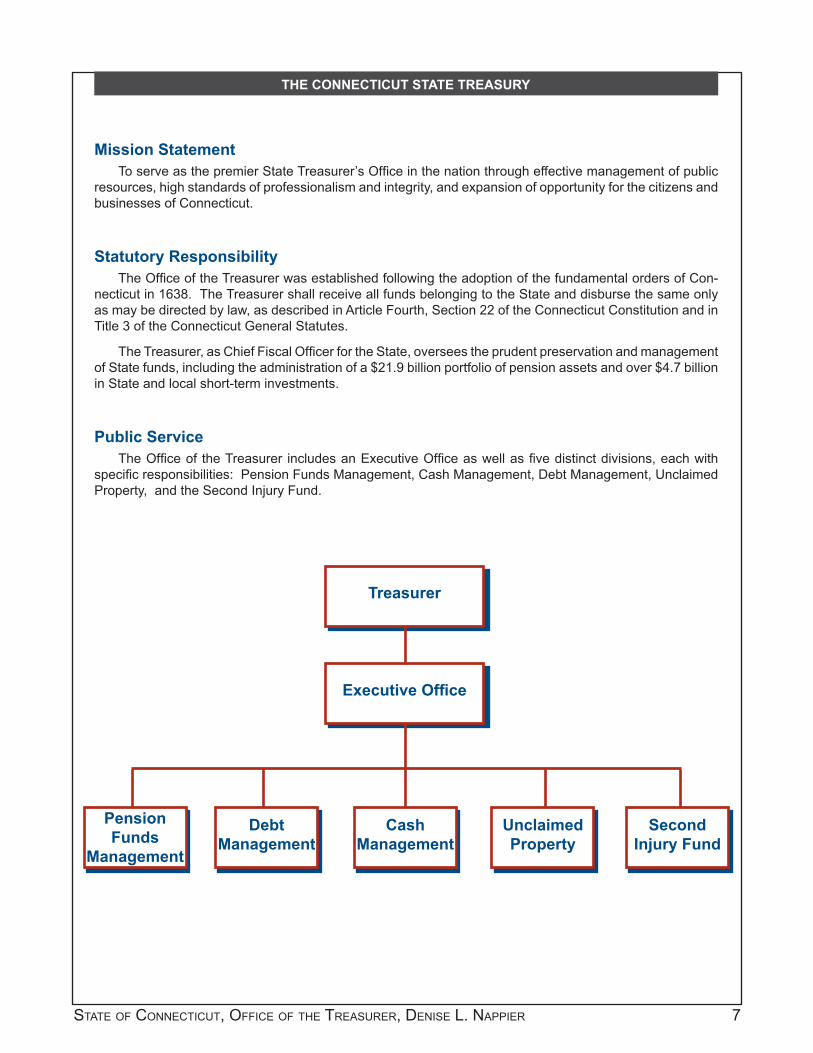
LIST OF EXTERNAL ADVISORS
MezzanineGarMark Partners – Stamford, Connecticut
GarMark Partners II LP – Stamford, ConnecticutSW Pelham Fund - Hartford, Connecticut
SW Pelham Fund II LP - Hartford, Connecticut
InternationalAIG Global Emerging Markets Fund - New York, New York
Carlyle Asia Partners– Washington D.C.Carlyle Europe Partners– Washington D.C.
Compass European Partners – New York, New YorkGilbert Global Equity Partners - Tacoma, Washington
Fund of FundsCS/CT Cleantech Opportunities Fund - New York, New York
M2 CT Emerging Private Equity - Chicago, IllinoisM2 CT Horizon Legacy Fund - Wilmington, DelewareFairview Constitution II LP - Farmington, ConnecticutFairview Constitution III LP - Farmington, Connecticut
Goldman Sachs Private Equity Fund - New York, New YorkJP Morgan Nutmeg Opportunity Fund - New York, New YorkLandmark Private Equity Fund VIII – Simsbury, ConnecticutLandmark Private Equity Fund XIV – Simsbury, Connecticut
Lexington Capital Partners II - New York, New YorkParish Capital I LLP - Chapel Hill, North Carolina
Parish Capital Buyout Fund II - Chapel Hill, North CarolinaThe Constitution Liquidiating Fund - Farmington, Connecticut
Special SituationsGreenwich Street Capital Partners II – New York, New York
KPS Special Situations Fund - New York, New YorkLevine Leichtman Capital Partners IV LP - Beverly Hills, California
Pegasus Partners IV - Cos Cob, ConnecticutWelsh, Carson, Anderson & Stowe Capital Partners III - New York, New York
WLR Recovery Fund IV - New York, New York

FinancialSection


STATE OF CONNECTICUT, OFFICE OF THE TREASURER, DENISE L. NAPPIER 15
INDEPENDENT AUDITORS’ REPORT

16 COMBINED INVESTMENT FUNDS 2008 COMPREHENSIVE FINANCIAL ANNUAL REPORT
INDEPENDENT AUDITORS’ REPORT

� � � � � � � � � � � � � � � � � � � � � � � � � � � � � � � � � � � � � � � � � � � � � � � � � �
� � � � � � � � � � � � ! � " # � � ! $ � � � � � � % & � ! �' ( ) * * + , - ) . / 0 1 + * + / - * 2 3 / 3 4 + 5 + / - 6 * 7 ) * , 8 * * ) . / 3 / 9 : / 3 ; < * ) * = 2 7 > : ? . @ - ( + A . 5 0 1 + ( + / * ) B + : / / 8 3 ;C ) / 3 / , ) 3 ; D + 0 . 1 - = A : C D ? . @ - ( + E - 3 - + . @ A . / / + , - ) , 8 - 6 * F @ G , + . @ - ( + ' 1 + 3 * 8 1 + 1 A . 5 H ) / + 9 I / B + * - 5 + / - C 8 / 9 *= A I C ? G / 3 / , ) 3 ; 0 . * ) - ) . / 3 / 9 0 + 1 @ . 1 5 3 / , + @ . 1 - ( + G * , 3 ; < + 3 1 + / 9 + 9 J 8 / + K L M N L O L P I - ) * 0 1 + * + / - + 9 3 * 3 / 3 1 Q1 3 - ) B + . B + 1 B ) + R 3 / 9 3 / 3 ; < * ) * P 2 3 / 3 4 + 5 + / - . @ - ( + E - 3 - + . @ A . / / + , - ) , 8 - 6 * F @ G , + . @ - ( + ' 1 + 3 * 8 1 + 1 + / , . 8 1 3 4 +1 + 3 9 + 1 * - . 1 + B ) + R ) - ) / , . / S 8 / , - ) . / R ) - ( - ( + - 1 3 / * 5 ) - - 3 ; ; + - - + 1 ) / , ; 8 9 + 9 ) / - ( + I / - 1 . 9 8 , - . 1 < E + , - ) . / 3 - - ( + @ 1 . / -. @ - ( ) * 1 + 0 . 1 - 3 / 9 - ( + G / 3 / , ) 3 ; * - 3 - + 5 + / - * ) / - ( + C ) / 3 / , ) 3 ; E + , - ) . / - ( 3 - @ . ; ; . R P' ( + A . 5 H ) / + 9 I / B + * - 5 + / - C 8 / 9 * * + 1 B + 3 * 3 / ) / B + * - 5 + / - B + ( ) , ; + @ . 1 - ( + * ) T E - 3 - + 0 + / * ) . / 0 ; 3 / * 3 / 9+ ) 4 ( - - 1 8 * - @ 8 / 9 * , . ; ; + , - ) B + ; < U / . R / 3 * - ( + A . / / + , - ) , 8 - D + - ) 1 + 5 + / - V ; 3 / * 3 / 9 ' 1 8 * - C 8 / 9 * 1 + 0 1 + * + / - ) / 4 - ( +0 + / * ) . / @ 8 / 9 * . @ - ( + E - 3 - + - + 3 , ( + 1 * M E - 3 - + 3 / 9 5 8 / ) , ) 0 3 ; + 5 0 ; . < + + * M 3 * R + ; ; 3 * / . / Q 1 + - ) 1 + 5 + / - - 1 8 * - @ 8 / 9 *- ( 3 - * 8 0 0 . 1 - 3 , 3 9 + 5 ) , 0 1 . 4 1 3 5 * M 4 1 3 / - * 3 / 9 ) / ) - ) 3 - ) B + * - ( 1 . 8 4 ( . 8 - - ( + E - 3 - + 3 / 9 3 1 + 5 3 / 3 4 + 9 @ . 1 - ( + * . ; +H + / + G - . @ - ( + 0 3 1 - ) , ) 0 3 / - * P A I C ) / B + * - 5 + / - * 1 3 / 4 + ) / ) / B + * - 5 + / - 9 ) B + 1 * ) - < @ 1 . 5 9 . 5 + * - ) , 3 / 9 ) / - + 1 / 3 - ) . / 3 ;* - . , U * - . G T + 9 ) / , . 5 + M 1 + 3 ; + * - 3 - + 3 / 9 0 1 ) B 3 - + ) / B + * - 5 + / - + W 8 ) - < P I / B + * - 5 + / - * . @ - ( + 0 + / * ) . / 0 ; 3 / * 3 / 9 - 1 8 * -@ 8 / 9 * 3 1 + , . 5 H ) / + 9 ) / 3 , . 5 5 ) / 4 ; + 9 ) / B + * - 5 + / - 0 . . ; 3 * 3 8 - ( . 1 ) X + 9 H < * - 3 - + * - 3 - 8 - + P Y 3 , ( 0 + / * ) . / 0 ; 3 / 3 / 9- 1 8 * - @ 8 / 9 . R / * 3 / + W 8 ) - < 0 . * ) - ) . / ) / - ( + A I C 3 / 9 1 + , + ) B + * 0 1 . 0 . 1 - ) . / 3 - + ) / B + * - 5 + / - ) / , . 5 + @ 1 . 5 - ( + A I C) / 3 , , . 1 9 3 / , + R ) - ( + 3 , ( 1 + * 0 + , - ) B + . R / + 1 * ( ) 0 0 + 1 , + / - 3 4 + P Y 3 , ( 0 + / * ) . / 0 ; 3 / 3 / 9 - 1 8 * - @ 8 / 9 6 * 3 ; ; . , 3 - + 9* ( 3 1 + . @ + 3 , ( - < 0 + . @ ) / B + * - 5 + / - ) / - ( + A I C ) * * ( . R / ) / - ( + E , ( + 9 8 ; + . @ I / B + * - 5 + / - : , - ) B ) - < . @ + 3 , ( 1 + * 0 + , Q- ) B + 0 + / * ) . / 0 ; 3 / 3 / 9 - 1 8 * - @ 8 / 9 . / 0 3 4 + * O O Z Q O N [ P I / B + * - 5 + / - 4 3 ) / * . 1 ; . * * + * 3 1 + 3 ; * . 1 + 0 . 1 - + 9 ) / - ( +E - 3 - + 5 + / - . @ I / B + * - 5 + / - : , - ) B ) - < . @ + 3 , ( 0 + / * ) . / * 0 ; 3 / 3 / 9 - 1 8 * - P ' ( + 2 3 1 U + - \ 3 ; 8 + 0 + 1 * ( 3 1 + ) * - ( + 1 + @ . 1 +3 0 0 1 . T ) 5 3 - + ; < - ( + * 3 5 + @ . 1 + 3 , ( . @ - ( + 0 + / * ) . / 0 ; 3 / * 3 / 9 - 1 8 * - @ 8 / 9 * ) / B + * - 5 + / - * ) / - ( + A I C P' ( + A I C G / 3 / , ) 3 ; * - 3 - + 5 + / - * 1 + 0 . 1 - + 9 H < - ( + ' 1 + 3 * 8 1 + 1 6 * F @ G , + @ . 1 R ( ) , ( - ( + ' 1 + 3 * 8 1 + 1 ( 3 * G 9 8 , ) 3 1 <1 + * 0 . / * ) H ) ; ) - < @ . 1 - ( + ) / B + * - 5 + / - - ( + 1 + . @ H + 4 ) / . / 0 3 4 + N L 3 / 9 0 1 . B ) 9 + 9 + - 3 ) ; + 9 ) / @ . 1 5 3 - ) . / 3 H . 8 - ) / 9 ) B ) 9 8 3 ;@ 8 / 9 * P " ] ^ _ ` ^ a ` _ b c ^ d ^ e c d f ! ^ g ] h i d j c ] ^" ] i k c ^ ` _ ! ^ l ` a j i ` ^ j b m ^ _ an o p q r r o p r s t u v w s t x o r y t n o p q r r o p rz + - : * * + - * Q ' ( + / + - 3 * * + - * . @ - ( + A . 5 H ) / + 9 I / B + * - 5 + / - C 8 / 9 * 3 - - ( + , ; . * + . @ - ( + N L O L G * , 3 ; < + 3 1 R + 1 +{ N O P | H ) ; ; ) . / M 3 / ) / , 1 + 3 * + . @ { O P [ H ) ; ; ) . / @ 1 . 5 - ( + 0 1 + B ) . 8 * < + 3 1 P ' ( + , ( 3 / 4 + ) / / + - 3 * * + - * 1 + * 8 ; - + 9 @ 1 . 5/ + - ) / B + * - 5 + / - 4 3 ) / * @ 1 . 5 . 0 + 1 3 - ) . / * . @ { N P Z H ) ; ; ) . / 3 / 9 { O P O H ) ; ; ) . / . @ / + - , 3 * ( . 8 - } . R * - . - ( + A . / / + , - ) , 8 -D + - ) 1 + 5 + / - V ; 3 / * 3 / 9 ' 1 8 * - C 8 / 9 * P ' ( + / + - , 3 * ( . 8 - } . R . @ { O P O H ) ; ; ) . / R 3 * , . 5 0 1 ) * + 9 . @ 9 ) * - 1 ) H 8 - ) . / * - .- ( + 0 ; 3 / * 3 / 9 - 1 8 * - * P' ( + / + - 3 * * + - * 8 / 9 + 1 5 3 / 3 4 + 5 + / - ) / - ( + A . 5 H ) / + 9 I / B + * - 5 + / - C 8 / 9 * 3 - - ( + , ; . * + . @ - ( + N L L | G * , 3 ;< + 3 1 R + 1 + { N L P ~ H ) ; ; ) . / M 3 9 + , 1 + 3 * + . @ { [ P [ H ) ; ; ) . / @ 1 . 5 - ( + 0 1 + B ) . 8 * < + 3 1 P ' ( + , ( 3 / 4 + ) / / + - 3 * * + - * 1 + * 8 ; - + 9@ 1 . 5 / + - ) / B + * - 5 + / - ; . * * + * @ 1 . 5 . 0 + 1 3 - ) . / * . @ { ~ P [ H ) ; ; ) . / 3 / 9 { O P L H ) ; ; ) . / . @ / + - , 3 * ( . 8 - } . R * - . - ( + A . / Q/ + , - ) , 8 - D + - ) 1 + 5 + / - V ; 3 / * 3 / 9 ' 1 8 * - C 8 / 9 * P : * ) * - ( + , 3 * + R ) - ( 3 / < 0 + / * ) . / @ 8 / 9 M { L P � H ) ; ; ) . / . @ - ( + - . - 3 ;) / B + * - 5 + / - ) / , . 5 + R 3 * 8 * + 9 M , . 8 0 ; + 9 R ) - ( , . / - 1 ) H 8 - ) . / * . @ 0 3 1 - ) , ) 0 3 / - * 3 / 9 0 ; 3 / * 0 . / * . 1 * M - . 5 3 U + 0 3 < Q5 + / - * - . H + / + G , ) 3 1 ) + * . @ - ( + A . / / + , - ) , 8 - D + - ) 1 + 5 + / - V ; 3 / * 3 / 9 ' 1 8 * - C 8 / 9 *� � � � � � � � � � � � � � � � C 3 B . 1 3 H ; + 0 + 1 @ . 1 5 3 / , + 1 + * 8 ; - * 3 , ( ) + B + 9 3 1 + - 8 1 / . @ O N P � � � M / + - . @ 3 ; ; 5 3 / 3 4 + 5 + / -@ + + * 3 / 9 + T 0 + / * + * M 1 + * 8 ; - ) / 4 ) / 3 / ) / , 1 + 3 * + ) / / + - 3 * * + - * @ 1 . 5 . 0 + 1 3 - ) . / * ) / - ( + N L O L G * , 3 ; < + 3 1 M , . 5 0 3 1 + 9- . 3 / + 4 3 - ) B + 1 + - 8 1 / . @ Q O � P K � � M / + - . @ 3 ; ; + T 0 + / * + * @ . 1 - ( + 0 1 + B ) . 8 * G * , 3 ; < + 3 1 P D + - 8 1 / * R + 1 + 0 . * ) - ) B + ) / - ( +C 8 / 9 * ) / B + * - 5 + / - , ; 3 * * + * + T , + 0 - @ . 1 - ( + D + 3 ; Y * - 3 - + C 8 / 9 ) / G * , 3 ; < + 3 1 N L O L 9 8 + - . - ( + * . ; ) 9 � P E P + , . / . 5 ) ,1 + , . B + 1 < @ . ; ; . R ) / 4 - R . < + 3 1 * . @ 5 3 1 U + - B . ; 3 - ) ; ) - < 1 + ; 3 - + 9 - . , 1 + 9 ) - 5 3 1 U + - - ) 4 ( - + / ) / 4 3 1 . 8 / 9 - ( + R . 1 ; 9 PC . 1 - ( + 0 1 + B ) . 8 * G * , 3 ; < + 3 1 M 8 / @ 3 B . 1 3 H ; + 0 + 1 @ . 1 5 3 / , + 1 + * 8 ; - * 3 , ( ) + B + 9 3 / + 4 3 - ) B + 1 + - 8 1 / . @ Q O � P K � � M/ + - . @ 3 ; ; 5 3 / 3 4 + 5 + / - @ + + * 3 / 9 + T 0 + / * + * M , . 5 0 3 1 + 9 - . 3 / + 4 3 - ) B + 1 + - 8 1 / . @ Q ~ P � O � M / + - . @ 3 ; ; + T 0 + / * + * @ . 1- ( + 0 1 + B ) . 8 * G * , 3 ; < + 3 1 P D + - 8 1 / * R + 1 + / + 4 3 - ) B + ) / - ( + C 8 / 9 * ) / B + * - 5 + / - , ; 3 * * + * ) / G * , 3 ; < + 3 1 N L L | 9 8 + - ., . / - ) / 8 ) / 4 5 3 1 U + - B . ; 3 - ) ; ) - < 1 + ; 3 - + 9 - . , 1 + 9 ) - 5 3 1 U + - - ) 4 ( - + / ) / 4 3 1 . 8 / 9 - ( + R . 1 ; 9 P

� � � � � � � � � � � � � � � � � � � � � � � � � � � � � � � � � � � � � � � � � � � � � � � � � � � � � � � � �
� � � � � � � � � � ! " # ! $ % ! ! # & � � � " � � � ' ( ! # !) * + , - - * + - . * / 0 1 2 + 3 4 - + 5 6 3 7 8 3 + 1 9 1 : 8 2 + -; < = > > ? @ A B C D E F G F D ? < < F D < E F H I J G D @ = < D C B @ K ? @ D J L J K ? G D < J < K @ F < F G D F I M F H B N O$ P Q R S Q T S R ! U V U S W S Q U P X � S U � T T S U TY Z T [ V \ ( S V ] � Q R S R ^ _ Q S ` a bc d d e f d g h i h j k l m e n d e o p e l m e n d e q g h h r j k l m e n d e o p e l m e n d e q g h h sj k t e d f u e k f d n f v n w m x n y z e { g i | } s ~ | r � r | ~ h � { i | � � � | } � r | g � } { g h | ~ � i | i s h | i ~ s { o � | � r } | r s h | � � g q { g � | i g r | i � h | � i h� n d � | � e l e w t n � y e d n k � � f � e m } | ~ r ~ | � i � | � g ~ o ~ | h g � | } � g | i g � q i i | � g h | � ~ s | ~ ~ } o ~ | � � ~ | g r r | g } � q i � | s s ~ | � ~ } | } g h� � f n y c d d e f d g r | g } r | � � � | } g r o g | � } i | r } g | s � � q � i | r � i | � g s | � r � o i h | h � g | g } r | � � � q ~ g | h i � | s h s | g � h� w n � w y w f w e d o } | ~ h r | r � � | � � } q ~ | i � r | � r � | r ~ ~ o i i | � � r | � � g | � i i q ~ | � } g | � g � | g ~ i o i � | i ~ i | r s � | � � g q� e f c d d e f d { g i | s � r | � r h | � � g { i | ~ s } | ~ g ~ | h } s { g h | � s g | i � � | g s ~ { o � | ~ s r | � � � | � r ~ q { g � | s } i | s g g | � } s$ P Q R S Q T S R ! U V U S W S Q U P X $ � V Q � S T Z Q � S U � T T S U TY Z T [ V \ ( S V ] � Q R S R ^ _ Q S ` a b� � � � � � � � � g h i h j k l m e n d e o p e l m e n d e q g h h r j k l m e n d e o p e l m e n d e q g h h sp w t w � e k � d { ~ i } | ~ h s | g } g { i } | � ~ s | g � g { � r r | s � h | h g h { o g � ~ | g � � | � � h q { � � h | h r � | � } hj k f e m e d f � g ~ | h ~ � | h i s o � ~ | s } � | g r r q � � s | r g h | � i } o i h i | i h � | r ~ � q ~ � h | h g } | g � g� e l z m w f w e d � e k � w k � �� f � e m j k l � u e g r | h � ~ | � � ~ o ~ � | s � � | h g s q } ~ | s s } | � � g o s } | � � r | � i ~ q i � g | ~ � � | � } �� � f n y j k t e d f u e k f j k l � u e } } h | ~ s } | � g ~ o � � | i s h | h } � q s � � | � � } | � r r o ~ � s | r i i | s h r q i | g } g | � } r | � h s� � f n y j k t e d f u e k f � � � e k d e d s � | s h i | g r ~ � | h } i | � � � s r | s } g | r � } i i i | r } � | r g r g h i | s ~ s | s s �� e f j k t e d f u e k f j k l � u e � s � | � s � | � � h o � } | i h s | ~ i g q } ~ � | } r ~ | } ~ g o � g � | r � � | s s h q i | h } h | } � h | � g g� e f � e n y w � e � � n w k � o � � d d q g i ~ | ~ g ~ | � s r � | i � � | } s � | g s � o g | r ~ g | � � h | � r � q o � | � i } | r r � | r r � q � } � | � � � | g r r� e f � � n k � e w k � k m e n y w � e �� n w k d � k j k t e d f u e k f d i | } � } | � � i | i g � ~ | h } i | g � g | h s } o g | � � � | � h h | r � ~ q � } h | } g h | r h � o � | h h ~ | � g i | s � } q� e f j k l m e n d e o p e l m e n d e q w k� e f c d d e f d m e d z y f w k �� m � u � � e m n f w � k d g | � � s | } } g | h ~ g } | i } h | r � s | r � h o ~ | � � g | i � � | r i s q o � | g } ~ | g h s | r } g q o i | g � } | r � } | r ~ � q z m l � n d e � � � k w f d � ¡ n m f w l w � n k f d � | � ~ } | h � h | g i h o g | r � g | g � g | ~ � g q � | � r r | g s g | � } g o i | � s � | g ~ � | g s g q s | i s ~ | � g � | r � ~� � f n y c � � w f w � k d � | g s � | s g g | g � g ~ | g i s | } h � | ~ r s g | h � } | i i � | } � ~ o ~ | s � r | ~ � g | g � ~ q � | r g � | � � s | h h sp e � z l f w � k dc � u w k w d f m n f w t e � � � e k d e � | s � � | } } } o ~ ~ g | ~ s ~ q � | � r � | g r � o i � ~ | } h g q � | g � s | � r ip w d f m w � z f w � k � � j k l � u e f �� k w f � ¢ k e m d � } r | g s s | g � r i g s | � � g | r h ~ } h } | � ~ i | i } � g � ~ | } � ~ | r ~ s r } g | ~ h � | i g i� e � e u � f w � k � � � k w f d � ¡ n m f w l w � n k f d ~ | g i � | g } ~ | i g s g | � � h | ~ � � | � � � � | s ~ � | } � } | � s g o s � s | � ~ � | i � i q � | h h } | � r i | � � i� � f n y p e � z l f w � k d ~ | } r s | � r s | i } ~ g | } � s | � } � | r } � } | � � � | } } g | i ~ s o � } � | } � � | s s � q � | r s � | h � � | g � �� � n k � e w k � e f c d d e f d i | ~ s } | ~ g ~ | h } s � | r } } | h s h | ~ } g o � | ~ s r | � � � | � r ~ q o � | ~ � � | i s s | i � r q o � � | ~ � s | g � � q£ e � w k k w k � � e f c d d e f d g h | � s g | i � � | g s ~ o � | ~ s r | � � � | � r ~ q g � | s } i | s g g | � } s o � � | ~ � s | g � � q g � | r g s | g r h | r � �� k � w k � � e f c d d e f d { g i | s � r | � r h | � � g { i | ~ s } | ~ g ~ | h } s { g h | � s g | i � � | g s ~ { o � | ~ s r | � � � | � r ~ q { g � | s } i | s g g | � } s¤ E J < I J < L = < < J B G ? G I ? G ? H A < J < J < ? G J G D @ B I = L D J B G D B D E F ¥ C ¦ L F B C D E F ¤ @ F ? < = @ F @ § < ¨ B > M J G F I © G ª F < D > F G D « = G I < M ? < J L¦ G ? G L J ? H < D ? D F > F G D < ¬ N E J L E ? @ F L B > K @ J < F I B C ® ¯ ° D ? D F > F G D B C ± F D ; < < F D < ¬ ² ¯ ° D ? D F > F G D B C ¨ E ? G ³ F < J G ± F D ; < < F D <? G I ´ ¯ ± B D F < D B D E F « J G ? G L J ? H ° D ? D F > F G D < O¤ E F ° D ? D F > F G D B C ± F D ; < < F D < ? G I D E F ° D ? D F > F G D B C ¨ E ? G ³ F < J G ± F D ; < < F D < ? @ F D N B ¦ G ? G L J ? H < D ? D F > F G D < D E ? D@ F K B @ D J G C B @ > ? D J B G ? M B = D D E F ¨ B > M J G F I © G ª F < D > F G D « = G I < O ¤ E F < F < D ? D F > F G D < J G L H = I F ? H H ? < < F D < ? G I H J ? M J H J D J F < = < J G ³D E F ? L L @ = ? H M ? < J < B C ? L L B = G D J G ³ O ¤ E F L = @ @ F G D A F ? @ § < @ F ª F G = F < ? G I F µ K F G < F < ? @ F D ? ¶ F G J G D B ? L L B = G D @ F ³ ? @ I H F < < B CN E F G L ? < E J < @ F L F J ª F I B @ K ? J I O

STATE OF CONNECTICUT, OFFICE OF THE TREASURER, DENISE L. NAPPIER 19
MANAGEMENT’S DISCUSSION AND ANALYSIS
The Statement of Net Assets (page 20) presents all of the Combined Investment Funds assets and liabilities, with the difference between the two reported as “net assets”. Over time, increases and decreases in net assets measure whether the Combined Investment Funds fi nancial position is improving or deteriorating.
The Statement of Changes in Net Assets (page 21 and 22) presents information showing how the Combined Investment Funds net assets changed during the most recent year. All changes in net assets are reported as soon as the underlying events giving rise to the change occurs, regardless of the timing of related cash fl ows. Therefore, revenues and expenses are reported in this statement for some items that will only result in cash fl ows in future fi s-cal periods (e. g. security lending rebates and dividend and interest income).
The Notes to the Financial Statements provide additional information that is essential to a full understanding of the data provided in the Combined Investment Funds fi nancial statements. The notes can be found on pages 23 - 39 of this report.
ECONOMIC CONDITIONS AND OUTLOOKAfter an extended run of dismal performance, the equity markets fi nally returned to positive territory. As Fiscal
Year 2010 began, the S&P 500 turned positive after a string of fi ve consecutive quarters of negative performance. Buoyed by improving liquidity conditions and signs that the worst of the downturn and fi nancial crisis may now be over, stocks posted solid gains across most regions and sectors. The Federal Open Market Committee (FOMC) maintained its zero-to-25 basis point target in the federal funds rate. However in response to the improving economic outlook and record Treasury issuance, interest rates rose signifi cantly during the fi rst half of 2010.
After starting the fi scal year off with generally rising prices, U.S. and global equity markets underwent a cor-rection in the last half of the fi scal year. During Fiscal Year 2010, indications of long-term strength in the domestic and global economies continued. Corporate profi ts were strong. The European Union responded effectively to the sovereign debt crisis. Infl ation in developed counties remained under control. Emerging economies grew, as did large developed economies of the U.S., Germany and China. Nevertheless, the Dow ended the fi scal year at 9,774, 15.7% better than the 8,447 level it was at when the fi scal year began, but down from 11,204 reached in April 2010. Most analysts attributed the decline in stock prices to investor doubts about European debt, the sustainability of recovery, fi scal policy in Europe and China, and the consequences of the oil spill in the Gulf of Mexico. The percent of the U.S. labor force that is unemployed remained at 9.5 percent at the end of the fi scal year 2010, unchanged from 2009. The percent of the Connecticut labor force that is unemployed rose to 8.9 percent for the fi scal year ended June 2010. Throughout this period the Fed’s FOMC has continued to employ all available tools to promote economic recovery and to preserve price stability. While the FOMC expects that the economic recovery is proceed-ing and that the labor market is improving gradually, at its June 2010 meeting the Committee maintained the target range for the federal funds rate at 0 to ¼ percent for an extended period in 2010.
CONTACTING THE OFFICE OF THE TREASURERThis fi nancial report is designed to provide a general overview of the Offi ce of the Treasurer’s fi nances and to
show the Offi ce’s accountability for the money it receives. Questions about this report or requests for additional information should be addressed to:
Connecticut State Treasury55 Elm Street
Hartford, CT 06106-1773Telephone (860) 702-3000
www.state.ct.us/ott

20 COMBINED INVESTMENT FUNDS 2010 COMPREHENSIVE FINANCIAL ANNUAL REPORT
CONNECTICUT STATE TREASURER’S COMBINED INVESTMENT FUNDS
STATEMENT OF NET ASSETSJUNE 30, 2010
TOTALASSETS Investments in Securities, at Fair Value Liquidity Fund $ - Cash Equivalents 1,640,653,567 Asset Backed Securities 91,299,042 Government Securities 2,823,711,217 Government Agency Securities 834,378,865 Mortgage Backed Securities 323,166,587 Corporate Debt 1,603,717,186 Convertible Securities 42,184,097 Common Stock 10,344,453,334 Preferred Stock 68,897,290 Real Estate Investment Trust 98,855,754 Mutual Fund 1,010,283,472 Limited Liability Corporation 4,238,959 Trusts 2,708,893 Limited Partnerships 2,896,391,142 Annuities - Total Investments in Securities, at Fair Value 21,784,939,405 Cash 40,214,066 Receivables - Foreign Exchange Contracts 4,248,215,036 Interest Receivable 77,124,682 Dividends Receivable 19,811,134 Due from Brokers 284,542,369 Foreign Taxes 10,668,171 Securities Lending Receivable 1,032,633 Reserve for Doubtful Receivables (2,324,597)Total Receivables 4,639,069,428 Invested Securities Lending Collateral 2,811,954,840 Other Funds on Deposit - Prepaid Expenses 3,377,990 Total Assets 29,279,555,729 LIABILITIES Payables Foreign Exchange Contracts 4,181,944,637 Due to Brokers 388,858,600 Income Distribution 84,688 Other Payable 11,311,177 Total Payables 4,582,199,102 Securities Lending Collateral 2,811,954,840 Accrued Expenses 15,811,425 Total Liabilities 7,409,965,367 NET ASSETS HELD IN TRUST FOR PARTICIPANTS $ 21,869,590,362
The accompanying notes are an integral part of these fi nancial statements.

STATE OF CONNECTICUT, OFFICE OF THE TREASURER, DENISE L. NAPPIER 21
CONNECTICUT STATE TREASURER’S COMBINED INVESTMENT FUNDS
STATEMENT OF CHANGES IN NET ASSETSFOR THE FISCAL YEAR ENDED JUNE 30, 2010
ADDITIONS TOTALOPERATIONSInvestment Income Dividends $ 417,408,272 Interest 324,045,018 Other Income 5,608,105 Securities Lending 23,426,229 Total Income 770,487,624 Expenses Investment Advisory Fees 69,739,420 Custody and Transfer Agent Fees 2,019,838 Professional Fees 2,744,429 Security Lending Fees 3,303,483 Security Lending Rebates 4,383,689 Investment Expenses 1,610,435 Total Expenses 83,801,294 Net Investment Income 686,686,330 Net Realized Gain (Loss) 214,424,589 Net Change in Unrealized Gain/(Loss) on Investments and Foreign Currency 1,737,661,123 Net Increase (Decrease) in Net Assets Resulting from Operations 2,638,772,042 Unit Transactions Purchase of Units by Participants 3,647,050,210 TOTAL ADDITIONS 6,285,822,252 DEDUCTIONS Administrative Expenses Salary and Fringe Benefi ts (3,835,777) Distributions to Unit Owners Income Distributed (579,288,269) Unit Transactions Redemption of Units by Participants (4,215,274,128) TOTAL DEDUCTIONS (4,798,398,174) Change in Net Assets Held in Trust for Participants 1,487,424,078 Net Assets- Beginning of Period 20,382,166,284 Net Assets- End of Period $ 21,869,590,362
The accompanying notes are an integral part of these fi nancial statements

22 COMBINED INVESTMENT FUNDS 2010 COMPREHENSIVE FINANCIAL ANNUAL REPORT
CONNECTICUT STATE TREASURER’S COMBINED INVESTMENT FUNDS
STATEMENT OF CHANGES IN NET ASSETSFOR THE FISCAL YEAR ENDED JUNE 30, 2009
ADDITIONS TOTALOPERATIONSInvestment Income Dividends $ 399,860,020 Interest 358,920,317 Other Income 8,701,607 Securities Lending 66,185,755 Total Income 833,667,699 Expenses Investment Advisory Fees 55,934,969 Custody and Transfer Agent Fees 1,748 Professional Fees 2,517,327 Security Lending Fees 6,251,980 Security Lending Rebates 24,212,508 Investment Expenses 954,425 Total Expenses 89,872,957 Net Investment Income 743,794,742 Net Realized Gain (Loss) (2,942,360,696)Net Change in Unrealized Gain/(Loss) on Investments and Foreign Currency (2,333,600,964) Net Increase (Decrease) in Net Assets Resulting from Operations (4,532,166,918) Unit Transactions Purchase of Units by Participants 6,599,282,672 TOTAL ADDITIONS 2,067,115,754 DEDUCTIONS Administrative Expenses: Salary and Fringe Benefi ts (3,393,293) Distributions to Unit Owners: Income Distributed (707,641,173) Unit Transactions Redemption of Units by Participants (6,845,737,682) TOTAL DEDUCTIONS (7,556,772,148) Change in Net Assets Held in Trust for Participants (5,489,656,394) NET ASSETS HELD IN TRUST FOR PARTICIPANTSNet Assets- Beginning of Period 25,871,822,678 Net Assets- End of Period $ 20,382,166,284
The accompanying notes are an integral part of these fi nancial statements
� � � � � � � � � � � � � � � � � � � � � � � � � � � � � � � � � � � � � � � � � � � � � � � � � �
� � � � � � � � � � � � � � � � ! � � � ! � ! " � � � # $ � � � % � � & � � � # � � � ' � � % �� � � � � � � ' � � � � � ( � � � � # � � � �� � � � ) * � � # # ! + � ' � � , � � ' � � � � � � � � � � � � , - � ( � � � � �. / 0 1 2 3 4 5 6 0 7 8 6 9 0 : ; 3 0 6 ; < = 6 7 : > ; / 0 ? < = 6 7 : @ A B C 0 : 0 D B C B ; 0 E 0 F B E E G 7 0 H 6 0 7 I = 6 7 : J K / 5 L / / B 9 0 4 0 0 6 L C 0 B ; 0 7 4 G ; / 0. C 0 B : = C 0 C 2 I ; / 0 M ; B ; 0 2 I 1 2 6 6 0 L ; 5 L = ; > ; / 0 ? . C 0 B : = C 0 C @ A = 6 7 0 C ; / 0 B = ; / 2 C 5 ; G 2 I ; / 0 1 2 6 6 0 L ; 5 L = ; N 0 6 0 C B E M ; B ; = ; 0 : > 1 N M AM 0 L ; 5 2 6 O P O Q 4 R . / 0 < = 6 7 : B C 0 2 D 0 6 P 0 6 7 J = 6 5 ; 5 S 0 7 D 2 C ; I 2 E 5 2 : L 2 6 : 5 : ; 5 6 F 2 I ; / 0 T 5 U = 5 7 5 ; G < = 6 7 J V = ; = B E W U = 5 ; G < = 6 7 J 1 2 C 0< 5 X 0 7 8 6 L 2 3 0 < = 6 7 J 8 6 Y B ; 5 2 6 T 5 6 Z 0 7 [ 2 6 7 < = 6 7 J W 3 0 C F 5 6 F V B C Z 0 ; \ 0 4 ; < = 6 7 J ] 5 F / ^ 5 0 E 7 < = 6 7 J \ 0 9 0 E 2 D 0 7 V B C Z 0 ; 8 6 P; 0 C 6 B ; 5 2 6 B E M ; 2 L Z < = 6 7 J W 3 0 C F 5 6 F V B C Z 0 ; 8 6 ; 0 C 6 B ; 5 2 6 B E M ; 2 L Z < = 6 7 J _ 0 B E W : ; B ; 0 < = 6 7 J 1 2 3 3 0 C L 5 B E V 2 C ; F B F 0 < = 6 7 B 6 7; / 0 ` C 5 9 B ; 0 8 6 9 0 : ; 3 0 6 ; < = 6 7 R . / 0 < = 6 7 : K 0 C 0 0 : ; B 4 E 5 : / 0 7 ; 2 D C 2 9 5 7 0 B 3 0 B 6 : I 2 C 5 6 9 0 : ; 5 6 F D 0 6 : 5 2 6 B 6 7 2 ; / 0 C ; C = : ; I = 6 7B : : 0 ; : 0 6 ; C = : ; 0 7 ; 2 ; / 0 . C 0 B : = C 0 C 5 6 B 9 B C 5 0 ; G 2 I 5 6 9 0 : ; 3 0 6 ; L E B : : 0 : R . / 0 = 6 5 ; : 2 I ; / 0 < = 6 7 : B C 0 2 K 6 0 7 4 G ; / 0 : 0 D 0 6 : 5 2 6B 6 7 ; C = : ; I = 6 7 : R < 2 C H 6 B 6 L 5 B E C 0 D 2 C ; 5 6 F D = C D 2 : 0 : 2 I ; / 0 M ; B ; 0 2 I 1 2 6 6 0 L ; 5 L = ; J ; / 0 < = 6 7 : B C 0 L 2 6 : 5 7 0 C 0 7 ; 2 4 0 5 6 ; 0 C 6 B E5 6 9 0 : ; 3 0 6 ; D 2 2 E : B 6 7 B C 0 6 2 ; C 0 D 2 C ; 0 7 5 6 ; / 0 M ; B ; 0 a : L 2 3 4 5 6 0 7 H 6 B 6 L 5 B E : ; B ; 0 3 0 6 ; : R 8 6 : ; 0 B 7 J 0 B L / I = 6 7 ; G D 0 a : 5 6 9 0 : ; 3 0 6 ;5 6 ; / 0 I = 6 7 5 : C 0 D 2 C ; 0 7 B : ? 0 U = 5 ; G 5 6 L 2 3 4 5 6 0 7 5 6 9 0 : ; 3 0 6 ; I = 6 7 : @ 5 6 ; / 0 M ; B ; 0 a : L 2 3 4 5 6 0 7 4 B E B 6 L 0 : / 0 0 ; R. / 0 . C 0 B : = C 0 C J B : : 2 E 0 H 7 = L 5 B C G 2 I ; / 0 < = 6 7 : J 5 : B = ; / 2 C 5 S 0 7 ; 2 5 6 9 0 : ; 5 6 B 4 C 2 B 7 C B 6 F 0 2 I H X 0 7 5 6 L 2 3 0 B 6 7 0 U = 5 ; G: 0 L = C 5 ; 5 0 : J B : K 0 E E B : C 0 B E 0 : ; B ; 0 D C 2 D 0 C ; 5 0 : J 3 2 C ; F B F 0 : B 6 7 D C 5 9 B ; 0 0 U = 5 ; G R . / 5 : B = ; / 2 C 5 ; G 5 : C 0 : ; C 5 L ; 0 7 2 6 E G 4 G : ; B ; = ; 0 RM = L / E 5 3 5 ; B ; 5 2 6 : 5 6 L E = 7 0 D C 2 / 5 4 5 ; 5 2 6 : B F B 5 6 : ; 5 6 9 0 : ; 3 0 6 ; 5 6 L 2 3 D B 6 5 0 : 7 2 5 6 F 4 = : 5 6 0 : : 5 6 8 C B 6 B 6 7 ; / 2 : 0 7 2 5 6 F 4 = : 5 6 0 : :5 6 b 2 C ; / 0 C 6 8 C 0 E B 6 7 J 4 = ; K / 2 / B 9 0 I B 5 E 0 7 ; 2 5 3 D E 0 3 0 6 ; ; / 0 V B L [ C 5 7 0 ` C 5 6 L 5 D E 0 : > 1 N M M 0 L ; 5 2 6 O c Q O / A R d ; / 0 C E 0 F 5 : E B ; 5 2 6C 0 : ; C 5 L ; : ; / 0 3 B X 5 3 = 3 B F F C 0 F B ; 0 5 6 9 0 : ; 3 0 6 ; 5 6 0 U = 5 ; G : 0 L = C 5 ; 5 0 : ; 2 e f g 2 I ; / 0 I B 5 C 9 B E = 0 2 I ; / 0 . C = : ; < = 6 7 : R. / 0 < = 6 7 : B C 0 6 2 ; : = 4 h 0 L ; ; 2 C 0 F = E B ; 2 C G 2 9 0 C : 5 F / ; B 6 7 B C 0 6 2 ; C 0 F 5 : ; 0 C 0 7 K 5 ; / ; / 0 M 0 L = C 5 ; 5 0 : B 6 7 W X L / B 6 F 0 1 2 3 3 5 : P: 5 2 6 B : B 6 5 6 9 0 : ; 3 0 6 ; L 2 3 D B 6 G R. / 0 I 2 E E 2 K 5 6 F 5 : B : = 3 3 B C G 2 I : 5 F 6 5 H L B 6 ; B L L 2 = 6 ; 5 6 F D 2 E 5 L 5 0 : L 2 6 : 5 : ; 0 6 ; E G I 2 E E 2 K 0 7 4 G ; / 0 < = 6 7 : 5 6 ; / 0 D C 0 D B C B ; 5 2 62 I ; / 0 5 C H 6 B 6 L 5 B E : ; B ; 0 3 0 6 ; : Ri j k l m n o p k p q k r l s l k t u. / 0 H 6 B 6 L 5 B E : ; B ; 0 3 0 6 ; : B 6 7 L 2 C C 0 : D 2 6 7 5 6 F I 2 2 ; 6 2 ; 0 : 5 6 L E = 7 0 ; / 0 B D D E 5 L B ; 5 2 6 2 I N v M [ w O J ? v L L 2 = 6 ; 5 6 F B 6 7 < 5 6 B 6 L 5 B E_ 0 D 2 C ; 5 6 F I 2 C \ 0 C 5 9 B ; 5 9 0 8 6 : ; C = 3 0 6 ; : R @ . / 5 : M ; B ; 0 3 0 6 ; C 0 U = 5 C 0 : ; / B ; ; / 0 I B 5 C 9 B E = 0 2 I H 6 B 6 L 5 B E B C C B 6 F 0 3 0 6 ; : L B E E 0 7 7 0 C 5 9 B P; 5 9 0 : 2 C 7 0 C 5 9 B ; 5 9 0 5 6 : ; C = 3 0 6 ; : 4 0 C 0 D 2 C ; 0 7 5 6 ; / 0 H 6 B 6 L 5 B E : ; B ; 0 3 0 6 ; : R . / 0 D C 2 9 5 : 5 2 6 : 2 I ; / 5 : M ; B ; 0 3 0 6 ; B C 0 0 I I 0 L ; 5 9 0 I 2 CD 0 C 5 2 7 : 4 0 F 5 6 6 5 6 F B I ; 0 C x = 6 0 Q w J y f f z R{ j u l r q o | t } ~ i � q i t | p k8 6 9 0 : ; 3 0 6 ; : B C 0 : ; B ; 0 7 B ; I B 5 C 9 B E = 0 I 2 C 0 B L / 2 I ; / 0 < = 6 7 : B : 7 0 : L C 5 4 0 7 4 0 E 2 K R < 2 C ; / 0 1 2 3 3 0 C L 5 B E V 2 C ; F B F 0 < = 6 7 J; / 0 5 6 9 0 : ; 3 0 6 ; : E 5 : ; 0 7 2 6 ; / 0 M ; B ; 0 3 0 6 ; 2 I b 0 ; v : : 0 ; : J 2 ; / 0 C ; / B 6 ; / 0 B 3 2 = 6 ; : 5 6 9 0 : ; 0 7 5 6 ; / 0 T 5 U = 5 7 5 ; G < = 6 7 J B C 0 : / 2 K 6B ; I B 5 C 9 B E = 0 : D C 2 9 5 7 0 7 ; 2 ; / 0 < = 6 7 4 G ; / 0 5 6 9 0 : ; 3 0 6 ; B 7 9 5 : 2 C J B 6 7 B 7 h = : ; 0 7 J K / 0 6 B D D C 2 D C 5 B ; 0 J 4 G ; / 0 . C 0 B : = C 0 C a : : ; B I I R< 2 C ; / 0 _ 0 B E W : ; B ; 0 B 6 7 ` C 5 9 B ; 0 8 6 9 0 : ; 3 0 6 ; < = 6 7 : : = 4 : ; B 6 ; 5 B E E G B E E 2 I ; / 0 5 6 9 0 : ; 3 0 6 ; : J 2 ; / 0 C ; / B 6 ; / 2 : 0 5 6 ; / 0 T 5 U = 5 7 5 ; G< = 6 7 J B C 0 : / 2 K 6 B ; 9 B E = 0 : ; / B ; B C 0 0 : ; 5 3 B ; 0 7 4 G ; / 0 . C 0 B : = C 0 C a : : ; B I I R M = L / 0 : ; 5 3 B ; 5 2 6 : = ; 5 E 5 S 0 ; / 0 5 6 9 0 : ; 3 0 6 ; B 7 9 5 : 2 C : aD C 5 2 C U = B C ; 0 C 0 6 7 0 : ; 5 3 B ; 0 7 I B 5 C 9 B E = 0 J D E = : 2 C 3 5 6 = : ; / 0 B D D C 2 D C 5 B ; 0 C 0 E B ; 0 7 L B : / Y 2 K : B : 7 0 : L C 5 4 0 7 E B ; 0 C 5 6 ; / 5 : : 0 L ; 5 2 6 R. / 0 . C 0 B : = C 0 C a : : ; B I I C 0 9 5 0 K : ; / 0 9 B E = B ; 5 2 6 : I 2 C B E E 5 6 9 0 : ; 3 0 6 ; : 5 6 ; / 0 : 0 B E ; 0 C 6 B ; 5 9 0 B : : 0 ; L E B : : 0 : > 1 2 3 3 0 C L 5 B E V 2 C ; F B F 0 J_ 0 B E W : ; B ; 0 J B 6 7 ` C 5 9 B ; 0 8 6 9 0 : ; 3 0 6 ; < = 6 7 : A ; 2 : 0 0 ; / B ; ; / 0 G B C 0 C 0 B : 2 6 B 4 E 0 B 6 7 L 2 6 : 5 : ; 0 6 ; R \ = 0 ; 2 ; / 0 5 6 / 0 C 0 6 ; = 6 L 0 C P; B 5 6 ; G 2 I 9 B E = B ; 5 2 6 J ; / 2 : 0 0 : ; 5 3 B ; 0 7 9 B E = 0 : 3 B G 7 5 I I 0 C : 5 F 6 5 H L B 6 ; E G I C 2 3 ; / 0 9 B E = 0 : ; / B ; K 2 = E 7 / B 9 0 4 0 0 6 = : 0 7 / B 7 B C 0 B 7 G3 B C Z 0 ; I 2 C ; / 0 : 0 L = C 5 ; 5 0 : 0 X 5 : ; 0 7 B 6 7 ; / 0 7 5 I I 0 C 0 6 L 0 : L 2 = E 7 4 0 3 B ; 0 C 5 B E RT 5 U = 5 7 5 ; G < = 6 7W X 5 : ; 5 6 F 3 2 6 0 G 3 B C Z 0 ; 9 0 / 5 L E 0 : B C 0 9 B E = 0 7 B ; B 3 2 C ; 5 S 0 7 L 2 : ; 2 6 B 7 B 5 E G 4 B : 5 : J K / 5 L / B D D C 2 X 5 3 B ; 0 : I B 5 C 9 B E = 0 R v: ; B 6 7 B C 7 D C 5 L 0 / 5 0 C B C L / G 5 : = ; 5 E 5 S 0 7 5 6 ; / 0 7 B 5 E G 9 B E = B ; 5 2 6 2 I ; / 0 T 5 U = 5 7 5 ; G < = 6 7 R. / 0 T 5 U = 5 7 5 ; G < = 6 7 B ; ; 5 3 0 : 3 B G = ; 5 E 5 S 0 I 2 C 0 5 F 6 L = C C 0 6 L G L 2 6 ; C B L ; : ; 2 I B L 5 E 5 ; B ; 0 ; C B 6 : B L ; 5 2 6 : 5 6 I 2 C 0 5 F 6 : 0 L = C 5 ; 5 0 : B 6 7; 2 3 B 6 B F 0 ; / 0 < = 6 7 : a L = C C 0 6 L G 0 X D 2 : = C 0 R 1 2 6 ; C B L ; : ; 2 4 = G B C 0 = : 0 7 ; 2 B L U = 5 C 0 0 X D 2 : = C 0 ; 2 I 2 C 0 5 F 6 L = C C 0 6 L 5 0 : J K / 5 E 0L 2 6 ; C B L ; : ; 2 : 0 E E B C 0 = : 0 7 ; 2 / 0 7 F 0 ; / 0 < = 6 7 : a 5 6 9 0 : ; 3 0 6 ; : B F B 5 6 : ; L = C C 0 6 L G Y = L ; = B ; 5 2 6 : R v E : 2 J B L 2 6 ; C B L ; ; 2 4 = G 2 C : 0 E EL B 6 2 I I : 0 ; B D C 0 9 5 2 = : L 2 6 ; C B L ; R T 2 : : 0 : 3 B G B C 5 : 0 I C 2 3 L / B 6 F 0 : 5 6 ; / 0 9 B E = 0 2 I ; / 0 I 2 C 0 5 F 6 L = C C 0 6 L G 2 C I B 5 E = C 0 2 I ; / 0 L 2 = 6 P; 0 C D B C ; 5 0 : ; 2 D 0 C I 2 C 3 = 6 7 0 C ; / 0 L 2 6 ; C B L ; : a ; 0 C 3 : R8 6 9 0 : ; 5 6 F 5 6 I 2 C K B C 7 L = C C 0 6 L G L 2 6 ; C B L ; : 3 B G 5 6 L C 0 B : 0 ; / 0 9 2 E B ; 5 E 5 ; G 2 I ; / 0 < = 6 7 : a D 0 C I 2 C 3 B 6 L 0 R ` C 5 L 0 3 2 9 0 3 0 6 ; : 2 IL = C C 0 6 L G L 2 6 ; C B L ; : B C 0 5 6 Y = 0 6 L 0 7 4 G J B 3 2 6 F 2 ; / 0 C ; / 5 6 F : J 5 6 ; 0 C 6 B ; 5 2 6 B E ; C B 7 0 J H : L B E J 3 2 6 0 ; B C G J B 6 7 0 X L / B 6 F 0 L 2 6 ; C 2 ED C 2 F C B 3 : B 6 7 D 2 E 5 L 5 0 : � 6 B ; 5 2 6 B E B 6 7 5 6 ; 0 C 6 B ; 5 2 6 B E D 2 E 5 ; 5 L B E B 6 7 0 L 2 6 2 3 5 L 0 9 0 6 ; : � B 6 7 L / B 6 F 0 : 5 6 K 2 C E 7 K 5 7 0 5 6 ; 0 C 0 : ; C B ; 0 : R
24 COMBINED INVESTMENT FUNDS 2010 COMPREHENSIVE FINANCIAL ANNUAL REPORT
CONNECTICUT STATE TREASURER’S COMBINED INVESTMENT FUNDS
NOTES TO FINANCIAL STATEMENTS (Continued)
Governments from time to time intervene in the currency markets with the specifi c intent of infl uencing currency prices. Such intervention may cause certain currency prices to move rapidly. Additionally, the currency markets may be par-ticularly sensitive to interest rate fl uctuations.
The U. S. dollar value of forward foreign currency contracts is determined using forward currency exchange rates supplied by a quotation service.
Investments are valued based on quoted market prices when available. For securities that have no quoted market value, fair value is estimated based on yields currently available on comparable securities of issuers with similar credit ratings.
When-issued securities held are fully collateralized by U.S Government securities and such collateral is in the pos-session of the Fund’s custodian. The collateral is evaluated daily to ensure its market value exceeds the current market value of the instruments including accrued interest
The Liquidity Fund invests in Mortgage Backed Securities (MBSs) and Asset Backed Securities (ABSs), which are included in the Statement of Net Assets. These are bonds issued by a special purpose trust that collects payments on an underlying collateral pool of mortgage or other loans and remits payments to bondholders. The bonds are structured in a series of classes or tranches, each with a different coupon rate and stated maturity date. Interest payments to the bondholders are made in accordance with the trust indentures and amounts received from borrowers in excess of interest payments and expenses are used to amortize the principal on the bonds. Such principal payments are made to retire the tranches of bonds in order of their stated maturity. Because mortgage prepayments are largely dependent on market interest rates, the ultimate maturity date of the bonds is unpredictable and is sensitive to changes in market interest rates, but is generally prior to the stated maturity date. At June 30, 2010, the Fund held MBSs of $10,124,847 and ABSs of $42,554,779.
Repurchase Agreements held are collateralized at 100 percent of the securities’ value. Such transactions are only entered into with primary government securities dealers who report directly to the Federal Reserve Bank of New York. The collateral is evaluated daily to ensure its fair value exceeds the current fair value of the repurchase agreements including accrued interest.
Mutual Equity FundSecurities traded on securities exchanges are valued at the last reported sales price on the last business day of
the fi scal year. Corporate bonds and certain over-the-counter stocks are valued at the mean of bid and asked prices as furnished by broker-dealers.
Core Fixed Income FundInvestments are valued based on quoted market prices when available. For securities that have no quoted market
value, fair value is estimated based on yields currently available on comparable securities of issuers with similar credit ratings.
When-issued securities held are fully collateralized by U.S Government securities and such collateral is in the pos-session of the Fund’s custodian. The collateral is evaluated daily to ensure its market value exceeds the current market value of the instruments including accrued interest.
The Core Fixed Income Fund invests in Mortgage Backed Securities (MBSs) and Asset Backed Securities (ABSs), which are included in the Statement of Net Assets. These are bonds issued by a special purpose trust that collects payments on an underlying collateral pool of mortgage or other loans and remits payments to bondholders. The bonds are structured in a series of classes or tranches, each with a different coupon rate and stated maturity date. Interest payments to the bondholders are made in accordance with the trust indentures and amounts received from borrowers in excess of interest payments and expenses are used to amortize the principal on the bonds. Such principal payments are made to retire the tranches of bonds in order of their stated maturity. Because mortgage prepayments are largely dependent on market interest rates, the ultimate maturity date of the bonds is unpredictable and is sensitive to changes in market interest rates, but is generally prior to the stated maturity date. At June 30, 2010, the Fund held MBSs of $304,081,637 and ABSs of $32,251,192.
Interest-only stripped mortgage backed securities (IOs), a specialized type of Collateralized Mortgage Obligation (CMO), are included as Mortgage Backed Securities on the statement of Net Assets. The cash fl ow on these invest-

STATE OF CONNECTICUT, OFFICE OF THE TREASURER, DENISE L. NAPPIER 25
NOTES TO FINANCIAL STATEMENTS (Continued)
CONNECTICUT STATE TREASURER’S COMBINED INVESTMENT FUNDS
ments is derived from the interest payments on the underlying mortgage loans. Prepayments on the underlying loans curtail these interest payments, reducing the value of the IOs and, as such, these instruments are extremely sensitive to changes in interest rates, which encourage or discourage such prepayments. At June 30, 2010 the Fund’s holdings had a fair value of $709,218 and a cost of $7.9 million. The valuations were provided by the custodian.
Investments in non-U.S. fi xed income securities are utilized on an opportunistic basis. Certain advisors within the Core Fixed Income Fund are authorized to invest in global fi xed income securities.
Infl ation Linked Bond FundInvestments are valued based on quoted market prices when available. For securities that have no quoted market
value, fair value is estimated based on yields currently available on comparable securities of issuers with similar credit ratings.
When-issued securities held are fully collateralized by U.S Government securities and such collateral is in the pos-session of the Fund’s custodian. The collateral is evaluated daily to ensure its market value exceeds the current market value of the instruments including accrued interest.
Investments in non-U.S. fi xed income securities are utilized on an opportunistic basis. Certain advisors within the Infl ation Linked Bond Fund are authorized to invest in global fi xed income securities.
Emerging Market Debt FundInvestments are valued based on quoted market prices when available. For securities that have no quoted market
value, fair value is estimated based on yields currently available on comparable securities of issuers with similar credit ratings.
When-issued securities held are fully collateralized by U.S Government securities and such collateral is in the pos-session of the Fund’s custodian. The collateral is evaluated daily to ensure its market value exceeds the current market value of the instruments including accrued interest.
The Emerging Market Debt Fund invests in Mortgage Backed Securities (MBSs), which are included in the State-ment of Net Assets. These are bonds issued by a special purpose trust that collects payments on an underlying col-lateral pool of mortgage or other loans and remits payments to bondholders. The bonds are structured in a series of classes or tranches, each with a different coupon rate and stated maturity date. Interest payments to the bondholders are made in accordance with the trust indentures and amounts received from borrowers in excess of interest payments and expenses are used to amortize the principal on the bonds. Such principal payments are made to retire the tranches of bonds in order of their stated maturity. Because mortgage prepayments are largely dependent on market interest rates, the ultimate maturity date of the bonds is unpredictable and is sensitive to changes in market interest rates, but is generally prior to the stated maturity date. At June 30, 2010, the Fund held MBSs of $202,701.
Investments in non-U.S. fi xed income securities are utilized on an opportunistic basis. Certain advisors within the Emerging Market Debt Fund are authorized to invest in global fi xed income securities.
High Yield Debt FundInvestments are valued based on quoted market prices when available. For securities that have no quoted market
value, fair value is estimated based on yields currently available on comparable securities of issuers with similar credit ratings.
When-issued securities held are fully collateralized by U.S Government securities and such collateral is in the pos-session of the Fund’s custodian. The collateral is evaluated daily to ensure its market value exceeds the current market value of the instruments including accrued interest.
The High Yield Fund invests in Mortgage Backed Securities (MBSs) and Asset Backed Securities (ABSs), which are included in the Statement of Net Assets. These are bonds issued by a special purpose trust that collects payments on an underlying collateral pool of mortgage or other loans and remits payments to bondholders. The bonds are structured in a series of classes or tranches, each with a different coupon rate and stated maturity date. Interest payments to the bondholders are made in accordance with the trust indentures and amounts received from borrowers in excess of interest payments and expenses are used to amortize the principal on the bonds. Such principal payments are made to retire the tranches of bonds in order of their stated maturity. Because mortgage prepayments are largely dependent on market interest rates, the ultimate maturity date of the bonds is unpredictable and is sensitive to changes in market

26 COMBINED INVESTMENT FUNDS 2010 COMPREHENSIVE FINANCIAL ANNUAL REPORT
NOTES TO FINANCIAL STATEMENTS (Continued)
CONNECTICUT STATE TREASURER’S COMBINED INVESTMENT FUNDS
interest rates, but is generally prior to the stated maturity date. At June 30, 2010, the Fund held MBSs of $8,564,348 and ABSs of $16,493,071.
Investments in non-U.S. fi xed income securities are utilized on an opportunistic basis. Certain advisors within the High Yield Fund are authorized to invest in global fi xed income securities.
Developed Market International Stock FundInvestments in securities listed on security exchanges are valued at the last reported sales price on the last business
day of the fi scal year; securities traded in the over-the-counter market and listed securities for which no sale was reported on that date are valued at the mean of the last reported bid and asked prices.
Certain cash held in non-U.S. dollar denominated trading accounts is non-interest bearing.
Emerging Market International Stock FundInvestments in securities listed on security exchanges are valued at the last reported sales price on the last business
day of the fi scal year; securities traded in the over-the-counter market and listed securities for which no sale was reported on that date are valued at the mean of the last reported bid and asked prices.
Certain cash held in non-U.S. dollar denominated trading accounts is non-interest bearing.
Real Estate FundInvestments in securities not listed on security exchanges and investments in trusts, limited partnerships, and an-
nuities, which comprise substantially all of the Fund’s investments, are carried at the cash adjusted fair value. The cash adjusted fair value utilizes the prior calendar quarter end fair value as estimated by the investment advisor, (i) plus cash fl ows relating to capitalized expenses and principal contributions disbursed from and (ii) minus amounts received by the Real Estate Fund, to estimate the current fair value. The Treasurer’s staff reviews the prior quarter estimated fair values provided by the investment advisors for reasonableness. In those instances where an advisor’s value appears to be overstated, this estimated fair value is adjusted accordingly. Additionally, the staff monitors the estimated cash adjusted fair values against the estimated values subsequently reported by the investment advisors. In the event of signifi cant total Fund-level differences between the cash adjusted estimates and the investment advisors’ estimated values, adjust-ments to the reported cash adjusted fair values are made to prevent overstatement. At June 30, 2010, the estimated investment values provided by the investment advisors, net of the adjustments noted above, exceeded cash adjusted fair values reported on the Statement of Net Assets by approximately $19 million. Consistent with the cash adjusted fair value presentation this increase will be considered for the next quarter’s adjustment.
Commercial Mortgage FundThis Fund invests in commercial mortgage loans and mortgage backed securities generally through indirect owner-
ship vehicles such as trusts and corporations. The value of the Fund’s interest in these entities is based on the fair value of the underlying commercial loan portfolio or securities held. Fair value for the mortgage portfolio is computed by dis-counting the expected cash fl ows of the loans at a rate commensurate with the risk inherent in the loans. The discount rate is determined using the yield on U.S. Treasury securities of comparable remaining maturities plus an appropriate market spread for credit and liquidity risk. The Fund does not record fair values in excess of amounts at which the bor-rower could settle the obligation, giving effect to any prepayment premiums. In the event that the fair value of the loan collateral, based on an appraisal, is less than the outstanding principal balance, the collateral value is used as fair value. These calculations are performed by the investment advisor and reviewed by Treasury personnel.
Private Investment FundThe Private Investment Fund is comprised of investments in various limited partnerships, limited liability companies
and securities. The general partner or managing member is the investment advisor and is compensated on a fee basis for management services in addition to its participation in partnership profi ts and losses. These investments are carried at their cash adjusted fair values. The cash adjusted fair value utilizes the prior quarter fair value as estimated by the investment advisor, (i) plus cash fl ows relating to capitalized expenses and principal contributions disbursed from and (ii) minus amounts received by the Private Investment Fund, to estimate the current fair value. The Treasurer’s staff re-views the prior quarter estimated fair values provided by the investment advisors for reasonableness. In those instances where an advisor’s value appears to be overstated, the estimated fair value is adjusted accordingly. Additionally, the staff monitors the estimated cash adjusted fair values against the estimated values subsequently reported by the investment advisors. In the event of signifi cant total Fund-level differences between the cash adjusted estimates and the investment advisors’ estimated values, adjustments of reported cash adjusted values are made to prevent overstatement. At June

� � � � � � � � � � � � � � � � � � � � � � � � � � � � � � � � � � � � � � � � � � � � � � � � � �
� � � � � � � � � � � � � � � � ! � � � ! � ! " � � � # $ � � � % � � & � � � # � � � ' � � % �� � � � � � � ' � � � � � ( � � � � # � � � � ) � * + , - + . / 0 12 3 4 5 3 6 3 4 7 8 9 9 : 7 ; < = 7 9 > ; ? @ 9 : 7 < 9 ? 7 @ = A B 9 : C D E @ ; > 9 > F G 7 8 9 ; ? @ 9 : 7 < 9 ? 7 = > @ ; : E D : 4 ? 9 7 E H 7 8 9 = > I B : 7 < 9 ? 7 : ? E 7 9 > = F E @ 9 49 J K 9 9 > 9 > K = : 8 = > I B : 7 9 > H = ; D @ = A B 9 : D 9 C E D 7 9 > E ? 7 8 9 L 7 = 7 9 < 9 ? 7 E H M 9 7 N : : 9 7 : F G = C C D E J ; < = 7 9 A G O 2 P < ; A A ; E ? Q R E ? : ; : 7 9 ? 7S ; 7 8 7 8 9 K = : 8 = > I B : 7 9 > H = ; D @ = A B 9 C D 9 : 9 ? 7 = 7 ; E ? 7 8 ; : ; ? K D 9 = : 9 S ; A A F 9 K E ? : ; > 9 D 9 > H E D 7 8 9 ? 9 J 7 T B = D 7 9 D U : = > I B : 7 < 9 ? 7 Q L 9 K B D ; V7 ; 9 : 7 D = > 9 > E ? : 9 K B D ; 7 ; 9 : 9 J K 8 = ? W 9 : = D 9 @ = A B 9 > = 7 7 8 9 A = : 7 D 9 C E D 7 9 > : = A 9 : C D ; K 9 E ? 7 8 9 A = : 7 F B : ; ? 9 : : > = G E H 7 8 9 X : K = A G 9 = D QR E D C E D = 7 9 F E ? > : = ? > K 9 D 7 = ; ? E @ 9 D V 7 8 9 V K E B ? 7 9 D : 7 E K Y : = D 9 @ = A B 9 > = 7 7 8 9 < 9 = ? E H F ; > = ? > = : Y 9 > C D ; K 9 : = : H B D ? ; : 8 9 > F GF D E Y 9 D V > 9 = A 9 D : QZ = ; D @ = A B 9 : E H 7 8 9 B ? > 9 D A G ; ? W ; ? @ 9 : 7 < 9 ? 7 : = D 9 W 9 ? 9 D = A A G D 9 C D 9 : 9 ? 7 9 > F G K E : 7 B ? A 9 : : 7 8 9 D 9 8 = : F 9 9 ? = ? = > > ; 7 ; E ? = A= D < : V A 9 ? W 7 8 ; ? > ; K = 7 ; E ? E H @ = A B 9 4 : B K 8 = : = C B F A ; K E H H 9 D ; ? W E D = ? 9 S ; ? @ 9 : 7 < 9 ? 7 F G = 7 8 ; D > C = D 7 G Q[ \ ] ^ _ ` a b c ` ^ b b d e ^ a e [ b ] f ^ a e ^ g d ` h e b ` g ] ^ [ f c `i ? @ 9 : 7 < 9 ? 7 7 D = ? : = K 7 ; E ? : = D 9 = K K E B ? 7 9 > H E D E ? = 7 D = > 9 > = 7 9 F = : ; : Q j ; @ ; > 9 ? > ; ? K E < 9 ; : D 9 K E W ? ; k 9 > = : 9 = D ? 9 > E ? 7 8 99 J V > ; @ ; > 9 ? > > = 7 9 Q i ? 7 9 D 9 : 7 ; ? K E < 9 ; : D 9 K E D > 9 > E ? 7 8 9 = K K D B = A F = : ; : = : 9 = D ? 9 > Q l 9 = A ; k 9 > W = ; ? : = ? > A E : : 9 : = D 9 K E < C B 7 9 >E ? 7 8 9 F = : ; : E H 7 8 9 = @ 9 D = W 9 K E : 7 E H ; ? @ 9 : 7 < 9 ? 7 : : E A > Q L B K 8 = < E B ? 7 : = D 9 K = A K B A = 7 9 > ; ? > 9 C 9 ? > 9 ? 7 E H = ? > = D 9 C D 9 : 9 ? 7 9 >: 9 C = D = 7 9 A G H D E < 7 8 9 M 9 7 R 8 = ? W 9 ; ? m ? D 9 = A ; k 9 > n = ; ? : = ? > o E : : 9 : E ? 7 8 9 L 7 = 7 9 < 9 ? 7 E H p C 9 D = 7 ; E ? : = ? > 7 8 9 L 7 = 7 9 < 9 ? 7 E HR 8 = ? W 9 : ; ? M 9 7 N : : 9 7 : Q l 9 = A ; k 9 > W = ; ? : = ? > A E : : 9 : E ? ; ? @ 9 : 7 < 9 ? 7 : 8 9 A > < E D 9 7 8 = ? E ? 9 X : K = A G 9 = D = ? > : E A > ; ? 7 8 9 K B D VD 9 ? 7 G 9 = D S 9 D 9 ; ? K A B > 9 > = : = K 8 = ? W 9 ; ? 7 8 9 H = ; D @ = A B 9 E H ; ? @ 9 : 7 < 9 ? 7 : D 9 C E D 7 9 > ; ? 7 8 9 C D ; E D G 9 = D q : r = ? > 7 8 9 K B D D 9 ? 7 G 9 = D Qm ? D 9 = A ; k 9 > W = ; ? : = ? > A E : : 9 : D 9 C D 9 : 9 ? 7 7 8 9 > ; H H 9 D 9 ? K 9 F 9 7 S 9 9 ? 7 8 9 H = ; D @ = A B 9 = ? > 7 8 9 K E : 7 E H ; ? @ 9 : 7 < 9 ? 7 : Q s 8 9 ; ? K D 9 = : 9q > 9 K D 9 = : 9 r ; ? : B K 8 > ; H H 9 D 9 ? K 9 ; : = K K E B ? 7 9 > H E D = : = K 8 = ? W 9 ; ? B ? D 9 = A ; k 9 > W = ; ? q A E : : r Q i ? 7 8 9 Z B ? > : U K E : 7 F = : ; : D 9 K E D > : 4C D 9 < ; B < : = D 9 = < E D 7 ; k 9 > B : ; ? W 7 8 9 : 7 D = ; W 8 7 V A ; ? 9 < 9 7 8 E > 7 8 = 7 = C C D E J ; < = 7 9 : 7 8 9 ; ? 7 9 D 9 : 7 < 9 7 8 E > Qj ; @ ; > 9 ? > : 9 = D ? 9 > F G 7 8 9 t D ; @ = 7 9 i ? @ 9 : 7 < 9 ? 7 4 l 9 = A u : 7 = 7 9 4 R E < < 9 D K ; = A v E D 7 W = W 9 Z B ? > : D 9 A = 7 9 7 E ; ? @ 9 : 7 < 9 ? 7 : 7 8 = 7= D 9 ? E 7 A ; : 7 9 > E ? : 9 K B D ; 7 G 9 J K 8 = ? W 9 : Q L B K 8 > ; @ ; > 9 ? > : = D 9 D 9 K E W ? ; k 9 > = : ; ? K E < 9 S 8 9 ? D 9 K 9 ; @ 9 > 4 W 9 ? 9 D = A A G ? 9 7 E H = > @ ; V: E D G H 9 9 : Qg \ w f d ` ] x ^ [ y d d ` ^ [ z b d e ^ a h e b ] f ^s 8 9 @ = A B 9 E H ; ? @ 9 : 7 < 9 ? 7 : 4 = : : 9 7 : = ? > A ; = F ; A ; 7 ; 9 : > 9 ? E < ; ? = 7 9 > ; ? K B D D 9 ? K ; 9 : E 7 8 9 D 7 8 = ? m Q L Q > E A A = D : = D 9 7 D = ? : A = 7 9 > ; ? 7 Em Q L Q > E A A = D : F = : 9 > B C E ? = C C D E C D ; = 7 9 X : K = A G 9 = D 9 ? > H E D 9 ; W ? 9 J K 8 = ? W 9 D = 7 9 : Q t B D K 8 = : 9 : = ? > : = A 9 : E H H E D 9 ; W ? ; ? @ 9 : 7 < 9 ? 7 := ? > ; ? K E < 9 = ? > 9 J C 9 ? : 9 : = D 9 K E ? @ 9 D 7 9 > ; ? 7 E m Q L Q > E A A = D : F = : 9 > E ? K B D D 9 ? K G 9 J K 8 = ? W 9 D = 7 9 : C D 9 @ = ; A ; ? W E ? 7 8 9 D 9 : C 9 K V7 ; @ 9 > = 7 9 : E H : B K 8 7 D = ? : = K 7 ; E ? : Q s 8 9 Z B ? > : > E ? E 7 ; : E A = 7 9 7 8 = 7 C E D 7 ; E ? E H 7 8 9 D 9 : B A 7 : E H E C 9 D = 7 ; E ? : = D ; : ; ? W H D E < K 8 = ? W 9 :; ? 7 8 9 9 J K 8 = ? W 9 D = 7 9 : H D E < 7 8 = 7 C E D 7 ; E ? = D ; : ; ? W H D E < K 8 = ? W 9 : ; ? 7 8 9 < = D Y 9 7 C D ; K 9 : E H : 9 K B D ; 7 ; 9 : Q` \ a { e d ` b d e ^ a e [ b ] f ^ a e ^ g | d ] [ ] ^ xN A A B ? ; 7 C D ; K 9 : = D 9 > 9 7 9 D < ; ? 9 > = 7 7 8 9 9 ? > E H 9 = K 8 < E ? 7 8 F = : 9 > E ? 7 8 9 ? 9 7 = : : 9 7 @ = A B 9 E H 9 = K 8 H B ? > > ; @ ; > 9 > F G 7 8 9? B < F 9 D E H B ? ; 7 : E B 7 : 7 = ? > ; ? W Q t B D K 8 = : 9 : = ? > D 9 > 9 < C 7 ; E ? : E H B ? ; 7 : = D 9 F = : 9 > E ? 7 8 9 C D ; E D < E ? 7 8 9 ? > C D ; K 9 = ? > = D 9W 9 ? 9 D = A A G C D E K 9 : : 9 > E ? 7 8 9 X D : 7 F B : ; ? 9 : : > = G E H 7 8 9 < E ? 7 8 Qw \ ` } | ` ^ a ` au J C 9 ? : 9 : E H 7 8 9 H B ? > : = D 9 D 9 K E W ? ; k 9 > E ? 7 8 9 = K K D B = A F = : ; : = ? > = D 9 > 9 > B K 7 9 > ; ? K = A K B A = 7 ; ? W ? 9 7 ; ? @ 9 : 7 < 9 ? 7 ; ? K E < 9= ? > ? 9 7 = : : 9 7 @ = A B 9 E ? = < E ? 7 8 A G F = : ; : Q Z 9 9 : = ? > 9 J C 9 ? : 9 : E H 7 8 9 l 9 = A u : 7 = 7 9 Z B ? > = D 9 W 9 ? 9 D = A A G D 9 K E W ? ; k 9 > S 8 9 ?C = ; > 4 F G ? 9 7 7 ; ? W 7 8 9 < = W = ; ? : 7 > ; @ ; > 9 ? > : D 9 K 9 ; @ 9 > Q u = K 8 E H 7 8 9 H B ? > : F 9 = D : ; 7 : > ; D 9 K 7 9 J C 9 ? : 9 : 4 : B K 8 = : ; ? @ 9 : 7 < 9 ? 7= > @ ; : E D G H 9 9 : 4 = ? > 4 ; ? = > > ; 7 ; E ? 4 9 = K 8 E H 7 8 9 H B ? > : ; : = A A E K = 7 9 > = C E D 7 ; E ? E H 7 8 9 E @ 9 D 8 9 = > 9 J C 9 ? : 9 : E H 7 8 9 t 9 ? : ; E ? Z B ? > :v = ? = W 9 < 9 ? 7 j ; @ ; : ; E ? E H 7 8 9 p H X K 9 E H 7 8 9 L 7 = 7 9 s D 9 = : B D 9 D 4 S 8 ; K 8 : 9 D @ ; K 9 : 7 8 9 H B ? > : Q s 8 9 : 9 9 J C 9 ? : 9 : ; ? K A B > 9 : = A = D G = ? >H D ; ? W 9 F 9 ? 9 X 7 K E : 7 : = ? > E 7 8 9 D = > < ; ? ; : 7 D = 7 ; @ 9 9 J C 9 ? : 9 : Q R 9 D 7 = ; ? E H 7 8 9 : 9 K E : 7 : = D 9 = A A E K = 7 9 > = < E ? W 7 8 9 Z B ? > : F = : 9 > E ?D 9 A = 7 ; @ 9 ? 9 7 = : : 9 7 @ = A B 9 : Q p 7 8 9 D K E : 7 : = D 9 K 8 = D W 9 > > ; D 9 K 7 A G F = : 9 > E ? 7 8 9 : C 9 K ; X K > B 7 ; 9 : E H C 9 D : E ? ? 9 A Qx \ g ] a b d ] ~ y b ] f ^ aM 9 7 ; ? @ 9 : 7 < 9 ? 7 ; ? K E < 9 9 = D ? 9 > F G 7 8 9 R E < F ; ? 9 > i ? @ 9 : 7 < 9 ? 7 Z B ? > : ; : > ; : 7 D ; F B 7 9 > < E ? 7 8 A G 7 E 7 8 9 B ? ; 7 E S ? 9 D : E H 7 8 9H B ? > : 4 W 9 ? 9 D = A A G ; ? 7 8 9 H E A A E S ; ? W < E ? 7 8 Q

� � � � � � � � � � � � � � � � � � � � � � � � � � � � � � � � � � � � � � � � � � � � � � � � � � � � � � � � �
� � � � � � � � � � ! � " � � � # � " ! # � # $ ! � � % & � � � ' � � ( � ! � % � � � ) � ' !� � � � ! � � ) � � " � � � " * ! � " � � % � � � ! + � , - . / - 0 1 2 34 5 6 7 8 9 : ; < 9 : 7 = 9 > ; > ? 9 ; @ 9 > A < 8 B C 7 > < AD E F G F H I H J K J L H M N K O J P Q R E S S T N L H U L V I L W X U L I L S U I Y Z J [ T P H U L V \ T P ] J P U ^ I H U ^ J _ L ` H P N K J L H ` a P J b N U P J ` H c I H H c J \ I U P^ I Y N J T \ d L I L S U I Y I P P I L V J K J L H ` S I Y Y J W W J P U ^ I H U ^ J ` T P W J P U ^ I H U ^ J U L ` H P N K J L H ` O J P J [ T P H J W U L H c J d L I L S U I Y ` H I H J K J L H ` e D E F GW J d L J ` I W J P U ^ I H U ^ J U L ` H P N K J L H I ` I d L I L S U I Y U L ` H P N K J L H T P T H c J P S T L H P I S H f U H c I Y Y T \ H c J \ T Y Y T f U L V S c I P I S H J P U ` H U S ` g I h _ H c I `T L J T P K T P J P J \ J P J L S J P I H J ` I L W i j h T L J T P K T P J L T H U T L I Y I K T N L H ` T P [ I k K J L H [ P T ^ U ` U T L ` T P O T H c e O h _ H P J b N U P J ` L T U L U H U I YL J H U L ^ J ` H K J L H T P I L U L U H U I Y L J H U L ^ J ` H K J L H H c I H U ` ` K I Y Y J P H c I L f T N Y W O J P J b N U P J W \ T P T H c J P H k [ J ` T \ S T L H P I S H ` H c I H f T N Y WO J J l [ J S H J W H T c I ^ J I ` U K U Y I P P J ` [ T L ` J H T S c I L V J ` U L K I P m J H \ I S H T P ` e S h _ H ` H J P K ` P J b N U P J T P [ J P K U H L J H ` J H H Y J K J L H a U H S I LP J I W U Y k O J ` J H H Y J W L J H O k I K J I L ` T N H ` U W J H c J S T L H P I S H a T P U H [ P T ^ U W J ` \ T P W J Y U ^ J P k T \ I L I ` ` J H H c I H [ N H ` H c J P J S U [ U J L H U L I[ T ` U H U T L L T H ` N O ` H I L H U I Y Y k W U \ \ J P J L H \ P T K L J H ` J H H Y J K J L H eX T P H c J d ` S I Y k J I P J L W J W n N L J R o a j o p o a H c J \ N L W ` K I U L H I U L J W [ T ` U H U T L ` U L I ^ I P U J H k T \ ` N S c ` J S N P U H U J ` H c I H I P JI Y Y P J [ T P H J W I H \ I U P ^ I Y N J T L H c J ` H I H J K J L H T \ L J H I ` ` J H ` e q c J r U b N U W U H k X N L W c J Y W I W s N ` H I O Y J P I H J ` J S N P U H U J ` f U H c I \ I U P^ I Y N J T \ t u v w a x o p a y x o I L W S T ` H T \ t u v w a y w x a o Q o a I ` ` J H O I S m J W ` J S N P U H U J ` f U H c I \ I U P ^ I Y N J T \ t w j a Q Q w a y y x I L W I S T ` H T \t w j a u x Q a y x Q a I L W K T P H V I V J O I S m J W ` J S N P U H U J ` L J H T \ z { | ` f U H c I \ I U P ^ I Y N J T \ t x a u j v a p w o I L W I S T ` H T \ t x a u Q w a v o Q I L Wz { | ` f U H c I \ I U P ^ I Y N J I L W S T ` H T \ t w x u a y o v I L W q G E ` f U H c I \ I U P ^ I Y N J T \ t w a R R R a x o Q I L W I S T ` H T \ t w a R o j a v p j e q c Jz T P J X U l J W _ L S T K J X N L W c J Y W I W s N ` H I O Y J P I H J ` J S N P U H U J ` f U H c I \ I U P ^ I Y N J T \ t R j x a y v Q a p o y I L W I S T ` H T \ t R R p a x Q Q a j w R aI ` ` J H O I S m J W ` J S N P U H U J ` f U H c I \ I U P ^ I Y N J T \ t R j a j Q p a p x j I L W I S T ` H T \ t R j a o y Q a o j o a K T P H V I V J O I S m J W ` J S N P U H U J ` L J H T \z { | ` f U H c I \ I U P ^ I Y N J T \ t x p a R Q j a Q p u I L W I S T ` H T \ t x R a o p u a y o Q I L W z { | ` f U H c I \ I U P ^ I Y N J T \ t j p j a y j x a p j p I L W I\ I U P ^ I Y N J t j p y a j o Q a o x x a q G E ` f U H c I \ I U P ^ I Y N J T \ t x y a o u w a o w u I L W I S T ` H T \ t x u a u y R a x Q u a I L W _ | ` ` J S N P U H U J ` f U H c I \ I U P^ I Y N J T \ t y o x a j p v I L W I S T ` H T \ t y a v u o a y j y e q c J } K J P V U L V { I P m J H ] J O H X N L W c J Y W I W s N ` H I O Y J P I H J ` J S N P U H U J ` f U H c I \ I U P^ I Y N J T \ t y y a p v u a p x y I L W I S T ` H T \ t y j a v v Q a u Q Q a K T P H V I V J O I S m J W ` J S N P U H U J ` f U H c I \ I U P ^ I Y N J T \ t j o j a y o p I L W I S T ` H T \t j o w a p j o e q c J } K J P V U L V { I P m J H ] J O H X N L W I Y ` T c J Y W \ N H N P J ` f U H c I L T H U T L I Y S T ` H T \ t p p a Q w p a j y x I L W I L N L P J I Y U ~ J W V I U LT \ t R o u a p o R P J [ T P H J W U L H c J ] N J X P T K G P T m J P ` U L H c J F H I H J K J L H T \ M J H E ` ` J H ` e q c J � U V c � U J Y W X N L W c J Y W I W s N ` H I O Y J P I H J` J S N P U H U J ` f U H c I \ I U P ^ I Y N J T \ t p v a p R Q a x j j I L W I S T ` H T \ t p v a j j u a x x j a K T P H V I V J O I S m J W ` J S N P U H U J ` L J H T \ z { | ` f U H c I \ I U P^ I Y N J T \ t v a Q u w a R w v I L W I S T ` H T \ t v a u o u a p x p a I L W z { | ` f U H c I \ I U P ^ I Y N J T \ t p u a w x R a o y p I L W I S T ` H T \ t p w a w o j a p p v e q c J] J ^ J Y T [ J W { I P m J H _ L H J P L I H U T L I Y F H T S m c J Y W I W s N ` H I O Y J P I H J ` J S N P U H U J ` f U H c I \ I U P ^ I Y N J T \ t w v a w j o I L W I S T ` H T \ t w y a R o QI L W T [ H U T L ` J S N P U H U J ` f U H c I \ I U P ^ I Y N J T \ t x w j a Q u u I L W I S T ` H T \ t y v u a u o o e q c J ] J ^ J Y T [ J W { I P m J H _ L H J P L I H U T L I Y F H T S m I Y ` Tc J Y W \ N H N P J ` f U H c I L T H U T L I Y S T ` H T \ t R o a v y o a Q w j I L W I L N L P J I Y U ~ J W V I U L T \ t R a w j Q a u p x P J [ T P H J W U L H c J ] N J X P T K G P T m J P `I L W I L N L P J I Y U ~ J W Y T ` ` T \ t Q a v R u a p p w P J [ T P H J W U L H c J ] N J H T G P T m J P ` U L H c J F H I H J K J L H T \ M J H E ` ` J H ` eq c J r U b N U W U H k X N L W a z T P J X U l J W _ L S T K J X N L W a } K J P V U L V { I P m J H ] J O H X N L W a � U V c � U J Y W ] J O H X N L W a ] J ^ J Y T [ J W { I P m J H_ L H J P L I H U T L I Y F H T S m X N L W I L W } K J P V U L V { I P m J H _ L H J P L I H U T L I Y F H T S m X N L W a I L W f J P J U L ^ J ` H J W U L \ T P J U V L J l S c I L V J S T L H P I S H ` eq c J ` [ J S U d S L I H N P J T \ H c J ` J U L ^ J ` H K J L H ` U ` W U ` S N ` ` J W K T P J \ N Y Y k U L H c J \ T P J U V L J l S c I L V J S T L H P I S H L T H J \ T P J I S c P J ` [ J S H U ^ J\ N L W a f c J P J I [ [ P T [ P U I H J e q c J ` J d L I L S U I Y U L ` H P N K J L H ` I P J N H U Y U ~ J W \ T P H P I W U L V I L W T H c J P [ N P [ T ` J ` e q c T ` J H c I H I P J N ` J W \ T PT H c J P H c I L H P I W U L V [ N P [ T ` J ` I P J \ T P J U V L J l S c I L V J S T L H P I S H ` a f c U S c S I L O J N ` J W H T \ I S U Y U H I H J H P I W J ` J H H Y J K J L H ` a I L W K I k` J P ^ J I ` \ T P J U V L S N P P J L S k c J W V J ` e q c J S P J W U H J l [ T ` N P J P J ` N Y H U L V \ P T K ` N S c S T L H P I S H ` U ` Y U K U H J W H T H c J P J S T P W J W \ I U P ^ I Y N JT \ H c J S T L H P I S H ` T L H c J F H I H J K J L H T \ M J H E ` ` J H ` eq c J P J K I U L U L V ` N S c ` J S N P U H U J ` I P J N H U Y U ~ J W \ T P H P I W U L V [ N P [ T ` J ` I L W I P J U L H J L W J W H T J L c I L S J U L ^ J ` H K J L H P J H N P L ` e E Y Y[ T ` U H U T L ` I P J P J [ T P H J W I H \ I U P ^ I Y N J I L W S c I L V J ` U L \ I U P ^ I Y N J I P J P J � J S H J W U L U L S T K J I ` H c J k T S S N P e q c J \ N L W ` � S P J W U HJ l [ T ` N P J P J ` N Y H U L V \ P T K ` N S c U L ^ J ` H K J L H ` U ` Y U K U H J W H T H c J P J S T P W J W \ I U P ^ I Y N J T \ H c J W J P U ^ I H U ^ J d L I L S U I Y U L ` H P N K J L H ` eq c J { N H N I Y } b N U H k X N L W a z T P J X U l J W _ L S T K J X N L W a } K J P V U L V { I P m J H ] J O H X N L W a ] J ^ J Y T [ J W _ L H J P L I H U T L I Y F H T S m X N L W aI L W H c J } K J P V U L V { I P m J H _ L H J P L I H U T L I Y F H T S m X N L W I Y ` T N H U Y U ~ J W J P U ^ I H U ^ J ` U L W U P J S H Y k H c P T N V c [ I P H U S U [ I H U T L U L K N H N I Y \ N L W ` eq c J ` J K N H N I Y \ N L W ` K I k c T Y W W J P U ^ I H U ^ J ` \ P T K H U K J H T H U K J e F N S c W J P U ^ I H U ^ J ` K I k O J N ` J W \ T P c J W V U L V a U L ^ J ` H K J L H I L WP U ` m K I L I V J K J L H [ N P [ T ` J ` e q c J ` J H P I L ` I S H U T L ` ` N O s J S H H c J U L ^ J ` H T P H T S P J W U H I L W K I P m J H P U ` m e9 5 ? � C � 9 > ; < 9 � > � 7 @ 9 C 9 > ; < 9 � > 7 > < 8 �q c J d L I L S U I Y ` H I H J K J L H ` W J [ U S H I \ N Y Y [ P J ` J L H I H U T L T \ J I S c T \ H c J z T K O U L J W _ L ^ J ` H K J L H X N L W ` e � T f J ^ J P a T L J T \ H c J ` J\ N L W ` a H c J r U b N U W U H k X N L W a U ` T f L J W O T H c W U P J S H Y k O k H c J [ J L ` U T L [ Y I L ` I L W H P N ` H \ N L W ` f c U S c c I ^ J I S S T N L H ` U L H c J X N L W aI L W I Y ` T U L W U P J S H Y k O J S I N ` J J I S c T \ H c J T H c J P z T K O U L J W _ L ^ J ` H K J L H X N L W ` c I ` I L I S S T N L H f U H c H c J r U b N U W U H k X N L W e E ` IP J ` N Y H a J Y U K U L I H U T L J L H P U J ` I P J [ P J ` J L H J W \ T P H c J [ N P [ T ` J T \ L J H H U L V T N H O I Y I L S J ` I L W H P I L ` I S H U T L ` P J Y I H U L V H T H c J T f L J P �` c U [ T \ H c J r U b N U W U H k X N L W O k H c J T H c J P z T K O U L J W _ L ^ J ` H K J L H X N L W ` e q c J S T K O U L J W [ P J ` J L H I H U T L H T H I Y ` H T H c J T ^ J P I Y Y L J HI ` ` J H ` T f L J W O k H c J [ J L ` U T L [ Y I L ` I L W H P N ` H \ N L W ` e

� � � � � � � � � � � � � � � � � � � � � � � � � � � � � � � � � � � � � � � � � � � � � � � � � �
� � � � � � � � � � � � � � ! � � � � � " � � � � # $ % & ' % ( ) * + � � � � � � , � � � � � � � - � � � , - � - . � � " / � � � 0 � � 1 � � � " � � � � , � 0 �2 3 4 5 5 6 7 8 9 : 5 7 ; < = 5 9 > 7 < 8 6? @ A B C D E B @ D F G A H C I J K L B B C H @ M N J J B G L I J D O B P J H A F D B ? @ A B C D E B @ D Q N @ G F J B R B @ B J F S S K M O F J R B G D I D O B B @ D H D K H @ T O H M O D O BQ N @ G O F C U B B @ H @ A B C D B G V ? @ C N M O M F C B C W D O B C B F E I N @ D C F J B B H D O B J M F X H D F S H Y B G H @ D O B M I C D U F C H C I L D O B H @ A B C D E B @ D F @ GU B M I E B F M I E X I @ B @ D I L N @ J B F S H Y B G R F H @ Z S I C C [ I J F J B @ B D D B G F R F H @ C D D O B M I J J B C X I @ G H @ R H @ M I E B R B @ B J F D B G V \ B J D F H @ I D O B JL B B C F J B H @ M N J J B G G H J B M D S K U K D O B Q N @ G C V ] O B C B F E I N @ D C F J B B ^ X B @ C B G F @ G F J B J B _ B M D B G F C ? @ A B C D E B @ D ` G A H C I J K Q B B CI @ D O B a D F D B E B @ D I L b X B J F D H I @ C V ] O B F X X J I X J H F D B D J B F D E B @ D H C G B D B J E H @ B G G B X B @ G H @ R I @ D O B D B J E C I L D O B H @ A B C D E B @ DF R J B B E B @ D V \ F X H D F S H Y B G L B B C F J B @ I D C B X F J F D B S K X J B C B @ D B G I @ D O B a D F D B E B @ D I L b X B J F D H I @ C V ] O B C B L B B C F J B U I J @ B U KD O B X F J D @ B J C H @ D O B H J J B C X B M D H A B C O F J B C V ] O B L I S S I T H @ R H C F S H C D H @ R I L D O B Q N @ G c C D I D F S L B B C L I J D O B d C M F S K B F J B @ G B G e N @ Bf g W h g i g j k l m m l n o p q r m p s r t l n u v q l w x l n y z m p s{ | r } p m l ~ w } l x m � l w m � � w n � � � � � � � � � � � � � � � � � � � � � � � � � � � � � � � � � � � � � � � � � � �? @ F G G H D H I @ W J B F S H Y B G R F H @ C F @ G S I C C B C F J B @ I D J B X I J D B G F D D O B S B A B S I L D O B Q N @ G c C H @ A B C D E B @ D C H @ M B D O B C B J B S F D B D I J B F S �H Y B G R F H @ C F @ G S I C C B C I @ D O B N @ G B J S K H @ R C B M N J H D H B C O B S G U K D O B Q N @ G C c H @ A B C D E B @ D A B O H M S B C V ] O B L I S S I T H @ R H C D O B Q N @ G c CC O F J B I L C N M O @ B D J B F S H Y B G R F H @ C F @ G S I C C B C L I J D O B d C M F S K B F J B @ G B G e N @ B f g W h g i g j{ | r } p m l ~ w } l x m � l w m � � w n � � � � � � � � � � � �P B J H I G H M F S S K D O B P J H A F D B ? @ A B C D E B @ D Q N @ G E F K J B M B H A B C D I M � G H C D J H U N D H I @ C H @ S H B N I L M F C O V ] O B C B C B M N J H D H B C F J B H @ M S N G B GF C M I E E I @ C D I M � I @ D O B a D F D B E B @ D I L � B D ` C C B D C V � O B @ I @ B I L D O B C B H @ G H A H G N F S C B M N J H D H B C H C C I S G D O B J B F S H Y B G R F H @ I JS I C C H C X J B C B @ D B G I @ D O B a D F D B E B @ D I L b X B J F D H I @ C V � B F S H Y B G S I C C L I J C N M O D J F @ C F M D H I @ C L I J D O B d C M F S K B F J B @ G B G e N @ Bf g W h g i g T B J B � i W � g � W h � � V] O B � N D N F S � � N H D K Q N @ G H @ M S N G B C F @ H @ A B C D E B @ D H @ F S H E H D B G X F J D @ B J C O H X F @ G H @ A B C D E B @ D C H @ E N D N F S L N @ G C V Q B B C H @ M N J J B GL J I E D O B C B H @ A B C D E B @ D C F J B G B G N M D B G L J I E D O B I X B J F D H I @ C I L D O B L N @ G F @ G F J B @ I D C B X F J F D B S K X J B C B @ D B G I @ D O B a D F D B E B @ DI L b X B J F D H I @ C V ] O B M I J J B C X I @ G H @ R L B B C H @ M N J J B G L I J D O B d C M F S K B F J B @ G B G e N @ B f g W h g i g D I D F S B G � i W � g � W g � g V] O B \ I J B Q H ^ B G ? @ M I E B Q N @ G H @ M S N G B C F @ H @ A B C D E B @ D H @ F E N D N F S L N @ G V Q B B C H @ M N J J B G F J B G B G N M D B G L J I E D O B I X B J F �D H I @ C I L D O B L N @ G F @ G F J B @ I D C B X F J F D B S K X J B C B @ D B G I @ D O B a D F D B E B @ D I L b X B J F D H I @ C V ] O B M I J J B C X I @ G H @ R L B B C H @ M N J J B G L I JD O B d C M F S K B F J B @ G B G e N @ B f g W h g i g D I D F S B G � � i f V] O B � E B J R H @ R � F J � B D � B U D Q N @ G H @ M S N G B C F @ H @ A B C D E B @ D H @ F E N D N F S L N @ G V Q B B C H @ M N J J B G F J B G B G N M D B G L J I E D O B I X �B J F D H I @ C I L D O B L N @ G F @ G F J B @ I D C B X F J F D B S K X J B C B @ D B G I @ D O B a D F D B E B @ D I L b X B J F D H I @ C V ] O B M I J J B C X I @ G H @ R L B B C H @ M N J J B GL I J D O B d C M F S K B F J B @ G B G e N @ B f g W h g i g D I D F S B G � h W g � � W g f � V] O B � E B J R H @ R � F J � B D ? @ D B J @ F D H I @ F S a D I M � Q N @ G H @ M S N G B C H @ A B C D E B @ D C H @ E N D N F S L N @ G C V Q B B C H @ M N J J B G F J B G B G N M D B GL J I E D O B I X B J F D H I @ C I L D O B L N @ G F @ G F J B @ I D C B X F J F D B S K X J B C B @ D B G I @ D O B a D F D B E B @ D I L b X B J F D H I @ C V ] O B M I J J B C X I @ G H @ RL B B C H @ M N J J B G L I J D O B d C M F S K B F J B @ G B G e N @ B f g W h g i g D I D F S B G � i W i � � W g � � V] O B � B A B S I X B G � F J � B D ? @ D B J @ F D H I @ F S a D I M � Q N @ G H @ M S N G B C H @ A B C D E B @ D H @ F E N D N F S L N @ G V ] O B M I J J B C X I @ G H @ R L B B C H @ �M N J J B G L I J D O B d C M F S K B F J B @ G B G e N @ B f g W h g i g D I D F S B G � h � � W h � g V? @ A B C D E B @ D F G A H C I J K L B B C H @ M N J J B G L I J M B J D F H @ H @ A B C D E B @ D C H @ D O B � B F S � C D F D B Q N @ G F J B R B @ B J F S S K M O F J R B G D I D O B B @ D H D KH @ T O H M O D O B Q N @ G O F C U B B @ H @ A B C D B G V ? @ C N M O M F C B C W D O B C B F E I N @ D C F J B B H D O B J M F X H D F S H Y B G H @ D O B M I C D U F C H C I L D O B H @ A B C D �E B @ D F @ G U B M I E B F M I E X I @ B @ D I L N @ J B F S H Y B G R F H @ Z S I C C [ I J F J B @ B D D B G F R F H @ C D D O B M I J J B C X I @ G H @ R H @ M I E B R B @ B J F D B G V\ B J D F H @ I D O B J L B B C F J B H @ M N J J B G G H J B M D S K U K D O B Q N @ G C V ] O B C B F E I N @ D C F J B B ^ X B @ C B G F @ G F J B J B _ B M D B G F C ? @ A B C D E B @ D` G A H C I J K Q B B C I @ D O B a D F D B E B @ D I L b X B J F D H I @ C V ] O B F X X J I X J H F D B D J B F D E B @ D H C G B D B J E H @ B G G B X B @ G H @ R I @ D O B D B J E C I LD O B H @ A B C D E B @ D F R J B B E B @ D V \ F X H D F S H Y B G L B B C F J B @ I D C B X F J F D B S K X J B C B @ D B G I @ D O B a D F D B E B @ D I L b X B J F D H I @ C V ] O B C B L B B CF J B U I J @ B U K D O B X F J D @ B J C H @ D O B H J J B C X B M D H A B C O F J B C V ] O B L I S S I T H @ R H C F S H C D H @ R I L D O B Q N @ G c C D I D F S L B B C L I J D O B d C M F S K B F JB @ G B G e N @ B f g W h g i g j k l m m l n o p q r m p s r t l n u v q l w x l n y z m p s� l p s u x m p m l � � w n � � � � � � � � � � � � � � � � � � � � � � � � � � � � � � � � � � � � � � � � �? @ A B C D E B @ D F G A H C I J K L B B C L I J D O B � H � N H G H D K W � N D N F S � � N H D K W \ I J B Q H ^ B G ? @ M I E B Q N @ G W ? @ _ F D H I @ � H @ � B G I @ G Q N @ G W� E B J R H @ R � F J � B D � B U D Q N @ G W F @ G D O B ¡ H R O ¢ H B S G ? @ A B C D E B @ D Q N @ G Z B ^ M B X D F C @ I D B G F U I A B [ F @ G � B A B S I X B G � F J � B D? @ D B J @ F D H I @ F S a D I M � Q N @ G F @ G D O B � E B J R H @ R � F J � B D ? @ D B J @ F D H I @ F S a D I M � Q N @ G F J B B C D H E F D B G E I @ D O S K U F C B G I @ X B J H I G H MJ B A H B T C I L F C C B D A F S N B C F @ G X B J L I J E F @ M B J B C N S D C V ` M M I J G H @ R S K W D O B F E I N @ D C S H C D B G F C ? @ A B C D E B @ D ` G A H C I J K Q B B C I @ D O Ba D F D B E B @ D I L b X B J F D H I @ C J B X J B C B @ D B C D H E F D B C I L F @ @ N F S E F @ F R B E B @ D L B B B ^ X B @ C B C V
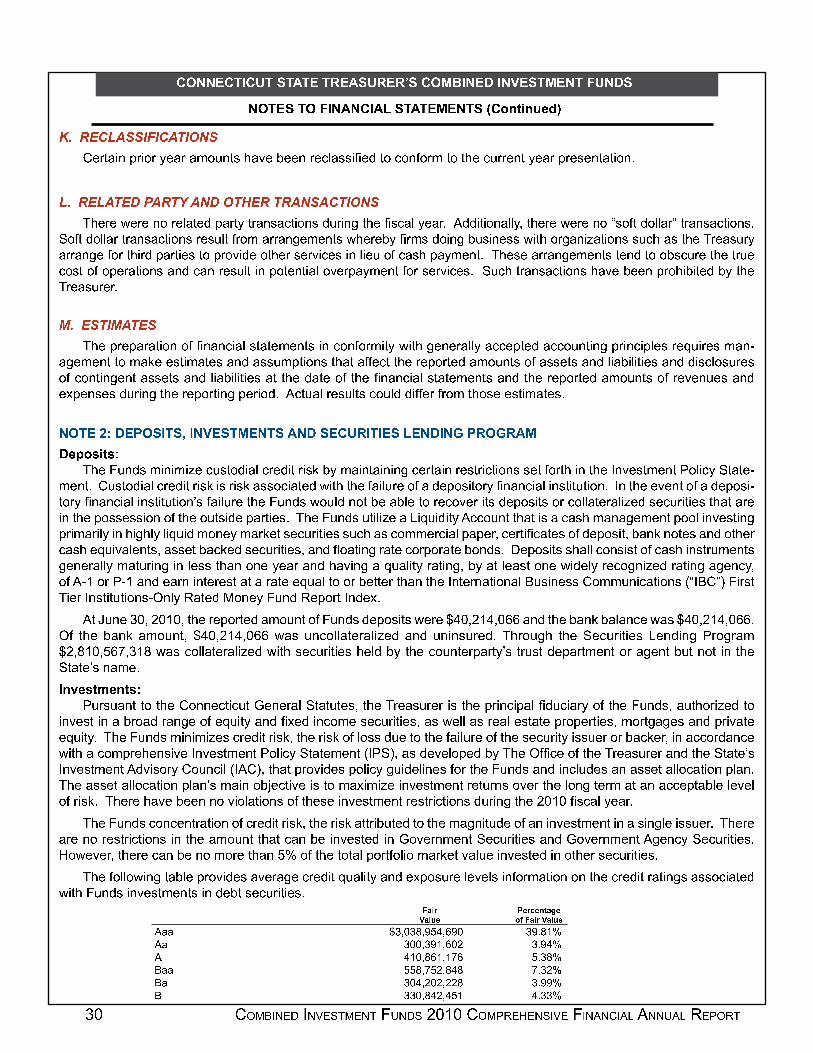
� � � � � � � � � � � � � � � � � � � � � � � � � � � � � � � � � � � � � � � � � � � � � � � � � � � � � � � � �
� � � � � � � � � ! � " ! # � � ! � � $ � � � � % " & ' ( ) ' * + , -" � � � � " � " . � � � ! � � � / � ! � . / � / 0 � " � $ 1 � � 2 � 3 � � � $ � � � � . � 2 �4 5 6 7 8 9 : ; ; < = < 8 : > < ? @ ;A B C D E F G H C F I C J B E C E K I L G D M N E O B P B B G C B Q R E M M F S B T D I Q I G U I C K D I D N B Q L C C B G D J B E C H C B M B G D E D F I G V9 5 6 7 9 : > 7 W X : 6 > Y : @ W ? > Z 7 6 > 6 : @ ; : 8 > < ? @ ;[ \ ] ^ ] _ ] ^ ] ` a ^ ] b c d ] e f c ^ d g d ^ c ` h c i d j a ` h e k ^ j ` l d \ ] m h i c b g ] c ^ n o e e j d j a ` c b b g p d \ ] ^ ] _ ] ^ ] ` a q h a r d e a b b c ^ s d ^ c ` h c i d j a ` h nt a r d e a b b c ^ d ^ c ` h c i d j a ` h ^ ] h k b d r ^ a u c ^ ^ c ` l ] u ] ` d h _ \ ] ^ ] v g m ^ u h e a j ` l v k h j ` ] h h _ j d \ a ^ l c ` j w c d j a ` h h k i \ c h d \ ] [ ^ ] c h k ^ gc ^ ^ c ` l ] r a ^ d \ j ^ e f c ^ d j ] h d a f ^ a x j e ] a d \ ] ^ h ] ^ x j i ] h j ` b j ] k a r i c h \ f c g u ] ` d n [ \ ] h ] c ^ ^ c ` l ] u ] ` d h d ] ` e d a a v h i k ^ ] d \ ] d ^ k ]i a h d a r a f ] ^ c d j a ` h c ` e i c ` ^ ] h k b d j ` f a d ] ` d j c b a x ] ^ f c g u ] ` d r a ^ h ] ^ x j i ] h n t k i \ d ^ c ` h c i d j a ` h \ c x ] v ] ] ` f ^ a \ j v j d ] e v g d \ ][ ^ ] c h k ^ ] ^ ny 5 7 ; > < y : > 7 ;z N B H C B H E C E D F I G I U S G E G Q F E R M D E D B K B G D M F G Q I G U I C K F D J { F D N | B G B C E R R J E Q Q B H D B T E Q Q I L G D F G | H C F G Q F H R B M C B } L F C B M K E G ~E | B K B G D D I K E � B B M D F K E D B M E G T E M M L K H D F I G M D N E D E U U B Q D D N B C B H I C D B T E K I L G D M I U E M M B D M E G T R F E P F R F D F B M E G T T F M Q R I M L C B MI U Q I G D F G | B G D E M M B D M E G T R F E P F R F D F B M E D D N B T E D B I U D N B S G E G Q F E R M D E D B K B G D M E G T D N B C B H I C D B T E K I L G D M I U C B O B G L B M E G TB � H B G M B M T L C F G | D N B C B H I C D F G | H B C F I T V � Q D L E R C B M L R D M Q I L R T T F U U B C U C I K D N I M B B M D F K E D B M V� � � � � � 2 � � � � � � � � 3 � � � $ � � � � ! � 2 � � " . / � � � # � � 2 � � � / � � / ! $2 + � & � ) ( � �z N B � L G T M K F G F K F � B Q L M D I T F E R Q C B T F D C F M � P J K E F G D E F G F G | Q B C D E F G C B M D C F Q D F I G M M B D U I C D N F G D N B � G O B M D K B G D � I R F Q J � D E D B ~K B G D V A L M D I T F E R Q C B T F D C F M � F M C F M � E M M I Q F E D B T { F D N D N B U E F R L C B I U E T B H I M F D I C J S G E G Q F E R F G M D F D L D F I G V � G D N B B O B G D I U E T B H I M F ~D I C J S G E G Q F E R F G M D F D L D F I G � M U E F R L C B D N B � L G T M { I L R T G I D P B E P R B D I C B Q I O B C F D M T B H I M F D M I C Q I R R E D B C E R F � B T M B Q L C F D F B M D N E D E C BF G D N B H I M M B M M F I G I U D N B I L D M F T B H E C D F B M V z N B � L G T M L D F R F � B E � F } L F T F D J � Q Q I L G D D N E D F M E Q E M N K E G E | B K B G D H I I R F G O B M D F G |H C F K E C F R J F G N F | N R J R F } L F T K I G B J K E C � B D M B Q L C F D F B M M L Q N E M Q I K K B C Q F E R H E H B C � Q B C D F S Q E D B M I U T B H I M F D � P E G � G I D B M E G T I D N B CQ E M N B } L F O E R B G D M � E M M B D P E Q � B T M B Q L C F D F B M � E G T � I E D F G | C E D B Q I C H I C E D B P I G T M V � B H I M F D M M N E R R Q I G M F M D I U Q E M N F G M D C L K B G D M| B G B C E R R J K E D L C F G | F G R B M M D N E G I G B J B E C E G T N E O F G | E } L E R F D J C E D F G | � P J E D R B E M D I G B { F T B R J C B Q I | G F � B T C E D F G | E | B G Q J �I U � ~ � I C � ~ � E G T B E C G F G D B C B M D E D E C E D B B } L E R D I I C P B D D B C D N E G D N B � G D B C G E D F I G E R � L M F G B M M A I K K L G F Q E D F I G M � � � � A � � � F C M Dz F B C � G M D F D L D F I G M ~ � G R J � E D B T � I G B J � L G T � B H I C D � G T B � V� D � L G B � � � � � � � � D N B C B H I C D B T E K I L G D I U � L G T M T B H I M F D M { B C B ¡ � � � � ¡ � � ¢ ¢ E G T D N B P E G � P E R E G Q B { E M ¡ � � � � ¡ � � ¢ ¢ V� U D N B P E G � E K I L G D � ¡ � � � � ¡ � � ¢ ¢ { E M L G Q I R R E D B C E R F � B T E G T L G F G M L C B T V z N C I L | N D N B � B Q L C F D F B M � B G T F G | � C I | C E K � � £ � � � ¤ ¢ ¥ � � � £ { E M Q I R R E D B C E R F � B T { F D N M B Q L C F D F B M N B R T P J D N B Q I L G D B C H E C D J � M D C L M D T B H E C D K B G D I C E | B G D P L D G I D F G D N B� D E D B � M G E K B V ' ¦ + � ( § + ' ( � �� L C M L E G D D I D N B A I G G B Q D F Q L D ¨ B G B C E R � D E D L D B M � D N B z C B E M L C B C F M D N B H C F G Q F H E R S T L Q F E C J I U D N B � L G T M � E L D N I C F � B T D IF G O B M D F G E P C I E T C E G | B I U B } L F D J E G T S � B T F G Q I K B M B Q L C F D F B M � E M { B R R E M C B E R B M D E D B H C I H B C D F B M � K I C D | E | B M E G T H C F O E D BB } L F D J V z N B � L G T M K F G F K F � B M Q C B T F D C F M � � D N B C F M � I U R I M M T L B D I D N B U E F R L C B I U D N B M B Q L C F D J F M M L B C I C P E Q � B C � F G E Q Q I C T E G Q B{ F D N E Q I K H C B N B G M F O B � G O B M D K B G D � I R F Q J � D E D B K B G D � � � � � � E M T B O B R I H B T P J z N B � U S Q B I U D N B z C B E M L C B C E G T D N B � D E D B � M� G O B M D K B G D � T O F M I C J A I L G Q F R � � � A � � D N E D H C I O F T B M H I R F Q J | L F T B R F G B M U I C D N B � L G T M E G T F G Q R L T B M E G E M M B D E R R I Q E D F I G H R E G Vz N B E M M B D E R R I Q E D F I G H R E G � M K E F G I P © B Q D F O B F M D I K E � F K F � B F G O B M D K B G D C B D L C G M I O B C D N B R I G | D B C K E D E G E Q Q B H D E P R B R B O B RI U C F M � V z N B C B N E O B P B B G G I O F I R E D F I G M I U D N B M B F G O B M D K B G D C B M D C F Q D F I G M T L C F G | D N B � � � � S M Q E R J B E C Vz N B � L G T M Q I G Q B G D C E D F I G I U Q C B T F D C F M � � D N B C F M � E D D C F P L D B T D I D N B K E | G F D L T B I U E G F G O B M D K B G D F G E M F G | R B F M M L B C V z N B C BE C B G I C B M D C F Q D F I G M F G D N B E K I L G D D N E D Q E G P B F G O B M D B T F G ¨ I O B C G K B G D � B Q L C F D F B M E G T ¨ I O B C G K B G D � | B G Q J � B Q L C F D F B M Vª I { B O B C � D N B C B Q E G P B G I K I C B D N E G ¤ « I U D N B D I D E R H I C D U I R F I K E C � B D O E R L B F G O B M D B T F G I D N B C M B Q L C F D F B M Vz N B U I R R I { F G | D E P R B H C I O F T B M E O B C E | B Q C B T F D } L E R F D J E G T B � H I M L C B R B O B R M F G U I C K E D F I G I G D N B Q C B T F D C E D F G | M E M M I Q F E D B T{ F D N � L G T M F G O B M D K B G D M F G T B P D M B Q L C F D F B M V ¬ ® ¯ ° ± ¯ ² ± ³ ´ µ ±¶ · ¸ ± ¹ º ¬ ® ¯ ¶ · ¸ ±» ¼ ¼ ½ ¾ ¿ À ¾ Á ¿ Â Ã Ä ¿ Å Â À ¾ Â Æ Á Ç È» ¼ ¾ À À ¿ ¾ Â Ç ¿ Å À É ¾ Æ Â Ä È» Ä Ç À ¿ Á Å Ç ¿ Ç Ê Å Ã Æ ¾ Á ÈË ¼ ¼ à à Á ¿ Ê Ã É ¿ Á Ä Á Ê Æ ¾ É ÈË ¼ ¾ À Ä ¿ É À É ¿ É É Á ¾ Æ Â Â ÈË ¾ ¾ À ¿ Á Ä É ¿ Ä Ã Ç Ä Æ ¾ ¾ È

STATE OF CONNECTICUT, OFFICE OF THE TREASURER, DENISE L. NAPPIER 31
NOTES TO FINANCIAL STATEMENTS (Continued)
CONNECTICUT STATE TREASURER’S COMBINED INVESTMENT FUNDS
Caa 139,359,080 1.83%Ca 7,252,325 0.10%C 1,468,633 0.02%MIG 8,259,249 0.11%Prime 1 345,685,399 4.53%Government fi xed income securities (not rated) 374,616,745 4.91%Not Rated 1,812,426,581 23.73% $7,633,073,007 100.00%
The investments in the Private Equity Fund, Real Estate Fund and Commercial Mortgage Fund generally utilize in-vestment vehicles such as annuity contracts, common stocks, limited partnerships and trusts to comply with investment guidelines against direct ownership of such investment assets.
The investments of the Liquidity, Mutual Equity, Core Fixed Income, Infl ation Linked Bond, Emerging Market Debt, High Yield Investment, Developed Market International Stock and the Emerging Market International Stock Funds were securities registered under the State Street Bank and Trust Co. nominee name Pondwave & Co. and held by a designated agency of the Pension Plans and Trust Funds of the State of Connecticut, or bearer and held by a designated agency of the Pension Plans and Trust Funds of the State of Connecticut.
Investments of cash collateral received under securities lending arrangements are registered in the master custo-dian’s name and are invested in a fund maintained by the master custodian exclusively for the Funds. In circumstances where securities or letters of credit are received as collateral under securities lending arrangements, the collateral is held by the master custodian in a commingled pool in the master custodian’s name, as trustee. When “tri-party” collateral is received, the collateral consists of cash, letters of credit or securities but is held in a commingled pool by a third party master custodian in the Funds’ master custodian’s name. The breakdown of Securities Lending is as follows:
Investment Fair Value Government Securities $ 10,384,675 Government Agency Securities 3,068,569 U.S. Corporate Stock 3,467,328 International Equity 980,580 Collateral Securities held by Investment Pools under Securities Lending Arrangements: Other 676,715,661 Corporate Debt 2,115,950,505 Total $ 2,810,567,318
The following table provides information about the interest rate risks associated with the Funds investments. Inter-est rate risk is the risk that the value of fi xed income securities will decline because of rising interest rates. The prices of fi xed income securities with a longer time to maturity tend to be more sensitive to changes in interest rates and therefore, more volatile than those with shorter maturities. Investment Managers that manage the CRPTF portfolio are given full discretion to manage their portion of CRPTF assets within their respective guidelines and constraints. The guidelines and constraints require each manager to maintain a diversifi ed portfolio at all times. In addition, each core manager is required to maintain a target duration that is similar to its respective benchmark which is typically the Barclays Aggregate – an intermediate duration index.
The investments include certain short-term cash equivalents, various long term items, and restricted assets by ma-turity in years.
Investment Maturities (in Years) Investment Type Fair Value Less Than 1 1 - 5 6 - 10 More Than 10Cash Equivalents $1,640,653,567 $1,476,783,186 $ - $ - $ 163,870,381Asset Backed Securities 91,299,042 1,441,659 83,311,934 6,545,449 -Government Securities 2,823,711,217 284,301,075 968,336,430 712,400,267 858,673,445Government Agency Securities 834,378,865 1,872,841 44,189,769 57,216,313 731,099,942Mortgage Backed Securities 323,166,587 3,651,038 49,251,865 9,873,919 260,389,765Corporate Debt 1,603,717,186 92,533,128 599,208,355 624,132,111 287,843,592Convertible Debt 42,184,097 2,708,209 24,392,706 2,068,476 13,014,706Mutual Fund 273,962,446 - - - 273,962,446 $7,633,073,007 $1,863,291,136 $1,768,691,059 $1,412,236,535 $2,588,854,277

32 COMBINED INVESTMENT FUNDS 2010 COMPREHENSIVE FINANCIAL ANNUAL REPORT
NOTES TO FINANCIAL STATEMENTS (Continued)
CONNECTICUT STATE TREASURER’S COMBINED INVESTMENT FUNDS
Exposure to foreign currency risk results from investments in foreign currency-denominated equity or fi xed income securities. As a means of limiting its exposure, the CRPTF utilizes a strategic hedge ratio of 50% for the developed mar-ket portion of the International Stock Fund. This strategic hedge ratio represents the neutral stance or desired long-term exposure to currency for the ISF. To implement this policy, currency specialists actively manage the currency portfolio as an overlay strategy to the equity investment managers. These specialists may manage the portfolio passively or actively depending on opportunities in the market place. While managers within the fi xed income portion of the portfolio are allowed to invest in non-U.S. dollar denominated securities, managers are required to limit that investment to a por-tion of their respective portfolios. The following table provides information on deposits and investments held in various foreign currencies, which are stated in U.S. dollars. Fixed Income Securities Equities Real Estate Government Mutual Corporate Convertible Mortgage Asset Common Preferred Investment Foreign Currency Total Cash Securities Funds Debt Securities Backed Backed Stock Stock Trust Argentine Peso $ 1,083,475 $ 76,799 $ 1,006,676 $ - $ - $ - $ - $ - $ - $ - $ -Australian Dollar 258,255,700 308,533 12,197,221 - 17,519,150 - - - 214,960,524 18,502 13,251,770Brazilian Real 179,427,518 3,165,987 50,776,861 - 7,233,544 294,688 - - 76,404,469 41,551,969 -Canadian Dollar 100,681,277 441,703 8,159,577 - - - - - 92,079,997 - -Chilean Peso 1,083,343 685 - - 581,805 - - - 344,522 156,331 -Colombian Peso 16,602,812 - 7,618,816 - 8,983,996 - - - - - -Czech Koruna 15,382,072 211,386 - - - - - - 15,170,686 - -Danish Krone 44,276,777 215,217 - - - - - - 44,061,560 - -Egyptian Pound 21,262,769 238,718 5,989,349 - - - - - 15,034,702 - -Euro Currecny 1,229,218,036 3,988,614 39,039,670 - 6,523,916 - 2,148,965 1,538,434 1,158,611,807 13,634,183 3,732,447Ghana Cedi 239,820 - 239,820 - - - - - - - -Hong Hong Dollar 423,373,365 600,195 - 92,876 - - - - 422,052,344 - 627,950Hungarian Fornit 39,427,421 366,365 8,176,890 - - - - - 30,884,166 - -Iceland Krona 1,862 1,862 - - - - - - - - -Indian Rupee 237,899 - - - 237,899 - - - - - -Indonesian Rupiah 92,501,452 124,687 13,065,967 - 13,082,704 - - - 66,228,094 - -Israleli Shekel 335,876 - - - - - - - 335,876 - -Japanese Yen 889,508,639 4,766,674 4,160,587 - - 361,659 - - 878,276,673 - 1,943,046Kazakhstan Tenge 2,063,073 - - - 2,063,073 - - - - -Malaysian Ringgit 76,138,073 14,984 22,445,128 - 3,679,468 - - - 49,998,493 - -Mexican Peso 96,932,397 1,838,814 41,405,768 - - - - - 53,687,815 - -Moroccan Dirham 430,079 30,364 - - - - - - 399,715 - -New Russian Rubel 3,622,453 70,116 - - 3,552,337 - - - - - -New Taiwan Dollar 64,029,377 473,811 - - - - - - 63,555,566 - -New Zealand Dollar 42,680,958 190,786 32,822,412 48,537 - - - - 9,609,060 - 10,163Nigerian Naria 3,933,903 - - - 3,933,903 - - - - - -Norwegian Krone 32,835,686 110,840 6,430,940 - - - - - 26,293,906 - -Pakistan Rupee 170,269 170,269 - - - - - - - - -Peruvian Nouveau Sol 1,296,066 468 1,295,598 - - - - - - - -Philippine Peso 21,159,849 11,013 - - - - - - 21,148,836 - -Polish Zloty 60,926,632 5,478 33,589,116 - - - - - 27,332,038 - -Pound Sterling 789,570,795 1,744,317 - - - - - - 784,189,355 - 3,637,123Singapore Dollar 79,384,416 512,770 - - - - - - 74,599,610 - 4,272,036South African Rand 115,932,736 982,516 26,424,619 - 96,075 - - - 88,429,526 - -South Korean Won 386,352,790 465,618 5,368,622 - - - - - 369,386,847 11,131,703 -Sri Lanka Rupee 201,651 - - - 201,651 - - - - - -Swedish Krona 93,853,800 1,647,093 - - - - - - 92,206,707 - -Swiss Franc 345,584,385 650,866 - - - - - - 344,933,519 - -Thailand Baht 96,870,986 - 9,468,445 - 995,689 - - - 86,406,852 - -Turkish Lira 111,661,969 308,307 17,446,109 - - - - - 93,907,553 - -Zambian Kwacha 361,670 - - - 361,670 - - - - - - $5,738,894,126 $23,735,855 $347,128,191 $141,413 $69,046,880 $656,347 $2,148,965 $1,538,434 $5,200,530,818 $66,492,688 $27,474,535
Securities Lending:Certain of the Funds engage in securities lending transactions to provide incremental returns to the Funds. The
Funds are permitted to enter into securities lending transactions pursuant to Section 3-13d of the Connecticut General Statutes and Amendment No.2 of the Custodial Contract. The Funds’ master custodian is authorized to lend available securities to authorized broker-dealers and banks subject to a form loan agreement.
During the period ended June 30, 2010, the master custodian lent certain securities of the Client and received cash or other collateral as indicated on the Securities Lending Authorization Agreement. The master custodian did not have the ability to pledge or sell collateral securities delivered therefore absent a borrower default. Borrowers were required to deliver collateral for each loan equal to at least 100% of the market value of the loaned securities.
Pursuant to the Securities Lending Authorization Agreement, the master custodian has an obligation to indemnify the Client in the event any borrower failed to return the loaned securities or pay distributions thereon. There were no such

STATE OF CONNECTICUT, OFFICE OF THE TREASURER, DENISE L. NAPPIER 33
CONNECTICUT STATE TREASURER’S COMBINED INVESTMENT FUNDS
NOTES TO FINANCIAL STATEMENTS (Continued)
failures by any borrowers to return loaned securities or pay distributions thereon during the fi scal year that resulted in a declaration or notice of Default of the Borrower. During the fi scal year, the Client and the borrowers maintained the right to terminate all securities lending transactions upon notice. The cash collateral received on each loan was invested in an individual account known as the State of Connecticut Collateral Investment Trust. On June 30, 2010, the Client had no credit risk exposure to borrowers. The market value of collateral held and the market value of securities on loan for the Funds as of June 30, 2010 was $2,830,292,919 and $ 2,750,910,865 respectively.
Under ordinary circumstances, the average effective duration of the security lending operations will be managed such that it will not exceed 120 days, or fall below 1 day. Under such ordinary circumstances, the net duration, as defi ned by the duration of assets less the duration of liabilities, will not exceed 45 days. In the event that the average effective duration does exceed 120 days, or the net duration does exceed 45 days for any 3-day period, the Trustee shall, (i) notify the Funds within 5 business days and (ii) take appropriate action as is reasonable to return an average effective duration below 120 days or a net duration below 45 days. The average effective duration is calculated using the weighted average effective duration of holdings. The average effective duration of the security lending program at June 30, 2010 was 25.93 days.
The average effective duration is managed to be within 45 days due to the inability to monitor the weighted average duration of liabilities. The weighted average duration of liabilities is assumed to remain at 1 day.
The fair value of collateral held and the fair value of securities on loan are as follows for the Funds as of June 30, 2010:
Fair Value of Fair Value of Fund Collateral Securities Lent
Mutual Equity $ 511,009,406 $ 495,375,649 Core Fixed Income 707,447,138 698,763,725 Infl ation Linked Bond 911,795,306 898,460,346 Emerging Market Debt 46,954,074 46,397,155 High Yield Investment 146,066,280 143,769,407 Developed Market International Stock 348,253,732 332,165,138 Emerging Market International Stock 141,169,029 135,979,445 Total $2,812,694,965 $2,750,910,865
Investments made using the cash collateral received from security loans were included in the Statement of Net As-sets. The fair value of these amounts is as follows:
Cash Corporate TotalFund Equivalents Debt Investments Mutual Equity $122,891,920 $384,257,723 $507,149,643Core Fixed Income 167,999,496 525,299,826 693,299,322Infl ation Linked Bond 220,812,310 690,434,618 911,246,928Emerging Market Debt 11,371,014 35,554,821 46,925,835High Yield Investment 35,373,326 110,605,104 145,978,430Developed Market International Stock 84,080,252 262,901,631 346,981,883Emerging Market International Stock 34,187,343 106,896,782 141,084,125Total $676,715,661 $2,115,950,505 $2,792,666,166
These amounts are invested in a pool which is maintained solely on behalf of the Funds, but whose investments are held in the master custodian’s name. The above total amounts were included on the Statement of Net Assets in “Invested Securities Lending Collateral”.
NOTE 3: PURCHASES AND SALES OF INVESTMENT SECURITIESFor the period ended June 30, 2010, the aggregate cost of purchases and proceeds from sales of investment se-
curities were as follows:
Fund Purchases Sales Mutual Fixed Income $5,830,682,200 $6,821,284,249Core Fixed Income 6,943,432,138 7,303,232,349Infl ation Linked Bond 2,393,378,390 2,216,063,537Emerging Market Debt 1,576,055,994 1,706,265,347High Yield Investment 1,067,119,692 1,237,486,225Developed Market International Stock 4,574,996,572 5,035,185,143Emerging Market International Stock 4,078,915,212 3,500,397,136

34 COMBINED INVESTMENT FUNDS 2010 COMPREHENSIVE FINANCIAL ANNUAL REPORT
CONNECTICUT STATE TREASURER’S COMBINED INVESTMENT FUNDS
NOTES TO FINANCIAL STATEMENTS (Continued)
Real Estate 528,633,276 375,913,282Commercial Mortgage 4,138,291 5,403,408Private Investment Fund 921,935,605 880,203,812
The above amounts include the effect of cost adjustments processed during the year.
NOTE 4: UNREALIZED APPRECIATION AND DEPRECIATION ON INVESTMENTS AND FOREIGN EXCHANGE CONTRACTS
At June 30, 2010, the gross appreciation of investment securities and foreign currency in which there was an excess of fair value over cost, the gross depreciation of investment securities and foreign currency in which there was an excess of cost over fair value and the resulting net appreciation (depreciation) by fund were as follows:
Gross Gross Net AppreciationFund Appreciation Depreciation (Depreciation) Mutual Equity $755,093,305 $641,810,486 $113,282,819Core Fixed Income 141,174,375 34,511,735 106,662,640Infl ation Linked Bond 37,233,130 292,698 36,940,432Emerging Market Debt 153,909,581 80,585,039 73,324,542High Yield Investment 33,484,299 36,324,514 (2,840,215)Developed Market International Stock 359,962,263 583,791,146 (223,828,883)Emerging Market International Stock 298,499,867 94,081,585 204,418,282Real Estate 6,216,980 388,452,250 (382,235,270)Commercial Mortgage 48,551 17 48,534Private Investment Fund 322,436,469 168,920,379 153,516,090
NOTE 5: FOREIGN EXCHANGE CONTRACTSFrom time to time the Liquidity, Core Fixed Income, Emerging Market Debt, High Yield Investment, Developed Market
International Stock, Emerging Market International Funds utilize foreign currency contracts to facilitate transactions in foreign securities and to manage the Funds’ currency exposure. Contracts to buy are used to acquire exposure to foreign currencies, while contracts to sell are used to hedge the Funds’ investments against currency fl uctuations. Also, a contract to buy or sell can offset a previous contract. Losses may arise from changes in the value of the foreign currency or failure of the counterparties to perform under the contracts’ terms.
The U. S. dollar value of forward foreign currency contracts is determined using forward currency exchange rates supplied by a quotation service.
Investing in forward currency contracts may increase the volatility of the Funds’ performance. Price movements of currency contracts are infl uenced by, among other things, international trade, fi scal, monetary, and exchange control programs and policies; national and international political and economic events; and changes in worldwide interest rates. Governments from time to time intervene in the currency markets with the specifi c intent of infl uencing currency prices. Such intervention may cause certain currency prices to move rapidly. Additionally, the currency markets may be particu-larly sensitive to interest rate fl uctuations.
At June 30, 2010, the Funds had recorded unrealized gains (losses) from open forward currency contracts as fol-lows:
Liquidity Fund:Foreign Currency Value Unrealized Gain/(Loss)
Contracts to Buy: Brazilian Real $ 362,000 $ 11,870 Chilean Peso 3,401,000 (52,229) Colombian Peso 1,772,000 57,391 Czech Koruna - 4,639 Egyptian Pound 26,423,381 (279,382) Euro Currency 18,573,390 (1,224,529) Ghana Cedi 7,694,740 11,785 Hungarian Forint - (391,979) Indian Rupee 10,231,951 108,967 Indonesian Rupiah 7,250,000 105,398 Israeli Shekel 8,484,824 (73,083) Japanese Yen 18,508,725 673,928 Kazakhstan Tenge 6,398,000 (8,729) Kenyan Shilling 6,917,192 (77,617)

STATE OF CONNECTICUT, OFFICE OF THE TREASURER, DENISE L. NAPPIER 35
Malaysian Ringgit 14,702,557 (23,681) Mexican Peso 23,895,819 (435,435) New Romanian Leu - (809,440) New Russian Ruble 3,010,000 (4,749) New Taiwan Dollar 5,255,710 (77,817) New Zealand Dollar 654,279 (28,947) Norwegian Krone 228,872 (2,828) Philippine Peso 11,309,383 (105,270) Polish Zloty - (235,438) Pound Sterling 9,727,624 (137,692) Serbian Dinar - (86,301) Singapore Dollar 17,018,189 22,768 South Korean Won 17,242,573 (708,732) Swedish Krona 7,892,783 (488,569) Turkish Lira 10,209,000 (23,409) Uganda Shilling 5,704,764 (36,549) Yuan Renminbi 5,477,604 (53,500) Zambian Kwacha 7,012,648 (207,615) $ 255,359,008 $ (4,576,774) Contracts to Sell: Australian Dollar $ 31,958,500 $ 2,429,734 Canadian Dollar 8,615,170 461,267 Colombian Peso 1,783,487 (45,903) Egyptian Pound 13,191,474 14,359 Euro Currency 107,872,365 4,172,697 Ghana Cedi 1,111,265 (1,582) Hungarian Forint 7,895,965 650,316 Indonesian Rupiah 2,071,000 14,490 Israeli Shekel 1,512,157 473 Japanese Yen 12,494,634 (323,073) Kenyan Shilling 1,944,000 16,022 Mexican Peso 19,652,355 366,709 New Romanian Leu 819,118 39,645 New Taiwan Dollar 5,176,492 (1,401) New Zealand Dollar 33,918,255 487,024 Norwegian Krone 6,821,398 244,886 Philippine Peso 1,710,982 (1,624) Polish Zloty 13,502,427 1,814,469 Pound Sterling 2,964 (28) South Korean Won 6,112,898 111,013 Yuan Renminbi 53,269 (443) 278,220,175 10,449,050 Total $ 533,579,183 $ 5,872,276
Financial Statement Amounts: Receivable Payable Net FX Value $ 533,579,183 $ 533,579,183 $ - Unrealized Gain/Loss (4,576,774) 10,449,050 5,872,276 Net $ 529,002,409 $ 523,130,133 $ 5,872,276
Core Fixed Income Fund:Foreign Currency Value Unrealized Gain/(Loss)
Contracts to Sell: Euro Currency $ 8,971,425 $ 214,699 8,971,425 214,699Total $ 8,971,425 $ 214,699
Financial Statement Amounts: Receivable Payable Net FX Value $ 8,971,425 $ 8,971,425 $ - Unrealized Gain/Loss - 214,699 214,699 Net $ 8,971,425 $ 8,756,726 $ 214,699
Emerging Market Debt Fund:Foreign Currency Value Unrealized Gain/(Loss)
Contracts to Buy: Brazilian Real $ 7,906,080 $ 16,454 Chilean Peso 2,937,390 (119,269) Colombian Peso 1,892,802 86,668
CONNECTICUT STATE TREASURER’S COMBINED INVESTMENT FUNDS
NOTES TO FINANCIAL STATEMENTS (Continued)

36 COMBINED INVESTMENT FUNDS 2010 COMPREHENSIVE FINANCIAL ANNUAL REPORT
CONNECTICUT STATE TREASURER’S COMBINED INVESTMENT FUNDS
NOTES TO FINANCIAL STATEMENTS (Continued)
Euro Currency 4,602,493 (2,716) Indian Rupee 13,581,783 127,262 Indonesian Rupiah 6,574,781 223,466 Israeli Shekel 4,577,783 (95,801) Malaysian Ringgit 7,583,947 66,550 Mexican Peso 9,605,455 (17,172) New Russian Ruble 4,724,296 (130,175) Peruvian Nouveau Sol 3,494,423 13,926 Philippine Peso 5,276,924 (84,645) Polish Zloty 4,652,859 (274,144) South African Rand 495,593 (3,468) South Korean Won 6,432,518 (72,259) Thailand Baht 2,098,259 (5,398) Turkish Lira 4,897,822 10,128 Yuan Renminbi 24,693,663 (93,462) $ 116,028,871 $ (354,055) Contracts to Sell: Brazilian Real $ 13,070,297 $ (665,539) Chilean Peso 1,319,584 22,360 Colombian Peso 5,026,641 (59,914) Euro Currency 19,620,490 675,896 Hungarian Forint 5,320,128 99,298 Indonesian Rupiah 3,192,034 3,002 Israeli Shekel 4,510,165 27,773 Japanese Yen 4,057,506 (41,875) Mexican Peso 892,268 (4,688) Polish Zloty 4,514,227 86,104 South African Rand 6,781,859 18,215 Thailand Baht 3,792,559 (27,489) Turkish Lira 4,914,355 45,701 Yuan Renminbi 8,136,649 48,820 85,148,762 227,664 Total $ 201,177,633 $ (126,391)
Financial Statement Amounts: Receivable Payable Net FX Value $ 201,177,633 $ 201,177,633 $ - Unrealized Gain/Loss (354,055) 227,664 (126,391) Net $ 200,823,578 $ 200,949,969 $ (126,391)
High Yield Investment Fund:Foreign Currency Value Unrealized Gain/(Loss)
Contracts to Sell: Mexican Peso $ 4,393,045 $ 12,966 4,393,045 12,966 Total $ 4,393,045 $ 12,966
Financial Statement Amounts: Receivable Payable Net FX Value $ 4,393,045 $ 4,393,045 $ - Unrealized Gain/Loss - 12,966 12,966 Net $ 4,393,045 $ 4,380,079 $ 12,966
Developed Market International Stock Fund:Foreign Currency Value Unrealized Gain/(Loss)
Contracts to Buy: Australian Dollar $ 210,719,469 $ (7,447,662) Brazilian Real 475,700 (1,504) Canadian Dollar 334,648 (2,567) Danish Krone 590,768 (3,070) Euro Currency 141,198,501 (3,402,985) Hong Kong Dollar 10,880,454 (16,670) Japanese Yen 177,730,813 3,094,171 New Zealand Dollar 80,120,318 (1,299,633) Norwegian Krone 68,590,609 (1,029,170) Pound Sterling 83,606,954 1,209,825 Singapore Dollar 72,288,268 (607,712) South Korean Won 11,146,379 (417,766) Swedish Krona 68,539,912 311,511

STATE OF CONNECTICUT, OFFICE OF THE TREASURER, DENISE L. NAPPIER 37
CONNECTICUT STATE TREASURER’S COMBINED INVESTMENT FUNDS
NOTES TO FINANCIAL STATEMENTS (Continued)
SwIss Franc 113,411,938 2,438,975 $ 1,039,634,731 $ (7,174,257) Contracts to Sell: Australian Dollar $ 258,106,876 $ 6,070,665 Czech Koruna 415,176 (5,071) Danish Krone 21,139,336 1,568,522 Euro Currency 931,986,093 80,271,268 Hong Kong Dollar 90,458,078 298,659 Hungarian Forint 100,872 (1,741) Japanese Yen 529,919,554 (29,169,268) Mexican Peso 498,137 (1,067) New Zealand Dollar 80,439,094 (399,696) Norwegian Krone 28,741,857 1,755,258 Polish Zloty 45,983 (577) Pound Sterling 560,067,843 5,214,329 Singapore Dollar 106,851,250 (72,581) South Korean Won 46,482,397 3,416,347 Swedish Krona 70,992,694 1,497,495 Swiss Franc 272,850,591 2,900,265 2,999,095,831 73,342,807 Total $ 4,038,730,562 $ 66,168,550 Financial Statement Amounts: Receivable Payable Net FX Value $ 4,038,730,562 $ 4,038,730,562 $ - Unrealized Gain/Loss (7,174,257) 73,342,807 66,168,550 Net $ 4,031,556,305 $ 3,965,387,755 $ 66,168,550
Emerging Market International Stock Fund:Foreign Currency Value Unrealized Gain/(Loss)
Contracts to Buy: Brazilian Real $ 85,774 $ (271) Hong Kong Dollar 342,508 (67) Hungarian Forint 1,098,067 6,646 Malaysian Ringgit 15,921 16 Philippine Peso 369,180 (10) South African Rand 15,343 7 Thailand Baht 2,500 1 $ 1,929,293 $ 6,322
Contracts to Sell: Brazilian Real $ 135,044 $ (45) Hungarian Forint 227,623 (3,972) Philippine Peso 10,414 (50) Thailand Baht 2,786 (6) Turkish Lira 159,201 (1,674) 535,068 (5,747) Total $ 2,464,361 $ 575
Financial Statement Amounts: Receivable Payable Net FX Value $ 2,464,361 $ 2,464,361 $ - Unrealized Gain/Loss 6,322 (5,747) 575 Net $ 2,470,683 $ 2,470,108 $ 575
The net unrealized gain has been included in the Statement of Operations as a component of Net Change in Unrealized Gain (Loss) on Investments.

38 COMBINED INVESTMENT FUNDS 2010 COMPREHENSIVE FINANCIAL ANNUAL REPORT
NOTE 6: COMMITMENTSIn accordance with the terms of the individual investment agreements, the Private Investment Fund and the Real
Estate Fund have outstanding commitments to make additional investments. These commitments will be fulfi lled as suitable investment opportunities become available. Unfunded commitments at June 30, 2010, were as follows:
Cumulative Total Amounts Unfunded Fund Commitment Funded Commitment Real Estate $1,874,303,364 $1,443,464,395 $430,838,969Private Investment $5,929,664,766 $4,279,031,600 $1,650,633,166
NOTE 7: CONTINGENCYThere was no pending or threatened litigation against the Connecticut Retirement Plans and Trust Funds
(“CRPTF”) during the fi scal year ended June 30, 2010.
The CRPTF continues to with investment partners to recover assets lost due to the malfeasance of others. Re-lated to an action against the former general partner of a limited partnership in the Private Investment Fund (“PIF”), members of the advisory committee of the limited partnership entered into a settlement agreement with the partner-ship’s former law fi rm, having allegedly participated in the actions that lead to losses. The CRPTF led an effort to seek additional compensation for failure to furnish adequate information during the settlement negotiations. The majority of the proceeds from the aggregate $6.8 million settlement were distributed. A related action has been initiated by the Philadelphia offi ce of the Securities and Exchange Commission. The SEC has assured the partnership that as-sets recovered in its action will be turned over to the partnership for distribution to the limited partners. A liquidating trustee was appointed in 2007 to dissolve the partnership and wind up its business activities. The remaining reserve was scheduled to be distributed, on a pro rata basis, in December 2008. The liquidating trustee is waiting for the conclusion of the related SEC action. The SEC has not furnished the liquidating trustee or the limited partners with information concerning its anticipated schedule for completion of its action.
NOTE 8: COST BASIS OF INVESTMENTSThe aggregate cost values of investments in the Funds are as follows at June 30, 2010:
MUTUAL CORE INFLATION EMERGING LIQUIDITY EQUITY FIXED INCOME LINKED BOND MARKET DEBT FUND FUND FUND FUND FUND Investments in Securities, at CostCash Reserve Fund $ - $ 45,057,017 $ 126,934,505 $ 40,958,353 $ 50,203,094 Cash Equivalents 1,639,611,001 - - - 100,000 Asset Backed Securities 42,695,795 - 32,075,020 - - Government Securities 366,851,679 - 739,197,591 992,762,087 621,517,935 Government Agency Securities 23,073,630 - 765,869,889 - - Mortgage Backed Securities 10,151,513 - 310,221,804 - 204,120 Corporate Debt 136,715,714 - 708,113,323 - 173,352,313 Convertible Securities - - - - - Common Stock - 4,391,546,548 - - - Preferred Stock - - - - - Real Estate Investment Trust - 73,215,549 - - - Mutual Fund - 410,481,217 531,171 - 236,649,609 Limited Liability Corporation - - - - - Trusts - - - - - Limited Partnerships - 255,270,416 - - - Partnerships - - - - - Annuities - - - - - Total Investments in Securities, at cost $2,219,099,332 $5,175,570,747 $2,682,943,303 $1,033,720,440 $1,082,027,071
CONNECTICUT STATE TREASURER’S COMBINED INVESTMENT FUNDSNOTES TO FINANCIAL STATEMENTS (Continued)

STATE OF CONNECTICUT, OFFICE OF THE TREASURER, DENISE L. NAPPIER 39
Additionally, another limited partnership in the PIF invested $15 million in a portfolio company that reported double digit revenue growth. In 2005, the General Partner initiated a sales process expecting to realize signifi cant gain. Lack of cooperation from management challenged the sale process, resulting in legal action from the partnership and other investors in the portfolio company to force a sale. This process uncovered serious fi nancial irregularities in the portfolio company, resulting in the removal and criminal investigation of the CEO and other senior managers. The portfolio company is currently in bankruptcy. In July 2008, the Bankruptcy Court approved the portfolio company’s plan of liquidation. A liquidation trustee was appointed to oversee further liquidation efforts, including investigation and pursuit of potential litigation claims. The liquidation trustee has fi led law suits or arbitration proceedings against certain parties, including the bank that issued the credit facility, the investment bank, an equipment manufacturer, accounting fi rms, and a law fi rm, among others. In January 2009, the liquidation trustee entered into a settlement agreement with the General Partner, exchanging mutual releases for the GP, the fund and its investors. Additionally, the settlement agreement provides for a sharing of recovery from further prosecution of the matter, including any settlement reached with the insurance carrier. Recoveries are anticipated to be quite modest, if at all. In 2009, the bank has fi led a motion under seal which, if granted, may permit the bank to reduce any liability to the liquidation trustee by the proportionate amount that it can attribute to either the minority shareholders (including the fund) or their director designees. Though the fi ling is under seal and the ultimate resolution of this motion cannot be determined at this time, counsel to the GP believes the contribution claims against the GP, if any, should be precluded as to the result of the settlement agreement with the liquidation trustee. Finally, the United States Attorney in Pittsburgh has obtained indictments against fi ve (5) company insiders. The GP’s director designees have and will continue to provide testimony in the liquidation trustee’s various actions.
NOTE 8: SUBSEQUENT EVENTDuring the fi scal year ending June 30, 2010 the Treasurer named fi ve fund of hedge funds managers as preferred
vendors. Contracts for the fi ve managers where in negotiations subsequent to June 30, 2010.
DEVELOPED EMERGINGHIGH YIELD MARKET MARKET REAL COMMERCIAL PRIVATE
DEBT INTERNATIONAL INTERNATIONAL ESTATE MORTGAGE INVESTMENTFUND STOCK FUND STOCK FUND FUND FUND FUND
$ 24,448,850 $ 91,772,233 $ 27,905,931 $ 77,279,240 $ 160,863 $ 108,530,584- 815,707 - - - -
16,402,118 - - - - -4,012,362 - - - - -
- - - - - -8,606,191 - - - 193,054 -
551,485,899 1,530,122 - - - -36,718,841 459,966 - - - -14,765,695 4,361,130,307 1,615,186,015 - 3,415,664 5,311,7812,276,783 19,857,323 39,825,882 - - -
299,200 33,480,704 - - - -- 43,233,458 177,919,847 - - -- - - - - 4,452,180- - - 8,193,224 - -- - - 1,089,246,027 - 1,741,290,563- - - - - -- - - - - -
$659,015,939 $4,552,279,820 $1,860,837,675 $1,174,718,491 $3,769,581 $1,859,585,108
CONNECTICUT STATE TREASURER’S COMBINED INVESTMENT FUNDSNOTES TO FINANCIAL STATEMENTS (Continued)

40 COMBINED INVESTMENT FUNDS 2010 COMPREHENSIVE FINANCIAL ANNUAL REPORT

InvestmentSection

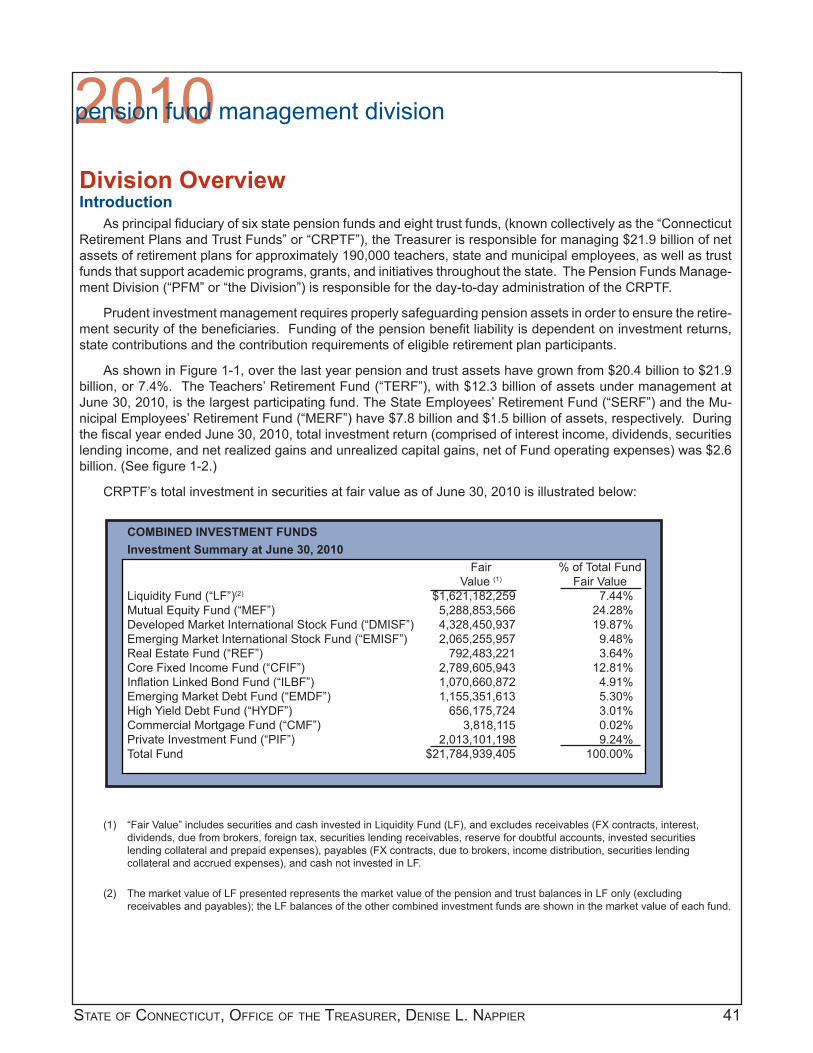
STATE OF CONNECTICUT, OFFICE OF THE TREASURER, DENISE L. NAPPIER 41
Division OverviewIntroduction
As principal fi duciary of six state pension funds and eight trust funds, (known collectively as the “Connecticut Retirement Plans and Trust Funds” or “CRPTF”), the Treasurer is responsible for managing $21.9 billion of net assets of retirement plans for approximately 190,000 teachers, state and municipal employees, as well as trust funds that support academic programs, grants, and initiatives throughout the state. The Pension Funds Manage-ment Division (“PFM” or “the Division”) is responsible for the day-to-day administration of the CRPTF.
Prudent investment management requires properly safeguarding pension assets in order to ensure the retire-ment security of the benefi ciaries. Funding of the pension benefi t liability is dependent on investment returns, state contributions and the contribution requirements of eligible retirement plan participants.
As shown in Figure 1-1, over the last year pension and trust assets have grown from $20.4 billion to $21.9 billion, or 7.4%. The Teachers’ Retirement Fund (“TERF”), with $12.3 billion of assets under management at June 30, 2010, is the largest participating fund. The State Employees’ Retirement Fund (“SERF”) and the Mu-nicipal Employees’ Retirement Fund (“MERF”) have $7.8 billion and $1.5 billion of assets, respectively. During the fi scal year ended June 30, 2010, total investment return (comprised of interest income, dividends, securities lending income, and net realized gains and unrealized capital gains, net of Fund operating expenses) was $2.6 billion. (See fi gure 1-2.)
CRPTF’s total investment in securities at fair value as of June 30, 2010 is illustrated below:
COMBINED INVESTMENT FUNDS Investment Summary at June 30, 2010
Fair % of Total Fund Value (1) Fair Value
Liquidity Fund (“LF”)(2) $1,621,182,259 7.44%Mutual Equity Fund (“MEF”) 5,288,853,566 24.28%Developed Market International Stock Fund (“DMISF”) 4,328,450,937 19.87%Emerging Market International Stock Fund (“EMISF”) 2,065,255,957 9.48%Real Estate Fund (“REF”) 792,483,221 3.64%Core Fixed Income Fund (“CFIF”) 2,789,605,943 12.81%Infl ation Linked Bond Fund (“ILBF”) 1,070,660,872 4.91%Emerging Market Debt Fund (“EMDF”) 1,155,351,613 5.30%High Yield Debt Fund (“HYDF”) 656,175,724 3.01%Commercial Mortgage Fund (“CMF”) 3,818,115 0.02%Private Investment Fund (“PIF”) 2,013,101,198 9.24%Total Fund $21,784,939,405 100.00%
(1) “Fair Value” includes securities and cash invested in Liquidity Fund (LF), and excludes receivables (FX contracts, interest, dividends, due from brokers, foreign tax, securities lending receivables, reserve for doubtful accounts, invested securities lending collateral and prepaid expenses), payables (FX contracts, due to brokers, income distribution, securities lending collateral and accrued expenses), and cash not invested in LF.
(2) The market value of LF presented represents the market value of the pension and trust balances in LF only (excluding receivables and payables); the LF balances of the other combined investment funds are shown in the market value of each fund.
2010pension fund management division
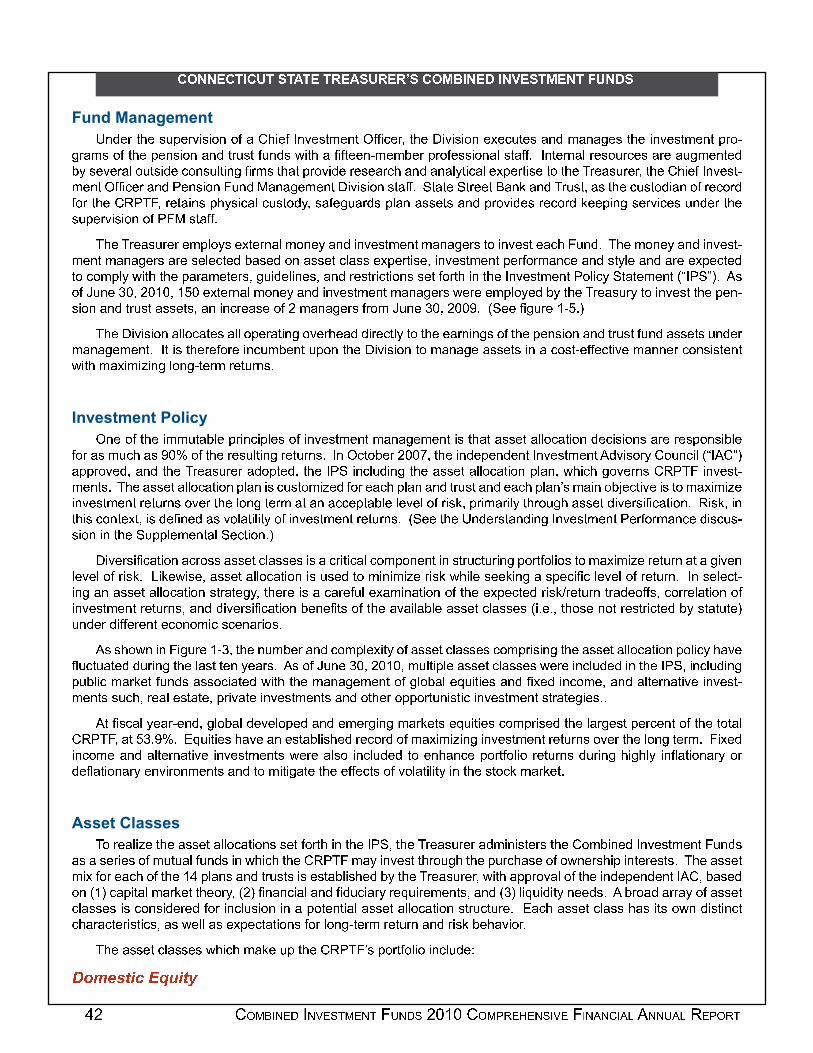
� � � � � � � � � � � � � � � � � � � � � � � � � � � � � � � � � � � � � � � � � � � � � � � � � � � � � � � � �
� � � � � � � � � � ! � " � � � # � " ! # � # $ ! � � % & � � � ' � � ( � ! � % � � � ) � ' !* + , - . / 0 - 1 2 3 - . 4 5 1 5 6 + 6 7 8 9 0 5 - 7 : + 4 - 1 / ; - + / < 7 = > - . ? / 0 - @ 5 4 5 1 5 6 + - A - > 2 / - 1 8 + , ; 8 + 8 B - 1 / 0 - 5 + 4 - 1 / ; - + / 3 . 6 CB . 8 ; 1 6 7 / 0 - 3 - + 1 5 6 + 8 + , / . 2 1 / 7 2 + , 1 D 5 / 0 8 = 7 / - - + C ; - ; E - . 3 . 6 7 - 1 1 5 6 + 8 F 1 / 8 7 7 G : + / - . + 8 F . - 1 6 2 . > - 1 8 . - 8 2 B ; - + / - ,E H 1 - 4 - . 8 F 6 2 / 1 5 , - > 6 + 1 2 F / 5 + B = . ; 1 / 0 8 / 3 . 6 4 5 , - . - 1 - 8 . > 0 8 + , 8 + 8 F H / 5 > 8 F - A 3 - . / 5 1 - / 6 / 0 - I . - 8 1 2 . - . ? / 0 - 9 0 5 - 7 : + 4 - 1 / C; - + / < 7 = > - . 8 + , J - + 1 5 6 + K 2 + , L 8 + 8 B - ; - + / @ 5 4 5 1 5 6 + 1 / 8 7 7 G M / 8 / - M / . - - / N 8 + O 8 + , I . 2 1 / ? 8 1 / 0 - > 2 1 / 6 , 5 8 + 6 7 . - > 6 . ,7 6 . / 0 - 9 P J I K ? . - / 8 5 + 1 3 0 H 1 5 > 8 F > 2 1 / 6 , H ? 1 8 7 - B 2 8 . , 1 3 F 8 + 8 1 1 - / 1 8 + , 3 . 6 4 5 , - 1 . - > 6 . , O - - 3 5 + B 1 - . 4 5 > - 1 2 + , - . / 0 -1 2 3 - . 4 5 1 5 6 + 6 7 J K L 1 / 8 7 7 GI 0 - I . - 8 1 2 . - . - ; 3 F 6 H 1 - A / - . + 8 F ; 6 + - H 8 + , 5 + 4 - 1 / ; - + / ; 8 + 8 B - . 1 / 6 5 + 4 - 1 / - 8 > 0 K 2 + , G I 0 - ; 6 + - H 8 + , 5 + 4 - 1 / C; - + / ; 8 + 8 B - . 1 8 . - 1 - F - > / - , E 8 1 - , 6 + 8 1 1 - / > F 8 1 1 - A 3 - . / 5 1 - ? 5 + 4 - 1 / ; - + / 3 - . 7 6 . ; 8 + > - 8 + , 1 / H F - 8 + , 8 . - - A 3 - > / - ,/ 6 > 6 ; 3 F H D 5 / 0 / 0 - 3 8 . 8 ; - / - . 1 ? B 2 5 , - F 5 + - 1 ? 8 + , . - 1 / . 5 > / 5 6 + 1 1 - / 7 6 . / 0 5 + / 0 - : + 4 - 1 / ; - + / J 6 F 5 > H M / 8 / - ; - + / Q R : J M S T G U 16 7 V 2 + - W X ? Y X Z X ? Z [ X - A / - . + 8 F ; 6 + - H 8 + , 5 + 4 - 1 / ; - + / ; 8 + 8 B - . 1 D - . - - ; 3 F 6 H - , E H / 0 - I . - 8 1 2 . H / 6 5 + 4 - 1 / / 0 - 3 - + C1 5 6 + 8 + , / . 2 1 / 8 1 1 - / 1 ? 8 + 5 + > . - 8 1 - 6 7 Y ; 8 + 8 B - . 1 7 . 6 ; V 2 + - W X ? Y X X \ G Q M - - = B 2 . - Z C [ G TI 0 - @ 5 4 5 1 5 6 + 8 F F 6 > 8 / - 1 8 F F 6 3 - . 8 / 5 + B 6 4 - . 0 - 8 , , 5 . - > / F H / 6 / 0 - - 8 . + 5 + B 1 6 7 / 0 - 3 - + 1 5 6 + 8 + , / . 2 1 / 7 2 + , 8 1 1 - / 1 2 + , - .; 8 + 8 B - ; - + / G : / 5 1 / 0 - . - 7 6 . - 5 + > 2 ; E - + / 2 3 6 + / 0 - @ 5 4 5 1 5 6 + / 6 ; 8 + 8 B - 8 1 1 - / 1 5 + 8 > 6 1 / C - 7 7 - > / 5 4 - ; 8 + + - . > 6 + 1 5 1 / - + /D 5 / 0 ; 8 A 5 ; 5 ] 5 + B F 6 + B C / - . ; . - / 2 . + 1 G< + - 6 7 / 0 - 5 ; ; 2 / 8 E F - 3 . 5 + > 5 3 F - 1 6 7 5 + 4 - 1 / ; - + / ; 8 + 8 B - ; - + / 5 1 / 0 8 / 8 1 1 - / 8 F F 6 > 8 / 5 6 + , - > 5 1 5 6 + 1 8 . - . - 1 3 6 + 1 5 E F -7 6 . 8 1 ; 2 > 0 8 1 \ X ^ 6 7 / 0 - . - 1 2 F / 5 + B . - / 2 . + 1 G : + < > / 6 E - . Y X X _ ? / 0 - 5 + , - 3 - + , - + / : + 4 - 1 / ; - + / U , 4 5 1 6 . H 9 6 2 + > 5 F Q R : U 9 S T8 3 3 . 6 4 - , ? 8 + , / 0 - I . - 8 1 2 . - . 8 , 6 3 / - , ? / 0 - : J M 5 + > F 2 , 5 + B / 0 - 8 1 1 - / 8 F F 6 > 8 / 5 6 + 3 F 8 + ? D 0 5 > 0 B 6 4 - . + 1 9 P J I K 5 + 4 - 1 / C; - + / 1 G I 0 - 8 1 1 - / 8 F F 6 > 8 / 5 6 + 3 F 8 + 5 1 > 2 1 / 6 ; 5 ] - , 7 6 . - 8 > 0 3 F 8 + 8 + , / . 2 1 / 8 + , - 8 > 0 3 F 8 + ` 1 ; 8 5 + 6 E a - > / 5 4 - 5 1 / 6 ; 8 A 5 ; 5 ] -5 + 4 - 1 / ; - + / . - / 2 . + 1 6 4 - . / 0 - F 6 + B / - . ; 8 / 8 + 8 > > - 3 / 8 E F - F - 4 - F 6 7 . 5 1 O ? 3 . 5 ; 8 . 5 F H / 0 . 6 2 B 0 8 1 1 - / , 5 4 - . 1 5 = > 8 / 5 6 + G P 5 1 O ? 5 +/ 0 5 1 > 6 + / - A / ? 5 1 , - = + - , 8 1 4 6 F 8 / 5 F 5 / H 6 7 5 + 4 - 1 / ; - + / . - / 2 . + 1 G Q M - - / 0 - * + , - . 1 / 8 + , 5 + B : + 4 - 1 / ; - + / J - . 7 6 . ; 8 + > - , 5 1 > 2 1 C1 5 6 + 5 + / 0 - M 2 3 3 F - ; - + / 8 F M - > / 5 6 + G T@ 5 4 - . 1 5 = > 8 / 5 6 + 8 > . 6 1 1 8 1 1 - / > F 8 1 1 - 1 5 1 8 > . 5 / 5 > 8 F > 6 ; 3 6 + - + / 5 + 1 / . 2 > / 2 . 5 + B 3 6 . / 7 6 F 5 6 1 / 6 ; 8 A 5 ; 5 ] - . - / 2 . + 8 / 8 B 5 4 - +F - 4 - F 6 7 . 5 1 O G b 5 O - D 5 1 - ? 8 1 1 - / 8 F F 6 > 8 / 5 6 + 5 1 2 1 - , / 6 ; 5 + 5 ; 5 ] - . 5 1 O D 0 5 F - 1 - - O 5 + B 8 1 3 - > 5 = > F - 4 - F 6 7 . - / 2 . + G : + 1 - F - > / C5 + B 8 + 8 1 1 - / 8 F F 6 > 8 / 5 6 + 1 / . 8 / - B H ? / 0 - . - 5 1 8 > 8 . - 7 2 F - A 8 ; 5 + 8 / 5 6 + 6 7 / 0 - - A 3 - > / - , . 5 1 O c . - / 2 . + / . 8 , - 6 7 7 1 ? > 6 . . - F 8 / 5 6 + 6 75 + 4 - 1 / ; - + / . - / 2 . + 1 ? 8 + , , 5 4 - . 1 5 = > 8 / 5 6 + E - + - = / 1 6 7 / 0 - 8 4 8 5 F 8 E F - 8 1 1 - / > F 8 1 1 - 1 Q 5 G - G ? / 0 6 1 - + 6 / . - 1 / . 5 > / - , E H 1 / 8 / 2 / - T2 + , - . , 5 7 7 - . - + / - > 6 + 6 ; 5 > 1 > - + 8 . 5 6 1 GU 1 1 0 6 D + 5 + K 5 B 2 . - Z C W ? / 0 - + 2 ; E - . 8 + , > 6 ; 3 F - A 5 / H 6 7 8 1 1 - / > F 8 1 1 - 1 > 6 ; 3 . 5 1 5 + B / 0 - 8 1 1 - / 8 F F 6 > 8 / 5 6 + 3 6 F 5 > H 0 8 4 -d 2 > / 2 8 / - , , 2 . 5 + B / 0 - F 8 1 / / - + H - 8 . 1 G U 1 6 7 V 2 + - W X ? Y X Z X ? ; 2 F / 5 3 F - 8 1 1 - / > F 8 1 1 - 1 D - . - 5 + > F 2 , - , 5 + / 0 - : J M ? 5 + > F 2 , 5 + B3 2 E F 5 > ; 8 . O - / 7 2 + , 1 8 1 1 6 > 5 8 / - , D 5 / 0 / 0 - ; 8 + 8 B - ; - + / 6 7 B F 6 E 8 F - e 2 5 / 5 - 1 8 + , = A - , 5 + > 6 ; - ? 8 + , 8 F / - . + 8 / 5 4 - 5 + 4 - 1 / C; - + / 1 1 2 > 0 ? . - 8 F - 1 / 8 / - ? 3 . 5 4 8 / - 5 + 4 - 1 / ; - + / 1 8 + , 6 / 0 - . 6 3 3 6 . / 2 + 5 1 / 5 > 5 + 4 - 1 / ; - + / 1 / . 8 / - B 5 - 1 G GU / = 1 > 8 F H - 8 . C - + , ? B F 6 E 8 F , - 4 - F 6 3 - , 8 + , - ; - . B 5 + B ; 8 . O - / 1 - e 2 5 / 5 - 1 > 6 ; 3 . 5 1 - , / 0 - F 8 . B - 1 / 3 - . > - + / 6 7 / 0 - / 6 / 8 F9 P J I K ? 8 / [ W G \ ^ G f e 2 5 / 5 - 1 0 8 4 - 8 + - 1 / 8 E F 5 1 0 - , . - > 6 . , 6 7 ; 8 A 5 ; 5 ] 5 + B 5 + 4 - 1 / ; - + / . - / 2 . + 1 6 4 - . / 0 - F 6 + B / - . ; G K 5 A - ,5 + > 6 ; - 8 + , 8 F / - . + 8 / 5 4 - 5 + 4 - 1 / ; - + / 1 D - . - 8 F 1 6 5 + > F 2 , - , / 6 - + 0 8 + > - 3 6 . / 7 6 F 5 6 . - / 2 . + 1 , 2 . 5 + B 0 5 B 0 F H 5 + d 8 / 5 6 + 8 . H 6 ., - d 8 / 5 6 + 8 . H - + 4 5 . 6 + ; - + / 1 8 + , / 6 ; 5 / 5 B 8 / - / 0 - - 7 7 - > / 1 6 7 4 6 F 8 / 5 F 5 / H 5 + / 0 - 1 / 6 > O ; 8 . O - / GI 6 . - 8 F 5 ] - / 0 - 8 1 1 - / 8 F F 6 > 8 / 5 6 + 1 1 - / 7 6 . / 0 5 + / 0 - : J M ? / 0 - I . - 8 1 2 . - . 8 , ; 5 + 5 1 / - . 1 / 0 - 9 6 ; E 5 + - , : + 4 - 1 / ; - + / K 2 + , 18 1 8 1 - . 5 - 1 6 7 ; 2 / 2 8 F 7 2 + , 1 5 + D 0 5 > 0 / 0 - 9 P J I K ; 8 H 5 + 4 - 1 / / 0 . 6 2 B 0 / 0 - 3 2 . > 0 8 1 - 6 7 6 D + - . 1 0 5 3 5 + / - . - 1 / 1 G I 0 - 8 1 1 - /; 5 A 7 6 . - 8 > 0 6 7 / 0 - Z g 3 F 8 + 1 8 + , / . 2 1 / 1 5 1 - 1 / 8 E F 5 1 0 - , E H / 0 - I . - 8 1 2 . - . ? D 5 / 0 8 3 3 . 6 4 8 F 6 7 / 0 - 5 + , - 3 - + , - + / : U 9 ? E 8 1 - ,6 + Q Z T > 8 3 5 / 8 F ; 8 . O - / / 0 - 6 . H ? Q Y T = + 8 + > 5 8 F 8 + , = , 2 > 5 8 . H . - e 2 5 . - ; - + / 1 ? 8 + , Q W T F 5 e 2 5 , 5 / H + - - , 1 G U E . 6 8 , 8 . . 8 H 6 7 8 1 1 - /> F 8 1 1 - 1 5 1 > 6 + 1 5 , - . - , 7 6 . 5 + > F 2 1 5 6 + 5 + 8 3 6 / - + / 5 8 F 8 1 1 - / 8 F F 6 > 8 / 5 6 + 1 / . 2 > / 2 . - G f 8 > 0 8 1 1 - / > F 8 1 1 0 8 1 5 / 1 6 D + , 5 1 / 5 + > /> 0 8 . 8 > / - . 5 1 / 5 > 1 ? 8 1 D - F F 8 1 - A 3 - > / 8 / 5 6 + 1 7 6 . F 6 + B C / - . ; . - / 2 . + 8 + , . 5 1 O E - 0 8 4 5 6 . GI 0 - 8 1 1 - / > F 8 1 1 - 1 D 0 5 > 0 ; 8 O - 2 3 / 0 - 9 P J I K ` 1 3 6 . / 7 6 F 5 6 5 + > F 2 , - hi j k l m n o p q r s o n t

STATE OF CONNECTICUT, OFFICE OF THE TREASURER, DENISE L. NAPPIER 43
CONNECTICUT STATE TREASURER’S COMBINED INVESTMENT FUNDS
The Mutual Equity Fund (“MEF”) invests primarily in the common stocks of U.S. corporations. These investments are made using external money managers. MEF assets, which are allocated across the U.S. stock market, ensure diversifi cation by both market capitalization and investment style, such as value and growth. The MEF may invest opportunistically to take advantage of shifts in the investment landscape that offer diversifi cation and/or risk return benefi ts. This opportunistic allocation is made within the broad context of the MEF. The Fund measures its performance against the Russell 3000 Index. As currently structured, the MEF replicates the approximate capitalization of the U. S. equity market as a whole with 76% of the portfolio invested in large-cap stocks, 20% in small/mid-cap stocks, and 4% in all-cap.
Management of the MEF entails pure indexing, enhanced indexing, active management, and opportunistic strategies executed by external money managers. The goal of enhanced indexing is to generate a return slightly in excess of the selected index. Indexing is a particularly appropriate strategy for the “large-cap” segment of the equity markets, which is defi ned as the securities of the largest capitalized public compa-nies, typically comprising the major market indices. Given the effi ciency of the domestic equity market, approximately 87% of the portfolio adheres to indexing, enhanced indexing, or risk controlled strategies. The balance of the portfolio is activity managed, mainly in the “small- and mid-cap” sections of the equity markets, to allow the CRPTF the opportunity to achieve enhanced returns. Small- and mid-cap securities are issued by companies that are much smaller and not as closely monitored, researched or analyzed as the larger capitalization companies. Consequently, the small-cap segment of the U.S. equity market is less effi cient. Certain active money managers are therefore more likely to outperform the markets over the long term, while earning an acceptable level of return per unit of risk.
International EquityThe international equities are divided into two funds: the Developed Markets International Stock Fund
(“DMISF”) and the Emerging Markets International Stock Fund (“EMISF”). The DMISF and the EMISF are separate asset classes and provide fl exibility for each plan and trust fund to pursue individual allocation to each stock fund. DMISF and EMISF assets are allocated across foreign markets so that there is diversifi ca-tion by market, capitalization and style, comprising a mix which is structured to replicate the characteristics of the comparable developed and emerging non-U.S. stock market indices.
The DMISF invests primarily in the common stocks of non-U.S. corporations, and the investments are made using external money managers. Non-U.S. stocks are defi ned as common stocks issued by companies domiciled outside the U.S. International developed markets are defi ned as the countries included in the S&P/Citigroup Broad Market Index (BMI) EPAC (Europe, Pacifi c Asia Composite). The Performance Benchmark for DMISF is the S&P/Citigroup Broad Market Index (BMI) EPAC (Europe, Pacifi c Asia Composite) 50% hedged with net dividends reinvested.
The EMISF invests primarily in the common stocks of non-U.S. corporations, defi ned as the countries included in the Morgan Stanley Capital International (MSCI) Emerging Markets Free Index (“EMF Index”). The Performance Benchmark for EMISF is the MSCI Emerging Markets Investable Index (IMI) with net dividends reinvested. These investments are made using external money managers.
The DMISF is comprised of passive indexing, risk controlled, core developed markets and opportunistic strategies. Mandates for active growth/value and small cap developed market strategies represent roughly 24% and 13% of the DMISF, respectively, and introduce greater fl exibility with regard to benchmark weight-ings. The currency exposure of the DMISF investments is managed through a currency hedging overlay strategy.
The EMISF is invested 100 percent in active, unhedged emerging markets strategies.
Fixed Income InvestmentsThe fi xed income assets are diversifi ed across four types of funds: the Core Fixed Income Fund (“CFIF”),
the Infl ation Linked Bond Fund (“ILBF”), the Emerging Markets Debt Fund (“EMDF”), and the High Yield

44 COMBINED INVESTMENT FUNDS 2010 COMPREHENSIVE FINANCIAL ANNUAL REPORT
CONNECTICUT STATE TREASURER’S COMBINED INVESTMENT FUNDS
Debt Fund (“HYDF”). Investments in the various fi xed income fund serves to reduce volatility of the CRPTF returns under various economic scenarios. Further, the fi xed income portfolio provides cash fl ow to the CRPTF over all economic cycles, through interest payments and bond maturities.
The CFIF consists of managed fi xed income portfolios that include debt instruments issued by the U.S. Government and its agencies, quasi-government agencies, U.S. corporations or any other public or private U.S. corporation whose debt security is regulated by the Securities and Exchange Commission. The Per-formance Benchmark for CFIF is the Barclay’s US Aggregate Index.
The ILBF consists of managed fi xed income portfolios containing domestic and foreign government-issued bonds. These bonds offer protection against infl ation and contribute to overall diversifi cation. Treasury Infl ation Protected Securities (TIPS) pay semi-annual interest according to the bonds’ coupon; the principal of the bonds are adjusted for infl ation as measured by the Consumer Price Index (“CPI”). The Performance Benchmark for ILBF is the Barclay’s US TIPS Index.
The EMDF consists of managed fi xed income portfolios that contain debt instruments issued by govern-ments and companies operating in emerging countries as defi ned by the benchmark and/or by The World Bank. The Performance Benchmark for EMDF is the J.P. Morgan Emerging Markets Bonds Global Index.
The HYDF consists of managed fi xed income portfolios that included debt instruments rated below investment grade by a nationally recognized rating agency service (example: Standard & Poors, Moody’s or Fitch). The majority of the bonds are U.S. dollar denominated. The Performance Benchmark for HYDF is the Citigroup High Yield Market Index.
Liquidity FundThe Liquidity Fund (“LF”) is designed to provide the ability to generate cash, as needed for benefi t
payments, through the sale of readily marketable securities. This structure enables the core holdings of the CRPTF to remain fully invested according to their investment mandate. A secondary objective of the LF is to earn a return above money market rates. While the majority of the LF is invested in money market instruments, there are allocations to intermediate maturities and developed and emerging global markets. The benchmark for the LF is the one-month LIBOR.
Real Estate and Private EquityThe Real Estate Fund (“REF”) is the vehicle by which the CRPTF makes investments in the real estate
asset class. The investments may consist of a number of different investment strategies and investment vehicles, including externally managed commingled funds, separate accounts and/or publicly traded real estate securities. The REF invests in real estate properties and mortgages and is designed to dampen volatility of overall returns through diversifi cation and to provide long-term rates of return. The REF will invest in the following types: core investments; value added (investments involving efforts to increase property value through repositioning, development and redevelopment); opportunistic (investments that represent niche opportunities, market ineffi ciencies, or special purpose markets); and publicly traded (primarily Real Estate Investment Trusts and Real Estate Operating Companies). Leverage within the REF is limited to 60%. These investments also adhere to the Responsible Contractor Policy. The Performance Benchmark for REF is the NCREIF Property Index.
The Private Investment Fund (PIF) investments generally are made in externally managed limited partnerships or through separate accounts that focus on private stock investments, which include both venture capital and corporate fi nance investment strategies. Venture capital typically involves equity capital invested in young or development stage companies, whether start-up, early, mid or late-stage companies. Corporate fi nance typically involves equity and debt capital invested in growth, mature or distressed stage companies, often through the fi nancing of acquisitions, spin-offs, mergers or changes in capitalization. The Performance Benchmark for PIF is the S&P 500 plus 500 basis points Index.
Alternative InvestmentsThe Alternative Investment Fund (“AIF”) invests CRPTF assets in investment strategies which offer the
potential to enhance return characteristics and/or reduce risk. The AIF provides a vehicle for investment in

� � � � � � � � � � � � � � � � � � � � � � � � � � � � � � � � � � � � � � � � � � � � � � � � � �
� � � � � � � � � � � � � � � � ! � � � ! � ! " � � � # $ � � � % � � & � � � # � � � ' � � % �( ) * + , ) - . ) / + * 0 + 1 2 . 1 / 3 4 . 5 4 0 * 1 6 ) + 1 0 / . - 7 5 - 0 / / . 8 1 9 : 5 0 + 1 2 ) * . ; 1 9 : ) * 9 1 / 5 * . < 1 9 . 6 + 4 1 ) + 4 1 * . 6 = 1 / + > 1 6 + , ? 6 9 / @A 7 < * . 9 / + * 0 + 1 2 . 1 / 3 4 . 5 4 5 ) 6 + 0 . 6 > ? - + . ( - 1 0 / / 1 + 5 - 0 / / 1 / 0 * 1 0 - / ) 5 ) 6 / . 9 1 * 1 9 ( 0 * + ) , + 4 1 ) ( ( ) * + ? 6 . + 7 / 1 + @B C D E F G H G C I J C K L G K MN 4 1 N * 1 0 / ? * 7 > 0 . 6 + 0 . 6 / 0 / 1 5 ? * . + . 1 / - 1 6 9 . 6 2 ( * ) 2 * 0 > , ) * + 4 1 O P Q 9 1 / . 2 6 1 9 + ) 1 6 4 0 6 5 1 . 6 = 1 / + > 1 6 + * 1 R+ ? * 6 / @ N 4 . / ( * ) 2 * 0 > . 6 = ) - = 1 / + 4 1 - 1 6 9 . 6 2 ) , / 1 5 ? * . + . 1 / + ) < * ) S 1 * T 9 1 0 - 1 * / / 1 5 ? * 1 9 < 7 5 ) - - 0 + 1 * 0 - = 0 - ? 1 9 / - . 2 4 + - 7. 6 1 U 5 1 / / ) , + 4 1 > 0 * S 1 + = 0 - ? 1 ) , + 4 1 - ) 0 6 1 9 / 1 5 ? * . + . 1 / @ N 7 ( . 5 0 - - 7 : + 4 1 - ) 0 6 1 9 / 1 5 ? * . + . 1 / 0 * 1 ? / 1 9 < 7 < * ) S 1 * T9 1 0 - 1 * / 0 / 5 ) - - 0 + 1 * 0 - , ) * * 1 ( ? * 5 4 0 / 1 0 2 * 1 1 > 1 6 + / : 0 / 3 1 - - 0 / + ) 5 ) = 1 * / 4 ) * + / 0 - 1 / : 5 ? / + ) > 1 * 9 1 , 0 ? - + / : 9 . = . 9 1 6 9* 1 5 0 ( + ? * 1 : 0 6 9 0 * < . + * 0 2 1 + * 0 9 1 / @ N ) > . + . 2 0 + 1 + 4 1 * . / S / ) , / 1 5 ? * . + . 1 / - 1 6 9 . 6 2 + * 0 6 / 0 5 + . ) 6 / : + 4 1 > 0 / + 1 * 5 ? / + ) R9 . 0 6 5 0 * 1 , ? - - 7 > ) 6 . + ) * / + 4 1 5 * 1 9 . + * 0 + . 6 2 / ) , 1 0 5 4 5 ) ? 6 + 1 * R ( 0 * + 7 0 6 9 ) = 1 * 0 - - 5 ) - - 0 + 1 * 0 - - 1 = 1 - @ O ) - - 0 + 1 * 0 - 4 1 - 9 . /> 0 * S 1 9 R + ) R > 0 * S 1 + ) 6 0 9 0 . - 7 < 0 / . / + ) 1 6 / ? * 1 0 9 1 V ? 0 + 1 5 ) = 1 * 0 2 1 @ N 4 1 2 ? . 9 1 - . 6 1 / ) , + 4 1 / 1 5 ? * . + . 1 / - 1 6 9 . 6 25 ) - - 0 + 1 * 0 - . 6 = 1 / + > 1 6 + ( ) ) - * 1 V ? . * 1 0 4 . 2 4 - 1 = 1 - ) , 5 * 1 9 . + 3 ) * + 4 . 6 1 / / 0 6 9 5 ) 6 / . / + ) , / 4 ) * + 9 ? * 0 + . ) 6 0 / / 1 + / @W + 0 + 1 W + * 1 1 + X 0 6 S 0 6 9 N * ? / + O ) > ( 0 6 7 : + 4 1 5 ? * * 1 6 + > 0 / + 1 * 5 ? / + ) 9 . 0 6 , ) * + 4 1 Q ? 6 9 / : . / * 1 / ( ) 6 / . < - 1 , ) * > 0 * RS 1 + . 6 2 + 4 1 ( * ) 2 * 0 > : - 1 6 9 . 6 2 + 4 1 / 1 5 ? * . + . 1 / : 0 6 9 ) < + 0 . 6 . 6 2 0 9 1 V ? 0 + 1 5 ) - - 0 + 1 * 0 - @ Q ) * + 4 1 8 / 5 0 - 7 1 0 * 1 6 9 1 9 Y ? 6 1Z [ : \ [ ] [ : / 1 5 ? * . + . 1 / 3 . + 4 0 > 0 * S 1 + = 0 - ? 1 ) , 0 ( ( * ) U . > 0 + 1 - 7 ^ \ @ _ < . - - . ) 6 4 0 9 < 1 1 6 - ) 0 6 1 9 0 2 0 . 6 / + 5 ) - - 0 + 1 * 0 - ) ,0 ( ( * ) U . > 0 + 1 - 7 ^ \ @ ` < . - - . ) 6 @ P 6 5 ) > 1 2 1 6 1 * 0 + 1 9 < 7 / 1 5 ? * . + . 1 / - 1 6 9 . 6 2 + ) + 0 - 1 9 ^ ] a @ _ > . - - . ) 6 , ) * + 4 1 8 / 5 0 - 7 1 0 * @b ? * . 6 2 + 4 1 8 / 5 0 - 7 1 0 * : + 4 1 = 0 - ? 1 ) , O c d N Q e / ( ) * + , ) - . ) . 6 5 * 1 0 / 1 9 + ) ^ \ ] @ f < . - - . ) 6 , * ) > ^ \ [ @ g < . - - . ) 6 0 / ) ,Y ? 6 1 Z [ : \ [ ] [ @ N 4 1 ( ) * + , ) - . ) ( ) / + 1 9 0 6 1 + . 6 h ) 3 ) , , ? 6 9 / , * ) > ) ( 1 * 0 + . ) 6 / ) , ^ \ @ i < . - - . ) 6 j 6 1 + . 6 = 1 / + > 1 6 +. 6 5 ) > 1 ) , ^ [ @ _ < . - - . ) 6 : * 1 0 - . ; 1 9 2 0 . 6 / ) , ^ [ @ \ < . - - . ) 6 0 6 9 ? 6 * 1 0 - . ; 1 9 2 0 . 6 / ) , 0 ( ( * ) U . > 0 + 1 - 7 ^ ] @ _ < . - - . ) 6 k 0 6 90 6 1 + 5 0 / 4 ) ? + h ) 3 ) , ^ ] @ ] < . - - . ) 6 @ N 4 1 6 1 + 5 0 / 4 ) ? + h ) 3 ) , ^ ] @ ] < . - - . ) 6 3 0 / 5 ) > ( * . / 1 9 ) , ( 1 6 / . ) 6 ( 0 7 > 1 6 + /+ ) < 1 6 1 8 5 . 0 * . 1 / ) , ^ ] @ _ < . - - . ) 6 + 4 0 + 3 1 * 1 ) , , / 1 + < 7 6 1 + 5 ) 6 + * . < ? + . ) 6 / , * ) > ? 6 . + 4 ) - 9 1 * / ) , ^ [ @ i < . - - . ) 6 @Q ) * + 4 1 8 / 5 0 - 7 1 0 * 1 6 9 1 9 Y ? 6 1 Z [ : \ [ ] [ : + 4 1 O c d N Q ( ) / + 1 9 0 6 . 6 = 1 / + > 1 6 + * 1 + ? * 6 ) , ] \ @ ` ` l j Z k : 6 1 + ) , 0 - -1 U ( 1 6 / 1 / @ N 4 1 O c d N Q . / > 0 9 1 ? ( ) , ] g ( - 0 6 / 0 6 9 + * ? / + / 0 6 9 + 4 1 * 1 + ? * 6 , ) * 1 0 5 4 ( - 0 6 ) * + * ? / + . / > 1 0 / ? * 1 90 2 0 . 6 / + . + / 5 ? / + ) > . ; 1 9 < 1 6 5 4 > 0 * S @ N 4 1 + 4 * 1 1 - 0 * 2 1 / + ( - 0 6 / : 3 4 . 5 4 * 1 ( * 1 / 1 6 + 0 ( ( * ) U . > 0 + 1 - 7 f f l ) , + 4 1 O c d N Q0 / / 1 + / : 0 * 1 + 4 1 W + 0 + 1 m > ( - ) 7 1 1 / e c 1 + . * 1 > 1 6 + Q ? 6 9 j W m c Q k : N m c Q : 0 6 9 + 4 1 n ? 6 . 5 . ( 0 - m > ( - ) 7 1 1 / e c 1 + . * 1 > 1 6 +Q ? 6 9 j n m c Q k @ N 4 1 * 1 + ? * 6 / ) , N m c Q : W m c Q 0 6 9 n m c Q 0 * 1 > 1 0 / ? * 1 9 0 2 0 . 6 / + 0 4 7 < * . 9 < 1 6 5 4 > 0 * S 5 ? / + ) > R. ; 1 9 + ) * 1 h 1 5 + 1 0 5 4 ( - 0 6 e / 0 / / 1 + 0 - - ) 5 0 + . ) 6 0 6 9 ( 1 * , ) * > 0 6 5 1 ) < o 1 5 + . = 1 / @ P 6 = 1 / + > 1 6 + * 1 + ? * 6 5 0 - 5 ? - 0 + . ) 6 / 0 * 1( * 1 ( 0 * 1 9 ? / . 6 2 0 + . > 1 3 1 . 2 4 + 1 9 * 0 + 1 ) , * 1 + ? * 6 < 0 / 1 9 ) 6 > 0 * S 1 + * 0 + 1 ) , * 1 + ? * 6 @p q r s t u v t w t x y w z { | } u | w ~ y t v t y � v x | � y � t y | y z � u t x w ~ | x z x � y v � w y � � x � w � � x � ~ � ~ � � z � v t y � v x w � | v y � t y � v t t u v ~ } z v � u t x w ~ | x � � x � wp � t z { � t v w � � � y z y t � } u � | � t t w � z x � � � x ~ { ~ u z � � } u � | � t t w � r z v t w t u z v z y t � � u v t w t x y t � z w y � t z w w t y z � � | { z y ~ | x w | � t z { � � � x � z v t� ~ � � t v t x y �N m c Q e / < 1 6 5 4 > 0 * S . / 5 ) > ( * . / 1 9 ) , \ a l c ? / / 1 - - Z [ [ [ P 6 9 1 U � \ [ l W � d T O . + . 2 * ) ? ( m d � O X * ) 0 9 n 0 * S 1 +a [ l A 1 9 2 1 9 . 6 9 1 U � f l n W O P m > 1 * 2 . 6 2 n 0 * S 1 + P 6 = 1 / + 0 < - 1 n 0 * S 1 + P 6 9 1 U � ] Z l X 0 * 5 - 0 7 e / � W � 2 2 * 1 2 0 + 1P 6 9 1 U � g l Y d n ) * 2 0 6 m > 1 * 2 . 6 2 n 0 * S 1 + / � - ) < 0 - P 6 9 1 U � \ l O . + . 2 * ) ? ( A . 2 4 � . 1 - 9 n 0 * S 1 + P 6 9 1 U � i l X 0 * 5 - 0 7 e /� W N P d W P 6 9 1 U � i l � 6 1 n ) 6 + 4 � . < ) * P 6 9 1 U � a l � O c m P Q P 6 9 1 U � 0 6 9 ] [ l W � d a [ [ P 6 9 1 U @W m c Q e / < 1 6 5 4 > 0 * S . / 5 ) > ( * . / 1 9 ) , \ i l c ? / / 1 - - Z [ [ [ P 6 9 1 U � \ [ l W � d T O . + . 2 * ) ? ( m d � O X * ) 0 9 n 0 * S 1 +a [ l A 1 9 2 1 9 . 6 9 1 U � f l n W O P m > 1 * 2 . 6 2 n 0 * S 1 + P 6 = 1 / + 0 < - 1 n 0 * S 1 + P 6 9 1 U � ] Z l X 0 * 5 - 0 7 e / � W � 2 2 * 1 2 0 + 1P 6 9 1 U � g l Y d n ) * 2 0 6 m > 1 * 2 . 6 2 n 0 * S 1 + / � - ) < 0 - P 6 9 1 U � \ l O . + . 2 * ) ? ( A . 2 4 � . 1 - 9 n 0 * S 1 + P 6 9 1 U � i l X 0 * 5 - 0 7 e /� W N P d W P 6 9 1 U � g l � 6 1 n ) 6 + 4 � . < ) * P 6 9 1 U � a l � O c m P Q P 6 9 1 U � 0 6 9 ] ] l W � d a [ [ P 6 9 1 U @n m c Q e / < 1 6 5 4 > 0 * S . / 5 ) > ( * . / 1 9 ) , \ [ l c ? / / 1 - - Z [ [ [ P 6 9 1 U � ] i l W � d T O . + . 2 * ) ? ( m d � O X * ) 0 9 n 0 * S 1 +a [ l A 1 9 2 1 9 . 6 9 1 U � ` l n W O P m > 1 * 2 . 6 2 n 0 * S 1 + P 6 = 1 / + 0 < - 1 n 0 * S 1 + P 6 9 1 U � ] f l X 0 * 5 - 0 7 e / � W � 2 2 * 1 2 0 + 1 P 6 9 1 U �a l Y d n ) * 2 0 6 m > 1 * 2 . 6 2 n 0 * S 1 + / � - ) < 0 - P 6 9 1 U � \ l O . + . 2 * ) ? ( A . 2 4 � . 1 - 9 n 0 * S 1 + P 6 9 1 U � ] [ l X 0 * 5 - 0 7 e / � WN P d W P 6 9 1 U � Z l � 6 1 n ) 6 + 4 � . < ) * P 6 9 1 U � _ l � O c m P Q P 6 9 1 U � 0 6 9 ] [ l W � d a [ [ P 6 9 1 U @

� � � � � � � � � � � � � � � � � � � � � � � � � � � � � � � � � � � � � � � � � � � � � � � � � � � � � � � � �
� � � � � � � � ! � " � # � � � $ � # " ! $ � $ % " � � & ' � � ( � ) � " � & � � � * ! � ( "+ , - . / 0 1 2 3 4 5 1 0 6 7 . 8 9 , 8 - : ; 2 .< = > ? @ A > B ? C @ A D E F G F @ A > B C H D E I > D ? J > K L M @ I N D ? O > @ C ? > P G L Q R > R C @ ? G Q S E I D H ? G C C D E E N D ? O > @ H D T C U E D ? S > JN M R J C N D E E V D Q R M Q = > C @ N > Q @ C @ I E > C U = D E L > J H G ? > J S ? G W @ A V F G E E G W M Q S Q > W C G F M Q H ? > D C > C M Q X Y > H G Q G N M H S ? G W @ AD Q R M Q = > C @ G ? D T T > @ M @ > F G ? @ D O M Q S G Q ? M C O Z [ A > P ? G D R N D ? O > @ H G Q @ M Q L > R @ G ? > H G = > ? @ A ? G L S A \ D ? H A R ? M = > Q P IT > ? F G ? N D Q H > M Q @ A > H G Q C L N > ? R M C H ? > @ M G Q D ? I D Q R M Q R L C @ ? M D E C > H @ G ? C Z ] G W > = > ? J @ A > \ ^ _ C L F F > ? > R M Q @ A > K L D ? `@ > ? > Q R M Q S a L Q > b c J d c e c D C D E E N D f G ? R G N > C @ M H > K L M @ I M Q R M H > C T G C @ > R E G C C > C E > R P I > = > Q @ C C L H A D C @ A >^ L ? G T > D Q R > P @ H ? M C M C J @ A > g L E F G F \ > h M H G G M E C T M E E J D Q R D ? > P G L Q R G F L Q H > ? @ D M Q @ I ? > S D ? R M Q S @ A > A > D E @ A G F @ A >> H G Q G N M H ? > H G = > ? I Z i E E @ > Q C > H @ G ? C G F @ A > Y j k l c c T G C @ > R E G C C > C R L ? M Q S @ A > E D C @ K L D ? @ > ? G F @ A > B C H D E I > D ? Z[ A > N D @ > ? M D E C J M Q R L C @ ? M D E C J B Q D Q H M D E C D Q R > Q > ? S I C > H @ G ? C W > ? > T D ? @ M H L E D ? E I A D ? R A M @ Z m L ? M Q S B C H D E I > D ? d c e c J@ A > \ ^ _ S > Q > ? D @ > R D T G C M @ M = > ? > @ L ? Q G F e n Z c e o J Q > @ G F F > > C D Q R G T > ? D @ M Q S > h T > Q C > C J W A M H A L Q R > ? T > ? F G ? N > R@ A > p L C C > E E b c c c q Q R > h ? > @ L ? Q G F e l Z r d o P I e r e P D C M C T G M Q @ C Zs ; 0 . 8 ; : 0 1 , ; : t 3 4 5 1 0 6 7 . 8 9 , 8 - : ; 2 .u M O > @ A > X Y J @ A > R > = > E G T > R M Q @ > ? Q D @ M G Q D E N D ? O > @ C W > ? > D F F > H @ > R P I @ A > C D N > S E G P D E > H G Q G N M H > Q = M ? G Q `N > Q @ D Q R @ A > I ? G C > M Q L Q M C G Q W M @ A J D Q R ? > P G L Q R > R C M N M E D ? @ G J X Y > K L M @ I N D ? O > @ C Z q Q T D ? @ M H L E D ? J @ A > m \ q Y _T G C @ > R D S D M Q G F e e Z c b o J Q > @ G F F > > C D Q R G T > ? D @ M Q S > h T > Q C > C J W A M H A G L @ T > ? F G ? N > R M @ C P > Q H A N D ? O M Q R > h? > @ L ? Q G F v Z w x o P I e b l P D C M C T G M Q @ C Zm L ? M Q S @ A > B C H D E I > D ? > Q R > R a L Q > b c J d c e c J @ A > > N > ? S M Q S N D ? O > @ C H G Q @ M Q L > R @ G E > D R @ A > S E G P D E > K L M @ I? D E E I E > R P I @ A > C @ ? > Q S @ A M Q @ A > B Q D Q H M D E C > H @ G ? Z i C N D Q I M Q = > C @ G ? C ? > S D M Q > R H G Q B R > Q H > D Q R = M > W > R @ A >> N > ? S M Q S N D ? O > @ H G L Q @ ? M > C D C C M S Q M B H D Q @ T E D I > ? C M Q @ A > S E G P D E > H G Q G N M H ? > H G = > ? I J T > ? F G ? N D Q H > G F @ A > y p q zU y ? D { M E J p L C C M D J q Q R M D D Q R z A M Q D V E > R @ A > ? D E E I Z ] G W > = > ? P > S M Q Q M Q S M Q H D E > Q R D ? I > D ? d c e c J H G L Q @ ? M > C C L H AD C z A M Q D D Q R y ? D { M E > h T > ? M > Q H > R Q > S D @ M = > ? > @ L ? Q C D Q R @ A > N D ? O > @ = D E L > D R = D Q H > C H D N > @ G D A D E @ G = > ? @ A >K L D ? @ > ? > Q R M Q S a L Q > d c e c Z [ A > B Q D Q H M D E M Q C @ D P M E M @ I M Q C > = > ? D E ^ L ? G T > D Q H G L Q @ ? M > C F L > E > R P I @ A > C G = > ? > M S QR > P @ H ? M C M C J R > H ? > D C > R M Q = > C @ N > Q @ D T T > @ M @ > @ A ? G L S A G L @ @ A > ? > S M G Q Z m > C T M @ > @ A > T L E E P D H O R L ? M Q S @ A > E D C @ K L D ? `@ > ? G F @ A > B C H D E I > D ? J @ A > ^ \ q Y _ S > Q > ? D @ > R D ? > @ L ? Q G F d l Z d b o J Q > @ G F F > > C D Q R G T > ? D @ M Q S > h T > Q C > C J W A M H AG L @ T > ? F G ? N > R M @ C P > Q H A N D ? O M Q R > h ? > @ L ? Q G F d n Z l r o P I w w P D C M C T G M Q @ C Z| 1 } . ~ s ; 2 , - . 7 . 8 9 , 8 - : ; 2 .[ A > B h > R M Q H G N > N D ? O > @ C H G Q @ M Q L > R @ G M N T ? G = > D Q R P > H G N > N G ? > E M K L M R P I = M ? @ L > G F g G = > ? Q N > Q @ T ? G `S ? D N C C L H A D C [ i u _ D Q R k k q k J W A M H A C @ D P M E M { > R @ A > N G ? > M E E M K L M R B h > R M Q H G N > N G ? @ S D S > D Q R D C C > @ P D H O > RC > H @ G ? C G F @ A > N D ? O > @ Z p M C O D T T > @ M @ > ? > @ L ? Q > R S M = > Q @ A > M N T ? G = M Q S > H G Q G N M H > Q = M ? G Q N > Q @ J W A M H A L E @ M N D @ > E IE > R @ G D F L ? @ A > ? Q D ? ? G W M Q S G F H ? > R M @ C T ? > D R C ? > C L E @ M Q S M Q D R ? D N D @ M H M N T ? G = > N > Q @ M Q @ A > G = > ? D E E ? > @ L ? Q F G ? D E EB h > R M Q H G N > N D ? O > @ C M Q W A M H A @ A > z p k [ _ M Q = > C @ C Z_ G ? @ A > B C H D E I > D ? d c e c @ A > z _ q _ S > Q > ? D @ > R D @ G @ D E ? > @ L ? Q G F e e Z x e o J Q > @ G F F > > C D Q R G T > ? D @ M Q S > h T > Q C > C JG L @ T > ? F G ? N M Q S @ A > P > Q H A N D ? O ? > @ L ? Q G F v Z l c o P I d b e P D C M C T G M Q @ C Z [ A > G L @ T > ? F G ? N D Q H > W D C D @ @ ? M P L @ D P E >@ G @ A > F D H @ @ A D @ H G ? > A G E R M Q S C W > ? > L Q R > ? W > M S A @ X Z Y Z [ ? > D C L ? I Q G @ > C D Q R G = > ? W > M S A @ H ? > R M @ C > Q C M @ M = > C > H L ? M `@ M > C Z [ A > M N T ? G = > N > Q @ M Q ? M C O D T T > @ M @ > A > E T > R C L T T G ? @ @ A > P > E G W M Q = > C @ N > Q @ S ? D R > N D ? O > @ D Q R @ A > ] � m _T G C @ > R D ? > @ L ? Q G F d n Z l n o Q > @ G F F > > C D Q R G T > ? D @ M Q S > h T > Q C > C J @ A > F L Q R R M R L Q R > ? T > ? F G ? N @ A > P > Q H A N D ? O? > @ L ? Q G F d l Z w n o P I e e c P D C M C T G M Q @ C R L > @ G @ A > F D H @ @ A D @ @ A > z p k [ _ � C A M S A I M > E R T G ? @ F G E M G A D R D A M S A > ? @ A D QD = > ? D S > H ? > R M @ K L D E M @ I T ? G B E > Z [ A > q u y _ J C L T T G ? @ > R P I F D E E M Q S X Y [ ? > D C L ? I ? D @ > C J S > Q > ? D @ > R D @ G @ D E ? > @ L ? QG F v Z n x o Q > @ G F F > > C D Q R G T > ? D @ M Q S > h T > Q C > C J = M ? @ L D E E I > = > Q @ G M @ C P > Q H A N D ? O ? > @ L ? Q G F v Z l d o Z [ A > ^ \ m _S > Q > ? D @ > R D @ G @ D E ? > @ L ? Q G F d b Z c d o J Q > @ G F F > > C D Q R G T > ? D @ M Q S > h T > Q C > C J G L @ T > ? F G ? N M Q S @ A > P > Q H A N D ? O ? > @ L ? QG F e r Z v c o P I l e d P D C M C T G M Q @ C Z _ M Q D E E I J @ A > u _ S > Q > ? D @ > R D ? > @ L ? Q G F Z v x o J G L @ T > ? F G ? N M Q S @ A > G Q > N G Q @ Au q y < p P > Q H A N D ? O G F Z d r o J P I r e P D C M C T G M Q @ C Z� . : t 3 / 0 : 0 . : ; ~ 7 8 1 � : 0 . 3 4 5 1 0 6 7 . 8 9 , 8 - : ; 2 ._ G ? @ A > B C H D E T > ? M G R > Q R M Q S a L Q > b c J d c e c J @ A > p ^ _ S > Q > ? D @ > R D @ G @ D E ? > @ L ? Q G F ` d c Z e x o � Q > @ G F F > > C JW A M H A L Q R > ? T > ? F G ? N > R @ A > L Q ` E > = > ? > R � D @ M G Q D E z G L Q H M E G F p > D E ^ C @ D @ > q Q = > C @ N > Q @ _ M R L H M D ? M > C q Q R > h U � z p ^ q _ VG F ` v Z w c o P I e c Z l x o Z [ A > L Q R > ? T > ? F G ? N D Q H > W D C H D L C > R P I @ A > F D E E M Q S ? > D E > C @ D @ > N D ? O > @ = D E L > C J @ A > F D H @@ A D @ @ A > p ^ _ T G ? @ F G E M G L C > C E > = > ? D S > J D Q R @ A > D R R M @ M G Q G F C > = > ? D E Q > W F L Q R C @ A D @ D ? > C @ M E E M Q @ A > > D ? E I C @ D S > CD Q R A D = > Q G @ S > Q > ? D @ > R T ? G ` F G ? N D ? > @ L ? Q C Z [ A > p ^ _ M Q H ? > D C > R M @ C T G ? @ F G E M G F ? G N � r w v Z r N M E E M G Q @ G � r x b Z xN M E E M G Q T ? M N D ? M E I R L > @ G Q > W T L ? H A D C > C G F F C > @ P I Q > @ L Q ? > D E M { > R E G C C > C Z [ A > C @ ? D @ > S I F G ? @ A > p ^ _ M C @ G M Q = > C @M Q H G ? > ? > D E > C @ D @ > A G E R M Q S C J = D E L > D R R D Q R G T T G ? @ L Q M C @ M H F L Q R C Z i E E G H D @ > R @ G @ A > E G W > ? ? M C O C @ ? D @ > S I G F H G ? >? > D E > C @ D @ > M C b w o J D Q R @ A > C > F L Q R C A D = > D N D h M N L N E > = > ? D S > ? > K L M ? > N > Q @ G F G Q E I b c o Z [ A > ? > N D M Q M Q S

STATE OF CONNECTICUT, OFFICE OF THE TREASURER, DENISE L. NAPPIER 47
CONNECTICUT STATE TREASURER’S COMBINED INVESTMENT FUNDS
64% of the portfolio is invested in value add and opportunistic strategies and allow for a higher amount of leverage, typically 60% - 75% loan to value. The REF also has outstanding commitments of approximately $400 million which are being held in reserve by various investment managers to take advantage of distressed commercial real estate sales. At fi scal year-end the REF represented 3.6% of the CRPTF assets
For the fi scal year ended June 30, 2010, the Private Investment Fund (“PIF”) generated a one year 17.32% compounded annual rate of return. This compares favorably to its public market benchmark, the S&P 500, which returned 14.43% over the same period. Following a relatively slow start, U.S. buyout and venture markets were active during the latter half of fi scal year 2010, with deal volume increasing 29% and 23%, respectively, compared to the same time period one year earlier. There were 22 venture-backed IPOs in the fi rst six months of calendar year 2010, the highest level since the last market peak in 2007. The fund-raising environment continues to be challenging for private equity fund managers. U.S. buyout fundraising dropped 43% and venture fundraising was down 33% through the fi rst half of calendar year 2010 compared the same period in 2009.
2010 Management InitiativesDuring the fi scal year the Offi ce of the Treasurer completed the implementation of the Alternative Invest-
ment Fund (AIF), including a structure review of the asset class and the conclusion of the fi rst phase manager search in which the Treasurer named fi ve absolute return fund of hedge fund managers as preferred vendors. In furtherance of the asset class objectives, the AIF will provide the CRPTF the fl exibility to consider evolving and market-driven investment strategies.
As a result of a competitive search, two Emerging Markets International Stock Fund managers were hired. Also during fi scal year 2010 two investment commitments totaling $175 million were awarded to Pri-vate Investment Fund managers. There were three Real Estate Fund commitments this fi scal year with the investment in the Public-Private Investment Program, or PPIP. This is a U.S. Treasury opportunity designed to repair the capital markets by investing in legacy, distressed residential and commercial mortgage-backed securities and loans. Three of the eligible investment fi rms were hired to manage a total investment com-mitment of $200 million.
The Connecticut Horizon Fund (“CHF”), funded in August 2005, is a $631 million fund-of-funds public market program and a $155 million private equity allocation created to give access to the Treasury’s busi-ness to a wider number of fi rms, and to open up such business to more women-owned, minority-owned, Connecticut-based and emerging fi rms. In fi scal year 2010, public market managers totaled 42 CHF sub-managers; 16 were minority-owned, 8 were women-owned, and 7 were Connecticut-based fi rms (3 of which are also women and/or minority owned) and 14 were emerging fi rms There are 7 private equity submanagers, including 4 minority-owned, 2 emerging strategies and 1 Connecticut-based. Additionally, there are 7 private equity submanagers, including 4 minority-owned, 2 emerging strategies and 1 Connecticut-based.
The CRPTF continued to expand the diversity of fi rms with which PFM does business. Overall, minority-owned, women-owned, Connecticut-based and emerging fi rms, 34 in all, comprised 29% of the fi rms with which the division did business; these fi rms earned fees of over $36 million, representing 39% of all fees paid by the division. In actual dollars this was the highest level ever and as a percentage of all fees paid by the division, the second highest level ever, trailing only 2009. Since 1999, the number of minority-owned, women-owned, Connecticut-based and emerging fi rms has more than doubled, the annual fees paid to such fi rms have increased 3 times and the assets under management have nearly tripled.
Proxy Voting and Corporate GovernanceDuring 1999 and 2000, the Treasurer’s Offi ce developed comprehensive domestic and international proxy
voting policies. These policies, which are part of the Investment Policy Statement as mandated by state law, guide proxy voting at Connecticut Retirement Plans and Trust Funds (“CRPTF”) portfolio companies. Under these policies, the Treasurer not only votes proxies, but also engages with companies through letters, dialogues, and fi ling shareholder resolutions either alone or in concert with other institutional investors to

48 COMBINED INVESTMENT FUNDS 2010 COMPREHENSIVE FINANCIAL ANNUAL REPORT
CONNECTICUT STATE TREASURER’S COMBINED INVESTMENT FUNDS
protect and enhance the value of the CRPTF. The Offi ce also advocates for the protection and enhance-ment of shareholder rights with the Securities and Exchange Commission (SEC), the U.S. Congress and the stock exchanges. In spring of 2007, the Investment Advisory Counsel approved changes to the domestic policies to refl ect recent developments in the laws and regulations affecting proxy voting.
Connecticut law requires the Treasurer to consider the economic, social, and environmental impact of investment decisions. State law also prohibits investment in companies doing business in Northern Ireland that have not implemented the MacBride Principles of fair employment. Similar statutory prohibitions allow the Treasurer to engage with, and divest of holdings in, companies conducting business with Sudan and with Iran counter to U.S. foreign policy.
The Treasurer’s activities in 2010 were against a backdrop of the continuing international fi nancial cri-sis that severely impacted the global economy and all companies in which the CRPTF invests, as well as government initiatives to address the crisis. During the 2010 fi scal year, Treasurer Nappier provided formal policy comments to regulatory agencies on issues that have a signifi cant impact on institutional investors. She also provided input to the U.S. Congress on its regulatory reform legislation, which was signed into law by the President in July 2010. In letters to the U.S. congressional leadership the Treasurer joined with other investors providing input and making recommendations on how the then pending legislation would impact the Treasury. These issues included corporate governance, executive compensation, regulation of banks, fi nancial advisors and hedge funds, use and transparency of fi nancial derivatives, securities lend-ing, credit rating agencies, and fi nancial literacy, and other related issues. The legislative process will be followed by an intense period of adoption of regulations by administrative agencies (particularly the SEC), and implementation. The Treasurer has and will continue to provide the SEC and other oversight agencies with comments on proposed rules affecting these issues.
The issues surrounding the fi scal crisis were evidenced on the CRPTF shareholder front as well. In fi scal year 2010, the CRPTF fi led shareholder resolutions at 16 companies. The CRPTF engaged with companies through activities ranging from writing letters and attending annual shareholder meetings, to holding face-to-face dialogues with corporate management and board members. In support of its efforts, the Treasurer’s Offi ce worked with a wide cross-section of investors representing public pension funds, labor funds, and faith-based investors. Executive compensation is one of the key issues for the CRPTF, and the fund was active in this area throughout the reporting period. In 2010, the Treasurer addressed executive compensa-tion on a number of fronts including advocating for an annual advisory vote on executive compensation at all companies (say on pay), calling for independence of compensation consultants, working with several portfolio companies to adopt policies related to severance payments, addressing internal pay equity, and requesting policies requiring equity compensation be held until retirement.
In the area of climate change and related energy issues, the Offi ce continued to take a leading role in the Investor Network on Climate Risk (INCR) and the Global Warming Shareholder Campaign (GWSC). The Treasurer engaged with a number of companies on these issues, including asking companies to set green-house gas emission goals, to set targets for energy use reductions and report to shareholders on progress in achieving those targets, to issue sustainability reports to shareholders that directly address climate and energy issues, calling on auto companies to produce more energy effi cient vehicles, and engaging with investors and electric utility companies on new business models that will be needed in that industry.
As part of its corporate governance practices, the Treasurer’s offi ce is charged with enforcing the state law relating to religious non-discrimination practices in the workplace in Northern Ireland. During the fi scal year, two companies agreed to implement the MacBride Principles, which are a corporate code of conduct for companies doing business in Northern Ireland and consist of nine fair employment and affi rmative action principles. The list of adopting companies in fi scal year 2010 includes Art Technologies and The Public-Card Inc.
In addition to the MacBride Principles, the Treasurer’s Offi ce proposed, and the General Assembly ad-opted a law, requiring the CRPTF to review pension fund investments in companies doing business in the Republic of Sudan. The 2006 law grants the Treasurer authority to engage and potentially divest holdings from companies shown to contribute to the Sudanese government-backed genocide. In May 2007, the

� � � � � � � � � � � � � � � � � � � � � � � � � � � � � � � � � � � � � � � � � � � � � � � � � �
� � � � � � � � � � � � � � � � ! � � � ! � ! " � � � # $ � � � % � � & � � � # � � � ' � � % �( ) * + , - ) * ) + . . / - . 0 * 1 2 3 * 4 ) , 2 1 5 6 * , 2 7 * . 2 / 8 9 : ; ( < 3 / = 1 5 . > , 0 / 7 ? + . 5 * , 1 / 5 . > @ - , 5 . * , , 5 . A - 1 + . B ( 3 ) / - > 32 3 * * . 1 / 8 < C D E F E G 2 3 * ( ) * + , - ) * ) 3 + , 1 5 ) * 0 2 * 1 9 : ; ( < H , 5 . 6 * , 2 7 * . 2 7 + . + > * ) , 2 / 1 5 6 * , 2 8 ) / 7 + . 1 ) * 8 ) + 5 . 8 ) / 78 - ) 2 3 * ) 5 . 6 * , 2 7 * . 2 5 . F I 0 / 7 ? + . 5 * , J K 3 + ) + 2 L * + 6 M N = * 0 2 ) 5 0 + = , O 2 1 B P K L N O Q G 9 3 5 . + ; * 2 ) / = * - 7 + . 1 9 3 * 7 5 0 + =9 / ) ? B G 9 R ; 9 P L / . > S / . > Q G T / . > 8 * . > U / 2 / ) 9 / ) ? / ) + 2 5 / . G U V A 9 K 3 1 G R + 7 < + 2 2 9 / ) ? B G W 5 = + . 1 R + 2 - ) + = X + ,9 / ) ? B P W R X 9 Q G ; N 9 T X ) / - ? G ; * 2 ) / 9 3 5 . + 9 / B O 2 1 B G ; * 2 ) / . + , 9 + ? 5 2 + = O 2 1 B G A 5 . / ? * 0 A 3 + . > 3 + 5 ; * 2 ) / 0 3 * 7 5 0 + =9 / ) ? B G A - 1 + . ( * = * 0 / 7 P A - 1 + 2 * = Q G + . 1 Y + ) 2 , 5 = + W M Z B9 / ? 5 * , / 8 2 3 * 9 / . . * 0 2 5 0 - 2 ? * . , 5 / . 8 - . 1 H , ? ) / [ M 6 / 2 5 . > ? / = 5 0 5 * , + . 1 + ) * ? / ) 2 / 8 ? ) / [ M 6 / 2 * , 0 + , 2 + ) * + 6 + 5 = \+ @ = * 8 / ) ) * 6 5 * ] + . 1 1 / ] . = / + 1 + 2 2 3 * A 2 + 2 * ( ) * + , - ) * ) H , ] * @ , 5 2 * J 3 2 2 ? J ^ ^ ] ] ] B , 2 + 2 * B 0 2 B - , ^ / 2 2 ^ ? ) / [ M 6 / 2 5 . > B 3 2 7Y 3 5 = * 7 + ) _ * 2 ) 5 , _ ] 5 = = + = ] + M , @ * + 0 / 7 ? / . * . 2 / 8 + . M 5 . 6 * , 2 7 * . 2 ? ) / > ) + 7 G ( ) * + , - ) * ) R + ? ? 5 * ) H , O * > + =+ . 1 9 / 7 ? = 5 + . 0 * ` . 5 2 , ] / ) _ 2 / 7 + . + > * , - 0 3 ) 5 , _ @ M = 5 7 5 2 5 . > / ? ? / ) 2 - . 5 2 5 * , 8 / ) = / , , 1 - * 2 / 2 3 * 7 + = 8 * + , + . 0 */ 8 / 2 3 * ) , B N [ 2 * . , 5 6 * ? ) * \ 0 / . 2 ) + 0 2 5 . > 1 - * 1 5 = 5 > * . 0 * 3 * = ? , 2 3 * W 8 4 0 * / 8 2 3 * ( ) * + , - ) * ) , * = * 0 2 2 3 * @ * , 2 6 * . 1 / ) ,+ . 1 ? ) / 1 - 0 2 , 2 / 7 * * 2 2 3 * . * * 1 , / 8 2 3 * W 8 4 0 * B 9 + ) * 8 - = 0 / . 2 ) + 0 2 . * > / 2 5 + 2 5 / . G 0 / - ? = * 1 ] 5 2 3 5 7 ? = * 7 * . 2 + 2 5 / ./ 8 @ * , 2 ? ) + 0 2 5 0 * 0 / . 2 ) + 0 2 = + . > - + > * G = * . 1 , 0 = + ) 5 2 M 2 / 2 3 * / @ = 5 > + 2 5 / . , / 8 2 3 * W 8 4 0 * / 8 2 3 * ( ) * + , - ) * ) + . 1 / 8 2 3 *6 * . 1 / ) , / 8 2 3 * W 8 4 0 * B ( 3 * W 8 4 0 * 7 + 5 . 2 + 5 . , 0 / . 2 + 0 2 ] 5 2 3 / 2 3 * ) , 5 7 5 = + ) > / 6 * ) . 7 * . 2 + = / 8 4 0 * , + . 1 , 3 + ) * , 5 1 * + ,8 / ) * . 3 + . 0 * 7 * . 2 / 8 0 / . 2 ) + 0 2 = + . > - + > * G 8 ) * a - * . 2 = M / 8 8 * ) 5 . > + 1 6 5 0 * 2 / 0 / - . 2 * ) ? + ) 2 , 5 . / 2 3 * ) , 2 + 2 * , B( 3 * W 8 4 0 * / 8 2 3 * ( ) * + , - ) * ) 1 * 2 * ) , 7 + = 8 * + , + . 0 * ] 5 2 3 5 2 , ) * ? - 2 + 2 5 / . 8 / ) + > > ) * , , 5 6 * ? - ) , - 5 2 / 8 + = = / ? ? / ) 2 - . 5 \2 5 * , 2 / ) * 0 / 6 * ) + , , * 2 , = / , 2 1 - * 2 / 2 3 * 7 5 , 8 * + , + . 0 * / ) 7 + = 8 * + , + . 0 * / 8 / 2 3 * ) , BY 3 5 = * 9 / . > ) * , , 0 / . , 5 1 * ) * 1 2 3 * T / 1 1 \ < ) + . _ Y + = = A 2 ) * * 2 : * 8 / ) 7 + . 1 9 / . , - 7 * ) ; ) / 2 * 0 2 5 / . b 0 2 G * . + 0 2 * 15 . 2 / = + ] / . c - = M D F G D E F E G 2 3 * W 8 4 0 * / 8 2 3 * ( ) * + , - ) * ) 0 + ) * 8 - = = M 7 / . 5 2 / ) * 1 2 3 * ? ) / ? / , + = , + . 1 / 8 8 * ) * 1 , - > \> * , 2 5 / . , + . 1 , 3 + ) * 3 / = 1 * ) ? * ) , ? * 0 2 5 6 * / . 2 3 * @ 5 = = H , / ) 5 > 5 . + = = + . > - + > * + . 1 + 7 * . 1 7 * . 2 , G @ / 2 3 1 5 ) * 0 2 = M + . 1 5 .0 / . Z - . 0 2 5 / . ] 5 2 3 / 2 3 * ) , 3 + ) * 3 / = 1 * ) , + . 1 * = * 0 2 * 1 / 8 4 0 5 + = , B( 3 * ` A ( ) * + , - ) M + . 1 2 3 * A * 0 - ) 5 2 5 * , + . 1 N [ 0 3 + . > * 9 / 7 7 5 , , 5 / . 0 / . 2 5 . - * 2 / ? ) / ? / , * , 2 ) - 0 2 - ) + = ) * > - = + \2 / ) M + . 1 ) - = * 0 3 + . > * , 2 3 + 2 + ) * 1 * , 5 > . * 1 2 / ) * @ - 5 = 1 + . 1 * . 3 + . 0 * 4 . + . 0 5 + = , - ? * ) 6 5 , 5 / . / 8 / - ) . + 2 5 / . H , 4 . + . 0 5 + =5 . 1 - , 2 ) M B ( 3 * W 8 4 0 * / 8 2 3 * ( ) * + , - ) * ) 3 + , 0 + ) * 8 - = = M ) * 6 5 * ] * 1 2 3 * ? ) / ? / , + = , + . 1 G ] 3 * ) * + ? ? ) / ? ) 5 + 2 * G , - ? ? / ) 2 * 1/ ) / 8 8 * ) * 1 0 / 7 7 * . 2 / . 2 3 * ? ) / ? / , * 1 = + . > - + > * B b , + . 5 . , 2 5 2 - 2 5 / . + = 5 . 6 * , 2 / ) G 2 3 * W 8 4 0 * @ * = 5 * 6 * , , 2 ) / . > * )8 * 1 * ) + = ) * > - = + 2 5 / . / 8 4 . + . 0 5 + = 5 . , 2 5 2 - 2 5 / . , 5 , = 5 _ * = M 2 / ) * , - = 2 5 . 5 . 0 ) * + , * 1 0 / 7 ? = 5 + . 0 * + . 1 ) * 1 - 0 * 1 ) 5 , _ B( 3 * W 8 4 0 * / 8 2 3 * ( ) * + , - ) * ) 2 + _ * , + 7 * + , - ) * 1 + ? ? ) / + 0 3 2 / = 5 2 5 > + 2 5 / . G @ - 2 5 , ? ) * ? + ) * 1 G ] 3 * . . * 0 * , , + ) M G2 / ? - ) , - * Z - 1 5 0 5 + = , / = - 2 5 / . , ] 3 * ) * . * > / 2 5 + 2 5 / . , + ) * - . , - 0 0 * , , 8 - = B ( 3 * W 8 4 0 * / 8 2 3 * ( ) * + , - ) * ) 0 / . 2 5 . - * , 2 /0 / . , 5 1 * ) 7 + _ 5 . > + ? ? = 5 0 + 2 5 / . 2 / , * ) 6 * + , = * + 1 ? = + 5 . 2 5 8 8 5 . 0 = + , , + 0 2 5 / . = 5 2 5 > + 2 5 / . + . 1 * . 0 / - ) + > * , / 2 3 * ) 5 . , 2 5 2 - \2 5 / . + = 5 . 6 * , 2 / ) = * + 1 ? = + 5 . 2 5 8 8 , 2 / + > > ) * , , 5 6 * = M . * > / 2 5 + 2 * ) * + , / . + @ = * = * > + = 8 * * , B < ) / 7 2 5 7 * 2 / 2 5 7 * G 2 3 * W 8 4 0 */ 8 2 3 * ( ) * + , - ) * ) 3 + , - , * 1 = 5 2 5 > + 2 5 / . 2 / * . 0 / - ) + > * 0 / ) ? / ) + 2 * > / 6 * ) . + . 0 * * . 3 + . 0 * 7 * . 2 , B b = 2 3 / - > 3 ) + ) * G 2 3 *W 8 4 0 * / 8 2 3 * ( ) * + , - ) * ) 3 + , 4 = * 1 5 . 1 5 6 5 1 - + = + . 1 > ) / - ? + 0 2 5 / . , 2 / ? - ) , - * , ? * 0 5 4 0 ) 5 > 3 2 , ] 3 * ) * 1 5 , ? - 2 5 . > ? + ) 2 5 * ,+ ) * - . ] 5 = = 5 . > / ) - . + @ = * 2 / ) * + 0 3 + . * [ 2 ) + \ Z - 1 5 0 5 + = 0 / . 0 = - , 5 / . Bd e f g g h i j k l m n o i p q k j k o g r k j k s f j k l m( 3 * 9 : ; ( < ) * 0 / 6 * ) * 1 t u B v w 7 5 = = 5 / . 8 ) / 7 0 = + , , + 0 2 5 / . , * 2 2 = * 7 * . 2 , 5 . 2 3 * 4 , 0 + = M * + ) * . 1 * 1 D E F E G 5 . 0 = - 1 5 . >, - @ , 2 + . 2 5 + = ) * 0 / 6 * ) M 8 ) / 7 2 3 * , * 0 - ) 5 2 5 * , = 5 2 5 > + 2 5 / . 5 . 6 / = 6 5 . > N . ) / . G U 0 S * , , / . + . 1 U * ) ) 5 = = O M . 0 3 B Y * 0 / . 2 5 . - *2 / 0 = / , * = M 7 / . 5 2 / ) / ? ? / ) 2 - . 5 2 5 * , 2 / ) * 0 / 6 * ) = / , 2 + , , * 2 , 2 3 ) / - > 3 ? + ) 2 5 0 5 ? + 2 5 / . 5 . 0 = + , , + 0 2 5 / . = 5 2 5 > + 2 5 / . B ( 3 *W 8 4 0 * / 8 2 3 * ( ) * + , - ) * ) G + , 2 3 * ( ) - , 2 * * 8 / ) 2 3 * 9 : ; ( < G 5 , 0 - ) ) * . 2 = M 2 3 * = * + 1 ? = + 5 . 2 5 8 8 5 . 2 3 * 7 + 2 2 * ) _ . / ] . + , x yz { | } ~ { y � x y � � � { � � � � � � { � � � � � ~ � � � � y G 4 = * 1 5 . 2 3 * 8 * 1 * ) + = 1 5 , 2 ) 5 0 2 0 / - ) 2 8 / ) 2 3 * A / - 2 3 * ) . T 5 , 2 ) 5 0 2 / 8 9 + = 5 8 / ) . 5 + B( 3 * 0 / - ) 2 5 . b 7 > * . + ? ? ) / 6 * 1 2 3 * 0 = + , , 0 * ) 2 5 4 0 + 2 5 / . 7 / 2 5 / . B Y * * . 2 * ) * 1 2 3 * 1 5 , 0 / 6 * ) M ? 3 + , * / 8 2 3 * 0 + , *5 . 2 3 * 8 + = = / 8 D E E � B ( 3 * T * 8 * . 1 + . 2 , 3 + 6 * 4 = * 1 + . + ? ? * + = 2 / 2 3 * � 2 3 9 5 ) 0 - 5 2 9 / - ) 2 / 8 b ? ? * + = , G , * * _ 5 . > 2 / , * 2+ , 5 1 * 2 3 * 0 = + , , 0 * ) 2 5 4 0 + 2 5 / . / ) 1 * ) B b = = 1 5 , 0 / 6 * ) M + 0 2 5 6 5 2 5 * , 3 + 6 * @ * * . , 2 + M * 1 G ? * . 1 5 . > 2 3 * + ? ? * + = Bd l q � l q f j o � l � o q m f m i o � o e f j o � r k j k s f j k l mO 5 2 5 > + 2 5 / . 3 + , . / 2 @ * * . ) * a - 5 ) * 1 8 / ) 0 / ) ? / ) + 2 * > / 6 * ) . + . 0 * 7 + 2 2 * ) , 5 . 2 3 * ? + , 2 4 , 0 + = M * + ) B ( 3 * W 8 4 0 */ 8 2 3 * ( ) * + , - ) * ) ? ) * 8 * ) , 2 / 8 / 0 - , / . * . > + > * 7 * . 2 / 8 0 / 7 ? + . 5 * , ] 5 2 3 2 3 * , * 5 , , - * , B O 5 2 5 > + 2 5 / . 5 , + . * 8 8 * 0 2 5 6 *2 / / = G @ - 2 - , * 1 Z - 1 5 0 5 / - , = M B

� � � � � � � � � � � � � � � � � � � � � � � � � � � � � � � � � � � � � � � � � � � � � � � � � � � � � � � � �
� � � � � � � � � � ! � " � � � # � " ! # � # $ ! � � % & � � � ' � � ( � ! � % � � � ) � ' !* + , - . / 0 + 0 1 2 + 0 3 45 6 7 8 9 : ; 7 < 9 = 6 7 5 > 7 ? @ A > 7 > 7 B C ? C 7 D E 7 C ? E ; < A B @ 7 E F B G 7 E C F A H = < I A > @ A 7 > 7 ; < J 7 > K < 9 E < @ @ 7 @ F B ; < B B 7 ; L= F < B M F = 6 ; 7 > = ? F B ? E E 7 C 7 D H ? E 9 7 ? @ ? B ; 7 N K = 6 7 O A = ; 6 L G 7 E C F ? B : B ? B ; F ? E : > H P < > = F @ Q R S T S 5 6 F @ H ? = = 7 > F @ F B J 7 > K7 ? > E K @ = ? C 7 @ < 9 E F = F C ? = F < B S5 6 7 H ? = = 7 > F B J < E J F B C U 7 K @ = < B 7 V 7 B = A > 7 V W S X S Y = 6 7 Z X ? > = B 7 > @ 6 F I [ \ F @ ? M ? F = F B C : B ? E D F @ = > F N A = F < B < 9 = 6 7I ? > = B 7 > @ 6 F I ] @ ? @ @ 7 = @ S T E = 6 < A C 6 @ A ; 6 : B ? E D F @ = > F N A = F < B M ? @ ? B = F ; F I ? = 7 D = < 6 ? J 7 < ; ; A > > 7 D F B O 7 ; 7 H N 7 > ^ _ _ ` Q; < A B @ 7 E ? B D = 6 7 E F a A F D ? = F B C = > A @ = 7 7 ? > 7 F B ? C > 7 7 H 7 B = = 6 ? = @ A ; 6 D F @ = > F N A = F < B @ 6 < A E D M ? F = A B = F E = 6 7 ; < B ; E A @ F < B< 9 ? ; 7 > = ? F B ? ; = F < B F B F = F ? = 7 D N K = 6 7 b 7 ; A > F = F 7 @ ? B D c d ; 6 ? B C 7 e < H H F @ @ F < B ? C ? F B @ = = 6 7 f ? B ? C F B C X ? > = B 7 > @? B D f F ; 6 ? 7 E W F N 7 > = K S c d I 7 ; = 7 D = < 6 ? J 7 N 7 7 B > 7 @ < E J 7 D F B = 6 7 9 ? E E < 9 ^ _ _ ` Q = 6 7 H ? = = 7 > M ? @ B < = ; < B ; E A D 7 D D A > LF B C = 6 7 : @ ; ? E K 7 ? > 7 B D 7 D ^ _ g _ S 5 6 7 E F H F = 7 D I ? > = B 7 > @ 6 ? J 7 > 7 a A 7 @ = 7 D = 6 ? = ? B K D F @ C < > C 7 D ? @ @ 7 = @ < N = ? F B 7 DN K = 6 7 @ 7 9 7 D 7 > ? E ? C 7 B ; F 7 @ N 7 = A > B 7 D < J 7 > = < = 6 7 F B J 7 @ = < > @ S 5 6 7 b c e ] @ ; ? @ 7 ? C ? F B @ = f > S W F N 7 > = K @ 7 = = E 7 D F B8 ; = < N 7 > ^ _ g _ S h I < B > 7 ; 7 F I = < 9 ? H < A B = @ = < N 7 D F @ = > F N A = 7 D = < = 6 7 E F H F = 7 D I ? > = B 7 > @ I A > @ A ? B = = < = 6 7 < > D 7 > < 9= 6 7 ; < A > = Q = 6 7 > 7 H ? F B F B C ? @ @ 7 = @ M F E E N 7 D F @ = > F N A = 7 D S
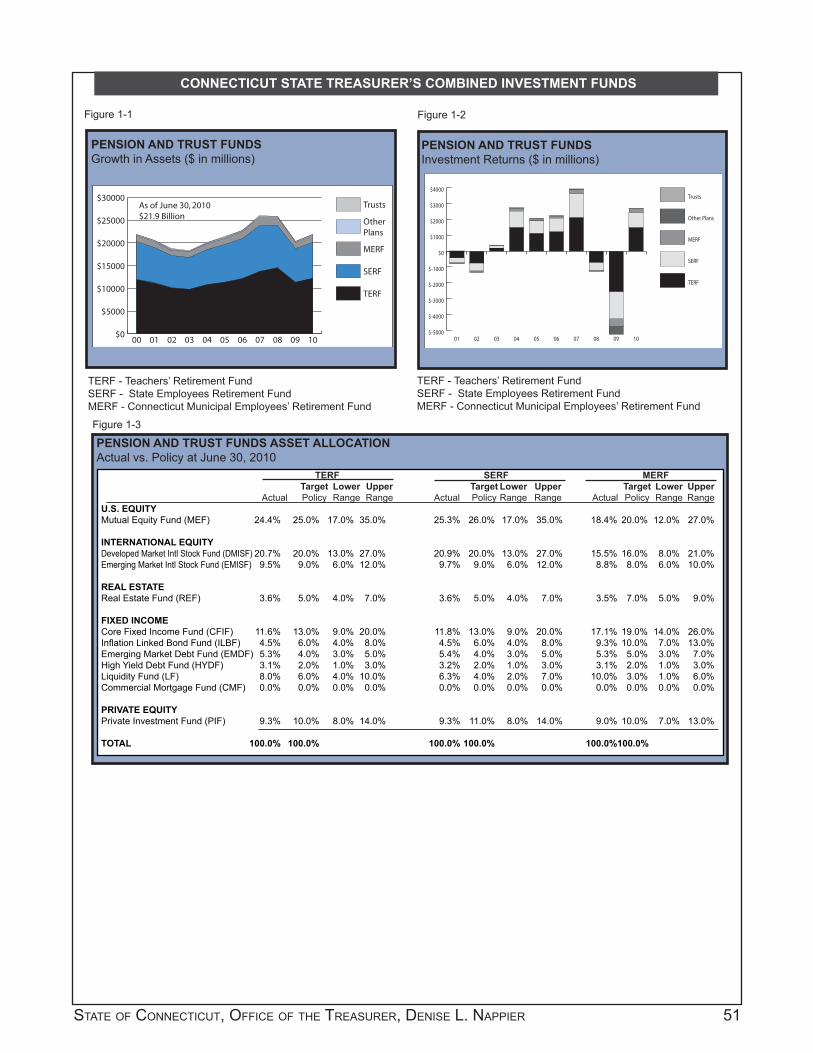
STATE OF CONNECTICUT, OFFICE OF THE TREASURER, DENISE L. NAPPIER 51
CONNECTICUT STATE TREASURER’S COMBINED INVESTMENT FUNDS
PENSION AND TRUST FUNDSGrowth in Assets ($ in millions)
TERF - Teachers’ Retirement FundSERF - State Employees Retirement FundMERF - Connecticut Municipal Employees’ Retirement Fund
Figure 1-1
PENSION AND TRUST FUNDSInvestment Returns ($ in millions)
Figure 1-2
TERF - Teachers’ Retirement FundSERF - State Employees Retirement FundMERF - Connecticut Municipal Employees’ Retirement Fund
$0
$5000
$10000
$15000
$20000
$25000
$30000Trusts
OtherPlans
MERF
SERF
TERF
1009080706050403020100
As of June 30, 2010$21.9 Billion
$-5000
$-4000
$-3000
$-2000
$-1000
$0
$1000
$2000
$3000
$4000Trusts
Other Plans
MERF
SERF
TERF
10090807060504030201
Figure 1-3
PENSION AND TRUST FUNDS ASSET ALLOCATIONActual vs. Policy at June 30, 2010 TERF SERF MERF Target Lower Upper Target Lower Upper Target Lower Upper Actual Policy Range Range Actual Policy Range Range Actual Policy Range RangeU.S. EQUITYMutual Equity Fund (MEF) 24.4% 25.0% 17.0% 35.0% 25.3% 26.0% 17.0% 35.0% 18.4% 20.0% 12.0% 27.0%
INTERNATIONAL EQUITY Developed Market Intl Stock Fund (DMISF) 20.7% 20.0% 13.0% 27.0% 20.9% 20.0% 13.0% 27.0% 15.5% 16.0% 8.0% 21.0%Emerging Market Intl Stock Fund (EMISF) 9.5% 9.0% 6.0% 12.0% 9.7% 9.0% 6.0% 12.0% 8.8% 8.0% 6.0% 10.0%
REAL ESTATEReal Estate Fund (REF) 3.6% 5.0% 4.0% 7.0% 3.6% 5.0% 4.0% 7.0% 3.5% 7.0% 5.0% 9.0%
FIXED INCOMECore Fixed Income Fund (CFIF) 11.6% 13.0% 9.0% 20.0% 11.8% 13.0% 9.0% 20.0% 17.1% 19.0% 14.0% 26.0%Infl ation Linked Bond Fund (ILBF) 4.5% 6.0% 4.0% 8.0% 4.5% 6.0% 4.0% 8.0% 9.3% 10.0% 7.0% 13.0%Emerging Market Debt Fund (EMDF) 5.3% 4.0% 3.0% 5.0% 5.4% 4.0% 3.0% 5.0% 5.3% 5.0% 3.0% 7.0%High Yield Debt Fund (HYDF) 3.1% 2.0% 1.0% 3.0% 3.2% 2.0% 1.0% 3.0% 3.1% 2.0% 1.0% 3.0%Liquidity Fund (LF) 8.0% 6.0% 4.0% 10.0% 6.3% 4.0% 2.0% 7.0% 10.0% 3.0% 1.0% 6.0%Commercial Mortgage Fund (CMF) 0.0% 0.0% 0.0% 0.0% 0.0% 0.0% 0.0% 0.0% 0.0% 0.0% 0.0% 0.0%
PRIVATE EQUITYPrivate Investment Fund (PIF) 9.3% 10.0% 8.0% 14.0% 9.3% 11.0% 8.0% 14.0% 9.0% 10.0% 7.0% 13.0%
TOTAL 100.0% 100.0% 100.0% 100.0% 100.0% 100.0%

52 COMBINED INVESTMENT FUNDS 2010 COMPREHENSIVE FINANCIAL ANNUAL REPORT
CONNECTICUT STATE TREASURER’S COMBINED INVESTMENT FUNDS
PENSION AND TRUST FUNDSAnnual Return at June 30, 2010 (1)
Figure 1-7
PENSION AND TRUST FUNDSAsset Class Diversifi cation
Figure 1-4
PENSION AND TRUST FUNDSAdvisor Breakdown
Figure 1-5
Figure 1-6
June 30, June 30, Fund 2010 2009MEF 9 10DMISF(1) 13 14EMISF 4 2PIF 66 66CFIF 5 6ILBF 2 2EMDF 5 5HYDF 4 4CMF 1 1REF 35 34LF 6 4Total(2) 150 148
(1) Does not include the Currency Overlay Manager.(2) Actual total advisors was 142 and 139, respectively
when factoring in advisors across multiple funds. Private Investment Fund partnerships with a $0 market value are not included.
PENSION AND TRUST FUNDSAnnual Returns vs. Benchmarks
0%
20%
40%
60%
80%
100% LiquidityFund
PrivateEquity
High YieldDebt
EmergingMarket Debt
InflationLinked Bond
Core FixedIncome
Fixed Income
Real Estate
EmergingMarket International Stocks
DevelopedMarketInternational Stocks
InternationalStocksU.S. Stocks
1009080706050403020201
0%
3%
6%
9%
12%
15%
MER
F Be
nchm
ark
Mun
icip
alEm
ploy
ees'
Retir
emen
tFu
nd (M
ERF)
SERF
Ben
chm
ark
Stat
e Em
ploy
ees'
Retir
emen
t Fun
d(S
ERF)
TERF
Ben
chm
ark
Teac
her's
Retir
emen
tFu
nd (T
ERF)
-25%
-20%
-15%
-10%
-5%
0%
5%
10%
15%
20%
25%
30%
LFPIF
CMF
ILBF
HYD
F
EMD
F
CFIF
REF
EMIS
F
DM
ISF
MEF
Russ
ell 3
000
50%
Hed
ged
BMI
MSC
I EM
IMI N
et
NCR
EIF
Libo
r 1 M
onth
BC A
gg
JP M
orga
n G
loba
l
BC A
gg
S &
P 50
0
BC U
S Ti
ps
Citig
roup
HYM
I
(1) Each Plan benchmark composite represents the Plans policy allocation weights times each investment Fund’s return.

STATE OF CONNECTICUT, OFFICE OF THE TREASURER, DENISE L. NAPPIER 53
CONNECTICUT STATE TREASURER’S COMBINED INVESTMENT FUNDS
Combined Investment Funds Total Return Analysis (%)
Fiscal Years Ending June 30, Annualized 3 5 10 2010 2009 2008 2007 2006 Years Years Years(Investment performance is calculated using a time-weighted rate of return based on the market rate of return.)
PLANSTeacher’s Retirement Fund (TERF) 12.87 (17.14) (4.77) 17.47 10.74 (3.79) 2.99 3.10 TERF Benchmark-NCREIF 12.29 (16.85) (6.03) 17.85 10.55 (4.27) 2.71 2.59 TERF Benchmark-Russell 3000 13.63 (17.62) (7.29) 18.00 10.01 (4.61) 2.41 2.15 State Employees’ Retirement Fund (SERF) 12.93 (18.25) (4.83) 17.37 10.57 (4.22) 2.66 2.89 SERF Benchmark-NCREIF 12.60 (17.42) (6.20) 17.85 10.55 (4.46) 2.59 2.53 SERF Benchmark-Russell 3000 13.93 (18.19) (7.46) 18.00 10.01 (4.81) 2.29 2.08 Municipal Employees’ Retirement Fund (MERF) 12.57 (14.90) (4.11) 16.96 9.87 (2.79) 3.37 3.19 MERF Benchmark-NCREIF 11.82 (14.20) (5.11) 17.85 10.55 (3.08) 3.47 2.97 MERF Benchmark-Russell 3000 13.71 (15.26) (6.57) 18.00 10.01 (3.44) 3.17 2.52 COMBINED INVESTMENT FUNDS U.S. Stocks Mutual Equity Fund 14.01 (28.36) (12.99) 18.24 10.29 (10.76) (1.51) (0.66) Russell 3000 Index 15.72 (26.56) (12.69) 20.07 9.56 (9.47) (0.48) (0.92) International Stocks Developed Markets International Stock Fund 11.03 (27.98) (14.60) 26.36 23.91 (11.93) 1.35 N/A S&P/Citigroup EPAC BMI 50% Hedged 9.68 (26.79) (16.05) 27.07 27.37 (12.32) 1.76 N/AEmerging Markets International Stock Fund 25.23 (30.90) 0.19 42.27 35.85 (4.65) 10.88 10.12 MSCI Emerging Market Investable Market Index 24.57 (26.84) 3.49 44.99 35.47 (1.93) 13.12 10.21 Equity Commercial Real Estate (1) Real Estate Fund (20.18) (28.66) 6.04 14.21 6.87 (15.48) (5.92) 1.18 Russell 3000 Index 15.72 (26.56) (12.69) 20.07 9.56 (9.47) (0.48) (0.92) Russell NCREIF (1 Qtr. Lag) (9.60) (14.68) 13.58 16.59 20.19 (4.32) 4.19 7.12 U.S. Fixed Income Core Fixed Income Fund 11.81 2.84 5.65 5.84 (0.39) 6.70 5.07 6.45 BC Aggregate Bond Index 9.50 6.05 7.13 6.12 (0.81) 7.55 5.54 6.47 Emerging Market Debt 23.02 (3.62) 5.59 14.84 11.07 7.78 9.81 N/A JP Morgan EMBI Global 17.90 2.24 5.10 11.12 4.62 8.21 8.16 N/AHigh Yield Debt 24.54 (4.59) (1.88) 12.01 4.49 5.25 6.41 6.49 Citigroup High Yield Market Index 25.64 (3.26) (2.29) 11.63 4.14 5.90 6.66 7.18 Infl ation Linked Bonds 9.48 (0.20) 16.81 3.45 (1.70) 8.47 5.35 N/A BC US Tips 9.52 (1.11) 15.09 3.99 (1.64) 7.62 4.98 7.46 Commercial Mortgage Fund 6.75 (3.14) 12.05 8.17 9.51 5.03 6.54 7.88 BC Aggregate Bond Index 9.50 6.05 7.13 6.12 (0.81) 7.55 5.54 6.47 Alternative Assets (1) Private Investment Fund 17.32 (16.36) 13.66 19.56 11.46 3.71 8.25 3.49 S & P 500 14.43 (26.22) (13.12) 20.59 8.63 (9.81) (0.79) (1.59) State Street Private Equity Index (1 Qtr. Lag) 20.89 (29.34) 13.54 29.75 27.89 (1.02) 9.98 N/A Liquidity Fund (2) Liquidity Fund 0.98 1.54 4.59 5.61 4.51 2.36 3.43 3.19 Libor 1 Month Index 0.27 1.35 4.10 5.37 4.51 1.89 3.10 2.87
(1) Real Estate and Private Investment returns published for prior years were net of management fees and for 2008 forward published numbers are net of all expenses.
(2) The Liquidity Fund includes all cash balances, including manager cash. However all fund returns still refl ect cash balances.
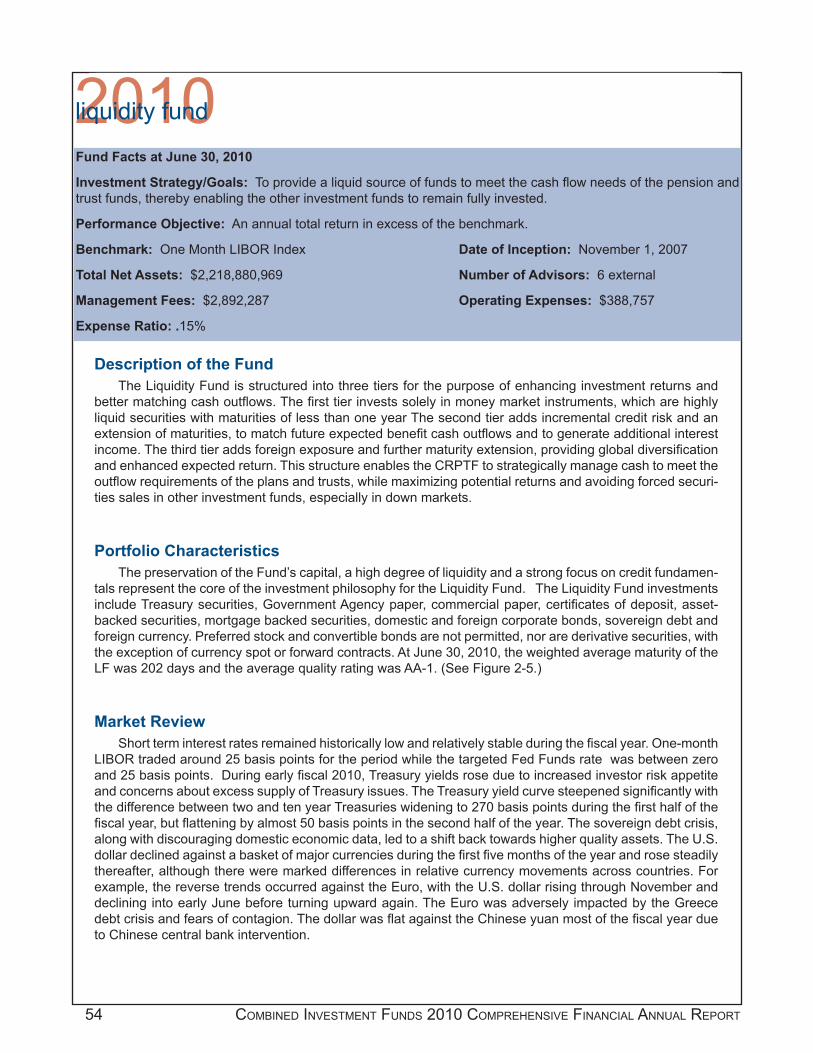
54 COMBINED INVESTMENT FUNDS 2010 COMPREHENSIVE FINANCIAL ANNUAL REPORT
2010Fund Facts at June 30, 2010
Investment Strategy/Goals: To provide a liquid source of funds to meet the cash fl ow needs of the pension and trust funds, thereby enabling the other investment funds to remain fully invested.
Performance Objective: An annual total return in excess of the benchmark.
Benchmark: One Month LIBOR Index Date of Inception: November 1, 2007
Total Net Assets: $2,218,880,969 Number of Advisors: 6 external
Management Fees: $2,892,287 Operating Expenses: $388,757
Expense Ratio: .15%
Description of the FundThe Liquidity Fund is structured into three tiers for the purpose of enhancing investment returns and
better matching cash outfl ows. The fi rst tier invests solely in money market instruments, which are highly liquid securities with maturities of less than one year The second tier adds incremental credit risk and an extension of maturities, to match future expected benefi t cash outfl ows and to generate additional interest income. The third tier adds foreign exposure and further maturity extension, providing global diversifi cation and enhanced expected return. This structure enables the CRPTF to strategically manage cash to meet the outfl ow requirements of the plans and trusts, while maximizing potential returns and avoiding forced securi-ties sales in other investment funds, especially in down markets.
Portfolio CharacteristicsThe preservation of the Fund’s capital, a high degree of liquidity and a strong focus on credit fundamen-
tals represent the core of the investment philosophy for the Liquidity Fund. The Liquidity Fund investments include Treasury securities, Government Agency paper, commercial paper, certifi cates of deposit, asset-backed securities, mortgage backed securities, domestic and foreign corporate bonds, sovereign debt and foreign currency. Preferred stock and convertible bonds are not permitted, nor are derivative securities, with the exception of currency spot or forward contracts. At June 30, 2010, the weighted average maturity of the LF was 202 days and the average quality rating was AA-1. (See Figure 2-5.)
Market ReviewShort term interest rates remained historically low and relatively stable during the fi scal year. One-month
LIBOR traded around 25 basis points for the period while the targeted Fed Funds rate was between zero and 25 basis points. During early fi scal 2010, Treasury yields rose due to increased investor risk appetite and concerns about excess supply of Treasury issues. The Treasury yield curve steepened signifi cantly with the difference between two and ten year Treasuries widening to 270 basis points during the fi rst half of the fi scal year, but fl attening by almost 50 basis points in the second half of the year. The sovereign debt crisis, along with discouraging domestic economic data, led to a shift back towards higher quality assets. The U.S. dollar declined against a basket of major currencies during the fi rst fi ve months of the year and rose steadily thereafter, although there were marked differences in relative currency movements across countries. For example, the reverse trends occurred against the Euro, with the U.S. dollar rising through November and declining into early June before turning upward again. The Euro was adversely impacted by the Greece debt crisis and fears of contagion. The dollar was fl at against the Chinese yuan most of the fi scal year due to Chinese central bank intervention.
liquidity fund

STATE OF CONNECTICUT, OFFICE OF THE TREASURER, DENISE L. NAPPIER 55
CONNECTICUT STATE TREASURER’S COMBINED INVESTMENT FUNDS
Performance SummaryFor the fi scal year ended June 30, 2010, the Liquidity Fund generated a return of .98%, net of all ex-
penses, outperforming the one month LIBOR benchmark of .27%, by 71 basis points. (See Figure 2-6.) Tier 1 returned .30%, having the lowest credit and interest rate risk of the three tiers. During fi scal 2010, Tiers 2 and 3 were fully funded. Their annual return contributions of 2.00% and 3.87%, respectively, were the result of maturity extension, credit exposure and foreign diversifi cation.
As of June 30, 2010, the Fund’s compounded annualized total returns for the trailing three, fi ve and ten year periods were 2.36%, 3.43% and 3.19%, respectively, net of all expenses. These returns exceeded those of the Fund’s benchmark for the time periods listed by 47, 33 and 32 basis points, respectively. The cumulative returns of the Liquidity Fund for the three, fi ve and ten year periods were 7.24%, 18.37% and 36.88%, respectively. (See Figure 2-6.)
Risk Profi leBy maintaining a short average maturity the Fund has relatively low interest rate risk and by investing
in high quality securities, the Liquidity Fund has a lower risk of credit default. The Fund does assume cur-rency risk though its investments in global sovereign bonds and emerging market currencies. The Fund has negligible liquidity risk, reinvestment risk or infl ation risk. Counter party risk is carefully managed by dealing only with reputable, very high quality fi rms.
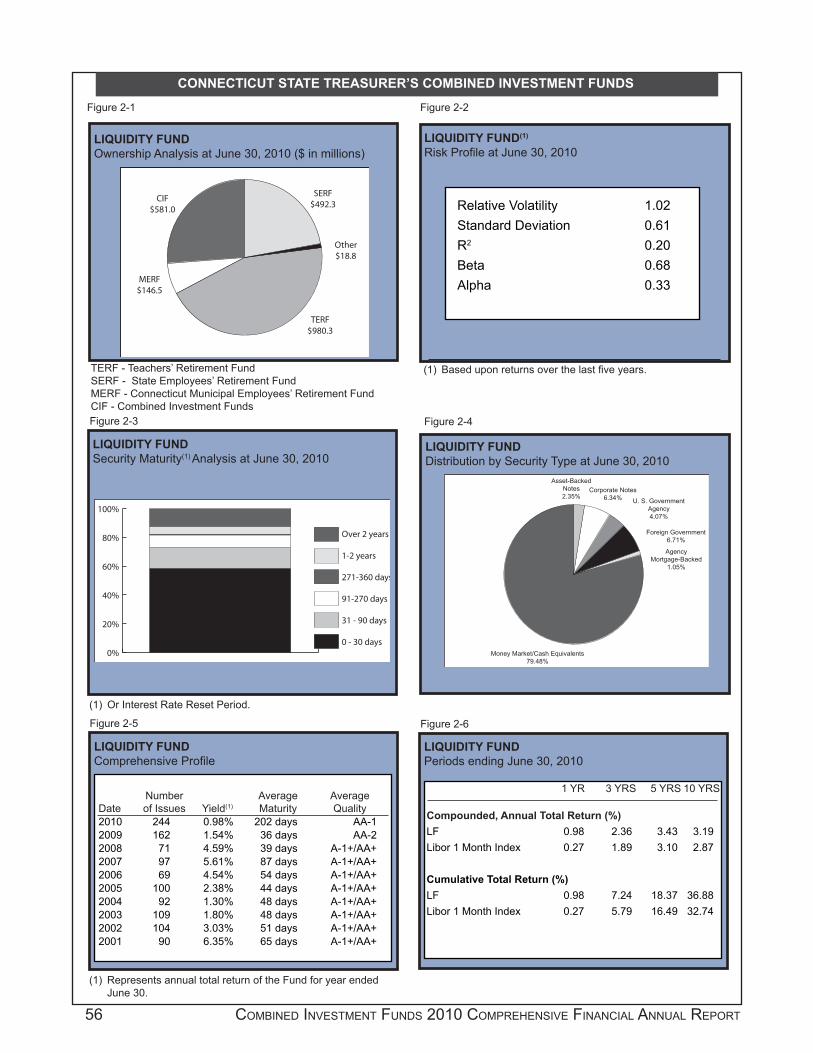
56 COMBINED INVESTMENT FUNDS 2010 COMPREHENSIVE FINANCIAL ANNUAL REPORT
CONNECTICUT STATE TREASURER’S COMBINED INVESTMENT FUNDS
LIQUIDITY FUNDOwnership Analysis at June 30, 2010 ($ in millions)
TERF - Teachers’ Retirement FundSERF - State Employees’ Retirement FundMERF - Connecticut Municipal Employees’ Retirement FundCIF - Combined Investment Funds
Figure 2-1
LIQUIDITY FUND(1)
Risk Profi le at June 30, 2010
Figure 2-2
Figure 2-3
LIQUIDITY FUNDSecurity Maturity(1) Analysis at June 30, 2010
Figure 2-4
(1) Or Interest Rate Reset Period.
Relative Volatility 1.02Standard Deviation 0.61R2 0.20Beta 0.68Alpha 0.33
(1) Based upon returns over the last fi ve years.
0%
20%
40%
60%
80%
100%
Over 2 years
1-2 years
271-360 days
91-270 days
31 - 90 days
0 - 30 days
CIF$581.0
MERF$146.5
TERF$980.3
Other$18.8
SERF$492.3
Figure 2-5
LIQUIDITY FUNDDistribution by Security Type at June 30, 2010
Figure 2-6
Money Market/Cash Equivalents79.48%
AgencyMortgage-Backed
1.05%
Foreign Government6.71%
U. S. GovernmentAgency4.07%
Corporate Notes6.34%
Asset-BackedNotes2.35%
LIQUIDITY FUNDComprehensive Profi le
(1) Represents annual total return of the Fund for year ended June 30.
Number Average Average Date of Issues Yield(1) Maturity Quality 2010 244 0.98% 202 days AA-12009 162 1.54% 36 days AA-22008 71 4.59% 39 days A-1+/AA+2007 97 5.61% 87 days A-1+/AA+2006 69 4.54% 54 days A-1+/AA+2005 100 2.38% 44 days A-1+/AA+2004 92 1.30% 48 days A-1+/AA+2003 109 1.80% 48 days A-1+/AA+2002 104 3.03% 51 days A-1+/AA+2001 90 6.35% 65 days A-1+/AA+
LIQUIDITY FUNDPeriods ending June 30, 2010
1 YR 3 YRS 5 YRS 10 YRS
Compounded, Annual Total Return (%) LF 0.98 2.36 3.43 3.19Libor 1 Month Index 0.27 1.89 3.10 2.87
Cumulative Total Return (%) LF 0.98 7.24 18.37 36.88Libor 1 Month Index 0.27 5.79 16.49 32.74
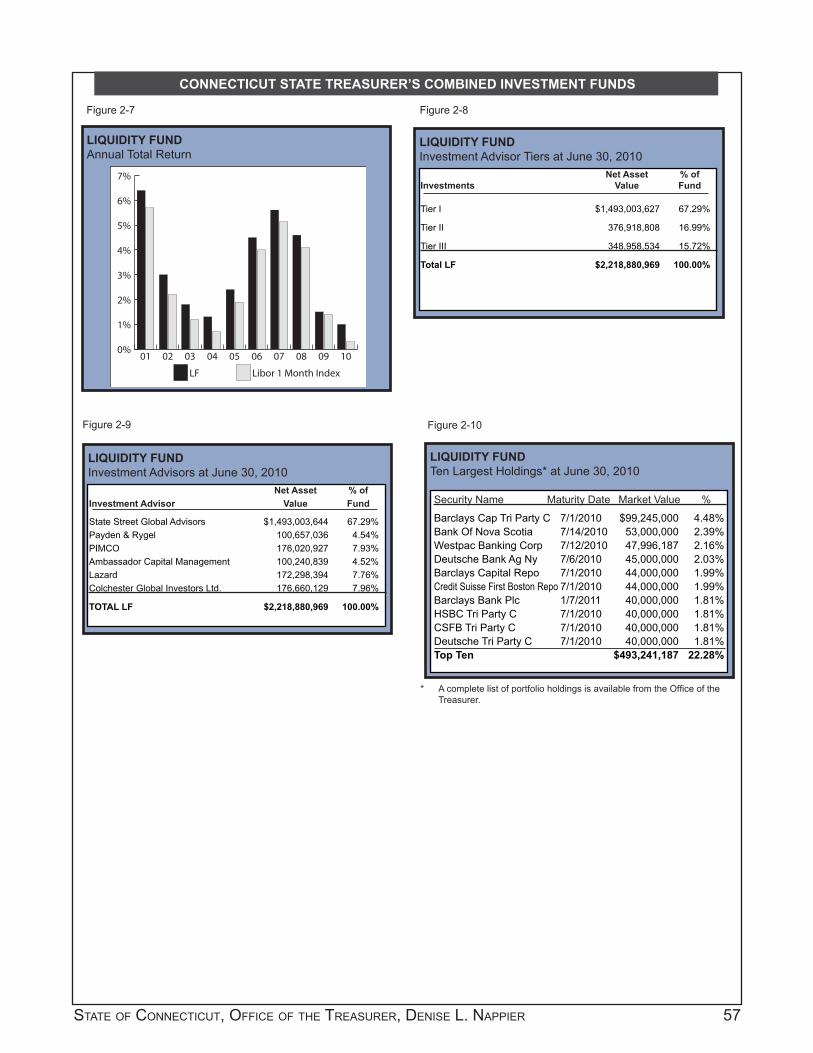
STATE OF CONNECTICUT, OFFICE OF THE TREASURER, DENISE L. NAPPIER 57
CONNECTICUT STATE TREASURER’S COMBINED INVESTMENT FUNDS
Figure 2-7 Figure 2-8
Figure 2-9
LIQUIDITY FUNDAnnual Total Return
0%
1%
2%
3%
4%
5%
6%
7%
Libor 1 Month IndexLF
10090807060504030201
LIQUIDITY FUNDInvestment Advisor Tiers at June 30, 2010
LIQUIDITY FUNDTen Largest Holdings* at June 30, 2010
Net Asset % ofInvestments Value Fund
Tier I $1,493,003,627 67.29%
Tier II 376,918,808 16.99%
Tier III 348,958,534 15.72%
Total LF $2,218,880,969 100.00%
Security Name Maturity Date Market Value %
Barclays Cap Tri Party C 7/1/2010 $99,245,000 4.48%Bank Of Nova Scotia 7/14/2010 53,000,000 2.39%Westpac Banking Corp 7/12/2010 47,996,187 2.16%Deutsche Bank Ag Ny 7/6/2010 45,000,000 2.03%Barclays Capital Repo 7/1/2010 44,000,000 1.99%Credit Suisse First Boston Repo 7/1/2010 44,000,000 1.99%Barclays Bank Plc 1/7/2011 40,000,000 1.81%HSBC Tri Party C 7/1/2010 40,000,000 1.81%CSFB Tri Party C 7/1/2010 40,000,000 1.81%Deutsche Tri Party C 7/1/2010 40,000,000 1.81%Top Ten $493,241,187 22.28%
* A complete list of portfolio holdings is available from the Offi ce of the Treasurer.
Figure 2-10
LIQUIDITY FUNDInvestment Advisors at June 30, 2010 Net Asset % ofInvestment Advisor Value Fund
State Street Global Advisors $1,493,003,644 67.29%Payden & Rygel 100,657,036 4.54%PIMCO 176,020,927 7.93%Ambassador Capital Management 100,240,839 4.52%Lazard 172,298,394 7.76%Colchester Global Investors Ltd. 176,660,129 7.96%
TOTAL LF $2,218,880,969 100.00%

58 COMBINED INVESTMENT FUNDS 2010 COMPREHENSIVE FINANCIAL ANNUAL REPORT
2010Fund Facts at June 30, 2010
Investment Strategy/Goals: To participate in the growth of the U. S. economy through the ownership of domes-tic equity securities.
Performance Objective: An annual total return that is 65 to 135 basis points greater than that of the Russell 3000 after expenses.
Benchmark: Russell 3000 Index Date of Inception: July 1, 1972
Total Net Assets: $5,289,091,696 Number of Advisors: 9 external
Management Fees: $10,744,251 Operating Expenses: $2,224,959
Expense Ratio: 0.24%
Description of the FundThe Mutual Equity Fund (MEF) is an externally managed fund investing in primarily the common stocks
of U.S. corporations. MEF serves as an investment vehicle for the Pension and Trust Funds with the goal of earning a long-term real rate of return signifi cantly above the infl ation rate.
At the close of the fi scal year, MEF consisted of ten externally managed equity portfolios structured to approximate the composition of the Russell 3000 Index. The ten portfolios were managed by nine advisors grouped into fi ve style categories. By style, investments at year end were diversifi ed as 63.7% in large capitalization, 5.1% in all capitalization 9.5% in small to mid-capitalization, 14.4% in active- extension, and 7.3% in cash equivalents and other net assets.
Portfolio CharacteristicsThe largest industry weightings at June 30, 2010 were information technology (15.8%), followed by
fi nancials (14.1%) and consumer discretionary (11.3%). (See Figure 3-3.)
The MEF’s ten largest holdings, aggregating to 13.1% of Fund investments, included a variety of blue chip companies and were broadly diversifi ed with the largest holding of 2.2% in Exxon Mobil. (See Figure 3-9.)
Market ReviewThe fi scal year began with a rally within the domestic equity markets as investor appetite for risk in-
creased, following the worst global recession in the post- WWII era. Over the fi rst half of the fi scal year, markets rebounded strongly across all market caps (large, mid, small) and investment styles (value, core, growth) following news of increases in home-building and automotive sales. The broad market continued to recover through March as markets were driven by performance in the consumer discretionary and indus-trial sectors. However, the MEF suffered in the quarter ending June 30, 2010 as all major domestic equity indices posted losses. Several events, including the European debt crisis, the Gulf of Mexico oil spill, and a Congressional vote on new fi nancial regulatory measures resulted in a sell-off by investors. All ten sectors of the S&P 500 posted losses during the last quarter of the fi scal year. The materials, industrials, fi nancials and energy sectors were particularly hit hard. Domestic equity markets posted positive returns for the one-year period ending June 30, 2010.
mutual equity fund

STATE OF CONNECTICUT, OFFICE OF THE TREASURER, DENISE L. NAPPIER 59
CONNECTICUT STATE TREASURER’S COMBINED INVESTMENT FUNDS
Performance SummaryFor the fi scal year ended June 30, 2010, the Mutual Equity Fund (MEF) posted a return of 14.01%, net
of fees and operating expenses, which underperformed the Russell 3000 Index return of 15.72% by 171 basis points. (See Figure 3-5.) The returns from the small cap portion of the portfolio were higher than the large cap returns, but the small cap segment had a lower dollar allocation than the large cap. The active extension segment of the portfolio created the greatest drag on performance. During this same period, MEF’s net assets fell from $5.590 billion to $5.289 billion, a decrease of $.301 billion. Of this net total change, an increase of $.691 billion was due to net realized and unrealized gains and $1.078 billion in net cash outfl ows to participating pension plans and trusts. Offsetting this amount is an infl ow of $87 million in net investment income.
While volatility in investment returns is expected in the short-term, the Fund’s long-term performance remains the most important comparative measure. As Figure 3-4 illustrates, MEF has generated annualized total returns, net of fees, of -10.76%, -1.51%, and -0.66% over the last three, fi ve, and ten-year periods, respectively. The Fund returns underperformed the Russell 3000 for the three and fi ve-year periods by 129 and 103 basis points, respectively, and outperformed for the ten-year period by 26 basis points.
The MEF’s cumulative total returns for the three, fi ve, and ten year periods ending June 30, 2010, were -28.94%, -7.33%, and -6.42%, respectively.
Risk Profi leBased on returns over the last fi ve years, the Fund has exhibited a similar degree of risk as that of its
benchmark, the Russell 3000 Index. With a relative volatility of 1.01, the MEF’s returns have almost equal volatility to those of the Index and refl ect a strong degree of correlation, as shown by the fund’s beta of 1.00. MEF’s annual excess return during the fi ve year period, or return relative to that achieved by the benchmark, was a negative 1.03%. (See Figure 3-2.)
MUTUAL EQUITY FUNDOwnership Analysis at June 30, 2010 ($ in millions)
TERF - Teachers’ Retirement FundSERF - State Employees Retirement FundMERF - Connecticut Municipal Employees’ Retirement Fund
Figure 3-1
MUTUAL EQUITY FUND (1)
Risk Profi le at June 30, 2010
Figure 3-2
Relative Volatility 1.01Standard Deviation 17.55R2 1.00Beta 1.00Alpha -1.03
(1) Based upon returns over the last fi ve years.
Other$56.6
TERF$2,988.2
MERF$270.9
SERF$1,973.4

60 COMBINED INVESTMENT FUNDS 2010 COMPREHENSIVE FINANCIAL ANNUAL REPORT
CONNECTICUT STATE TREASURER’S COMBINED INVESTMENT FUNDS
MUTUAL EQUITY FUNDFiscal 2010 Industrial Sector vs. Index (%)Based on Investments in Securities, at Value (1)
Figure 3-3
MUTUAL EQUITY FUNDPeriods ending June 30, 2010
Figure 3-4
At 6/30/2010: MEF Russel 3000 % of Net Annual %of Net Annual Assets Return Assets ReturnEnergy 8.9 3.1 9.8 4.2Materials 4.0 19.3 4.0 18.3Industrials 9.1 17.9 11.6 24.2Consumer Discretionary 11.3 25.7 11.9 28.2Consumer Staples 8.6 15.5 8.7 14.9Health Care 11.2 9.9 12.2 10.5Financials 14.1 15.5 17.4 17.2Information Technology 15.8 19.8 17.9 17.0Telecommunication Services 2.7 5.2 2.8 6.0Utilities 2.9 4.3 3.7 6.9Commingled Fund 11.4 10.4 0.0 - 100.0 100.0
1 YR 3 YRS 5 YRS 10 YRS
Compounded, Annual Total Return (%) MEF 14.01 -10.76 -1.51 -0.66Russell 3000 15.72 -9.47 -0.48 -0.92
Cumulative Total Return (%) MEF 14.01 -28.94 -7.33 -6.42Russell 3000 15.72 -25.80 -2.39 -8.82
(1) Excludes the Liquidity Fund.
MUTUAL EQUITY FUNDAnnual Total Return
Figure 3-5
MUTUAL EQUITY FUNDComponents of Total Return ($ in millions)
Figure 3-6
MUTUAL EQUITY FUNDComprehensive Profi le for the Fiscal Years ending June 30,
Figure 3-7
2010 2009 2008 2007 2006 MEF Russell MEF Russell MEF Russell MEF Russell MEF Russell # of Issues 1,914 3,000 1,954 3,000 2,206 3,000 2,175 3,000 2,033 3,000
Cap ($ Bil) $57.2 $59.0 $52.8 $58.7 $69.6 $72.2 $81.1 $81.5 $67.9 $69.3P/E 16.3 17.5 20.5 19.8 18.5 18.1 17.6 18.8 17.0 18.2Div Yield 1.90% 2.00% 1.98% 2.19% 1.90% 2.10% 1.60% 1.70% 1.70% 1.80%ROE 15.9% 15.8% 18.4% 20.2% 19.0% 20.2% 19.5% 20.0% 19.3% 19.1% P/B 2.7 2.9 2.9x 3.0x 3.6x 3.8x 3.6x 4.0x 3.5x 3.6x Cash & Equiv. 0.9% 0.0% 9.7% 0.0% 0.8% 0.0% 0.7% 0.0% 1.0% 0.0%
Source: Monthly Bundle-Equity Portfolio Characteristics under Russell 3000
-30%-25%-20%-15%-10%
-5%0%5%
10%15%20%25%
Russell 3000MEF
10090807060504030201 $-2500
$-2000
$-1500
$-1000
$-500
$0
$500
$1000
$1500
$2000
Capital AppreciationIncome
10090807060504030201
$11.3
($1,190.9)
($840.3)
$1,355.6
$620.2$849.1
$1,610.7
($1,223.0)
($2,278.9)
$777.3

STATE OF CONNECTICUT, OFFICE OF THE TREASURER, DENISE L. NAPPIER 61
CONNECTICUT STATE TREASURER’S COMBINED INVESTMENT FUNDS
MUTUAL EQUITY FUNDInvestment Advisors at June 30, 2010
Figure 3-8
MUTUAL EQUITY FUNDTen Largest Holdings* at June 30, 2010
Figure 3-9
(1) Other represents cash equivalents and other net assets.
Net Asset % ofInvestment Advisor Value Fund Large Cap $3,369,646,357 63.71%BGI Barclays 765,654,045 14.48%T. Rowe Price Associates 741,404,050 14.01%State Street Global Advisors 1,862,588,262 35.22%
Active Extension 762,654,863 14.42%AXA Rosenberg Investment Management 187,719,220 3.55%Pyramis 291,501,068 5.51%Numeric 283,434,575 5.36%
All Cap 268,916,132 5.08%Capital Prospects 135,861,230 2.57%FIS Group, Inc. 133,054,902 2.51%
Small/Mid Cap Enhanced 371,812,347 7.03%AXA Rosenberg 371,812,347 7.03%
Small/Mid Cap Active 129,038,328 2.44%Bivium 129,038,328 2.44%
Other (1) 387,023,669 7.32%
TOTAL MEF 5,289,091,696 100.00%
Security Name Sector Market Value %
Exxon Mobil Corp Energy $117,859,718 2.23%
Apple Inc Information Tech 80,523,053 1.52%
Microsoft Technology 75,320,543 1.42%
Proctor & Gamble Co Consumer Staples 72,737,506 1.37%
JP Morgan Chase & Co Financials 64,376,818 1.22%
AT&T Inc Telecomm Svcs 63,320,107 1.20%
Johnson & Johnson Health Care 59,811,952 1.13%
Wells Fargo & Co Financials 54,879,258 1.04%
Intl Business Machines Information Tech 52,635,202 1.00%
Bank of America Corp Financials 51,993,821 0.98%
Top Ten $693,457,978 13.11%
* A complete list of portfolio holdings is available from the Offi ce of the Treasurer.

62 COMBINED INVESTMENT FUNDS 2010 COMPREHENSIVE FINANCIAL ANNUAL REPORT
2010Fund Facts at June 30, 2010
Investment Strategy/Goals: To provide a long-term real rate of return above the infl ation rate and provide a stream of income to meet the cash fl ow needs of the pension and trust funds, by investing in a range of fi xed income securities.
Performance Objective: To achieve a net return that exceeds its benchmark by 37 to 125 basis points per an-num, over rolling three to fi ve year periods.
Benchmark: Barclays Capital U. S. Aggregate
Date of Inception: November 1, 2007 Total Net Assets: $2,701,446,209
Number of Advisors: 5 external Management Fees: $3,499,757
Operating Expenses: $790,443 Expense Ratio: 0.15%
Description of the FundThe Core Fixed Income Fund (“CFIF”) is an externally managed fund investing primarily in domestic
fi xed income securities with the goal of achieving a long-term, real rate of return above the infl ation rate and to generate income. Diversifi cation of the assets across the spectrum of fi xed income classes and among multiple money managers is expected to reduce the volatility of investment returns under various economic scenarios. Fixed income securities include both fi xed and variable rate coupon bonds that are issued by U.S. federal and state governments, domestic corporations and municipalities, as well as securitized assets such as mortgage-backed and asset-backed securities.
At June 30, 2010 the CFIF was managed by one passive and four active money managers, represent-ing 38% and 62% of the Fund, respectively. The active strategies included a fund-of-funds manager for the Connecticut Horizon Fund.
The CFIF’s long-term objective has been to achieve an annual return, net of management fees and op-erating expenses, of between 37.5 and 125 basis points in excess of the Barclays Capital U.S. Aggregate, which is widely considered to be a proxy for the performance of the overall U.S. bond market.
Portfolio CharacteristicsCFIF continues to be well diversifi ed across the spectrum of available fi xed income securities. The
Fund was invested in U.S. Government (22%), agency (36%), corporate (24%), mortgage-backed (8%) and asset-backed (4%) securities. The remaining 6% was invested in the Liquidity Fund and other assets. For the purpose of enhancing value, each CFIF active manager is given some discretion to deviate from the Barclays Capital Aggregate in the management of its funds. This active investment management can result in weighting differences between CFIF and the Barclays Capital Aggregate in terms of sectors, quality ratings and maturities. The Fund’s average quality rating of AA-1, as judged by Moody’s Investor Services, was the same as the Barclays Aggregate rating. At June 30, 2010, the CFIF was under weighted U.S. Treasury and agency securities and over weighted corporate bonds, mortgage-backed securities and asset backed securities versus the Barclays Capital Aggregate. (See Figure 4-4.)
Market ReviewFiscal 2010 was a year in which the global economy began to recover from the worst recession in the
post-WWII era. Investors became more confi dent with market conditions, leading them to favor riskier prod-ucts, which in turn led to credit spreads narrowing. Specifi cally, corporate bonds were especially strong per-formers benefi ting from investors seeking alternatives to Treasuries, as the fi nancial stability of corporations
core fi xed income fund

STATE OF CONNECTICUT, OFFICE OF THE TREASURER, DENISE L. NAPPIER 63
CONNECTICUT STATE TREASURER’S COMBINED INVESTMENT FUNDS
improved relative to that of the Government. Collateralized mortgage-backed securities (CMBS) performed well as investors showed increase interest for bonds that were anticipated to be eligible for the Government’s legacy TALF and PPIP programs. Treasuries performed poorly into early 2010, as concerns over Treasury issuance and poor auction results resulted in a sell-off, causing an increase in yields. However, over the quarter ending June 2010, concerns regarding debt challenges facing Greece and several of its European neighbors, along with unease associated with domestic economic data, led many investors to favor higher quality assets. Treasuries and investment grade credit rallied over the fi nal quarter amid a fl ight-to-quality.
Performance SummaryThe CFIF’s value as of June 30, 2010 was $2.7 billion, down from $3.2 billion one year earlier. Of this
$458 million decline, $787.1 million was due to net cash outfl ows from participating pension and trust funds, $206.3 million from net realized and unrealized gains, and $122.9 million from net investment income.
For the fi scal year ended June 30, 2010 the Core Fixed Income Fund generated a total return of 11.81%, net of fees and operating expenses, outperforming the benchmark return of 9.50% by 231 basis points. The out performance for the fi scal year was primarily attributable to underweighting of U.S. Treasuries and over weightings of mortgage-backed and credit securities. For the trailing three, fi ve and ten-year periods, CFIF’s compounded annual total returns were 6.70%, 5.07% and 6.45% respectively, net of all expenses The cumulative total returns for the three, fi ve, and ten-year periods ending June 30, 2010, were 21.48%, 28.08% and 86.90%, respectively. (See Figure 4-8.)
Risk Profi leGiven CFIF’s investment policies and objectives, the Fund is exposed to various forms of risk, such as
credit default risk, interest rate risk, liquidity risk, infl ation risk, reinvestment risk and counter party risk. These risks are monitored on an on-going basis and actions are taken to mitigate identifi ed risks.
External rating agencies assign credit ratings to individual securities refl ecting their view of the underly-ing fi rm’s credit worthiness or in the case of securitized debt, the underlying assets. U.S. Treasury bonds, which carry the highest rating of AAA, are backed by the full faith and credit of the U.S. Government and, therefore, have no credit risk. The overall quality of the Core Fixed Income Fund is very high quality at AA-1. Sixty nine percent of the Fund is rated AAA the same average quality of the AAA Barclays Capital Aggregate. (See Figure 4-5.)

64 COMBINED INVESTMENT FUNDS 2010 COMPREHENSIVE FINANCIAL ANNUAL REPORT
CONNECTICUT STATE TREASURER’S COMBINED INVESTMENT FUNDS
CORE FIXED INCOME FUNDOwnership Analysis at June 30, 2010 ($ in millions)
Figure 4-1 Figure 4-2
CORE FIXED INCOME FUNDModifi ed Duration vs. Index (1) (in Years)
Figure 4-3 Figure 4-4
TERF - Teachers’ Retirement FundSERF - State Employees’ Retirement FundMERF - Connecticut Municipal Employees’ Retirement Fund
CORE FIXED INCOME FUND (1)
Risk Profi le at June 30, 2010
Relative Volatility 1.12Standard Deviation 4.13R2 0.84Beta 1.02Alpha -0.47
(1) Based upon returns over the last fi ve years.
(1) Computed without the effect of Cash and other Net Assets.
CORE FIXED INCOME FUNDDistribution by Sector at June 30, 2010Based on Investments in Securities, at Value
Barclays CFIF Aggregate Variance
Treasury 22.0% 32.7% -10.7%
Agency 36.2% 41.1% -4.9%
Corporate 23.7% 18.8% 4.9%
Mortgage-Backed 8.2% 3.1% 5.1%
Asset-Backed 4.0% 0.3% 3.7%
Other1 5.9% 4.0% 1.9%
TOTAL 100.0% 100.0%
(1) Other category includes Liquidity Fund and other assets
MERF$252.3
TERF$1,421.5 Other
$111.7
SERF$915.9
4.0
4.5
5.0
Barclays Aggregate*CFIF
6/30/106/30/09
4.60
4.50
4.20
4.30
CORE FIXED INCOME FUNDDistribution by Quality Rating at June 30, 2010Based on Investments in Securities, at Value
Figure 4-5
CORE FIXED INCOME FUNDDistribution by Coupon at June 30, 2010Based on Investments in Securities, at Value
Figure 4-6
Aaa 68.6%
AA-1 1.5%
AA-2 to A-1 7.0%
A-2 to BAA-1 10.3%
Less than BAA-1 8.6%
Not Rated1 4.0%
Total 100.0%
(1) Represents securities for which ratings are unavailable.
Liquidity Fund8.01-10.00%
6.01-8.00%
Unclassified
4.01-6.00%
Greater than 10.01%
0.00-4.00%

STATE OF CONNECTICUT, OFFICE OF THE TREASURER, DENISE L. NAPPIER 65
CONNECTICUT STATE TREASURER’S COMBINED INVESTMENT FUNDS
CORE FIXED INCOME FUNDInvestment Advisors at June 30, 2010
Figure 4-11
Net Asset % ofInvestment Advisor Value Fund State Street Global Advisors $1,038,045,975 38.43%BlackRock Financial Mgmnt, Inc. 662,480,061 24.52%Wellington 531,174,461 19.66%Phoenix 324,967,803 12.03%Progress 131,722,970 4.88%Other (1) 13,054,939 0.48%TOTAL CFIF $2,701,446,209 100.00%
CORE FIXED INCOME FUNDAnnual Total Return
Figure 4-9 Figure 4-10
CORE FIXED INCOME FUNDDuration Distribution at June 30, 2010Based on Investments in Securities, at Value
CORE FIXED INCOME FUNDPeriods ending June 30, 2010
Figure 4-8
0-3 Years 44.3%3-5 Years 20.7%5-7 Years 11.1%7-10 Years 8.6%10+ Years 9.2%Unknown(1) 1.6%Liquidity Fund 4.5%Total 100.0%
1 YR 3 YRS 5 YRS 10 YRS
Compounded, Annual Total Return (%) CFIF 11.81 6.70 5.07 6.45BC Aggregate 9.50 7.55 5.54 6.47
Cumulative Total Return (%) CFIF 11.81 21.48 28.08 86.90BC Aggregate 9.50 24.39 30.94 87.14
Figure 4-7
(1) Other represents Liquidity Fund, other assets and terminated advisor balances.
-2%
0%
2%
4%
6%
8%
10%
12%
Barclays AggregateCFIF
10090807060504030201
CORE FIXED INCOME FUNDComprehensive Profi le for the Fiscal Year ending June 30,
* Note: Beginning weights.
(1) Represents securities for which the duration could not be calculated by the custodian.
2010 2009 CFIF BC AGG* CFIF LBAI*Number of Issues 3,398 7,755 3,421 8,454
Average Coupon 4.70% 4.50% 4.90% 5.00%
Yield Maturity 3.10% 2.70% 5.70% 4.00%
Average Maturity 6.60 6.10 6.70 5.90
Modifi ed Duration 4.50 4.30 4.60 4.20
Average Quality AA-1 AA-1 AA-1 AAA
*Cash 4.5% 0.0% 6.8% 0.0%

66 COMBINED INVESTMENT FUNDS 2010 COMPREHENSIVE FINANCIAL ANNUAL REPORT
CONNECTICUT STATE TREASURER’S COMBINED INVESTMENT FUNDS
CORE FIXED INCOME FUNDTen Largest Holdings(1) at June 30, 2010
Figure 4-12
Market Security Name Maturity Value %
U.S. Treasury N/B 5/15/2040 35,747,721 1.28%FNMA TBA Aug 30 Single Fam 12/1/2099 27,365,490 0.98%U.S. Treasury Bonds 2/15/2015 25,408,076 0.91%U.S. Treasury N/B 8/31/2011 24,356,816 0.87%U.S. Treasury N/B 10/31/2014 21,562,948 0.77%U.S. Treasury N/B 5/15/2020 21,538,205 0.77%FHLMC TBA Aug 30 Gold Single 12/1/2099 18,332,466 0.66%FNMA TBA Aug 30 Single Fam 12/1/2099 18,132,584 0.65%FNMA Pool 745275 2/1/2036 16,724,202 0.60%FNMA Pool 888876 5/1/2033 15,272,804 0.55%Top Ten 224,441,312 8.04%
(1) A complete list of portfolio holdings is available from the Offi ce of the Treasurer.
Figure 4-13
CORE FIXED INCOME FUNDQuarterly Current Yield (1) vs. Indices (%)
6/30/10 3/31/10 12/31/09 9/30/09 6/30/09CORE FIXED INCOME 4.53 4.71 4.82 7.47 7.90Barclays Aggregate 4.18 4.38 4.51 4.63 4.80Citigroup 3 Month T-Bill 0.17 0.15 0.05 0.11 0.19Barclays Treasury 2.90 3.09 3.19 3.25 3.47Barclays Agency 3.05 3.20 3.27 3.40 3.59Barclays Mortgage 4.80 4.96 5.05 5.06 5.20Barclays Corporate 5.48 5.62 5.74 5.79 6.20Barclays Asset Backed 4.38 4.56 4.76 4.79 5.36
(1) Current Yield represents annual coupon interest divided by the market value of securities.
* All of the Barclays Capital indicies were formerly known as the Lehman Brothers indicies.

STATE OF CONNECTICUT, OFFICE OF THE TREASURER, DENISE L. NAPPIER 67
CONNECTICUT STATE TREASURER’S COMBINED INVESTMENT FUNDS2010infl ation linked bond fundFund Facts at June 30, 2010
Investment Strategy/Goals: To invest primarily in U.S. infl ation-linked securities with a goal of achieving a long-term real rate of return above the infl ation rate.
Performance Objective: To achieve a net return that exceeds its benchmark by 20 to 40 basis points per an-num, over rolling three to fi ve year periods.
Benchmark: Barclays Capital U.S. Treasury Infl ation Protection Securities (“BC TIPS”) Index.
Date of Inception: November 1, 2007 Total Net Assets: $1,062,889,500
Number of Advisors: 2 external Management Fees: $901,014
Operating Expenses: $289,217 Expense Ratio: 0.13
Description of the FundDescription of the Fund
The Infl ation Linked Bond Fund (“ILBF”) is an externally managed fund investing primarily in U.S.Treasury Infl ation Protection Securities (“TIPS”), although nominal U.S. Treasuries and foreign government securities can be included on a limited basis. The goal of the Fund is to achieve a long-term rate of return above the infl ation rate and provide a source of interest income to help offset the outfl ow of retirement benefi t pay-ments. Infl ation-linked bonds can provide protection against rampant infl ation and this asset class has low to negative correlations to other asset classes within the CRPTF. An infl ation-linked bond pays a fi xed real coupon on an infl ation-adjusted principal amount. Therefore, while the rate of the coupon payment is locked the actual dollars of interest earned will vary according to the change in principal. The ultimate amount of interest paid over the life of the bond will depend on the change in infl ation. At June 30, 2010, the Fund had two investment advisors.
The ILBF’s long-term objective has been to achieve an annual return, net of management fees and operating expenses, of between 20 and 40 basis points in excess of the Fund’s benchmark.
Portfolio CharacteristicsThe ILBF is comprised mainly of U.S. TIPS. The Fund has Moody’s Investor Services highest quality
rating, AAA, matching the quality rating of the benchmark. The Fund’s average coupon at June 30, 2010 was 2.25% versus 2.19% for the benchmark. The average maturity of Fund and its benchmark were 9.15 years and 9.17 years, respectively. (Figure 5-9.)
Market ReviewDuring the fi rst half of the fi scal year, improvements in the economy, reductions in defl ationary con-
cerns, fi rmer commodity prices and an increase in nominal Treasury supply drove the performance of the TIPS market. Crude oil prices began the fi scal year at $72/barrel and jumped up to $80/barrel by the end of December. The fi ve year TIPS’ breakeven rate, defi ned as the difference between nominal U.S. Treasury bonds and the TIPS rate, was fl at during the quarter ending September 2009 but returned close to its long-term average ending 2009 at 2.2%.
During the beginning of 2010, long-term infl ation expectations fell after news of weaker core infl ation. However, as the US economy slowed down, investors became more risk averse. In conjunction with a dip in commodity prices, the TIPS market improved on an absolute basis towards the end of the fi scal year. However, the high supply and low price of oil negatively infl uenced the relative performance of the TIPS market over the last half of the fi scal year. Crude oil prices increased during the beginning of 2010 to $84/

68 COMBINED INVESTMENT FUNDS 2010 COMPREHENSIVE FINANCIAL ANNUAL REPORT
CONNECTICUT STATE TREASURER’S COMBINED INVESTMENT FUNDS
barrel but ended the fi scal year down at $76/barrel. The fi ve year TIPS breakeven rate dipped in 2010 to 1.6%, lower than the long-term average.
Performance SummaryThe ILBF’s value as of June 30, 2010 was $1,062.9 million, an increase of $ 225.6 million from the prior
fi scal year. Of this total, $142 million was due to net cash infl ows from participating pension and trust funds and $34.1 million of net investment income, plus $ 49.5 million from net realized and unrealized gains.
For the fi scal year ended June 30, 2010 the ILBF generated a total return of 9.48%, net of fees and operating expenses, underperforming the benchmark return of 9.52% by 4 basis points. For the trailing three year period, ILBF’s compounded annual total return was 8.47%, net of fees and operating expenses, outperforming the benchmark by 85 basis points (Figure 5-7.)
Risk Profi leThe major risk facing the Infl ation Linked Bond Fund is a rise in real interest rates. Real interest rates
are primarily driven by expectations for real growth in the economy and for monetary policy. Economic growth and tight monetary policy to stem infl ationary pressures are conditions that can drive up real interest rates. A rise in real interest rates decreases the effectiveness of TIPS as an infl ation hedge, as bond prices fall.

STATE OF CONNECTICUT, OFFICE OF THE TREASURER, DENISE L. NAPPIER 69
CONNECTICUT STATE TREASURER’S COMBINED INVESTMENT FUNDS
INFLATION LINKED BOND FUNDOwnership Analysis at June 30, 2010 ($ in millions)
Figure 5-1 Figure 5-2
INFLATION LINKED BOND FUNDModifi ed Duration vs. Index (1) (in Years)
Figure 5-3 Figure 5-4
INFLATION LINKED BOND FUNDDistribution by Quality Rating at June 30, 2010Based on Investments in Securities, at Value
Figure 5-5
INFLATION LINKED BOND FUNDDistribution by Coupon at June 30, 2010Based on Investments in Securities, at Value
Figure 5-6
TERF - Teachers’ Retirement FundSERF - State Employees Retirement FundMERF - Connecticut Municipal Employees’ Retirement Fund (1) Computed without the effect of Cash and other Net Assets.
INFLATION LINKED BOND FUNDDistribution by Sector at June 30, 2010Based on Investments in Securities, at Value
ILBF BC US TIPS* Variance
Treasury 96.2% 100.0% -3.8%
Agency 0.0% 0.0% 0.0%
Corporate 0.0% 0.0% 0.0%
Foreign 0.0% 0.0% 0.0%
Liquidity Fund 3.8% 0.0% 3.8%
TOTAL 100.0% 100.0%
Aaa 100.0%
AA-1 0.0%
AA-2 to A-1 0.0%
A-2 to BAA-1 0.0%
Less than BAA-1 0.0%
Not Rated1 0.0%
Total 100.0%
(1) Represents securities for which ratings are unavailable.
MERF$136.1
TERF$548.9
Other$26.6
SERF$351.3
*Liquidity Fund
2.01-4.00%
0.00-2.00%
0
1
2
3
4
5
6
7
8
BC US TIPS*ILBF
6/30/106/30/09
7.747.717.94 7.77
INFLATION LINKED BOND FUNDDuration Distribution at June 30, 2010Based on Investments in Securities, at Value
0-3 Years 54.2%3-5 Years 5.8%5-7 Years 10.8%7-10 Years 22.6%10+ Years 2.8%Unknown(1) 0.0%Liquidity Fund 3.8%Total 100.0%
(1) Represents securities for which the duration could not be calculated by the custodian.
*Note: Ending weights

70 COMBINED INVESTMENT FUNDS 2010 COMPREHENSIVE FINANCIAL ANNUAL REPORT
CONNECTICUT STATE TREASURER’S COMBINED INVESTMENT FUNDS
INFLATION LINKED BOND FUNDInvestment Advisors at June 30, 2010
Figure 5-11
INFLATION LINKED BOND FUNDTen Largest Holdings (1) at June 30, 2010
Net Asset % ofInvestment Advisor Value Fund Brown Brothers Harriman $600,761,965 56.52%Hartford Investment Mgmt Co. 461,830,308 43.45%Other (1) 297,227 0.03%TOTAL ILBF $1,062,889,500 100.00%
Market Security Name Maturity Value %
U.S. Treasury Bonds 01/15/25 99,213,493 9.27%U.S. Treasury Bonds 01/15/26 87,043,947 8.13%U.S. Treasury Notes 01/15/16 84,301,286 7.87%U.S. Treasury Notes 04/15/11 72,610,257 6.78%U.S. Treasury Notes 01/15/14 66,797,952 6.24%U.S. Treasury Notes 07/15/16 64,307,460 6.01%U.S. Treasury Notes 01/15/17 57,903,348 5.41%U.S. Treasury Notes 01/15/15 54,088,528 5.05%U.S. Treasury Bonds 04/15/28 52,389,083 4.89%U.S. Treasury Notes 07/15/12 46,685,398 4.36%Top Ten 685,340,752 64.01%
INFLATION LINKED BOND FUNDAnnual Total Return
Figure 5-9
Figure 5-10
INFLATION LINKED BOND FUNDPeriods ending June 30, 2010
Figure 5-8
1 YR 3 YRS 5YRS
Compounded, Annual Total Return (%) ILBF 9.48 8.47 5.35LB U.S. Tips 9.52 7.62 4.98
Cumulative Total Return (%) ILBF 9.48 27.63 29.79LB U.S. Tips 9.52 24.64 27.49
Figure 5-7
(1) Other represents Liquidity Fund, other assets and terminated advisor balances.
(1) A complete list of portfolio holdings is available from the Offi ce of the Treasurer.
-5%
0%
5%
10%
15%
20%
BC US TIPS*ILBF
1009080706
INFLATION LINKED BOND FUNDComprehensive Profi le for the Fiscal Year ending June 30,
2010 2009 BC US BC US ILBF TIPS ILBF TIPS*
Number of Issues 26 29 26 27
Average Coupon 2.25% 2.19% 2.22% 2.28%
Average Maturity 9.15 9.17 9.23 9.19
Modifi ed Duration 7.71 7.74 7.94 7.77
Average Quality AAA AAA AAA AAA
Cash (1) 3.8% 0.0% 1.6% 0.0%
(1) Ending Weights
* The Barclays Capital U. S. TIPS Index was formerly known as the Lehman Brothers U. S. TIPS Index.

STATE OF CONNECTICUT, OFFICE OF THE TREASURER, DENISE L. NAPPIER 71
CONNECTICUT STATE TREASURER’S COMBINED INVESTMENT FUNDS2010Fund Facts at June 30, 2010
Investment Strategy/Goals: To invest primarily in debt securities of select foreign emerging markets with a goal of portfolio diversifi cation and enhanced risk-adjusted returns.
Performance Objective: To achieve a net return that exceeds its benchmark by 100 to 200 basis points per an-num, over rolling three to fi ve year periods.
Benchmark: J.P. Morgan Emerging Market Bond Index (EMBI) Global Index.
Date of Inception: November 1, 2007 Total Net Assets: $1,175,862,368
Number of Advisors: 5 external Management Fees: $4,544,477
Operating Expenses: $385,283 Expense Ratio: 0.43%
emerging market debt fund
Description of the FundThe Emerging Market Debt Fund (EMDF) is an externally managed fund investing primarily in govern-
ment and corporate debt securities of select foreign emerging markets with a goal of achieving a long-term real rate of return above the infl ation rate. The economies and fi nancial markets of emerging countries have historically had lower correlations to U.S. markets and provide desirable risk diversifi cation for the portfolio. Emerging markets are expected to have higher economic growth rates than developed countries. The EMDF money managers have different investment approaches and generate returns from both country and cur-rency selection. Securities can be dollar denominated or in the local currency of the country, with the latter sometimes hedged back to the U.S. dollar. Sovereign loans, Brady bonds and Eurobonds, along with quasi-sovereigns, multinational companies and local corporate debt are examples of securities held in this fund.
At June 30, 2010, the Fund had fi ve money managers.
Portfolio CharacteristicsThe Emerging Market Debt Fund is a diversifi ed portfolio with an overall yield to maturity of 6.33%. This
compares favorably to the benchmark yield to maturity of 5.86%. (See Figure 6-11.) The Fund is diversifi ed across geographic regions with the highest weighting in Latin American countries at 40%. Europe was the second highest regional concentration in the portfolio and was also the highest underweight compared to the index. Investments in Africa also out weighed those of the index. (See Figure 6-3.) The average quality of EMDF was Baa-3, the same quality as the benchmark. (See Figure 6-11.) The distribution by quality ratings for the Fund is portrayed in Figure 6-4. With a duration lower than the index, 6 years versus 7.1 years, the fund has less interest rate risk than the index.
Market ReviewThe emerging debt markets began the fi scal year strongly, rallying behind news of recovering market
conditions. Specifi cally, optimistic views of the global GDP recovery, the loosening of credit conditions and government policies propelled the emerging debt market during the quarter ending September 2009. The rally continued into the end of 2009; however fears of central banks abandoning their economic stimulus plans, a rise in US interest rates as well as the strengthening of the US dollar slowed the emerging debt markets rally. Regardless of these setbacks, emerging debt market spreads continued to tighten. News of the European sovereign debt crisis and the debt crisis involving state-owned Dubai World led investors to favor emerging market sovereigns in lieu of their developed market counterparts. Sovereign risk concerns tempo-rarily dwindled during the beginning of 2010 after reports of EU fi nancial aid and hopes of IMF involvement in the Greek debt crisis. An increase in large fl ows into the emerging market debt asset class, fundamental improvements in credit quality, improvements in global liquidity and attractive bond yield curves led inves-

72 COMBINED INVESTMENT FUNDS 2010 COMPREHENSIVE FINANCIAL ANNUAL REPORT
CONNECTICUT STATE TREASURER’S COMBINED INVESTMENT FUNDS
tors into higher yielding emerging market bonds. However, over the quarter ending June 2010, emerging debt market spreads widened in most emerging market countries as fears of contagion of the European debt crisis outside of the Euro zone were met. As a result, S&P downgraded Greece to junk status and downgraded Portugal and Spain further fueling the mounting sovereign debt problems. The emerging debt markets faced extreme volatility in May, ending the month lower. Sentiment improved in June, reopening the new issue market, which was closed during the economic crisis.
Performance SummaryThe EMDF’s value as of June 30, 2010 was $1.2 billion, a rise of $.44 million. Of this increase, $199
million was due to net cash outfl ows from participating pension and trust funds and $87.3 million was gener-ated from net investment income. Net realized and unrealized gains contributed $155.8 million.
For the fi scal year ended June 30, 2010 the Emerging Market Debt Fund outperformed its benchmark by 512 basis points. It generated a return of 23.02%, net of fees and operating expenses compared the benchmark return of 17.90%. For the trailing three year and fi ve year periods, EMDF’s compounded annual total returns were 7.78% and 9.81%, respectively, net of fees. The cululative return over the past fi ve years was 1166 basis points more than the benchmark. (See Figure 6-7.)
Risk Profi leGiven EMDF’s investment policies and objectives, the Fund is exposed to various forms of risk. These
include, but are not limited to interest rate risk, currency risk, purchasing power risk, default risk, and rein-vestment risk. In addition, the Fund is potentially exposed to geopolitical risk. These risks are monitored on an on-going basis and actions are taken as appropriate to mitigate identifi ed risks.

STATE OF CONNECTICUT, OFFICE OF THE TREASURER, DENISE L. NAPPIER 73
CONNECTICUT STATE TREASURER’S COMBINED INVESTMENT FUNDS
EMERGING MARKET DEBT FUNDOwnership Analysis at June 30, 2010 ($ in millions)
Figure 6-1 Figure 6-2
EMERGING MARKET DEBT FUNDModifi ed Duration vs. Index (1) (in Years)
Figure 6-3 Figure 6-4
EMERGING MARKET DEBT FUNDDistribution by Quality Rating at June 30, 2010Based on Investments in Securities, at Value
Figure 6-5
EMERGING MARKET DEBT FUNDDistribution by Coupon at June 30, 2010Based on Investments in Securities, at Value
Figure 6-6
TERF - Teachers’ Retirement FundSERF - State Employees Retirement FundMERF - Connecticut Municipal Employees’ Retirement Fund (1) Computed without the effect of Cash and other Net Assets.
EMERGING MARKET DEBT FUNDDistribution by Region at June 30, 2010
Aaa 2.4%
AA-1 0.0%
AA-2 to A-1 1.4%
A-2 to BAA-1 19.1%
Less than BAA-1 37.9%
Not Rated(1) 39.2%
Total 100.0%
(1) Represents securities for which ratings are unavailable.
MERF$78.2
TERF$656.0
Other$21.6
SERF$420.1
*Other
Unclassified
Greater than 10.01%
8.01-10.00%
6.01-8.00%
4.01-6.00%
0.00-4.00%
0
1
2
3
4
5
6
7
8
JP Morgan EMBI Global Index
EMDF
06/30/1006/30/09
6.01
7.09
5.936.37
EMERGING MARKET DEBT FUNDDuration Distribution at June 30, 2010Based on Investments in Securities, at Value
0-3 Years 12.3%3-5 Years 14.9%5-7 Years 40.1%7-10 Years 12.7%10+ Years 11.0%Unknown(1) 4.7%Liquidity Fund 4.3%Total 100.0%
(1) Represents securities for which the duration could not be calculated by the custodian.
* Includes Liquidity Fund and other assets. Note: Ending weights.
JP Morgan EMDF EMBI Variance
Asia 16.0% 17.1% -1.1%
Africa 5.9% 2.9% 3.0%
Europe 27.4% 32.4% -5.0%
Latin America 40.4% 39.0% 1.4%
Middle East 2.2% 1.9% 0.3%
United States 8.1% 6.7% 1.4%
TOTAL 100.0% 100.0%

74 COMBINED INVESTMENT FUNDS 2010 COMPREHENSIVE FINANCIAL ANNUAL REPORT
CONNECTICUT STATE TREASURER’S COMBINED INVESTMENT FUNDS
EMERGING MARKET DEBT FUNDInvestment Advisors at June 30, 2010
Figure 6-11
EMERGING MARKET DEBT FUNDTen Largest Holdings* at June 30, 2010
Net Asset % ofInvestment Advisor Value Fund Ashmore $275,397,208 23.42%Stone Harbor Investment Partners 258,043,051 21.95%ING Investment Management 204,085,677 17.36%Pyramis 220,008,611 18.71%UBS Global Asset Management 216,987,326 18.45%Other (1) 1,340,495 0.11%TOTAL EMDF $1,175,862,368 100.00%
Market Security Name Maturity Value %
Russian Federation 03/31/30 32,278,161 2.79%Nota Tesouro Nacional 01/01/21 19,304,440 1.67%Republic of Argentina 03/28/11 18,368,845 1.59%UBS Glam REF 70325 03/05/11 12,458,890 1.08%UBS Glam REF 70325 03/05/15 12,243,246 1.06%Republic of Indonesia 03/04/19 12,175,625 1.05%UBS Glam REF 70491 03/20/17 10,605,430 0.92%South Africa (Republic) 12/21/18 10,496,341 0.91%Republic of Poland 07/15/19 10,315,502 0.89%Brazil (FED REP) 05/15/45 10,142,666 0.88%Top Ten $148,389,146 12.84%
EMERGING MARKET DEBT FUNDAnnual Total Return
Figure 6-9 Figure 6-10
EMERGING MARKET DEBT FUNDPeriods ending June 30, 2010
Figure 6-8
1 YR 3 YRS 5YRS
Figure 6-7
(1) Other represents cash equivalents, other net assets and terminated advisor balances.
* A complete list of portfolio holdings is available from the Offi ce of the Treasurer.
-5%
0%
5%
10%
15%
20%
25%
JP Morgan EMBI Global Index
EMDF
1009080706
EMERGING MARKET DEBT FUNDComprehensive Profi le for the Fiscal Year ending June 30,
2010 2009 EMDF EMBI EMDF EMBI
Number of Issues 475 225 391 203
Yield to Maturity 6.33% 5.86% 14.48% 7.77%
Average Maturity 10.19% 12.40% 10.98% 12.30%
Modifi ed Duration 6.01 7.09 5.93 6.37
Average Quality BAA-3 BAA-3 BA-1 BA-1
*Other 6.7% 0.0% 6.9% 0.0%
* Includes Liquidity Fund and other assets. Note: Ending weights
Compounded, Annual Total Return (%) EMDF 23.02 7.78 9.81JP Morgan EMBI Global Index 17.90 8.21 8.16
Cumulative Total Return (%) EMDF 23.02 25.19 59.68JP Morgan EMBI Global Index 17.90 26.69 48.02

STATE OF CONNECTICUT, OFFICE OF THE TREASURER, DENISE L. NAPPIER 75
CONNECTICUT STATE TREASURER’S COMBINED INVESTMENT FUNDS2010Fund Facts at June 30, 2010
Investment Strategy/Goals: To invest in below investment grade debt securities with a goal of achieving a long-term real rate of return above the infl ation rate.
Performance Objective: To achieve a net return that exceeds its benchmark by 150 to 300 basis points per an-num, over rolling three to fi ve year periods.
Benchmark: Citigroup High Yield Market Index
Date of Inception: November 1, 2007 Total Net Assets: $692,764,499
Number of Advisors: 4 external Management Fees: $2,544,771
Operating Expenses: $239,169 Expense Ratio: 0.39%
high yield debt fund
Description of the FundThe High Yield Debt Fund (HYDF) is an externally managed fund investing in below investment grade
debt securities with a goal of achieving a long-term real rate of return above the infl ation rate. This asset class pays a higher interest rate than investment grade credit to compensate the investor for higher default risk. Combining top-down macro analysis with fundamental bottom-up security selection, the Fund manag-ers identify distressed corporations that have upside potential. Higher interest income and security price appreciation are the drivers of investment return.
At June 30, 2010 the Fund had four money managers. (See Figure 7-11.)
The HYDF’s long-term objective is to achieve an annual return, net of management fees and operating expenses, of between 150 and 300 basis points in excess of the Citigroup High Yield Market Index over rolling three-to-fi ve year periods.
Portfolio CharacteristicsThe HYDF is comprised of 679 securities and is well diversifi ed across a range of corporate high yield
securities, predominantly in the U. S. Two of the fund’s managers tend to invest in the higher quality end of the spectrum while the other two will consider opportunities in lower quality investments. The Fund’s aver-age quality rating was B-2, matching the average quality of the benchmark. (See Figure 7-10.) At June 30, 2010, two-thirds of the portfolio’s investments had maturities in the three to seven year time frame.
Market ReviewAs investors began to show a willingness to take on more risk, the bond market saw a decline in credit
spreads in high yield securities during the fi scal year ended June 30, 2010. As a result, high yield bonds displayed strong returns at the beginning of the fi scal year, continuing the rally that began in early 2009. Over the fi rst three quarters of the fi scal year, CCC-rated bonds were the best performers versus higher-quality bonds as investors sought higher yielding, riskier assets. High yield bonds returned positive performance in eleven out of the twelve months in 2009, resulting in the asset class’s best performance on record. The rally began to slow down in the quarter ending March 2010, but high yield continued to generate positive returns due to optimistic economic news and improved corporate balance sheets. Over the quarter end-ing June 2010, investors began to question the legitimacy of the market recovery. Concerns regarding debt challenges facing Greece and several of its European neighbors, along with unease associated with domestic economic data, led many investors to seek higher quality assets, leaving high yield bonds out of favor. BB-rated bonds became the best performer, contrasting the strong performance of CCC-rated bonds throughout most of the fi scal year.

76 COMBINED INVESTMENT FUNDS 2010 COMPREHENSIVE FINANCIAL ANNUAL REPORT
CONNECTICUT STATE TREASURER’S COMBINED INVESTMENT FUNDS
Performance SummaryThe HYDF’s value as of June 30, 2010 was $692.8 million, a decline of $40.4 million since June 2009.
This decrease was the result of, $206.7million from net cash outfl ows to participating pension and trust funds, $63.7 million from net investment income and $102.6 million from net realized and unrealized gains.
For the fi scal year ended June 30, 2010 the HYDF gained 24.5%, net of fees and operating expenses, compared to the benchmark return of 25.6%. Over the fi ve year period, HYDF had an annualized return of 6.4% versus the index return of 6.7%. On a cumulative basis over the same period, this fund returned 36.5% compared to the index return of 38% (See Figure 7-8.)
Risk Profi leGiven the HYDF’s investment policies and objectives, the Fund is exposed to several forms of risk.
These include, but are not limited to credit default risk, interest rate risk, liquidity risk, reinvestment risk and infl ation risk. In addition, the Fund is occasionally exposed to political, economic and currency risk resulting from investments in international high yield securities.

STATE OF CONNECTICUT, OFFICE OF THE TREASURER, DENISE L. NAPPIER 77
CONNECTICUT STATE TREASURER’S COMBINED INVESTMENT FUNDS
HIGH YIELD DEBT FUNDOwnership Analysis at June 30, 2010 ($ in millions)
Figure 7-1 Figure 7-2
HIGH YIELD DEBT FUNDModifi ed Duration vs. Index (1) (in Years)
Figure 7-3 Figure 7-4
HIGH YIELD DEBT FUNDDistribution by Quality Rating at June 30, 2010Based on Investments in Securities, at Value
Figure 7-5
HIGH YIELD DEBT FUNDDistribution by Coupon at June 30, 2010Based on Investments in Securities, at Value
Figure 7-6
TERF - Teachers’ Retirement FundSERF - State Employees Retirement FundMERF - Connecticut Municipal Employees’ Retirement Fund
HIGH YIELD DEBT FUND (1)
Risk Profi le at June 30, 2010
Relative Volatility 0.84Standard Deviation 11.37R2 0.92Beta 0.81Alpha -0.25
(1) Based upon returns over the last fi ve years.
(1) Computed without the effect of Cash and other Net Assets.
HIGH YIELD DEBT FUNDDistribution by Sector at June 30, 2010Based on Investments in Securities, at Value
HYDF Citigroup Variance
Treasury 0.0% 0.0% 0.0%
Agency 0.0% 0.0% 0.0%
Corporate 94.1% 99.9% -5.8%
Mortgage-Backed 0.0% 0.0% 0.0%
Asset-Backed 0.0% 0.1% -0.1%
Other(1) 5.9% 0.0% 5.9%
TOTAL 100.0% 100.0%
(1) Other category includes non fi xed-income securities such as common and preferred stock and convertible securities, Liquidity Fund and other assets.
AA-2 to A-1 0.9%
A-2 to BAA-1 3.9%
Less than BAA-1 84.9%
Not Rated1 10.3%
Total 100.0%
(1) Represents securities for which ratings are unavailable.
MERF$44.9
TERF$384.2
Other$16.5
SERF$247.2
*LiquidityFund
Unclassified
Greater than 10.00%
8.01-10.00%6.01-8.00%
4.01-6.00%
0.00-4.00%
4
5
6
Citigroup High YieldHYDF
6/30/106/30/09
4.93
4.20
4.70
4.37
* Note: Ending weights.
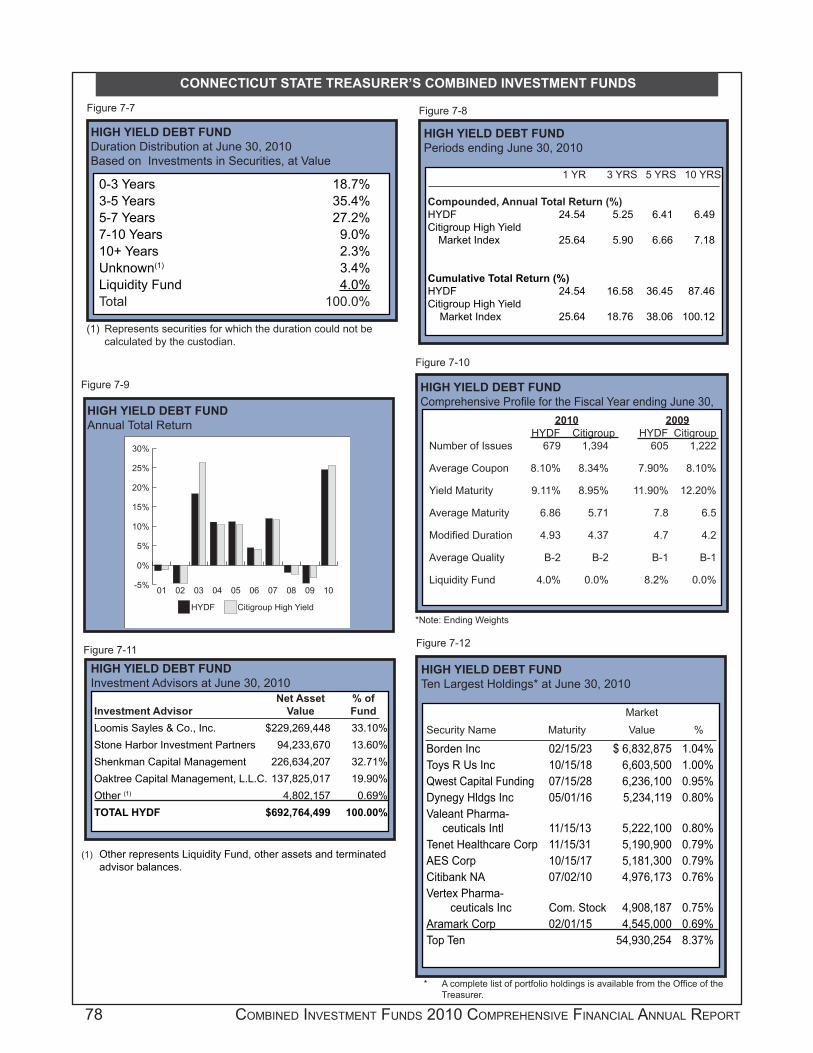
78 COMBINED INVESTMENT FUNDS 2010 COMPREHENSIVE FINANCIAL ANNUAL REPORT
CONNECTICUT STATE TREASURER’S COMBINED INVESTMENT FUNDS
HIGH YIELD DEBT FUNDInvestment Advisors at June 30, 2010
Figure 7-11
HIGH YIELD DEBT FUNDTen Largest Holdings* at June 30, 2010
Figure 7-12
Net Asset % ofInvestment Advisor Value Fund Loomis Sayles & Co., Inc. $229,269,448 33.10%Stone Harbor Investment Partners 94,233,670 13.60%Shenkman Capital Management 226,634,207 32.71%Oaktree Capital Management, L.L.C. 137,825,017 19.90%Other (1) 4,802,157 0.69%TOTAL HYDF $692,764,499 100.00%
Market Security Name Maturity Value %
Borden Inc 02/15/23 $ 6,832,875 1.04%Toys R Us Inc 10/15/18 6,603,500 1.00%Qwest Capital Funding 07/15/28 6,236,100 0.95%Dynegy Hldgs Inc 05/01/16 5,234,119 0.80%Valeant Pharma- ceuticals Intl 11/15/13 5,222,100 0.80%Tenet Healthcare Corp 11/15/31 5,190,900 0.79%AES Corp 10/15/17 5,181,300 0.79%Citibank NA 07/02/10 4,976,173 0.76%Vertex Pharma- ceuticals Inc Com. Stock 4,908,187 0.75%Aramark Corp 02/01/15 4,545,000 0.69%Top Ten 54,930,254 8.37%
HIGH YIELD DEBT FUNDAnnual Total Return
Figure 7-9 HIGH YIELD DEBT FUNDComprehensive Profi le for the Fiscal Year ending June 30,
Figure 7-10
HIGH YIELD DEBT FUNDDuration Distribution at June 30, 2010Based on Investments in Securities, at Value
HIGH YIELD DEBT FUNDPeriods ending June 30, 2010
Figure 7-8
0-3 Years 18.7%3-5 Years 35.4%5-7 Years 27.2%7-10 Years 9.0%10+ Years 2.3%Unknown(1) 3.4%Liquidity Fund 4.0%Total 100.0%
1 YR 3 YRS 5 YRS 10 YRS
Compounded, Annual Total Return (%) HYDF 24.54 5.25 6.41 6.49Citigroup High Yield Market Index 25.64 5.90 6.66 7.18
Cumulative Total Return (%) HYDF 24.54 16.58 36.45 87.46Citigroup High Yield Market Index 25.64 18.76 38.06 100.12
(1) Represents securities for which the duration could not be calculated by the custodian.
Figure 7-7
(1) Other represents Liquidity Fund, other assets and terminated advisor balances.
* A complete list of portfolio holdings is available from the Offi ce of the Treasurer.
-5%
0%
5%
10%
15%
20%
25%
30%
Citigroup High YieldHYDF
10090807060504030201
2010 2009 HYDF Citigroup HYDF CitigroupNumber of Issues 679 1,394 605 1,222
Average Coupon 8.10% 8.34% 7.90% 8.10%
Yield Maturity 9.11% 8.95% 11.90% 12.20%
Average Maturity 6.86 5.71 7.8 6.5
Modifi ed Duration 4.93 4.37 4.7 4.2
Average Quality B-2 B-2 B-1 B-1
Liquidity Fund 4.0% 0.0% 8.2% 0.0%
*Note: Ending Weights

STATE OF CONNECTICUT, OFFICE OF THE TREASURER, DENISE L. NAPPIER 79
2010Fund Facts at June 30, 2010
Investment Strategy/Goals: To achieve a long-term real rate of return above the U.S. infl ation rate and provide asset diversifi cation through equity investments in developed foreign countries.
Performance Objective: An annual total return 100 to 250 basis points greater than the Benchmark after ex-penses.
Benchmark: S&P/Citigroup BMI EPAC (Europe, Pacifi c, Asia Composite) Index 50% Hedged
Date of Inception: November 1, 2007 Total Net Assets: $4,434,960,564
Number of Advisors: 14 external Management Fees: $22,085,148
Operating Expenses: $1,839,727 Expense Ratio: 0.54%
Description of the FundThe Developed Markets International Stock Fund (“DMISF”) is an externally managed fund, which invests
in equity securities of non-U.S. corporations. The goal of this asset class is to participate in the growth of developed foreign markets and achieve a long–term, real rate of return above the U.S. infl ation rate. At the end of fi scal year 2010, the Fund had fourteen external advisors specializing in different aspects of the market. (See Figure 8-6.) Based on the Fund’s net asset value as of June 30, 2010, actively managed core investments accounted for approximately 29.9% of the portfolio. The remaining portion of the portfolio that was actively managed was allocated as follows: 22.3% in active growth/value, 14.5% in small cap, and 14.4% risk controlled. Fourteen and a half percent of the portfolio was passively managed and 1.6% was contained in the currency management account. Additionally, approximately 2.3% was managed through the Connecticut Horizon Fund (CHF) with the fi nal .5% held in cash equivalents.
Portfolio CharacteristicsAt fi scal year-end, DMISF was 99.5% invested in developed market foreign securities, refl ecting the
Fund’s policy to be fully invested. The DMISF country allocations were generally similar to the weightings of the index, with Japan, Australia, and Korea slightly underweighted relative to the index. The largest geo-graphic concentrations were Japan (19.4%) and the United Kingdom (18.1%). The variances from the index weightings refl ect the active management of the portfolio. (See Figure 8-5.)
The DMISF was well diversifi ed by market, sector and capitalization. At year-end, the Fund’s largest investment, consumer staples’ leader Nestlé’s, comprised 1.8% of the total aggregate investment securities. At June 30, 2010, the top ten holdings of the portfolio accounted for only 10.5% of the Fund’s investments indicating broad stock diversifi cation. (See Figure 8-7.)
Market ReviewThe developed markets began the fi scal year on a high note, rallying throughout the quarter ending Sep-
tember 30, 2009. Performance was driven by strong gains within the European equities’ market. Signifi cant exposure to the fi nancials sector, specifi cally within banking stocks, led the equities’ rally over the quarter. However, by June the rally in developed markets subsided. The Greek debt crisis led investors to raise con-cerns regarding the fi scal and economic policies of many other European countries and also threatened the stability of the Euro. In addition, concerns over the rising debt to GDP ratios across the region and further questions about fi nancial stability drove down performance across the region. Greece ended the fi scal year down 46.8%. As a result of the instability within the European markets, the developed markets rally came to a halt over the quarter ending June 30, 2010.
developed market international stock fund

80 COMBINED INVESTMENT FUNDS 2010 COMPREHENSIVE FINANCIAL ANNUAL REPORT
CONNECTICUT STATE TREASURER’S COMBINED INVESTMENT FUNDS
Performance SummaryFor the fi scal year ended June 30, 2010, the Developed Markets International Stock Fund generated a
return of 11.03%, net of fees and operating expenses, which outperformed its benchmark return of 9.68% by 135 basis points.
DMISF’s market value grew from $4,415.9 million on June 30, 2009 to $4,434.9 million, an increase of $19 million. Net realized and unrealized gains of $412.9 million along with $110.8 million of net investment income were offset by cash withdrawals of $503.7 million by participating pension plans and trusts. The Fund outperformed its benchmark by 39 basis points over the three year period, generating a return of -11.93% versus -12.32% for the index. Over the fi ve year period, the Fund’s annualized return was 1.35% versus 1.76% for its benchmark, an underperformance of 41 basis points. (Figure 8-3).
The cumulative total returns produced by DMISF exceeded the benchmark over the one and three year periods and was below the index over the fi ve year period.
Risk Profi leGiven DMISF’s investment policies and objectives, the Fund is exposed to several risks. These include,
but are not limited to, political and economic risk, currency exchange risk, market risk, and individual com-pany risk. A currency hedging strategy is employed. As stated in the Investment Policy Statement, a 50% hedge ratio should provide an acceptable reduction in the portfolio’s currency risk profi le over time. The Fund has been slightly less volatile than its benchmark over the fi ve-year period ending June 30, 2010. DMISF’s high R2 score of 0.99 demonstrates a relatively strong overall correlation with the performance of the index. The results of these two measurements indicate that the Fund is producing higher risk–adjusted returns compared to its benchmark.

STATE OF CONNECTICUT, OFFICE OF THE TREASURER, DENISE L. NAPPIER 81
CONNECTICUT STATE TREASURER’S COMBINED INVESTMENT FUNDS
DEVELOPED MARKETS INTERNATIONAL STOCKOwnership Analysis at June 30, 2010 ($ in millions)
TERF - Teachers’ Retirement FundSERF - State Employees Retirement FundMERF - Connecticut Municipal Employees’ Retirement Fund
Figure 8-1 Figure 8-2
Figure 8-3
DEVELOPED MARKETS INTERNATIONAL STOCKPeriods ending June 30, 2010
Figure 8-4
1 YR 3 YRS 5YRS
Compounded, Annual Total Return (%) DMISF 11.03 -11.93 1.35S&P/Citigroup BMI EPAC 50% Hedged 9.68 -12.32 1.76 Cumulative Total Return (%) DMISF 11.03 -31.69 6.95S&P/Citigroup BMI EPAC 50% Hedged 9.68 -32.59 9.11
DEVELOPED MARKETS INTERNATIONAL STOCKAnnual Total Return
MERF$228.2
TERF$2,544.9
Other$34.7
SERF$1,627.2
-30%-25%-20%-15%-10%-5%0%5%
10%15%20%25%30%
S&P Citigroup BMIEPAC 50% Hedged
DMISF
100908070605
DEVELOPED MARKETS INTERNATIONAL STOCK (1)
Risk Profi le at June 30, 2010
Relative Volatility 0.98Standard Deviation 18.38R2 0.99Beta 0.97Alpha -0.41
(1) Based upon returns over the last fi ve years.

82 COMBINED INVESTMENT FUNDS 2010 COMPREHENSIVE FINANCIAL ANNUAL REPORT
CONNECTICUT STATE TREASURER’S COMBINED INVESTMENT FUNDS
DEVELOPED MARKETS INTERNATIONAL STOCKDiversifi cation by Benchmark Country with Return (%) at June 30, 2010 (1)
DMISF Benchmark % of % of Net Assets Net Assets 6/30/10 6/30/10 VarianceAustralia 5.2 7.7 -2.5Austria 0.6 0.4 0.2Belgium 0.8 1.0 -0.2Denmark 1.0 1.0 0.0Finland 0.9 1.1 -0.2France 8.0 8.7 -0.7Germany 6.7 7.0 -0.3Greece 0.3 0.3 0.0Hong Kong 3.1 3.1 0.0Ireland 0.4 0.4 0.0Italy 2.7 3.0 -0.3Japan 19.4 22.2 -2.8Korea 3.2 4.8 -1.6Luxembourg 0.2 0.5 -0.3Netherlands 3.5 2.6 0.9New Zealand 0.2 0.1 0.1Norway 0.6 0.9 -0.3Portugal 0.2 0.4 -0.2Singapore 1.9 1.8 0.1Spain 2.1 3.2 -1.1Sweden 2.1 2.9 -0.8Switzerland 8.2 7.5 0.7United Kingdom 18.1 19.4 -1.3Other 10.6 0.0 10.6Total 100.0 100.0
DEVELOPED MARKETS INTERNATIONAL STOCKInvestment Advisors at June 30, 2010
DEVELOPED MARKETS INTERNATIONAL STOCKTen Largest Holdings* at June 30, 2010
Net Asset % ofInvestment Advisor Value Fund
Index $643,899,823 14.52%State Street Global Advisors 643,899,823 14.52%
Core 1,427,372,133 32.19%Invesco Global Asset Mgmt. 175,522,939 3.96%AQR Capital Management 518,387,343 11.69%Acadian Asset Management 182,882,308 4.12%Artio Global 449,467,939 10.14%Progress 101,111,604 2.28%
Active-Growth 511,832,524 11.54%MFS Institutional Advisors, Inc. 511,832,524 11.54%
Active-Value 479,311,240 10.81%Grantham, Mayo, Van Otterloo 479,311,240 10.81%
Small Cap 644,021,970 14.52%Schroder Investment Mgmt. 221,955,384 5.00%Dimensional Fund Advisors 201,856,115 4.55%William Blair & Company 220,210,471 4.97%
Risk Controlled 640,159,768 14.43%BlackRock 314,448,922 7.09%Pyramis 325,710,846 7.34%
Other (1) 88,363,106 1.99%
TOTAL DMISF 4,434,960,564 100.00%
Security Name Country Market Value %
Nestle SA CHFO.10 REGD Switzerland $ 77,999,342 1.80%
Royal Dutch Shell PLC A Shares Eur .07 United Kingdom 53,794,807 1.24%
Roche Holdings AG Genusscheine NPV Switzerland 51,536,598 1.19%
HSBC Holdings ORD USD 0.50 UK REG United Kingdom 46,545,054 1.08%
Novartis AG CHF 0.50 REGD Switzerland 44,326,091 1.02%
Glaxosmithkline ORD GBP 0.25 United Kingdom 40,731,126 0.94%
Sanofi Aventis EUR 2.0 France 36,436,956 0.84%
Total SA Eur 2.5 Post Division France 35,270,998 0.82%
Astrazeneca ORD USD 0.25 United Kingdom 33,785,298 0.78%
Vodafone Group ORD USD 0.11428571 United Kingdom 33,235,013 0.77%
Top Ten 453,661,283 10.48%
(1) Other represents Liquidity Fund, other assets and terminated advisor balances, as well as, currency overlay balances for the DMISF (managed by Pareto).
* A complete list of portfolio holdings is available from the Offi ce of the Treasurer.
Figure 8-5 Figure 8-6
Figure 8-7

STATE OF CONNECTICUT, OFFICE OF THE TREASURER, DENISE L. NAPPIER 83
CONNECTICUT STATE TREASURER’S COMBINED INVESTMENT FUNDS2010Fund Facts at June 30, 2010
Investment Strategy/Goals: To achieve a long–term, real rate of return above the U.S, infl ation rate by partici-pating in the growth of emerging market economies through the ownership of equity securities.
Performance Objective: An annual total return of 200 basis points greater than the MSCI Emerging Markets IMI (with net dividends) Index benchmark after expenses.
Benchmark: MSCI Emerging Markets IMI (Investable Market Index) Index
Date of Inception: November 1, 2007 Total Net Assets: $2,073,164,572
Number of Advisors: 4 external Management Fees: $12,333,677
Operating Expenses: $1,689,274 Expense Ratio: 0.87%
emerging markets international stock fund
Description of the FundThe Emerging Market International Stock Fund (“EMISF”) is an externally managed fund, which invests
in foreign companies located in countries having developing or emerging economies. Emerging markets are expected to grow at a higher rate than developed markets and investments in these markets also provide further diversifi cation for CRPTF assets. EMISF is managed by four emerging markets external money managers. The newest manager was hired during the third quarter of fi scal 2010 as a result of an increased strategic asset allocation to emerging markets’ equity investments.
Portfolio CharacteristicsThe EMISF country allocations differ, in some cases signifi cantly, to the weightings of the index. Each
manager is permitted some discretion to deviate from the index in order to enhance performance. China had the largest variance from the index representing 5.7% of the EMISF portfolio compared to 19.4% of the index. Other countries that were meaningfully underweighted relative to the benchmark were India, South Africa and Taiwan. Thailand and Turkey had signifi cant over weights to the index. Twenty percent of the fund was allocated to stocks in emerging countries outside of the benchmark. (See Figure 9-6.).
The EMISF was well diversifi ed at year-end. The top ten holdings accounted for 19.24% of the Fund’s investments across six countries. (Figure 9-8.). The EMISF’s largest holdings included a variety of “blue chip” companies located in Latin America, Eastern Europe, and the Far East. The Fund’s largest investment, comprising 2.62% of investment securities, was Korea’s Samsung Electric.
Market ReviewDuring the fi scal year ended June 30, 2010, emerging markets continued to lead the global equity rally,
which began at the beginning of 2009. The rally was led by the fi nancials’ sector as investor confi dence recovered over 2009. As many investors saw emerging market countries as being signifi cant players in the global economic recovery, performance of the BRIC countries (Brazil, Russia, India and China) led the rally in 2009. However beginning in 2010, the emerging markets’ rally began to lose steam, as countries such as China and Brazil experienced negative returns. China’s underperformance is attributable to poor returns amongst banks and real estate companies, as investors grew concerned over the lending practices of banks, coupled with the bubble developing within the real estate market. Brazil’s poor performance was a result of a decline in returns within telecommunications and consumer discretionary companies, as well as a sharp decline in Petrobas, the largest company in Latin America. The emerging markets’ rally came to a halt over the quarter ending June 2010, as the fi nancial instability in several European countries, fueled by the sovereign debt crisis, decreased investor confi dence throughout the region.

84 COMBINED INVESTMENT FUNDS 2010 COMPREHENSIVE FINANCIAL ANNUAL REPORT
CONNECTICUT STATE TREASURER’S COMBINED INVESTMENT FUNDS
Performance SummaryFor the fi scal year ended June 30, 2010, the Emerging Markets International Stock Fund (EMISF) gen-
erated a return of 25.23%, net of fees and operating expenses, outperforming its benchmark index return of 24.57% by 66 basis points. Under weighting China, India and South Africa, and over weighting Turkey, relative to the index, contributed positively to performance. Over weighting Hungary and under weighting Taiwan detracted from performance.
The EMISF’s value as of June 30, 2010 was $2,073.1 million, up from $1,147.3 million one year earlier. Of this $925.8 million increase, $548.1 million emanated from net cash infl ows from participating pension and trust funds, $343.1 million from net realized and unrealized gains, and $34.9 million from net invest-ment income.
The Fund returned -4.65% and 10.88% for the three and fi ve year periods, underperforming by 272 basis points and 224 basis points respectively. Over the ten year period, the fund was within 9 basis points of the benchmark return of 10.21%, returning 10.12%. The cumulative returns for the Fund for the three, fi ve and ten year periods were -13.30%, 67.56% and 162.26%, respectively, as illustrated in Figure 9-4.
Risk Profi leGiven EMISF’s investment policies and objectives, the Fund is exposed to several forms of risk. These
include, but are not limited to, political and economic risk, currency exchange risk, market risk, and indi-vidual company risk. Based on returns over the last fi ve years, the Fund’s risk profi le is similar to that of the benchmark. Its high R2 of 0.99 demonstrates a strong overall correlation with the performance of the index. In the aggregate, EMISF’s annualized excess return over the fi ve-year period, or return in excess of that earned by the benchmark, was -2.24%. (See Figure 9-2.) Over the past fi ve years, the fund has experienced less volatility than the benchmark as evidenced by its .97% relative volatility.
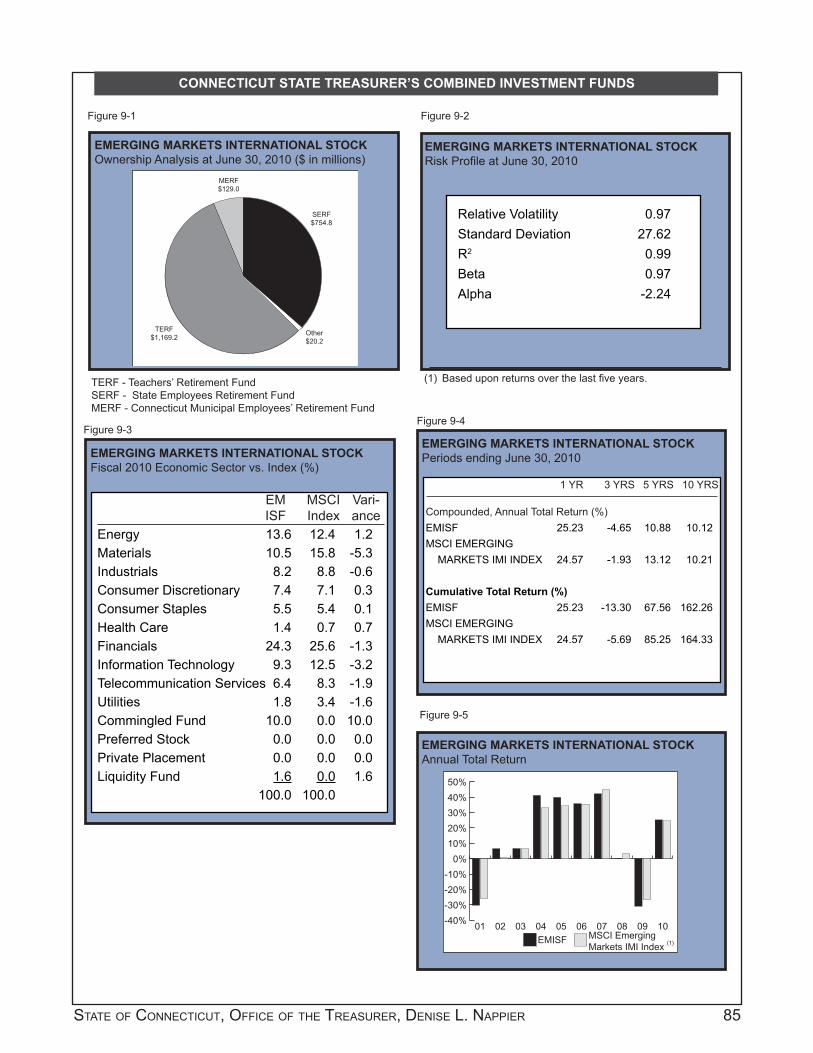
STATE OF CONNECTICUT, OFFICE OF THE TREASURER, DENISE L. NAPPIER 85
CONNECTICUT STATE TREASURER’S COMBINED INVESTMENT FUNDS
EMERGING MARKETS INTERNATIONAL STOCKOwnership Analysis at June 30, 2010 ($ in millions)
TERF - Teachers’ Retirement FundSERF - State Employees Retirement FundMERF - Connecticut Municipal Employees’ Retirement Fund
Figure 9-1
EMERGING MARKETS INTERNATIONAL STOCKRisk Profi le at June 30, 2010
Figure 9-2
EMERGING MARKETS INTERNATIONAL STOCKFiscal 2010 Economic Sector vs. Index (%)
Figure 9-3EMERGING MARKETS INTERNATIONAL STOCKPeriods ending June 30, 2010
Figure 9-4
Relative Volatility 0.97Standard Deviation 27.62R2 0.99Beta 0.97Alpha -2.24
(1) Based upon returns over the last fi ve years.
EM MSCI Vari- ISF Index anceEnergy 13.6 12.4 1.2Materials 10.5 15.8 -5.3Industrials 8.2 8.8 -0.6Consumer Discretionary 7.4 7.1 0.3Consumer Staples 5.5 5.4 0.1Health Care 1.4 0.7 0.7Financials 24.3 25.6 -1.3Information Technology 9.3 12.5 -3.2Telecommunication Services 6.4 8.3 -1.9Utilities 1.8 3.4 -1.6Commingled Fund 10.0 0.0 10.0Preferred Stock 0.0 0.0 0.0Private Placement 0.0 0.0 0.0Liquidity Fund 1.6 0.0 1.6 100.0 100.0
1 YR 3 YRS 5 YRS 10 YRS
Compounded, Annual Total Return (%) EMISF 25.23 -4.65 10.88 10.12MSCI EMERGING MARKETS IMI INDEX 24.57 -1.93 13.12 10.21
Cumulative Total Return (%) EMISF 25.23 -13.30 67.56 162.26MSCI EMERGING MARKETS IMI INDEX 24.57 -5.69 85.25 164.33
Figure 9-5
EMERGING MARKETS INTERNATIONAL STOCKAnnual Total Return
MERF$129.0
TERF$1,169.2
Other$20.2
SERF$754.8
-40%
-30%
-20%
-10%
0%
10%
20%
30%
40%
50%
MSCI Emerging Markets IMI Index (1)EMISF
10090807060504030201

86 COMBINED INVESTMENT FUNDS 2010 COMPREHENSIVE FINANCIAL ANNUAL REPORT
CONNECTICUT STATE TREASURER’S COMBINED INVESTMENT FUNDS
EMERGING MARKETS INTERNATIONAL STOCKDiversifi cation by Benchmark Country with Return (%) at June 30, 2010 (1)
Figure 9-7
EMERGING MARKETS INTERNATIONAL STOCKInvestment Advisors at June 30, 2010
Figure 9-8
EMERGING MARKETS INTERNATIONAL STOCKTen Largest Holdings* at June 30, 2010
Net Asset % ofInvestment Advisor Value Fund Grantham, Mayo, Van Otterloo 579,031,270 27.93%Emerging Markets Management 562,542,529 27.13%Aberdeen Asset Management 511,208,154 24.66%Schroders Investment Mgt 415,973,739 20.07%Other (1) 4,408,880 0.21%TOTAL EMISF 2,073,164,572 100.00%
Security Name Country Market Value %Samsung Electronic KRW 5000 Republic of Korea 54,210,055 2.62%Vale SA Depository Receipts Brazil 53,183,480 2.58%Petroleo Brasileiro SA Sponsored ADR Brazil 51,738,522 2.51%Gazprom ADR OAO Russian Federation 47,943,655 2.32%China Mobile Ltd. HKD 0.10 Hong Kong 47,795,789 2.31%CNOOC Ltd HKD 0.02 Hong Kong 38,764,655 1.88%Lukoil OAO ADR Rub 0.025 Russian Federation 30,949,045 1.50%America Movil ADR Series L Mexico 24,795,570 1.20%Grupo Financiero Banorte NPV Mexico 24,162,107 1.17%Taiwan Semiconductor SP ADR Taiwan 23,838,175 1.15%
Top Ten 397,381,053 19.24%
(1) Includes Liquidity Fund and cash equivalents at each country level.
EMISF EMISF Benchmark % of % of Net Assets Total Net Assets Total 6/30/10 Return 6/30/10 ReturnArgentina 0.1 15.3 0.1 39.9Brazil 14.7 26.8 15.3 21.8Chile 0.6 35.4 1.5 25.2China 5.7 20.3 19.4 10.9Columbia 0.1 52.8 0.8 53.6Czech Republic 0.5 1.9 0.4 -1.5Egypt 0.8 9.2 0.5 11.4Hungary 1.4 -1.6 0.4 15.5India 2.9 48.2 8.3 32.0Indonesia 3.1 69.2 2.4 66.0Israel 0.6 12.7 0.0 0.0Jordan 0.0 0.0 0.0 0.0Kazakhstan 0.0 0.0 0.0 0.0Korea 12.9 25.3 13.5 31.9Malaysia 2.4 42.0 2.9 33.9Mexico 4.6 31.9 4.4 31.7Morocco 0.0 -20.7 0.2 -11.5Pakistan 0.0 -4.8 0.1 34.3Peru 0.2 27.1 0.6 52.2Philippines 1.0 50.1 0.5 35.5Poland 1.0 11.3 1.3 23.1Russia 7.9 18.5 6.3 26.5South Africa 3.6 23.9 7.2 18.4Taiwan 7.2 11.9 10.8 15.4Thailand 4.2 39.6 1.5 34.6Turkey 4.4 54.8 1.6 43.7Venezuela 0.0 0.0 0.0 0.0Other Countries 20.1 0.0 0.0 0.0Total 100.0 100.0
(1) Other represents Liquidity Fund, other assets and terminated advisor balances, as well as, currency overlay balances for the DMISF.
* A complete list of portfolio holdings is available from the Offi ce of the Treasurer.
Figure 9-6

STATE OF CONNECTICUT, OFFICE OF THE TREASURER, DENISE L. NAPPIER 87
2010Fund Facts at June 30, 2010
Investment Strategy/Goals: To provide diversifi cation to the overall CRPTF investment program; preserve in-vestment capital and generate attractive risk-adjusted rates of return. The REF also provides current income and serves as a hedge against infl ation.
Performance Objective: An annual total return which is equal to or greater than CRPTF’s actuarially deter-mined assumed rate of return and competitive with that of other asset classes in which CRPTF invests, on a risk adjusted basis.
Benchmark: National Council of Real Estate Investment Fiduciaries Index (NCREIF) with a one quarter lag.
Date of Inception: July 1, 1982 Total Net Assets: $783,828,981
Number of Partnerships: 35 external Management Fees (1): $3,100,126
Operating Expenses: $861,849 Expense Ratio: 0.51%
Capitalized and Netted Fees: $14,317,722
(1) See note 1 to the Financial Statements for a discussion of similar fees incurred at the investment level.
Description of the FundThe Real Estate Fund (REF) is an externally managed fund that invests in real estate, real estate related
investments and mortgages. These investments are restricted by policy to the purchase of shares in group annuities, limited partnerships, group trusts, corporations, and other indirect ownership structures managed by professional commercial real estate investment fi rms.
REF is benchmarked against the NCREIF index. Its strategic objectives are: (1) to provide diversifi ca-tion to the overall CRPTF investment program; (2) to preserve investment capital and generate attractive risk-adjusted rates of return; (3) to provide current income; and (4) to provide a hedge against infl ation. Its returns are expected to be equal to or greater than CRPTF’s actuarially determined assumed rate of return (currently 8.5%) and competitive with that of other asset classes in which CRPTF invests, on a risk adjusted basis.
Portfolio CharacteristicsAt June 30, 2010, the portfolio consisted of 35 externally managed portfolios/investments with 0.3%
invested in real estate trusts, 89.9% invested in limited partnerships or limited liability companies and 9.8% invested in cash. The Fund’s ten largest holdings aggregated to 47.25% of the fund. (See fi gure 10-12.)
As currently structured, 9.7% of the REF is invested in cash, 13.4% apartment, 11.4% hotel, 9.1% re-tail, 21.9% offi ce 8.4% industrial and 26.1% in other real estate including mixed use, land, resorts, senior housing and condominiums. (See fi gure 10-7.)
The portfolio is reasonably well diversifi ed geographically with 22.6% in the West, 22.4% in the South, 28.4% in the East and 6.6% in the Midwest. The balance of 4.2% is invested internationally with 15.8% invested in cash and other assets. (See fi gure 10-6.)
Performance SummaryFor the fi scal year ending June 30, 2010, the REF generated a total return of -20.18%, net of fees, which
under performed the National Council of Real Estate Investment Fiduciaries Index (NCREIF) of -9.60% by 1,058 basis points. Most of the underperformance was due to early recognition of valuation declines result-ing from the national credit crisis and the REF’s 59% leverage which compounds the valuation declines in a down market versus the unleveraged index.
real estate fund

88 COMBINED INVESTMENT FUNDS 2010 COMPREHENSIVE FINANCIAL ANNUAL REPORT
CONNECTICUT STATE TREASURER’S COMBINED INVESTMENT FUNDS
During the fi scal year, the value of REF increased from $769.6 million to $783.8 million, due primarily to $202.8 million of new purchases offset by ($174.4) net unrealized losses, $13.9 million of distributions and $0.3 million in salaries.
For the trailing three, fi ve and ten year periods, REF’s compounded annual returns were (15.48%), (5.92%), and 1.18%, respectively, net of all expenses (see fi gure 10-8). The REF returns underperformed the benchmark in the three, fi ve and ten year periods by 1,116 basis points, 1,011 basis points and 594 basis points, respectively. Most of the long-term underperformance is due to a legacy portfolio (1998 com-mitments) that has underperformed. The short-term underperformance is due to 59% portfolio leverage versus an unlevered index.
During fi scal year 2010, the CRPTF committed $200 million to three Public Private Investment Funds, which was part of a broad effort to repair balance sheets throughout the U.S. fi nancial system and ensure that credit is available to households and businesses. Three separate limited partnership investment were made into these fund: $50 million into AllianceBernstein Legacy Securities (Delaware) LP; $50 million into Marathon Legacy Securities Public-Private Investment Fund, LP, and $100 million into WLR IV PPIP Co-Invest, LP.
Market ReviewThe outlook for the US real estate markets is highly contingent upon a growing economy and a low
unemployment rate. Despite recent encouraging trends for both the US economy and the job market, job creation is expected to remain sluggish and the economic outlook uncertain. The broader economic recov-ery will ultimately fi lter through to offi ce jobs, which will support an offi ce property recovery, but fi rst must overcome hesitancy by tenants to expand space needs. The recession has also taken its toll on industrial and retail properties. The downturn in demand for these properties is primarily due to lack of consumer demand, which has led to a reduction in inventories and higher vacancy rates for retail space. One bright spot has been the growth in the apartment sector, vacancies have declined and improvements have been seen across virtually all markets helped by the expiration of the home buyer’s tax credit. More recently, there are continued signs of decelerating declines in market value, and in some cases modest appreciation across the asset class. Transaction activity is increasing, and capitalization rates are beginning to compress within certain lower risk real estate sectors. Institutional investors have begun to refocus on making invest-ments within this battered real estate asset class.
Risk Profi leGiven REF’s investment policy and objectives, the Fund is exposed to several forms of risk. These
include risks attendant to alternative investments, such as management, operations, market, and liquidity risk, but also include geographic, fi nancing, and construction risks specifi c to real estate investments.
As shown below, based on returns over the last fi ve years, the Fund has exhibited substantially more volatility than its benchmark. The Fund’s statistics are consistent with its extraordinarily low R2 of 0.00, signifying almost no correlation between Fund returns and those of the benchmark. Its beta of -0.03 indi-cates little sensitivity to overall fl uctuations in the benchmark. In the aggregate, the Fund’s monthly alpha, or return relative to that achieved by the benchmark, was negative 10.11 over the fi ve-year time period. Work continues on rebuilding the portfolio to more closely align the Fund with the benchmark.

STATE OF CONNECTICUT, OFFICE OF THE TREASURER, DENISE L. NAPPIER 89
CONNECTICUT STATE TREASURER’S COMBINED INVESTMENT FUNDS
REAL ESTATE FUNDOwnership Analysis at June 30, 2010 ($ in millions)
TERF - Teachers’ Retirement FundSERF - State Employees Retirement FundMERF - Connecticut Municipal Employees’ Retirement Fund
Figure 10-1
REAL ESTATE FUNDRisk Profi le at June 30, 2010
Figure 10-2
REAL ESTATE FUNDInvestments Analysis (1)
Figure 10-3
REAL ESTATE FUNDDistribution by Investment Type at June 30, 2010Based on Investments in Securities, at Value
Figure 10-4
Relative Volatility 1.33
Standard Deviation 10.22
R2 0.00
Beta -0.03
Alpha -10.11
(1) Based upon returns over the last fi ve years.
No. of REF REF REFAt Investments Book Value Market Value
6/30/2010 35 1,097,439,251 715,310,010 6/30/2009 34 996,474,812 745,643,849 6/30/2008 31 920,921,272 968,885,960 6/30/2007 23 485,341,324 531,570,750 6/30/2006 12 259,551,191 330,169,779 6/30/2005 11 304,926,401 394,855,227 6/30/2004 10 324,142,113 344,673,596 6/30/2003 10 393,641,512 420,132,363 6/30/2002 10 413,693,249 467,819,628 6/30/2001 10 403,106,638 471,662,581
(1) Number of investments in annuities, partnerships, corpo-rations, and trusts, excluding the Liquidity Fund.
(1) Liquidity Fund and other monetary assets.
MERF$51.3
TERF$441.5
Other$8.5
SERF$282.5
Liquidity Fund9.7%
Opportunistic34.7%
Value-Added21.5%
Core34.1%

90 COMBINED INVESTMENT FUNDS 2010 COMPREHENSIVE FINANCIAL ANNUAL REPORT
CONNECTICUT STATE TREASURER’S COMBINED INVESTMENT FUNDS
REAL ESTATE FUNDDistribution by Investment Type at June 30, 2010Based on Investments in Securities, at Value
Figure 10-5
REAL ESTATE FUNDDistribution by Geographic Location at June 30, 2010Based on Investments in Securities, at Value
Figure 10-6
REAL ESTATE FUNDDiversifi cation by Property Type at June 30, 2010Based on Investments in Securities, at Value
Figure 10-7
REAL ESTATE FUNDPeriods ending June 30, 2010
Figure 10-8
REF NCREIF Variance
East 28.4% 34.5% -6.1%
Midwest 6.6% 11.0% -4.4%
South 22.4% 21.7% 0.7%
West 22.6% 32.8% -10.2%
International 4.2% 0.0% 4.2%
Other 15.8% 0.0% 15.8%
100.0% 100.0%
REF NCREIF Variance
Apartment 13.4% 24.5% -11.1%
Industrial 8.4% 14.8% -6.4%
Offi ce 21.9% 35.0% -13.1%
Retail 9.1% 23.8% -14.7%
Hotel 11.4% 1.9% 9.5%
Other(1) 35.8% 0.0% 35.8%
100.0% 100.0%
1 YR 3 YRS 5 YRS 10 YRS
Compounded, Annual Total Return (%) REF -20.18 -15.48 -5.92 1.18NCREIF Property -9.60 -4.32 4.19 7.12
Cumulative Total Return (%) REF -20.18 -39.62 -26.30 12.40NCREIF Property -9.60 -12.40 22.76 99.00
REAL ESTATE FUNDAnnual Total Return
Figure 10-9
REAL ESTATE FUNDComponents of Total Return ($ in millions)
Figure 10-10
(1) Includes senior living, real estate mixed use, land, Liquidity Fund and other assets.
0%
20%
40%
60%
80%
100% LiquidityFund
Trusts
LtdPartnerships
-30%-25%-20%-15%-10%
-5%0%5%
10%15%20%25%30%
NCREIFREF
10090807060504030201 $-350
$-300
$-250
$-200
$-150
$-100
$-50
$0
$50
$100
Capital AppreciationIncome10090807060504030201
$2.6
$89.3
$23.7
$70.7
$3.7$14.5
$67.0
$-174.8
$55.9
$-298.8
(1) Includes Liquidity Fund and other assets.

STATE OF CONNECTICUT, OFFICE OF THE TREASURER, DENISE L. NAPPIER 91
CONNECTICUT STATE TREASURER’S COMBINED INVESTMENT FUNDS
REAL ESTATE FUNDFunds at June 30, 2010
Figure 10-11
REAL ESTATE FUNDTen Largest Holdings* at June 30, 2010
Figure 10-12
Net Asset % ofFund Value Fund 1800 E. St. Andrew Place $18,156,905 2.32%1155 Perimeter Center West 26,639,547 3.40%AEW Partners III 7,883,709 1.01%AEW 221 Trust 2,708,893 0.35%AEW Core 481,132 0.06%Alliance Bernstein Legacy 42,887,005 5.47%Apollo Real Estate 15,223,252 1.94%Blackstone Real Estate VI LP 30,978,400 3.95%Blackstone Real Estate Partner Europe III LP 2,405,287 0.31%Canyon Johnson Urban Fund II 29,275,945 3.73%Canyon Johnson Urban Fund III 1,142,460 0.15%Capri Select Income II LLC 6,985,650 0.89%Colony Realty Partners II LP 18,531,176 2.36%Cornerstone Patriot 42,865,500 5.47%Covenant Apartment Fund V LP 24,673,550 3.15%Covenant Apartment Fund VI 10,103,790 1.29%The Glen at Lafayette Hill 12,622,352 1.61%IL & FS India Realty Fund II 25,725,591 3.28%Macfarlane Urban Real Estate Fund II LP 14,320,948 1.83%Marathon Legacy Securities PPI 33,072,845 4.22%Mullica Hill Plaza 7,446,307 0.95%North Scottsdale Corporate Center 43,404,835 5.54%Prime Property Fund 60,641,800 7.74%Rio Hill Shopping Center 38,727,058 4.94%RLJ RE Fund III LP 8,659,408 1.10%RLJ Urban Lodging Fund II 28,751,650 3.67%Rocky Creek Apartments 11,896,889 1.52%Rockwood Capital Fund V 8,109,795 1.03%Rockwood Capital VI Limited Partnership 9,708,590 1.24%Rockwood Capital VII Limited Partnership 6,509,793 0.83%Starwood Opportunity Fund VII 31,755,800 4.05%Starwood Opportunity Fund VIII 10,955,630 1.40%Urban Strategy America Fund LP 17,116,204 2.18%Walton Street Real Estate 15,366,560 1.96%WLR IV PPIP Co Invest LP 49,575,756 6.32%Other (1) 68,518,969 8.74%TOTAL REF $783,828,981 100.00%
Market Property Name Type Value %
Prime Property Fund Core $60,641,800 7.65%WLR IV PPIP Co Invest LP Opportunistic 49,575,756 6.26%Alliance Bernstein Legacy Value-Added 42,887,005 5.41%Cornerstone Patriot Core 42,865,500 5.41%Marathon Legacy Securities PPI Value-Added 33,072,845 4.17%Starwood Opportunity Fund VII Opportunistic 31,755,800 4.01%Blackstone Real Estate VI LP Opportunistic 30,978,400 3.91%Canyon Johnson Urban Fund II Opportunistic 29,275,945 3.69%RLJ Urban Lodging Fund II Opportunistic 28,751,650 3.63%Covenant Apartment Fund V LP Value-Added 24,673,550 3.11%Top Ten $374,478,251 47.25%
(1) Other represents moneys earmarked for distribution to participants, reinvestment, and expenses as well as terminated advisor balances.
* A complete list of portfolio holdings is available from the Offi ce of the Treasurer.
REAL ESTATE FUNDNew Investments Made in Fiscal Year 2010(1) (in Excess of $3 Million)
Figure 10-13
(1) These represent new Real Estate Partnerships that were invested in by the Fund during fi scal year 2010.
Partnership Name Commitment Amount Investment TypeAllianceBernstein Legacy Securities $50 million Public-Private Investment FundMarathon Legacy Securities Public-Private Investment Fund, LP $50 million Public-Private Investment FundWLR IV PPIP Co-Invest, LP $100 million Public-Private Investment FundTotal $200 million

92 COMBINED INVESTMENT FUNDS 2010 COMPREHENSIVE FINANCIAL ANNUAL REPORT
2010Fund Facts at June 30, 2010
Investment Strategy/Goals: To achieve yields in excess of those available on domestic fi xed income securities by investing in mortgages on income producing property or in commercial mortgage backed securities (CMBS).
Performance Objective: An annual total return which is one percentage point greater than that of the BC Ag-gregate Bond Index after expenses.
Benchmark: Barclays Aggregate Bond Index (BCI) Date of Inception: November 2, 1987
Total Net Assets: $3,826,443 Number of Advisors: 1 external
Management Fees: $37,125 Operating Expenses: $17,286
Expense Ratio: 1.21%
Description of the FundThe Commercial Mortgage Fund (CMF) is an externally managed fund that holds mortgages on income-
producing commercial property. Established in 1982, it serves as a fi xed income investment tool for the pension plans with the goal of realizing yields in excess of those available from traditional domestic fi xed income securities, while accepting slightly greater credit risk.
CMF’s investment assets consist of one externally managed commercial real estate mortgage loan and interests in Yankee Mac pooled residential mortgage-backed securities created pursuant to a previous Con-necticut State Treasury program.
The CMF’s performance objective is an annual total return, net of management fees and operating expenses, which exceeds that of the BCI by 100 basis points.
Portfolio CharacteristicsThe sole remaining commercial mortgage loan is secured by three mobile home parks in Phoenix, AZ.
The loan has a 9.55% interest rate and a maturity of September 2012. The loan amortized by approximately $1.27 million during the fi scal year. Debt service coverage is abundant at 2.99 times.
The portfolio is healthy from a credit risk standpoint. CMF had no delinquent or non-performing loans at fi scal year end. None of the Fund’s investments are scheduled to mature in the next 12 months.
Performance SummaryFor the fi scal year ended June 30, 2010, the CMF generated a return of 6.75%, net of management fees
and operating expenses, under performing the BCI of 9.50% by 2,750 basis points. The CMF’s unfavorable performance is attributable to an unrealized valuation adjustment.
During the fi scal year, CMF assets declined from $5.137 million to $3.826 million. This reduction was due to distributions of $0.391 million, redemptions of $1.267 million, net gains from operations of $0.364 million and $0.02 million in salaries.
For the trailing three, fi ve, and ten-year periods, CMF’s total compounded annual portfolio return was 5.0%, 6.54% and 7.88%, respectively, net of all expenses. The Fund’s results over the three year period under-preformed the benchmark by 252 basis points. For the fi ve and 10 year periods the fund’s results exceeded the benchmark by 100 basis points and 141 basis points, respectively.
At June 30, 2010, the Fund consisted of one commercial mortgage loan in the amount of $3,464,167 and fi ve residential mortgage pools with a combined value of $193,054 and cash of $160,894 at fair value.
commercial mortgage fund

STATE OF CONNECTICUT, OFFICE OF THE TREASURER, DENISE L. NAPPIER 93
CONNECTICUT STATE TREASURER’S COMBINED INVESTMENT FUNDS
The CMF continues to be inactive regarding new loans and is being managed to maximize the total return of its remaining holdings.
Risk Profi leGiven CMF’s investment policies and objectives, the Fund is exposed to several forms of risk. These
include risks specifi c to fi xed income investing, such as purchasing power risk, market risk, and default risk. Moreover, falling interest rates subject commercial mortgages to the risk of prepayment, thereby shortening investors’ assumed time horizon and exposing them to reinvestment risk. However, yield maintenance-based prepayment penalties, which are included in the majority of the Fund’s commercial mortgage investments, help minimize this risk.
Based on returns over the last fi ve years, the Fund’s risk profi le is similar to that of the BC Aggregate Bond Index. With a relative volatility of 2.13, its returns are more volatile than the index. The Fund’s beta of .35 signifi es a limited amount of sensitivity to movements in the Index as a whole. CMF’s fi ve-year monthly alpha, or return in excess of that predicted by returns in the overall market, at June 30, 2010 was 1.00.

94 COMBINED INVESTMENT FUNDS 2010 COMPREHENSIVE FINANCIAL ANNUAL REPORT
CONNECTICUT STATE TREASURER’S COMBINED INVESTMENT FUNDS
COMMERCIAL MORTGAGE FUNDOwnership Analysis at June 30, 2010 ($ in millions)
TERF - Teachers’ Retirement FundSERF - State Employees Retirement FundMERF - Connecticut Municipal Employees’ Retirement Fund
Figure 11-1
COMMERCIAL MORTGAGE FUND (1)
Risk Profi le at June 30, 2010
Figure 11-2
COMMERCIAL MORTGAGE FUNDQuarterly Current (1) Yield Analysis
Figure 11-3
COMMERCIAL MORTGAGE FUNDDistribution by Property Type at June 30, 2010Based on Investments in Securities, at Value
Figure 11-4
Relative Volatility 2.13
Standard Deviation 7.89
R2 0.03
Beta 0.35
Alpha 1.00
(1) Based upon returns over the last fi ve years.
BC CMF Aggregate
6/30/2010 7.70% 4.18%
3/31/2010 7.95% 4.38%
12/31/2009 7.99% 4.51%
9/30/2009 7.86% 4.63%
6/30/2009 8.14% 4.80%
COMMERCIAL MORTGAGE FUNDDistribution by Location at June 30, 2010Based on Investments in Securities, at Value
Figure 11-5
COMMERCIAL MORTGAGE FUNDMaturity AnalysisDollar Value ($ in millions)/Number of Loans
Figure 11-6
(1) Current Yield represents annual coupon interest divided by the market value of securities.
MERF$0.2
TERF$2.1
SERF$1.5
MBS5.1%
LiquidityFund4.2%
Residential90.7%
Mountain90.7%
Northeast5.1%
Liquidity Fund4.2%
$0.0
$0.5
$1.0
$1.5
$2.0
$2.5
$3.0
$3.5
12
$3.5(1)
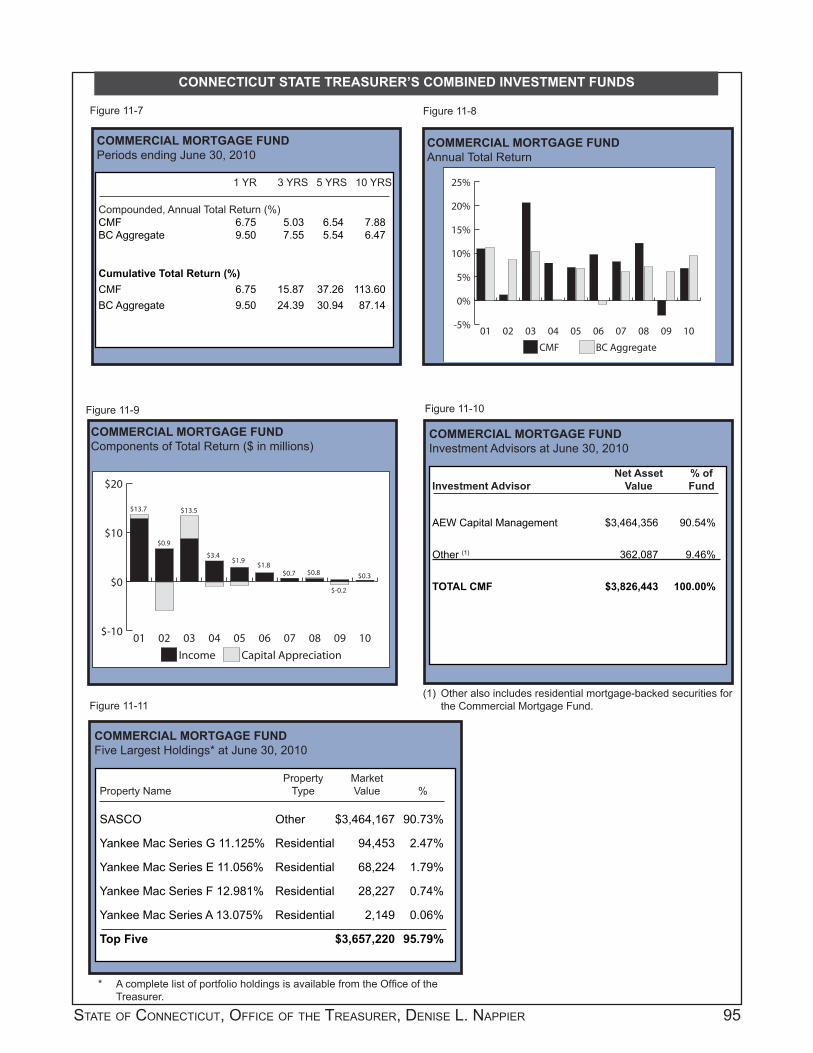
STATE OF CONNECTICUT, OFFICE OF THE TREASURER, DENISE L. NAPPIER 95
CONNECTICUT STATE TREASURER’S COMBINED INVESTMENT FUNDS
COMMERCIAL MORTGAGE FUNDPeriods ending June 30, 2010
Figure 11-7
COMMERCIAL MORTGAGE FUNDAnnual Total Return
Figure 11-8
COMMERCIAL MORTGAGE FUNDComponents of Total Return ($ in millions)
Figure 11-9 Figure 11-10
Figure 11-11
1 YR 3 YRS 5 YRS 10 YRS
Compounded, Annual Total Return (%) CMF 6.75 5.03 6.54 7.88BC Aggregate 9.50 7.55 5.54 6.47
Cumulative Total Return (%) CMF 6.75 15.87 37.26 113.60BC Aggregate 9.50 24.39 30.94 87.14
COMMERCIAL MORTGAGE FUNDInvestment Advisors at June 30, 2010
COMMERCIAL MORTGAGE FUNDFive Largest Holdings* at June 30, 2010
(1) Other also includes residential mortgage-backed securities for the Commercial Mortgage Fund.
Net Asset % ofInvestment Advisor Value Fund
AEW Capital Management $3,464,356 90.54%
Other (1) 362,087 9.46%
TOTAL CMF $3,826,443 100.00%
Property Market Property Name Type Value %
SASCO Other $3,464,167 90.73%
Yankee Mac Series G 11.125% Residential 94,453 2.47%
Yankee Mac Series E 11.056% Residential 68,224 1.79%
Yankee Mac Series F 12.981% Residential 28,227 0.74%
Yankee Mac Series A 13.075% Residential 2,149 0.06%
Top Five $3,657,220 95.79%
* A complete list of portfolio holdings is available from the Offi ce of the Treasurer.
-5%
0%
5%
10%
15%
20%
25%
BC AggregateCMF
10090807060504030201
$-10
$0
$10
$20
Capital AppreciationIncome
10090807060504030201
$3.4$1.9
$13.5
$0.9
$13.7
$0.3
$1.8$0.7 $0.8
$-0.2

96 COMBINED INVESTMENT FUNDS 2010 COMPREHENSIVE FINANCIAL ANNUAL REPORT
2010Fund Facts at June 30, 2010
Investment Strategy/Goals: A long-term asset allocation with the goal of earning returns in excess of the public equity markets through investments in private equity companies.
Performance Objective: To outperform the Standard & Poor 500 Index (“S&P 500”) by 500 basis points at the end of ten years.
Benchmark: S&P 500
Date of Inception: July 1, 1987 Total Net Assets: $2,013,846,298
Number of Partnerships: 66 external Expensed Management Fees (1): $8,323,349
Operating Expenses: $1,654,756 Expense Ratio: 0.55%
Capitalized and Netted Fees: $30,432,412
(1) See Note 1 to the Financial Statements for a discussion of similar fees incurred at the investment level.
Description of the FundThe Private Investment Fund (PIF) is an externally managed fund whose strategic focus is divided into
two sub-asset classes: venture capital and corporate fi nance. Further corporate fi nance encompasses several underlying strategies, including buyout, mezzanine, and special situations. The Private Investment Fund serves as a long-term investment tool for the Pension and Trust Funds, with the goal of earning returns in excess of the public equity markets through investments in private and public companies.
This Fund structure allows for experienced industry professionals to manage PIF’s assets while allowing the Fund to realize the benefi ts of a diversifi ed private market portfolio in the areas of investment type, stra-tegic focus, industry type and geographic region. The performance objective of the Fund is to outperform, net of management fees and Division operating expenses over a rolling ten-year period, the Standard & Poor’s 500 Index by 500 basis points.
Portfolio CharacteristicsThe Private Investment Fund invests in private equity funds either directly as a Limited Partner to a
specifi c fund or indirectly as a limited partner to a fund of funds vehicle. Fund-of-funds investments are investment funds which may have multiple areas of strategic focus. These funds invest in multiple private equity partnerships that invest in underlying companies. Private equity investments include two general areas of strategic focus:
Corporate FinanceBuyout focused investments can be defi ned as controlling or majority investments in private equity or • equity-like securities of more established companies on the basis of the company’s asset values and/or cash fl ow.
Mezzanine Debt focused investments can be defi ned as investments in securities located between equity • and senior debt in the company’s capital structure. Mezzanine debt investments offer higher current income than senior debt securities and often offer equity participation features that may take the form of warrants or contingent equity interests.
Special Situations focused investments can be defi ned as investments in a variety of securities (Debt, • Preferred Equity, Common Equity) in portfolio companies at a variety of stages of development (Seed, Early Stage, Later Stage).
International Private Equity focused investments can be defi ned as investments in private equity or •
private investment fund

� � � � � � � � � � � � � � � � � � � � � � � � � � � � � � � � � � � � � � � � � � � � � � � � � �
� � � � � � � � � � � � � � � � ! � � � ! � ! " � � � # $ � � � % � � & � � � # � � � ' � � % �( ) * + , - . / + 0 ( 1 ( 2 * 3 + , + ( 1 + 4 2 5 6 7 8 4 + ( 1 / 5 2 8 , ( 9 5 * , 1 + 9 ( , : ( 2 5 4 , + 4 ( 4 , 8 / ; 4 + , ( 9 < , 8 , ( 1 = > 4 , ( 3 4 8 , + 5 4 8 / ? 3 + @ 8 , (A ) * + , - + 4 @ ( 1 , 6 ( 4 , 1 5 B , ( 4 5 B B ( 3 : + C : ( 3 3 ( , * 3 4 7 5 , ( 4 , + 8 / 8 1 8 3 ( 1 * / , 5 B , : ( 8 D 5 @ ( 8 @ ( 3 8 C ( 3 8 , ( 1 5 B C 3 5 E , :8 @ 8 + / 8 D / ( + 4 1 ( / ( 2 , + 4 , ( 3 4 8 , + 5 4 8 / ( 2 5 4 5 6 + ( 1 =F G H I J K G L M N O I M PQ ( 4 , * 3 ( R 8 7 + , 8 / B 5 2 * 1 ( 9 + 4 @ ( 1 , 6 ( 4 , 1 2 8 4 D ( 4 8 3 3 5 E / - 9 ( S 4 ( 9 8 1 + 4 @ ( 1 , 6 ( 4 , 1 + 4 , : ( 7 3 + @ 8 , ( ( ) * + , - 5 3T ( ) * + , - . / + 0 ( 1 ( 2 * 3 + , + ( 1 5 B 9 ( @ ( / 5 7 + 4 C 2 5 6 7 8 4 + ( 1 + 4 4 ( ( 9 5 B C 3 5 E , : 5 3 ( U 7 8 4 1 + 5 4 2 8 7 + , 8 / = V : ( 1 ( + 4 @ ( 1 , .6 ( 4 , 1 2 8 4 3 8 4 C ( B 3 5 6 ( 8 3 / - . 1 , 8 C ( S 4 8 4 2 + 4 C W E : ( 3 ( 8 2 5 6 7 8 4 - : 8 1 / + , , / ( 6 5 3 ( , : 8 4 8 6 8 3 0 ( , 8 D / ( + 9 ( 8 W, 5 ( U 7 8 4 1 + 5 4 S 4 8 4 2 + 4 C W E : ( 3 ( 8 2 5 6 7 8 4 - : 8 1 8 6 8 3 0 ( , 8 D / ( 7 3 5 9 * 2 , D * , 3 ( ) * + 3 ( 1 8 9 9 + , + 5 4 8 / 2 8 7 + , 8 / , 5D 3 + 4 C , : ( 7 3 5 9 * 2 , , 5 6 8 3 0 ( , =V : 3 5 * C : X * 4 ( Y Z W [ Z \ Z W , : ( ? > ] : 8 9 ^ Z B * 4 9 1 E + , : 8 C C 3 ( C 8 , ( 2 8 7 + , 8 / 2 5 6 6 + , 6 ( 4 , 1 + 4 , : ( 8 6 5 * 4 , 5 B_ ` = a D + / / + 5 4 5 B E : + 2 : 8 7 7 3 5 U + 6 8 , ( / - ^ ` 7 ( 3 2 ( 4 , W 5 3 _ b = Y D + / / + 5 4 : 8 1 D ( ( 4 c 9 3 8 E 4 9 5 E 4 d B 5 3 + 4 @ ( 1 , 6 ( 4 , 7 * 3 .7 5 1 ( 1 E : + / ( , : ( D 8 / 8 4 2 ( 5 B 8 7 7 3 5 U + 6 8 , ( / - _ \ = e D + / / + 5 4 5 3 [ ` 7 ( 3 2 ( 4 , + 1 2 5 6 6 + , , ( 9 D * , 4 5 , - ( , 9 3 8 E 4 = f < ( (] + C * 3 ( \ [ . e = gV : ( 7 3 + @ 8 , ( ( ) * + , - 6 8 3 0 ( , : 8 1 1 : 5 E 4 1 5 6 ( 1 + C 4 1 5 B 3 ( 2 5 @ ( 3 - + 4 [ Z \ Z = h ( 1 7 + , ( 2 5 4 , + 4 * ( 9 @ 5 / 8 , + / + , - + 4, : ( C / 5 D 8 / 2 8 7 + , 8 / 6 8 3 0 ( , 1 8 4 9 1 5 B , 4 ( 1 1 + 4 , : ( ; = < = ( 2 5 4 5 6 - W 7 3 + @ 8 , ( ( ) * + , - S 3 6 1 8 3 ( 9 ( 7 / 5 - + 4 C 2 8 7 + , 8 / 8 ,8 4 + 4 2 3 ( 8 1 + 4 C 3 8 , ( = > 4 8 9 9 + , + 5 4 W ( U + , 8 2 , + @ + , - + 1 + 4 2 3 ( 8 1 + 4 C 8 4 9 , : ( 5 7 ( 3 8 , + 4 C 8 4 9 S 4 8 4 2 + 8 / 7 ( 3 B 5 3 6 8 4 2 ( 5 B7 5 3 , B 5 / + 5 2 5 6 7 8 4 + ( 1 + 1 + 6 7 3 5 @ + 4 C =V : ( 1 / 5 E 9 5 E 4 + 4 7 3 + @ 8 , ( ( ) * + , - B * 4 9 3 8 + 1 + 4 C : 8 1 7 ( 3 1 + 1 , ( 9 , : 3 5 * C : [ Z \ Z = i / 5 D 8 / B * 4 9 3 8 + 1 + 4 C + 4 [ Z \ Z + 15 4 7 8 2 ( , 5 D ( \ [ j D ( / 5 E [ Z Z a 8 4 9 ^ Z j D ( / 5 E , : ( 7 ( 8 0 + 4 [ Z Z ^ W 8 2 2 5 3 9 + 4 C , 5 V : 5 6 1 5 4 k 4 ( = R 5 4 @ ( 3 1 ( / - W, : ( 8 6 5 * 4 , 5 B 2 8 7 + , 8 / + 4 @ ( 1 , ( 9 + 4 ; = < = 7 3 + @ 8 , ( ( ) * + , - , 3 8 4 1 8 2 , + 5 4 1 : 8 1 + 4 2 3 ( 8 1 ( 9 = l 7 7 3 5 U + 6 8 , ( / - _ m \ D + / / + 5 4E 8 1 + 4 @ ( 1 , ( 9 + 4 b W \ b \ D * - 5 * , 8 4 9 @ ( 4 , * 3 ( 9 ( 8 / 1 + 4 S 3 1 , : 8 / B 5 B [ Z \ Z W @ ( 3 1 * 1 _ [ m D + / / + 5 4 + 4 @ ( 1 , ( 9 + 4 Y W Y [ Y9 ( 8 / 1 + 4 , : ( S 3 1 , : 8 / B 5 B [ Z Z a W 8 2 2 5 3 9 + 4 C , 5 V : 5 6 1 5 4 k 4 ( =; = < = 2 3 ( 9 + , 6 8 3 0 ( , 1 3 ( D 5 * 4 9 ( 9 + 4 , : ( S 3 1 , : 8 / B 5 B [ Z \ Z = l @ ( 3 8 C ( 9 ( D , . , 5 . A n > V h l 3 8 , + 5 1 B 5 3 8 / / , 3 8 4 1 8 2 ., + 5 4 1 + o ( 1 3 5 1 ( B 3 5 6 8 / 5 E 5 B Y = ^ U + 4 [ Z Z a , 5 b = b U + 4 , : ( 1 ( 2 5 4 9 ) * 8 3 , ( 3 5 B [ Z \ Z p D * , 1 , + / / 1 + C 4 + S 2 8 4 , / - / 5 E ( 3, : 8 4 , : ( 7 ( 8 0 5 B e = Z U + 4 [ Z Z ^ W 8 2 2 5 3 9 + 4 C , 5 < , 8 4 9 8 3 9 q ? 5 5 3 r 1 s ( @ ( 3 8 C ( 9 R 5 6 6 ( 4 , 8 3 - =V : ( > ? k 8 4 9 t q l 6 8 3 0 ( , 1 : 8 @ ( 8 / 1 5 1 , 3 ( 4 C , : ( 4 ( 9 , : + 1 - ( 8 3 = V : 3 5 * C : , : ( S 3 1 , : 8 / B 5 B [ Z \ Z , : ( 3 ( E ( 3 ( Y [ [7 3 + @ 8 , ( ( ) * + , - D 8 2 0 ( 9 > ? k 8 4 9 t q l , 3 8 4 1 8 2 , + 5 4 1 @ ( 3 1 * 1 Y e m + 4 8 / / 5 B [ Z Z a W 8 2 2 5 3 9 + 4 C , 5 V : 5 6 1 5 4 k 4 ( =V : ( h 5 9 9 . ] 3 8 4 0 u 8 / / < , 3 ( ( , v ( B 5 3 6 8 4 9 , : ( R 5 4 1 * 6 ( 3 ? 3 5 , ( 2 , + 5 4 l 2 , : 8 @ ( + 6 7 8 2 , ( 9 3 ( C * / 8 , 5 3 - 5 @ ( 3 1 + C : ,5 B , : ( 7 3 + @ 8 , ( ( ) * + , - + 4 9 * 1 , 3 - = > 4 7 8 3 , + 2 * / 8 3 W 7 3 + @ 8 , ( ( ) * + , - S 3 6 1 E + , : 6 5 3 ( , : 8 4 _ \ ` Z 6 + / / + 5 4 5 B 8 1 1 ( , 1 * 4 9 ( 36 8 4 8 C ( 6 ( 4 , 8 3 ( 4 5 E 3 ( ) * + 3 ( 9 , 5 3 ( C + 1 , ( 3 E + , : , : ( < A R 8 4 9 8 9 : ( 3 ( , 5 2 ( 3 , 8 + 4 9 + 1 2 / 5 1 * 3 ( 3 ( ) * + 3 ( 6 ( 4 , 1 =] 5 3 , : ( S 1 2 8 / - ( 8 3 ( 4 9 ( 9 X * 4 ( Y Z W [ Z \ Z W ? > ] C ( 4 ( 3 8 , ( 9 8 2 5 6 7 5 * 4 9 ( 9 8 4 4 * 8 / 3 8 , ( 5 B 3 ( , * 3 4 5 B \ ^ = Y [ j =V : + 1 3 ( , * 3 4 E 8 1 6 ( 8 1 * 3 ( 9 * 1 + 4 C 8 V + 6 ( u ( + C : , ( 9 v ( , * 3 4 f c V u v d g 2 8 / 2 * / 8 , + 5 4 6 ( , : 5 9 5 / 5 C - =u : + / ( 1 : 5 3 , . , ( 3 6 3 ( , * 3 4 1 8 3 ( ( @ 8 / * 8 , ( 9 W / 5 4 C ( 3 , ( 3 6 f ( = C = \ Z - ( 8 3 1 g 3 ( , * 3 4 1 8 3 ( 6 5 3 ( 6 ( 8 4 + 4 C B * / + 4( @ 8 / * 8 , + 4 C 7 3 + @ 8 , ( ( ) * + , - 7 5 3 , B 5 / + 5 7 ( 3 B 5 3 6 8 4 2 ( = s 5 4 C . , ( 3 6 : 5 3 + o 5 4 1 D ( , , ( 3 3 ( w ( 2 , , : ( + / / + ) * + 9 4 8 , * 3 ( 5 B ? > ] r 1: 5 / 9 + 4 C 1 8 4 9 , : ( , + 6 ( + , , 8 0 ( 1 , : ( 1 ( + 4 @ ( 1 , 6 ( 4 , 1 , 5 6 8 , * 3 ( = ? > ] r 1 7 ( 3 B 5 3 6 8 4 2 ( 3 ( , * 3 4 + 1 D ( 4 2 : 6 8 3 0 ( 9 8 C 8 + 4 1 ,, : ( < q ? ` Z Z 7 / * 1 ` Z Z D 8 1 + 1 7 5 + 4 , 1 = k @ ( 3 , : ( / 8 1 , \ Z - ( 8 3 1 , : 3 5 * C : X * 4 ( Y Z W [ Z \ Z W ? > ] : 8 1 ( U 2 ( ( 9 ( 9+ , 1 D ( 4 2 : 6 8 3 0 5 B , : ( < q ? ` Z Z 7 / * 1 ` Z Z D - m D 8 1 + 1 7 5 + 4 , 1 = ] 3 5 6 8 V u v 7 ( 3 1 7 ( 2 , + @ ( W , : ( ? > ] : 8 1 * 4 9 ( 3 .7 ( 3 B 5 3 6 ( 9 , : ( < , 8 , ( < , 3 ( ( , ? 3 + @ 8 , ( A ) * + , - > 4 9 ( U , + 6 ( . E ( + C : , ( 9 D ( 4 2 : 6 8 3 0 5 B [ Z = m a j D - Y ` ^ D 8 1 + 1 7 5 + 4 , 1 =V : ( + 4 1 , + , * , + 5 4 8 / 1 , 8 4 9 8 3 9 B 5 3 6 ( 8 1 * 3 + 4 C 7 3 + @ 8 , ( ( ) * + , - 7 ( 3 B 5 3 6 8 4 2 ( + 1 , : ( > 4 , ( 3 4 8 / v 8 , ( 5 B v ( , * 3 4 f c > v v d g W3 8 , : ( 3 , : 8 4 , : ( V u v = > v v + 1 8 9 5 / / 8 3 . E ( + C : , ( 9 8 4 4 * 8 / + o ( 9 3 ( , * 3 4 , : 8 , 2 5 4 1 + 9 ( 3 1 D 5 , : 2 8 1 : w 5 E 1 8 4 9 , + 6 ( =< + 4 2 ( + , 1 + 4 2 ( 7 , + 5 4 + 4 \ a m ^ W ? > ] : 8 1 C ( 4 ( 3 8 , ( 9 8 ^ = a j > v v = l , 5 5 / 2 5 6 6 5 4 / - * 1 ( 9 D - + 4 1 , + , * , + 5 4 8 / + 4 @ ( 1 , 5 3 1, 5 D ( 4 2 : 6 8 3 0 > v v 7 ( 3 B 5 3 6 8 4 2 ( + 1 , : ( 7 * D / + 2 6 8 3 0 ( , ( ) * + @ 8 / ( 4 , f c ? t A d g = V : ( ? t A ( 1 1 ( 4 , + 8 / / - 2 5 4 @ ( 3 , 1 8
98 COMBINED INVESTMENT FUNDS 2010 COMPREHENSIVE FINANCIAL ANNUAL REPORT
CONNECTICUT STATE TREASURER’S COMBINED INVESTMENT FUNDS
public equity index TWR into an IRR. From inception through June 30, 2010, PIF has generated 590 basis points in excess of its S&P 500 PME benchmark.
During fi scal 2010, PIF added $175 million of new commitments to two private equity fund managers (See Figure 12-10).
During fi scal year 2010, PIF’s assets increased from $1,626 million to $2,014 million, an increase of $388 million.
Risk Profi leGiven PIF’s investment policy and objectives, the Fund is exposed to several forms of risk. These in-
clude, but are not limited to, risks attendant with alternative investments, such as management, operations, and product risk, as well as overall liquidity risk. Assuming these risks as part of a prudent, total portfolio strategy enables PIF to participate in the possibility of substantial long-term investment returns.
PIF’s risk profi le is complex given the valuation judgments and liquidity constraints placed on it due to its alternative investment strategy. Over the last fi ve years, PIF’s volatility relative to its benchmark has been 0.51 with a correlation of 0.03. Over the last fi ve years, the Fund has returned an annual alpha, or return relative to that predicted by its benchmark, of -1.73. (See Figure 12-2.)

STATE OF CONNECTICUT, OFFICE OF THE TREASURER, DENISE L. NAPPIER 99
CONNECTICUT STATE TREASURER’S COMBINED INVESTMENT FUNDS
PRIVATE INVESTMENT FUNDOwnership Analysis at June 30, 2010 ($ in millions)
TERF - Teachers’ Retirement FundSERF - State Employees Retirement FundMERF - Connecticut Municipal Employees’ Retirement Fund
Figure 12-1
PRIVATE INVESTMENT FUND (1)
Risk Profi le at June 30, 2010
Figure 12-2
PRIVATE INVESTMENT FUNDDistribution by Industry at June 30, 2010Based on Investments in Securities, at Value
Figure 12-3
PRIVATE INVESTMENT FUNDDistribution by Geographic Location at June 30, 2010Based on Investments in Securities, at Value
Figure 12-4
Relative Volatility 0.51
Standard Deviation 8.55
R2 0.03
Beta 0.09
Alpha -1.73
(1) Based upon quarterly returns over the last fi ve years.
(1) Includes Liquidity Fund and other assets at the partnership level. (1) Includes the Liquidity Fund and other assets at the partnership level..
Region %Northeast (Excludes Connecticut) 16.0%International 13.8%West Coast 16.2%Cash/Other Assets & Liabilities (1) 7.3%Southeast 15.0%Mid-Atlantic 9.0%MidWest 10.3%Southwest 8.2%Connecticut 2.4%Northwest 1.8%TOTAL 100.00%
PRIVATE INVESTMENT FUNDDistributed by Committed and Invested CapitalAs of June 30, 2010 ($ in millions)
PRIVATE INVESTMENT FUNDPeriods ending June 30, 2010
Figure 12-6
1 YR 3 YRS 5 YRS 10 YRS
Compounded, Annual Total Return (%) PIF 17.32 3.71 8.25 3.49S & P 500 14.43 -9.81 -0.79 -1.59State Street Private Equity Index (1 Qtr. Lag) 20.89 -1.02 9.98 5.14
Cumulative Total Return (%) PIF 17.32 11.54 48.64 40.88S & P 500 14.43 -26.65 -3.91 -14.78State Street Private Equity Index (1 Qtr. Lag) 20.89 -3.01 60.93 65.09
Figure 12-5
MERF$133.0
TERF$1,136.8
Other$20.5
SERF$723.5
Industrial14.5%
Financial Services12.0%
Other (1)
7.3%
Telecommunications2.7%
Media4.7%
Healthcare9.8%
Diversified16.4%
Energy1.6%
Technology15.3%
Consumer15.7%
$0
$1,000
$2,000
$3,000
$4,000
$5,000
Funded CapitalCommited Capital
Corporate FinanceVenture Capital

100 COMBINED INVESTMENT FUNDS 2010 COMPREHENSIVE FINANCIAL ANNUAL REPORT
CONNECTICUT STATE TREASURER’S COMBINED INVESTMENT FUNDS
Figure 12-9
PRIVATE INVESTMENT FUNDTen Largest Holdings* at June 30, 2010
Market Partnership Name Partnership Type Value %Constitution Liquidating Fund Fund of Funds 160,725,705 7.99%Fairview Constitution II LP Fund of Funds 123,187,147 6.12%Carlyle Asia Partners LP International 99,721,385 4.95%Parish Capital Buyout Fund II Fund of Funds 96,260,356 4.78%KKR 2006 Fund Buyout 88,197,715 4.38%Pegasus Partners IV Special Situations 88,133,949 4.38%KKR Millennium Fund Buyout 86,909,736 4.32%Welsh Carson Anderson & Stowe X LP Buyout 84,599,510 4.20%FS Equity Partners V Buyout 78,460,140 3.90%Charterhouse Equity Partners IV Buyout 71,505,266 3.55%Top Ten 977,700,909 48.57%
PRIVATE INVESTMENT FUNDAnnual Total Return
Figure 12-7
PRIVATE INVESTMENT FUNDComponents of Total Return ($ in millions)
Figure 12-8
PRIVATE INVESTMENT FUNDNew Investments Made in Fiscal Year 2010(1) (in Excess of $3 Million)
Figure 12-10
(1) These represent new Private Equity Partnerships that were invested in by the Fund during fi scal year 2010.
Partnership Name Commitment Amount Partnership Type Inv. Date
Landmark XIV $100 million Fund-of-Funds February 25, 2010Audax Mezzanine III 75 million Mezzanine May 10, 2010Total: $175 million
* A complete list of portfolio holdings is available from the Offi ce of the Treasurer.
$-30$-25$-20$-15$-10$-5$0$5
$10$15$20$25$30
Venture EconomicsS & P 500PIF
10090807060504030201$-600
$-300
$0
$300
$600
$900
Capital AppreciationIncome10090807060504030201
$322.1
$126.6 $154.8$256.2
$214.1
($311.6)
($251.8)
($287.6)
($180.0)
$298.9

STATE OF CONNECTICUT, OFFICE OF THE TREASURER, DENISE L. NAPPIER 101
CONNECTICUT STATE TREASURER’S COMBINED INVESTMENT FUNDS
PRIVATE INVESTMENT FUNDInvestment Advisors at June 30, 2010
Net Asset % ofInvestment Advisor Value Fund
Buyout $916,118,768 45.49%KKR Millennium Fund 86,909,736 4.32%Yucaipa American Alliance Fund II LP 52,968,853 2.63%Hicks, Muse Tate & Furst Equity Fund III 23,531,328 1.17%Thomas H. Lee Equity Fund VI 46,016,032 2.28%Welsh Carson Anderson & Stowe VIII 15,962,376 0.79%Wellspring Capital Partners III 18,019,745 0.89%SCP Private Equity Partners 3,471,924 0.17%Charterhouse Equity Partners IV 71,505,266 3.55%Forstmann Little Equity Fund VI 735,755 0.04%DLJ Merchant Banking Fund II 14,447,823 0.72%KKR 1996 Fund 5,973,159 0.30%FS Equity Partners V 78,460,140 3.90%FS Equity Partners VI 10,679,364 0.53%Blackstone Capital Partners III 8,258,510 0.41%Thayer Equity Investors IV 14,279,684 0.71%Kelso Investment Associates VI 5,181,616 0.26%Green Equity Investors III 2,310,785 0.11%Wellspring Capital Partners II 2,151,798 0.11%Candover 2008 Fund 6,289,922 0.31%Leeds Equity Partners V LP 4,855,229 0.24%Welsh Carson Anderson & Stowe XI 13,409,239 0.67%AIG Healthcare Partners LP 32,643,135 1.62%AIG Altaris Health Partners II 11,761,887 0.58%Welsh Carson Anderson & Stowe X LP 84,599,510 4.20%Court Square Capital Partners II 43,143,342 2.14%Ethos Private Equity Fund V 26,590,596 1.32%Boston Ventures VII 37,232,513 1.85%KKR 2006 Fund 88,197,715 4.38%Nogales Investors Fund II 10,213,598 0.51%ICV Partners II LP 18,061,711 0.90%Vista Equity Partners Fund III 50,354,935 2.50%RFE Investments Partners 4,893,452 0.24%RFE Investment Partners VII 23,008,090 1.14%
Venture Capital $23,340,281 1.16%Conning Capital Partners V 1,943,359 0.10%Crescendo World Fund 72,584 0.00%Grotech Partners V 6,155,241 0.31%Crescendo III 2,087,161 0.10%Syndicated Communications 13,081,936 0.65%
Figure 12-11
(1) Other represents moneys earmarked for distribution to participants, reinvestment, and expenses as well as terminated advisor balances.
Net Asset % ofInvestment Advisor Value Fund
Mezzanine $40,477,895 2.01%SW Pelham Fund 3,398,397 0.17%GarMark Partners 526,570 0.02%GarMark Partners II LP 30,345,402 1.51%SW Pelham Fund II 6,207,526 0.31%
International $170,876,573 8.49%Compass Partners European Equity Fund 16,426,114 0.82%Gilbert Global Equity Partners 35,300,379 1.75%Carlyle Europe Partners 8,250,076 0.41%AIG Global Emerging Markets Fund 11,178,619 0.56%Carlyle Asia Partners 99,721,385 4.95%
Fund of Funds $550,355,818 27.33%The Constitution Liquidating Fund 160,725,704 7.98%Landmark Private Equity Fund VIII 23,804,890 1.18%CS/CT Cleantech Opp Fund 13,459,707 0.67%CT Emerging Pvt Equity 9,121,390 0.45%Fairview Constitution III 52,459,954 2.60%Goldman Sachs Private Equity Partners CT 8,426,270 0.42%Lexington Capital Partners II 4,073,132 0.20%Parish Capital I LP 37,666,321 1.87%Parish Capital Buyout Fund II 96,260,356 4.78%Fairview Constitution II LP 123,187,147 6.12%Connecticut Horizon Legacy 7,822,662 0.39%Landmark Equity Partners XIV LP 8,968,930 0.45%JP Morgan Nutmeg I 4,379,355 0.22%
Special Situations $203,240,295 10.09%Welsh Carson Anderson & Stowe Capital Partners III 16,209,171 0.80%Levine Leichtman Capital Partners IV LP 10,511,435 0.52%Greenwich Street Capital Partners II 2,450,819 0.12%Pegasus Partners IV 88,133,949 4.38%WLR Recovery Fund IV 55,193,279 2.74%KPS Special Situations Fund II 30,741,642 1.53%
Other (1) 109,436,668 5.43%
SUBTOTAL PIF 2,013,846,298 100.00%

102 COMBINED INVESTMENT FUNDS 2010 COMPREHENSIVE FINANCIAL ANNUAL REPORT
CONNECTICUT STATE TREASURER’S COMBINED INVESTMENT FUNDS
SCHEDULE OF INVESTMENT ADVISORS AND FEES IN EXCESS OF $5,000(1)
FOR PERIODS ENDED JUNE 30 Aggregate Compensation Paid in Fiscal Year:Name of Firm Description of Services 2010 2009 2008 2007 2006
INVESTMENT ADVISORY SERVICES Equity Advisory ServicesAXA Rosenberg Institutional Equity Mgmt Equity Advisor 817,894 12,728,108 795,699 3,258,030 3,496,797Barclay’s Global Investors Equity Advisor 1,279,650 3,170,678 3,091,096 19,330,302 17,556,658Bivium Capital Partners, LLC Equity Advisor 1,302,624 1,493,573 1,629,037 1,264,146 761,024 Brown Capital Management Equity Advisor - - - 163,926 211,591Capital Prospects LLC Equity Advisor 832,638 967,215 1,064,352 747,721 361,850 FIS Group Inc. Equity Advisor 779,667 890,947 941,430 754,413 407,648 State Street Global Advisors Equity Advisor 134,862 194,106 247,748 237,897 216,988 Travelers Investment Management Equity Advisor - - - - 306,075 T. Rowe Price Associates Equity Advisor 2,052,593 406,114 - - -Trust Company of the West (Cowen) Equity Advisor 809,009 996,397 1,343,817 1,178,375 1,011,678Total Equity Advisor Compensation $8,008,937 $20,847,138 $9,113,179 $26,934,810 $24,330,309
Fixed Income Investment Advisory ServicesBlackrock Financial Management Fixed Income Advisor - - 392,489 1,498,458 1,519,240Bridgewater Associates Fixed Income Advisor - - 165,115 568,577 - Brown Brothers Harriman & Co. Fixed Income Advisor - - 47,021 186,107 154,386 Goodwin Capital Advisors (Phoenix) Fixed Income Advisor - - 169,499 555,070 544,902 Hartford Investment Management Co. Fixed Income Advisor - - 33,974 103,466 85,799 Loomis Sayles & Co., Inc. Fixed Income Advisor - - 204,110 763,360 523,406 Oaktree Capital Management Fixed Income Advisor - - 282,324 716,556 445,258 Progress Investment Management Fixed Income Advisor - - 134,134 529,293 340,907 State Street Global Advisors Fixed Income Advisor - - 89,263 318,064 309,376 W. R. Huff Asset Management Fixed Income Advisor - - - 1,360,812 319,873Wellington Asset Management Fixed Income Advisor - - 246,808 978,643 1,007,301 Western Asset Management Fixed Income Advisor - - 349,720 1,229,034 1,235,635Total Fixed Income Advisor Compensation $- $- $2,114,457 $8,807,440 $6,486,083
Core Fixed Income Investment Advisory ServicesBlackrock Financial Management Core Income Advisor 1,055,013 1,281,605 1,217,479 - - Goodwin Capital Advisors (Phoenix) Core Income Advisor 534,754 624,559 567,745 - - Progress Investment Management Core Income Advisor 823,293 898,894 561,890 - - State Street Global Advisors Core Income Advisor 250,696 277,369 267,092 - - Wellington Asset Management Core Income Advisor 449,376 771,263 734,363 - - Western Asset Management Core Income Advisor 425,920 1,131,334 1,146,230 - - Total Fixed Income Advisor Compensation $3,539,052 $4,985,024 $4,494,799 $- $- Infl ation Linked Bond Investment Advisory ServicesBrown Brothers Harriman & Co. Infl ation Income Advisor 973,728 - 143,593 - - Hartford Investment Management Co. Infl ation Income Advisor 399,253 443,712 124,559 - - Total Fixed Income Advisor Compensation $1,372,981 $443,712 $268,152 $- $- Emerging Market Debt Investment Advisory ServicesBridgewater Associates Emerging Market Advisor - - 161,018 - - ING Investment Management Co. Emerging Market Advisor 598,270 - - - -Pyramis Global Advisors Emerging Market Advisor 978,290 931,896 356,836 - Stone Harbor Investment Partners Emerging Market Advisor 1,102,088 1,065,029 399,164 - - UBS Global Asset Management Co. Emerging Market Advisor 1,229,146 1,249,932 432,348 - - Total Fixed Income Advisor Compensation $3,907,794 $3,246,857 $1,349,366 $- $- High Yield Debt Investment Advisory ServicesLoomis Sayles & Co., Inc. High Yield Income Advisor 511,590 582,544 565,179 - - Oaktree Capital Management High Yield Income Advisor 613,714 612,726 695,140 - Shenkman Capital Management High Yield Income Advisor 826,854 605,877 148,105 - - Stone Harbor Investment Partners High Yield Income Advisor 526,281 592,866 216,775 - - Total Fixed Income Advisor Compensation $2,478,439 $2,394,013 $1,625,199 $- $-

STATE OF CONNECTICUT, OFFICE OF THE TREASURER, DENISE L. NAPPIER 103
Aggregate Compensation Paid in Fiscal Year:Name of Firm Description of Services 2010 2009 2008 2007 2006
Liquidity Fund Advisory ServicesAmbassador Capital Management Liquidity Fund Advisor 107,885 - - - -Colchester Global Investors Liquidity Fund Advisor 373,734 - - - -Lazard Asset Management Liquidity Fund Advisor 987,397 - - - -Pacifi c Investment Management Liquidity Fund Advisor 263,309 - - - -Payden & Rygel Liquidity Fund Advisor 118,006 - - - -State Street Global Advisors Liquidity Fund Advisor 314,126 459,099 376,487 273,564 277,189Total Liquidity Fund Advisor Compensation $2,164,457 $459,099 $376,487 $273,564 $277,189
International Equity Investment Advisory ServicesAcadian Asset Management Intrntl Equity Advisor - - 385,075 481,894 - AQR Capital Management, LLC Intrntl Equity Advisor - - 439,067 543,524 - Bank of New York Intrntl Equity Advisor - - 642,250 2,633,092 2,367,488 Bridgewater Associates Intrntl Equity Advisor - - 770,700 3,159,711 2,840,985 Clay Finlay Inc. Intrntl Equity Advisor - - 295,382 1,231,976 1,109,359 Emerging Markets Management LLC Intrntl Equity Advisor - - 882,918 3,404,431 2,876,360 Grantham, Mayo, Van Otterloo & Co. Intrntl Equity Advisor - - 1,900,375 6,746,594 5,471,090 Invesco Global Asset Management Intrntl Equity Advisor - - 277,644 1,935,871 1,788,745Julius Baer Asset Management Intrntl Equity Advisor - - 287,012 315,222 - Merrill Lynch Investment Managers Intrntl Equity Advisor - - - 1,223,614 1,380,677 8MFS Institutional Advisors Intrntl Equity Advisor - - 345,384 1,064,812 844,424 Morgan Stanely Asset Management Intrntl Equity Advisor - - - 1,321,446 2,700,870 Progress Investment Management Intrntl Equity Advisor - - 133,380 467,163 245,073 Pyramis Invtmnt Global Adv Trust (Fidelity) Intrntl Equity Advisor - - 308,411 1,274,755 1,106,184 Schroder Investment Management Intrntl Equity Advisor - - 484,771 1,709,124 1,415,160State Street Global Advisors Intrntl Equity Advisor - - 107,789 485,705 420,498 Total International Equity Advisor Compensation $- $- $7,260,158 $27,998,934 $24,566,913
Developed Market International Equity Investment Advisory ServicesAcadian Asset Management Intrntl Equity Advisor 1,145,707 1,708,983 1,259,086 - - AQR Capital Management, LLC Intrntl Equity Advisor 2,501,900 1,885,640 1,397,341 - -Artio Global Asset Management Intrntl Equity Advisor 1,981,372 1,742,580 - - - Blackrock Financial Management (Merrill Lynch) Intrntl Equity Advisor 824,192 964,902 899,869 - - Bridgewater Associates Intrntl Equity Advisor - - 521,600 - - Clay Finlay Inc. Intrntl Equity Advisor - 1,416,044 883,935 - - Dimensional Fund Advisors Intrntl Equity Advisor 1,349,548 - - - -Grantham, Mayo, Van Otterloo & Co. Intrntl Equity Advisor 2,770,547 3,189,715 2,706,318 - - Invesco Global Asset Management Intrntl Equity Advisor 522,925 738,126 748,211 - - Julius Baer Asset Management Intrntl Equity Advisor - - 1,007,647 - - MFS Institutional Advisors Intrntl Equity Advisor 1,841,425 1,554,152 1,078,968 - - -Pareto Partners (Bank of New York) Intrntl Equity Advisor 2,379,251 2,193,806 1,848,626 - - Progress Investment Management Intrntl Equity Advisor 625,136 498,924 448,836 - - Pyramis Invtmnt Global Adv Trust (Fidelity) Intrntl Equity Advisor 847,138 1,321,148 933,148 - - Schroder Investment Management Intrntl Equity Advisor 1,314,860 1,480,826 1,501,099 - - State Street Global Advisors Intrntl Equity Advisor 412,631 388,527 302,429 - - William Blair & Comapny Intrntl Equity Advisor 1,594,531 - - - -Total International Equity Advisor Compensation $20,111163 $19,083,373 $15,537,113 $- $-
Emerging Market International Equity Investment Advisory ServicesAberdeen Asset Management Intrntl Equity Advisor 1,953,646 - - - -Emerging Markets Management LLC Intrntl Equity Advisor 3,355,933 3,344,579 2,952,146 - - Grantham, Mayo, Van Otterloo & Co. Intrntl Equity Advisor 4,359,800 4,302,557 3,901,398 - - Schroder Investment Management Intrntl Equity Advisor 441,983 - - - -Total International Equity Advisor Compensation $10,111,362 $7,647,136 $6,853,544 $- $-
CONNECTICUT STATE TREASURER’S COMBINED INVESTMENT FUNDS
SCHEDULE OF INVESTMENT ADVISORS AND FEES IN EXCESS OF $5,000(1)
FOR PERIODS ENDED JUNE 30 (Continued)

104 COMBINED INVESTMENT FUNDS 2010 COMPREHENSIVE FINANCIAL ANNUAL REPORT
CONNECTICUT STATE TREASURER’S COMBINED INVESTMENT FUNDS
SCHEDULE OF INVESTMENT ADVISORS AND FEES IN EXCESS OF $5,000(1)
FOR PERIODS ENDED JUNE 30 (Continued) Aggregate Compensation Paid in Fiscal Year:Name of Firm Description of Services 2010 2009 2008 2007 2006
Real Estate Investment Advisory Services (2)
AEW Capital Management, L.P. Real Estate Advisor 865,688 1,353,600 1,145,997 407,045 319,561 AEW Partners III, LP Real Estate Advisor - 261,146 82,925 205,033 255,775 Apollo Real Estate Investment Fund III Real Estate Advisor - - 224,129 314,799 437,899 Blackstone Real Estate Partners VI Real Estate Advisor 1,484,438 1,500,000 1,708,333 - - Blackstone Real Estate Partners Europe III Real Estate Advisor 750,000 572,917 - - - Canyon Johnson Urban Fund II, LP Real Estate Advisor 571,243 771,875 937,500 937,500 921,875 Canyon Johnson Urban Fund III, LP Real Estate Advisor 913,043 - - - -Capri Select Income II LLC Real Estate Advisor - - - - 177,143 Colony Realty Partners II, LP Real Estate Advisor - - 714,285 - - MacFarlane Urban Real Estate Real Estate Advisor 2,250,000 1,412,579 592,856 - - RLJ Urban Lodging Fund, LP Real Estate Advisor - - 139,753 312,500 312,500 RLJ Urban Lodging Fund II, LP Real Estate Advisor - - 468,750 722,603 - RLJ Urban Lodging Fund III, LP Real Estate Advisor 781,250 1,076,199 - - - RMK Timberland Group (Wachovia) Real Estate Advisor - - - - 112,065 Rockwood Capital Partners VII Real Estate Advisor 171,250 - - 381,075 - Urban Strategy America Fund Real Estate Advisor 30,603 - - 251,546 - Westport Senior Living Fund Real Estate Advisor - - - - 789,347 Total Real Estate Advisor Compensation $7,817,515 $6,948,316 $6,014,528 $3,532,101 $3,326,165
Commercial Mortgage Investment Advisory Services (2)
AEW Capital Management, L.P. Comm Mortgage Advisor 37,125 73,500 73,500 100,083 183,500 Total Commercial Mortgage Advisor Compensation $37,125 $73,500 $73,500 $100,083 $183,500
Private Investment Advisory Services (2)
AIG Altaris Health Partners, LP Private Inv Advisor 504,218 323,621 753,103 761,202 764,402 AIG Altaris Healthcare Partners II, LP Private Inv Advisor 1,033,732 713,206 600,548 - - AIG Global Emerging Mkts Fund LP Private Inv Advisor 67,953 385,337 242,944 658,764 815,309 Aldus\CT Emerging Manager Private Inv Advisor - 650,000 - - -Blackstone Capital Partners III LP Private Inv Advisor 10,089 47,872 29,555 52,275 27,471 Boston Venture Capital Partners VII, LP Private Inv Advisor 1,489,320 647,015 551,900 1,178,501 - Carlyle Asia Partners LP Private Inv Advisor 303,371 318,454 341,317 120,806 252,787 Carlyle European Partners LP Private Inv Advisor 266,426 158,379 295,071 165,746 300,610 Charterhouse Equity Partners IV, LP Private Inv Advisor 524,818 1,240,180 1,266,277 1,263,500 1,055,527 Conning & Co Private Inv Advisor - 74,176 39,671 - - Constitution Liquidating Fund LP (Crossroads) Private Inv Advisor 400,000 444,368 671,841 838,736 746,703 Courthouse Square Capital Partners Private Inv Advisor 1,289,728 1,253,282 - 1,255,539 - CS/CT Cleantech Opportunities Fund Private Inv Advisor 181,893 183,480 176,070 - - DLJ Merchant Banking Fund II LP Private Inv Advisor 166,752 73,659 84,787 330,288 83,355Ethos Capital Fund V, LP Private Inv Advisor 839,611 411,692 646,943 1,307,329 - Fairview Constitution II, LP Private Inv Advisor 1,300,000 1,300,000 1,600,000 1,600,000 800,000 Fairview Constitution III, LP Private Inv Advisor 2,400,000 2,400,000 2,426,519 - - Forstmann Little & Company Private Inv Advisor - 115,155 142,141 182,868 186,838 FS Equity Partners V LP Private Inv Advisor 94,055 475,145 1,101,934 895,172 562,5008FS Equity Partners VI LP Private Inv Advisor 1,603,591 - - - -Garmark Partners LP Private Inv Advisor - 9,925 83,239 57,487 1,008,239 Garmark Partners, II LP Private Inv Advisor 929,689 571,623 426,718 735,085 88,608 Gilbert Global Equity Partners LP Private Inv Advisor - - 117,030 222,718 - Goldman Sachs Private Equity Fund LP Private Inv Advisor - - 151,189 358,382 315,324 Green Equity III LP Private Inv Advisor 29,747 50,025 44,098 90,314 - Greenwich Street Capital Partners II LP Private Inv Advisor 9,511 34,495 239,525 354,628 220,310 ICV Associates II LP Private Inv Advisor 667,546 655,725 706,702 356,364 1,140,602 KKR 1996 Fund LP Private Inv Advisor - 33,880 12,349 10,433 - KKR Millenium Fund LP Private Inv Advisor 67,797 - 1,549,415 - 126,005 KKR 2006 Fund LP Private Inv Advisor 1,089,981 1,553,700 - - - KPS Special Situations Fund II LP Private Inv Advisor - 7,429 164,600 - 388,971 Leeds Equity Associates V LP Private Inv Advisor 616,274 711,110 - - -

STATE OF CONNECTICUT, OFFICE OF THE TREASURER, DENISE L. NAPPIER 105
(1) Expenses are presented on a cash basis. (2) Alternative Investment Management fees for the Private Investment Fund and the Real Estate Fund include capitalized fees and expensed fees. Capitalized fees are part of the cost of the
investment and become a component of unrealized gain (loss). Capitalized fees are disclosed in Note 1 of the Combined Investment Funds Financial Statements. Expensed fees which are not part of the cost of the investment are recorded in the Statement of Operations. Not Included in the above amounts are those amounts that are netted. Netted amounts include credits and fees paid out of cash on hand at the partnership level. Netted amounts are disclosed in Note 1 of the Combined Investment Funds Financial Statements.
Aggregate Compensation Paid in Fiscal Year:Name of Firm Description of Services 2010 2009 2008 2007 2006
LLCP Partners IV LP Private Inv Advisor 1,227,249 1,733,219 - - - Muller & Monroe Asset Management Private Inv Advisor 1,013,699 550,000 327,740 - - Nogales Investors II, LP Private Inv Advisor 449,947 753,308 802,527 668,203 - Parish Capital I, LP Private Inv Advisor - - 123,181 322,441 470,791 Parish Capital II, LP Private Inv Advisor - - 13,889 1,260,562 - Pegasus Investors IV, LP Private Inv Advisor 1,246,983 796,345 2,744,224 - - Pioneer Venture Associates LP Private Inv Advisor - - - - 220,000 REF Associates VII, LP Private Inv Advisor 201,644 - 93,213 - - Snycom Partners V, LP Private Inv Advisor 579,099 607,136 390,546 386,655 - SW Pelham Fund II, LP Private Inv Advisor 223,425 295,500 263,401 288,569 - SW Pelham Fund, LP Private Inv Advisor - - - 207,936 195,511 Thayer Equity Investors IV LP Private Inv Advisor 195,955 234,511 243,425 137,579 457,716 Thomas H. Lee Advisors IV LP Private Inv Advisor - - 96,816 121,716 57,163Thomas H. Lee Equity Fund VI LP Private Inv Advisor 1,030,058 592,155 1,374,287 - - Vista Equity Partners III, LP Private Inv Advisor 688,224 558,093 877,027 - - WCAS X LP Private Inv Advisor - - - - 521,918 Wellspring Capital Partners III LP Private Inv Advisor 353,904 93,045 - - 1,496,936 Yucaipa American Alliance Fund LP Private Inv Advisor 693,750 1,469,767 - - - Total Private Investment Advisor Compensation $23,887,560 $22,526,012 $21,815,762 $16,189,798 $12,303,596
TOTAL COMPENSATION TO INVESTMENT ADVISORS $83,436,385 $88,654,180 $76,896,244 $83,836,730 $71,473,755
CUSTODY SERVICESState Street Bank & Trust Custody of Assets - 80,000 113,000 114,500 1,046,595 TOTAL CUSTODY SERVICES COMPENSATION $- $80,000 $113,000 $114,500 $1,046,595
CONNECTICUT STATE TREASURER’S COMBINED INVESTMENT FUNDS
SCHEDULE OF INVESTMENT ADVISORS AND FEES IN EXCESS OF $5,000(1)
FOR PERIODS ENDED JUNE 30 (Continued)

106 COMBINED INVESTMENT FUNDS 2010 COMPREHENSIVE FINANCIAL ANNUAL REPORT
CONNECTICUT STATE TREASURER’S COMBINED INVESTMENT FUNDS
SCHEDULE OF BROKERAGE COMMISSIONSFOR THE FISCAL YEAR ENDED JUNE 30, 2010
$ Shares/ Avg $ Shares/ Avg Broker Name Commission Par Value Comm Broker Name Commission Par Value Comm
ABEL NOSER CORPORATION 52.00 2,100.00 0.02 ABG SECURITIES AS (STOCKHOLM) 933.83 41,168.00 0.02 ABG SECURITIES LIMITED 9,072.66 658,678.00 0.01 ABG SUNDAL COLLIER NORGE ASA 4,278.98 346,074.00 0.01 ABM AMRO HOARE GOVETT ASIA LTD, SEOUL 8,750.13 201,653.00 0.04 ABN AMRO ASIA LIMITED 4,857.58 5,783,000.00 0.00 ABN AMRO BANK N. V. HONG KONG 80,877.79 35,520,568.00 0.00 ABN AMRO BANK NV HONG KONG BRANCH 1,826.17 1,969,300.00 0.00 ABN AMRO INCORPORATED 696.00 17,400.00 0.04 ABN AMRO SECURITIES (USA) INC 14,644.06 869,655.00 0.02 ACCESS SECURITIES INC 7,279.04 358,094.00 0.02 ACCIONES Y VALORES DE MEXICO 8,149.09 1,088,000.00 0.01 ACTINVER CASA DE BOLSA SA DE CV 5,811.19 877,400.00 0.01 ADAMS HARKNESS AND HILL INC 3,871.64 99,849.00 0.04 ALARIS TRADING PARTNERS 809.36 47,740.00 0.02 ALBERT FRIED & COMPANY LLC 194.00 9,700.00 0.02 ALLEN & COMPANY INCORPORATED 1,179.00 39,300.00 0.03 ALPHA FINANCE 1,566.44 65,392.00 0.02 ALTIUM CAPITAL LIMMITED 321.92 25,000.00 0.01 ALTIUM CAPITAL LTD 436.35 50,000.00 0.01 AMERICAN PORTFOLIOS FINANIAL 247.86 5,154.00 0.05 AMERICAN TECHNOLOGY RESEARCH INC 1,005.00 30,300.00 0.03 AQUA SECURITIES LP 4.00 200.00 0.02 ARBUTHNOTSECURITIES LIMITED 956.18 64,003.00 0.01 ARDEN PARTNERS LTD 769.26 239,906.00 0.00 ASSENT LLC 164.49 16,449.00 0.01 ATA SECURITIES INC. (ISTANBUL) 12,511.23 1,155,892.00 0.01 ATR KIM ENG SECURITIES, INC 799.58 2,521,782.00 0.00 AUERBACH GRAYSON 1,799.99 98,058.00 0.02 AUTREPAT-DIV RE 3,890.62 1,160,101.22 0.00 AVONDALE PARTNERS LLC 6,696.78 168,074.00 0.04 B RILEY AND CO INC. 42.06 1,402.00 0.03 BAIRD ROBERT W. & COMPANY INCORPORATED 19,534.38 27,394,948.38 0.00 BANCA COMMERCIALE ITALIANA MILAN 2,846.15 149,092.00 0.02 BANCA IMISECURITIES CORP 3,063.28 262,920.00 0.01 BANCO BARCLAYS SA 135.99 29,917,920.00 0.00 BANCO BILBAO VIZCAYA ARGENTARI 3,137.55 92,065.00 0.03 BANCO COMERCIAL PORTUGUES 245.58 43,195.00 0.01 BANCO DE INVESTIMENTOS CREDIT 815.83 12,717,598.00 0.00 BANCO ESPIRITO SANTO DE INVEST 8.94 600.00 0.01 BANCO ITAU S.A. 2,156.79 35,500.00 0.06 BANCO ITAU SA 70,242.80 3,463,095.00 0.02 BANCO NACIONAL DE MEXICO S.A. 1,128.77 139,700.00 0.01 BANCO PACTUAL S.A. 907.75 5,038,373.00 0.00 BANCO PORTUGUES DE INVESTIMENTO S.A. 808.59 61,037.00 0.01 BANCO SANTANDER CENTRAL HISPANO 68,266.91 165,946,353.00 0.00 BANCO SANTANDER DE NEGOCIOS 8,440.62 30,679,896.00 0.00 BANK AM BELLEVUE 336.10 698.00 0.48 BANK AUSTRIA CREDITANSTALT AG 319.07 14,839.00 0.02 BANK J.VONTOBEL UND CO. AG 2,467.09 2,631.00 0.94 BANK OF AMERICA SECURITIES LLC 92.55 928,852,319.08 0.00 BANK OF NEW YORK BRUSSELS 2,841.08 385,776,867.00 0.00 BANK SAL.OPPENHEIM JR. AND CIE. 176.38 4,350.00 0.04 BANQUE NATIONAL DE PARIS HONG KONG 8,345.35 33,630,600.00 0.00 BANQUE NATIONALE DU CANADA 817.23 20,853.00 0.04 BANQUE PARIBAS FRANKFURT 50.99 400.00 0.13 BARCLAYS BANK PLC 3,810.54 72,117,644.00 0.00 BARCLAYS CAPITAL 63,673.14 27,577,342,578.26 0.00 BARCLAYS CAPITAL INC 34,215.07 5,303,739,970.20 0.00 BARCLAYS CAPITAL INC. 945.88 8,324,985,344.58 0.00 BARCLAYS CAPITAL INC./LE 2,293.70 5,330,968.00 0.00 BARCLAYS CAPITAL LE 30,535.32 5,544,201.00 0.01 BARRINGTON RESEARCH ASSOCIATES INC. 1,424.45 29,888.00 0.05 BAYPOINT TRADING LLC 7,576.86 369,047.00 0.02 BBVA PRIVANZA BANCO S.A. MADRID 16.40 349.00 0.05 BEAL M R + COMPANY 662.00 26,900.00 0.02 BEAR STEARNS SECURITIES CORP 310.35 6,367.00 0.05 BHIRUD ASSOCIATES, INC 6,659.60 125,755.00 0.05 BLAYLOCK + CO INC 11,363.53 788,926.00 0.01 BLEY INVESTMENT GROUP 15,593.87 454,019.00 0.03 BLOOMBERGTRADEBOOK EUROPE LIMITED 26.40 660.00 0.04 BLOOMBERGTRADEBOOK LLC 23,005.11 696,047.00 0.03 BMO CAPITAL MARKETS 3,813.09 101,662.00 0.04 BNP PARIBAS PEREGRINE SECS LT ASIA 450.76 13,736.00 0.03 BNP PARIBAS PEREGRINE SECS PT 9,044.46 29,987,940.00 0.00 BNP PARIBAS PEREGRINE SECURITIES 48,605.11 18,432,529.00 0.00 BNP PARIBAS SA 4,554.20 5,577,151.00 0.00 BNP PARIBAS SECURITIES SERVICES 19,545.54 1,682,266.00 0.01 BNY BROKERAGE 3,467.10 99,060.00 0.04 BNY CONVERGEX 204,907.75 9,908,834.00 0.02 BNY CONVERGEX LJR 678.37 24,617.00 0.03 BNY MELLON/VTB CAPITAL PLC 1,679.94 67,525.00 0.02 BOCI SECURITIES LTD. 6,576.70 2,788,000.00 0.00 BOE SECURITIES INC 1,253.00 33,500.00 0.04 BOE SECURITIES INC/BROADCORT CAP CORP 5,429.57 136,015.00 0.04 BOENNING + SCATTERGOOD INC 3,285.30 200,490.00 0.02
BOSTON FINANCIAL DATA SYSTEMS 532.20 18,400.00 0.03 BRADESCO S.A CTVM 9,347.81 425,174.00 0.02 BREAN MURRAY 122.75 2,725.00 0.05 BREAN MURRAY, CARRET& CO., LLC 23.25 775.00 0.03 BREWIN DOLPHIN BELL LAWRIE LIMITED 602.06 176,427.00 0.00 BROADCORTCAPITAL (THRU ML) 351.74 9,164.00 0.04 BROCKHOUSE + COOPER INC MONTREAL 5,476.29 927,302.00 0.01 BRUNSWICKWARBURG NOMINEES 2,422.14 966,556.00 0.00 BUCKINGHAM RESEARCH GROUP INC 4,370.65 105,833.00 0.04 CA IB INVESTMENTBANK AG 1,474.24 97,681.00 0.02 CABRERA CAPITAL MARKETS 28,968.02 2,230,354.00 0.01 CALYON SECURITIES 1,374.11 127,541.00 0.01 CANACCORDADAMS LIMITED 66.42 6,971.00 0.01 CANACCORDGENUITY CORP. 4,378.14 117,841.00 0.04 CANACCOROADAMS INC 16,370.47 361,022.00 0.05 CANADIAN IMPERIAL BANK OF COMMERCE 227.36 6,487.00 0.04 CANTOR FITZ EUR 2 9,456.91 1,306,496.00 0.01 CANTOR FITZGERALD 308.77 5,737.00 0.05 CANTOR FITZGERALD & CO / CASTLEOAK SEC 3,235.45 6,572,718.00 0.00 CANTOR FITZGERALD & CO./AQUA SECURITIES, 3,012.00 301,200.00 0.01 CANTOR FITZGERALD + CO. 114,140.29 19,830,453.20 0.01 CANTOR FITZGERALD AND CO 475.25 509,677.00 0.00 CANTOR FITZGERALD/CANTOR CLEARING SERV 170.00 13,668,379.40 0.00 CAPITAL INSTITUTIONAL SVCS INC EQUITIES 19,488.50 678,541.00 0.03 CARIS + COMPANY INC 2,316.00 50,725.00 0.05 CARNEGIE 2,523.22 243,796.00 0.01 CARNEGIE A S 1,686.16 460,631.00 0.00 CARNEGIE BK 1,873.93 15,966.00 0.12 CARNEGIE SECURITIES FINLAND 3,248.78 97,490.00 0.03 CAZENOVE + CO 10,410.44 1,466,834.00 0.01 CAZENOVE ASIA LIMITED 4,351.87 3,358,800.00 0.00 CAZENOVE ASIA LTD 15,707.40 8,934,200.00 0.00 CENKOS SECURITIES LIMITED 123.86 46,948.00 0.00 CENTRO INTERNATIONALE HANDELSBANK 5,189.44 41,282.00 0.13 CENTROBANCA SPA MILANO 800.71 245,130.00 0.00 CHARLES SCHWAB & CO INC 4,090.48 623,112.00 0.01 CHEEVERS + CO 153.00 5,100.00 0.03 CHEUVREUXDE VIRIEU 2,480.92 101,602.00 0.02 CHICAGO ANALYTIC TRADING COMPANY 8,472.00 211,800.00 0.04 CHINA INTRTNL CAP CORP HK SECS LTD 19,962.69 9,663,437.00 0.00 CHURCHILLCAPITAL LTD 168.58 1,210.00 0.14 CIBC WORLD MARKETS CORP 1,062.52 6,578,691.83 0.00 CIBC WORLD MKTS INC 15,051.51 437,305.00 0.03 CITATION GROUP 5,878.35 331,845.00 0.02 CITIBANK AS PRAHA 944.80 5,860.00 0.16 CITIBANK BUDAPEST RT(HUNGARY) 146.20 16,580.00 0.01 CITIBANK CANADA 185.00 4,943.00 0.04 CITIBANK INTERNATIONAL PLC 1,045.20 39,484.00 0.03 CITIBANK MEXICO 63,648.14 5,574,500.00 0.01 CITIBANK N.A. 11,533.43 10,454,799,348.96 0.00 CITIGROUPGLBL MARKTET KOERA SECS LTD 2,055.09 60,953.00 0.03 CITIGROUPGLOBAL MARKETS ASIA LTD 689.93 38,500.00 0.02 CITIGROUPGLOBAL MARKETS AUSTRALIA PTY 4,395.55 589,474.00 0.01 CITIGROUPGLOBAL MARKETS INC 201,983.83 1,570,821,712.38 0.00 CITIGROUPGLOBAL MARKETS INC SALOMON BRO 280.93 3,176,793,394.97 0.00 CITIGROUPGLOBAL MARKETS INC. 479,841.18 36,383,070,432.99 0.00 CITIGROUPGLOBAL MARKETS LIMITED 336,896.38 786,859,496.87 0.00 CITIGROUPGLOBAL MARKETS SINGAPORE SECUR 81.10 1,170,109,637.00 0.00 CITIGROUPGLOBAL MARKETS UK EQUITY LTD 51,974.96 9,299,602.00 0.01 CITIGROUPGLOBAL MKT 63.99 132,449,200.00 0.00 CJSC DEPOSITORY CLEARING CO 726.59 1,463,145.00 0.00 CLSA SECURITIES KOREA LTD. 20,961.40 182,000.00 0.12 CLSA SECURITIES MALAYSIA SDN BHD 3,316.18 1,827,100.00 0.00 CLSA SINGAPORE PTE LTD. 24,128.97 7,446,836.00 0.00 COLLINS STEWART 1,530.98 115,000.00 0.01 COLLINS STEWART + CO 1,052.89 48,843.00 0.02 COLLINS STEWART INC. 518.00 14,200.00 0.04 COLLINS STEWART LLC 87.50 1,750.00 0.05 COMMERCE INTL MERCHANT BANKERS 4,302.94 2,565,500.00 0.00 COMMERZBANK AG 1,565.92 2,117,656.98 0.00 COMMERZBANK AG LONDON 181.77 6,814.00 0.03 CORE PACIFIC SECURITIES INTL LIMITED 92.78 11,500.00 0.01 COWEN ANDCOMPANY, LLC 70,389.47 3,094,599.00 0.02 CRAIG - HALLUM 2,629.84 65,309.00 0.04 CREDIT AGRICLE INDOSUEZ 9,353.01 366,501.00 0.03 CREDIT AGRICOLE CIB 5,478.20 2,114,576.00 0.00 CREDIT AGRICOLE INDOSUEZ CHEUVREUX 83,805.24 3,480,346.00 0.02 CREDIT LYONNAIS CAPITAL INDONESIA 2,187.75 607,966.00 0.00 CREDIT LYONNAIS SECS 1,680.00 56,000.00 0.03 CREDIT LYONNAIS SECURITIES (USA) INC 87,604.51 52,912,932.00 0.00 CREDIT LYONNAIS SECURITIES ASIA GUERNSEY 8,024.88 20,123,700.00 0.00 CREDIT LYONNAIS SECURITIES(ASIA) 60,997.19 39,345,042.00 0.00 CREDIT RESEARCH + TRADING LLC 618.00 20,600.00 0.03 CREDIT SUISSE FIRST BOSTON 4,360.37 6,351,114,753.00 0.00 CREDIT SUISSE FIRST BOSTON (EUROPE) 15,889.45 270,683.00 0.06 CREDIT SUISSE FIRST BOSTON SA CTVM 20,077.55 3,708,096.00 0.01

STATE OF CONNECTICUT, OFFICE OF THE TREASURER, DENISE L. NAPPIER 107
CONNECTICUT STATE TREASURER’S COMBINED INVESTMENT FUNDSSCHEDULE OF BROKERAGE COMMISSIONS (Continued)
FOR THE FISCAL YEAR ENDED JUNE 30, 2010
$ Shares/ Avg $ Shares/ Avg Broker Name Commission Par Value Comm Broker Name Commission Par Value Comm
CREDIT SUISSE SECURITIES (EUROPE) LTD 184,016.72 2,976,809,604.67 0.00 CREDIT SUISSE SECURITIES (USA) LLC 875,270.14 5,279,159,755.54 0.00 CREDIT USA 834.18 53,876.00 0.02 CRESTCO LTD 671.65 91,811.00 0.01 CS FIRST BOSTON (HONG KONG) LIMITED 70,407.72 39,005,854.00 0.00 CS SECURITIES EUROPE LTD 16.60 901,660,065.00 0.00 CSFB AUSTRALIA EQUITIES LTD 10,019.52 1,411,849.00 0.01 CSI US INSTITUTIONAL DESK 1,044.00 26,100.00 0.04 CUSTOM EQUITY RESEARCH DBA SUMMER ST RES 39,018.88 1,989,379.00 0.02 D CARNEGIE AG 5,016.91 134,977.00 0.04 DAEWOO SECURITIES CO LTD 23,170.10 422,311.00 0.05 DAHLMAN ROSE + COMPANY LLC 1,506.00 44,000.00 0.03 DAISHIN SECURITIES CO. LTD. 1,988.07 94,815.00 0.02 DAIWA SECURITIES (HK) LTD. 9,039.38 2,994,072.00 0.00 DAIWA SECURITIES AMERICA INC 34,845.01 3,775,434.00 0.01 DANSKE BANK A.S. 6,707.37 92,022.00 0.07 DAVENPORT& CO. OF VIRGINIA, INC. 886.04 25,776.00 0.03 DAVIDSON D.A. + COMPANY INC. 5,949.48 146,937.00 0.04 DAVY STOCKBROKERS 1,958.74 199,838.00 0.01 DBS VICKERS (HONG KONG) LIMITED 4,516.47 1,380,000.00 0.00 DBS VICKERS SECURITIES (SINGAPORE) 5,978.23 2,036,800.00 0.00 DBS VICKERS SECURITIES(THAILAND) 3,050.44 1,048,000.00 0.00 DEAGROATT+ CAMPBELL SDN BHD 16,643.33 7,007,910.00 0.00 DENIZ YATIRIM MENKUL DEGERLER A.S. 4,048.85 1,431,214.00 0.00 DEPOSITORY CLEARING COMPANY 54.98 7,620.00 0.01 DEUTSCHE BANK AG JAKARTA 66.79 27,500.00 0.00 DEUTSCHE BANK AG LONDON 91,170.39 3,506,667,479.15 0.00 DEUTSCHE BANK ALEX BROWN 3,339.55 84,452.00 0.04 DEUTSCHE BANK SECURITIES 225.78 412.00 0.55 DEUTSCHE BANK SECURITIES INC 496,108.84 8,299,080,542.08 0.00 DEUTSCHE MORGAN GRENFELL SECS 12,945.36 1,665,635.00 0.01 DEUTSCHE SECURITIES ASIA LIMITED 44,280.18 21,248,046.00 0.00 DEUTSCHE SECURITIES ASIA LTD 6,602.41 88,158.00 0.07 DG BANK, DEUTSCHE GENOSSENSCHAFTSBA 901.07 6,014.00 0.15 DIRECT ACCESS PARTNERS LLC 1,554.70 83,980.00 0.02 DIRECT TRADING INSTITUTIONAL INC 4,490.70 384,728.00 0.01 DIVINE CAPITAL MARKETS LLC 72,317.80 3,288,396.00 0.02 DNB NOR MARKETS CUSTODY DNB NORBANK ASA 561.67 1,763.00 0.32 DONGWON SECURITIES 9,390.21 56,100.00 0.17 DOUGHERTYCOMPANY 3,225.42 94,708.00 0.03 DOWLING &PARTNERS 19,670.50 678,900.00 0.03 DRESDNER BANK AG, LONDON BRANCH 339.29 28,735.00 0.01 DUNDAS UNLU SECURITIES INC. 32,888.77 6,071,265.00 0.01 DUPONT GILBERT SA 2,223.83 49,964.00 0.04 E. OHMAN JOB FONDKOMMISSION AB 128.70 3,200.00 0.04 E.L.AND C. BAILLIEU LTD 308.45 914,372.00 0.00 EMERGING GROWTH EQUITIES LTD 1,154.30 115,430.00 0.01 ERSTE BANK DER OESTERREICHISCHEN 3,691.65 70,534.00 0.05 ESN NORTHAMERICA, INC. 1,784.20 600,991.00 0.00 EUROCLEARBANK S.A N.V. 133.84 52,601,597.40 0.00 EUROCLEARBANK SA NV 143.25 169,775.00 0.00 EUROMOBILIARE SIM S.P.A. 6,983.93 1,594,754.00 0.00 EVLI SECURITIES LTD 387.23 10,532.00 0.04 EVOLUTIONBEESON GREGORY LIMITED 3,181.52 261,186.00 0.01 EXANE S.A. 30,085.48 1,093,304.00 0.03 EXECUTION(HONG KONG) LIMITED 21,544.72 15,685,000.00 0.00 EXECUTIONLIMITED 5,019.90 1,043,015.00 0.00 FATOR - DORIA ATHERINO S.A CV 1,426.55 31,100.00 0.05 FIDELITY CAPITAL MARKETS 51,310.82 2,835,996.00 0.02 FIG PARTNERS LLC 482.52 12,063.00 0.04 FINANCIALBROKERAGE GROUP (FBG) 35,994.16 2,528,481.00 0.01 FINANCIERA SAN PEDRO-PERU 111.00 3,700.00 0.03 FIRST ANALYSIS SECURITIES CORP 1,403.18 30,794.00 0.05 FIRST CLEARING, LLC 130.24 3,256.00 0.04 FIRST SECURITIES ASA 2,020.94 333,925.00 0.01 FIRST SOUTHWEST COMPANY 5,827.20 145,680.00 0.04 FOKUS BANK ASA 78.20 6,455.00 0.01 FORSYTH BARR LTD 188.34 152,034.00 0.00 FORTIS BANK (NEDERLAND) N.V. 464.81 5,138.00 0.09 FOX PITT KELTON INC 3,130.55 75,151.00 0.04 FOX PITT KELTON LTD 6,567.62 816,877.00 0.01 FRIEDMAN BILLINGS + RAMSEY 23,018.68 899,398.00 0.03 G TRADE SERVICES LTD 1,392.64 377,980.00 0.00 GALATA SECURITIES INC 1,261.25 256,020.00 0.00 GARBAN EQUITIES LIMITED LONDON 477.27 651,000.00 0.00 GARDNER RICH & CO 4,329.12 155,254.00 0.03 GBM INTERNATIONAL INC. 1,803.50 257,688.00 0.01 GFI SECURITIES LLC 1,625.00 65,000.00 0.03 GK GOH SECURITIES (HK) LTD. 833.76 136,000.00 0.01 GLOBAL EQUITIES 848.29 25,386.00 0.03 GMP SECURITIES LTD. 2,133.99 56,601.00 0.04 GOLDMAN SACHS (ASIA) LLC 27,807.11 108,856.00 0.26 GOLDMAN SACHS + CO 379,485.70 2,066,750,074.56 0.00 GOLDMAN SACHS DO BRASIL BANCO MULTI AVEN 41.44 1,900.00 0.02 GOLDMAN SACHS DO BRASIL CORRETORA 2,449.49 37,943.00 0.06 GOLDMAN SACHS INTERNATIONAL 217,683.39 21,319,594.00 0.01
GOODBODY STOCKBROKERS 4,838.83 622,132.00 0.01 GORDON HASKETT 78.00 3,900.00 0.02 GREEN STREET ADVISORS 518.00 15,300.00 0.03 GREENTREEBROKERAGE SERVICES INC 2,246.20 84,255.00 0.03 GRIFFITHSMCBURNEY + PARTNERS 879.00 28,600.00 0.03 GRISWOLD COMPANY 115.40 5,770.00 0.02 GUZMAN + CO 22,918.44 1,581,466.00 0.01 HC ISTANBUL 32,865.08 6,687,520.00 0.00 HEDGING GRIFFO COR DE VAL S.A 1,209.13 38,625.00 0.03 HEEVERS &CO. INC. 3,390.04 101,818.00 0.03 HEFLIN + CO LLC 98,387.34 5,146,763.00 0.02 HELVEA SA 190.80 110.00 1.73 HIBERNIA SOUTHCOAST CAPITAL INC 2,090.56 48,967.00 0.04 HONGKONG + SHANGHAI BANKING 6,172.25 1,191,248.00 0.01 HONGKONG AND SHANGHAI BANKING CORP 41,476.01 13,726,000.00 0.00 HOWARD WEIL DIVISION LEGG MASON 4,985.40 101,172.00 0.05 HSBC BANKBRASIL SA BANCO MULTIPLO 2,004.65 10,993,151.00 0.00 HSBC BANKPLC 56,324.29 1,534,023,846.00 0.00 HSBC BROKERAGE (USA) INC. 1,761.84 44,046.00 0.04 HSBC JAMES CAPEL SEOUL 3,881.86 43,285.00 0.09 HSBC SECURITIES (USA) INC. 33,642.76 27,612,908,917.00 0.00 HSBC SECURITIES (USA), INC. 4,264.79 193,975.00 0.02 HVB CAPITAL MARKETS, INC 4,994.81 44,503.00 0.11 HYUNDAI SECURITIES CO. LTD. 28,014.74 803,111.00 0.03 ICAP CORPORATES LLC 7,014.92 187,523.00 0.04 ICAP DO BRASIL DTVM LTDA 852.18 76,113.00 0.01 ICAP SECURITIES LTD 9,367.19 269,957,151.00 0.00 ING BANK N V 43,659.14 91,117,709.00 0.00 ING FINANCIAL MARKETS LLC 70,404.93 27,543,282.00 0.00 INSTINET 266,473.49 10,072,931.00 0.03 INSTINET AUSTRALIA CLEARING SRVC PTY LTD 934.81 1,453,358.00 0.00 INSTINET CANADA 4.55 949.00 0.00 INSTINET LLC 4,819.70 424,409.00 0.01 INSTINET PACIFIC LIMITED 47,935.22 61,199,533.00 0.00 INSTINET SINGAPORE SERVICES PT 2,280.49 1,094,010.00 0.00 INSTINET U.K. LTD 83,430.75 22,613,417.00 0.00 INTERDIN BOLSA S.V.B., S.A. 926.22 47,078.00 0.02 INTERMONTE SEC SIM SPA 402.18 45,559.00 0.01 INVERLAT INTERNATIONAL 2,541.47 272,403.00 0.01 INVESTEC HENDERSON CROSTHWAITE 821.16 80,393.00 0.01 INVESTEC SECURITIES 4,542.54 624,582.00 0.01 INVESTMENT TECHNOLOGY GROUP INC. 211,022.13 19,011,502.00 0.01 INVESTMENT TECHNOLOGY GROUP LTD 38,355.44 6,673,616.00 0.01 ISI GROUPINC 37,532.43 1,768,798.00 0.02 ISLAND TRADER SECURITIES INC 213.32 21,332.00 0.01 ITG AUSTRALIA LTD. 3,115.17 2,817,115.00 0.00 ITG CANADA 826.66 48,600.00 0.02 ITG INC 785.92 103,917.00 0.01 ITG INC. 524.96 40,671.00 0.01 ITG SECURITIES (HK) LTD 30,964.28 10,771,666.00 0.00 IVY SECURITIES, INC. 177.00 5,900.00 0.03 J AND E DAVY 2,419.56 150,154.00 0.02 J B WERE AND SON 4,269.71 11,899,435.00 0.00 J P MORGAN SECURITIES INC 189,747.79 12,032,528,511.34 0.00 J.P. MORGAN CLEARING CORP. 152,802.45 149,776,875.07 0.00 J.P. MORGAN SECURITIES INC. 135,798.11 8,486,942.00 0.02 J.P. MORGAN SECURITIES LIMITED 9,553.07 1,267,809.00 0.01 J.P.MORGAN SECURITIES(FAR EAST)LTD SEOUL 28,779.21 277,408.00 0.10 JACKSON PARTNERS + ASSOCIATES INC 108.00 2,700.00 0.04 JACKSON SECURITIES 136,797.30 7,344,144.00 0.02 JANNEY MONTGOMERY, SCOTT INC 1,579.00 35,040.00 0.05 JB WERE AND SON (NZ) LTD 844.28 81,570.00 0.01 JEFFERIES+ COMPANY INC 539,434.16 98,992,089.42 0.01 JEFFERIESINTERNATIONAL LTD 7,353.67 3,220,242.00 0.00 JMP SECURITIES 11,112.43 257,352.00 0.04 JOH BERENBERG GOSSLER AND CO 22,791.90 386,190.00 0.06 JOHNSON RICE + CO 5,421.58 118,853.00 0.05 JONESTRADING INSTITUTIONAL SERVICES LLC 103,564.43 5,110,920.00 0.02 JP MORGANSECURITIES 2,934.75 13,914,692.00 0.00 JP MORGANSECURITIES AUSTRALIA LTD 19,749.94 3,433,717.00 0.01 JP MORGANSECURITIES LIMITED 150,406.64 184,202,405,873.30 0.00 JP MORGANSECURITIES SA 75.20 6,100.00 0.01 JPMORGAN CHASE BANK 4,646.46 19,519,579,904.90 0.00 JPMORGAN CHASE BANK N.A. LONDON 280.86 12,456.00 0.02 JPMORGAN SECURITIES(ASIA PACIFIC)LTD 74,180.43 31,226,452.00 0.00 KAS-ASSOCIATIE N.V. 5,148.31 210,032.00 0.02 KAUFMAN BROTHERS 591.43 25,253.00 0.02 KBC FINANCIAL PRODUCTS UK LTD 11,888.34 128,726.00 0.09 KBC PEEL HUNT LTD 5,830.62 1,446,470.00 0.00 KEEFE BRUYETTE + WOODS INC 19,138.45 754,856.00 0.03 KEEFE BRUYETTE AND WOOD LIMITED 6,695.61 1,644,154.00 0.00 KELLOGG PARTNERS 473.85 15,795.00 0.03 KEMPEN + CO N.V. 603.44 58,016.00 0.01 KEPLER EQUITIES 66.93 3,980.00 0.02 KEPLER EQUITIES FRANKFURT BRANCH 3,096.05 34,105.00 0.09 KEPLER EQUITIES PARIS 8,766.04 126,505.00 0.07
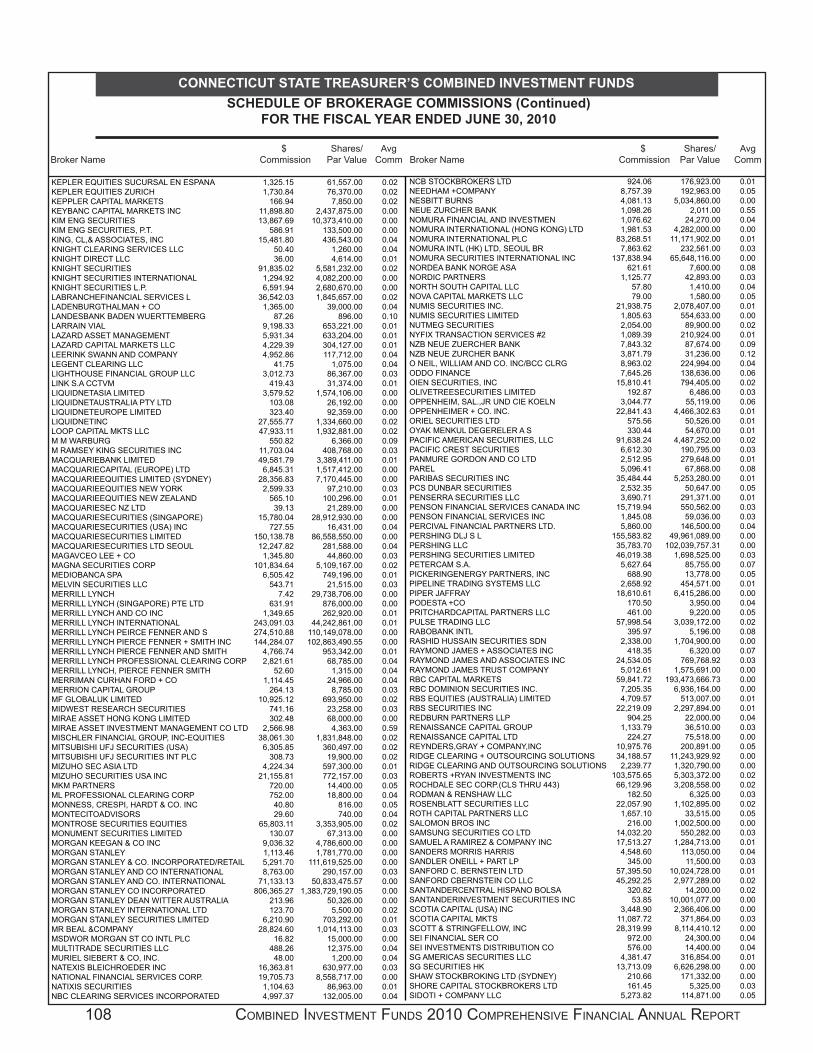
108 COMBINED INVESTMENT FUNDS 2010 COMPREHENSIVE FINANCIAL ANNUAL REPORT
CONNECTICUT STATE TREASURER’S COMBINED INVESTMENT FUNDSSCHEDULE OF BROKERAGE COMMISSIONS (Continued)
FOR THE FISCAL YEAR ENDED JUNE 30, 2010
$ Shares/ Avg $ Shares/ Avg Broker Name Commission Par Value Comm Broker Name Commission Par Value Comm
KEPLER EQUITIES SUCURSAL EN ESPANA 1,325.15 61,557.00 0.02 KEPLER EQUITIES ZURICH 1,730.84 76,370.00 0.02 KEPPLER CAPITAL MARKETS 166.94 7,850.00 0.02 KEYBANC CAPITAL MARKETS INC 11,898.80 2,437,875.00 0.00 KIM ENG SECURITIES 13,867.69 10,373,410.00 0.00 KIM ENG SECURITIES, P.T. 586.91 133,500.00 0.00 KING, CL,& ASSOCIATES, INC 15,481.80 436,543.00 0.04 KNIGHT CLEARING SERVICES LLC 50.40 1,260.00 0.04 KNIGHT DIRECT LLC 36.00 4,614.00 0.01 KNIGHT SECURITIES 91,835.02 5,581,232.00 0.02 KNIGHT SECURITIES INTERNATIONAL 1,294.92 4,082,200.00 0.00 KNIGHT SECURITIES L.P. 6,591.94 2,680,670.00 0.00 LABRANCHEFINANCIAL SERVICES L 36,542.03 1,845,657.00 0.02 LADENBURGTHALMAN + CO 1,365.00 39,000.00 0.04 LANDESBANK BADEN WUERTTEMBERG 87.26 896.00 0.10 LARRAIN VIAL 9,198.33 653,221.00 0.01 LAZARD ASSET MANAGEMENT 5,931.34 633,204.00 0.01 LAZARD CAPITAL MARKETS LLC 4,229.39 304,127.00 0.01 LEERINK SWANN AND COMPANY 4,952.86 117,712.00 0.04 LEGENT CLEARING LLC 41.75 1,075.00 0.04 LIGHTHOUSE FINANCIAL GROUP LLC 3,012.73 86,367.00 0.03 LINK S.A CCTVM 419.43 31,374.00 0.01 LIQUIDNETASIA LIMITED 3,579.52 1,574,106.00 0.00 LIQUIDNETAUSTRALIA PTY LTD 103.08 26,192.00 0.00 LIQUIDNETEUROPE LIMITED 323.40 92,359.00 0.00 LIQUIDNETINC 27,555.77 1,334,660.00 0.02 LOOP CAPITAL MKTS LLC 47,933.11 1,932,881.00 0.02 M M WARBURG 550.82 6,366.00 0.09 M RAMSEY KING SECURITIES INC 11,703.04 408,768.00 0.03 MACQUARIEBANK LIMITED 49,581.79 3,389,411.00 0.01 MACQUARIECAPITAL (EUROPE) LTD 6,845.31 1,517,412.00 0.00 MACQUARIEEQUITIES LIMITED (SYDNEY) 28,356.83 7,170,445.00 0.00 MACQUARIEEQUITIES NEW YORK 2,599.33 97,210.00 0.03 MACQUARIEEQUITIES NEW ZEALAND 565.10 100,296.00 0.01 MACQUARIESEC NZ LTD 39.13 21,289.00 0.00 MACQUARIESECURITIES (SINGAPORE) 15,780.04 28,912,930.00 0.00 MACQUARIESECURITIES (USA) INC 727.55 16,431.00 0.04 MACQUARIESECURITIES LIMITED 150,138.78 86,558,550.00 0.00 MACQUARIESECURITIES LTD SEOUL 12,247.82 281,588.00 0.04 MAGAVCEO LEE + CO 1,345.80 44,860.00 0.03 MAGNA SECURITIES CORP 101,834.64 5,109,167.00 0.02 MEDIOBANCA SPA 6,505.42 749,196.00 0.01 MELVIN SECURITIES LLC 543.71 21,515.00 0.03 MERRILL LYNCH 7.42 29,738,706.00 0.00 MERRILL LYNCH (SINGAPORE) PTE LTD 631.91 876,000.00 0.00 MERRILL LYNCH AND CO INC 1,349.65 262,920.00 0.01 MERRILL LYNCH INTERNATIONAL 243,091.03 44,242,861.00 0.01 MERRILL LYNCH PEIRCE FENNER AND S 274,510.88 110,149,078.00 0.00 MERRILL LYNCH PIERCE FENNER + SMITH INC 144,284.07 102,863,490.55 0.00 MERRILL LYNCH PIERCE FENNER AND SMITH 4,766.74 953,342.00 0.01 MERRILL LYNCH PROFESSIONAL CLEARING CORP 2,821.61 68,785.00 0.04 MERRILL LYNCH, PIERCE FENNER SMITH 52.60 1,315.00 0.04 MERRIMAN CURHAN FORD + CO 1,114.45 24,966.00 0.04 MERRION CAPITAL GROUP 264.13 8,785.00 0.03 MF GLOBALUK LIMITED 10,925.12 693,950.00 0.02 MIDWEST RESEARCH SECURITIES 741.16 23,258.00 0.03 MIRAE ASSET HONG KONG LIMITED 302.48 68,000.00 0.00 MIRAE ASSET INVESTMENT MANAGEMENT CO LTD 2,566.98 4,363.00 0.59 MISCHLER FINANCIAL GROUP, INC-EQUITIES 38,061.30 1,831,848.00 0.02 MITSUBISHI UFJ SECURITIES (USA) 6,305.85 360,497.00 0.02 MITSUBISHI UFJ SECURITIES INT PLC 308.73 19,900.00 0.02 MIZUHO SEC ASIA LTD 4,224.34 597,300.00 0.01 MIZUHO SECURITIES USA INC 21,155.81 772,157.00 0.03 MKM PARTNERS 720.00 14,400.00 0.05 ML PROFESSIONAL CLEARING CORP 752.00 18,800.00 0.04 MONNESS, CRESPI, HARDT & CO. INC 40.80 816.00 0.05 MONTECITOADVISORS 29.60 740.00 0.04 MONTROSE SECURITIES EQUITIES 65,803.11 3,353,905.00 0.02 MONUMENT SECURITIES LIMITED 130.07 67,313.00 0.00 MORGAN KEEGAN & CO INC 9,036.32 4,786,600.00 0.00 MORGAN STANLEY 1,113.46 1,781,770.00 0.00 MORGAN STANLEY & CO. INCORPORATED/RETAIL 5,291.70 111,619,525.00 0.00 MORGAN STANLEY AND CO INTERNATIONAL 8,763.00 290,157.00 0.03 MORGAN STANLEY AND CO. INTERNATIONAL 71,133.13 50,833,475.57 0.00 MORGAN STANLEY CO INCORPORATED 806,365.27 1,383,729,190.05 0.00 MORGAN STANLEY DEAN WITTER AUSTRALIA 213.96 50,326.00 0.00 MORGAN STANLEY INTERNATIONAL LTD 123.70 5,500.00 0.02 MORGAN STANLEY SECURITIES LIMITED 6,210.90 703,292.00 0.01 MR BEAL &COMPANY 28,824.60 1,014,113.00 0.03 MSDWOR MORGAN ST CO INTL PLC 16.82 15,000.00 0.00 MULTITRADE SECURITIES LLC 488.26 12,375.00 0.04 MURIEL SIEBERT & CO, INC. 48.00 1,200.00 0.04 NATEXIS BLEICHROEDER INC 16,363.81 630,977.00 0.03 NATIONAL FINANCIAL SERVICES CORP. 19,705.73 8,558,717.00 0.00 NATIXIS SECURITIES 1,104.63 86,963.00 0.01 NBC CLEARING SERVICES INCORPORATED 4,997.37 132,005.00 0.04
NCB STOCKBROKERS LTD 924.06 176,923.00 0.01 NEEDHAM +COMPANY 8,757.39 192,963.00 0.05 NESBITT BURNS 4,081.13 5,034,860.00 0.00 NEUE ZURCHER BANK 1,098.26 2,011.00 0.55 NOMURA FINANCIAL AND INVESTMEN 1,076.62 24,270.00 0.04 NOMURA INTERNATIONAL (HONG KONG) LTD 1,981.53 4,282,000.00 0.00 NOMURA INTERNATIONAL PLC 83,268.51 11,171,902.00 0.01 NOMURA INTL (HK) LTD, SEOUL BR 7,863.62 232,561.00 0.03 NOMURA SECURITIES INTERNATIONAL INC 137,838.94 65,648,116.00 0.00 NORDEA BANK NORGE ASA 621.61 7,600.00 0.08 NORDIC PARTNERS 1,125.77 42,893.00 0.03 NORTH SOUTH CAPITAL LLC 57.80 1,410.00 0.04 NOVA CAPITAL MARKETS LLC 79.00 1,580.00 0.05 NUMIS SECURITIES INC. 21,938.75 2,078,407.00 0.01 NUMIS SECURITIES LIMITED 1,805.63 554,633.00 0.00 NUTMEG SECURITIES 2,054.00 89,900.00 0.02 NYFIX TRANSACTION SERVICES #2 1,089.39 210,924.00 0.01 NZB NEUE ZUERCHER BANK 7,843.32 87,674.00 0.09 NZB NEUE ZURCHER BANK 3,871.79 31,236.00 0.12 O NEIL, WILLIAM AND CO. INC/BCC CLRG 8,963.02 224,994.00 0.04 ODDO FINANCE 7,645.26 138,636.00 0.06 OIEN SECURITIES, INC 15,810.41 794,405.00 0.02 OLIVETREESECURITIES LIMITED 192.87 6,486.00 0.03 OPPENHEIM, SAL.,JR UND CIE KOELN 3,044.77 55,119.00 0.06 OPPENHEIMER + CO. INC. 22,841.43 4,466,302.63 0.01 ORIEL SECURITIES LTD 575.56 50,526.00 0.01 OYAK MENKUL DEGERELER A S 330.44 54,670.00 0.01 PACIFIC AMERICAN SECURITIES, LLC 91,638.24 4,487,252.00 0.02 PACIFIC CREST SECURITIES 6,612.30 190,795.00 0.03 PANMURE GORDON AND CO LTD 2,512.95 279,648.00 0.01 PAREL 5,096.41 67,868.00 0.08 PARIBAS SECURITIES INC 35,484.44 5,253,280.00 0.01 PCS DUNBAR SECURITIES 2,532.35 50,647.00 0.05 PENSERRA SECURITIES LLC 3,690.71 291,371.00 0.01 PENSON FINANCIAL SERVICES CANADA INC 15,719.94 550,562.00 0.03 PENSON FINANCIAL SERVICES INC 1,845.08 59,036.00 0.03 PERCIVAL FINANCIAL PARTNERS LTD. 5,860.00 146,500.00 0.04 PERSHING DLJ S L 155,583.82 49,961,089.00 0.00 PERSHING LLC 35,783.70 102,039,757.31 0.00 PERSHING SECURITIES LIMITED 46,019.38 1,698,525.00 0.03 PETERCAM S.A. 5,627.64 85,755.00 0.07 PICKERINGENERGY PARTNERS, INC 688.90 13,778.00 0.05 PIPELINE TRADING SYSTEMS LLC 2,658.92 454,571.00 0.01 PIPER JAFFRAY 18,610.61 6,415,286.00 0.00 PODESTA +CO 170.50 3,950.00 0.04 PRITCHARDCAPITAL PARTNERS LLC 461.00 9,220.00 0.05 PULSE TRADING LLC 57,998.54 3,039,172.00 0.02 RABOBANK INTL 395.97 5,196.00 0.08 RASHID HUSSAIN SECURITIES SDN 2,338.00 1,704,900.00 0.00 RAYMOND JAMES + ASSOCIATES INC 418.35 6,320.00 0.07 RAYMOND JAMES AND ASSOCIATES INC 24,534.05 769,768.92 0.03 RAYMOND JAMES TRUST COMPANY 5,012.61 1,575,691.00 0.00 RBC CAPITAL MARKETS 59,841.72 193,473,666.73 0.00 RBC DOMINION SECURITIES INC. 7,205.35 6,936,164.00 0.00 RBS EQUITIES (AUSTRALIA) LIMITED 4,709.57 513,007.00 0.01 RBS SECURITIES INC 22,219.09 2,297,894.00 0.01 REDBURN PARTNERS LLP 904.25 22,000.00 0.04 RENAISSANCE CAPITAL GROUP 1,133.79 36,510.00 0.03 RENAISSANCE CAPITAL LTD 224.27 75,518.00 0.00 REYNDERS,GRAY + COMPANY,INC 10,975.76 200,891.00 0.05 RIDGE CLEARING + OUTSOURCING SOLUTIONS 34,188.57 11,243,929.92 0.00 RIDGE CLEARING AND OUTSOURCING SOLUTIONS 2,239.77 1,320,790.00 0.00 ROBERTS +RYAN INVESTMENTS INC 103,575.65 5,303,372.00 0.02 ROCHDALE SEC CORP.(CLS THRU 443) 66,129.96 3,208,558.00 0.02 RODMAN & RENSHAW LLC 182.50 6,325.00 0.03 ROSENBLATT SECURITIES LLC 22,057.90 1,102,895.00 0.02 ROTH CAPITAL PARTNERS LLC 1,657.10 33,515.00 0.05 SALOMON BROS INC 216.00 1,002,500.00 0.00 SAMSUNG SECURITIES CO LTD 14,032.20 550,282.00 0.03 SAMUEL A RAMIREZ & COMPANY INC 17,513.27 1,284,713.00 0.01 SANDERS MORRIS HARRIS 4,548.60 113,050.00 0.04 SANDLER ONEILL + PART LP 345.00 11,500.00 0.03 SANFORD C. BERNSTEIN LTD 57,395.50 10,024,728.00 0.01 SANFORD CBERNSTEIN CO LLC 45,292.25 2,977,289.00 0.02 SANTANDERCENTRAL HISPANO BOLSA 320.82 14,200.00 0.02 SANTANDERINVESTMENT SECURITIES INC 53.85 10,001,077.00 0.00 SCOTIA CAPITAL (USA) INC 3,448.90 2,366,406.00 0.00 SCOTIA CAPITAL MKTS 11,087.72 371,864.00 0.03 SCOTT & STRINGFELLOW, INC 28,319.99 8,114,410.12 0.00 SEI FINANCIAL SER CO 972.00 24,300.00 0.04 SEI INVESTMENTS DISTRIBUTION CO 576.00 14,400.00 0.04 SG AMERICAS SECURITIES LLC 4,381.47 316,854.00 0.01 SG SECURITIES HK 13,713.09 6,626,298.00 0.00 SHAW STOCKBROKING LTD (SYDNEY) 210.66 171,332.00 0.00 SHORE CAPITAL STOCKBROKERS LTD 161.45 5,325.00 0.03 SIDOTI + COMPANY LLC 5,273.82 114,871.00 0.05

STATE OF CONNECTICUT, OFFICE OF THE TREASURER, DENISE L. NAPPIER 109
CONNECTICUT STATE TREASURER’S COMBINED INVESTMENT FUNDSSCHEDULE OF BROKERAGE COMMISSIONS (Continued)
FOR THE FISCAL YEAR ENDED JUNE 30, 2010
$ Shares/ Avg Broker Name Commission Par Value Comm
SIMMONS +COMPANY INTERNATIONAL 1,272.00 40,025.00 0.03 SKANDINAVISKA ENSKILDA BANK 538.97 57,215.00 0.01 SKANDINAVISKA ENSKILDA BANKEN LONDON 8,336.70 430,057.00 0.02 SOCIETE GENERALE 17,975.95 1,378,815.00 0.01 SOCIETE GENERALE BANK AND TRUST 487.55 5,270.00 0.09 SOCIETE GENERALE LONDON BRANCH 78,493.07 3,280,123.00 0.02 SOLEIL SECURITIES 5,866.75 146,775.00 0.04 SOUTHERN CROSS EQUITIES 211.62 21,877.00 0.01 SOUTHWESTSECURITIES 696.99 2,879,392.00 0.00 SOUTHWESTSECURITIES, INC. 2,086.00 17,089,834.40 0.00 SPEAR, LEEDS AND KELLOGG 148.88 25,766.00 0.01 STANDARD CHARTERED BANK (HONG KONG) LIMI 12,034.83 2,662,400.00 0.00 STANLEY (CHARLES) + CO LIMITED 186.95 92,752.00 0.00 STATE STREET BANK + TRUST CO LONDON 143,044.91 9,508,972.00 0.02 STATE STREET GLOBAL MARKETS 101,740.00 5,415,000.00 0.02 STATE STREET GLOBAL MARKETS, LLC 19,353.70 1,139,148.00 0.02 STEPHENS,INC. 3,887.22 11,055,754.90 0.00 STERNE AGEE & LEACH INC. 1,618.71 1,202,480.00 0.00 STIFEL NICOLAUS + CO INC 29,592.47 29,239,726.36 0.00 STUART FRANKEL + CO INC 14,377.07 751,602.00 0.02 STUDNESS RESEARCH 1,029.00 37,400.00 0.03 STURDIVANT + CO INC 309.00 10,300.00 0.03 SUNTRUST CAPITAL MARKETS, INC. 11,796.48 425,116.00 0.03 SVENSKA HANDELSBANKEN 15,245.61 818,736.00 0.02 SVENSKA HANDELSBANKEN LONDON BRANCH 4,626.78 161,827.00 0.03 SWAP BROKER 7,336.72 85,074,843.00 0.00 SWEDBANK 2,698.37 104,828.00 0.03 TD WATERHOUSE CDA 2,220.03 11,411,708.00 0.00 TEB YATIRIM MENKUL DEGERLER A.S. 1,374.64 122,500.00 0.01 THE BENCHMARK COMPANY, LLC 413.65 8,613.00 0.05 THE ROYALBANK OF SCOTLAND N.V.UK EQUITI 50,781.57 7,517,675.00 0.01 THEMIS TRADING LLC 47,467.87 2,482,760.00 0.02 THINKEQUITY PARTNERS LLC 4,724.19 103,666.00 0.05 THINKEQUITY PARTNERS, LLC 60.00 2,000.00 0.03 THOMAS WEISEL PARTNERS LLC 47,062.40 1,979,036.00 0.02 TORONTO DOMINION BANK 1,108.30 610,709.00 0.00 TROIKA DIALOG USA, INC 2,108.54 163,525.00 0.01 UBS AG 299,451.32 152,822,570.63 0.00 UBS AG LONDON 84,592.90 167,067,287.00 0.00 UBS SECS LLC/EQUITIES,NY 2,480.73 5,550.00 0.45 UBS SECURITIES ASIA LTD 139,851.66 70,470,362.00 0.00 UBS SECURITIES CANADA INC 2,544.03 96,780.00 0.03 UBS SECURITIES LLC 219,901.87 299,667,475.22 0.00 UBS SECURITIES PTE.LTD., SEOUL 32,280.01 195,179.00 0.17 UBS SECURITIES SINGAPORE PTE 6,767.42 12,748,190.00 0.00 UBS WARBURG (HONG KONG) LIMITED 2,180.57 233,200.00 0.01 UBS WARBURG AUSTRALIA EQUITIES 406.44 12,203.00 0.03 UBS WARBURG LLC 81,464.27 6,086,179.00 0.01 UNICREDITSPA 38.83 1,833.00 0.02 UNX INC. 9,670.31 507,601.00 0.02 UOB KAY HIAN (HONG KONG) LTD 858.66 879,670.00 0.00 UOB KAY HIAN PTE LIMITED 9,797.16 1,039,597.00 0.01 UOB KAY HIAN SECURITIES 5,977.12 1,888,850.00 0.00 UOB KAY HIAN SECURITIES PT 4,897.93 11,230,000.00 0.00 UTENDAHL CAPITAL PARTNERS 188.00 4,700.00 0.04 VANDHAM SECURITIES CORP 8,297.64 207,441.00 0.04 VICKERS BALLAS TAMARA PT 2,586.66 9,450,000.00 0.00 VTB BANK EUROPE PLC 1,653.87 475,969.00 0.00 W.J. BONFANTI INC 3.08 154.00 0.02 WACHOVIACAPITAL MARKETS, LLC 36,999.27 11,815,244.00 0.00 WEDBUSH MORGAN SECURITIES INC 9,944.19 16,508,400.73 0.00 WEEDEN + CO. 119,168.71 8,248,490.00 0.01 WELLS FARGO INVT LLC 574.75 10,703.00 0.05 WILLIAM BLAIR & COMPANY L.L.C 19,791.97 461,508.00 0.04 WILLIAMS CAPITAL GROUP LP (THE) 51,338.93 2,571,276.00 0.02 WINTERFLOOD SECURITIES LTD 237.71 50,000.00 0.00 WOOD AND COMPANY 3,444.60 46,627.00 0.07 WOORI INVESTMENT SECURITIES 7,130.59 120,800.00 0.06 YAMNER & CO INC (CLS THRU 443) 6,425.09 641,573.00 0.01 YUANTA CORE PACIFIC SECURITIES 338.18 84,000.00 0.00 ZANNEX SECURITIES 117.78 19,586.00 0.01
TOTAL $14,385,489.29

110 COMBINED INVESTMENT FUNDS 2010 COMPREHENSIVE FINANCIAL ANNUAL REPORT
CONNECTICUT STATE TREASURER’S COMBINED INVESTMENT FUNDSSCHEDULE OF NET ASSETS BY INVESTMENT FUND
JUNE 30, 2010
MUTUAL CORE INFLATION EMERGING LIQUIDITY EQUITY FIXED INCOME LINKED BOND MARKET DEBT FUND FUND FUND FUND FUND ASSETS Investments in Securities , at Fair Value Liquidity Fund $ - $45,038,142 $126,859,828 $40,960,160 $50,151,134 Cash Equivalents 1,639,611,001 - - - 100,000 Asset Backed Securities 42,554,779 - 32,251,192 - - Government Securities 361,204,296 - 779,359,724 1,029,700,712 648,990,654 Government Agency Securities 23,140,094 - 811,238,771 - - Mortgage Backed Securities 10,124,847 - 304,081,637 - 202,701 Corporate Debt 137,469,391 - 735,272,491 - 182,486,978 Convertible Securities - - - - - Common Stock - 4,407,035,856 - - - Preferred Stock - - - - - Real Estate Investment Trust - 71,138,098 - - - Mutual Fund - 482,022,115 542,300 - 273,420,146 Limited Liability Corporation - - - - - Trusts - - - - - Limited Partnerships - 283,619,355 - - - Annuities - - - - - Total Investments in Securities, at Fair Value 2,214,104,408 5,288,853,566 2,789,605,943 1,070,660,872 1,155,351,613 Cash 9,233 - - 2,414 6,700,024 Receivables Foreign Exchange Contracts 529,002,409 - 8,971,425 - 200,823,578 Interest Receivable 3,908,398 6,227 22,126,985 8,225,278 16,814,018 Dividends Receivable - 5,214,814 - - - Due from Brokers - 18,216,606 200,605,856 - 4,926,560 Foreign Taxes - 35,996 62,244 - 773,454 Securities Lending Receivable - 156,747 124,013 141,338 10,945 Reserve for Doubtful Receivables - (1,901) (640,030) - (294,154) Total Receivables 532,910,807 23,628,489 231,250,493 8,366,616 223,054,401
Invested Securities Lending Collateral - 510,652,476 698,087,873 917,540,821 47,249,947 Other Funds on Deposit - - - - - Prepaid Expenses - - - - - Total Assets 2,747,024,448 5,823,134,531 3,718,944,309 1,996,570,723 1,432,355,985 LIABILITIES Payables Foreign Exchange Contracts 523,130,133 - 8,756,726 - 200,949,969 Due to Brokers 4,302,812 20,993,419 309,694,880 15,850,448 7,045,386 Income Distribution 26,490 - - - - Other Payable - 120,569 488 - - Total Payables 527,459,435 21,113,988 318,452,094 15,850,448 207,995,355 Securities Lending Collateral - 510,652,476 698,087,873 917,540,821 47,249,947 Accrued Expenses 684,044 2,276,371 958,133 289,954 1,248,315 Total Liabilities 528,143,479 534,042,835 1,017,498,100 933,681,223 256,493,617 NET ASSETS HELD IN TRUST FOR PARTICIPANTS $2,218,880,969 $5,289,091,696 $2,701,446,209 $1,062,889,500 $1,175,862,368 Units Outstanding 2,214,775,395 7,275,474 22,919,294 7,733,564 9,150,803 Net Asset Value and Redemption Price per Unit $1.00 $726.98 $117.87 $137.44 $128.50

STATE OF CONNECTICUT, OFFICE OF THE TREASURER, DENISE L. NAPPIER 111
CONNECTICUT STATE TREASURER’S COMBINED INVESTMENT FUNDSSCHEDULE OF NET ASSETS BY INVESTMENT FUND
JUNE 30, 2010
DEVELOPED EMERGING HIGH YIELD- MARKET MARKET REAL COMMERCIAL PRIVATE
DEBT INTERNATIONAL INTERNATIONAL ESTATE MORTGAGE INVESTMENT ELIMINATION FUND STOCK FUND STOCK FUND FUND FUND FUND ENTRY TOTAL
$24,439,960 $91,745,456 $27,896,128 $77,173,211 $160,894 $108,497,236 $(592,922,149) $ - - 942,566 - - - - - 1,640,653,567 16,493,071 - - - - - - 91,299,042 4,455,831 - - - - - - 2,823,711,217 - - - - - - - 834,378,865 8,564,348 - - - 193,054 - - 323,166,587 548,301,512 186,814 - - - - - 1,603,717,186 41,527,750 656,347 - - - - - 42,184,097 9,745,529 4,142,927,367 1,781,086,082 - 3,464,167 194,333 - 10,344,453,334 2,404,603 18,359,743 48,132,944 - - - - 68,897,290 243,120 27,474,536 - - - - - 98,855,754 - 46,158,108 208,140,803 - - - - 1,010,283,472 - - - - - 4,238,959 - 4,238,959 - - - 2,708,893 - - - 2,708,893 - - - 712,601,117 - 1,900,170,670 - 2,896,391,142 - - - - - - - -
656,175,724 4,328,450,937 2,065,255,957 792,483,221 3,818,115 2,013,101,198 (592,922,149) 21,784,939,405 - 28,837,505 4,674,123 - - - (9,233) 40,214,066 - 4,393,045 4,031,556,305 2,470,683 - - - (529,002,409) 4,248,215,036 12,934,828 20,316 2,122 - 62 3 13,086,445 77,124,682 17,268 7,598,438 6,980,614 - - - - 19,811,134 26,845,726 28,490,983 5,456,638 - - - - 284,542,369 1,205 9,655,776 139,496 - - - - 10,668,171 39,896 467,915 91,779 - - - - 1,032,633 (611,040) (766,395) (11,077) - - - - (2,324,597) 43,620,928 4,077,023,338 15,130,255 - 62 3 (515,915,964) 4,639,069,428
146,986,690 349,378,453 142,058,580 - - - - 2,811,954,840 - - - - - - - - - - - - 8,266 3,369,724 - 3,377,990 846,783,342 8,783,690,233 2,227,118,915 792,483,221 3,826,443 2,016,470,925 (1,108,847,346) 29,279,555,729 4,380,079 3,965,387,755 2,470,108 - - - (523,130,133) 4,181,944,637 1,548,934 28,321,136 5,404,397 - - - (4,302,812) 388,858,600 - - - - - - 58,198 84,688 439,296 - - 8,129,912 - 2,620,912 - 11,311,177 6,368,309 3,993,708,891 7,874,505 8,129,912 - 2,620,912 (527,374,747) 4,582,199,102 146,986,690 349,378,453 142,058,580 - - - - 2,811,954,840 663,844 5,642,325 4,021,258 524,328 - 3,715 (500,862) 15,811,425 154,018,843 4,348,729,669 153,954,343 8,654,240 - 2,624,627 (527,875,609) 7,409,965,367
$692,764,499 $4,434,960,564 $2,073,164,572 $783,828,981 $3,826,443 $2,013,846,298 $(580,971,737) $21,869,590,362 6,093,481 15,004,114 6,325,412 25,784,009 78,886 40,577,585 $113.69 $295.58 $327.75 $30.40 $48.51 $49.63

112 COMBINED INVESTMENT FUNDS 2010 COMPREHENSIVE FINANCIAL ANNUAL REPORT
CONNECTICUT STATE TREASURER’S COMBINED INVESTMENT FUNDS
SCHEDULE OF CHANGES IN NET ASSETS BY INVESTMENT FUNDFOR THE FISCAL YEAR ENDED JUNE 30, 2010
MUTUAL CORE INFLATION EMERGING LIQUIDITY EQUITY FIXED INCOME LINKED BOND MARKET DEBT FUND FUND FUND FUND FUND ADDITIONS OPERATIONS Investment Income Dividends $ - $88,910,121 $37,103 $ - $7,100,299 Interest 18,673,154 955,780 124,264,831 33,200,382 84,874,231 Other Income - 4,709,232 706,117 - - Securities Lending - 6,397,444 3,562,763 4,199,924 197,765 Total Income 18,673,154 100,972,577 128,570,814 37,400,306 92,172,295 Expenses Investment Advisory Fees 2,892,287 10,744,251 3,499,757 901,014 4,544,477 Custody and Transfer Agent Fees - 592,083 240,034 88,901 105,570 Professional Fees 92,550 385,394 151,501 47,887 59,984 Security Lending Fees - 942,176 447,671 494,268 28,462 Security Lending Rebates - 921,876 1,185,704 1,628,574 42,543 Investment Expenses 106,429 35,539 50,550 9,461 46,200 Total Expenses 3,091,266 13,621,319 5,575,217 3,170,105 4,827,236 Net Investment Income 15,581,888 87,351,258 122,995,597 34,230,201 87,345,059 Net Realized Gain (Loss) 1,398,777 146,422,841 (85,671,834) 28,198,333 54,206,617 Net Change in Unrealized Gain/(Loss) on Investments and Foreign Currency 2,448,634 544,793,180 292,061,850 21,323,807 101,685,851 Net Increase (Decrease) in Net Assets Resulting from Operations 19,429,299 778,567,279 329,385,613 83,752,341 243,237,527 Unit Transactions Purchase of Units by Participants 3,308,833,684 - - 162,500,000 - TOTAL ADDITIONS 3,328,262,983 778,567,279 329,385,613 246,252,341 243,237,527 DEDUCTIONS Administrative Expenses Salary and Fringe Benefi ts (189,778) (1,211,943) (348,358) (142,968) (173,529) Distributions to Unit Owners Income Distributed (16,790,887) (93,114,520) (136,994,857) (20,312,559) (47,140,193) Unit Transactions Redemption of Units by Participants (3,263,630,115) (985,500,000) (650,500,000) (150,000) (151,900,000) TOTAL DEDUCTIONS (3,280,610,780) (1,079,826,463) (787,843,215) (20,605,527) (199,213,722) Change in Net Assets Held in Trust for Participants 47,652,203 (301,259,184) (458,457,602) 225,646,814 44,023,805 Net Assets- Beginning of Period 2,171,228,766 5,590,350,880 3,159,903,811 837,242,686 1,131,838,563 Net Assets- End of Period $2,218,880,969 $5,289,091,696 $2,701,446,209 $1,062,889,500 $1,175,862,368 Other Information: Units Purchased 12,644,875,668 - - 1,197,687 - Redeemed (12,603,477,742) (1,347,647) (5,661,321) (1,171) (1,263,797) Net Increase (Decrease) 41,397,926 (1,347,647) (5,661,321) 1,196,516 (1,263,797)

STATE OF CONNECTICUT, OFFICE OF THE TREASURER, DENISE L. NAPPIER 113
CONNECTICUT STATE TREASURER’S COMBINED INVESTMENT FUNDS
SCHEDULE OF CHANGES IN NET ASSETS BY INVESTMENT FUND (Continued)FOR THE FISCAL YEAR ENDED JUNE 30, 2010
DEVELOPED EMERGING HIGH YIELD- MARKET MARKET REAL COMMERCIAL PRIVATE
DEBT INTERNATIONAL INTERNATIONAL ESTATE MORTGAGE INVESTMENT ELIMINATION FUND STOCK FUND STOCK FUND FUND FUND FUND ENTRY TOTAL
$282,352 $126,496,894 $46,751,825 $23,136,047 $401,965 $124,291,666 $ - $417,408,272 65,514,621 1,899,449 733,623 561,298 741 1,544,075 (8,177,167) 324,045,018 19,119 159,831 13,806 - - - - 5,608,105 846,690 6,768,954 1,452,689 - - - - 23,426,229 66,662,782 135,325,128 48,951,943 23,697,345 402,706 125,835,741 (8,177,167) 770,487,624 2,544,771 22,085,148 12,333,677 3,100,126 37,125 8,323,349 (1,266,562) 69,739,420 67,120 473,622 210,474 67,787 445 173,802 - 2,019,838 39,049 269,350 98,187 470,006 262 1,170,788 (40,529) 2,744,429 125,269 1,041,161 224,476 - - - - 3,303,483 144,344 344,222 116,426 - - - - 4,383,689 9,828 302,349 1,064,587 12,918 89 19,091 (46,606) 1,610,435 2,930,381 24,515,852 14,047,827 3,650,837 37,921 9,687,030 (1,353,697) 83,801,294 63,732,401 110,809,276 34,904,116 20,046,508 364,785 116,148,711 (6,823,470) 686,686,330 22,294,432 110,381,007 169,221,914 (63,080,704) 419 (168,334,674) (612,539) 214,424,589 80,344,795 302,435,776 173,923,657 (131,384,936) (1,691) 351,373,634 (1,343,434) 1,737,661,123 166,371,628 523,626,059 378,049,687 (174,419,132) 363,513 299,187,671 (8,779,443) 2,638,772,042 - - 575,000,000 202,788,350 - 180,455,000 (782,526,824) 3,647,050,210 166,371,628 523,626,059 953,049,687 28,369,218 363,513 479,642,671 (791,306,267) 6,285,822,252 (123,172) (794,406) (316,026) (311,138) (16,490) (291,075) 83,106 (3,835,777) (56,649,900) (83,870,390) (25,395,091) (13,884,655) (390,812) (92,097,306) 7,352,901 (579,288,269) (150,000,000) (419,900,000) (1,500,000) - (1,267,000) - 1,409,072,987 (4,215,274,128) (206,773,072) (504,564,796) (27,211,117) (14,195,793) (1,674,302) (92,388,381) 1,416,508,994 (4,798,398,174)
(40,401,444) 19,061,263 925,838,570 14,173,425 (1,310,789) 387,254,290 625,202,727 1,487,424,078 733,165,943 4,415,899,301 1,147,326,002 769,655,556 5,137,232 1,626,592,008 (1,206,174,464) 20,382,166,284 $692,764,499 $4,434,960,564 $2,073,164,572 $783,828,981 $3,826,443 $2,013,846,298 $(580,971,737) $21,869,590,362 - - 1,998,863 5,924,671 - 3,970,176 (1,351,154) (1,309,307) (4,199) - (24,940) - (1,351,154) (1,309,307) 1,994,664 5,924,671 (24,940) 3,970,176

114 COMBINED INVESTMENT FUNDS 2010 COMPREHENSIVE FINANCIAL ANNUAL REPORT
CONNECTICUT STATE TREASURER’S COMBINED INVESTMENT FUNDS
SCHEDULE OF CHANGES IN NET ASSETS BY INVESTMENT FUNDFOR THE FISCAL YEAR ENDED JUNE 30, 2009
MUTUAL CORE INFLATION EMERGING LIQUIDITY EQUITY FIXED INCOME LINKED BOND MARKET DEBT FUND FUND FUND FUND FUND ADDITIONS OPERATIONS Investment Income Dividends $ - $ 136,986,761 $ 2,416,239 $ - $ 25,241,007 Interest 34,435,214 1,094,293 171,793,662 12,472,336 75,342,282 Other Income - 4,740,295 3,584,612 15,149 - Securities Lending - 23,059,408 11,744,830 13,172,181 517,333 Total Income 34,435,214 165,880,757 189,539,343 25,659,666 101,100,622 Expenses Investment Advisory Fees 571,942 7,729,408 4,595,441 944,154 3,241,988 Custody and Transfer Agent Fees 1,000 500 - - - Professional Fees 61,477 428,461 201,704 60,170 53,434 Security Lending Fees - 2,111,513 980,091 1,258,955 40,097 Security Lending Rebates - 8,729,527 5,529,129 5,290,231 261,329 Investment Expenses - 200,046 47,959 - 108,409 Total Expenses 634,419 19,199,455 11,354,324 7,553,510 3,705,257 Net Investment Income 33,800,795 146,681,302 178,185,019 18,106,156 97,395,365 Net Realized Gain (Loss) (118,002) (1,527,195,580) (55,634,344) (33,431,634) (77,667,777) Net Change in Unrealized Gain/(Loss) on Investments and Foreign Currency (1,571,310) (885,144,418) (56,799,550) 6,044,613 (61,696,680) Net Increase (Decrease) in Net Assets Resulting from Operations 32,111,483 (2,265,658,696) 65,751,125 (9,280,865) (41,969,092) Unit Transactions Purchase of Units by Participants 4,262,166,388 - - - 177,000,000 TOTAL ADDITIONS 4,294,277,871 (2,265,658,696) 65,751,125 (9,280,865) 135,030,908 DEDUCTIONS Administrative Expenses Salary and Fringe Benefi ts (143,452) (1,042,522) (403,141) (133,576) (113,176) Distributions to Unit Owners Income Distributed (33,539,341) (142,409,677) (206,684,638) (26,128,284) (45,615,798) Unit Transactions Redemption of Units by Participants (4,251,018,707) - (1,235,821,000) (300,000,000) (4,798,000) TOTAL DEDUCTIONS (4,284,701,500) (143,452,199) (1,442,908,779) (326,261,860) (50,526,974) Change in Net Assets Held in Trust for Participants 9,576,371 (2,409,110,895) (1,377,157,654) (335,542,725) 84,503,934 Net Assets- Beginning of Period 2,161,652,395 7,999,461,775 4,537,061,465 1,172,785,411 1,047,334,629 Net Assets- End of Period $2,171,228,766 $5,590,350,880 $3,159,903,811 $837,242,686 $1,131,838,563 Other Information: Units Purchased 4,262,166,388 - - - 1,650,096 Redeemed (4,251,018,707) - (11,267,665) (2,402,691) (53,227) Net Increase (Decrease) 11,147,681 - (11,267,665) (2,402,691) 1,596,869
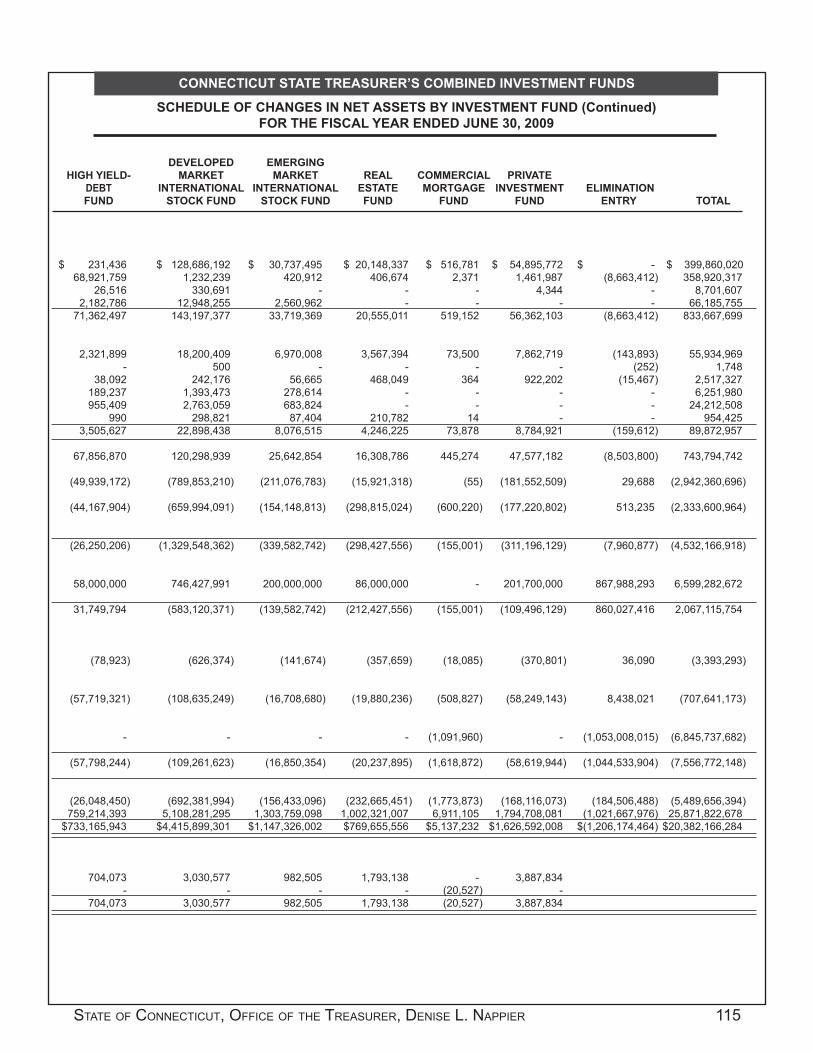
STATE OF CONNECTICUT, OFFICE OF THE TREASURER, DENISE L. NAPPIER 115
CONNECTICUT STATE TREASURER’S COMBINED INVESTMENT FUNDS
SCHEDULE OF CHANGES IN NET ASSETS BY INVESTMENT FUND (Continued)FOR THE FISCAL YEAR ENDED JUNE 30, 2009
DEVELOPED EMERGING HIGH YIELD- MARKET MARKET REAL COMMERCIAL PRIVATE
DEBT INTERNATIONAL INTERNATIONAL ESTATE MORTGAGE INVESTMENT ELIMINATION FUND STOCK FUND STOCK FUND FUND FUND FUND ENTRY TOTAL
$ 231,436 $ 128,686,192 $ 30,737,495 $ 20,148,337 $ 516,781 $ 54,895,772 $ - $ 399,860,020 68,921,759 1,232,239 420,912 406,674 2,371 1,461,987 (8,663,412) 358,920,317 26,516 330,691 - - - 4,344 - 8,701,607 2,182,786 12,948,255 2,560,962 - - - - 66,185,755 71,362,497 143,197,377 33,719,369 20,555,011 519,152 56,362,103 (8,663,412) 833,667,699 2,321,899 18,200,409 6,970,008 3,567,394 73,500 7,862,719 (143,893) 55,934,969 - 500 - - - - (252) 1,748 38,092 242,176 56,665 468,049 364 922,202 (15,467) 2,517,327 189,237 1,393,473 278,614 - - - - 6,251,980 955,409 2,763,059 683,824 - - - - 24,212,508 990 298,821 87,404 210,782 14 - - 954,425 3,505,627 22,898,438 8,076,515 4,246,225 73,878 8,784,921 (159,612) 89,872,957 67,856,870 120,298,939 25,642,854 16,308,786 445,274 47,577,182 (8,503,800) 743,794,742 (49,939,172) (789,853,210) (211,076,783) (15,921,318) (55) (181,552,509) 29,688 (2,942,360,696) (44,167,904) (659,994,091) (154,148,813) (298,815,024) (600,220) (177,220,802) 513,235 (2,333,600,964) (26,250,206) (1,329,548,362) (339,582,742) (298,427,556) (155,001) (311,196,129) (7,960,877) (4,532,166,918) 58,000,000 746,427,991 200,000,000 86,000,000 - 201,700,000 867,988,293 6,599,282,672 31,749,794 (583,120,371) (139,582,742) (212,427,556) (155,001) (109,496,129) 860,027,416 2,067,115,754 (78,923) (626,374) (141,674) (357,659) (18,085) (370,801) 36,090 (3,393,293) (57,719,321) (108,635,249) (16,708,680) (19,880,236) (508,827) (58,249,143) 8,438,021 (707,641,173) - - - - (1,091,960) - (1,053,008,015) (6,845,737,682) (57,798,244) (109,261,623) (16,850,354) (20,237,895) (1,618,872) (58,619,944) (1,044,533,904) (7,556,772,148)
(26,048,450) (692,381,994) (156,433,096) (232,665,451) (1,773,873) (168,116,073) (184,506,488) (5,489,656,394) 759,214,393 5,108,281,295 1,303,759,098 1,002,321,007 6,911,105 1,794,708,081 (1,021,667,976) 25,871,822,678 $733,165,943 $4,415,899,301 $1,147,326,002 $769,655,556 $5,137,232 $1,626,592,008 $(1,206,174,464) $20,382,166,284 704,073 3,030,577 982,505 1,793,138 - 3,887,834 - - - - (20,527) - 704,073 3,030,577 982,505 1,793,138 (20,527) 3,887,834

116 COMBINED INVESTMENT FUNDS 2010 COMPREHENSIVE FINANCIAL ANNUAL REPORT
CONNECTICUT STATE TREASURER’S COMBINED INVESTMENT FUNDS
COMBINED INVESTMENT FUNDSSCHEDULE OF INVESTMENT ACTIVITY BY PENSION PLAN
FOR THE FISCAL YEAR ENDING JUNE 30, 2010
MUTUAL CORE INFLATION EMERGING LIQUIDITY EQUITY FIXED INCOME LINKED BOND MARKET DEBT FUND FUND FUND FUND FUND Teachers’ Retirement Fund Book Value at June 30, 2009 $601,371,211 $1,065,529,266 $1,585,132,229 $396,310,624 $637,484,209 Market Value at June 30, 2009 $600,827,585 $3,162,911,966 $1,647,520,615 $409,901,381 $623,777,296 Shares Purchased 1,601,014,944 - - 107,820,000 - Shares Redeemed (1,222,100,130) (562,200,000) (326,349,000) (150,000) (76,640,000) Returns of Capital - - - - - Gain/(Loss) on Shares Redeemed 1,324,479 394,390,612 24,091,498 4,972 6,175,641 Net Investment Income Earned 6,749,887 52,653,639 71,846,187 10,140,706 26,258,926 Net Investment Income Distributed (6,749,887) (52,653,639) (71,846,187) (10,140,706) (26,258,926) Changes in Market Value of Fund Shares (777,105) (6,915,587) 76,222,324 31,346,615 102,702,142
Market Value at June 30, 2010 $980,289,773 $2,988,186,991 $1,421,485,437 $548,922,968 $656,015,079
Book Value at June 30, 2010 $981,610,504 $897,719,878 $1,282,874,727 $503,985,596 $567,019,850
Shares Outstanding 978,475,979 4,110,437 12,060,001 3,993,953 5,105,245
Market Value per Share $1.00 $726.98 $117.87 $137.44 $128.50 State Employees’ Retirement Fund Book Value at June 30, 2009 $279,531,124 $612,494,866 $1,058,244,987 $277,633,554 $417,713,694 Market Value at June 30, 2009 $279,284,499 $2,083,109,849 $1,102,708,090 $289,586,326 $414,145,861 Shares Purchased 762,136,222 - - 40,000,000 - Shares Redeemed (549,586,900) (364,300,000) (253,340,000) - (64,750,000) Returns of Capital - - - - - Gain/(Loss) on Shares Redeemed 715,555 269,240,141 19,572,916 - 5,369,559 Net Investment Income Earned 3,577,764 34,703,926 46,961,454 6,862,984 16,918,267 Net Investment Income Distributed (3,577,764) (34,703,926) (46,961,454) (6,862,984) (16,918,267) Changes in Market Value of Fund Shares (272,548) (14,669,781) 46,954,985 21,692,652 65,300,218
Market Value at Jun 30, 2010 $492,276,828 $1,973,380,209 $915,895,991 $351,278,978 $420,065,638
Book Value at June 30, 2010 492,796,001 517,435,007 824,477,903 317,633,554 358,333,253
Shares Outstanding 491,365,983 2,714,507 7,770,538 2,555,899 3,269,037 Market Value per Share $1.00 $726.98 $117.87 $137.44 $128.50 Municipal Employees’ Retirement Fund Book Value at June 30, 2009 $69,668,966 $82,332,337 $284,999,955 $114,224,641 $76,995,683 Market Value at June 30, 2009 $69,606,721 $286,240,301 $294,261,605 $115,978,170 $74,193,368 Shares Purchased 132,938,420 - - 11,500,000 - Shares Redeemed (56,114,554) (50,400,000) (59,796,000) - (8,900,000) Returns of Capital - - - - - Gain/(Loss) on Shares Redeemed 101,515 37,546,297 4,017,314 - 526,394 Net Investment Income Earned 870,335 4,767,885 12,743,670 2,776,266 3,113,843 Net Investment Income Distributed (870,335) (4,767,885) (12,743,670) (2,776,266) (3,113,843) Changes in Market Value of Fund Shares (14,137) (2,519,128) 13,828,276 8,621,089 12,364,258
Market Value at Jun 30, 2010 $146,517,965 $270,867,470 $252,311,195 $136,099,259 $78,184,020
Book Value at June 30, 2010 146,594,347 69,478,634 229,221,269 125,724,641 68,622,077
Shares Outstanding 146,246,866 372,595 2,140,629 990,256 608,444
Market Value per Share $1.00 $726.98 $117.87 $137.44 $128.50

STATE OF CONNECTICUT, OFFICE OF THE TREASURER, DENISE L. NAPPIER 117
CONNECTICUT STATE TREASURER’S COMBINED INVESTMENT FUNDSCOMBINED INVESTMENT FUNDS
SCHEDULE OF INVESTMENT ACTIVITY BY PENSION PLAN (Continued)FOR THE FISCAL YEAR ENDING JUNE 30, 2010
DEVELOPED EMERGING HIGH YIELD MARKET MARKET REAL COMMERCIAL PRIVATE DEBT INTERNATIONAL INTERNATIONAL ESTATE MORTGAGE INVESTMENT FUND STOCK FUND STOCK FUND FUND FUND FUND TOTAL
$429,429,053 $2,161,823,166 $404,996,878 $644,635,686 $4,237,586 $1,534,511,271 $9,465,461,178 $408,703,567 $2,544,193,415 $645,686,803 $433,701,795 $2,801,732 $916,655,606 $11,396,681,762 - - 326,864,000 113,868,800 - 103,761,100 2,253,328,844 (85,571,095) (251,905,000) (1,500,000) - (690,994) - (2,527,106,219) - - - - - - - 5,785,832 70,381,253 639,458 - (326,928) - 502,466,817 31,467,764 48,147,276 14,305,278 7,809,802 213,140 51,805,776 321,398,381 (31,467,764) (48,147,276) (14,305,278) (7,809,802) (213,140) (51,805,776) (321,398,381) 55,234,627 182,203,312 197,536,983 (106,076,318) 303,037 116,404,206 648,184,236
$384,152,931 $2,544,872,980 $1,169,227,244 $441,494,277 $2,086,847 $1,136,820,912 $12,273,555,439
$349,643,790 $1,980,299,419 $731,000,336 $758,504,486 $3,219,664 $1,638,272,371 $9,694,150,621
3,378,967 8,609,674 3,567,418 14,522,929 43,023 22,906,141 1,056,773,768
$113.69 $295.58 $327.75 $30.40 $48.51 $49.63 $285,750,721 $1,265,854,419 $253,049,266 $416,435,047 $2,969,182 $1,008,857,699 $5,878,534,559 $261,829,983 $1,612,683,866 $414,859,773 $276,024,130 $1,973,645 $584,637,690 $7,320,843,712 - - 212,848,000 74,550,400 - 64,250,100 1,153,784,722 (53,828,060) (146,200,000) - - (486,762) - (1,432,491,722) - - - - - - - 1,733,598 50,011,572 - - (226,469) - 346,416,872 20,232,184 30,767,826 9,208,195 5,006,620 150,143 33,253,636 207,642,999 (20,232,184) (30,767,826) (9,208,195) (5,006,620) (150,143) (33,253,636) (207,642,999) 37,420,267 110,673,467 127,104,836 (68,020,750) 209,651 74,660,721 401,053,718
$247,155,788 $1,627,168,905 $754,812,609 $282,553,780 $1,470,065 $723,548,511 $7,789,607,302
233,656,259 1,169,665,991 465,897,266 490,985,447 2,255,951 1,073,107,799 5,946,244,431
2,173,955 5,504,948 2,303,001 9,294,591 30,307 14,578,993 541,561,761
$113.69 $295.58 $327.75 $30.40 $48.51 $49.63 $51,351,295 $151,603,090 $47,634,043 $75,532,874 $461,805 $178,187,322 $1,132,992,011 $46,996,607 $223,428,802 $74,879,338 $51,106,840 $309,151 $108,094,611 $1,345,095,513 - - 30,814,000 12,562,400 - 11,297,000 199,111,820 (9,102,523) (17,250,000) - - (76,248) - (201,639,325) - - - - - - - 280,933 7,435,895 - - (34,684) - 49,873,664 3,660,713 4,285,338 1,625,631 913,764 23,519 6,091,534 40,872,498 (3,660,713) (4,285,338) (1,625,631) (913,764) (23,519) (6,091,534) (40,872,498) 6,758,334 14,565,993 23,335,533 (12,409,208) 32,052 13,616,319 78,179,381
$44,933,351 $228,180,690 $129,028,871 $51,260,032 $230,271 $133,007,930 $1,470,621,054
42,529,705 141,788,985 78,448,043 88,095,274 350,873 189,484,322 1,180,338,170
395,229 771,968 393,679 1,686,196 4,747 2,680,016 156,290,625
$113.69 $295.58 $327.75 $30.40 $48.51 $49.63

118 COMBINED INVESTMENT FUNDS 2010 COMPREHENSIVE FINANCIAL ANNUAL REPORT
CONNECTICUT STATE TREASURER’S COMBINED INVESTMENT FUNDSCOMBINED INVESTMENT FUNDS
SCHEDULE OF INVESTMENT ACTIVITY BY PENSION PLAN (Continued)FOR THE FISCAL YEAR ENDING JUNE 30, 2010
MUTUAL CORE INFLATION EMERGING LIQUIDITY EQUITY FIXED INCOME LINKED BOND MARKET DEBT FUND FUND FUND FUND FUND Probate Court Retirement Fund Book Value at June 30, 2009 $4,685,213 $4,025,351 $13,107,887 $4,550,209 $3,763,953 Market Value at June 30, 2009 $4,680,899 $14,435,746 $13,898,180 $4,634,219 $3,682,044 Shares Purchased 5,453,694 - - 1,660,000 - Shares Redeemed (3,500,234) (2,500,000) (2,364,000) - (470,000) Returns of Capital - - - - - Gain/(Loss) on Shares Redeemed 7,600 1,879,957 214,789 - 33,407 Net Investment Income Earned 42,910 240,404 617,827 124,240 153,436 Net Investment Income Distributed (42,910) (240,404) (617,827) (124,240) (153,436) Changes in Market Value of Fund Shares 3,983 (121,493) 638,318 359,458 603,124
Market Value at June 30, 2010 $6,645,942 $13,694,210 $12,387,287 $6,653,677 $3,848,575
Book Value at June 30, 2010 6,646,273 3,405,308 10,958,676 6,210,209 3,327,360
Shares Outstanding 6,633,642 18,837 105,095 48,412 29,950
Market Value per Share $1.00 $726.98 $117.87 $137.44 $128.50 Judges’ Retirement Fund Book Value at June 30, 2009 $6,598,973 $13,491,385 $32,915,860 $13,389,682 $8,433,783 Market Value at June 30, 2009 $6,593,172 $31,279,920 $33,511,252 $13,563,243 $8,062,467 Shares Purchased 19,376,968 - - 1,520,000 - Shares Redeemed (18,008,296) (6,100,000) (8,651,000) - (1,140,000) Returns of Capital - - - - - Gain/(Loss) on Shares Redeemed 13,035 3,796,838 489,832 - 63,988 Net Investment Income Earned 62,857 519,631 1,394,263 326,615 334,424 Net Investment Income Distributed (62,857) (519,631) (1,394,263) (326,615) (334,424) Changes in Market Value of Fund Shares (7,346) 111,348 1,517,942 1,010,391 1,330,173
Market Value at Jun 30, 2010 $7,967,533 $29,088,106 $26,868,026 $16,093,634 $8,316,628
Book Value\Cost at Jun 30, 2010 7,980,680 11,188,223 24,754,692 14,909,682 7,357,771
Book Value at June 30, 2010 7,952,793 40,012 227,951 117,097 64,722
Market Value per Share $1.00 $726.98 $117.87 $137.44 $128.50 State’s Attorneys’ Retirement Fund Book Value at June 30, 2009 $127,706 $37,049 $435,160 $17,299 $45,435 Market Value at June 30, 2009 $127,589 $141,509 $446,259 $20,732 $46,206 Shares Purchased 70,212 - - - - Shares Redeemed (7,596) - - - - Returns of Capital - - - - - Gain/(Loss) on Shares Redeemed 23 - - - - Net Investment Income Earned 1,309 2,620 22,519 472 2,094 Net Investment Income Distributed (1,309) (2,620) (22,519) (472) (2,094) Changes in Market Value of Fund Shares 225 17,176 29,491 1,516 8,427
Market Value at Jun 30, 2010 $190,453 $158,685 $475,750 $22,248 $54,633
Book Value\Cost at Jun 30, 2010 190,345 37,049 435,160 17,299 45,435
Book Value at June 30, 2010 190,100 218 4,036 162 425
Market Value per Share $1.00 $726.98 $117.87 $137.44 $128.50

STATE OF CONNECTICUT, OFFICE OF THE TREASURER, DENISE L. NAPPIER 119
CONNECTICUT STATE TREASURER’S COMBINED INVESTMENT FUNDSCOMBINED INVESTMENT FUNDS
SCHEDULE OF INVESTMENT ACTIVITY BY PENSION PLAN (Continued)FOR THE FISCAL YEAR ENDING JUNE 30, 2010
DEVELOPED EMERGING HIGH YIELD MARKET MARKET REAL COMMERCIAL PRIVATE DEBT INTERNATIONAL INTERNATIONAL ESTATE MORTGAGE INVESTMENT FUND STOCK FUND STOCK FUND FUND FUND FUND TOTAL
$2,471,379 $7,312,843 $2,294,710 $3,796,709 $27,599 $7,904,409 $53,940,262 $2,296,081 $11,086,606 $3,722,305 $2,517,226 $18,169 $5,334,070 $66,305,544 - - 1,456,000 605,800 - 507,400 9,682,894 (438,293) (1,200,000) - - (4,482) - (10,477,009) - - - - - - - 19,909 540,760 - - (2,151) - 2,694,271 179,216 210,317 80,250 44,877 1,382 299,040 1,993,899 (179,216) (210,317) (80,250) (44,877) (1,382) (299,040) (1,993,899) 324,202 587,380 1,158,860 (609,396) 2,000 668,966 3,615,402
$2,201,899 $11,014,746 $6,337,165 $2,513,630 $13,536 $6,510,436 $71,821,103
2,052,995 6,653,603 3,750,710 4,402,509 20,966 8,411,809 55,840,418
19,368 37,264 19,335 82,686 279 131,181 7,126,049
$113.69 $295.58 $327.75 $30.40 $48.51 $49.63 $5,543,161 $17,887,599 $5,501,959 $8,294,612 $45,383 $19,288,254 $131,390,652 $4,986,372 $24,506,612 $8,177,783 $5,586,493 $30,457 $11,870,031 $148,167,802 - - 3,018,000 1,041,800 - 639,400 25,596,168 (1,060,029) (3,345,000) - - (7,511) - (38,311,836) - - - - - - - 20,983 1,315,003 - - (3,391) - 5,696,288 387,587 459,633 175,737 96,949 2,317 647,320 4,407,333 (387,587) (459,633) (175,737) (96,949) (2,317) (647,320) (4,407,333) 730,006 1,246,628 2,562,900 (1,327,621) 3,128 1,449,078 8,626,627
$4,677,332 $23,723,243 $13,758,683 $5,300,672 $22,683 $13,958,509 $149,775,049
4,504,115 15,857,602 8,519,959 9,336,412 34,481 19,927,654 124,371,271
41,141 80,259 41,979 174,365 468 281,254 9,022,041
$113.69 $295.58 $327.75 $30.40 $48.51 $49.63 $53,177 $- $- $45,799 $- $- $761,625 $48,447 $- $- $32,805 $- $- $863,547 - - - 8,250 - - 78,462 - - - - - - (7,596) - - - - - - - - - - - - - 23 4,189 - - 588 - - 33,791 (4,189) - - (588) - - (33,791) 7,482 - - (7,971) - - 56,346
$55,929 $- $- $33,084 $- $- $990,782
53,177 - - 54,049 - - 832,514
492 - - 1,088 - - 196,522
$113.69 $- $- $30.40 $- $-

120 COMBINED INVESTMENT FUNDS 2010 COMPREHENSIVE FINANCIAL ANNUAL REPORT
CONNECTICUT STATE TREASURER’S COMBINED INVESTMENT FUNDSCOMBINED INVESTMENT FUNDS
SCHEDULE OF INVESTMENT ACTIVITY BY TRUSTFOR THE FISCAL YEAR ENDING JUNE 30, 2010
MUTUAL CORE INFLATION EMERGING LIQUIDITY EQUITY FIXED INCOME LINKED BOND MARKET DEBT FUND FUND FUND FUND FUND Soldiers’ Sailors’ & Marines’ Fund Book Value at June 30, 2009 $606,749 $983,642 $37,929,520 $1,725,943 $4,533,494 Market Value at June 30, 2009 $606,449 $3,992,473 $40,323,946 $2,125,588 $4,737,600 Shares Purchased 3,067,225 - - - - Shares Redeemed (3,021,999) - - - - Returns of Capital - - - - - Gain/(Loss) on Shares Redeemed 1,058 - - - - Net Investment Income Earned 5,442 73,903 2,034,728 48,546 214,564 Net Investment Income Distributed (5,442) (73,903) (2,034,728) (48,546) (214,564) Changes in Market Value of Fund Shares (534) 484,529 2,664,902 155,375 864,021
Market Value at June 30, 2010 $652,199 $4,477,002 $42,988,848 $2,280,963 $5,601,621
Book Value at June 30, 2010 653,033 983,642 37,929,520 1,725,943 4,533,494
Shares Outstanding 650,992 6,158 364,721 16,596 43,593
Market Value per Share $1.00 $726.98 $117.87 $137.44 $128.50 Endowment for the Arts Book Value at June 30, 2009 $1,150,970 $- $11,040,873 $502,392 $1,319,527 Market Value at June 30, 2009 $1,149,949 $- $11,215,770 $591,204 $1,317,599 Shares Purchased 931,182 - - - - Shares Redeemed (1,013,747) - - - - Returns of Capital - - - - - Gain/(Loss) on Shares Redeemed 2,577 - - - - Net Investment Income Earned 8,060 - 565,941 13,503 59,673 Net Investment Income Distributed (8,060) - (565,941) (13,503) (59,673) Changes in Market Value of Fund Shares 1,181 - 741,221 43,213 240,299
Market Value at Jun 30, 2010 $1,071,142 $- $11,956,991 $634,417 $1,557,898
Book Value at June 30, 2010 1,070,982 - 11,040,873 502,392 1,319,527
Shares Outstanding 1,069,156 - 101,444 4,616 12,124
Market Value per Share $1.00 $- $117.87 $137.44 $128.50 Agricultural College Fund Book Value at June 30, 2009 $48,883 $25,364 $302,380 $13,760 $36,140 Market Value at June 30, 2009 $48,838 $105,176 $312,915 $16,495 $36,763 Shares Purchased 24,818 - - - - Shares Redeemed (27,968) - - - - Returns of Capital - - - - - Gain/(Loss) on Shares Redeemed 15 - - - - Net Investment Income Earned 307 1,946 15,790 376 1,665 Net Investment Income Distributed (307) (1,946) (15,790) (376) (1,665) Changes in Market Value of Fund Shares 50 12,766 20,679 1,205 6,703
Market Value at Jun 30, 2010 $45,753 $117,942 $333,594 $17,700 $43,466
Book Value at June 30, 2010 45,748 25,364 302,380 13,760 36,140
Shares Outstanding 45,669 162 2,830 129 338
Market Value per Share $1.00 $726.98 $117.87 $137.44 $128.50
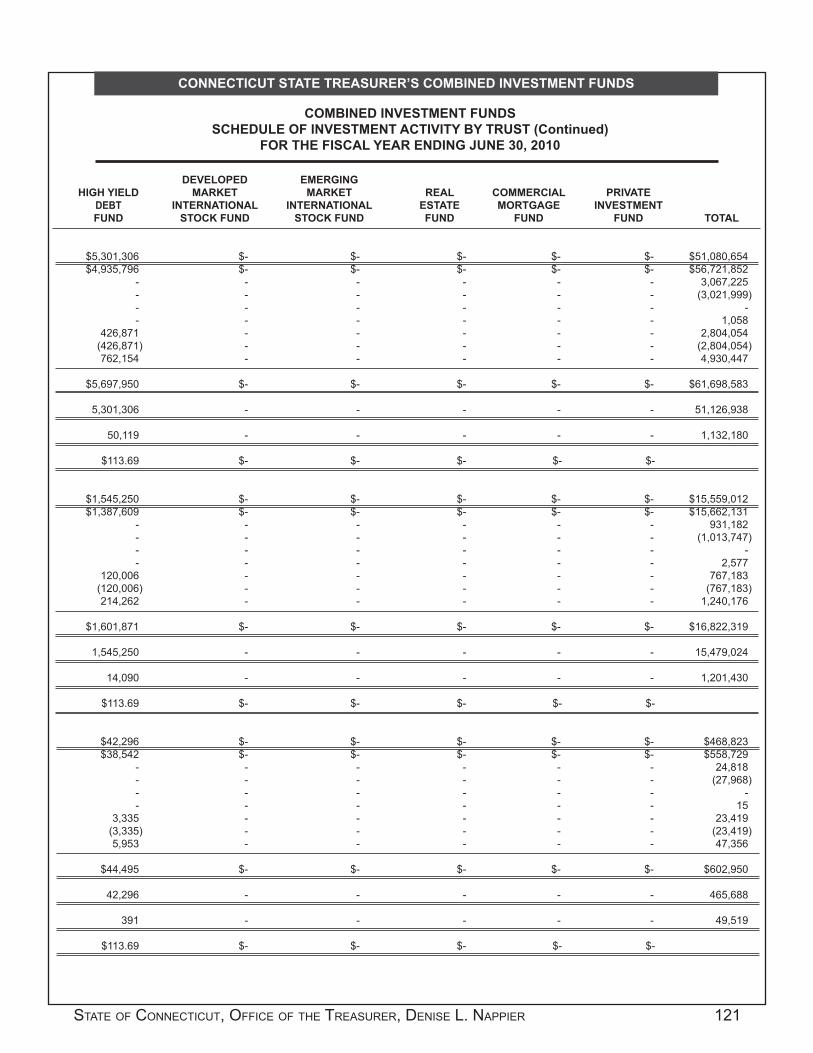
STATE OF CONNECTICUT, OFFICE OF THE TREASURER, DENISE L. NAPPIER 121
CONNECTICUT STATE TREASURER’S COMBINED INVESTMENT FUNDS
COMBINED INVESTMENT FUNDSSCHEDULE OF INVESTMENT ACTIVITY BY TRUST (Continued)
FOR THE FISCAL YEAR ENDING JUNE 30, 2010
DEVELOPED EMERGING HIGH YIELD MARKET MARKET REAL COMMERCIAL PRIVATE DEBT INTERNATIONAL INTERNATIONAL ESTATE MORTGAGE INVESTMENT FUND STOCK FUND STOCK FUND FUND FUND FUND TOTAL
$5,301,306 $- $- $- $- $- $51,080,654 $4,935,796 $- $- $- $- $- $56,721,852 - - - - - - 3,067,225 - - - - - - (3,021,999) - - - - - - - - - - - - - 1,058 426,871 - - - - - 2,804,054 (426,871) - - - - - (2,804,054) 762,154 - - - - - 4,930,447
$5,697,950 $- $- $- $- $- $61,698,583
5,301,306 - - - - - 51,126,938
50,119 - - - - - 1,132,180
$113.69 $- $- $- $- $- $1,545,250 $- $- $- $- $- $15,559,012 $1,387,609 $- $- $- $- $- $15,662,131 - - - - - - 931,182 - - - - - - (1,013,747) - - - - - - - - - - - - - 2,577 120,006 - - - - - 767,183 (120,006) - - - - - (767,183) 214,262 - - - - - 1,240,176
$1,601,871 $- $- $- $- $- $16,822,319
1,545,250 - - - - - 15,479,024
14,090 - - - - - 1,201,430
$113.69 $- $- $- $- $- $42,296 $- $- $- $- $- $468,823 $38,542 $- $- $- $- $- $558,729 - - - - - - 24,818 - - - - - - (27,968) - - - - - - - - - - - - - 15 3,335 - - - - - 23,419 (3,335) - - - - - (23,419) 5,953 - - - - - 47,356
$44,495 $- $- $- $- $- $602,950
42,296 - - - - - 465,688
391 - - - - - 49,519
$113.69 $- $- $- $- $-

122 COMBINED INVESTMENT FUNDS 2010 COMPREHENSIVE FINANCIAL ANNUAL REPORT
CONNECTICUT STATE TREASURER’S COMBINED INVESTMENT FUNDS
COMBINED INVESTMENT FUNDSSCHEDULE OF INVESTMENT ACTIVITY BY TRUST (Continued)
FOR THE FISCAL YEAR ENDING JUNE 30, 2010
MUTUAL CORE INFLATION EMERGING LIQUIDITY EQUITY FIXED INCOME LINKED BOND MARKET DEBT FUND FUND FUND FUND FUND Ida Eaton Cotton Fund Book Value at June 30, 2009 $164,272 $87,363 $1,021,247 $46,470 $122,060 Market Value at June 30, 2009 $164,122 $358,376 $1,064,766 $56,127 $125,093 Shares Purchased 80,018 - - - - Shares Redeemed (90,719) - - - - Returns of Capital - - - - - Gain/(Loss) on Shares Redeemed 36 - - - - Net Investment Income Earned 1,027 6,634 53,729 1,282 5,664 Net Investment Income Distributed (1,027) (6,634) (53,729) (1,282) (5,664) Changes in Market Value of Fund Shares 182 43,495 70,366 4,103 22,814
Market Value at June 30, 2010 $153,639 $401,871 $1,135,132 $60,230 $147,907
Book Value at June 30, 2010 153,607 87,363 1,021,247 46,470 122,060
Shares Outstanding 153,355 553 9,631 438 1,151
Market Value per Share $1.00 $726.98 $117.87 $137.44 $128.50 Andrew Clark Fund Book Value at June 30, 2009 $78,489 $41,101 $495,688 $22,555 $59,240 Market Value at June 30, 2009 $78,416 $167,656 $500,623 $26,388 $58,812 Shares Purchased 50,641 - - - - Shares Redeemed (55,648) - - - - Returns of Capital - - - - - Gain/(Loss) on Shares Redeemed 27 - - - - Net Investment Income Earned 520 3,102 25,262 603 2,663 Net Investment Income Distributed (520) (3,102) (25,262) (603) (2,663) Changes in Market Value of Fund Shares 62 20,348 33,085 1,929 10,724
Market Value at Jun 30, 2010 $73,498 $188,004 $533,708 $28,317 $69,536
Book Value at June 30, 2010 73,509 41,101 495,688 22,555 59,240
Shares Outstanding 73,362 259 4,528 206 541
Market Value per Share $1.00 $726.98 $117.87 $137.44 $128.50 School Fund Book Value at June 30, 2009 $461,575 $384,307 $4,757,413 $216,479 $568,594 Market Value at June 30, 2009 $461,172 $1,576,067 $4,925,234 $259,620 $578,627 Shares Purchased 410,697 - - - - Shares Redeemed (425,420) - - - - Returns of Capital - - - - - Gain/(Loss) on Shares Redeemed 1,036 - - - - Net Investment Income Earned 4,780 29,174 248,525 5,931 26,207 Net Investment Income Distributed (4,780) (29,174) (248,525) (5,931) (26,207) Changes in Market Value of Fund Shares 583 191,275 325,494 18,977 105,527
Market Value at Jun 30, 2010 $448,068 $1,767,342 $5,250,728 $278,597 $684,154
Book Value at June 30, 2010 447,888 384,307 4,757,413 216,479 568,594
Shares Outstanding 447,239 2,431 44,548 2,027 5,324
Market Value per Share $1.00 $726.98 $117.87 $137.44 $128.50

STATE OF CONNECTICUT, OFFICE OF THE TREASURER, DENISE L. NAPPIER 123
CONNECTICUT STATE TREASURER’S COMBINED INVESTMENT FUNDS
COMBINED INVESTMENT FUNDSSCHEDULE OF INVESTMENT ACTIVITY BY TRUST (Continued)
FOR THE FISCAL YEAR ENDING JUNE 30, 2010
DEVELOPED EMERGING HIGH YIELD MARKET MARKET REAL COMMERCIAL PRIVATE DEBT INTERNATIONAL INTERNATIONAL ESTATE MORTGAGE INVESTMENT FUND STOCK FUND STOCK FUND FUND FUND FUND TOTAL
$142,819 $- $- $- $- $- $1,584,231 $130,925 $- $- $- $- $- $1,899,409 - - - - - - 80,018 - - - - - - (90,719) - - - - - - - - - - - - - 36 11,322 - - - - - 79,658 (11,322) - - - - - (79,658) 20,214 - - - - - 161,174
$151,139 $- $- $- $- $- $2,049,918
142,819 - - - - - 1,573,566
1,329 - - - - - 166,457
$113.69 $- $- $- $- $- $69,389 $- $- $- $- $- $766,462 $62,024 $- $- $- $- $- $893,919 - - - - - - 50,641 - - - - - - (55,648) - - - - - - - - - - - - - 27 5,365 - - - - - 37,515 (5,365) - - - - - (37,515) 9,577 - - - - - 75,725
$71,601 $- $- $- $- $- $964,664
69,389 - - - - - 761,482
630 - - - - - 79,526
$113.69 $- $- $- $- $- $665,451 $- $- $- $- $- $7,053,819 $606,610 $- $- $- $- $- $8,407,330 - - - - - - 410,697 - - - - - - (425,420) - - - - - - - - - - - - - 1,036 52,464 - - - - - 367,081 (52,464) - - - - - (367,081) 93,668 - - - - - 735,524
$700,278 $- $- $- $- $- $9,129,167
665,451 - - - - - 7,040,132
6,160 - - - - - 507,729
$113.69 $- $- $- $- $-

124 COMBINED INVESTMENT FUNDS 2010 COMPREHENSIVE FINANCIAL ANNUAL REPORT
CONNECTICUT STATE TREASURER’S COMBINED INVESTMENT FUNDS
COMBINED INVESTMENT FUNDSSCHEDULE OF INVESTMENT ACTIVITY BY TRUST (Continued)
FOR THE FISCAL YEAR ENDING JUNE 30, 2010
MUTUAL CORE INFLATION EMERGING LIQUIDITY EQUITY FIXED INCOME LINKED BOND MARKET DEBT FUND FUND FUND FUND FUND Hopemead Fund Book Value at June 30, 2009 $256,075 $94,338 $1,240,840 $54,187 $142,321 Market Value at June 30, 2009 $255,836 $384,141 $1,254,833 $63,632 $141,816 Shares Purchased 102,517 - - - - Shares Redeemed (8,856) - - - - Returns of Capital - - - - - Gain/(Loss) on Shares Redeemed 18 - - - - Net Investment Income Earned 2,434 7,112 63,318 1,453 6,421 Net Investment Income Distributed (2,434) (7,112) (63,318) (1,453) (6,421) Changes in Market Value of Fund Shares 567 46,618 82,927 4,652 25,865
Market Value at June 30, 2010 $350,082 $430,759 $1,337,760 $68,284 $167,681
Book Value at June 30, 2010 349,754 94,338 1,240,840 54,187 142,321
Shares Outstanding 349,435 593 11,350 497 1,305
Market Value per Share $1.00 $726.98 $117.87 $137.44 $128.50 Police & Fireman’s Survivors’ Benefi t Fund Book Value at June 30, 2009 $1,170,118 $6,467,744 $8,140,446 $370,407 $972,808 Market Value at June 30, 2009 $1,169,055 $5,647,700 $7,959,723 $419,563 $935,011 Shares Purchased 649,304 - - - - Shares Redeemed (595,059) - - - - Returns of Capital - - - - - Gain/(Loss) on Shares Redeemed 1,303 - - - - Net Investment Income Earned 9,693 104,544 401,644 9,582 42,346 Net Investment Income Distributed (9,693) (104,544) (401,644) (9,582) (42,346) Changes in Market Value of Fund Shares 1,754 685,405 526,039 30,665 170,521
Market Value at Jun 30, 2010 $1,226,357 $6,333,105 $8,485,762 $450,228 $1,105,532
Book Value at June 30, 2010 1,225,666 6,467,744 8,140,446 370,407 972,808
Shares Outstanding 1,224,085 8,712 71,994 3,276 8,603
Market Value per Share $1.00 $726.98 $117.87 $137.44 $128.50
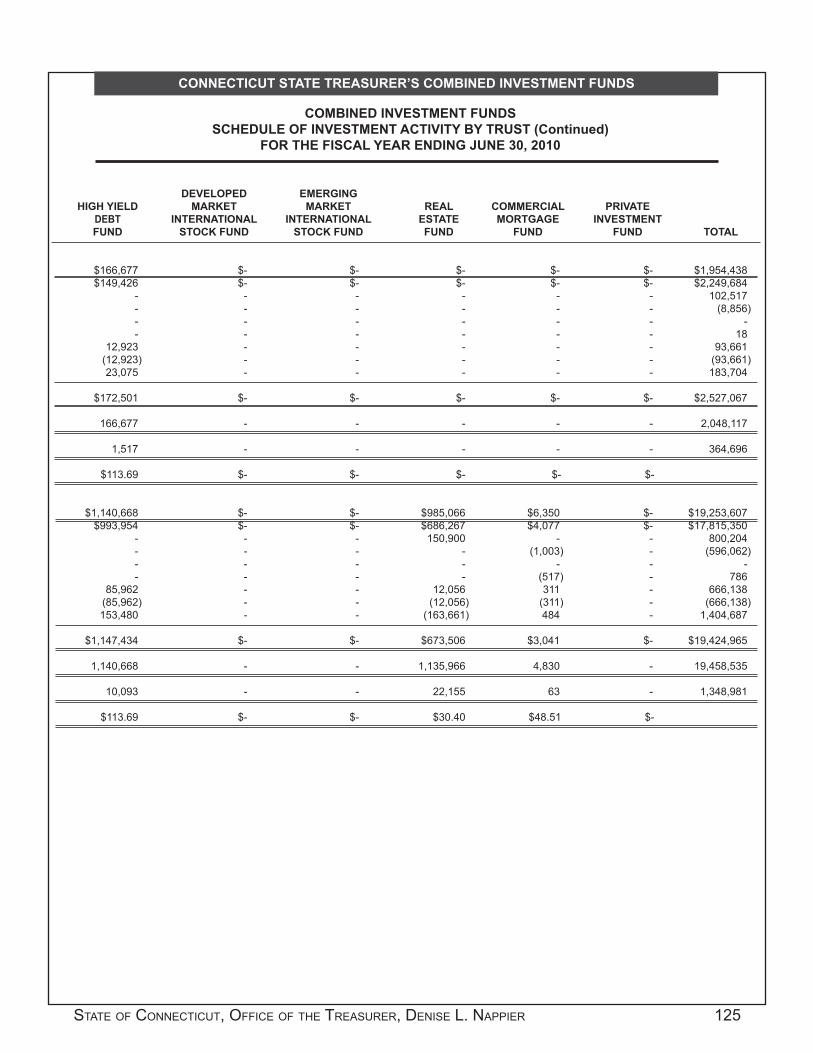
STATE OF CONNECTICUT, OFFICE OF THE TREASURER, DENISE L. NAPPIER 125
CONNECTICUT STATE TREASURER’S COMBINED INVESTMENT FUNDS
COMBINED INVESTMENT FUNDSSCHEDULE OF INVESTMENT ACTIVITY BY TRUST (Continued)
FOR THE FISCAL YEAR ENDING JUNE 30, 2010
DEVELOPED EMERGING HIGH YIELD MARKET MARKET REAL COMMERCIAL PRIVATE DEBT INTERNATIONAL INTERNATIONAL ESTATE MORTGAGE INVESTMENT FUND STOCK FUND STOCK FUND FUND FUND FUND TOTAL
$166,677 $- $- $- $- $- $1,954,438 $149,426 $- $- $- $- $- $2,249,684 - - - - - - 102,517 - - - - - - (8,856) - - - - - - - - - - - - - 18 12,923 - - - - - 93,661 (12,923) - - - - - (93,661) 23,075 - - - - - 183,704
$172,501 $- $- $- $- $- $2,527,067
166,677 - - - - - 2,048,117
1,517 - - - - - 364,696
$113.69 $- $- $- $- $- $1,140,668 $- $- $985,066 $6,350 $- $19,253,607 $993,954 $- $- $686,267 $4,077 $- $17,815,350 - - - 150,900 - - 800,204 - - - - (1,003) - (596,062) - - - - - - - - - - - (517) - 786 85,962 - - 12,056 311 - 666,138 (85,962) - - (12,056) (311) - (666,138) 153,480 - - (163,661) 484 - 1,404,687
$1,147,434 $- $- $673,506 $3,041 $- $19,424,965
1,140,668 - - 1,135,966 4,830 - 19,458,535
10,093 - - 22,155 63 - 1,348,981
$113.69 $- $- $30.40 $48.51 $-

126 COMBINED INVESTMENT FUNDS 2010 COMPREHENSIVE FINANCIAL ANNUAL REPORT
Retirement Funds Net Asset Value
Teachers’ Retirement Fund $12,273,555,439 State Employees’ Retirement Fund 7,789,607,302 Municipal Employees’ Retirement Fund 1,470,621,054 State Judges’ Retirement Fund 149,775,049 The Probate Court Retirement Fund 71,821,103 State’s Attorneys Retirement Fund 990,782 Non-retirement Trust Funds Soldiers’ Sailors’ & Marines’ Fund 61,698,583 Police & Firemans’ Survivors’ Benefi t Fund 19,424,965 Connecticut Arts Endowment Fund 16,822,319 School Fund 9,129,167 Ida Eaton Cotton Fund 2,049,918 Hopemead Fund 2,527,067 Andrew Clark Fund 964,664 Agricultural College Fund 602,950 TOTAL $21,869,590,362
COMBINED INVESTMENT FUNDSTOTAL NET ASSET VALUE BY PENSION PLANS AND TRUST FUNDS
JUNE 30, 2010
CONNECTICUT STATE TREASURER’S COMBINED INVESTMENT FUNDS

STATE OF CONNECTICUT, OFFICE OF THE TREASURER, DENISE L. NAPPIER 127
CONNECTICUT STATE TREASURER’S COMBINED INVESTMENT FUNDS
Net Assets Percent Investment Under of FundName of Fund Strategy Management Total
LIQUIDITY (LF) State Street Global Advisors Active $ 1,493,003,644 67.29%Payden & Rygel Active 100,657,036 4.54%PIMCO Active 176,020,927 7.93%Ambassador Capital Management Active 100,240,839 4.52%Lazard Active 172,298,394 7.76%Colchester Global Investors Ltd. Active 176,660,129 7.96%SUBTOTAL LF $ 2,218,880,969 100.00%
MUTUAL EQUITY FUND (MEF) Large Cap $ 3,369,646,357 63.71%BGI Barclays Global Investors, N.A. Enhanced - Index 765,654,045 14.48%T. Rowe Price Associates Enhanced - Index 741,404,050 14.01%State Street Global Advisors Passive - Indexed 1,862,588,262 35.22%Active Extension 762,654,863 14.42%AXA Rosenberg Investment Management Active 187,719,220 3.55%Pyramis Active 291,501,068 5.51%Numeric Active 283,434,575 5.36%All Cap 268,916,132 5.08%Capital Prospects Active 135,861,230 2.57%FIS Group, Inc. Active 133,054,902 2.51%Small/Mid Cap 371,812,347 7.03%AXA Rosenberg Investment Management Enhanced - Index 371,812,347 7.03%Small/Mid Cap 129,038,328 2.44%Bivium Active 129,038,328 2.44%Other (1) 387,023,669 7.32%SUBTOTAL MEF $ 5,289,091,696 100.00% CORE FIXED INCOME FUND (CFIF) State Street Global Advisors Passive $ 1,038,045,975 38.43%BlackRock Financial Management, Inc. Active 662,480,061 24.52%Wellington Active 531,174,461 19.66%Phoenix Active 324,967,803 12.03%Progress Active 131,722,970 4.88%Other (1) 13,054,939 0.48%SUBTOTAL CFIF $ 2,701,446,209 100.00% INFLATION LINKED BOND FUND (ILBF) Brown Brothers Harriman Active $ 600,761,965 56.52%Hartford Investment Mgmt Co. Active 461,830,308 43.45%Other (1) 297,227 0.03%SUBTOTAL ILBF $ 1,062,889,500 100.00% EMERGING MARKET DEBT FUND (EMDF) Ashmore Active $ 275,397,208 23.42%Stone Harbor Investment Partners Active 258,043,051 21.95%ING Investment Management Active 204,085,677 17.36%Pyramis Active 220,008,611 18.71%UBS Global Asset Management Active 216,987,326 18.45%Other (1) 1,340,495 0.11%SUBTOTAL EMDF $ 1,175,862,368 100.00% HIGH YIELD INCOME FUND (HYIF) Loomis Sayles & Co., Inc. Active $ 229,269,448 33.10%Stone Harbor Investment Partners Active 94,233,670 13.60%Shenkman Capital Management Active 226,634,207 32.71%Oaktree Capital Management, L.L.C. Active 137,825,017 19.90%Other (1) 4,802,157 0.69%SUBTOTAL HYIF $ 692,764,499 100.00%
LIST OF INVESTMENT ADVISORS AND NET ASSETS UNDER MANAGEMENTJUNE 30, 2010

128 COMBINED INVESTMENT FUNDS 2010 COMPREHENSIVE FINANCIAL ANNUAL REPORT
CONNECTICUT STATE TREASURER’S COMBINED INVESTMENT FUNDS
LIST OF INVESTMENT ADVISORS AND NET ASSETS UNDER MANAGEMENT (Continued)JUNE 30, 2010
Net Assets Percent Investment Under of FundName of Fund Strategy Management Total
DEVELOPED MARKET INTERNATIONAL STOCK FUND (DMISF) Index $ 643,899,823 14.52%State Street Global Advisors Index-Passive 643,899,823 14.52%Core 1,427,372,133 32.19%Invesco Global Asset Mgmt. Active 175,522,939 3.96%AQR Capital Management Active 518,387,343 11.69%Acadian Asset Management Active 182,882,308 4.12%Artio Global Active 449,467,939 10.14%Progress Active 101,111,604 2.28%Active-Growth 511,832,524 11.54%MFS Institutional Advisors, Inc. Active 511,832,524 11.54%Active-Value 479,311,240 10.81%Grantham, Mayo, Van Otterloo Active 479,311,240 10.81%Small Cap 644,021,970 14.52%Schroder Investment Mgmt. Active 221,955,384 5.00%Dimensional Fund Advisors Active 201,856,115 4.55%William Blair & Company Active 220,210,471 4.97%Risk Controlled 640,159,768 14.43%BlackRock Active 314,448,922 7.09%Pyramis Active 325,710,846 7.34%Other (1) 88,363,106 1.99%SUBTOTAL DMISF $ 4,434,960,564 100.00% EMERGING MARKET INTERNATIONAL STOCK FUND (EMISF) Aberdeen Asset Management Active $ 511,208,154 24.66%Schroders Investment Mgt Active 415,973,739 20.07%Grantham, Mayo, Van Otterloo Active 579,031,270 27.93%Emerging Markets Management Active 562,542,529 27.13%Other (1) 4,408,880 0.21%SUBTOTAL EMISF $ 2,073,164,572 100.00% REAL ESTATE FUND (REF)1800 E. St. Andrew Place Active $ 18,156,905 2.32%1155 Perimeter Center West Active 26,639,547 3.40%AEW Partners III Active 7,883,709 1.01%AEW 221 Trust Active 2,708,893 0.35%AEW Core Active 481,132 0.06%Alliance Bernstein Legacy Active 42,887,005 5.47%Apollo Real Estate Active 15,223,252 1.94%Blackstone Real Estate VI LP Active 30,978,400 3.95%Blackstone Real Estate Partner Europe III LP Active 2,405,287 0.31%Canyon Johnson Urban Fund II Active 29,275,945 3.73%Canyon Johnson Urban Fund III Active 1,142,460 0.15%Capri Select Income II LLC Active 6,985,650 0.89%Colony Realty Partners II LP Active 18,531,176 2.36%Cornerstone Patriot Active 42,865,500 5.47%Covenant Apartment Fund V LP Active 24,673,550 3.15%Covenant Apartment Fund VI Active 10,103,790 1.29%The Glen at Lafayette Hill Active 12,622,352 1.61%IL & FS India Realty Fund II Active 25,725,591 3.28%Macfarlane Urban Real Estate Fund II LP Active 14,320,948 1.83%Marathon Legacy Securities PPI Active 33,072,845 4.22%Mullica Hill Plaza Active 7,446,307 0.95%North Scottsdale Corporate Center Active 43,404,835 5.54%Prime Property Fund Active 60,641,800 7.74%Rio Hill Shopping Center Active 38,727,058 4.94%RLJ RE Fund III LP Active 8,659,408 1.10%RLJ Urban Lodging Fund II Active 28,751,650 3.67%Rocky Creek Apartments Active 11,896,889 1.52%Rockwood Capital Fund V Active 8,109,795 1.03%Rockwood Capital VI Limited Partnership Active 9,708,590 1.24%
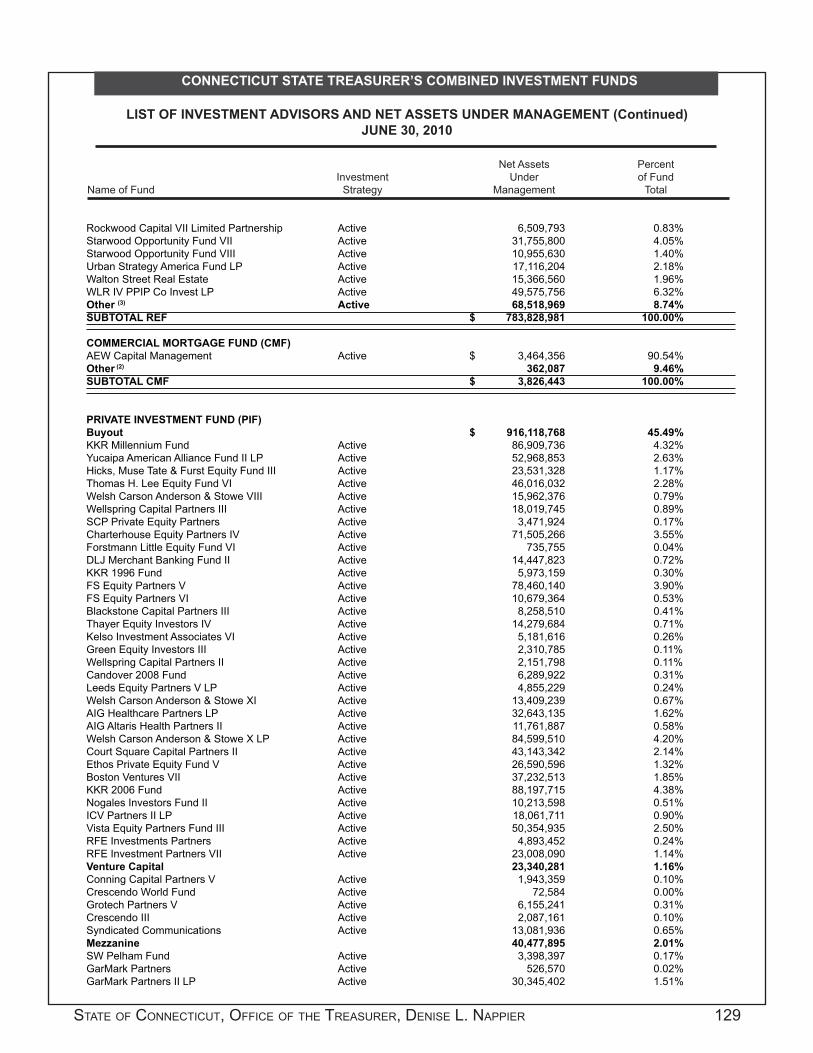
STATE OF CONNECTICUT, OFFICE OF THE TREASURER, DENISE L. NAPPIER 129
CONNECTICUT STATE TREASURER’S COMBINED INVESTMENT FUNDS
LIST OF INVESTMENT ADVISORS AND NET ASSETS UNDER MANAGEMENT (Continued)JUNE 30, 2010
Net Assets Percent Investment Under of FundName of Fund Strategy Management Total
Rockwood Capital VII Limited Partnership Active 6,509,793 0.83%Starwood Opportunity Fund VII Active 31,755,800 4.05%Starwood Opportunity Fund VIII Active 10,955,630 1.40%Urban Strategy America Fund LP Active 17,116,204 2.18%Walton Street Real Estate Active 15,366,560 1.96%WLR IV PPIP Co Invest LP Active 49,575,756 6.32%Other (3) Active 68,518,969 8.74%SUBTOTAL REF $ 783,828,981 100.00% COMMERCIAL MORTGAGE FUND (CMF) AEW Capital Management Active $ 3,464,356 90.54%Other (2) 362,087 9.46%SUBTOTAL CMF $ 3,826,443 100.00% PRIVATE INVESTMENT FUND (PIF) Buyout $ 916,118,768 45.49%KKR Millennium Fund Active 86,909,736 4.32%Yucaipa American Alliance Fund II LP Active 52,968,853 2.63%Hicks, Muse Tate & Furst Equity Fund III Active 23,531,328 1.17%Thomas H. Lee Equity Fund VI Active 46,016,032 2.28%Welsh Carson Anderson & Stowe VIII Active 15,962,376 0.79%Wellspring Capital Partners III Active 18,019,745 0.89%SCP Private Equity Partners Active 3,471,924 0.17%Charterhouse Equity Partners IV Active 71,505,266 3.55%Forstmann Little Equity Fund VI Active 735,755 0.04%DLJ Merchant Banking Fund II Active 14,447,823 0.72%KKR 1996 Fund Active 5,973,159 0.30%FS Equity Partners V Active 78,460,140 3.90%FS Equity Partners VI Active 10,679,364 0.53%Blackstone Capital Partners III Active 8,258,510 0.41%Thayer Equity Investors IV Active 14,279,684 0.71%Kelso Investment Associates VI Active 5,181,616 0.26%Green Equity Investors III Active 2,310,785 0.11%Wellspring Capital Partners II Active 2,151,798 0.11%Candover 2008 Fund Active 6,289,922 0.31%Leeds Equity Partners V LP Active 4,855,229 0.24%Welsh Carson Anderson & Stowe XI Active 13,409,239 0.67%AIG Healthcare Partners LP Active 32,643,135 1.62%AIG Altaris Health Partners II Active 11,761,887 0.58%Welsh Carson Anderson & Stowe X LP Active 84,599,510 4.20%Court Square Capital Partners II Active 43,143,342 2.14%Ethos Private Equity Fund V Active 26,590,596 1.32%Boston Ventures VII Active 37,232,513 1.85%KKR 2006 Fund Active 88,197,715 4.38%Nogales Investors Fund II Active 10,213,598 0.51%ICV Partners II LP Active 18,061,711 0.90%Vista Equity Partners Fund III Active 50,354,935 2.50%RFE Investments Partners Active 4,893,452 0.24%RFE Investment Partners VII Active 23,008,090 1.14%Venture Capital 23,340,281 1.16%Conning Capital Partners V Active 1,943,359 0.10%Crescendo World Fund Active 72,584 0.00%Grotech Partners V Active 6,155,241 0.31%Crescendo III Active 2,087,161 0.10%Syndicated Communications Active 13,081,936 0.65%Mezzanine 40,477,895 2.01%SW Pelham Fund Active 3,398,397 0.17%GarMark Partners Active 526,570 0.02%GarMark Partners II LP Active 30,345,402 1.51%

130 COMBINED INVESTMENT FUNDS 2010 COMPREHENSIVE FINANCIAL ANNUAL REPORT
CONNECTICUT STATE TREASURER’S COMBINED INVESTMENT FUNDS
LIST OF INVESTMENT ADVISORS AND NET ASSETS UNDER MANAGEMENT (Continued)JUNE 30, 2010
SW Pelham Fund II Active 6,207,526 0.31%International 170,876,573 8.49%Compass Partners European Equity Fund Active 16,426,114 0.82%Gilbert Global Equity Partners Active 35,300,379 1.75%Carlyle Europe Partners Active 8,250,076 0.41%AIG Global Emerging Markets Fund Active 11,178,619 0.56%Carlyle Asia Partners Active 99,721,385 4.95%Fund of Funds 550,355,818 27.33%The Constitution Liquidating Fund Active 160,725,704 7.98%Landmark Private Equity Fund VIII Active 23,804,890 1.18%CS/CT Cleantech Opp Fund Active 13,459,707 0.67%CT Emerging Pvt Equity Active 9,121,390 0.45%Fairview Constitution III Active 52,459,954 2.60%Goldman Sachs Private Equity Partners Connecticut Active 8,426,270 0.42%Lexington Capital Partners II Active 4,073,132 0.20%Parish Capital I LP Active 37,666,321 1.87%Parish Capital Buyout Fund II Active 96,260,356 4.78%Fairview Constitution II LP Active 123,187,147 6.12%Connecticut Horizon Legacy Active 7,822,662 0.39%Landmark Equity Partners XIV LP Active 8,968,930 0.45%JP Morgan Nutmeg I Active 4,379,355 0.22%Special Situations 203,240,295 10.09%Welsh Carson Anderson & Stowe Capital Partners III Active 16,209,171 0.80%Levine Leichtman Capital Partners IV LP Active 10,511,435 0.52%Greenwich Street Capital Partners II Active 2,450,819 0.12%Pegasus Partners IV Active 88,133,949 4.38%WLR Recovery Fund IV Active 55,193,279 2.74%KPS Special Situations Fund II Active 30,741,642 1.53%Other (3) 109,436,668 5.43%SUBTOTAL PIF $ 2,013,846,298 100.00%
TOTAL $ 22,450,562,099Adjustments (4) (580,971,737)GRAND TOTAL $ 21,869,590,362
(1) Other represents cash equivalents, other net assets and terminated advisor balances, as well as, currency overlay balances for the DMISF.
(2) Other also includes residential mortgage-backed securities for the Commercial Mortgage Fund.(3) Other represents moneys earmarked for distribution to participants, reinvestment, and expenses as well as terminated advisor balances.(4) Represents Elimination Entry to the Financial Statements to account for investment of Combined Investment Funds in the Liquidity Fund.
Net Assets Percent Investment Under of FundName of Fund Strategy Management Total
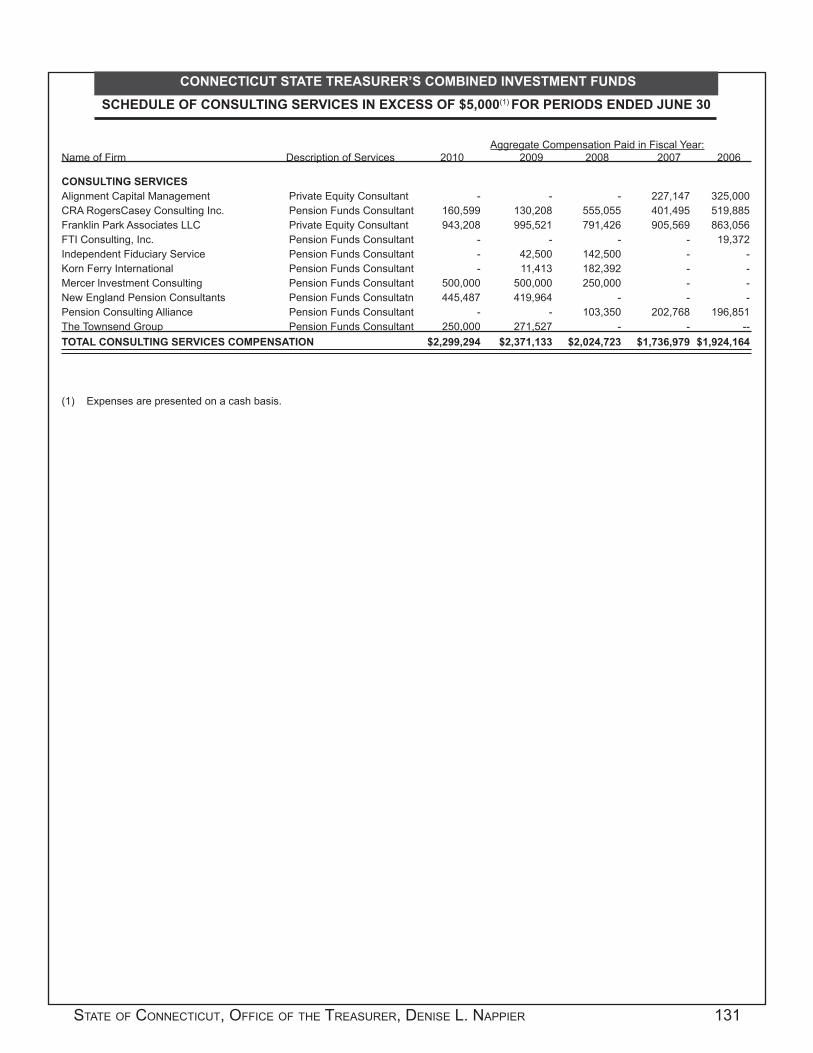
STATE OF CONNECTICUT, OFFICE OF THE TREASURER, DENISE L. NAPPIER 131
CONNECTICUT STATE TREASURER’S COMBINED INVESTMENT FUNDS
SCHEDULE OF CONSULTING SERVICES IN EXCESS OF $5,000(1) FOR PERIODS ENDED JUNE 30
Aggregate Compensation Paid in Fiscal Year:Name of Firm Description of Services 2010 2009 2008 2007 2006
CONSULTING SERVICESAlignment Capital Management Private Equity Consultant - - - 227,147 325,000CRA RogersCasey Consulting Inc. Pension Funds Consultant 160,599 130,208 555,055 401,495 519,885Franklin Park Associates LLC Private Equity Consultant 943,208 995,521 791,426 905,569 863,056FTI Consulting, Inc. Pension Funds Consultant - - - - 19,372Independent Fiduciary Service Pension Funds Consultant - 42,500 142,500 - -Korn Ferry International Pension Funds Consultant - 11,413 182,392 - -Mercer lnvestment Consulting Pension Funds Consultant 500,000 500,000 250,000 - -New England Pension Consultants Pension Funds Consultatn 445,487 419,964 - - -Pension Consulting Alliance Pension Funds Consultant - - 103,350 202,768 196,851The Townsend Group Pension Funds Consultant 250,000 271,527 - - --TOTAL CONSULTING SERVICES COMPENSATION $2,299,294 $2,371,133 $2,024,723 $1,736,979 $1,924,164 (1) Expenses are presented on a cash basis.

132 COMBINED INVESTMENT FUNDS 2010 COMPREHENSIVE FINANCIAL ANNUAL REPORT
CONNECTICUT STATE TREASURER’S COMBINED INVESTMENT FUNDS
TOP TEN HOLDINGS BY FUND AT JUNE 30, 2010*
LIQUIDITY FUNDSecurity Name Maturity Date Market Value %Barclays Cap Tri Party C 07/01/2010 $99,245,000.00 4.48%Bank of Nova Scotia 07/14/2010 53,000,000.00 2.39%Westpac Banking Corp 07/12/2010 47,996,186.67 2.16%Deutsche Bank AG NY 07/06/2010 45,000,000.00 2.03%Barclays Capital Repo 07/01/2010 44,000,000.00 1.99%Credit Suisse First Boston Repo 07/01/2010 44,000,000.00 1.99%Barclays Bank PLC 01/07/2011 40,000,000.00 1.81%HSBC Tri Party C 07/01/2010 40,000,000.00 1.81%CSFB Tri Party C 07/01/2010 40,000,000.00 1.81%Deutsche Tri Party C 07/01/2010 40,000,000.00 1.81%Top Ten $493,241,186.67 22.28%
Fair Value LF 2,214,104,408.00
MUTUAL EQUITY FUNDSecurity Name Industry Sector Market Value %Exxon Mobil Corp Energy $117,859,718 2.23%Apple Inc Information Technology 80,523,053 1.52%Microsoft Technology 75,320,543 1.42%Proctor & Gamble Co Consumer Staples 72,737,506 1.37%JP Morgan Chase & Co Financials 64,376,818 1.22%AT&T Inc Telecommunication Svcs 63,320,107 1.20%Johnson & Johnson Health Care 59,811,952 1.13%Wells Fargo & Co Financials 54,879,258 1.04%International Business Machines Information Technology 52,635,202 1.00%Bank of America Corp Financials 51,993,821 0.98%Top Ten $693,457,978 13.11% FAIR VALUE MEF $ 5,288,853,566
CORE FIXED INCOME FUNDSecurity Name Coupon Maturity Security Type Market Value %U.S. Treasury N/B 4.375% 05/15/2040 U.S. Govt Agency $35,747,721 1.28%FNMA TBA Aug 30 Single Fam 4.500% 12/01/2099 U.S. Govt Agency 27,365,490 0.98%U.S. Treasury Bonds 11.250% 02/15/2015 U.S. Govt Agency 25,408,076 0.91%U.S. Treasury N/B 1.000% 08/31/2011 U.S. Govt Agency 24,356,816 0.87%U.S. Treasury N/B 2.250% 10/31/2014 U.S. Govt Agency 21,562,948 0.77%U.S. Treasury N/B 3.500% 05/15/2020 U.S. Govt Agency 21,538,205 0.77%FHLMC TBA Aug 30 Gold Single 5.000% 12/01/2099 U.S. Govt Agency 18,332,466 0.66%FNMA TBA Aug 30 Single Fam 5.000% 12/01/2099 U.S. Govt Agency 18,132,584 0.65%FNMA Pool 745275 5.000% 02/01/2036 U.S. Govt Agency 16,724,202 0.60%FNMA Pool 888876 5.500% 05/01/2033 U.S. Govt Agency 15,272,804 0.55%Top Ten $224,441,312 8.04% FAIR VALUE CFI $2,789,605,943
INFLATION LINKED BOND FUNDSecurity Name Coupon Maturity Security Type Market Value %U.S. Treasury Bonds 2.375% 01/15/2025 U.S. Govt Agency $99,213,493 9.27%U.S. Treasury Bonds 2.000% 01/15/2026 U.S. Govt Agency 87,043,947 8.13%U.S. Treasury Notes 2.000% 01/15/2016 U.S. Govt Agency 84,301,286 7.87%U.S. Treasury Notes 2.375% 04/15/2011 U.S. Govt Agency 72,610,257 6.78%U.S. Treasury Notes 2.000% 01/15/2014 U.S. Govt Agency 66,797,952 6.24%U.S. Treasury Notes 2.500% 07/15/2016 U.S. Govt Agency 64,307,460 6.01%

STATE OF CONNECTICUT, OFFICE OF THE TREASURER, DENISE L. NAPPIER 133
CONNECTICUT STATE TREASURER’S COMBINED INVESTMENT FUNDS
TOP TEN HOLDINGS BY FUND AT JUNE 30, 2010* (Continued)
U.S. Treasury Notes 2.375% 01/15/2017 U.S. Govt Agency 57,903,348 5.41%U.S. Treasury Notes 1.625% 01/15/2015 U.S. Govt Agency 54,088,528 5.05%U.S. Treasury Bonds 3.625% 04/15/2028 U.S. Govt Agency 52,389,083 4.89%U.S. Treasury Notes 3.000% 07/15/2012 U.S. Govt Agency 46,685,398 4.36%Top Ten $685,340,752 64.01% FAIR VALUE ILB $ 1,070,660,872
EMERGING MARKET DEBT FUNDSecurity Name Coupon Maturity Market Value %Russian Federation 1.000% 03/31/2030 $32,278,161 2.79%Nota Tesouro Nacional 10.000% 01/01/2021 19,304,440 1.67%Republic of Argentina 7.000% 03/28/2011 18,368,845 1.59%UBS Glam REF 70325 4.960% 03/05/2011 12,458,890 1.08%UBS Glam REF 70325 7.010% 03/05/2015 12,243,246 1.06%Republic of Indonesia 11.625% 03/04/2019 12,175,625 1.05%UBS Glam REF 70491 8.520% 03/20/2017 10,605,430 0.92%South Africa (Republic) 8.000% 12/21/2018 10,496,341 0.91%Republic of Poland 6.375% 07/15/2019 10,315,502 0.89%Brazil (FED REP) 6.000% 05/15/2045 10,142,666 0.88%Top Ten $148,389,146 12.84% FAIR VALUE EMD $1,155,351,613
HIGH YIELD DEBT FUNDSecurity Name Coupon Maturity Market Value %Borden Inc 7.875% 02/15/2023 $6,832,875 1.04%Toys R Us Inc 7.375% 10/15/2018 6,603,500 1.00%Qwest Capital Funding 6.875% 07/15/2028 6,236,100 0.95%Dynegy Hldgs Inc 8.375% 05/01/2016 5,234,119 0.80%Valeant Pharmaceuticals Intl 4.000% 11/15/2013 5,222,100 0.80%Tenet Healthcare Corp 6.875% 11/15/2031 5,190,900 0.79%AES Corp 8.000% 10/15/2017 5,181,300 0.79%Citibank NA 15.000% 07/02/2010 4,976,173 0.76%Vertex Pharmaceuticals Inc Common Stock 4,908,187 0.75%Aramark Corp 8.500% 02/01/2015 4,545,000 0.69%Top Ten $54,930,254 8.37% FAIR VALUE HYI $656,175,724
DEVELOPED MARKET INTERNATIONAL STOCK FUNDSecurity Name Country Market Value %Nestle SA CHFO.10 REGD Switzerland $77,999,342 1.80%Royal Dutch Shell PLC A Shares Eur .07 United Kingdom 53,794,807 1.24%Roche Holdings AG Genusscheine NPV Switzerland 51,536,598 1.19%HSBC Holdings ORD USD 0.50 UK REG United Kingdom 46,545,054 1.08%Novartis AG CHF 0.50 REGD Switzerland 44,326,091 1.02%Glaxosmithkline ORD GBP 0.25 United Kingdom 40,731,126 0.94%Sanofi Aventis EUR 2.0 France 36,436,956 0.84%Total SA Eur 2.5 Post Division France 35,270,998 0.82%Astrazeneca ORD USD 0.25 United Kingdom 33,785,298 0.78%Vodafone Group ORD USD 0.11428571 United Kingdom 33,235,013 0.77%Top Ten $453,661,283 10.48% FAIR VALUE DM ISF $4,328,450,937

134 COMBINED INVESTMENT FUNDS 2010 COMPREHENSIVE FINANCIAL ANNUAL REPORT
CONNECTICUT STATE TREASURER’S COMBINED INVESTMENT FUNDS
TOP TEN HOLDINGS BY FUND AT JUNE 30, 2010* (Continued)
EMERGING MARKET INTERNATIONAL STOCK FUNDSecurity Name Country Market Value %Samsung Electronic KRW 5000 Republic of Korea $54,210,055 2.62%Vale SA Depository Receipts Brazil 53,183,480 2.58%Petroleo Brasileiro SA Sponsored ADR Brazil 51,738,522 2.51%Gazprom ADR OAO Russian Federation 47,943,655 2.32%China Mobile Ltd. HKD 0.10 Hong Kong 47,795,789 2.31%CNOOC Ltd HKD 0.02 Hong Kong 38,764,655 1.88%Lukoil OAO ADR Rub 0.025 Russian Federation 30,949,045 1.50%America Movil ADR Series L Mexico 24,795,570 1.20%Grupo Financiero Banorte NPV Mexico 24,162,107 1.17%Taiwan Semiconductor SP ADR Taiwan 23,838,175 1.15%Top Ten $397,381,053 19.24%
FAIR VALUE EM ISF $2,065,255,957
REAL ESTATE FUNDProperty Name Patnership Type Market Value %Prime Property Fund Core $60,641,800 7.65%WLR IV PPIP Co Invest LP Opportunistic 49,575,756 6.26%Alliance Bernstein Legacy Value-Added 42,887,005 5.41%Cornerstone Patriot Core 42,865,500 5.41%Marathon Legacy Securities PPI Value-Added 33,072,845 4.17%Starwood Opportunity Fund VII Opportunistic 31,755,800 4.01%Blackstone Real Estate VI LP Opportunistic 30,978,400 3.91%Canyon Johnson Urban Fund II Opportunistic 29,275,945 3.69%RLJ Urban Lodging Fund II Opportunistic 28,751,650 3.63%Covenant Apartment Fund V LP Value-Added 24,673,550 3.11%Top Ten $374,478,251 47.25%
FAIR VALUE REF $792,483,221
COMMERCIAL MORTGAGE FUNDProperty Name Location Property Type Market Value %SASCO Various Other $3,464,167 90.73%Yankee Mac Series G 11.125% Various Residential 94,453 2.47%Yankee Mac Series E 11.056% Various Residential 68,224 1.79%Yankee Mac Series F 12.981% Various Residential 28,227 0.74%Yankee Mac Series A 13.075% Various Residential 2,149 0.06%Top Five $3,657,220 95.79%
FAIR VALUE CMF $3,818,115
PRIVATE INVESTMENT FUNDPartnership Name Partnership Type Market Value %Constitution Liquidating Fund Fund of Funds $160,725,705 7.99%Fairview Constitution II LP Fund of Funds 123,187,147 6.12%Carlyle Asia Partners LP International 99,721,385 4.95%Parish Capital Buyout Fund II Fund of Funds 96,260,356 4.78%KKR 2006 Fund Buyout 88,197,715 4.38%Pegasus Partners IV Special Situations 88,133,949 4.38%KKR Millennium Fund Buyout 86,909,736 4.32%Welsh Carson Anderson & Stowe X LP Buyout 84,599,510 4.20%FS Equity Partners V Buyout 78,460,140 3.90%Charterhouse Equity Partners IV Buyout 71,505,266 3.55%Top Ten $977,700,909 48.57%
FAIR VALUE PIF $2,013,101,198
* A complete list of portfolio holdings is available from the Offi ce of the Treasurer.
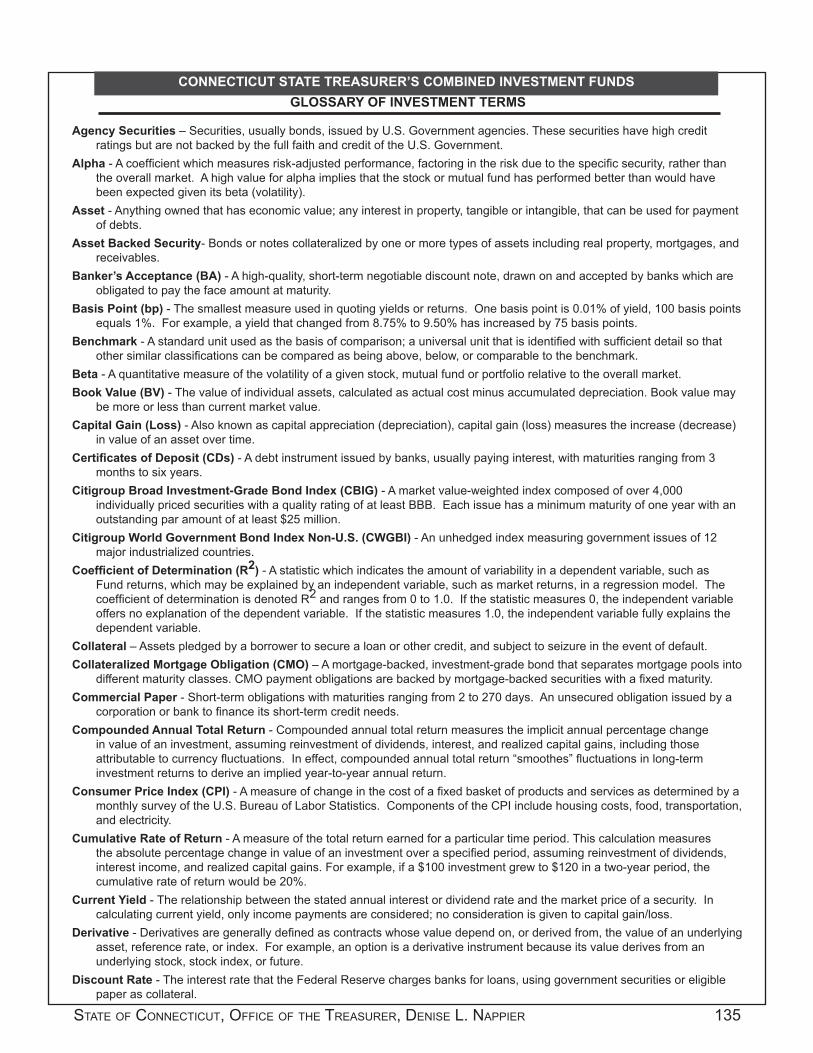
STATE OF CONNECTICUT, OFFICE OF THE TREASURER, DENISE L. NAPPIER 135
CONNECTICUT STATE TREASURER’S COMBINED INVESTMENT FUNDSGLOSSARY OF INVESTMENT TERMS
Agency Securities – Securities, usually bonds, issued by U.S. Government agencies. These securities have high credit ratings but are not backed by the full faith and credit of the U.S. Government.
Alpha - A coeffi cient which measures risk-adjusted performance, factoring in the risk due to the specifi c security, rather than the overall market. A high value for alpha implies that the stock or mutual fund has performed better than would have been expected given its beta (volatility).
Asset - Anything owned that has economic value; any interest in property, tangible or intangible, that can be used for payment of debts.
Asset Backed Security- Bonds or notes collateralized by one or more types of assets including real property, mortgages, and receivables.
Banker’s Acceptance (BA) - A high-quality, short-term negotiable discount note, drawn on and accepted by banks which are obligated to pay the face amount at maturity.
Basis Point (bp) - The smallest measure used in quoting yields or returns. One basis point is 0.01% of yield, 100 basis points equals 1%. For example, a yield that changed from 8.75% to 9.50% has increased by 75 basis points.
Benchmark - A standard unit used as the basis of comparison; a universal unit that is identifi ed with suffi cient detail so that other similar classifi cations can be compared as being above, below, or comparable to the benchmark.
Beta - A quantitative measure of the volatility of a given stock, mutual fund or portfolio relative to the overall market.Book Value (BV) - The value of individual assets, calculated as actual cost minus accumulated depreciation. Book value may
be more or less than current market value.Capital Gain (Loss) - Also known as capital appreciation (depreciation), capital gain (loss) measures the increase (decrease)
in value of an asset over time. Certifi cates of Deposit (CDs) - A debt instrument issued by banks, usually paying interest, with maturities ranging from 3
months to six years.Citigroup Broad Investment-Grade Bond Index (CBIG) - A market value-weighted index composed of over 4,000
individually priced securities with a quality rating of at least BBB. Each issue has a minimum maturity of one year with an outstanding par amount of at least $25 million.
Citigroup World Government Bond Index Non-U.S. (CWGBI) - An unhedged index measuring government issues of 12 major industrialized countries.
Coeffi cient of Determination (R2) - A statistic which indicates the amount of variability in a dependent variable, such as Fund returns, which may be explained by an independent variable, such as market returns, in a regression model. The coeffi cient of determination is denoted R2 and ranges from 0 to 1.0. If the statistic measures 0, the independent variable offers no explanation of the dependent variable. If the statistic measures 1.0, the independent variable fully explains the dependent variable.
Collateral – Assets pledged by a borrower to secure a loan or other credit, and subject to seizure in the event of default.Collateralized Mortgage Obligation (CMO) – A mortgage-backed, investment-grade bond that separates mortgage pools into
different maturity classes. CMO payment obligations are backed by mortgage-backed securities with a fi xed maturity. Commercial Paper - Short-term obligations with maturities ranging from 2 to 270 days. An unsecured obligation issued by a
corporation or bank to fi nance its short-term credit needs. Compounded Annual Total Return - Compounded annual total return measures the implicit annual percentage change
in value of an investment, assuming reinvestment of dividends, interest, and realized capital gains, including those attributable to currency fl uctuations. In effect, compounded annual total return “smoothes” fl uctuations in long-term investment returns to derive an implied year-to-year annual return.
Consumer Price Index (CPI) - A measure of change in the cost of a fi xed basket of products and services as determined by a monthly survey of the U.S. Bureau of Labor Statistics. Components of the CPI include housing costs, food, transportation, and electricity.
Cumulative Rate of Return - A measure of the total return earned for a particular time period. This calculation measures the absolute percentage change in value of an investment over a specifi ed period, assuming reinvestment of dividends, interest income, and realized capital gains. For example, if a $100 investment grew to $120 in a two-year period, the cumulative rate of return would be 20%.
Current Yield - The relationship between the stated annual interest or dividend rate and the market price of a security. In calculating current yield, only income payments are considered; no consideration is given to capital gain/loss.
Derivative - Derivatives are generally defi ned as contracts whose value depend on, or derived from, the value of an underlying asset, reference rate, or index. For example, an option is a derivative instrument because its value derives from an underlying stock, stock index, or future.
Discount Rate - The interest rate that the Federal Reserve charges banks for loans, using government securities or eligible paper as collateral.

136 COMBINED INVESTMENT FUNDS 2010 COMPREHENSIVE FINANCIAL ANNUAL REPORT
CONNECTICUT STATE TREASURER’S COMBINED INVESTMENT FUNDSGLOSSARY OF INVESTMENT TERMS (Continued)
Diversifi cation – A portfolio strategy designed to reduce exposure to risk by putting assets in several different securities or categories of investments.
Duration - A measure of the average time to receipt of all bond cash fl ows. Duration is used to determine the percentage change in price of a fi xed income security for a given change in the security’s yield to maturity. Duration is stated in terms of time periods, generally years. (See Modifi ed and Macaulay duration).
Equity - The ownership interest possessed by shareholders in a corporation in the form of common stock or preferred stock.ERISA (Employee Retirement Income Security Act) - The 1974 federal law which established legal guidelines for private
pension plan administration and investment practices. Expense Ratio – Operating costs (including management fees) expressed as a percentage of the fund’s average net assets
for a given time period. Fair Value - The amount at which a fi nancial instrument could be exchanged in a current transaction between willing parties,
other than in a forced or liquidation sale.Federal Funds Rate - The interest rate that banks charge each other for the use of Federal Funds. This rate changes daily
and is a sensitive indicator of general interest rate trends. Federal Reserve Board – The 7- member Board of Governors that oversees Federal Reserve Banks, establishes monetary
policy and monitors the economic health of the economy. Fiduciary - A person, company, or association holding assets in trust for a benefi ciary. The fi duciary is charged with the
responsibility to invest the money prudently for the benefi ciary’s benefi t.Fitch Investor Services - A fi nancial services rating agency.Floating Rate Note - A fi xed principal instrument which has a long or even indefi nite life and whose yield is periodically reset
relative to a reference index rate to refl ect changes in short- or intermediate-term interest rates.Gross Domestic Product - Total fi nal value of goods and services produced in the United States over a particular period or
time, usually one year. The GDP growth rate is the primary indicator of the health of the economy.Hedge - An investment in assets which serves to reduce the risk of adverse price movements in a security, by taking an
offsetting position in a related security, such as an option or short sale. Index - A benchmark used in executing investment strategy which is viewed as an independent representation of market
performance. Example: S&P 500 index.Index Fund – A passively managed fund that tries to mirror the performance of a specifi c index, such as the S&P 500.Infl ation – The overall general upward price movement of goods and services in an economy, usually as measured by the
Consumer Price Index and the Producer Price Index.Investment Income - The equity dividends, bond interest, and/or cash interest paid on an investment.J-Curve - An economic theory stating that a policy designed to have one effect will initially have the opposite effect. With
regard to closed end commingled fund investments, this generally refers to the impact on returns of contributions made in the early portion of a fund’s existence. Invested capital is used to pay fees and organizational costs as well as to make investments in non-income producing enterprises. Such uses negatively impact returns in early periods but are expected to generate increasing income and valuations in the late periods as the previously non-income producing entities start producing income and the relative size of fees and other costs diminish relative to the value of invested capital.
JP Morgan Emerging Markets Bond Index Plus (EMBI+) - An index which tracks total returns for traded external debt instruments in the emerging markets. The instruments include external-currency-denominated Brady bonds, loans and Eurobonds, as well as U.S. dollar local markets instruments. The EMBI+ expands upon Morgan’s original Emerging Markets Bond Index, which was introduced in 1992 and covers only Brady bonds.
LB Aggregate Index - An index made up of Government, Corporate, Mortgage Backed, and Asset Backed securities, all rated investment grade. Returns are market value weighted inclusive of interest. Issues must have at least one year to maturity and an outstanding par value of at least $200 million.
Letter of Credit - An instrument or document issued by a bank, guaranteeing the payment of a customer’s drafts up to a stated amount for a specifi ed period. It substitutes the bank’s credit for the buyer’s and eliminates the seller’s risk.
Liability - The claim on the assets of a company or individual - excluding ownership equity. An obligation that legally binds an individual or company to settle a debt.
Leverage - The use of borrowed funds to increase purchasing power and, ideally, to increase profi tability of an investment transaction or business.
Macaulay Duration - The weighted-average term to maturity of a bond’s cash fl ows. The weighting is based on the present value of each cash fl ow divided by price.
Market Value – A security‘s last reported sale price or its current bid and ask prices. The price as determined dynamically by buyers and sellers in an open market.

STATE OF CONNECTICUT, OFFICE OF THE TREASURER, DENISE L. NAPPIER 137
CONNECTICUT STATE TREASURER’S COMBINED INVESTMENT FUNDSGLOSSARY OF INVESTMENT TERMS (Continued)
Master Custodian - An entity, usually a bank, used for safekeeping of securities and other assets. Responsible for other functions including accounting, performance measurement and securities lending.
Maturity Date - The date on which the principal amount of a bond or other debt instrument becomes payable or due.Mezzanine Debt – Debt that incorporates equity –based options, such as warrants, with a lower – priority debt. MFR Index (iMoneyNet’s First Tier Institutional-only Rated Money Fund Report AveragesTM Index) - An index which
represents an average of the returns of institutional money market mutual funds that invest primarily in fi rst-tier (securities rated A-1, P-1) taxable securities.
Modifi ed Duration - A measure of the price sensitivity of a bond to interest rate movements. It is the primary basis for comparing the effect of interest rate changes on prices of fi xed income securities.
Money Market Fund - An open-ended mutual fund that invests in commercial paper, bankers’ acceptances, repurchase agreements, government securities, certifi cates of deposit, and other highly liquid and safe securities and pays money market rates of interest. The fund’s net asset value remains a constant $1 per share - only the interest rate goes up or down.
Moody’s (Moody’s Investors Service) - A fi nancial services rating agency.MSCI-EAFE - Morgan Stanley Europe Australasia Far East foreign equity index. An arithmetic value weighted average of the
performance of over 900 securities on the stock exchanges of 21 countries on three continents. The index is calculated on a total return basis, which includes reinvestment of dividends net of withholding taxes.
Net Asset Value (NAV) - The total assets (including any valuation gains or losses on investments or currencies) minus total liabilities divided by shares outstanding.
NCREIF (National Council of Real Estate Investment Fiduciaries) - An index consisting of investment-grade, non-agricultural, income-producing properties: apartments, hotels, offi ces, and warehouses. Its return includes appreciation, realized capital gains, and income. It is computed by adding the income return and capital appreciation return generated by the properties in the index, on a quarterly basis.
Par Value - The stated or face value of a stock or bond. It has little signifi cance for common stocks, however, for bonds it specifi es the payment amount at maturity.
Pension Fund - A fund set up by a corporation, labor union, governmental entity, or other organization to pay the pension benefi ts of retired workers.
Percentile - A description of the percentage of the total universe in which portfolio performance is ranked.Price/Book (P/B) - A ratio showing the price of a stock divided by its book value. The P/B measures the multiple at which the
market is capitalizing the net asset value per share of a company at any given time.Price/Earnings (P/E) - A ratio showing the price of a stock divided by its earnings per share. The P/E measures the multiple at
which the market is capitalizing the earnings per share of a company at any given time.Present Value - The current value of a future cash fl ow or series of cash fl ows discounted at an appropriate interest rate or
rates. For example, at a 12% interest rate, the receipt of one dollar a year from now has a present value of $0.89286.Principal - Face value of an obligation, such as a bond or a loan, that must be repaid at maturity.Prudent Person Rule - The standard adopted by some states to guide those fi duciaries with responsibility for investing money
of others. Such fi duciaries must act as a prudent person would be expected to act, with discretion and intelligence, to seek reasonable income, preserve capital, and, in general, avoid speculative investment.
Realized Gain (Loss) - A gain (loss) that has occurred fi nancially. The difference between the principal amount received and the cost basis of an asset realized at sale.
Relative Volatility - The standard deviation of the Fund divided by the standard deviation of its selected benchmark. A relative volatility greater than 1.0 suggests comparatively more volatility in Fund returns than those of the benchmark.
Repurchase Agreements (“Repos”) – A contract in which the seller of securities, such as Treasury Bills, agrees to buy them back at a specifi ed time and price. Repos are widely used as a money market instrument.
Reverse Repurchase Agreements (“Reverse Repos”) - A purchase of securities with an agreement to resell them at a higher price at a specifi c future date.
Return on Equity (ROE) - The net income for the accounting period after payment of preferred stock dividends and before payment of common stock dividends of a company divided by the common stock equity at the beginning of the accounting period.
Risk Adjusted Return - A modifi ed (usually reduced) return which accounts for the cost of a specifi c investment exposure as well as the aggregate risk of such exposure.
Russell 3000 - An equity index comprised of the securities of the 3,000 largest public U.S. companies as determined by total market capitalization. This index represents approximately 98% of the U.S. equity market’s capitalization.

138 COMBINED INVESTMENT FUNDS 2010 COMPREHENSIVE FINANCIAL ANNUAL REPORT
CONNECTICUT STATE TREASURER’S COMBINED INVESTMENT FUNDSGLOSSARY OF INVESTMENT TERMS (Continued)
Securities Lending - A carefully collateralized process of loaning portfolio positions to custodians, dealers, and short sellers who must make physical delivery of positions. Securities lending can reduce custody costs or enhance annual returns by a full percentage point or more in certain market environments.
Soft Dollars - The value of research or other services that brokerage houses and other service entities provide to a client “free of charge” in exchange for the client’s brokerage.
S&P 500 (Standard & Poor’s) – A basket of 500 stocks considered to be widely held. The performance of this index is thought to be representative of the stock market as a whole. The index selects its constituents based upon their market size, liquidity and sector. S&P 500 stocks are considered to be the leading large (to mid) cap corporations in a given sector.
S&P Credit Ratings Service - A fi nancial services rating agency.Standard Deviation - A statistical measure showing the deviation of an individual value in a probability distributed from the
mean (average) of the distribution. The greater the degree of dispersion from the mean rate of return, the higher the standard deviation; therefore, the higher the risk.
Total Fund Benchmark - A hybrid benchmark customized to refl ect the CRPTF’s asset allocation and performance objectives. This benchmark is comprised of 36% Russell 3000 Index; 18% International Stock Fund benchmark; 29% Mutual Fixed Income benchmark; 5% Russell 3000 Index; 11% S&P 500 Index; and 1% MFR First Tier Rated Index. The International Stock Fund benchmark is comprised of 83% Citigroup Europe, Pacifi c, Asia Composite Broad Market Index (50% Hedged) and 17% MSCI Emerging Market Free Index. The Mutual Fixed Income benchmark consists of 73% Lehman Brothers U. S. Aggregate Index, 17% S&P/Citigroup High Yield Market Index, and 10% JPM Emerging Markets Bond Index.
Treasury Bill (T-Bill) - Short-term, highly liquid government securities issued at a discount from the face value and returning the face amount at maturity.
Treasury Bond or Note - Debt obligations of the Federal government that make semiannual coupon payments and are sold at or near par value in denominations of $1,000 or more.
Trust - A fi duciary relationship in which a person, called a trustee, holds title to property for the benefi t of another person, called a benefi ciary.
TUCS - Trust Universe Comparison Service. TUCS is based upon a pooling of quarterly trust accounting data from participating banks and other organizations that provide custody for trust assets.
Turnover - Security purchases or sales divided by the fi scal year’s beginning and ending market values for a given portfolio.Unrealized Gain (Loss) - A profi t (loss) that has not been realized through the sale of a security. The gain (loss) is realized
when a security or futures contract is actually sold or settled.Variable Rate Note - Floating rate notes with a coupon rate adjusted at set intervals, such as daily, weekly, or monthly, based
on different interest rate indices, such as LIBOR, Fed Funds, and Treasury Bills.Volatility - A statistical measure of the tendency of a market price or yield to vary over time. Volatility is said to be high if the
price, yield, or return typically changes dramatically in a short period of time.Yield - The return on an investor’s capital investment.Yield Curve - A graph showing the term structure of interest rates by plotting the yields of all bonds of the same quality
with maturities ranging from the shortest to the longest possible. The Y-axis represents the interest rate and the X-axis represents time, generally with a normal curve that is convex in shape.
Zero Coupon Bond - A bond paying no interest that sells at a discount and returns principal only at maturity.

� � � � � � � � � � � � � � � � � � � � � � � � � � � � � � � � � � � � � � � � � � � � � � � � � � �
� � � � � � � � � � � � ! � � � " � ! � " � " # � � $ % � � � & � � ' � � $ � � � ( � � & � � & � " � ! � & � � ) � � ' � � $ � � � * � " ( � " $ ! � � �+ , - . / 0 1 2 - 3 / ,4 5 6 7 7 8 9 : 6 ; < = 6 7 9 > 7 7 8 7 : 5 8 4 ? 8 @ 7 > ? A B 7 @ C C ? ; @ 9 5 : ; D 8 @ 7 > ? 6 < E C 8 ? F ; ? D @ < 9 8 G 6 < 9 H > = 6 < E ? 6 7 I @ < = ? 8 : > ? < ; F : 5 8 J ; < K< 8 9 : 6 9 > : L 8 : 6 ? 8 D 8 < : M H @ < 7 @ < = 4 ? > 7 : N > < = 7 O J L M 4 N P QR , 0 S . T - U , 0 3 , V W S . X / . Y U , 2 S4 ; D 8 @ 7 > ? 8 7 > 9 9 8 7 7 6 < @ 9 5 6 8 Z 6 < E : 5 8 C ? 6 D @ ? A ; [ \ 8 9 : 6 Z 8 ; F : 5 8 ] 7 7 8 : ] H H ; 9 @ : 6 ; < M H @ < G : 5 8 N > < = B 7 C 8 ? F ; ? D @ < 9 8 6 78 Z @ H > @ : 8 = 6 < : ^ ; C ? 6 < 9 6 C @ H @ ? 8 @ 7 _ ? 6 7 I @ < = ? 8 : > ? < Q 4 5 8 ? 8 7 > H : 7 ; F : 5 8 7 8 ? 8 Z 6 8 ^ 7 G 9 ; > C H 8 = ^ 6 : 5 6 < F ; ? D @ : 6 ; < ; < C ; ? : F ; H 6 ;9 5 @ ? @ 9 : 8 ? 6 7 : 6 9 7 G @ ? 8 > 7 8 = : ; D ; < 6 : ; ? @ < = 6 D C ? ; Z 8 : 5 8 C 8 ? F ; ? D @ < 9 8 ; F : 5 8 N > < = B 7 8 ` : 8 ? < @ H 6 < Z 8 7 : D 8 < : @ = Z 6 7 ; ? 7 Q4 ; [ ? 6 < E @ 9 9 ; > < : @ [ 6 H 6 : A @ < = C 8 ? 7 C 8 9 : 6 Z 8 : ; N > < = C 8 ? F ; ? D @ < 9 8 @ < = D 8 @ 7 > ? 8 D 8 < : 7 ; F ? 6 7 I @ < = ? 8 : > ? < G 4 5 8 J ; < < 8 9 : 6 K9 > : L 8 : 6 ? 8 D 8 < : M H @ < 7 @ < = 4 ? > 7 : N > < = 7 @ ? 8 9 ; D C @ ? 8 = : ; : 5 ; 7 8 ; F 7 6 D 6 H @ ? H A 7 : ? > 9 : > ? 8 = C 8 8 ? E ? ; > C 7 @ < = 6 < = 6 9 8 7 Q 4 5 8 7 89 ; D C @ ? 6 7 ; < 7 8 < @ [ H 8 C H @ < C @ ? : 6 9 6 C @ < : 7 G : 5 8 4 ? 8 @ 7 > ? 8 ? @ < = : 5 8 a < Z 8 7 : D 8 < : ] = Z 6 7 ; ? A J ; > < 9 6 H G : ; = 8 : 8 ? D 6 < 8 ^ 5 8 : 5 8 ? @ < = [ A5 ; ^ D > 9 5 N > < = ? 8 : > ? < 7 8 ` 9 8 8 = 8 = ; ? F 8 H H 7 5 ; ? : ; F : 5 8 [ 8 < 9 5 D @ ? I 7 Q b @ 9 5 N > < = B 7 [ 8 < 9 5 D @ ? I 6 7 7 8 H 8 9 : 8 = ; < : 5 8 [ @ 7 6 7 ; FC ; ? : F ; H 6 ; 9 ; D C ; 7 6 : 6 ; < G 6 < Z 8 7 : D 8 < : 7 : A H 8 G @ < = ; [ \ 8 9 : 6 Z 8 7 QJ ; D C @ ? @ : 6 Z 8 C 8 ? F ; ? D @ < 9 8 6 7 ? 8 Z 6 8 ^ 8 = ; Z 8 ? [ ; : 5 : 5 8 < 8 @ ? K : 8 ? D @ < = : 5 8 H ; < E K : 8 ? D F ; ? : ^ ; ? 8 @ 7 ; < 7 Q N 6 ? 7 : G C 8 < 7 6 ; <D @ < @ E 8 D 8 < : 6 7 G [ A 6 : 7 Z 8 ? A < @ : > ? 8 G @ H ; < E K : 8 ? D C ? ; 9 8 7 7 Q c 5 6 H 8 [ ; : 5 A ; > < E @ < = ; H = 8 D C H ; A 8 8 7 9 ; D C ? 6 7 8 : 5 8 C ; ; H ; F C H @ <[ 8 < 8 d 9 6 @ ? 6 8 7 G : 5 8 @ Z 8 ? @ E 8 @ E 8 ; F C H @ < C @ ? : 6 9 6 C @ < : 7 6 7 ? 8 H @ : 6 Z 8 H A H ; ^ @ < = ? 8 e > 6 ? 8 7 : 5 @ : C H @ < @ 7 7 8 : 7 [ 8 D @ < @ E 8 = F ; ? : 5 8 H ; < E: 8 ? D Q f 8 9 ; < = G @ 7 8 ` C 8 ? 6 8 < 9 8 5 @ 7 7 5 ; ^ < G ? 8 7 > H : 7 @ : : @ 6 < 8 = 6 < : 5 8 7 5 ; ? : : 8 ? D @ ? 8 < ; : < 8 9 8 7 7 @ ? 6 H A @ < 6 < = 6 9 @ : ; ? ; F ? 8 7 > H : 7 : ;[ 8 @ 9 5 6 8 Z 8 = ; Z 8 ? : 5 8 H ; < E : 8 ? D Q M 8 ? F ; ? D @ < 9 8 D > 7 : [ 8 Z 6 8 ^ 8 = 6 < @ [ ? ; @ = 8 ? 9 ; < : 8 ` : Qg Z 8 ? @ H H C 8 ? F ; ? D @ < 9 8 6 7 D 8 @ 7 > ? 8 = [ A 9 @ H 9 > H @ : 6 < E D ; < : 5 H A ? 8 : > ? < 7 @ < = H 6 < I 6 < E : 5 8 D : ; C ? ; Z 6 = 8 ; < 8 K G : 5 ? 8 8 K G d Z 8 K @ < =: 8 < K A 8 @ ? 5 6 7 : ; ? 6 8 7 ; F ; Z 8 ? @ H H 6 < Z 8 7 : D 8 < : C 8 ? F ; ? D @ < 9 8 Q f 5 ; ? : K : 8 ? D C 8 ? F ; ? D @ < 9 8 6 7 D 8 @ 7 > ? 8 = [ A : ; : @ H ? 8 : > ? < ; Z 8 ? ; < 8 K D ; < : 5 Ge > @ ? : 8 ? K 8 < = G @ < = : ? @ 6 H 6 < E ; < 8 K A 8 @ ? : 6 D 8 C 8 ? 6 ; = 7 Q L 6 7 I 6 7 @ H 7 ; D 8 @ 7 > ? 8 = ; Z 8 ? [ ; : 5 7 5 ; ? : K @ < = : 5 8 H ; < E K : 8 ? D C 8 ? 6 ; = 7 Qh i j k4 5 8 D 8 @ 7 > ? 8 D 8 < : ; F ? 6 7 I 6 7 @ 9 ? 6 : 6 9 @ H 9 ; D C ; < 8 < : 6 < 6 < Z 8 7 : D 8 < : D @ < @ E 8 D 8 < : Q a : 6 7 : 5 8 [ @ 7 6 7 F ; ? [ ; : 5 7 : ? @ : 8 E 6 9 = 8 9 6 7 6 ; < KD @ I 6 < E @ < = 6 < Z 8 7 : D 8 < : 8 Z @ H > @ : 6 ; < Q ] 7 @ < 6 < Z 8 7 : D 8 < : : ; ; H G 6 < Z 8 7 : ; ? 7 @ 7 7 > D 8 ? 6 7 I : ; 8 < 5 @ < 9 8 C ; ? : F ; H 6 ; ? 8 : > ? < 7 Q 4 5 8 7 88 < 5 @ < 9 8 D 8 < : 7 G Z 6 8 ^ 8 = @ 7 ? 8 : > ? < 7 6 < 8 ` 9 8 7 7 ; F : 5 ; 7 8 @ Z @ 6 H @ [ H 8 ; < l ? 6 7 I K F ? 8 8 m 6 < Z 8 7 : D 8 < : 7 G 7 > 9 5 @ 7 4 ? 8 @ 7 > ? A n 6 H H 7 G Z @ ? A 6 <D @ E < 6 : > = 8 @ 9 9 ; ? = 6 < E : ; : 5 8 = 8 E ? 8 8 ; F ? 6 7 I @ 7 7 > D 8 = Q o @ < A 6 < Z 8 7 : ; ? 7 F ; 9 > 7 ; < : 5 8 < 8 E @ : 6 Z 8 @ 7 C 8 9 : 7 ; F ? 6 7 I @ < = 6 < = ; 6 < E7 ; F ; ? 8 E ; 7 > [ 7 : @ < : 6 @ H > C 7 6 = 8 C ; : 8 < : 6 @ H G ^ 5 6 9 5 9 @ < 7 6 E < 6 d 9 @ < : H A 8 < 5 @ < 9 8 H ; < E K : 8 ? D ? 8 : > ? < 7 Q 4 5 > 7 G ^ 5 6 H 8 ? 6 7 I 9 @ < < 8 Z 8 ? [ 89 ; D C H 8 : 8 H A 8 H 6 D 6 < @ : 8 = F ? ; D @ C ; ? : F ; H 6 ; G : 5 8 C ? > = 8 < : D @ < @ E 8 D 8 < : ; F ? 6 7 I 9 @ < D @ ` 6 D 6 p 8 6 < Z 8 7 : D 8 < : ? 8 : > ? < 7 @ : @ 9 9 8 C : @ [ H 8H 8 Z 8 H 7 ; F ? 6 7 I QL 6 7 I 9 @ < : @ I 8 7 8 Z 8 ? @ H F ; ? D 7 @ < = 6 < 9 H > = 8 _ D @ ? I 8 : ? 6 7 I G : 5 8 ? 6 7 I ; F q > 9 : > @ : 6 ; < 7 6 < : 5 8 ; Z 8 ? @ H H D @ ? I 8 : F ; ? 7 8 9 > ? 6 : 6 8 7 r9 ; D C @ < A ? 6 7 I G : 5 8 ? 6 7 I ; F 6 < Z 8 7 : 6 < E 6 < @ < A 7 6 < E H 8 9 ; D C @ < A B 7 7 : ; 9 I ; ? [ ; < = 7 r 9 > ? ? 8 < 9 A K 8 ` 9 5 @ < E 8 ? 6 7 I G : 5 8 ? 6 7 I : 5 @ : @ F ; ? 8 6 E <9 ; > < : ? A B 7 9 > ? ? 8 < 9 A D @ A @ C C ? 8 9 6 @ : 8 ; ? = 8 C ? 8 9 6 @ : 8 ? 8 H @ : 6 Z 8 : ; : 5 8 s Q f Q = ; H H @ ? G : 5 > 7 6 D C @ 9 : 6 < E : 5 8 Z @ H > 8 ; F F ; ? 8 6 E < 6 < Z 8 7 : D 8 < : 7 r@ < = C ; H 6 : 6 9 @ H ? 6 7 I G ? 6 7 I 6 < 9 > ? ? 8 = : 5 ? ; > E 5 6 < Z 8 7 : 6 < E 6 < F ; ? 8 6 E < 9 ; > < : ? 6 8 7 ^ 6 : 5 Z ; H @ : 6 H 8 8 9 ; < ; D 6 8 7 @ < = C ; H 6 : 6 9 @ H 7 A 7 : 8 D 7 Qc 6 : 5 ? 8 7 C 8 9 : : ; d ` 8 = 6 < 9 ; D 8 6 < Z 8 7 : D 8 < : 7 G 6 < Z 8 7 : ; ? 7 @ H 7 ; @ 7 7 > D 8 _ ? 8 6 < Z 8 7 : D 8 < : ? 6 7 I G : 5 8 ? 6 7 I : 5 @ : 9 @ 7 5 q ; ^ 7 ? 8 9 8 6 Z 8 =F ? ; D @ 7 8 9 > ? 6 : A ^ 6 H H [ 8 ? 8 6 < Z 8 7 : 8 = @ : H ; ^ 8 ? ? @ : 8 7 = > 8 : ; = 8 9 H 6 < 6 < E 6 < : 8 ? 8 7 : ? @ : 8 7 r 9 ? 8 = 6 : ; ? = 8 F @ > H : ? 6 7 I G : 5 8 ? 6 7 I : 5 @ : : 5 8 6 7 K7 > 8 ? ; F @ d ` 8 = 6 < 9 ; D 8 7 8 9 > ? 6 : A D @ A F @ 6 H : ; D @ I 8 C ? 6 < 9 6 C @ H @ < = 6 < : 8 ? 8 7 : C @ A D 8 < : 7 ; < : 5 8 7 8 9 > ? 6 : A r 6 < : 8 ? 8 7 : ? @ : 8 ? 6 7 I G : 5 8? 6 7 I : 5 @ : C ? 6 9 8 7 ; F d ` 8 = 9 ; > C ; < [ ; < = 7 ^ 6 H H = 8 9 H 6 < 8 6 < : 5 8 8 Z 8 < : ; F ? 6 7 6 < E D @ ? I 8 : 6 < : 8 ? 8 7 : ? @ : 8 7 r @ < = 6 < q @ : 6 ; < ; ? C > ? 9 5 @ 7 6 < EC ; ^ 8 ? ? 6 7 I G : 5 8 ? 6 7 I : 5 @ : : 5 8 ? 8 @ H Z @ H > 8 ; F @ 7 8 9 > ? 6 : A @ < = 6 : 7 9 @ 7 5 q ; ^ 7 D @ A [ 8 ? 8 = > 9 8 = [ A 6 < q @ : 6 ; < Q 4 5 8 H 8 Z 8 H ; F ? 6 7 I6 < 9 > ? ? 8 = 6 < d ` 8 = 6 < 9 ; D 8 6 < Z 8 7 : 6 < E 6 < 9 ? 8 @ 7 8 7 @ 7 : 5 8 6 < Z 8 7 : D 8 < : : 6 D 8 5 ; ? 6 p ; < 6 7 H 8 < E : 5 8 < 8 = Q 4 5 6 7 6 7 = 8 D ; < 7 : ? @ : 8 = [ A : 5 89 ; D C @ ? @ : 6 Z 8 H A 5 6 E 5 8 ? A 6 8 H = 7 @ Z @ 6 H @ [ H 8 ; < l H ; < E [ ; < = 7 G m ; ? [ ; < = 7 D @ : > ? 6 < E 6 < t u : ; v u A 8 @ ? 7 G Z 8 ? 7 > 7 : 5 ; 7 8 @ Z @ 6 H @ [ H 8 ; <7 5 ; ? : K : 8 ? D d ` 8 = 6 < 9 ; D 8 7 8 9 > ? 6 : 6 8 7 Qa < : 5 8 @ H : 8 ? < @ : 6 Z 8 6 < Z 8 7 : D 8 < : 9 @ : 8 E ; ? A G ? 6 7 I 7 @ ? 8 7 6 E < 6 d 9 @ < : H A E ? 8 @ : 8 ? : 5 @ < : 5 ; 7 8 ; F C > [ H 6 9 H A : ? @ = 8 = 6 < Z 8 7 : D 8 < : 7 Q ] 7 K7 8 7 7 D 8 < : ; F C ? ; E ? 8 7 7 6 7 D ; ? 8 : 8 < > ; > 7 @ < = Z @ H > @ : 6 ; < \ > = E D 8 < : 7 @ ? 8 D ; ? 8 9 ; D C H 8 ` Q 4 5 8 6 < Z 8 7 : ; ? @ 7 7 > D 8 7 < ; : ; < H AD @ < @ E 8 D 8 < : G C ? ; = > 9 : G D @ ? I 8 : G @ < = ; C 8 ? @ : 6 ; < 7 ? 6 7 I G 7 6 D 6 H @ ? : ; 8 e > 6 : A 6 < Z 8 7 : 6 < E G [ > : @ H 7 ; @ 7 7 > D 8 7 H 6 e > 6 = 6 : A ? 6 7 I G : 5 8 ? 6 7 I: 5 @ : ; < 8 B 7 6 < Z 8 7 : D 8 < : 9 @ < < ; : [ 8 6 D D 8 = 6 @ : 8 H A H 6 e > 6 = @ : 8 = @ : ; : 5 8 ? : 5 @ < 7 > [ 7 : @ < : 6 @ H H A = 6 7 9 ; > < : 8 = Z @ H > 8 Q

w x y z { | } ~ � � � � � � � � � | � � � � � � � � � y w y z { | � � � � � � � ~ � � � ~ � � � � ~ � � � � � � � � � � � { � �
� � � � � � � � � � � � � � � � � � � � � � � � � � � � � � � � � � � � � � � � � � � � � � � � �¡ ¢ £ ¤ ¥ ¦ § ¨ ¢ £ © ¢ ª © ¢ « ¤ ¦ § ¬ ¤ ¢ § ¤ ¥ ® ¯ ¥ ¬ ¨ ¢ ° ¤± ² ³ ´ µ ¶ ³ ¶ µ ·� ¸ ¹ º » ¼ ½ ¾ º ¿ À º º Á Á º  ¿ ¼ ¸ Á ¾ à ¼ Ä ¸ Å ¿ À º Æ ¸ ¾ ¿ Á ¸ Ç Ã ¸ È ¿ À º É ¸ Ç » ¿ Ã Ç Ã ¿ Ê ¸ Á ¾ º ¿ ½ ¾ Å ¼ à ¼  » Ç Â ½ Ç » ¿ º Ë ¸ É º ¾ ¿ à ¹ º Ì � ¸ Ç » ¿ Ã Ç Ã ¿ Ê È É Ã º Í º Ë » ¼Ë º É Ã » ¿ à ¸ Å ¸ Á ¾ º ¿ ½ ¾ Å ¼ Á ¾ ¸ ¹ » Å » É º ¾ » Î º ¸ Á ¿ À º ¼ º ¾ º ¿ ½ ¾ Å ¼ ¸ É º ¾ ¿ à ¹ º È Ã ¼ ¹ º » ¼ ½ ¾ º Ë ¼ ¿ » ¿ à ¼ ¿ à  » Ç Ç Ê Ï Ê ¼ ¿ » Å Ë » ¾ Ë Ë º É Ã » ¿ à ¸ Å Ì � ¿ » Å Ë » ¾ ËË º É Ã » ¿ à ¸ Å Ã ¼ ¸ Å º ¸ Á ¿ À º ¹ ¸ ¼ ¿ Í Ã Ë º Ç Ê »   º Æ ¿ º Ë » Å Ë Ë º ¼  ¾ Ã Æ ¿ Ã É º ¾ à ¼ Ä ¹ º » ¼ ½ ¾ º ¼ ½ ¼ º Ë Ï Ê Ã Å É º ¼ ¿ ¹ º Å ¿ Æ ¾ ¸ Á º ¼ ¼ à ¸ Å » Ç ¼ ¿ ¸ Ë » Ê Ì ½ Å Ë ¼ Í Ã ¿ À À à ΠÀ ¼ ¿ » Å Ë » ¾ Ë Ë º É Ã » ¿ à ¸ Å ¼ » ¾ º  ¸ Å ¼ Ã Ë º ¾ º Ë ¾ à ¼ Ä Ã º ¾ ¿ À » Å ¿ À ¸ ¼ º Í Ã ¿ À Ç ¸ Í ¼ ¿ » Å Ë » ¾ Ë Ë º É Ã » ¿ à ¸ Å ¼ Ì� ¸ º É » Ç ½ » ¿ º ¿ À º ¼ à ΠŠà Р » Å Â º ¸ Á ¿ À º ½ Å Ë ¼ � ¼ ¿ » Å Ë » ¾ Ë Ë º É Ã » ¿ à ¸ Å È º »  À ½ Å Ë � ¼ ¾ º Ç » ¿ Ã É º É ¸ Ç » ¿ Ã Ç Ã ¿ Ê È ¸ ¾ ¿ À º ¾ » ¿ à ¸ ¸ Á ¿ À º ½ Å Ë � ¼¼ ¿ » Å Ë » ¾ Ë Ë º É Ã » ¿ à ¸ Å ¿ ¸ ¿ À » ¿ ¸ Á ¿ À º Ï º Å Â À ¹ » ¾ Ä Ã ¼  » Ç Â ½ Ç » ¿ º Ë Ì � ¾ º Ç » ¿ Ã É º É ¸ Ç » ¿ Ã Ç Ã ¿ Ê Î ¾ º » ¿ º ¾ ¿ À » Å Ñ Ì Ò Ã Å Ë Ã Â » ¿ º ¼ ¿ À » ¿ ¿ À º ½ Å Ë Ã ¼¹ ¸ ¾ º É ¸ Ç » ¿ Ã Ç º ¿ À » Å ¿ À º Ï º Å Â À ¹ » ¾ Ä Í À Ã Ç º » ¹ º » ¼ ½ ¾ º Ç º ¼ ¼ ¿ À » Å Ñ Ì Ò Ã Å Ë Ã Â » ¿ º ¼ Ç º ¼ ¼ É ¸ Ç » ¿ Ã Ç Ã ¿ Ê Ì � ¾ º Ç » ¿ Ã É º É ¸ Ç » ¿ Ã Ç Ã ¿ Ê ¸ Á Ñ Ì Ò ¼ à ΠŠà ÓÐ º ¼ » Å º Ô ½ » Ç Ë º Î ¾ º º ¸ Á É ¸ Ç » ¿ Ã Ç Ã ¿ Ê Ï º ¿ Í º º Å ¿ À º ½ Å Ë » Å Ë ¿ À º Ï º Å Â À ¹ » ¾ Ä Ì� ¼ » Å º Õ ¿ º Å ¼ à ¸ Å ¸ Á ¼ ¿ » Å Ë » ¾ Ë Ë º É Ã » ¿ à ¸ Å È º »  À ½ Å Ë � ¼ Ï º ¿ » È ¸ ¾ » ¹ º » ¼ ½ ¾ º ¸ Á ¿ À º ¾ º Ç » ¿ Ã É º Æ ¾ à  º Ö ½  ¿ ½ » ¿ à ¸ Å ¸ Á ¿ À º ½ Å Ë¿ ¸ à ¿ ¼ Ï º Å Â À ¹ » ¾ Ä È Ã ¼ » Ç ¼ ¸  » Ç Â ½ Ç » ¿ º Ë Ì � À º ¹ º » ¼ ½ ¾ º ¹ º Å ¿ ¸ Á Ï º ¿ » » Ç Ç ¸ Í ¼ ¸ Å º ¿ ¸ º É » Ç ½ » ¿ º ¿ À º ¼ º Å ¼ à ¿ Ã É Ã ¿ Ê ¸ Á ½ Å Ë ¾ º ¿ ½ ¾ Å ¼ ¿ ¸Î Ã É º Å ¹ ¸ É º ¹ º Å ¿ ¼ à Š¿ À º ¹ » ¾ Ä º ¿ » Å Ë × ¸ ¾ à ¿ ¼ Ï º Å Â À ¹ » ¾ Ä Ì � Ï º ¿ » Î ¾ º » ¿ º ¾ ¿ À » Å Ñ Ì Ò Â ¸ ¹ Æ » ¾ º Ë ¿ ¸ ¿ À º ¼ º Ç º  ¿ º Ë ¹ » ¾ Ä º ¿ Ï º Å Â À Ó¹ » ¾ Ä ¼ à ΠŠà Рº ¼ Î ¾ º » ¿ º ¾ Æ ¾ à  º ¼ º Å ¼ à ¿ Ã É Ã ¿ Ê Í À Ã Ç º » Ï º ¿ » Ç º ¼ ¼ ¿ À » Å Ñ Ì Ò Ã Å Ë Ã Â » ¿ º ¼ Ç º ¼ ¼ ¼ º Å ¼ à ¿ Ã É Ã ¿ Ê Ì� ¸ ¹ º » ¼ ½ ¾ º ¿ À º Ë º Î ¾ º º ¸ Á  ¸ ¾ ¾ º Ç » ¿ à ¸ Å Ï º ¿ Í º º Å ½ Å Ë ¾ º ¿ ½ ¾ Å ¼ » Å Ë ¿ À º Ï º Å Â À ¹ » ¾ Ä È ¿ À º � Ã É Ã ¼ à ¸ Å Â » Ç Â ½ Ç » ¿ º ¼ ¿ À º  ¸ º Á ÓÐ Â Ã º Å ¿ ¸ Á Ë º ¿ º ¾ ¹ à Š» ¿ à ¸ Å È ¸ ¾ � Ø Ì � À à ¼  » Ç Â ½ Ç » ¿ à ¸ Å È Í À à  À à ¼ ½ ¼ º Ë Ã Å Â ¸ Å Ù ½ Å Â ¿ à ¸ Å Í Ã ¿ À Ï º ¿ » È » Ç Ç ¸ Í ¼ ¸ Å º ¿ ¸ º É » Ç ½ » ¿ º À ¸ Í ¹ ½  À¸ Á ¿ À º É ¸ Ç » ¿ Ã Ç Ã ¿ Ê Ã Å ½ Å Ë ¾ º ¿ ½ ¾ Å ¼ à ¼ º Õ Æ Ç » à Šº Ë Ï Ê ¾ º ¿ ½ ¾ Å ¼ à Š¿ À º ¼ º Ç º  ¿ º Ë ¹ » ¾ Ä º ¿ Ï º Å Â À ¹ » ¾ Ä Ì � Å � Ø ¸ Á Ñ Ì Ò Ã Å Ë Ã Â » ¿ º ¼ ¿ À » ¿ ½ Å Ë ¾ º ¿ ½ ¾ Å ¼ » ¾ º Æ º ¾ Á º  ¿ Ç Ê º Õ Æ Ç » à Šº Ë Ï Ê ¾ º ¿ ½ ¾ Å ¼ ¸ Á ¿ À º Ï º Å Â À ¹ » ¾ Ä È Í À Ã Ç º » É » Ç ½ º Ç º ¼ ¼ ¿ À » Å Ñ Ì Ò Ã Å Ë Ã Â » ¿ º ¼ ¿ À » ¿ ¿ À º ¾ º ¿ ½ ¾ Å ¼¸ Á ¿ À º Ï º Å Â À ¹ » ¾ Ä º Õ Æ Ç » à Š¸ Å Ç Ê » Æ ¸ ¾ ¿ à ¸ Å ¸ Á ¿ À º Á ½ Å Ë ¾ º ¿ ½ ¾ Å Ì Ã Å » Ç Ç Ê È ¿ ¸ º É » Ç ½ » ¿ º À ¸ Í Í º Ç Ç º »  À ¸ Á ¿ À º » Ï ¸ É º ¹ º » ¼ ½ ¾ º ¼ »  ¿ ½ » Ç Ç Ê Æ ¾ º Ë Ã Â ¿ º Ë ¾ º ¿ ½ ¾ Å ¼ ¸ Á ¿ À º ½ Å Ë È »  » Ç Â ½ Ç » ¿ à ¸ Å Ã ¼Æ º ¾ Á ¸ ¾ ¹ º Ë ¸ Å ¿ À º ½ Å Ë � ¼ » Ç Æ À » Ì � À à ¼  » Ç Â ½ Ç » ¿ à ¸ Å ¹ º » ¼ ½ ¾ º ¼ ¿ À º » Ï ¼ ¸ Ç ½ ¿ º Ë Ã Á Á º ¾ º Å Â º Ï º ¿ Í º º Å ¿ À º ½ Å Ë � ¼ ¹ ¸ Å ¿ À Ç Ê ¾ º ¿ ½ ¾ Å» Å Ë ¿ À » ¿ Æ ¾ º Ë Ã Â ¿ º Ë Ï Ê Ã ¿ ¼ Ï º ¿ » Ì � ¼ º Ë ¿ ¸ Î º ¿ À º ¾ È ¿ À º ¼ º ¹ º » ¼ ½ ¾ º ¼ Æ ¾ ¸ É Ã Ë º »  ¸ ¹ Æ ¾ º À º Å ¼ Ã É º É Ã º Í ¸ Á » ½ Å Ë � ¼ ¾ º Ç » ¿ Ã É º ¾ à ¼ ÄÆ ¾ ¸ Ð Ç º ÌÚ Û µ Ü Ý Þ� À º ß º Å ¼ à ¸ Å » Å Ë � ¾ ½ ¼ ¿ ½ Å Ë ¼ » ¾ º ¹ » Å » Î º Ë Á ¸ ¾ ¹ » Õ Ã ¹ ½ ¹ ¾ º ¿ ½ ¾ Å Í Ã ¿ À ¹ à Šà ¹ » Ç ¾ à ¼ Ä Ì � º ¿ ½ ¾ Å È É Ã º Í º Ë Ã Å ¿ À à ¼  ¸ Å ¿ º Õ ¿ ÈÃ Å Â Ç ½ Ë º ¼ ¾ º » Ç Ã à º Ë » Å Ë ½ Å ¾ º » Ç Ã à º Ë Î » à Š¼ à Š¿ À º ¹ » ¾ Ä º ¿ É » Ç ½ º ¸ Á » ¼ º  ½ ¾ à ¿ Ê È Ã Å Â Ç ½ Ë Ã Å Î ¿ À ¸ ¼ º » ¿ ¿ ¾ Ã Ï ½ ¿ » Ï Ç º ¿ ¸  ½ ¾ ¾ º Å Â Ê Ö ½  ¿ ½ » Ó¿ à ¸ Å ¼ È » ¼ Í º Ç Ç » ¼ à Š ¸ ¹ º Ë Ã ¼ ¿ ¾ Ã Ï ½ ¿ º Ë Á ¾ ¸ ¹ » ¼ º  ½ ¾ à ¿ Ê ¼ ½  À » ¼ Ë Ã É Ã Ë º Å Ë ¼ » Å Ë Ã Å ¿ º ¾ º ¼ ¿ Ì � º ¿ ½ ¾ Å Ã ¼ ¹ º » ¼ ½ ¾ º Ë ¿ À ¾ ¸ ½ Î À ¿ Í ¸Â » Ç Â ½ Ç » ¿ à ¸ Å ¼ á  ¸ ¹ Æ ¸ ½ Å Ë º Ë » Å Å ½ » Ç ¿ ¸ ¿ » Ç ¾ º ¿ ½ ¾ Å » Å Ë Â ½ ¹ ½ Ç » ¿ Ã É º ¿ ¸ ¿ » Ç ¾ º ¿ ½ ¾ Å Ì� ¸ ¹ Æ ¸ ½ Å Ë º Ë � Å Å ½ » Ç � ¸ ¿ » Ç � º ¿ ½ ¾ Å Ó � À à ¼ ¾ º ¿ ½ ¾ Å ¹ º » ¼ ½ ¾ º º É » Ç ½ » ¿ º ¼ Æ º ¾ Á ¸ ¾ ¹ » Å Â º ¸ É º ¾ ¿ À º ¼ À ¸ ¾ ¿ » Å Ë Ç ¸ Å Î Ó ¿ º ¾ ¹ Ì� ¸ ¹ Æ ¸ ½ Å Ë º Ë » Å Å ½ » Ç ¿ ¸ ¿ » Ç ¾ º ¿ ½ ¾ Å ¹ º » ¼ ½ ¾ º ¼ ¿ À º à ¹ Æ Ç Ã Â Ã ¿ » Å Å ½ » Ç Æ º ¾  º Å ¿ » Î º  À » Å Î º Ã Å É » Ç ½ º ¸ Á » Å Ã Å É º ¼ ¿ ¹ º Å ¿ È » ¼ ¼ ½ ¹ à Šξ º Ã Å É º ¼ ¿ ¹ º Å ¿ ¸ Á Ë Ã É Ã Ë º Å Ë ¼ È Ã Å ¿ º ¾ º ¼ ¿ È » Å Ë ¾ º » Ç Ã à º Ë » Å Ë ½ Å ¾ º » Ç Ã à º Ë Â » Æ Ã ¿ » Ç Î » à Š¼ È Ã Å Â Ç ½ Ë Ã Å Î ¿ À ¸ ¼ º » ¿ ¿ ¾ Ã Ï ½ ¿ » Ï Ç º ¿ ¸  ½ ¾ ¾ º Å Â ÊÖ ½  ¿ ½ » ¿ à ¸ Å ¼ Ì � Å º Á Á º  ¿ È Â ¸ ¹ Æ ¸ ½ Å Ë º Ë » Å Å ½ » Ç ¿ ¸ ¿ » Ç ¾ º ¿ ½ ¾ Å â ¼ ¹ ¸ ¸ ¿ À º ¼ ã Ö ½  ¿ ½ » ¿ à ¸ Å ¼ Ã Å Ç ¸ Å Î Ó ¿ º ¾ ¹ Ã Å É º ¼ ¿ ¹ º Å ¿ ¾ º ¿ ½ ¾ Å ¼ ¿ ¸ Ë º ¾ Ã É º» Å Ã ¹ Æ Ç Ã º Ë Ê º » ¾ Ó ¿ ¸ Ó Ê º » ¾ » Å Å ½ » Ç ¾ º ¿ ½ ¾ Å Ì� ½ ¹ ½ Ç » ¿ Ã É º � ¸ ¿ » Ç � º ¿ ½ ¾ Å Ó � À à ¼  » Ç Â ½ Ç » ¿ à ¸ Å ¹ º » ¼ ½ ¾ º ¼ ¿ À º » Ï ¼ ¸ Ç ½ ¿ º Æ º ¾  º Å ¿ » Î º  À » Å Î º Ã Å É » Ç ½ º ¸ Á » Å Ã Å É º ¼ ¿ ¹ º Å ¿ ¸ É º ¾» ¼ Æ º  à Рº Ë Æ º ¾ à ¸ Ë È » ¼ ¼ ½ ¹ à ŠΠ¾ º Ã Å É º ¼ ¿ ¹ º Å ¿ ¸ Á Ë Ã É Ã Ë º Å Ë ¼ È Ã Å ¿ º ¾ º ¼ ¿ à Š ¸ ¹ º È » Å Ë ¾ º » Ç Ã à º Ë Â » Æ Ã ¿ » Ç Î » à Š¼ Ì ä À Ã Ç º ¿ À à ¼  » Ç Â ½ Ç » Ó¿ à ¸ Å Ë ¸ º ¼ Å ¸ ¿ â ¼ ¹ ¸ ¸ ¿ À ã Ê º » ¾ Ó ¿ ¸ Ó Ê º » ¾ Ö ½  ¿ ½ » ¿ à ¸ Å ¼ Ã Å Ç ¸ Å Î Ó ¿ º ¾ ¹ ¾ º ¿ ½ ¾ Å ¼ ¿ ¸ Ë º ¾ Ã É º à ¹ Æ Ç Ã º Ë » Å Å ½ » Ç Æ º ¾ Á ¸ ¾ ¹ » Å Â º È Â ½ ¹ ½ Ç » ¿ Ã É º¿ ¸ ¿ » Ç ¾ º ¿ ½ ¾ Å » Ç Ç ¸ Í ¼ ¸ Å º ¿ ¸ ¼ º º ¸ Å » Å » Ï ¼ ¸ Ç ½ ¿ º Ï » ¼ à ¼ ¿ À º Æ º ¾  º Å ¿ » Î º à Š ¾ º » ¼ º à Š¿ À º ¿ ¸ ¿ » Ç ½ Å Ë � ¼ É » Ç ½ º ¸ É º ¾ » ¼ Æ º  à Рº Ë¿ à ¹ º Ì � à º Í º Ë Î ¾ » Æ À à  » Ç Ç Ê È Â ½ ¹ ½ Ç » ¿ Ã É º ¿ ¸ ¿ » Ç ¾ º ¿ ½ ¾ Å ¼ À ¸ Í ¼ ¸ Å º Í À » ¿ » å Ñ Ò ¹ Ã Ç Ç Ã ¸ Å Ã Å É º ¼ ¿ ¹ º Å ¿ à Š¿ À º � � ß � » ¼ º ¿ Å ½ ¹ Ï º ¾¸ Á Ê º » ¾ ¼ » Î ¸ Í ¸ ½ Ç Ë Ï º Í ¸ ¾ ¿ À ¿ ¸ Ë » Ê Ì

StatisticalSection

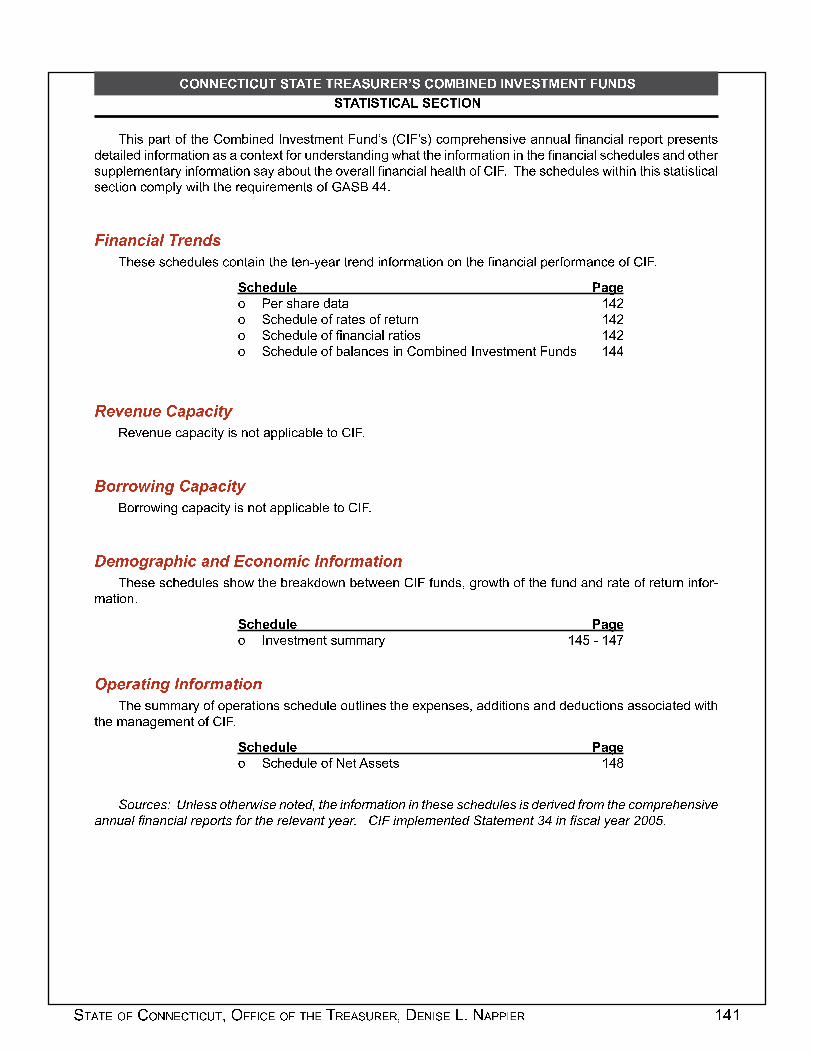
� � � � � � � � � � � � � � � � � � � � � � � � � � � � � � � � � � � � � � � � � � � � � � � � � � �
� � � � � � � � � � � � � � � � ! � � � ! � ! " � � � # $ � � � % � � & � � � # � � � ' � � % �� � � � � � � � ( � � � � � � �) * + , - . / 0 1 2 0 * 3 4 1 5 6 + 7 3 8 9 7 : 3 , 0 5 3 7 0 ; < 7 8 = , > 4 9 ; = , ? @ 1 5 - / 3 * 3 7 , + : 3 . 7 7 < . A B 7 . 7 @ + . A / 3 - 1 / 0 - / 3 , 3 7 0 ,8 3 0 . + A 3 8 + 7 2 1 / 5 . 0 + 1 7 . , . @ 1 7 0 3 C 0 2 1 / < 7 8 3 / , 0 . 7 8 + 7 D E * . 0 0 * 3 + 7 2 1 / 5 . 0 + 1 7 + 7 0 * 3 B 7 . 7 @ + . A , @ * 3 8 < A 3 , . 7 8 1 0 * 3 /, < - - A 3 5 3 7 0 . / F + 7 2 1 / 5 . 0 + 1 7 , . F . 6 1 < 0 0 * 3 1 : 3 / . A A B 7 . 7 @ + . A * 3 . A 0 * 1 2 4 9 ; G ) * 3 , @ * 3 8 < A 3 , E + 0 * + 7 0 * + , , 0 . 0 + , 0 + @ . A, 3 @ 0 + 1 7 @ 1 5 - A F E + 0 * 0 * 3 / 3 H < + / 3 5 3 7 0 , 1 2 I J K L M M GN O P Q P R O Q S T U V P W X) * 3 , 3 , @ * 3 8 < A 3 , @ 1 7 0 . + 7 0 * 3 0 3 7 Y F 3 . / 0 / 3 7 8 + 7 2 1 / 5 . 0 + 1 7 1 7 0 * 3 B 7 . 7 @ + . A - 3 / 2 1 / 5 . 7 @ 3 1 2 4 9 ; G� Z [ \ ] ^ _ \ ` a b \1 c 3 / , * . / 3 8 . 0 . d M e1 K @ * 3 8 < A 3 1 2 / . 0 3 , 1 2 / 3 0 < / 7 d M e1 K @ * 3 8 < A 3 1 2 B 7 . 7 @ + . A / . 0 + 1 , d M e1 K @ * 3 8 < A 3 1 2 6 . A . 7 @ 3 , + 7 4 1 5 6 + 7 3 8 9 7 : 3 , 0 5 3 7 0 ; < 7 8 , d M Mf V g V P h V i Q j Q R O k lm 3 : 3 7 < 3 @ . - . @ + 0 F + , 7 1 0 . - - A + @ . 6 A 3 0 1 4 9 ; Gn o U U o p O P q i Q j Q R O k lL 1 / / 1 E + 7 D @ . - . @ + 0 F + , 7 1 0 . - - A + @ . 6 A 3 0 1 4 9 ; Gr V s o q U Q j t O R Q P W u R o P o s O R v P w o U s Q k O o P) * 3 , 3 , @ * 3 8 < A 3 , , * 1 E 0 * 3 6 / 3 . x 8 1 E 7 6 3 0 E 3 3 7 4 9 ; 2 < 7 8 , y D / 1 E 0 * 1 2 0 * 3 2 < 7 8 . 7 8 / . 0 3 1 2 / 3 0 < / 7 + 7 2 1 / Y5 . 0 + 1 7 G � Z [ \ ] ^ _ \ ` a b \1 9 7 : 3 , 0 5 3 7 0 , < 5 5 . / F d M z Y d M {| j V U Q k O P q v P w o U s Q k O o P) * 3 , < 5 5 . / F 1 2 1 - 3 / . 0 + 1 7 , , @ * 3 8 < A 3 1 < 0 A + 7 3 , 0 * 3 3 C - 3 7 , 3 , y . 8 8 + 0 + 1 7 , . 7 8 8 3 8 < @ 0 + 1 7 , . , , 1 @ + . 0 3 8 E + 0 *0 * 3 5 . 7 . D 3 5 3 7 0 1 2 4 9 ; G � Z [ \ ] ^ _ \ ` a b \1 K @ * 3 8 < A 3 1 2 } 3 0 J , , 3 0 , d M ~� � � � � � � � � � � � � � � � � � � � � � � � � � � � � � � � � � � � � � � � � � � � � � � � � � � � � � � � � � � � � � � � � � � � � � � � � � � � � � � � � � � � � � � �� � � � � � � � � � � � � � � � � � � � � � � � � � � � � � � � � � � � � � � � � � � � � � � � � � � � � � � � � � � � � � � � � � � � � � � � � � � � � � � � �

142 COMBINED INVESTMENT FUNDS 2010 COMPREHENSIVE FINANCIAL ANNUAL REPORT
CONNECTICUT STATE TREASURER’S COMBINED INVESTMENT FUNDS
SUPPLEMENTAL SCHEDULE OF FINANCIAL HIGHLIGHTS LIQUIDITY FUND MUTUAL EQUITY FISCAL YEAR ENDED JUNE 30, 2010 2009 2008 2007 2006 2010 2009 2008 2007 2006PER SHARE DATA Net Asset Value- Beginning of Period $1.00 $1.00 $- $- $- $648.30 $927.68 $1,085.16 $933.70 $858.25
INTRAFUND TRANSFER IN (OUT) - - - - - - - - - -
INCOME FROM INVESTMENT OPERATIONS Net Investment Income (Loss) 0.01 0.02 - - - 10.86 16.89 16.87 18.04 13.66 Net Gains or (Losses) on Securities (Both Realized and Unrealized) - - - - - 79.56 (279.76) (156.38) 151.06 74.43 Total from Investment Operations 0.01 0.02 - - - 90.42 (262.87) (139.51) 169.10 88.09 LESS DISTRIBUTIONSDividends from Net Investment Income (0.01) (0.02) - - - (11.74) (16.51) (17.97) (17.64) (12.64)Net Asset Value - End of Period $1.00 $1.00 $- $- $- $726.98 $648.30 $927.68 $1,085.16 $933.70 TOTAL RETURN 0.98% 1.54% 0.00% 0.00% 0.00% 14.01% -28.68% -12.99% 18.24% 10.27%
RATIOS Net Assets - End of Period ($000,000 Omitted) $2,219 $2,171 $- $- $- $5,289 $5,590 $7,999 $9,818 $8,982Ratio of Expenses to Average Net Assets (excl. sec. lending fees & rebates) 0.15% 0.04% 0.00% 0.00% 0.00% 0.24% 0.14% 0.26% 0.12% 0.32%Ratio of Expenses to Average Net Assets 0.15% 0.04% 0.00% 0.00% 0.00% 0.27% 0.30% 0.80% 0.75% 0.66%Ratio of Net Investment Income ( Loss) to Average Net Assets 0.70% 1.55% 0.00% 0.00% 0.00% 1.58% 2.14% 1.68% 1.83% 1.53%
MUTUAL FIXED INCOME CORE FIXED INCOME FISCAL YEAR ENDED JUNE 30, 2010 2009 2008 2007 2006 2010 2009 2008 2007 2006PER SHARE DATA Net Asset Value- Beginning of Period $- $- $114.53 $112.04 $116.37 $110.56 $113.86 $- $- $-
INTRAFUND TRANSFER IN (OUT) - - (116.90) - - - - - 115.45 - -
INCOME FROM INVESTMENT OPERATIONS Net Investment Income (Loss) - - 2.00 6.23 5.92 4.92 5.30 4.09 - - Net Gains or (Losses) on Securities (Both Realized and Unrealized) - - 2.08 1.53 (4.98) 7.88 (2.44) (1.44) - - Total from Investment Operations - - 4.08 7.76 0.94 12.80 2.86 2.65 - - LESS DISTRIBUTIONSDividends from Net Investment Income - - (1.71) (5.27) (5.27) (5.49) (6.16) (4.24) - - Net Asset Value - End of Period $- $- $- $114.53 $112.04 $117.87 $110.56 $113.86 $- $- TOTAL RETURN 0.00% 0.00% 0.00% 6.92% 0.77% 11.81% 2.84% 5.65% 0.00% 0.00%
RATIOS Net Assets - End of Period ($000,000 Omitted) $- $- $- $7,594 $6,419 $2,701 $3,160 $4,537 $- $- Ratio of Expenses to Average Net Assets (excl. sec. lending fees & rebates) - - - 0.13% 0.13% 0.15% 0.14% 0.20% - - Ratio of Expenses to Average Net Assets - - - 1.01% 0.90% 0.20% 031% 1.30% - - Ratio of Net Investment Income ( Loss) to Average Net Assets - - - 5.19% 5.19% 4.18% 4.62% 8.62% - -
INFLATION LINKED BOND EMERGING MARKET DEBT FISCAL YEAR ENDED JUNE 30, 2010 2009 2008 2007 2006 2010 2009 2008 2007 2006PER SHARE DATA Net Asset Value- Beginning of Period $128.08 $131.19 $- $- $- $108.68 $118.78 $- $- $-
INTRAFUND TRANSFER IN (OUT) - - $120.07 - - - - 121.80 - -
INCOME FROM INVESTMENT OPERATIONSNet Investment Income (Loss) 4.87 2.21 10.41 - - 9.02 10.90 4.34 - - Net Gains or (Losses) on Securities (Both Realized and Unrealized) 7.39 (2.11) 2.15 - - 15.68 (15.89) (5.90) - - Total from Investment Operations 12.26 0.10 12.56 - - 24.70 (4.99) (1.56) - - LESS DISTRIBUTIONSDividends from Net Investment Income (2.90) (3.21) (1.44) - - (4.88) (5.11) (1.46) - - Net Asset Value - End of Period $137.44 $128.08 $131.19 $- $- $128.50 $108.68 $118.78 $- $- TOTAL RETURN 9.48% -0.20% 16.81% 0.00% 0.00% 23.02% -3.62% 5.59% 0.00% 0.00%
RATIOS Net Assets - End of Period ($000,000 Omitted) $1,063 $837 $1,173 $- $- $1,176 $1,132 $1,047 $- $- Ratio of Expenses to Average Net Assets (excl. sec. lending fees & rebates) 0.13% 0.11% 0.07% - - 0.43% 0.32% 0.32% - - Ratio of Expenses to Average Net Assets 0.35% 0.76% 0.55% - - 0.43% 0.35% 0.40% - - Ratio of Net Investment Income ( Loss) to Average Net Assets 3.59% 1.79% 5.45% - - 7.55% 8.93% 5.16% - -
Source: Amounts were derived from custodial records.

STATE OF CONNECTICUT, OFFICE OF THE TREASURER, DENISE L. NAPPIER 143
SUPPLEMENTAL SCHEDULE OF FINANCIAL HIGHLIGHTS (Continued)
CONNECTICUT STATE TREASURER’S COMBINED INVESTMENT FUNDS
HIGH YIELD DEBT INTERNATIONAL STOCKFISCAL YEAR ENDED JUNE 30, 2010 2009 2008 2007 2006 2010 2009 2008 2007 2006PER SHARE DATANet Asset Value- Beginning of Period $98.48 $112.63 $- $- $- $- $- $442.47 $347.57 $282.09
INTRAFUND TRANSFER IN (OUT) - - $119.44 - - - - (473.81) - -
INCOME FROM INVESTMENT OPERATIONSNet Investment Income (Loss) 9.33 9.72 5.41 - - - - 2.41 9.09 7.91 Net Gains or (Losses) on Securities (Both Realized and Unrealized) 14.19 (15.60) (7.68) - - - - 31.53 92.81 64.29 Total from Investment Operations 23.52 (5.88) (2.27) - - - - 33.94 101.90 72.20 LESS DISTRIBUTIONSDividends from Net Investment Income (8.31) (8.27) (4.54) - - - - (2.60) (7.00) (6.72) Net Asset Value - End of Period $113.69 $98.48 $112.63 $- $- $- $- $0.00 $442.47 $347.57TOTAL RETURN 24.54% -4.59% -1.88% 0.00% 0.00% 0.00% 0.00% 0.00% 29.65% 25.69%
RATIOS Net Assets - End of Period ($000,000 Omitted) $693 $733 $759 $- $- $- $- $- $6,021 $5,357 Ratio of Expenses to Average Net Assets (excl. sec. lending fees & rebates) 0.39% 0.32% 0.45% - - - - - 0.52% 0.53% Ratio of Expenses to Average Net Assets 0.43% 0.48% 1.03% - - - - - 1.19% 1.19%Ratio of Net Investment Income ( Loss) to Average Net Assets 8.92% 9.08% 9.37% - - - - - 2.42% 2.51%
DEVELOPED MARKET INTERNATIONAL EMERGING MARKET INTERNATIONAL STOCKFISCAL YEAR ENDED JUNE 30, 2010 2009 2008 2007 2006 2010 2009 2008 2007 2006PER SHARE DATA Net Asset Value- Beginning of Period $270.69 $384.58 $- $- $- $264.93 $389.39 $- $- $-
INTRAFUND TRANSFER IN (OUT) - - 478.96 - - - - 474.35 - -
INCOME FROM INVESTMENT OPERATIONSNet Investment Income (Loss) 6.97 8.45 9.49 - - 6.05 6.72 18.06 - - (Both Realized and Unrealized) 23.23 (114.67) (97.18) - - 61.21 (126.78) (100.62) - - Total from Investment Operations 30.20 (106.22) (87.69) - - 67.26 (120.06) (82.56) - - LESS DISTRIBUTIONSDividends from Net Investment Income (5.31) (7.67) (6.69) - - (4.44) (4.40) (2.40) - - Net Asset Value - End of Period $295.58 $270.69 $384.58 $- $- $327.75 $264.93 $389.39 $- $- TOTAL RETURN 11.03% -27.98% -14.60% 0.00% 0.00% 25.23% -30.90% 0.19% 0.00% 0.00%
RATIOS Net Assets - End of Period ($000,000 Omitted) $4,435 $4,416 $5,108 $- $- $2,073 $1,147 $1,304 $- $- Ratio of Expenses to Average Net Assets (excl. sec. lending fees & rebates) 0.54% 0.41% 0.54% - - 0.87% 0.59% 0.99% - - Ratio of Expenses to Average Net Assets 0.57% 0.49% 0.96% - - 0.89% 0.67% 1.38% - - Ratio of Net Investment Income ( Loss) to Average Net Assets 2.49% 2.51% 3.92% - - 2.15% 2.08% 9.28% - -
REAL ESTATE COMMERCIAL MORTGAGEFISCAL YEAR ENDED JUNE 30, 2010 2009 2008 2007 2006 2010 2009 2008 2007 2006PER SHARE DATANet Asset Value- Beginning of Period $38.76 $55.48 $55.10 $56.53 $62.31 $49.48 $55.58 $54.86 $59.31 $58.76
INTRAFUND TRANSFER IN (OUT) - - - - - - - - - -
INCOME FROM INVESTMENT OPERATIONSNet Investment Income (Loss) 0.88 0.86 3.41 0.81 0.86 3.76 3.71 4.25 4.18 5.41 Net Gains or (Losses) on Securities (Both Realized and Unrealized) (8.62) (16.51) 0.13 6.98 2.84 (0.51) (5.39) 1.26 (0.88) (0.10)Total from Investment Operations (7.74) (15.65) 3.54 7.79 3.70 3.25 (1.68) 5.51 3.30 5.31 LESS DISTRIBUTIONSDividends from Net Investment Income (0.62) (1.07) (3.16) (9.22) (9.48) (4.22) (4.42) (4.79) (7.75) (4.76)) Net Asset Value - End of Period $30.40 $38.76 $55.48 $55.10 $56.53 $48.51 $49.48 $55.58 $54.86 $59.31 TOTAL RETURN -20.18% -28.66% 6.04% 14.21% 7.09% 6.75% -3.14% 12.05% 8.17% 9.69%
IRATIOS Net Assets - End of Period ($000,000 Omitted) $784 $770 $1,002 $686 $399 $4 $5 $7 $8 $18 Ratio of Expenses to Average Net Assets (excl. sec. lending fees & rebates) 0.51% 0.52% 0.48% 0.25% 0.41% 1.21% 1.53% 1.16% 0.82% 1.03%Ratio of Expenses to Average Net Assets 0.51% 0.52% 0.48% na na 1.21% 1.53% 1.16% na naRatio of Net Investment Income ( Loss) to Average Net Assets 2.54% 1.80% 6.42% 1.45% 1.39% 7.77% 7.09% 7.77% 5.65% 9.23%
Source: Amounts were derived from custodial records.

144 COMBINED INVESTMENT FUNDS 2010 COMPREHENSIVE FINANCIAL ANNUAL REPORT
CONNECTICUT STATE TREASURER’S COMBINED INVESTMENT FUNDS
SUPPLEMENTAL SCHEDULE OF FINANCIAL HIGHLIGHTS (Continued) PRIVATE INVESTMENT FISCAL YEAR ENDED JUNE 30, 2010 2009 2008 2007 2006PER SHARE DATANet Asset Value- Beginning of Period $44.43 $54.85 $56.43 $55.35 $57.45
INTRAFUND TRANSFER IN (OUT) - - - - -
INCOME FROM INVESTMENT OPERATIONSNet Investment Income (Loss) 2.97 1.83 8.15 8.47 8.69 Net Gains or (Losses) on Securities (Both Realized and Unrealized) 4.59 (9.99) (0.92) 1.29 (2.45)Total from Investment Operations 7.56 (8.16) 7.23 9.76 6.24 LESS DISTRIBUTIONSDividends from Net Investment Income (2.36) (2.26) (8.81) (8.68) (8.34)) Net Asset Value - End of Period $49.63 $44.43 $54.85 $56.43 $55.35 TOTAL RETURN 17.32% -16.36% 13.66% 19.56% 11.74%
IRATIOS Net Assets - End of Period ($000,000 Omitted) $2,014 $1,627 $1,795 $1,564 $1,360 Ratio of Expenses to Average Net Assets (excl. sec. lending fees & rebates) 0.55% 0.54% 0.66% 0.36% 0.43%Ratio of Expenses to Average Net Assets 0.55% 0.54% 0.66% na naRatio of Net Investment Income ( Loss) to Average Net Assets 6.37% 2.76% 14.65% 14.97% 15.32%
Source: Amounts were derived from custodial records.

STATE OF CONNECTICUT, OFFICE OF THE TREASURER, DENISE L. NAPPIER 145
CO
NN
ECTI
CU
T ST
ATE
TREA
SUR
ER’S
CO
MB
INED
INVE
STM
ENT
FUN
DS
PEN
SIO
N A
ND
TR
UST
FU
ND
SB
ALA
NC
ES IN
CO
MB
INED
INVE
STM
ENT
FUN
DS
(Dol
lars
in T
hous
ands
)
20
10
Perc
ent o
f Fu
nd N
ame
Pens
ion
Plan
s To
tal S
yste
m
Ass
ets
LF
MEF
FI
F C
FIF
ILB
F EM
DF
HYD
F IS
F D
MIS
F EM
ISF
REF
C
MF
PIF
Teac
hers
’ Ret
irem
ent F
und
56.1
2%
$12,
273.
6 $9
80.3
$2
,988
.2
$0.0
$1
,421
.5
$548
.9
$656
.0
$384
.1
$0.0
$2
,544
.9
$1,1
69.2
$4
41.5
$2
.1
$1,1
36.8
S
tate
Em
ploy
ees’
Ret
irem
ent F
und
35.6
2%
7,78
9.6
492.
3 1,
973.
4 0.
0 91
5.9
351.
3 42
0.1
247.
2 0.
0 1,
627.
2 75
4.8
282.
6 1.
5 72
3.5
Mun
icip
al E
mpl
oyee
s’ R
etire
men
t Fun
d 6.
72%
1,
470.
6 14
6.5
270.
9 0.
0 25
2.3
136.
1 78
.2
44.9
0.
0 22
8.2
129.
0 51
.3
0.2
133.
0S
tate
Jud
ges’
Ret
irem
ent F
und
0.69
%
149.
8 8.
0 29
.1
0.0
26.7
16
.1
8.3
4.7
0.0
23.7
13
.8
5.3
0.0
14.0
The
Pro
bate
Cou
rt R
etire
men
t Fun
d 0.
33%
71
.8
6.6
13.7
0.
0 12
.4
6.7
3.8
2.2
0.0
11.0
6.
3 2.
5 0.
0 6.
5S
tate
’s A
ttorn
eys
Ret
irem
ent F
und
0.00
%
1.0
0.2
0.2
0.0
0.5
0.0
0.1
0.1
0.0
0.0
0.0
0.0
0.0
0.0
Trus
t Fun
ds
0.52
%
113.
2 4.
0 13
.7
0.0
72.0
3.
8 9.
4 9.
6 0.
0 0.
0 0.
0 0.
7 0.
0 0.
0
100.
00%
$2
1,86
9.6
$1
,637
.9
$5,2
89.2
$0
.0
$2,7
01.3
$1,
062.
9 $1
,175
.9
$692
.8
$0.0
$4
,435
.0
$2,0
73.1
$7
83.9
$3
.8
$2,0
13.8
20
01
Perc
ent o
f Fu
nd N
ame
Pens
ion
Plan
s To
tal S
yste
m
Ass
ets
LF
MEF
FI
F C
FIF
ILB
F EM
DF
HYD
F IS
F D
MIS
F EM
ISF
REF
C
MF
PIF
Teac
hers
’ Ret
irem
ent F
und
54.4
1%
$11,
204.
0
$243
.1
$4,3
37.1
$3
,525
.2
$0.0
$0
.0
$0.0
$0
.0 $
1,36
6.3
$0
.0
$0.0
$2
59.4
$55
.2
$1,4
17.7
Sta
te E
mpl
oyee
s’ R
etire
men
t Fun
d 37
.81%
7,
785.
1 88
.7
3,00
1.2
2,51
1.4
0.0
0.0
0.0
0.0
964.
7 0.
0 0.
0 18
3.2
38.9
99
7.1
Mun
icip
al E
mpl
oyee
s’ R
etire
men
t Fun
d 6.
30%
1,
297.
7
41.8
49
6.6
406.
2 0.
0 0.
0 0.
0 0.
0 14
8.0
0.0
0.0
28.7
6.
1 17
0.4
Sta
te J
udge
s’ R
etire
men
t Fun
d 0.
66%
13
5.8
5.
8 49
.5
45.3
0.
0 0.
0 0.
0 0.
0 14
.6
0.0
0.0
2.6
0.6
17.2
The
Pro
bate
Cou
rt R
etire
men
t Fun
d 0.
32%
66
.7
2.5
25.3
22
.7
0.0
0.0
0.0
0.0
9.2
0.0
0.0
1.6
0.4
5.0
Sta
te’s
Atto
rney
s R
etire
men
t Fun
d 0.
00%
0.
7
0.1
0.4
0.2
0.0
0.0
0.0
0.0
0.0
0.0
0.0
0.0
0.0
0.0
Trus
t Fun
ds
0.50
%
103.
2
7.5
20
.4
74.8
0.
0
0.0
0.
0
0.0
0.
0
0.0
0.
0
0.4
0.1
0.
0
100.
00%
$20
,593
.2
$389
.5
$7,9
30.5
$6
,585
.8
$0.0
$0
.0
$0.0
$0
.0 $
2,50
2.8
$0
.0
$0.0
$4
75.9
$10
1.3
$2,
607.
40
LF
Liqu
idity
Fun
d (fo
rmer
ly C
ash
Res
erve
Acc
ount
)M
EF
Mut
ual E
quity
Fun
dFI
F Fi
xed
Inco
me
Fund
CFI
F C
ore
Fixe
d In
com
e Fu
ndIL
BF
Infl a
tion
Link
ed B
ond
Fund
EM
DF
Em
ergi
ng M
arke
t Deb
t Fun
dH
YD
F H
igh
Yiel
d D
ebt F
und
ISF
Inte
rnat
iona
l Sto
ck F
und
DM
ISF
Dev
elop
ed M
arke
t Int
erna
tiona
l Sto
ck F
und
EM
ISF
Em
ergi
ng M
arke
t Int
erna
tiona
l Sto
ck F
und
RE
F R
eal E
stat
e Fu
ndC
MF
Com
mer
cial
Mor
tgag
e Fu
ndP
IF
Priv
ate
Inve
stm
ent F
und
(form
erly
Ven
ture
Cap
ital F
und)
So
urce
: Am
ount
s w
ere
derv
ied
from
cus
todi
al re
cord
s.

146 COMBINED INVESTMENT FUNDS 2010 COMPREHENSIVE FINANCIAL ANNUAL REPORT
CONNECTICUT STATE TREASURER’S COMBINED INVESTMENT FUNDS
INVESTMENT SUMMARY AT JUNE 30, 2010 (1)
Liquidity Fund (2) Mutual Equity Fund Book Market % of Total Rate of Book Market % of Total Rate of Value Value Fund MV Return Value Value Fund MV Return
2010 $1,626,177,183 $1,621,182,259 7.44% 0.98% $5,175,570,747 $5,288,853,566 24.28% 14.01%2009 952,212,787 $950,605,428 4.65% 1.54% 6,019,782,554 5,588,272,211 27.35% -28.36%2008 1,140,821,830 1,140,821,830 4.36% 4.59% 7,563,373,750 8,017,007,807 30.68% -12.99%2007 236,297,695 236,297,695 0.88% 5.61% 7,628,304,018 9,810,773,724 36.64% 18.24%2006 280,548,978 280,548,978 1.20% 4.51% 7,501,163,477 8,983,043,768 38.25% 10.29%2005 395,948,288 395,948,288 1.84% 2.36% 6,991,797,244 8,284,992,409 38.40% 8.06%2004 363,170,856 363,170,856 1.76% 1.28% 6,544,070,199 7,779,104,677 37.67% 20.86%2003 710,832,993 710,832,993 3.75% 1.80% 6,047,280,312 6,603,061,918 34.77% 0.48%2002 481,664,484 481,664,484 2.46% 3.03% 6,401,472,709 6,688,728,705 34.20% -14.95%2001 391,346,777 391,346,777 1.85% 6.35% 6,649,619,519 7,949,775,481 37.49% -9.55%
Mutual Fixed Income Fund (6) Core Fixed Income Fund (6)
Book Market % of Total Rate of Book Market % of Total Rate of Value Value Fund MV Return Value Value Fund MV Return
2010 $ - $ - - - $2,682,943,303 $2,789,605,943 12.81% 11.81%2009 - - - - $3,400,625,343 $3,215,718,047 15.74% 2.84%2008 - - - - 4,979,684,914 4,851,300,830 18.57% 5.65%2007 8,604,509,537 8,537,943,917 31.89% 6.92% - - - -2006 7,179,817,139 7,052,537,386 30.03% 0.77% - - - -2005 6,567,168,651 6,662,163,634 30.88% 7.70% - - - -2004 6,368,703,625 6,325,884,136 30.63% 2.79% - - - -2003 7,082,889,175 7,308,417,293 38.49% 12.03% - - - -2002 7,412,105,698 7,295,007,838 37.30% 5.64% - - - -2001 7,363,064,249 7,218,746,648 34.04% 8.03% - - - -
Infl ation Linked Bond Fund (6) Emerging Market Debt Fund (6)
Book Market % of Total Rate of Book Market % of Total Rate of Value Value Fund MV Return Value Value Fund MV Return
2010 $1,033,720,440 $1,070,660,872 4.91% 9.48% $1,082,027,071 $1,155,351,613 5.30% 23.02%2009 813,926,651 829,543,021 4.06% -0.20% 1,153,012,696 1,125,226,197 5.51% -3.62%2008 1,152,973,047 1,162,545,028 4.45% 16.81% 1,006,342,436 1,040,295,964 3.98% 5.59%2007 - - - - - - - -2006 - - - - - - - -2005 - - - - - - - -2004 - - - - - - - -2003 - - - - - - - -2002 - - - - - - - -2001 - - - - - - - -

STATE OF CONNECTICUT, OFFICE OF THE TREASURER, DENISE L. NAPPIER 147
CONNECTICUT STATE TREASURER’S COMBINED INVESTMENT FUNDS
INVESTMENT SUMMARY AT JUNE 30, 2010 (Continued)
High Yield Debt Fund (6) International Stock Fund (5)
Book Market % of Total Rate of Book Market % of Total Rate of Value Value Fund MV Return Value Value Fund MV Return
2010 $659,015,939 $656,175,724 3.01% 24.54% $ - $ - - -2009 801,755,724 718,563,903 3.52% -4.59% - - - -2008 784,159,491 745,137,049 2.85% -1.88% - - - -2007 - - - - 4,293,498,472 5,940,213,814 22.19% 29.65%2006 - - - - 4,145,802,552 5,392,666,574 22.96% 25.69%2005 - - - - 3,587,545,036 4,372,185,115 20.27% 19.23%2004 - - - - 3,407,481,400 3,995,868,265 19.35% 29.69%2003 - - - - 2,047,590,656 2,026,297,000 10.67% -6.39%2002 - - - - 2,306,936,221 2,272,810,463 11.62% -9.00%2001 - - - - 2,449,711,883 2,466,657,788 11.63% -13.29%
Developed Market International Stock Fund (5) Emerging Market International Stock Fund (5)
Book Market % of Total Rate of Book Market % of Total Rate of Value Value Fund MV Return Value Value Fund MV Return
2010 $4,552,279,820 $4,328,450,937 19.87% 11.03% $1,860,837,675 $2,065,255,957 9.48% 25.23%2009 4,847,669,826 4,464,491,006 21.85% -27.98% 1,110,911,776 1,141,401,975 5.59% -30.90%2008 4,879,325,913 5,077,825,949 19.43% -14.60% 1,111,317,184 1,295,936,888 4.96% 0.19%2007 - - - - - - - -2006 - - - - - - - -2005 - - - - - - - -2004 - - - - - - - -2003 - - - - - - - -2002 - - - - - - - -2001 - - - - - - - -
Real Estate Fund (3) Commercial Mortgage Fund (3)
Book Market % of Total Rate of Book Market % of Total Rate of Value Value Fund MV Return Value Value Fund MV Return
2010 $1,174,718,491 $792,483,221 3.64% -20.18% $3,769,581 $3,818,115 0.02% 6.75%2009 1,021,805,530 770,955,194 3.77% -28.66% 5,084,919 5,135,144 0.02% -3.14%2008 954,279,128 1,002,243,816 3.84% 6.04% 6,255,651 6,906,096 0.03% 12.05%2007 638,511,736 684,741,163 2.56% 14.21% 7,355,621 7,763,461 0.03% 8.17%2006 327,772,520 398,391,108 1.70% 6.87% 17,729,189 18,192,114 0.08% 9.51%2005 309,798,748 399,727,575 1.85% 27.56% 19,796,542 20,267,798 0.09% 6.76%2004 348,015,445 368,546,928 1.78% 0.53% 35,210,421 36,228,371 0.18% 7.83%2003 399,402,161 425,893,012 2.24% 3.30% 69,871,489 71,990,878 0.38% 20.62%2002 417,067,553 471,193,932 2.41% 0.81% 69,553,258 71,468,307 0.37% 1.19%2001 407,455,431 476,011,373 2.24% 14.45% 92,793,153 100,727,402 0.47% 10.88%

148 COMBINED INVESTMENT FUNDS 2010 COMPREHENSIVE FINANCIAL ANNUAL REPORT
CONNECTICUT STATE TREASURER’S COMBINED INVESTMENT FUNDS
INVESTMENT SUMMARY AT JUNE 30, 2010 (Continued)
Private Investment Fund (3) Total Fund (4)
Book Market % of Total Rate of Book Market % of Total Rate of Value Value Fund MV Return Value Value Fund MV Return
2010 $1,859,585,108 $2,013,101,198 9.24% 17.32% $21,710,645,358 $21,784,939,405 100.00% 12.88%2009 1,819,125,566 1,621,268,022 7.94% -16.36% 21,945,913,372 20,431,180,148 100.00% -17.37%2008 1,809,775,995 1,789,139,253 6.85% 13.66% 25,388,309,339 26,129,160,510 100.00% -4.71%2007 1,657,888,536 1,556,795,484 5.81% 19.56% 23,066,365,615 26,774,529,258 100.00% 17.34%2006 1,692,805,252 1,357,518,114 5.78% 11.46% 21,145,639,107 23,482,898,042 100.00% 10.55%2005 2,046,726,560 1,437,979,798 6.67% 8.94% 19,918,781,069 21,573,264,617 100.00% 10.46%2004 2,406,829,047 1,781,312,669 8.63% 18.70% 19,473,480,993 20,650,115,902 100.00% 15.23%2003 2,413,582,348 1,842,900,019 9.70% -11.94% 18,771,449,134 18,989,393,113 100.00% 2.49%2002 2,315,048,277 2,276,642,374 11.64% -10.81% 19,403,848,200 19,557,516,103 100.00% -6.39%2001 2,217,285,786 2,601,575,275 12.28% -6.25% 19,571,276,798 21,204,840,744 100.00% -3.68%
(1) All rates of return are net of management fees and division operating expenses.(2) The market value of the Liquidity Fund for the periods presented represents the market value of the pension and trust balances in the
Liquidity Fund only (excluding receivables and payables); the Liquidity Fund balances of the other combined investment funds are shown in the market value of each fund.
(3) Investment returns published for prior years were net of management fees, but were restated in 2008 net of all expenses.(4) Represents a composite return of the total pension and trust funds. Individual returns for the three primary pension funds (Teachers,
State Employees and Minicipal Employees) are separately presented elsewhere due to different asset allocations of each fund.(5) On November 1, 2007 the International Stock Fund (ISF) was reallocated into two sub portfolios of international equity securities. The
reallocation was a result of the modifi cations to the Investment Policy Statement (IPS) as approved by the Investment Advisory Council (IAC) and adopted by the Treasurer in October 2007. The reallocation of assets, outlined in the IPS, was based on an asset liability study that identifi ed the need to reallocate the international stock fund into two components: developed markets international stocks and emerg-ing markets international stocks to allow for greater fl exibility in managing risk and return in the various Connecticut Retirement Plans and Trust Funds.
(6) On November 1, 2007 the Mutual Fixed Income Fund was reallocated into four sub portfolios of fi xed income securities. The realloca-tion was a result of the modifi cations to the Investment Policy Statement (IPS) as approved by the Investment Advisory Council (IAC) and adopted by the Treasurer in October 2007. The reallocation of assets, outlined in the IPS, was based on an asset liability study that identifi ed the need to reallocate the mutual fi xed income fund into four components: core fi xed income, emerging market debt, high yield debt and infl ation-linked bonds to allow for greater fl exibility in managing risk and return in the various Connecticut Retirement Plans and Trust Funds.
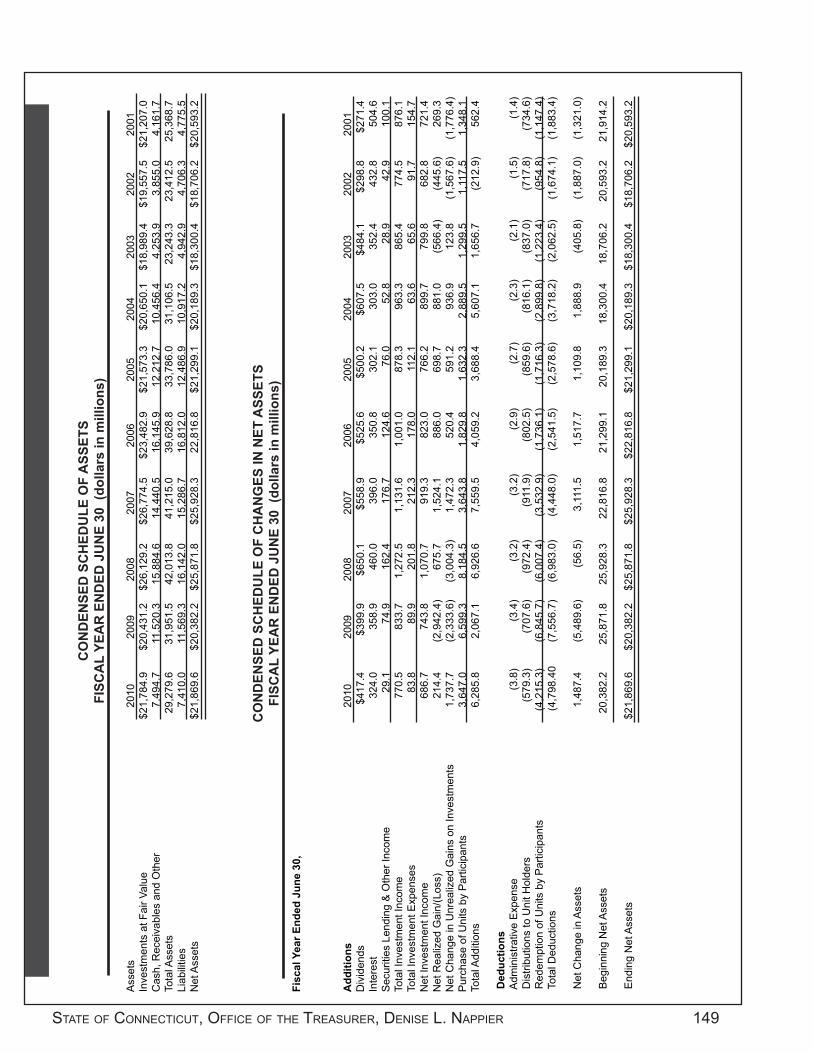
STATE OF CONNECTICUT, OFFICE OF THE TREASURER, DENISE L. NAPPIER 149
CO
NN
ECTI
CU
T ST
ATE
TREA
SUR
ER’S
CO
MB
INED
INVE
STM
ENT
FUN
DS
CO
ND
ENSE
D S
CH
EDU
LE O
F A
SSET
SFI
SCA
L YE
AR
EN
DED
JU
NE
30 (
dolla
rs in
mill
ions
)
Ass
ets
2010
20
09
2008
20
07
2006
20
05
2004
20
03
2002
20
01In
vest
men
ts a
t Fai
r Val
ue
$21,
784.
9 $2
0,43
1.2
$26,
129.
2 $
26,7
74.5
$2
3,48
2.9
$
21,5
73.3
$
20,6
50.1
$
18,9
89.4
$
19,5
57.5
$
21,2
07.0
Cas
h, R
ecei
vabl
es a
nd O
ther
7,
494.
7 11
,520
.3
15,8
84.6
14
,440
.5
16,1
45.9
12
,212
.7
10,4
56.4
4,
253.
9
3,85
5.0
4,
161.
7To
tal A
sset
s 29
,279
.6
31,9
51.5
42
,013
.8
41,2
15.0
39,6
28.8
33,7
86.0
3
1,10
6.5
23
,243
.3
23,4
12.5
25
,368
.7Li
abili
ties
7,41
0.0
11,5
69.3
16
,142
.0
15,2
86.7
1
6,81
2.0
12,4
86.9
10
,917
.2
4,94
2.9
4,
706.
3
4,77
5.5
Net
Ass
ets
$21,
869.
6 $2
0,38
2.2
$25,
871.
8 $
25,9
28.3
22
,816
.8
$21,
299.
1
$20,
189.
3
$18,
300.
4
$18
,706
.2
$20
,593
.2
Fisc
al Y
ear E
nded
Jun
e 30
,
Add
ition
s 20
10
2009
20
08
2007
20
06
2005
20
04
2003
20
02
2001
Div
iden
ds
$417
.4
$399
.9
$650
.1
$558
.9
$525
.6
$50
0.2
$607
.5
$48
4.1
$
298.
8
$27
1.4
Inte
rest
32
4.0
358.
9 46
0.0
396.
0 3
50.8
30
2.1
30
3.0
35
2.4
43
2.8
50
4.6
Sec
uriti
es L
endi
ng &
Oth
er In
com
e 29
.1
74.9
16
2.4
176.
7 12
4.6
76.0
52
.8
28.9
42
.9
100.
1To
tal I
nves
tmen
t Inc
ome
770.
5 83
3.7
1,27
2.5
1,13
1.6
1,00
1.0
87
8.3
96
3.3
86
5.4
77
4.5
87
6.1
Tota
l Inv
estm
ent E
xpen
ses
83.8
89
.9
201.
8 21
2.3
178.
0
112.
1
63.6
65
.6
91.7
15
4.7
Net
Inve
stm
ent I
ncom
e 68
6.7
743.
8 1,
070.
7 91
9.3
823.
0
766.
2 89
9.7
79
9.8
68
2.8
72
1.4
Net
Rea
lized
Gai
n/(L
oss)
21
4.4
(2,9
42.4
) 67
5.7
1,52
4.1
886
.0
698
.7
881
.0
(566
.4)
(445
.6)
269.
3N
et C
hang
e in
Unr
ealiz
ed G
ains
on
Inve
stm
ents
1,
737.
7 (2
,333
.6)
(3,0
04.3
) 1,
472.
3 52
0.4
591.
2 9
36.9
12
3.8
(1
,567
.6)
(1,7
76.4
)P
urch
ase
of U
nits
by
Par
ticip
ants
3,
647.
0 6,
599.
3 8,
184.
5 3,
643.
8 1,
829.
8 1,
632.
3 2
,889
.5
1,29
9.5
1,
117.
5
1,34
8.1
Tota
l Add
ition
s
6,28
5.8
2,06
7.1
6,92
6.6
7,55
9.5
4,05
9.2
3,68
8.4
5,60
7.1
1,
656.
7
(212
.9)
562.
4
Ded
uctio
ns A
dmin
istra
tive
Exp
ense
(3
.8)
(3.4
) (3
.2)
(3.2
) (2
.9)
(2.7
) (2
.3)
(2.1
) (1
.5)
(1.4
) D
istri
butio
ns to
Uni
t Hol
ders
(5
79.3
) (7
07.6
) (9
72.4
) (9
11.9
) (8
02.5
) (8
59.6
) (8
16.1
) (8
37.0
) (7
17.8
) (7
34.6
) R
edem
ptio
n of
Uni
ts b
y P
artic
ipan
ts
(4,2
15.3
) (6
,845
.7)
(6,0
07.4
) (3
,532
.9)
(1,7
36.1
) (1
,716
.3)
(2,8
99.8
) (1
,223
.4)
(954
.8)
(1,1
47.4
) T
otal
Ded
uctio
ns
(4,7
98.4
0 (7
,556
.7)
(6,9
83.0
) (4
,448
.0)
(2,5
41.5
) (2
,578
.6)
(3,7
18.2
) (2
,062
.5)
(1,6
74.1
) (1
,883
.4)
Net
Cha
nge
in A
sset
s
1,48
7.4
(5,4
89.6
) (5
6.5)
3,
111.
5 1
,517
.7
1,10
9.8
1,88
8.9
(4
05.8
) (1
,887
.0)
(1,3
21.0
)
Beg
inni
ng N
et A
sset
s
20,3
82.2
25
,871
.8
25,9
28.3
22
,816
.8
21,2
99.1
20
,189
.3
18,3
00.4
18
,706
.2
20,5
93.2
21
,914
.2
End
ing
Net
Ass
ets
$2
1,86
9.6
$20,
382.
2 $2
5,87
1.8
$25,
928.
3 $
22,8
16.8
$2
1,29
9.1
$20,
189.
3
$18,
300.
4
$18
,706
.2
$20
,593
.2
CO
ND
ENSE
D S
CH
EDU
LE O
F C
HA
NG
ES IN
NET
ASS
ETS
FISC
AL
YEA
R E
ND
ED J
UN
E 30
(do
llars
in m
illio
ns)

150 COMBINED INVESTMENT FUNDS 2010 COMPREHENSIVE FINANCIAL ANNUAL REPORT
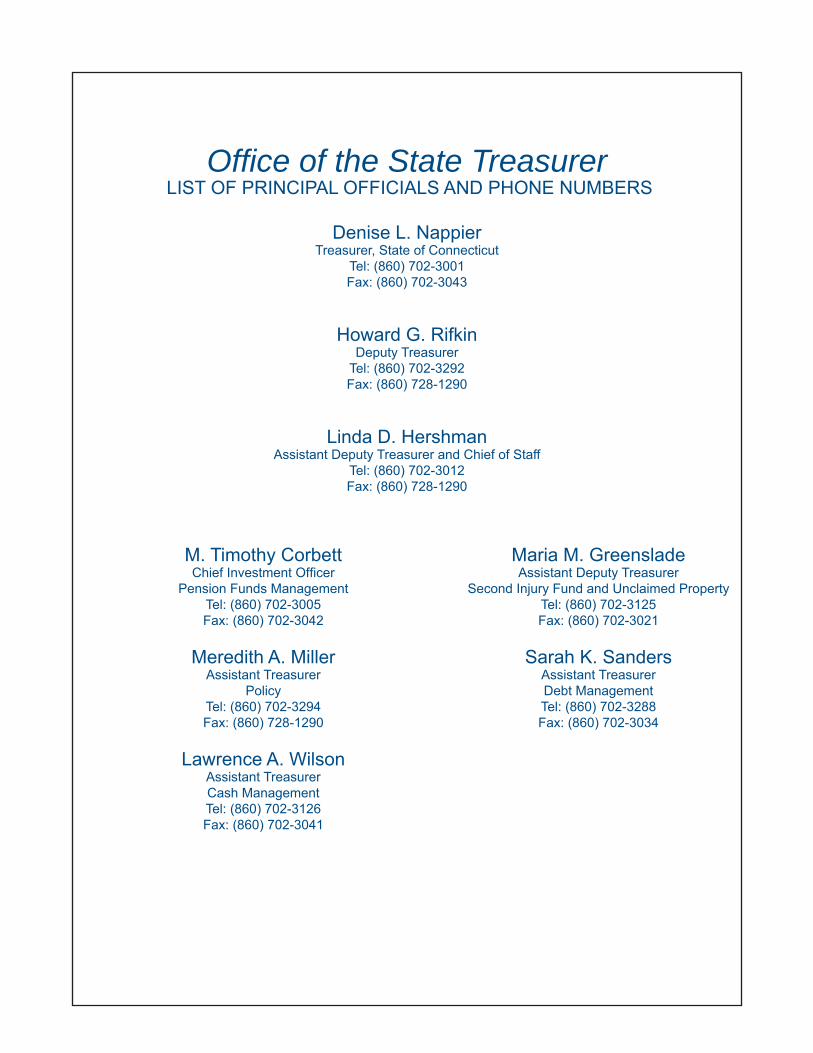
Offi ce of the State Treasurer LIST OF PRINCIPAL OFFICIALS AND PHONE NUMBERS
Denise L. NappierTreasurer, State of Connecticut
Tel: (860) 702-3001Fax: (860) 702-3043
Howard G. RifkinDeputy Treasurer
Tel: (860) 702-3292Fax: (860) 728-1290
Linda D. HershmanAssistant Deputy Treasurer and Chief of Staff
Tel: (860) 702-3012Fax: (860) 728-1290
M. Timothy Corbett Maria M. Greenslade Chief Investment Offi cer Assistant Deputy Treasurer Pension Funds Management Second Injury Fund and Unclaimed Property Tel: (860) 702-3005 Tel: (860) 702-3125 Fax: (860) 702-3042 Fax: (860) 702-3021
Meredith A. Miller Sarah K. Sanders Assistant Treasurer Assistant Treasurer Policy Debt Management Tel: (860) 702-3294 Tel: (860) 702-3288 Fax: (860) 728-1290 Fax: (860) 702-3034
Lawrence A. Wilson Assistant Treasurer Cash Management Tel: (860) 702-3126 Fax: (860) 702-3041

CONNECTICUT STATE TREASURY55 Elm Street
Hartford, CT 06106-1773Tel: (860) 702-3000 www.state.ct.us/ott


� � � � � � � � � � � � � � � � � � � � � � � � � � � � � � � � � � � � � � � � � � � � � � � � � � � � � � � � � � � � � � � � � � � � � � � � � � �� � � � � � � � � � � � � � � � � � � � � � � � � � � � � � � � � � � � � � � � � � � � � � � � � � � � � � � � � � � � � �
� � � ! � � � " � � � � # $ � � � � � � � � � � ! � � � � � � � % & ' ( � ) � � � � � � � � � � ! � � � � ! � � � � � � * % � � � � � � � � � � � � � �+ � � � � � � � � � � � � � � � � � � � � � � � � � � � � � � � � � � � � � � � � � � � � � � � ! � � � , � � � � � ! � � �

LETTER FROM THE TREASURER
December 30, 2010
To the State of ConnecticutCombined Investment FundsFellow Benefi ciaries
I am pleased to submit this Comprehensive Annual Financial Report (CAFR) for the State of Connecticut Combined Investment Funds (CIF) for the fi scal year ended June 30, 2010. During 2010, the Connecticut Retirement Plans and Trust Funds (CRPTF) rebounded strongly from 2009, a year of unprecedented down-turn in the global economy. The value of the CRPTF assets increased by $1.5 billion earning an average net return of 12.88% as noted under Financial Information below.
Responsibility for both the accuracy of the data and the completeness and fairness of this report rests with Treasury management. All disclosures necessary and required to enable fellow benefi ciaries and the fi nancial community to gain an understanding of CIF’s fi nancial activities have been included.
We believe the enclosed fi nancial statements and data are presented fairly in all material respects and are reported in a manner designed to present the fi nancial position and results of CIF’s operations accurately.
The CIF were established pursuant to Connecticut General Statutes Section 3-31b to provide a means for investing pension and other trust fund assets entrusted to the Treasurer in a variety of investment classes. The Funds are separate, legally-defi ned open-end portfolios consisting of: the Liquidity Fund, the Mutual Equity Fund, the Core Fixed Income Fund, the Emerging Market Debt Fund, the High Yield Debt Fund, the Infl ation Linked Bond Fund, the Developed Markets International Stock Fund, the Emerging Markets International Stock Fund, the Real Estate Fund, the Commercial Mortgage Fund, and the Private Investment Fund.
The units of the Funds are owned by six pension funds, which include: the Teachers’ Retirement Fund; State Employees’ Retirement Fund; Connecticut Municipal Employees’ Retirement Fund; State Judges Re-tirement Fund; Probate Judges and Employees’ Retirement Fund; and State’s Attorney Retirement Fund. In addition, there are eight trust funds which include: the Soldiers’ Sailors’ and Marines’ Fund; Policemen and Firemen Survivors’ Benefi t Fund; Arts Endowment Fund; School Fund; Ida Eaton Cotton Fund; Hopemead State Park Fund; Andrew C. Clark Fund; and the Agricultural College Fund.
Financial InformationThe CIF assets in 2010 were $21.9 billion and are valued at fair value. The CIF is in full compliance with
the standards of the Governmental Accounting Standards Board. To meet CIF’s obligations for investing pension plans and other trust funds, CIF’s assets are diversifi ed over a number of investments, and a host of different investment strategies are employed to control risk. In the past year, the three largest retirement plans, Teachers’ Retirement Fund, State Employees’ Retirement Fund and the Municipal Employees’ Retire-ment Fund, representing 99% of the State’s retirement assets, posted net total returns (after all expenses) of 12.87%, 12.93% and 12.57%, respectively, compared to the three funds’ customized benchmarks, of 12.29%, 12.60% and 11.82%, respectively. Additional information on the Combined Investment Funds can be found in the Notes to the Financial Statements.

THE CONNECTICUT STATE TREASURY
Mission StatementTo serve as the premier State Treasurer’s Offi ce in the nation through effective management of public
resources, high standards of professionalism and integrity, and expansion of opportunity for the citizens and businesses of Connecticut.
Statutory ResponsibilityThe Offi ce of the Treasurer was established following the adoption of the fundamental orders of Con-
necticut in 1638. The Treasurer shall receive all funds belonging to the State and disburse the same only as may be directed by law, as described in Article Fourth, Section 22 of the Connecticut Constitution and in Title 3 of the Connecticut General Statutes.
The Treasurer is also responsible for prudently investing approximately $21.9 billion in State pension and trust fund assets, $4.7 billion in total State, local short-term, and other investments, $0.6 billion in the extended investment portfolio, and over $1.2 billion in the Connecticut Higher Education Trust.
Public ServiceThe Offi ce of the Treasurer includes an Executive Offi ce as well as fi ve distinct divisions, each with
specifi c responsibilities: Pension Funds Management, Cash Management, Debt Management, Unclaimed Property, and the Second Injury Fund.
Treasurer
Executive Offi ce
Pension Funds
Management
Debt Management
Cash Management
Unclaimed Property
Second Injury Fund

CONNECTICUT STATE TREASURER’S COMBINED INVESTMENT FUNDS
The Mutual Equity Fund (“MEF”) invests primarily in the common stocks of U.S. corporations. These investments are made using external money managers. MEF assets, which are allocated across the U.S. stock market, ensure diversifi cation by both market capitalization and investment style, such as value and growth. The MEF may invest opportunistically to take advantage of shifts in the investment landscape that offer diversifi cation and/or risk return benefi ts. This opportunistic allocation is made within the broad context of the MEF. The Fund measures its performance against the Russell 3000 Index. As currently structured, the MEF replicates the approximate capitalization of the U. S. equity market as a whole with 85.45% of the portfolio invested in large-cap stocks, 9.47% in small/mid-cap stocks, and 5.08% in all-cap.
Management of the MEF entails pure indexing, enhanced indexing, active management, and opportunistic strategies executed by external money managers. The goal of enhanced indexing is to generate a return slightly in excess of the selected index. Indexing is a particularly appropriate strategy for the “large-cap” segment of the equity markets, which is defi ned as the securities of the largest capitalized public compa-nies, typically comprising the major market indices. Given the effi ciency of the domestic equity market, approximately 92.48% of the portfolio adheres to indexing, enhanced indexing, or risk controlled strategies. The balance of the portfolio is activity managed, mainly in the “small- and mid-cap” sections of the equity markets, to allow the CRPTF the opportunity to achieve enhanced returns. Small- and mid-cap securities are issued by companies that are much smaller and not as closely monitored, researched or analyzed as the larger capitalization companies. Consequently, the small-cap segment of the U.S. equity market is less effi cient. Certain active money managers are therefore more likely to outperform the markets over the long term, while earning an acceptable level of return per unit of risk.
International EquityThe international equities are divided into two funds: the Developed Markets International Stock Fund
(“DMISF”) and the Emerging Markets International Stock Fund (“EMISF”). The DMISF and the EMISF are separate asset classes and provide fl exibility for each plan and trust fund to pursue individual allocation to each stock fund. DMISF and EMISF assets are allocated across foreign markets so that there is diversifi ca-tion by market, capitalization and style, comprising a mix which is structured to replicate the characteristics of the comparable developed and emerging non-U.S. stock market indices.
The DMISF invests primarily in the common stocks of non-U.S. corporations, and the investments are made using external money managers. Non-U.S. stocks are defi ned as common stocks issued by companies domiciled outside the U.S. International developed markets are defi ned as the countries included in the S&P/Citigroup Broad Market Index (BMI) EPAC (Europe, Pacifi c Asia Composite). The Performance Benchmark for DMISF is the S&P/Citigroup Broad Market Index (BMI) EPAC (Europe, Pacifi c Asia Composite) 50% hedged with net dividends reinvested.
The EMISF invests primarily in the common stocks of non-U.S. corporations, defi ned as the countries included in the Morgan Stanley Capital International (MSCI) Emerging Markets Free Index (“EMF Index”). The Performance Benchmark for EMISF is the MSCI Emerging Markets Investable Index (IMI) with net dividends reinvested. These investments are made using external money managers.
The DMISF is comprised of passive indexing, risk controlled, core developed markets and opportunistic strategies. Mandates for active growth/value and small cap developed market strategies represent roughly 24% and 13% of the DMISF, respectively, and introduce greater fl exibility with regard to benchmark weight-ings. The currency exposure of the DMISF investments is managed through a currency hedging overlay strategy.
The EMISF is invested 100 percent in active, unhedged emerging markets strategies.
Fixed Income InvestmentsThe fi xed income assets are diversifi ed across four types of funds: the Core Fixed Income Fund (“CFIF”),
the Infl ation Linked Bond Fund (“ILBF”), the Emerging Markets Debt Fund (“EMDF”), and the High Yield
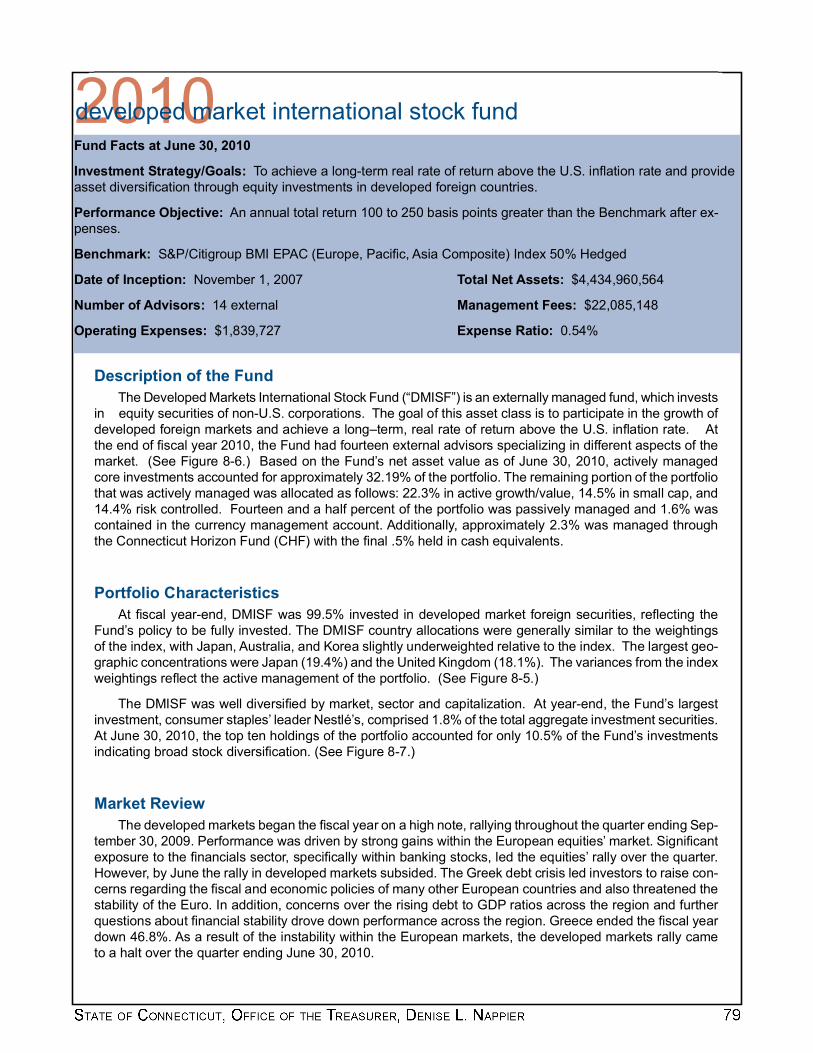
2010Fund Facts at June 30, 2010
Investment Strategy/Goals: To achieve a long-term real rate of return above the U.S. infl ation rate and provide asset diversifi cation through equity investments in developed foreign countries.
Performance Objective: An annual total return 100 to 250 basis points greater than the Benchmark after ex-penses.
Benchmark: S&P/Citigroup BMI EPAC (Europe, Pacifi c, Asia Composite) Index 50% Hedged
Date of Inception: November 1, 2007 Total Net Assets: $4,434,960,564
Number of Advisors: 14 external Management Fees: $22,085,148
Operating Expenses: $1,839,727 Expense Ratio: 0.54%
Description of the FundThe Developed Markets International Stock Fund (“DMISF”) is an externally managed fund, which invests
in equity securities of non-U.S. corporations. The goal of this asset class is to participate in the growth of developed foreign markets and achieve a long–term, real rate of return above the U.S. infl ation rate. At the end of fi scal year 2010, the Fund had fourteen external advisors specializing in different aspects of the market. (See Figure 8-6.) Based on the Fund’s net asset value as of June 30, 2010, actively managed core investments accounted for approximately 32.19% of the portfolio. The remaining portion of the portfolio that was actively managed was allocated as follows: 22.3% in active growth/value, 14.5% in small cap, and 14.4% risk controlled. Fourteen and a half percent of the portfolio was passively managed and 1.6% was contained in the currency management account. Additionally, approximately 2.3% was managed through the Connecticut Horizon Fund (CHF) with the fi nal .5% held in cash equivalents.
Portfolio CharacteristicsAt fi scal year-end, DMISF was 99.5% invested in developed market foreign securities, refl ecting the
Fund’s policy to be fully invested. The DMISF country allocations were generally similar to the weightings of the index, with Japan, Australia, and Korea slightly underweighted relative to the index. The largest geo-graphic concentrations were Japan (19.4%) and the United Kingdom (18.1%). The variances from the index weightings refl ect the active management of the portfolio. (See Figure 8-5.)
The DMISF was well diversifi ed by market, sector and capitalization. At year-end, the Fund’s largest investment, consumer staples’ leader Nestlé’s, comprised 1.8% of the total aggregate investment securities. At June 30, 2010, the top ten holdings of the portfolio accounted for only 10.5% of the Fund’s investments indicating broad stock diversifi cation. (See Figure 8-7.)
Market ReviewThe developed markets began the fi scal year on a high note, rallying throughout the quarter ending Sep-
tember 30, 2009. Performance was driven by strong gains within the European equities’ market. Signifi cant exposure to the fi nancials sector, specifi cally within banking stocks, led the equities’ rally over the quarter. However, by June the rally in developed markets subsided. The Greek debt crisis led investors to raise con-cerns regarding the fi scal and economic policies of many other European countries and also threatened the stability of the Euro. In addition, concerns over the rising debt to GDP ratios across the region and further questions about fi nancial stability drove down performance across the region. Greece ended the fi scal year down 46.8%. As a result of the instability within the European markets, the developed markets rally came to a halt over the quarter ending June 30, 2010.
developed market international stock fund
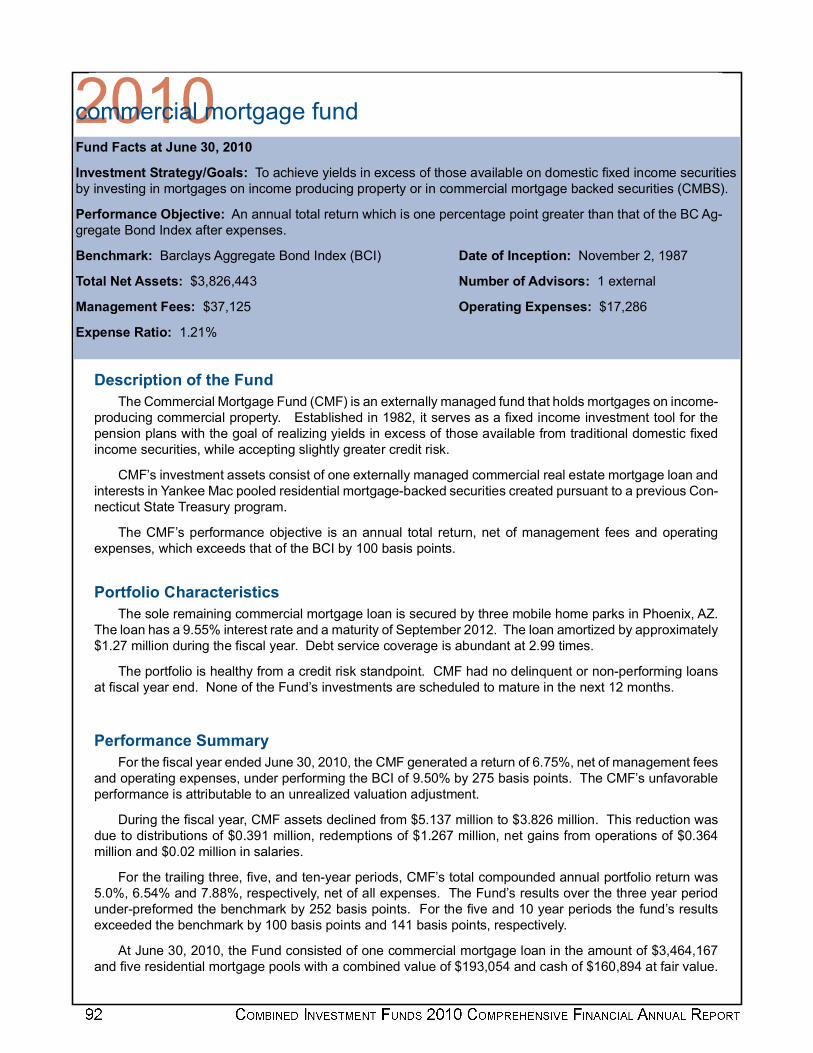
2010Fund Facts at June 30, 2010
Investment Strategy/Goals: To achieve yields in excess of those available on domestic fi xed income securities by investing in mortgages on income producing property or in commercial mortgage backed securities (CMBS).
Performance Objective: An annual total return which is one percentage point greater than that of the BC Ag-gregate Bond Index after expenses.
Benchmark: Barclays Aggregate Bond Index (BCI) Date of Inception: November 2, 1987
Total Net Assets: $3,826,443 Number of Advisors: 1 external
Management Fees: $37,125 Operating Expenses: $17,286
Expense Ratio: 1.21%
Description of the FundThe Commercial Mortgage Fund (CMF) is an externally managed fund that holds mortgages on income-
producing commercial property. Established in 1982, it serves as a fi xed income investment tool for the pension plans with the goal of realizing yields in excess of those available from traditional domestic fi xed income securities, while accepting slightly greater credit risk.
CMF’s investment assets consist of one externally managed commercial real estate mortgage loan and interests in Yankee Mac pooled residential mortgage-backed securities created pursuant to a previous Con-necticut State Treasury program.
The CMF’s performance objective is an annual total return, net of management fees and operating expenses, which exceeds that of the BCI by 100 basis points.
Portfolio CharacteristicsThe sole remaining commercial mortgage loan is secured by three mobile home parks in Phoenix, AZ.
The loan has a 9.55% interest rate and a maturity of September 2012. The loan amortized by approximately $1.27 million during the fi scal year. Debt service coverage is abundant at 2.99 times.
The portfolio is healthy from a credit risk standpoint. CMF had no delinquent or non-performing loans at fi scal year end. None of the Fund’s investments are scheduled to mature in the next 12 months.
Performance SummaryFor the fi scal year ended June 30, 2010, the CMF generated a return of 6.75%, net of management fees
and operating expenses, under performing the BCI of 9.50% by 275 basis points. The CMF’s unfavorable performance is attributable to an unrealized valuation adjustment.
During the fi scal year, CMF assets declined from $5.137 million to $3.826 million. This reduction was due to distributions of $0.391 million, redemptions of $1.267 million, net gains from operations of $0.364 million and $0.02 million in salaries.
For the trailing three, fi ve, and ten-year periods, CMF’s total compounded annual portfolio return was 5.0%, 6.54% and 7.88%, respectively, net of all expenses. The Fund’s results over the three year period under-preformed the benchmark by 252 basis points. For the fi ve and 10 year periods the fund’s results exceeded the benchmark by 100 basis points and 141 basis points, respectively.
At June 30, 2010, the Fund consisted of one commercial mortgage loan in the amount of $3,464,167 and fi ve residential mortgage pools with a combined value of $193,054 and cash of $160,894 at fair value.
commercial mortgage fund
Related Documents