PNWD-3380 ©2004, PUBLIC UTILITY DISTRICT NO. 2 OF GRANT COUNTY, WASHINGTON. ALL RIGHTS RESERVED UNDER U.S. AND FOREIGN LAW, TREATIES, AND CONVENTIONS. THE ATTACHED WORK WAS SPECIFICALLY ORDERED UNDER AN AGREEMENT WITH PUBLIC UTILITY DISTRICT NO. 2 OF GRANT COUNTY, WASHINGTON, FOR USE AS A CONTRIBUTION TO A COLLECTION OF WORK RELATING TO THE RELICENSING OF THE PRIEST RAPIDS HYDROELECTRIC PROJECT, FERC LICENSE NO. 2114. ALL RIGHTS IN THE VARIOUS WORK PRODUCED FOR OR UNDER THIS AGREEMENT, INCLUDING BUT NOT LIMITED TO STUDY PLANS AND STUDY RESULTS, DRAFTS, CHARTS, GRAPHS, AND OTHER FORMS OF PRESENTATION, SUMMARIES, AND FINAL WORK PRODUCTS, ARE THE EXCLUSIVE PROPERTY OF THE DISTRICT. Chinook Salmon Escapement and Spawning in the Priest Rapids Project Prepared for the Public Utility District No. 2 of Grant County Ephrata, Washington under Contract 430-794 Project Number 41030

Welcome message from author
This document is posted to help you gain knowledge. Please leave a comment to let me know what you think about it! Share it to your friends and learn new things together.
Transcript

PNWD-3380 ©2004, PUBLIC UTILITY DISTRICT NO. 2 OF GRANT COUNTY, WASHINGTON. ALL RIGHTS RESERVED UNDER U.S. AND FOREIGN LAW, TREATIES, AND CONVENTIONS. THE ATTACHED WORK WAS SPECIFICALLY ORDERED UNDER AN AGREEMENT WITH PUBLIC UTILITY DISTRICT NO. 2 OF GRANT COUNTY, WASHINGTON, FOR USE AS A CONTRIBUTION TO A COLLECTION OF WORK RELATING TO THE RELICENSING OF THE PRIEST RAPIDS HYDROELECTRIC PROJECT, FERC LICENSE NO. 2114. ALL RIGHTS IN THE VARIOUS WORK PRODUCED FOR OR UNDER THIS AGREEMENT, INCLUDING BUT NOT LIMITED TO STUDY PLANS AND STUDY RESULTS, DRAFTS, CHARTS, GRAPHS, AND OTHER FORMS OF PRESENTATION, SUMMARIES, AND FINAL WORK PRODUCTS, ARE THE EXCLUSIVE PROPERTY OF THE DISTRICT.
Chinook Salmon Escapement and Spawning in the Priest Rapids Project
Prepared for the Public Utility District No. 2 of Grant County Ephrata, Washington under Contract 430-794 Project Number 41030

PNWD-3380
©2004, PUBLIC UTILITY DISTRICT NO. 2 OF GRANT COUNTY, WASHINGTON. ALL RIGHTS RESERVED UNDER U.S. AND FOREIGN LAW, TREATIES, AND CONVENTIONS.
THE ATTACHED WORK WAS SPECIFICALLY ORDERED UNDER AN AGREEMENT WITH PUBLIC UTILITY DISTRICT NO. 2 OF GRANT COUNTY, WASHINGTON, FOR USE AS A CONTRIBUTION TO A COLLECTION OF WORK RELATING TO THE RELICENSING OF THE PRIEST RAPIDS HYDROELECTRIC PROJECT, FERC LICENSE NO. 2114. ALL RIGHTS IN THE VARIOUS WORK PRODUCED FOR OR UNDER THIS AGREEMENT, INCLUDING BUT NOT LIMITED TO STUDY PLANS AND STUDY RESULTS, DRAFTS, CHARTS, GRAPHS, AND OTHER FORMS OF PRESENTATION, SUMMARIES, AND FINAL WORK PRODUCTS, ARE THE EXCLUSIVE PROPERTY OF THE DISTRICT.
Chinook Salmon Escapement and Spawning in the Priest Rapids Project Prepared for the Public Utility District No. 2 of Grant County P.O. Box 878 Ephrata, WA 98823 Prepared by G. A. McMichael R. P. Mueller J. A. Vucelick Battelle-Pacific Northwest Division P.O. Box 999, MS K6-85 Richland, WA 99352 February 2004

©2004, Public Utility District No. 2 of Grant County, Washington. All Rights Reserved Under U.S. and Foreign Law, Treaties, and Conventions.
Executive Summary iii
Executive Summary
The Grant County Public Utility District contracted Battelle to conduct escapement and spawning studies on adult fall Chinook salmon in the Priest Rapids Project (PRP). A large amount of research has been conducted on the Hanford Reach fall Chinook salmon, but little has been conducted on the fall Chinook salmon in the Columbia River immediately upstream of the Hanford Reach in the PRP including the Priest Rapids and Wanapum pools). One notable exception is the work by Edson (1957, 1958) that detailed aspects of anadromous fish use of the PRP area before the construction of Priest Rapids and Wanapum dams. Fall Chinook salmon used areas within the PRP for spawning in 2000, 2001, 2002, and 2003. The escapement of adult salmon in the PRP was estimated by using dam count data, harvest estimates, and data relating to fallback at Priest Rapids Dam. The extent of spawning by fall Chinook salmon in the PRP was investigated using visual observations from low-flying fixed-wing aircraft, georeferenced/orthorectified aerial photography, and deepwater videography. The estimated total number of adult fall Chinook salmon in the PRP was 10,971, 8,336, 9,202, and 21,079 for 2000, 2001, 2002, and 2003, respectively.
The majority of the fish recovered in carcass surveys in the PRP area were unmarked. In 2000, all aged carcasses were 4 or 5 years old. The sex ratio of carcasses recovered in the Wanapum tailrace in 2000 was skewed slightly towards females (male: female ratio = 1:1.11). In 2001, the age structure of the spawning population of fall Chinook salmon in the Wanapum Dam tailrace included larger numbers of age 3 and 4 fish. The sex ratio of carcasses in 2001 was skewed towards males (1:0.61). In 2002, males were typically age 3, 4, and 5, while females were predominantly age 4. The sex ratio of carcasses recovered in was 1:1 and 1:1.16 in 2002 and 2003, respectively. All of the spawning observed in the PRP was limited to the reach between 1.7 and 6.0 km downstream of Wanapum Dam. The large population of spawning fall Chinook salmon in the Wanapum Dam tailrace area in 2000 resulted in superimposition of redds in an area referred to as the Barge Dock Bar, which is located near center channel between 1.7 and 2.3 km downstream of Wanapum Dam. The estimated number of redds in 2000 was 2,954 (95 percent CI = 2,755 to 3,187). The spawning population was lower in 2001 and only limited redd superimposition was observed, resulting in an estimate of 845 redds (95 percent CI = 784 to 916) in the Wanapum Dam tailrace. In 2002, there were an estimated 2,299 redds (95 percent CI = 2,103 to 2,540). Superimposition of redds on the Barge Dock Bar in 2002 was similar to that seen in 2001. In 2003 there was again a relatively high degree of superimposition, with an estimated 2,536 redds (95 percent CI = 2,383 to 2,712). Use of side channels by spawning adult fall Chinook salmon was highest in 2000, 2002, and 2003 when mean daily discharge and escapement were higher than in 2001. Two deepwater spawning areas were located and the numbers of redds in these areas were estimated in 2001, 2002, and 2003. A deepwater (9 to 11.5 m) spawning area was located using an acoustic spawning detection system and confirmed by underwater videography in the center of the river channel downstream of the railroad trestle (river kilometer [rkm] 663, river mile [rm] 412) in 2001. Thirty-five redds were estimated to be constructed by fall Chinook salmon in this area in 2001. In 2002, an estimated 49 redds were located in this railroad bridge area and an additional estimated 17 redds were located in a deep (3.7 to 7.0 m) area immediately downstream of the Barge Dock Bar. In 2003, there were an estimated 227 deep redds in the railroad bridge are and another 20 deep redds in the area downstream of the Barge Dock Bar.

©2004, Public Utility District No. 2 of Grant County, Washington. All Rights Reserved Under U.S. and Foreign Law, Treaties, and Conventions.
iv Executive Summary
Based on the results of our studies, we conclude the total number of fall Chinook salmon redds each year between 2000 and 2003 in the Priest Rapids Pool exceeded the maximum annual number of redds observed in the Columbia River between Priest Rapids and Rock Island dams between 1947 and 1956, prior to the construction of Priest Rapids and Wanapum dams.

©2004, Public Utility District No. 2 of Grant County, Washington. All Rights Reserved Under U.S. and Foreign Law, Treaties, and Conventions.
Acknowledgments v
Acknowledgments We appreciate the support we have received over the past four years from Grant County Public Utility District’s dedicated staff. Joe Lukas provided technical and financial support. Curt Dotson provided tireless logistical, personnel, and facilities support. Grant County biologists, technicians, engineers, dispatchers, operators, and mechanics were all very helpful during the project. Specifically, we appreciate the help of Tom Dresser, David Duvall, Mike Clement, Marty Rudnicki, Greg Hovland, Bill Anderson Jr., Rob Weedmark, Ed Perez, Brandon Horner, Jim Claussen, Brian Black, and Pat Burdick. Battelle staff and students who worked on many aspects of this project were Scott Titzler, Corey Duberstein, Jennifer Zohn, and Duane Ward.

©2004, Public Utility District No. 2 of Grant County, Washington. All Rights Reserved Under U.S. and Foreign Law, Treaties, and Conventions.
Contents vii
Contents Executive Summary ........................................................................................................................... iii Acknowledgments.............................................................................................................................. v 1.0 Introduction................................................................................................................................ 1.1 2.0 Methods...................................................................................................................................... 2.1 2.1 Escapement......................................................................................................................... 2.1 2.2 Redd Enumeration.............................................................................................................. 2.1 3.0 Results ........................................................................................................................................ 3.1 3.1 Results ................................................................................................................................ 3.1 3.1.1 Escapement ......................................................................................................... 3.1 3.1.2 Redd Enumeration .............................................................................................. 3.5 4.0 Discussion .................................................................................................................................. 4.1 5.0 Literature Cited .......................................................................................................................... 5.1
Figures 1 Weighted sled with video camera and lasers used to collect salmon redd video images......... 2.3 2 Estimated passage of adult and jack fall Chinook salmon at Priest Rapids Dam between 1960 and 2003............................................................................................................ 3.1 3 Percentage of adult fall Chinook salmon that passed McNary Dam and also passed Priest Rapids Dam between 1980 and 2003............................................................................. 3.2 4 Estimated escapement of adult fall Chinook salmon to the Priest Rapids Project between 1980 and 2003 .......................................................................................................................... 3.2 5 Percentage of adult fall Chinook salmon that passed Priest Rapids Dam and also passed Rock Island Dam between 1980 and 2003 ................................................................... 3.3 6 Age of male and female fall Chinook salmon collected in the Priest Rapids Project in 2000, 2001, 2002, and 2003................................................................................................. 3.4

©2004, Public Utility District No. 2 of Grant County, Washington. All Rights Reserved Under U.S. and Foreign Law, Treaties, and Conventions.
viii Contents
7 Visual counts of all Chinook salmon redds in the Wanapum Dam tailrace area between 1987 and 2003 .......................................................................................................................... 3.5 8 Temporal pattern of fall Chinook salmon redds below Wanapum Dam in 2000, 2001, and 2002................................................................................................................................... 3.6 9 Map of Wanapum Dam tailrace showing primary spawning areas identified by visual aerial surveys between 2000 and 2003..................................................................................... 3.7 10 Mean daily discharge at Wanapum Dam during the fall Chinook salmon spawning period between 2000 and 2003 ................................................................................................ 3.8 11 Aerial digital image of the Barge Dock Bar area downstream of Wanapum Dam on November 10, 2000.................................................................................................................. 3.9 12 Aerial photograph of the Barge Dock Bar area downstream of Wanapum Dam on November 8, 2001.................................................................................................................... 3.10 13 Digitized fall Chinook salmon reds in the Wanapum Dam tailrace area in 2000 and 2001 .... 3.11 14 Digitized fall Chinook salmon redds in the island complex area of the Wanapum Dam tailrace in 2000, 2001, 2002, and 2003 .................................................................................... 3.12 15 Aerial photograph of the Barge Dock Bar area downstream of Wanapum Dam on November 25, 2002.................................................................................................................. 3.13 16 Aerial photograph of the Barge Dock Bar area downstream of Wanapum Dam on November 13, 2003.................................................................................................................. 3.14 17 Map of polygon area used to delineate suitable spawning habitat within polygon 3............... 3.16 18 Map of polygon 1 surveyed using underwater videography in 2002 ....................................... 3.17 19 Map of polygon 2 surveyed using underwater videography in 2002 ....................................... 3.18 20 Map of polygon 1 surveyed using underwater videography in 2003 ....................................... 3.19 21 Map of polygon 2 surveyed using underwater videography in 2003 ....................................... 3.20
Tables 1 Summary of area searched for fall Chinook salmon redds in the Wanapum Dam tailrace using underwater video in 2001-2003...................................................................................... 2.4 2 Tag location information from marked adult fall Chinook salmon carcasses collected in the Priest Rapids Pool in the fall of 2000................................................................................. 3.4
©2004, Public Utility District No. 2 of Grant County, Washington. All Rights Reserved Under U.S. and Foreign Law, Treaties, and Conventions.
Contents ix
3 Estimated number of adult male and female Chinook salmon in the Priest Rapids Pool in 2000, 2001, 2002, and 2003................................................................................................. 3.5 4 Estimated number of all Chinook salmon redds from digitized aerial photographs in the Wanapum Dam tailrace area in 2000 ....................................................................................... 3.9 5 Estimated number of fall Chinook salmon redds from digitized aerial photographs in the Wanapum Dam tailrace area in 2001 ....................................................................................... 3.10 6 Estimated number of fall Chinook salmon redds from digitized aerial photographs in the Wanapum Dam tailrace area in 2002 ....................................................................................... 3.13 7 Estimated number of fall Chinook salmon redds from digitized aerial photographs in the Wanapum Dam tailrace area in 2003 ....................................................................................... 3.15 8 Annual fall Chinook salmon redd count data from aerial surveys conducted near the peak of fall Chinook spawning before the construction of the Priest Rapids Project....................... 4.5

©2004, Public Utility District No. 2 of Grant County, Washington. All Rights Reserved Under U.S. and Foreign Law, Treaties, and Conventions.
Chinook Salmon Escapement and Spawning 1.1
1.0 Introduction
Fall Chinook salmon in the Columbia River historically spawned and reared in mainstem areas, most of which have been affected by the development of the hydropower system (Fulton 1968). Currently, fall Chinook salmon in the Columbia River spawn in riverine habitats largely unaffected by downstream impoundments (for example, Chapman et al. 1994; Dauble et al. 1999). The last free-flowing stretch of the Columbia River, the Hanford Reach, is known for its robust fall Chinook salmon population. While a large amount of research has been conducted on the Hanford Reach fall Chinook salmon (with most of the emphasis on spawning, for example, Watson 1970; Chapman et al. 1984, 1986; Dauble and Watson 1997; Geist and Dauble 1998; Geist 2000; Geist et al. 2000), little research has been conducted on the fall Chinook salmon in the Columbia River immediately upstream of the Hanford Reach in the Priest Rapids Project (PRP) including the Priest Rapids and Wanapum pools). One notable exception is the work by Edson (1957, 1958) that detailed aspects of anadromous fish use of the PRP area before the construction of Priest Rapids and Wanapum dams.
Dauble and Watson (1997) presented detailed information on the status of the fall Chinook salmon population in the Hanford Reach between 1948 and 1992. Over this period of time, it is postulated that the Hanford Reach fall Chinook population increased as a result of the construction of Priest Rapids, McNary, and Ice Harbor Dams (Watson 1970; Dauble and Watson 1997). The primary spawning areas before hydro system development were between Beverly and Vantage and between Vantage and Crescent Bar (Edson 1957, 1958). Davidson (1966) also reported that fall Chinook salmon spawned in the area between Beverly and Wanapum Dam after the construction of Wanapum Dam. Dauble and Watson (1997) noted that limited spawning occurred in the mainstem of the Columbia River below Wanapum Dam. Horner and Bjornn (1979) also reported that minor fall Chinook salmon spawning areas existed below Wanapum and Rocky Reach Dams. They also stated that these minor tailrace areas were “not fully seeded in recent years” as a result of the trapping of adults at Priest Rapids Dam for brood stock and introduction into the spawning channel below the dam (p. 16, Horner and Bjornn 1979). Rogers et al. (1989) reported some spawning in the Wanapum Dam tailrace (408 redds observed on November 11, 1987). Apart from this limited information, little was known about fall Chinook salmon spawning in the PRP area following the construction of the project.
To better understand fall Chinook salmon spawning in the PRP, the Grant County Public Utility District (GC PUD) contracted with Battelle to characterize current fall Chinook salmon escapement levels and distribution of spawning. This section of the report provides: 1) estimates of escapement of adult Chinook salmon in the PRP area between 2000 and 2003 and in the recent past, and 2) estimates of the number, and the location of, fall Chinook salmon redds in the PRP area between 2000 and 2003.
©2004, Public Utility District No. 2 of Grant County, Washington. All Rights Reserved Under U.S. and Foreign Law, Treaties, and Conventions.
Chinook Salmon Escapement and Spawning 2.1
2.0 Methods
2.1 Escapement
Ladder count data were used to estimate the escapement of adult fall Chinook salmon to the PRP area between 1980 and 2003. The period used to determine the fall Chinook salmon escapement for each year was August 14 through November 15 at Priest Rapids Dam and August 18 through November 15 at Rock Island Dam. The 1999 and 2000 data included ladder count data from Priest Rapids, Wanapum, and Rock Island dams. To estimate the proportion of fish that passed Priest Rapids Dam and remained in the Priest Rapids and Wanapum Pools for years with no Wanapum Dam ladder count data (all years except 1999 and 2000), the Rock Island Dam counts were divided by 0.71 (the mean of the proportions of fish that passed Wanapum Dam and also passed Rock Island Dam in 1999 and 2000). Because the extent of fall back at Wanapum Dam is unknown, we also present escapement estimates for the PRP (includes all adult fall Chinook salmon between Priest Rapids and Rock Island Dams). The 1999 and 2000 escapement numbers were adjusted downward for fallback at Priest Rapids Dam (based on a 44 percent fallback estimate from University of Idaho radio telemetry data). The rate of fallback did not appear to be as high in 2001, 2002, or 2003 so an estimate of 10 percent fallback was used for these years. Fallback adjust-ments were made on Priest Rapids Dam counts before other amounts (for example, harvest or Wanapum Dam passage) were subtracted. No fallback adjustments were made to escapement estimates before 1999 because data were not available. A 5 percent harvest for adult fall Chinook salmon in the Priest Rapids Pool was assumed (no harvest data were available).
Carcass data collected by GC PUD and Pacific States Marine Fish Commission (PSMFC)/ Washington Department of Fish and Wildlife (WDFW) staff were analyzed to estimate the age composi-tion, hatchery/wild origin, and sex ratios of the fall Chinook salmon recovered in the Priest Rapids Pool. Carcass data were collected between November 8 and December 1, 2000, November 6 and 30, 2001, November 13 and 27, 2002, and November 5 and December 4, 2003. Coded wire tags were recovered from some of the adipose-clipped carcasses and used to determine the release year and location of tagged fish. Scales collected from a subsample of the total number of fish were aged by WDFW.
2.2 Redd Enumeration
Estimates of the number of fall Chinook salmon redds in the PRP area were obtained by a combina-tion of visual surveys, aerial photography, and deepwater videography.
Aerial Visual Surveys. Visual observations occurred in the Priest Rapids and Wanapum Pools on October 30, November 5, and November 13, 2000, and on October 22, November 2, 8, and 20, 2001. In 2002, one early survey was done on September 24 and additional surveys occurred on October 25, November 1, 6, 11, and 25. In 2002, the only date when the Rock Island Dam tailrace was surveyed was on November 25. In 2003, the visual aerial survey dates were November 1, 3, 14, and 22. The Rock Island Dam tailrace area was surveyed on the November 14, 2003 flight. The November 5, 2000, flight was terminated after surveying the Wanapum Dam tailrace area because of high winds. Visual surveys were conducted from fixed-wing aircraft flying about 150 m above the water surface at air speeds ranging from 110 to 130 km/h. Surveys proceeded in an upstream direction, beginning below Hanson Creek (rkm 594) in the Priest Rapids Pool and continuing up to Wanapum Dam. Areas of high redds density

©2004, Public Utility District No. 2 of Grant County, Washington. All Rights Reserved Under U.S. and Foreign Law, Treaties, and Conventions.
2.2 Chinook Salmon Escapement and Spawning
were often passed over multiple times before the final number of redds was recorded. After completing the visual counts below Wanapum Dam, the survey continued directly upstream to the mouth of Tarpiscan Creek (rkm 718), then flew upstream to Rock Island Dam. Emphasis in the Rock Island Dam area was placed on the large cobble bar towards the east shore about 2.6 km downstream of Rock Island Dam and the alluvial deposits off the mouth of Moses Coulee (rkm 721). The number and general location of groups of redds were recorded on maps of the study area.
Aerial Photography. Digital aerial photographs of both the Wanapum Dam and Rock Island Dam tailraces were taken in 2000. In 2001, aerial photography was done in the Wanapum Dam tailrace area only. A Kodak DCS 460 CIR, 6.0 megapixel color infrared camera with a 35-mm lens set for 1/320-s exposures with an auto adjustment for aperture was belly-mounted in a Cessna 182 flown at an elevation of approximately 1,520 m above the water surface at approximately 145 km/h. Pixel size in the raw images was approximately 29 cm. Digital images were georeferenced using a combination of ground markers placed for this project and reference points found on digital ortho quad maps.
Georeferenced images were color adjusted, placed together in mosaics of four images in ERDAS Imagine 8.4 software, and digitized to calculate the area of each distinguishable redd. A shape file was then created with the digitized redds and superimposed area to be incorporated in to the geographic information system (GIS). Redd counts in areas of high superimposition were calculated by the following method: 1) the area of the superimposed redds was calculated, 2) the area of undisturbed (dark) substrate within the superimposed area was removed from the total superimposed area, and 3) the number of average-sized redds that would fit within that superimposed area was calculated with no redd overlap, 10 percent redd overlap, and 30 percent overlap. Overlap calculations were done by reducing the mean area of a redd by 10 percent and 30 percent for 2000 and by 10 percent in 2001.
On November 11, 2001, November 25, 2002, and November 13, 2003, aerial photographs were collected for the Wanapum Dam tailrace area from Sentinel Gap upstream to the power line immediately upstream of the Barge Dock Bar. These photographs were collected using a Zeiss precision aerial camera equipped with a gyro-stabilized mount and an image-motion-compensated magazine. The camera was also equipped with an event-marking capability to permit shutter-opening events to be recorded by a global positioning system (GPS) during the flight. The aircraft was fitted with a survey-grade GPS antenna mounted on the top of the fuselage over the camera. The aircraft also contained a separate, differentially corrected GPS receiver that was linked to the autopilot and used to navigate flight lines and operate the camera. The final aerial photographs were orthorectified and were at a 1:1,700 scale. Pixel size of the scanned images was 15 cm. A total of 16 images, in tag image file format (TIFF), were produced covering the study area.
Four mosaics were produced from the 16 TIFF images, using ERDAS Imagine 8.4 software, each containing 4 of the individual TIFF images. Each mosaic was clipped to a shoreline polygon coverage. Shoreline data were derived from digital elevation models developed during the production of the orthophotography. The resulting clipped mosaics contained only in-shore areas, hence, enhancing the redds that could be detected in the imagery. All of the resulting images were visually examined for redds. Once the locations of redds were determined, a subset image of those areas was created. A single subset image is used to digitize polygons that represented single and multiple redds using ArcGIS 8.1 software. Polygons were digitized at a scale of 1:1,700 and care was taken to maintain a constant scale throughout the data capture process. Coordinates were calculated for each redd from the centroid of each polygon.
©2004, Public Utility District No. 2 of Grant County, Washington. All Rights Reserved Under U.S. and Foreign Law, Treaties, and Conventions.
Chinook Salmon Escapement and Spawning 2.3
Final data were incorporated into a GIS and exist in both ArcView ShapeFile and Arc/Info coverage format. Because redd superimposition appeared to be less in 2001 and 2002 than in 2000, the number of redds was estimated with no overlap and 10 percent overlap. Redd overlap was estimated to be higher in 2003, and estimates were generated for no overlap, 10 percent overlap and 30 percent overlap for 2003.
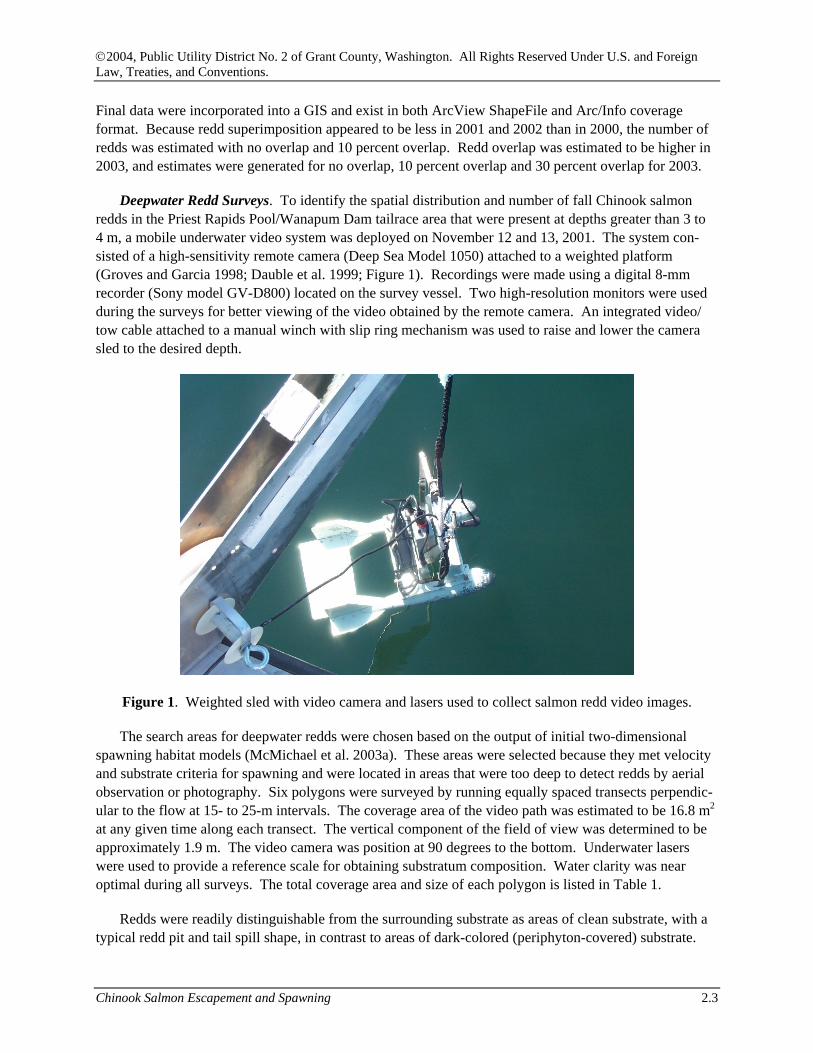
Deepwater Redd Surveys. To identify the spatial distribution and number of fall Chinook salmon redds in the Priest Rapids Pool/Wanapum Dam tailrace area that were present at depths greater than 3 to 4 m, a mobile underwater video system was deployed on November 12 and 13, 2001. The system con-sisted of a high-sensitivity remote camera (Deep Sea Model 1050) attached to a weighted platform (Groves and Garcia 1998; Dauble et al. 1999; Figure 1). Recordings were made using a digital 8-mm recorder (Sony model GV-D800) located on the survey vessel. Two high-resolution monitors were used during the surveys for better viewing of the video obtained by the remote camera. An integrated video/ tow cable attached to a manual winch with slip ring mechanism was used to raise and lower the camera sled to the desired depth.
Figure 1. Weighted sled with video camera and lasers used to collect salmon redd video images.
The search areas for deepwater redds were chosen based on the output of initial two-dimensional spawning habitat models (McMichael et al. 2003a). These areas were selected because they met velocity and substrate criteria for spawning and were located in areas that were too deep to detect redds by aerial observation or photography. Six polygons were surveyed by running equally spaced transects perpendic-ular to the flow at 15- to 25-m intervals. The coverage area of the video path was estimated to be 16.8 m2 at any given time along each transect. The vertical component of the field of view was determined to be approximately 1.9 m. The video camera was position at 90 degrees to the bottom. Underwater lasers were used to provide a reference scale for obtaining substratum composition. Water clarity was near optimal during all surveys. The total coverage area and size of each polygon is listed in Table 1.
Redds were readily distinguishable from the surrounding substrate as areas of clean substrate, with a typical redd pit and tail spill shape, in contrast to areas of dark-colored (periphyton-covered) substrate.

©2004, Public Utility District No. 2 of Grant County, Washington. All Rights Reserved Under U.S. and Foreign Law, Treaties, and Conventions.
2.4 Chinook Salmon Escapement and Spawning
Table 1. Summary of area searched for fall Chinook salmon redds in the Wanapum Dam tailrace using underwater video in 2001-2003.
Polygon No.
Total Polygon Area
(sq m) Searched in
Polygon (sq m) Percent
Surveyed Number of Transects
Distance Between
Transects (m)
2001
1 79,000 7,330 9.3 18 20 2 22,500 2,880 12.8 12 15 3 125,000 10,890 8.7 16 20 4 136,000 10,230 7.5 13 25 5 78,400 6,020 7.7 13 25 6 37,400 3,380 9.0 15 20
2002
1 38,497 13,561 35.2 44 10 2 293,964 88,633 30.2 92 10
2003
1 39,905 13,245 33.2 44 10 2 251,019 37,198 14.8 46 20
The redd locations (northing and easting) were correlated to the GPS location by a video time stamp. An on-board, real-time differential GPS (Trimble Pathfinder™ Pro XR) was used to collect positional data and to navigate pre-set transect grids during the surveys. The integrated GPS beacon receiver and antenna provided GPS corrections for calculating sub-meter accuracy (approximately 0.5 m). The system’s software (ASPEN) displayed a background map of the study site on a personal computer, so researchers could navigate to site locations on a pre-determined transect line and visually verify data accuracy in the field.
On November 12, 13, and 14, 2002, and November 13 and 14, 2003, the same methods were used to survey two deepwater areas. One area was located immediately downstream of the Barge Dock Bar (polygon 1) and the other was an expanded area in the center of the river channel downstream of the railroad bridge (polygon 2) near Beverly, Washington.

©2004, Public Utility District No. 2 of Grant County, Washington. All Rights Reserved Under U.S. and Foreign Law, Treaties, and Conventions.
Chinook Salmon Escapement and Spawning 3.1
3.0 Results
3.1 Results
3.1.1 Escapement
Total estimated passage of adult fall Chinook salmon between 1960 and 2003 at Priest Rapids Dam averaged 15,996 and ranged from a low of 2,327 (1972) to a high of 48,546 (2003) (Figure 2). The proportion of jack fall Chinook salmon has shown a decreasing trend since the 1960s and relative numbers do not appear to be a strong predictor of following adult passage at Priest Rapids Dam. For example, very low jack counts in 1998 and 1999 were followed by the high counts of adults passing Priest Rapids Dam in 1999 and 2000 (see also comments below on fallback in 1999 and 2000). Regressions between jack counts and the numbers of returning adults 1, 2, and 3 years later were all insignificant (adults+1; r = 0.03, p = 0.87, adults+2; r = 0.11, p = 0.50, adults+3; r = 0.22, p = 0.17). The percentage of adult fall Chinook salmon that were counted at McNary Dam and also were counted at Priest Rapids Dam averaged 16.1 percent between 1980 and 1998. The percentage increased substantially in 1999 and 2000 and then fell in 2001 (Figure 3). In 2002 and 2003, the percentage of fall Chinook salmon that were counted at McNary and Priest Rapids Dams was again very close to the 1980-1998 average.
Escapement of adult fall Chinook salmon to the Priest Rapids Project (Wanapum and Priest Rapids Pools combined) has varied widely over the past 20 years (Figure 4). Escapement of fall Chinook salmon to the PRP area was well above the 10-year average (8,999) in two of the past four years (2000 and 2003).
The proportion of adult fall Chinook salmon that passed Priest Rapids Dam and also passed Rock Island Dam ranged from 24 percent to 57 percent and averaged 43 percent between 1980 and 2003
0
10,000
20,000
30,000
40,000
50,000
60,000
1960 1962 1964 1966 1968 1970 1972 1974 1976 1978 1980 1982 1984 1986 1988 1990 1992 1994 1996 1998 2000 2002
Year
Num
ber C
ount
ed P
assi
ng D
am
Fall Chinook Adults Fall Chinook Jacks
Figure 2. Estimated passage of adult and jack fall Chinook salmon at Priest Rapids Dam between 1960 and 2003. Data from Grant County Public Utility District.

©2004, Public Utility District No. 2 of Grant County, Washington. All Rights Reserved Under U.S. and Foreign Law, Treaties, and Conventions.
3.2 Chinook Salmon Escapement and Spawning
0.0
10.0
20.0
30.0
40.0
50.0
60.0
70.0
1980
1981
1982
1983
1984
1985
1986
1987
1988
1989
1990
1991
1992
1993
1994
1995
1996
1997
1998
1999
2000
2001
2002
2003
Year
% o
f MC
N th
at p
asse
d PR
D
Figure 3. Percentage of adult fall Chinook salmon that passed McNary Dam and also passed Priest Rapids Dam between 1980 and 2003.
0
5000
10000
15000
20000
25000
1980
1981
1982
1983
1984
1985
1986
1987
1988
1989
1990
1991
1992
1993
1994
1995
1996
1997
1998
1999
2000
2001
2002
2003
Year
Estim
ated
Esc
apem
ent
Figure 4. Estimated escapement of adult fall Chinook salmon to the Priest Rapids Project (WAN and PRD Pools combined) between 1980 and 2003.
(Figure 5). Interestingly, in the 2 years when fallback was estimated to be relatively high at Priest Rapids Dam (1999 and 2000, 44 percent fallback estimate from University of Idaho radio telemetry data in 2000), the percentage of fish that passed Priest Rapids Dam and Rock Island Dam was the lowest observed in the past 20 years (1999 = 25.5% and 2000 = 23.9%). In those same 2 years, the percentage of fish that passed McNary Dam and also passed Priest Rapids Dam was the highest recorded in the past 20 years (see Figure 3).

©2004, Public Utility District No. 2 of Grant County, Washington. All Rights Reserved Under U.S. and Foreign Law, Treaties, and Conventions.
Chinook Salmon Escapement and Spawning 3.3
0.00
10.00
20.00
30.00
40.00
50.00
60.00
70.00
1980
1982
1984
1986
1988
1990
1992
1994
1996
1998
2000
2002
Year
% o
f PR
D th
at p
asse
d R
IS
Figure 5. Percentage of adult fall Chinook salmon that passed Priest Rapids Dam and also passed Rock Island Dam between 1980 and 2003.
Age data were collected for 38 of the 166 carcasses sampled in the Priest Rapids Pool/Wanapum Dam tailrace in 2000; all of the carcasses were 4 or 5 years old (Figure 6; all carcass data courtesy of R. Watson, PSMFC/WDFW, personal communication). Of the total number of carcasses (N = 166) sam-pled in the same area, nine (5.1 percent) were marked (indicating they were tagged with a coded wire tag). The coded wire tag recoveries from these fish were from five different tagging groups (Table 2). The overall male:female ratio of adult fall Chinook salmon recovered in the area in 2000 was 1:1.11; however, the sex ratio was skewed towards males in the age 4 fish (1:0.7) and towards females in the age 5 fish (1:1.63). Carcasses recovered in the Priest Rapids Pool in the fall of 2001 showed that less than 1 percent of the 119 adults sampled were marked (and those 2 fish did not contain coded wire tags). The age structure of the 129 Chinook salmon carcasses examined in the PRP in the fall of 2001 (126 in Priest Rapids Pool and 3 in the Wanapum Pool) tended to be younger than those collected in 2000. The overall male:female ratio in 2001 was skewed towards males (1:0.61). Again in 2001, the males tended to be younger than females. In 2002, 122 carcasses were sampled and one was marked but did not contain a CWT. In 2002, males were typically age 3, 4, and 5, while females were predominantly age 4. The sex ratio of carcasses recovered in the Wanapum Dam tailrace in 2002 was 1:1. In 2003, the sex ratio of carcasses collected in the Priest Rapids Pool was 1:1.16 and most fish were age 4. No marked carcasses were recovered in the Priest Rapids Pool in 2003.

©2004, Public Utility District No. 2 of Grant County, Washington. All Rights Reserved Under U.S. and Foreign Law, Treaties, and Conventions.
3.4 Chinook Salmon Escapement and Spawning
0
5
10
15
20
25
30
35
40
45
50
%Age2 %Age3 %Age4 %Age5
Age
Perc
ent O
ccur
renc
e
Male01 Female01 Male00 Female00 Male02Female02 Male03 Female03
Figure 6. Age of male and female fall Chinook salmon collected in the Priest Rapids Project in 2000, 2001, 2002, and 2003. A sample of 38 from the Priest Rapids Pool were aged in 2000. Samples of 126 from Priest Rapids Pool and 3 from Wanapum Pool were aged in 2001. A total of 122 and 179 from Priest Rapids Pool were aged in 2002 and 2003, respectively. (Data courtesy of R. Watson, PSMFC/WDFW.) Table 2. Tag location information from marked adult fall Chinook salmon carcasses collected in the Priest Rapids Pool in the fall of 2000. (Data courtesy of R. Watson, PSMFC/WDFW.)
Tag Location Number Percent 96 Ringold 1 12.5 95 K Basin 2 25 95 Yakima 1 12.5 96 Priest Rapids Hatchery 1 12.5 95 McNary URB Mixed 3 37.5
The ratio of adult female to adult male Chinook salmon in the Priest Rapids Pool favored females in 2000 and 2003 and males in 2001 and was equal in 2002 (Table 3). For comparison, the sex ratio of fall Chinook salmon carcasses recovered in the Hanford Reach in 2000 was 64 percent female and 36 percent male (R. Watson, PSMFC/WDFW, personal communication). In 2001, the sex ratio was 52 percent female and 48 percent male (Watson and Hoffarth 2002).
%Age6

©2004, Public Utility District No. 2 of Grant County, Washington. All Rights Reserved Under U.S. and Foreign Law, Treaties, and Conventions.
Chinook Salmon Escapement and Spawning 3.5
Table 3. Estimated number of adult male and female Chinook salmon in the Priest Rapids Pool in 2000, 2001, 2002, and 2003. Data derived from the total adult escapement numbers and sex ratio data from GC PUD/WDFW carcass surveys.
Year Adult Escapement Percent
Male Percent Female est Male est Female
2000 8,750 47.4 52.6 4,147 4,602
2001 3,072 63.6 36.4 1,954 1,118
2002 3,363 50.0 50.0 1,681 1,682
2003 12,517 46.4 53.6 5,808 6,709
3.1.2 Redd Enumeration
Aerial Visual Surveys. Fall Chinook salmon spawning in the PRP area was confined to the upper portion of Priest Rapids Pool, with most spawning occurring in the Wanapum Dam tailrace. Maximum redd counts from aerial visual observations in the Wanapum Dam tailrace area were 885, 506, and 1,379 in 2000, 2001, and 2002, respectively (Figure 7). The redd counts in 2000 and 2001 were higher than each of the counts from previous years. However, not all of the previous surveys were conducted at the peak of spawning. No evidence of spawning was observed in either the Wanapum Pool or Rock Island Dam tailrace in 2000 or 2001.
0
200
400
600
800
1000
1200
1400
1600
1987 1988 1989 1990 1991 1992 1993 1994 1995 1996 1997 1998 1999 2000 2001 2002 2003
Year
Visu
al R
edd
Cou
nt
No DataNo Data
Figure 7. Visual counts of fall Chinook salmon redds in the Wanapum Dam tailrace area between 1987 and 2003. Data were not collected in 1988 and between 1992 and 1999. Data from 1987 and 1989-1991 from D. Dauble, Battelle, personal communication. Note: this is not the total estimate of redds in the study area; see aerial photography section below for total redd estimates. Also, the count for 2003 is low due to poor observation conditions during flights.
©2004, Public Utility District No. 2 of Grant County, Washington. All Rights Reserved Under U.S. and Foreign Law, Treaties, and Conventions.
3.6 Chinook Salmon Escapement and Spawning
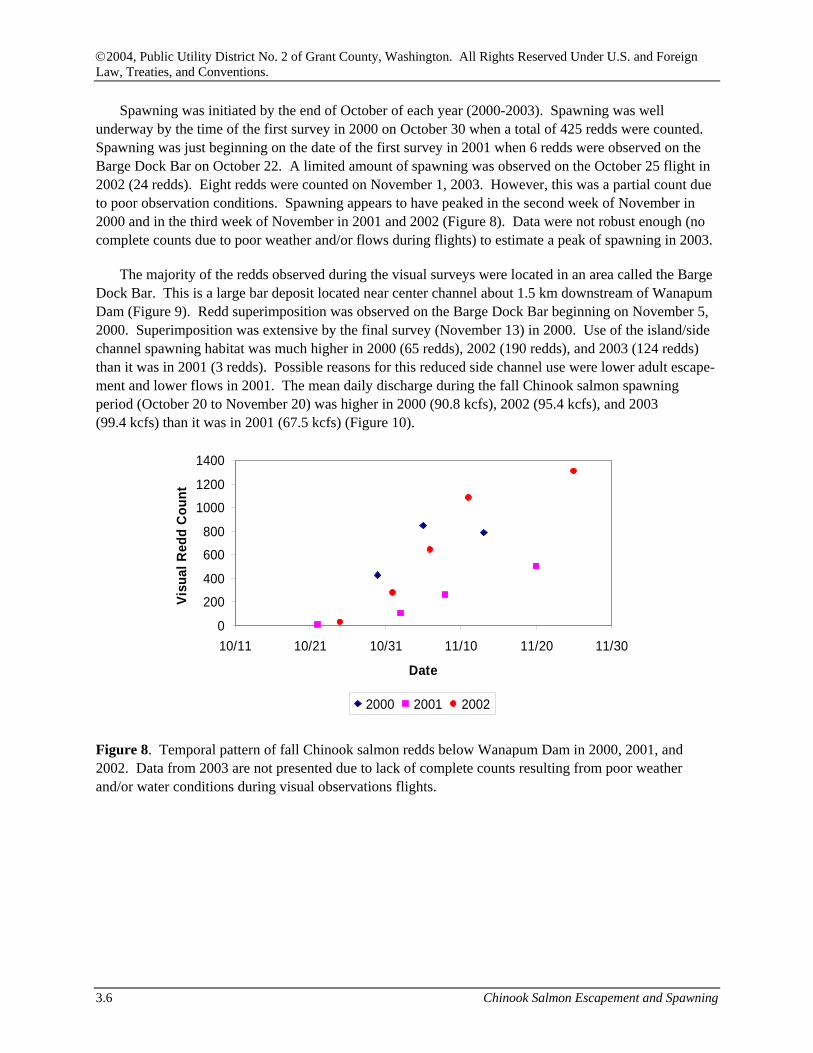
Spawning was initiated by the end of October of each year (2000-2003). Spawning was well underway by the time of the first survey in 2000 on October 30 when a total of 425 redds were counted. Spawning was just beginning on the date of the first survey in 2001 when 6 redds were observed on the Barge Dock Bar on October 22. A limited amount of spawning was observed on the October 25 flight in 2002 (24 redds). Eight redds were counted on November 1, 2003. However, this was a partial count due to poor observation conditions. Spawning appears to have peaked in the second week of November in 2000 and in the third week of November in 2001 and 2002 (Figure 8). Data were not robust enough (no complete counts due to poor weather and/or flows during flights) to estimate a peak of spawning in 2003.
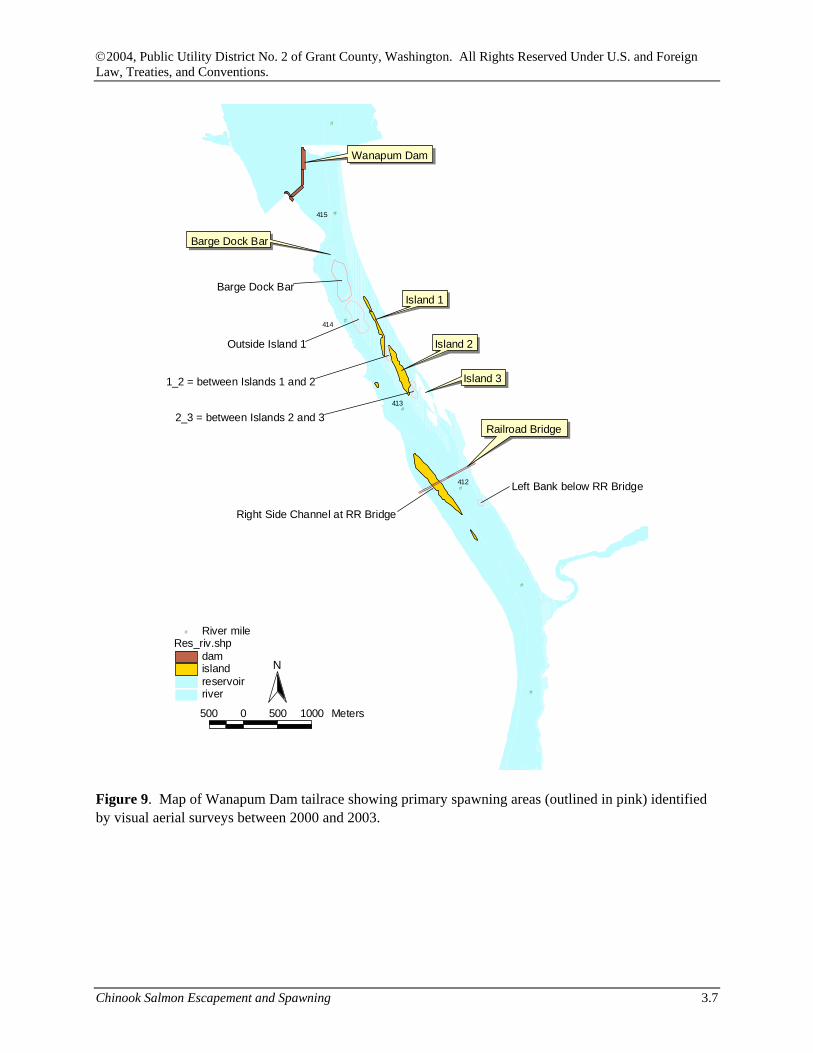
The majority of the redds observed during the visual surveys were located in an area called the Barge Dock Bar. This is a large bar deposit located near center channel about 1.5 km downstream of Wanapum Dam (Figure 9). Redd superimposition was observed on the Barge Dock Bar beginning on November 5, 2000. Superimposition was extensive by the final survey (November 13) in 2000. Use of the island/side channel spawning habitat was much higher in 2000 (65 redds), 2002 (190 redds), and 2003 (124 redds) than it was in 2001 (3 redds). Possible reasons for this reduced side channel use were lower adult escape-ment and lower flows in 2001. The mean daily discharge during the fall Chinook salmon spawning period (October 20 to November 20) was higher in 2000 (90.8 kcfs), 2002 (95.4 kcfs), and 2003 (99.4 kcfs) than it was in 2001 (67.5 kcfs) (Figure 10).
0
200
400
600
800
1000
1200
1400
10/11 10/21 10/31 11/10 11/20 11/30
Date
Visu
al R
edd
Cou
nt
2000 2001 2002
Figure 8. Temporal pattern of fall Chinook salmon redds below Wanapum Dam in 2000, 2001, and 2002. Data from 2003 are not presented due to lack of complete counts resulting from poor weather and/or water conditions during visual observations flights.
©2004, Public Utility District No. 2 of Grant County, Washington. All Rights Reserved Under U.S. and Foreign Law, Treaties, and Conventions.
Chinook Salmon Escapement and Spawning 3.7
#
#
#
#
#
#
#
Island 1
Island 2
Island 3
Barge Dock Bar
Wanapum Dam
415
414
412
413
%
Barge Dock Bar
#
Outside Island 1#
1_2 = between Islands 1 and 2#
2_3 = between Islands 2 and 3
#
Left Bank below RR Bridge#
Right Side Channel at RR Bridge
Railroad Bridge
N
500 0 500 1000 Meters
Res_riv.shpdamislandreservoirriver
# River mile
Figure 9. Map of Wanapum Dam tailrace showing primary spawning areas (outlined in pink) identified by visual aerial surveys between 2000 and 2003.

©2004, Public Utility District No. 2 of Grant County, Washington. All Rights Reserved Under U.S. and Foreign Law, Treaties, and Conventions.
3.8 Chinook Salmon Escapement and Spawning
0
20
40
60
80
100
120
140
10/20 10/23 10/26 10/29 11/1 11/4 11/7 11/10 11/13 11/16 11/19
Date
Mea
n D
aily
Dis
char
ge (k
cfs)
2000 2001 2002 2003
Figure 10. Mean daily discharge (kcfs) at Wanapum Dam during the fall Chinook salmon spawning period between 2000 and 2003.
Aerial Photography. The combination of visual surveys and digital photography provided an effective technique for detecting the maximum number of redds that were visible from the air. Several redds were observed on the visual surveys that were not apparent on the photographs, while the photographs proved much more precise for the enumeration of redds in large aggregations and for determining the precise locations of redds.
2000. Counts of redds from digital aerial images taken on November 10, 2000, provided a higher total number of visible redds than did visual counts. Because of the large amount of superimposition on the Barge Dock Bar (Figure 11), the mean area of individual redds that were distinguishable on the aerial images (N = 91; mean area = 22.8 m2) was used to calculate the number of redds in the Wanapum Dam tailrace area. To do this, the total area that was used for spawning was divided by the mean area of individual redds. Some redds observed in visual surveys were not distinguishable on the aerial photo-graphs. These redds (20 total, including 19 from the left bank below the railroad bridge and 1 in the side channel on the river left side of the railroad bridge) were added to the total number of redds enumerated based on the aerial photographs. The combination of the 20 redds not detected on the photographs and the estimate based on the area-based calculations (assuming no redd superimposition) yielded a point estimate of 2,102 redds for the Wanapum Dam tailrace area in 2000.
When the mean size of the redds was reduced to account for 10 percent and 30 percent superimpo-sition in the Barge Dock Bar area, the point estimates increased to 2,323 and 2,954 redds, respectively. Table 4 shows the point estimates and confidence limits (±1.96*SD/sqrt(N) of redd area) of redds in the Wanapum Dam tailrace area in 2000. These redd estimates include only redds that were visible from the air. No deepwater redd surveys (using underwater videography) were conducted in 2000.

©2004, Public Utility District No. 2 of Grant County, Washington. All Rights Reserved Under U.S. and Foreign Law, Treaties, and Conventions.
Chinook Salmon Escapement and Spawning 3.9
Figure 11. Aerial digital image of the Barge Dock Bar area downstream of Wanapum Dam on November 10, 2000. Light areas in the left-center of the image are fall Chinook salmon redds. The image has been color-shifted to enhance the definition of redds. Table 4. Estimated number of fall Chinook salmon redds from digitized aerial photographs in the Wanapum Dam tailrace area in 2000. Estimates include mean numbers of redds assuming no overlap, 10 percent overlap, and 30 percent overlap for superimposed area on Barge Dock Bar. Confidence intervals (CI) are also shown for each estimate.
No Overlap 10 Percent
Overlap 30 Percent
Overlap Mean 2,102 2,323 2,954 Low CI 1,962 2,167 2,755 High CI 2,264 2,483 3,187
2001. Aerial photographs taken on November 8, 2001, revealed a total point estimate of 725 redds in the Wanapum Dam tailrace area (Table 5). Even with the lower redd densities in 2001, there appeared to be some superimposition on the Barge Dock Bar (Figure 12). A 10 percent redd overlap estimate for 2001 resulted in an estimate of 845 fall Chinook salmon redds visible from the air. There was a high degree of overlap between the areas where redds were constructed between 2000 and 2001 (Figures 13 and 14).

©2004, Public Utility District No. 2 of Grant County, Washington. All Rights Reserved Under U.S. and Foreign Law, Treaties, and Conventions.
3.10 Chinook Salmon Escapement and Spawning
Table 5. Estimated number of fall Chinook salmon redds from digitized aerial photographs in the Wanapum Dam tailrace area in 2001. Estimates include mean numbers of redds assuming no overlap and 10 percent overlap for superimposed area on Barge Dock Bar. Confidence intervals (CI) are also shown for each estimate.
No Overlap 10 Percent
Overlap Mean 725 845 Low CI 671 784 High CI 789 916
Figure 12. Aerial photograph of the Barge Dock Bar area downstream of Wanapum Dam on November 8, 2001. Light areas (dots) in the left-center of the image are fall Chinook salmon redds.

©2004, Public Utility District No. 2 of Grant County, Washington. All Rights Reserved Under U.S. and Foreign Law, Treaties, and Conventions.
Chinook Salmon Escapement and Spawning 3.11
Figure 13. Digitized fall Chinook salmon redds in the Wanapum Dam tailrace area in 2000 and 2001. Locations of single redds (red) and multiple redds (superimposed; stippled blue) are shown for each year. Note: Side channel/island redds are not represented in this figure.
2002. In 2002, the redds followed the same spatial distribution as in the previous two years. Aerial photography was delayed by bad weather from November 11 through November 24. Redds were less visible than the previous two years due to this delay (lower sun angle and periphyton re-growth on some of the oldest redds). Aerial photographs taken on November 25, 2002 (Figure 15), combined with information from visual aerial and deepwater (see below) surveys, revealed a total point estimate of 2,086 redds in the Wanapum Dam tailrace area (Table 6). Similar to 2001, there appeared to be some superimposition on the Barge Dock Bar. A 10 percent redd overlap estimate for 2002 resulted in an estimate of 2,299 fall Chinook salmon redds visible from the air. Use of side channel spawning areas in the island complex by spawning fall Chinook salmon was higher in 2002 than in 2000 or 2001 (Figure 13).

©2004, Public Utility District No. 2 of Grant County, Washington. All Rights Reserved Under U.S. and Foreign Law, Treaties, and Conventions.
3.12 Chinook Salmon Escapement and Spawning
90 0 90 180 270 360 450 Meters
Res_riv.shpRedds00Redds01Redds02Redds03
Figure 14. Digitized fall Chinook salmon redds in the island complex area of the Wanapum Dam tailrace in 2000, 2001, 2002, and 2003. Locations of redds observed in 2000 are shown in green. The location of the single redd detected on aerial photographs in 2001 is shown in red (single redd). Redds from 2002 are marked in blue and redds observed in 2003 are marked in stippled blue. The center of the island complex shown is approximately 3.5 km downstream of Wanapum Dam.

©2004, Public Utility District No. 2 of Grant County, Washington. All Rights Reserved Under U.S. and Foreign Law, Treaties, and Conventions.
Chinook Salmon Escapement and Spawning 3.13
Figure 15. Aerial photograph of the Barge Dock Bar area downstream of Wanapum Dam on November 25, 2002. Light areas (dots) in the left-center of the image are fall Chinook salmon redds.
Table 6. Estimated number of fall Chinook salmon redds from digitized aerial photographs in the Wanapum Dam tailrace area in 2002. Estimates include mean numbers of redds assuming no overlap and 10 percent overlap for superimposed area on Barge Dock Bar. Confidence intervals (CI) are also shown for each estimate.
No Overlap 10 Percent
Overlap Mean 2,086 2,299 Low CI 1,909 2,103 High CI 2,303 2,540

©2004, Public Utility District No. 2 of Grant County, Washington. All Rights Reserved Under U.S. and Foreign Law, Treaties, and Conventions.
3.14 Chinook Salmon Escapement and Spawning
2003. Aerial photography was collected on November 13, 2003. Aerial photographs, combined with information from visual aerial and deepwater (see Figure 16) surveys, revealed a total point estimate of 1,849 redds in the Wanapum Dam tailrace area (Table 7) in 2003. Similar to 2001, there appeared to be some superimposition on the Barge Dock Bar. A 10 percent redd overlap estimate for 2003 resulted in an estimate of 2,027 fall Chinook salmon redds visible from the air. Use of side channel spawning areas in the island complex by spawning fall Chinook salmon was again high in 2003.
Figure 16. Aerial photograph of the Barge Dock Bar area downstream of Wanapum Dam on November 13, 2003. Light areas (dots) in the left-center of the image are fall Chinook salmon redds.

©2004, Public Utility District No. 2 of Grant County, Washington. All Rights Reserved Under U.S. and Foreign Law, Treaties, and Conventions.
Chinook Salmon Escapement and Spawning 3.15
Table 7. Estimated number of fall Chinook salmon redds from digitized aerial photographs in the Wanapum Dam tailrace area in 2003. Estimates include mean numbers of redds assuming no overlap and 10 and 30 percent overlap for superimposed area on Barge Dock Bar. Confidence intervals (CI) are also shown for each estimate.
No overlap 10% overlap 30% overlapMean 1,849 2,027 2,536
Low CI 1,742 1,909 2,383High CI 1,973 2,164 2,712
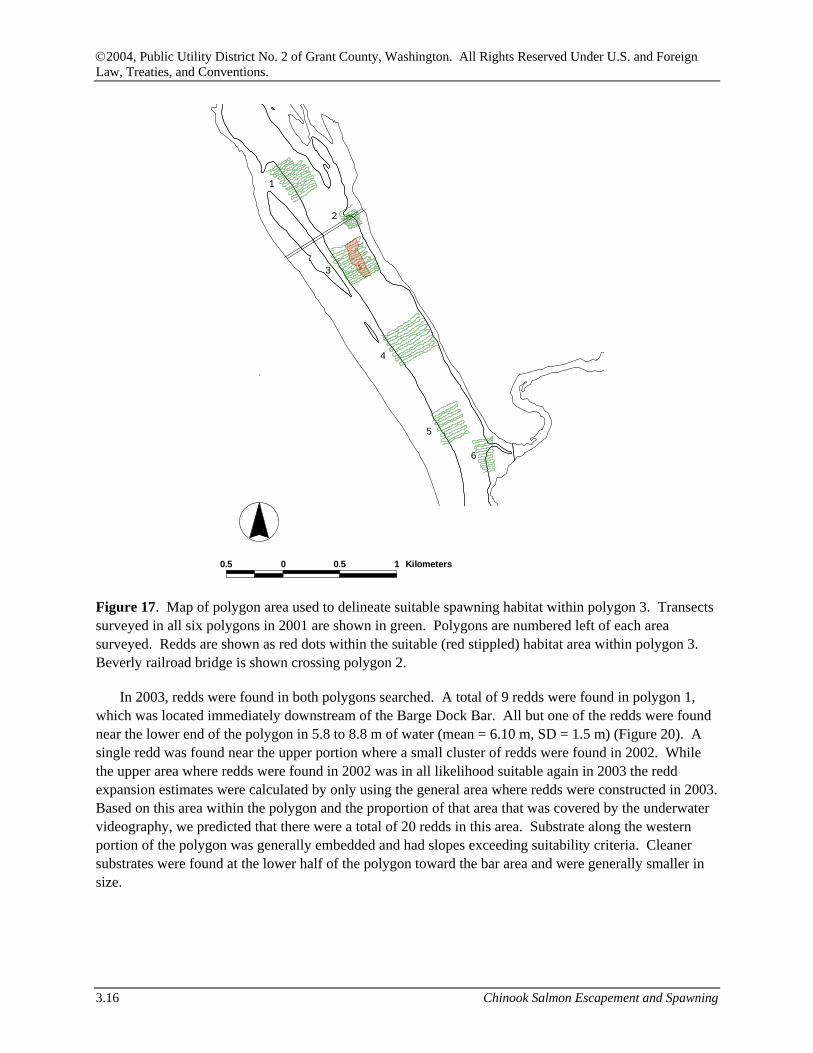
Deepwater Redd Surveys. Salmon redds were observed in one of the six deepwater areas surveyed by underwater videography in the Wanapum Dam tailrace area on November 12 and 13, 2001. Four fall Chinook salmon redds were located within an area downstream of the train trestle below Wanapum Dam in polygon 3 (rkm 663, rm 412). These redds were found in 9 to 11.5 m of water and were near the mid-channel region. Two carcasses and two live fall Chinook salmon were observed near one of the redds. The search area where the deepwater redds were found was dominated by areas of boulders (the eastern shore of the polygon) that were considered unsuitable for Chinook salmon spawning. To expand the survey counts to estimate the number of redds in this polygon, the underwater video footage was visually examined to reduce the total area of the polygon to a suitable area based on substrate size. The size of the suitable spawning area was estimated to be 30,000 m2 (Figure 17). Video coverage within this area was 3,410 m2 or 11.3 percent. Based on the total number of redds (4) within this polygon and the proportion of the suitable area that was surveyed, an expanded estimate of 35 redds in this area was produced. No extrapolations were calculated for polygons 1, 2, 4, 5, and 6 because no redds were found there.
In 2002, redds were found in both polygons searched. A total of 7 redds were found in polygon 1, which was located immediately downstream of the Barge Dock Bar. The redds were found in 3.7 to 6.9 m of water (mean = 5.2 m, SD = 1.2 m) and were near the upper end of the polygon (Figure 18). The suitable spawning area within polygon 1 was generally limited to the area where the redds were found. Substrate along the western portion of the polygon was appeared to be embedded and had slopes exceeding suitability criteria. Cleaner substrates were found at the lower half of the polygon toward the bar area and particles were generally smaller in size. The slope in this region also exceeded the criteria. Based on the area within the polygon that we determined to be suitable, and the proportion of that suitable area that was covered by the underwater videography, we predicted that there were a total of 17 redds in this area immediately downstream of the Barge Dock Bar. In polygon 2, downstream of the railroad bridge, we located 19 redds in water between 7.0 and 11.5 m deep (mean = 9.3 m, SD = 1.9 m) in the center of the river channel (Figure 19). Nearly all redds were identified by the presence one or more live adult salmon (or jacks). In addition, 16 salmon carcasses were observed. Boundaries were placed within polygon 2 based on the location and extent of suitable cobbles determined in 2001 and on the locations of redds observed in 2002. The substrate size range used for this determination was 7.6 to 15 cm. Substrate size increases towards the east side of the river channel with larger rocks >35 cm becoming the dominant substrate type. Substrate size on the west side of the channel is intermixed with smaller cobbles being more dominant and an increasing amount of embeddedness. Based on the area within the polygon that we determined to be suitable and the proportion of that suitable area that was covered by the underwater videography, we predicted that there were a total of 49 redds in this area immediately downstream of the Beverly railroad bridge.
©2004, Public Utility District No. 2 of Grant County, Washington. All Rights Reserved Under U.S. and Foreign Law, Treaties, and Conventions.
3.16 Chinook Salmon Escapement and Spawning
#
###
1
2
3
4
5
6
0.5 0 0.5 1 Kilometers
Figure 17. Map of polygon area used to delineate suitable spawning habitat within polygon 3. Transects surveyed in all six polygons in 2001 are shown in green. Polygons are numbered left of each area surveyed. Redds are shown as red dots within the suitable (red stippled) habitat area within polygon 3. Beverly railroad bridge is shown crossing polygon 2.
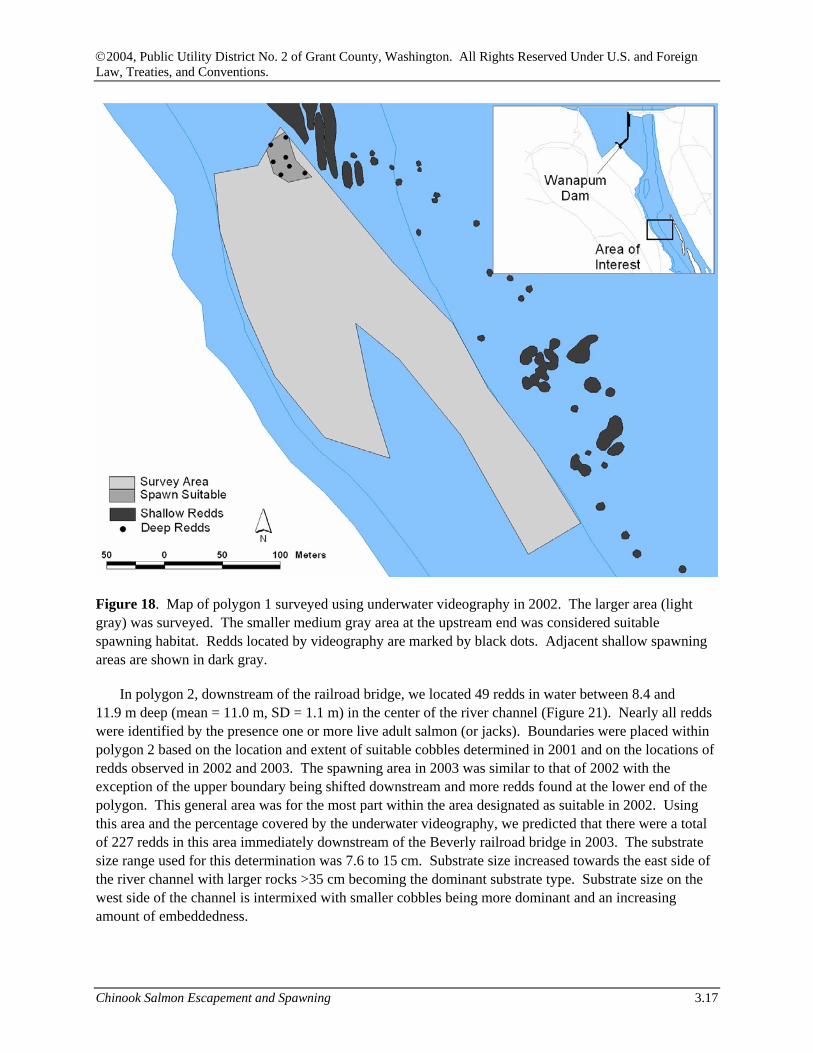
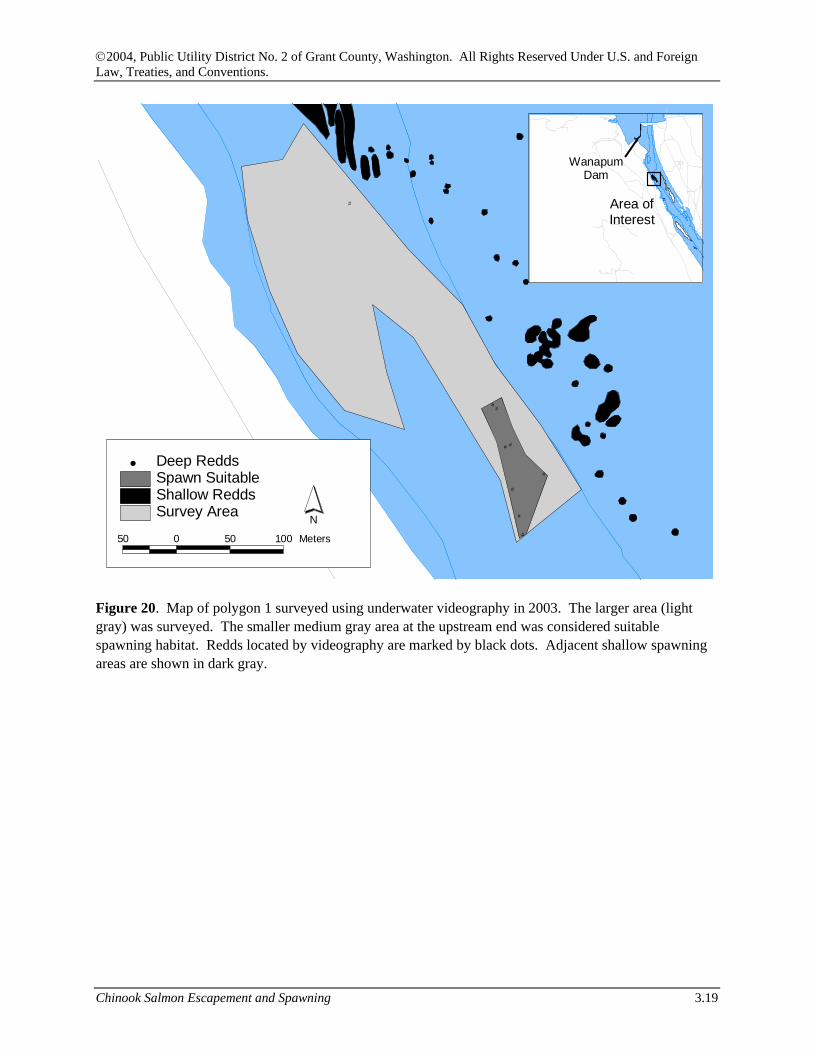
In 2003, redds were found in both polygons searched. A total of 9 redds were found in polygon 1, which was located immediately downstream of the Barge Dock Bar. All but one of the redds were found near the lower end of the polygon in 5.8 to 8.8 m of water (mean = 6.10 m, SD = 1.5 m) (Figure 20). A single redd was found near the upper portion where a small cluster of redds were found in 2002. While the upper area where redds were found in 2002 was in all likelihood suitable again in 2003 the redd expansion estimates were calculated by only using the general area where redds were constructed in 2003. Based on this area within the polygon and the proportion of that area that was covered by the underwater videography, we predicted that there were a total of 20 redds in this area. Substrate along the western portion of the polygon was generally embedded and had slopes exceeding suitability criteria. Cleaner substrates were found at the lower half of the polygon toward the bar area and were generally smaller in size.
©2004, Public Utility District No. 2 of Grant County, Washington. All Rights Reserved Under U.S. and Foreign Law, Treaties, and Conventions.
Chinook Salmon Escapement and Spawning 3.17
Figure 18. Map of polygon 1 surveyed using underwater videography in 2002. The larger area (light gray) was surveyed. The smaller medium gray area at the upstream end was considered suitable spawning habitat. Redds located by videography are marked by black dots. Adjacent shallow spawning areas are shown in dark gray.
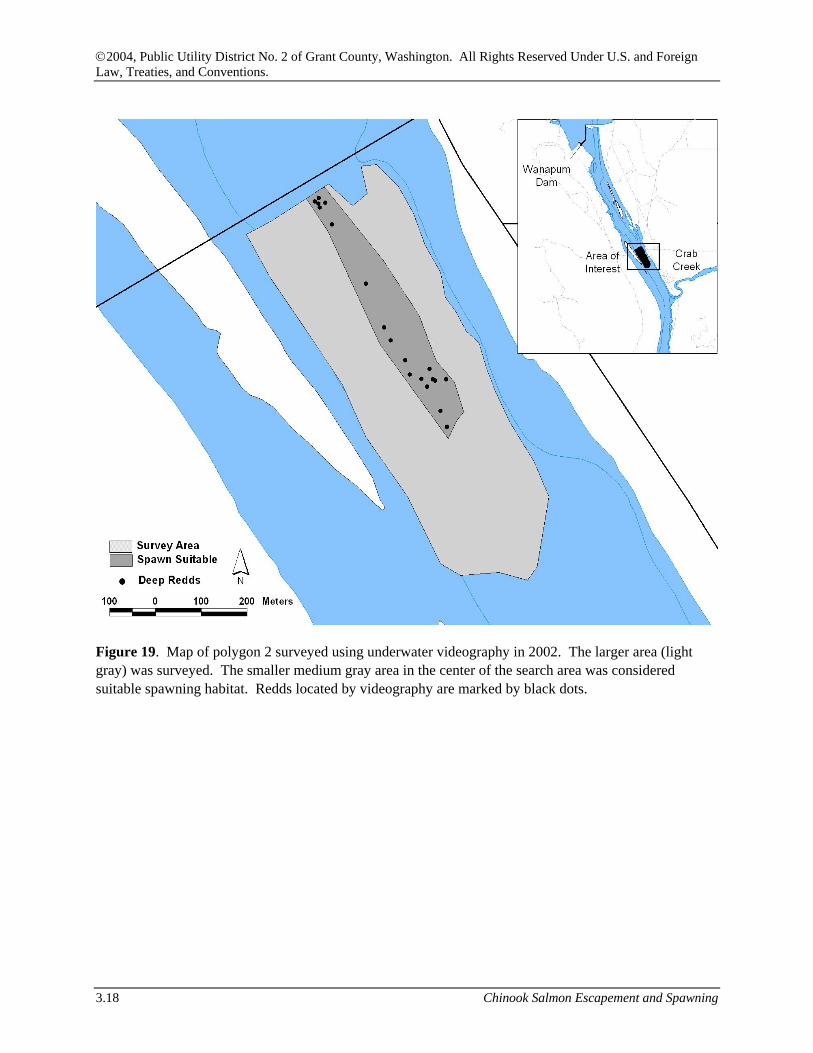
In polygon 2, downstream of the railroad bridge, we located 49 redds in water between 8.4 and 11.9 m deep (mean = 11.0 m, SD = 1.1 m) in the center of the river channel (Figure 21). Nearly all redds were identified by the presence one or more live adult salmon (or jacks). Boundaries were placed within polygon 2 based on the location and extent of suitable cobbles determined in 2001 and on the locations of redds observed in 2002 and 2003. The spawning area in 2003 was similar to that of 2002 with the exception of the upper boundary being shifted downstream and more redds found at the lower end of the polygon. This general area was for the most part within the area designated as suitable in 2002. Using this area and the percentage covered by the underwater videography, we predicted that there were a total of 227 redds in this area immediately downstream of the Beverly railroad bridge in 2003. The substrate size range used for this determination was 7.6 to 15 cm. Substrate size increased towards the east side of the river channel with larger rocks >35 cm becoming the dominant substrate type. Substrate size on the west side of the channel is intermixed with smaller cobbles being more dominant and an increasing amount of embeddedness.
©2004, Public Utility District No. 2 of Grant County, Washington. All Rights Reserved Under U.S. and Foreign Law, Treaties, and Conventions.
3.18 Chinook Salmon Escapement and Spawning
Figure 19. Map of polygon 2 surveyed using underwater videography in 2002. The larger area (light gray) was surveyed. The smaller medium gray area in the center of the search area was considered suitable spawning habitat. Redds located by videography are marked by black dots.
©2004, Public Utility District No. 2 of Grant County, Washington. All Rights Reserved Under U.S. and Foreign Law, Treaties, and Conventions.
Chinook Salmon Escapement and Spawning 3.19
#
##
# #
#
#
#
#
50 0 50 100 Meters
N
#
WanapumDam
Area ofInterest
Survey AreaShallow ReddsSpawn Suitable
# Deep Redds
Figure 20. Map of polygon 1 surveyed using underwater videography in 2003. The larger area (light gray) was surveyed. The smaller medium gray area at the upstream end was considered suitable spawning habitat. Redds located by videography are marked by black dots. Adjacent shallow spawning areas are shown in dark gray.
•

©2004, Public Utility District No. 2 of Grant County, Washington. All Rights Reserved Under U.S. and Foreign Law, Treaties, and Conventions.
3.20 Chinook Salmon Escapement and Spawning
##
# #
# ##
## #
#### ##
## ##
## #
## ##
## ###
##
### #
##### ##
###
#
200 0 200 Meters
N
Survey AreaSpawn Suitable
# Deep Redds
#
WanapumDam
Area ofInterest
CrabCreek
Figure 21. Map of polygon 2 surveyed using underwater videography in 2003. The larger area (light gray) was surveyed. The smaller medium gray area in the center of the search area was considered suitable spawning habitat. Redds located by videography are marked by black dots.
•

©2004, Public Utility District No. 2 of Grant County, Washington. All Rights Reserved Under U.S. and Foreign Law, Treaties, and Conventions.
Chinook Salmon Escapement and Spawning 4.1
4.0 Discussion
From the early 1960s through the mid-1980s, fish managers considered the mainstem habitat upstream of Priest Rapids Dam to be unsuitable for successful natural production of fall Chinook salmon. The construction of the hydropower system, which replaced much of shallow swift riverine environments with deep and relatively slow reservoirs, was thought to have all but eliminated the possibility that fall Chinook salmon might be able to survive without man’s intervention. Regarding the Washington Department of Fisheries’ decision to trap most adult fall Chinook salmon at Priest Rapids Dam for an artificial production program, Allen (1977) wrote:
“In defense of our trapping program, I don’t believe fall Chinook have any future above Priest Rapids because of the lack of spawning area in the main channel, the loss of rearing due to river fluctuations, and the serious juvenile mortality rate caused in passage through the dams.”
Mr. Allen may not have given the fall Chinook salmon enough credit for being adaptable. Fall Chinook salmon did have a future above Priest Rapids Dam. A substantial number of fall Chinook salmon now spawn successfully in the Wanapum Dam tailrace area. This was not always the case. Starting in 1963, fish managers implemented a program to mitigate the impact of the Priest Rapids Dam (completed in 1960) and the soon-to-be-completed Wanapum Dam on the fall Chinook salmon. The managers trapped a large percentage of the total fall Chinook salmon run in the left bank (east) ladder at Priest Rapids Dam and then placed the salmon in a 1,829-m-long artificial spawning channel designed for 2,500 pairs of adult fall Chinook salmon (Allen and Meekin 1973; Allen 1977; Dauble and Watson 1990). For example, an average of 57 percent (range = 35 to 69 percent) of the total run of adult fall Chinook salmon passing Priest Rapids Dam was removed between 1963 and 1970 (Allen and Meekin 1973). Brood fish collected from the ladder were also used at the Priest Rapids Hatchery from 1972 through 1988 (Dauble and Watson 1990). Consequently, relatively few fall Chinook salmon were allowed to migrate upstream past Priest Rapids Dam for over 20 years. In reference to the early capture and transport of most of the fall Chinook salmon attempting to migrate upstream past Priest Rapids Dam, Davidson (1966, p. 30) wrote:
“It is obvious from the results of the past two years operations of the spawning channel that it is not a satisfactory means of artificially propagating the fall Chinook runs. In fact, it is destroying rather than salvaging almost the entire run to the upper Columbia above Priest Rapids Dam.”
Escapement of fall Chinook salmon to areas upstream of Priest Rapids Dam increased after the spawning channel was abandoned (primarily because of disease and wind-blown fine sediment problems) and the Priest Rapids Hatchery began collecting brood stock in their volunteer trap located at the down-stream end of the old spawning channel (now juvenile rearing ponds).
Redd counts for the Wanapum Dam tailrace area in each year between 2000 and 2003 were higher than any previously documented value in this area since the dams were constructed (Priest Rapids Dam completed in 1960; Wanapum Dam completed in 1964). The estimated number of redds in 2000 was 2,954. The estimate for 2001 was 845. In 2002 and 2003 there were an estimate 2,299 and 2,536 redds, respectively. Previously, the highest count for redds in the Wanapum Dam tailrace area was 492 in 1989 (D. Dauble, Battelle, personal communication).

©2004, Public Utility District No. 2 of Grant County, Washington. All Rights Reserved Under U.S. and Foreign Law, Treaties, and Conventions.
4.2 Chinook Salmon Escapement and Spawning
In 2000, there was a high degree of redd superimposition on the Barge Dock Bar spawning area below Wanapum Dam. Overall production of fall Chinook salmon in the Wanapum Dam tailrace was likely reduced by this redd superimposition. Egg losses in superimposed redds caused by digging in and around previously constructed redds has been shown to impact overall production in salmonids (McNeil 1964; Hayes 1987; Fukushima et al. 1998). Fall Chinook salmon disturbed the surface substrate nearly completely when spawning in an area over 35,000 m2. It appeared that the outer margins of this high density spawning area were defined within the first two weeks of spawning; additional redds were then constructed between or overlapping with previously constructed redds. In 2001, when escapement was lower, less superimposition (10 percent) was estimated to have occurred. In 2002, superimposition again occurred, but appeared to be relatively limited, possibly due to the higher flows (than 2001) and lower escapement (than 2000). In areas where redd superimposition has been studied, fish that spawn later tend to be more successful than those that spawn early. Hayes (1987) reported that redd superimposition by later spawning rainbow trout caused a 94 percent reduction in spawning success for earlier spawning brown trout in a New Zealand stream.
The high degree of redd superimposition and lack of any documented fall Chinook spawning in the Rock Island Dam tailrace may indicate that spawning habitat for fall Chinook salmon is limiting the population in the Priest Rapids Project area. Our spawning habitat suitability model predicted that there were other areas within the Wanapum Dam tailrace that were suitable for fall Chinook spawning, yet these areas were not utilized (McMichael et al. 2003a). Efforts to increase the area of suitable spawning habitat in the Wanapum Dam tailrace should be evaluated as a means to increase overall fall Chinook salmon production in the Priest Rapids Project area. Experiments evaluating the possibility of attracting some spawners from the Barge Dock Bar to nearby areas with suitable depth, velocity, and substrate may be worth pursuing in the future. Two alternatives may warrant consideration as possible spawning habitat enhancement actions. First, an experimental evaluation of whether the construction of artificial redds or scarification would attract spawning fall Chinook salmon to recently unutilized (but suitable) spawning habitat would increase understanding relative to the role that substrate permeability and the effect loose substrate plays in redd site selection. Chapman et al. (1984) reported minimal success in their efforts to attract spawning fall Chinook salmon into areas they scarified in the Hanford Reach. However, they did report that many salmon spawned on the areas that they dug up in their efforts to construct artificial redds for some incubation and development research. A draft experimental design to evaluate the utility of the construction of areas of increased sediment permeability (using high pressure water) to attract spawning fall Chinook salmon to areas that were previously unused was submitted to GC PUD in the form of a technical memorandum (McMichael to Lukas, Jan. 6, 2004). The second possible method that might be investigated for increasing the amount of suitable spawning habitat is the creation of artificial upwelling areas near presently used spawning locations. Geist (2000) showed that hyporheic discharge may be one of the key habitat features that affect where fall Chinook salmon build their redds. Upwelling areas could be created by pumping river water into perforated pipes placed under the substrate in areas that are currently unused by spawning fall Chinook salmon.
In contrast to extensive spawning of fall Chinook salmon downstream of Wanapum Dam, no salmon spawning was detected in the Rock Island Dam tailrace area in 2000, 2001, 2002, or 2003. The deep U-shaped channel through bedrock in much of this reach was not expected to be used by fall Chinook salmon for spawning. However, the large cobble bar near the left (east) bank at rkm 726.5 and the alluvial deposits off the mouth of Moses Coulee (rkm 720) appeared to contain suitable depths and substrate for fall Chinook salmon spawning, but no redds were observed during flights or in aerial

©2004, Public Utility District No. 2 of Grant County, Washington. All Rights Reserved Under U.S. and Foreign Law, Treaties, and Conventions.
Chinook Salmon Escapement and Spawning 4.3
photographs of these areas. Three fall Chinook salmon carcasses were counted on the east side of the large cobble bar during aerial surveys in 2000. The encroachment of the Wanapum Pool on the tailwater of Rock Island Dam may have reduced water velocities to the point where the habitat is not suitable for fall Chinook spawning. Deepwater spawning may have occurred in the Rock Island Dam tailrace area that was not detected by visual observation methods. Redds to a depth of about 3 to 4 m are visible from the air (Dauble and Watson 1990). Therefore, if any spawning occurred in the Rock Island Dam tailrace in water deeper than about 4 m, it would have gone undetected. No attempt was made to locate redds with the deepwater videography system because no evidence of spawning existed based on traditional aerial methods. The lack of visible redds in the Rock Island Dam area may have little to do with the construction of the Wanapum Dam. Edson (1957, 1958) found relatively little spawning in the Columbia River between Crescent Bar and Rock Island Dam before the construction of Wanapum Dam.
Based on the combination of aerial visual counts, aerial photography, and deepwater videography, comprehensive estimates of fall Chinook salmon redds constructed in the Wanapum Dam tailrace area in 2001, 2002, and 2003 were produced. The combined estimate for the Wanapum Dam tailrace area was 845 in 2001. Deepwater videography surveys were not conducted in this area in 2000. Based on the proportion of shallow versus deep redds in 2000 and 2001, there may have been as many as 136 deep water redds that were not accounted for in 2000. Higher numbers may have spawned in deep water in 2000 because of relatively higher escapement of adults and the large amount of redd superimposition that occurred in the Barge Dock Bar area. An estimated 247 deep water redds were constructed by spawning fall Chinook salmon in the Wanapum Dam tail race area in 2003.
The density of spawning adults was much higher in the Wanapum Dam tailrace in 2000 than it was for the entire Hanford Reach. For example, an estimated 35,547 adult fall Chinook salmon (Watson 2001) in the Hanford Reach spawned in the 72 km between Wooded Island and Priest Rapids Dam in 2000 yielding a relative density of 493 adults/km. In contrast, an estimated 8,750 adult fall Chinook salmon spawned in the 8-km reach below Wanapum Dam in 2000 yielding a relative density of 1,094 adults/km. However, there are patches of fall Chinook salmon spawning in the Hanford Reach having similar redd density to the Barge Dock Bar area below Wanapum Dam (e.g., Area 10 - Vernita Bar and Area 5 – Locke Island; Dauble and Watson 1997; Geist et al. 2000).
There is a fair amount of uncertainty in the escapement estimates as a result of several factors. First, except for radio telemetry data for 2000 (an estimate of 44 percent fallback, T. Bjornn, University of Idaho, unpublished data) and the feasibility fallback monitoring Battelle conducted in 2001 (McMichael et al. 2003a), little information exists regarding fallback at Priest Rapids Dam. Fish managers used an adjustment factor to try to improve the Hanford Reach escapement estimates in 2000 and 2001 (Watson 2001; Watson and Hoffarth 2002). Fallback appears to have been particularly high in 2000. Without an adjustment for fallback at Priest Rapids Dam, the adult fall Chinook salmon escapement estimate for the Hanford Reach would have been 5,288 (Watson 2001). This escapement estimate was inconsistent with aerial redd counts (R. Mueller, Battelle, unpublished data) and carcass recoveries (Watson 2001). The cause of the high fallback rates in 2000 is unknown. However, the operation of the Priest Rapids Hatchery spawning channel/volunteer trap may have been a factor in the high fallback rate that year. Hatchery staff constructed a temporary rack (weir) in the channel downstream of the volunteer trap in an attempt to keep the salmon in the Columbia River until they were needed for brood stock at the hatchery. The ‘volunteer’ trap was operated for the first time on September 20, 2000, approximately 2 weeks later than the typical start between September 6 and 8. Much of the temporary weir was removed when it

©2004, Public Utility District No. 2 of Grant County, Washington. All Rights Reserved Under U.S. and Foreign Law, Treaties, and Conventions.
4.4 Chinook Salmon Escapement and Spawning
became apparent that the fish were not appearing in the adult trap upstream of the weir (D. Bogart, WDFW, personal communication). The temporary weir was constructed in part with pressure treated lumber. This lumber commonly contains copper, chromium, and arsenate. Salmonids have been shown to avoid these metals (Poston 2001). Installation of treated wood structures and the resulting release of metals may have resulted in avoidance reactions by fish. Laboratory and field studies have shown that rainbow trout and Atlantic salmon can detect and will avoid zinc, copper, and chromium (Sprague 1964; Sprague et al. 1965; Sprague 1968; Anestis and Neufield 1986). The combination of the new weir and the later date of opening the volunteer trap may have contributed to a larger-than-normal number of salmon migrating past Priest Rapids Dam in 2000. Second, the water source for Priest Rapids Hatchery is taken from the forebay of Priest Rapids Dam. Fish that were not allowed to enter the hatchery system through the channel may have continued upstream and over Priest Rapids Dam in an attempt to home to this water body. Other sources of error in escapement estimates for the Priest Rapids Pool are very little adult passage (upstream and fallback) data for Wanapum Dam, no harvest data for the area between Priest Rapids and Wanapum Dams, and little data on spawning of fall Chinook salmon in tributaries.
The ratio of observed redds (based on aerial photography) to estimated adults was 1:4.2 in 2000, 1:4.2 in 2001, 1:1.6 in 2002, and 1:6.8 in 2003, assuming no overlap between redds. More probable estimates, using overlap estimates (30 percent for 2000 and 2003 and 10 percent for 2001 and 2002) as a result of the redd superimposition, yielded a redd-to-adult ratio of 1:3.0 in 2000, 1:3.6 in 2001, 1:1.5 in 2002, and 1:4.9 in 2003. These ratios fall towards the low end of the range observed in past studies on the Hanford Reach where visual aerial surveys produced an average of one redd for every nine adults (range = 1:3 to 1:16; Dauble and Watson 1990). Visser et al. (2002) enumerated redds in the Hanford Reach by analyses of aerial photography and found values similar to ours: redd to adult ratios of 1:3.4 and 1:3.7 for 1994 and 1995, respectively. Using sex ratio data from carcass surveys in the study area (data from R. Watson, PSMFC/WDFW, personal communication), there were 4,602 adult female fall Chinook salmon in the Wanapum Dam tailrace area in 2000, 1,118 females in 2001, 1,682 females in 2002, and 6,709 females in 2003. Therefore, the ratio of redds (assuming 30 percent overlap for 2000 and 2003 and 10 percent for 2001) to estimated number of females was 1:1.6 in 2000, 1:1.3 in 2001, 1:0.7 in 2002, and 1: 2.6 in 2003. In 2002, we estimated that the ratio of redds to females was 1:0.7, indicating there were more redds than females. This is an unlikely result. The level of certainty in the redd estimates is much higher than that in the escapement estimates. The escapement estimates for Priest Rapids Pool were made using a ratio between Wanapum and Rock Island Dam counts from only two years. In addition, with no spawning detected below Rock Island Dam between 2000 and 2002, there were between 2,332 (2000) and 8,776 (2003) adult fall Chinook salmon ‘unaccounted for’ annually between Wanapum and Rock Island Dams. It is possible that fallback at Wanapum Dam has occurred at a high rate in some years and/or the ratio between Wanapum and Rock Island dam counts is highly variable. Therefore, we feel the escapement estimates for the entire Priest Rapids Project (all adult fall Chinook salmon passing Priest Rapids Dam minus fallback at PRD [e.g., 10% in 2001 and 2002], limited harvest [estimated at 5%] and tributary loss [estimated at 1%], and passage at Rock Island Dam]) provide a more useful (fewer sources of error) estimate of the number of adult fall Chinook salmon available to spawn within the project. If we consider escapement of adult fall Chinook salmon to the entire PRP (as described above), the ratios between the estimated number of redds (using overlap estimates previously described) and female adult fall Chinook salmon are as follows; 2000 = 1:2.0, 2001 = 1:3.6, 2002 = 1:2.1, and 2003 = 1:4.5.
While the fall Chinook salmon in the PRP area do have a future, they also had a past. Edson (1957) reported fall Chinook salmon redd count numbers (from aerial surveys near the peak of spawning) for

©2004, Public Utility District No. 2 of Grant County, Washington. All Rights Reserved Under U.S. and Foreign Law, Treaties, and Conventions.
Chinook Salmon Escapement and Spawning 4.5
the area between Priest Rapids and Rock Island Dam over an 11-year period between 1947 and 1957 (Table 8). Edson reported that most of the spawning in the PRP area occurred between Beverly and Crescent Bar. He speculated that inundation of spawning habitat between the site of Priest Rapids Dam and Beverly would “not destroy a significant amount of spawning habitat.” However, he concluded that “slack water” behind Wanapum Dam would “destroy the spawning habitat upstream to Rock Island Dam.” It appears that his speculations were accurate.
In conclusion, the total number of fall Chinook salmon redds each year between 2000 and 2003 in the Priest Rapids Pool exceeded the maximum annual number of redds observed in the Columbia River between Priest Rapids and Rock Island Dams between 1947 and 1956, prior to the construction of Priest Rapids and Wanapum Dams. More redds were observed in the PRP area in 1957 than in any of the previous 10 years. Edson (1958) and Davidson (1966) attributed the increased redd numbers in 1957 to the reduced fishing pressure and improved passage conditions at Celilo Falls that year. The increased passage and escapement was attributed to the filling of the reservoir behind the Dalles Dam in 1957. The majority of the fall Chinook salmon spawning in the Wanapum Dam tailrace between 2000 and 2003 was located on one large mid-channel bar where the water depth (3 to 5 m) may protect the redds from the negative effects of fluctuations in river elevation related to the operation of the Priest Rapids Project. The depth at the location of this important spawning area may be responsible for its continued success. McMichael et al. (2003a) examined spawning habitat suitability throughout the Wanapum Dam tailrace area in more detail. In addition, McMichael et al. (2003b) estimated egg-to-fry survival rates for fall Chinook salmon redds in shallow side channel areas downstream of Wanapum Dam that are subjected to periodic dewatering due to hydropower operations.
Table 8. Annual fall Chinook salmon redd count data from aerial surveys conducted near the peak of fall Chinook spawning before the construction of the Priest Rapids Project (Edson 1957, 1958). PR = Priest Rapids. River kilometers are shown in parentheses.
Year PR to Beverly
(639-665) Beverly to Vantage
(663-677) Vantage to Crescent
Bar (677-710) Crescent Bar to Rock
Island (710-729) Annual Total
1947 0 138 202 1 341 1948 40 135 525 12 712 1949 0 114 136 1 251 1950 1 337 126 26 490 1951 0 265 364 95 724 1952 0 375 86 32 493 1953 4 92 58 28 182 1954 0 110 50 15 175 1955 0 64 41 6 111 1956 0 121 44 3 168 1957 0 389 309 58 756 Mean 4.1 194.5 176.5 25.2 400.3
©2004, Public Utility District No. 2 of Grant County, Washington. All Rights Reserved Under U.S. and Foreign Law, Treaties, and Conventions.
Chinook Salmon Escapement and Spawning 5.1
5.0 Literature Cited
Allen, R. L. 1977. “Status of the upper Columbia River salmon and steelhead runs.” In Columbia River Salmon and Steelhead, ed. E. Schweibert, pp. 23-30. American Fisheries Society, Special Publication Number 10, Washington, D.C.
Allen, R. L. and T. K. Meekin. 1973. “An evaluation of the Priest Rapids Chinook salmon spawning channel, 1963-1971.” Washington Department of Fisheries, Technical Report Number 11, Olympia, Washington.
Anestis, J. and R. J. Neufield. 1986. “Avoidance-preference reactions of rainbow trout (Salmo gairdneri) after prolonged exposure to chromium.” Water Research 20:1233-1241.
Chapman, D., A. Giorgi, T. Hillman, D. Deppert, M. Ehro, S. Hays, C. Peven, B. Suzumoto, and R. Klinge. 1994. Status of summer/fall Chinook salmon in the mid-Columbia region. Report of Don Chapman Consultants Inc. to Chelan, Douglas, and Grant County Public Utility Districts, Boise, Idaho.
Chapman, D. W., D. E. Weitkamp, T. L. Welsh, M. B. Dell, and T. H. Schadt. 1984. Effects of minimum flow regimes on fall Chinook spawning at Vernita Bar 1978-82. Report to the Grant County Public Utility District, Ephrata, Washington.
Chapman, D. W., D. E. Weitkamp, T. L. Welsh, M. B. Dell, and T. H. Schadt. 1986. “Effects of river flow on the distribution of Chinook salmon redds.” Transactions of the American Fisheries Society 115:537-547.
Dauble, D. D., R. L. Johnson, and A. P. Garcia. 1999. “Fall Chinook spawning in the tailraces of lower Snake River hydroelectric projects.” Transactions of the American Fisheries Society 128:672-679.
Dauble, D. D. and D. G. Watson. 1990. Spawning and abundance of fall Chinook salmon (Oncorhynchus tshawytscha) in the Hanford Reach of the Columbia River, 1948-1988. PNL-7289, Pacific Northwest National Laboratory, Richland, Washington.
Dauble, D. D. and D. G. Watson. 1997. “Status of fall Chinook salmon populations in the mid-Columbia River, 1948-1992.” North American Journal of Fisheries Management 17:283-300.
Davidson, F. A. 1966. Population trends in the blueback and upper Columbia River fall Chinook salmon. Consultant Report to the Public Utility District of Grant County, Ephrata, Washington.
Edson, Q. A. 1957. Summary report Priest Rapids fisheries research program 1957. Washington Department of Fisheries, Olympia, Washington.
Edson, Q. A. 1958. Biological report Rocky Reach fisheries research program 1958. Report of Washington Department of Fisheries to the Chelan County Public Utilities District, Wenatchee, Washington.

©2004, Public Utility District No. 2 of Grant County, Washington. All Rights Reserved Under U.S. and Foreign Law, Treaties, and Conventions.
5.2 Chinook Salmon Escapement and Spawning
Fukushima, M., T. J. Quinn, and W. W. Smoker. 1998. “Estimation of eggs lost from superimposed pink salmon (Oncorhynchus gorbuscha) redds.” Canadian Journal of Fisheries and Aquatic Sciences 55:618-625.
Fulton, L. A. 1968. “Spawning areas and abundance of Chinook salmon Oncorhynchus tshawytscha in the Columbia River basin – past and present.” U.S. Fish and Wildlife Service Special Scientific Report Fisheries 571.
Geist, D. R. 2000. “Hyporheic discharge of river water into fall Chinook salmon (Oncorhynchus tshawytscha) spawning areas in the Hanford Reach, Columbia River.” Canadian Journal of Fisheries and Aquatic Sciences 57(8):1647-1656.
Geist, D. R. and D. D. Dauble. 1998. “Redd site selection and spawning habitat use by fall Chinook salmon: the importance of geomorphic features in large rivers.” Environmental Management 22:655-669.
Geist, D. R., J. J. Jones, C. J. Murray, and D. D. Dauble. 2000. “Suitability criteria analyzed at the spatial scale of redd clusters improved estimates of fall Chinook salmon (Oncorhynchus tshawytscha) spawning habitat use in the Hanford Reach, Columbia River.” Canadian Journal of Fisheries and Aquatic Sciences 57(8):1636-1646.
Groves, P. A. and A. P. Garcia. 1998. “Two carriers used to suspend an underwater video camera from a boat.” North American Journal of Fisheries Management 18:1004-1007.
Hayes, J. W. 1987. “Competition for spawning space between brown (Salmo trutta) and rainbow trout (S. gairdneri) in a lake inlet tributary, New Zealand.” Canadian Journal of Fisheries and Aquatic Sciences 44:40-47.
Horner, N. and T. Bjornn. 1979. Status of upper Columbia River fall Chinook salmon. University of Idaho, Idaho Cooperative Fishery Research Unit Report for the U.S. Fish and Wildlife Service, Boise, Idaho.
McMichael, G. A., D. R. Geist, T. P. Hanrahan, E. V. Arntzen, R. P. Mueller, R. A. Moursund, J. A. Carter, J. M. Becker, C. A. McKinstry, W. A. Perkins, D. D. Dauble, T. M. Degerman, J. R. Skalski, R. L. Townsend, B. B. James, and D. R. Thornhill. 2003a. Chinook salmon in the Priest Rapids Project. Report prepared for the Public Utility District No. 2 of Grant County. Technical Report PNWD-3243, Battelle – Pacific Northwest Division, P.O. Box 999, Richland, Washington.
McMichael, G. A., W. A. Perkins, C. J. Murray, Y. J. Chien, C. L. Rakowski, A. Coleman, M. C. Richmond, J. Vucelick, E. V. Arntzen, R. P. Mueller, C. A. Duberstein, and J. Lukas. 2003b. Subyearling Chinook salmon stranding in the Hanford Reach of the Columbia River. Report prepared for the Public Utility District No. 2 of Grant County. Technical Report PNWD-3308, Battelle – Pacific Northwest Division, P.O. Box 999, Richland, Washington.
McNeil, W. J. 1964. “Redd superimposition and egg capacity of pink salmon spawning beds.” Journal of the Fisheries Research Board of Canada 21:1385-1396.

©2004, Public Utility District No. 2 of Grant County, Washington. All Rights Reserved Under U.S. and Foreign Law, Treaties, and Conventions.
Chinook Salmon Escapement and Spawning 5.3
Poston, T. 2001. Treated wood issues associated with overwater structures in freshwater and marine environments. Report of Battelle for Washington State Departments of Transportation, Fish and Wildlife, and Ecology, Olympia, Washington. Available at: http://www.wa.gov/wdfw/hab/ahg/overwatr.htm
Rogers, L. E., P. A. Beedlow, L. E. Eberhardt, D. D. Dauble, and R. E. Fitzner. 1989. Ecological baseline study of the Yakima Firing Center proposed land acquisition; a status report. PNL-6485, Rev. 1, Pacific Northwest National Laboratory, Richland, Washington.
Sprague, J. B. 1964. “Avoidance of copper-zinc solutions by young salmonids in the laboratory.” Journal of the Water Pollution Control Federation 36:990-1004.
Sprague, J. B. 1968. “Avoidance reactions of rainbow trout to zinc sulfate solutions.” Water Research 2:367-372.
Sprague, J. B., P. F. Elson, and R. L. Saunders. 1965. “Sub-lethal copper-zinc pollution in a salmon river - A field and laboratory study.” International Journal of Air and Water Pollution 9:531-543.
Visser, R. H., D. D. Dauble, and D. R. Geist. 2002. “Use of aerial photography to monitor fall Chinook salmon spawning in the Columbia River.” Transactions of the American Fisheries Society 131:1173-1179.
Watson, D. W. 1970. Fall Chinook salmon spawning in the Columbia River near Hanford. BNWL-1515, Battelle Northwest Laboratory, Richland, Washington.
Watson, R. 2001. 2000 Hanford Reach fall Chinook stream survey summary. Washington Department of Fish and Wildlife Fish Management Program, Yakima, Washington.
Watson, R. and P. Hoffarth. 2002. Hanford Reach upriver brights escapement sampling 2001, draft annual report. Washington Department of Fish and Wildlife Fish Management Program, Yakima, Washington.
Related Documents