Asia-Pacific Oil & Gas January 23, 2013 Neil Beveridge, Ph.D. (Senior Analyst) • [email protected] • +852-2918-5741 Michael W. Parker (Senior Analyst) • [email protected] • +852-2918-5747 Mike Werner (Senior Analyst) • [email protected] • +852-2918-5748 Vanessa Lau (Senior Analyst) • [email protected] • +852-2918-5717 Lu Wang • [email protected] • +852-2918-5723 Ying Lou • [email protected] • +852-2918-5743 Hua Cheng • [email protected] • +852-2918-5721 Will Feng • [email protected] • +852-2918-5730 See Disclosure Appendix of this report for important disclosures and analyst certifications. China Economic & Energy Indicators - December 2012; Dragon Year Ends on a High as Energy Demand Heats Up Please see the Disclosure Appendix for the ratings and price targets of the companies covered in this report. Highlights ∑ 2012 ended with a strong finish despite a weak start. Real GDP growth in 4Q12 improved to 7.9%. Industrial production growth in December accelerated to 10.3%. Both refinery throughput and apparent oil demand surged to all time highs. Electricity production rebounded with 7.2% y-o-y growth in December. Gas demand remained strong with 10% y-o-y growth in November. Latest energy indicators continue to affirm China is on the road to economic recovery. ∑ Year-over-year real GDP growth for Q4 2012 came in at 7.9%, a 50bp improvement from the 7.4% growth reported in Q3 and 10bp above the market expectations of 7.8%. This represents the first time China's economic growth accelerated after 7 consecutive quarters of deceleration. December Industrial production growth improved 20bp m-o-m to 10.3% while the PMI figure was flat at 50.6, supporting the economic rebound in China as we enter 2013. ∑ The December headline loan growth figure came in at RMB 454 billion, 17% below market expectations. This marked the weakest month of loan growth since December 2009. Despite this, total credit formation (total bank loans and non-bank financing) was robust at RMB 1.61 trillion in December, 25% higher than year-to-date average as the issuance of corporate debt and trust loans remained strong. ∑ For December, China's CPI inflation figure (at 2.5%) increased sequentially by 50bp which was more driven by an increase in food price (+4.2%) while the non-food portion of the inflation (at 1.7%) stayed below 2.0% for the 13th consecutive month. Meanwhile, December PPI inflation was up 30bp m- o-m to -1.9%. This marks the third consecutive m-o-m increase to the nation's PPI inflation figure after declining the previous 14 months. ∑ Apparent oil demand surged by 9.1% y-o-y to an all time high of 44.8MT as Chinese refining throughput reached a new high in December. Apparent oil demand averaged 9.67Mbpd in 2012, which was up 4.0% y-o-y. We expect Chinese apparent oil demand will accelerate by 6% y-o-y to 10.3Mbpd, which is 0.3Mbpd higher than current IEA estimates (9.98Mbpd). Crude production improved by 5.6% y-o-y to 17.9MT in December on CNOOC's expanding offshore production and Penglai ramp up. Crude imports increased 8.0% y-o-y to 23.7MT. ∑ Natural gas demand in November increased by 10.2% y-o-y as demand from heating accelerates in winter. Gas imports accounted for 28% of gas demand. Pipeline gas imports from Central Asia increased by 0.34bcf/d (15% m-o-m) to 2.57bcf/d, offsetting LNG imports decrease as spot LNG markets tightened in winter. Natural gas production increased by 8.2% y-o-y to 11.5bcf/d in November. ∑ Electricity production in December was 432.7TWh, up 7.2% Y-o-Y and up 7.9% sequentially from November. The Y-o-Y power generation growth in December 2011 was 9.8%. Power production in 2012 was 4,771TWh up 4.2% Y-o-Y. This is the lowest annual production growth since 2005. ∑ Qinhuangdao spot coal price (5,500kcal/kg) has decreased by RMB15/ton to RMB620/ton since the end of November. Coal prices turned with the end of winter restocking at the end of October. We For the exclusive use of MAURIZIO BESSONE at EURIZON CAPITAL SGR SPA on 26-Mar-2013

Welcome message from author
This document is posted to help you gain knowledge. Please leave a comment to let me know what you think about it! Share it to your friends and learn new things together.
Transcript

Asi
a-P
acif
ic O
il&
Gas
January 23, 2013
Neil Beveridge, Ph.D. (Senior Analyst) • [email protected] • +852-2918-5741
Michael W. Parker (Senior Analyst) • [email protected] • +852-2918-5747
Mike Werner (Senior Analyst) • [email protected] • +852-2918-5748
Vanessa Lau (Senior Analyst) • [email protected] • +852-2918-5717
Lu Wang • [email protected] • +852-2918-5723
Ying Lou • [email protected] • +852-2918-5743
Hua Cheng • [email protected] • +852-2918-5721
Will Feng • [email protected] • +852-2918-5730
See Disclosure Appendix of this report for important disclosures and analyst certifications.
China Economic & Energy Indicators - December 2012; Dragon Year Ends on a High as Energy Demand Heats Up
Please see the Disclosure Appendix for the ratings and price targets of the companies covered in this report.
Highlights
∑ 2012 ended with a strong finish despite a weak start. Real GDP growth in 4Q12 improved to 7.9%. Industrial production growth in December accelerated to 10.3%. Both refinery throughput and apparent oil demand surged to all time highs. Electricity production rebounded with 7.2% y-o-y growth in December. Gas demand remained strong with 10% y-o-y growth in November. Latest energy indicators continue to affirm China is on the road to economic recovery.
∑ Year-over-year real GDP growth for Q4 2012 came in at 7.9%, a 50bp improvement from the 7.4% growth reported in Q3 and 10bp above the market expectations of 7.8%. This represents the first time China's economic growth accelerated after 7 consecutive quarters of deceleration. December Industrial production growth improved 20bp m-o-m to 10.3% while the PMI figure was flat at 50.6, supporting the economic rebound in China as we enter 2013.
∑ The December headline loan growth figure came in at RMB 454 billion, 17% below market expectations. This marked the weakest month of loan growth since December 2009. Despite this, total credit formation (total bank loans and non-bank financing) was robust at RMB 1.61 trillion in December, 25% higher than year-to-date average as the issuance of corporate debt and trust loans remained strong.
∑ For December, China's CPI inflation figure (at 2.5%) increased sequentially by 50bp which was more driven by an increase in food price (+4.2%) while the non-food portion of the inflation (at 1.7%) stayed below 2.0% for the 13th consecutive month. Meanwhile, December PPI inflation was up 30bp m-o-m to -1.9%. This marks the third consecutive m-o-m increase to the nation's PPI inflation figure after declining the previous 14 months.
∑ Apparent oil demand surged by 9.1% y-o-y to an all time high of 44.8MT as Chinese refining throughput reached a new high in December. Apparent oil demand averaged 9.67Mbpd in 2012, which was up 4.0% y-o-y. We expect Chinese apparent oil demand will accelerate by 6% y-o-y to 10.3Mbpd, which is 0.3Mbpd higher than current IEA estimates (9.98Mbpd). Crude production improved by 5.6% y-o-y to 17.9MT in December on CNOOC's expanding offshore production and Penglai ramp up. Crude imports increased 8.0% y-o-y to 23.7MT.
∑ Natural gas demand in November increased by 10.2% y-o-y as demand from heating accelerates in winter. Gas imports accounted for 28% of gas demand. Pipeline gas imports from Central Asia increased by 0.34bcf/d (15% m-o-m) to 2.57bcf/d, offsetting LNG imports decrease as spot LNG markets tightened in winter. Natural gas production increased by 8.2% y-o-y to 11.5bcf/d in November.
∑ Electricity production in December was 432.7TWh, up 7.2% Y-o-Y and up 7.9% sequentially from November. The Y-o-Y power generation growth in December 2011 was 9.8%. Power production in 2012 was 4,771TWh up 4.2% Y-o-Y. This is the lowest annual production growth since 2005.
∑ Qinhuangdao spot coal price (5,500kcal/kg) has decreased by RMB15/ton to RMB620/ton since the end of November. Coal prices turned with the end of winter restocking at the end of October. We
For the exclusive use of MAURIZIO BESSONE at EURIZON CAPITAL SGR SPA on 26-Mar-2013

Asi
a-P
acif
ic O
il&
Gas
January 23, 2013
Neil Beveridge, Ph.D. (Senior Analyst) • [email protected] • +852-2918-5741
2
anticipate – based on seasonal patterns of the last three years – that coal prices will continue to drift down through the end of the first quarter. Coal price is down 26% since last December. The average coal price was RMB699/ton in 2012 down 15% from RMB821/ton in 2011. The coal price was down 24% for the fourth quarter Y-o-Y.
∑ Crude steel production in December was 59.5 million tons, up 14% YoY due to low production in December 2011. 2012 full year saw crude steel production of ~711 million tons i.e. 3.8% growth, only slightly higher than the 2.1% seen in 2008 when the financial crisis hit. Steel prices saw a moderate rebound from mid-September, with China HRC spot price ending the year at RMB3,974 per ton. Despite the rise, this is still 6% lower than the price at the start of 2012.
∑ Aluminum LME price saw a rebound in mid-November, ending the year at US$2,040 per ton, close to where the year started. Alumina price was less volatile than LME price, and only saw a moderate increase to US$331 per ton, averaging at 15.9% of LME price for 2012, which is above what we would see as the more "normal" range of 13-15%.
∑ Within China's energy sector, gas distributors, power companies and oil services outperformed regional index over the last 12 months while steel and coal companies underperformed. Natural gas continues to be the fastest growing component of China's energy complex. With slower electricity growth resulting in lower coal prices, power producers continue to outperform over coal names.
Investment Conclusion
The economic recovery which started in September 2012 continued to gather pace in December. Total energy consumption growth in 4Q reached 7.4%, the highest reading since 1Q12 while GDP growth rebounded to 7.9%. Sectors with a high beta to a recovery in China growth such as steel, cement, refining and petrochemicals are all benefiting from the turnaround in growth in the near term. While China oil demand exceeded 10Mbpd in 4Q12 for the first time ever, strong non-OPEC production continues to put a cap on oil prices which is limiting the benefit to integrated oils and E&Ps. The key question remains how sustainable this recovery will prove. While most expect positive momentum in the first half of 2013, there remains uncertainty beyond this. Policy announcements over the coming months as the new government takes shape could set the tone for how the rest of 2013 pans out.
Our top picks within Chinese energy sector are Huaneng (902.HK; TP HK$8.0) and CR Power (836.HK, TP HK$20.0), Sinopec (386.HK; TP HK$10.0) and CNOOC (883.HK; TP HK$21.7) which we rate as outperform.
For the exclusive use of MAURIZIO BESSONE at EURIZON CAPITAL SGR SPA on 26-Mar-2013
Asi
a-P
acif
ic O
il&
Gas
January 23, 2013
Neil Beveridge, Ph.D. (Senior Analyst) • [email protected] • +852-2918-5741
3
Details
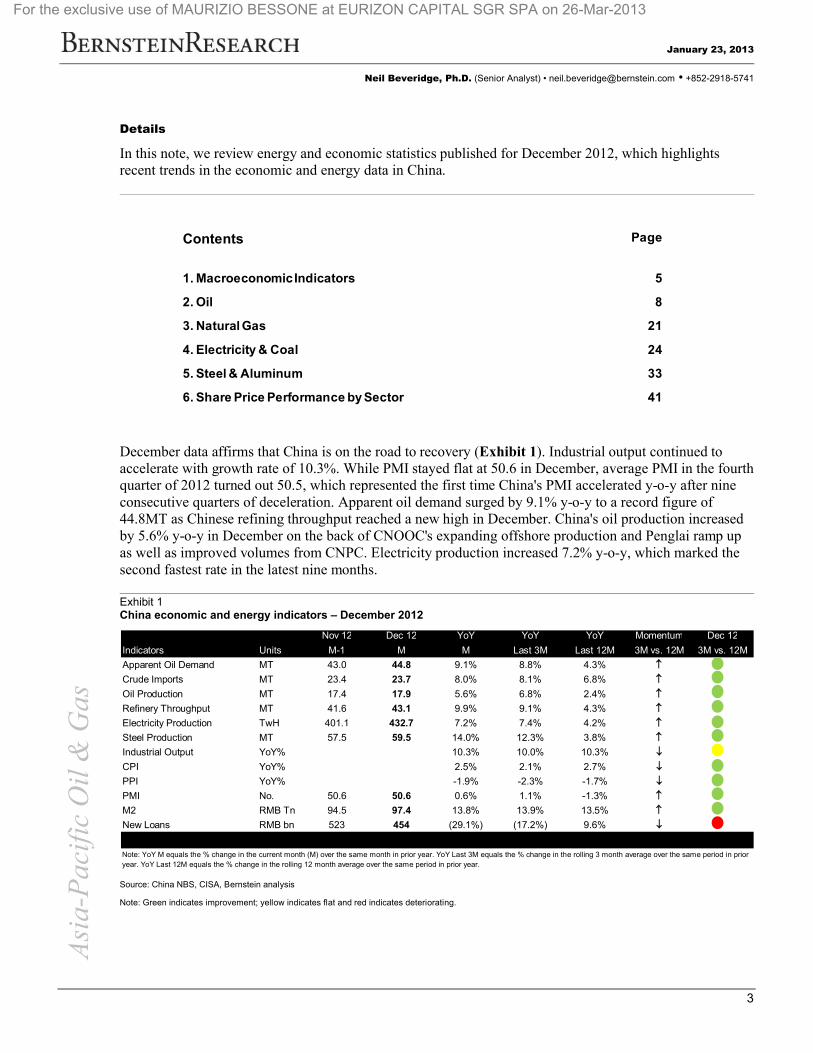
In this note, we review energy and economic statistics published for December 2012, which highlights recent trends in the economic and energy data in China.
December data affirms that China is on the road to recovery (Exhibit 1). Industrial output continued to accelerate with growth rate of 10.3%. While PMI stayed flat at 50.6 in December, average PMI in the fourth quarter of 2012 turned out 50.5, which represented the first time China's PMI accelerated y-o-y after nineconsecutive quarters of deceleration. Apparent oil demand surged by 9.1% y-o-y to a record figure of 44.8MT as Chinese refining throughput reached a new high in December. China's oil production increased by 5.6% y-o-y in December on the back of CNOOC's expanding offshore production and Penglai ramp upas well as improved volumes from CNPC. Electricity production increased 7.2% y-o-y, which marked the second fastest rate in the latest nine months.
Exhibit 1China economic and energy indicators – December 2012
Source: China NBS, CISA, Bernstein analysis
Note: Green indicates improvement; yellow indicates flat and red indicates deteriorating.
Contents Page
1. Macroeconomic Indicators 5
2. Oil 8
3. Natural Gas 21
4. Electricity & Coal 24
5. Steel & Aluminum 33
6. Share Price Performance by Sector 41
Nov 12 Dec 12 YoY YoY YoY Momentum Dec 12
Indicators Units M-1 M M Last 3M Last 12M 3M vs. 12M 3M vs. 12M
Apparent Oil Demand MT 43.0 44.8 9.1% 8.8% 4.3% ≠Crude Imports MT 23.4 23.7 8.0% 8.1% 6.8% ≠Oil Production MT 17.4 17.9 5.6% 6.8% 2.4% ≠Refinery Throughput MT 41.6 43.1 9.9% 9.1% 4.3% ≠Electricity Production TwH 401.1 432.7 7.2% 7.4% 4.2% ≠Steel Production MT 57.5 59.5 14.0% 12.3% 3.8% ≠Industrial Output YoY% 10.3% 10.0% 10.3% ØCPI YoY% 2.5% 2.1% 2.7% ØPPI YoY% -1.9% -2.3% -1.7% ØPMI No. 50.6 50.6 0.6% 1.1% -1.3% ≠M2 RMB Tn 94.5 97.4 13.8% 13.9% 13.5% ≠New Loans RMB bn 523 454 (29.1%) (17.2%) 9.6% Ø
Note: YoY M equals the % change in the current month (M) over the same month in prior year. YoY Last 3M equals the % change in the rolling 3 month average over the same period in prior year. YoY Last 12M equals the % change in the rolling 12 month average over the same period in prior year.
For the exclusive use of MAURIZIO BESSONE at EURIZON CAPITAL SGR SPA on 26-Mar-2013
Asi
a-P
acif
ic O
il&
Gas
January 23, 2013
Neil Beveridge, Ph.D. (Senior Analyst) • [email protected] • +852-2918-5741
4
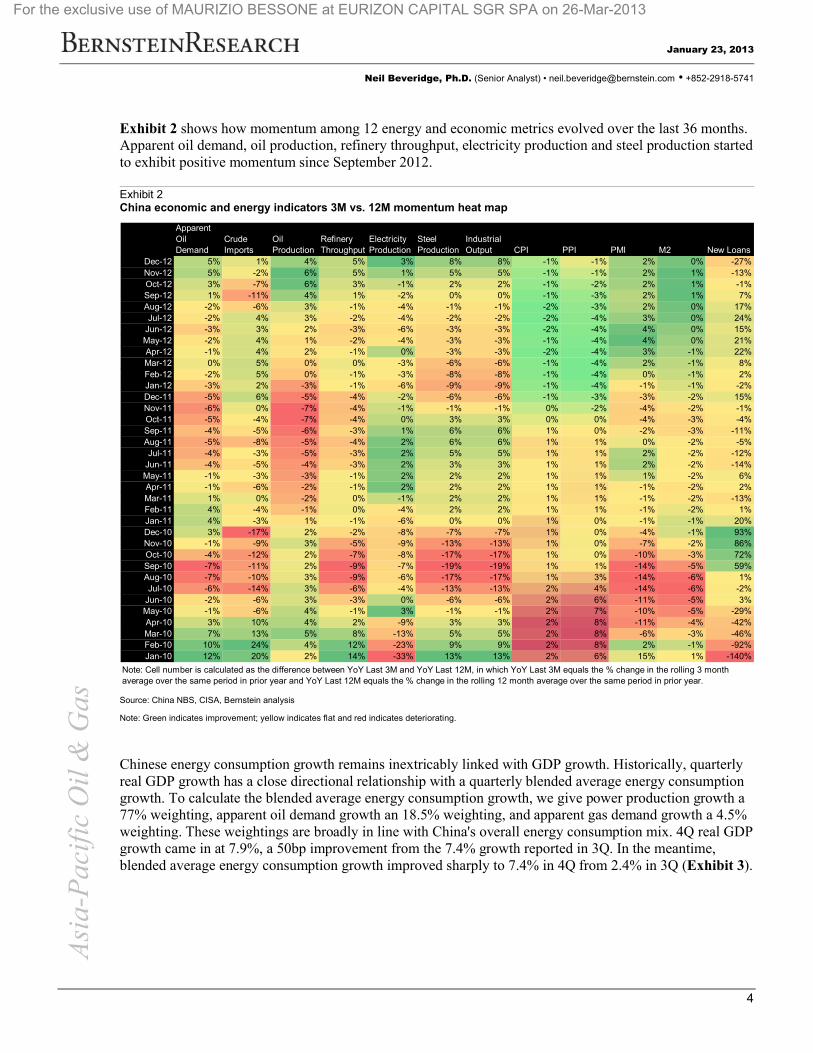
Exhibit 2 shows how momentum among 12 energy and economic metrics evolved over the last 36 months. Apparent oil demand, oil production, refinery throughput, electricity production and steel production started to exhibit positive momentum since September 2012.
Exhibit 2China economic and energy indicators 3M vs. 12M momentum heat map
Source: China NBS, CISA, Bernstein analysis
Note: Green indicates improvement; yellow indicates flat and red indicates deteriorating.
Chinese energy consumption growth remains inextricably linked with GDP growth. Historically, quarterly real GDP growth has a close directional relationship with a quarterly blended average energy consumption growth. To calculate the blended average energy consumption growth, we give power production growth a 77% weighting, apparent oil demand growth an 18.5% weighting, and apparent gas demand growth a 4.5% weighting. These weightings are broadly in line with China's overall energy consumption mix. 4Q real GDP growth came in at 7.9%, a 50bp improvement from the 7.4% growth reported in 3Q. In the meantime, blended average energy consumption growth improved sharply to 7.4% in 4Q from 2.4% in 3Q (Exhibit 3).
Apparent Oil Demand
Crude Imports
Oil Production
Refinery Throughput
Electricity Production
Steel Production
Industrial Output CPI PPI PMI M2 New Loans
Dec-12 5% 1% 4% 5% 3% 8% 8% -1% -1% 2% 0% -27%Nov-12 5% -2% 6% 5% 1% 5% 5% -1% -1% 2% 1% -13%Oct-12 3% -7% 6% 3% -1% 2% 2% -1% -2% 2% 1% -1%Sep-12 1% -11% 4% 1% -2% 0% 0% -1% -3% 2% 1% 7%Aug-12 -2% -6% 3% -1% -4% -1% -1% -2% -3% 2% 0% 17%Jul-12 -2% 4% 3% -2% -4% -2% -2% -2% -4% 3% 0% 24%
Jun-12 -3% 3% 2% -3% -6% -3% -3% -2% -4% 4% 0% 15%May-12 -2% 4% 1% -2% -4% -3% -3% -1% -4% 4% 0% 21%Apr-12 -1% 4% 2% -1% 0% -3% -3% -2% -4% 3% -1% 22%Mar-12 0% 5% 0% 0% -3% -6% -6% -1% -4% 2% -1% 8%Feb-12 -2% 5% 0% -1% -3% -8% -8% -1% -4% 0% -1% 2%Jan-12 -3% 2% -3% -1% -6% -9% -9% -1% -4% -1% -1% -2%Dec-11 -5% 6% -5% -4% -2% -6% -6% -1% -3% -3% -2% 15%Nov-11 -6% 0% -7% -4% -1% -1% -1% 0% -2% -4% -2% -1%Oct-11 -5% -4% -7% -4% 0% 3% 3% 0% 0% -4% -3% -4%Sep-11 -4% -5% -6% -3% 1% 6% 6% 1% 0% -2% -3% -11%Aug-11 -5% -8% -5% -4% 2% 6% 6% 1% 1% 0% -2% -5%Jul-11 -4% -3% -5% -3% 2% 5% 5% 1% 1% 2% -2% -12%
Jun-11 -4% -5% -4% -3% 2% 3% 3% 1% 1% 2% -2% -14%May-11 -1% -3% -3% -1% 2% 2% 2% 1% 1% 1% -2% 6%Apr-11 -1% -6% -2% -1% 2% 2% 2% 1% 1% -1% -2% 2%Mar-11 1% 0% -2% 0% -1% 2% 2% 1% 1% -1% -2% -13%Feb-11 4% -4% -1% 0% -4% 2% 2% 1% 1% -1% -2% 1%Jan-11 4% -3% 1% -1% -6% 0% 0% 1% 0% -1% -1% 20%Dec-10 3% -17% 2% -2% -8% -7% -7% 1% 0% -4% -1% 93%Nov-10 -1% -9% 3% -5% -9% -13% -13% 1% 0% -7% -2% 86%Oct-10 -4% -12% 2% -7% -8% -17% -17% 1% 0% -10% -3% 72%Sep-10 -7% -11% 2% -9% -7% -19% -19% 1% 1% -14% -5% 59%Aug-10 -7% -10% 3% -9% -6% -17% -17% 1% 3% -14% -6% 1%Jul-10 -6% -14% 3% -6% -4% -13% -13% 2% 4% -14% -6% -2%
Jun-10 -2% -6% 3% -3% 0% -6% -6% 2% 6% -11% -5% 3%May-10 -1% -6% 4% -1% 3% -1% -1% 2% 7% -10% -5% -29%Apr-10 3% 10% 4% 2% -9% 3% 3% 2% 8% -11% -4% -42%Mar-10 7% 13% 5% 8% -13% 5% 5% 2% 8% -6% -3% -46%Feb-10 10% 24% 4% 12% -23% 9% 9% 2% 8% 2% -1% -92%Jan-10 12% 20% 2% 14% -33% 13% 13% 2% 6% 15% 1% -140%
Note: Cell number is calculated as the difference between YoY Last 3M and YoY Last 12M, in which YoY Last 3M equals the % change in the rolling 3 month average over the same period in prior year and YoY Last 12M equals the % change in the rolling 12 month average over the same period in prior year.
For the exclusive use of MAURIZIO BESSONE at EURIZON CAPITAL SGR SPA on 26-Mar-2013

Asi
a-P
acif
ic O
il&
Gas
January 23, 2013
Neil Beveridge, Ph.D. (Senior Analyst) • [email protected] • +852-2918-5741
5
Exhibit 3China energy consumption growth and real GDP growth
Source: China NBS, Bernstein analysis and estimates
Part 1 - Macroeconomic Indicators
Consumer inflation was 2.5% for December, up 50bp from the previous month's readings and 20bp above market expectations (see Exhibit 4). China's 2012 full-year CPI inflation rate averaged 2.65%, well below the central bank's full-year target of 4.0%. China's December PPI inflation of -1.9% was up 30bp from November levels but was 10bp below market expectations of -1.8%. This marks the third consecutive MoM increase to China's PPI inflation figure as PPI inflation is now 170bp higher than the 35-month low levels reported in September. As the PPI tends to be a leading indicator to CPI in China, we believe the data supports the view that consumer price inflation will remain moderate in the coming 6 months (though food prices may continue to rise in the short-term).
Exhibit 4China's y-o-y CPI growth
Source: CEIC, NBS, Bernstein analysis
Including the December data, China's economic indicators have exhibited an upward trend over the past 3-4 months that was highlighted by the rebound in the country's Q4 2012 real GDP growth of 7.9%. This
-10.0%
-5.0%
0.0%
5.0%
10.0%
15.0%
20.0%
25.0%
5.0%
6.0%
7.0%
8.0%
9.0%
10.0%
11.0%
12.0%
13.0%
4Q20
12
3Q20
12
2Q20
12
1Q20
12
4Q20
11
3Q20
11
2Q20
11
1Q20
11
4Q20
10
3Q20
10
2Q20
10
1Q20
10
4Q20
09
3Q20
09
2Q20
09
1Q20
09
4Q20
08
3Q20
08
2Q20
08
1Q20
08
4Q20
07
3Q20
07
2Q20
07
En
erg
y C
on
sum
pti
on G
row
th
Rea
l GD
P G
row
th
Real GDP Growth (YoY) Energy Consumption Growth (YoY)
Dec CPI = 2.5%
-4.0%
-2.0%
0.0%
2.0%
4.0%
6.0%
8.0%
10.0%
Jan
-05
Apr
-05
Jul
-05
Oc
t-0
5
Jan
-06
Apr
-06
Jul
-06
Oc
t-0
6
Jan
-07
Apr
-07
Jul
-07
Oc
t-0
7
Jan
-08
Apr
-08
Jul
-08
Oc
t-0
8
Jan
-09
Apr
-09
Jul
-09
Oc
t-0
9
Jan
-10
Apr
-10
Jul
-10
Oc
t-1
0
Jan
-11
Apr
-11
Jul
-11
Oc
t-1
1
Jan
-12
Apr
-12
Jul
-12
Oc
t-1
2
For the exclusive use of MAURIZIO BESSONE at EURIZON CAPITAL SGR SPA on 26-Mar-2013

Asi
a-P
acif
ic O
il&
Gas
January 23, 2013
Neil Beveridge, Ph.D. (Senior Analyst) • [email protected] • +852-2918-5741
6
marked an improvement of 50bp off the 7.4% reported in Q3 2012 and represented the first QoQ improvement in nearly 2 years.
Regarding the specific factors we track, retail sales and industrial production growth accelerated in December from November levels while the December PMI figures remained above 50 (indicating economic expansion) – see Exhibit 5 and Exhibit 6. Retail sales for the month were 15.2%, 20bp higher than expected and 30bp higher than November. China's PMI Industrial production came in at 50.6 for December, inline with November levels which themselves marked a 7-month high. The only deceleration we saw from a major indictor was on YTD fixed-asset investment where December YTD growth fell 10bp from November levels to 20.6%.
Exhibit 5China PMI and Industrial Production Growth
Source: NBS, CEIC, Bernstein analysis
Exhibit 6YoY Growth of Key Components to China's GDP Growth
Source: Bloomberg, Bernstein analysis & estimates
On the export side, China reported a trade surplus of US$31.6 billion in December, the third highest level for 2012 as exports rose 14.1% YoY, up sharply from the 2.9% growth reported in November and well above the year-to-date average of 7.9% (see Exhibit 7).
In light of improving economic data over the past 3-4 months as well as the rising CPI inflation, we'd be surprised to see the central bank cut interest rates again in the coming months, despite the fact that M2
50.6
8%
10%
12%
14%
16%
18%
46474849505152535455
De
c-1
0
Jan
-11
Fe
b-11
Mar
-11
Ap
r-1
1
May
-11
Jun
-11
Jul
-11
Au
g-1
1
Se
p-1
1
Oc
t-1
1
No
v-1
1
De
c-1
1
Jan
-12
Fe
b-12
Mar
-12
Ap
r-1
2
May
-12
Jun
-12
Jul
-12
Au
g-1
2
Se
p-1
2
Oc
t-1
2
No
v-1
2
De
c-1
2
Ind
us
try
Pro
du
cti
on
Gro
wth
PM
Il
Manufacturing PMI Industry Production Growth
20%
21%
22%
23%
24%
25%
26%
27%
10%
12%
14%
16%
18%
20%
Oc
t-1
0
No
v-1
0
De
c-1
0
Jan-
11
Fe
b-1
1
Mar
-11
Apr
-11
May
-11
Jun-
11
Jul
-11
Au
g-1
1
Se
p-1
1
Oc
t-1
1
No
v-1
1
De
c-1
1
Jan-
12
Fe
b-1
2
Mar
-12
Apr
-12
May
-12
Jun-
12
Jul
-12
Au
g-1
2
Se
p-1
2
Oc
t-1
2
No
v-1
2
De
c-1
2
FA
I Yo
Y G
row
th
Re
tail
Sa
les
Yo
Y G
row
th
Retail Sales Fixed Asset Investment (YTD)
For the exclusive use of MAURIZIO BESSONE at EURIZON CAPITAL SGR SPA on 26-Mar-2013
Asi
a-P
acif
ic O
il&
Gas
January 23, 2013
Neil Beveridge, Ph.D. (Senior Analyst) • [email protected] • +852-2918-5741
7
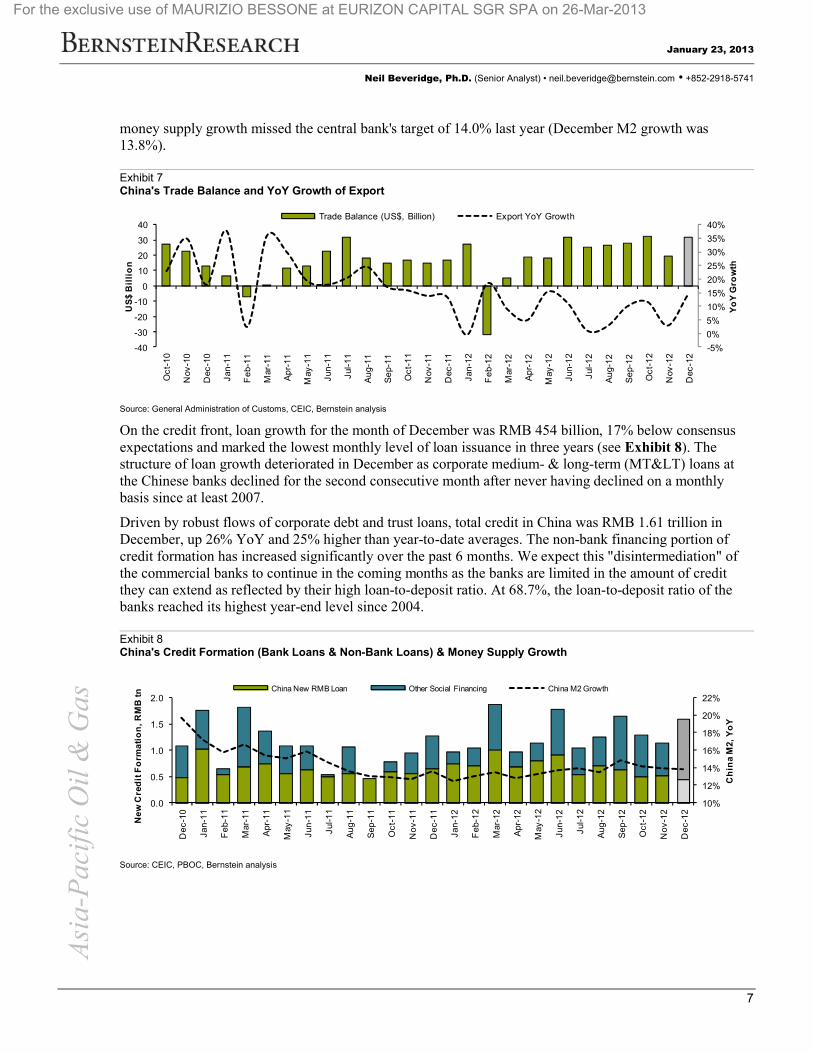
money supply growth missed the central bank's target of 14.0% last year (December M2 growth was 13.8%).
Exhibit 7China's Trade Balance and YoY Growth of Export
Source: General Administration of Customs, CEIC, Bernstein analysis
On the credit front, loan growth for the month of December was RMB 454 billion, 17% below consensus expectations and marked the lowest monthly level of loan issuance in three years (see Exhibit 8). The structure of loan growth deteriorated in December as corporate medium- & long-term (MT<) loans at the Chinese banks declined for the second consecutive month after never having declined on a monthly basis since at least 2007.
Driven by robust flows of corporate debt and trust loans, total credit in China was RMB 1.61 trillion in December, up 26% YoY and 25% higher than year-to-date averages. The non-bank financing portion of credit formation has increased significantly over the past 6 months. We expect this "disintermediation" ofthe commercial banks to continue in the coming months as the banks are limited in the amount of credit they can extend as reflected by their high loan-to-deposit ratio. At 68.7%, the loan-to-deposit ratio of the banks reached its highest year-end level since 2004.
Exhibit 8China's Credit Formation (Bank Loans & Non-Bank Loans) & Money Supply Growth
Source: CEIC, PBOC, Bernstein analysis
-5%
0%
5%
10%
15%
20%
25%
30%
35%
40%
-40
-30
-20
-10
0
10
20
30
40
Oc
t-1
0
Nov
-10
Dec
-10
Jan
-11
Fe
b-1
1
Mar
-11
Ap
r-1
1
May
-11
Jun
-11
Jul
-11
Au
g-11
Se
p-11
Oc
t-1
1
Nov
-11
Dec
-11
Jan
-12
Fe
b-1
2
Mar
-12
Ap
r-1
2
May
-12
Jun
-12
Jul
-12
Au
g-12
Se
p-12
Oc
t-1
2
Nov
-12
Dec
-12
Yo
Y G
row
th
US
$ B
illi
on
Trade Balance (US$, Billion) Export YoY Growth
10%
12%
14%
16%
18%
20%
22%
0.0
0.5
1.0
1.5
2.0
De
c-1
0
Jan-
11
Fe
b-1
1
Mar
-11
Apr
-11
May
-11
Jun-
11
Jul
-11
Aug
-11
Sep
-11
Oc
t-11
No
v-1
1
De
c-1
1
Jan-
12
Fe
b-1
2
Mar
-12
Apr
-12
May
-12
Jun-
12
Jul
-12
Aug
-12
Sep
-12
Oc
t-12
No
v-1
2
De
c-1
2
Ch
ina
M2,
Yo
Y
Ne
w C
red
it F
orm
ati
on
, R
MB
tn China New RMB Loan Other Social Financing China M2 Growth
For the exclusive use of MAURIZIO BESSONE at EURIZON CAPITAL SGR SPA on 26-Mar-2013

Asi
a-P
acif
ic O
il&
Gas
January 23, 2013
Neil Beveridge, Ph.D. (Senior Analyst) • [email protected] • +852-2918-5741
8
Part 2 - Oil
Oil Demand
Apparent oil demand (crude runs plus net product imports) in December increased by 9.1% y-o-y with a record-high daily demand of 10.64 Mbpd (Exhibits 9).
Exhibit 9China apparent oil demand
Source: China NBS, Bernstein analysis
Note: China apparent oil demand is defined as crude runs plus net product imports
Crude imports in December increased 8.0% y-o-y to 23.7MT on higher demand (Exhibit 10).
Exhibit 10Chinese crude imports
Source: China NBS, Bernstein analysis
During 2Q12 and 3Q12, demand for oil slumped in China along with industrial production and passenger vehicle sales growth. Since 4Q however there has been a dramatic increase in apparent oil demand, increasing at 9.9% y-o-y in November and 9.1% y-o-y in December as economic conditions improved. This improving trend has been evident in the bottoming out of industrial production growth (Exhibit 11).
44.8
-2%0%2%4%6%8%10%12%14%16%18%20%
25
30
35
40
45
50
Dec
-10
Jan
-11
Feb
-11
Mar
-11
Ap
r-11
May
-11
Jun
-11
Jul-
11
Aug
-11
Sep
-11
Oc
t-11
No
v-11
Dec
-11
Jan
-12
Feb
-12
Mar
-12
Ap
r-12
May
-12
Jun
-12
Jul-
12
Aug
-12
Sep
-12
Oc
t-12
No
v-12
Dec
-12
Gro
wth
, Yo
Y
Ap
par
ent O
il D
eman
d,
MM
T
Apparent Oil Demand YoY Growth
23.7
-20%
-10%0%10%20%
30%40%
9111315171921232527
Dec
-10
Jan
-11
Feb
-11
Ma
r-11
Ap
r-11
May
-11
Jun
-11
Jul-
11
Aug
-11
Sep
-11
Oc
t-11
No
v-11
Dec
-11
Jan
-12
Feb
-12
Ma
r-12
Ap
r-12
May
-12
Jun
-12
Jul-
12
Aug
-12
Sep
-12
Oc
t-12
No
v-12
Dec
-12
Cru
de
Imp
ort
s G
wth
. Yo
Y
Ch
ina
Cru
de
Imp
ort
s, M
MT
China Crude Imports Crude Imports
For the exclusive use of MAURIZIO BESSONE at EURIZON CAPITAL SGR SPA on 26-Mar-2013

Asi
a-P
acif
ic O
il&
Gas
January 23, 2013
Neil Beveridge, Ph.D. (Senior Analyst) • [email protected] • +852-2918-5741
9
Exhibit 11Industrial output growth vs. apparent oil demand growth
Source: China NBS, Bernstein analysis
China's oil market is dominated by growth in demand for transportation fuels. Over the past decade, demand for transportation fuels has more than doubled and now accounts for 54% of total demand. In December, passenger car sales increased by 6.9% y-o-y as Chinese consumers bought 1.46 million cars (Exhibit 12) highlighting continued growth in automobile and transport fuel demand.
Exhibit 12Passenger car sales in China
Source: China NBS, Bernstein analysis
Given that industrial demand and transport demand are the two dominant factors which drive oil demand, we use PMI and passenger car sales (both 1 quarter lagged and weighted by 80% PMI and 20% car sales) as
5%
8%
11%
14%
17%
20%
-15%
-10%
-5%
0%
5%
10%
15%
20%
25%M
ar-0
5
Jun-
05
Sep
-05
Dec
-05
Mar
-06
Jun-
06
Sep
-06
Dec
-06
Mar
-07
Jun-
07
Sep
-07
Dec
-07
Mar
-08
Jun-
08
Sep
-08
Dec
-08
Mar
-09
Jun-
09
Sep
-09
Dec
-09
Mar
-10
Jun-
10
Sep
-10
Dec
-10
Mar
-11
Jun-
11
Sep
-11
Dec
-11
Mar
-12
Jun-
12
Sep
-12
Dec
-12
Ind
us
tria
l Ou
tpu
t G
row
th
Ap
par
en
t O
il D
ema
nd
Gro
wth
Apparent Oil Demand Growth Industrial Output Growth
December apparentoil demand growth
is 9.1%
1.5
-30%
-20%
-10%
0%
10%
20%
30%
0.00.20.40.60.81.01.21.41.61.8
Dec
-10
Jan
-11
Feb
-11
Mar
-11
Ap
r-11
May
-11
Jun
-11
Jul-
11
Aug
-11
Sep
-11
Oct
-11
No
v-11
Dec
-11
Jan
-12
Feb
-12
Mar
-12
Ap
r-12
May
-12
Jun
-12
Jul-
12
Aug
-12
Sep
-12
Oct
-12
No
v-12
Dec
-12
Yo
Y G
wth
Sal
es V
olu
me
, MM
un
its
Passenger Car Sales Volume YoY Growth
For the exclusive use of MAURIZIO BESSONE at EURIZON CAPITAL SGR SPA on 26-Mar-2013

Asi
a-P
acif
ic O
il&
Gas
January 23, 2013
Neil Beveridge, Ph.D. (Senior Analyst) • [email protected] • +852-2918-5741
10
leading indicators in forecasting China oil demand growth. Our near term projection for China oil demand are shown in Exhibit 13, Exhibit 14.
4Q12 apparent oil demand achieved a record high of over 10.3Mbpd giving an average apparent demand for 2012 of 9.7Mbpd (4% higher y-o-y). We estimate apparent oil demand in 1Q13 will grow by 7.5% y-o-y to 10.3Mbpd. We estimate Chinese oil demand in 2013 will reach 10.3Mbpd (Exhibit 13), which remains 0.3Mbpd above the IEA estimates despite of IEA's recent upside revision. We expect the IEA to make a number of further positive demand revisions this year.
Exhibit 13Chinese oil demand estimate
Source: China NBS, Bernstein analysis and estimates
Exhibit 14We estimate China oil demand growth using PMI and car sales growth as leading indicators
Source: China NBS, Bernstein analysis
Oil Supply
Oil production in December increased by 5.6% y-o-y to 17.9MT (Exhibit 15). PetroChina and Sinopec continued to increase production gradually (Exhibit 16, Exhibit 17). CNOOC delivered exceptionally strong growth in oil production on the back expanding offshore production and Penglai ramp up although we now expect this growth to level off (Exhibit 18).
Chinese Oil Demand Summary 1Q12 2Q12 3Q12 4Q12 2012 1Q13E 2Q13E 3Q13E 4Q13E 2013E
Mbpd
PMI 51.53 51.30 49.70 50.47 50.75 50.70 51.30 50.80 50.70 50.88
YoY change -2.5% -1.2% -2.4% 1.1% -1.3% -1.6% 0.0% 2.2% 0.5% 0.2%
Car sales 3.77 3.84 3.65 4.22 15.49 4.06 4.15 3.89 4.51 16.63
YoY change -1.8% 16.6% 6.7% 7.4% 6.9% 7.5% 7.9% 6.5% 6.9% 7.4%
PMI and car sales index growth 0.2% 1.6% 3.1% 1.7% 1.7%
China apparent oil demand 9.69 9.30 9.37 10.33 9.67 10.31 9.83 9.94 11.02 10.28
YoY change 3.3% 0.2% 3.5% 8.8% 4.0% 6.4% 5.7% 6.1% 6.6% 6.2%
Refining throughput 9.31 9.01 9.14 9.99 9.36 9.90 9.52 9.70 10.65 9.94
Net product import 0.38 0.29 0.23 0.35 0.31 0.41 0.31 0.24 0.37 0.33
China oil demand - IEA - Jan 13 9.59 9.26 9.40 10.12 9.60 9.95 9.81 9.87 10.30 9.98
YoY change 3.1% -0.4% 4.4% 7.7% 3.9% 3.8% 5.9% 5.0% 1.8% 4.0%
Delta (SCB - IEA) 0.10 0.04 (0.03) 0.21 0.07 0.36 0.02 0.07 0.72 0.30
-5%
0%
5%
10%
15%
20%
25%
4Q
13
3Q
13
2Q
13
1Q
13
4Q
12
3Q
12
2Q
12
1Q
12
4Q
11
3Q
11
2Q
11
1Q
11
4Q
10
3Q
10
2Q
10
1Q
10
4Q
09
3Q
09
2Q
09
1Q
09
4Q
08
3Q
08
2Q
08
1Q
08
4Q
07
3Q
07
2Q
07
1Q
07
4Q
06
Yo
Y C
han
ge
Actual oil demand growth Estimate by blended index
For the exclusive use of MAURIZIO BESSONE at EURIZON CAPITAL SGR SPA on 26-Mar-2013

Asi
a-P
acif
ic O
il&
Gas
January 23, 2013
Neil Beveridge, Ph.D. (Senior Analyst) • [email protected] • +852-2918-5741
11
Exhibit 15Chinese oil production
Source: China NBS, Bernstein analysis
Exhibit 16PetroChina oil production
Exhibit 17Sinopec oil production
Exhibit 18CNOOC and others oil production
Source: China OGP, Bernstein analysis Source: China OGP, Bernstein analysis Source: China OGP, Bernstein analysis
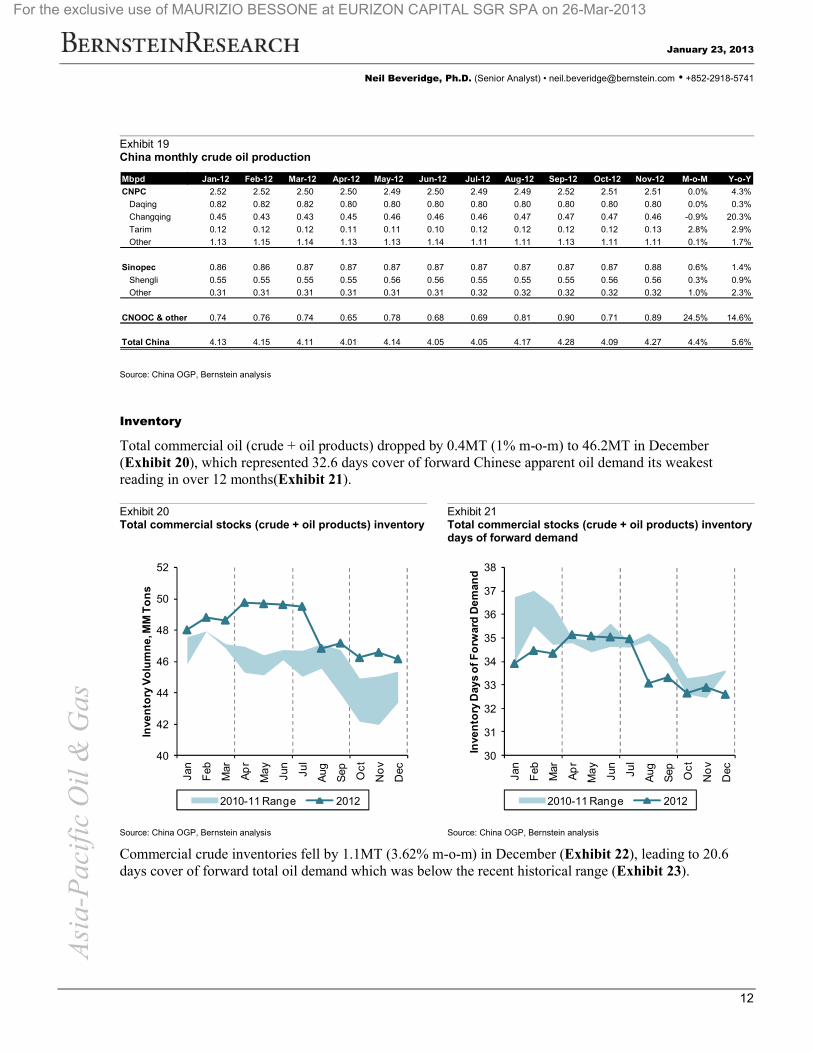
Exhibit 19 summarizes China monthly crude oil production by key fields. CNPC's Changqing oil field achieved 20.3% y-o-y growth in November and contributed 18.5% of CNPC's overall production. This is largely driven by the growth in tight oil fraccing in Central China. CNOOC and others' production increased sharply by 14.6% in November as Peng Lai volumes continued to ramp up. While offshore China oilfields (Fanyu 4-2/5-1 and Liuhua 4-1) started production in December 2012, we expect production will start to flatten off in the near term.
17.9
-8%
-3%
2%
7%
12%
12.5
13.5
14.5
15.5
16.5
17.5
18.5D
ec-1
0
Jan
-11
Feb
-11
Mar
-11
Ap
r-11
May
-11
Jun
-11
Jul-
11
Aug
-11
Sep
-11
Oct
-11
No
v-11
Dec
-11
Jan
-12
Feb
-12
Mar
-12
Ap
r-12
May
-12
Jun
-12
Jul-
12
Aug
-12
Sep
-12
Oct
-12
No
v-12
Dec
-12
Yo
Y G
row
th
Oil
Pro
du
ctio
n, M
MT
Oil Production YoY Growth
-2%
-1%
0%
1%
2%
3%
4%
5%
6%
7%
0.0
0.2
0.4
0.6
0.8
1.0
1.2
1.4
1.6
1.8
2.0
Jul-
09S
ep-0
9N
ov-0
9Ja
n-10
Mar
-10
May
-10
Jul-
10S
ep-1
0N
ov-1
0Ja
n-11
Mar
-11
May
-11
Jul-
11S
ep-1
1N
ov-1
1Ja
n-12
Mar
-12
May
-12
Jul-
12S
ep-1
2N
ov-1
2
Yo
Y G
row
th
mm
bp
d
Daqing Changqing
Tarim Other
YoY Growth
-0.5%
0.0%
0.5%
1.0%
1.5%
2.0%
2.5%
3.0%
3.5%
4.0%
4.5%
0.0
0.2
0.4
0.6
0.8
1.0
1.2
1.4
1.6
1.8
2.0
Jul-
09S
ep-0
9N
ov-0
9Ja
n-10
Mar
-10
May
-10
Jul-
10S
ep-1
0N
ov-1
0Ja
n-11
Mar
-11
May
-11
Jul-
11S
ep-1
1N
ov-1
1Ja
n-12
Mar
-12
May
-12
Jul-
12S
ep-1
2N
ov-1
2
Yo
Y G
row
th
mm
bp
d
Shengli Other YoY Growth
-40%
-30%
-20%
-10%
0%
10%
20%
30%
40%
50%
60%
0.0
0.2
0.4
0.6
0.8
1.0
1.2
1.4
1.6
1.8
2.0
Jul-
09S
ep-0
9N
ov-0
9Ja
n-10
Mar
-10
May
-10
Jul-
10S
ep-1
0N
ov-1
0Ja
n-11
Mar
-11
May
-11
Jul-
11S
ep-1
1N
ov-1
1Ja
n-12
Mar
-12
May
-12
Jul-
12S
ep-1
2N
ov-1
2
Yo
Y G
row
th
mm
bp
d
CNOOC & Others YoY Growth
For the exclusive use of MAURIZIO BESSONE at EURIZON CAPITAL SGR SPA on 26-Mar-2013
Asi
a-P
acif
ic O
il&
Gas
January 23, 2013
Neil Beveridge, Ph.D. (Senior Analyst) • [email protected] • +852-2918-5741
12
Exhibit 19China monthly crude oil production
Source: China OGP, Bernstein analysis
Inventory
Total commercial oil (crude + oil products) dropped by 0.4MT (1% m-o-m) to 46.2MT in December(Exhibit 20), which represented 32.6 days cover of forward Chinese apparent oil demand its weakest reading in over 12 months(Exhibit 21).
Exhibit 20Total commercial stocks (crude + oil products) inventory
Exhibit 21Total commercial stocks (crude + oil products) inventory days of forward demand
Source: China OGP, Bernstein analysis Source: China OGP, Bernstein analysis
Commercial crude inventories fell by 1.1MT (3.62% m-o-m) in December (Exhibit 22), leading to 20.6 days cover of forward total oil demand which was below the recent historical range (Exhibit 23).
Mbpd Jan-12 Feb-12 Mar-12 Apr-12 May-12 Jun-12 Jul-12 Aug-12 Sep-12 Oct-12 Nov-12 M-o-M Y-o-Y
CNPC 2.52 2.52 2.50 2.50 2.49 2.50 2.49 2.49 2.52 2.51 2.51 0.0% 4.3%
Daqing 0.82 0.82 0.82 0.80 0.80 0.80 0.80 0.80 0.80 0.80 0.80 0.0% 0.3%
Changqing 0.45 0.43 0.43 0.45 0.46 0.46 0.46 0.47 0.47 0.47 0.46 -0.9% 20.3%
Tarim 0.12 0.12 0.12 0.11 0.11 0.10 0.12 0.12 0.12 0.12 0.13 2.8% 2.9%
Other 1.13 1.15 1.14 1.13 1.13 1.14 1.11 1.11 1.13 1.11 1.11 0.1% 1.7%
Sinopec 0.86 0.86 0.87 0.87 0.87 0.87 0.87 0.87 0.87 0.87 0.88 0.6% 1.4%
Shengli 0.55 0.55 0.55 0.55 0.56 0.56 0.55 0.55 0.55 0.56 0.56 0.3% 0.9%
Other 0.31 0.31 0.31 0.31 0.31 0.31 0.32 0.32 0.32 0.32 0.32 1.0% 2.3%
CNOOC & others 0.74 0.76 0.74 0.65 0.78 0.68 0.69 0.81 0.90 0.71 0.89 24.5% 14.6%
Total China 4.13 4.15 4.11 4.01 4.14 4.05 4.05 4.17 4.28 4.09 4.27 4.4% 5.6%
40
42
44
46
48
50
52
Jan
Feb
Mar
Ap
r
Ma
y
Jun
Jul
Aug
Sep Oc
t
No
v
Dec
Inve
nto
ry V
olu
mn
e, M
M T
on
s
2010-11 Range 2012
30
31
32
33
34
35
36
37
38
Jan
Feb
Mar
Ap
r
Ma
y
Jun
Jul
Aug
Sep Oc
t
No
v
Dec
Inve
nto
ry D
ays
of
Fo
rwar
d D
em
and
2010-11 Range 2012
For the exclusive use of MAURIZIO BESSONE at EURIZON CAPITAL SGR SPA on 26-Mar-2013

Asi
a-P
acif
ic O
il&
Gas
January 23, 2013
Neil Beveridge, Ph.D. (Senior Analyst) • [email protected] • +852-2918-5741
13
Exhibit 22Commercial crude inventory
Exhibit 23Commercial crude inventory days of forward demand
Source: China OGP, Bernstein analysis Source: China OGP, Bernstein analysis
The commercial oil products inventory grew by 0.88MT (4.15% m-o-m) to in December (Exhibit 24), implying 12.3 days cover of forward apparent oil demand (Exhibit 25) which was in line with seasonal averages
Exhibit 24Commercial oil products inventory
Exhibit 25Commercial oil products inventory days of forward demand
Source: China OGP, Bernstein analysis Source: China OGP, Bernstein analysis
Gasoline inventory accounted for 44% of total oil products inventory. In December, gasoline inventory increased by 0.59MT (8.54% m-o-m) (Exhibit 26), leading to 30.7 days cover of forward apparent gasoline demand which was in line with the historical range (Exhibit 27).
22
24
26
28
30
32
34Ja
n
Feb
Ma
r
Ap
r
May
Jun
Jul
Aug
Sep Oc
t
No
v
Dec
Inve
nto
ry V
olu
mn
e, M
M T
on
s
2010-11 Range 2012
18
19
20
21
22
23
24
Jan
Feb
Mar
Ap
r
May
Jun
Jul
Aug
Sep Oc
t
No
v
Dec
Inve
nto
ry D
ays
of
Fo
rwar
d D
em
and
2010-11 Range 2012
10
12
14
16
18
20
22
Jan
Feb
Mar
Ap
r
May
Jun
Jul
Aug
Sep Oct
No
v
Dec
Inve
nto
ry V
olu
mn
e, M
M T
on
s
2010-11 Range 2012
10
11
12
13
14
15
16
Jan
Feb
Mar
Ap
r
May
Jun
Jul
Aug
Sep Oct
No
v
Dec
Inve
nto
ry D
ays
of
Fo
rwar
d D
eman
d
2010-11 Range 2012
For the exclusive use of MAURIZIO BESSONE at EURIZON CAPITAL SGR SPA on 26-Mar-2013

Asi
a-P
acif
ic O
il&
Gas
January 23, 2013
Neil Beveridge, Ph.D. (Senior Analyst) • [email protected] • +852-2918-5741
14
Exhibit 26Gasoline inventory
Exhibit 27Gasoline inventory days of forward demand
Source: China OGP, Bernstein analysis Source: China OGP, Bernstein analysis and estimates
Diesel inventories accounted for 48% of total oil products inventory. In December the diesel inventory increased slightly by 0.88MT (1.90% m-o-m) (Exhibit 28), implying 16.7 days cover of forward apparent diesel demand (Exhibit 29) which was in line with seasonal trends.
Exhibit 28Diesel inventory
Exhibit 29Diesel inventory days of forward demand
Source: China OGP, Bernstein analysis Source: China OGP, Bernstein analysis and estimates
4
5
6
7
8
9
10Ja
n
Feb
Mar
Ap
r
May
Jun
Jul
Aug
Sep Oc
t
No
v
Dec
Inve
nto
ry V
olu
mn
e, M
M T
on
s
2010-11 Range 2012
20
22
24
26
28
30
32
34
36
Jan
Feb
Mar
Ap
r
May
Jun
Jul
Aug
Sep Oc
t
No
v
Dec
Inve
nto
ry D
ays
of
Fo
rwar
d D
em
and
2010-11 Range 2012
0
2
4
6
8
10
12
14
Jan
Feb
Mar
Ap
r
Ma
y
Jun
Jul
Aug
Sep Oc
t
No
v
Dec
Inve
nto
ry V
olu
mn
e, M
M T
on
s
2010-11 Range 2012
12
14
16
18
20
22
24
26
28
Jan
Feb
Mar
Ap
r
Ma
y
Jun
Jul
Aug
Sep Oc
t
No
v
Dec
Inve
nto
ry D
ays
of
Fo
rwar
d D
em
and
2010-11 Range 2012
For the exclusive use of MAURIZIO BESSONE at EURIZON CAPITAL SGR SPA on 26-Mar-2013

Asi
a-P
acif
ic O
il&
Gas
January 23, 2013
Neil Beveridge, Ph.D. (Senior Analyst) • [email protected] • +852-2918-5741
15
Refining
Refining throughput surged by 9.9% y-o-y in December to all time high amount of 43.1MT (Exhibit 30). We expect high refining throughput growth to continue as Chinese refiners add 1.2Mblsd of additional refining capacity in 2013.
Exhibit 30Chinese refinery throughput
Source: China NBS, Bernstein analysis and estimates
Net products imports were 1.6MT for December, which marked the highest reading over the last nine months as seasonal demand for fuel oil and diesel increased (Exhibit 31).
Exhibit 31Chinese net products imports
Source: China NBS, Bernstein analysis and estimates
Apparent gasoline demand in November was 7.7MMT, up 17.6% y-o-y (Exhibit 32) and diesel demand increased by 3.2% y-o-y to 14.7MMT (Exhibit 33). Again this highlights the importance in transportation demand over industrial demand in driving overall oil demand in China.
43.1
-2%0%2%4%6%8%10%12%14%
25
30
35
40
45
Dec
-10
Jan
-11
Feb
-11
Mar
-11
Ap
r-11
May
-11
Jun
-11
Jul-
11
Aug
-11
Sep
-11
Oc
t-11
No
v-11
Dec
-11
Jan
-12
Feb
-12
Mar
-12
Ap
r-12
May
-12
Jun
-12
Jul-
12
Aug
-12
Sep
-12
Oc
t-12
No
v-12
Dec
-12
Th
rou
gh
t Gw
th, Y
oY
Th
rou
gh
put
, MM
T
Refinery Throughput YoY
1.6
-100%
-50%
0%
50%
100%
150%
200%
0.0
0.5
1.0
1.5
2.0
2.5
Dec
-10
Jan
-11
Feb
-11
Mar
-11
Ap
r-11
Ma
y-11
Jun
-11
Jul-
11
Aug
-11
Sep
-11
Oc
t-11
No
v-11
Dec
-11
Jan
-12
Feb
-12
Mar
-12
Ap
r-12
Ma
y-12
Jun
-12
Jul-
12
Aug
-12
Sep
-12
Oc
t-12
No
v-12
Dec
-12
Th
rou
gh
t Gw
th, Y
oY
Net
pro
du
cts
imp
ort
s, M
MT Net products imports YoY
For the exclusive use of MAURIZIO BESSONE at EURIZON CAPITAL SGR SPA on 26-Mar-2013

Asi
a-P
acif
ic O
il&
Gas
January 23, 2013
Neil Beveridge, Ph.D. (Senior Analyst) • [email protected] • +852-2918-5741
16
Exhibit 32China gasoline demand
Source: China NBS, Bernstein analysis
Exhibit 33China diesel demand
Source: China NBS, Bernstein analysis
Since the introduction of the NDRC's current retail pricing mechanism in 2009 there have been 14 upward adjustments to product prices and 9 downward adjustments (Exhibit 34). China's NDRC announced the fourth fuel price reduction this year on November 15th, cutting retail gasoline and diesel prices by 3.2% and 3.4% respectively.
7.7
-5%
0%
5%
10%
15%
20%
25%
4.04.55.05.56.06.57.07.58.0
Dec
-10
Jan
-11
Feb
-11
Ma
r-11
Ap
r-11
May
-11
Jun
-11
Jul-
11
Aug
-11
Sep
-11
Oc
t-11
No
v-11
Dec
-11
Jan
-12
Feb
-12
Ma
r-12
Ap
r-12
May
-12
Jun
-12
Jul-
12
Aug
-12
Sep
-12
Oc
t-12
No
v-12
Yo
Y G
row
th
Ap
par
ent G
aso
line
Dem
and
(M
MT
)
Apparent Gasoline Demand yoy %
14.7
-5%
0%
5%
10%
15%
20%
9
10
11
12
13
14
15
16
Dec
-10
Jan
-11
Feb
-11
Mar
-11
Ap
r-11
Ma
y-11
Jun
-11
Jul-
11
Aug
-11
Sep
-11
Oct
-11
No
v-11
Dec
-11
Jan
-12
Feb
-12
Mar
-12
Ap
r-12
Ma
y-12
Jun
-12
Jul-
12
Aug
-12
Sep
-12
Oct
-12
No
v-12
Yo
Y G
row
th
Ap
par
ent D
iese
l Dem
and
(M
MT
)
Apparent Diesel Demand yoy %
For the exclusive use of MAURIZIO BESSONE at EURIZON CAPITAL SGR SPA on 26-Mar-2013

Asi
a-P
acif
ic O
il&
Gas
January 23, 2013
Neil Beveridge, Ph.D. (Senior Analyst) • [email protected] • +852-2918-5741
17
Exhibit 34NDRC retail fuel price changes have lagged crude prices on since the start of the current pricing system
Source: Company reports, Bloomberg, Bernstein analysis and estimates
Despite the price cut, refining margins should still remain positive for Sinopec. Gasoline & diesel/crude price ratios correlate strongly with Sinopec's refining margins. The ratio between gasoline/diesel prices and crude bottomed out in 2Q12, which should mean that 2Q12 was probably the low point for refining margins this year. The improvement in refining margins going into 3Q and 4Q is a major positive for Sinopec given the scale of their refining division (Exhibit 35). We believe that in 2013, the government could take steps to reform product pricing to a shorter time window for pricing adjustment, a lower threshold for changes and an agency outside of NDRC to announce changes.
40
50
60
70
80
90
100
110
120
5
7
9
11
Jan-
09Fe
b-09
Mar
-09
Apr
-09
May
-09
Jun-
09Ju
l-09
Aug
-09
Sep
-09
Oct
-09
Nov
-09
Dec
-09
Jan-
10Fe
b-10
Mar
-10
Apr
-10
May
-10
Jun-
10Ju
l-10
Aug
-10
Sep
-10
Oct
-10
Nov
-10
Dec
-10
Jan-
11Fe
b-11
Mar
-11
Apr
-11
May
-11
Jun-
11Ju
l-11
Aug
-11
Sep
-11
Oct
-11
Nov
-11
Dec
-11
Jan-
12Fe
b-12
Mar
-12
Apr
-12
May
-12
Jun-
12Ju
l-12
Aug
-12
Sep
-12
Oct
-12
Nov
-12
Dec
-12
$/b
bl
RM
B/L
China Gaso93 (RMB/L) China Diesel (RMB/L) Dubai Crude ($/bbl)
For the exclusive use of MAURIZIO BESSONE at EURIZON CAPITAL SGR SPA on 26-Mar-2013

Asi
a-P
acif
ic O
il&
Gas
January 23, 2013
Neil Beveridge, Ph.D. (Senior Analyst) • [email protected] • +852-2918-5741
18
Exhibit 35Sinopec refining margins have tracked the price ratio of retail fuels and crude
Source: Company reports, Bloomberg, Bernstein analysis and estimates
Strategic Petroleum Reserves (SPR)
China does not release SPR fill on a regular basis. In addition, there is limited data to track the SPR fill. We estimate monthly SPR change and commercial inventory level change (Exhibit 36) through the difference between total oil demand (China crude production and net imports) and apparent oil demand (refining throughput and net products imports).
Exhibit 36Implied monthly change in China's commercial crude and products inventory and SPR level
Source: China NBS, Bernstein analysis
Note: Implied commercial crude and products inventory and SPR is calculated as the difference between total oil demand and apparent oil demand
-5
0
5
10
15
20
1.0x
1.4x
1.8x
2.2x
2.6x
3.0xJa
n-0
9F
eb-0
9M
ar-
09A
pr-
09M
ay-0
9Ju
n-0
9Ju
l-09
Aug
-09
Sep
-09
Oct
-09
No
v-09
Dec
-09
Jan
-10
Feb
-10
Ma
r-10
Ap
r-10
May
-10
Jun
-10
Jul-
10A
ug-1
0S
ep-1
0O
ct-1
0N
ov-
10D
ec-1
0Ja
n-1
1F
eb-1
1M
ar-
11A
pr-
11M
ay-1
1Ju
n-1
1Ju
l-11
Aug
-11
Sep
-11
Oct
-11
No
v-11
Dec
-11
Jan
-12
Feb
-12
Ma
r-12
Ap
r-12
May
-12
Jun
-12
Jul-
12A
ug-1
2S
ep-1
2O
ct-1
2N
ov-
12D
ec-1
2
SN
P re
po
rted
GR
M, $
/bb
l
Rat
io o
f ret
ail p
rice
s (a
dju
ste
d fo
r co
nsu
mp
tion
tax)
ov
er c
rud
e p
ric
es
Gaso / Dubai Diesel / Dubai SNP Reported GRM
-1.6
70
80
90
100
110
120
130
-3-2-1012345
Dec
-10
Jan
-11
Feb
-11
Mar
-11
Ap
r-11
Ma
y-11
Jun
-11
Jul-
11
Aug
-11
Sep
-11
Oct
-11
No
v-11
Dec
-11
Jan
-12
Feb
-12
Mar
-12
Ap
r-12
Ma
y-12
Jun
-12
Jul-
12
Aug
-12
Sep
-12
Oct
-12
No
v-12
Dec
-12
Bre
nt,
US
$/b
bl
Inve
nto
ry C
han
ge,
MM
T
on
s
For the exclusive use of MAURIZIO BESSONE at EURIZON CAPITAL SGR SPA on 26-Mar-2013

Asi
a-P
acif
ic O
il&
Gas
January 23, 2013
Neil Beveridge, Ph.D. (Senior Analyst) • [email protected] • +852-2918-5741
19
Exhibit 37Implied monthly change in China's SPR level
Source: China NBS, Bernstein analysis
Note: Implied SPR level change is calculated as the difference between total oil demand and apparent oil demand minus commercial crude and products inventory change.
Through monitoring implied SPR level change every month (Exhibit 37), we estimate that China SPR level by December 2012 was close to 280mmbbls (Exhibit 38), indicating that Phase 2 SPR has been filled.Beyond Phase 2, China will begin the construction of Phase 3 storage bases this year with a total capacity of 28.2 cubic meters. We expect 200mbd of demand outside of 'apparent demand' for the filling of this capacity.
Exhibit 38China's SPR level and SPR capacity
Source: China NBS, Bernstein analysis
(1.3) (1.2)
70
80
90
100
110
120
130
-3-2-1012345
Dec
-10
Jan
-11
Feb
-11
Mar
-11
Ap
r-11
Ma
y-11
Jun
-11
Jul-
11
Aug
-11
Sep
-11
Oc
t-11
No
v-11
Dec
-11
Jan
-12
Feb
-12
Mar
-12
Ap
r-12
Ma
y-12
Jun
-12
Jul-
12
Aug
-12
Sep
-12
Oc
t-12
No
v-12
Dec
-12
Bre
nt,
US
$/b
bl
SP
R L
evel
Ch
ang
e, M
M
To
ns
-
50
100
150
200
250
300
350
400
De
c-0
6F
eb
-07
Ap
r-0
7Ju
n-0
7A
ug
-07
Oct
-07
De
c-0
7F
eb
-08
Ap
r-0
8Ju
n-0
8A
ug
-08
Oct
-08
De
c-0
8F
eb
-09
Ap
r-0
9Ju
n-0
9A
ug
-09
Oct
-09
De
c-0
9F
eb
-10
Ap
r-1
0Ju
n-1
0A
ug
-10
Oct
-10
De
c-1
0F
eb
-11
Ap
r-1
1Ju
n-1
1A
ug
-11
Oct
-11
De
c-1
1F
eb
-12
Ap
r-1
2Ju
n-1
2A
ug
-12
Oct
-12
De
c-1
2F
eb
-13
Ap
r-1
3Ju
n-1
3A
ug
-13
Oct
-13
De
c-1
3
mm
bb
ls
SPR SPR Capacity
For the exclusive use of MAURIZIO BESSONE at EURIZON CAPITAL SGR SPA on 26-Mar-2013
Asi
a-P
acif
ic O
il&
Gas
January 23, 2013
Neil Beveridge, Ph.D. (Senior Analyst) • [email protected] • +852-2918-5741
20
Petrochemicals
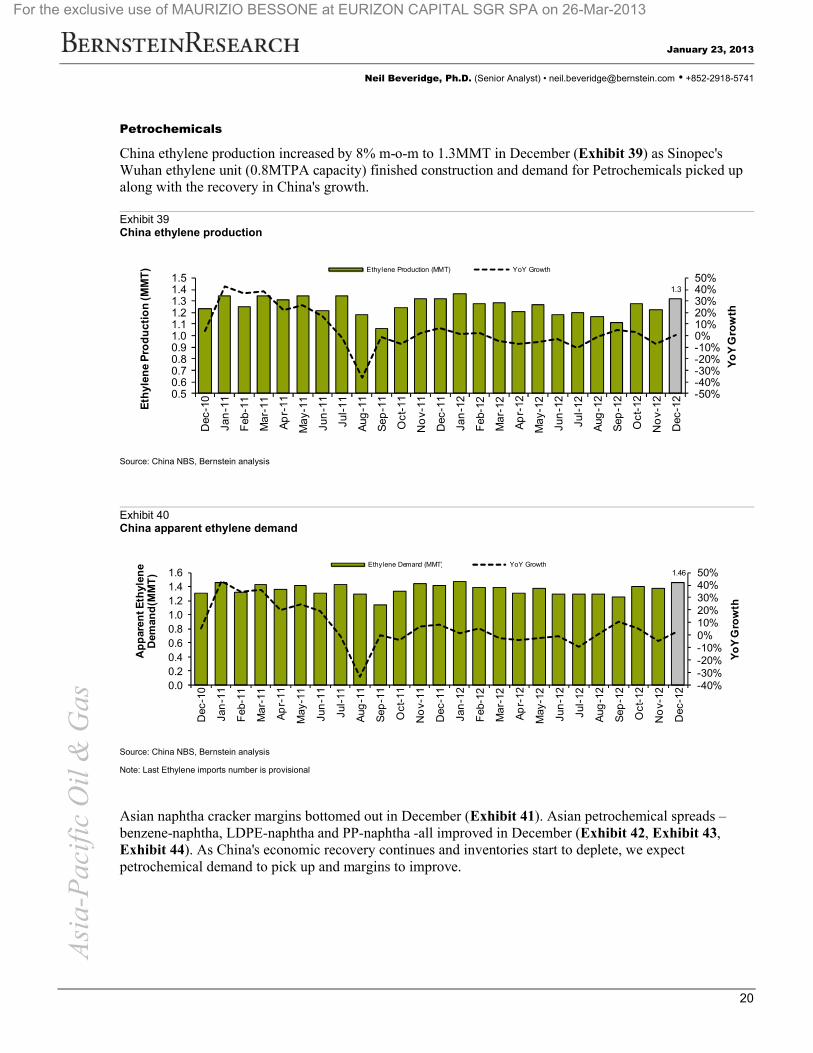
China ethylene production increased by 8% m-o-m to 1.3MMT in December (Exhibit 39) as Sinopec's Wuhan ethylene unit (0.8MTPA capacity) finished construction and demand for Petrochemicals picked up along with the recovery in China's growth.
Exhibit 39China ethylene production
Source: China NBS, Bernstein analysis
Exhibit 40China apparent ethylene demand
Source: China NBS, Bernstein analysis
Note: Last Ethylene imports number is provisional
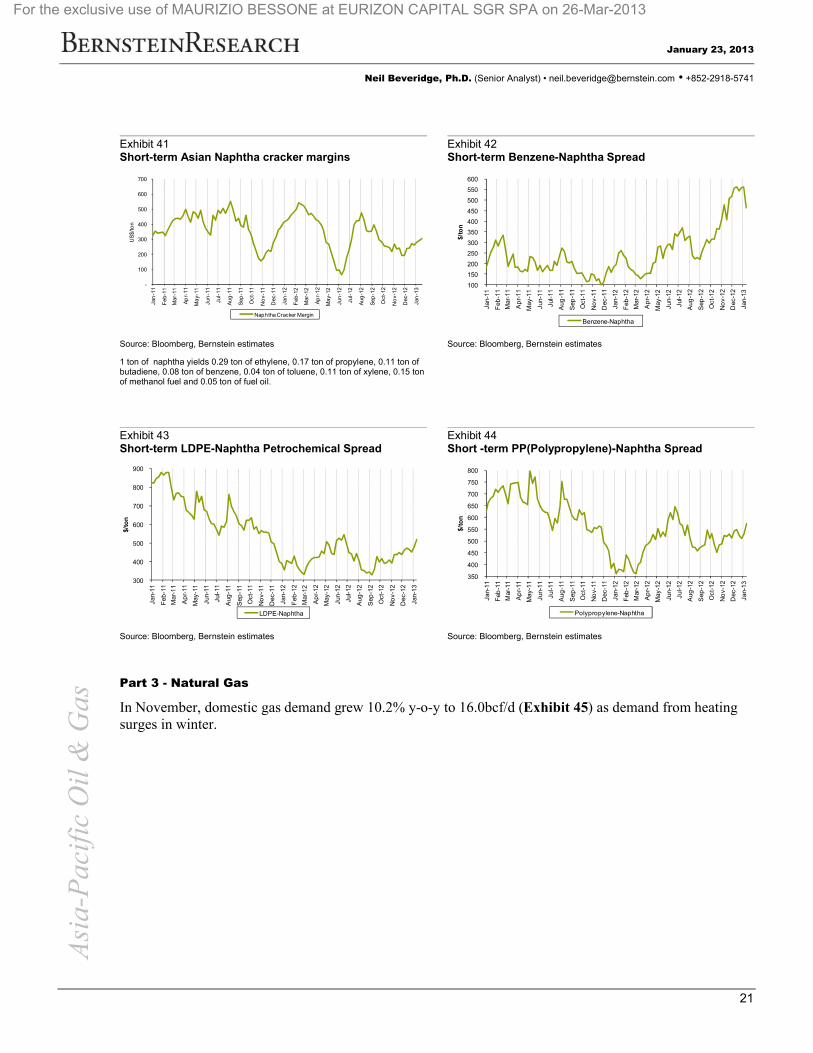
Asian naphtha cracker margins bottomed out in December (Exhibit 41). Asian petrochemical spreads –benzene-naphtha, LDPE-naphtha and PP-naphtha -all improved in December (Exhibit 42, Exhibit 43, Exhibit 44). As China's economic recovery continues and inventories start to deplete, we expect petrochemical demand to pick up and margins to improve.
1.3
-50%-40%-30%-20%-10%0%10%20%30%40%50%
0.50.60.70.80.91.01.11.21.31.41.5
Dec
-10
Jan
-11
Feb
-11
Ma
r-11
Ap
r-11
Ma
y-11
Jun
-11
Jul-
11
Aug
-11
Sep
-11
Oct
-11
No
v-11
Dec
-11
Jan
-12
Feb
-12
Ma
r-12
Ap
r-12
Ma
y-12
Jun
-12
Jul-
12
Aug
-12
Sep
-12
Oct
-12
No
v-12
Dec
-12
Yo
Y G
row
th
Eth
ylen
e P
rod
uc
tio
n (M
MT
) Ethylene Production (MMT) YoY Growth
1.46
-40%-30%-20%-10%0%10%20%30%40%50%
0.00.20.40.60.81.01.21.41.6
Dec
-10
Jan
-11
Feb
-11
Ma
r-11
Ap
r-11
May
-11
Jun
-11
Jul-
11
Aug
-11
Sep
-11
Oct
-11
No
v-11
Dec
-11
Jan
-12
Feb
-12
Ma
r-12
Ap
r-12
May
-12
Jun
-12
Jul-
12
Aug
-12
Sep
-12
Oct
-12
No
v-12
Dec
-12
Yo
Y G
row
th
Ap
par
ent E
thyl
ene
Dem
and
(MM
T)
Ethylene Demand (MMT) YoY Growth
For the exclusive use of MAURIZIO BESSONE at EURIZON CAPITAL SGR SPA on 26-Mar-2013
Asi
a-P
acif
ic O
il&
Gas
January 23, 2013
Neil Beveridge, Ph.D. (Senior Analyst) • [email protected] • +852-2918-5741
21
Exhibit 41Short-term Asian Naphtha cracker margins
Exhibit 42Short-term Benzene-Naphtha Spread
Source: Bloomberg, Bernstein estimates
1 ton of naphtha yields 0.29 ton of ethylene, 0.17 ton of propylene, 0.11 ton of butadiene, 0.08 ton of benzene, 0.04 ton of toluene, 0.11 ton of xylene, 0.15 ton of methanol fuel and 0.05 ton of fuel oil.
Source: Bloomberg, Bernstein estimates
Exhibit 43Short-term LDPE-Naphtha Petrochemical Spread
Exhibit 44Short -term PP(Polypropylene)-Naphtha Spread
Source: Bloomberg, Bernstein estimates Source: Bloomberg, Bernstein estimates
Part 3 - Natural Gas
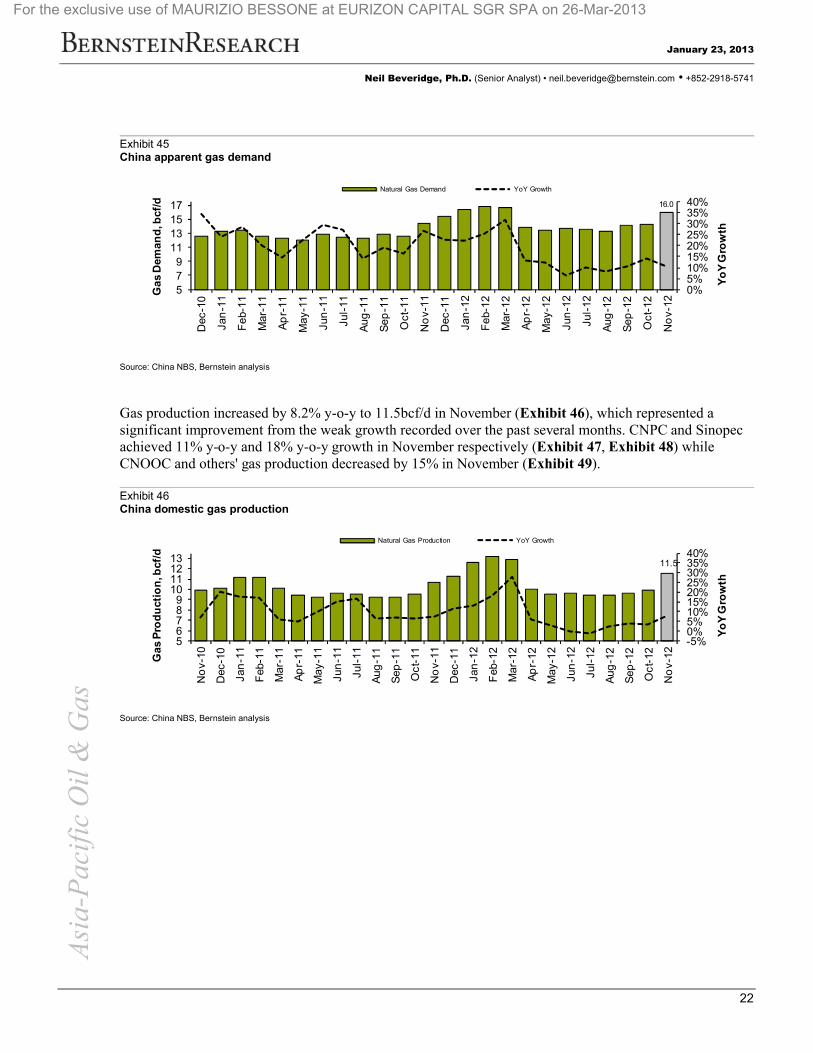
In November, domestic gas demand grew 10.2% y-o-y to 16.0bcf/d (Exhibit 45) as demand from heating surges in winter.
-
100
200
300
400
500
600
700
Jan
-11
Feb
-11
Mar
-11
Ap
r-11
Ma
y-11
Jun
-11
Jul-
11
Aug
-11
Sep
-11
Oct
-11
No
v-11
Dec
-11
Jan
-12
Feb
-12
Mar
-12
Ap
r-12
Ma
y-12
Jun
-12
Jul-
12
Aug
-12
Sep
-12
Oct
-12
No
v-12
Dec
-12
Jan
-13
US
$/to
n
Naphtha Cracker Margin
100
150
200
250
300
350
400
450
500
550
600
Jan-
11
Feb
-11
Mar
-11
Ap
r-11
May
-11
Jun-
11
Jul-1
1
Aug
-11
Sep
-11
Oct
-11
No
v-11
Dec
-11
Jan-
12
Feb
-12
Mar
-12
Ap
r-12
May
-12
Jun-
12
Jul-1
2
Aug
-12
Sep
-12
Oct
-12
No
v-12
Dec
-12
Jan-
13
$/to
n
Benzene-Naphtha
300
400
500
600
700
800
900
Jan-
11
Feb
-11
Mar
-11
Ap
r-11
May
-11
Jun-
11
Jul-1
1
Aug
-11
Sep
-11
Oct
-11
No
v-11
Dec
-11
Jan-
12
Feb
-12
Mar
-12
Ap
r-12
May
-12
Jun-
12
Jul-1
2
Aug
-12
Sep
-12
Oct
-12
No
v-12
Dec
-12
Jan-
13
$/to
n
LDPE-Naphtha
350
400
450
500
550
600
650
700
750
800
Jan-
11
Feb
-11
Mar
-11
Ap
r-11
May
-11
Jun-
11
Jul-1
1
Aug
-11
Sep
-11
Oct
-11
No
v-11
Dec
-11
Jan-
12
Feb
-12
Mar
-12
Ap
r-12
May
-12
Jun-
12
Jul-1
2
Aug
-12
Sep
-12
Oct
-12
No
v-12
Dec
-12
Jan-
13
$/to
n
Polypropylene-Naphtha
For the exclusive use of MAURIZIO BESSONE at EURIZON CAPITAL SGR SPA on 26-Mar-2013
Asi
a-P
acif
ic O
il&
Gas
January 23, 2013
Neil Beveridge, Ph.D. (Senior Analyst) • [email protected] • +852-2918-5741
22
Exhibit 45China apparent gas demand
Source: China NBS, Bernstein analysis
Gas production increased by 8.2% y-o-y to 11.5bcf/d in November (Exhibit 46), which represented a significant improvement from the weak growth recorded over the past several months. CNPC and Sinopec achieved 11% y-o-y and 18% y-o-y growth in November respectively (Exhibit 47, Exhibit 48) while CNOOC and others' gas production decreased by 15% in November (Exhibit 49).
Exhibit 46China domestic gas production
Source: China NBS, Bernstein analysis
16.0
0%5%10%15%20%25%30%35%40%
579
11131517
Dec
-10
Jan
-11
Feb
-11
Mar
-11
Ap
r-11
May
-11
Jun
-11
Jul-
11
Aug
-11
Sep
-11
Oct
-11
No
v-11
Dec
-11
Jan
-12
Feb
-12
Mar
-12
Ap
r-12
May
-12
Jun
-12
Jul-
12
Aug
-12
Sep
-12
Oct
-12
No
v-12
Yo
Y G
row
th
Ga
s D
eman
d, b
cf/d
Natural Gas Demand YoY Growth
11.5
-5%0%5%10%15%20%25%30%35%40%
56789
10111213
No
v-10
Dec
-10
Jan
-11
Feb
-11
Mar
-11
Ap
r-11
May
-11
Jun
-11
Jul-
11
Aug
-11
Sep
-11
Oc
t-11
No
v-11
Dec
-11
Jan
-12
Feb
-12
Mar
-12
Ap
r-12
May
-12
Jun
-12
Jul-
12
Aug
-12
Sep
-12
Oc
t-12
No
v-12
Yo
Y G
row
th
Ga
s P
rod
uct
ion
, bcf
/d
Natural Gas Production YoY Growth
For the exclusive use of MAURIZIO BESSONE at EURIZON CAPITAL SGR SPA on 26-Mar-2013

Asi
a-P
acif
ic O
il&
Gas
January 23, 2013
Neil Beveridge, Ph.D. (Senior Analyst) • [email protected] • +852-2918-5741
23
Exhibit 47PetroChina gas production
Exhibit 48Sinopec gas production
Exhibit 49CNOOC and others gas production
Source: China OGP, Bernstein analysis Source: China OGP, Bernstein analysis Source: China OGP, Bernstein analysis
Imports made up 28% of the total demand in November (Exhibit 50). Pipeline gas imports increased by 0.34bcf/d (15% m-o-m) to 2.57bcf/d (Exhibit 52), offsetting LNG imports decrease as spot LNG markets tightened in winter (Exhibit 51). Pipeline gas imports accounted for 58% of total gas imports in November. As China's second West-to-East gas pipeline became completely operational on December 30, 2012 and Myanmar pipeline will finish construction in May 2013, we expect pipeline gas imports continue to growthin 2013.
Exhibit 50China monthly gas supply and demand summary
Source: Bloomberg, China OGP, Bernstein analysis
-10%
-5%
0%
5%
10%
15%
20%
0.0
1.0
2.0
3.0
4.0
5.0
6.0
7.0
8.0
9.0
10.0
Jul-
09S
ep-0
9N
ov-0
9Ja
n-10
Mar
-10
May
-10
Jul-
10S
ep-1
0N
ov-1
0Ja
n-11
Mar
-11
May
-11
Jul-
11S
ep-1
1N
ov-1
1Ja
n-12
Mar
-12
May
-12
Jul-
12S
ep-1
2N
ov-1
2
Yo
Y G
row
th
bcf
/d
Total CNPC YoY Growth
0%
10%
20%
30%
40%
50%
60%
70%
0.0
0.2
0.4
0.6
0.8
1.0
1.2
1.4
1.6
1.8
2.0
Jul-
09S
ep-0
9N
ov-0
9Ja
n-10
Mar
-10
May
-10
Jul-
10S
ep-1
0N
ov-1
0Ja
n-11
Mar
-11
May
-11
Jul-
11S
ep-1
1N
ov-1
1Ja
n-12
Mar
-12
May
-12
Jul-
12S
ep-1
2N
ov-1
2
Yo
Y G
row
th
bcf
/d
Total Sinopec YoY Growth
-100%
-50%
0%
50%
100%
150%
200%
0.0
0.5
1.0
1.5
2.0
2.5
3.0
3.5
Jul-
09S
ep-0
9N
ov-0
9Ja
n-10
Mar
-10
May
-10
Jul-
10S
ep-1
0N
ov-1
0Ja
n-11
Mar
-11
May
-11
Jul-
11S
ep-1
1N
ov-1
1Ja
n-12
Mar
-12
May
-12
Jul-
12S
ep-1
2N
ov-1
2
Yo
Y G
row
th
bcf
/d
Total CNOOC & Others YoY Growth
Bcf/d Jan-12 Feb-12 Mar-12 Apr-12 May-12 Jun-12 Jul-12 Aug-12 Sep-12 Oct-12 Nov-12 M-o-M Y-o-Y
Production 12.55 13.22 12.88 9.98 9.49 9.59 9.40 9.44 9.62 9.86 11.52 16.8% 8.2%
Imports 3.78 3.62 3.76 3.91 3.92 4.11 4.22 3.81 4.58 4.45 4.45 0.0% 16.0%
Pipeline gas 1.59 2.13 1.87 2.07 2.01 2.01 1.99 1.99 2.19 2.23 2.57 15.2% 61.7%
LNG 2.19 1.49 1.89 1.83 1.91 2.10 2.23 1.82 2.39 2.22 1.88 -15.4% -16.4%
Gas Demand 16.33 16.84 16.64 13.89 13.41 13.70 13.62 13.26 14.19 14.31 15.97 11.6% 10.2%Imports as % of demand 23% 21% 23% 28% 29% 30% 31% 29% 32% 31% 28%
For the exclusive use of MAURIZIO BESSONE at EURIZON CAPITAL SGR SPA on 26-Mar-2013

Asi
a-P
acif
ic O
il&
Gas
January 23, 2013
Neil Beveridge, Ph.D. (Senior Analyst) • [email protected] • +852-2918-5741
24
Exhibit 51China LNG imports
Source: China NBS, Bernstein analysis
Exhibit 52China's pipeline gas imports
Source: China NBS, Bernstein analysis
Note: May data provisional
Part 4 - Electricity & Coal
Electricity production in December was 432.7TWh, up 7.2% Y-o-Y and up 7.9% sequentially from November. Power generation growth in December 2011 was 9.8% (Exhibit 53). Power production in 2012 was 4,771TWh up 4.2% Y-o-Y. This is the lowest annual production growth since 2005.
1.9
-40%
-20%
0%
20%
40%
60%
80%
100%
0.0
0.5
1.0
1.5
2.0
2.5
3.0O
ct-1
0
No
v-10
Dec
-10
Jan
-11
Feb
-11
Mar
-11
Ap
r-11
Ma
y-11
Jun
-11
Jul-
11
Aug
-11
Sep
-11
Oct
-11
No
v-11
Dec
-11
Jan
-12
Feb
-12
Mar
-12
Ap
r-12
Ma
y-12
Jun
-12
Jul-
12
Aug
-12
Sep
-12
Oct
-12
No
v-12
Yo
Y G
row
th
LN
G Im
po
rts,
bcf
/d
Natural Gas Imports YoY Growth
2.6
0%
100%
200%
300%
400%
500%
600%
0.0
0.5
1.0
1.5
2.0
2.5
3.0
Oc
t-1
0
No
v-10
De
c-10
Jan
-11
Feb
-11
Mar
-11
Apr
-11
May
-11
Jun
-11
Jul
-11
Au
g-1
1
Se
p-1
1
Oc
t-1
1
No
v-11
De
c-11
Jan
-12
Feb
-12
Mar
-12
Apr
-12
May
-12
Jun
-12
Jul
-12
Au
g-1
2
Se
p-1
2
Oc
t-1
2
No
v-12
Yo
Y G
row
th
Pip
ed G
as Im
po
rts
, bcf
/d
Piped Gas YoY Growth
For the exclusive use of MAURIZIO BESSONE at EURIZON CAPITAL SGR SPA on 26-Mar-2013

Asi
a-P
acif
ic O
il&
Gas
January 23, 2013
Neil Beveridge, Ph.D. (Senior Analyst) • [email protected] • +852-2918-5741
25
Exhibit 53Electricity production growth (Y-o-Y comparison – same month previous year)
Source: CEIC, NBS, Bernstein analysis
Using the average power production growth of 4.3% and GDP growth of 7.7% for 2012, we get a power multiplier of ~0.56x for 2012. We continue to believe the long-term power multiplier in China is roughly 1x real GDP growth (Exhibit 54). With increasing power production growth in the fourth quarter of 2012, the economy is moving back to this longer term trend.
Exhibit 54China power multiplier (power production growth / GDP growth)
Source: CEIC, NBS, Bernstein analysis
Thermal power generation was 355.4TWh in December, up 3.8% Y-o-Y and up 11.3% sequentially (Exhibit 55). This was the only second time thermal power generation growth was positive since March this year. 2012 thermal power production is down 0.6% Y-o-Y – the first time China has seen negative thermal production growth since 2005.
7.2%
-10%
0%
10%
20%
30%D
ec-1
0
Jan-
11
Feb-
11
Mar
-11
Apr
-11
May
-11
Jun-
11
Jul-1
1
Aug
-11
Sep
-11
Oct
-11
Nov
-11
Dec
-11
Jan-
12
Feb-
12
Mar
-12
Apr
-12
May
-12
Jun-
12
Jul-1
2
Aug
-12
Sep
-12
Oct
-12
Nov
-12
Dec
-12El
ect
rici
ty P
rod
uct
ion
Gro
wth
Yo
Y
2012 YoY Growth = 4.2%
(0.60)
(0.10)
0.40
0.90
1.40
-10%
-5%
0%
5%
10%
15%
20%
25%
30%
1Q07
2Q07
3Q07
4Q07
1Q08
2Q08
3Q08
4Q08
1Q09
2Q09
3Q09
4Q09
1Q10
2Q10
3Q10
4Q10
1Q11
2Q11
3Q11
4Q11
1Q12
2Q12
3Q12
4Q12
Po
we
r Mul
tipl
ier
Yo
Y G
row
th
Electricity Production growth GDP growth Power "Multiplier"
Average Power Multiplier 2007-10 = 1.05x
Power Multiplier:2011 Avg. = 1.18x
Power Multiplier:2012 Avg = 0.56x
For the exclusive use of MAURIZIO BESSONE at EURIZON CAPITAL SGR SPA on 26-Mar-2013

Asi
a-P
acif
ic O
il&
Gas
January 23, 2013
Neil Beveridge, Ph.D. (Senior Analyst) • [email protected] • +852-2918-5741
26
Exhibit 55Thermal electricity production and Y-o-Y growth
Source: CEIC, NBS, Bernstein analysis
Hydro power generation was 50.1TWh in December, up 13.3% Y-o-Y, although it is down 11.9% sequentially due to seasonality (Exhibit 56). 2012 annual hydro power production is up 22.7% Y-o-Y.
Exhibit 56Hydro electricity production and Y-o-Y growth
Source: CEIC, NBS, Bernstein analysis
Nuclear power generation was 8.1TWh in December, up 7.4% Y-o-Y and flat compared to November (Exhibit 57). 2012 annual nuclear power production is up 8.5% Y-o-Y.
355
-15%-10%-5%0%5%10%15%20%25%
0
100
200
300
400
500
600D
ec-1
0
Jan-
11
Feb-
11
Mar
-11
Apr
-11
May
-11
Jun-
11
Jul-1
1
Aug
-11
Sep
-11
Oct
-11
Nov
-11
Dec
-11
Jan-
12
Feb-
12
Mar
-12
Apr
-12
May
-12
Jun-
12
Jul-1
2
Aug
-12
Sep
-12
Oct
-12
Nov
-12
Dec
-12
Yo
Y G
row
th
Th
erm
al E
lect
rici
ty
Pro
du
cti
on,
TW
h
Thermal Power YoY Growth
50
-40.0%
-20.0%
0.0%
20.0%
40.0%
60.0%
0.0
20.0
40.0
60.0
80.0
100.0
Dec
-10
Jan-
11
Feb-
11
Mar
-11
Apr
-11
May
-11
Jun-
11
Jul-1
1
Aug
-11
Sep
-11
Oct
-11
Nov
-11
Dec
-11
Jan-
12
Feb-
12
Mar
-12
Apr
-12
May
-12
Jun-
12
Jul-1
2
Aug
-12
Sep
-12
Oct
-12
Nov
-12
Dec
-12
Yo
Y G
row
th
Hyd
ro E
lect
rici
ty
Pro
du
cti
on,
TW
h
Hy dro Power YoY Growth
For the exclusive use of MAURIZIO BESSONE at EURIZON CAPITAL SGR SPA on 26-Mar-2013
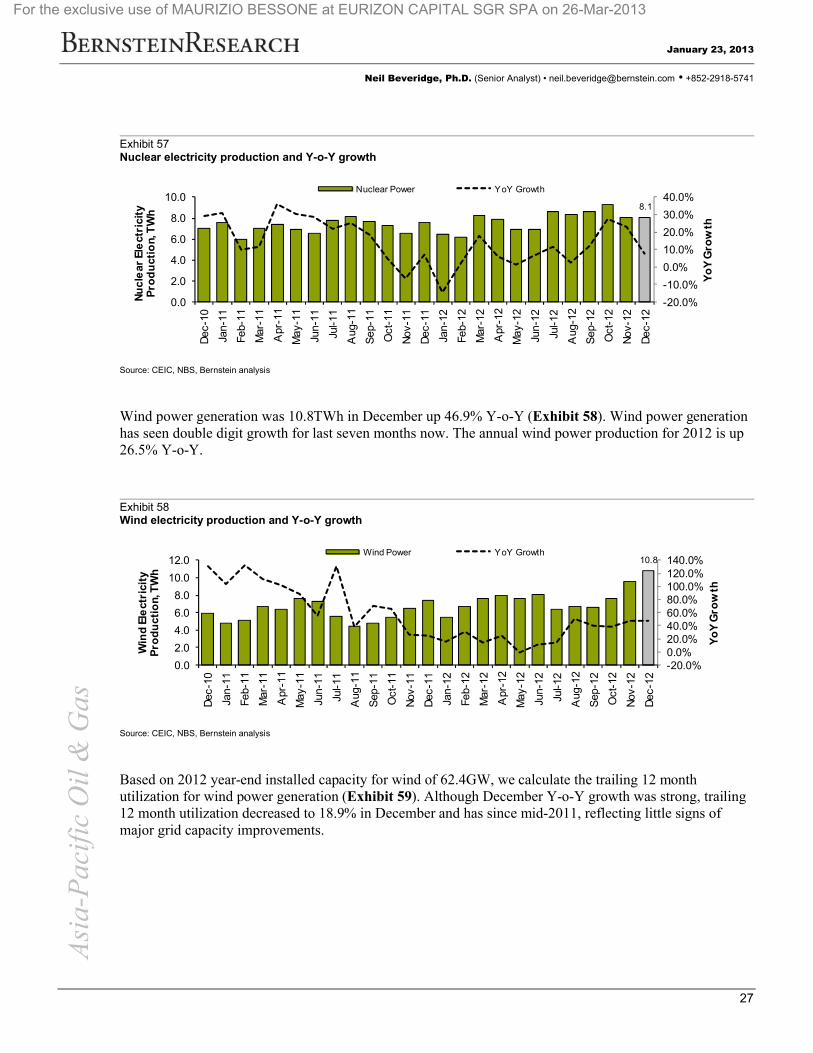
Asi
a-P
acif
ic O
il&
Gas
January 23, 2013
Neil Beveridge, Ph.D. (Senior Analyst) • [email protected] • +852-2918-5741
27
Exhibit 57Nuclear electricity production and Y-o-Y growth
Source: CEIC, NBS, Bernstein analysis
Wind power generation was 10.8TWh in December up 46.9% Y-o-Y (Exhibit 58). Wind power generation has seen double digit growth for last seven months now. The annual wind power production for 2012 is up 26.5% Y-o-Y.
Exhibit 58Wind electricity production and Y-o-Y growth
Source: CEIC, NBS, Bernstein analysis
Based on 2012 year-end installed capacity for wind of 62.4GW, we calculate the trailing 12 month utilization for wind power generation (Exhibit 59). Although December Y-o-Y growth was strong, trailing 12 month utilization decreased to 18.9% in December and has since mid-2011, reflecting little signs of major grid capacity improvements.
8.1
-20.0%
-10.0%
0.0%
10.0%
20.0%
30.0%
40.0%
0.0
2.0
4.0
6.0
8.0
10.0D
ec-1
0
Jan-
11
Feb-
11
Mar
-11
Apr
-11
May
-11
Jun-
11
Jul-1
1
Aug
-11
Sep
-11
Oct
-11
Nov
-11
Dec
-11
Jan-
12
Feb-
12
Mar
-12
Apr
-12
May
-12
Jun-
12
Jul-1
2
Aug
-12
Sep
-12
Oct
-12
Nov
-12
Dec
-12
Yo
Y G
row
th
Nu
cle
ar E
lect
rici
ty
Pro
du
ctio
n, T
Wh
Nuclear Power YoY Growth
10.8
-20.0%0.0%20.0%40.0%60.0%80.0%100.0%120.0%140.0%
0.0
2.0
4.0
6.0
8.0
10.0
12.0
Dec
-10
Jan-
11
Feb-
11
Mar
-11
Apr
-11
May
-11
Jun-
11
Jul-1
1
Aug
-11
Sep
-11
Oct
-11
Nov
-11
Dec
-11
Jan-
12
Feb-
12
Mar
-12
Apr
-12
May
-12
Jun-
12
Jul-1
2
Aug
-12
Sep
-12
Oct
-12
Nov
-12
Dec
-12
Yo
Y G
row
th
Win
d E
lect
rici
ty
Pro
du
ctio
n, T
Wh
Wind Power YoY Growth
For the exclusive use of MAURIZIO BESSONE at EURIZON CAPITAL SGR SPA on 26-Mar-2013

Asi
a-P
acif
ic O
il&
Gas
January 23, 2013
Neil Beveridge, Ph.D. (Senior Analyst) • [email protected] • +852-2918-5741
28
Exhibit 59Chinese Wind Power: Trailing 12M Utilization and Monthly Y-o-Y Growth
Source: CEIC, NBS, Bernstein analysis and estimates
Another way to measure this transmission capacity improvement is to see whether generation growth is higher than installed capacity growth. Looking at trailing three month Y/Y generation growth minus Y/Ycapacity growth, the result turned positive in October and improved further in November and December (Exhibit 60). This is an early sign consistent with transmission capacity improvements and a trend towards higher utilization.
Exhibit 60China Trailing 3M Y/Y Wind Generation Growth Minus Y/Y Wind Capacity Growth
Source: CEIC, NBS, Bernstein analysis and estimates
Overall, December's 7.2% power production growth was driven by strong renewables power generation, offsetting the low thermal power production growth (Exhibit 61).
-20%0%20%40%60%80%100%120%140%
18%19%20%21%22%23%24%25%26%
Nov
-10
Dec
-10
Jan-
11
Feb-
11
Mar
-11
Apr
-11
May
-11
Jun-
11
Jul-1
1
Aug
-11
Sep
-11
Oct
-11
Nov
-11
Dec
-11
Jan-
12
Feb-
12
Mar
-12
Apr
-12
May
-12
Jun-
12
Jul-1
2
Aug
-12
Sep
-12
Oct
-12
Nov
-12
Dec
-12 M
on
thly
Y/Y
Gro
wth
Rat
e
Tra
ilin
g 1
2M U
tiliz
atio
n R
ate
Trailing 12M Utilization Monthly Y-o-Y Growth
12.0%
-40%
-30%
-20%
-10%
0%
10%
20%
30%
Jan-
11
Feb-
11
Mar
-11
Apr
-11
May
-11
Jun-
11
Jul-1
1
Aug
-11
Sep
-11
Oct
-11
Nov
-11
Dec
-11
Jan-
12
Feb-
12
Mar
-12
Apr
-12
May
-12
Jun-
12
Jul-1
2
Aug
-12
Sep
-12
Oct
-12
Nov
-12
Dec
-12T
raili
ng
3M
Y/Y
Ge
ne
rati
on
Gro
wth
Min
us Y
/Y C
apac
ity
Gro
wth
For the exclusive use of MAURIZIO BESSONE at EURIZON CAPITAL SGR SPA on 26-Mar-2013
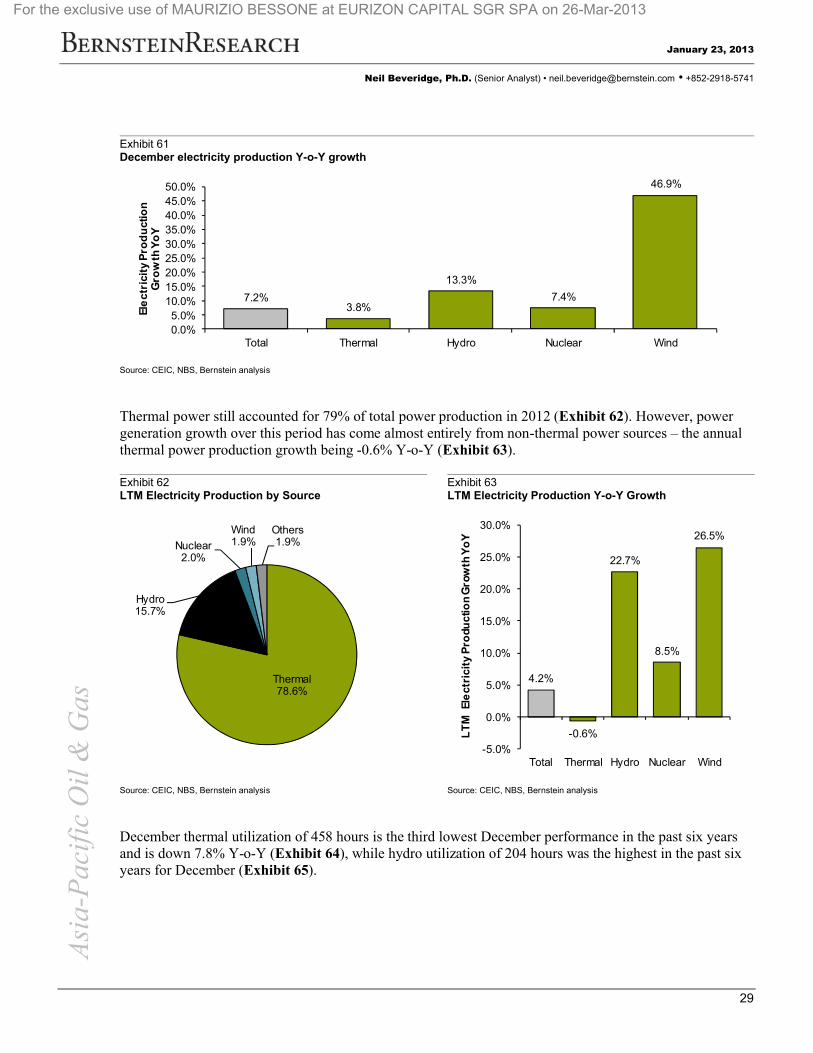
Asi
a-P
acif
ic O
il&
Gas
January 23, 2013
Neil Beveridge, Ph.D. (Senior Analyst) • [email protected] • +852-2918-5741
29
Exhibit 61December electricity production Y-o-Y growth
Source: CEIC, NBS, Bernstein analysis
Thermal power still accounted for 79% of total power production in 2012 (Exhibit 62). However, power generation growth over this period has come almost entirely from non-thermal power sources – the annual thermal power production growth being -0.6% Y-o-Y (Exhibit 63).
Exhibit 62LTM Electricity Production by Source
Exhibit 63LTM Electricity Production Y-o-Y Growth
Source: CEIC, NBS, Bernstein analysis Source: CEIC, NBS, Bernstein analysis
December thermal utilization of 458 hours is the third lowest December performance in the past six years and is down 7.8% Y-o-Y (Exhibit 64), while hydro utilization of 204 hours was the highest in the past six years for December (Exhibit 65).
7.2%3.8%
13.3%
7.4%
46.9%
0.0%5.0%
10.0%15.0%20.0%25.0%30.0%35.0%40.0%45.0%50.0%
Total Thermal Hydro Nuclear Wind
Ele
ctr
icit
y P
rod
uct
ion
Gro
wth
Yo
Y
Thermal78.6%
Hydro15.7%
Nuclear2.0%
Wind1.9%
Others1.9%
4.2%
-0.6%
22.7%
8.5%
26.5%
-5.0%
0.0%
5.0%
10.0%
15.0%
20.0%
25.0%
30.0%
Total Thermal Hydro Nuclear Wind
LT
M E
lect
rici
ty P
rodu
ctio
n G
row
th Y
oY
For the exclusive use of MAURIZIO BESSONE at EURIZON CAPITAL SGR SPA on 26-Mar-2013

Asi
a-P
acif
ic O
il&
Gas
January 23, 2013
Neil Beveridge, Ph.D. (Senior Analyst) • [email protected] • +852-2918-5741
30
Exhibit 64December thermal electricity utilization hours
Exhibit 65December hydro electricity utilization hours
Source: CEIC, China Electricity Council, Bernstein analysis Source: CEIC, China Electricity Council, Bernstein analysis
Looking ahead at January sequential electricity production growth in "February Chinese New Year" years, electricity production growth has historically decreased 1.7% sequentially on average in January (Exhibit 66).
Exhibit 66Electricity production growth – seasonality effect – Seq. change in production December-January
Source: CEIC, NBS, Bernstein analysis
We track the reported Qinhuangdao coal prices from SX Coal, and also look at the Qinhuangdao coal prices reported by McCloskey. The most recently reported coal price was RMB620/ton based on SX Coal on January 22, 2013 for 5,500 Kcal/Kg coal (Exhibit 67). The coal price was RMB719/ton based on the Qinhuangdao index tracked by McCloskey and Bloomberg as of January 11, 2013 for 5,800 Kcal/Kg coal (Exhibit 68). Coal prices turned with the end of winter restocking at the end of October. We anticipate –
458
0
100
200
300
400
500
600
2007 2008 2009 2010 2011 2012
De
cem
ber
Th
erm
al U
tili
zati
on H
ou
rs 204
0
50
100
150
200
250
2007 2008 2009 2010 2011 2012
De
cem
ber
Hyd
ro U
tiliz
atio
n H
ou
rs
-13.7%-16.0%-14.0%-12.0%-10.0%-8.0%-6.0%-4.0%-2.0%0.0%2.0%
2002 2003 2004 2005 2006 2007 2008 2009 2010 2011 2012
Se
q. C
han
ge
in E
lec.
P
rod
uct
ion,
De
c-Ja
n
Average = -1.7%
For the exclusive use of MAURIZIO BESSONE at EURIZON CAPITAL SGR SPA on 26-Mar-2013
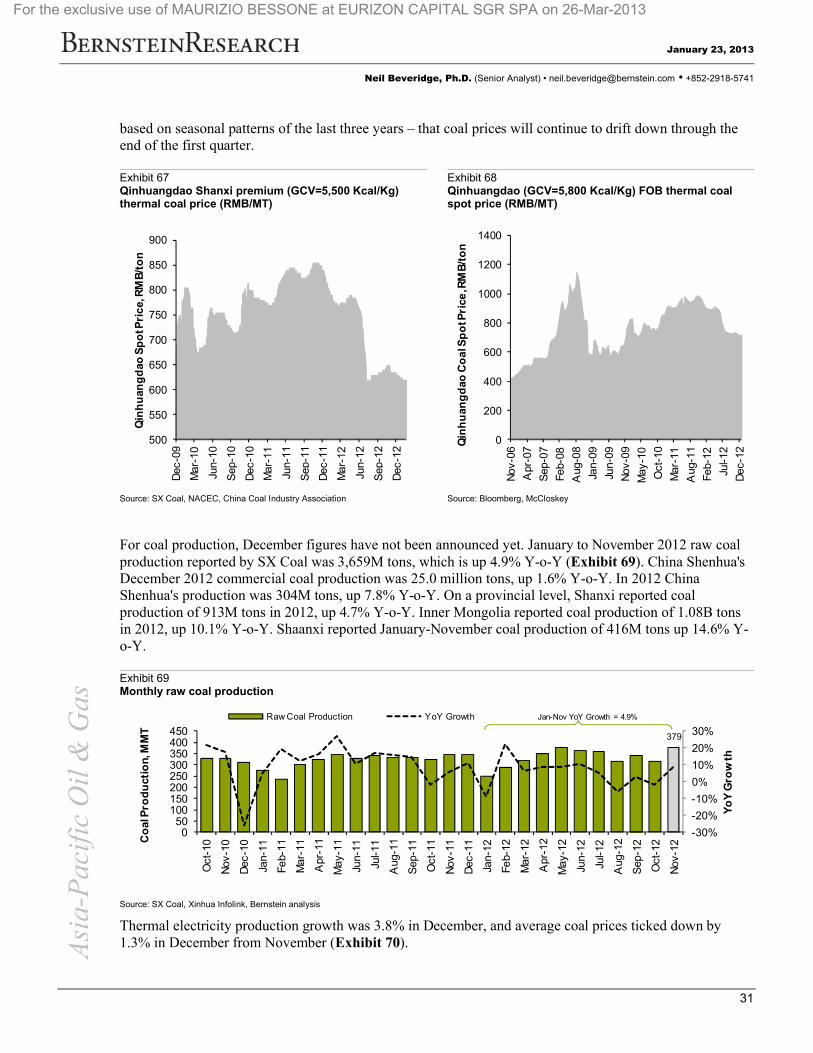
Asi
a-P
acif
ic O
il&
Gas
January 23, 2013
Neil Beveridge, Ph.D. (Senior Analyst) • [email protected] • +852-2918-5741
31
based on seasonal patterns of the last three years – that coal prices will continue to drift down through the end of the first quarter.
Exhibit 67Qinhuangdao Shanxi premium (GCV=5,500 Kcal/Kg) thermal coal price (RMB/MT)
Exhibit 68Qinhuangdao (GCV=5,800 Kcal/Kg) FOB thermal coal spot price (RMB/MT)
Source: SX Coal, NACEC, China Coal Industry Association Source: Bloomberg, McCloskey
For coal production, December figures have not been announced yet. January to November 2012 raw coal production reported by SX Coal was 3,659M tons, which is up 4.9% Y-o-Y (Exhibit 69). China Shenhua's December 2012 commercial coal production was 25.0 million tons, up 1.6% Y-o-Y. In 2012 China Shenhua's production was 304M tons, up 7.8% Y-o-Y. On a provincial level, Shanxi reported coal production of 913M tons in 2012, up 4.7% Y-o-Y. Inner Mongolia reported coal production of 1.08B tons in 2012, up 10.1% Y-o-Y. Shaanxi reported January-November coal production of 416M tons up 14.6% Y-o-Y.
Exhibit 69Monthly raw coal production
Source: SX Coal, Xinhua Infolink, Bernstein analysis
Thermal electricity production growth was 3.8% in December, and average coal prices ticked down by 1.3% in December from November (Exhibit 70).
500
550
600
650
700
750
800
850
900
Dec
-09
Mar
-10
Jun-
10
Sep
-10
Dec
-10
Mar
-11
Jun-
11
Sep
-11
Dec
-11
Mar
-12
Jun-
12
Sep
-12
Dec
-12
Qin
hu
ang
dao
Sp
ot P
ric
e, R
MB
/to
n
0
200
400
600
800
1000
1200
1400
Nov
-06
Apr
-07
Sep
-07
Feb-
08
Aug
-08
Jan-
09
Jun-
09
Nov
-09
May
-10
Oct
-10
Mar
-11
Aug
-11
Feb-
12
Jul-1
2
Dec
-12
Qin
hu
ang
dao
Co
al S
po
t Pri
ce, R
MB
/to
n
379
-30%
-20%
-10%
0%
10%
20%
30%
050
100150200250300350400450
Oct
-10
Nov
-10
Dec
-10
Jan-
11
Feb-
11
Mar
-11
Apr
-11
May
-11
Jun-
11
Jul-1
1
Aug
-11
Sep
-11
Oct
-11
Nov
-11
Dec
-11
Jan-
12
Feb-
12
Mar
-12
Apr
-12
May
-12
Jun-
12
Jul-1
2
Aug
-12
Sep
-12
Oct
-12
Nov
-12
Yo
Y G
row
th
Co
al P
rod
uct
ion,
MM
T
Raw Coal Production YoY Growth Jan-Nov YoY Growth = 4.9%
For the exclusive use of MAURIZIO BESSONE at EURIZON CAPITAL SGR SPA on 26-Mar-2013

Asi
a-P
acif
ic O
il&
Gas
January 23, 2013
Neil Beveridge, Ph.D. (Senior Analyst) • [email protected] • +852-2918-5741
32
Exhibit 70Thermal electricity production growth and coal prices
Source: CEIC, NBS, SX Coal
Coal net imports in December was 34.3M tons with exports of 0.8M tons and imports of 35.1M tons. This represents a 66.6% Y-o-Y increase from the 20.6M ton net imports in December 2011 and a 20.7% sequential increase from 28.4M tons in November (Exhibit 71).
Exhibit 71Chinese coal net imports
Source: CEIC, General Administration of Customs, Bernstein analysis
China's monthly net imports are partially a function of the price differential between domestic and imported coal (Exhibit 72).
3.8%
600
650
700
750
800
850
900
-15%-10%-5%0%5%
10%15%20%25%
Nov
-10
Dec
-10
Jan-
11
Feb-
11
Mar
-11
Apr
-11
May
-11
Jun-
11
Jul-1
1
Aug
-11
Sep
-11
Oct
-11
Nov
-11
Dec
-11
Jan-
12
Feb-
12
Mar
-12
Apr
-12
May
-12
Jun-
12
Jul-1
2
Aug
-12
Sep
-12
Oct
-12
Nov
-12
Dec
-12 Q
inh
uan
gd
ao C
oal
Sp
ot
Pri
ce
(RM
B/t
on
)
Th
erm
al P
ow
er P
rod
ucti
on
Gro
wth
(Yo
Y)
Thermal Power Production Growth QHD Coal Spot Price (RMB/Ton)
34.3
-100.0%
0.0%
100.0%
200.0%
300.0%
05
10152025303540
Dec
-10
Jan-
11
Feb-
11
Mar
-11
Apr
-11
May
-11
Jun-
11
Jul-1
1
Aug
-11
Sep
-11
Oct
-11
Nov
-11
Dec
-11
Jan-
12
Feb-
12
Mar
-12
Apr
-12
May
-12
Jun-
12
Jul-1
2
Aug
-12
Sep
-12
Oct
-12
Nov
-12
Dec
-12
Yo
Y G
row
th
Ne
t Co
al Im
po
rts,
MM
T Net Imports YoY Growth
For the exclusive use of MAURIZIO BESSONE at EURIZON CAPITAL SGR SPA on 26-Mar-2013

Asi
a-P
acif
ic O
il&
Gas
January 23, 2013
Neil Beveridge, Ph.D. (Senior Analyst) • [email protected] • +852-2918-5741
33
Exhibit 72Qinhuangdao-Newcastle spot coal price differential vs Chinese coal net imports
Source: CEIC, General Administration of Customs, Bloomberg, China Coal Industry Association, Bernstein analysis
As the spread between coal price in Qinhuangdao and Newcastle widened from -US$7 per ton in January 2011 to ~US$32 per ton in June 2012, net imports also increased. In July and August 2012, the spread decreased to ~US$17 per ton and ~US$16 per ton respectively, the net imports also decreased. Over the past two years, the highest correlation between net imports and the price differential between domestic and imported coal is when net imports lag the coal price differential by one month, which results in an R-squared of ~0.6.
Part 5 - Steel & Aluminum
December PMI for the China steel sector came in at 48.9, which is a YoY improvement for the third consecutive month (Exhibit 73). This PMI tracked by Steelease is based on surveys with end market users (in construction, machinery, automotive, transport, hardware & tools, home appliance and shipbuilding), with a 50+ score representing a positive MoM change.
Construction, which accounts for over 50% of China's steel demand, also saw stable PMI at 47.8 in December versus November, representing a significant YoY improvement (Exhibit 74). China steel sector PMI tends to drop in the fourth quarter as Northern China's winter conditions become too challenging for construction work, but we have seen less of a decline in sentiment this year.
Exhibit 73PMI for China's Steel Sector (tracked by Steelease)
Exhibit 74PMI for China's Construction Market (tracked by Steelease)
Source: Steelease, Bernstein analysis Source: Steelease, Bernstein analysis
34.3
-20
-10
0
10
20
30
40
05
10152025303540
Jan-
11
Feb-
11
Mar
-11
Apr
-11
May
-11
Jun-
11
Jul-1
1
Aug
-11
Sep
-11
Oct
-11
Nov
-11
Dec
-11
Jan-
12
Feb-
12
Mar
-12
Apr
-12
May
-12
Jun-
12
Jul-1
2
Aug
-12
Sep
-12
Oct
-12
Nov
-12
Dec
-12 Q
HD
-Ne
wca
stl
e S
po
t Pri
ce
Sp
read
(US
$/to
n)
Co
al N
et
Imp
ort
s, M
MT Net Imports QHD-Newcastle Spot Price
48.9
30
35
40
45
50
55
60
65
Overall Steel Sector Monthly PMI
50 = same as previous month
47.8
303540455055606570
Construction End Market Monthly PMI
50 = same as previous month
For the exclusive use of MAURIZIO BESSONE at EURIZON CAPITAL SGR SPA on 26-Mar-2013
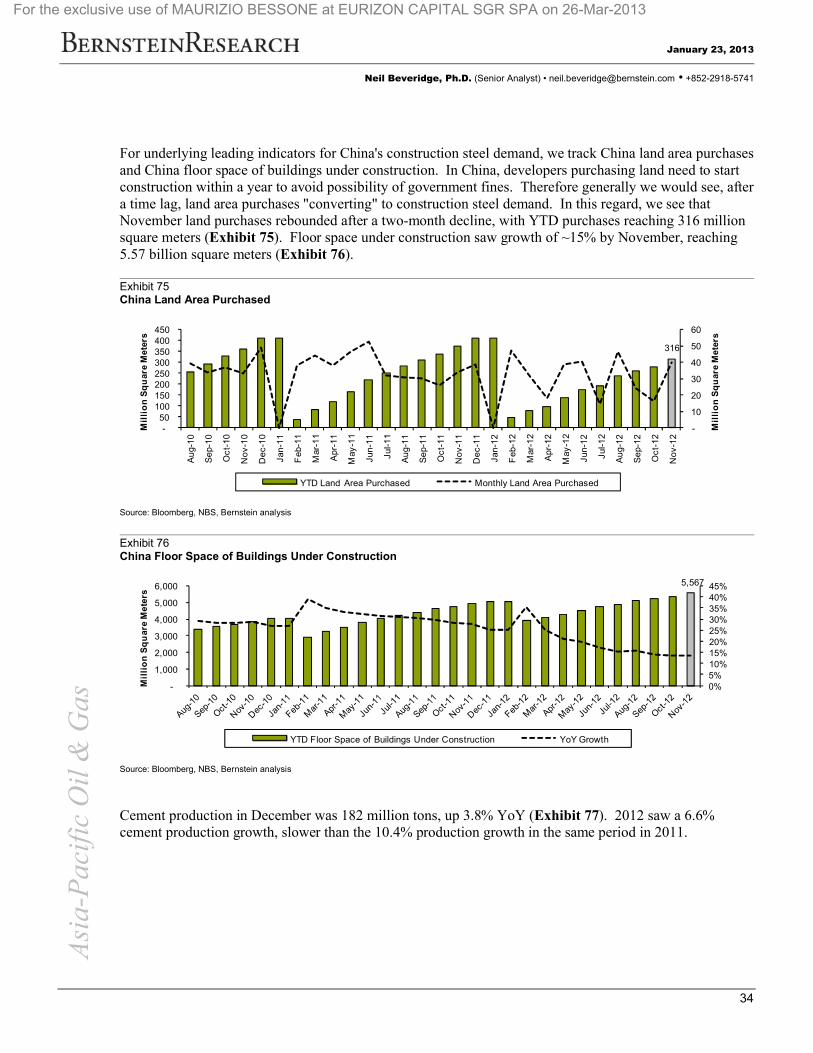
Asi
a-P
acif
ic O
il&
Gas
January 23, 2013
Neil Beveridge, Ph.D. (Senior Analyst) • [email protected] • +852-2918-5741
34
For underlying leading indicators for China's construction steel demand, we track China land area purchases and China floor space of buildings under construction. In China, developers purchasing land need to start construction within a year to avoid possibility of government fines. Therefore generally we would see, after a time lag, land area purchases "converting" to construction steel demand. In this regard, we see that November land purchases rebounded after a two-month decline, with YTD purchases reaching 316 million square meters (Exhibit 75). Floor space under construction saw growth of ~15% by November, reaching 5.57 billion square meters (Exhibit 76).
Exhibit 75China Land Area Purchased
Source: Bloomberg, NBS, Bernstein analysis
Exhibit 76China Floor Space of Buildings Under Construction
Source: Bloomberg, NBS, Bernstein analysis
Cement production in December was 182 million tons, up 3.8% YoY (Exhibit 77). 2012 saw a 6.6% cement production growth, slower than the 10.4% production growth in the same period in 2011.
316
-
10
20
30
40
50
60
-50
100 150 200 250 300 350 400 450
Au
g-10
Se
p-10
Oc
t-10
No
v-1
0
De
c-1
0
Jan-
11
Feb
-11
Mar
-11
Apr
-11
May
-11
Jun-
11
Jul-1
1
Au
g-11
Se
p-11
Oc
t-11
No
v-1
1
De
c-1
1
Jan-
12
Feb
-12
Mar
-12
Apr
-12
May
-12
Jun-
12
Jul-1
2
Au
g-12
Se
p-12
Oc
t-12
No
v-1
2
Mil
lio
n S
qu
are
Met
ers
Mil
lio
n S
qu
are
Met
ers
YTD Land Area Purchased Monthly Land Area Purchased
5,567
0%5%10%15%20%25%30%35%40%45%
-
1,000
2,000
3,000
4,000
5,000
6,000
Mil
lio
n S
qu
are
Me
ters
YTD Floor Space of Buildings Under Construction YoY Growth
For the exclusive use of MAURIZIO BESSONE at EURIZON CAPITAL SGR SPA on 26-Mar-2013

Asi
a-P
acif
ic O
il&
Gas
January 23, 2013
Neil Beveridge, Ph.D. (Senior Analyst) • [email protected] • +852-2918-5741
35
Exhibit 77China Cement Production
Source: CEIC, Bernstein analysis
As reported by CISA, crude steel production in December was 59.5 million tons, up 14% YoY – somewhat inflated due to the low production in December 2011 (Exhibit 78). 2012 ended with 710.6 million tons of crude steel production i.e. 3.8% growth, which is only slightly higher than the exceptionally low growth rate of 2.1% in 2008 when the financial crisis hit.
National Bureau of Statistics reports crude steel production based on provincially submitted data (rather than CISA's estimate from producers), and is showing a 3.1% YoY growth (based on 2012 crude steel production of 716.5 million tons), slightly lower than that reported by CISA.
Exhibit 78China Crude Steel Production
Source: CISA, Bernstein analysis
Crude steel production was low in 2012 because the steel prices came down significantly. From mid-September, due to the more positive economic news, we saw a moderate rebound of China HRC spot price, ending the year at RMB3,974 per ton (Exhibit 79). In particular, we note that the SHFE 3-month rebar future price rose steeply to RMB3,958 per ton, which is RMB316 per ton higher than the rebar spot price, indicating a more positive sentiment.
182
-20%-10%0%10%20%30%40%
0
50
100
150
200
250A
ug-1
0
Sep
-10
Oc
t-10
No
v-10
Dec
-10
Jan
-11
Feb
-11
Mar
-11
Ap
r-11
May
-11
Jun
-11
Jul-
11
Aug
-11
Sep
-11
Oc
t-11
No
v-11
Dec
-11
Jan
-12
Feb
-12
Mar
-12
Ap
r-12
May
-12
Jun
-12
Jul-
12
Aug
-12
Sep
-12
Oc
t-12
No
v-12
Dec
-12 Y
oY
Gro
wth
Mill
ion
ton
s
Cement Production YoY Growth
2012YoY Growth = 6.6%
60
-10%-5%0%5%10%15%20%
01020304050607080
Aug
-10
Sep
-10
Oc
t-10
No
v-10
Dec
-10
Jan
-11
Feb
-11
Ma
r-11
Ap
r-11
May
-11
Jun
-11
Jul-
11
Aug
-11
Sep
-11
Oc
t-11
No
v-11
Dec
-11
Jan
-12
Feb
-12
Ma
r-12
Ap
r-12
May
-12
Jun
-12
Jul-
12
Aug
-12
Sep
-12
Oc
t-12
No
v-12
Dec
-12 Y
oY
Gro
wth
Mil
lion
ton
s
Crude Steel Production YoY Growth
2012YoY Growth = 3.8%
For the exclusive use of MAURIZIO BESSONE at EURIZON CAPITAL SGR SPA on 26-Mar-2013

Asi
a-P
acif
ic O
il&
Gas
January 23, 2013
Neil Beveridge, Ph.D. (Senior Analyst) • [email protected] • +852-2918-5741
36
Exhibit 79China HRC Spot vs. China Rebar Spot vs. SHFE 3-Month Rebar Future
Source: Bloomberg, Antaike, SHFE, Bernstein analysis
As steel prices tumbled for the first 9 months of 2012, the raw material prices soon followed, though less sharply than steel prices. Tracking steel prices, we saw a moderate rebound for raw material prices from mid-September. Iron ore fines cfr China price rebounded in Q4 2012 and ended the year at US$129 per ton. A similar trend was seen in seaborne coking coal prices, which rebounded since mid-September to end the year at US$157 per ton (premium HCC Australia fob). Domestic Shanxi premium coking coal saw a similar rebound to US$209 per ton and continue to be priced above seaborne coking coal (Exhibit 80).
Exhibit 80China Domestic vs. Import Iron Ore and Coking Coal Spot
Source: Bloomberg, SBB, Antaike, Bernstein analysis
As a result of the rebound in steel prices in Q4, and the roughly one-quarter time lag of raw material price input into steelmakers' P&L, we saw the monthly profit of the ~80 large/medium steel manufacturers tracked by CISA recover to RMB3.3 billion in November (Exhibit 81). The first 11 months still record a loss of RMB1.97 billion, versus a profit of RMB85.3 billion for the same period in 2011.
3,642
3,974
3,958
3,200
3,400
3,600
3,800
4,000
4,200
5/16/2012 6/16/2012 7/16/2012 8/16/2012 9/16/2012 10/16/2012 11/16/2012 12/16/2012
RM
B p
er
ton
China Steel Rebar Spot China HRC Spot SHFE 3-M Rebar Future
129
157
209
50
100
150
200
250
300
350
US
$ p
er
ton
Iron Ore Fines Spot, CFR China (61.5% Fe) HCC Spot, FOB Australia Shanxi premium coking coal
For the exclusive use of MAURIZIO BESSONE at EURIZON CAPITAL SGR SPA on 26-Mar-2013

Asi
a-P
acif
ic O
il&
Gas
January 23, 2013
Neil Beveridge, Ph.D. (Senior Analyst) • [email protected] • +852-2918-5741
37
Exhibit 81Monthly Profit of ~80 Large and Medium Steel Manufacturers Tracked by China Iron and Steel Association
Source: CISA, Bernstein analysis
From March 2012 onwards, China steelmakers had been running down their steel inventory, though it was still at a higher level than the prior year until past September. Steel inventory across five major products (HRC, CRC, medium plate, rebar, wire rod) ended the year at 12.2 million tons, ~9% lower than the prior year (Exhibit 82).
Exhibit 82China Steel Inventory Across 5 Major Products (HRC, CRC, Medium Plates, Rebar, Wire Rod)
Source: Bloomberg, Steelhome, Bernstein analysis
Iron ore inventory stayed reasonably constant in the range of 97-100 million tons until October, when destocking started, and ended the year at 82.8 million tons (Exhibit 83). The recent rise in steel prices and relatively lower iron ore inventory have provided support to the recent iron ore price rally.
3.3
-5
0
5
10
15A
ug-1
0
Sep
-10
Oc
t-10
No
v-10
Dec
-10
Jan
-11
Feb
-11
Ma
r-11
Ap
r-11
May
-11
Jun
-11
Jul-
11
Aug
-11
Sep
-11
Oc
t-11
No
v-11
Dec
-11
Jan
-12
Feb
-12
Ma
r-12
Ap
r-12
May
-12
Jun
-12
Jul-
12
Aug
-12
Sep
-12
Oc
t-12
No
v-12
RM
B b
illio
n
L&M Steel Monthly Profit
2012 YTDYoY Change = -102.3%
-15%-10%-5%0%5%10%15%20%25%
10 11 12 13 14 15 16 17 18 19 20
Mil
lio
n t
on
s
Steel Inventory (5 Major Products) YoY Growth
For the exclusive use of MAURIZIO BESSONE at EURIZON CAPITAL SGR SPA on 26-Mar-2013

Asi
a-P
acif
ic O
il&
Gas
January 23, 2013
Neil Beveridge, Ph.D. (Senior Analyst) • [email protected] • +852-2918-5741
38
Exhibit 83China Steel Inventory and Iron Ore Inventory
Source: Bloomberg, Steelhome, Bernstein analysis
Aluminum LME price saw a rebound in mid-September to almost US$2,200 per ton with positive economic news, which did not sustain, and subsequently a second rebound in mid-November, again on economic news, ending the year at US$2,040 per ton, which is close to where the year started (Exhibit 84).
Exhibit 84LME Price
Source: Bloomberg, LME, Bernstein analysis
Alumina price was less volatile than LME price, and only saw a moderate increase to US$331 per ton by the end of 2012 (Exhibit 85). Alumina price as a percentage of LME price averaged 15.9% for 2012, which is above what we would see as the more "normal" range of 13-15%, driven by the steep decline of LME during the first half of the year whilst alumina price fell less sharply.
82.8 80828486889092949698100
10 11 12 13 14 15 16 17 18 19 20
Mil
lio
n to
ns
Mil
lio
n t
on
s
Steel Inventory (5 Major Products) Iron Ore Total Ports Inventory
2,177
2,040
1,000
1,500
2,000
2,500
3,000
US
$ p
er t
on
LME Primary Aluminum
For the exclusive use of MAURIZIO BESSONE at EURIZON CAPITAL SGR SPA on 26-Mar-2013

Asi
a-P
acif
ic O
il&
Gas
January 23, 2013
Neil Beveridge, Ph.D. (Senior Analyst) • [email protected] • +852-2918-5741
39
For the entire 2012, the SHFE-LME arbitrage was technically closed i.e. SHFE remained at a higher level than LME, which is unfavorable for China aluminum exports (Exhibit 86). The average SHFE-LME differential was RMB467 per ton for 2012, with the year finishing lower as LME started rising, at a differential of RMB387 per ton. However, we should take into account the fact that some producers are realizing LME plus physical premium, the latter being in excess of US$230 per ton (Exhibit 89), hence in effect the SHFE-(LME+physical premium) arbitrage is open at least for some players.
Exhibit 86Primary Aluminum LME vs. SHFE Price
Source: Bloomberg, LME, SHFE, Bernstein analysis
Aluminum inventory continues to be a closely watched data point. Total world reported stocks stood at 8.02 million tons as of October, a 15% YoY increase (Exhibit 87). Of this, 5.07 million tons are stocks in LME warehouses, with ~54% attributable to the Detroit and Vlissingen warehouses. These warehouses have seen a 22% and 83% YoY increase in stock level, as they account for the bulk of the stocks tied in financing deals.
1,500 1,700 1,900 2,100 2,300 2,500 2,700 2,900 3,100
(300)(200)(100)
-100 200 300 400 500 600 700
8/1/
2010
9/1/
2010
10/1
/201
0
11/1
/201
0
12/1
/201
0
1/1/
2011
2/1/
2011
3/1/
2011
4/1/
2011
5/1/
2011
6/1/
2011
7/1/
2011
8/1/
2011
9/1/
2011
10/1
/201
1
11/1
/201
1
12/1
/201
1
1/1/
2012
2/1/
2012
3/1/
2012
4/1/
2012
5/1/
2012
6/1/
2012
7/1/
2012
8/1/
2012
9/1/
2012
10/1
/201
2
11/1
/201
2
12/1
/201
2
1/1/
2013
RM
B p
er t
on
RM
B p
er t
on
SHFE - LME Arbitrage LME Primary Aluminum SHFE Primary Aluminum
Exhibit 85Alumina FOB Australia Price and as % of LME
Source: Bloomberg, Metal Bulletin, Bernstein analysis
331 13.0%
14.0%
15.0%
16.0%
17.0%
18.0%
300
320
340
360
380
400
420
440
US
$ p
er to
n
Alumina FOB Australia AU Alumina as % of LME
For the exclusive use of MAURIZIO BESSONE at EURIZON CAPITAL SGR SPA on 26-Mar-2013

Asi
a-P
acif
ic O
il&
Gas
January 23, 2013
Neil Beveridge, Ph.D. (Senior Analyst) • [email protected] • +852-2918-5741
40
Exhibit 87Primary Aluminum Stocks Breakdown
Source: CRU, Bernstein analysis
The 5 million tons of LME warehouse stocks have stayed pretty constant ever since they got built up during the 2008/09 financial crisis – not a surprise, given the low interest rate environment has persisted, and so has the metal contango (Exhibit 88). As a result of the high level of LME stocks, there continues to be physical tightness in the market for this fast-growing metal, leading to historically high physical premiums, reaching US$237 per ton for US Midwest and US$274 per ton for Rotterdam in Q3 (Exhibit 89). The physical premiums are likely to remain at a high level into 2013.
Exhibit 88Primary Aluminum Inventory Stocks
Exhibit 89Physical Premiums in US Midwest and Rotterdam DP
Source: CRU, Bernstein analysis Source: CRU, Bernstein analysis
Part 6 - Share Price Performance by Sector
We summarize key metrics for Chinese energy and commodity stocks under Bernstein coverage in Exhibit 90. Within China's energy sector, last 4 weeks' momentum was in favor of renewable companies, steel and aluminum producer due to positive market sentiments from China recovery (Exhibit 91). Gas distributors, power companies and oil services outperformed regional index over the last 12 months while steel and coal companies underperformed (Exhibit 92). Natural gas continues to be the fastest growing component of China's energy complex. With slower electricity growth resulting in lower coal prices, power producers continue to outperform over coal names.
('000 tons) Jan-12 Feb-12 Mar-12 Apr-12 May-12 Jun-12 Jul-12 Aug-12 Sep-12 Oct-12 y-o-y
LME primary stocks
North America 2,185 2,238 2,217 2,189 2,124 2,074 2,037 1,968 2,129 2,008 -1%
of which Detroit 1,363 1,428 1,427 1,429 1,414 1,396 1,360 1,314 1,476 1,423 22%
Europe 1,858 1,910 1,948 1,936 1,940 1,958 2,097 2,208 2,232 2,389 46%
of which Vlissingen 941 999 1,042 1,031 1,039 1,070 1,199 1,269 1,265 1,302 83%
Asia 953 955 912 890 852 790 744 709 689 675 -24%
Total LME stocks 4,996 5,103 5,077 5,015 4,917 4,823 4,878 4,885 5,050 5,071 12%
Japan port stocks 278 265 245 235 225 233 235 261 274 258 9%
Reported stocks China 1,073 1,248 1,271 1,195 1,118 1,104 1,180 1,265 1,291 1,410 81%
Total world reported stocks 7,840 8,040 7,984 7,897 7,691 7,485 7,649 7,739 7,901 8,019 15%
-1,000 2,000 3,000 4,000 5,000 6,000 7,000 8,000
'000
ton
s
LME stocks
World Excluding China Reported Stocks + SHFE Stocks
237
274
-
50
100
150
200
250
300
US
$ p
er to
n
US Midwest Rotterdam DP
For the exclusive use of MAURIZIO BESSONE at EURIZON CAPITAL SGR SPA on 26-Mar-2013

Asi
a-P
acif
ic O
il&
Gas
January 23, 2013
Neil Beveridge, Ph.D. (Senior Analyst) • [email protected] • +852-2918-5741
41
Exhibit 90Chinese energy and commodity companies under Bernstein coverage
Source: Bloomberg, Bernstein analysis
Company Ticker Curcy Mkt Cap P/E P/B Price Price Price 4W 12M USD$Bn 2013 2013 1/18/13 12/21/12 12/22/11 % %
Integrated Oil 1017% 991% 1021% 3% 0%PetroChina 857 HK Equity HKD 264.5 11.5 1.4 11.1 11.1 11.3 1% -2%Sinopec 386 HK Equity HKD 97.1 8.7 1.1 9.2 8.8 9.1 5% 1%E&P 1638% 1678% 1546% -2% 6%CNOOC 883 HK Equity HKD 94.3 9.1 1.6 16.4 16.8 15.5 -2% 6%Coal 1828% 1813% 2121% 1% -14%China Shenhua 1088 HK Equity HKD 79.8 10.4 1.8 32.7 33.7 35.0 -3% -7%China Coal Energy 1898 HK Equity HKD 16.2 10.1 1.0 8.7 8.2 9.9 6% -13%Yanzhou Coal 1171 HK Equity HKD 12.1 13.1 1.1 13.5 12.5 18.8 8% -28%Power 1005% 962% 738% 4% 36%Datang 991 HK Equity HKD 8.1 8.3 0.8 3.1 2.9 2.6 6% 21%Huaneng 902 HK Equity HKD 14.5 9.9 1.3 7.1 7.0 4.6 1% 54%CR Power 836 HK Equity HKD 12.3 11.3 1.6 20.0 18.9 15.0 6% 33%Gas Distributor 2432% 2352% 1707% 3% 42%HK&C Gas 3 HK Equity HKD 23.9 24.3 3.8 21.3 21.0 16.4 2% 30%Kunlun Energy 135 HK Equity HKD 17.3 15.7 2.6 16.7 16.1 12.4 4% 35%ENN Energy 2688 HK Equity HKD 4.9 16.1 2.9 35.0 33.5 22.5 4% 55%Renewable 314% 246% 301% 27% 4%China Longyuan 916 HK Equity HKD 6.7 13.2 1.2 6.5 5.2 5.9 23% 10%Datang Renewable 1798 HK Equity HKD 1.2 10.8 0.7 1.2 0.9 1.3 36% -2%Huaneng Renewables958 HK Equity HKD 1.9 11.3 0.9 1.7 1.2 1.9 39% -9%Steel 434% 393% 480% 10% -9%Angang 347 HK Equity HKD 4.9 78.1 0.7 6.1 5.5 6.6 10% -8%Maanshan 323 HK Equity HKD 2.7 -54.0 0.7 2.6 2.3 3.0 11% -13%Aluminium 397% 348% 402% 14% -1%Chalco 2600 HK Equity HKD 10.1 -16.9 0.9 4.0 3.5 4.0 14% -1%Oil Services 1596% 1610% 1250% -1% 28%COSL 2883 HK Equity HKD 11.0 10.8 1.6 16.0 16.1 12.5 -1% 28%IndiciesMXAPJ MXAPJ Index USD 6,959.0 10.4 1.4 480 462 420 4% 14%HSI HSI Index HKD 1,777.3 9.4 1.2 23,602 22,506 19,943 5% 18%MXJP MXJP Index JPY 2,917.0 11.6 1.0 564 514 454 10% 24%ASX 300 AS52 Index AUD 1,389.1 11.4 1.6 4,750 4,601 4,212 3% 13%SENSEX Index SENSEX Index INR 614.0 12.5 2.0 20,039 19,242 16,644 4% 20%PriceBrent EUCRBRDT Index US$/bbl 113 110 111 3% 2%Qinhuangdao Coal na RMB/ton 625 630 820 -1% -24%SHFE Aluminum MBALAL28 Index RMB/ton 15,070 15,090 16,185 0% -7%Steel Rebar CDSPDRAV Index RMB/ton 3,730 3,623 4,226 3% -12%Hot Rolled Steel CDSPHRAV Index RMB/ton 4,063 3,944 4,223 3% -4%
For the exclusive use of MAURIZIO BESSONE at EURIZON CAPITAL SGR SPA on 26-Mar-2013

Asi
a-P
acif
ic O
il&
Gas
January 23, 2013
Neil Beveridge, Ph.D. (Senior Analyst) • [email protected] • +852-2918-5741
42
Exhibit 91Last 4 weeks performance by sector
Source: Bloomberg, Bernstein analysis
Exhibit 92Last 12 months performance by sector
Source: Bloomberg, Bernstein analysis
27%
14%
10%
4% 3% 3%1%
-1%-2%
5% 4% 3% 3% 3%
0% -1%-5%
0%
5%
10%
15%
20%
25%
30%
Ren
ewab
le
Alu
min
ium
Ste
el
Po
wer
Gas
Dis
trib
utor
Inte
gra
ted
Oil
Co
al
Oil
Ser
vice
s
E&
P
HS
I
MX
AP
J
Ho
t Ro
lled
Ste
el
Ste
el R
ebar
Bre
nt
SH
FE
Alu
min
um
Qin
hua
ngda
o C
oal
Las
t 4 w
eeks
per
form
ance
42%36%
28%
6% 4%
0% -1%
-9%-14%
18%14%
2%
-4%-7%
-12%
-24%-30%
-20%
-10%
0%
10%
20%
30%
40%
50%
Ga
s D
istr
ibut
or
Po
wer
Oil
Ser
vic
es
E&
P
Ren
ewa
ble
Inte
gra
ted
Oil
Alu
min
ium
Ste
el
Co
al
HS
I
MX
AP
J
Bre
nt
Ho
t Ro
lled
Ste
el
SH
FE
Alu
min
um
Ste
el R
ebar
Qin
hua
ngda
o C
oal
Las
t 12
mo
nth
s p
erfo
rman
ce
For the exclusive use of MAURIZIO BESSONE at EURIZON CAPITAL SGR SPA on 26-Mar-2013
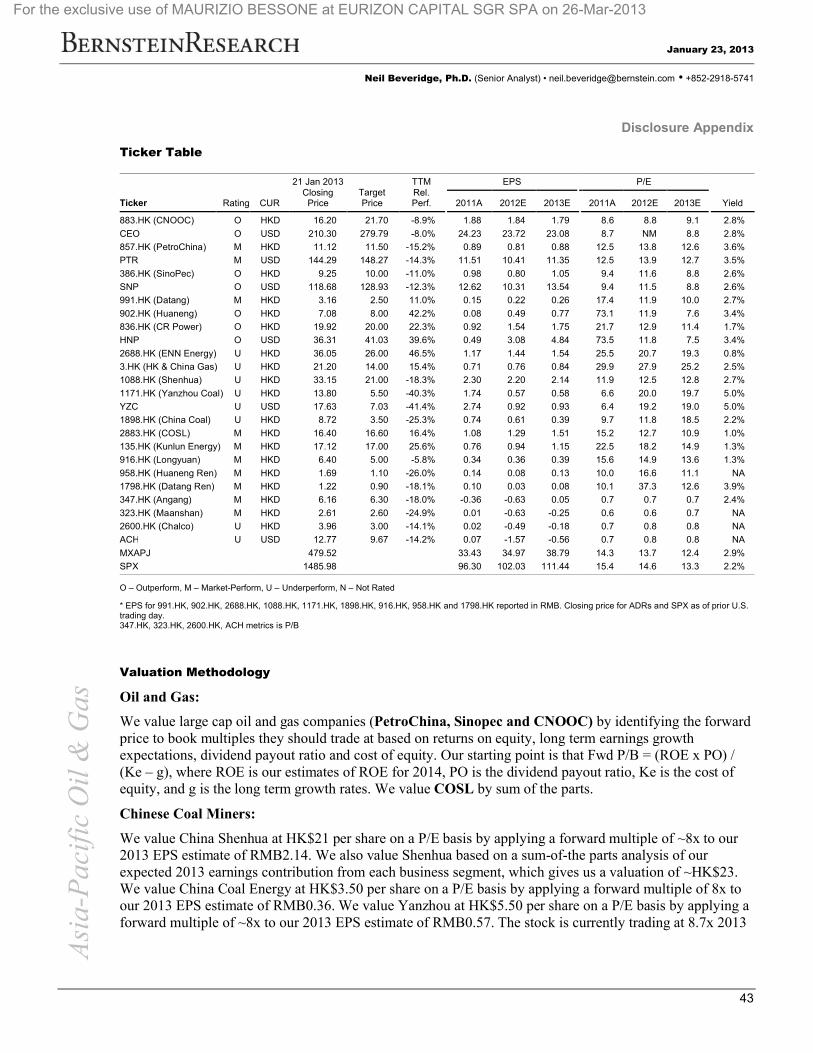
Asi
a-P
acif
ic O
il&
Gas
January 23, 2013
Neil Beveridge, Ph.D. (Senior Analyst) • [email protected] • +852-2918-5741
43
Disclosure Appendix
Ticker Table
Ticker Rating CUR
21 Jan 2013ClosingPrice
TargetPrice
TTMRel.Perf.
EPS P/E
2011A 2012E 2013E 2011A 2012E 2013E Yield
883.HK (CNOOC) O HKD 16.20 21.70 -8.9% 1.88 1.84 1.79 8.6 8.8 9.1 2.8%
CEO O USD 210.30 279.79 -8.0% 24.23 23.72 23.08 8.7 NM 8.8 2.8%
857.HK (PetroChina) M HKD 11.12 11.50 -15.2% 0.89 0.81 0.88 12.5 13.8 12.6 3.6%
PTR M USD 144.29 148.27 -14.3% 11.51 10.41 11.35 12.5 13.9 12.7 3.5%
386.HK (SinoPec) O HKD 9.25 10.00 -11.0% 0.98 0.80 1.05 9.4 11.6 8.8 2.6%
SNP O USD 118.68 128.93 -12.3% 12.62 10.31 13.54 9.4 11.5 8.8 2.6%
991.HK (Datang) M HKD 3.16 2.50 11.0% 0.15 0.22 0.26 17.4 11.9 10.0 2.7%
902.HK (Huaneng) O HKD 7.08 8.00 42.2% 0.08 0.49 0.77 73.1 11.9 7.6 3.4%
836.HK (CR Power) O HKD 19.92 20.00 22.3% 0.92 1.54 1.75 21.7 12.9 11.4 1.7%
HNP O USD 36.31 41.03 39.6% 0.49 3.08 4.84 73.5 11.8 7.5 3.4%
2688.HK (ENN Energy) U HKD 36.05 26.00 46.5% 1.17 1.44 1.54 25.5 20.7 19.3 0.8%
3.HK (HK & China Gas) U HKD 21.20 14.00 15.4% 0.71 0.76 0.84 29.9 27.9 25.2 2.5%
1088.HK (Shenhua) U HKD 33.15 21.00 -18.3% 2.30 2.20 2.14 11.9 12.5 12.8 2.7%
1171.HK (Yanzhou Coal) U HKD 13.80 5.50 -40.3% 1.74 0.57 0.58 6.6 20.0 19.7 5.0%
YZC U USD 17.63 7.03 -41.4% 2.74 0.92 0.93 6.4 19.2 19.0 5.0%
1898.HK (China Coal) U HKD 8.72 3.50 -25.3% 0.74 0.61 0.39 9.7 11.8 18.5 2.2%
2883.HK (COSL) M HKD 16.40 16.60 16.4% 1.08 1.29 1.51 15.2 12.7 10.9 1.0%
135.HK (Kunlun Energy) M HKD 17.12 17.00 25.6% 0.76 0.94 1.15 22.5 18.2 14.9 1.3%
916.HK (Longyuan) M HKD 6.40 5.00 -5.8% 0.34 0.36 0.39 15.6 14.9 13.6 1.3%
958.HK (Huaneng Ren) M HKD 1.69 1.10 -26.0% 0.14 0.08 0.13 10.0 16.6 11.1 NA
1798.HK (Datang Ren) M HKD 1.22 0.90 -18.1% 0.10 0.03 0.08 10.1 37.3 12.6 3.9%
347.HK (Angang) M HKD 6.16 6.30 -18.0% -0.36 -0.63 0.05 0.7 0.7 0.7 2.4%
323.HK (Maanshan) M HKD 2.61 2.60 -24.9% 0.01 -0.63 -0.25 0.6 0.6 0.7 NA
2600.HK (Chalco) U HKD 3.96 3.00 -14.1% 0.02 -0.49 -0.18 0.7 0.8 0.8 NA
ACH U USD 12.77 9.67 -14.2% 0.07 -1.57 -0.56 0.7 0.8 0.8 NA
MXAPJ 479.52 33.43 34.97 38.79 14.3 13.7 12.4 2.9%
SPX 1485.98 96.30 102.03 111.44 15.4 14.6 13.3 2.2%
O – Outperform, M – Market-Perform, U – Underperform, N – Not Rated
* EPS for 991.HK, 902.HK, 2688.HK, 1088.HK, 1171.HK, 1898.HK, 916.HK, 958.HK and 1798.HK reported in RMB. Closing price for ADRs and SPX as of prior U.S. trading day.347.HK, 323.HK, 2600.HK, ACH metrics is P/B
Valuation Methodology
Oil and Gas:
We value large cap oil and gas companies (PetroChina, Sinopec and CNOOC) by identifying the forward price to book multiples they should trade at based on returns on equity, long term earnings growth expectations, dividend payout ratio and cost of equity. Our starting point is that Fwd P/B = (ROE x PO) / (Ke – g), where ROE is our estimates of ROE for 2014, PO is the dividend payout ratio, Ke is the cost of equity, and g is the long term growth rates. We value COSL by sum of the parts.
Chinese Coal Miners:
We value China Shenhua at HK$21 per share on a P/E basis by applying a forward multiple of ~8x to our 2013 EPS estimate of RMB2.14. We also value Shenhua based on a sum-of-the parts analysis of our expected 2013 earnings contribution from each business segment, which gives us a valuation of ~HK$23. We value China Coal Energy at HK$3.50 per share on a P/E basis by applying a forward multiple of 8x to our 2013 EPS estimate of RMB0.36. We value Yanzhou at HK$5.50 per share on a P/E basis by applying a forward multiple of ~8x to our 2013 EPS estimate of RMB0.57. The stock is currently trading at 8.7x 2013
For the exclusive use of MAURIZIO BESSONE at EURIZON CAPITAL SGR SPA on 26-Mar-2013
Asi
a-P
acif
ic O
il&
Gas
January 23, 2013
Neil Beveridge, Ph.D. (Senior Analyst) • [email protected] • +852-2918-5741
44
consensus earnings. Our valuation for YZC (the NYSE-listed ADR) multiplies Hong Kong valuation by 10.0 (the number of H-Shares each ADR represents) and divides by the current HK$ exchange rate.
Chinese IPPs:
Our valuation for Huaneng of HK$8.00 is based on the average between our P/E and P/B valuations – a P/E multiple of ~8x applied to our 2014E EPS estimate of RMB0.86, as well as a P/B of ~1.4x. Our valuation for HNP (the NYSE-listed ADR) multiplies of Hong Kong valuation by 40 (the number of H-Shares each ADR represents) and divides by the current HKD exchange rate. Our valuation for Datang of HK$2.50 is based on the average between our P/E and P/B Valuations – a P/E multiple of ~8x applied to our 2013E EPS estimate of RMB0.26, as well as a P/B of ~0.7x. Our valuation for CR Power of HK$20.00 is based on the average between our P/E and P/B valuations – a P/E multiple of ~11x applied to our 2014 EPS estimate of HK$1.84, as well as a P/B of ~1.6x..
Chinese Renewable Energy Operators:
We value China Longyuan at HK$5.00 by applying an average P/E ratio of ~10x to our 2013 EPS estimate of RMB 0.39/share. We value Datang Renewable at HK$0.90 by applying an average P/E ratio of ~9x to our 2013 EPS estimate of RMB 0.08/share. The stock is currently trading at ~7x 2013 consensus earnings and trading at a P/B of ~0.57x. We value Huaneng Renewables at HK$1.10 by applying an average P/E ratio of ~7x to our 2013 EPS estimate of RMB 0.13/share.
Chinese Gas Distributors:
Our valuation for Kunlun of HK$17 is based on our Sum of the Parts method. We value gas distribution pipeline assets at ~15x 2013E earnings and valued its E&P business based on a discounted cash flow analysis. We also assume ~HK$1.00 of value created from additional asset injections. Our valuation for ENN of HK$26.00 is a twelve-month target price based on a P/FE multiple of ~14x and our 2013 EPS estimate of RMB1.54. We value the Hong Kong gas business on a combination of discounted cash flow and dividend yield. We value the property business as reflected in the company's financial statements as this value is provided by a third party valuer and updated on a six-monthly basis. We value the company's 66.2% interest in Towngas China based on its current market value, as the company is publicly traded. We value the mainland non-Towngas China business based on EV/Gas Sales and P/B multiples, the new energy segment based on the total project investment value, and its water and midstream segment based on asset value.
Steel & Aluminum:
The steel and aluminum sectors have generally seen a decline in earnings and valuation in the last year, resulting in short term valuation multiples being significantly distorted.
For long term fundamentals in setting our 12–month price target, we prefer to value steel and aluminum companies based on a forward price-to-book multiple (P/B), as this is more stable than other multiples like EV/EBITDA or P/E, and more closely reflect the cyclicality of the steel industry. We pair P/B with our view on forecast ROE, and triangulate this with the discounted cash flow (DCF) method.
For near term dynamics, we review P/E multiples, and EV/EBITDA multiples as a proxy to P/E when EPS is negative.
We value Angang Steel Company Limited ("Angang") on a P/B basis by applying a forward multiple of ~0.75x to our 2014 book value of equity per share of RMB6.79.
We value Maanshan Iron & Steel ("Maanshan") on a P/B basis by applying a forward multiple of ~0.65x to our 2014 book value of equity per share of RMB3.20.
For the exclusive use of MAURIZIO BESSONE at EURIZON CAPITAL SGR SPA on 26-Mar-2013

Asi
a-P
acif
ic O
il&
Gas
January 23, 2013
Neil Beveridge, Ph.D. (Senior Analyst) • [email protected] • +852-2918-5741
45
We value Aluminum Corporation of China Limited ("Chalco") on a P/B basis by applying a forward multiple of ~0.6x to our 2014 book value of equity per share of RMB4.07.
Risks
Risks to energy and commodity stocks include economic conditions and commodity price swings. If the global, US or Chinese economies turn down significantly, global demand growth for commodities could decelerate, putting pressure on prices and thus on the cash flow of producers. Economic swings also affect refiners and utilities. Utility stocks could be further impacted by swings in demand for electric power. If demand drops, utilities could suffer.
For the exclusive use of MAURIZIO BESSONE at EURIZON CAPITAL SGR SPA on 26-Mar-2013

SRO REQUIRED DISCLOSURES
∑ References to "Bernstein" relate to Sanford C. Bernstein & Co., LLC, Sanford C. Bernstein Limited, Sanford C. Bernstein (Hong Kong) Limited, and Sanford C. Bernstein (business registration number 53193989L), a unit of AllianceBernstein (Singapore) Ltd. which is a licensed entity under the Securities and Futures Act and registered with Company Registration No. 199703364C, collectively.
∑ Bernstein analysts are compensated based on aggregate contributions to the research franchise as measured by account penetration, productivity and proactivity of investment ideas. No analysts are compensated based on performance in, or contributions to, generating investment banking revenues.
∑ Bernstein rates stocks based on forecasts of relative performance for the next 6-12 months versus the S&P 500 for stocks listed on the U.S. and Canadian exchanges, versus the MSCI Pan Europe Index for stocks listed on the European exchanges (except for Russian companies), versus the MSCI Emerging Markets Index for Russian companies and stocks listed on emerging markets exchanges outside of the Asia Pacific region, and versus the MSCI Asia Pacific ex-Japan Index for stocks listed on the Asian (ex-Japan) exchanges - unless otherwise specified. We have three categories of ratings:
Outperform: Stock will outpace the market index by more than 15 pp in the year ahead.
Market-Perform: Stock will perform in line with the market index to within +/-15 pp in the year ahead.
Underperform: Stock will trail the performance of the market index by more than 15 pp in the year ahead.
Not Rated: The stock Rating, Target Price and estimates (if any) have been suspended temporarily.
∑ As of 01/16/2013, Bernstein's ratings were distributed as follows: Outperform - 39.3% (0.5% banking clients) ; Market-Perform - 48.9% (0.4% banking clients); Underperform - 11.8% (0.0% banking clients); Not Rated - 0.0% (0.0% banking clients). The numbers in parentheses represent the percentage of companies in each category to whom Bernstein provided investment banking services within the last twelve (12) months.
∑ Neil Beveridge maintains a long position in BP PLC (BP).
∑ Accounts over which Bernstein and/or their affiliates exercise investment discretion own more than 1% of the outstanding common stock of the following companies 386.HK / China Petroleum & Chemical Corp.
∑ This research publication covers six or more companies. For price chart disclosures, please visit www.bernsteinresearch.com, you can also write to either: Sanford C. Bernstein & Co. LLC, Director of Compliance, 1345 Avenue of the Americas, New York, N.Y. 10105 or Sanford C. Bernstein Limited, Director of Compliance, 50 Berkeley Street, London W1J 8SB, United Kingdom; or Sanford C. Bernstein (Hong Kong) Limited, Director of Compliance, Suites 3206-11, 32/F, One International Finance Centre, 1 Harbour View Street, Central, Hong Kong, or Sanford C. Bernstein (business registration number 53193989L) , a unit of AllianceBernstein (Singapore) Ltd. which is a licensed entity under the Securities and Futures Act and registered with Company Registration No. 199703364C, Director of Compliance,30 Cecil Street, #28-01 Prudential Tower, Singapore 049712.
12-Month Rating History as of 01/21/2013
Ticker Rating Changes
1088.HK U (RC) 12/14/11
1171.HK U (RC) 12/14/11
135.HK M (RC) 12/10/12 O (RC) 09/17/12 M (IC) 06/23/10
1798.HK M (RC) 05/22/12 O (IC) 04/19/11
1898.HK U (RC) 06/13/12 M (IC) 10/25/11
2600.HK U (IC) 09/18/12
2688.HK U (RC) 09/17/12 M (RC) 01/05/12
2883.HK M (RC) 01/08/13 O (RC) 04/17/12 M (IC) 11/29/11
3.HK U (IC) 06/23/10
323.HK M (RC) 01/11/13 U (IC) 09/18/12
347.HK M (IC) 09/18/12
386.HK O (RC) 10/05/12 M (RC) 03/09/12 O (RC) 08/23/11
836.HK O (RC) 03/03/11
857.HK M (RC) 04/20/11
883.HK O (RC) 12/01/11
902.HK O (IC) 06/23/10
916.HK M (RC) 05/22/12 O (IC) 04/19/11
958.HK M (RC) 05/22/12 O (IC) 06/16/11
991.HK M (RC) 03/03/11
ACH U (IC) 09/18/12
CEO O (RC) 12/01/11
HNP O (IC) 06/23/10
PTR M (RC) 04/20/11
SNP O (RC) 10/05/12 M (RC) 03/09/12 O (RC) 08/23/11
YZC U (RC) 12/14/11
For the exclusive use of MAURIZIO BESSONE at EURIZON CAPITAL SGR SPA on 26-Mar-2013

Rating Guide: O - Outperform, M - Market-Perform, U - Underperform, N - Not Rated
Rating Actions: IC - Initiated Coverage, DC - Dropped Coverage, RC - Rating Change
OTHER DISCLOSURES
A price movement of a security which may be temporary will not necessarily trigger a recommendation change. Bernstein will advise as and when coverage of securities commences and ceases. Bernstein has no policy or standard as to the frequency of any updates or changes to its coverage policies. Although the definition and application of these methods are based on generally accepted industry practices and models, please note that there is a range of reasonable variations within these models. The application of models typically depends on forecasts of a range of economic variables, which may include, but not limited to, interest rates, exchange rates, earnings, cash flows and risk factors that are subject to uncertainty and also may change over time. Any valuation is dependent upon the subjective opinion of the analysts carrying out this valuation.
This document may not be passed on to any person in the United Kingdom (i) who is a retail client (ii) unless that person or entity qualifies as an authorised person or exempt person within the meaning of section 19 of the UK Financial Services and Markets Act 2000 (the "Act"), or qualifies as a person to whom the financial promotion restriction imposed by the Act does not apply by virtue of the Financial Services and Markets Act 2000 (Financial Promotion) Order 2005, or is a person classified as an "professional client" for the purposes of the Conduct of Business Rules of the Financial Services Authority.
To our readers in the United States: Sanford C. Bernstein & Co., LLC is distributing this publication in the United States and accepts responsibility for its contents. Any U.S. person receiving this publication and wishing to effect securities transactions in any security discussed herein should do so only through Sanford C. Bernstein & Co., LLC.
To our readers in the United Kingdom: This publication has been issued or approved for issue in the United Kingdom by Sanford C. Bernstein Limited, authorised and regulated by the Financial Services Authority and located at 50 Berkeley Street, London W1J 8SB, +44 (0)20-7170-5000.
To our readers in member states of the EEA: This publication is being distributed in the EEA by Sanford C. Bernstein Limited, which is authorised and regulated in the United Kingdom by the Financial Services Authority and holds a passport under the Markets in Financial Instruments Directive.
To our readers in Hong Kong: This publication is being distributed in Hong Kong by Sanford C. Bernstein (Hong Kong) Limited which is licensed and regulated by the Hong Kong Securities and Futures Commission (Central Entity No. AXC846). This publication is solely for professional investors only, as defined in the Securities and Futures Ordinance (Cap. 571).
To our readers in Singapore: This publication is being distributed in Singapore by Sanford C. Bernstein, a unit of AllianceBernstein (Singapore) Ltd., only to accredited investors or institutional investors, as defined in the Securities and Futures Act (Chapter 289). Recipients in Singapore should contact AllianceBernstein (Singapore) Ltd. in respect of matters arising from, or in connection with, this publication. AllianceBernstein (Singapore) Ltd. is a licensed entity under the Securities and Futures Act and registered with Company Registration No. 199703364C. It is regulated by the Monetary Authority of Singapore and located at 30 Cecil Street, #28-01 Prudential Tower, Singapore 049712, +65-62304600. The business name "Sanford C. Bernstein" is registered under business registration number 53193989L.
To our readers in Australia: Sanford C. Bernstein & Co., LLC, Sanford C. Bernstein Limited and Sanford C. Bernstein (Hong Kong) Limited are exempt from the requirement to hold an Australian financial services licence under the Corporations Act 2001 in respect of the provision of the following financial services to wholesale clients:
∑ providing financial product advice;
∑ dealing in a financial product;
∑ making a market for a financial product; and
∑ providing a custodial or depository service.
Sanford C. Bernstein & Co., LLC., Sanford C. Bernstein Limited, Sanford C. Bernstein (Hong Kong) Limited and AllianceBernstein (Singapore) Ltd. are regulated by, respectively, the Securities and Exchange Commission under U.S. laws, by the Financial Services Authority under U.K. laws, by the Hong Kong Securities and Futures Commission under Hong Kong laws, and by the Monetary Authority of Singapore under Singapore laws, all of which differ from Australian laws.
One or more of the officers, directors, or employees of Sanford C. Bernstein & Co., LLC, Sanford C. Bernstein Limited, Sanford C. Bernstein (Hong Kong) Limited, Sanford C. Bernstein (business registration number 53193989L) , a unit of AllianceBernstein (Singapore) Ltd. which is a licensed entity under the Securities and Futures Act and registered with Company Registration No. 199703364C, and/or their affiliates may at any time hold, increase or decrease positions in securities of any company mentioned herein.
Bernstein or its affiliates may provide investment management or other services to the pension or profit sharing plans, or employees of any company mentioned herein, and may give advice to others as to investments in such companies. These entities may effect transactions that are similar to or different from those recommended herein.
For the exclusive use of MAURIZIO BESSONE at EURIZON CAPITAL SGR SPA on 26-Mar-2013

Bernstein Research Publications are disseminated to our customers through posting on the firm's password protected website, www.bernsteinresearch.com. Additionally, Bernstein Research Publications are available through email, postal mail and commercial research portals. If you wish to alter your current distribution method, please contact your salesperson for details.
Bernstein and/or its affiliates do and seek to do business with companies covered in its research publications. As a result, investors should be aware that Bernstein and/or its affiliates may have a conflict of interest that could affect the objectivity of this publication. Investors should consider this publication as only a single factor in making their investment decisions.
This publication has been published and distributed in accordance with Bernstein's policy for management of conflicts of interest in investment research, a copy of which is available from Sanford C. Bernstein & Co., LLC, Director of Compliance, 1345 Avenue of the Americas, New York, N.Y. 10105, Sanford C. Bernstein Limited, Director of Compliance, 50 Berkeley Street, London W1J 8SB, United Kingdom, or Sanford C. Bernstein (Hong Kong) Limited, Director of Compliance, Suites 3206-11, 32/F, One International Finance Centre, 1 Harbour View Street, Central, Hong Kong, or Sanford C. Bernstein (business registration number 53193989L) , a unit of AllianceBernstein (Singapore) Ltd. which is a licensed entity under the Securities and Futures Act and registered with Company Registration No. 199703364C, Director of Compliance, 30 Cecil Street, #28-01 Prudential Tower, Singapore 049712. Additional disclosures and information regarding Bernstein's business are available on our website www.bernsteinresearch.com.
CERTIFICATIONS
∑ I/(we), Neil Beveridge, Ph.D., Vanessa Lau, Michael W. Parker, Mike Werner, Senior Analyst(s)/Analyst(s), certify that all of the views expressed in this publication accurately reflect my/(our) personal views about any and all of the subject securities or issuers and that no part of my/(our) compensation was, is, or will be, directly or indirectly, related to the specific recommendations or views in this publication.
Approved By: CDK
Copyright 2013, Sanford C. Bernstein & Co., LLC, Sanford C. Bernstein Limited, Sanford C. Bernstein (Hong Kong) Limited, and AllianceBernstein (Singapore) Ltd., subsidiaries of AllianceBernstein L.P. ~1345 Avenue of the Americas ~ NY, NY 10105 ~212/756-4400. All rights reserved.
This publication is not directed to, or intended for distribution to or use by, any person or entity who is a citizen or resident of, or located in any locality, state, country or other jurisdiction where such distribution, publication, availability or use would be contrary to law or regulation or which would subject Bernstein or any of their subsidiaries or affiliates to any registration or licensing requirement within such jurisdiction. This publication is based upon public sources we believe to be reliable, but no representation is made by us that the publication is accurate or complete. We do not undertake to advise you of any change in the reported information or in the opinions herein. This publication was prepared and issued by Bernstein for distribution to eligible counterparties or professional clients. This publication is not an offer to buy or sell any security, and it does not constitute investment, legal or tax advice. The investments referred to herein may not be suitable for you. Investors must make their own investment decisions in consultation with their professional advisors in light of their specific circumstances. The value of investments may fluctuate, and investments that are denominated in foreign currencies may fluctuate in value as a result of exposure to exchange rate movements. Information about past performance of an investment is not necessarily a guide to, indicator of, or assurance of, future performance.
For the exclusive use of MAURIZIO BESSONE at EURIZON CAPITAL SGR SPA on 26-Mar-2013
Related Documents