Please refer to the important disclosures and analyst certification on inside back cover of this document, or on our website www.macquarie.com/disclosures. CHINA Great Wall’s new H7 turned heads The Japanese OEMs featured concept cars designed for China Toyota’s Yundong Shuangqing II hybrid Honda’s Concept M Nissan’s Friend-Me hybrid Macquarie Research, April 2013 Analyst(s) Janet Lewis, CFA +852 3922 5417 [email protected] Zhixuan Lin +86 21 2412 9006 [email protected] Aaron Qi +852 3922 4854 [email protected] 24 April 2013 Macquarie Capital Securities Limited China Autos Shanghai Auto Show – down to earth An air of practicality prevails in Shanghai The usual bevy of slim women in polyester evening dresses draped the cars at the Shanghai Auto Show and throngs of people crowded the ultra-luxury displays, but the focus of new models was more utilitarian than in past years. Space-age electric vehicles (EVs) have been mainly replaced with more promising – and car-like – hybrids (HEV) and plug-in hybrids (PHEV). Many new car models sported fuel-efficient turbo engines, signalling a renewed focus on fuel economy. The star of the show was Great Wall Motor, which showed it can continue to produce attractive and ever-improved new product. It played to its strengths in SUVs with what appeared to be a production model of the H2 urban SUV, due to be launched mid-year, and unveiled the new H7 prototype and a newer version of the H8, both positioned above the hugely popular H6 SUV. Japanese OEMs also demonstrated their commitment to rebuild lost market share with production models of compact and sub-compact cars due to be launched later this year. Each of the big three displayed prototypes of designed-in-China concept vehicles to be launched in coming years. Each one also showed off their advanced new energy vehicles (NEV), underlining Japan’s technological advantage in NEVs. Two trends – turbo engines and hybrids Focus on fuel economy: The ongoing pressure to lift fuel economy and emissions has led to the growing popularity of turbo engines. Many automakers featured models equipped with new turbo power plants. See our recent note China Auto – Turbo engines boost margins (16 April 2013). From EV to hybrid: At past auto shows virtually every OEM had the requisite EV on display. This year EVs were more scarce, as the failure of EVs to sell (just over 12k sold in China in 2012) has led to a renewed focus on cheaper alternatives. Many auto makers had hybrids on display along with a few plug- in hybrids, lending credence to expectations that the government may include hybrids in the definition of NEVs in the future and provide increased subsidies. Outlook Initial reaction in the stock market to the auto show was generally strong on Monday April 22, but most automakers gave back these gains on Tuesday. The exception is Great Wall Motor, which surged 15% on Monday followed by a further 1% gain Tuesday. We recently upgraded Great Wall to Outperform (Great Wall Motor – 2013 profit growth under-estimated , 16 April 2013), but the shares have already surged over 20% to hit our target price. We would look to buy on weakness, and note that the new product at the Auto Show provides further upside to our forecasts. Our top picks in the sector remain Brilliance China Automotive, which is benefiting from strong demand for locally made BMW, supported by rapid expansion of the BMW dealer network, and Dongfeng Motor, which is seeing strong demand for PSA Peugeot Citroën products and a recovery in Japanese brands Nissan and Honda; commercial vehicles should recover in 2H. [email protected] FIRST LAST 04/27/13 11:16:54 AM Hong Kong Highpower

Welcome message from author
This document is posted to help you gain knowledge. Please leave a comment to let me know what you think about it! Share it to your friends and learn new things together.
Transcript
Please refer to the important disclosures and analyst certification on inside back cover of this document, or on our
website www.macquarie.com/disclosures.
CHINA
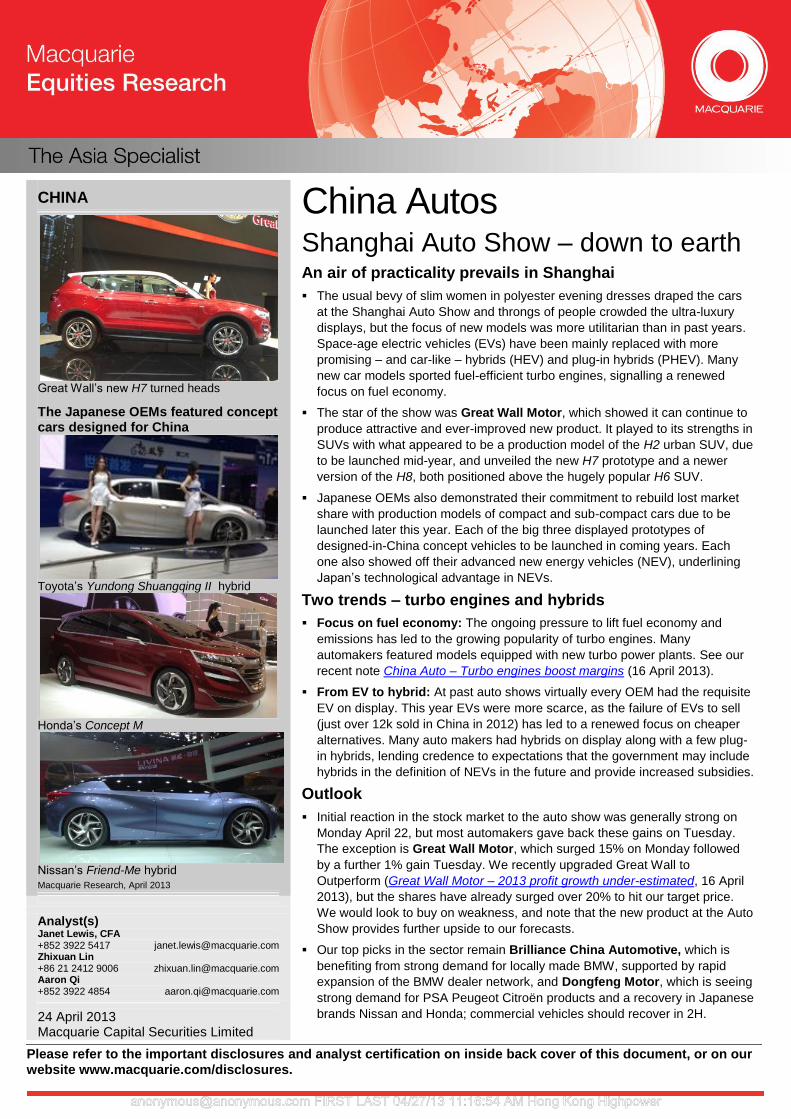
Great Wall’s new H7 turned heads
The Japanese OEMs featured concept cars designed for China
Toyota’s Yundong Shuangqing II hybrid
Honda’s Concept M
Nissan’s Friend-Me hybrid
Macquarie Research, April 2013
Analyst(s) Janet Lewis, CFA +852 3922 5417 [email protected] Zhixuan Lin +86 21 2412 9006 [email protected] Aaron Qi +852 3922 4854 [email protected]
24 April 2013 Macquarie Capital Securities Limited
China Autos Shanghai Auto Show – down to earth An air of practicality prevails in Shanghai
The usual bevy of slim women in polyester evening dresses draped the cars
at the Shanghai Auto Show and throngs of people crowded the ultra-luxury
displays, but the focus of new models was more utilitarian than in past years.
Space-age electric vehicles (EVs) have been mainly replaced with more
promising – and car-like – hybrids (HEV) and plug-in hybrids (PHEV). Many
new car models sported fuel-efficient turbo engines, signalling a renewed
focus on fuel economy.
The star of the show was Great Wall Motor, which showed it can continue to
produce attractive and ever-improved new product. It played to its strengths in
SUVs with what appeared to be a production model of the H2 urban SUV, due
to be launched mid-year, and unveiled the new H7 prototype and a newer
version of the H8, both positioned above the hugely popular H6 SUV.
Japanese OEMs also demonstrated their commitment to rebuild lost market
share with production models of compact and sub-compact cars due to be
launched later this year. Each of the big three displayed prototypes of
designed-in-China concept vehicles to be launched in coming years. Each
one also showed off their advanced new energy vehicles (NEV), underlining
Japan’s technological advantage in NEVs.
Two trends – turbo engines and hybrids
Focus on fuel economy: The ongoing pressure to lift fuel economy and
emissions has led to the growing popularity of turbo engines. Many
automakers featured models equipped with new turbo power plants. See our
recent note China Auto – Turbo engines boost margins (16 April 2013).
From EV to hybrid: At past auto shows virtually every OEM had the requisite
EV on display. This year EVs were more scarce, as the failure of EVs to sell
(just over 12k sold in China in 2012) has led to a renewed focus on cheaper
alternatives. Many auto makers had hybrids on display along with a few plug-
in hybrids, lending credence to expectations that the government may include
hybrids in the definition of NEVs in the future and provide increased subsidies.
Outlook
Initial reaction in the stock market to the auto show was generally strong on
Monday April 22, but most automakers gave back these gains on Tuesday.
The exception is Great Wall Motor, which surged 15% on Monday followed
by a further 1% gain Tuesday. We recently upgraded Great Wall to
Outperform (Great Wall Motor – 2013 profit growth under-estimated, 16 April
2013), but the shares have already surged over 20% to hit our target price.
We would look to buy on weakness, and note that the new product at the Auto
Show provides further upside to our forecasts.
Our top picks in the sector remain Brilliance China Automotive, which is
benefiting from strong demand for locally made BMW, supported by rapid
expansion of the BMW dealer network, and Dongfeng Motor, which is seeing
strong demand for PSA Peugeot Citroën products and a recovery in Japanese
brands Nissan and Honda; commercial vehicles should recover in 2H.
[email protected] FIRST LAST 04/27/13 11:16:54 AM Hong Kong Highpower

Macquarie Research China Autos
24 April 2013 2
Analysis
Focus on turbo-charged engines
Turbo engines help environment and bottom line: As detailed in our recent note on the
financial benefits of turbo-charged engines, which allow smaller engine displacement but typically
no change in vehicle selling prices, many auto makers featured models with new turbo-charged
power plants. Given the increased focus on reduced fuel consumption and emissions, we expect
these products to multiply, especially as currently most products with a “T” added are selling well.
Fig 1 Nissan Tiida GTS turbo Fig 2 Checking the engine of Hyundai Veloster turbo
Source: Macquarie Research, April 2013 Source: Macquarie Research, April 2013
Fig 3 GAC Trumpchi hopes a 1.8T engine can help sales of GA5
Fig 4 Great Wall displayed its in-house developed 2.0L turbo engine that meets Euro V+ emissions stds
Source: Macquarie Research, April 2013 Source: Macquarie Research, April 2013
Hybrids much more in evidence than previous auto shows
Not just the Japanese: While hybrid technology is viewed as dominated by the Japanese, a
greater variety of auto makers were displaying hybrid products, including the French, German
luxury brands and even Chinese brands like GAC Trumpchi and BYD. Nissan and Toyota both
showed new hybrid concept cars designed for the China market (see page 1 photos), while Honda
had the hybrid Fit sub-compact on display. Currently Toyota is the only OEM producing hybrids in
China – the FAW Toyota Prius and GAC Toyota Camry HEV – but other OEMs appear to be
preparing to launch product.
[email protected] FIRST LAST 04/27/13 11:16:54 AM Hong Kong Highpower

Macquarie Research China Autos
24 April 2013 3
Fig 5 The Honda Fit Hybrid already sells well in Japan Fig 6 Hyundai showed off its Sonata Hybrid
Source: Macquarie Research, April 2013 Source: Macquarie Research, April 2013
Lower price point needed: We believe in the near term, the fuel economy attractions of hybrids
appeal most to lower-income car buyers. As a result, we believe low-priced products are needed
to convince Chinese buyers to try hybrids. Honda’s Fit Hybrid could fit the bill if produced locally in
China, something GAC Honda is considering. This could be achieved if the government raised the
subsidy on hybrids from the current Rmb3,000 (cf subsidy for EVs is Rmb60k from the central
government and up to a further Rmb60k from local governments), coupled with better explanation
of savings on fuel consumption.
More education, advertisement needed: The absence of many hybrids from the auto market
means that most consumers need to learn more about them. We expect any move to provide
further subsidies to hybrids, either from local or national government levels, would be
accompanied by informational campaigns on their merits both to fuel consumption and emissions.
Push from both the government and OEMs will be needed to entice buyers. We are still likely one-
to-two years away from hybrids entering the market in volume, but the OEMs are clearly
preparing.
Fig 7 Great Wall showed off its plug-in hybrid technology
Fig 8 We expect BMW’s EV i3 (rear) and PHEV i8 (front) to be mainly curiosities in China
Source: Macquarie Research, April 2013 Source: Macquarie Research, April 2013
[email protected] FIRST LAST 04/27/13 11:16:54 AM Hong Kong Highpower

Macquarie Research China Autos
24 April 2013 4
Concept cars mainly from Japanese and local OEMs
Not many new models: We were surprised that there were not more global launches by
international car makers at the Shanghai Auto Show, as the biggest auto show of the year in the
world’s biggest auto market. The Japanese OEMs appeared to want to show their commitment to
the China market by showing a number of concept cars designed for the China market. Honda
and Toyota both showed production models of vehicles first displayed at the Beijing Auto Show in
2012 that will be launched in 2013.
Focus on practicality: Most of the concept cars shown were ones that we could easily see
becoming production models within the next 12-24 months. There was little in the way of flashy
cars designed for PR purposes.
Great Wall vehicles offered the most excitement, with the H2 urban SUV providing greater
confidence to forecasts that it will become a high-volume seller when it launches later this
year. Additional excitement was provided by the H7 SUV, which will take on the JV brand
SUVs as it is expected to be priced in the Rmb150-200k range. It also had the guts of a hybrid
vehicle on display.
Fig 9 Great Wall’s H2 SUV will launch in 4Q Fig 10 Geely displayed the KC concept car
Source: Macquarie Research, April 2013 Source: Macquarie Research, April 2013
Geely displayed one Emgrand model at the concept stage, but it appeared unlikely to become
a production model until well into 2014. The KC concept car is expected to join the Emgrand
brand as the EC9. Press reports suggested it could also be available as a hybrid using Volvo
technology. The minimal space given to the Englon brand stood out, suggesting little is being
done to promote this line-up, which is desperately in need of refreshing or abandonment, in
our view.
BYD had the S7 SUV – the evolution of the S6 SUV – on display. Despite a Reuters report
that it is considering moving away from traditional gasoline engines to focus on NEVs, most of
the vehicles on display were traditional vehicles. There was an informational display on
hybrids, but not a single consumer was looking at the e6 EV, which was tucked in a back
corner.
[email protected] FIRST LAST 04/27/13 11:16:54 AM Hong Kong Highpower

Macquarie Research China Autos
24 April 2013 5
Fig 11 BYD showed the new S7 SUV Fig 12 No one seemed interested in the BYD e6 EV
Source: Macquarie Research, April 2013 Source: Macquarie Research, April 2013
Honda showed production models of the Concept S – christened the Jade – that will be
launched by Dongfeng Honda in September and the Concept C – rebadged as the Crider, to
be sold by GAC Honda from June. It also displayed the Concept M (photo on p. 1), but not
many details were available on the MPV. News reports suggest it is supposed to be smaller
than the Odyssey minivan, and Honda’s website indicated it will be launched in 2014. A
notable absence was the new Accord, being launched by GAC Honda in September after
undergoing a makeover to increase its appeal to Chinese consumers.
Fig 13 DF Honda Jade enters production this year Fig 14 GAC Honda Crider looks attractive for 2H13
Source: Macquarie Research, April 2013 Source: Macquarie Research, April 2013
Toyota showed production models of the Yaris hatchback (GAC Toyota) and Vios sedan
(FAW Toyota), to be launched towards the end of this year. They were originally on display as
concept cars at the Beijing Auto show as the Dear Qin. While more attractive than the
incumbent vehicles, we are not sure they have what it takes to surpass 10,000 units per
month. A new volume model for Toyota in China remains elusive. The new RAV4 SUV offers
more promise, and feedback in the China media has been positive. The RAV4 offers a six-
shift automatic transmission, up from four and considered a big improvement. It also displayed
two concept cars, the FT-HT Yue Jia 6-seater and the Yundong Shaungqing II hybrid, as well
as the FCV-R fuel cell car.
[email protected] FIRST LAST 04/27/13 11:16:54 AM Hong Kong Highpower

Macquarie Research China Autos
24 April 2013 6
Fig 15 GAC Toyota new Yaris may not meet hopes for high volume
Fig 16 New RAV4 SUV looks attractive
Source: Macquarie Research, April 2013 Source: Macquarie Research, April 2013
Nissan recently launched the new Teana, the first launch by a Japanese OEM since the
eruption of the territorial dispute in the South China Sea last September, and it was featured
centre stage along with the facelift of the Livina (mainly the front grille, ahead of a full model
change postponed until next year) and a new concept hybrid sedan Friend-Me (see photo on
p. 1). Its local brand with Dongfeng Motor, Venucia, displayed an EV based on the Nissan
Leaf, one of the few practical-looking EVs.
Fig 17 New front grille on Livina may not be enough to boost sales
Fig 18 Venucia EV was one of few on display
Source: Macquarie Research, April 2013 Source: Macquarie Research, April 2013
PSA Peugeot-Citroën’s area had a good buzz to it. The new 3008 SUV floor model was
swarming with people and the Citroën C4 Technospace concept car (to be launched as C4
Picasso) MPV, scheduled to launch in 2H 2013, also attracted attention. Both brands had new
energy vehicles on display focused on the Hybrid Air for Peugeot and the Citroën C3 Hybrid
Air.
VW had only one new concept car on display, the Cross Blue Coupé, which features a plug-in
hybrid system. It also showed the Gran Lavida, a derivative of its top-selling model in China,
the Lavida. Group OEM Skoda had the Yeti SUV on display ahead of its launch later this year.
With its leading market share in China, its strategy appears driven by expanding production
rather than adding models.
[email protected] FIRST LAST 04/27/13 11:16:54 AM Hong Kong Highpower

Macquarie Research China Autos
24 April 2013 7
Fig 19 Peugeot 3008 SUV is selling well Fig 20 VW CrossBlue Coupé was on display
Source: Macquarie Research, April 2013 Source: Company data, April 2013
Hyundai displayed a new concept car designed for the China market, the HCD-14 sedan. It
also had a couple of alternative fuel vehicles on display, including a Sonata hybrid, a
hydrogen vehicle, as well as a turbo Veloster, one of its better selling vehicles in China.
Fig 21 VW’s new Gran Lavida hatchback/wagon Fig 22 Hyundai’s HCD-14 concept car
Source: ChinaAutoWeb.com, April 2013 Source: Macquarie Research, April 2013
Chery showed off two concepts, the α7 sedan and β5 small urban SUV. Chery recently
announced a major restructuring of its brands, reduced to one from four, coupled with a
halving of its models. Nevertheless, it needs to upgrade its existing models. While we did not
get a close-up view of the concepts, they appeared to be a good start. Its JV with Israel Group
also showed off its first model, the Qoros 3 sedan.
[email protected] FIRST LAST 04/27/13 11:16:54 AM Hong Kong Highpower

Macquarie Research China Autos
24 April 2013 8
Fig 23 Chery α7 sedan Fig 24 Chery β5 small urban SUV
Source: Macquarie Research, April 2013 Source: Macquarie Research, April 2013
Crowds drawn to luxury, international brands, main domestic brands
Heaviest crowds at ultra-luxury: The crowds were thickest around high-end luxury and luxury,
as the Auto Show offers the opportunity to sit in the seat of cars many can never aspire to own or
even test drive. We were pleased to see that the Japanese brands appeared to attract as many
consumers as other mainstream international brands like VW (which only offered one new concept
car) and Ford, where the popularity of the Kuga SUV extended from dealerships to the floor of the
Auto Show. Peugeot’s popular 3008 SUV– a large part of the upgrade to volume targets by
Dongfeng PSA to 557k for 2013 from 500k – and the Citroen C4L sedan attracted attention. The
Great Wall floor was also crowded, while Geely’s stand was busy. For the lesser-well-known local
brands, however, consumers were few and far apart.
Fig 25 Lesser known local brands like FAW had few visitors
Fig 26 Japanese displays like Nissan attracted crowds even on Monday morning
Source: Macquarie Research, April 2013 Source: Macquarie Research, April 2013
[email protected] FIRST LAST 04/27/13 11:16:54 AM Hong Kong Highpower

Macquarie Research China Autos
24 April 2013 9
Fig 27 Memories of the past… Fig 28 ….as future hopes pinned on the new Red Flag
Source: Macquarie Research, April 2013 Source: Macquarie Research, April 2013
[email protected] FIRST LAST 04/27/13 11:16:54 AM Hong Kong Highpower

Ma
cq
ua
rie R
es
ea
rch
C
hin
a A
uto
s
24
Ap
ril 201
3
10
Fig 29 Macquarie global autos coverage valuations and performance summary
Note: Share prices are as of April 23 close.
Source: FactSet, Macquarie Research, April 2013
Macquarie global autos coverage valuations and performance summary
Stock Code Rating Mkt cap Price TP +/-price performance (in US$) FY1 EPS FY1 FY1 FY2 FY1 EV/ FY2 EV/ FY1 Lead analyst Lead analyst
US$m (local) (local) 1-mth 3-mth 12-mth Cents P/E P/E EBITDA EBITDA ROE Email
Dealers
Baoxin 1293 HK Outperform 2,183.7 6.63 7.30 10% -5.2% -17.1% -32.3% 2012E 59.3 8.9 5.4 5.6 3.7 32.4 Janet Lewis [email protected]
DCH 1828 HK Outperform 1,683.1 7.14 9.60 34% 0.4% -20.1% -16.2% 2013E 86.5 8.3 6.8 5.3 4.4 17.2 Janet Lewis [email protected]
Yongda 3669 HK Outperform 1,555.4 8.16 9.80 20% 1.3% -2.3% n.a. 2012E 66.2 9.8 7.3 5.8 4.5 26.8 Zhixuan Lin [email protected]
Zhengtong 1728 HK Outperform 1,468.7 5.16 6.90 34% -7.0% -27.3% -35.4% 2012E 46.7 8.8 5.9 5.5 4.0 14.1 Zhixuan Lin [email protected]
Zhongsheng 881 HK Neutral 2,580.9 10.50 9.30 -11% 8.1% -5.5% -33.2% 2012E 75.3 11.1 7.7 6.8 5.6 17.7 Zhixuan Lin [email protected]
OEMsBrilliance 1114 HK Outperform 6,175.0 9.54 11.80 24% -6.7% -9.1% 15.0% 2012E 69.5 10.9 7.6 9.9 6.9 31.1 Janet Lewis [email protected]
BYD 1211 HK Underperform 7,656.5 25.35 10.50 -59% 1.6% -4.3% 18.4% 2012E 29.5 68.4 53.7 12.6 11.4 3.2 Janet Lewis [email protected] 489 HK Outperform 12,783.6 11.48 13.10 14% 9.5% -6.8% -20.5% 2012E 106.3 8.6 7.2 3.3 2.9 15.8 Janet Lewis [email protected]
GAC 2238 HK Underperform 5,221.3 6.30 5.20 -17% -0.7% -5.5% -24.1% 2012E 46.3 10.8 6.7 8.3 5.6 9.1 Janet Lewis [email protected]
Geely 175 HK Underperform 4,107.6 3.86 3.00 -22% -2.5% -10.4% 27.3% 2012E 24.6 12.5 11.5 6.6 6.0 15.5 Janet Lewis [email protected]
Great Wall 2333 HK Outperform 13,224.6 33.75 33.00 -2% 20.1% 12.1% 101.5% 2012E 235.4 11.4 9.2 8.2 6.6 29.8 Janet Lewis [email protected]
BMW BMW GY Neutral 57,014.8 66.78 80.00 20% -3.9% -12.0% -1.2% 2012E 742.8 9.0 8.9 4.1 4.3 15.2 C. Breitsprecher [email protected]
Daimler DAI GY Outperform 56,808.7 40.90 60.00 47% -7.0% -7.1% 2.7% 2012E 523.9 7.8 7.3 7.2 6.8 13.4 C. Breitsprecher [email protected]
Fiat SpA F IM Underperform 7,139.8 4.51 3.10 -31% 1.7% -6.1% 23.5% 2012E 46.1 9.8 5.6 1.1 1.0 6.0 J. Schattner [email protected]
Fiat Industrial FI IM Underperform 13,970.4 8.78 8.50 -3% 0.4% -10.1% 14.0% 2012E 92.8 9.5 9.2 8.8 8.4 20.6 J. Schattner [email protected]
MAN MAN GY Neutral 16,172.9 84.51 80.89 -4% -0.2% -6.6% -12.2% 2012E 321.3 26.3 19.2 12.0 10.0 8.3 C. Breitsprecher [email protected]
Peugeot UG FP Underperform 2,425.0 5.45 4.80 -12% -11.4% -13.5% -37.7% 2012E (296.6) nmf nmf 3.6 2.9 (10.0) J. Schattner [email protected]
Renault RNO FP Outperform 18,786.4 49.49 59.00 19% -3.0% 14.1% 45.6% 2012E 798.2 6.2 4.8 4.4 3.8 8.6 J. Schattner [email protected]
Scania SCVB Neutral 16,558.1 137.00 130.00 -5% -1.9% -1.1% 10.3% 2012E 836.8 16.4 12.6 9.0 7.2 18.4 C. Breitsprecher [email protected]
Volkswagen VOW3 GY Neutral 88,948.0 146.90 175.00 19% -6.0% -21.2% 20.1% 2012E 1,863.4 7.9 6.3 3.3 2.9 11.0 C. Breitsprecher [email protected]
Volvo VOLVB Outperform 27,493.8 89.75 108.00 20% -8.0% -6.6% 8.7% 2012E 596.1 15.1 11.1 8.8 7.2 13.5 J. Schattner [email protected]
Ashok Leyland AL IN Outperform 1,113.2 22.75 29.00 27% -0.9% -10.2% -30.4% FY3/13E 16.6 137.4 31.9 14.4 11.2 1.1 Amit Mishra [email protected]
Bajaj Auto BJAUT IN Underperform 9,600.9 1,804.2 1,400 -22% -1.1% -12.5% 4.2% FY3/13E 10,581.4 17.1 14.8 12.6 10.7 45.4 Amit Mishra [email protected]
Hero MotoCorp HMCL IN Underperform 5,773.1 1,572.1 1,250 -20% -5.2% -12.8% -29.2% FY3/13E 10,639.2 14.8 14.4 14.1 12.7 44.6 Amit Mishra [email protected]
M&M MM IN Outperform 9,991.7 884.9 955 8% 1.2% -1.0% 19.6% FY3/13E 5,286.8 16.7 15.1 12.2 10.9 24.6 Amit Mishra [email protected]
Maruti Suzuki MSIL IN Outperform 8,161.0 1,536.0 1,600 4% 17.8% -3.7% 7.9% FY3/13E 6,656.2 23.1 15.3 14.9 10.4 12.2 Amit Mishra [email protected]
Tata Motors TTMT IN Outperform 14,012.6 281.4 350 24% 4.0% -11.0% -12.2% FY3/13E 2,798.5 10.1 7.8 5.2 4.3 24.3 Amit Mishra [email protected]
Daihatsu 7262 JP Neutral 8,319.6 1,914 2,000 4% -5.1% -3.5% 8.5% FY3/13E 179.6 10.7 10.6 3.6 3.4 16.8 Clive Wiggins [email protected]
FHI 7270 JP Neutral 14,334.9 1,794 1,600 -11% 15.9% 44.2% 140.4% FY3/13E 106.5 16.8 11.0 8.3 5.5 17.1 Clive Wiggins [email protected]
Honda 7267 JP Outperform 71,195.9 3,875 4,300 11% 0.4% 5.1% 9.8% FY3/13E 176.4 22.0 12.1 9.3 6.4 7.1 Clive Wiggins [email protected]
Mazda 7261 JP Underperform 10,439.2 337 260 -23% 10.1% 43.7% 111.5% FY3/13E 7.4 45.6 10.8 12.4 6.7 4.6 Clive Wiggins [email protected]
Nissan 7201 JP Outperform 44,502.9 1,034 1,100 6% 3.9% 9.4% 0.9% FY3/13E 82.5 12.5 8.6 6.2 4.5 10.5 Clive Wiggins [email protected]
Suzuki 7269 JP Underperform 13,391.7 2,344 2,000 -15% 1.8% -8.1% 1.7% FY3/13E 127.4 18.4 15.2 5.9 4.9 7.0 Clive Wiggins [email protected]
Toyota 7203 JP Outperform 177,530.5 5,510 6,500 18% 7.4% 18.2% 37.7% FY3/13E 227.1 24.3 12.9 11.6 7.4 6.7 Clive Wiggins [email protected]
Hyundai Motor 5380 KS Outperform 34,444.2 184,000 260,000 41% -14.3% -19.7% -25.2% FY3/13E 39,565.5 4.7 4.2 4.0 3.6 16.7 Michael Sohn [email protected]
Kia Motors 270 KS Outperform 18,064.4 49,550 63,000 27% -10.2% -13.0% -35.9% FY3/13E 9,506.5 5.2 4.6 3.2 2.9 20.7 Michael Sohn [email protected]
[email protected] FIRST LAST 04/27/13 11:16:54 AM Hong Kong Highpower

Macquarie Research China Autos
24 April 2013 11
Important disclosures:
Recommendation definitions
Macquarie - Australia/New Zealand Outperform – return >3% in excess of benchmark return Neutral – return within 3% of benchmark return Underperform – return >3% below benchmark return Benchmark return is determined by long term nominal GDP growth plus 12 month forward market dividend yield
Macquarie – Asia/Europe Outperform – expected return >+10% Neutral – expected return from -10% to +10% Underperform – expected return <-10%
Macquarie First South - South Africa Outperform – expected return >+10% Neutral – expected return from -10% to +10% Underperform – expected return <-10%
Macquarie - Canada
Outperform – return >5% in excess of benchmark return Neutral – return within 5% of benchmark return Underperform – return >5% below benchmark return
Macquarie - USA Outperform (Buy) – return >5% in excess of Russell 3000 index return Neutral (Hold) – return within 5% of Russell 3000 index return Underperform (Sell)– return >5% below Russell 3000 index return
Volatility index definition*
This is calculated from the volatility of historical price movements. Very high–highest risk – Stock should be
expected to move up or down 60–100% in a year – investors should be aware this stock is highly speculative. High – stock should be expected to move up or down at least 40–60% in a year – investors should be aware this stock could be speculative. Medium – stock should be expected to move up or down at least 30–40% in a year. Low–medium – stock should be expected to move up or down at least 25–30% in a year. Low – stock should be expected to move up or down at least 15–25% in a year. * Applicable to Australian/NZ/Canada stocks only
Recommendations – 12 months Note: Quant recommendations may differ from Fundamental Analyst recommendations
Financial definitions
All "Adjusted" data items have had the following adjustments made: Added back: goodwill amortisation, provision for catastrophe reserves, IFRS derivatives & hedging, IFRS impairments & IFRS interest expense Excluded: non recurring items, asset revals, property revals, appraisal value uplift, preference dividends & minority interests EPS = adjusted net profit / efpowa* ROA = adjusted ebit / average total assets ROA Banks/Insurance = adjusted net profit /average total assets ROE = adjusted net profit / average shareholders funds Gross cashflow = adjusted net profit + depreciation *equivalent fully paid ordinary weighted average number of shares All Reported numbers for Australian/NZ listed stocks are modelled under IFRS (International Financial Reporting Standards).
Recommendation proportions – For quarter ending 31 March 2013
AU/NZ Asia RSA USA CA EUR Outperform 45.12% 53.24% 50.00% 40.70% 62.98% 43.30% (for US coverage by MCUSA, 10.55% of stocks followed are investment banking clients)
Neutral 41.52% 28.01% 41.43% 55.01% 32.60% 34.10% (for US coverage by MCUSA, 9.05% of stocks followed are investment banking clients)
Underperform 13.36% 18.74% 8.57% 4.29% 4.42% 22.60% (for US coverage by MCUSA, 0.00% of stocks followed are investment banking clients)
Company Specific Disclosures: Important disclosure information regarding the subject companies covered in this report is available at www.macquarie.com/disclosures.
Analyst Certification: The views expressed in this research accurately reflect the personal views of the analyst(s) about the subject securities or issuers and no part of the compensation of the analyst(s) was, is, or will be directly or indirectly related to the inclusion of specific recommendations or views in this research. The analyst principally responsible for the preparation of this research receives compensation based on overall revenues of Macquarie Group Ltd ABN 94 122 169 279 (AFSL No. 318062) (MGL) and its related entities (the Macquarie Group) and has taken reasonable care to achieve and maintain independence and objectivity in making any recommendations. General Disclaimers: Macquarie Securities (Australia) Ltd; Macquarie Capital (Europe) Ltd; Macquarie Capital Markets Canada Ltd; Macquarie Capital Markets North America Ltd; Macquarie Capital (USA) Inc; Macquarie Capital Securities Ltd and its Taiwan branch; Macquarie Capital Securities (Singapore) Pte Ltd; Macquarie Securities (NZ) Ltd; Macquarie First South Securities (Pty) Limited; Macquarie Capital Securities (India) Pvt Ltd; Macquarie Capital Securities (Malaysia) Sdn Bhd; Macquarie Securities Korea Limited and Macquarie Securities (Thailand) Ltd are not authorized deposit-taking institutions for the purposes of the Banking Act 1959 (Commonwealth of Australia), and their obligations do not represent deposits or other liabilities of Macquarie Bank Limited ABN 46 008 583 542 (MBL) or MGL. MBL does not guarantee or otherwise provide assurance in respect of the obligations of any of the above mentioned entities. MGL provides a guarantee to the Monetary Authority of Singapore in respect of the obligations and liabilities of Macquarie Capital Securities (Singapore) Pte Ltd for up to SGD 35 million. This research has been prepared for the general use of the wholesale clients of the Macquarie Group and must not be copied, either in whole or in part, or distributed to any other person. If you are not the intended recipient you must not use or disclose the information in this research in any way. If you received it in error, please tell us immediately by return e-mail and delete the document. We do not guarantee the integrity of any e-mails or attached files and are not responsible for any changes made to them by any other person. MGL has established and implemented a conflicts policy at group level (which may be revised and updated from time to time) (the "Conflicts Policy") pursuant to regulatory requirements (including the FSA Rules) which sets out how we must seek to identify and manage all material conflicts of interest. Nothing in this research shall be construed as a solicitation to buy or sell any security or product, or to engage in or refrain from engaging in any transaction. In preparing this research, we did not take into account your investment objectives, financial situation or particular needs. Macquarie salespeople, traders and other professionals may provide oral or written market commentary or trading strategies to our clients that reflect opinions which are contrary to the opinions expressed in this research. Macquarie Research produces a variety of research products including, but not limited to, fundamental analysis, macro-economic analysis, quantitative analysis, and trade ideas. Recommendations contained in one type of research product may differ from recommendations contained in other types of research, whether as a result of differing time horizons, methodologies, or otherwise. Before making an investment decision on the basis of this research, you need to consider, with or without the assistance of an adviser, whether the advice is appropriate in light of your particular investment needs, objectives and financial circumstances. There are risks involved in securities trading. The price of securities can and does fluctuate, and an individual security may even become valueless. International investors are reminded of the additional risks inherent in international investments, such as currency fluctuations and international stock market or economic conditions, which may adversely affect the value of the investment. This research is based on information obtained from sources believed to be reliable but we do not make any representation or warranty that it is accurate, complete or up to date. We accept no obligation to correct or update the information or opinions in it. Opinions expressed are subject to change without notice. No member of the Macquarie Group accepts any liability whatsoever for any direct, indirect, consequential or other loss arising from any use of this research and/or further communication in relation to this research. Clients should contact analysts at, and execute transactions through, a Macquarie Group entity in their home jurisdiction unless governing law permits otherwise. The date and timestamp for above share price and market cap is the closed price of the price date. #CLOSE is the final price at which the security is traded in the relevant exchange on the date indicated. Country-Specific Disclaimers: Australia: In Australia, research is issued and distributed by Macquarie Securities (Australia) Ltd (AFSL No. 238947), a participating organisation of the Australian Securities Exchange. New Zealand: In New Zealand, research is issued and distributed by Macquarie Securities (NZ) Ltd, a NZX Firm. Canada: In Canada, research is prepared, approved and distributed by Macquarie Capital Markets Canada Ltd, a participating organisation of the Toronto Stock Exchange, TSX Venture Exchange & Montréal Exchange. Macquarie Capital Markets North America Ltd., which is a registered broker-dealer and member of FINRA, accepts responsibility for the contents of reports issued by Macquarie Capital Markets Canada Ltd in the United States and sent to US persons. Any person wishing to effect transactions in the securities described in the reports issued by Macquarie Capital Markets Canada Ltd should do so with Macquarie Capital Markets North America Ltd. The Research Distribution Policy of Macquarie Capital Markets Canada Ltd is to allow all clients that are entitled to have equal access to our research. United Kingdom: In the United Kingdom, research is issued and
[email protected] FIRST LAST 04/27/13 11:16:54 AM Hong Kong Highpower

Macquarie Research China Autos
24 April 2013 12
distributed by Macquarie Capital (Europe) Ltd, which is authorised and regulated by the Financial Services Authority (No. 193905). Germany: In Germany, this research is issued and/or distributed by Macquarie Capital (Europe) Limited, Niederlassung Deutschland, which is authorised and regulated by the UK Financial Services Authority (No. 193905). and in Germany by BaFin. France: In France, research is issued and distributed by Macquarie Capital (Europe) Ltd, which is authorised and regulated in the United Kingdom by the Financial Services Authority (No. 193905). Hong Kong & Mainland China: In Hong Kong, research is issued and distributed by Macquarie Capital Securities Ltd, which is licensed and regulated by the Securities and Futures Commission. In Mainland China, Macquarie Securities (Australia) Limited Shanghai Representative Office only engages in non-business operational activities excluding issuing and distributing research. Only non-A share research is distributed into Mainland China by Macquarie Capital Securities Ltd. Japan: In Japan, research is issued and distributed by Macquarie Capital Securities (Japan) Limited, a member of the Tokyo Stock Exchange, Inc. and Osaka Securities Exchange Co. Ltd (Financial Instruments Firm, Kanto Financial Bureau (kin-sho) No. 231, a member of Japan Securities Dealers Association and The Financial Futures Association of Japan and Japan Investment Advisers Association). India: In India, research is issued and distributed by Macquarie Capital Securities (India) Pvt Ltd., 92, Level 9, 2 North Avenue, Maker Maxity, Bandra Kurla Complex, Bandra (East), Mumbai – 400 051, India, which is a SEBI registered Stock Broker having membership with National Stock Exchange of India Limited (INB231246738) and Bombay Stock Exchange Limited (INB011246734). Malaysia: In Malaysia, research is issued and distributed by Macquarie Capital Securities (Malaysia) Sdn. Bhd. (Company registration number: 463469-W) which is a Participating Organisation of Bursa Malaysia Berhad and a holder of Capital Markets Services License issued by the Securities Commission. Taiwan: Information on securities/instruments that are traded in Taiwan is distributed by Macquarie Capital Securities Ltd, Taiwan Branch, which is licensed and regulated by the Financial Supervisory Commission. No portion of the report may be reproduced or quoted by the press or any other person without authorisation from Macquarie. Nothing in this research shall be construed as a solicitation to buy or sell any security or product. Research Associate(s) in this report who are registered as Clerks only assist in the preparation of research and are not engaged in writing the research. Thailand: In Thailand, research is produced with the contribution of Kasikorn Securities Public Company Limited, issued and distributed by Macquarie Securities (Thailand) Ltd. Macquarie Securities (Thailand) Ltd. is a licensed securities company that is authorized by the Ministry of Finance, regulated by the Securities and Exchange Commission of Thailand and is an exchange member of the Stock Exchange of Thailand. Macquarie Securities (Thailand) Limited and Kasikorn Securities Public Company Limited have entered into an exclusive strategic alliance agreement to broaden and deepen the scope of services provided to each parties respective clients. The strategic alliance does not constitute a joint venture. The Thai Institute of Directors Association has disclosed the Corporate Governance Report of Thai Listed Companies made pursuant to the policy of the Securities and Exchange Commission of Thailand. Macquarie Securities (Thailand) Ltd does not endorse the result of the Corporate Governance Report of Thai Listed Companies but this Report can be accessed at: http://www.thai-iod.com/en/publications.asp?type=4. South Korea: In South Korea, unless otherwise stated, research is prepared, issued and distributed by Macquarie Securities Korea Limited, which is regulated by the Financial Supervisory Services. Information on analysts in MSKL is disclosed at http://dis.kofia.or.kr/fs/dis2/fundMgr/DISFundMgrAnalystPop.jsp?companyCd2=A03053&pageDiv=02. South Africa: In South Africa, research is issued and distributed by Macquarie First South Securities (Pty) Limited, a member of the JSE Limited. Singapore: In Singapore, research is issued and distributed by Macquarie Capital Securities (Singapore) Pte Ltd (Company Registration Number: 198702912C), a Capital Markets Services license holder under the Securities and Futures Act to deal in securities and provide custodial services in Singapore. Pursuant to the Financial Advisers (Amendment) Regulations 2005, Macquarie Capital Securities (Singapore) Pte Ltd is exempt from complying with sections 25, 27 and 36 of the Financial Advisers Act. All Singapore-based recipients of research produced by Macquarie Capital (Europe) Limited, Macquarie Capital Markets Canada Ltd, Macquarie First South Securities (Pty) Limited and Macquarie Capital (USA) Inc. represent and warrant that they are institutional investors as defined in the Securities and Futures Act. United States: In the United States, research is issued and distributed by Macquarie Capital (USA) Inc., which is a registered broker-dealer and member of FINRA. Macquarie Capital (USA) Inc, accepts responsibility for the content of each research report prepared by one of its non-US affiliates when the research report is distributed in the United States by Macquarie Capital (USA) Inc. Macquarie Capital (USA) Inc.’s affiliate’s analysts are not registered as research analysts with FINRA, may not be associated persons of Macquarie Capital (USA) Inc., and therefore may not be subject to FINRA rule restrictions on communications with a subject company, public appearances, and trading securities held by a research analyst account. Information regarding futures is provided for reference purposes only and is not a solicitation for purchases or sales of futures. Any persons receiving this report directly from Macquarie Capital (USA) Inc. and wishing to effect a transaction in any security described herein should do so with Macquarie Capital (USA) Inc. Important disclosure information regarding the subject companies covered in this report is available at www.macquarie.com/research/disclosures, or contact your registered representative at 1-888-MAC-STOCK, or write to the Supervisory Analysts, Research Department, Macquarie Securities, 125 W.55th Street, New York, NY 10019. © Macquarie Group Auckland
Tel: (649) 377 6433
Jakarta Tel: (62 21) 515 1818
Mumbai
Tel: (91 22) 6653 3000
Singapore Tel: (65) 6601 1111
Bangkok
Tel: (662) 694 7999
Johannesburg Tel: (2711) 583 2000
Munich
Tel: (089) 2444 31800
Sydney Tel: (612) 8232 9555
Calgary
Tel: (1 403) 218 6650
Kuala Lumpur Tel: (60 3) 2059 8833
New York
Tel: (1 212) 231 2500
Taipei Tel: (886 2) 2734 7500
Denver
Tel: (303) 952 2800
London Tel: (44 20) 3037 2000
Paris
Tel: (33 1) 7842 3823
Tokyo Tel: (81 3) 3512 7900
Frankfurt
Tel: (069) 509 578 000
Manila Tel: (63 2) 857 0888
Perth
Tel: (618) 9224 0888
Toronto Tel: (1 416) 848 3500
Geneva
Tel: (41) 22 818 7777
Melbourne Tel: (613) 9635 8139
Seoul
Tel: (82 2) 3705 8500
Hong Kong
Tel: (852) 2823 3588
Montreal Tel: (1 514) 925 2850
Shanghai
Tel: (86 21) 6841 3355
Available to clients on the world wide web at www.macquarieresearch.com and through Thomson Financial, FactSet, Reuters, Bloomberg, and CapitalIQ.
[email protected] FIRST LAST 04/27/13 11:16:54 AM Hong Kong Highpower
Asia Research Head of Equity Research
John O’Connell (Global – Head) (612) 8232 7544
Peter Redhead (Asia – Head) (852) 3922 4836
Automobiles/Auto Parts
Janet Lewis (China) (852) 3922 5417
Amit Mishra (India) (9122) 6720 4084
Clive Wiggins (Japan) (813) 3512 7856
Michael Sohn (Korea) (82 2) 3705 8644
Banks and Non-Bank Financials
Ismael Pili (Asia, Hong Kong) (852) 3922 4774
Victor Wang (China) (852) 3922 1479
Suresh Ganapathy (India) (9122) 6720 4078
Nicolaos Oentung (Indonesia) (6221) 2598 8366
Alastair Macdonald (Japan) (813) 3512 7476
Chan Hwang (Korea) (822) 3705 8643
Matthew Smith (Malaysia, Singapore) (65) 6601 0981
Alex Pomento (Philippines) (632) 857 0899
Passakorn Linmaneechote (Thailand) (662) 694 7728
Conglomerates
Alex Pomento (Philippines) (632) 857 0899 Somesh Agarwal (Singapore) (65) 6601 0840
Consumer and Gaming
Gary Pinge (Asia) (852) 3922 3557
Linda Huang (China, Hong Kong) (852) 3922 4068
Amit Mishra (India) (9122) 6720 4084
Lyall Taylor (Indonesia) (6221) 2598 8489
Toby Williams (Japan) (813) 3512 7392
HongSuk Na (Korea) (822) 3705 8678
Alex Pomento (Philippines) (632) 857 0899 Somesh Agarwal (Singapore) (65) 6601 0840
Best Waiyanont (Thailand) (662) 694 7993
Emerging Leaders
Jake Lynch (China, Asia) (8621) 2412 9007 Adam Worthington (ASEAN) (852) 3922 4626
Michael Newman (Japan) (813) 3512 7920
Industrials
Janet Lewis (Asia) (852) 3922 5417
Patrick Dai (China) (8621) 2412 9082
Saiyi He (China) (852) 3922 3585
Inderjeetsingh Bhatia (India) (9122) 6720 4087
Kenjin Hotta (Japan) (813) 3512 7871 Juwon Lee (Korea) (822) 3705 8661
Sunaina Dhanuka (Malaysia) (603) 2059 8993
David Gambrill (Thailand) (662) 694 7753
Insurance
Scott Russell (Asia, Japan) (852) 3922 3567
Chung Jun Yun (Korea) (822) 2095 7222
Software and Internet
David Gibson (Asia) (813) 3512 7880
Jiong Shao (China, Hong Kong) (852) 3922 3566
Steve Zhang (China, Hong Kong) (852) 3922 3578 Nitin Mohta (India) (9122) 6720 4090
Nathan Ramler (Japan) (813) 3512 7875
Prem Jearajasingam (Malaysia) (603) 2059 8989 Alex Pomento (Philippines) (632) 857 0899
Oil, Gas and Petrochemicals
James Hubbard (Asia) (852) 3922 1226 Jal Irani (India) (9122) 6720 4080
Polina Diyachkina (Japan) (813) 3512 7886
Brandon Lee (Korea) (822) 3705 8669 Sunaina Dhanuka (Malaysia) (603) 2059 8993
Trevor Buchinski (Thailand) (662) 694 7829
Pharmaceuticals and Healthcare
Abhishek Singhal (India) (9122) 6720 4086 Eunice Bu (Korea) (822) 2095 7223
Property
Callum Bramah (Asia) (852) 3922 4731
David Ng (China, Hong Kong) (852) 3922 1291 Jeffrey Gao (China) (8621) 2412 9026
Abhishek Bhandari (India) (9122) 6720 4088
Norihiko Sawano (Japan) (813) 3512 7873 Sunaina Dhanuka (Malaysia) (603) 2059 8993
Alex Pomento (Philippines) (632) 857 0899
Tuck Yin Soong (Singapore) (65) 6601 0838 Corinne Jian (Taiwan) (8862) 2734 7522
Patti Tomaitrichitr (Thailand) (662) 694 7727
Resources / Metals and Mining
Ivan Lee (Asia) (852) 3922 3572 Graeme Train (China) (8621) 2412 9035
Matty Zhao (Hong Kong) (852) 3922 1293
Rakesh Arora (India) (9122) 6720 4093 Adam Worthington (Indonesia) (852) 3922 4626
Riaz Hyder (Indonesia) (6221) 2598 8486
Polina Diyachkina (Japan) (813) 3512 7886 Chak Reungsinpinya (Thailand) (662) 694 7982
Andrew Dale (852) 3922 3587
Technology
Jeffrey Su (Asia, Taiwan) (8862) 2734 7512 Lisa Soh (China) (852) 3922 1401
Steve Zhang (China, Hong Kong) (852) 3922 3578
Nitin Mohta (India) (9122) 6720 4090 Claudio Aritomi (Japan) (813) 3512 7858
Damian Thong (Japan) (813) 3512 7877
David Gibson (Japan) (813) 3512 7880 George Chang (Japan) (813) 3512 7854
Daniel Kim (Korea) (822) 3705 8641
Soyun Shin (Korea) (822) 3705 8659 Andrew Chang (Taiwan) (8862) 2734 7526
Daniel Chang (Taiwan) (8862) 2734 7516
Tammy Lai (Taiwan) (8862) 2734 7525
Telecoms
Nathan Ramler (Asia, Japan) (813) 3512 7875
Lisa Soh (China, Hong Kong) (852) 3922 1401
Riaz Hyder (Indonesia) (6221) 2598 8486 Prem Jearajasingam (Malaysia, Singapore) (603) 2059 8989
Alex Pomento (Philippines) (632) 857 0899 Joseph Quinn (Taiwan) (8862) 2734 7519
Transport & Infrastructure
Janet Lewis (Asia, Japan) (852) 3922 5417
Bonnie Chan (Hong Kong) (852) 3922 3898
Nicholas Cunningham (Japan) (813) 3512 6044 Sunaina Dhanuka (Malaysia) (603) 2059 8993
Corinne Jian (Taiwan) (8862) 2734 7522
Utilities & Renewables
Ivan Lee (Asia) (852) 3922 3572 Inderjeetsingh Bhatia (India) (9122) 6720 4087
Prem Jearajasingam (Malaysia) (603) 2059 8989
Alex Pomento (Philippines) (632) 857 0899
Commodities
Colin Hamilton (Global) (4420) 3037 4061
Jim Lennon (4420) 3037 4271
Duncan Hobbs (4420) 3037 4497 Bonnie Liu (65) 6601 0144
Graeme Train (8621) 2412 9035
Rakesh Arora (9122) 6720 4093
Economics
Peter Eadon-Clarke (Asia, Japan) (813) 3512 7850
Aimee Kaye (ASEAN) (65) 6601 0574
Richard Gibbs (Australia) (612) 8232 3935 Tanvee Gupta (India) (9122) 6720 4355
Quantitative / CPG
Gurvinder Brar (Global) (4420) 3037 4036
Josh Holcroft (Asia). (852) 3922 1279 Burke Lau (Asia) (852) 3922 5494
Simon Rigney (Asia, Japan) (852) 3922 4719
Eric Yeung (Asia) (852) 3922 4077
Strategy/Country
Viktor Shvets (Asia) (852) 3922 3883 Chetan Seth (Asia) (852) 3922 4769 Joshua van Lin (Asia Micro) (852) 3922 1425 Peter Eadon-Clarke (Japan) (813) 3512 7850
Jiong Shao (China) (852) 3922 3566
Rakesh Arora (India) (9122) 6720 4093 Nicolaos Oentung (Indonesia) (6121) 2598 8366
Chan Hwang (Korea) (822) 3705 8643
Yeonzon Yeow (Malaysia) (603) 2059 8982 Alex Pomento (Philippines) (632) 857 0899
Conrad Werner (Singapore) (65) 6601 0182
Daniel Chang (Taiwan) (8862) 2734 7516 David Gambrill (Thailand) (662) 694 7753 Find our research at Macquarie: www.macquarie.com.au/research Thomson: www.thomson.com/financial Reuters: www.knowledge.reuters.com Bloomberg: MAC GO Factset: http://www.factset.com/home.aspx CapitalIQ www.capitaliq.com TheMarkets.com www.themarkets.com Email [email protected] for access
Asia Sales Regional Heads of Sales
Robin Black (Asia) (852) 3922 2074 Chris Gray (ASEAN) (65) 6601 0288
Peter Slater (Boston) (1 617) 598 2502
Jeffrey Shiu (China & Hong Kong) (852) 3922 2061 Thomas Renz (Geneva) (41) 22 818 7712
Andrew Mouat (India) (9122) 6720 4100
Miki Edelman (Japan) (813) 3512 7857 JJ Kim (Korea) (822) 3705 8799
Chris Gould (Malaysia) (603) 2059 8888
Gino C Rojas (Philippines) (632) 857 0861 Eric Roles (New York) (1 212) 231 2559
Paul Colaco (New York) (1 212) 231 2496
Sheila Schroeder (San Francisco) (1 415) 762 5001 Erica Wang (Taiwan) (8862) 2734 7586
Regional Heads of Sales cont’d
Angus Kent (Thailand) (662) 694 7601
Angus Innes (UK/Europe) (44) 20 3037 4841
Sean Alexander (Generalist) (852) 3922 2101
Regional Head of Distribution
Justin Crawford (Asia) (852) 3922 2065
Sales Trading
Adam Zaki (Asia) (852) 3922 2002 Phil Sellaroli (Japan) (813) 3512 7837 Grace Lee (Korea) (822) 3705 8601
Matthew Ryan (Singapore) (65) 6601 0216
Sales Trading cont’d
Mike Keen (Europe) (44) 20 3037 4905 Chris Reale (New York) (1 212) 231 2555
Marc Rosa (New York) (1 212) 231 2555
Stanley Dunda (Indonesia) (6221) 515 1555 Kenneth Cheung (Malaysia) (603) 2059 8888
John Fajardo (Philippines) (632) 857 0840
Michael Santos (Philippines) (632) 857 0813 Isaac Huang (Taiwan) (8862) 2734 7582
Dominic Shore (Thailand) (662) 694 7707
[email protected] FIRST LAST 04/27/13 11:16:54 AM Hong Kong Highpower
Related Documents