2015 CHILD POVERTY REPORT CARD firstcallbc.org 39 Richest 10% of families: 24.2% Poorest 50% of families: 25.4% Second richest 10%: 15.8 Third richest 10%: 13.6% Fourth richest 10%: 11% Fifth richest 10%: 10.1% Incomes of Families with Children: Growing Inequality 10 FACT SHEET In the past 20 years, income inequality in Canada has increased and con- tinues to grow. The richest group of Canadians has increased its share of total national income, while the poorest and middle-income groups have been losing ground. International research shows that high rates of in- come inequality negatively affect both rich and poor people. As shown in the following graph, in BC in 2011, the richest 10% received 24.2% of all the income of BC families with children. The top five deciles (or half) collected three quarters (75%) of all income received by BC fam- ilies with children, leaving only 25.4% for the other half. Some families in the bottom half are poor, but many others are middle-class families living well above the poverty line. The graph, using data from Statistics Canada prepared for the Canadian Centre for Policy Alternatives, measures the total income of families with children. Total income refers to all income before taxes, including wages and salaries, earnings from self-employment and earnings from invest- ments. It also includes government benefits from the federal and prov- incial governments, such as the Canada Child Tax Benefit, GST credits, Employment Insurance and welfare payments. Percentage of Total Income Among BC Parents with Children, 2011 The richest 10% of BC families with children received 24% of the total income, while the poorest 50% shared 25%. Source: Canadian Centre for Policy Alternatives based on Statistics Canada data. In the past 20 years, income inequality in Canada has increased and continues to grow. The richest group of Canadians has increased its share of total national income, while the poorest and middle- income groups have been losing ground.

Welcome message from author
This document is posted to help you gain knowledge. Please leave a comment to let me know what you think about it! Share it to your friends and learn new things together.
Transcript
2015 CHILD POVERTY REPORT CARDfirstcallbc.org39
Richest 10% of families:
24.2%
Poorest 50% of families:
25.4%
Second richest
10%: 15.8
Third richest
10%: 13.6%
Fourth richest
10%: 11%
Fifth richest 10%:
10.1%
Incomes of Families with Children: Growing Inequality10
FACT SHEET
In the past 20 years, income inequality in Canada has increased and con-tinues to grow. The richest group of Canadians has increased its share of total national income, while the poorest and middle-income groups have been losing ground. International research shows that high rates of in-come inequality negatively affect both rich and poor people.
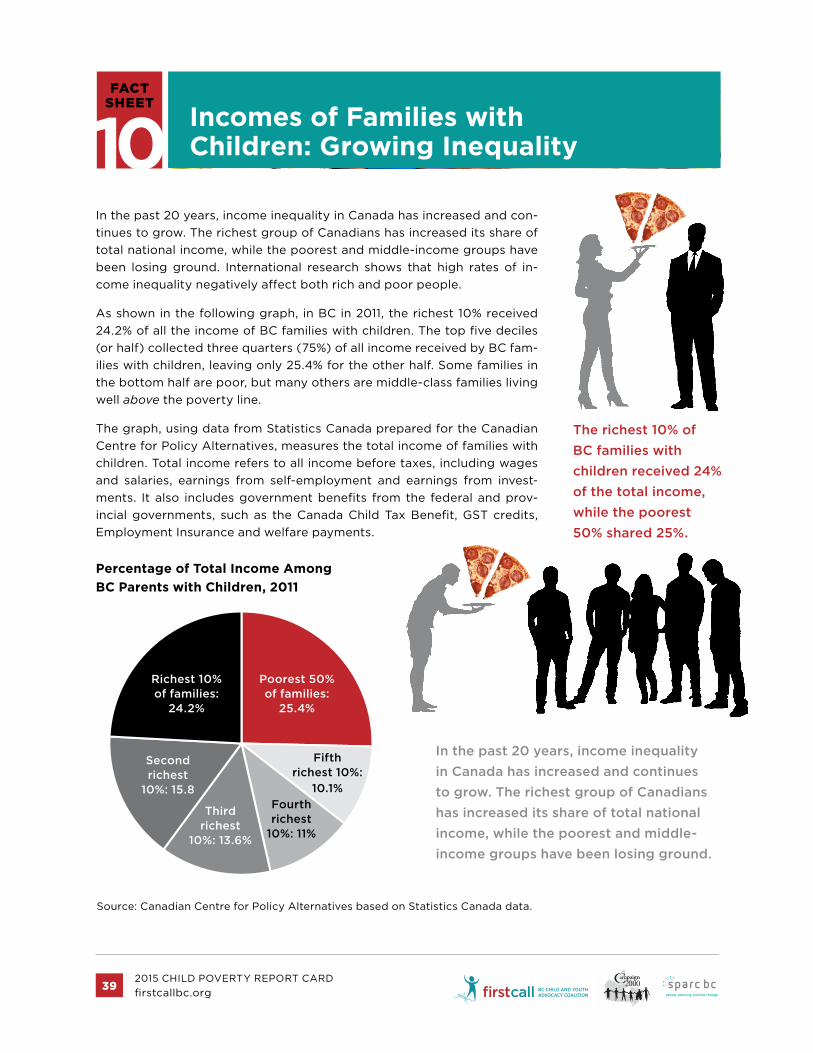
As shown in the following graph, in BC in 2011, the richest 10% received 24.2% of all the income of BC families with children. The top five deciles (or half) collected three quarters (75%) of all income received by BC fam-ilies with children, leaving only 25.4% for the other half. Some families in the bottom half are poor, but many others are middle-class families living well above the poverty line.
The graph, using data from Statistics Canada prepared for the Canadian Centre for Policy Alternatives, measures the total income of families with children. Total income refers to all income before taxes, including wages and salaries, earnings from self-employment and earnings from invest-ments. It also includes government benefits from the federal and prov-incial governments, such as the Canada Child Tax Benefit, GST credits, Employment Insurance and welfare payments.
Percentage of Total Income Among BC Parents with Children, 2011
The richest 10% of BC families with children received 24% of the total income, while the poorest 50% shared 25%.
Source: Canadian Centre for Policy Alternatives based on Statistics Canada data.
In the past 20 years, income inequality in Canada has increased and continues to grow. The richest group of Canadians has increased its share of total national income, while the poorest and middle-income groups have been losing ground.
2015 CHILD POVERTY REPORT CARDfirstcallbc.org40
The table below shows how total income has changed for each of the 10-percent groups or “deciles” since 1989. Families in the three lower deciles actually lost money over time, while those in the higher deciles, especially the top half of the income groups, gained significant amounts of income"—"much of it during the last several years.
Changes in Average Total Incomes by Decile Group, All BC Families With Children, in Constant 2011 Dollars
Decile 1989 2011 Difference
Decile 1: Poorest $ 18,843 $ 18,070 $ -773
Decile 2: Second poorest 36,986 33,197 -3,789
Decile 3 52,488 47,427 -5,061
Decile 4 63,564 64,802 1,238
Decile 5 72,727 79,731 7,004
Decile 6 81,752 93,401 11,649
Decile 7 92,764 109,143 16,379
Decile 8 105,300 124,924 19,624
Decile 9: Second richest 121,055 152,025 30,970
Decile 10: Richest 172,477 227,164 54,687
Average for families with children 81,873 95,439 13,566
Source: Canadian Centre for Policy Alternatives based on Statistics Canada data.
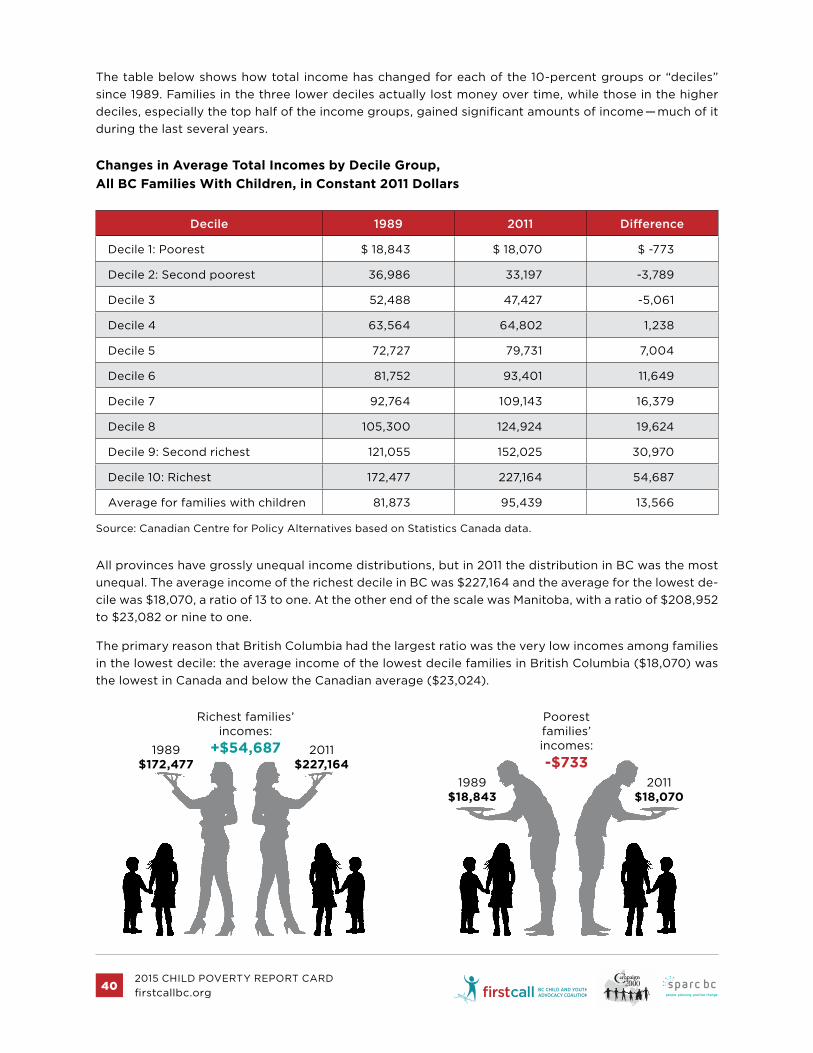
All provinces have grossly unequal income distributions, but in 2011 the distribution in BC was the most unequal. The average income of the richest decile in BC was $227,164 and the average for the lowest de-cile was $18,070, a ratio of 13 to one. At the other end of the scale was Manitoba, with a ratio of $208,952 to $23,082 or nine to one.
The primary reason that British Columbia had the largest ratio was the very low incomes among families in the lowest decile: the average income of the lowest decile families in British Columbia ($18,070) was the lowest in Canada and below the Canadian average ($23,024).
1989$172,477
2011$227,164
Richest families’ incomes:
+$54,687
1989$18,843
2011$18,070
Poorest families’ incomes: -$733
2015 CHILD POVERTY REPORT CARDfirstcallbc.org41
GROWING INCOME FOR THE RICHEST LEAVES EVERYONE ELSE IN THE DUST
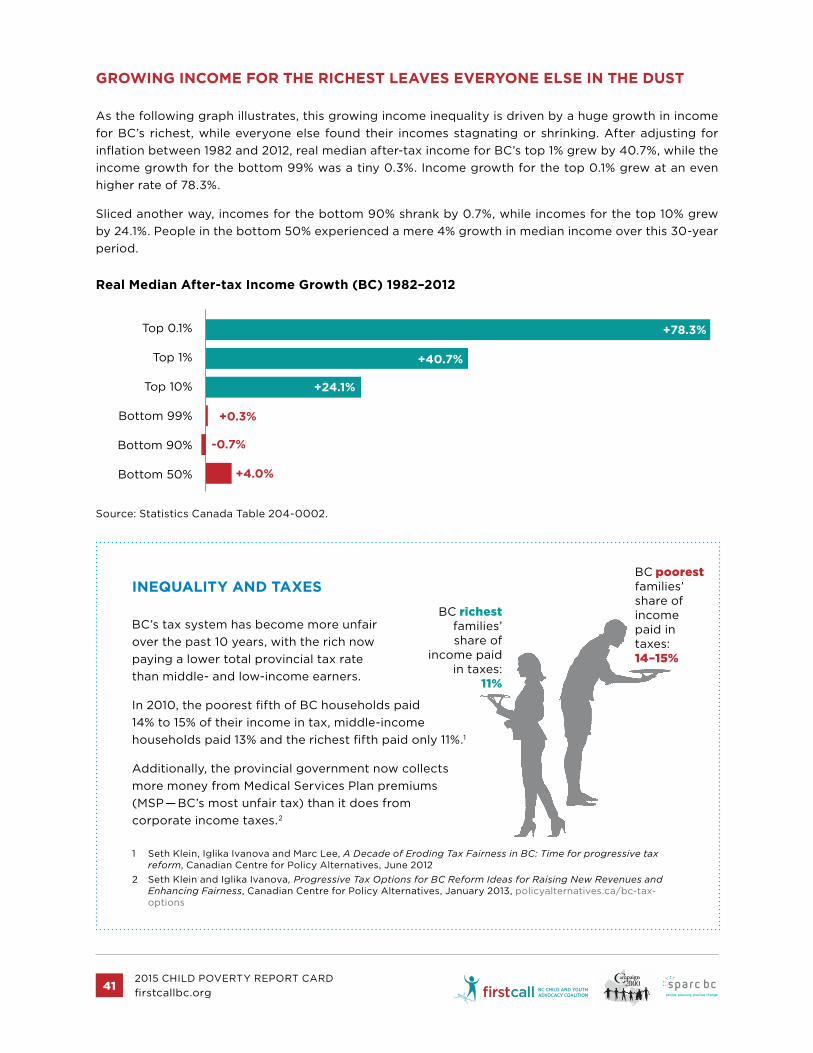
As the following graph illustrates, this growing income inequality is driven by a huge growth in income for BC’s richest, while everyone else found their incomes stagnating or shrinking. After adjusting for inflation between 1982 and 2012, real median after-tax income for BC’s top 1% grew by 40.7%, while the income growth for the bottom 99% was a tiny 0.3%. Income growth for the top 0.1% grew at an even higher rate of 78.3%.
Sliced another way, incomes for the bottom 90% shrank by 0.7%, while incomes for the top 10% grew by 24.1%. People in the bottom 50% experienced a mere 4% growth in median income over this 30-year period.
Real Median After-tax Income Growth (BC) 1982–2012
Top 0.1%
Top 1%
Top 10%
Bottom 99%
Bottom 90%
Bottom 50%
+78.3%
+40.7%
+24.1%
+0.3%
-0.7%
+4.0%
Source: Statistics Canada Table 204-0002.
INEQUALITY AND TAXES
BC’s tax system has become more unfair over the past 10 years, with the rich now paying a lower total provincial tax rate than middle- and low-income earners.
In 2010, the poorest fifth of BC households paid 14% to 15% of their income in tax, middle-income households paid 13% and the richest fifth paid only 11%.1
Additionally, the provincial government now collects more money from Medical Services Plan premiums (MSP"—"BC’s most unfair tax) than it does from corporate income taxes.2
1 Seth Klein, Iglika Ivanova and Marc Lee, A Decade of Eroding Tax Fairness in BC: Time for progressive tax reform, Canadian Centre for Policy Alternatives, June 2012
2 Seth Klein and Iglika Ivanova, Progressive Tax Options for BC Reform Ideas for Raising New Revenues and Enhancing Fairness, Canadian Centre for Policy Alternatives, January 2013, policyalternatives.ca/bc-tax-options
BC richest families’ share of
income paid in taxes:
11%
BC poorest families’ share of income paid in taxes:14–15%

2015 CHILD POVERTY REPORT CARDfirstcallbc.org42
FIRST CALL RECOMMENDS
■■ Implement the promised Canada Child Benefit with a maximum of $6,800 per child under 6 and $5,800 for children 6–17 years.
■■ Scrap the income splitting provisions for families with children and invest the money saved in the other recommended federal program enhancements.
■■ Increase funding for First Nations child welfare, education and community health services, and develop a long-term plan to eradicate poverty among Aboriginal families
■■ Create an independent commission on tax reform in BC aimed at making the tax system fairer and reducing income inequality.
See the full list of recommendations on pages 48 and 49.
POVERTY MAKES YOU SICK
If you are poor, you are more likely to suffer more illness, have a chronic health condition and die earlier. The Canadian Medical Association, in their report, What Makes Us Sick? notes, “Poverty in childhood can be a greater predictor of cardiovascular disease and diabetes in adults than later life circumstances and behaviour.”1
Poverty is a major contributor to health inequities, which in turn results in higher costs for our health and social service systems, as well as negative social impacts on people and our com-munities. It is estimated that $1.2 billion in health care costs could be saved if disadvantaged British Columbians were as healthy as those with higher education and incomes.2
1 Canadian Mental Health Association cma.ca/En/Pages/health-equity.aspx
2 Public Health Association of BC, Health Voices, povertybadforhealth.wordpress.com/poverty-health/ poverty-is-bad-for-your-health/
2015 CHILD POVERTY REPORT CARDfirstcallbc.org43
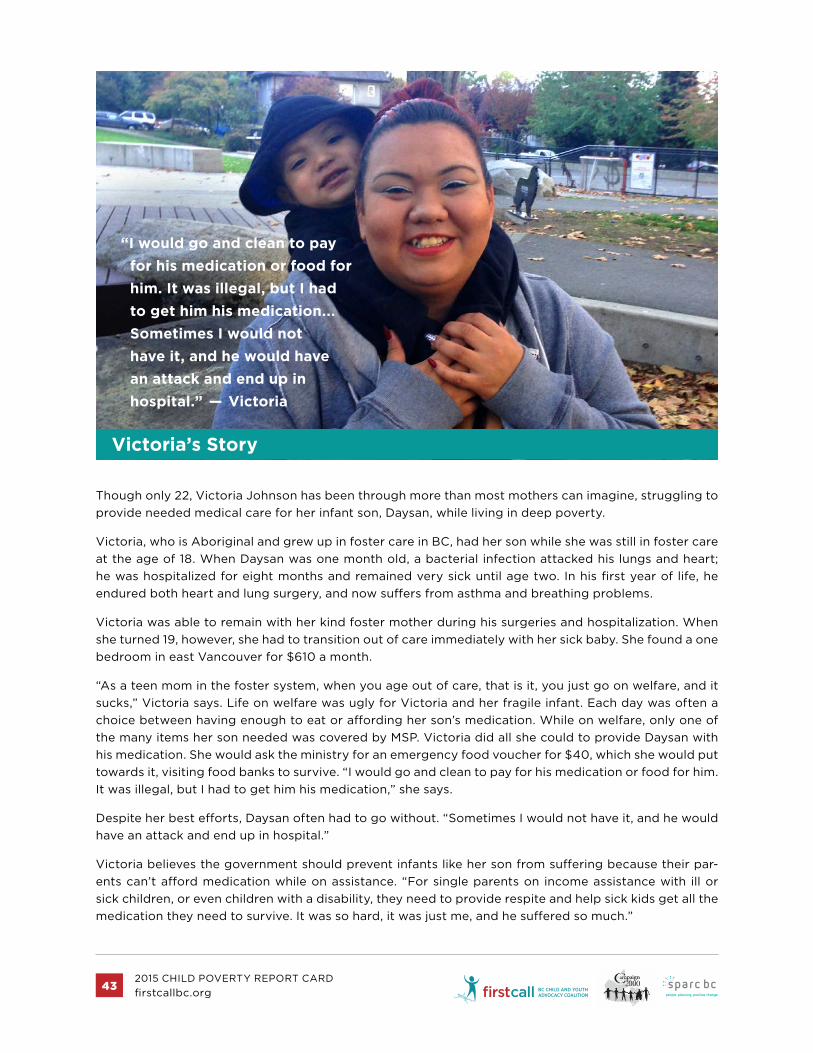
“I would go and clean to pay for his medication or food for him. It was illegal, but I had to get him his medication... Sometimes I would not have it, and he would have an attack and end up in hospital.” !—! Victoria
Victoria’s Story
Though only 22, Victoria Johnson has been through more than most mothers can imagine, struggling to provide needed medical care for her infant son, Daysan, while living in deep poverty.
Victoria, who is Aboriginal and grew up in foster care in BC, had her son while she was still in foster care at the age of 18. When Daysan was one month old, a bacterial infection attacked his lungs and heart; he was hospitalized for eight months and remained very sick until age two. In his first year of life, he endured both heart and lung surgery, and now suffers from asthma and breathing problems.
Victoria was able to remain with her kind foster mother during his surgeries and hospitalization. When she turned 19, however, she had to transition out of care immediately with her sick baby. She found a one bedroom in east Vancouver for $610 a month.
“As a teen mom in the foster system, when you age out of care, that is it, you just go on welfare, and it sucks,” Victoria says. Life on welfare was ugly for Victoria and her fragile infant. Each day was often a choice between having enough to eat or affording her son’s medication. While on welfare, only one of the many items her son needed was covered by MSP. Victoria did all she could to provide Daysan with his medication. She would ask the ministry for an emergency food voucher for $40, which she would put towards it, visiting food banks to survive. “I would go and clean to pay for his medication or food for him. It was illegal, but I had to get him his medication,” she says.
Despite her best efforts, Daysan often had to go without. “Sometimes I would not have it, and he would have an attack and end up in hospital.”
Victoria believes the government should prevent infants like her son from suffering because their par-ents can’t afford medication while on assistance. “For single parents on income assistance with ill or sick children, or even children with a disability, they need to provide respite and help sick kids get all the medication they need to survive. It was so hard, it was just me, and he suffered so much.”
Related Documents