William W. L. Cheung Co-Director & Associate Professor Nippon Foundation-Nereus Program The University of British Columbia, Canada Our Common Future, Paris, 8 July 2015. Responses of marine ecosystems to climate change and ocean acidification

Welcome message from author
This document is posted to help you gain knowledge. Please leave a comment to let me know what you think about it! Share it to your friends and learn new things together.
Transcript
William W. L. Cheung
Co-Director & Associate Professor
Nippon Foundation-Nereus Program
The University of British Columbia, Canada
Our Common Future, Paris, 8 July 2015.
Responses of marine ecosystems to
climate change and ocean acidification
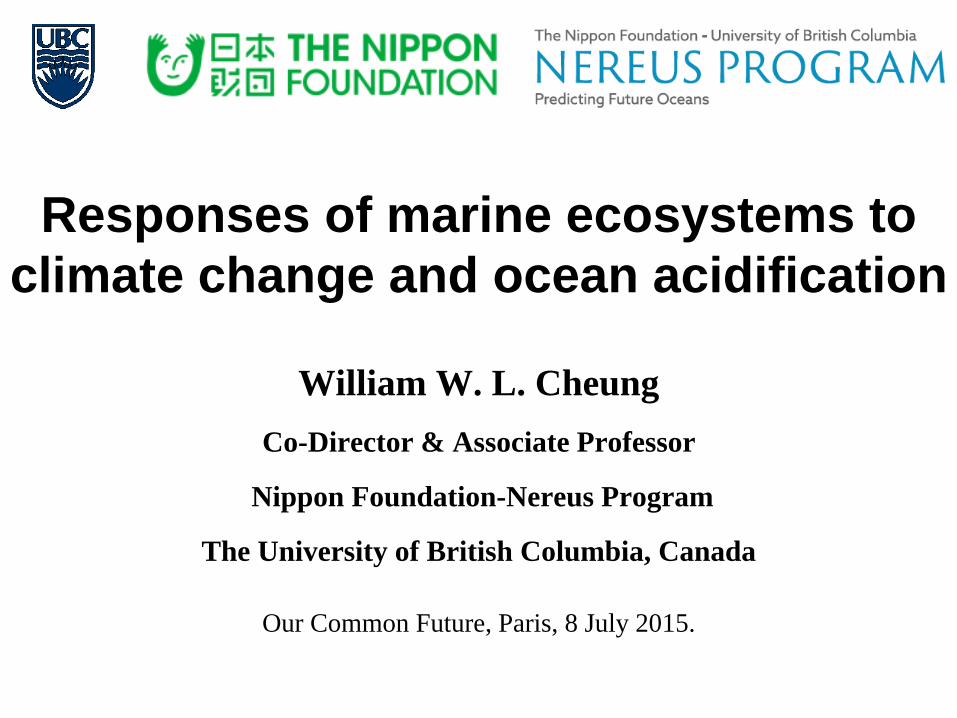
Gattuso, Magnan, Billé, Cheung, Howes, Joos, et al. 2015 Science.
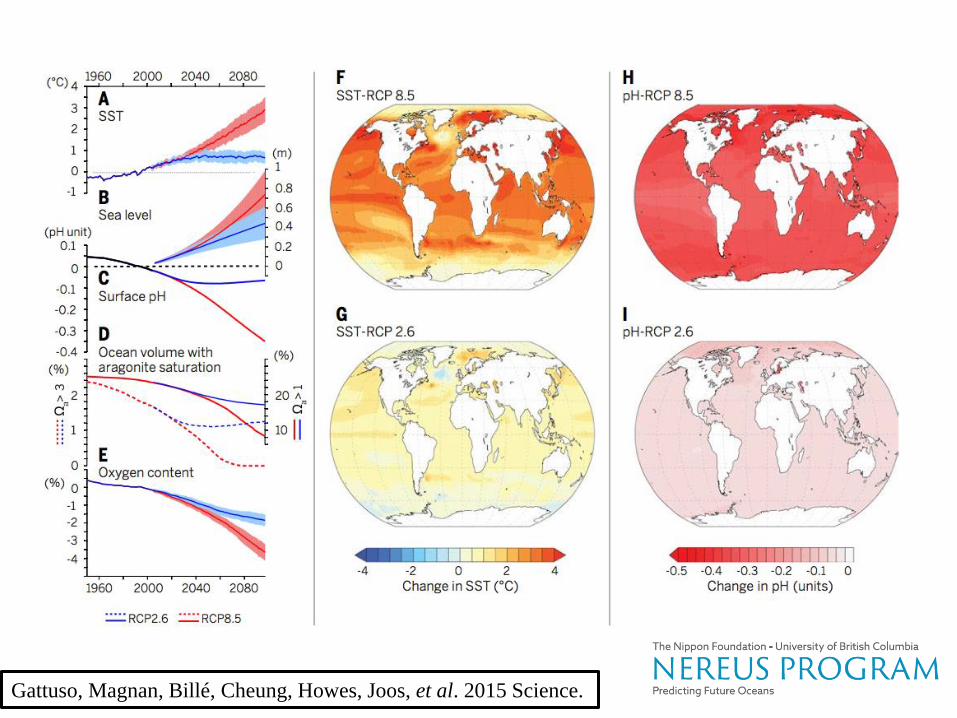
Climate change effects in the ocean
Physical Biological Social/Economics
From: Sumaila, Cheung, Lam, Pauly, Herrick (2011) Nature
Climate Change
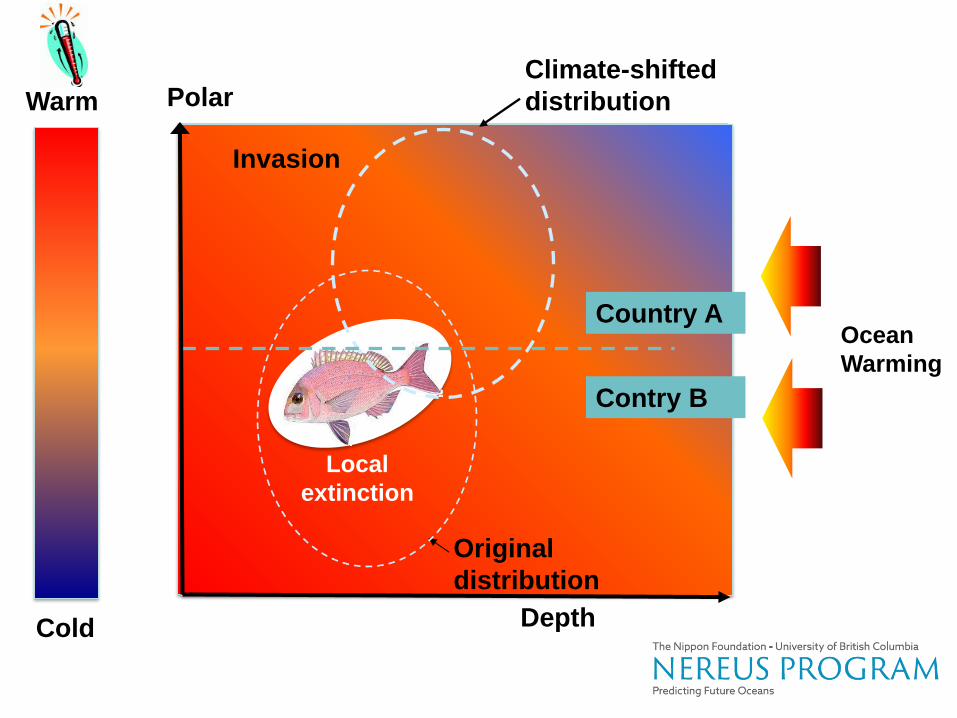
Polar
Country A
Contry B
Original
distribution
Depth
Climate-shifted
distribution
Local
extinction
Invasion
Ocean
Warming
Warm
Cold
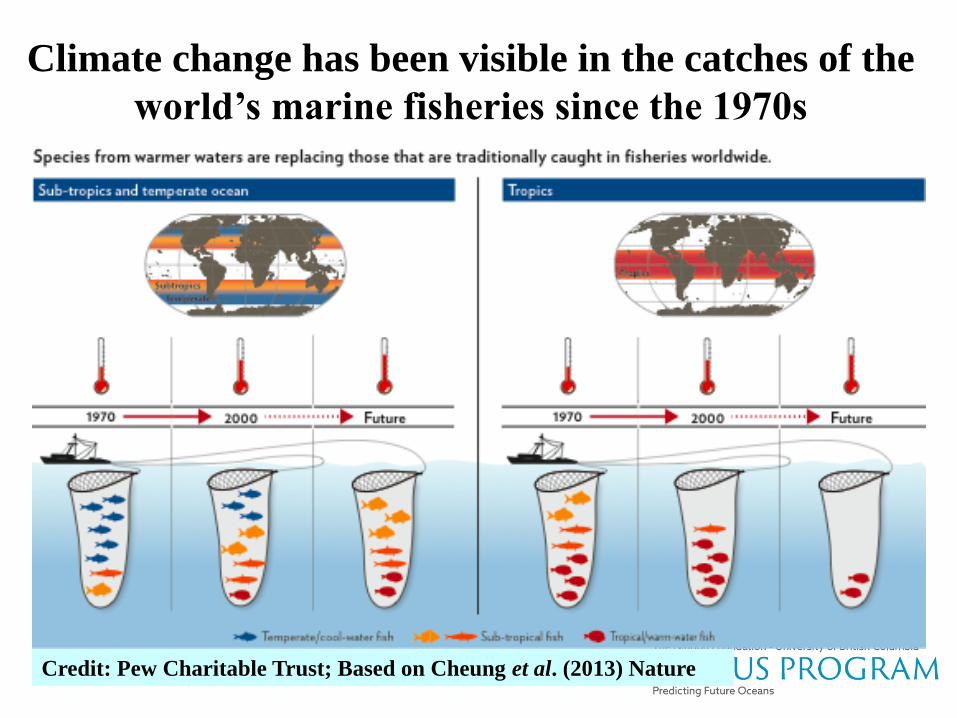
Climate change has been visible in the catches of the
world’s marine fisheries since the 1970s
Credit: Pew Charitable Trust; Based on Cheung et al. (2013) Nature
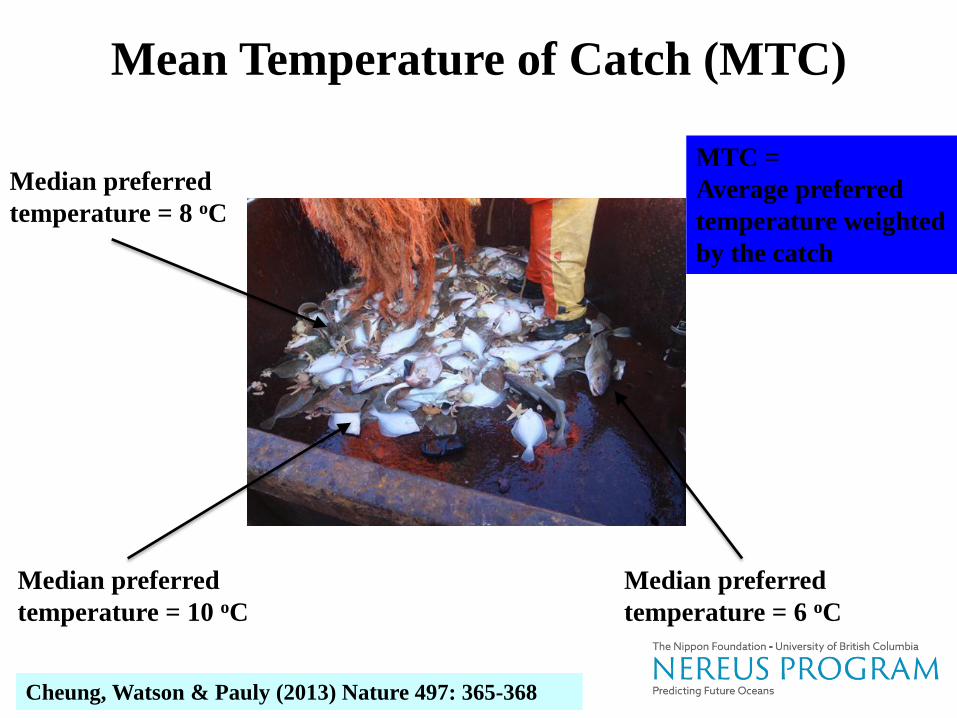
Median preferred
temperature = 10 oC
Mean Temperature of Catch (MTC)
Cheung, Watson & Pauly (2013) Nature 497: 365-368
Median preferred
temperature = 6 oC
Median preferred
temperature = 8 oC
MTC =
Average preferred
temperature weighted
by the catch
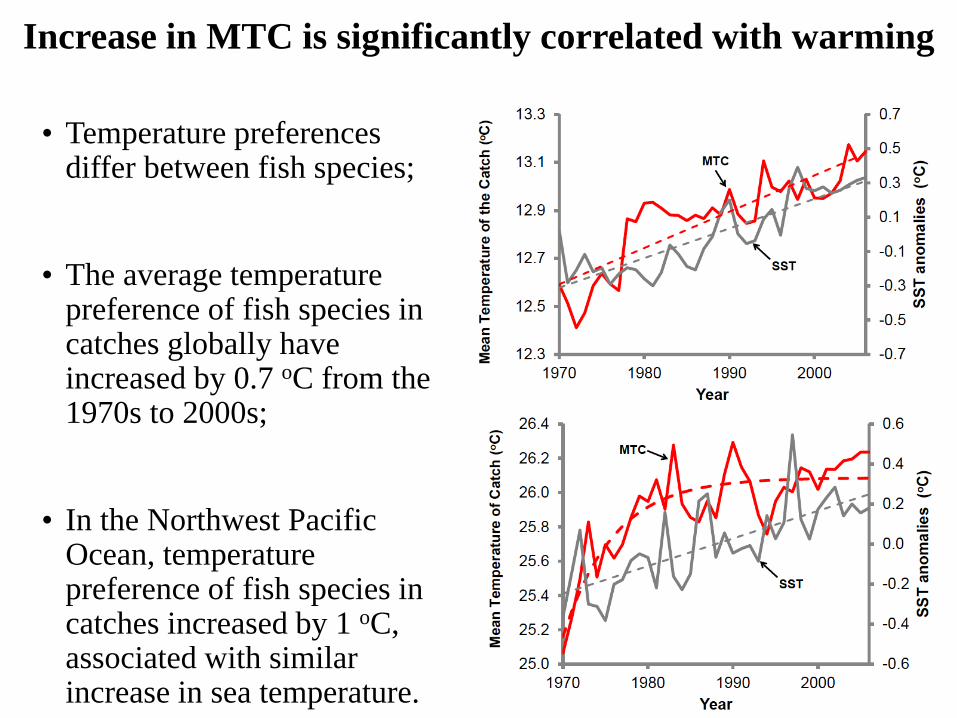
Increase in MTC is significantly correlated with warming
• Temperature preferences differ between fish species;
• The average temperature preference of fish species in catches globally have increased by 0.7 oC from the 1970s to 2000s;
• In the Northwest Pacific Ocean, temperature preference of fish species in catches increased by 1 oC, associated with similar increase in sea temperature.
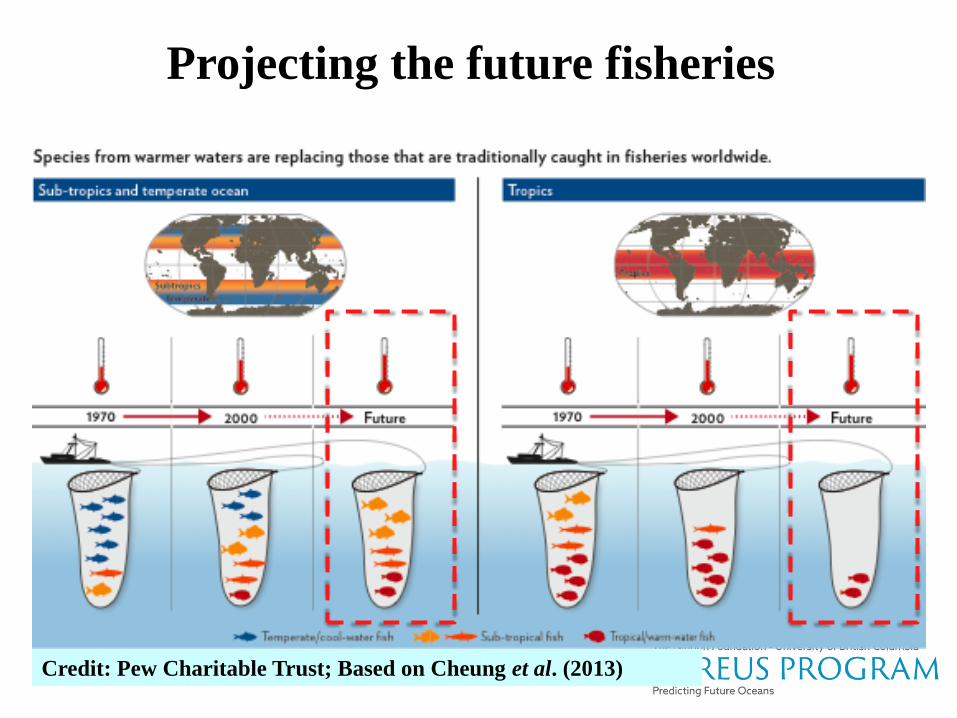
Projecting the future fisheries
Credit: Pew Charitable Trust; Based on Cheung et al. (2013)
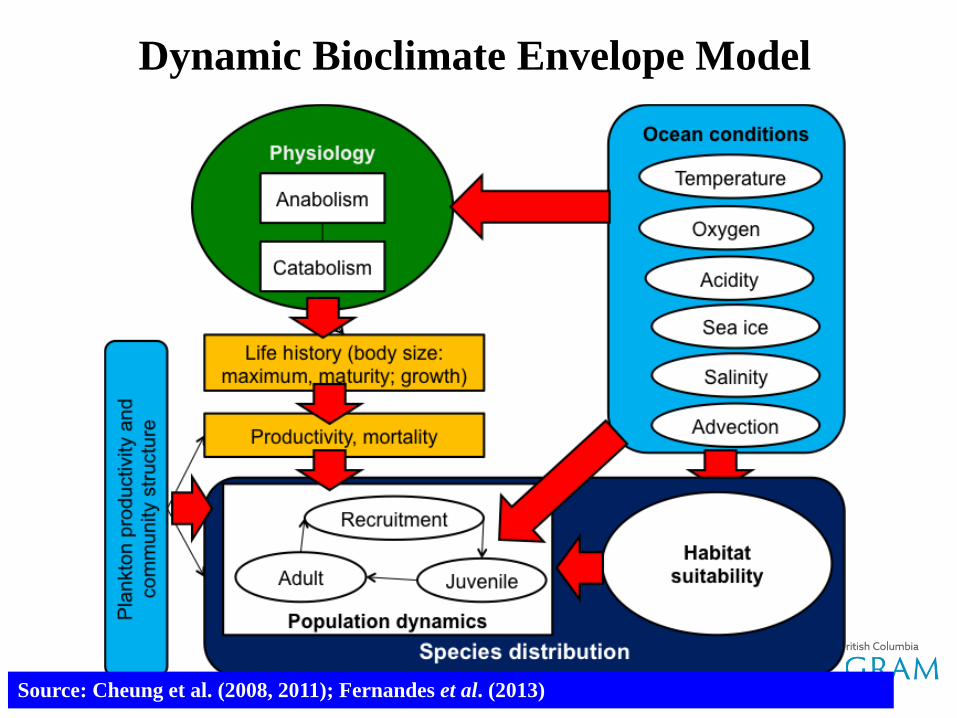
Dynamic Bioclimate Envelope Model
Source: Cheung et al. (2008, 2011); Fernandes et al. (2013)
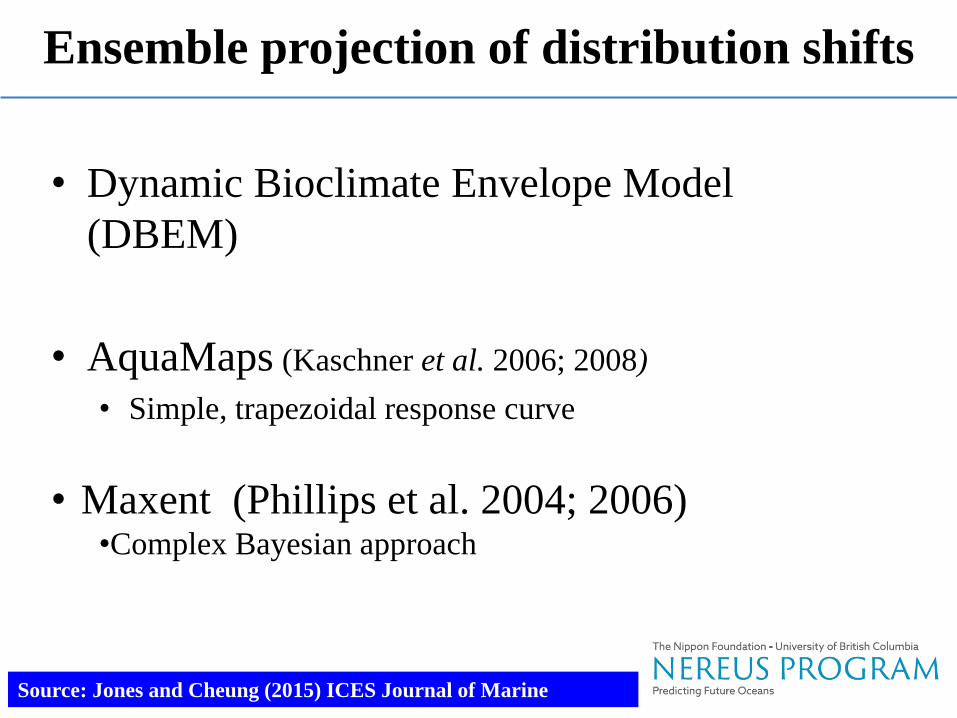
• Dynamic Bioclimate Envelope Model
(DBEM)
• AquaMaps (Kaschner et al. 2006; 2008)
• Simple, trapezoidal response curve
• Maxent (Phillips et al. 2004; 2006) •Complex Bayesian approach
Ensemble projection of distribution shifts
Source: Jones and Cheung (2015) ICES Journal of Marine
Sciences

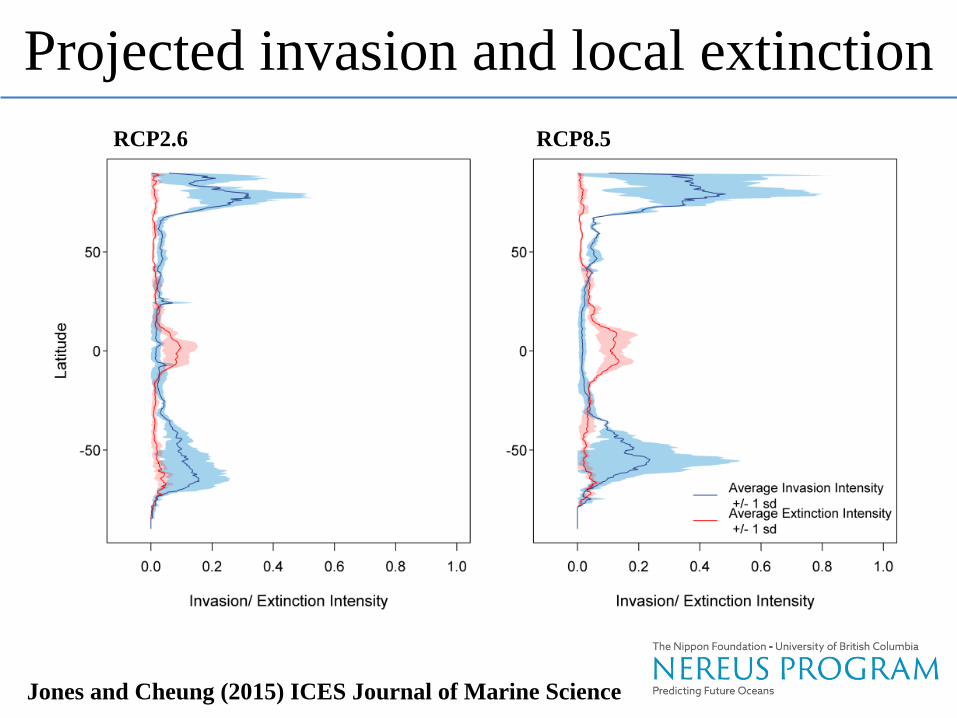
Projected invasion and local extinction
Jones and Cheung (2015) ICES Journal of Marine Science
RCP2.6 RCP8.5
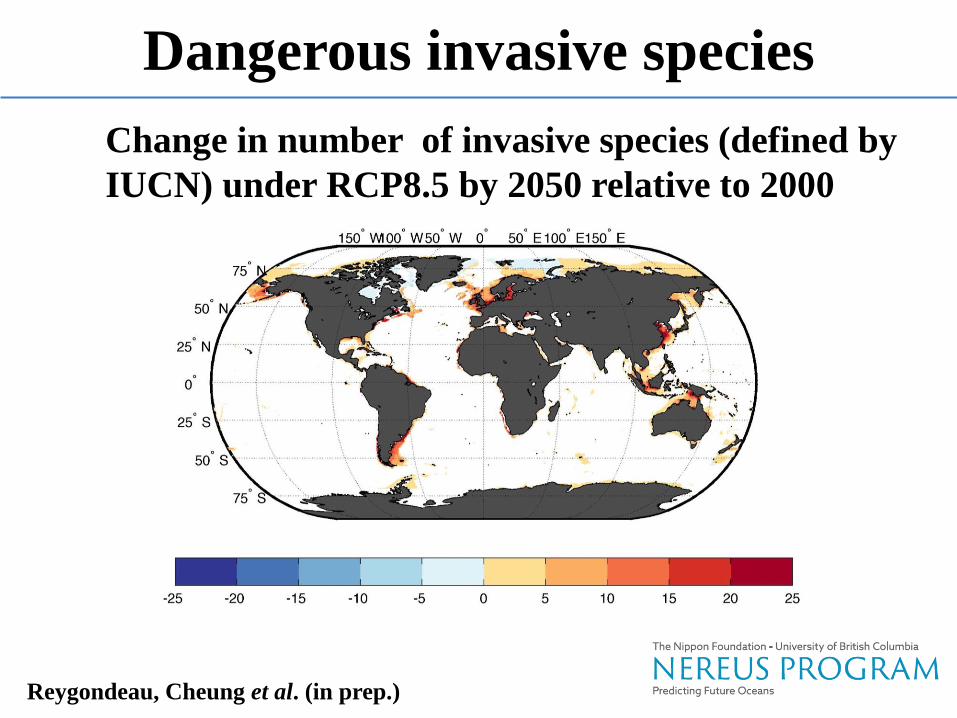
Dangerous invasive species
Reygondeau, Cheung et al. (in prep.)
Change in number of invasive species (defined by
IUCN) under RCP8.5 by 2050 relative to 2000
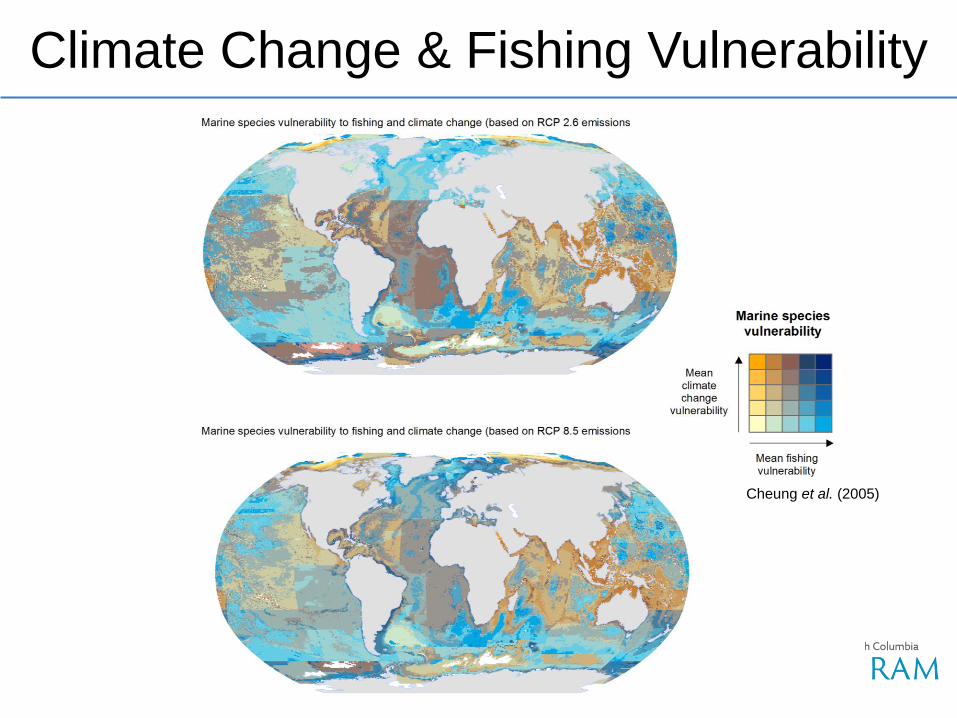
Climate Change & Fishing Vulnerability
Cheung et al. (2005)
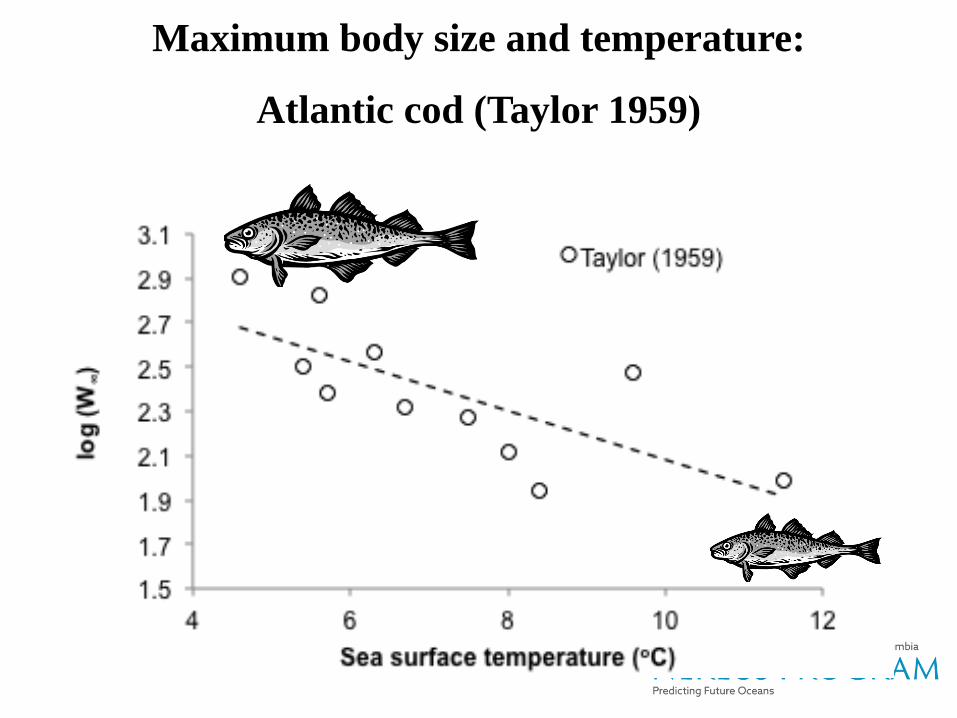
Maximum body size and temperature:
Atlantic cod (Taylor 1959)
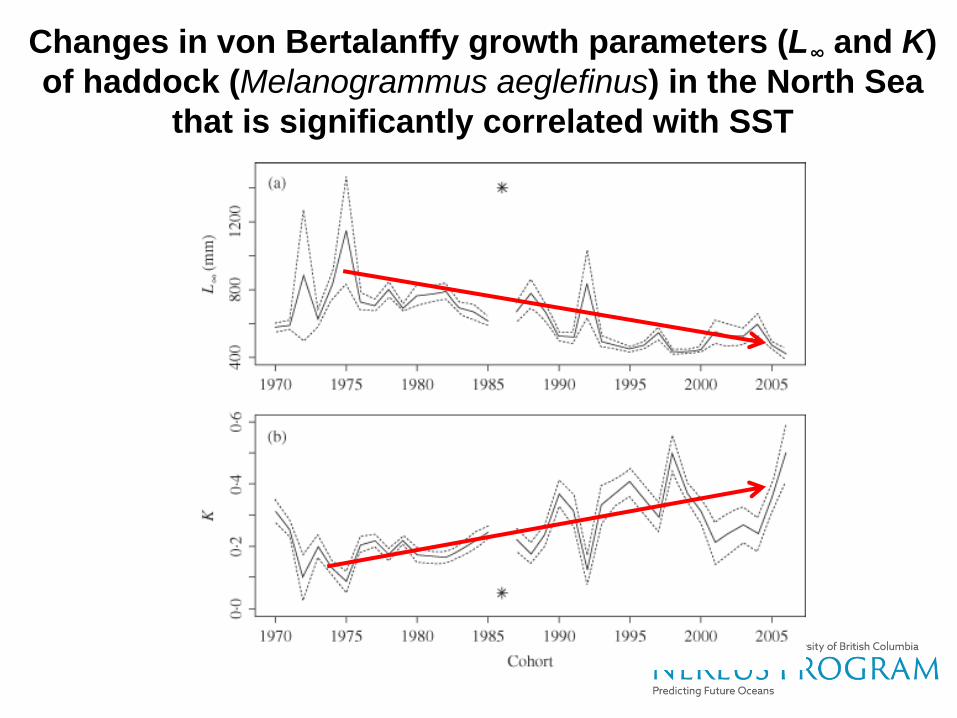
Changes in von Bertalanffy growth parameters (L∞ and K)
of haddock (Melanogrammus aeglefinus) in the North Sea
that is significantly correlated with SST
Source: Baudron et al. (2011)
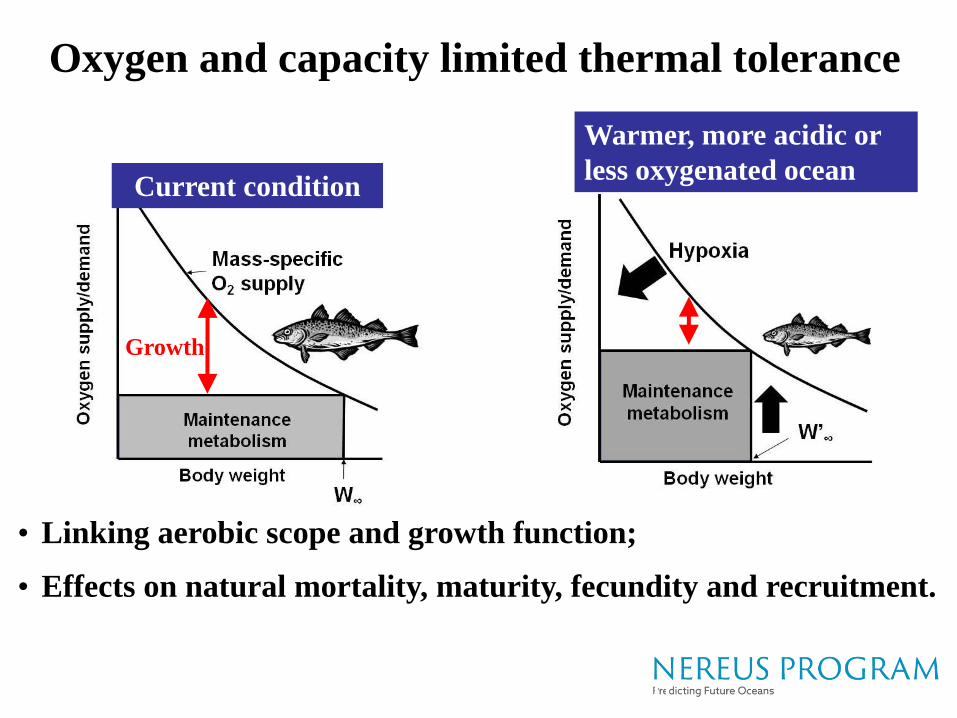
Oxygen and capacity limited thermal tolerance
Source: Pauly (2010); Cheung, Dunne, Sarmiento, Pauly (2011)
Current condition
Warmer, more acidic or
less oxygenated ocean
• Linking aerobic scope and growth function;
• Effects on natural mortality, maturity, fecundity and recruitment.
Growth
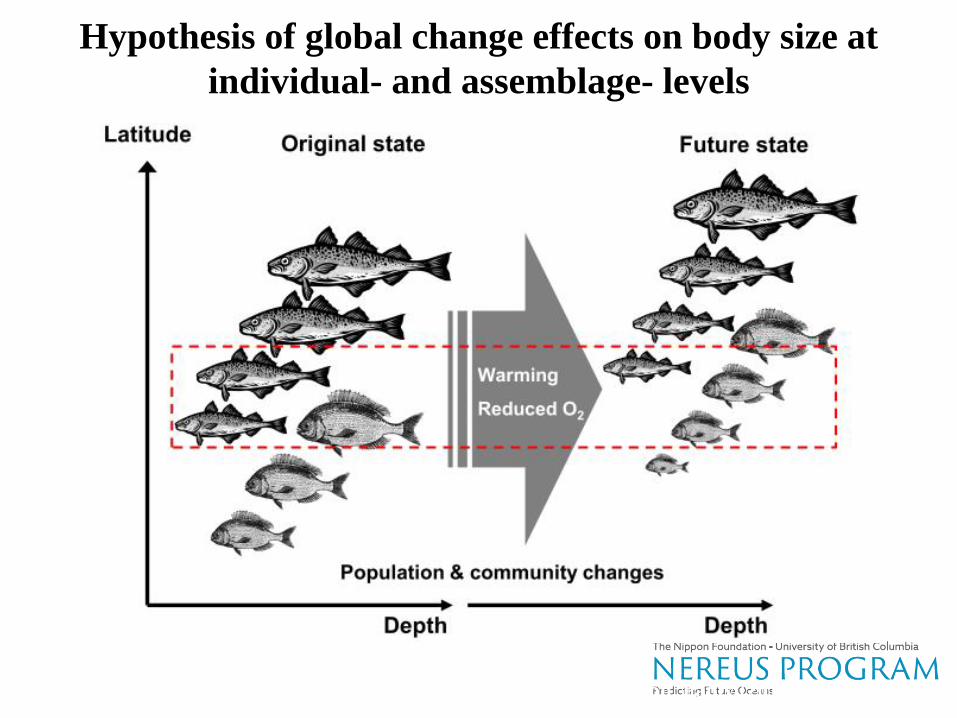
Hypothesis of global change effects on body size at
individual- and assemblage- levels
Source: Cheung, Sarmiento, Dunne, Frölicher, Lam, Palomares, Watson, Pauly (2012)
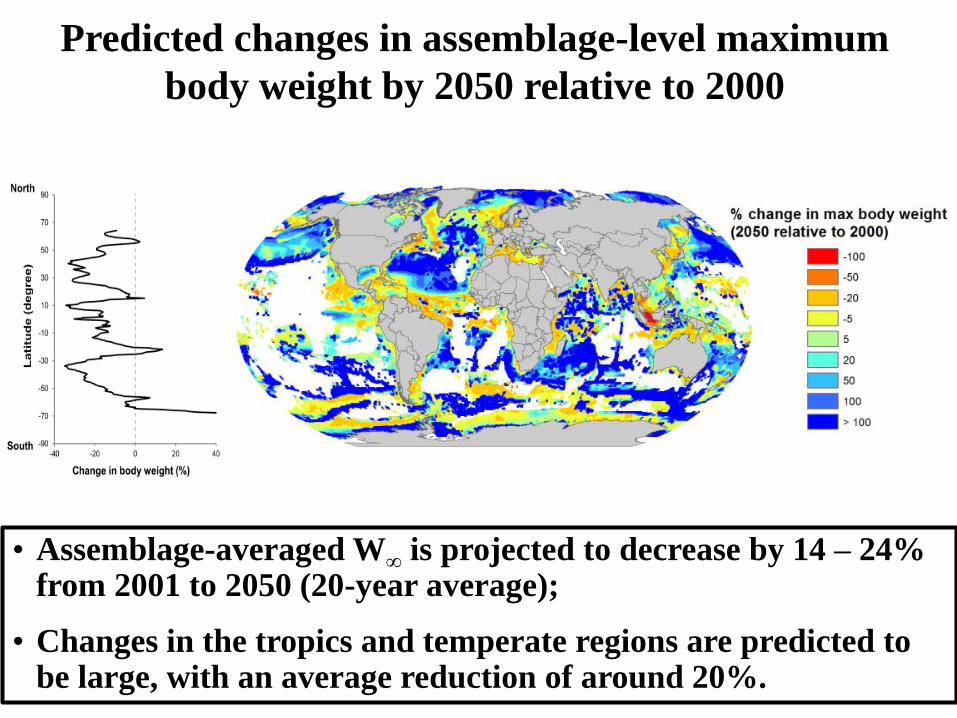
Predicted changes in assemblage-level maximum
body weight by 2050 relative to 2000
• Assemblage-averaged W∞ is projected to decrease by 14 – 24% from 2001 to 2050 (20-year average);
• Changes in the tropics and temperate regions are predicted to be large, with an average reduction of around 20%.
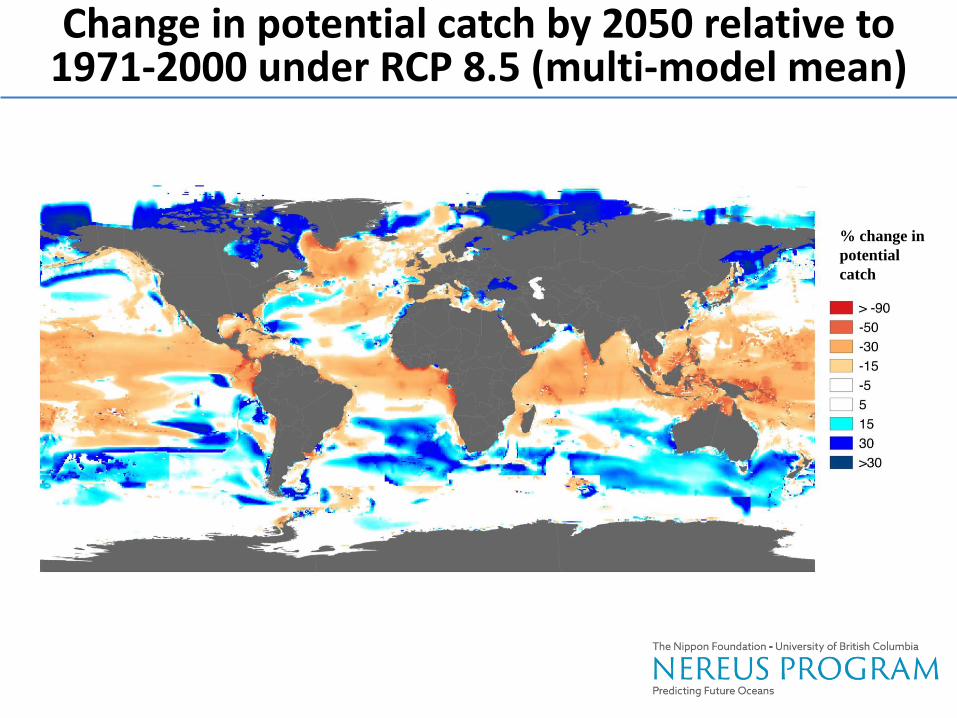
Change in potential catch by 2050 relative to 1971-2000 under RCP 8.5 (multi-model mean)
% change in
potential
catch
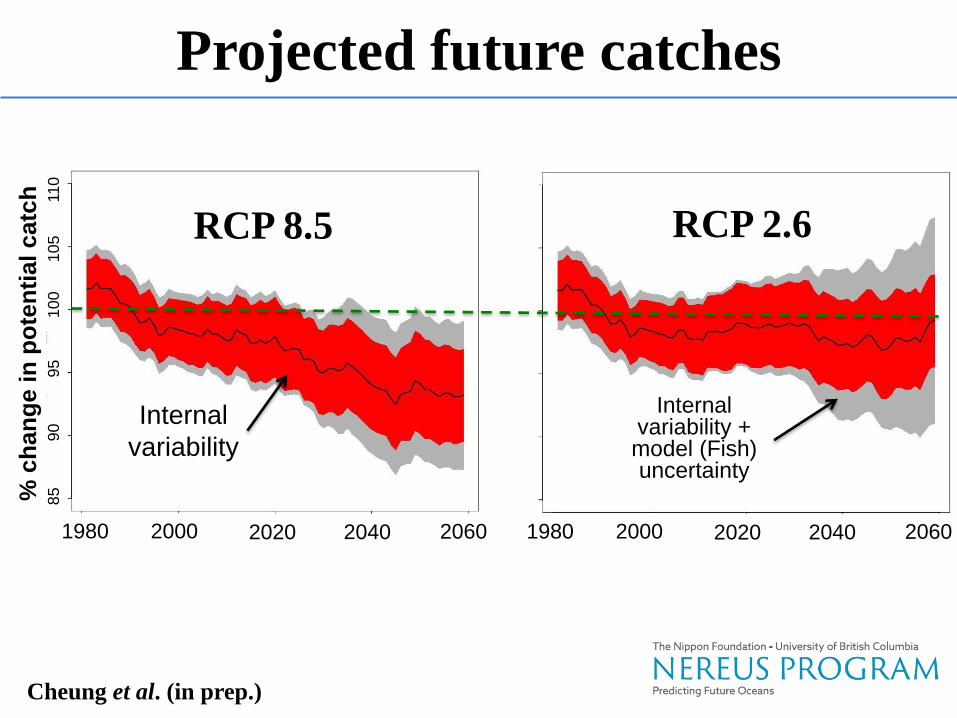
Projected future catches
Cheung et al. (in prep.)
1980 2000 2020 2040 2060
100
95
90
105
110
85
% c
han
ge in
po
ten
tial c
atc
h
1980 2000 2020 2040 2060
RCP 8.5 RCP 2.6
Internal
variability
Internal variability + model (Fish) uncertainty
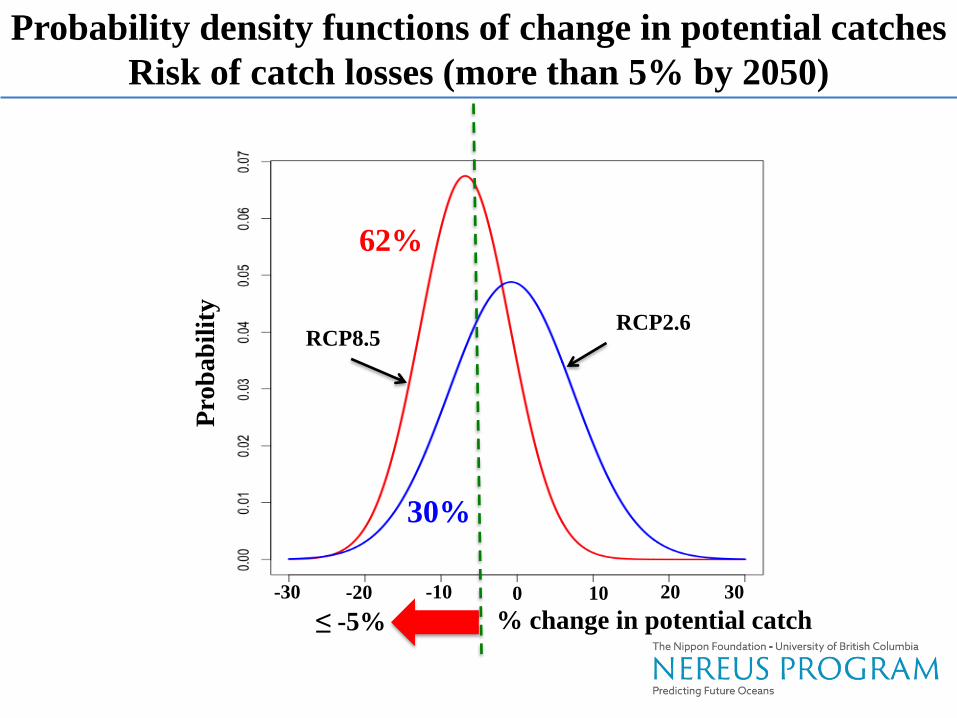
Probability density functions of change in potential catches
Risk of catch losses (more than 5% by 2050)
RCP2.6 RCP8.5
62%
30%
≤ -5% % change in potential catch
Pro
bab
ilit
y
-30 -20 0 10 30 -10 20
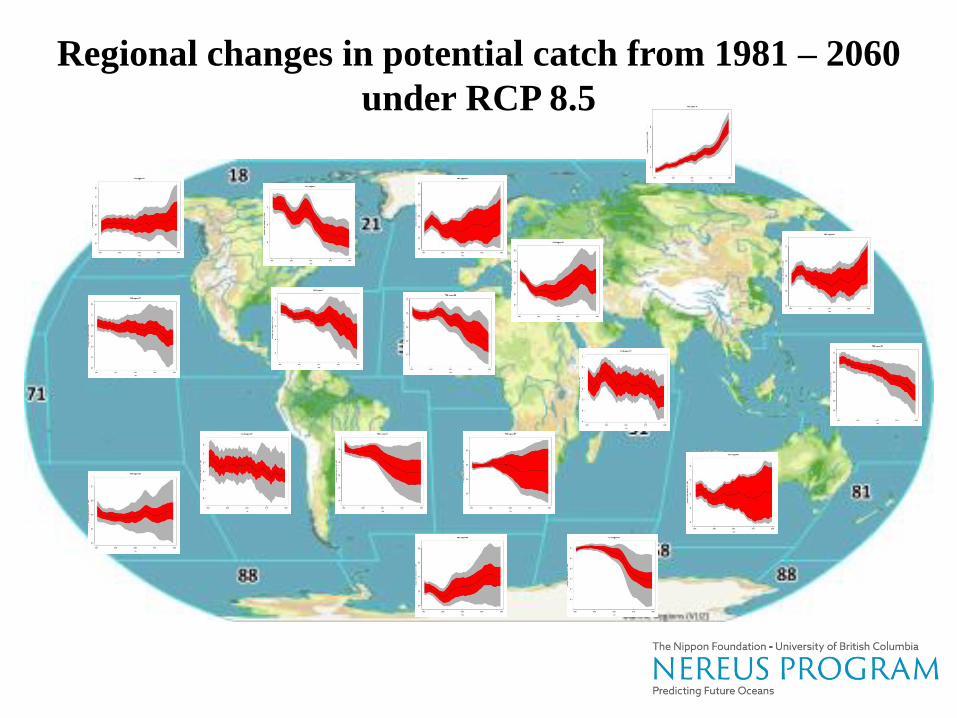
Regional changes in potential catch from 1981 – 2060
under RCP 8.5
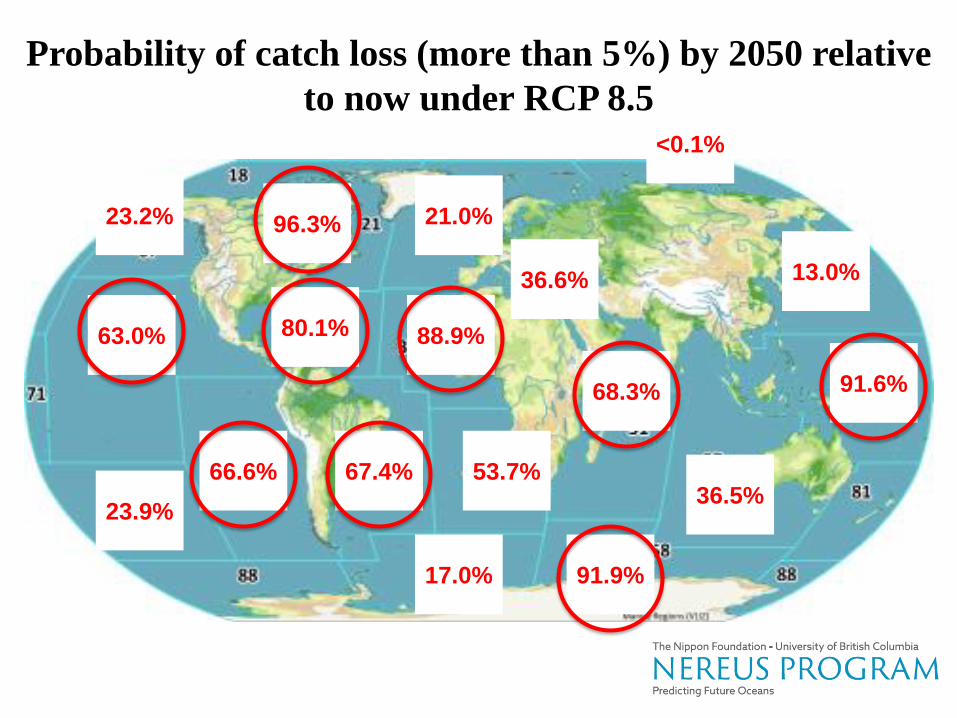
23.2% 96.3%
63.0% 80.1%
23.9%
66.6% 67.4%
21.0%
<0.1%
88.9%
36.6% 13.0%
91.6% 68.3%
53.7% 36.5%
91.9% 17.0%
Probability of catch loss (more than 5%) by 2050 relative
to now under RCP 8.5
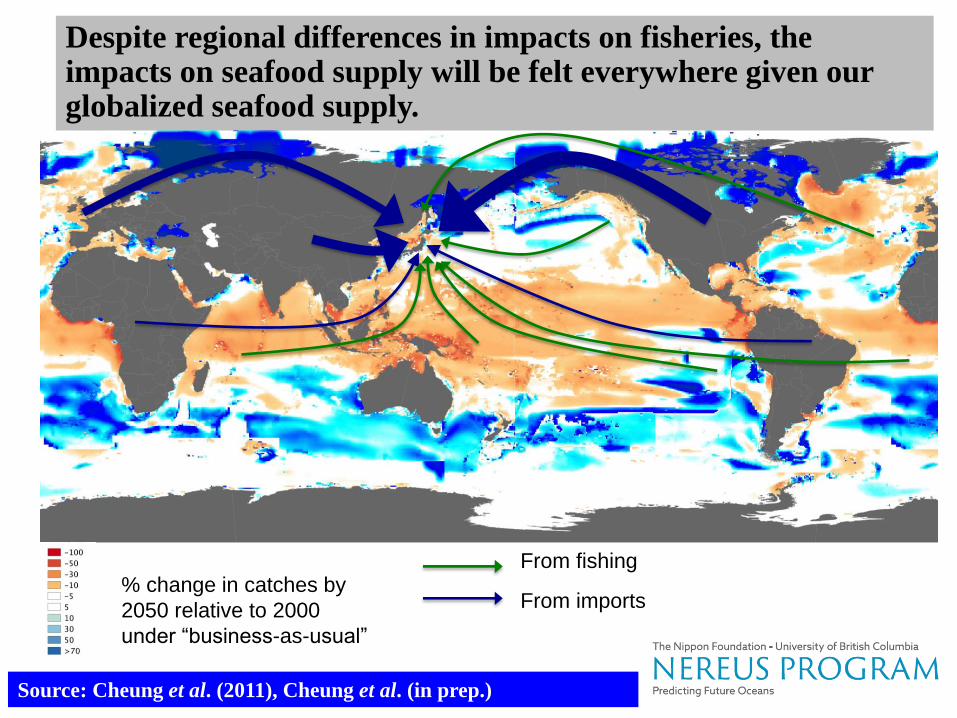
Despite regional differences in impacts on fisheries, the impacts on seafood supply will be felt everywhere given our globalized seafood supply.
From fishing
From imports % change in catches by
2050 relative to 2000
under “business-as-usual”
Source: Cheung et al. (2011), Cheung et al. (in prep.)
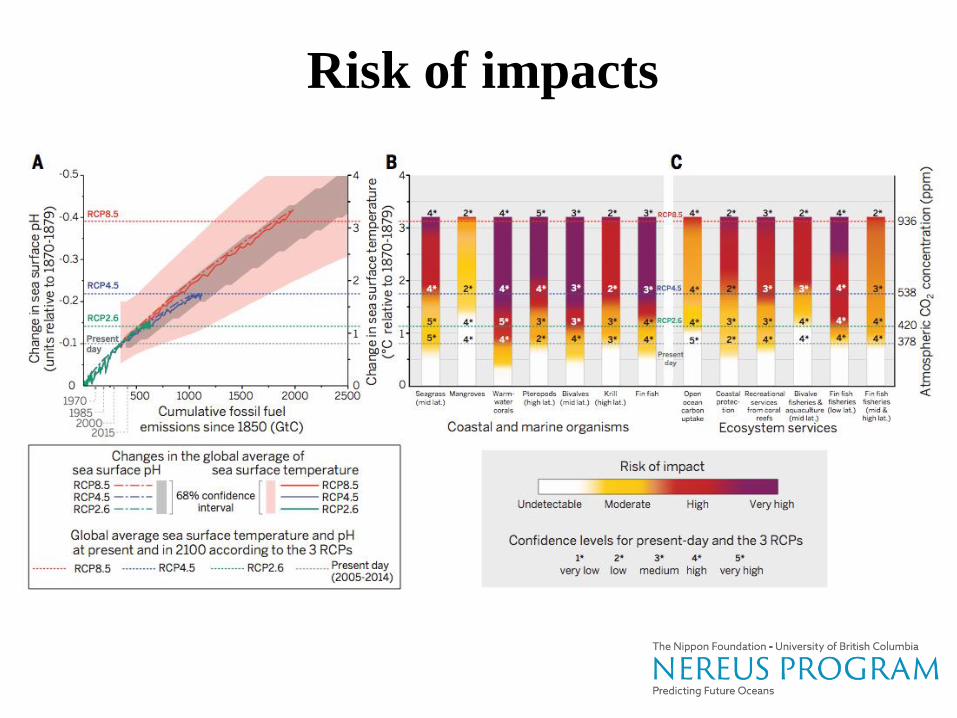
Risk of impacts
Summary
• Climate change has been visible in the catches of the world’s marine fish stocks since the 1970s, with increasing dominant of warm water species in catches at a rate that is similar to ocean warming;
• If current trend of ocean warming, increasing acidity and decreasing oxygen availability continues, fishes and invertebrates are predicted to shift poleward by 100s to 1000s of km by 2050, resulting in species invasion and local extinctions;
• Body size of fishes are projected to decrease with ocean warming and decrease in oxygen levels;
• Overall, the risk of impacts on marine species and ecosystem services will be high to very high under RCP 8.5 but it can be substantially reduced by moving to RCP 2.6.
Contributions from research team
Ocean2015 Initiatives
Acknowledgement
Ocean2015 Initiatives
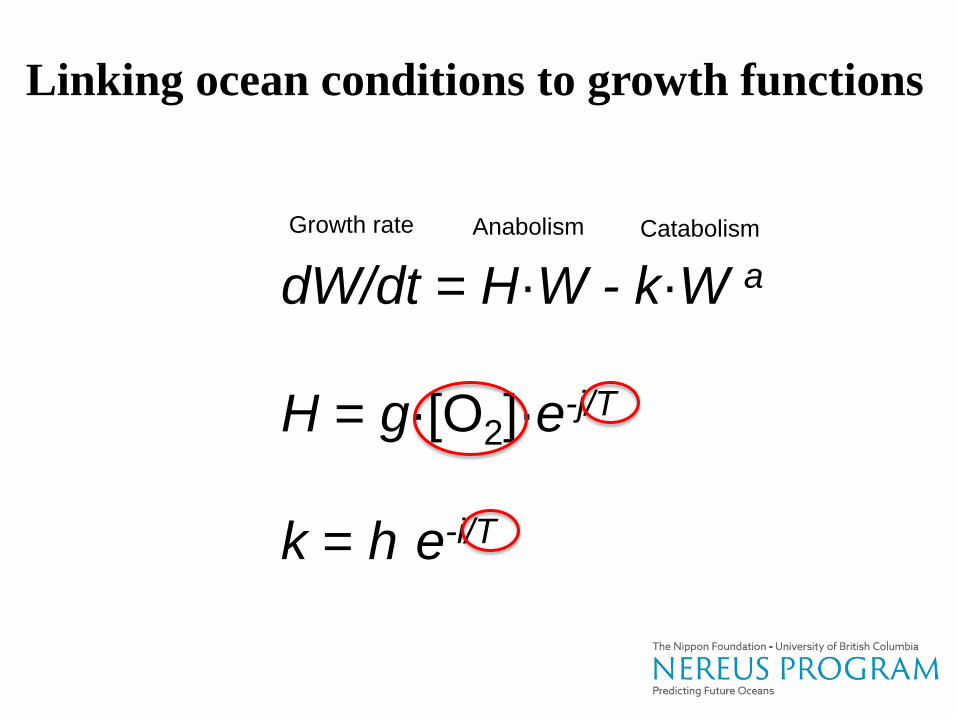
dW/dt = H·W - k·W a
H = g·[O2]·e-j/T
k = h·e-i/T
Linking ocean conditions to growth functions
Anabolism Catabolism Growth rate
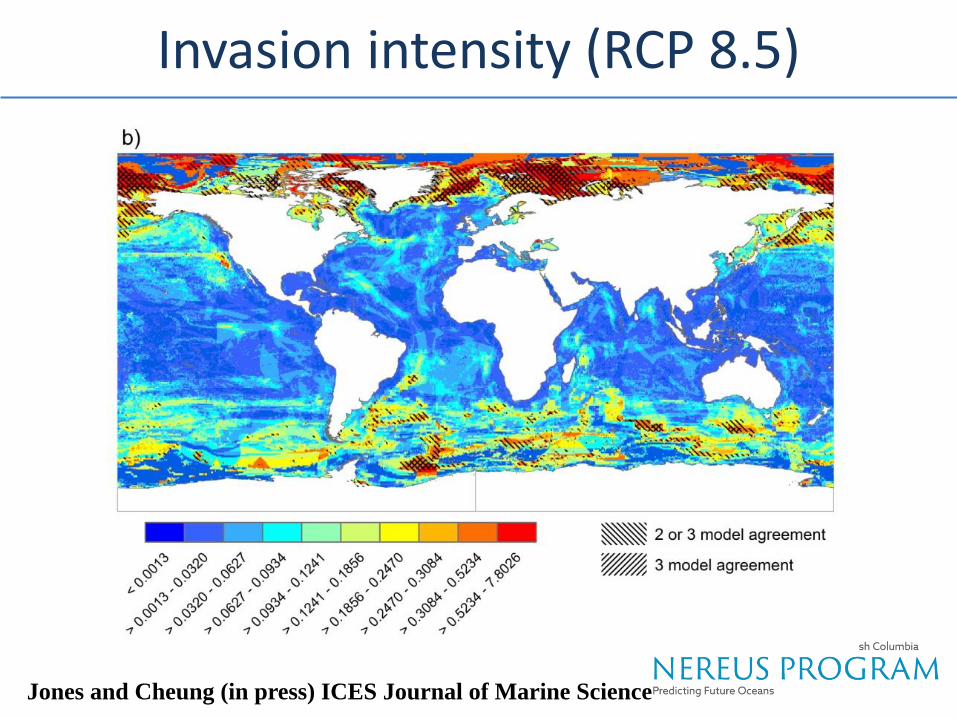
Invasion intensity (RCP 8.5)
Jones and Cheung (in press) ICES Journal of Marine Science
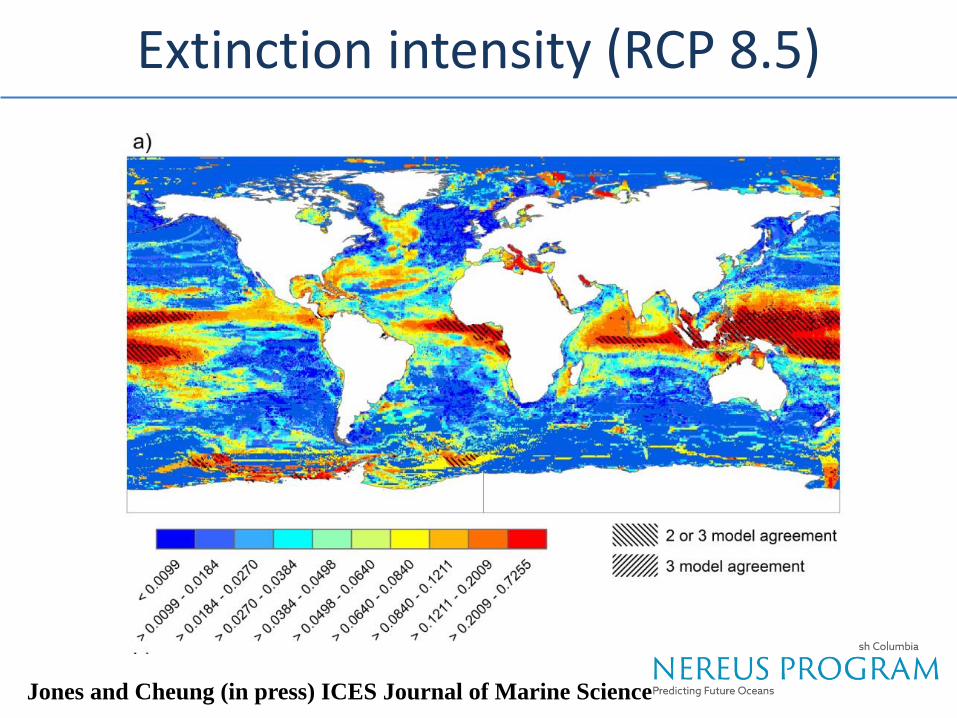
Extinction intensity (RCP 8.5)
Jones and Cheung (in press) ICES Journal of Marine Science
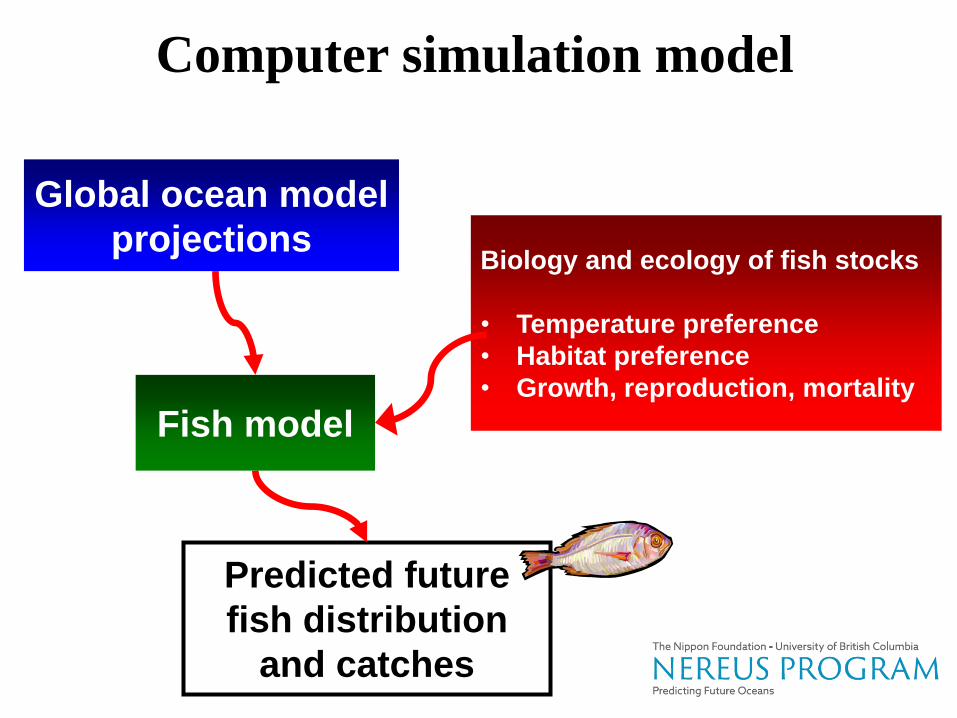
Global ocean model
projections
Computer simulation model
Biology and ecology of fish stocks
• Temperature preference
• Habitat preference
• Growth, reproduction, mortality
Predicted future
fish distribution
and catches
Fish model
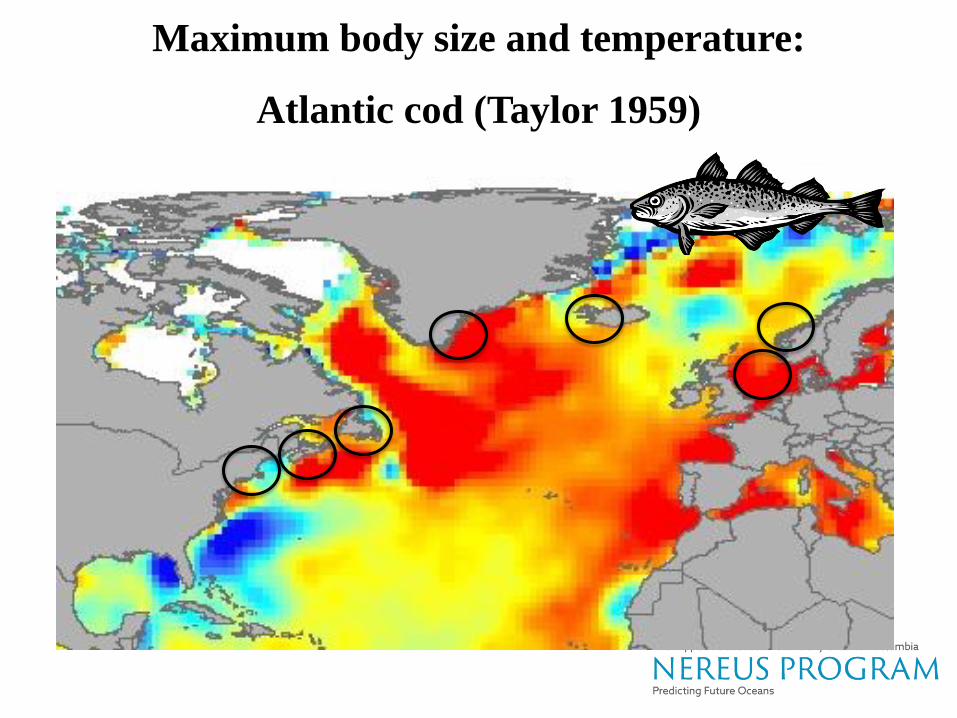
Maximum body size and temperature:
Atlantic cod (Taylor 1959)
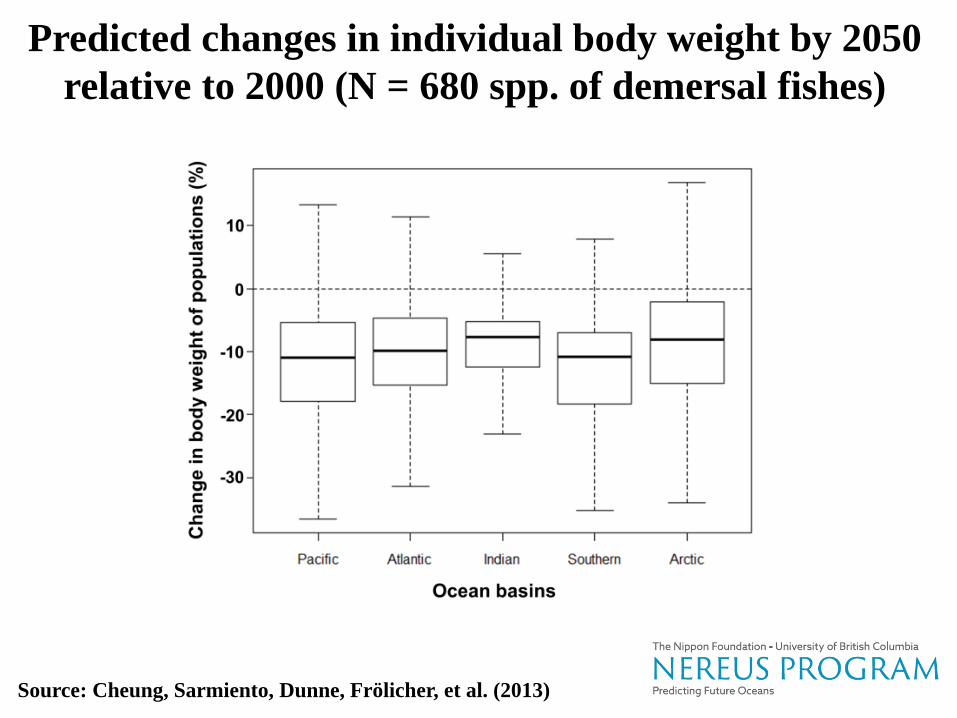
Predicted changes in individual body weight by 2050
relative to 2000 (N = 680 spp. of demersal fishes)
Source: Cheung, Sarmiento, Dunne, Frölicher, et al. (2013)
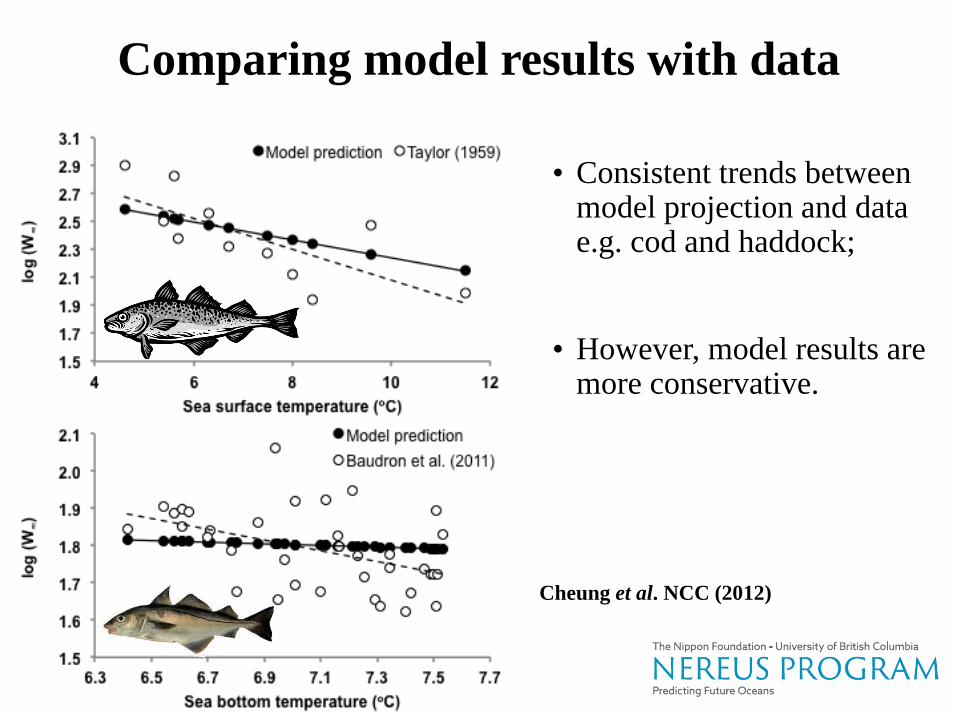
Comparing model results with data
• Consistent trends between model projection and data e.g. cod and haddock;
• However, model results are more conservative.
Model predictions
Source: Cheung et al. NCC (2012)
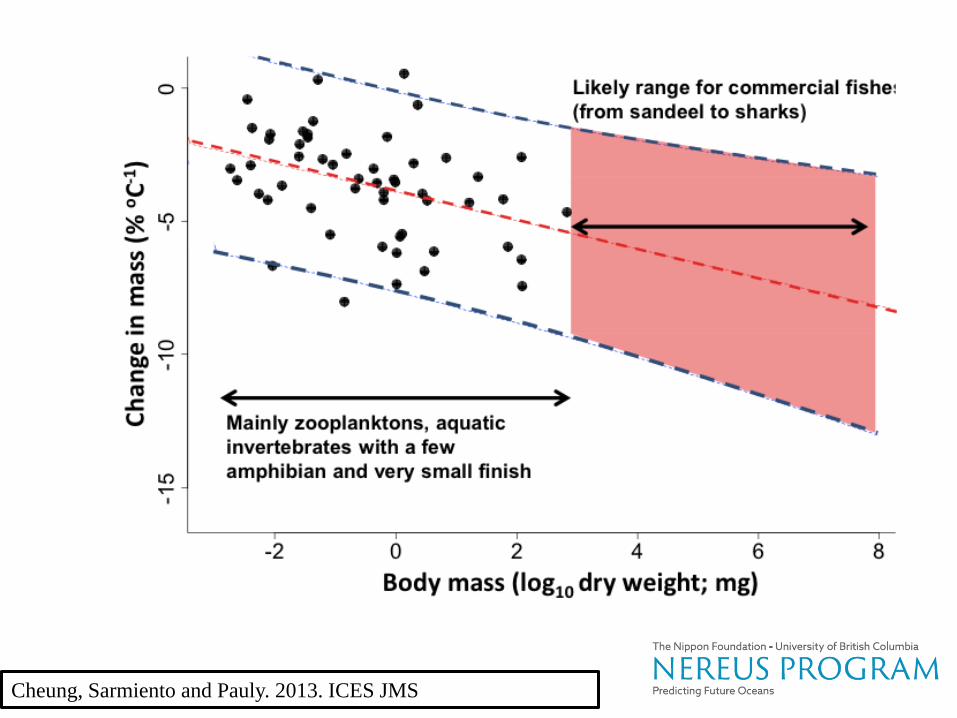
Source: Forster et al. (2013) Cheung, Sarmiento and Pauly. 2013. ICES JMS
Related Documents