Acta Materialia 50 (2002) 4741–4753 www.actamat-journals.com Chemical reaction-limited spreading: the triple line velocity versus contact angle relation O. Dezellus, F. Hodaj, N. Eustathopoulos ∗ LTPCM-UMR 5614 CNRS-INPG-UJF/ENSEEG, BP 75, Domaine Universitaire F-38402, Saint-Martin d’He `res Cedex, France Received 3 January 2002; received in revised form 8 July 2002; accepted 8 July 2002 Abstract The mechanisms of reaction-limited spreading of molten copper and nickel silicides on carbon substrates are studied by the dispensed drop variant of the sessile drop technique under high vacuum. Both standard wetting experiments and experiments which separate the effect of time and instantaneous contact angle on spreading rate are carried out. Equations are derived for the time-dependent variation of contact angle and spreading rate. 2002 Acta Materialia Inc. Published by Elsevier Science Ltd. All rights reserved. Keywords: Wetting; Reactivity; Contact angle; Adhesion; Metals; Carbon 1. Introduction In reactive spreading limited by the chemical reaction rate at the triple line, the triple line velo- city is considerably greater in the high contact angle range (q 100°) compared to the nearly constant velocities observed at lower contact angles. In Ref. [1], it is shown that this behaviour is not due to the reaction occurring at the head of the triple line during spreading by an evaporation– condensation mechanism. Another possibility, pro- posed by Landry and Eustathopoulos [2] is that the comparatively high triple line velocities observed at q 100° are due to a contribution of the reac- tion behind the triple line. The purpose of this study is to examine this ∗ Corresponding author. Fax: +33-4-7682-6767. E-mail address: [email protected] (N. Eustathopoulos). 1359-6454/02/$22.00. 2002 Acta Materialia Inc. Published by Elsevier Science Ltd. All rights reserved. PII:S1359-6454(02)00309-9 point of view and more generally move towards a model of this type of reactive spreading by estab- lishing the expressions describing the time-depen- dent change of contact angle and spreading rate. The systems chosen for the study are Cu–50 at% Si and Cu–40 at% Si alloys on vitreous carbon (C v ) substrate and Ni–63 at% Si alloy on the same sub- strate. These alloys react with C v to form smooth layers of SiC which is a nearly covalent ceramic well wetted by molten silicides [3,4]. To obtain rig- orously isothermal wetting conditions, sessile drop experiments were conducted using the ‘dispensed drop’ variant of the sessile drop technique [5]. 2. Experimental procedure A substrate of vitreous carbon (V25 vitreous car- bon, featuring no open porosity, an ash content of less than 50 ppm and a density of 1500–1550 kg

Welcome message from author
This document is posted to help you gain knowledge. Please leave a comment to let me know what you think about it! Share it to your friends and learn new things together.
Transcript
Acta Materialia 50 (2002) 4741–4753www.actamat-journals.com
Chemical reaction-limited spreading: the triple line velocityversus contact angle relation
O. Dezellus, F. Hodaj, N. Eustathopoulos ∗
LTPCM-UMR 5614 CNRS-INPG-UJF/ENSEEG, BP 75, Domaine Universitaire F-38402, Saint-Martin d’Heres Cedex, France
Received 3 January 2002; received in revised form 8 July 2002; accepted 8 July 2002
Abstract
The mechanisms of reaction-limited spreading of molten copper and nickel silicides on carbon substrates are studiedby the dispensed drop variant of the sessile drop technique under high vacuum. Both standard wetting experimentsand experiments which separate the effect of time and instantaneous contact angle on spreading rate are carried out.Equations are derived for the time-dependent variation of contact angle and spreading rate. 2002 Acta Materialia Inc. Published by Elsevier Science Ltd. All rights reserved.
Keywords: Wetting; Reactivity; Contact angle; Adhesion; Metals; Carbon
1. Introduction
In reactive spreading limited by the chemicalreaction rate at the triple line, the triple line velo-city is considerably greater in the high contactangle range (q � 100°) compared to the nearlyconstant velocities observed at lower contactangles. In Ref. [1], it is shown that this behaviouris not due to the reaction occurring at the head ofthe triple line during spreading by an evaporation–condensation mechanism. Another possibility, pro-posed by Landry and Eustathopoulos [2] is that thecomparatively high triple line velocities observedat q � 100° are due to a contribution of the reac-tion behind the triple line.
The purpose of this study is to examine this
∗ Corresponding author. Fax: +33-4-7682-6767.E-mail address: [email protected] (N. Eustathopoulos).
1359-6454/02/$22.00. 2002 Acta Materialia Inc. Published by Elsevier Science Ltd. All rights reserved.PII: S 13 59 -6454( 02 )0 0309-9
point of view and more generally move towards amodel of this type of reactive spreading by estab-lishing the expressions describing the time-depen-dent change of contact angle and spreading rate.
The systems chosen for the study are Cu–50 at%Si and Cu–40 at% Si alloys on vitreous carbon (Cv)substrate and Ni–63 at% Si alloy on the same sub-strate. These alloys react with Cv to form smoothlayers of SiC which is a nearly covalent ceramicwell wetted by molten silicides [3,4]. To obtain rig-orously isothermal wetting conditions, sessile dropexperiments were conducted using the ‘dispenseddrop’ variant of the sessile drop technique [5].
2. Experimental procedure
A substrate of vitreous carbon (V25 vitreous car-bon, featuring no open porosity, an ash content ofless than 50 ppm and a density of 1500–1550 kg
4742 O. Dezellus et al. / Acta Materialia 50 (2002) 4741–4753
m�3, provided by Le Carbone-Lorraine, France)was mechanically polished to a 1 µm diamondpaste. Average roughness Ra values of polishedsurfaces are between 1 and 2 nm.
Wetting was studied by the dispensed dropmethod, which is derived from the classical sessiledrop technique, in a metallic furnace under a vac-uum of 10�5 Pa. The apparatus consists essentiallyof a molybdenum heater surrounded by molyb-denum radiation shields, located in a water-cooledstainless-steel chamber. The chamber is fitted withtwo windows enabling the illumination of the sess-ile drop on the substrate. The drop images wereproduced using an optical system fitted with azoom (magnification 30×). The time-dependentchange in linear dimensions (drop base radius Rand height) and contact angle q of the drop arerecorded with a video camera connected to a com-puter enabling automatic image analysis. Thisdevice enables the characteristic dimensions of thedrop to be obtained after 40 ms of contact betweenthe liquid and the solid with an accuracy of ±2°for q and ±2% for R.
The copper–silicon and nickel–silicon alloysused were prepared from pure Cu (99.999 wt%),Ni (99.997 wt%) and Si (99.9995 wt%) by meltingand alloying in an alumina crucible during experi-ments performed in high vacuum (10�5 Pa). Oncethe experimental temperature is attained, the liquidis extruded from the crucible, then the entire capil-lary introducer and the alloy droplet descend so asto initiate contact between the lower surface of thedroplet and the C substrate. The capillary intro-ducer then rises again and this movement inducescomplete transfer of the drop to the C substrate.Spreading subsequently continues in the classicalsessile drop configuration. The advantage of thistechnique is that it allows the process of meltingand spreading to be separated so that fully iso-thermal experiments can be performed. Anotheradvantage is that during extrusion any oxide layeron the liquid surface alloy is broken. After cooling,selected specimens were cut, embedded in resinand polished for characterisation.
3. Results
3.1. Dispensed drop experiments
A plot of the variation of contact angle q anddroplet base radius R versus time for an experimentconducted at 1200°C for a Cu–50 at% Si alloy bythe dispensed drop technique is given in Fig. 1.The perturbation on the q(t) curve at t�60 s is dueto a slight increase in drop volume from freshliquid contained in the crucible at the moment ofdrop separation from the capillary. This increaseoccurs at constant drop base radius. The contactangles measured before and after separation areboth advanced contact angles as shown by theR(t) curve.
Spreading occurs between 180° and a final orsteady contact angle qF which is close to 40°. Thespreading regime between 180° and the first meas-ured contact angle of about 150°, noted q0, is toofast to be followed by the CCD camera used in thisstudy. In other words, the time t0 corresponding toq0 is different from but very close to zero.
On the R(t) curve between t0�0 and tF three kin-etic stages can be defined. The first two werealready observed by Landry and Eustathopoulos[2] for Al–carbon system, but not the third terminalstage. In the first stage (t0 � t � t1), called by
Fig. 1. Contact angle and drop base radius versus time for aCu–50 at% Si alloy at 1200°C by the dispensed drop technique.The perturbation on the q(t) curve shown by an arrow corre-sponds to the moment of drop detachment from the capillary.

4743O. Dezellus et al. / Acta Materialia 50 (2002) 4741–4753
these authors as ‘transient spreading’, spreadingoccurs rapidly with time. In the second stage, tak-ing place between t1 and tN, the drop base radiusR changes only slightly with time, thus justifyingwhy this stage was called ‘linear spreading’. As thetransition between the first and the second stages iscontinuous, the boundary between these two stagescannot be determined accurately.
In the present study, we prefer to call the secondstage ‘quasi-linear’ in order to contrast with thethird one which is strictly linear. This third stage(between tN and tF), during which the change incontact angle is very limited (about 10°), takesplace at a spreading rate lower by one order ofmagnitude than in the quasi-linear stage. The tran-sition between the quasi-linear and linear stages isabrupt. Similar spreading curves were obtained forNi–Si alloys (Fig. 2) and for pure Si (Fig. 3). Inboth cases a first stage of comparatively rapidspreading with a time-dependent triple line velo-city is followed by a quasi-linear wetting stage andfinally by strictly linear spreading.
Fig. 4 shows that an increase in temperature pro-duces a strong acceleration of Ni–63 at% Si alloydroplets on vitreous carbon as illustrated by thedecrease in spreading time tF, from more than1800s at 1146°C to 500 s at 1260°C. This decreaseresults from the acceleration of spreading in all
Fig. 2. Contact angle and drop base radius versus time for aNi–63 at% Si alloy at 1200°C by the dispensed drop technique.The perturbation on the q(t) curve shown by an arrow corre-sponds to the moment of drop detachment from the capillary.
Fig. 3. Contact angle and drop base radius versus time forpure Si at 1420°C by the dispensed drop technique. The pertur-bation on the q(t) curve shown by an arrow corresponds to themoment of drop detachment from the capillary.
Fig. 4. Drop base radius and contact angle versus time for aNi–63 at% Si alloy at three different temperatures.
three stages, especially in the quasi-linear and thelinear stages. A similar effect of T on R(t) curveswas found for Cu–Si alloys [6].
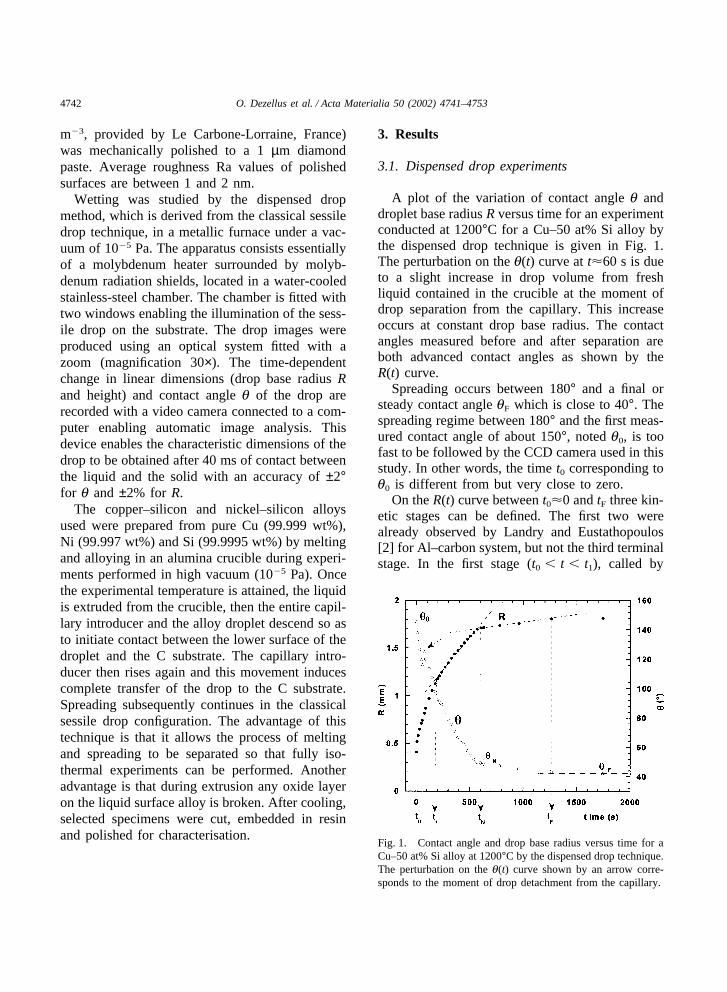
Fig. 5 shows the profile of the substrate surfacein the vicinity of the triple line for a Cu–40 at%Si alloy obtained by high resolution optical profi-lometer. The specimen was cooled from 1180°C ata steady contact angle at time t � tF � 1000s. Thesolidified alloy was removed from the substrate by
4744 O. Dezellus et al. / Acta Materialia 50 (2002) 4741–4753
Fig. 5. Profile of the substrate surface in the vicinity of thefinal position of the triple line after cooling from 1180°C attime t � tF � 1000s and removal of the solidified droplet. Cu–40 at% Si alloy/Cv, T � 1180°C.
dissolution in a mixture of acids. On this profilethe unreacted free surface can be distinguishedfrom the two continuous reaction layers. Thethicker of them, formed under the drop, was foundby X-ray microanalysis to contain only carbon andsilicon and by low angle X-ray diffraction to be β-SiC (cubic). The thin layer is attributed to SiCwhich grew outside the droplet mainly between tFand tF � 1000s.
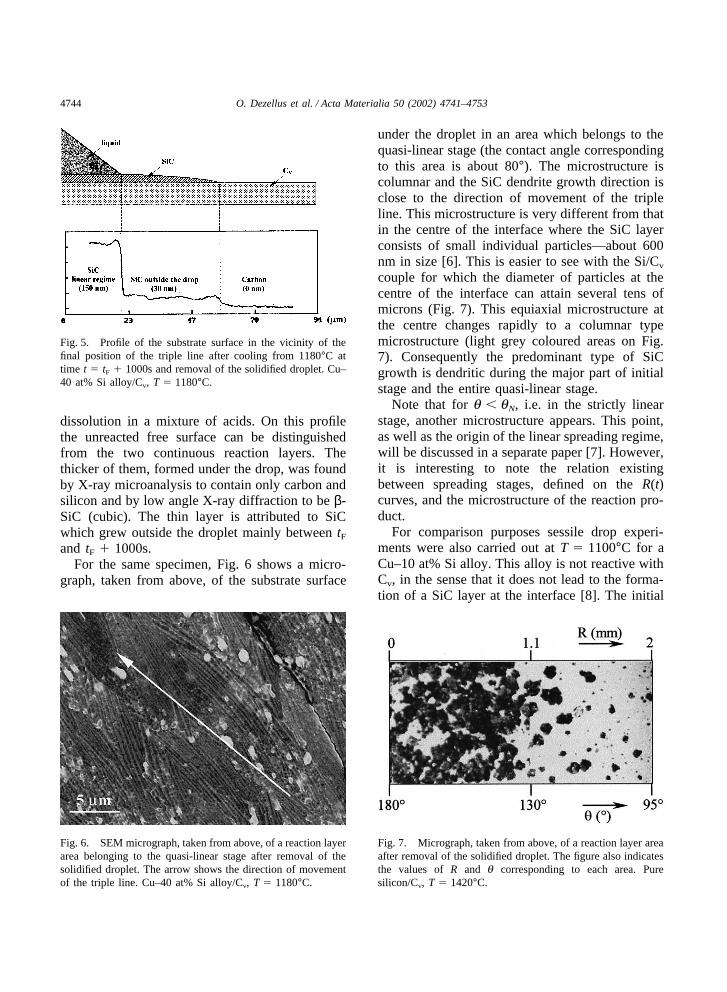
For the same specimen, Fig. 6 shows a micro-graph, taken from above, of the substrate surface
Fig. 6. SEM micrograph, taken from above, of a reaction layerarea belonging to the quasi-linear stage after removal of thesolidified droplet. The arrow shows the direction of movementof the triple line. Cu–40 at% Si alloy/Cv, T � 1180°C.
under the droplet in an area which belongs to thequasi-linear stage (the contact angle correspondingto this area is about 80°). The microstructure iscolumnar and the SiC dendrite growth direction isclose to the direction of movement of the tripleline. This microstructure is very different from thatin the centre of the interface where the SiC layerconsists of small individual particles—about 600nm in size [6]. This is easier to see with the Si/Cv
couple for which the diameter of particles at thecentre of the interface can attain several tens ofmicrons (Fig. 7). This equiaxial microstructure atthe centre changes rapidly to a columnar typemicrostructure (light grey coloured areas on Fig.7). Consequently the predominant type of SiCgrowth is dendritic during the major part of initialstage and the entire quasi-linear stage.
Note that for q � qN, i.e. in the strictly linearstage, another microstructure appears. This point,as well as the origin of the linear spreading regime,will be discussed in a separate paper [7]. However,it is interesting to note the relation existingbetween spreading stages, defined on the R(t)curves, and the microstructure of the reaction pro-duct.
For comparison purposes sessile drop experi-ments were also carried out at T � 1100°C for aCu–10 at% Si alloy. This alloy is not reactive withCv, in the sense that it does not lead to the forma-tion of a SiC layer at the interface [8]. The initial
Fig. 7. Micrograph, taken from above, of a reaction layer areaafter removal of the solidified droplet. The figure also indicatesthe values of R and q corresponding to each area. Puresilicon/Cv, T � 1420°C.
4745O. Dezellus et al. / Acta Materialia 50 (2002) 4741–4753
contact angle on Cv (147°) is as high as for thereactive Cu–Si alloys but contrary to these alloys,this angle remains constant with time. Note thateven this ‘non-reactive’ alloy exhibits some verylimited reactivity consisting of dissolution of car-bon into the alloy. Indeed, after 2 min of contactwith this alloy at 1100°C, an erosion of Cv of about5 nm was found in the area under the drop. Thisdissolution increases the carbon content of thealloy, but does not affect wetting as testified by theabsence of any variation in q with time for thisalloy.
3.2. Perturbation experiments
In order to determine if there is a relationbetween the triple line velocity and the instan-taneous contact angle q in the domain qN � q �q0, ‘perturbation experiments’ were carried out.
These experiments consist of varying the contactangle suddenly from qa to qb and recording anyvariation in triple line velocity. The change in qwas produced either at nearly constant drop baseradius R or at increasing R.
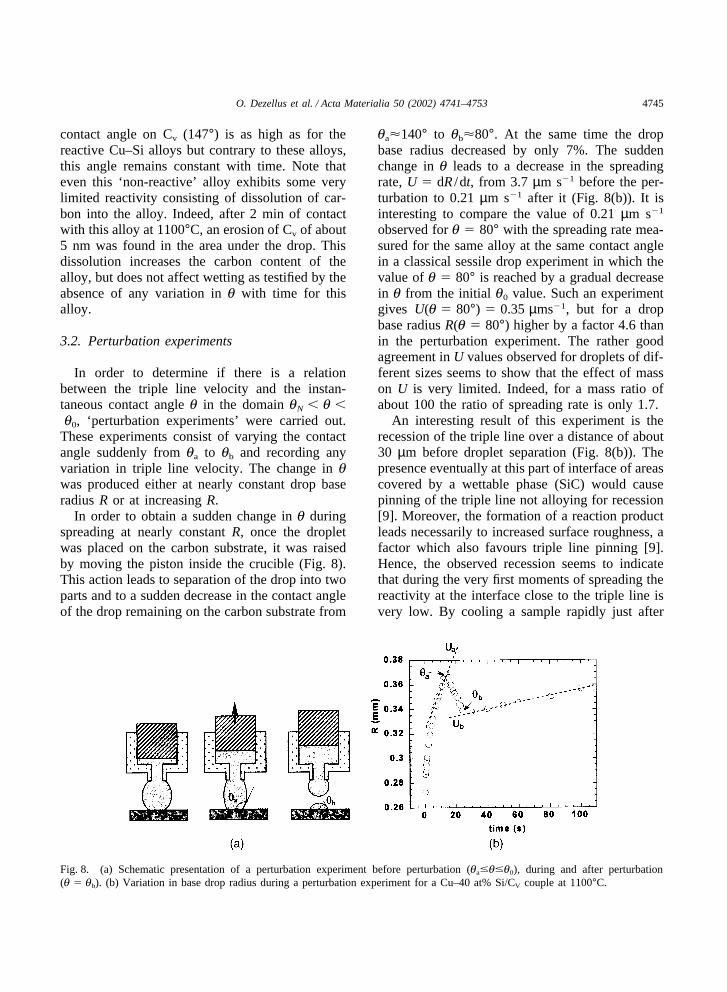
In order to obtain a sudden change in q duringspreading at nearly constant R, once the dropletwas placed on the carbon substrate, it was raisedby moving the piston inside the crucible (Fig. 8).This action leads to separation of the drop into twoparts and to a sudden decrease in the contact angleof the drop remaining on the carbon substrate from
Fig. 8. (a) Schematic presentation of a perturbation experiment before perturbation (qa�q�q0), during and after perturbation(q � qb). (b) Variation in base drop radius during a perturbation experiment for a Cu–40 at% Si/CV couple at 1100°C.
qa�140° to qb�80°. At the same time the dropbase radius decreased by only 7%. The suddenchange in q leads to a decrease in the spreadingrate, U � dR /dt, from 3.7 µm s�1 before the per-turbation to 0.21 µm s�1 after it (Fig. 8(b)). It isinteresting to compare the value of 0.21 µm s�1
observed for q � 80° with the spreading rate mea-sured for the same alloy at the same contact anglein a classical sessile drop experiment in which thevalue of q � 80° is reached by a gradual decreasein q from the initial q0 value. Such an experimentgives U(q � 80°) � 0.35 µms�1, but for a dropbase radius R(q � 80°) higher by a factor 4.6 thanin the perturbation experiment. The rather goodagreement in U values observed for droplets of dif-ferent sizes seems to show that the effect of masson U is very limited. Indeed, for a mass ratio ofabout 100 the ratio of spreading rate is only 1.7.
An interesting result of this experiment is therecession of the triple line over a distance of about30 µm before droplet separation (Fig. 8(b)). Thepresence eventually at this part of interface of areascovered by a wettable phase (SiC) would causepinning of the triple line not alloying for recession[9]. Moreover, the formation of a reaction productleads necessarily to increased surface roughness, afactor which also favours triple line pinning [9].Hence, the observed recession seems to indicatethat during the very first moments of spreading thereactivity at the interface close to the triple line isvery low. By cooling a sample rapidly just after
4746 O. Dezellus et al. / Acta Materialia 50 (2002) 4741–4753
receding of the triple line, it was possible to exam-ine a part of the substrate surface which had con-tacted the liquid alloy by Auger microprobe analy-sis, a technique with a lateral resolution of 100nm2. No significant signal of Si on this area wasfound showing that the coverage of the interfaceby the reaction product (SiC) is very small. Severalattempts were made to obtain triple line recedingat contact angles lower than 140° without success.Recedings were non-measurable by the techniqueused in this work, which means that the recedingdistances would be smaller than the accuracy onthe position of the triple line, i.e. a few microns.
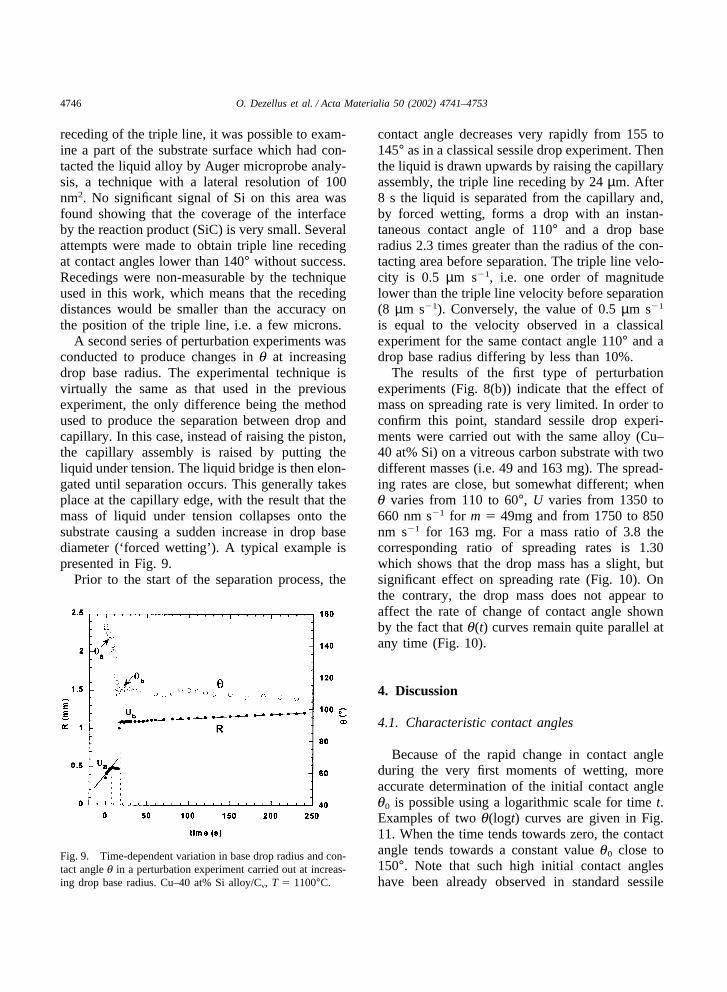
A second series of perturbation experiments wasconducted to produce changes in q at increasingdrop base radius. The experimental technique isvirtually the same as that used in the previousexperiment, the only difference being the methodused to produce the separation between drop andcapillary. In this case, instead of raising the piston,the capillary assembly is raised by putting theliquid under tension. The liquid bridge is then elon-gated until separation occurs. This generally takesplace at the capillary edge, with the result that themass of liquid under tension collapses onto thesubstrate causing a sudden increase in drop basediameter (‘forced wetting’). A typical example ispresented in Fig. 9.
Prior to the start of the separation process, the
Fig. 9. Time-dependent variation in base drop radius and con-tact angle q in a perturbation experiment carried out at increas-ing drop base radius. Cu–40 at% Si alloy/Cv, T � 1100°C.
contact angle decreases very rapidly from 155 to145° as in a classical sessile drop experiment. Thenthe liquid is drawn upwards by raising the capillaryassembly, the triple line receding by 24 µm. After8 s the liquid is separated from the capillary and,by forced wetting, forms a drop with an instan-taneous contact angle of 110° and a drop baseradius 2.3 times greater than the radius of the con-tacting area before separation. The triple line velo-city is 0.5 µm s�1, i.e. one order of magnitudelower than the triple line velocity before separation(8 µm s�1). Conversely, the value of 0.5 µm s�1
is equal to the velocity observed in a classicalexperiment for the same contact angle 110° and adrop base radius differing by less than 10%.
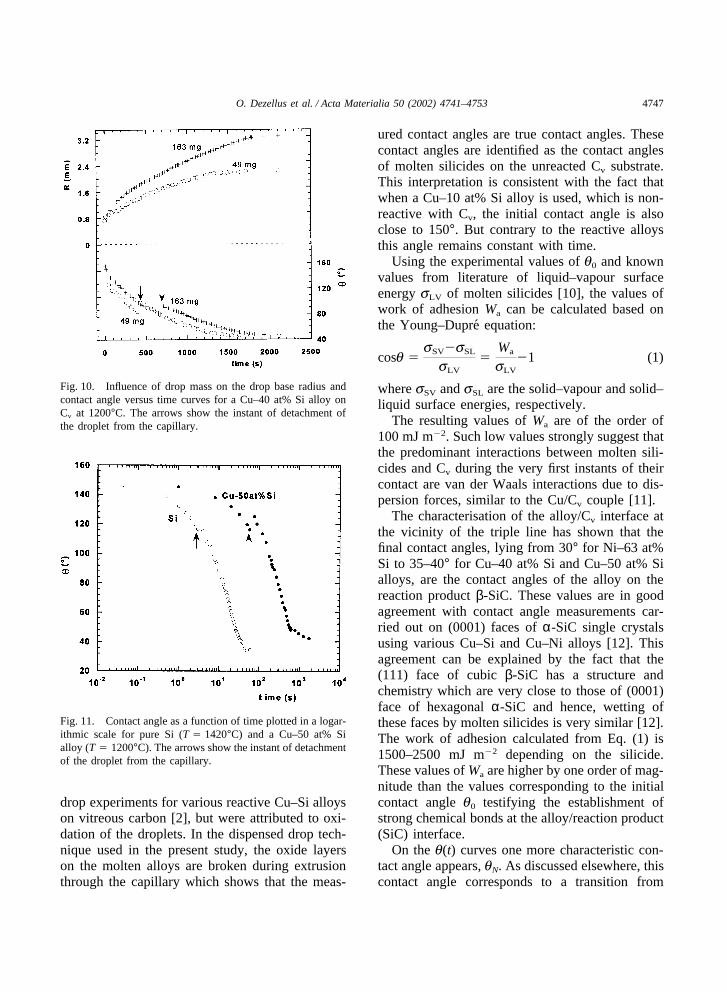
The results of the first type of perturbationexperiments (Fig. 8(b)) indicate that the effect ofmass on spreading rate is very limited. In order toconfirm this point, standard sessile drop experi-ments were carried out with the same alloy (Cu–40 at% Si) on a vitreous carbon substrate with twodifferent masses (i.e. 49 and 163 mg). The spread-ing rates are close, but somewhat different; whenq varies from 110 to 60°, U varies from 1350 to660 nm s�1 for m � 49mg and from 1750 to 850nm s�1 for 163 mg. For a mass ratio of 3.8 thecorresponding ratio of spreading rates is 1.30which shows that the drop mass has a slight, butsignificant effect on spreading rate (Fig. 10). Onthe contrary, the drop mass does not appear toaffect the rate of change of contact angle shownby the fact that q(t) curves remain quite parallel atany time (Fig. 10).
4. Discussion
4.1. Characteristic contact angles
Because of the rapid change in contact angleduring the very first moments of wetting, moreaccurate determination of the initial contact angleq0 is possible using a logarithmic scale for time t.Examples of two q(logt) curves are given in Fig.11. When the time tends towards zero, the contactangle tends towards a constant value q0 close to150°. Note that such high initial contact angleshave been already observed in standard sessile
4747O. Dezellus et al. / Acta Materialia 50 (2002) 4741–4753
Fig. 10. Influence of drop mass on the drop base radius andcontact angle versus time curves for a Cu–40 at% Si alloy onCv at 1200°C. The arrows show the instant of detachment ofthe droplet from the capillary.
Fig. 11. Contact angle as a function of time plotted in a logar-ithmic scale for pure Si (T � 1420°C) and a Cu–50 at% Sialloy (T � 1200°C). The arrows show the instant of detachmentof the droplet from the capillary.
drop experiments for various reactive Cu–Si alloyson vitreous carbon [2], but were attributed to oxi-dation of the droplets. In the dispensed drop tech-nique used in the present study, the oxide layerson the molten alloys are broken during extrusionthrough the capillary which shows that the meas-
ured contact angles are true contact angles. Thesecontact angles are identified as the contact anglesof molten silicides on the unreacted Cv substrate.This interpretation is consistent with the fact thatwhen a Cu–10 at% Si alloy is used, which is non-reactive with Cv, the initial contact angle is alsoclose to 150°. But contrary to the reactive alloysthis angle remains constant with time.
Using the experimental values of q0 and knownvalues from literature of liquid–vapour surfaceenergy sLV of molten silicides [10], the values ofwork of adhesion Wa can be calculated based onthe Young–Dupre equation:
cosq �sSV�sSL
sLV�
Wa
sLV�1 (1)
where sSV and sSL are the solid–vapour and solid–liquid surface energies, respectively.
The resulting values of Wa are of the order of100 mJ m�2. Such low values strongly suggest thatthe predominant interactions between molten sili-cides and Cv during the very first instants of theircontact are van der Waals interactions due to dis-persion forces, similar to the Cu/Cv couple [11].
The characterisation of the alloy/Cv interface atthe vicinity of the triple line has shown that thefinal contact angles, lying from 30° for Ni–63 at%Si to 35–40° for Cu–40 at% Si and Cu–50 at% Sialloys, are the contact angles of the alloy on thereaction product β-SiC. These values are in goodagreement with contact angle measurements car-ried out on (0001) faces of α-SiC single crystalsusing various Cu–Si and Cu–Ni alloys [12]. Thisagreement can be explained by the fact that the(111) face of cubic β-SiC has a structure andchemistry which are very close to those of (0001)face of hexagonal α-SiC and hence, wetting ofthese faces by molten silicides is very similar [12].The work of adhesion calculated from Eq. (1) is1500–2500 mJ m�2 depending on the silicide.These values of Wa are higher by one order of mag-nitude than the values corresponding to the initialcontact angle q0 testifying the establishment ofstrong chemical bonds at the alloy/reaction product(SiC) interface.
On the q(t) curves one more characteristic con-tact angle appears, qN. As discussed elsewhere, thiscontact angle corresponds to a transition from
4748 O. Dezellus et al. / Acta Materialia 50 (2002) 4741–4753
coupled reactive spreading to non-coupled (orweakly coupled) reactive spreading [7].
4.2. Spreading rate versus contact angle relation
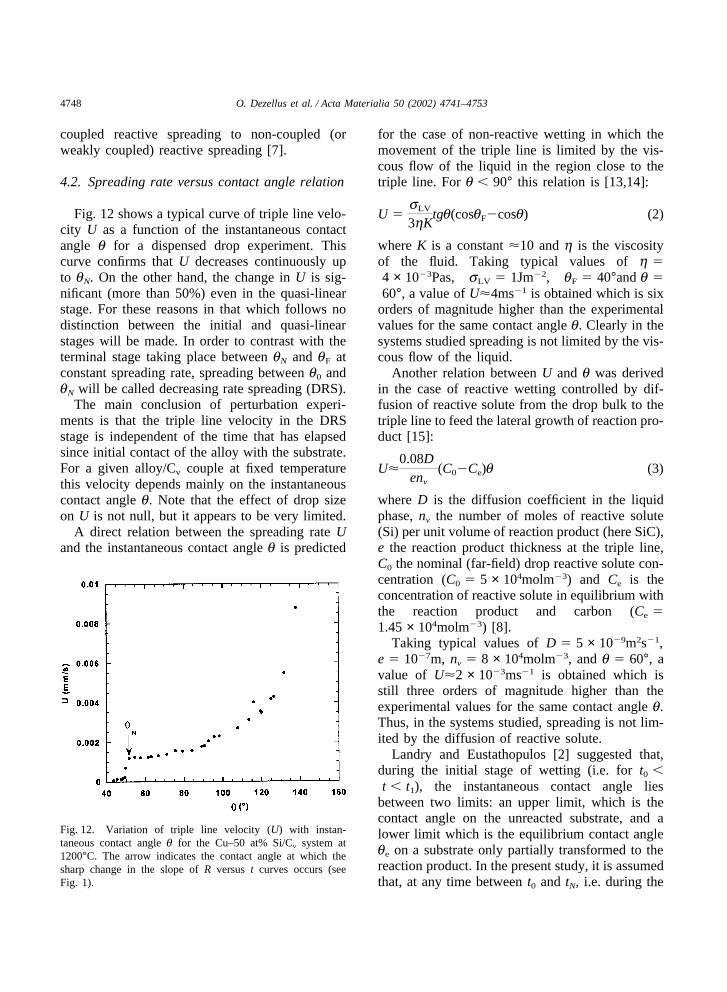
Fig. 12 shows a typical curve of triple line velo-city U as a function of the instantaneous contactangle q for a dispensed drop experiment. Thiscurve confirms that U decreases continuously upto qN. On the other hand, the change in U is sig-nificant (more than 50%) even in the quasi-linearstage. For these reasons in that which follows nodistinction between the initial and quasi-linearstages will be made. In order to contrast with theterminal stage taking place between qN and qF atconstant spreading rate, spreading between q0 andqN will be called decreasing rate spreading (DRS).
The main conclusion of perturbation experi-ments is that the triple line velocity in the DRSstage is independent of the time that has elapsedsince initial contact of the alloy with the substrate.For a given alloy/Cv couple at fixed temperaturethis velocity depends mainly on the instantaneouscontact angle q. Note that the effect of drop sizeon U is not null, but it appears to be very limited.
A direct relation between the spreading rate Uand the instantaneous contact angle q is predicted
Fig. 12. Variation of triple line velocity (U) with instan-taneous contact angle q for the Cu–50 at% Si/Cv system at1200°C. The arrow indicates the contact angle at which thesharp change in the slope of R versus t curves occurs (seeFig. 1).
for the case of non-reactive wetting in which themovement of the triple line is limited by the vis-cous flow of the liquid in the region close to thetriple line. For q � 90° this relation is [13,14]:
U �sLV
3hKtgq(cosqF�cosq) (2)
where K is a constant �10 and h is the viscosityof the fluid. Taking typical values of h �4 × 10�3Pas, sLV � 1Jm�2, qF � 40°and q �60°, a value of U�4ms�1 is obtained which is six
orders of magnitude higher than the experimentalvalues for the same contact angle q. Clearly in thesystems studied spreading is not limited by the vis-cous flow of the liquid.
Another relation between U and q was derivedin the case of reactive wetting controlled by dif-fusion of reactive solute from the drop bulk to thetriple line to feed the lateral growth of reaction pro-duct [15]:
U�0.08D
env
(C0�Ce)q (3)
where D is the diffusion coefficient in the liquidphase, nv the number of moles of reactive solute(Si) per unit volume of reaction product (here SiC),e the reaction product thickness at the triple line,C0 the nominal (far-field) drop reactive solute con-centration (C0 � 5 × 10⁴molm�3) and Ce is theconcentration of reactive solute in equilibrium withthe reaction product and carbon (Ce �1.45 × 10⁴molm�3) [8].
Taking typical values of D � 5 × 10�9m2s�1,e � 10�7m, nv � 8 × 10⁴molm�3, and q � 60°, avalue of U�2 × 10�3ms�1 is obtained which isstill three orders of magnitude higher than theexperimental values for the same contact angle q.Thus, in the systems studied, spreading is not lim-ited by the diffusion of reactive solute.
Landry and Eustathopulos [2] suggested that,during the initial stage of wetting (i.e. for t0 �t � t1), the instantaneous contact angle lies
between two limits: an upper limit, which is thecontact angle on the unreacted substrate, and alower limit which is the equilibrium contact angleqe on a substrate only partially transformed to thereaction product. In the present study, it is assumedthat, at any time between t0 and tN, i.e. during the
4749O. Dezellus et al. / Acta Materialia 50 (2002) 4741–4753
entire DRS stage, the instantaneous contact angleis higher than but very close to this equilibriumcontact angle (q�qe).
For the case of a uniform dispersion of a particlephase P (in this case P � SiC) on a substrate S(S � Cv), qe is given by the Cassie equation [16]:
cosqe � acosqP � (1�a)cosqs (4)
where a is the surface coverage of the discontinu-ous phase (SiC), and qP and qS are the equilibriumcontact angles of liquid on SiC and C, respectivelywith qP�qF and qS�q0.
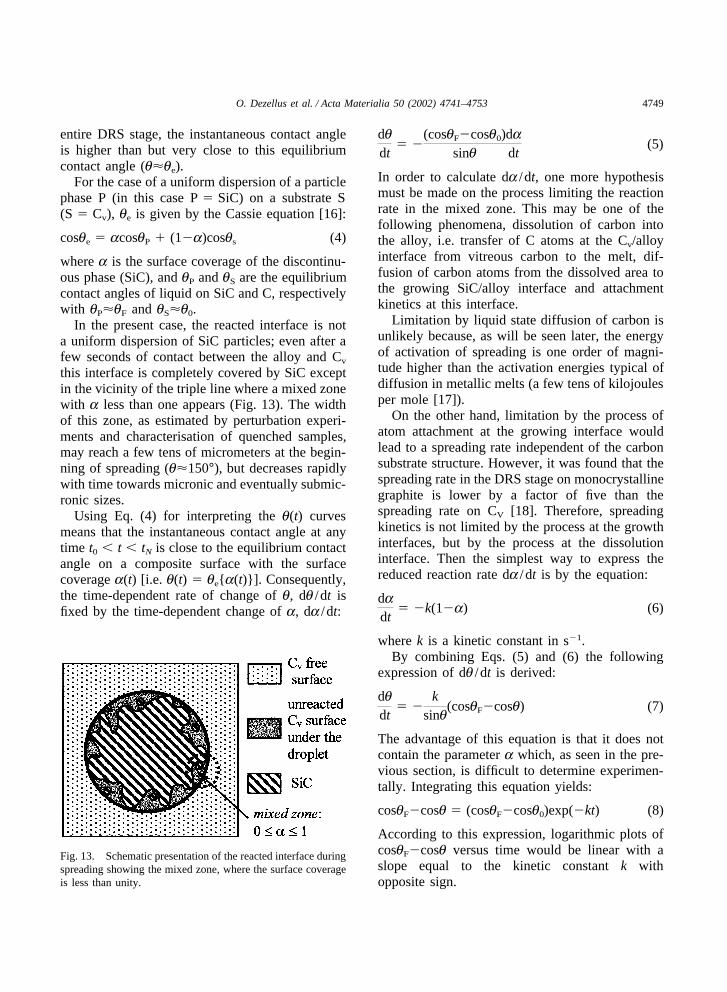
In the present case, the reacted interface is nota uniform dispersion of SiC particles; even after afew seconds of contact between the alloy and Cv
this interface is completely covered by SiC exceptin the vicinity of the triple line where a mixed zonewith a less than one appears (Fig. 13). The widthof this zone, as estimated by perturbation experi-ments and characterisation of quenched samples,may reach a few tens of micrometers at the begin-ning of spreading (q�150°), but decreases rapidlywith time towards micronic and eventually submic-ronic sizes.
Using Eq. (4) for interpreting the q(t) curvesmeans that the instantaneous contact angle at anytime t0 � t � tN is close to the equilibrium contactangle on a composite surface with the surfacecoverage a(t) [i.e. q(t) � qe{a(t)}]. Consequently,the time-dependent rate of change of q, dq /dt isfixed by the time-dependent change of a, da /dt:
Fig. 13. Schematic presentation of the reacted interface duringspreading showing the mixed zone, where the surface coverageis less than unity.
dqdt
� �(cosqF�cosq0)
sinqdadt
(5)
In order to calculate da /dt, one more hypothesismust be made on the process limiting the reactionrate in the mixed zone. This may be one of thefollowing phenomena, dissolution of carbon intothe alloy, i.e. transfer of C atoms at the Cv/alloyinterface from vitreous carbon to the melt, dif-fusion of carbon atoms from the dissolved area tothe growing SiC/alloy interface and attachmentkinetics at this interface.
Limitation by liquid state diffusion of carbon isunlikely because, as will be seen later, the energyof activation of spreading is one order of magni-tude higher than the activation energies typical ofdiffusion in metallic melts (a few tens of kilojoulesper mole [17]).
On the other hand, limitation by the process ofatom attachment at the growing interface wouldlead to a spreading rate independent of the carbonsubstrate structure. However, it was found that thespreading rate in the DRS stage on monocrystallinegraphite is lower by a factor of five than thespreading rate on CV [18]. Therefore, spreadingkinetics is not limited by the process at the growthinterfaces, but by the process at the dissolutioninterface. Then the simplest way to express thereduced reaction rate da / dt is by the equation:
dadt
� �k(1�a) (6)
where k is a kinetic constant in s�1.By combining Eqs. (5) and (6) the following
expression of dq /dt is derived:
dqdt
� �k
sinq(cosqF�cosq) (7)
The advantage of this equation is that it does notcontain the parameter a which, as seen in the pre-vious section, is difficult to determine experimen-tally. Integrating this equation yields:
cosqF�cosq � (cosqF�cosq0)exp(�kt) (8)
According to this expression, logarithmic plots ofcosqF�cosq versus time would be linear with aslope equal to the kinetic constant k withopposite sign.
4750 O. Dezellus et al. / Acta Materialia 50 (2002) 4741–4753
The spreading rate U � dR /dt is calculatedfrom Eq. (7) taking the volume V of the droplet tobe constant, i.e. assuming that the thickness of thereaction product is much lower than the dropletsize. Then R and q are linked by:
π3V
R3 �sin3q
2�3cosq � cos3q(9)
Eqs. (7) and (9) lead to the following expressionof the spreading rate:
UF(q)
� k�3Vπ�1/3
(cosqF�cosq) (10)
with
F(q) � �cosq (2�3cosq � cos3q)�sin4q
sinq (2�3cosq � cos3q)4/3 (11)
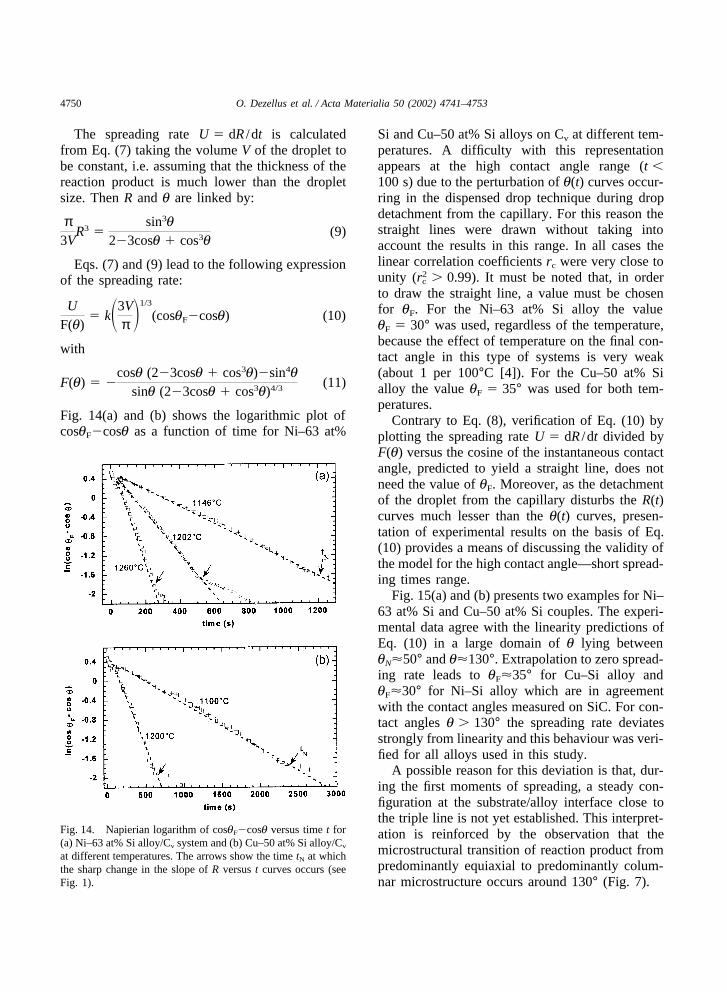
Fig. 14(a) and (b) shows the logarithmic plot ofcosqF�cosq as a function of time for Ni–63 at%
Fig. 14. Napierian logarithm of cosqF�cosq versus time t for(a) Ni–63 at% Si alloy/Cv system and (b) Cu–50 at% Si alloy/Cv
at different temperatures. The arrows show the time tN at whichthe sharp change in the slope of R versus t curves occurs (seeFig. 1).
Si and Cu–50 at% Si alloys on Cv at different tem-peratures. A difficulty with this representationappears at the high contact angle range (t �100 s) due to the perturbation of q(t) curves occur-ring in the dispensed drop technique during dropdetachment from the capillary. For this reason thestraight lines were drawn without taking intoaccount the results in this range. In all cases thelinear correlation coefficients rc were very close tounity (r2
c � 0.99). It must be noted that, in orderto draw the straight line, a value must be chosenfor qF. For the Ni–63 at% Si alloy the valueqF � 30° was used, regardless of the temperature,because the effect of temperature on the final con-tact angle in this type of systems is very weak(about 1 per 100°C [4]). For the Cu–50 at% Sialloy the value qF � 35° was used for both tem-peratures.
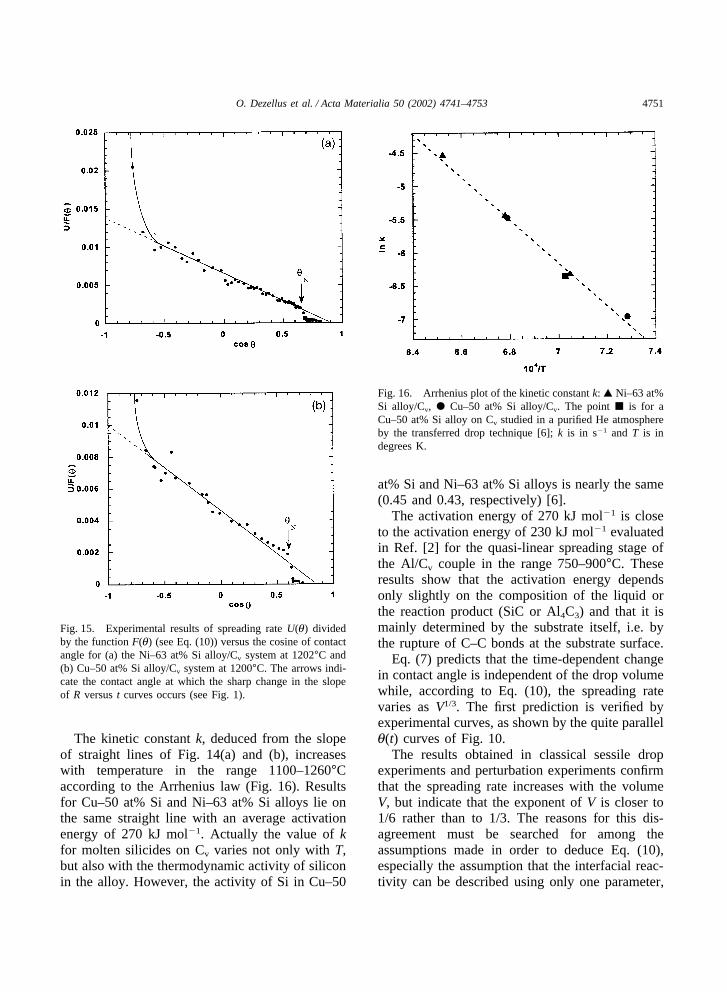
Contrary to Eq. (8), verification of Eq. (10) byplotting the spreading rate U � dR /dt divided byF(q) versus the cosine of the instantaneous contactangle, predicted to yield a straight line, does notneed the value of qF. Moreover, as the detachmentof the droplet from the capillary disturbs the R(t)curves much lesser than the q(t) curves, presen-tation of experimental results on the basis of Eq.(10) provides a means of discussing the validity ofthe model for the high contact angle—short spread-ing times range.
Fig. 15(a) and (b) presents two examples for Ni–63 at% Si and Cu–50 at% Si couples. The experi-mental data agree with the linearity predictions ofEq. (10) in a large domain of q lying betweenqN�50° and q�130°. Extrapolation to zero spread-ing rate leads to qF�35° for Cu–Si alloy andqF�30° for Ni–Si alloy which are in agreementwith the contact angles measured on SiC. For con-tact angles q � 130° the spreading rate deviatesstrongly from linearity and this behaviour was veri-fied for all alloys used in this study.
A possible reason for this deviation is that, dur-ing the first moments of spreading, a steady con-figuration at the substrate/alloy interface close tothe triple line is not yet established. This interpret-ation is reinforced by the observation that themicrostructural transition of reaction product frompredominantly equiaxial to predominantly colum-nar microstructure occurs around 130° (Fig. 7).
4751O. Dezellus et al. / Acta Materialia 50 (2002) 4741–4753
Fig. 15. Experimental results of spreading rate U(q) dividedby the function F(q) (see Eq. (10)) versus the cosine of contactangle for (a) the Ni–63 at% Si alloy/Cv system at 1202°C and(b) Cu–50 at% Si alloy/Cv system at 1200°C. The arrows indi-cate the contact angle at which the sharp change in the slopeof R versus t curves occurs (see Fig. 1).
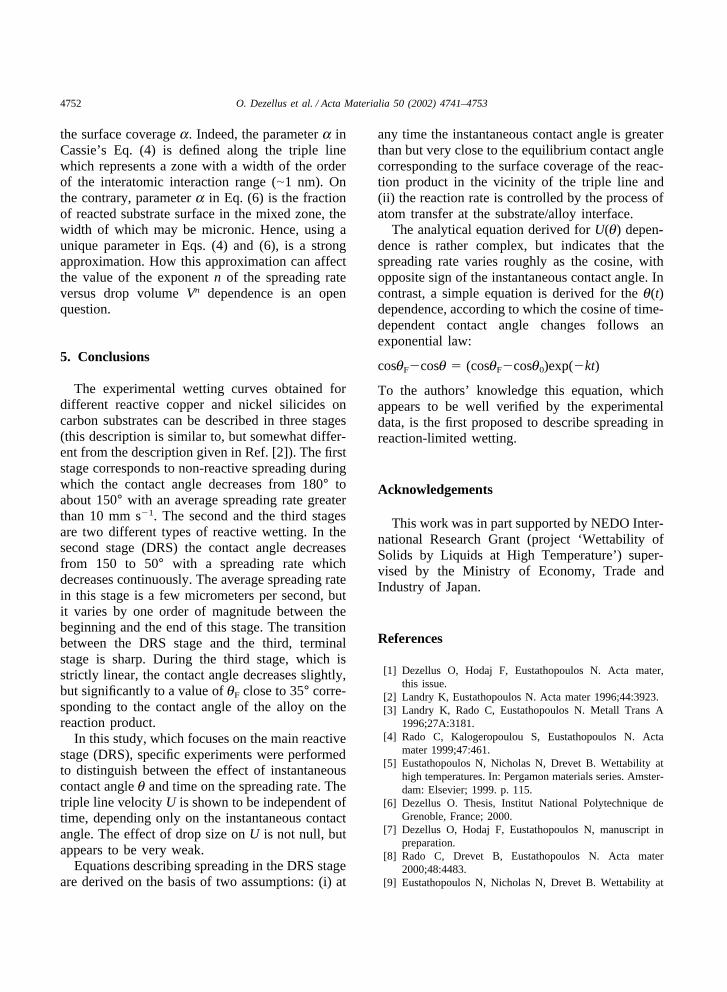
The kinetic constant k, deduced from the slopeof straight lines of Fig. 14(a) and (b), increaseswith temperature in the range 1100–1260°Caccording to the Arrhenius law (Fig. 16). Resultsfor Cu–50 at% Si and Ni–63 at% Si alloys lie onthe same straight line with an average activationenergy of 270 kJ mol�1. Actually the value of kfor molten silicides on Cv varies not only with T,but also with the thermodynamic activity of siliconin the alloy. However, the activity of Si in Cu–50
Fig. 16. Arrhenius plot of the kinetic constant k: � Ni–63 at%Si alloy/Cv, � Cu–50 at% Si alloy/Cv. The point � is for aCu–50 at% Si alloy on Cv studied in a purified He atmosphereby the transferred drop technique [6]; k is in s�1 and T is indegrees K.
at% Si and Ni–63 at% Si alloys is nearly the same(0.45 and 0.43, respectively) [6].
The activation energy of 270 kJ mol�1 is closeto the activation energy of 230 kJ mol�1 evaluatedin Ref. [2] for the quasi-linear spreading stage ofthe Al/Cv couple in the range 750–900°C. Theseresults show that the activation energy dependsonly slightly on the composition of the liquid orthe reaction product (SiC or Al4C3) and that it ismainly determined by the substrate itself, i.e. bythe rupture of C–C bonds at the substrate surface.
Eq. (7) predicts that the time-dependent changein contact angle is independent of the drop volumewhile, according to Eq. (10), the spreading ratevaries as V1/3. The first prediction is verified byexperimental curves, as shown by the quite parallelq(t) curves of Fig. 10.
The results obtained in classical sessile dropexperiments and perturbation experiments confirmthat the spreading rate increases with the volumeV, but indicate that the exponent of V is closer to1/6 rather than to 1/3. The reasons for this dis-agreement must be searched for among theassumptions made in order to deduce Eq. (10),especially the assumption that the interfacial reac-tivity can be described using only one parameter,
4752 O. Dezellus et al. / Acta Materialia 50 (2002) 4741–4753
the surface coverage a. Indeed, the parameter a inCassie’s Eq. (4) is defined along the triple linewhich represents a zone with a width of the orderof the interatomic interaction range (�1 nm). Onthe contrary, parameter a in Eq. (6) is the fractionof reacted substrate surface in the mixed zone, thewidth of which may be micronic. Hence, using aunique parameter in Eqs. (4) and (6), is a strongapproximation. How this approximation can affectthe value of the exponent n of the spreading rateversus drop volume Vn dependence is an openquestion.
5. Conclusions
The experimental wetting curves obtained fordifferent reactive copper and nickel silicides oncarbon substrates can be described in three stages(this description is similar to, but somewhat differ-ent from the description given in Ref. [2]). The firststage corresponds to non-reactive spreading duringwhich the contact angle decreases from 180° toabout 150° with an average spreading rate greaterthan 10 mm s�1. The second and the third stagesare two different types of reactive wetting. In thesecond stage (DRS) the contact angle decreasesfrom 150 to 50° with a spreading rate whichdecreases continuously. The average spreading ratein this stage is a few micrometers per second, butit varies by one order of magnitude between thebeginning and the end of this stage. The transitionbetween the DRS stage and the third, terminalstage is sharp. During the third stage, which isstrictly linear, the contact angle decreases slightly,but significantly to a value of qF close to 35° corre-sponding to the contact angle of the alloy on thereaction product.
In this study, which focuses on the main reactivestage (DRS), specific experiments were performedto distinguish between the effect of instantaneouscontact angle q and time on the spreading rate. Thetriple line velocity U is shown to be independent oftime, depending only on the instantaneous contactangle. The effect of drop size on U is not null, butappears to be very weak.
Equations describing spreading in the DRS stageare derived on the basis of two assumptions: (i) at
any time the instantaneous contact angle is greaterthan but very close to the equilibrium contact anglecorresponding to the surface coverage of the reac-tion product in the vicinity of the triple line and(ii) the reaction rate is controlled by the process ofatom transfer at the substrate/alloy interface.
The analytical equation derived for U(q) depen-dence is rather complex, but indicates that thespreading rate varies roughly as the cosine, withopposite sign of the instantaneous contact angle. Incontrast, a simple equation is derived for the q(t)dependence, according to which the cosine of time-dependent contact angle changes follows anexponential law:
cosqF�cosq � (cosqF�cosq0)exp(�kt)
To the authors’ knowledge this equation, whichappears to be well verified by the experimentaldata, is the first proposed to describe spreading inreaction-limited wetting.
Acknowledgements
This work was in part supported by NEDO Inter-national Research Grant (project ‘Wettability ofSolids by Liquids at High Temperature’) super-vised by the Ministry of Economy, Trade andIndustry of Japan.
References
[1] Dezellus O, Hodaj F, Eustathopoulos N. Acta mater,this issue.
[2] Landry K, Eustathopoulos N. Acta mater 1996;44:3923.[3] Landry K, Rado C, Eustathopoulos N. Metall Trans A
1996;27A:3181.[4] Rado C, Kalogeropoulou S, Eustathopoulos N. Acta
mater 1999;47:461.[5] Eustathopoulos N, Nicholas N, Drevet B. Wettability at
high temperatures. In: Pergamon materials series. Amster-dam: Elsevier; 1999. p. 115.
[6] Dezellus O. Thesis, Institut National Polytechnique deGrenoble, France; 2000.
[7] Dezellus O, Hodaj F, Eustathopoulos N, manuscript inpreparation.
[8] Rado C, Drevet B, Eustathopoulos N. Acta mater2000;48:4483.
[9] Eustathopoulos N, Nicholas N, Drevet B. Wettability at

4753O. Dezellus et al. / Acta Materialia 50 (2002) 4741–4753
high temperatures. In: Pergamon materials series. Amster-dam: Elsevier; 1999. p. 36.
[10] Khilya GP, Ivashchenko Y. Dopov Akad Nauk Ukr RSRSer B 1973;35:69.
[11] Dezellus O, Eustathopoulos N. Scr Mater 1999;40:1283.[12] Rado C, Kalogeropoulou S, Eustathopoulos N. Scr
Mater 1999;42:203.[13] Tanner LH. Appl Phys 1979;12:1473.
[14] de Gennes PG. Rev Mod Phys 1985;57:827.[15] Mortensen A, Drevet B, Eustathopoulos N. Scr Mater
1997;36:645.[16] Cassie ABD. Discuss Faraday Soc 1948;3:11.[17] Geiger GH, Poirier DR. In: Transport phenomena in met-
allurgy. Reading, MA: Addison–Wesley; 1980. p. 459.[18] Dezellus O, Hodaj F, Eustathopoulos N. Trans JWRI
2001;30:75.
Related Documents