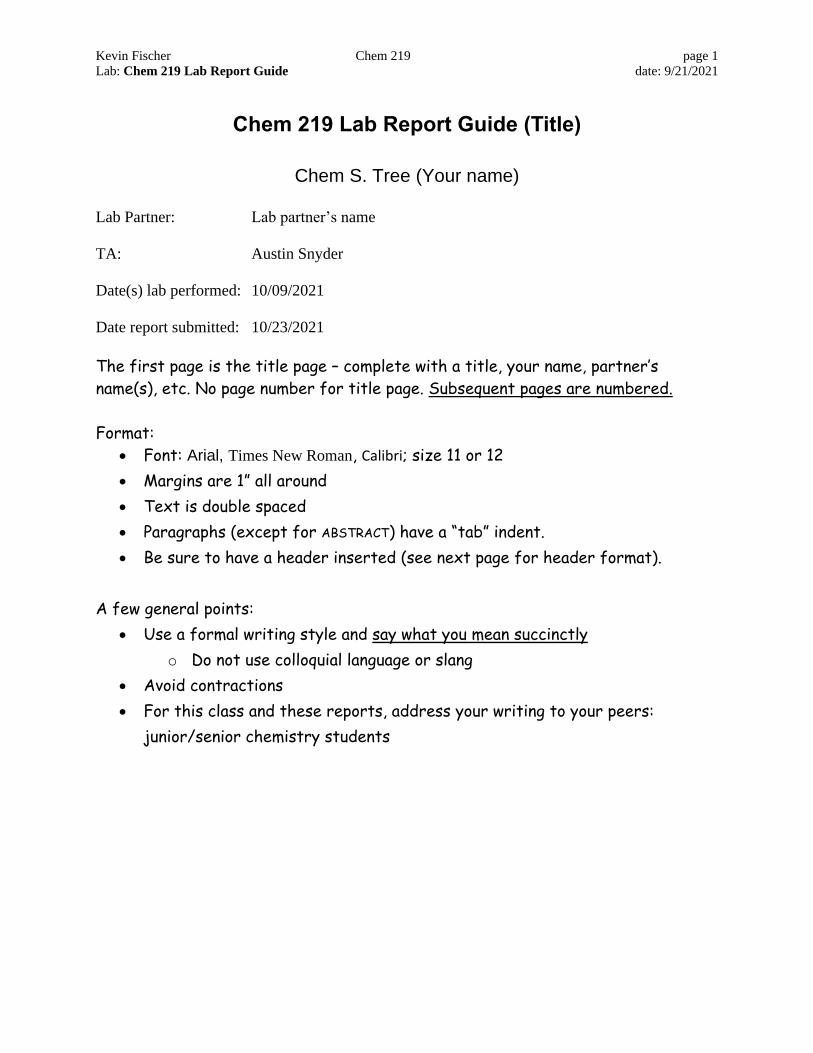
Kevin Fischer Chem 219 page 1 Lab: Chem 219 Lab Report Guide date: 9/21/2021 Chem 219 Lab Report Guide (Title) Chem S. Tree (Your name) Lab Partner: Lab partner’s name TA: Austin Snyder Date(s) lab performed: 10/09/2021 Date report submitted: 10/23/2021 The first page is the title page – complete with a title, your name, partner’s name(s), etc. No page number for title page. Subsequent pages are numbered. Format: • Font: Arial, Times New Roman, Calibri; size 11 or 12 • Margins are 1” all around • Text is double spaced • Paragraphs (except for ABSTRACT) have a “tab” indent. • Be sure to have a header inserted (see next page for header format). A few general points: • Use a formal writing style and say what you mean succinctly o Do not use colloquial language or slang • Avoid contractions • For this class and these reports, address your writing to your peers: junior/senior chemistry students

Welcome message from author
This document is posted to help you gain knowledge. Please leave a comment to let me know what you think about it! Share it to your friends and learn new things together.
Transcript
Kevin Fischer Chem 219 page 1
Lab: Chem 219 Lab Report Guide date: 9/21/2021
Chem 219 Lab Report Guide (Title)
Chem S. Tree (Your name)
Lab Partner: Lab partner’s name
TA: Austin Snyder
Date(s) lab performed: 10/09/2021
Date report submitted: 10/23/2021
The first page is the title page – complete with a title, your name, partner’s
name(s), etc. No page number for title page. Subsequent pages are numbered.
Format:
• Font: Arial, Times New Roman, Calibri; size 11 or 12
• Margins are 1” all around
• Text is double spaced
• Paragraphs (except for ABSTRACT) have a “tab” indent.
• Be sure to have a header inserted (see next page for header format).
A few general points:
• Use a formal writing style and say what you mean succinctly
o Do not use colloquial language or slang
• Avoid contractions
• For this class and these reports, address your writing to your peers:
junior/senior chemistry students
Kevin Fischer Chem 219 page 2
Lab: Chem 219 Lab Report Guide date: 9/21/2021
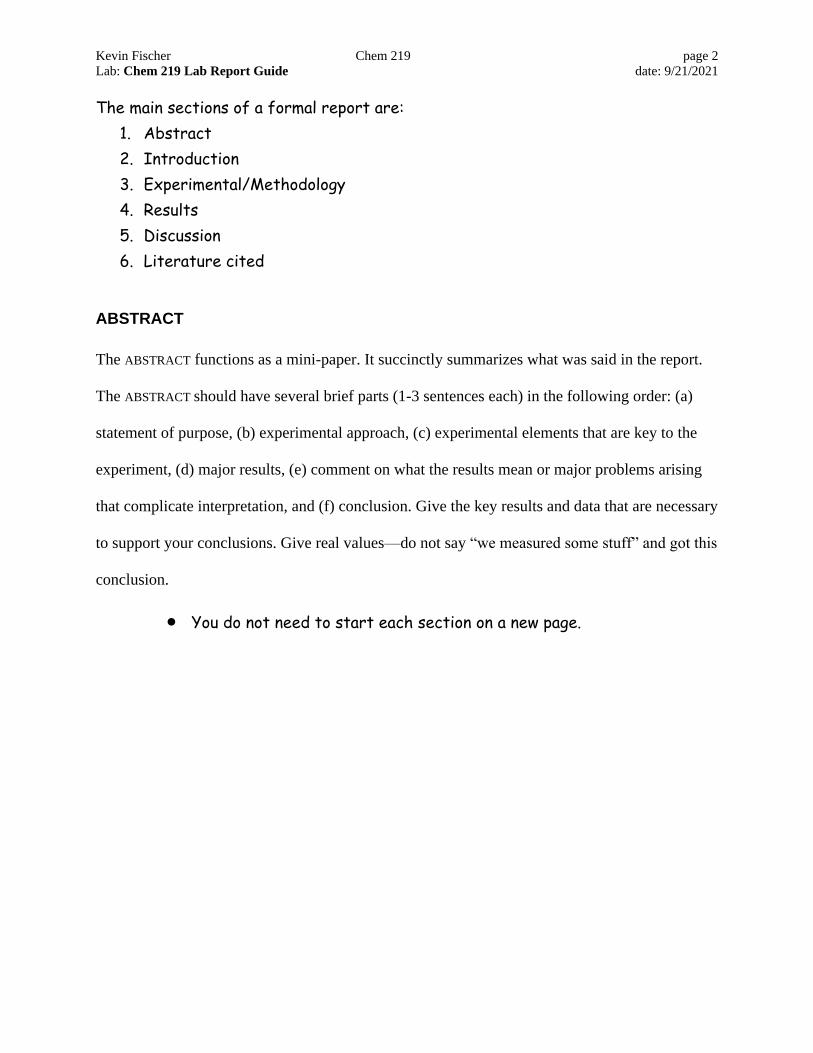
The main sections of a formal report are:
1. Abstract
2. Introduction
3. Experimental/Methodology
4. Results
5. Discussion
6. Literature cited
ABSTRACT
The ABSTRACT functions as a mini-paper. It succinctly summarizes what was said in the report.
The ABSTRACT should have several brief parts (1-3 sentences each) in the following order: (a)
statement of purpose, (b) experimental approach, (c) experimental elements that are key to the
experiment, (d) major results, (e) comment on what the results mean or major problems arising
that complicate interpretation, and (f) conclusion. Give the key results and data that are necessary
to support your conclusions. Give real values—do not say “we measured some stuff” and got this
conclusion.
• You do not need to start each section on a new page.
Kevin Fischer Chem 219 page 3
Lab: Chem 219 Lab Report Guide date: 9/21/2021
INTRODUCTION
The INTRODUCTION (a) introduces the problem to be addressed and (b) tells why the work
being done is important. The INTRODUCTION then goes on to tell (c) something about the
experimental approach used in the experiment and why. The minimum length of the
INTRODUCTION would therefore be 3 paragraphs. Think of the introduction to be an overture to
the work.
When you cite the work of others, cite it using parentheses as shown here. For example, I
have published work looking at how leucine is metabolized in the body (1) and how amino acids
are absorbed by the gut and liver (2-4).

Kevin Fischer Chem 219 page 4
Lab: Chem 219 Lab Report Guide date: 9/21/2021
EXPERIMENTAL
Each sub-section in the experimental section has a sub-heading that is set off in bold. The
sub-sections are shown below.
Not all sub-sections may be required.
NOTE: If you develop an equation or relationship from the data that you have collected,
then that material goes in the RESULTS and DISCUSSION sections, not in the EXPERIMENTAL section.
The EXPERIMENTAL section is only for what you know when you started the study.
Other big points:
• Do not give results in the experimental section. Results go in next section
• Write in the past tense. You are reporting about what you did, not what you are
doing or what you are planning to do
Theory. Place here the background material required to explain your results. The theory
may include material leading up to what you explain in the data analysis sub-section that
follows. For example, if you are doing IR, then the theory as to how the rotational and
vibrational components arise and are measured go here. This section would include appropriate
citations to the literature (5). This section will demonstrate that you understand what you are
doing in this experiment, but it is not necessary to regurgitate the literature verbatim – just state
the critical elements required to understand the experiment.
Materials. State the chemicals, reagents and solutions that you used. Say what the
materials are and where you got them. If they were provided to you, state who gave them to you
and what you know about their history (when prepared etc.). If the materials came from a
manufacturer, give the manufacturer’s name (and location in parentheses). For example:
Reagent-grade glucose was obtained from Sigma Chemical Comp. (St. Louis), and N-methyl-N-
(t-butyldimethylsilyl)-trifluoroacetamide (MTBSTFA) was obtained from Pierce Chemical
company (Rockford, IL).
Kevin Fischer Chem 219 page 5
Lab: Chem 219 Lab Report Guide date: 9/21/2021
Instrumentation. If specific piece(s) of instrumentation are central to the experiment and
were used in specific modes, give the name, model, manufacturer and key features of the
instrument.
Procedures. Here is where you outline your experiment(s). Give an overview paragraph
of the experiment(s) first; then give individual paragraphs concerning each experiment or sub-
part. State clearly and succinctly what you did.
The predominant approach to defining procedures has been to use “passive voice”. A
simple example is: Samples were collected in 10-ml tubes, and the solvent evaporated
under a stream of dry N2 gas. When the tubes were dry, the derivatizing reagent was
added. The tubes were capped and heated for 30 min at 100° C in an aluminum heating
block.
Data Analysis. You succinctly state the calculations you performed in this section. This
section should describe how all results were calculated from data that you collected in your
experiments. The RESULTS and DISCUSSION sections should not need to state or restate your
calculations—they should be defined here. You give the key equations you used to calculate
your data. You define all variables in the equation (generally after stating the equation), and you
give units of measure for all variables. Simple equations can be written using normal word-
processing. Really simple equations can be worked into the text. An example is: Blood glucose
concentration ([G], mM) was the product of the measured glucose per sample (nG,
nmol) and sampled aliquot (V, µl): [G] = nG/V.
When an equation is longer, it is set off in its own paragraph. All equations that are set
off on their own line should have an equation number in parentheses at the right. An example is:
Kevin Fischer Chem 219 page 6
Lab: Chem 219 Lab Report Guide date: 9/21/2021
Homocysteine was determined from the ion intensity ratio of unlabeled
homocysteine to [2H4]homocysteine (R0/4):
n0 = n4 • [R0/4 - R0/4(4)]/k0/4, (Eq. 1)
where n0 is the amount of homocysteine (nmol), n4 is the amount of
[2H4]homocysteine added to the sample (2 x the amount of [2H8]homocystine), R0/4 is the
measured A411/A415 ion intensity ratio, and R0/4(4) is the A411/A415 ion intensity ratio when
pure [2H4]homocysteine is injected.
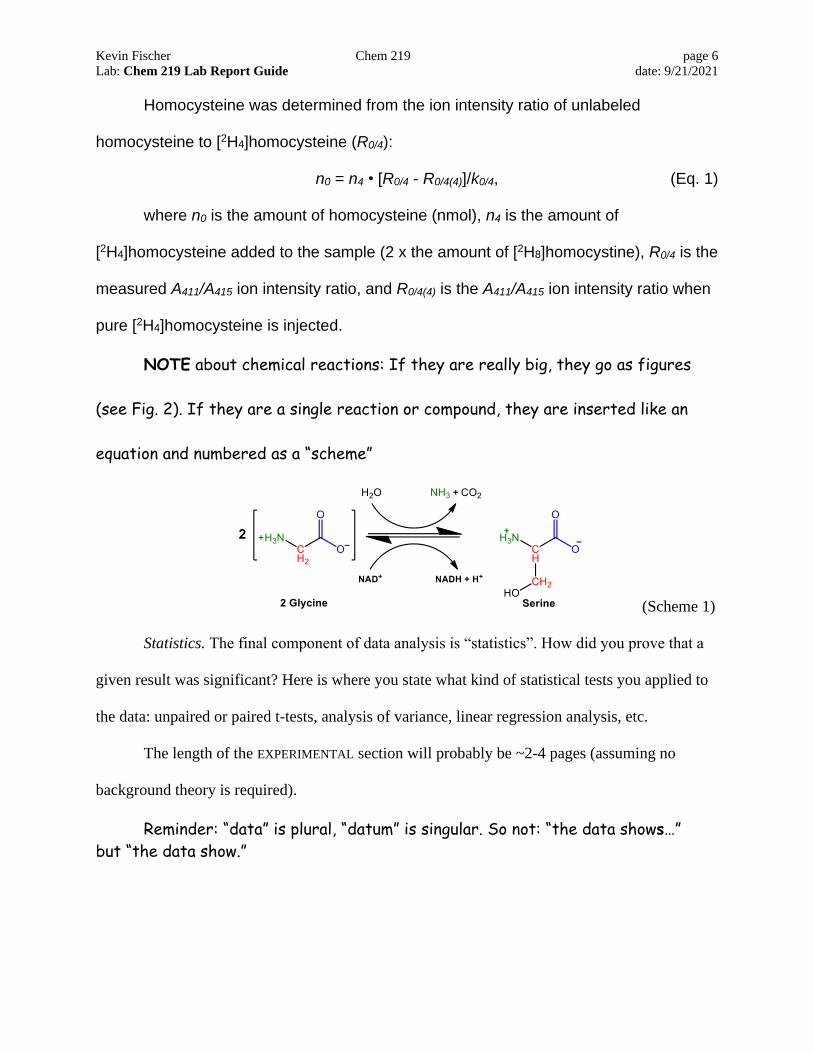
NOTE about chemical reactions: If they are really big, they go as figures
(see Fig. 2). If they are a single reaction or compound, they are inserted like an
equation and numbered as a “scheme”
(Scheme 1)
Statistics. The final component of data analysis is “statistics”. How did you prove that a
given result was significant? Here is where you state what kind of statistical tests you applied to
the data: unpaired or paired t-tests, analysis of variance, linear regression analysis, etc.
The length of the EXPERIMENTAL section will probably be ~2-4 pages (assuming no
background theory is required).
Reminder: “data” is plural, “datum” is singular. So not: “the data shows…”
but “the data show.”
Kevin Fischer Chem 219 page 7
Lab: Chem 219 Lab Report Guide date: 9/21/2021
RESULTS
The RESULTS section is your experimental results. The key to the RESULTS section is an
organized layout that builds logically from the simple and basic to the complex. Results that
depend on earlier results come later. Make this section a logical development of your data. Do
not show data that you did not obtain. If you want to discuss data that come from the literature or
someone else’s work, save it for the DISCUSSION. Some interpretation of the results may be given
in this section (e.g. statistical analysis of significance), but discussion of the results and their
importance comes in the next section.
The RESULTS section is where almost all the tables and figures are cited. Use Arabic
numbering for your tables and figures. Put tables and figures on separate pages after the written
text (see below). Capitalize references to specific tables and figures, such as “Table 2” or
“Figure 1.” Summarize the tables and figures in the RESULTS section.
Once you have prepared tables and figures of your data, the RESULTS section will write
itself and may only be 1-2 pages. The simplest approach is to think of the RESULTS section being
one paragraph describing each figure and/or table (if the data in the table matches or tabulates
what is in the figure, both can be in the same paragraph). Do not jam descriptions of several
figures into a single paragraph. Paragraphs are complete thoughts, and so should be individual
figures. You need to introduce the figure, explain the figure, and summarize what the figure tells
you.
Tell a story with the RESULTS section. Yes, you can repeat (briefly) some of the
introductory material to start the story off. Tell the reader what you first did and why. For
example, you may have taken several spectra at different resolutions and conditions with the
spectrometer to see the effect of spectrometer settings had on the resulting spectra. Then you
Kevin Fischer Chem 219 page 8
Lab: Chem 219 Lab Report Guide date: 9/21/2021
may have used the optimal settings obtained in the first part to take experimental data. If so, start
out by telling the reader that “before you could investigate the spectroscopic properties of the
compound dimugleoglugtane, you first needed to optimize the conditions of the spectrometer. To
do that you first measured trimethylsimplene as the model compound to test various
spectrometer parameters.” Then you can present your data for this part: “Fig. 1 shows the
spectrum of trimethylsimplene obtained where __ resolution was used. Note that the individual
peaks overlap. However, when resolution was increased to __, the individual peaks became
resolved (Fig. 2).” …and so one to tell the story of your RESULTS of your experiments in a logical
fashion.
Kevin Fischer Chem 219 page 9
Lab: Chem 219 Lab Report Guide date: 9/21/2021
DISCUSSION
This section is where you discuss your results. That is, you say what is important about
them--good and bad. You put your results in context with information already in the literature.
Often times, the first paragraph of the discussion is a restatement of the problem and why
you are doing what you are doing. That paragraph makes it easier to slide into giving the strength
and weaknesses of your findings and comparing your results with the literature.
Although it is not mandatory, most people have a final paragraph in their discussion that
serves as a conclusions paragraph. The conclusions paragraph serves to summarize the important
findings of the work.
The length of the DISCUSSION section is dependent upon what you have to say. 2-5 pages
should suffice.
LITERATURE CITED
References will be cited in the text using numbers in parentheses (1) and then listed here
numerically by citation order. You can use either standard ACS format or J. Biol. Chem. format for
the citations. The references you see below are J. Biol. Chem. format.
Do not quote anything from the literature without putting quotes around
what you are “quoting.”
1. Matthews, D. E., Bier, D. M., Rennie, M. J., Edwards, R. H. T., Halliday, D., Millward, D. J.,
and Clugston, G. A. (1981) Science 214, 1129-1131
2. Matthews, D. E., Marano, M. A., and Campbell, R. G. (1993) Am. J. Physiol. Endocrinol.
Metab. 264, E109-E118
3. Matthews, D. E., Marano, M. A., and Campbell, R. G. (1993) Am. J. Physiol. Endocrinol.
Metab. 264, E848-E854
Kevin Fischer Chem 219 page 10
Lab: Chem 219 Lab Report Guide date: 9/21/2021
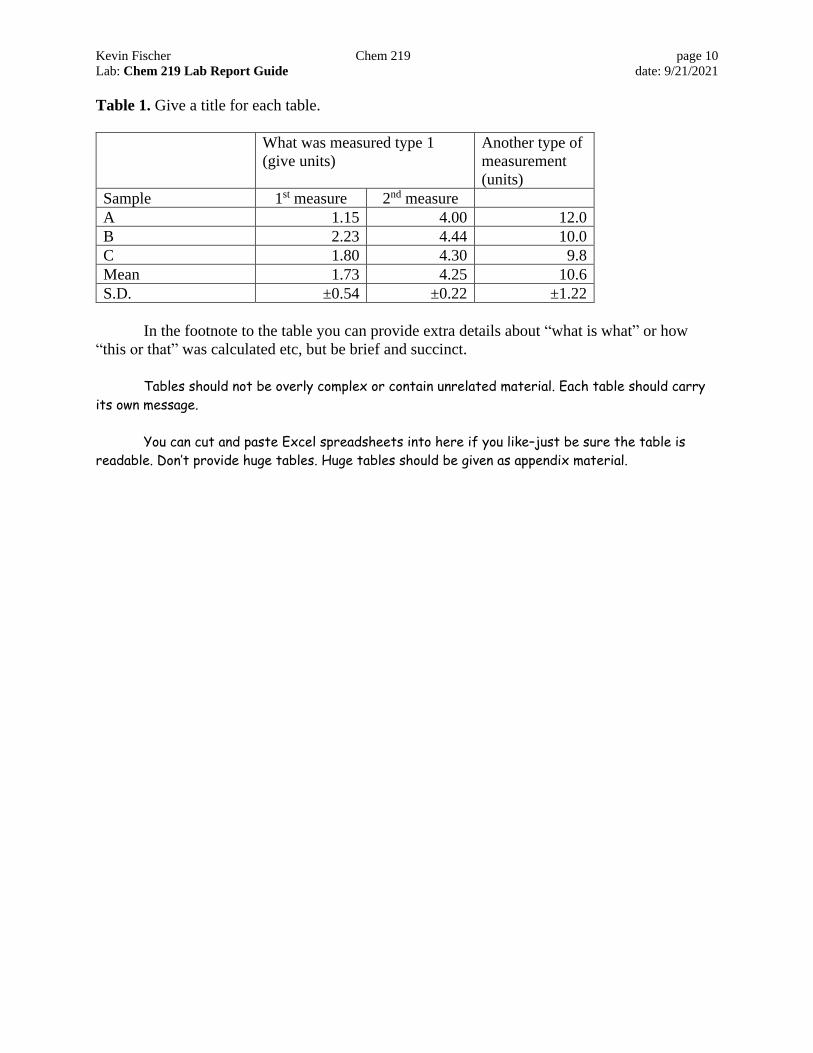
Table 1. Give a title for each table.
What was measured type 1
(give units)
Another type of
measurement
(units)
Sample 1st measure 2nd measure
A 1.15 4.00 12.0
B 2.23 4.44 10.0
C 1.80 4.30 9.8
Mean 1.73 4.25 10.6
S.D. ±0.54 ±0.22 ±1.22
In the footnote to the table you can provide extra details about “what is what” or how
“this or that” was calculated etc, but be brief and succinct.
Tables should not be overly complex or contain unrelated material. Each table should carry
its own message.
You can cut and paste Excel spreadsheets into here if you like–just be sure the table is
readable. Don’t provide huge tables. Huge tables should be given as appendix material.

Kevin Fischer Chem 219 page 11
Lab: Chem 219 Lab Report Guide date: 9/21/2021
Notes about producing figures (examples shown below):
Figure 1. Provide a title sentence for the figure. Then give any supporting sentences you need to
explain the figure and tell what is what on the figure. For example, what are the symbols?
This section can be typed single space to save room.
Notes:
• Be sure to annotate your figure axes clearly
• Be sure to use large enough type in your figures to be readable
• If you “scan” a figure, be sure that it is saved compactly as a JPEG, TIF, or GIF format and
that it is clearly readable
Other notes:
Microsoft Excel:
1. When you prepare a graph, you almost always want to choose the “XY Scatter” plot. Do
not choose “Line” because “Line” gives you even spacing of the x-symbols, regardless of
their value.
2. Make sure the plot area is clear/white
3. Do not use grid lines. Turn them off
4. Do not use a title on your Excel figure. You add the title in Word as your figure caption
text
5. Format your x & y axes appropriately:
a. Set the font to be appropriate (i.e. bigger than default) for your axis annotations
b. Set the scale to be appropriate repeat patterns (e.g. “0, 5, 10, 15, 20…”, not “-0.5,
5.5, 11.5…”
c. Use an appropriate number of zeros in your axes. Don’t have values of “0.000,
2.000, 4.000, 8.000” when “0, 2, 4, 8” are more readable and simpler
d. Add an x-axis and a y-axis title that describes what the axes are. Be sure the title
font size is as large or larger than you annotated numbers
e. If you need to plot two traces of (i) significantly different scales (e.g. on has a
maximum intensity of 1000 and the other has a maximum of 50) or (ii) different
units (e.g. one is absorption and one is emission), then have one trace use the right
Y-axis. (Right click on the series data and select “Format data series” and select
“Secondary axis” under “Series options”.)
f. If the scale of your axis is really big (e.g. 100,000) or small (e.g. 0.00001), then
scale your data and plot it with a scale factor. For example, 100,000 would be
divided by 1000 and plotted so that the maximum value would be 100 (“100” is
more readable than 100,000)

Kevin Fischer Chem 219 page 12
Lab: Chem 219 Lab Report Guide date: 9/21/2021
6. Use simple geometric symbols for your graph points: open or closed circles (e.g. ○●),
squares (□■), triangles or inverted triangles
7. Be sure your lines/curves are of appropriate thickness and line style (solid lines preferred)
8. Annotate every key peak in a figure (see example that follows)
Final important point:
Be sure your figure is included at an appropriate size.
1. If it is better to turn the page from portrait to landscape to make the figure bigger, do it
2. Don’t try to jam several figures on a page by making them smaller

Kevin Fischer Chem 219 page 13
Lab: Chem 219 Lab Report Guide date: 9/21/2021
Figure 1. Selection ion traces showing elution of leucine and isoleucine (m/z =349, blue trace),
[1,2-13C2] leucine (m/z = 351, orange trace and right-side y-axis), and [2H7] leucine (m/z = 356,
green trace).
Kevin Fischer Chem 219 page 14
Lab: Chem 219 Lab Report Guide date: 9/21/2021
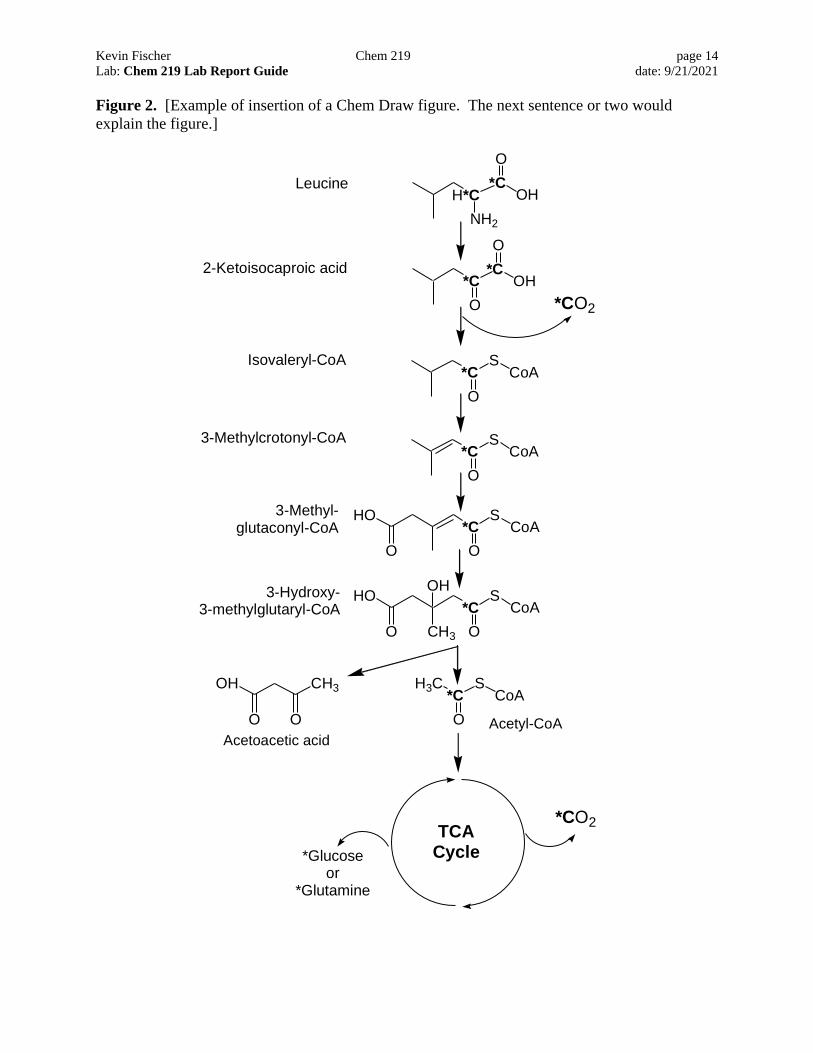
Figure 2. [Example of insertion of a Chem Draw figure. The next sentence or two would
explain the figure.]
*C
O
H*C OH
NH2
*C
O
*C OH
O
S*C
O
CoA
S*C
O
CoA
S*C
O
CoAHO
O
S*C
OCH3
CoAHO
O
OH
S*C
O
CoAH3C
O
OH
O
CH3
Leucine
2-Ketoisocaproic acid
Isovaleryl-CoA
3-Methylcrotonyl-CoA
3-Methyl-glutaconyl-CoA
3-Hydroxy-3-methylglutaryl-CoA
Acetoacetic acidAcetyl-CoA
*Glucoseor
*Glutamine
*CO2TCA
Cycle
*CO2
Kevin Fischer Chem 219 page 15
Lab: Chem 219 Lab Report Guide date: 9/21/2021
APPENDICES
#1. Give a title
#2. Give a title
If you have material that is relevant to your report in the form of complex spectra, long lists of
data, etc that do not readily go into a making a simple table or figure, then these materials may be
attached as appendices to the end of the report. List each piece of material with a sequential
number and title.
Related Documents