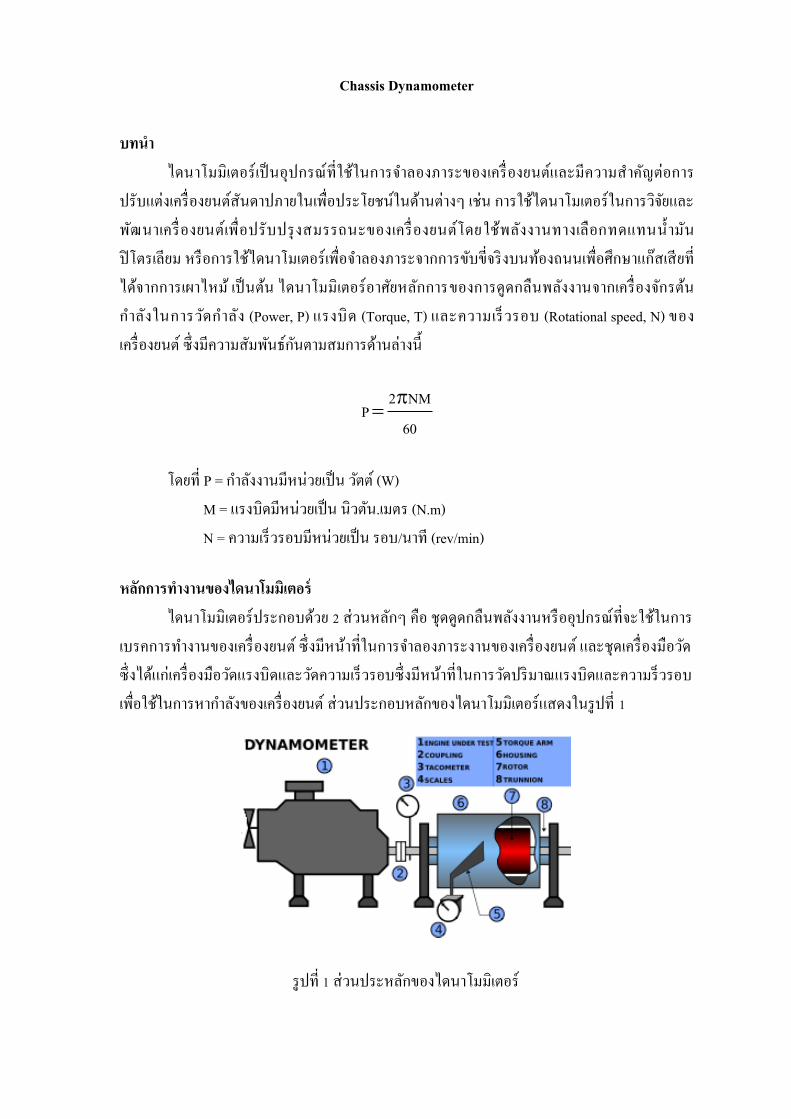
Chassis Dynamometer บทนำ ไดนาโมมิเตอร์เป็นอุปกรณ์ที่ใช้ในการจาลองภาระของเครื่องยนต์และมีความสาคัญต่อการ ปรับแต่งเครื่องยนต์สันดาปภายในเพื่อประโยชน์ในด้านต่างๆ เช่น การใช้ไดนาโมเตอร์ในการวิจัยและ พัฒนาเครื่องยนต์เพื่อปรับปรุงสมรรถนะของเครื่องยนต์โดยใช้พลังงานทางเลือกทดแทนน ้ ามัน ปิโตรเลียม หรือการใช้ไดนาโมเตอร์เพื่อจาลองภาระจากการขับขี่จริงบนท้องถนนเพื่อศึกษาแก๊สเสียที่ ได้จากการเผาไหม้ เป็นต้น ไดนาโมมิเตอร์อาศัยหลักการของการดูดกลืนพลังงานจากเครื่องจักรต้น กาลังในการวัดกาลัง (Power, P) แรงบิด (Torque, T) และความเร็วรอบ (Rotational speed, N) ของ เครื่องยนต์ ซึ ่งมีความสัมพันธ์กันตามสมการด้านล่างนี ้ 2 NM P 60 โดยที่ P = กาลังงานมีหน่วยเป็น วัตต์ (W) M = แรงบิดมีหน่วยเป็น นิวตัน.เมตร (N.m) N = ความเร็วรอบมีหน่วยเป็น รอบ/นาที (rev/min) หลักกำรทำงำนของไดนำโมมิเตอร์ ไดนาโมมิเตอร์ประกอบด้วย 2 ส่วนหลักๆ คือ ชุดดูดกลืนพลังงานหรืออุปกรณ์ที่จะใช้ในการ เบรคการทางานของเครื่องยนต์ ซึ ่งมีหน้าที่ในการจาลองภาระงานของเครื่องยนต์ และชุดเครื่องมือวัด ซึ ่งได้แก่เครื่องมือวัดแรงบิดและวัดความเร็วรอบซึ ่งมีหน้าที่ในการวัดปริมาณแรงบิดและความร็วรอบ เพื่อใช้ในการหากาลังของเครื่องยนต์ ส ่วนประกอบหลักของไดนาโมมิเตอร์แสดงในรูปที่ 1 รูปที่ 1 ส ่วนประหลักของไดนาโมมิเตอร์

Welcome message from author
This document is posted to help you gain knowledge. Please leave a comment to let me know what you think about it! Share it to your friends and learn new things together.
Transcript
Chassis Dynamometer
บทน ำ ไดนาโมมเตอรเปนอปกรณทใชในการจ าลองภาระของเครองยนตและมความส าคญตอการ
ปรบแตงเครองยนตสนดาปภายในเพอประโยชนในดานตางๆ เชน การใชไดนาโมเตอรในการวจยและพฒนาเครองยนตเพอปรบปรงสมรรถนะของเครองยนตโดยใชพลงงานทางเลอกทดแทนน ามนปโตรเลยม หรอการใชไดนาโมเตอรเพอจ าลองภาระจากการขบขจรงบนทองถนนเพอศกษาแกสเสยทไดจากการเผาไหม เปนตน ไดนาโมมเตอรอาศยหลกการของการดดกลนพลงงานจากเครองจกรตนก าลงในการวดก าลง (Power, P) แรงบด (Torque, T) และความเรวรอบ (Rotational speed, N) ของเครองยนต ซงมความสมพนธกนตามสมการดานลางน
2 NM
P60
โดยท P = ก าลงงานมหนวยเปน วตต (W) M = แรงบดมหนวยเปน นวตน.เมตร (N.m) N = ความเรวรอบมหนวยเปน รอบ/นาท (rev/min)
หลกกำรท ำงำนของไดนำโมมเตอร ไดนาโมมเตอรประกอบดวย 2 สวนหลกๆ คอ ชดดดกลนพลงงานหรออปกรณทจะใชในการเบรคการท างานของเครองยนต ซงมหนาทในการจ าลองภาระงานของเครองยนต และชดเครองมอวดซงไดแกเครองมอวดแรงบดและวดความเรวรอบซงมหนาทในการวดปรมาณแรงบดและความรวรอบเพอใชในการหาก าลงของเครองยนต สวนประกอบหลกของไดนาโมมเตอรแสดงในรปท 1
รปท 1 สวนประหลกของไดนาโมมเตอร
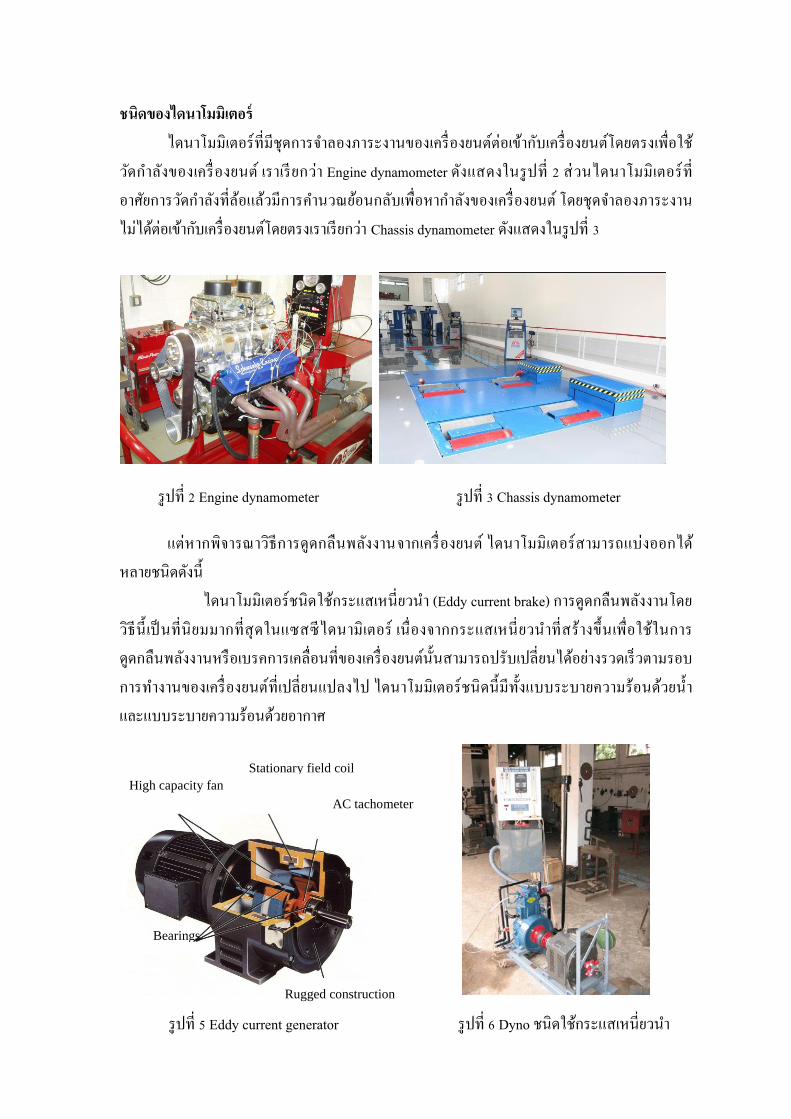
ชนดของไดนำโมมเตอร ไดนาโมมเตอรทมชดการจ าลองภาระงานของเครองยนตตอเขากบเครองยนตโดยตรงเพอใชวดก าลงของเครองยนต เราเรยกวา Engine dynamometer ดงแสดงในรปท 2 สวนไดนาโมมเตอรทอาศยการวดก าลงทลอแลวมการค านวณยอนกลบเพอหาก าลงของเครองยนต โดยชดจ าลองภาระงานไมไดตอเขากบเครองยนตโดยตรงเราเรยกวา Chassis dynamometer ดงแสดงในรปท 3
รปท 2 Engine dynamometer รปท 3 Chassis dynamometer
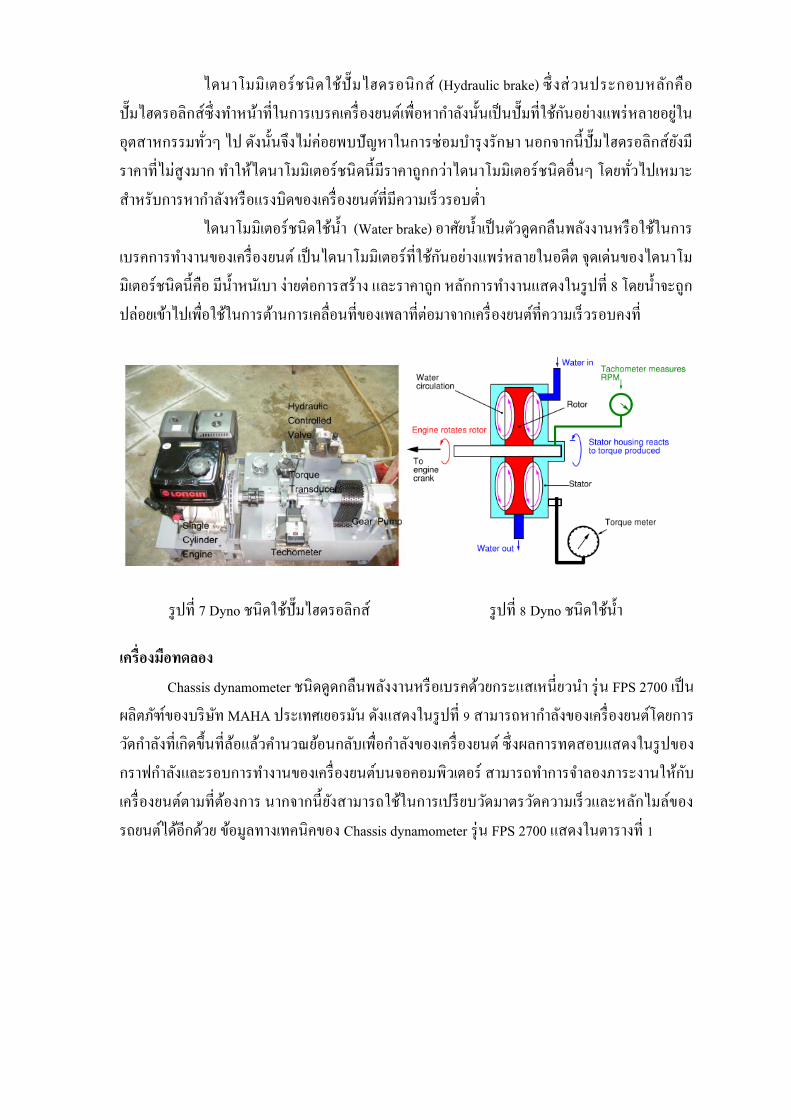
แตหากพจารณาวธการดดกลนพลงงานจากเครองยนต ไดนาโมมเตอรสามารถแบงออกไดหลายชนดดงน ไดนาโมมเตอรชนดใชกระแสเหนยวน า (Eddy current brake) การดดกลนพลงงานโดยวธนเปนทนยมมากทสดในแซสซไดนามเตอร เนองจากกระแสเหนยวน าทสรางขนเพอใชในการดดกลนพลงงานหรอเบรคการเคลอนทของเครองยนตนนสามารถปรบเปลยนไดอยางรวดเรวตามรอบการท างานของเครองยนตทเปลยนแปลงไป ไดนาโมมเตอรชนดนมทงแบบระบายความรอนดวยน าและแบบระบายความรอนดวยอากาศ
รปท 5 Eddy current generator รปท 6 Dyno ชนดใชกระแสเหนยวน า
High capacity fan
Stationary field coil
AC tachometer
Bearings
Rugged construction
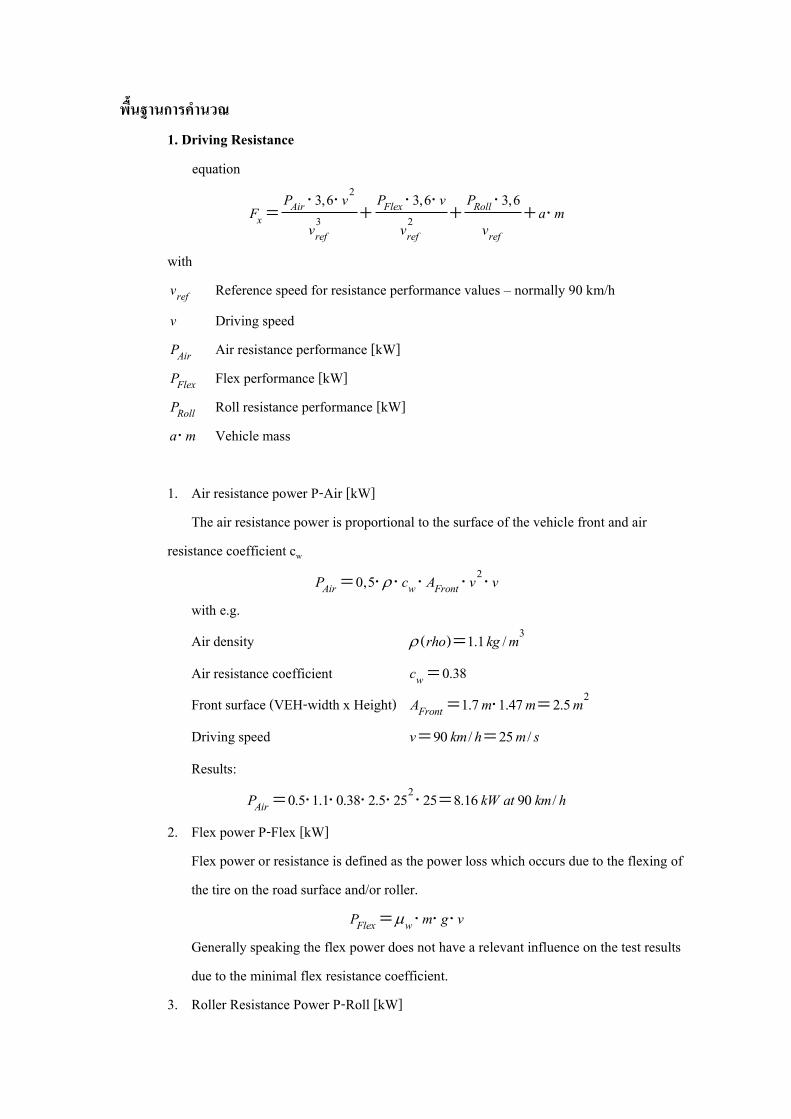
ไดนาโมมเตอรชนดใชปมไฮดรอนกส (Hydraulic brake) ซงสวนประกอบหลกคอปมไฮดรอลกสซงท าหนาทในการเบรคเครองยนตเพอหาก าลงนนเปนปมทใชกนอยางแพรหลายอยในอตสาหกรรมทวๆ ไป ดงนนจงไมคอยพบปญหาในการซอมบ ารงรกษา นอกจากนปมไฮดรอลกสยงมราคาทไมสงมาก ท าใหไดนาโมมเตอรชนดนมราคาถกกวาไดนาโมมเตอรชนดอนๆ โดยทวไปเหมาะส าหรบการหาก าลงหรอแรงบดของเครองยนตทมความเรวรอบต า ไดนาโมมเตอรชนดใชน า (Water brake) อาศยน าเปนตวดดกลนพลงงานหรอใชในการเบรคการท างานของเครองยนต เปนไดนาโมมเตอรทใชกนอยางแพรหลายในอดต จดเดนของไดนาโมมเตอรชนดนคอ มน าหนเบา งายตอการสราง และราคาถก หลกการท างานแสดงในรปท 8 โดยน าจะถกปลอยเขาไปเพอใชในการตานการเคลอนทของเพลาทตอมาจากเครองยนตทความเรวรอบคงท
รปท 7 Dyno ชนดใชปมไฮดรอลกส รปท 8 Dyno ชนดใชน า
เครองมอทดลอง Chassis dynamometer ชนดดดกลนพลงงานหรอเบรคดวยกระแสเหนยวน า รน FPS 2700 เปน
ผลตภฑของบรษท MAHA ประเทศเยอรมน ดงแสดงในรปท 9 สามารถหาก าลงของเครองยนตโดยการวดก าลงทเกดขนทลอแลวค านวณยอนกลบเพอก าลงของเครองยนต ซงผลการทดสอบแสดงในรปของกราฟก าลงและรอบการท างานของเครองยนตบนจอคอมพวเตอร สามารถท าการจ าลองภาระงานใหกบเครองยนตตามทตองการ นากจากนยงสามารถใชในการเปรยบวดมาตรวดความเรวและหลกไมลของรถยนตไดอกดวย ขอมลทางเทคนคของ Chassis dynamometer รน FPS 2700 แสดงในตารางท 1

ตารางท 1 ขอมลทางเทคนค ของ Chassis dynamometer รน 2700 FPS 2700 FPS 5500 Axle load max. Weight max. Weight incl. packing Version
2.7 t 1250 kg 1350 kg
inground- and surface
5.5 t 1350 kg 1450 kg
inground only Dimensions (LxW1/W2xH1/H2)see Drawing No.43003 Roller length per roller Separation roller inner edges Separation roller outside edges Roller diameter Roller axle separation Power supply Fuse Compressed air for lifting bar Smallest testable wheel diameter Driving direction Max. test speed Measurement accuracy wheel power Maximum engine standard power Max. traction Packing dimensions (LxWxH) Power paint coating
3539x718/930x450/725 mm 850 mm 736 mm 2438 mm 217 mm 444 mm
230 V, 500/600 Hz 20 A slow
min 6 bar, max. 10 bar 13’
one direction 200 km/h
+/- 3% 260 kW 6000 N
4.0 x 1.1 x 1.0 blue RAL 5010
dark gray RAL 7016
รปท 9 Chassis dynamometer รน FPS 2700
พนฐำนกำรค ำนวณ
1. Driving Resistance equation
2
3 23,6 3,6 3,6Air Flex Roll
xref ref ref
P v P v PF a m
v v v
with
refv Reference speed for resistance performance values – normally 90 km/h v Driving speed
AirP Air resistance performance [kW]
FlexP Flex performance [kW]
RollP Roll resistance performance [kW] a m Vehicle mass
1. Air resistance power P-Air [kW]
The air resistance power is proportional to the surface of the vehicle front and air resistance coefficient cw
20,5Air w FrontP c A v v
with e.g.
Air density 3( ) 1.1 /rho kg m
Air resistance coefficient 0.38wc
Front surface (VEH-width x Height) 21.7 1.47 2.5FrontA m m m
Driving speed 90 / 25 /v km h m s
Results: 20.5 1.1 0.38 2.5 25 25 8.16 90 /AirP kW at km h
2. Flex power P-Flex [kW] Flex power or resistance is defined as the power loss which occurs due to the flexing of the tire on the road surface and/or roller.
Flex wP m g v Generally speaking the flex power does not have a relevant influence on the test results due to the minimal flex resistance coefficient.
3. Roller Resistance Power P-Roll [kW]

The rolling resistance power arises from tire and road surface deformation as a function of speed
Roll rP m g v with e.g. Roll resistance coefficient of the tires 0.012r Vehicle mass 950m kg
Gravitation constant 29.81 /g m s
Driving speed 90 / 25 /v km h m s
The result is: 0.012 950 9.81 25 2.79RollP kW
Since this value only represents a small fraction of the total driving resistance it is entered as a fixed standard value on our dynamometers: for steel belted redial tires approx. 2.5 kW, for winter tires approx. 3.75 kW. Setting of the vehicle mass, the aerodynamic drag power and the rolling resistance power is absolutely necessary for driving resistance simulation and stop watch tests, in order to simulation the vehicle under the correct driving resistance.
4. Mass m=Vehicle mass [kg] This value is needed in order to attain a proportional traction F via the eddy-current brake from the vehicle determined acceleration.
[ ]F m a N
2. Torque Equation
[ ] 9549
[ / min]
P kWM
n rot
3. Calculation equation of the Standardized Power
Norm MotP k P with NormP Standardized engine power k Correction factor MotP Measured engine power
4. Projection of the Engine Power with Gasoline Engines
DIN 70020 1013 273
293F
Tk
p
EWG 80/1269
1.2 0.6990 273
298T
Tk
p
ISO 1585 1.2 0.6990 273
298T
Tk
p
SAE J1349 1.2 0.6990 273
298T
Tk
p
JIS D1001 1.2 0.6990 273
298T
Tk
p
With k correction factor
Fp pressure of humidity (measured barometric air pressure in mbar)
Tp pressure of dry air (in mbar) T intake air temperature Calculation of the dry air pressure
T F steamp p p Calculation of the steam pressure
steam Air saturationp H p with steamp steam pressure (pressure part of the water part dissolved in the air in mbar) AirH Relative humidity saturationp Saturation pressure in the air (in mbar)
Calculation of the saturation pressure
8.020 2.8868 1.098
100saturationT
T C p
o
12.30 0.04689 1.486
100saturationT
T C p
o
with T ambient air temperature 5. Projection of the Engine Power Diesel Engines (Suction and/or mech. Charger)
DIN 70020 1013 273
293F
Tk
p
EWG 80/1269
0.7990 273
298
fm
T
Tk
p
ISO 1585 0.7990 273
298
fm
T
Tk
p
SAE J1349 0.7990 273
298
fm
T
Tk
p
JIS D1001 0.7990 273
298
fm
T
Tk
p
with fm engine factor (Standard = 0.3) 6. Projection of the Engine Power with Turbodiesel Engines
DIN 70020 1013 273
293F
Tk
p
EWG 80/1269
0.7 1.5990 273
298
fm
T
Tk
p
ISO 1585 0.7 1.2990 273
298
fm
T
Tk
p

SAE J1349 0.7 1.5990 273
298
fm
T
Tk
p
JIS D1001 0.7 1.5990 273
298
fm
T
Tk
p
with fm engine factor (Standard = 0.3)
The projection equation for Turbodiesel engine in the ISO 1585 only applies to air cooled charger cooling. The following equation applies to water cooled charger cooling.:
ISO 1585 (Water cooled)
0.7 0.7990 273298
fm
T
Tk
p
7. Calculate Engine Factor fm In most cases fm = 0.3 applies but this value can be changes. The following equations are used: Engine factor fm based on ISO 1585:
37.2 65qr
0.036 1.14q
fmr
37.2qr 0.2fm
65qr 1.2fm
Engine factor fm based on EWG 80/1269, SAE J1349 and JIS D1001:
40 65qr
0.036 1.14q
fmr
40qr 0.3fm
65qr 1.2fm
Pressure behavior of the supercharging: L
E
Pr
P
Specific fuel consumption based on SAE J1349:
4-stroke engine 120000F
qD n
2-stroke engine 60000F
qD n
with fm Engine factor r Pressure behavior of the supercharging q Specific fuel consumption based on SAE J1349
Lp Absolute boost pressure
Ep Absolute pressure in front of the compressor F fuel flow (mg/s) D Cubic capacity volume n Engine RPM
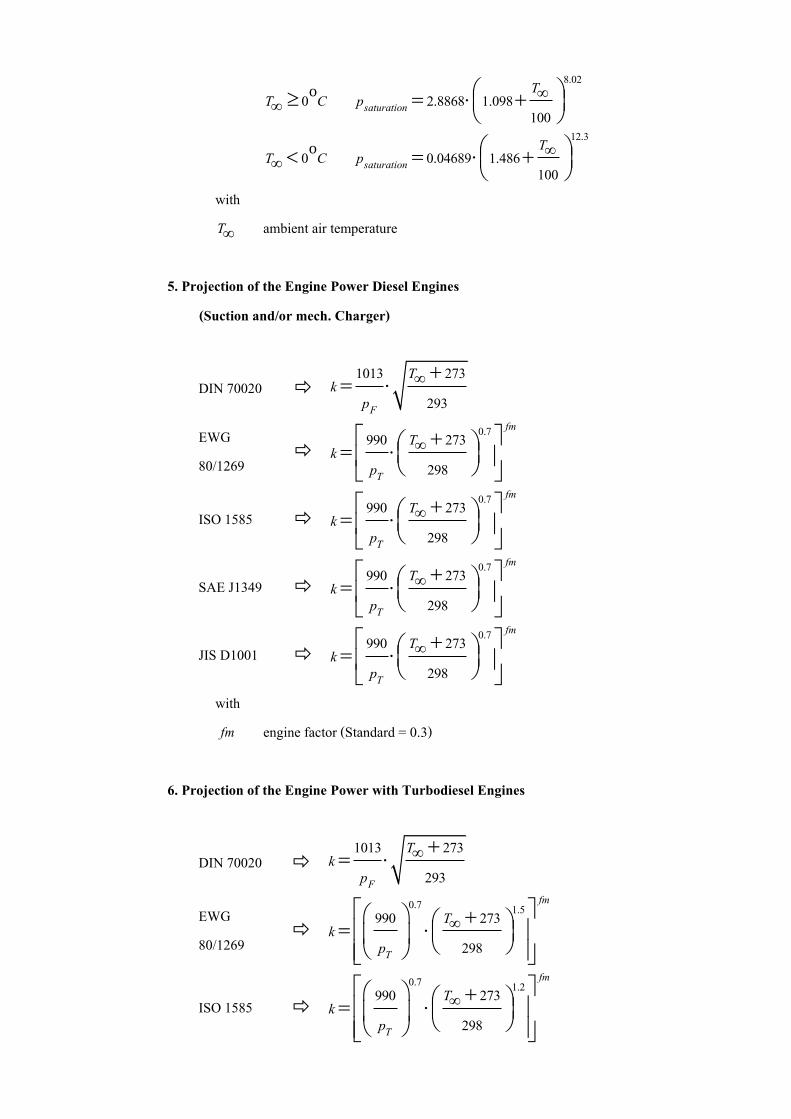
โครงสรำงของโปรแกรมกำรทดสอบ
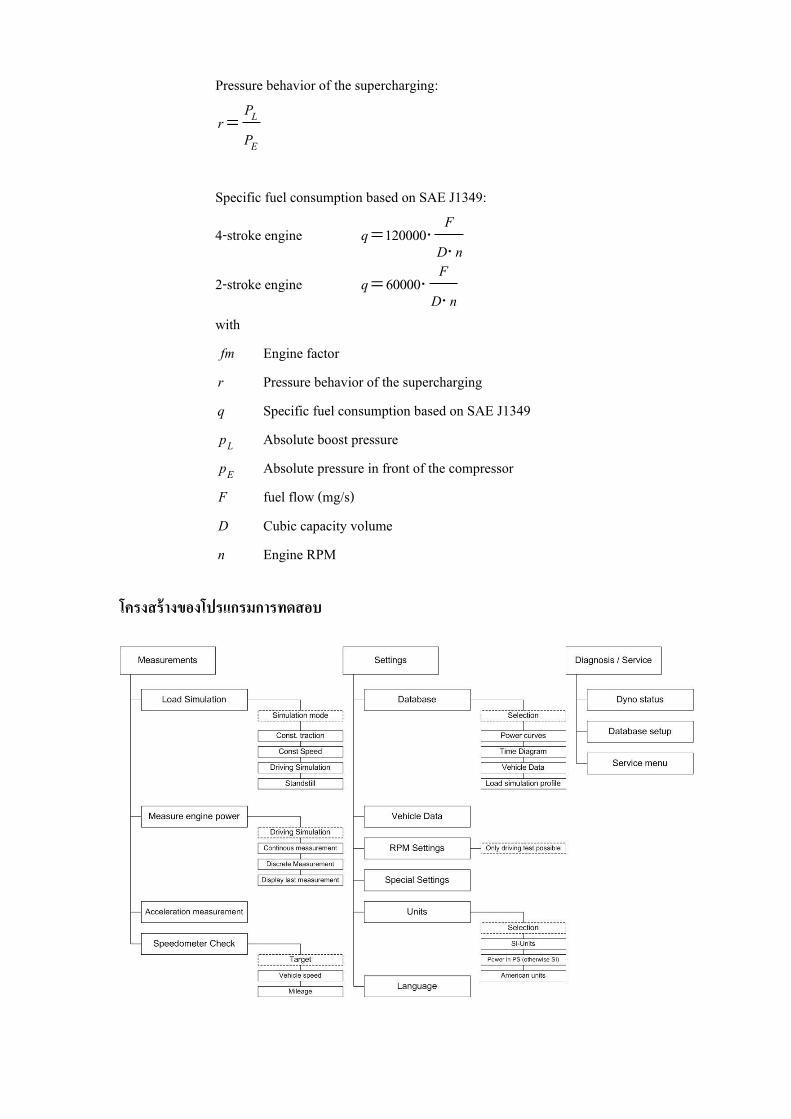
กำรถำยถอดก ำลงของเครองยนต
โดยท engineP คอ ก าลงงานจากแกสทเผาไหมถายทอดใหกบลกสบ wheelP คอ ก าลงงานทเกดขนทลอ dragP คอ ก าลงงานทสญเสยไปกบอปกรณตางๆ เชนชดเกยร คอมแพสเซอร และไดชารจ ขนตอนกำรทดลอง กำรวดก ำลงของเครองยนต การเตรยมรถทใชทดสอบ 1. ลางท าความสะอาดรถยนตทใชในการทดสอบ 2. ตรวจสอบสภาพทวไปของรถยนต เชน ตรวจระดบน ามนเครอง,ระดบน าหลอเยน 3. น ารถยนตขนบนแทนทดสอบ ควรน ารถเขาไปใหตรงต าแหนง โดยใหตวรถอยในแนวตรง 4. เปด Computer ของชดทดสอบ แลวเรยกโปรแกรม FPS 2700
Fuel Air
Engine
Thermal energy
Pengine
Pdrag Pwheel
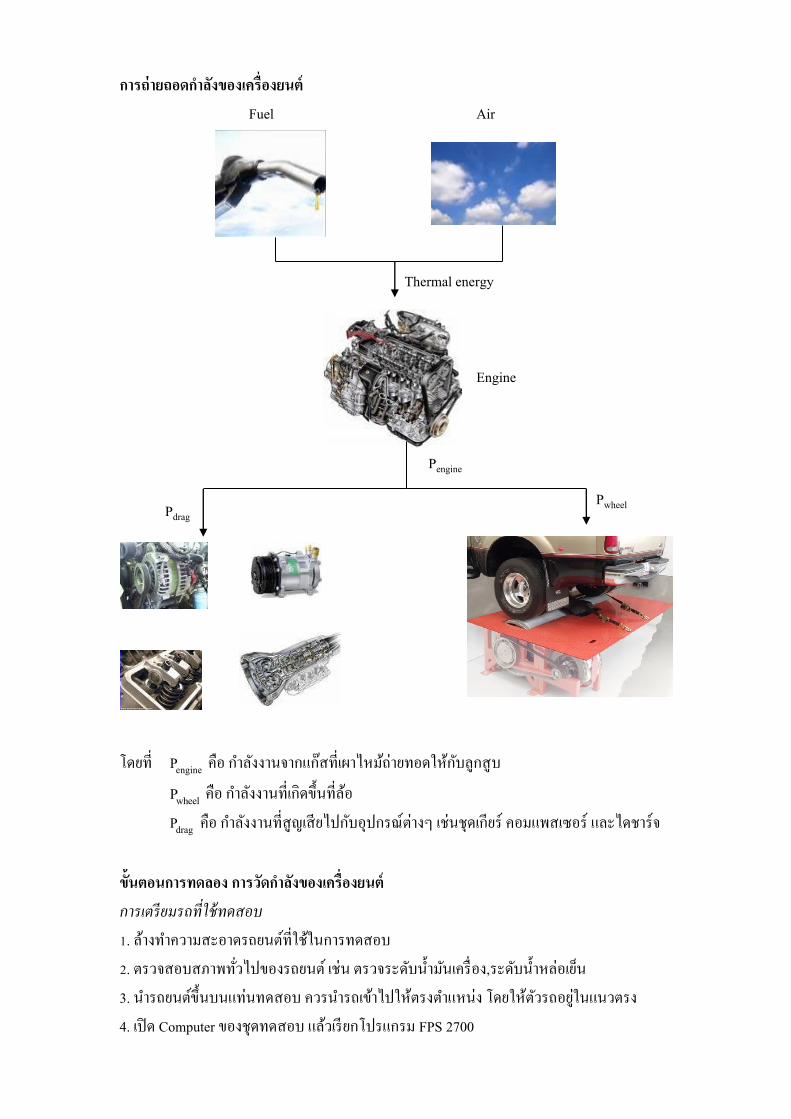
5. ปลดชดน ารถเขาลง ปลอยใหลอของรถอยใน Roller ของชดทดสอบ (กดปม F3 ตามดวย ปม ลง ท Computer) 6. ท าการยดรถทใชในการทดสอบกบจดยดของแทนทดสอบ โดยท าการยดดงน 6.1 รถยนตขบเคลอนลอหนา ใหยด 4จด ดานหนา 2 จด ดานหลง 2 จด 6.2 รถยนตขบเคลอนลอหลง ใหยด 2 จด ยดเฉพาะดานหลง 2 จด 7. น าชดพดลมระบายความรอนมาตดตง ในต าแหนงดานหนารถ การเตรยมขอมลในสวนของ Software 1. เลอก Menu Measure engine power
2. เลอก Menu Continuous measurement
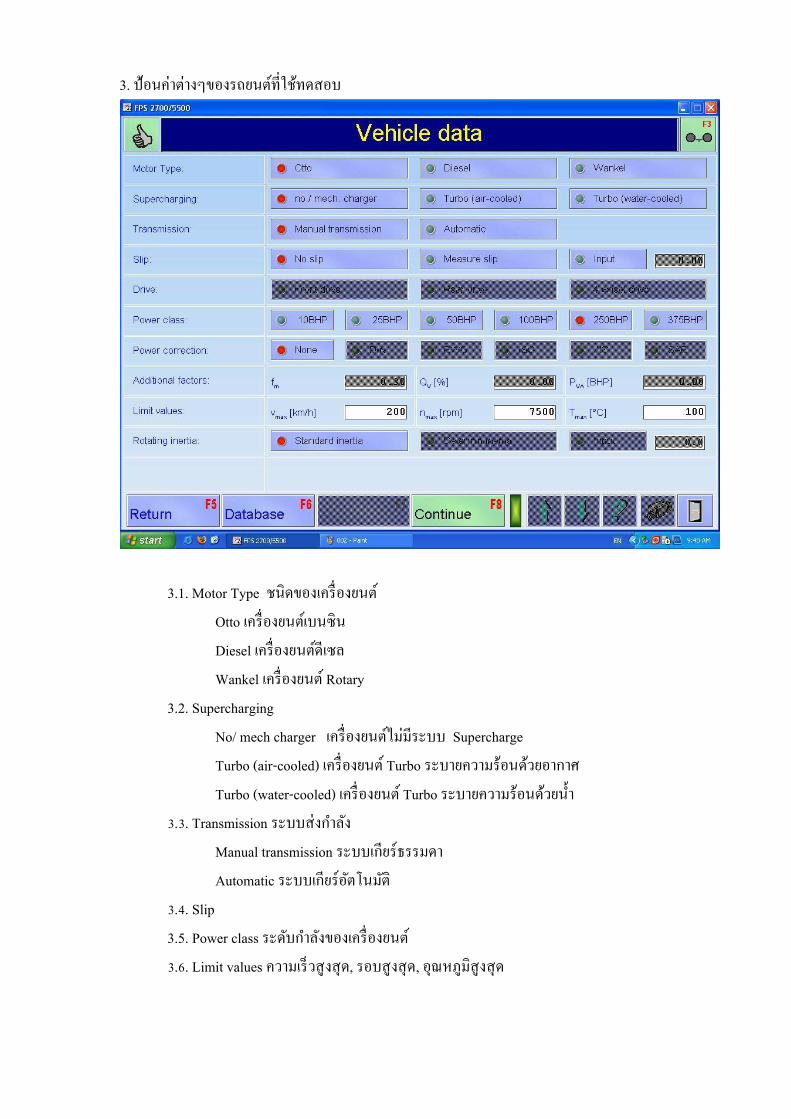
3. ปอนคาตางๆของรถยนตทใชทดสอบ
3.1. Motor Type ชนดของเครองยนต Otto เครองยนตเบนซน Diesel เครองยนตดเซล Wankel เครองยนต Rotary
3.2. Supercharging No/ mech charger เครองยนตไมมระบบ Supercharge Turbo (air-cooled) เครองยนต Turbo ระบายความรอนดวยอากาศ Turbo (water-cooled) เครองยนต Turbo ระบายความรอนดวยน า
3.3. Transmission ระบบสงก าลง Manual transmission ระบบเกยรธรรมดา Automatic ระบบเกยรอตโนมต
3.4. Slip 3.5. Power class ระดบก าลงของเครองยนต 3.6. Limit values ความเรวสงสด, รอบสงสด, อณหภมสงสด
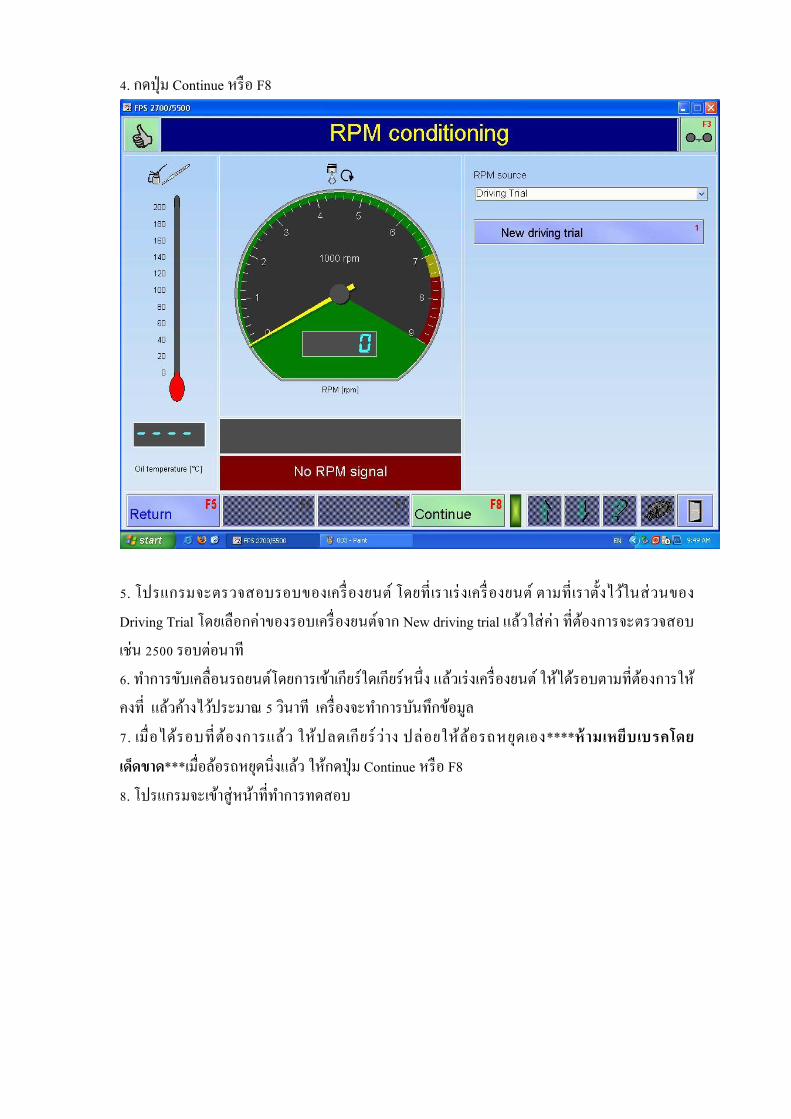
4. กดปม Continue หรอ F8
5. โปรแกรมจะตรวจสอบรอบของเครองยนต โดยทเราเรงเครองยนต ตามทเราต งไวในสวนของ Driving Trial โดยเลอกคาของรอบเครองยนตจาก New driving trial แลวใสคา ทตองการจะตรวจสอบ เชน 2500 รอบตอนาท 6. ท าการขบเคลอนรถยนตโดยการเขาเกยรใดเกยรหนง แลวเรงเครองยนต ใหไดรอบตามทตองการใหคงท แลวคางไวประมาณ 5 วนาท เครองจะท าการบนทกขอมล 7. เมอไดรอบทตองการแลว ใหปลดเกยรวาง ปลอยใหลอรถหยดเอง****หำมเหยบเบรคโดยเดดขำด***เมอลอรถหยดนงแลว ใหกดปม Continue หรอ F8 8. โปรแกรมจะเขาสหนาทท าการทดสอบ

ขนตอนการทดลอง
1. รถยนตทใชระบบเกยรธรรมดา ใหใชเกยร 4 ในระบบสงก าลงทม5 เกยร ในการทดสอบ 1.1 ท าการขบเคลอนรถยนต ไปเรอยๆโดยเรมจากเกยร 1-2-3 จนถงเกยร 4 พยายามอยาใหความเรวเกน 50 กม./ชม เพราะเครองทดสอบจะเรมวดทความเรว 50 กม./ชม 1.2 เรงเครองยนตใหไดความประมาณ 50 กม./ชม 1.3 เหยยบคนเรงใหเรวทสด จนสดคนเรง 1.4 สงเกตดกราฟทหนาจอ ของ Computer วากราฟเรมตก ใหปลดเกยรเปนเกยรวาง 1.4 ปลอยใหลอรถหยดเอง ****หำมเหยบเบรคโดยเดดขำด*** 1.5 ใสคา Environment vales 1.6 เลอกมาตรฐานทใชในการทดสอบ 1.7 บนทกผลการทดสอบ 2. รถยนตทใชระบบเกยรอตโนมต ใหปดระบบ Over drive กอน แลวใชเกยร ทต ากวาเกยรสดทายในการทดสอบ 2.1 ท าการขบเคลอนรถยนตไปเรอยๆ โดยใชเกยรทต ากวาเกยรสดทาย จนกวาเกยรจะเปลยนเปนจนครบ พยายามอยาใหความเรวเกน 50 กม./ชม 2.2 เรงเครองยนตใหไดความประมาณ 50 กม./ชม
2.3 เหยยบคนเรงใหเรวทสด จนสดคนเรง 2.4 กราฟจะเรมตก แลวโปรแกรมจะสงใหเราเปลยนเกยร ขนอก1จงหวะ หรอเกยรสดทาย 2.5 โปรแกรมจะสงใหเราเรงเครองยนตใหไดตามความเรวทไดค านวณไว 2.6 หลงจากไดความเรวตามทตองการแลว ใหปลดเกยร ใหอยในต าแหนง N 2.7 ปลอยใหลอรถหยดเอง ****หามเหยบเบรคโดยเดดขาด*** 2.8 ใสคา Environment vales 2.9 เลอกมาตรฐานทใชในการทดสอบ 2.10 บนทกผลการทดสอบ
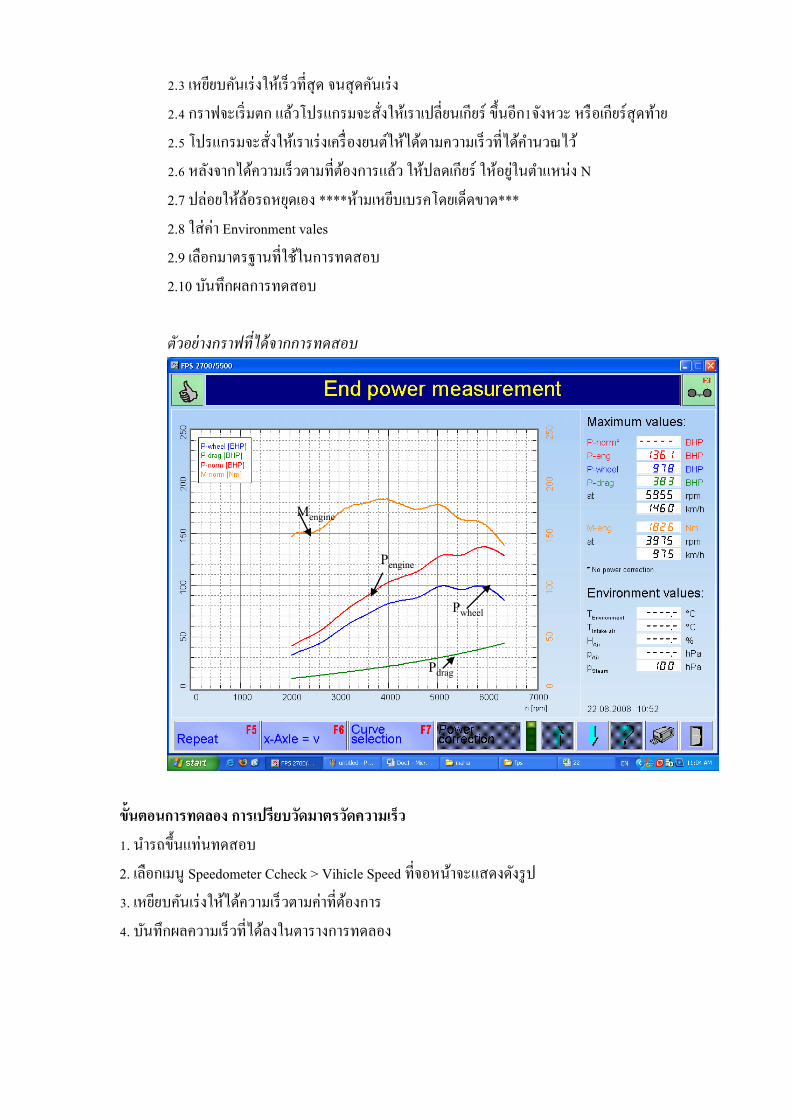
ตวอยางกราฟทไดจากการทดสอบ
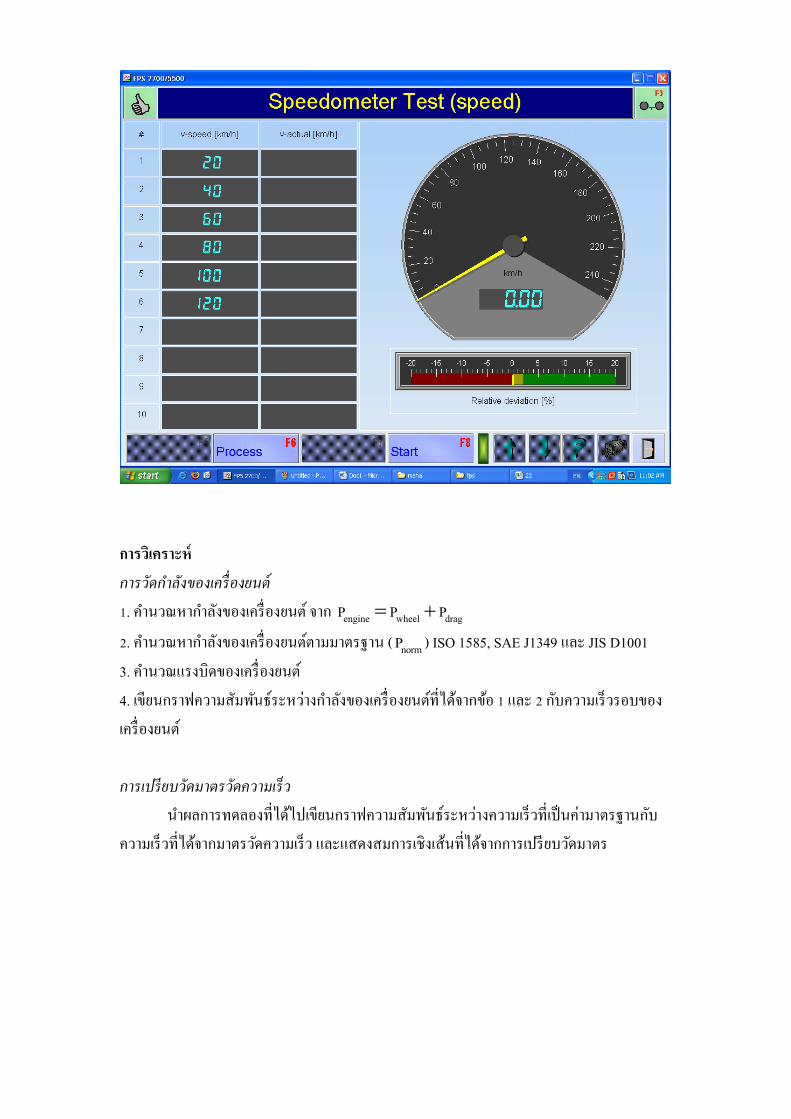
ขนตอนกำรทดลอง กำรเปรยบวดมำตรวดควำมเรว 1. น ารถขนแทนทดสอบ 2. เลอกเมน Speedometer Ccheck > Vihicle Speed ทจอหนาจะแสดงดงรป 3. เหยยบคนเรงใหไดความเรวตามคาทตองการ 4. บนทกผลความเรวทไดลงในตารางการทดลอง
Pdrag
Mengine
Pwheel
Pengine
กำรวเครำะห การวดก าลงของเครองยนต 1. ค านวณหาก าลงของเครองยนต จาก engine wheel dragP P P 2. ค านวณหาก าลงของเครองยนตตามมาตรฐาน ( normP ) ISO 1585, SAE J1349 และ JIS D1001 3. ค านวณแรงบดของเครองยนต 4. เขยนกราฟความสมพนธระหวางก าลงของเครองยนตทไดจากขอ 1 และ 2 กบความเรวรอบของเครองยนต การเปรยบวดมาตรวดความเรว
น าผลการทดลองทไดไปเขยนกราฟความสมพนธระหวางความเรวทเปนคามาตรฐานกบความเรวทไดจากมาตรวดความเรว และแสดงสมการเชงเสนทไดจากการเปรยบวดมาตร
เอกสำรอำงอง Heyhood, J.B., “Internal Combustion Engines Fundamental,” McGraw-Hill, 1988 Winther, J. B., “Dynamometer Handbook of Basic Theory and Applications,” Cleveland, Ohio, Eaton Corporation, 1975 Dinkel, J., “Road and Track Illustrated Automotive Dictionary,” Bentley Publishers, 2000 Dynamometer, www, 2008 ; http://en.wikipedia.org/wiki/Dynamometer คมอการใชงาน Diagnostic dynamometer รน FPS 2700 / 5500. บรษท MAHA
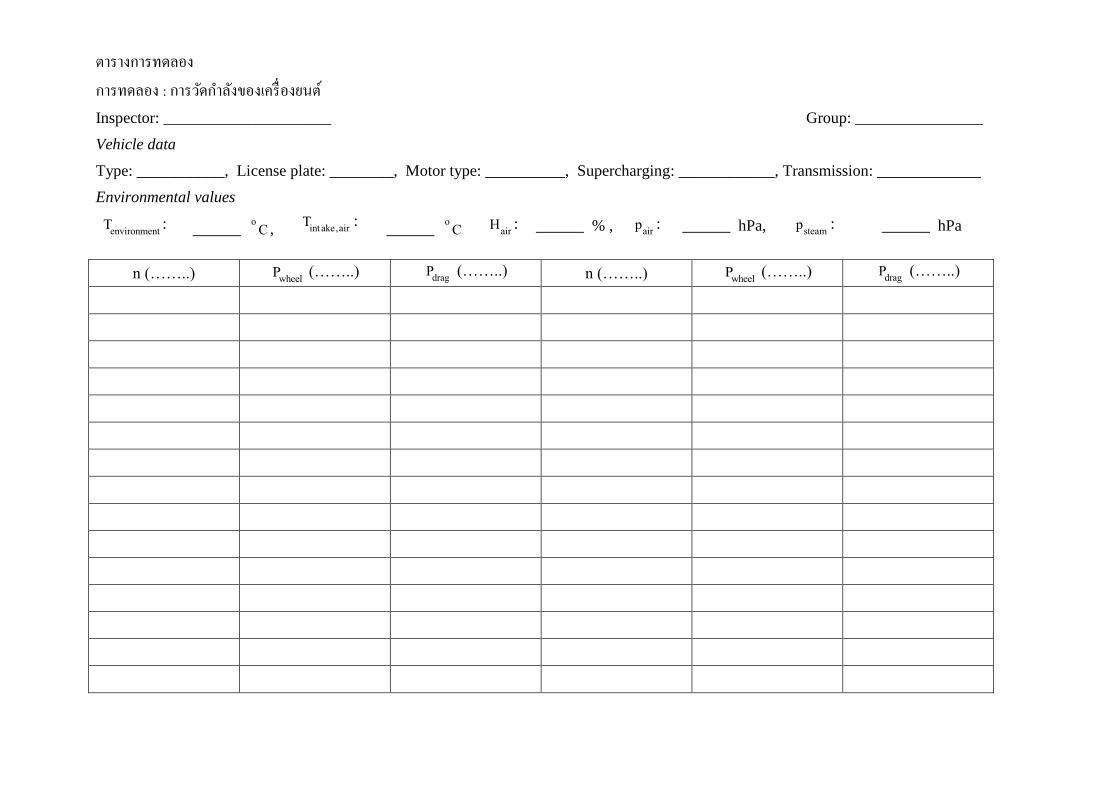
ตารางการทดลอง การทดลอง : การวดก าลงของเครองยนต Inspector: _____________________ Group: ________________
Vehicle data
Type: ___________, License plate: ________, Motor type: __________, Supercharging: ____________, Transmission: _____________
Environmental values
environmentT : ______ o C , int ake,airT :
______ o C airH : ______ % , airp : ______ hPa, steamp : ______ hPa
n (……..) wheelP (……..) dragP (……..) n (……..) wheelP (……..) dragP (……..)
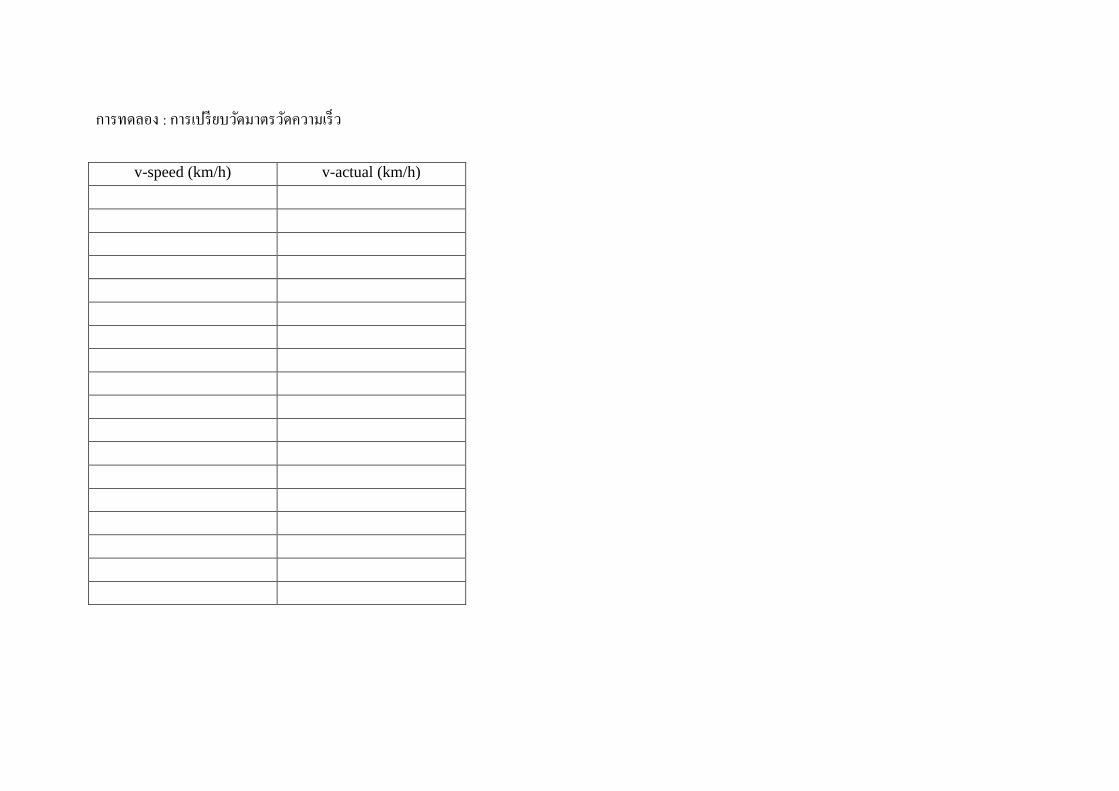
การทดลอง : การเปรยบวดมาตรวดความเรว
v-speed (km/h) v-actual (km/h)
Related Documents