Prepared for: Charting the Expanding Horizons of Big Data Report Summary ENTERPRISE MANAGEMENT ASSOCIATES ® (EMA™) and 9SIGHT CONSULTING Research Report, January 2017 Written by John L. Myers, Lyndsay Wise, and Dr. Barry Devlin

Welcome message from author
This document is posted to help you gain knowledge. Please leave a comment to let me know what you think about it! Share it to your friends and learn new things together.
Transcript

© 2017 Enterprise Management Associates, Inc. and 9sight Consulting
Report Summary: Charting the Expanding Horizons of Big Data | APrepared for:
Charting the Expanding Horizons of Big DataReport SummaryENTERPRISE MANAGEMENT ASSOCIATES® (EMA™) and 9SIGHT CONSULTING Research Report, January 2017
Written by John L. Myers, Lyndsay Wise, and Dr. Barry Devlin

© 2017 Enterprise Management Associates, Inc. and 9sight Consulting
| Report Summary: Charting the Expanding Horizons of Big DataII
Table of ContentsEXECUTIVE SUMMARY ........................................................................................................................................1
KEY FINDINGS .......................................................................................................................................................4
LOOKING DEEPER INTO BIG DATA ...................................................................................................................13
BIG DATA—PERVASIVE, BUT HOW MATURE? ................................................................................................15
BIG DATA STRATEGIES ARE MATURING .........................................................................................................17
MATURITY IN IT SPENDING ON BIG DATA .......................................................................................................19
PROJECT NUMBERS INCREASE WITH MATURITY (UP TO A POINT) ...........................................................21
DATA LAKES: PAST, PRESENT, FUTURE ..........................................................................................................24
THE CONTINUING IMPORTANCE OF MACHINE-GENERATED DATA ............................................................26
HYBRID DATA ECOSYSTEM: EMA BIG DATA REFERENCE ARCHITECTURE ..............................................28
ENTERPRISE MANAGEMENT ASSOCIATES’ HYBRID DATA ECOSYSTEM REFERENCE ARCHITECTURE FOR BIG DATA IMPLEMENTATIONS .............................................................34
AUTHORS AND METHODOLOGY ......................................................................................................................42

© 2017 Enterprise Management Associates, Inc. and 9sight Consulting
Report Summary: Charting the Expanding Horizons of Big Data | 1
EXECUTIVE SUMMARY

© 2017 Enterprise Management Associates, Inc. and 9sight Consulting
| Report Summary: Charting the Expanding Horizons of Big Data2
Executive Summary
Since its inception, the concept of “big data” has meant many things to many people. If you are a fan of the Apache Hadoop ecosystem, big data is the raison d’etre for your Hadoop environment and the sprawling zoological lexicon upon which that ecosystem is built and continues to evolve. If you are a devotee of multi-structured data such as JSON, XML, etc, your definition of big data revolves around how relational data management is not well-suited for the modern data architecture of event-based processing and the Internet of Things. And so on and so forth…
As we explored since the inaugural EMA/9sight survey in 2012, big data is both a way to look at new sources of data and how organizations place that information under “new management.” Big data attracted a wide range of application innovators, as well as many protesters against the dominance of relational databases and data warehouses. The EMA/9sight surveys use a deliberately broad definition of big data to inspire end-users to think beyond the box of limiting definitions. This will let them see how a larger world of traditional data sources, data management, and processing can be interwoven with the new era. As was established in three previous studies in 2012, 2013, and 2014/2015, big data offers a wide range of possibilities. The 2016 EMA/9sight Big Data End-user Survey continues to look at that range of possibilities for big data definitions, implementations, and technologies.
In the 2016 survey, EMA and 9sight Consulting look at various trends associated with big data and how end-users are taking up the challenge of integrating big data and next generation data management into their everyday lives. This study shows that big data strategies and drivers show increased maturity across a wide range of organizations. This filters into the funding of their overall initiatives from direct budgeting from the CIO, and additional funding from line of business departments who use and benefit from those big data initiatives.
Big data projects continue to develop and mature as organizations improve their best practices, learn from past implementations, and
discover how to apply those lessons learned to new projects. This extends to the amount of success that organizations have with their projects, which saw an increase from the 2014/2015 survey to the current edition.
In this edition of the EMA/9sight survey, the data lake architecture provides interesting insight. As a leading data management architecture associated with Hadoop environments, and a potential coopetition partner for the traditional enterprise data warehouse, the data lake provides both great opportunity and potential risk for organizations who implement this new architecture.
A continuing theme in all of the EMA/9sight Big Data surveys is the impact of data generated not from humans in terms of product orders, healthcare forms, social media content, or analytical results, but from machines such as IoT devices, mobile apps, or event sources like server log files. Input from the end-user implementing big data initiatives continues to show the impact these machine-generated data sources continue to provide.
co·op·e·ti·tion/kōˌäpəˈtiSH(ə)n/noun
collaboration between business competitors, in the hope of mutually beneficial results.

© 2017 Enterprise Management Associates, Inc. and 9sight Consulting
Report Summary: Charting the Expanding Horizons of Big Data | 3
Introduction to Big Data
Using information from the 2016 survey, a maturity scoring model – the EMA Maturity Scoring Model – was developed to help organizations understand their placement along a big data development scale. It also offers attributes, examples, and practices of organizations, both successful and less so, to guide the implementation journey of other enterprises. Throughout the report, comparisons between high-achieving big data organizations and those just starting their big data implementations are provided.
To support the big data initiative implementations above since the initial 2012 survey, EMA used the information from the EMA/9sight survey to develop a reference architecture known as the EMA Hybrid Data Ecosystem. This reference architecture is intended to capture the concepts supporting big data initiatives, that at that time and even today, no single big data platform can meet all the demands of big data initiatives. These demands include a series of specific business-related requirements:
• Response – New technology platforms such as big data tools and frameworks are at the core of this evolution, powering new solutions and improved speed of results.
• Economics – Big data platforms leverage commodity hardware and the software is often free, substantially reducing financial barriers to adoption.
• Workload – Big data platforms play a role within the ecosystem to execute extremely complex analytic workloads. Innovative companies are willing to invest early in these solutions to gain competitive advantage.
• Load – Data loads are growing more complex and the sources are more diverse. Driven by greater complexity and demand, big data adoption is driven by the need to provide flexibility.
• Structure – Data structure and schema flexibility are key to the foundation of big data utilization and adoption.
In the 2016 report, feedback from the end-user community continues to refine the EMA Hybrid Data Ecosystem and provides new insights into how organizations view low-latency response within their environments. It also discusses the application of complex workloads like advanced analytical processing.
Finally, the 2016 EMA/9sight provides detailed information on over 700 projects this year and nearly 2400 since 2013. It delivers information about trends across the various EMA/9sight studies and how mature organizations are differing from their less mature counterparts as part of their implementation strategies.

© 2017 Enterprise Management Associates, Inc. and 9sight Consulting
| Report Summary: Charting the Expanding Horizons of Big Data4
KEY FINDINGS
© 2017 Enterprise Management Associates, Inc. and 9sight Consulting
Report Summary: Charting the Expanding Horizons of Big Data | 5
Strategy and Driver Findings
• Big Data! Big Time! – Nearly 9 of 10 respondents are adopting big data strategies in 2016. The growth of respondents adopting those strategies is over 22% from the previous EMA/9sight study in 2014/2015.
• Establishing Precedent – Over 70% of respondents indicate that they used big data strategies between 1 and 4 years.
• Time Well Spent – Not surprisingly, Robust scoring organizations are more likely to have implemented big data for 3 to 4 years, while less mature organizations typically have less than one year’s worth of experience in big data implementations.
• Early to the Party – Over 7 of 10 respondents describe themselves as early adopters or an early majority in their self-assessment of their organization’s innovation practices relating to big data. Early adopters or early majority self-assessments grew nearly 18% year over year since the 2013 survey.
• Driven for Speed – The top two technical drivers among EMA/9sight respondents are focused on delivering faster results. The top business driver for respondents is for faster response time associated with their analytical and operational workloads.

© 2017 Enterprise Management Associates, Inc. and 9sight Consulting
| Report Summary: Charting the Expanding Horizons of Big Data6
Hybrid Data Ecosystem 2016
Since 2012, the EMA Hybrid Data Ecosystem was described and represented as a series of concentric layers. At the center of the HDE are the core big data requirements supported by all of the EMA/9sight Big Data End-user research studies:
• Structure• Response• Complex Workload• Economics• Load
Surrounding the core requirements are the HDE technology platforms linked by Information Management, Security, and Data Integration practices. These practices ensured the right data for an appropriate use case was available to the correct processing engine with minimal need for replication and data movement. These platforms are surrounded by the various use case workloads of:
• Operational Processing• Exploration• Analytics• Operational Analytics
The final outer layer is the most important of any technology platform: the data consumers. These data consumers represent the community of people who utilize the information residing within a big data environment such as an HDE.
Hadoop Data Mart (DM)
Enterprise DataWarehouse (EDW)
External Data
NoSQL
DiscoveryPlatform
Analytical Platform(ADBMS)
OperationalSystems
Streaming DataPlatform
Line of BusinessExecutives
Data Scientists
Developers
BI Analysts
IT Analysts
BusinessAnalysts
External Users
Operations Team
OPERAT
IONAL ANALYTICS
OPERATIONAL PROCESSING
ANALYTICS
EXPLORATIO
N
LOAD
RESPONSE
STRUCTURE
COMPLEXWORKLOAD
ECONOMICS
REQUIREMENTS
SECURITY
DATA INTE
GRAT
ION
INFORMATION MANAGEMENT
© 2017 Enterprise Management Associates, Inc. and 9sight Consulting
Report Summary: Charting the Expanding Horizons of Big Data | 7
Hybrid Data Ecosystem Findings: Structure and Response
Structure• Multiple Levels of Structure – Nearly 6 of 10 big
data projects are using multi-structured data as their primary data sources. Examples of multi-structured data include JSON, XML, and API provided datasets.
• Increasingly Important Events – Use of event information grew over 17% year over year between the 2014/2015 study and the 2016 study.
• Challenging Access – One of the top three obstacles impacting big data initiatives is the need to access internal and external multi-structured data sets.
• Start With the Devil You Know – Organizations with mature big data implementations are more likely to use multi-structured datasets from event data than those without. Organizations with weak data implementations are focused on datasets that mostly contain operational data.
Response• Speed is Driving – The top business driver
from respondents is the need for faster response time of operational or analytical workloads.
• Optimizing Machines – The top driver for real-time processing strategies is integrating machine-generated data into optimization models. IoT and location-based services for transportation logistics are good examples.
• What Does Real-time Mean? – Nearly 35% of respondents say that real-time means “immediately.” Just over 60% indicate that real-time means “by the end of the business day.”
• Speeding up as You go Along! – Robust big data implementations are over 4x more likely to adopt real-time processing strategies than organizations with Struggling or Ineffective big data maturity scores.
• How Fast is Your Project? – Over 3 of 4 big data projects in the EMA/9sight study have a processing latency requirement of intra-day. However, big data project requirements for “immediate” response decreased by over 20% since the 2014/15 study.

© 2017 Enterprise Management Associates, Inc. and 9sight Consulting
| Report Summary: Charting the Expanding Horizons of Big Data8
Hybrid Data Ecosystem Findings: Data Load and Economics
Data Load• Growing by Leaps and Bounds – Big data
environments are expanding over 250TB. Larger big data environments up to 10 petabytes are expanding in 2017 per respondents’ projections.
• Withering on the Vine – Big data environments are declining below 250TB. Smaller big data environments are in decline among respondents.
• Better is Bigger – Projecting to 2017, Robust scored organizations are 6x more likely to have big data environment sizes over 250TB (69.2%) than those in the Struggling and Ineffective categories (11.7%).
Economics
• Reducing Overhead – The most common financial driver from respondents is the need to reduce operational labor expenses associated with data management configuration and operations.
• Capital Cost a Lower Concern – Lower capital expenditures for underlying data management hardware declined over 10% since the previous survey.
• Right-sized Staffing – Robust scoring organizations consider staff head count to be one of their lowest financial drivers (8.1%). Struggling and Ineffective organizations consider this to be a much higher priority within their financial drivers.

© 2017 Enterprise Management Associates, Inc. and 9sight Consulting
Report Summary: Charting the Expanding Horizons of Big Data | 9
Hybrid Data Ecosystem Findings: Workloads and Technology Platforms
Workloads• Advancing Data Science – Nearly 70% of
respondents indicate that they are adopting strategies that would implement complex workloads such as advanced analytics and data science.
• Complex Projects – Over 40% of big data projects are implementing complex workloads in their implementation.
• Nodes and Edges! Oh my! – The top rated complex workload for big data initiatives is graph analysis for behavioral and relationship analysis.
• Advancing Analytics – Looking at the area of data science and advanced analytics, maturity in big data implementation is a key factor in the adoption of data science. Organizations with Robust big data implementations adopt advanced analytics over 5.5x more often than organizations that are in the early stages.
Technology Platforms• Strength in Numbers – Over 60% of respondents indicated
that their big data environments, such as the Hybrid Data Ecosystem, included between 2 and 5 different platforms.
• Speed is King – The top platforms selected by respondents are analytical database platforms. These platforms support the complex workloads and speed of response commonly required in big data environments.
• How to Handle the Stream – Streaming data platforms is one of the newest components of big data environments like the EMA Hybrid Data Ecosystem. Robust scoring organizations with mature implementation practices are two times more likely to implement these real-time integration and analytics platforms as less mature organizations.
© 2017 Enterprise Management Associates, Inc. and 9sight Consulting
| Report Summary: Charting the Expanding Horizons of Big Data10
Hybrid Data Ecosystem Findings: Use Case and Data Consumer
Use Cases• Analyzing Your Operations – The top three use
cases for big data initiatives are advanced analytics, operational processing such as bill and rating, and operational visibility reporting for process assessment.
• Balance Comes With Experience – Organizations with Robust classification in the EMA Big Data Maturity scoring are better-rounded with their application of use cases. Organizations with Struggling or Ineffective scores tend to focus, to a large extent, on Analytics and Exploration use cases.
Data Consumers• Linked to the Line of Business – Over half of the
data consumers in big data projects are business stakeholders, such as line of business executives, business analysts, and operations management and staff.
• Out of Balance – Organizations with less mature big data implementations have an unbalanced distribution of business stakeholders to technologists in their data consumer communities. Robust scoring organizations are much closer to a balanced 50/50 split.

© 2017 Enterprise Management Associates, Inc. and 9sight Consulting
Report Summary: Charting the Expanding Horizons of Big Data | 11
Project Findings
• Three (and Four) Times the Charm – Nearly half of respondents are implementing between 3 and 4 projects as part of their big data program and as part of a “Maturing” implementation strategy. The “Maturing” implementation strategy grew from just over 15% in the 2013 survey to over 46% in the 2016 survey panel. This shows 100% YOY growth from the 2013 survey.
• Configure Your Big Data Application – The top implementation strategy for big data projects is the use of customizable applications to speed time to implementation.
• NOT Do It Yourself – Organizations are moving away from “hand coding,” or developing their big data project applications and environments. In terms of year over year growth, respondents indicated that their interest in hand-rolled development as a project implementation avenue had fallen by over 14%.
• Lower Contractors – Organizations are using fewer external consulting services for big data project implementations. Between 2014/2015 and 2016, respondents were 16% less likely to use those consulting services to implement projects.
• Putting Projects in Play – In big data project implementations, less mature organizations are more likely to utilize external consultants and hand-rolled development than organizations with Robust big data maturity scoring. These more mature organizations are more likely to implement via configurable applications from external providers.
• Serving the Top and Bottom Line – The top three business goals associated with big data projects are all directly linked to the balance sheet with increasing revenue, engaging with customers, and reducing costs and risk.
• Customer is Job #1 – Robust maturity scoring organizations are focused on customer engagement with their big data projects. The top two business goals relate directly to engaging with and analyzing customer information using advanced analytics.
• Importance of the Business – Business stakeholders continue to be very important to big data projects. 4 of the top 5 sponsors of big data projects come from outside of IT – marketing, sales, finance, and customer care.
• Increasing Chances of Success – Over 7 of 10 big data projects have some form of success, with 41.3% of projects experiencing moderately successful results. This is a growth of over 20% from the results in the 2014/15 survey.
• Getting Off the Fence – Between 2014/2015 and 2016, EMA/9sight respondents were better able to assess the success or failure of their projects with only 22.8% of projects being considered neither a success nor failure. This is down nearly 40% from the 2014/2015 survey.

© 2017 Enterprise Management Associates, Inc. and 9sight Consulting
| Report Summary: Charting the Expanding Horizons of Big Data12
Security Findings
• Plan the Work, Work the Plan – The top security strategy for big data initiatives is to establish comprehensive data security policies to ensure that big data is secure.
• Hot on the (Audit) Trail – The top security technique is to utilize audit trails to monitor data access and manage risk associated with big data datasets.
• Who was That Masked Data? – Data masking is one of the top-growing data security techniques, with over 15% between the 2014/2015 survey and today.

© 2017 Enterprise Management Associates, Inc. and 9sight Consulting
Report Summary: Charting the Expanding Horizons of Big Data | 13
LOOKING DEEPER INTO BIG DATA

© 2017 Enterprise Management Associates, Inc. and 9sight Consulting
| Report Summary: Charting the Expanding Horizons of Big Data14
Introduction
Since the first EMA/9sight big data survey in 2012, there were many changes in the world of big data. On the other hand, some fundamentals remained constant.
Among the constants, there is a continuing growth in interest and uptake of big data and the breadth of meaning assigned to it. As noted even in the first survey, respondents adopted the broadest possible definition of the term, essentially assigning to this moniker every business initiative requiring more than an average amount of data, speedier than normal data, or data in non-traditional structures. To quote the 2012 survey, “By late 2012, it is clear that big data is rapidly becoming all the digital information that is and has ever been collected, generated, and processed.” This trend continued unabated in subsequent years and the 2016 results are no different, with almost a third of projects focused on operational use of big data, either directly or in optimization of workloads.
Of course, among the changes is the fact that the amount of (big) data in the world is more than doubling every two years. According to the most recent EMC Digital Universe Study (2014), it is growing approximately 40% per year, from some 3ZB (zettabytes) in 2012 to 12ZB in 2016 and reaching a projected 44ZB by 2020.
From an IT point of view, this growth is re-emphasizing the need for storage and processing technologies that scale, both upward in performance and downward in cost. For business, the growth enabled a shift in thinking from optimizing existing processes to exploring opportunities for new and reinvented processes. Furthermore, big data is now directly affecting the daily lives and activities of the general public, initially through smartphone apps and increasingly through Internet-connected technology, from automobiles to medical devices and from smart meters to ongoing security and surveillance.

© 2017 Enterprise Management Associates, Inc. and 9sight Consulting
Report Summary: Charting the Expanding Horizons of Big Data | 15
BIG DATA—PERVASIVE, BUT HOW MATURE?

© 2017 Enterprise Management Associates, Inc. and 9sight Consulting
| Report Summary: Charting the Expanding Horizons of Big Data16
Big Data—Pervasive, but how Mature?
Over the four surveys, EMA/9sight found big data to be pervasive, with the breadth and depth of its uptake exceeding that suggested by other surveys. This disparity is easily explained: EMA/9sight took a business view of what big data means. Rather than confining the topic to the boundaries of a single set of technologies—Hadoop and its menagerie of loosely associated tools—the respondents were offered the opportunity to look at and discuss big data in terms of their own strategies. These strategies are defined as:
A set of business, technical, and financial drivers that support new business requirements driving big data implementations that can no longer be easily supported with traditional data management tools, methods, and infrastructures. These business requirements include economic and return on investment drivers, expanding data loads, evolving and variable data structures, service level agreements on response, and complexity of workloads to support operational and analytical requirements.
Over the timeframe of the surveys, there was an explosion of new technologies. There are now 15 official Apache Hadoop projects and over forty related (and wonderfully named) components, not to mention dozens of NoSQL tools.
Concepts such as “data-driven” and “data lake” have become part of mainstream thinking. Now, deep learning and cognitive computing approaches are threatening to transform the entire decision-making support market. This includes both automation in a wide variety of aspects of business intelligence—eliminating the need for human participation—and big data and augmentation—improving human action via software support.
Given these changing circumstances, this iteration of the EMA/9sight Big Data Survey focuses on gauging the maturity of the market. In this context, maturity has multiple aspects:
• The level of strategic thinking, within and across both business and IT
• The range and variety of undertaken projects• The technologies used and the way they
are employed in implementation• The success of both the overall process
and the individual projects
With some 250-300 respondents in each of four iterations of the survey providing information on nearly 2,400 project instances over the past three surveys, we truly have a large database to examine trends in maturity across the big data market.
There were big data implementation projects from 303 respondents in the 2016 EMA/9sight Big Data End-user research study, with information on 2394 projects across three different studies in 2013, 2014/15, and 2016.
742PROJECTS
© 2017 Enterprise Management Associates, Inc. and 9sight Consulting
Report Summary: Charting the Expanding Horizons of Big Data | 17
PROJECTS
BIG DATA STRATEGIES ARE MATURING

© 2017 Enterprise Management Associates, Inc. and 9sight Consulting
| Report Summary: Charting the Expanding Horizons of Big Data18
Big Data Strategies are Maturing
In any industry, a visionary and viable business strategy is mandatory for success. As particular industries are increasingly digitalized, a business strategy alone is no longer sufficient. With the close interlinking of business and technology inherent to digitalization, a combination of business and technology strategies is required. The necessary symbiosis between business and IT is explained in the concept and features of the biz-tech ecosystem in Business unIntelligence:1
1 Devlin, Barry, “Business unIntelligence: Insight and Innovation Beyond Analytics and Big Data.” Technics Publications, LLC, 2013, http://dl.acm.org/citation.cfm?id=2588162
1. Reintegration of the silos within and across business and IT to allow information coherence and drive technology and organizational consistency
2. Interdependence between novel technology and new business opportunities that drives advances in technology and enables new business possibilities in a classic positive feedback loop, triggering exponential growth
3. Crossover between businesspeople who envision how technical advances recreate the business and
IT people who see how emerging technology can satisfy novel business needs in new ways
4. Cooperation that dissolves the boundaries between the business, its suppliers and customers, and governmental agencies, enabling free flow of information to eliminate delays and errors
5. Trust that replaces competitive and adversarial relationships if we are to avoid a runaway, hypercompetitive, technology-driven environment that ultimately devours itself

© 2017 Enterprise Management Associates, Inc. and 9sight Consulting
Report Summary: Charting the Expanding Horizons of Big Data | 19
MATURITY IN IT SPENDING ON BIG DATA
© 2017 Enterprise Management Associates, Inc. and 9sight Consulting
| Report Summary: Charting the Expanding Horizons of Big Data20
Maturity in IT Spending on Big Data
One of the most obvious indicators of commitment to any strategy is the level of budget assigned to it by IT. IT’s investment is particularly important in the case of a big data strategy because of the infrastructure that must be built. Given the commodity nature of big data hardware, cloud-driven opportunities to switch from capex to opex spending, and the mix of “free” and licensed payment options for open-source software, it can be dangerous to draw very detailed conclusions.
Nonetheless, the results from the EMA/9sight survey are unambiguous. IT budget percentages allocated to big data increased significantly over the past three surveys. Spending in every band from 15% to 40% increased, often dramatically. The most common band moved from under 10% in 2013 to 21-25% in 2016, and spending in the less than 10% band fell from 26% in 2013 to 11% in 2016.
Recall also that in many organizations, IT spending reflects strategic or cross-functional drivers in the business. As a guide to the overall commitment of the business to a big data strategy, this measure is among the most useful. Note, therefore, that investment percentage in the past two years falls dramatically in the bands above 25%. This may suggest the continuing high level of spending on traditional IT systems, or that spending on IoT has not yet ramped up significantly.

© 2017 Enterprise Management Associates, Inc. and 9sight Consulting
Report Summary: Charting the Expanding Horizons of Big Data | 21
PROJECT NUMBERS INCREASE WITH MATURITY (UP TO A POINT)

© 2017 Enterprise Management Associates, Inc. and 9sight Consulting
| Report Summary: Charting the Expanding Horizons of Big Data22
A unique feature of the EMA/9sight survey is its extensive data collection and analysis at the project level. Over the past three surveys, respondents provided information on how many big data projects are running in their company and a variety of characteristics about the individual projects.
At the most basic level, it would be expected that businesses with a more mature big data environment would undertake more projects in this area. The survey trends match this expectation. In 2013, the vast majority of respondents reported having either one or two big data projects (34% and 36% respectively), while less than 2% had four projects active. The growth in percentage of respondents with both three and four projects was dramatic, while percentages with one and two projects declined as expected. By 2016, 18% of respondents had four projects, while the percentage with three projects had more than doubled to 28%.
This clear trend from mostly having one or two big data projects a few years ago to now having three or four indicates a significant growth in the maturation of big data usage. For respondents with five or more projects the data is more ambiguous, with a strong peak in 2014/15. One explanation for this might be a spike in proof-of-concept or prototype projects, which have now been discontinued (see next page). Over the past two surveys, the granularity of data for five or more projects increased, but no particular trend is evident in this data. We speculate that having more than five big data projects in production may be associated with specific circumstances rather than overall maturity.
Project Numbers Increase With Maturity (Up to a Point)

© 2017 Enterprise Management Associates, Inc. and 9sight Consulting
Report Summary: Charting the Expanding Horizons of Big Data | 23
To better assess organizational maturity in big data, the 2016 EMA/9sight survey significantly expanded analysis of the duration that big data projects have been in production. The result shows that 30% of big data projects have been in production for 1-3 years, while 23% have been in production for more than that.
In total, almost three quarters of the projects in this year’s survey are in production. This represents an unlikely level of growth compared with the 2014/15 figures, even allowing for the change in allowed responses. Comparing the 2014/15 responses with those of the previous two surveys suggests that the 2014/15 results were anomalous. In 2012 (not shown, because the data collected was by respondent rather than by project), 27% of respondents had a project
in production. In 2013, the percentage of projects in production was 34%, but this dropped back to 27% in 2014/15. The data suggests that many respondents in 2014/15 were undertaking pilots or in the late stages of planning big data projects. Such activity would be consistent with the rapid rollout of new Hadoop 2.x versions through 2014 and the release of Spark 1.0 and 1.1 in the same timeframe (the 2014/15 survey data was gathered in December 2014).
Mature Organizations are Getting More Projects Into Production

© 2017 Enterprise Management Associates, Inc. and 9sight Consulting
| Report Summary: Charting the Expanding Horizons of Big Data24
DATA LAKES: PAST, PRESENT, FUTURE

© 2017 Enterprise Management Associates, Inc. and 9sight Consulting
Report Summary: Charting the Expanding Horizons of Big Data | 25
Data lakes divided the technical community since the concept emerged in 2010. One of the biggest problems with the concept is the absence of a comprehensive and agreed-upon definition.
The origins of the data lake can be found in the analogy of big data being a resource like water. Clean water flowing either from the sky or from a mountain spring provides a great resource with endless opportunities. On the other hand, a contaminated water source such as a swamp or polluted reservoir has the opposite opportunity: the stagnation and pollution of a valuable resource. On the other hand, it does provide a vision of the freedom a data lake offers to (business) users to access and use data with ease and at will. Since then, explanations evolved variously and rapidly. The following two definitions sum up current market understanding:
“A data lake is a massive, easily accessible, centralized repository of large volumes of structured and unstructured data.”1
“A data lake is a large object-based storage repository that holds a vast amount of raw data in its native format until it is needed.”2
From a business viewpoint this is ultimate goodness, as found in many requirements-gathering exercises for data warehouses: everyone wants all the data in its original glory and variety stored forever and easily accessible whenever required.
1 https://www.techopedia.com/definition/30172/data-lake2 http://searchaws.techtarget.com/definition/data-lake
From a data management perspective, the contradictions are immediately obvious. Data in various formats, as originally collected and in vast quantities, may be made easily accessible, but its business use is fraught with issues of quality and understanding, and its ongoing management by IT will be exceedingly expensive, irrespective of the decreasing cost of storage hardware or the availability of free, open-source software.
Dr. Michael Stonebraker, a pioneer of database research and technology and Adjunct Professor of Computer Science at M.I.T., said the following in 2014:
“The moral of this story is ‘don’t underestimate the difficulty of data curation.’ If you do, you will revisit …the experience of enterprises in the 1990s concerning data warehouses.”3
The EMA/9sight survey results reveal a continuing disparity in the understanding of the concept of data lakes in the broad market.
3 http://cacm.acm.org/blogs/blog-cacm/181547-why-the-data-lake-is-really-a-data-swamp/fulltext
Data Lake – a Concept in Search of a Good Definition

© 2017 Enterprise Management Associates, Inc. and 9sight Consulting
| Report Summary: Charting the Expanding Horizons of Big Data26
THE CONTINUING IMPORTANCE OF MACHINE-GENERATED DATA

© 2017 Enterprise Management Associates, Inc. and 9sight Consulting
Report Summary: Charting the Expanding Horizons of Big Data | 27
The Continuing Importance of Machine-generated DataThe growing importance of machine-generated data from both internal sources and the Internet of Things was noted over previous EMA/9sight big data surveys. In the 2014/15 survey, “Insights Across the Hybrid Enterprise” (page 8), it was noted that the percentage of such data grew from some 24% in 2012 to just over 41% in 2014/15, with a corresponding decrease in human-sourced information. This rapid and significant growth was somewhat surprising, but corresponded to the finding that nearly half of the respondents in 2014/15 declared that the Internet of Things was “currently adopted and an important or essential part of business” for them.
In this year’s big data survey, we included questions at a project level about primary and secondary data sources in an effort to understand the relative importance of machine-generated data versus the two other categories: process-mediated data (the legally binding transactional data generated by business processes) and human-sourced information (social media, audio/video, etc.). While the percentages cannot be directly compared with previous data, the results confirm the relatively large importance of machine-generated data vs. human-sourced information to the survey respondents.
Event information from web servers or server logs are the largest primary and secondary data sources at over 26% and over 21% of projects, respectively. In comparison, raw data from IoT devices comes to 15% and 13% respectively.
The importance of process-mediated data in respondents’ big data projects should not be underestimated. Nearly 50% of both primary and secondary data is sourced almost equally from operational and data warehouse environments. This emphasis on traditional business data (in combination with big data) has important consequences for the design of big data systems: in essence, they must be architected to work in tight proximity with existing business systems and support substantial data sharing between older (usually relational) environments and the newer Hadoop or NoSQL stores.
This new data provides important insight into sources of machine-generated data. However, the figures for human-sourced information vs. process-mediated data are anomalous. While the percentage of human-sourced information dropped over the previous surveys (from 45% in 2013 to 31% in 2014/15), the current survey’s figures of approximately 10% in both primary and secondary sources are unexpectedly low, while process-mediated data took up the slack. This will require further investigation in future surveys.

© 2017 Enterprise Management Associates, Inc. and 9sight Consulting
| Report Summary: Charting the Expanding Horizons of Big Data28
HYBRID DATA ECOSYSTEM: EMA BIG DATA REFERENCE ARCHITECTURE
© 2017 Enterprise Management Associates, Inc. and 9sight Consulting
Report Summary: Charting the Expanding Horizons of Big Data | 29
Since its inception, the concept of “big data” was widely associated with a single data management platform: Hadoop. This connection may be due to the popularity of the use of the Hadoop platform to store and process large amounts of multi-structured data. However, Hadoop is not the only platform that can meet these requirements.
Many data management platforms can store large amounts of information. Traditional relational databases served the needs of organizations such as AT&T and Walmart for years. These environments store the operational and analytical information associated with over 100 million telecommunications subscribers and a retail organization with nearly $1.5 billion in worldwide annual revenues.
Other traditional data management platforms can process massive amounts of information. Cray supercomputers serve the processing requirements of government agencies like the National Oceanic and Atmospheric Administration (NOAA) and National Center for Atmospheric Research (NCAR), processing massive amounts of data for oceanographic and atmospheric research and prediction. In smaller environments, the columnar database format became mainstream in the mid-2000s and provided commercial operations with the ability to process mass quantities of information in many disciplines.
Many different platforms can natively support multi-structured data. Some, such as Cassandra™ and Redis, support key-value formats. Others, such as CouchDB™ and MongoDB, base their approach on a document model. Still other platforms support a wide range of non-relational data models that include graph and object.
In each of these cases, a wide range of options can support many of the common concepts of big data initiatives. Big data was, and is, bigger than a single data management platform or paradigm. Big data initiatives encompass a wide range of business, technical, and financial requirements to move from our previous era of data—whether you call that traditional, relational, or enterprise—to a new era of data. This new era of big data is more than a “rip and replace” of previous times. It is an augmentation of traditional approaches that includes new capabilities and possibilities.
The need to capture all of these concepts supporting big data initiatives led to the development of a next generation data management environment framework called the EMA Hybrid Data Ecosystem (HDE). Developed initially in 2012 as part of the initial EMA/9sight Big Data End-user survey and refined with each iteration of the survey, the HDE serves as a reference architecture to guide big data initiatives.
Hybrid Data Ecosystem: EMA Big Data Reference Architecture

© 2017 Enterprise Management Associates, Inc. and 9sight Consulting
| Report Summary: Charting the Expanding Horizons of Big Data30
Organizations were mixing and matching platforms within their big data environments to meet a range of requirements. At that time and even today, no single big data platform can meet all the demands of big data initiatives. These demands include a series of specific business-related requirements.
• Response – New technology platforms such as big data tools and frameworks are at the core of this evolution, powering new solutions and improved speed of results.
• Economics – Big data platforms leverage commodity hardware and the software is often free, substantially reducing financial barriers to adoption.
• Workload – Big data platforms play a role within the ecosystem to execute extremely complex analytic workloads. Innovative companies are willing to invest early in these solutions to gain competitive advantage.
• Load – Data loads are growing more complex and the sources are more diverse. Driven by greater complexity and demand, big data adoption is driven by the need to provide flexibility.
• Structure – Data structure and schema flexibility are key to the foundation of big data utilization and adoption.
To meet these requirements, big data initiatives need to expand beyond the data storage and workload processing abilities of any one single platform to a hybrid environment that can meet a wide range of complex processing, high-speed response and multi-structured data requirements. They must also handle economic and data size issues that are common in organizations implementing their big data strategies.
In this section, these issues will be detailed. Additionally, the section will go over how the 2016 EMA/9sight research continues to support those concepts and provide guidance for today’s and future big data initiatives and implementations.
Hybrid Data Ecosystem: Core Drivers
© 2017 Enterprise Management Associates, Inc. and 9sight Consulting
Report Summary: Charting the Expanding Horizons of Big Data | 31
Case Study: IMMConsumers’ online behavior can change rapidly and unpredictably, which presents a unique challenge for digital marketers. To get the right message to the right person at the right time, they must continually monitor responses to online ads and adapt their marketing strategies to capitalize on emerging opportunities. But when you are sending out thousands of ads each day, how can you keep track of and optimize campaign performance across your different customer segments?
“By continually optimizing our campaigns with IBM solutions, we can drive incremental sales to stretch our clients’ advertising dollars further.”
~ Ken O’Brien, SVP, Applied Sciences and Technology, IMM
IMM ingests data from its clients, combines it with data sets from third parties such as ad servers, publishers, and attribution vendors, and uses the IBM solutions to analyze it on a large scale and at high speed. This enables the company’s analysts and data scientists to extract rapid insights into impressions, click-through rates, and conversions for online ads.
Since IMM works with clients across multiple industries, one of the key benefits of the new platform is that it can easily analyze a wide range of data sets, empowering IMM’s data scientists to slice and dice the results to find the correlations that are most relevant to each specific company.
Customer Name: IMM
Customer Domain: Digital Marketing
Vendor Name: IBM
Products:
• IBM® BigInsights® for Hadoop• IBM PureData® System
for Analytics• IBM Streams• IBM Cognos® Business Intelligence• IBM SPSS® Modeler
“By continually optimizing our campaigns with IBM solutions, we can drive incremental sales to stretch our clients’ advertising dollars further.”~ Ken O’Brien, SVP, Applied Sciences and Technology, IMM

© 2017 Enterprise Management Associates, Inc. and 9sight Consulting
| Report Summary: Charting the Expanding Horizons of Big Data32
Case Study: IMMFor example, IMM is putting its analytics solutions to work to support the media campaigns for a major telecommunications provider.
Ken O’Brien explains: “In the telecommunications industry, the principal factors that affect purchasing behavior outside of advertising include competitive offerings, consumer contract cycles, holiday drive periods, product availability, and offline and in-store experiences. With IBM Analytics solutions, we are able to incorporate insights from these macro trends into daily decision-making around how advertising dollars are spent.”
For a large restaurant client, IMM is exploring the relationship between weather data, time of day, and door numbers to maximize the impact of its digital ads.
“For example, at the moment we’re slicing and dicing all of our data sources and putting
them in a format where our data scientists and our clients’ analysts can work with them and answer questions from the business. But if we hooked up Watson Analytics and pointed it at that same set of well-organized data, the business users could start answering their own questions,” continues Ken O’Brien.
By enabling more dynamic and tailored campaigns, IMM expects that the IBM solutions will not only help it to deliver significant savings to clients, but also increase in value over time.
Today, IMM has dramatically reduced the time its analysts spend compiling reports. Ken O’Brien comments, “Reports that used to take more than 12 person-hours per day to produce are now ready in just 45 minutes. Better still, the process is almost completely automated, which gives our analysts more time to do what they do best—analyze!”
ChallengeHow to harness clients’ unique and varied data sets to target digital ads to deliver the right message to the right person at the right time?
Transformation(s)IMM uses IBM Analytics to process large amounts of data from multiple sources, enabling smarter, faster, and more tailored campaigns for clients that drive business impact in real-time.
Benefits30% faster insights translate into higher returns on marketing spend for clients.
Lifts sales by targeting specific customers to improve conversion rates to 45 minutes to deliver reports that previously took more than 12 hours
“…we can find out whether a particular approach is working by the next morning, rather than waiting until late in the day. This can translate into tens of thousands of dollars of savings, which we can pass on to clients to reinvest for more sales.”~ Sean Baker, Chief Client Officer

© 2017 Enterprise Management Associates, Inc. and 9sight Consulting
Report Summary: Charting the Expanding Horizons of Big Data | 33
Big data initiatives support multiple use cases and the Hybrid Data Ecosystem is no different. Since 2012, end-users indicated that their HDE environments supported analytical or exploratory use cases, as was often the case with early implementations of Apache Hadoop in the initial days of big data. Big data initiatives implementing environments such as the HDE adopted a wide range of use cases. These include:
Hybrid Data Ecosystem Use Cases: Big Data Platforms Have Multiple Uses
Analytical ProcessingThese use cases include data science, data mining, and advanced analytics.
Operational Processing and Visibility This includes a range of operational use cases that include concepts such as rating and billing for revenue generation and invoicing, as well as visibility into process status and standard reporting.
Online ArchivingArchiving includes the longer-term data retention and storage to provide online access to data.
Exploratory AnalysisUsing data discovery techniques to find new relationships in different datasets.
Utilization of Streaming DataUses of event-based datasets from operational systems, clickstream data from online applications, and sensor information from the Internet of Things.

© 2017 Enterprise Management Associates, Inc. and 9sight Consulting
| Report Summary: Charting the Expanding Horizons of Big Data34
ENTERPRISE MANAGEMENT ASSOCIATES’ HYBRID DATA ECOSYSTEM REFERENCE ARCHITECTURE FOR BIG DATA IMPLEMENTATIONS

© 2017 Enterprise Management Associates, Inc. and 9sight Consulting
Report Summary: Charting the Expanding Horizons of Big Data | 35
ENTERPRISE MANAGEMENT ASSOCIATES’ HYBRID DATA ECOSYSTEM REFERENCE ARCHITECTURE FOR BIG DATA IMPLEMENTATIONS
Developed, refined, and supported with end-user insights since 2012, the EMA Hybrid Data Ecosystem reference architecture is described and represented as a series of concentric layers. These layers build out, not from technical limitations, but from business requirements.
At the center of the HDE are the core big data requirements supported by results of all of the EMA/9sight Big Data End-user research studies. These requirements include:
• Structure• Response• Complex Workload• Economics• Load
Surrounding the core business requirements are the HDE technology data management platforms linked by Information Management, Security, and Data Integration practices. These practices ensure that the right data with associated metadata for an appropriate use case is available to the correct processing engine with minimal need for duplication or movement.
This combination of data management platforms are surrounded by the various use case workloads of:
• Operational Processing• Exploration• Analytics• Operational Analytics
The outer layer is the most important of any technology platform: the data consumers. These data consumers represent the community of people who utilize the information resident within a big data environment such as an HDE.
Hybrid Data Ecosystem: A Comprehensive View
Hadoop Data Mart (DM)
Enterprise DataWarehouse (EDW)
External Data
NoSQL
DiscoveryPlatform
Analytical Platform(ADBMS)
OperationalSystems
Streaming DataPlatform
Line of BusinessExecutives
Data Scientists
Developers
BI Analysts
IT Analysts
BusinessAnalysts
External Users
Operations Team
OPERAT
IONAL ANALYTICS
OPERATIONAL PROCESSING
ANALYTICS
EXPLORATIO
N
LOAD
RESPONSE
STRUCTURE
COMPLEXWORKLOAD
ECONOMICS
REQUIREMENTSSECURITY
DATA INTE
GRAT
ION
INFORMATION MANAGEMENT

© 2017 Enterprise Management Associates, Inc. and 9sight Consulting
| Report Summary: Charting the Expanding Horizons of Big Data36
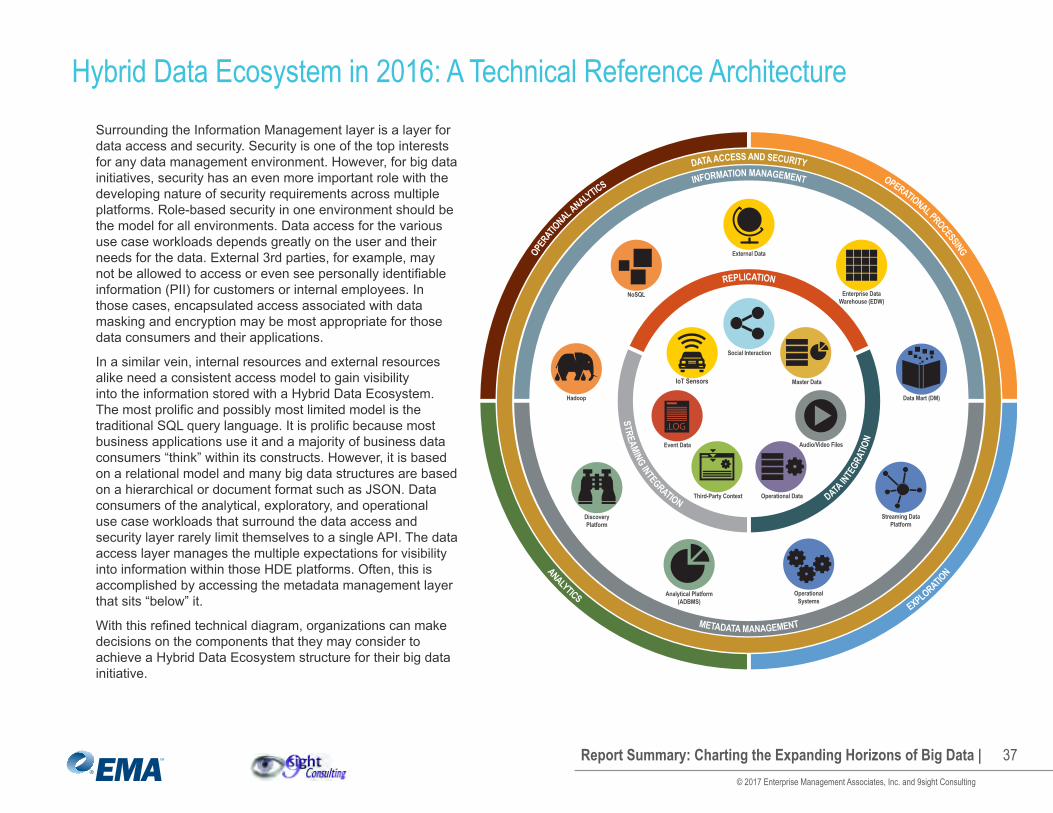
In 2016, as additional best practices evolved for next generation data management environments such as the Hybrid Data Ecosystem, it seems appropriate to create a more detailed look at not only the technical environments associated with big data initiatives, but the business use cases as well.
Starting with the technical environments, the refinement of the inner components of the HDE was developed. For visual representation, the business requirements are “replaced” with the major sources of data in big data initiatives. These include:
• Social interactions• Master Data• Audio/Video information• Operational Data• 3rd Party information• Event Data for log files• IoT and Sensor data
Sitting between those various sources of data and the collection of traditional HDE data management platforms are the major sources of data acquisition represented in big data environments: data integration such as ETL, ELT, etc., data replication that manages consistent “copies” of data, and streaming integration that brings together data “in motion” from sources such as IoT devices and sensor data.
The HDE data platforms are connected via an Information Management layer that includes robust sharing and management of platform metadata. This metadata management is required to optimize the workloads between HDE platforms and ensure business stakeholders have visibility into the quality, lineage, and format of their data.
Hybrid Data Ecosystem in 2016: A Technical Reference Architecture
Hadoop Data Mart (DM)
Enterprise DataWarehouse (EDW)
External Data
NoSQL
DiscoveryPlatform
Analytical Platform(ADBMS)
OperationalSystems
Streaming DataPlatform
INFORMATION MANAGEMENT
METADATA MANAGEMENT
DATA ACCESS AND SECURITY
DATA IN
TEGR
ATIO
N
REPLICATION
STREAMING INTEGRATION
OPERAT
IONAL ANALYTICS
OPERATIONAL PROCESSING
ANALYTICS
EXPLORATIO
N
Third-Party Context Operational Data
Master Data
Social Interaction
Event Data
.LOG
IoT Sensors
Audio/Video Files
© 2017 Enterprise Management Associates, Inc. and 9sight Consulting
Report Summary: Charting the Expanding Horizons of Big Data | 37
Surrounding the Information Management layer is a layer for data access and security. Security is one of the top interests for any data management environment. However, for big data initiatives, security has an even more important role with the developing nature of security requirements across multiple platforms. Role-based security in one environment should be the model for all environments. Data access for the various use case workloads depends greatly on the user and their needs for the data. External 3rd parties, for example, may not be allowed to access or even see personally identifiable information (PII) for customers or internal employees. In those cases, encapsulated access associated with data masking and encryption may be most appropriate for those data consumers and their applications.
In a similar vein, internal resources and external resources alike need a consistent access model to gain visibility into the information stored with a Hybrid Data Ecosystem. The most prolific and possibly most limited model is the traditional SQL query language. It is prolific because most business applications use it and a majority of business data consumers “think” within its constructs. However, it is based on a relational model and many big data structures are based on a hierarchical or document format such as JSON. Data consumers of the analytical, exploratory, and operational use case workloads that surround the data access and security layer rarely limit themselves to a single API. The data access layer manages the multiple expectations for visibility into information within those HDE platforms. Often, this is accomplished by accessing the metadata management layer that sits “below” it.
With this refined technical diagram, organizations can make decisions on the components that they may consider to achieve a Hybrid Data Ecosystem structure for their big data initiative.
Hybrid Data Ecosystem in 2016: A Technical Reference Architecture
Hadoop Data Mart (DM)
Enterprise DataWarehouse (EDW)
External Data
NoSQL
DiscoveryPlatform
Analytical Platform(ADBMS)
OperationalSystems
Streaming DataPlatform
INFORMATION MANAGEMENT
METADATA MANAGEMENT
DATA ACCESS AND SECURITY
DATA IN
TEGR
ATIO
N
REPLICATION
STREAMING INTEGRATION
OPERAT
IONAL ANALYTICS
OPERATIONAL PROCESSING
ANALYTICS
EXPLORATIO
N
Third-Party Context Operational Data
Master Data
Social Interaction
Event Data
.LOG
IoT Sensors
Audio/Video Files
© 2017 Enterprise Management Associates, Inc. and 9sight Consulting
| Report Summary: Charting the Expanding Horizons of Big Data38
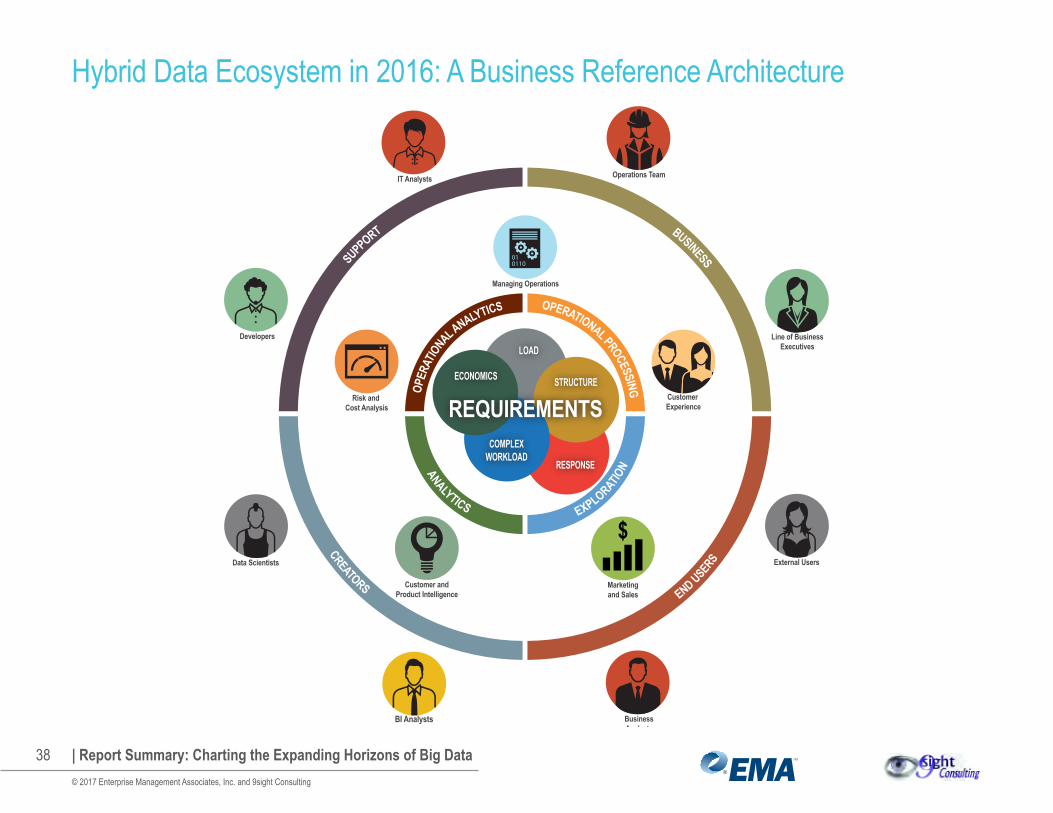
Hybrid Data Ecosystem in 2016: A Business Reference Architecture
Customer Experience
Customer andProduct Intelligence
Marketingand Sales
Line of BusinessExecutives
Data Scientists
BI Analysts
IT Analysts
BusinessAnalysts
Developers
External Users
Operations Team
SUPPORT BUSINESS
CREATORSEND USERS
OPER
ATIONAL ANALYTICS OPERATIONAL PROCESSING
ANALYTICS EXPLORATIO
N
LOAD
RESPONSE
STRUCTURE
COMPLEXWORKLOAD
ECONOMICS
REQUIREMENTS
Managing Operations
011001
Risk and Cost Analysis
$
© 2017 Enterprise Management Associates, Inc. and 9sight Consulting
Report Summary: Charting the Expanding Horizons of Big Data | 39
With the inner components of the Hybrid Data Ecosystem detailed with a more refined technical reference architecture, it is important to extend out to the business use cases associated with big data initiatives. For this view, the business requirements “return” and are surrounded by the use case workloads of the HDE.
The use case workloads are surrounded by the types of applications that often implement those use case workloads:
• Customer Experience• Managing Operations• Risk and Cost Analysis• Operational and Product Intelligence• Marketing and Sales operations
These big data applications can mix and match the various use case workloads to best implement their goals. For example, Marketing and Sales operations will utilize operational use cases as well as exploratory and analytical workloads to match the best offers to customers or find the right sales strategy.
Moving out from those applications, the traditional data consumers of HDE take on roles such as:
• Support• Business• End User• Creators
In these personas, the data consumers each have role to play with the application. Some are purely associated with the business of an organization, such as Operations teams and Line of Business executives. Others are the end-users of data such as business analysts and external 3rd parties. Others take on a role of configuration and creation of big data applications such as BI Analysts and data scientists, while other data consumers support the wider organization and the HDE applications. It should be noted that data consumers are not limited to a single role, just as a single application is not limited to a single use case workload. Data scientists are often in creation, support, and line of business roles. Likewise, line of business executives find themselves as end-users, defining business requirements AND in the growing role of self-service, creating configuration and content for others.
Hybrid Data Ecosystem in 2016: A Business Reference Architecture

© 2017 Enterprise Management Associates, Inc. and 9sight Consulting
| Report Summary: Charting the Expanding Horizons of Big Data40
Case Study: Big Fish GamesFounded in 2002, Big Fish Games is the world’s largest producer and distributor of casual games, delivering more than 2.5 billion games to customers in more than 150 countries from a growing catalog. Big Fish is headquartered in Seattle, WA, with regional offices in Oakland, CA, and Luxembourg.
Big Fish Games is creating big business with the everyday game consumer. The typical profile of a gamer is evolving, as the proliferation of smartphones means that most people now carry the equivalent of a games console in their pockets. With the rise of casual gamers and the democratization of game development, creators need to work harder than ever to stand out from the crowd.
David Darden, BI Engineering Manager at Big Fish Games, explains: “A few years ago, we successfully transitioned from a PC-centric to a mobile-centric gaming company, and with that came a change in strategy. Today, mobile users are spoiled for choice with millions of games at their fingertips and new releases emerging at lightning speed. The window of opportunity to capture and keep the attention of a player is shrinking, so it is vital that we get our games right the first time.”
For Big Fish, the key to success lies in understanding customers’ changing tastes so it can deliver the optimal balance between challenging and satisfying gameplay.
Customer Name: Big Fish Games
Customer Domain: Mobile/Online Gaming
Vendor Name: IBM
Products: IBM® InfoSphere® BigInsights®
IBM PureData® System for Analytics
IBM Big Data Stampede Services “With IBM Analytics solutions, we are increasing customer engagement and loyalty, and attracting new users.” ~ David Darden, BI Engineering Manager, Big Fish Games

© 2017 Enterprise Management Associates, Inc. and 9sight Consulting
Report Summary: Charting the Expanding Horizons of Big Data | 41
Case Study: Big Fish GamesFor Big Fish, the key to success lies in understanding customers’ changing tastes so that it can deliver the optimal balance between challenging and satisfying gameplay. To get to these insights, the company needed to get a handle on escalating volumes of data.
“Our games can bring in tens of millions of players from around the world each day, so the amount and variety of data at our disposal is staggering,” says David Darden. “Working with such large data sets, it was all too easy to spend time on a particular analytical exercise before realizing that it was a dead end – we wanted a smarter approach.”
Big Fish set out to create an analytics platform that will meet many business demands. To do so, the company integrated IBM® PureData® System for Analytics and IBM InfoSphere®
BigInsights® solutions with IBM Fluid Query to create a smarter data analytics process.
Big Fish relied on IBM Big Data Stampede services to get started with the InfoSphere BigInsights solution. The company is utilizing the solution to build a holistic view of player behavior, and using this information to guide current and future game development.
According to the Big Fish Team, making these usable, analytic conclusions possible is IBM Fluid Query. Today, Big Fish is successfully tapping into consumer behaviors to deliver games that keep players coming back for more.
Big Fish can recognize and respond faster to changes in trends than ever before, offering the company a key competitive advantage.
ChallengeIn the competitive mobile and online gaming industry, the ability to identify loyal clients and reduce customer churn are key factors to success.
Transformation(s)With event-level insight into customer behavior, Big Fish Games can now continually fine-tune existing games and the development of new releases to give audiences more of what they want.
BenefitsOptimized player experience for enhanced customer engagement and loyalty
Faster response to new trends in the marketplace for a key competitive advantage
Better utilization of resources enabled by basing decisions on data rather than instinct
“We have been especially impressed by the seamless integration between the PureData System and InfoSphere BigInsights solutions. Fluid Query gives us the ability to leverage the different strengths and capabilities of Hadoop and PureData System for Analytics together.” ~ David Darden, BI Engineering Manager, Big Fish Games

© 2017 Enterprise Management Associates, Inc. and 9sight Consulting
| Report Summary: Charting the Expanding Horizons of Big Data42
AUTHORS AND METHODOLOGY

© 2017 Enterprise Management Associates, Inc. and 9sight Consulting
Report Summary: Charting the Expanding Horizons of Big Data | 43
Authors
John Myers joined Enterprise Management Associates in 2011 as Senior Analyst of Business Intelligence (BI). In this role, John delivers comprehensive coverage of the business intelligence and data warehouse industry with a focus on database management, data integration, data visualization, and process management solutions.
John has years of experience working in areas related to business analytics in professional services consulting and product development roles. He has also helped organizations solve their business analytics problems whether they relate to operational platforms, such as customer care or billing, or applied analytical applications, such as revenue assurance or fraud management.
During his professional career, John has spent over 10 years working with business analytics implementations associated with the telecommunications industry. In this role, John has worked on reducing the complexity of the flood of data associated with the augmented role of telecommunications on everyday activities, including increased importance of smartphone and tablet applications, emerging role of over the top (OTT) video content (IPTV), and potential of machine to machine (M2M) connectivity for smart grids. John was recognized as a key component of the TeleManagement Forum’s (TMForum) work on analytics-based content distribution as part of the TMForum’s Content Encounter applied solution demonstration series in 2009.
Lyndsay Wise joined EMA in 2015 as Research Director for Business Intelligence (BI) and Data Warehousing, focusing on data integration, data governance, cloud technologies, data visualization, analytics, and collaboration. She has over 10 years of experience in software research, BI consulting, and strategy development, specializing in software evaluation and best-fit solution selection.
In 2007 Lyndsay founded WiseAnalytics, a boutique analyst and consulting firm focused on business intelligence for small and mid-sized organizations. WiseAnalytics covered research areas related to data visualization, analytics, BI in the cloud, and implementation strategies for mid-market organizations. She provided consulting services as well as industry research into leading technologies, market trends,
BI products and vendors, mid-market needs, and data visualization. She brings this expertise to EMA to extend the consulting activities of the business intelligence research space.
In 2012, Lyndsay wrote “Using Open Source Platforms for Business Intelligence: Avoid Pitfalls and Maximize ROI” to help provide organizations with the tools needed to evaluate open-source business intelligence and make the right software decisions. In addition, she has contributed to Information Management, InsightaaS, TechTarget, Dashboard Insight, B-eye-Network as a BI for mid- market channel expert, and other online publications over the past 10 years, providing best practices and advice related to business intelligence technologies and market trends.

© 2017 Enterprise Management Associates, Inc. and 9sight Consulting
| Report Summary: Charting the Expanding Horizons of Big Data44
Authors
Dr. Barry Devlin is a founder of the data warehousing industry, defining its first architecture in 1985. A foremost authority on business intelligence (BI), big data, and beyond, he is respected worldwide as a visionary and thought-leader in the evolving industry. Barry authored two ground-breaking books: the classic Data Warehouse—from Architecture to Implementation and Business unIntelligence—Insight and Innovation Beyond Analytics and Big Data in 2013 (bit.ly/BunI-TP1).
Barry has over 30 years of experience in the IT industry, previously with IBM, as a consultant, manager, and distinguished engineer. As founder and principal of 9sight Consulting (www.9sight.com) in 2008, Barry provides strategic consulting and thought-leadership to buyers and vendors of BI and Big Data solutions. He is an associate editor of TDWI’s Journal of Business Intelligence, and a regular keynote speaker, teacher, and writer on all aspects of information creation and use. Barry operates worldwide from Cape Town, South Africa.

© 2017 Enterprise Management Associates, Inc. and 9sight Consulting
Report Summary: Charting the Expanding Horizons of Big Data | 45
Methodology Description
EMA and 9sight Consulting crafted the big data user surveys that are the basis for this report. Before the survey was conducted, report sponsors were provided with a copy of the survey instrument. However, sponsors had no direct involvement in or influence on the survey creation, survey contents, survey execution, or any of the subsequent evaluation and analysis of the results for this report.
For this research, EMA and 9sight invited pre-qualified business intelligence (BI) and information technology (IT) professionals to complete an extensive web-based survey. These respondents were further qualified based on their responses to the following questions:
• What is your primary role in the usage and/or management of big data applications/technology within your organization?
• Which of the following best describes your company’s primary industry?
• How would you describe the extent to which big data initiatives have been adopted within your business/organization?
• What is your relation to big data applications/products currently being used within your organization?
• At what phase of implementation are your business area/organization’s big data initiative’s project(s)?
Respondents who failed to qualify on these questions were rejected. As a result, all respondents (in addition to being independently pre-qualified through the initial invitation process) self-identified as being active participants with a working knowledge of current operational and analytical data management practices within their company presently researching, planning, or implementing big data strategies.
2016 RespondentsIn 2016, 303 business and technology professionals responded to an invitation to provide their insights on big data strategies and implementation practices. To offer a balanced enterprise view of the subject, the respondent pool was also restricted. Business stakeholders represented 46% of respondents. Technologists were 54%.
The 2016 survey instrument was executed in March 2016.
2014/2015 RespondentsIn 2014, 351 business and technology professionals responded to an invitation to provide their insights on big data strategies and implementation practices. To offer a balanced enterprise view of the subject, the respondent pool was also restricted. Business stakeholders represented 57% of respondents. Technologists were 43%.
The 2014 survey instrument was executed in December 2014.

© 2017 Enterprise Management Associates, Inc. and 9sight Consulting
| Report Summary: Charting the Expanding Horizons of Big Data46
Survey Information and Year Over Year Calculations
2013 RespondentsIn 2013, 259 business and technology professionals responded to an invitation to provide their insights on big data strategies and implementation practices. To offer a balanced enterprise view of the subject, the respondent pool was also restricted. Business stakeholders represented 51% of respondents. Technologists were 48%. Professional services consultants in IT represented less than 1% of the response panel.
The 2013 survey instrument was executed between July and August 2013.
2012 RespondentsFor 2012, 255 business and technology professionals responded to the survey invitation. To provide balance, EMA/9sight restricted the respondent pool to an approximate mix of 45% business stakeholders, 45% IT participants, and 10% IT consultants.
The 2012 survey instrument was conducted between July and August 2012.
For easy identification, in this report each year’s information is color coded. Red represents the 2012 survey, the 2013 survey is green, orange is the 2014/2015 survey, and blue is the 2016 survey.
Year Over Year CalculationsEach year over year calculation assumes a straight line growth, or contraction, between two surveys.
Due to the fact that data collection periods and published analysis from surveys are performed annually but not within a precise 12-month period, the term “year over year” is used loosely to refer to two surveys as opposed to two calendar years.
Because of the changing nature of big data business and technology challenges, the questions in each survey were adjusted, new questions and variables added, and older questions removed. Trending information may be between two non-consecutive surveys. In these cases of comparing two non-consecutive surveys (e.g., 2013 and 2016), the growth will be considered a straight line between the survey publish dates, and year over year calculations will be based between the surveys. For example, 35% growth between the 2013 and 2016 surveys would be considered 17.5% year over year growth between the two survey “years.”

About Enterprise Management Associates, Inc.Founded in 1996, Enterprise Management Associates (EMA) is a leading industry analyst firm that provides deep insight across the full spectrum of IT and data management technologies. EMA analysts leverage a unique combination of practical experience, insight into industry best practices, and in-depth knowledge of current and planned vendor solutions to help EMA’s clients achieve their goals. Learn more about EMA research, analysis, and consulting services for enterprise line of business users, IT professionals and IT vendors at www.enterprisemanagement.com or blogs.enterprisemanagement.com. You can also follow EMA on Twitter, Facebook or LinkedIn.
This report in whole or in part may not be duplicated, reproduced, stored in a retrieval system or retransmitted without prior written permission of Enterprise Management Associates, Inc. All opinions and estimates herein constitute our judgement as of this date and are subject to change without notice. Product names mentioned herein may be trademarks and/or registered trademarks of their respective companies. “EMA” and “Enterprise Management Associates” are trademarks of Enterprise Management Associates, Inc. in the United States and other countries.
©2017 Enterprise Management Associates, Inc. All Rights Reserved. EMA™, ENTERPRISE MANAGEMENT ASSOCIATES®, and the mobius symbol are registered trademarks or common-law trademarks of Enterprise Management Associates, Inc.
Corporate Headquarters: 1995 North 57th Court, Suite 120 Boulder, CO 80301 Phone: +1 303.543.9500 Fax: +1 303.543.7687 www.enterprisemanagement.com3436-IBM-SUMMARY.010417
Related Documents