CHARTING THE COURSE: THE COMPREHENSIVE CONSERVATION AND MANAGEMENT PLAN FOR TAMPA BAY AUGUST 2017 REVISION Go to: TABLE OF CONTENTS | INDEX OF ACTIONS

Welcome message from author
This document is posted to help you gain knowledge. Please leave a comment to let me know what you think about it! Share it to your friends and learn new things together.
Transcript
CHARTING THE COURSE:THE COMPREHENSIVE
CONSERVATION
AND MANAGEMENT PLAN
FOR TAMPA BAY
AUGUST 2017 REVISION
Go to: TABLE OF CONTENTS | INDEX OF ACTIONS

HOW TO NAVIGATE THIS DOCUMENT:
CHARTING THE COURSE: THE COMPREHENSIVE CONSERVATION AND MANAGEMENT PLAN FOR TAMPA BAY (AUGUST 2017 REVISION)
PAGE 2
Go to: TABLE OF CONTENTS | INDEX OF ACTIONS
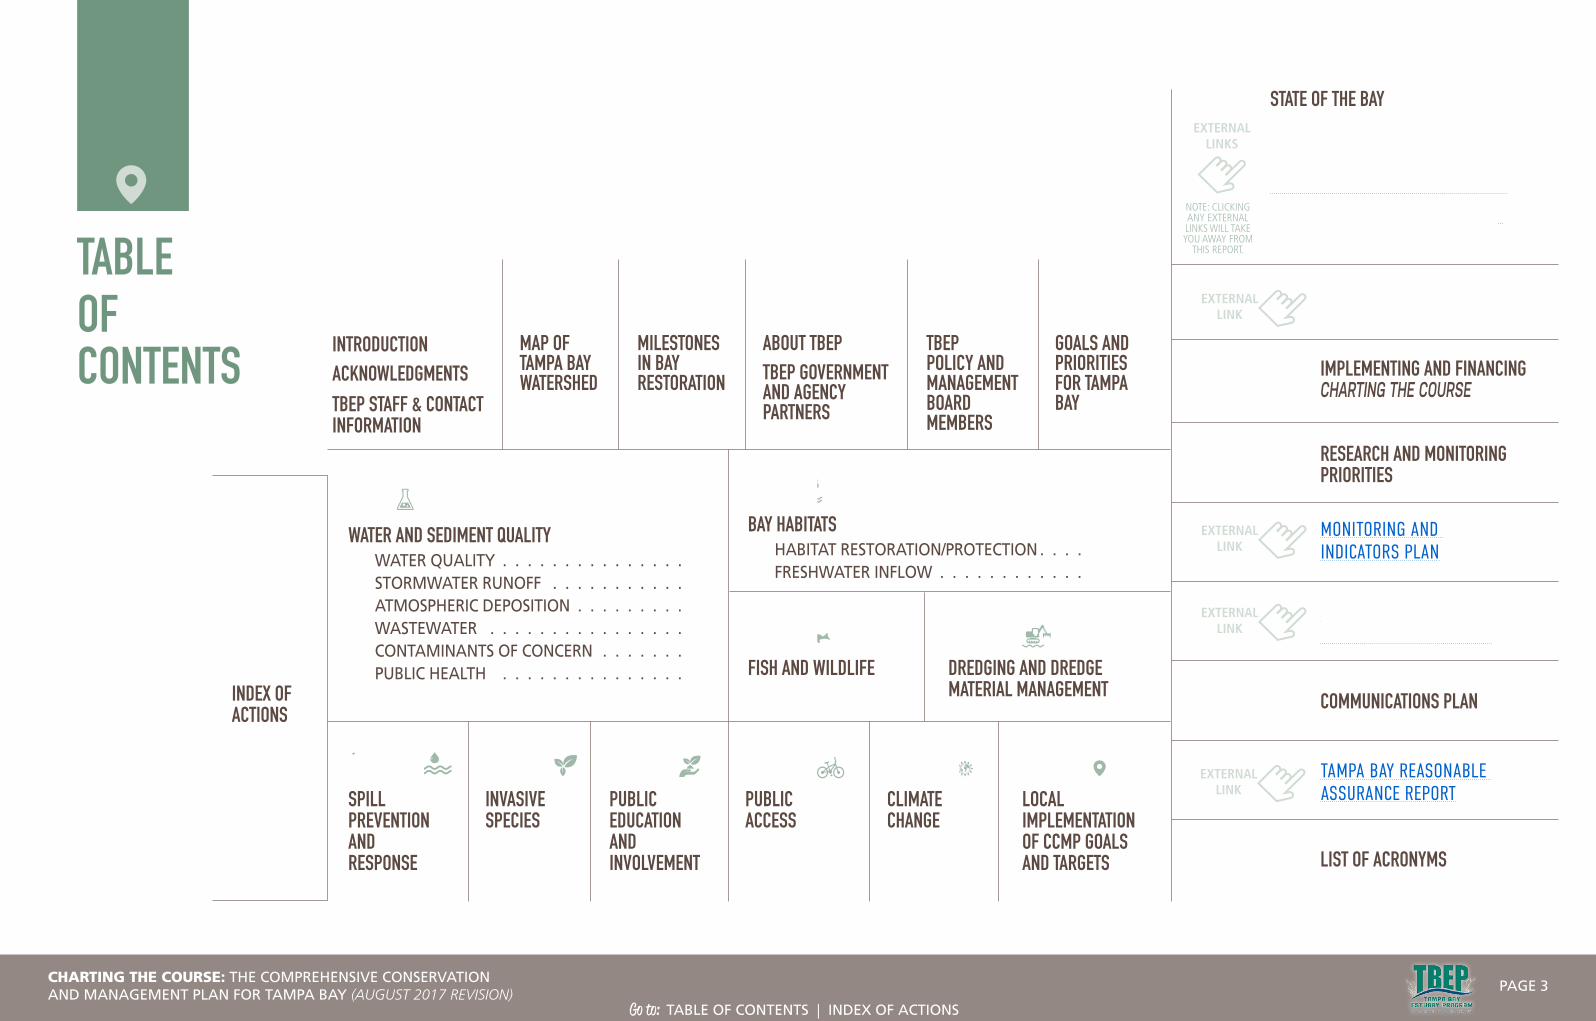
14WATER AND SEDIMENT QUALITY
WATER QUALITY . . . . . . . . . . . . . . . 14STORMWATER RUNOFF . . . . . . . . . . . 21ATMOSPHERIC DEPOSITION . . . . . . . . . 31WASTEWATER . . . . . . . . . . . . . . . . 35CONTAMINANTS OF CONCERN . . . . . . . 49PUBLIC HEALTH . . . . . . . . . . . . . . . 55
65BAY HABITATS
HABITAT RESTORATION/PROTECTION . . . . 65 FRESHWATER INFLOW . . . . . . . . . . . . 93
4INTRODUCTIONACKNOWLEDGMENTSTBEP STAFF & CONTACT INFORMATION
5MAP OF TAMPA BAY WATERSHED
6MILESTONES IN BAY RESTORATION
7ABOUT TBEPTBEP GOVERNMENT AND AGENCY PARTNERS
8TBEP POLICY AND MANAGEMENT BOARD MEMBERS
9GOALS AND PRIORITIES FOR TAMPA BAY
95FISH AND WILDLIFE
118SPILL PREVENTION AND RESPONSE
111DREDGING AND DREDGE MATERIAL MANAGEMENT
124INVASIVE SPECIES
129PUBLIC EDUCATION AND INVOLVEMENT
136PUBLIC ACCESS
141CLIMATE CHANGE
148LOCAL IMPLEMENTATION OF CCMP GOALS AND TARGETS
STATE OF THE BAY
TAMPA BAY ESTUARY PROGRAM PROGRESS REPORT
BASIS 6 SYMPOSIUM PROCEEDINGS
TAMPA BAY HABITAT RESTORATION MASTER PLAN
IMPLEMENTING AND FINANCING CHARTING THE COURSE
COMMUNICATIONS PLAN
LIST OF ACRONYMS
153
CLIMATE CHANGE VULNERABILITY ANALYSIS12
INDEX OF ACTIONS
151RESEARCH AND MONITORING PRIORITIES
TAMPA BAY REASONABLE ASSURANCE REPORT
MONITORING AND INDICATORS PLAN
157
156
TABLEOF CONTENTS
EXTERNAL LINK
EXTERNAL LINK
EXTERNAL LINK
EXTERNAL LINK
EXTERNAL LINKS
NOTE: CLICKING ANY EXTERNAL LINKS WILL TAKE YOU AWAY FROM
THIS REPORT.
STRATEGIC PLAN
CHARTING THE COURSE: THE COMPREHENSIVE CONSERVATION AND MANAGEMENT PLAN FOR TAMPA BAY (AUGUST 2017 REVISION)
PAGE 3
Go to: TABLE OF CONTENTS | INDEX OF ACTIONS

ACKNOWLEDGMENTSThe August 2017 Revision of Charting the Course: The Comprehensive Conservation and Management Plan for Tampa Bay was prepared by Nanette O’Hara (TBEP Public Outreach Coordinator), with research, writing and data/graphics support from Shafer Consulting and design by Bazany Design. TBEP staff and members of the TBEP’s Technical Advisory and Community Advisory Committees and Nitrogen Management Consortium; the Tampa Bay Regional Planning Council Agency on Bay Management; and the Tampa Bay scientific and management community provided critical input and review. Comments from Felicia Burks (EPA Region 4, Atlanta) and Nancy Laurson (EPA Headquarters, Washington DC) and their colleagues provided valuable structural and content edits. This revision of Charting the Course: was approved by TBEP’s Management and Policy Board in February 2017.
CONTACT INFORMATION Tampa Bay Estuary Program
263 13th Avenue SouthSt. Petersburg, FL 33701
727-893-2765tbep.org
tbeptech.org
TBEP STAFF Holly S . GreeningExecutive [email protected]
Ron HoslerProgram Administrator
Maya BurkeTechnical Projects Coordinator
Misty CladasProject [email protected]
Nanette O’ HaraPublic Outreach Coordinator
Gary RaulersonEcologist
Ed SherwoodSenior Scientist
Blue crabs are an important commercial species in Tampa Bay. They contributed to total seafood harvests for the 4-county bay area valued at $35.3 million in 2015. Photo by Nanette O’Hara.
An aerial view of Shell Key, an undeveloped barrier island near the mouth of Tampa Bay. Shell Key is managed as a preserve by Pinellas County to protect its mangrove and seagrass resources. The island is among Florida’s most important shorebird nesting beaches. It is also a prized recreational area, and public uses are carefully balanced to accommodate both people and wildlife.Photo courtesy Pinellas County Communications.
INTRODUCTIONThe 2017 Revision of Charting The Course: The Comprehensive Conservation and Management Plan (CCMP) for Tampa Bay is intended to serve as a community blueprint for action to sustain progress in protecting and restoring the bay over a 10-year horizon .
Key achievements since the 2006 Revision include:
• Surpassing TBEP’s seagrass recovery goal of 38,000 acres baywide, with an estimated 41,655 acres in 2016;• Meeting one or both water quality targets in all bay segments every year but one (2011), and;• Establishing measurable restoration targets for freshwater wetlands (18,703 acres) and emergent tidal wetlands (22,739 acres) .
Important goals and challenges for the 2017-2027 timeframe include:
• Maintaining at least 38,000 acres of seagrass by continuing to manage nitrogen loadings to the bay;• Establishing restoration and protection targets for hard bottom habitats, coastal uplands and tidal tributaries, and;• Planning for and adapting to a changing climate .
WHAT’S NEW IN THIS UPDATE• This is the first CCMP designed exclusively on a digital
platform .• Two new categories have been added: Public Access and
Local Implementation of CCMP Goals . • Nine new actions have been added: WQ-3, WW-5, COC-4,
BH-10, DR-2, PE-2, PA-1, CC-2, LI-1. • Several existing actions were consolidated or moved
to different categories that more accurately represent updated implementation strategies . See Index of Actions.
• Five actions have been completed and retired . See Index of Actions.
• New or revised goals adopted since the 2006 CCMP address Water Quality; Bay Habitats; Dredging; Fish and Wildlife; Invasive Species; Spill Prevention; Public Access; and Local Implementation of CCMP Goals . See Goals and Priorities Table.
• This CCMP codifies the desire of TBEP’s local and regional partners to formally adopt the goals and actions of this Plan in their planning and guidance documents (see Action LI-1) .
PUBLIC AND STAKEHOLDER INPUTCommunity input into the development of the CCMP Update was solicited as follows: • An online survey was conducted in 2015 to solicit public and stakeholder
opinions about bay improvement and to rank priority issues . More than 400 people took the poll: 41% identified urban/residential runoff as the biggest threat to the bay’s health today, while 31% said habitat loss will be the biggest threat to the bay 10 years from now.
• External reviewers with expertise in issues specific to each action were enlisted to provide comments and guidance .
• Actions were developed over a 2-year period with quarterly reviews by TBEP’s Technical Advisory Committee, Community Advisory Committee, and the Tampa Bay Regional Planning Council’s Agency on Bay Management . Recommendations from these groups were presented to TBEP’s Management Board, who made further recommendations for consideration by the Policy Board . Final adoption of individual actions, as well as the entire CCMP, came from the Policy Board – composed of elected and appointed officials, and high-level environmental administrators from TBEP partner governments and agencies .
• A matrix of comments submitted during the development of the CCMP is available on request .
CHARTING THE COURSE: THE COMPREHENSIVE CONSERVATION AND MANAGEMENT PLAN FOR TAMPA BAY (AUGUST 2017 REVISION)
PAGE 4
Go to: TABLE OF CONTENTS | INDEX OF ACTIONS
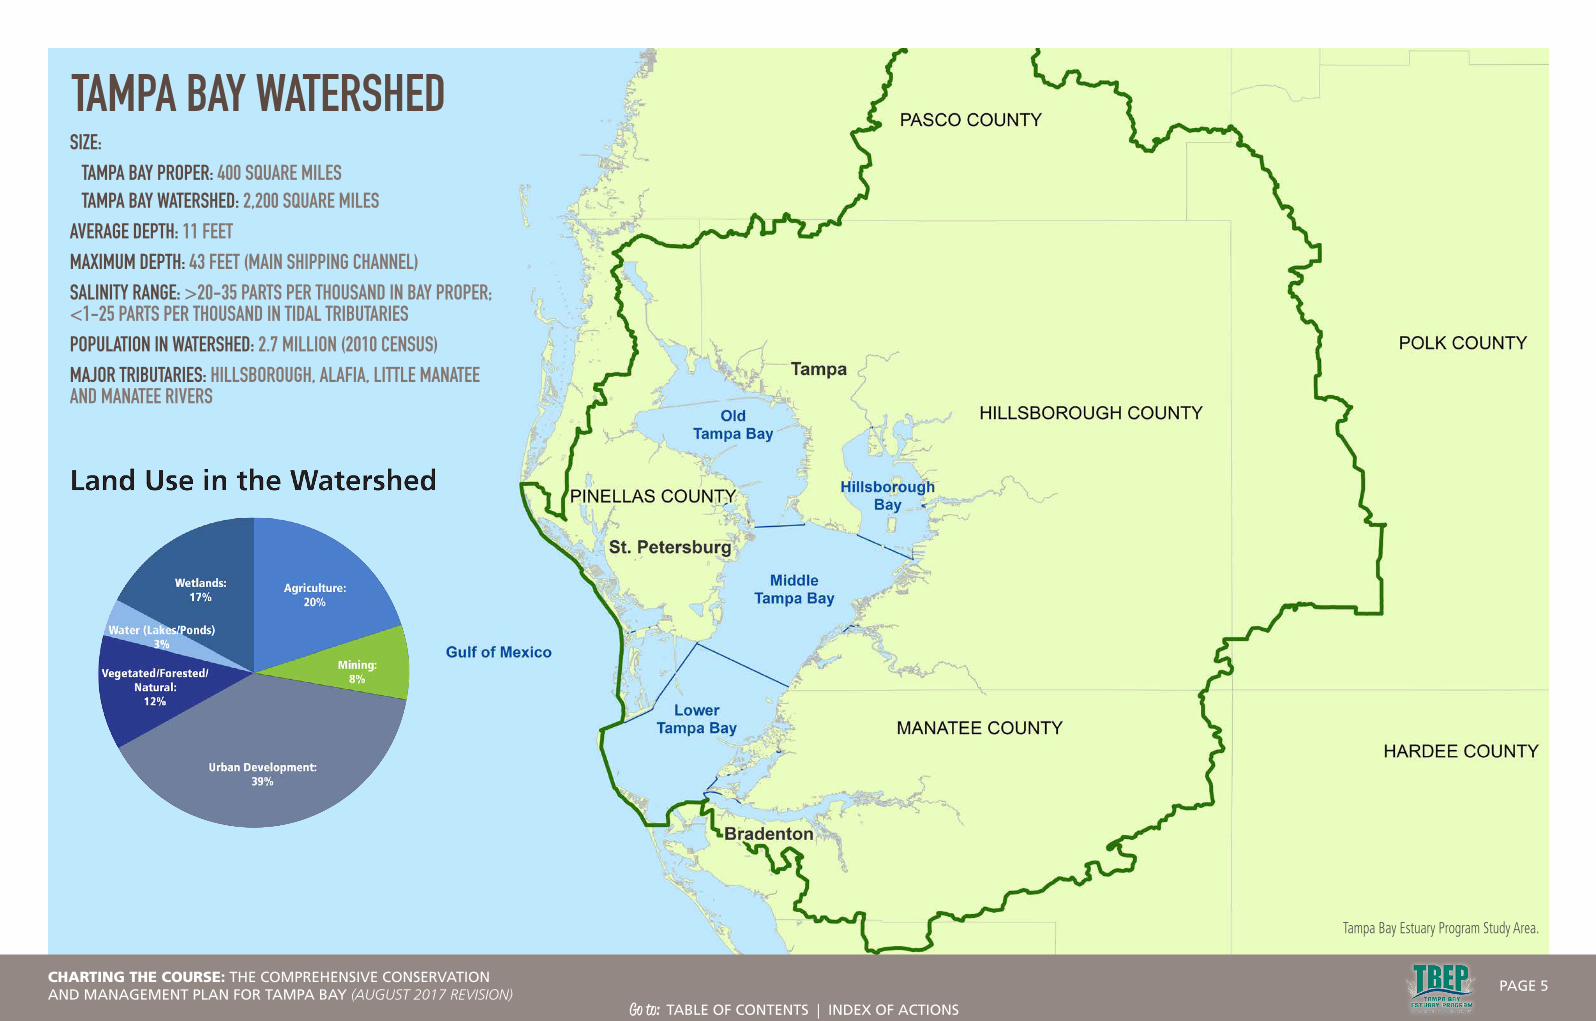
TAMPA BAY WATERSHEDSIZE: TAMPA BAY PROPER: 400 SQUARE MILES TAMPA BAY WATERSHED: 2,200 SQUARE MILESAVERAGE DEPTH: 11 FEET MAXIMUM DEPTH: 43 FEET (MAIN SHIPPING CHANNEL) SALINITY RANGE: >20-35 PARTS PER THOUSAND IN BAY PROPER; <1-25 PARTS PER THOUSAND IN TIDAL TRIBUTARIES POPULATION IN WATERSHED: 2.7 MILLION (2010 CENSUS) MAJOR TRIBUTARIES: HILLSBOROUGH, ALAFIA, LITTLE MANATEE AND MANATEE RIVERS
Tampa Bay Estuary Program Study Area.
CHARTING THE COURSE: THE COMPREHENSIVE CONSERVATION AND MANAGEMENT PLAN FOR TAMPA BAY (AUGUST 2017 REVISION)
PAGE 5
Go to: TABLE OF CONTENTS | INDEX OF ACTIONS

KEY MILESTONES IN THE RESTORATION OF TAMPA BAY, 1950-2016.
1950sPopulation less than ¼ of today.
1972EPA Clean Water Act approved.
1996TBNEP’s CCMP is approved by local partners, the Governor, and the EPA Administrator. Numeric goals for habitat restoration and water quality improvement are adopted.
1982Statewide Stormwater Rule is enacted, requiring nutrient management from municipal stormwater systems.
1991Tampa Bay is recognized by EPA as an “estuary of national significance,” and the Tampa Bay National Estuary Program is created to develop a Comprehensive Conservation and Management Plan.
1998The TBNMC develops an Action Plan (Partnership for Progress) to meet nutrient management targets.
1967Environmental Protection Commission of Hillsborough County (EPCHC) established.
1974EPCHC initiates baywide water quality monitoring program.
2014Tampa Bay surpasses seagrass recovery goal of 38,000 acres.
1985The Tampa Bay Regional Planning Council convenes the region to develop the Future of Tampa Bay report, including specific actions to reduce pollution and recover habitats in Tampa Bay. The Agency on Bay Management is established to support the report’s recommendations.
2006First year that all bay segments achieve TBEP water quality targets.
1970sSave Our Bays and other citizen groups call for legislative action to reduce pollution discharges.
1987The State’s Water Management Districts establish Surface Water Implementation and Management (SWIM) programs to restore and protect priority water bodies within each District. Tampa Bay is identified as the Southwest Florida Water Management District’s priority water body.
1998An Interlocal Agreement between the TBNEP partners forms a new Independent Special District of the State of Florida, the Tampa Bay Estuary Program. TBEP partners commit to implementing projects to assist in meeting numeric goals, and to support a funding schedule.
1979City of Tampa’s Howard F. Curren Wastewater Treatment Plant (WWTP) achieves AWT standard, reduces nitrogen loadings by 90%. City of St Petersburg implements 100% reclaimed water from their direct discharge, with similar reductions. Other WWTPs in the region implement nutrient reductions.
2016Seagrass coverage increases to 41,655 acres.
1960sBay degradation is recognized.
1972Florida’s Wilson-Grizzle Act requires wastewater plants discharging to Tampa Bay to upgrade to Advanced Wastewater Treatment (AWT) standards, or enact 100% reclaimed.
1996The public/private Tampa Bay Nitrogen Management Consortium (TBNMC) is formed to assist in meeting nitrogen management targets needed to meet seagrass goals.
1982The first Bay Area Science Information Symposium (BASIS) is conducted by the Tampa Bay Regional Planning Council.
2009TBNMC develops voluntary nutrient loading limits for all sources, to continue to meet water quality targets. Federal and state regulatory agencies adopt limits to meet regulatory requirements.
Image credit JOR Johansson
Courtesy Florida State Archives
SWFWMD photo
A HISTORY OF TAMPA BAY
CHARTING THE COURSE: THE COMPREHENSIVE CONSERVATION AND MANAGEMENT PLAN FOR TAMPA BAY (AUGUST 2017 REVISION)
PAGE 6
Go to: TABLE OF CONTENTS | INDEX OF ACTIONS

ABOUT US Tampa Bay was designated an “estuary of national significance” by Congress in 1990, laying the foundation for the creation of the Tampa Bay Estuary Program (TBEP) in 1991.
TBEP is an intergovernmental partnership of Hillsborough, Manatee, Pasco and Pinellas counties; the cities of Tampa, St. Petersburg and Clearwater; the U.S. Environmental Protection Agency (EPA); the Southwest Florida Water Management District (SWFWMD); and the Florida Department of Environmental Protection (FDEP). These partners have pledged, through a binding Interlocal Agreement, to achieve the science-based goals of Charting the Course: The Comprehensive Conservation and Management Plan for Tampa Bay.
TBEP is governed by a Policy Board of elected officials from our local government members, SWFWMD, EPA and FDEP. A larger Management Board comprised of administrators from local, regional and state government agencies and organizations makes recommendations to the Policy Board.
TBEP’s mission of bay restoration, research and education is supported by several committees, including a Technical Advisory Committee of scientists and managers; a Nitrogen Management Consortium of industries, regulators and expanded city-county members; and a Community Advisory Committee of engaged citizens.
TBEP GOVERNMENT AND AGENCY PARTNERSThe following cities, counties, state and regional agencies and organizations are members of TBEP’s Management and/or Policy Boards.
Elected officials represent cities and counties on the Policy Board. Other members are appointed or designated by their respective organizations.
Photo by Merle Allshouse
TBEP MISSION STATEMENT The mission of the Tampa Bay Estuary Program is to build partnerships to restore and protect Tampa Bay through implementation of a scientifically sound, community-based management plan.
Hillsborough County
Manatee County
Pasco County
Pinellas County
City of Clearwater
City of St. Petersburg
City of Tampa
Southwest Florida Water Management District
U.S. Environmental Protection Agency
Florida Department of Environmental Protection
Florida Fish and Wildlife Conservation Commission
Environmental Protection Commission of Hillsborough County
Port Tampa Bay
Port Manatee
Tampa Bay Regional Planning Council
Tampa Bay Water
U.S. Army Corps of Engineers
Brown pelican with chicks. Photo by Gerold Morrison.
ABOUT CHARTING THE COURSECharting The Course: The Comprehensive Conservation and Management Plan for Tampa Bay is intended to be a living document that reflects our evolving knowledge and understanding of bay processes and community needs . Major revisions of Charting The Course occur every 10 years; minor updates occur every 3-5 years .
There are 39 actions in the 2017 CCMP Update . Each action presents specific strategies to meet agreed-upon objectives . Responsible parties, implementation timetables, and results and deliverables are part of every action .
Costs estimates for implementing the various activities detailed in each action are as follows:
$ less than $25,000
$$ $25,000-$99,999
$$$ $100,000-$500,000
$$$$ More than $500,000
CHARTING THE COURSE: THE COMPREHENSIVE CONSERVATION AND MANAGEMENT PLAN FOR TAMPA BAY (AUGUST 2017 REVISION)
PAGE 7
Go to: TABLE OF CONTENTS | INDEX OF ACTIONS
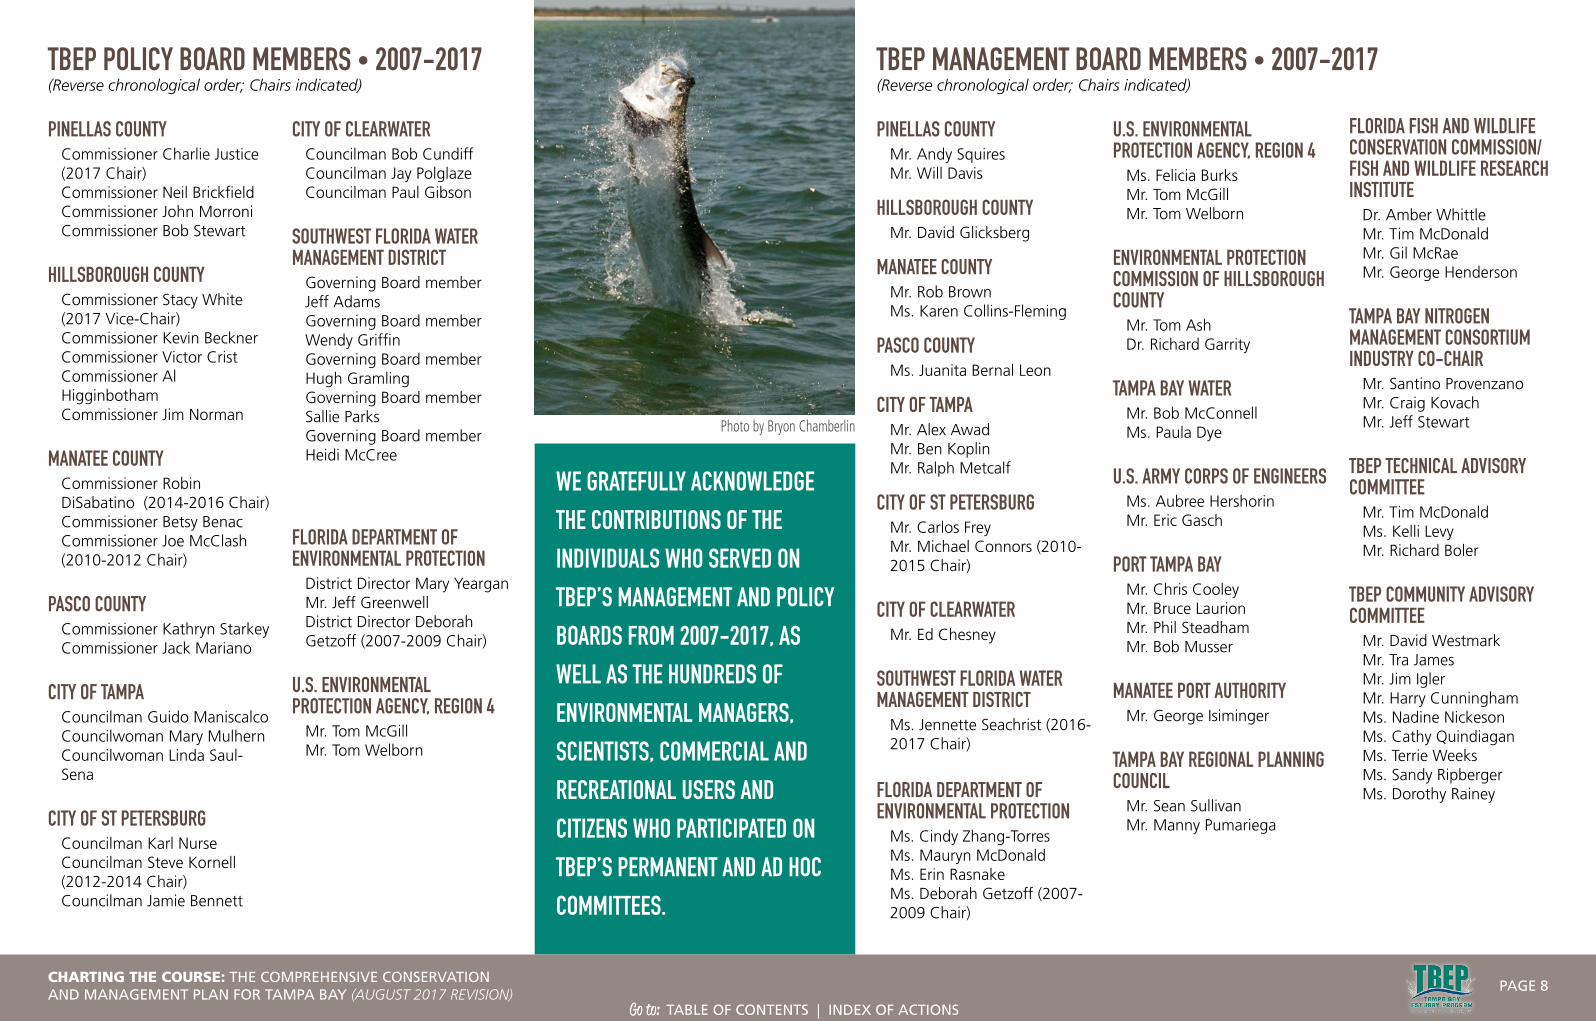
TBEP POLICY BOARD MEMBERS • 2007-2017(Reverse chronological order; Chairs indicated)
PINELLAS COUNTY Commissioner Charlie Justice
(2017 Chair) Commissioner Neil Brickfield Commissioner John Morroni Commissioner Bob Stewart
HILLSBOROUGH COUNTY Commissioner Stacy White
(2017 Vice-Chair) Commissioner Kevin Beckner Commissioner Victor Crist Commissioner Al
Higginbotham Commissioner Jim Norman
MANATEE COUNTY Commissioner Robin
DiSabatino (2014-2016 Chair) Commissioner Betsy Benac Commissioner Joe McClash
(2010-2012 Chair)
PASCO COUNTY Commissioner Kathryn Starkey Commissioner Jack Mariano
CITY OF TAMPA Councilman Guido Maniscalco Councilwoman Mary Mulhern Councilwoman Linda Saul-
Sena
CITY OF ST PETERSBURG Councilman Karl Nurse Councilman Steve Kornell
(2012-2014 Chair) Councilman Jamie Bennett
CITY OF CLEARWATER Councilman Bob Cundiff Councilman Jay Polglaze Councilman Paul Gibson
SOUTHWEST FLORIDA WATER MANAGEMENT DISTRICT Governing Board member
Jeff Adams Governing Board member
Wendy Griffin Governing Board member
Hugh Gramling Governing Board member
Sallie Parks Governing Board member
Heidi McCree
FLORIDA DEPARTMENT OF ENVIRONMENTAL PROTECTION District Director Mary Yeargan Mr. Jeff Greenwell District Director Deborah
Getzoff (2007-2009 Chair)
U.S. ENVIRONMENTAL PROTECTION AGENCY, REGION 4 Mr. Tom McGill Mr. Tom Welborn
TBEP MANAGEMENT BOARD MEMBERS • 2007-2017(Reverse chronological order; Chairs indicated)
PINELLAS COUNTY Mr. Andy Squires Mr. Will Davis
HILLSBOROUGH COUNTY Mr. David Glicksberg
MANATEE COUNTY Mr. Rob Brown Ms. Karen Collins-Fleming
PASCO COUNTY Ms. Juanita Bernal Leon
CITY OF TAMPA Mr. Alex Awad Mr. Ben Koplin Mr. Ralph Metcalf
CITY OF ST PETERSBURG Mr. Carlos Frey Mr. Michael Connors (2010-
2015 Chair)
CITY OF CLEARWATER Mr. Ed Chesney
SOUTHWEST FLORIDA WATER MANAGEMENT DISTRICT Ms. Jennette Seachrist (2016-
2017 Chair)
FLORIDA DEPARTMENT OF ENVIRONMENTAL PROTECTION Ms. Cindy Zhang-Torres Ms. Mauryn McDonald Ms. Erin Rasnake Ms. Deborah Getzoff (2007-
2009 Chair)
U.S. ENVIRONMENTAL PROTECTION AGENCY, REGION 4 Ms. Felicia Burks Mr. Tom McGill Mr. Tom Welborn
ENVIRONMENTAL PROTECTION COMMISSION OF HILLSBOROUGH COUNTY Mr. Tom Ash Dr. Richard Garrity
TAMPA BAY WATER Mr. Bob McConnell Ms. Paula Dye
U.S. ARMY CORPS OF ENGINEERS Ms. Aubree Hershorin Mr. Eric Gasch
PORT TAMPA BAY Mr. Chris Cooley Mr. Bruce Laurion Mr. Phil Steadham Mr. Bob Musser
MANATEE PORT AUTHORITY Mr. George Isiminger
TAMPA BAY REGIONAL PLANNING COUNCIL Mr. Sean Sullivan Mr. Manny Pumariega
FLORIDA FISH AND WILDLIFE CONSERVATION COMMISSION/ FISH AND WILDLIFE RESEARCH INSTITUTE Dr. Amber Whittle Mr. Tim McDonald Mr. Gil McRae Mr. George Henderson
TAMPA BAY NITROGEN MANAGEMENT CONSORTIUM INDUSTRY CO-CHAIR Mr. Santino Provenzano Mr. Craig Kovach Mr. Jeff Stewart
TBEP TECHNICAL ADVISORY COMMITTEE Mr. Tim McDonald Ms. Kelli Levy Mr. Richard Boler
TBEP COMMUNITY ADVISORY COMMITTEE Mr. David Westmark Mr. Tra James Mr. Jim Igler Mr. Harry Cunningham Ms. Nadine Nickeson Ms. Cathy Quindiagan Ms. Terrie Weeks Ms. Sandy Ripberger Ms. Dorothy Rainey
Photo by Bryon Chamberlin
WE GRATEFULLY ACKNOWLEDGE THE CONTRIBUTIONS OF THE INDIVIDUALS WHO SERVED ON TBEP’S MANAGEMENT AND POLICY BOARDS FROM 2007-2017, AS WELL AS THE HUNDREDS OF ENVIRONMENTAL MANAGERS, SCIENTISTS, COMMERCIAL AND RECREATIONAL USERS AND CITIZENS WHO PARTICIPATED ON TBEP’S PERMANENT AND AD HOC COMMITTEES.
CHARTING THE COURSE: THE COMPREHENSIVE CONSERVATION AND MANAGEMENT PLAN FOR TAMPA BAY (AUGUST 2017 REVISION)
PAGE 8
Go to: TABLE OF CONTENTS | INDEX OF ACTIONS

CCMP GOAL RELATED ACTIONS
Water and Sediment Quality
Reduce or preclude nutrient loadings in the bay from all sources, to meet water quality targets and maintain at least 38,000 acres of seagrass baywide
Reduce the frequency and duration of harmful algal blooms
Reduce the amount of toxic chemicals in contaminated bay sediments and protect relatively clean areas of the bay from contamination
Reduce pollution from microplastics and emerging contaminants of concern
Reduce bacterial contamination from sources in the watershed to maintain recreational uses of the bay such as fishing and swimming
ACTIONS TO IMPROVE WATER QUALITY: WQ-1 Implement the Tampa Bay nutrient management strategy
WQ-3 Reduce frequency and duration of harmful algal blooms
ACTIONS TO REDUCE POLLUTION FROM STORMWATER RUNOFF:SW-1 Reduce nitrogen runoff from urban landscapes
SW-8 Expand adoption and implementation of Best Management Practices for commercial and urban agriculture
SW-10 Expand use of Green Infrastructure practices
ACTIONS TO REDUCE THE EFFECTS OF AIR POLLUTION ON THE BAY:AD-1 Continue to reduce nitrogen loading from atmospheric deposition
ACTIONS TO REDUCE POLLUTION FROM WASTEWATER DISCHARGED TO THE BAY: WW-1 Expand the beneficial use of reclaimed water
WW-2 Extend central sewer service to priority areas now served by septic systems
WW-3 Require standardized monitoring and reporting of wastewater discharges
WW-5 Reduce the occurrence of sanitary sewer overflows to the bay
ACTIONS TO REDUCE CONTAMINANTS OF CONCERN IN THE BAY:COC-1 Address hot spots of sediment contamination in the bay
COC-4 Identify and understand emerging contaminants
ACTIONS TO REDUCE PATHOGENS: PH-2 Continue source and risk assessments of human and ecosystem health indicators suitable for Tampa Bay beaches and other recreational waters
PH-4 Reduce fecal contamination from humans and pets in Tampa Bay Area waters
PH-5 Reduce pollution from recreational boaters
GOALS AND PRIORITIES OF CHARTING THE COURSE
CHARTING THE COURSE: THE COMPREHENSIVE CONSERVATION AND MANAGEMENT PLAN FOR TAMPA BAY (AUGUST 2017 REVISION)
PAGE 9
Go to: TABLE OF CONTENTS | INDEX OF ACTIONS
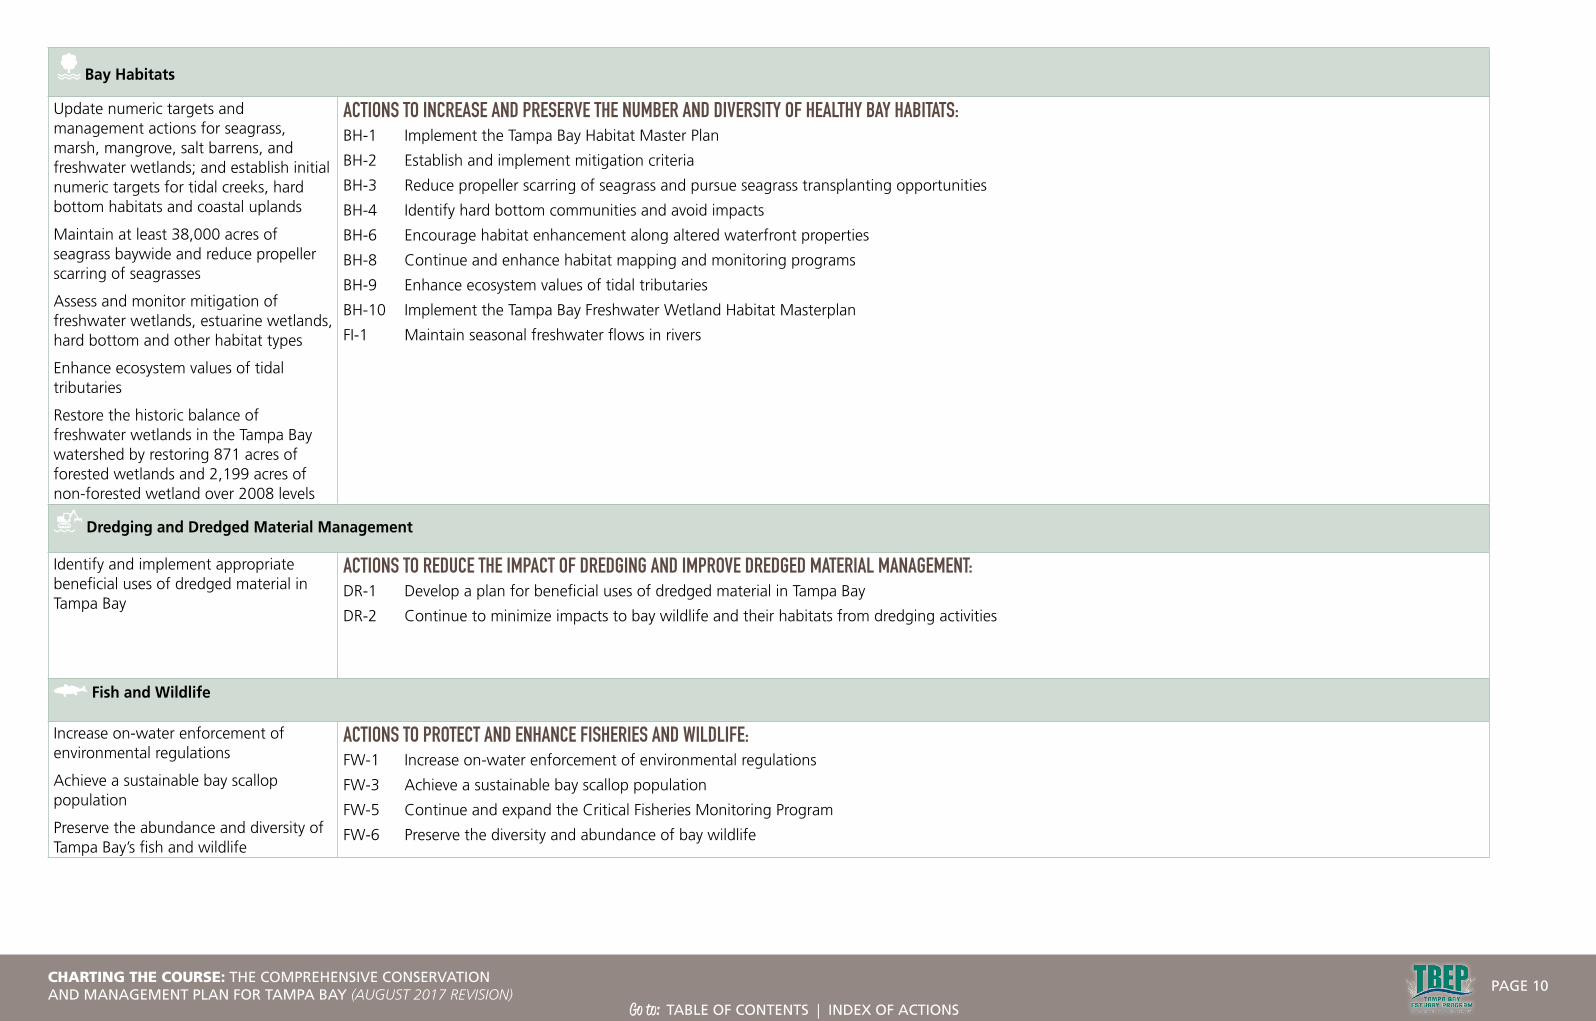
Bay Habitats
Update numeric targets and management actions for seagrass, marsh, mangrove, salt barrens, and freshwater wetlands; and establish initial numeric targets for tidal creeks, hard bottom habitats and coastal uplands
Maintain at least 38,000 acres of seagrass baywide and reduce propeller scarring of seagrasses
Assess and monitor mitigation of freshwater wetlands, estuarine wetlands, hard bottom and other habitat types
Enhance ecosystem values of tidal tributaries
Restore the historic balance of freshwater wetlands in the Tampa Bay watershed by restoring 871 acres of forested wetlands and 2,199 acres of non-forested wetland over 2008 levels
ACTIONS TO INCREASE AND PRESERVE THE NUMBER AND DIVERSITY OF HEALTHY BAY HABITATS: BH-1 Implement the Tampa Bay Habitat Master Plan
BH-2 Establish and implement mitigation criteria
BH-3 Reduce propeller scarring of seagrass and pursue seagrass transplanting opportunities
BH-4 Identify hard bottom communities and avoid impacts
BH-6 Encourage habitat enhancement along altered waterfront properties
BH-8 Continue and enhance habitat mapping and monitoring programs
BH-9 Enhance ecosystem values of tidal tributaries
BH-10 Implement the Tampa Bay Freshwater Wetland Habitat Masterplan
FI-1 Maintain seasonal freshwater flows in rivers
Dredging and Dredged Material Management
Identify and implement appropriate beneficial uses of dredged material in Tampa Bay
ACTIONS TO REDUCE THE IMPACT OF DREDGING AND IMPROVE DREDGED MATERIAL MANAGEMENT: DR-1 Develop a plan for beneficial uses of dredged material in Tampa Bay
DR-2 Continue to minimize impacts to bay wildlife and their habitats from dredging activities
Fish and Wildlife
Increase on-water enforcement of environmental regulations
Achieve a sustainable bay scallop population
Preserve the abundance and diversity of Tampa Bay’s fish and wildlife
ACTIONS TO PROTECT AND ENHANCE FISHERIES AND WILDLIFE:FW-1 Increase on-water enforcement of environmental regulations
FW-3 Achieve a sustainable bay scallop population
FW-5 Continue and expand the Critical Fisheries Monitoring Program
FW-6 Preserve the diversity and abundance of bay wildlife
CHARTING THE COURSE: THE COMPREHENSIVE CONSERVATION AND MANAGEMENT PLAN FOR TAMPA BAY (AUGUST 2017 REVISION)
PAGE 10
Go to: TABLE OF CONTENTS | INDEX OF ACTIONS

Spill Prevention and Response
Reduce the risk of oil or chemical spills in the bay and protect high-priority environmentally sensitive areas
Secure a permanent funding source for the Physical Oceanographic Real-Time System (PORTS) of navigational information
ACTIONS TO IMPROVE SPILL PREVENTION AND RESPONSE:SP-1 Continue implementation of advanced technology to improve coordination of ship movements in Tampa Bay
SP-2 Evaluate and update spill response plans for priority areas
Invasive Species
Reduce impacts of existing and potential harmful invasive species in Tampa Bay and its watershed
ACTIONS TO REDUCE THE OCCURRENCE OF INVASIVE SPECIES IN THE BAY:IS-2 Support prevention, eradication or management of invasive species in Tampa Bay and its watershed
Public Access
Foster adequate and appropriate access to the bay and address competing uses
ACTIONS TO IMPROVE RESPONSIBLE PUBLIC USE OF THE BAY:PA-1 Provide for and manage recreational uses of the bay
Public Education and Involvement
Create a constituency of informed, involved citizens who engage in actions to protect the bay and actively participate in restoring and protecting it
ACTIONS TO INCREASE PUBLIC EDUCATION AND INVOLVEMENT:PE-1 Promote public involvement in bay restoration and protection
PE-2 Promote public education about key issues affecting Tampa Bay
Local Implementation
Integrate CCMP goals, actions and priorities in local government comprehensive plans and development guidance
ACTIONS TO INCORPORATE CCMP GOALS AND TARGETS INTO LOCAL LAND USE PLANS, DEVELOPMENT CODES, CLIMATE CHANGE AND LAND ACQUISITION PROGRAMS:LI-1 Incorporate CCMP goals and actions in local government comprehensive plans, land development regulations or ordinances
Climate Change
Assess the vulnerability of critical coastal habitats to sea level rise and support adaptation strategies that promote the long-term resiliency and diversity of these habitats
ACTIONS TO IMPROVE THE RESILIENCY OF BAY HABITATS TO CLIMATE CHANGE:CC-1 Improve ability of bay habitats to adapt to a changing climate
CC-2 Understand and address the effects of ocean acidification
CHARTING THE COURSE: THE COMPREHENSIVE CONSERVATION AND MANAGEMENT PLAN FOR TAMPA BAY (AUGUST 2017 REVISION)
PAGE 11
Go to: TABLE OF CONTENTS | INDEX OF ACTIONS

WATER & SEDIMENT QUALITY
Actions to improve water quality:
WQ-1 Implement the Tampa Bay nutrient management strategy*
WQ-2 Reduce pollution from recreational boaters
Action moved to Public Health Action Plan in 2017 Revision
WQ-3 Reduce frequency and duration of harmful algal blooms
New action in 2017 Revision
Actions to reduce pollution from stormwater runoff:
SW-1 Reduce nitrogen runoff from urban landscapes*
SW-2 Assist businesses in implementing best management practices to reduce pollution, and to develop model landscaping guidelines for commercial use
Action merged into revised SW-1
SW-3 Encourage local governments to adopt integrated pest management policies and implement environmentally beneficial landscaping practices
Action retired in 2017 Revision
SW-4 Reduce impervious paved surfaces
Action retired in 2006 update
SW-5 Require older properties being redeveloped to meet current stormwater treatment standards for that portion of the site being redeveloped, or
Action retired in 2006 update
SW-6 Promote compact urban development and redevelopment
Action retired in 2006 update
SW-7 Enforce and require the timely completion of the consent order for the cleanup of fertilizer facilities in the East Bay sector
Action retired in 2017 Revision
SW-8 Expand adoption and implementation of best management practices for commercial and urban agriculture
Action revised in 2017 Revision
SW-9 Improve compliance with agricultural ground and surface water management plans
Action retired in 2006 update
SW-10 Expand use of Green Infrastructure practices
Action Revised
SW-11 Expand the Adopt-A-Pond program to additional communities
Action merged into revised SW-1
SW-12 Reduce nitrogen loading from urban landscapes
Action moved to SW-1 in 2017 Revision and expanded to incorporate SW-2 and SW-11
Actions to reduce the effects of air pollution on the bay:
AD-1 Continue to reduce nitrogen
loading from atmospheric deposition
AD-2 Promote public and business energy conservation
Action merged into AD-1
Actions to reduce pollution from wastewater discharged to the bay:
WW-1 Expand the beneficial use of reclaimed water
Action revised in 2017 Revision
WW-2 Extend central sewer service to priority areas now served by septic systems
WW-3 Require standardized monitoring and reporting of wastewater discharges
WW-4 Revise HRS rules to incorporate environmental performance or design
standards for septic systems
Action retired in 2006 update
WW-5 Reduce the occurrence of sanitary sewer overflows to the bay*
New action in 2017 Revision.
Actions to reduce Contaminants of Concern in the bay:
Note: This Action Plan was renamed Contaminants of Concern in 2017 CCMP update
COC-1 Address hot spots of contamination in the bay
Action revised in 2017 Revision, renamed as “Contaminants of Concern”
TX-2 Improve opportunities for proper hazardous waste disposal
Action retired in 2017 Revision
TX-3 Reduce toxic contaminants from ports and marinas
Action retired in 2006 update
COC-4 Identify and understand emerging contaminants
New action in 2017 Revision
Actions to reduce pathogens:
PH-1 Reduce the occurrence of municipal sewer overflows to the bay
Action moved to Wastewater Action Plan in 2017 Revision.
PH-2 Continue assessments of human and environmental health indicators suitable for Tampa Bay beaches and other recreational waters.
PH-3 Install additional sewage pump-out facilities for recreational boaters and
live-aboard vessels
Action retired in 2006 update. Issue incorporated in PH-5 in 2017 Revision.
PH-4 Reduce fecal contamination from humans and pets in Tampa Bay Area waters
Action revised in 2017 Revision and moved from Public Access Action Plan
INDEX OF ACTIONS FOR TAMPA BAY
*denotes Priority Action
CHARTING THE COURSE: THE COMPREHENSIVE CONSERVATION AND MANAGEMENT PLAN FOR TAMPA BAY (AUGUST 2017 REVISION)
PAGE 12
Go to: TABLE OF CONTENTS | INDEX OF ACTIONS

PH-5 Reduce pollution from recreational boaters
Action moved from Water Quality Action Plan in 2017 Revision
BAY HABITATS
Actions to increase and preserve the number and diversity of healthy bay habitats:
BH-1 Implement the Tampa Bay Habitat Master Plan*
BH-2 Establish and implement mitigation criteria
BH-3 Reduce propeller scarring of seagrass and pursue seagrass transplanting opportunities
BH-4 Identify hard bottom communities and avoid impacts
Action revised in 2017 Revision
BH-5 Improve management of parking and vehicle access along causeways and coastal areas
Action retired in 2006 update
BH-6 Encourage habitat enhancement along altered waterfront properties
Action revised in 2017 Revision
BH-7 Improve compliance with and enforcement of wetland permits
Action retired in 2006 update
BH-8 Continue and enhance habitat mapping and monitoring programs
BH-9 Enhance ecosystem values of tidal tributaries
Action added in 2012 update
BH-10 Implement the Tampa Bay Freshwater Wetland Habitat Masterplan
New action in 2017 Revision
Actions to establish and preserve adequate freshwater inflows to Tampa Bay and its tributaries:
FI-1 Maintain seasonal freshwater flows in rivers
Action revised in 2017 Revision
FISH & WILDLIFE
Actions to protect and enhance fisheries and wildlife:
FW-1 Increase on-water enforcement of environmental regulations
FW-2 Establish and enforce manatee protection zones
Action merged in FW-1 in 2017 Revision
FW-3 Achieve a sustainable bay scallop population
Action revised in 2017 Revision
FW-4 Assess the need to investigate the cumulative impacts of power plant entrainment on fisheries
Action retired in 2017 Revision
FW-5 Continue and expand the Critical Fisheries Monitoring Program
FW-6 Preserve the diversity and abundance of bay wildlife*
DREDGING & DREDGED MATERIAL MANAGEMENT
Actions to reduce the impact of dredging and improve dredged material management:
DR-1 Develop a plan for beneficial uses of dredged material in Tampa Bay
Action revised in 2017 Revision
DR-2 Continue to minimize impacts to bay wildlife and their habitats from dredging activities
New action in 2017 Revision
SPILL PREVENTION & RESPONSE
Actions to improve spill prevention and response:
SP-1 Continue implementation of advanced technology to improve coordination of ship movements in Tampa Bay
Action revised in 2017 Revision
SP-2 Evaluate and update oil and hazardous material spill response plans for priority areas
SP-3 Improve fueling and bilge-pumping practices among pleasure boaters
Action retired in 2006 update
INVASIVE SPECIES
Actions to reduce the occurrence of invasive species in the bay:
IS-1 Assess the extent of the existing invasions in Tampa Bay
Action retired in 2017 Revision
IS-2 Support prevention, eradication or management of invasive species in Tampa Bay and its watershed
Action revised in 2017 Revision
PUBLIC EDUCATION & INVOLVEMENT
Actions to increase public education and involvement:
PE-1 Promote public involvement in bay restoration and protection
PE-2 Promote public education about key issues affecting Tampa Bay
New action in 2017 Revision
PUBLIC ACCESS
Actions to improve responsible public use of the bay:
PA-1 Reduce human and pet waste in traditional bay recreation areas
Action moved to Public Health Action Plan in 2017 Revision
PA-1 Provide for and manage recreational uses of the bay*
New action in 2017 Revision
CLIMATE CHANGE
Actions to improve the resiliency of bay habitats to climate change:
CC-1 Improve ability of bay habitats to adapt to a changing climate
Action added in 2012 update
CC-2 Understand and address effects of ocean acidification
New action in 2017 Revision
LOCAL IMPLEMENTATION
Actions to incorporate CCMP goals and targets into local land use plans and other planning and development guidance tools:
LI-1 Incorporate CCMP goals and actions in local government comprehensive plans, land development regulations or ordinances*
New action in 2017 Revision
*denotes Priority Action
CHARTING THE COURSE: THE COMPREHENSIVE CONSERVATION AND MANAGEMENT PLAN FOR TAMPA BAY (AUGUST 2017 REVISION)
PAGE 13
Go to: TABLE OF CONTENTS | INDEX OF ACTIONS

WATER AND SEDIMENT QUALITY
WATER QUALITYImplement the nutrient management strategy for Tampa Bay
SW-10 Expand use of green infrastructure practices
SW-8 Expand adoption and implementation of best management practices for commercial and urban agriculture
WW-1 Expand the beneficial use of reclaimed water
WW-2 Extend central sewer service to priority areas now served by septic systems
WW-3 Require standardized monitoring of wastewater discharges
WW-5 Reduce the occurrence of municipal sewer overflows to the bay
BACKGROUND:Controlling nitrogen input into the bay as a means to regain vital seagrass beds has been one of TBEP’s most prominent initiatives. Seagrasses were selected as a metric by which efforts to improve the bay are measured because of their overall importance as a bay habitat and nursery, and because they are an important barometer of water quality.
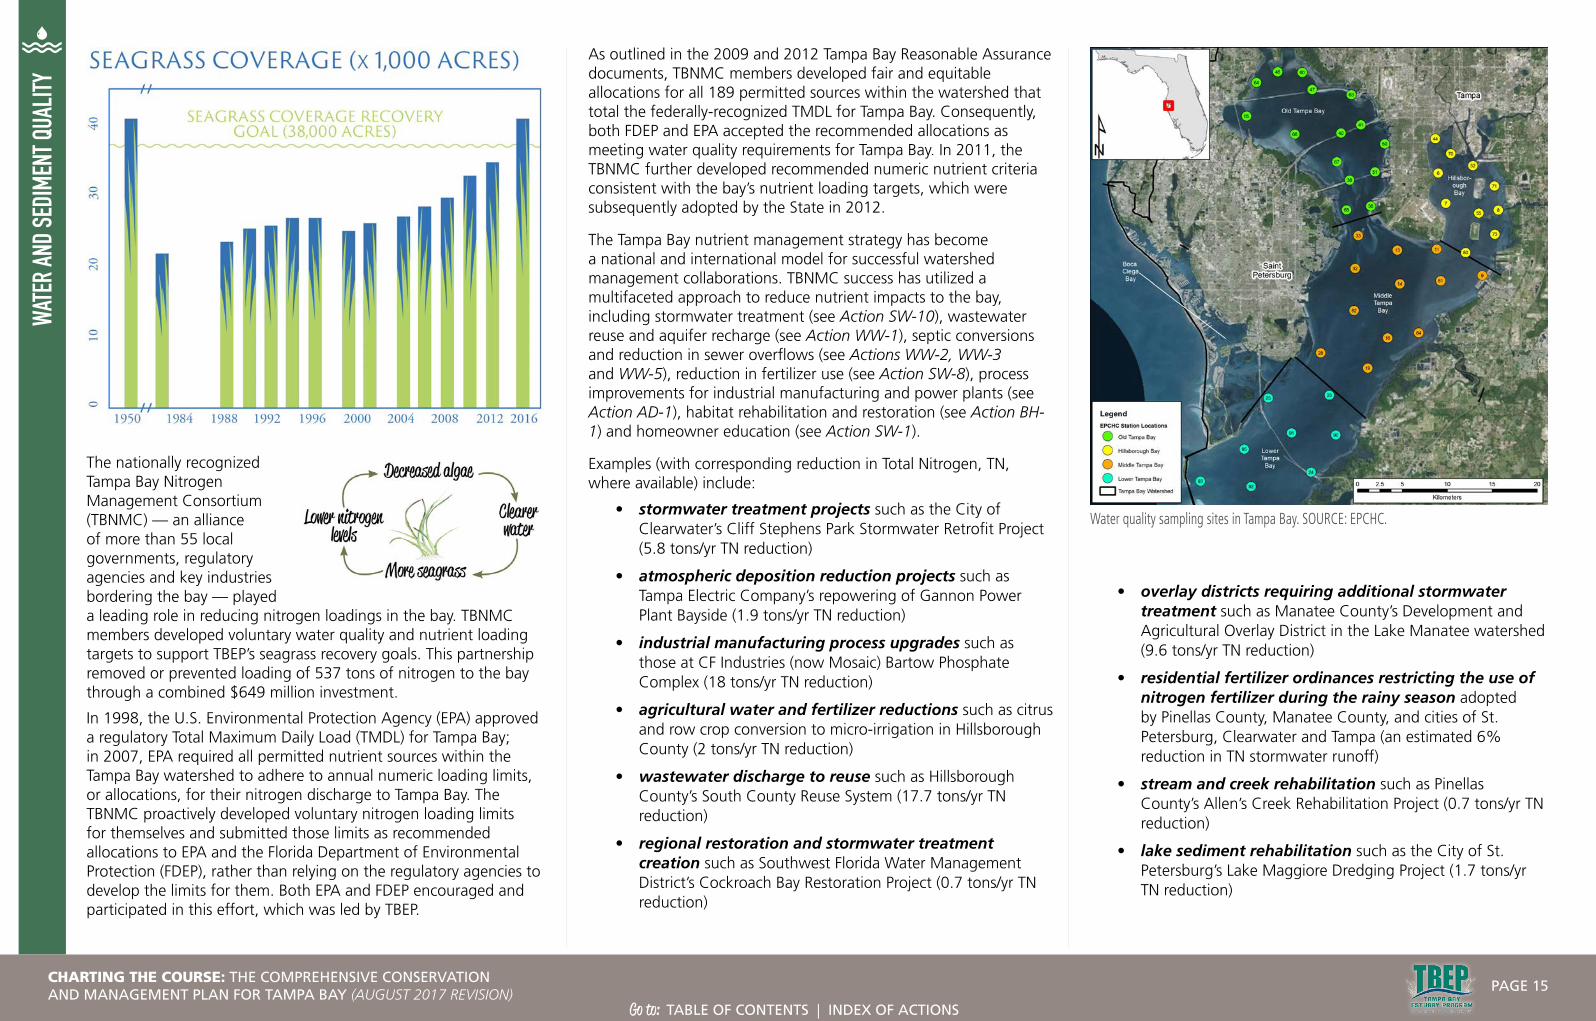
In 1995, TBEP adopted a goal of restoring seagrass to 1950 levels after decades of decline. Reaching this goal required collaboration from local governments, industries, and citizens to reduce nutrients throughout the watershed. By June 2016, more than 500 nitrogen load reduction projects had been implemented, resulting in water clarity equivalent to the 1950s period. In 2017, the bay had 41,655 acres of seagrasses, surpassing the original restoration goal (38,000 acres) by more than 3,600 acres.
At left: Because seagrass requires clear water to flourish, it is a valuable indicator of water quality in Tampa Bay. Photo by Jimmy White.
OBJECTIVES:Continue to implement the nutrient management strategy for Tampa Bay to maintain water quality necessary to support seagrass at or above target levels. Document trends in water quality, and track nutrient reduction and prevention actions within the watershed. Develop and implement nutrient criteria recommendations and management strategies for the bay’s tidal streams.
STATUS: Ongoing. The Tampa Bay Estuary Program (TBEP) continues to maintain the Nitrogen Reduction Action Plan Database and prepare Reasonable Assurance documentation for water quality requirements. TBEP further supported: 1) establishment of estimates for atmospheric deposition to Tampa Bay watershed sub basins and waters, 2) establishment of estimates of nitrogen loading from residential fertilizer and irrigation and corresponding nutrient load reductions associated with fertilizer restrictions and 3) development of numeric nutrient criteria recommendations for Tampa Bay.
RELATED ACTIONS:AD-1 Continue to reduce nitrogen
loading from atmospheric deposition
BH-1 Implement the Tampa Bay Habitat Master Plan
BH-9 Enhance ecosystem values of tidal tributaries
SW-1 Reduce nitrogen runoff from urban landscapes
WQ-1
Water Quality Report Card.Green: Bay segment met chlorophyll and water clarity targets.Blue: Bay segment did not meet one of the targets.Orange: Bay segment did not meet either target.SOURCE: TBEP
YEAROLD TAMPA BAY
HILLS-BOROUGH BAY
MIDDLE TAMPA BAY
LOWER TAMPA BAY
1978
1979
1980
1981
1982
1983
1984
1985
1986
1987
1988
1989
1990
1991
1992
1993
1994
1995
1996
1997
1998
1999
2000
2001
2002
2003
2004
2005
2006
2007
2008
2009
2010
2011
2012
2013
2014
2015
2016
CHARTING THE COURSE: THE COMPREHENSIVE CONSERVATION AND MANAGEMENT PLAN FOR TAMPA BAY (AUGUST 2017 REVISION)
PAGE 14
Go to: TABLE OF CONTENTS | INDEX OF ACTIONS
WATE
R AN
D SE
DIME
NT Q
UALIT
Y
The nationally recognized Tampa Bay Nitrogen Management Consortium (TBNMC) — an alliance of more than 55 local governments, regulatory agencies and key industries bordering the bay — played a leading role in reducing nitrogen loadings in the bay. TBNMC members developed voluntary water quality and nutrient loading targets to support TBEP’s seagrass recovery goals. This partnership removed or prevented loading of 537 tons of nitrogen to the bay through a combined $649 million investment.
In 1998, the U.S. Environmental Protection Agency (EPA) approved a regulatory Total Maximum Daily Load (TMDL) for Tampa Bay; in 2007, EPA required all permitted nutrient sources within the Tampa Bay watershed to adhere to annual numeric loading limits, or allocations, for their nitrogen discharge to Tampa Bay. The TBNMC proactively developed voluntary nitrogen loading limits for themselves and submitted those limits as recommended allocations to EPA and the Florida Department of Environmental Protection (FDEP), rather than relying on the regulatory agencies to develop the limits for them. Both EPA and FDEP encouraged and participated in this effort, which was led by TBEP.
As outlined in the 2009 and 2012 Tampa Bay Reasonable Assurance documents, TBNMC members developed fair and equitable allocations for all 189 permitted sources within the watershed that total the federally-recognized TMDL for Tampa Bay. Consequently, both FDEP and EPA accepted the recommended allocations as meeting water quality requirements for Tampa Bay. In 2011, the TBNMC further developed recommended numeric nutrient criteria consistent with the bay’s nutrient loading targets, which were subsequently adopted by the State in 2012.
The Tampa Bay nutrient management strategy has become a national and international model for successful watershed management collaborations. TBNMC success has utilized a multifaceted approach to reduce nutrient impacts to the bay, including stormwater treatment (see Action SW-10), wastewater reuse and aquifer recharge (see Action WW-1), septic conversions and reduction in sewer overflows (see Actions WW-2, WW-3 and WW-5), reduction in fertilizer use (see Action SW-8), process improvements for industrial manufacturing and power plants (see Action AD-1), habitat rehabilitation and restoration (see Action BH-1) and homeowner education (see Action SW-1).
Examples (with corresponding reduction in Total Nitrogen, TN, where available) include:
• stormwater treatment projects such as the City of Clearwater’s Cliff Stephens Park Stormwater Retrofit Project (5.8 tons/yr TN reduction)
• atmospheric deposition reduction projects such as Tampa Electric Company’s repowering of Gannon Power Plant Bayside (1.9 tons/yr TN reduction)
• industrial manufacturing process upgrades such as those at CF Industries (now Mosaic) Bartow Phosphate Complex (18 tons/yr TN reduction)
• agricultural water and fertilizer reductions such as citrus and row crop conversion to micro-irrigation in Hillsborough County (2 tons/yr TN reduction)
• wastewater discharge to reuse such as Hillsborough County’s South County Reuse System (17.7 tons/yr TN reduction)
• regional restoration and stormwater treatment creation such as Southwest Florida Water Management District’s Cockroach Bay Restoration Project (0.7 tons/yr TN reduction)
• overlay districts requiring additional stormwater treatment such as Manatee County’s Development and Agricultural Overlay District in the Lake Manatee watershed (9.6 tons/yr TN reduction)
• residential fertilizer ordinances restricting the use of nitrogen fertilizer during the rainy season adopted by Pinellas County, Manatee County, and cities of St. Petersburg, Clearwater and Tampa (an estimated 6% reduction in TN stormwater runoff)
• stream and creek rehabilitation such as Pinellas County’s Allen’s Creek Rehabilitation Project (0.7 tons/yr TN reduction)
• lake sediment rehabilitation such as the City of St. Petersburg’s Lake Maggiore Dredging Project (1.7 tons/yr TN reduction)
Water quality sampling sites in Tampa Bay. SOURCE: EPCHC.
CHARTING THE COURSE: THE COMPREHENSIVE CONSERVATION AND MANAGEMENT PLAN FOR TAMPA BAY (AUGUST 2017 REVISION)
PAGE 15
Go to: TABLE OF CONTENTS | INDEX OF ACTIONS

WATE
R AN
D SE
DIME
NT Q
UALIT
Y
SOURCE: TBEP
• point discharge to deep well injection such as Tropicana’s Deep Well Injection Project (11 tons/yr TN reduction)
• education campaigns addressing homeowner actions to reduce stormwater runoff such as UF/IFAS Extension’s Florida Friendly Landscaping™ and TBEP’s Be Floridian campaign.
Periodic assessments of the bay’s condition using nutrient-related metrics are now required by FDEP for TBEP partners and the TBNMC. These reporting requirements include annual water quality reports and 5-year Reasonable Assurance (RA) demonstrations that assure that the Tampa Bay Nutrient Management Strategy continues to meet state and federal water quality requirements. Reporting elements in the RA document include 5-year nitrogen loadings from all sources, compliance assessments with approved allocations, water quality trends in each bay segment, and identification of current and future actions to reduce nutrient loadings to Tampa Bay.1 The next Tampa Bay RA report, which covers the 2012-2016 period, is due to FDEP by December 2017. Additional planned and budgeted projects are expected to reduce TN loading by 62 tons per year.
Efforts to implement a similar nutrient management strategy in Tampa Bay tidal streams are underway (see Action BH-9). Ongoing research includes development of environmental indicators and thresholds of tidal stream health and nursery function to protect wetland systems against nutrient impairment and a management framework for their restoration. This framework establishes proactive metrics that can be utilized by partners to implement watershed restoration actions that can reduce nutrient inputs to tidal streams.
As a follow-up, project partners are proposing to explore the relationship between nutrient dynamics and tidal stream condition, advancing regional knowledge of these important low-salinity habitats, as well as informing and prioritizing management actions that may be needed to protect or enhance the ecology of these systems.
STRATEGY:Activity 1 Continue to assess and report water quality targets
annually. Expand monitoring and reporting to tidal creeks as available resources allow and appropriate water quality indicators are identified (see Action BH-9).
Responsible parties: TBEP (lead), with water quality data from EPCHC, Pinellas County and Manatee County
Timeframe: Ongoing; annual reports are delivered to FDEP and EPA by April 1 each year
Cost and potential funding sources: $ Using TBEP Workplan and CWA Section 320 funds for the annual bay report; $$ for water quality monitoring conducted by EPCHC, Pinellas County and Manatee County
Location: Baywide
Benefit/Performance measure: Annual documentation of attainment of numeric water quality targets in each major bay segment and in tidal creeks where data are available. Public reports to promote understanding of water quality trends to multiple audiences.
Results: Annual assessment of water quality progress and potential problems will allow timely understanding of potential problem areas and promote adaptive management of nutrient management in each bay segment.
Deliverables: Annual reports assessing numeric water quality targets in each major bay segment and tidal creek where data are available. Graphic report of water quality trends for public outreach.
Activity 2 Develop Reasonable Assurance Updates to demonstrate that the Tampa Bay Nutrient Management Strategy is effective at maintaining water quality to support seagrasses. Maintain the Nitrogen Action Plan Database developed by TBEP to effectively track and quantify nitrogen load reduction projects.
Responsible parties: Tampa Bay Nitrogen Screen shot for TBEP Action Plan Database for tracking nitrogen management projects by Nitrogen Management Consortium Partners.
Fertilizer Losses Point Sources Atmospheric Deposition Nonpoint Sources GW & Springs
Fertilizer Losses Industrial Point Sources Domestic Point Sources Atmospheric Deposition Nonpoint Sources GW & Springs
1970s
SOURCES OF NITROGEN LOADING TO TAMPA BAY, 1970s VS. 2010s2010s
CHARTING THE COURSE: THE COMPREHENSIVE CONSERVATION AND MANAGEMENT PLAN FOR TAMPA BAY (AUGUST 2017 REVISION)
PAGE 16
Go to: TABLE OF CONTENTS | INDEX OF ACTIONS

WATE
R AN
D SE
DIME
NT Q
UALIT
YManagement Consortium participants (lead), TBEP (facilitation of the Consortium and maintenance of database)
Timeframe: Ongoing; next Reasonable Assurance document submitted in 2017 and every 5 years thereafter
Cost and potential funding sources: $ Staff time and funds to support Consortium’s technical contractor from TBNMC participants; $ for TBEP database management (CWA Section 320 funds); $$–$$$$ to implement nutrient management projects by local partners.
Location: Baywide
Benefit/Performance measure: Documentation of nutrient loadings and nutrient reductions from projects conducted throughout the Tampa Bay watershed.
Results: Nutrient management projects and programs implemented throughout the watershed will help attain water quality targets and seagrass goals.
Deliverables: 2017 Reasonable Assurance documentation. Updated TBNMC Action Plan database of nitrogen reduction projects.
Activity 3 Further develop and refine effective nutrient management strategies to support ecological function of Tampa Bay tidal tributaries.
Responsible parties: TBEP (in partnership with Sarasota Bay and Charlotte Harbor National Estuary Programs), local government and agency partners
Timeframe: Initiate in 2018, complete within 3 years of initiation
Cost and potential funding sources: $$ grant funds from EPA or other agencies; $ for TBEP staff time (CWA Section 320 funds)
Location: Tidal creeks throughout Tampa Bay
Benefit/Performance measure: Analysis and documentation of nutrient dynamics in Southwest Florida tidal creeks. Prioritized strategies for effective nutrient management to support ecological function of these systems.
Results: Increased protection and management of tidal creeks and the fisheries that depend upon them.
Deliverables: Final report documenting nutrient dynamics and prioritized management strategies for ecological function of tidal creeks.
1 2015 Tampa Bay Nutrient Management Compliance Assessment Results
A scientist measures water clarity using a Secchi disk.
CHARTING THE COURSE: THE COMPREHENSIVE CONSERVATION AND MANAGEMENT PLAN FOR TAMPA BAY (AUGUST 2017 REVISION)
PAGE 17
Go to: TABLE OF CONTENTS | INDEX OF ACTIONS
WATER AND SEDIMENT QUALITY
WATER QUALITYReduce frequency and duration of harmful algal blooms
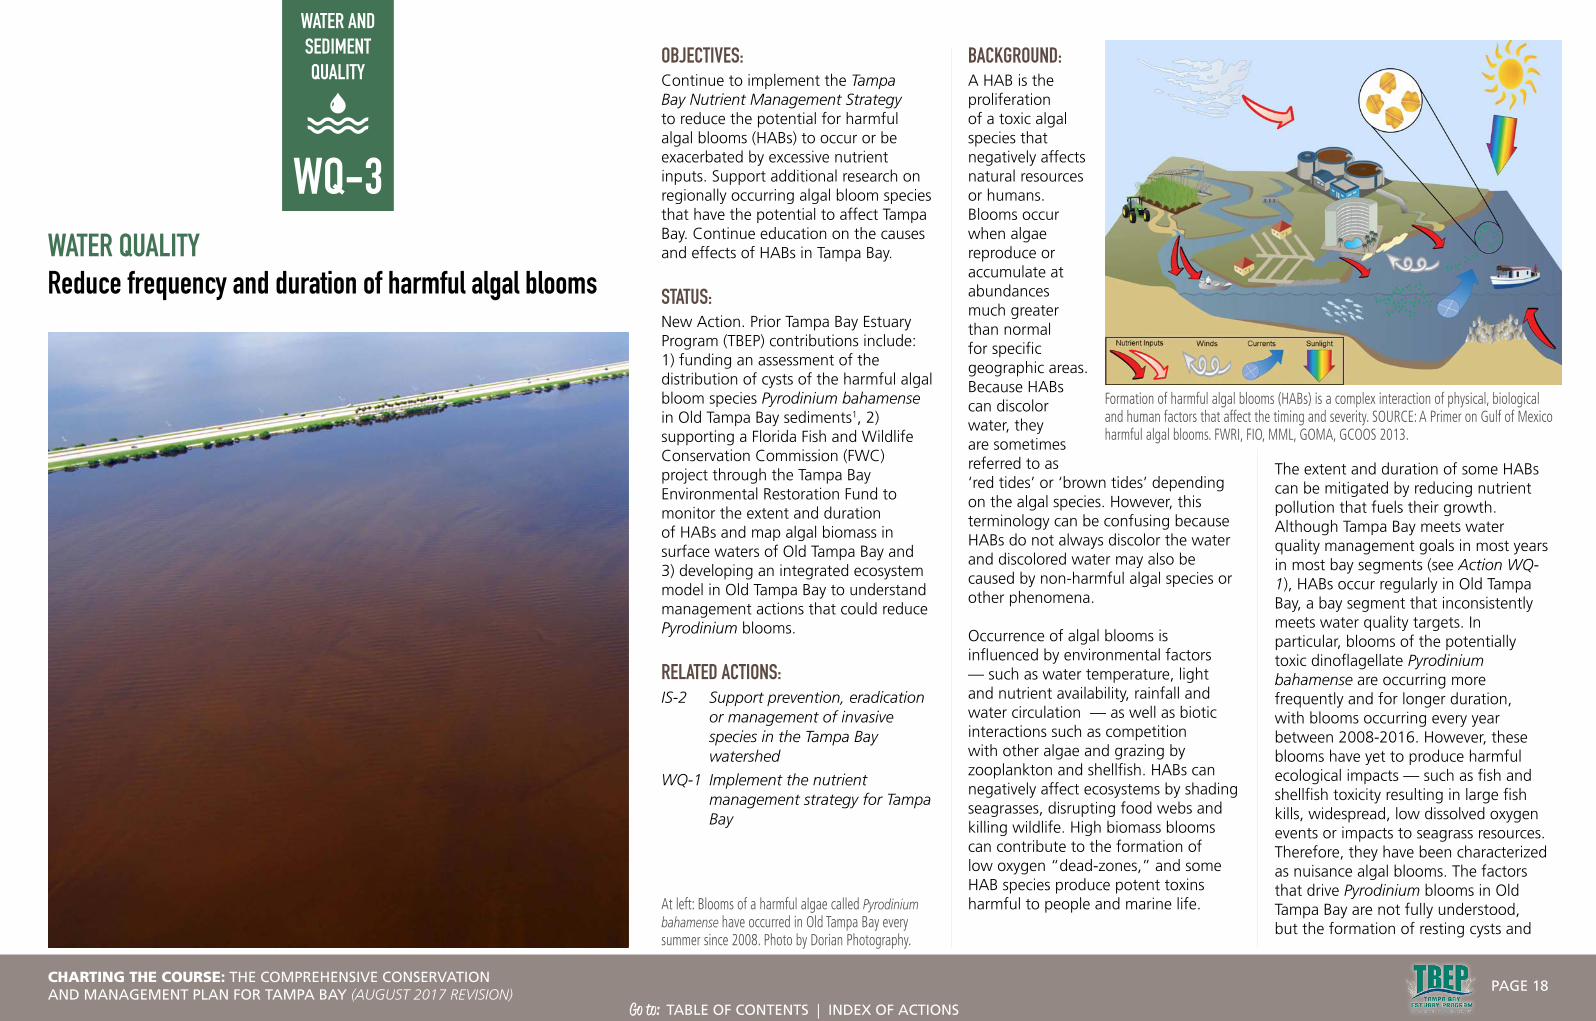
At left: Blooms of a harmful algae called Pyrodinium bahamense have occurred in Old Tampa Bay every summer since 2008. Photo by Dorian Photography.
OBJECTIVES:Continue to implement the Tampa Bay Nutrient Management Strategy to reduce the potential for harmful algal blooms (HABs) to occur or be exacerbated by excessive nutrient inputs. Support additional research on regionally occurring algal bloom species that have the potential to affect Tampa Bay. Continue education on the causes and effects of HABs in Tampa Bay.
STATUS:New Action. Prior Tampa Bay Estuary Program (TBEP) contributions include: 1) funding an assessment of the distribution of cysts of the harmful algal bloom species Pyrodinium bahamense in Old Tampa Bay sediments1, 2) supporting a Florida Fish and Wildlife Conservation Commission (FWC) project through the Tampa Bay Environmental Restoration Fund to monitor the extent and duration of HABs and map algal biomass in surface waters of Old Tampa Bay and 3) developing an integrated ecosystem model in Old Tampa Bay to understand management actions that could reduce Pyrodinium blooms.
RELATED ACTIONS:IS-2 Support prevention, eradication
or management of invasive species in the Tampa Bay watershed
WQ-1 Implement the nutrient management strategy for Tampa Bay
BACKGROUND:A HAB is the proliferation of a toxic algal species that negatively affects natural resources or humans. Blooms occur when algae reproduce or accumulate at abundances much greater than normal for specific geographic areas. Because HABs can discolor water, they are sometimes referred to as ‘red tides’ or ‘brown tides’ depending on the algal species. However, this terminology can be confusing because HABs do not always discolor the water and discolored water may also be caused by non-harmful algal species or other phenomena.
Occurrence of algal blooms is influenced by environmental factors — such as water temperature, light and nutrient availability, rainfall and water circulation — as well as biotic interactions such as competition with other algae and grazing by zooplankton and shellfish. HABs can negatively affect ecosystems by shading seagrasses, disrupting food webs and killing wildlife. High biomass blooms can contribute to the formation of low oxygen “dead-zones,” and some HAB species produce potent toxins harmful to people and marine life.
The extent and duration of some HABs can be mitigated by reducing nutrient pollution that fuels their growth. Although Tampa Bay meets water quality management goals in most years in most bay segments (see Action WQ-1), HABs occur regularly in Old Tampa Bay, a bay segment that inconsistently meets water quality targets. In particular, blooms of the potentially toxic dinoflagellate Pyrodinium bahamense are occurring more frequently and for longer duration, with blooms occurring every year between 2008-2016. However, these blooms have yet to produce harmful ecological impacts — such as fish and shellfish toxicity resulting in large fish kills, widespread, low dissolved oxygen events or impacts to seagrass resources. Therefore, they have been characterized as nuisance algal blooms. The factors that drive Pyrodinium blooms in Old Tampa Bay are not fully understood, but the formation of resting cysts and
WQ-3
Formation of harmful algal blooms (HABs) is a complex interaction of physical, biological and human factors that affect the timing and severity. SOURCE: A Primer on Gulf of Mexico harmful algal blooms. FWRI, FIO, MML, GOMA, GCOOS 2013.
CHARTING THE COURSE: THE COMPREHENSIVE CONSERVATION AND MANAGEMENT PLAN FOR TAMPA BAY (AUGUST 2017 REVISION)
PAGE 18
Go to: TABLE OF CONTENTS | INDEX OF ACTIONS

WATE
R AN
D SE
DIME
NT Q
UALIT
Y
establishment of Pyrodinium resting cyst beds is important for bloom recurrence each year.
The Indian River Lagoon (IRL) on Florida’s east coast provides a cautionary example of the potential environmental and economic consequences of severe algae blooms. Widespread “superblooms” in the lagoon since 2011, fueled in part by large volumes of nutrient-laden runoff, have caused a 60% loss of seagrasses, and unusually high mortality in fish, pelicans and manatees. Residents and tourism-dependent businesses have suffered the loss of key recreational resources for extended periods.
FWC maintains a toll-free Fish Kill Reporting Hotline and online reporting form and, in response to public concern, the Florida Department of Environmental Protection (FDEP) launched a similar toll-free Bloom Reporting Hotline and online reporting form for residents to report algal blooms.
Species associated with HABs in Tampa Bay include:
• Cyanobacteria (also known as blue-green algae), a photosynthetic bacteria nearly ubiquitous in marine and freshwaters. Some but not all cyanobacteria can produce a bright blue-green tint or slimy scum. Similarly, some but not all cyanobacteria are known to produce one or more biotoxins. Extensive blue-green algal blooms occurred in Tampa Bay in the 1970s and 1980s, associated with nutrient pollution
from poorly treated wastewater. Blue-green algal blooms now occur mostly in nutrient-rich freshwater systems such as Lake Thonotosassa. Preemptive measures to help prevent blue-green algal blooms in Tampa Bay focus on maintaining nutrient loading at targets levels (see Action WQ-1).
• Karenia brevis (also known as Florida’s ‘red tide’ alga) is a single-celled dinoflagellate naturally occurring in marine and estuarine waters of Florida. Blooms develop 10-40 miles offshore, and are sometimes brought inshore by currents and winds. Although there is no direct link between coastal nutrient pollution and the initiation, frequency or severity of an offshore red tide bloom, nutrient runoff can help sustain blooms that are transported inshore. Red tide produces neurotoxins (brevetoxins) that can kill fish, seabirds, turtles and marine mammals; cause respiratory distress in people; and accumulate to dangerous levels in shellfish. Presently, there is no practical and acceptable way to control the formation of red tide blooms or remove the resulting toxins from the water.
• Pyrodinium bahamense is also a naturally occurring dinoflagellate. It produces saxitoxins, which can accumulate in shellfish and cause poisoning if the shellfish are consumed. No closures of shellfish harvesting areas have been necessary in Tampa Bay to date, largely because no shellfish harvesting is allowed in Old Tampa Bay where blooms most frequently occur. Pyrodinium forms resting cysts that settle from the water column to sediments, forming a cyst bed to seed future blooms. There were no recorded occurrences of Pyrodinium in the bay between 1983 and 2000. However, blooms have occurred
Life cycle of the dinoflagellate Pyrodinium bahamense. SOURCE: FWC
Distribution of Pyrodinium cysts in Tampa Bay in 2011. SOURCE: Dave Karlen, EPCHC
CHARTING THE COURSE: THE COMPREHENSIVE CONSERVATION AND MANAGEMENT PLAN FOR TAMPA BAY (AUGUST 2017 REVISION)
PAGE 19
Go to: TABLE OF CONTENTS | INDEX OF ACTIONS

WATE
R AN
D SE
DIME
NT Q
UALIT
Yevery summer since 2008. In the future, the intensity, timing and duration of Pyrodinium blooms may be influenced by increasing summer water temperatures, shifting rainfall patterns and corresponding changes in salinity and nutrient inputs. Additional research is needed to understand the factors associated with blooms of Pyrodinium and potential effective management actions.
STRATEGY:Activity 1 Continue to implement the nutrient management
strategy for Tampa Bay to reduce the potential for harmful algal blooms to occur or be exacerbated by nutrient inputs (see Action WQ-1).
Responsible parties: Tampa Bay Nitrogen Management Consortium, TBEP
Timeframe: Ongoing
Cost and potential funding sources: $$$ Local government and industry funds to implement nutrient reduction actions
Location: Baywide
Benefit/Performance measure: Documentation of nutrient loadings and nutrient reductions from projects conducted throughout the watershed.
Results: Nutrient reductions will reduce the potential, extent and duration of harmful algal blooms.
Deliverables: Periodic documentation of nutrient targets, loadings and attainment of water quality standards.
Activity 2 Support additional research on harmful algal bloom species found within the region that are or may emerge as a significant issue in the future (e.g., Pyrodinium bahamense, Pseudo-nitzschia spp., brown tide species such as Aureoumbra lagunensis). Research should include identification of critical factors in bloom development (such as physical circulation, nutrient limitation, rainfall and freshwater pulses, and life cycle dynamics) and understanding of trophic links with zooplankton and fish as well as interactions with drift
algae. Leverage existing hydrodynamic models to better understand the role of circulation in HABs and improve forecasting of spread and extent of algal blooms.
Responsible parties: FWC-FWRI, Mote Marine Laboratory, USF Marine Sciences, FDOH, FDEP, Florida Sea Grant (for research related to HAB impacts on shellfish aquaculture), other academic institutions, TBEP
Timeframe: Ongoing
Cost and potential funding sources: $$ Programmatic funds; grants
Location: Baywide, especially Old Tampa Bay
Benefit/Performance measure: Models of phytoplankton life history and trophic dynamics to help predict, prevent and abate harmful algal blooms.
Results: Better understanding of what causes HABs will result in better management strategies to avoid them.
Deliverables: Research reports documenting relevant trophic and life history dynamics of nuisance algal bloom species relevant to conditions in Tampa Bay.
Activity 3 Continue education about causes and effects of harmful algal blooms in bay waters, focusing on coordinated and timely communications to the public about potential health risks and environmental effects of HABs. Support general boater education and port vessel operations that reduce the potential to import HAB species through ballast or bilge water. Encourage modifications to dredging and dredge disposal activities that reduce potential spread of cysts through dredging and dredge disposal activities (see Action IS-2).
Responsible parties: FWC-FWRI, Mote Marine Laboratory, local health departments (for education and outreach regarding health effects and at-risk populations), TBEP, Port Tampa Bay,
Port Manatee, Port of St. Petersburg (for ballast water issues)
Timeframe: Ongoing
Cost and potential funding sources: $ Programmatic funds; grants
Location: Baywide
Benefit/Performance measure: Educational outreach programs for the public with metrics for engagement and behavior change.
Results: Better public understanding of what causes HABs will result in greater support of and compliance with nutrient reduction and other strategies to prevent or mitigate them.
Deliverables: Educational outreach materials and program metrics.
1 The distribution of Pyrodinium bahamense cysts in Old Tampa Bay sediments. TBEP Technical Report 07-12.
CHARTING THE COURSE: THE COMPREHENSIVE CONSERVATION AND MANAGEMENT PLAN FOR TAMPA BAY (AUGUST 2017 REVISION)
PAGE 20
Go to: TABLE OF CONTENTS | INDEX OF ACTIONS
WATER AND SEDIMENT QUALITY
STORMWATER RUNOFFReduce nitrogen runoff from urban landscapes
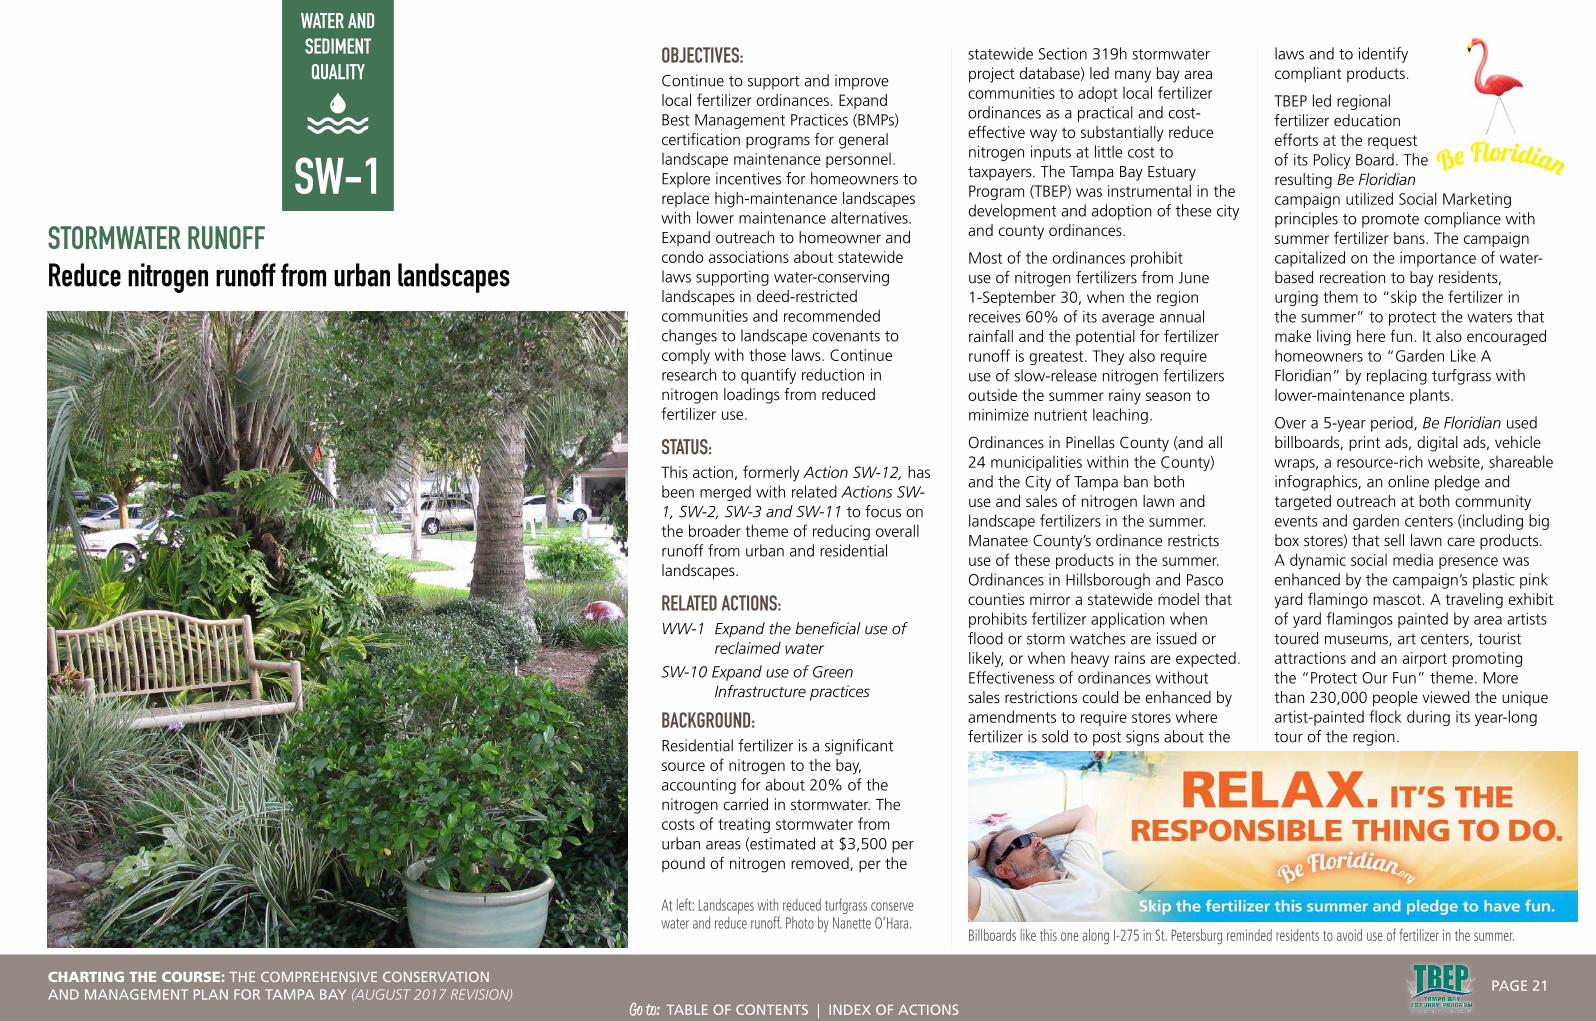
OBJECTIVES: Continue to support and improve local fertilizer ordinances. Expand Best Management Practices (BMPs) certification programs for general landscape maintenance personnel. Explore incentives for homeowners to replace high-maintenance landscapes with lower maintenance alternatives. Expand outreach to homeowner and condo associations about statewide laws supporting water-conserving landscapes in deed-restricted communities and recommended changes to landscape covenants to comply with those laws. Continue research to quantify reduction in nitrogen loadings from reduced fertilizer use.
STATUS: This action, formerly Action SW-12, has been merged with related Actions SW-1, SW-2, SW-3 and SW-11 to focus on the broader theme of reducing overall runoff from urban and residential landscapes.
RELATED ACTIONS:WW-1 Expand the beneficial use of
reclaimed water
SW-10 Expand use of Green Infrastructure practices
BACKGROUND:Residential fertilizer is a significant source of nitrogen to the bay, accounting for about 20% of the nitrogen carried in stormwater. The costs of treating stormwater from urban areas (estimated at $3,500 per pound of nitrogen removed, per the
statewide Section 319h stormwater project database) led many bay area communities to adopt local fertilizer ordinances as a practical and cost-effective way to substantially reduce nitrogen inputs at little cost to taxpayers. The Tampa Bay Estuary Program (TBEP) was instrumental in the development and adoption of these city and county ordinances.
Most of the ordinances prohibit use of nitrogen fertilizers from June 1-September 30, when the region receives 60% of its average annual rainfall and the potential for fertilizer runoff is greatest. They also require use of slow-release nitrogen fertilizers outside the summer rainy season to minimize nutrient leaching.
Ordinances in Pinellas County (and all 24 municipalities within the County) and the City of Tampa ban both use and sales of nitrogen lawn and landscape fertilizers in the summer. Manatee County’s ordinance restricts use of these products in the summer. Ordinances in Hillsborough and Pasco counties mirror a statewide model that prohibits fertilizer application when flood or storm watches are issued or likely, or when heavy rains are expected. Effectiveness of ordinances without sales restrictions could be enhanced by amendments to require stores where fertilizer is sold to post signs about the
laws and to identify compliant products.
TBEP led regional fertilizer education efforts at the request of its Policy Board. The resulting Be Floridian campaign utilized Social Marketing principles to promote compliance with summer fertilizer bans. The campaign capitalized on the importance of water-based recreation to bay residents, urging them to “skip the fertilizer in the summer” to protect the waters that make living here fun. It also encouraged homeowners to “Garden Like A Floridian” by replacing turfgrass with lower-maintenance plants.
Over a 5-year period, Be Floridian used billboards, print ads, digital ads, vehicle wraps, a resource-rich website, shareable infographics, an online pledge and targeted outreach at both community events and garden centers (including big box stores) that sell lawn care products. A dynamic social media presence was enhanced by the campaign’s plastic pink yard flamingo mascot. A traveling exhibit of yard flamingos painted by area artists toured museums, art centers, tourist attractions and an airport promoting the “Protect Our Fun” theme. More than 230,000 people viewed the unique artist-painted flock during its year-long tour of the region.
SW-1
Billboards like this one along I-275 in St. Petersburg reminded residents to avoid use of fertilizer in the summer.
At left: Landscapes with reduced turfgrass conserve water and reduce runoff. Photo by Nanette O’Hara.
CHARTING THE COURSE: THE COMPREHENSIVE CONSERVATION AND MANAGEMENT PLAN FOR TAMPA BAY (AUGUST 2017 REVISION)
PAGE 21
Go to: TABLE OF CONTENTS | INDEX OF ACTIONS
WATE
R AN
D SE
DIME
NT Q
UALIT
YEvaluations of Be Floridian showed that the campaign helped to boost knowledge of and compliance with the fertilizer ordinances. Fewer than 5% of respondents in a 2015 evaluation survey identified summer months as the best time to fertilize lawns, and 63% said they were less likely to use fertilizer in summer because of what they had learned (up from 47% in a 2012 survey). External social science surveys conducted as part of an overall evaluation of fertilizer practices and ordinance awareness also showed widespread awareness that fertilizer should not be applied before a heavy rain. That research also found that Pinellas County residents were more aware of fertilizer ordinances, and applied significantly less fertilizer to their lawns.
A variety of other educational programs continue to reinforce and expand outreach to homeowners, property managers and lawn care professionals. The longstanding Florida Yards & Neighborhoods Program (FY&N) administered by UF/IFAS Extension is delivered locally through county extension offices. The FY&N program promotes Florida-Friendly Landscaping™ to reduce water, fertilizer and pesticide use. Extension specialists also provide Best Management Practices training now required by state law for all commercial fertilizer applicators in Florida.
Additional training for general landscape maintenance personnel on key aspects of lawn care that influence water quality (such as management of grass clippings) is required in Pinellas and Manatee counties. That training is provided by county staff, but potentially could be expanded to additional counties and conducted by Extension specialists if funding were available.
More effort also should be directed to educating landscapers, irrigation contractors, homeowners, homeowner associations and property managers about reducing or eliminating fertilizer use where reclaimed water is used to irrigate lawns,
since reclaimed water contains varying amounts of nutrients depending on source (see Action WW-1).
Hillsborough and Pinellas counties also offer Adopt A Pond programs that teach residents how to improve management of stormwater ponds at the neighborhood level – including creation of vegetated shoreline buffer zones and reduced fertilizer and chemical use on neighborhood lawns that drain to the ponds. A comprehensive social marketing-based program led by UF/IFAS is increasing awareness and action to improve stormwater pond management among residents of the sprawling Lakewood Ranch community in Manatee and Sarasota counties.
Deed-restricted Homeowner Associations (HOAs) continue to be a major barrier to a shift in cultural norms toward less-lawn or no-lawn landscapes that require less water and fertilizer use. These barriers exist despite the passage of state laws allowing Florida-Friendly Landscaping™ in deed-restricted communities to conserve water. Court cases still have not clearly established a precedent that favors this law over HOA covenants, although some HOAs have updated their covenants and plant lists to allow more flexibility and integrate UF/IFAS recommendations for Florida-friendly plants.
Incentives to conserve water and reduce high-maintenance turfgrass also are needed. One promising model is the new “Turf Swap” program in Alachua County. Starting in April 2017, the program will offer cash rebates to property owners that replace irrigated turf with Florida Friendly LandscapingTM.
As of 2017, Pinellas County has a UF/IFAS Extension specialist dedicated to working with HOAs, condo associations and property managers. Pasco County’s FY&N coordinator also has had success in working with HOAs, and all the FY&N county programs consistently provide high-quality training and free assistance to homeowners across their geographic and demographic spectrums. Future efforts to reduce nitrogen from urban landscapes in the Tampa Bay watershed must focus on reaching and recruiting these key audiences.
Additional research is needed to quantify the impact of fertilizer ordinances on water quality over time, and to improve ordinance compliance. A study coordinated by TBEP1 found that a minimum of 5-6 years of monitoring is needed to test for statistically significant differences in environmental data collected from Tampa Bay residential communities with different fertilizer ordinances.
STRATEGY:Activity 1 Support and improve local ordinances addressing use
of lawn/landscape fertilizers. Explore potential for requiring retail signage where not already required by local ordinances. Monitor state legislation that may impact local implementation of ordinances.
Responsible parties: Hillsborough, Manatee, Pasco, Pinellas, Tampa, Clearwater and St. Petersburg (Leads for local ordinance implementation)
Timeframe: Initiate in 2018
Cost and potential funding sources: $ Staff time only
Location: Baywide
Benefit/Performance measure: Adoption of retail signage requirements for fertilizer ordinances throughout the region
Results: Greater awareness of local ordinance restrictions, leading to increased use of ordinance-compliant products and reduced fertilizer use overall.
Deliverables: Adoption of signage requirements through new or amended ordinances.
Pinellas County installed wraps on several fleet vehicles to promote pollution prevention.
State law requires all lawn care professionals who apply fertilizer to be certified and display this decal on company vehicles.
The Be Floridian pledge asked homeowners to commit to skip fertilizing lawns in the summer.
CHARTING THE COURSE: THE COMPREHENSIVE CONSERVATION AND MANAGEMENT PLAN FOR TAMPA BAY (AUGUST 2017 REVISION)
PAGE 22
Go to: TABLE OF CONTENTS | INDEX OF ACTIONS

WATE
R AN
D SE
DIME
NT Q
UALIT
YActivity 2 Support continued public education about proper
fertilizer use and irrigation practices, Florida-Friendly Landscaping™ and other watershed protection principles. Support regional water conservation plans and outreach and incentive programs to encourage efficient irrigation practices. Increase efforts to inform HOAs and condominium associations about laws regarding Florida Friendly Landscaping™ and its benefits. Develop incentives for homeowners to replace turfgrass with low-maintenance Florida-friendly alternatives.
Responsible parties: TBEP, UF/IFAS Extension, city/county stormwater programs, Southwest Florida Water Management District, Tampa Bay Water
Timeframe: Ongoing
Cost and potential funding sources: $$ CWA Section 320 funds for TBEP staff time; other programs supported by local governments, SWFWMD, Tampa Bay Water
Location: Baywide
Benefit/Performance measure: Number of homeowners complying with fertilizer ordinances; number of landscape professionals certified in Best Management Practices (BMPs); compliance rate for retail stores in communities with store inspections. Number of communities participating in Adopt A Pond programs.
Results: Better information for developing and prioritizing strategies for reducing and removing nutrient load and contamination from the watershed.
Deliverables: Annual reports from enforcement and education programs.
Activity 3 Explore support for expanding BMPs certification programs for general landscape maintenance personnel to additional counties.
Responsible parties: FDEP; UF/IFAS; local counties
Timeframe: Initiate in 2017
Cost and potential funding sources: $$–$$$ State or federal funds, such as 319 grants to reduce
stormwater pollution and support BMPs
Location: Baywide
Benefit/Performance measure: Additional landscape professionals trained in IFAS-recommended BMPs.
Results: Reduced nitrogen loading from residential landscapes.
Deliverables: BMP training programs for landscape maintenance professionals throughout the bay watershed.
Activity 4 Continue research to quantify reduction in nitrogen loadings from reduced fertilizer use. Investigate sources, contributions and fate of nitrogen from urban landscapes.
Responsible parties: UF, UCF, USF or other academic institutions, local cities and counties, FDEP, TBEP
Timeframe: Ongoing
Cost and potential funding sources: $$–$$$
Location: Baywide
Benefit/Performance measure: Quantification of the relative importance of residential fertilizer inputs to urban stormwater loads.
Results: Improvements to local ordinances and statewide BMP programs for homeowners, HOAs and lawn care professionals.
Deliverables: Technical reports or peer-reviewed scientific journal articles.
1 Listopad, C., Souto, L. and Bohlen, P. 2015. Tampa Bay Residential Stormwater Evaluation: Final Project Report. Tampa Bay Estuary Program Technical Publication #02-15.
CHARTING THE COURSE: THE COMPREHENSIVE CONSERVATION AND MANAGEMENT PLAN FOR TAMPA BAY (AUGUST 2017 REVISION)
PAGE 23
Go to: TABLE OF CONTENTS | INDEX OF ACTIONS
WATER AND SEDIMENT QUALITY
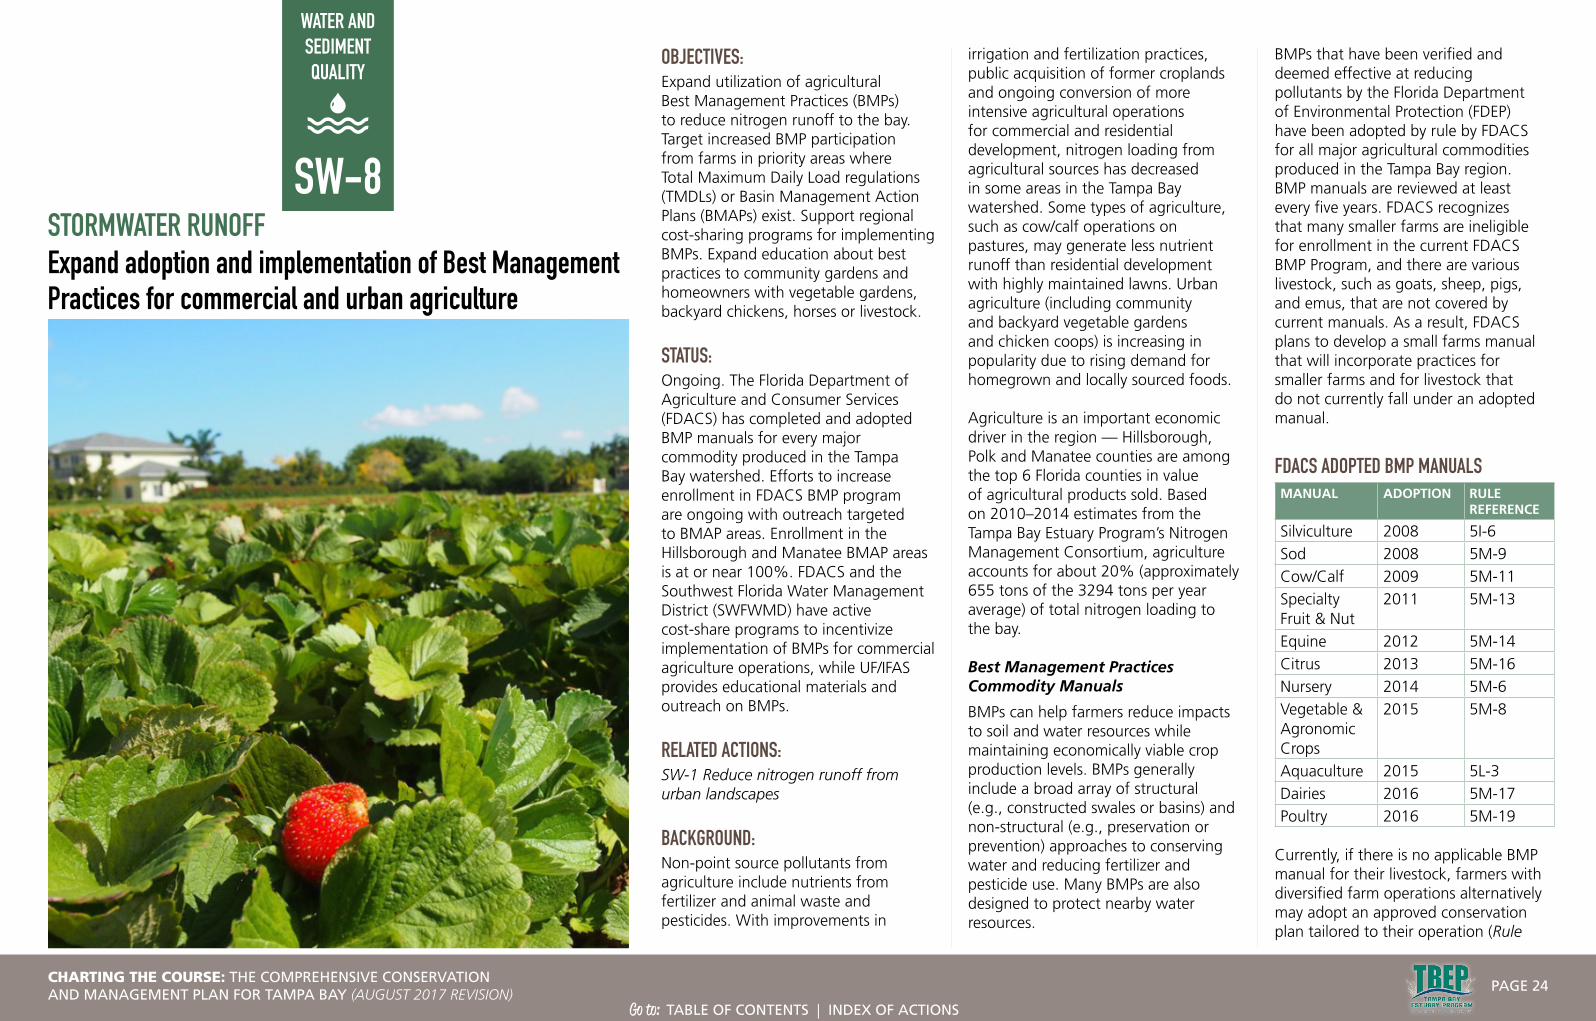
STORMWATER RUNOFFExpand adoption and implementation of Best Management Practices for commercial and urban agriculture
OBJECTIVES: Expand utilization of agricultural Best Management Practices (BMPs) to reduce nitrogen runoff to the bay. Target increased BMP participation from farms in priority areas where Total Maximum Daily Load regulations (TMDLs) or Basin Management Action Plans (BMAPs) exist. Support regional cost-sharing programs for implementing BMPs. Expand education about best practices to community gardens and homeowners with vegetable gardens, backyard chickens, horses or livestock.
STATUS: Ongoing. The Florida Department of Agriculture and Consumer Services (FDACS) has completed and adopted BMP manuals for every major commodity produced in the Tampa Bay watershed. Efforts to increase enrollment in FDACS BMP program are ongoing with outreach targeted to BMAP areas. Enrollment in the Hillsborough and Manatee BMAP areas is at or near 100%. FDACS and the Southwest Florida Water Management District (SWFWMD) have active cost-share programs to incentivize implementation of BMPs for commercial agriculture operations, while UF/IFAS provides educational materials and outreach on BMPs.
RELATED ACTIONS:SW-1 Reduce nitrogen runoff from urban landscapes
BACKGROUND:Non-point source pollutants from agriculture include nutrients from fertilizer and animal waste and pesticides. With improvements in
irrigation and fertilization practices, public acquisition of former croplands and ongoing conversion of more intensive agricultural operations for commercial and residential development, nitrogen loading from agricultural sources has decreased in some areas in the Tampa Bay watershed. Some types of agriculture, such as cow/calf operations on pastures, may generate less nutrient runoff than residential development with highly maintained lawns. Urban agriculture (including community and backyard vegetable gardens and chicken coops) is increasing in popularity due to rising demand for homegrown and locally sourced foods.
Agriculture is an important economic driver in the region — Hillsborough, Polk and Manatee counties are among the top 6 Florida counties in value of agricultural products sold. Based on 2010–2014 estimates from the Tampa Bay Estuary Program’s Nitrogen Management Consortium, agriculture accounts for about 20% (approximately 655 tons of the 3294 tons per year average) of total nitrogen loading to the bay.
Best Management Practices Commodity Manuals
BMPs can help farmers reduce impacts to soil and water resources while maintaining economically viable crop production levels. BMPs generally include a broad array of structural (e.g., constructed swales or basins) and non-structural (e.g., preservation or prevention) approaches to conserving water and reducing fertilizer and pesticide use. Many BMPs are also designed to protect nearby water resources.
BMPs that have been verified and deemed effective at reducing pollutants by the Florida Department of Environmental Protection (FDEP) have been adopted by rule by FDACS for all major agricultural commodities produced in the Tampa Bay region. BMP manuals are reviewed at least every five years. FDACS recognizes that many smaller farms are ineligible for enrollment in the current FDACS BMP Program, and there are various livestock, such as goats, sheep, pigs, and emus, that are not covered by current manuals. As a result, FDACS plans to develop a small farms manual that will incorporate practices for smaller farms and for livestock that do not currently fall under an adopted manual.
FDACS ADOPTED BMP MANUALSMANUAL ADOPTION RULE
REFERENCE
Silviculture 2008 5I-6Sod 2008 5M-9Cow/Calf 2009 5M-11Specialty Fruit & Nut
2011 5M-13
Equine 2012 5M-14Citrus 2013 5M-16Nursery 2014 5M-6Vegetable & Agronomic Crops
2015 5M-8
Aquaculture 2015 5L-3Dairies 2016 5M-17Poultry 2016 5M-19
Currently, if there is no applicable BMP manual for their livestock, farmers with diversified farm operations alternatively may adopt an approved conservation plan tailored to their operation (Rule
SW-8
CHARTING THE COURSE: THE COMPREHENSIVE CONSERVATION AND MANAGEMENT PLAN FOR TAMPA BAY (AUGUST 2017 REVISION)
PAGE 24
Go to: TABLE OF CONTENTS | INDEX OF ACTIONS

WATE
R AN
D SE
DIME
NT Q
UALIT
Y5M-12 Conservation Plans for Specified Agricultural Operations). Notably, facilities with large numbers of livestock in a confined area, known as animal feeding operations (AFOs) and concentrated animal feeding operations (CAFOs), are not regulated by FDACS. Instead, FDEP regulates AFOs under its industrial wastewater rules and CAFOs under its NPDES program. Hobby farmers are not currently enrolled in the FDACS BMP Program; however, FDACS plans to develop and adopt manuals for these operations.
Appropriate BMPs are encouraged through technical and financial assistance and a streamlined regulatory process. Farmers who implement FDACS-adopted BMPs benefit from a presumption of compliance with state water quality standards for pollutants that the BMPs address. Farming operations in BMAP areas are required to implement FDACS-adopted BMPs, otherwise they must conduct prescribed water quality monitoring that is approved by FDEP or Southwest Florida Water Management District (SWFWMD) to demonstrate compliance with water quality standards. FDACS prioritizes outreach to commercial operators within BMAP areas. Producers who enroll in the FDACS BMP Program benefit from a presumption of compliance regardless of whether they are located within an adopted BMAP boundary.
Cost-Sharing Incentives for Participation
FDACS and SWFWMD incentivize adoption of BMPs through partnerships, such as the Facilitating Agricultural Resource Management Systems (FARMS) program that make it more feasible for farmers to implement new technologies.
• The mini-FARMS program is a partnership of FDACS and SWFWMD that provides small farmers (less than 100 irrigated acres) reimbursement for 75% of the cost (up to $5000) to implement water conserving BMP projects. Farmers must be enrolled in the FDACS BMP Program to be eligible for mini-FARMS grants. SWFWMD offers the FARMS cost-share program for any farm located in the SWFWMD.
• The Florida Farm Bureau County Alliance for Responsible Environmental Stewardship (CARES) program publicly recognizes farmers and ranchers that are enrolled with the FDACS BMP Program and remain in good standing with the FDACS Implementation Assurance Program. Producers
receive a certificate and a “This Farm CARES” sign to place at their farm gate.
Assuring BMP Compliance
In 2014, FDACS’ Office of Agricultural Water Policy (OAWP) adopted a standardized statewide Implementation and Assurance Program consistent across all regions, commodities and BMP manuals. The program consists of two key components: mail-out surveys and site visits. Mail-out surveys are commodity specific and rotate between commodities year-to-year. The surveys contain a series of questions about management actions that correspond to the targeted BMPs for that commodity. Site visits utilize a standard form with inspections of BMP compliance for nutrient management, irrigation management and water resource protection. In 2014, site visits to 267 operations in 42 counties (including Manatee and Hillsborough) showed 55%
ESTIMATED ACRES OF AGRICULTURAL LAND IN THE TAMPA BAY ESTUARY AS MAPPED BY SWFWMD AND LANDS ENROLLED IN FDACS BMP PROGRAMS FOR SPECIFIC COMMODITIES.NOTE: Enrollment acreage may exceed mapped land use acreage due to changes in land use since 2011. Conversely, mapped land use acreage may exceed enrolled acreage even at 100% enrollment, as not all acreage is eligible for BMP enrollment (e.g., buildings, parking lots, fallow acres or non-commercial operations). AGRICULTURAL LAND USE AND BMP ENROLLMENT WITHIN THE TAMPA BAY ESTUARY PROGRAM AREA2011 SWFWMD Land Use 2011 Acres Related FDACS BMP Programs 2016 Acreage
Enrolled
Pasture and Mixed Rangeland
161,856.8
Cow/Calf 75,107.5 Sod 2,574.4 Vegetable/Agronomic Crops (Hay)
48,753.6 Row/Field/Mixed Crops
42,861.7 Vegetable/Agronomic Crops
Tree Crops
25,743.5 Citrus 15,083.4 Specialty Fruit & Nut 1,277.5
Nurseries and Vineyards
11,084.7 Statewide Nurseries 2,887.2
Specialty Farms 2,384.5
Equine 119.1
Conservation Plan Rule - Feeding Operations
1,503.3
Other Open Lands – Rural
50,436.5 No enrollment needed N/A
Aquaculture - Tropical Fish Farms 1,215.0 Aquaculture Certification Program
Totals 297,086.0 145,802.7 SOURCE: FDACS
needing improvement on one or more BMPs. In 2016, the OAWP revised the program per the new State Water Law.
A 2016 map analysis comparing 2011 SWFWMD land use to FDACS BMP Program enrollment within the Tampa Bay watershed shows approximately 49% of lands identified as agricultural use are enrolled1. Within the three BMAP areas (Alafia River, Hillsborough River and Manatee River drainage areas), approximately 81% of mapped agricultural lands are enrolled, while approximately 47% of mapped agricultural lands outside BMAP areas are in the program. According to the land use maps, most identified commercial agricultural operations in the Manatee River Basin BMAP and the Hillsborough River Basin BMAP have enrolled in BMPs, while approximately 53% of identified agricultural lands in the Alafia River Basin BMAP are enrolled. Continued expansion of enrollees is anticipated as they are identified in the future.
Participants in the County Alliance for Responsible Environmental Stewardship program receive this sign to post at their farm gate.
CHARTING THE COURSE: THE COMPREHENSIVE CONSERVATION AND MANAGEMENT PLAN FOR TAMPA BAY (AUGUST 2017 REVISION)
PAGE 25
Go to: TABLE OF CONTENTS | INDEX OF ACTIONS

WATE
R AN
D SE
DIME
NT Q
UALIT
YEducation for Urban and Backyard Growers
UF/IFAS Extension Agents provide outreach to both commercial and non-commercial operators to encourage BMP adoption. Outreach to rural hobby operators (e.g., horse boarding facilities, alpaca ranches, rabbit breeding operations), especially with property adjacent to waterways, should be a focus. In addition, education should be extended to urban farmers with a greater potential to contribute pollution to stormwater runoff, including community gardens, backyard gardens and chicken coops.
With the growing popularity and interest among urban homeowners in backyard chicken coops, Pinellas County (and five of its municipalities), the City of Tampa, Polk County, and Manatee County have adopted backyard chicken ordinances. Some ordinances have setback requirements for the coop, which can help minimize stormwater pollution from waste. UF/IFAS is developing a Backyard Poultry 101 Workshop for Small Farms Agents in several counties, which will likely include recommendations for managing waste.
STRATEGY:Activity 1 Expand utilization
of agricultural Best Management Practices (BMPs) to reduce nitrogen and other pollution to the bay. Encourage development of new BMPs for emerging agricultural commodities that have the potential to contribute nutrient or pesticide runoff to the bay.
Responsible parties: FDACS, FDEP, SWFWMD, UF/IFAS
Timeframe: Ongoing
Cost and potential funding sources: $$ FDACS
Location: Baywide, with emphasis on existing BMAP areas
Benefit/Performance measure: Increased enrollment in BMP Program among applicable operations, including row crops and other low-participation commodities. Increased adoption of
BMPs among non-commercial hobby farmers in rural and urban areas.
Results: Reduction in nitrogen loading and pesticide runoff to the bay from agriculture.
Deliverables: Regularly updated FDACS-OAWP enrollment data and compliance reporting from outreach and Implementation and Assurance Program site visits.
Activity 2 Using information from FDACS, FDEP, SWFWMD and UF/IFAS, identify and map BMP practitioners in the watershed to better understand and estimate nitrogen loading from agricultural operations. Identify gaps in BMP participation where TMDLs or BMAPs exist, and target those areas for increased enrollment.
Responsible parties: FDACS for updating maps and enrolling new operations, FDEP, SWFWMD, UF/IFAS for identifying potential new enrollees; TBEP for estimates of nitrogen loadings
Timeframe: 2017
Cost and potential funding sources: $ FDACS
Location: Baywide, with emphasis on existing BMAP areas
Benefit/Performance measure: Spatial analysis to identify gaps in BMP participation and a strategy for targeting operators in those areas.
Results: Potential load reduction credits that could address TMDL and BMAP goals for reducing nitrogen from agricultural operations.
Deliverables: Regularly updated maps and data of participation in BMPs in the watershed with focus on BMAP areas.
Activity 3 Support regional cost-sharing programs for implementing BMPs, including SWFWMD’s FARMS and mini-FARMS, and FDACS cost-sharing programs.
Responsible parties: SWFWMD, FDACS
Timeframe: Ongoing
Cost and potential funding sources: $ SWFWMD
Location: Baywide, with emphasis on existing BMAP areas
Benefit/Performance measure: Increased utilization of BMP improvements on commercial farms.
Results: Reduced nutrient pollution from agricultural operations entering Tampa Bay.
Deliverables: Progress report on number of cost-share projects implemented and types of BMPs implemented in the Tampa Bay watershed.
Activity 4 Expand education and outreach about BMPs to hobby and small livestock operations, community gardens and homeowners with vegetable gardens and backyard chickens or other livestock.
Responsible parties: UF/IFAS Extension programs (Extension staff, as well as Master Gardener and 4H programs)
Nearly one-half of all agricultural land in Florida is involved in cattle production, like this ranch in Manatee County.
CHARTING THE COURSE: THE COMPREHENSIVE CONSERVATION AND MANAGEMENT PLAN FOR TAMPA BAY (AUGUST 2017 REVISION)
PAGE 26
Go to: TABLE OF CONTENTS | INDEX OF ACTIONS

WATE
R AN
D SE
DIME
NT Q
UALIT
YTimeframe: Ongoing
Cost and potential funding sources: $ UF/IFAS
Location: Baywide
Benefit/Performance measure: Increased adoption of BMPs for nutrient management among community gardens, homeowners and other non-commercial operations.
Results: Reductions in nitrogen loading to the bay from hobby and small farm agriculture.
Deliverables: Education and outreach materials on nutrient management targeted to urban community gardens and homeowners with backyard gardens and chicken coops. Outreach and education on waste management targeted to rural hobbyists with horses and other livestock.
CHARTING THE COURSE: THE COMPREHENSIVE CONSERVATION AND MANAGEMENT PLAN FOR TAMPA BAY (AUGUST 2017 REVISION)
PAGE 27
Go to: TABLE OF CONTENTS | INDEX OF ACTIONS

WATER AND SEDIMENT QUALITY
extensive networks of gutters, ditches, canals and pipes. This management approach often resulted in polluted waterways, impacts to fish, wildlife and habitats and loss of economic and recreational opportunities that depend on healthy waters.
Florida Law requires that all new and redevelopment projects manage the first inch of rainfall onsite rather than discharging to storm drains. The Florida Department of Environmental Protection (FDEP) and the Southwest Florida Water Management District (SWFWMD) have determined that Environmental Resource Permit (ERP) applicants for new construction discharges in the Tampa Bay watershed must meet more stringent standards by demonstrating net improvement (i.e., no degradation) to waterways, because Tampa Bay is not meeting all water quality standards in all areas of the bay.
Communities across Florida are now replacing outdated stormwater management systems with more innovative ones that can simultaneously reduce flooding while protecting the natural environment. These practices may also advance beneficial uses of reclaimed water (see Action WW-1) and comprehensive management of water resources within the watershed.
Green Infrastructure practices (also known as Low Impact Development or Low Impact Design) reduce and treat stormwater
STORMWATER RUNOFFExpand use of Green Infrastructure practices
Green Infrastructure is an approach to water management that protects, restores, or mimics the natural water cycle. Green Infrastructure reduces and treats stormwater at its source while delivering environmental, social, and economic benefits.
OBJECTIVES:Promote expanded use of Green Infrastructure practices to prevent and reduce nitrogen pollution. Promote development and delivery of tools and incentives to expand low impact/green infrastructure implementation, including: professional training; compatibility reviews of local government development codes and comprehensive plans; and demonstration sites. Encourage Tampa Bay Estuary Program (TBEP) partners to submit local projects that implement innovative building or site design techniques to the Action Plan Database of the Tampa Bay Nitrogen Management Consortium. Encourage adoption and implementation of regional policies facilitating low impact/green infrastructure development.
STATUS: Revised from previous SW-10 Design and Implement a Low Impact Development Strategy.
RELATED ACTIONS:WW-1 Expand the beneficial use of
reclaimed water
BH-6 Encourage habitat enhancement along altered waterfront properties
BACKGROUND:Historically, stormwater management in Florida focused on rapidly removing rainwater from the built environment to avoid flooding. High volumes of polluted runoff were routed to the nearest receiving water body through
at its source, minimizing the volume of water and pollution discharged from the built environment. At the city or county scale, Green Infrastructure is a patchwork of natural areas that provides habitat, flood protection, cleaner air and cleaner water. At the neighborhood or site scale, green stormwater management systems mimic nature by soaking up and storing water, thereby reducing flow of pollutants to water bodies.
EXAMPLES OF GREEN INFRASTRUCTURE TECHNIQUES:• Pervious surfaces for parking
areas, walkways and drives can reduce runoff from small rain events, allowing gradual infiltration into underlying soils. Pervious surfaces include pavers, bricks, gravel, shell and porous concretes.
• Retention areas like rain gardens, vegetated swales and recessed tree islands are small depressions designed to capture runoff and allow it to evaporate or percolate into the ground. Associated vegetation can take up water and nutrients.
• Vegetative buffers and littoral zones around shorelines, ponds and waterways can filter pollutants and litter from runoff before it enters a waterbody. Specifically, biological communities (including bacteria) provide valuable nutrient removal services. Harvestable floating vegetated islands can increase the effective area over which plants can remove nutrient pollution from conventional detention ponds (see Action BH-6).
SW-10
At left: The Straz Center for the Performing Arts was the first building in Tampa with a green roof. It is located on the second level of Ferguson Hall. Photo courtesy Straz Center
CHARTING THE COURSE: THE COMPREHENSIVE CONSERVATION AND MANAGEMENT PLAN FOR TAMPA BAY (AUGUST 2017 REVISION)
PAGE 28
Go to: TABLE OF CONTENTS | INDEX OF ACTIONS
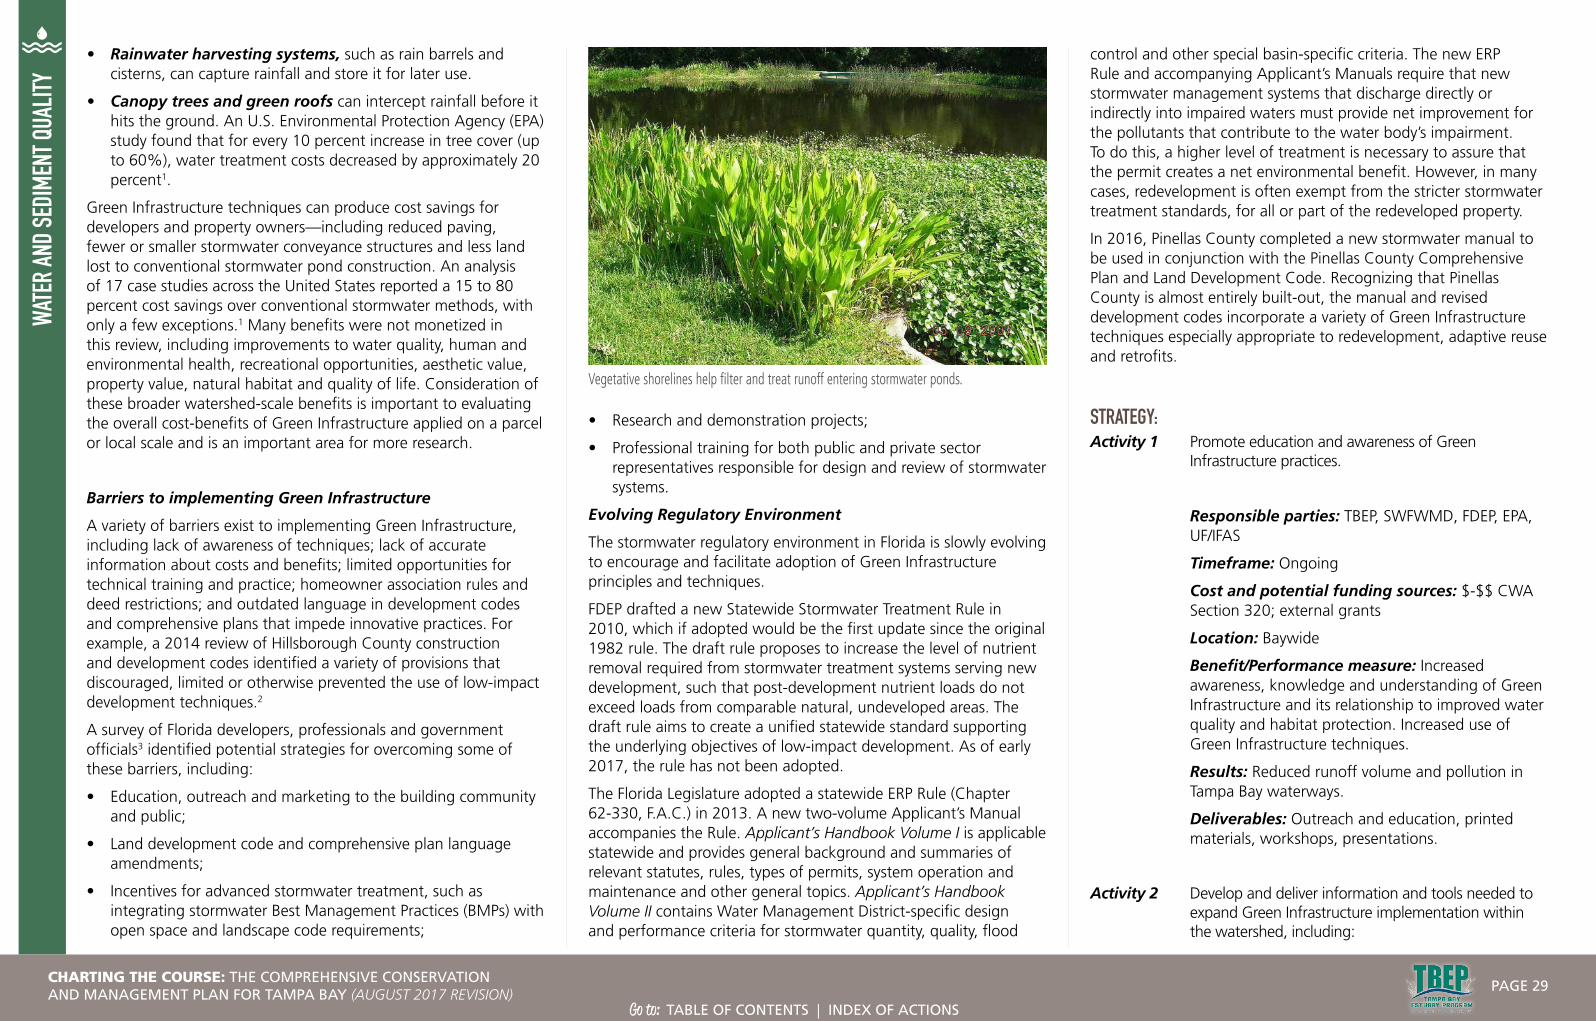
WATE
R AN
D SE
DIME
NT Q
UALIT
Y• Rainwater harvesting systems, such as rain barrels and
cisterns, can capture rainfall and store it for later use.
• Canopy trees and green roofs can intercept rainfall before it hits the ground. An U.S. Environmental Protection Agency (EPA) study found that for every 10 percent increase in tree cover (up to 60%), water treatment costs decreased by approximately 20 percent1.
Green Infrastructure techniques can produce cost savings for developers and property owners —including reduced paving, fewer or smaller stormwater conveyance structures and less land lost to conventional stormwater pond construction. An analysis of 17 case studies across the United States reported a 15 to 80 percent cost savings over conventional stormwater methods, with only a few exceptions.1 Many benefits were not monetized in this review, including improvements to water quality, human and environmental health, recreational opportunities, aesthetic value, property value, natural habitat and quality of life. Consideration of these broader watershed-scale benefits is important to evaluating the overall cost-benefits of Green Infrastructure applied on a parcel or local scale and is an important area for more research.
Barriers to implementing Green Infrastructure
A variety of barriers exist to implementing Green Infrastructure, including lack of awareness of techniques; lack of accurate information about costs and benefits; limited opportunities for technical training and practice; homeowner association rules and deed restrictions; and outdated language in development codes and comprehensive plans that impede innovative practices. For example, a 2014 review of Hillsborough County construction and development codes identified a variety of provisions that discouraged, limited or otherwise prevented the use of low-impact development techniques.2
A survey of Florida developers, professionals and government officials3 identified potential strategies for overcoming some of these barriers, including:
• Education, outreach and marketing to the building community and public;
• Land development code and comprehensive plan language amendments;
• Incentives for advanced stormwater treatment, such as integrating stormwater Best Management Practices (BMPs) with open space and landscape code requirements;
• Research and demonstration projects;
• Professional training for both public and private sector representatives responsible for design and review of stormwater systems.
Evolving Regulatory Environment
The stormwater regulatory environment in Florida is slowly evolving to encourage and facilitate adoption of Green Infrastructure principles and techniques.
FDEP drafted a new Statewide Stormwater Treatment Rule in 2010, which if adopted would be the first update since the original 1982 rule. The draft rule proposes to increase the level of nutrient removal required from stormwater treatment systems serving new development, such that post-development nutrient loads do not exceed loads from comparable natural, undeveloped areas. The draft rule aims to create a unified statewide standard supporting the underlying objectives of low-impact development. As of early 2017, the rule has not been adopted.
The Florida Legislature adopted a statewide ERP Rule (Chapter 62-330, F.A.C.) in 2013. A new two-volume Applicant’s Manual accompanies the Rule. Applicant’s Handbook Volume I is applicable statewide and provides general background and summaries of relevant statutes, rules, types of permits, system operation and maintenance and other general topics. Applicant’s Handbook Volume II contains Water Management District-specific design and performance criteria for stormwater quantity, quality, flood
control and other special basin-specific criteria. The new ERP Rule and accompanying Applicant’s Manuals require that new stormwater management systems that discharge directly or indirectly into impaired waters must provide net improvement for the pollutants that contribute to the water body’s impairment. To do this, a higher level of treatment is necessary to assure that the permit creates a net environmental benefit. However, in many cases, redevelopment is often exempt from the stricter stormwater treatment standards, for all or part of the redeveloped property.
In 2016, Pinellas County completed a new stormwater manual to be used in conjunction with the Pinellas County Comprehensive Plan and Land Development Code. Recognizing that Pinellas County is almost entirely built-out, the manual and revised development codes incorporate a variety of Green Infrastructure techniques especially appropriate to redevelopment, adaptive reuse and retrofits.
STRATEGY:Activity 1 Promote education and awareness of Green
Infrastructure practices.
Responsible parties: TBEP, SWFWMD, FDEP, EPA, UF/IFAS
Timeframe: Ongoing
Cost and potential funding sources: $-$$ CWA Section 320; external grants
Location: Baywide
Benefit/Performance measure: Increased awareness, knowledge and understanding of Green Infrastructure and its relationship to improved water quality and habitat protection. Increased use of Green Infrastructure techniques.
Results: Reduced runoff volume and pollution in Tampa Bay waterways.
Deliverables: Outreach and education, printed materials, workshops, presentations.
Activity 2 Develop and deliver information and tools needed to expand Green Infrastructure implementation within the watershed, including:
Vegetative shorelines help filter and treat runoff entering stormwater ponds.
CHARTING THE COURSE: THE COMPREHENSIVE CONSERVATION AND MANAGEMENT PLAN FOR TAMPA BAY (AUGUST 2017 REVISION)
PAGE 29
Go to: TABLE OF CONTENTS | INDEX OF ACTIONS
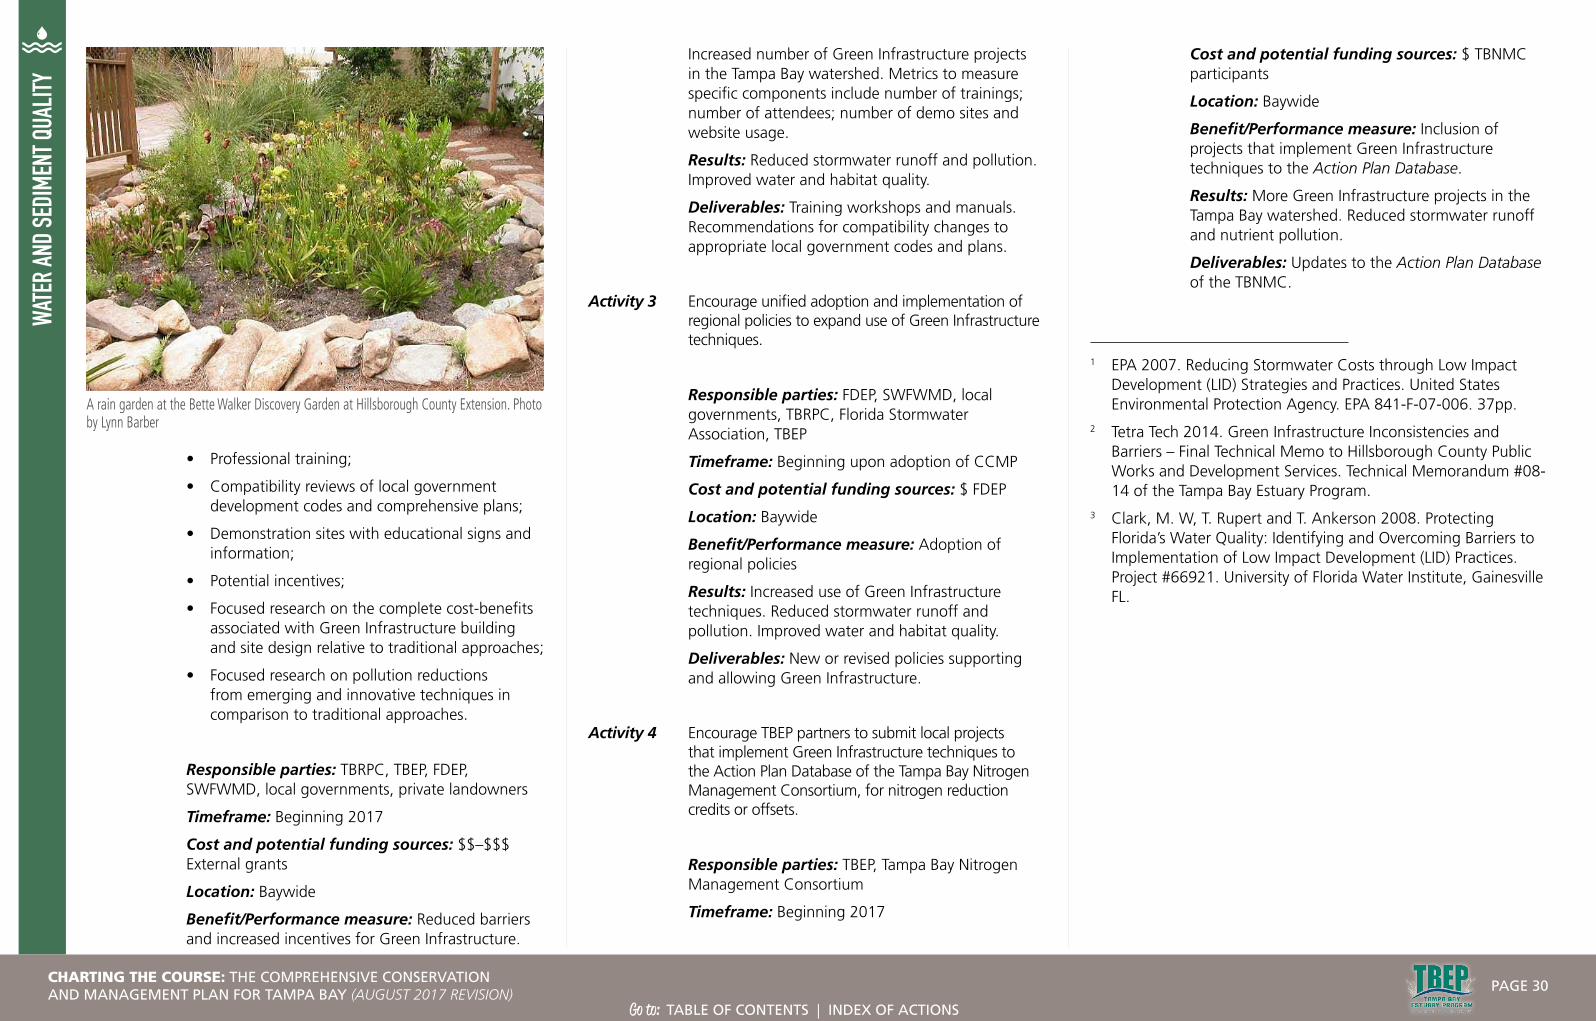
WATE
R AN
D SE
DIME
NT Q
UALIT
Y
• Professional training;
• Compatibility reviews of local government development codes and comprehensive plans;
• Demonstration sites with educational signs and information;
• Potential incentives;
• Focused research on the complete cost-benefits associated with Green Infrastructure building and site design relative to traditional approaches;
• Focused research on pollution reductions from emerging and innovative techniques in comparison to traditional approaches.
Responsible parties: TBRPC, TBEP, FDEP, SWFWMD, local governments, private landowners
Timeframe: Beginning 2017
Cost and potential funding sources: $$–$$$ External grants
Location: Baywide
Benefit/Performance measure: Reduced barriers and increased incentives for Green Infrastructure.
Increased number of Green Infrastructure projects in the Tampa Bay watershed. Metrics to measure specific components include number of trainings; number of attendees; number of demo sites and website usage.
Results: Reduced stormwater runoff and pollution. Improved water and habitat quality.
Deliverables: Training workshops and manuals. Recommendations for compatibility changes to appropriate local government codes and plans.
Activity 3 Encourage unified adoption and implementation of regional policies to expand use of Green Infrastructure techniques.
Responsible parties: FDEP, SWFWMD, local governments, TBRPC, Florida Stormwater Association, TBEP
Timeframe: Beginning upon adoption of CCMP
Cost and potential funding sources: $ FDEP
Location: Baywide
Benefit/Performance measure: Adoption of regional policies
Results: Increased use of Green Infrastructure techniques. Reduced stormwater runoff and pollution. Improved water and habitat quality.
Deliverables: New or revised policies supporting and allowing Green Infrastructure.
Activity 4 Encourage TBEP partners to submit local projects that implement Green Infrastructure techniques to the Action Plan Database of the Tampa Bay Nitrogen Management Consortium, for nitrogen reduction credits or offsets.
Responsible parties: TBEP, Tampa Bay Nitrogen Management Consortium
Timeframe: Beginning 2017
Cost and potential funding sources: $ TBNMC participants
Location: Baywide
Benefit/Performance measure: Inclusion of projects that implement Green Infrastructure techniques to the Action Plan Database.
Results: More Green Infrastructure projects in the Tampa Bay watershed. Reduced stormwater runoff and nutrient pollution.
Deliverables: Updates to the Action Plan Database of the TBNMC.
1 EPA 2007. Reducing Stormwater Costs through Low Impact Development (LID) Strategies and Practices. United States Environmental Protection Agency. EPA 841-F-07-006. 37pp.
2 Tetra Tech 2014. Green Infrastructure Inconsistencies and Barriers – Final Technical Memo to Hillsborough County Public Works and Development Services. Technical Memorandum #08-14 of the Tampa Bay Estuary Program.
3 Clark, M. W, T. Rupert and T. Ankerson 2008. Protecting Florida’s Water Quality: Identifying and Overcoming Barriers to Implementation of Low Impact Development (LID) Practices. Project #66921. University of Florida Water Institute, Gainesville FL.
A rain garden at the Bette Walker Discovery Garden at Hillsborough County Extension. Photo by Lynn Barber
CHARTING THE COURSE: THE COMPREHENSIVE CONSERVATION AND MANAGEMENT PLAN FOR TAMPA BAY (AUGUST 2017 REVISION)
PAGE 30
Go to: TABLE OF CONTENTS | INDEX OF ACTIONS

WATER AND SEDIMENT QUALITY
ATMOSPHERIC DEPOSITIONContinue to reduce nitrogen loading from atmospheric deposition
OBJECTIVES: Continue to support power plant upgrades and transitions to alternate energy sources. Continue to support initiatives to reduce atmospheric nitrogen pollution from vehicles. Expand the number of air monitoring stations for atmospheric nitrogen. Support research to better understand and quantify the contribution of atmospheric deposition to stormwater runoff. Support public education about the link between air and water quality.
STATUS: Revised Action. Formerly Action AD-1 Continue atmospheric deposition studies to better understand the relationship between air and water quality. Appended with background from former Action AD-2 Promote public and business energy conservation.
RELATED ACTIONS:SW-1 Reduce nitrogen runoff from
urban landscapes
SW-8 Expand adoption and implementation of Best Management Practices for commercial and urban agriculture
SW-10 Expand use of Green Infrastructure practices
WQ-1 Implement the Tampa Bay Nutrient Management Strategy
WW-2 Extend central sewer service to priority areas now served by septic systems
WW-3 Require standardized monitoring and reporting of wastewater discharges
WW-5 Reduce the occurrence of municipal sewer overflows to the bay
BACKGROUND:Reducing nitrogen input (loading) to Tampa Bay is a core management objective for the Tampa Bay Estuary Program (TBEP) and its partners (see Action WQ-1). Reductions in nitrogen pollution are linked to improved water quality, recovery of seagrass meadows and associated marine life and other environmental and human health benefits.
Nitrogen (N) pollution can reach Tampa Bay from a variety of sources, including stormwater runoff from non-point sources (e.g., urban fertilizer runoff or septic systems — see Actions SW-1, SW-8, SW-10, WW-2), point sources (e.g., a wastewater treatment plant — see Actions WW-3 and WW-5), groundwater and springs and atmospheric deposition. Atmospheric nitrogen can reach bay waters directly through deposition from rainfall and dust and indirectly through stormwater runoff carrying atmospheric nitrogen deposited on impervious surfaces in the watershed.
Nitrogen can be emitted to the atmosphere from natural sources, such as manure emissions, forest fires and lightning. In Tampa Bay’s highly
urbanized watershed, natural sources are a relatively small contributor to atmospheric nitrogen loading. Most atmospheric nitrogen is emitted from fossil-fuel burning power plants and vehicles.
TBEP has been a national leader in investigating and quantifying the significant role of airborne nitrogen in overall nitrogen inputs to the bay. The long-term, multi-site bay Region Atmospheric Chemistry Experiment (BRACE), completed in 2013, was conducted by scientists from the U.S. Environmental Protection Agency (EPA), University of South Florida, TBEP and other federal, state and local environmental agencies.
BRACE demonstrated that atmospheric deposition (both directly on the bay’s surface, and indirectly, through stormwater runoff) accounted for 57%
AD-1
At left: TECO’s 23-megawatt solar array near the Big Bend Power Station is capable of powering more than 3,300 homes. Photo courtesy Tampa Electric
The Tampa Bay airshed extends north to Atlanta and south to Cuba.
CHARTING THE COURSE: THE COMPREHENSIVE CONSERVATION AND MANAGEMENT PLAN FOR TAMPA BAY (AUGUST 2017 REVISION)
PAGE 31
Go to: TABLE OF CONTENTS | INDEX OF ACTIONS

WATE
R AN
D SE
DIME
NT Q
UALIT
Yof the total annual nitrogen loading to the bay from all sources. This contribution is mainly in the form of nitrogen oxides (NOx), which contribute to ozone, an air pollutant of public health concern in Florida. BRACE showed that atmospheric sources contributed four times as much nitrogen to Tampa Bay as discharges from municipal sewage treatment plants and industry combined.
Although the bulk of emissions generated in the Tampa Bay Area originated from power plants and industry, BRACE demonstrated that emissions from vehicles had a larger local impact. This is likely due to the fact that these emissions are generated low to the ground and tend to stay within the bay watershed, while pollution emitted from tall industrial stacks is dispersed over a much larger airshed that extends north to Atlanta and south to Cuba.
Data collected for BRACE showed that, compared to power plants, vehicles contributed four times more NOx deposition to the Tampa Bay watershed and two times more NOx deposition directly to the bay. The study also reported that two-thirds of atmospheric nitrogen deposition was contained in dust particles (dry deposition) and one-third came with rainfall (wet deposition); and that air pollution from outside the Tampa Bay Area can impact the bay as well.
Local and national regulations are significantly reducing nitrogen emissions and improving air quality in the Tampa Bay Area.
Power plants
The Cross-State Air Pollution Rule (CSAPR) finalized in 2011 by the EPA requires states to improve air quality by reducing power plant emissions that contribute to fine particle pollution and ground-level ozone in downwind states. This rule replaced EPA’s 2005 Clean Air Interstate Rule.
Local power plant upgrades, including replacing coal-burning plants with natural gas facilities and installing nitrogen reduction equipment on smoke stacks, resulted in a 95-ton per year decline in nitrogen emissions between 2002 and 2012.
Tampa Electric Company (TECO) replaced its coal-fired Gannon plant at Port Sutton in 2003 with the H.L. Culbreath Bayside Power Station, a 1,800 megawatt natural gas plant. According to TECO, the switch from coal to natural gas reduced nitrogen oxide and sulfur dioxide emissions by 99 percent and particulate matter emissions by 93 percent from 1998 levels. TECO also reported that NOx emissions from the 1,700 megawatt, coal-fired Big Bend Power Station in Apollo Beach declined 91 percent from 1998 emission levels by using technology that converts NOx into N2 and water. In 2004, TECO reduced emissions of particulate matter by 87 percent over 1998 levels by optimizing emission control units. In addition, more than $23 million in scrubber upgrades have resulted in a 94 percent reduction of sulfur dioxide levels compared to 1998 levels.
Duke Energy (formerly Progress Energy) converted its Bartow Power Plant at Weedon Island in 2009 from fuel oil to natural gas, reducing emissions by more than 80 percent, including a 98 percent reduction of sulfur dioxide emissions.
Since 2001, Florida Power and Light (FPL) has transitioned from burning more oil than any other utility in the nation to having less than 0.1 percent of its electricity generation produced from oil. Locally, FPL added a new natural gas-fueled generator at its Manatee County power plant and converted two existing units to co-fire natural gas and oil.
Both TECO and FPL began operating universal solar energy facilities in 2017. FPL’s 74.35-megawatt Manatee Solar Energy Center is among several large-scale facilities completed or planned by the company throughout Florida. The Manatee site houses 338,000 solar panels, enough to cover five football fields.
TECO launched a 23-megawatt photovoltaic (PV) array with more than 200,000 solar panels near the Big Bend Power Station. The system has the capacity to power more than 3,300 homes.
Despite its abundant sunshine throughout the year, Florida — the Sunshine State — lags nationally in solar production. In 2016, Florida voters approved a State Constitutional Amendment to provide property tax breaks for people who install solar panels on their homes.
Vehicles
America’s fleet of cars and trucks is becoming more energy efficient. New Corporate Average Fuel Economy (CAFE) standards were adopted in 2012, but are currently being reevaluated. Progress continues in developing hybrid, electric and hydrogen-powered cars. Sales of battery-powered and plug-in hybrid cars in the U.S. increased by 37% in 2016, to 159,139 vehicles.
The Tampa Bay Area Regional Transit Authority (TBARTA) is working to create a better multi-modal regional transportation plan for the Tampa Bay Area. Cities and counties have improved alternative and public transit options, including local streetcar and trolley lines, compressed natural gas-powered buses, bicycle lanes and pedestrian-friendly neighborhoods and urban centers. Commuter light rail, high-speed ferries and even An electric car charging station in Tampa.
Local transit authorities are gradually investing in more efficient hybrid, electric and compressed natural gas buses.
TBEP-sponsored research has shown that cars and trucks contribute four times as much nitrogen deposition to the bay watershed as power plants.
SOURCE: TBEP
CHARTING THE COURSE: THE COMPREHENSIVE CONSERVATION AND MANAGEMENT PLAN FOR TAMPA BAY (AUGUST 2017 REVISION)
PAGE 32
Go to: TABLE OF CONTENTS | INDEX OF ACTIONS

WATE
R AN
D SE
DIME
NT Q
UALIT
Y
elevated transit systems are in the discussion or planning phase. However, much work remains to build a successful interconnected, balanced multi-modal transportation network.
Energy conservation
Many opportunities exist to promote energy conservation that saves consumers money and reduces NOx emissions. Examples include:
The EPA’s voluntary Energy Star program helps businesses and individuals save money and protect the environment by identifying and promoting energy efficient products, homes and businesses. Since its inception in 1992, the Energy Star program has helped consumers save $362 billion dollars on utility bills and prevent 2.5 billion tons of greenhouse gases.
A variety of rebate programs, free energy audits and other incentive programs are sponsored by local utilities such as TECO, FPL and Duke Energy to increase efficiency of appliances, heat pumps, air conditioning ducts and insulation.
The Tampa Bay Regional Planning Council has a Telework program to promote and assess the benefits of tele-commuting to local businesses. TBEP is among the companies and organizations participating in the program.
UF/IFAS Extension provides a wealth of general information about energy efficiency and “living green” including specific information about energy-efficient lighting, heating, cooling and landscaping.
Despite significant reductions in nitrogen emissions from power plants and vehicles and improved energy efficiency of buildings and appliances, rapid population growth in the Tampa Bay Area may offset some of these gains. In 2002, direct atmospheric loading to Tampa Bay was estimated to be 548 metric tons per year. The most recent estimate for the period 2010–2014 is 542 metric tons per year. As population size and energy demand grow, continuing reductions in per capita energy use and air pollution will be needed, especially from vehicles, to maintain and improve the region’s water quality and quality of life.
STRATEGY:Activity 1 Continue to encourage power plant upgrades and
transitions to alternate energy sources to reduce nitrogen emissions. Incorporate associated reductions into the Nitrogen Management Consortium’s Action Plan Database.
Responsible parties: TECO, Duke Energy, FPL (leads); TBEP for incorporation of nitrogen reductions in baywide database
Timeframe: Ongoing.
Cost and potential funding sources: $ Contributions from NMC members support database maintenance
Location: Baywide
Benefit/Performance measure: Reductions in nitrogen emissions per unit of energy creation. Improved tracking of nitrogen emissions in the NMC Action Plan Database.
Results: Reduced nitrogen loading in Tampa Bay. Improved water quality.
Deliverables: Database entries.
Activity 2 Support federal and regional initiatives to reduce vehicle emissions, including increased fuel efficiency, mass transit, carpooling, bicycle commuting, telecommuting, and expansion of alternative/electric vehicle fueling stations. Incorporate associated reductions into the Nitrogen Management Consortium’s Action Plan Database.
Responsible parties: City/county transportation planning agencies, local commuter agencies, TBARTA, TBRPC (leads); TBEP for incorporation of nitrogen reductions in baywide database
Timeframe: Ongoing
Cost and potential funding sources: $ Staff Time from local and regional partners
Location: Baywide
Benefit/Performance measure: Reduced nitrogen emissions from cars and trucks. Increased fuel efficiency. More people carpooling, driving alternative energy vehicles, riding bicycles, using mass transit and telecommuting.
Results: Reduced nitrogen loading in Tampa Bay. Improved water quality.
Deliverables: Database entries.
Tampa Electric has significantly reduced emissions from its coal-fired Big Bend power plant near Apollo Beach. Photo by Nanette O’Hara.
Sources of nitrogen loading in Tampa Bay 2012-2016. SOURCE: TBEP
CHARTING THE COURSE: THE COMPREHENSIVE CONSERVATION AND MANAGEMENT PLAN FOR TAMPA BAY (AUGUST 2017 REVISION)
PAGE 33
Go to: TABLE OF CONTENTS | INDEX OF ACTIONS
WATE
R AN
D SE
DIME
NT Q
UALIT
YActivity 3 Support existing air quality monitoring programs
conducted by local governments. Expand the number of long-term air quality monitoring stations for atmospheric nitrogen deposition to include at least one in the Tampa Bay watershed.
Responsible parties: EPA, FDEP, EPCHC, local governments
Timeframe: Beginning 2017
Cost and potential funding sources: $$–$$$ EPCHC budget, potential state or federal grants
Location: Baywide
Benefit/Performance measure: Improved air quality monitoring. Improved understanding of the relationship and dynamics between air pollution and water pollution in Tampa Bay.
Results: Improved air and water quality management capacity.
Deliverables: Air quality monitoring station in the Tampa Bay watershed.
Activity 4 Support research to better quantify the sources, pathways and contribution of atmospheric deposition to stormwater runoff, especially in urban areas with extensive impervious surfaces.
Responsible parties: TBEP, local governments, USF
Timeframe: Beginning 2017
Cost and potential funding sources: $$–$$$ CWA Section 320 funds, state or federal grants
Location: Baywide
Benefit/Performance measure: Improved understanding of sources, pathways and contribution of atmospheric N deposition to stormwater runoff.
Results: Improved air and water quality management capacity.
Deliverables: Research study and report.
Activity 5 Improve outreach to the public about the link between air and water quality and foster behavior changes that reduce air pollution.
Responsible parties: TBEP, commuter and public health organizations, such as bay Area Commuter Services, TBARTA, local MPOs and the American Lung Association.
Timeframe: Ongoing
Cost and potential funding sources: $ CWA Section 320 funds, Bay Mini-Grants
Location: Baywide
Benefit/Performance measure: Improved public understanding about link between air and water quality. Behavior changes resulting in reduced per capita emissions of atmospheric nitrogen pollution.
Results: Improved air and water quality.
Deliverables: Outreach and education.
CHARTING THE COURSE: THE COMPREHENSIVE CONSERVATION AND MANAGEMENT PLAN FOR TAMPA BAY (AUGUST 2017 REVISION)
PAGE 34
Go to: TABLE OF CONTENTS | INDEX OF ACTIONS
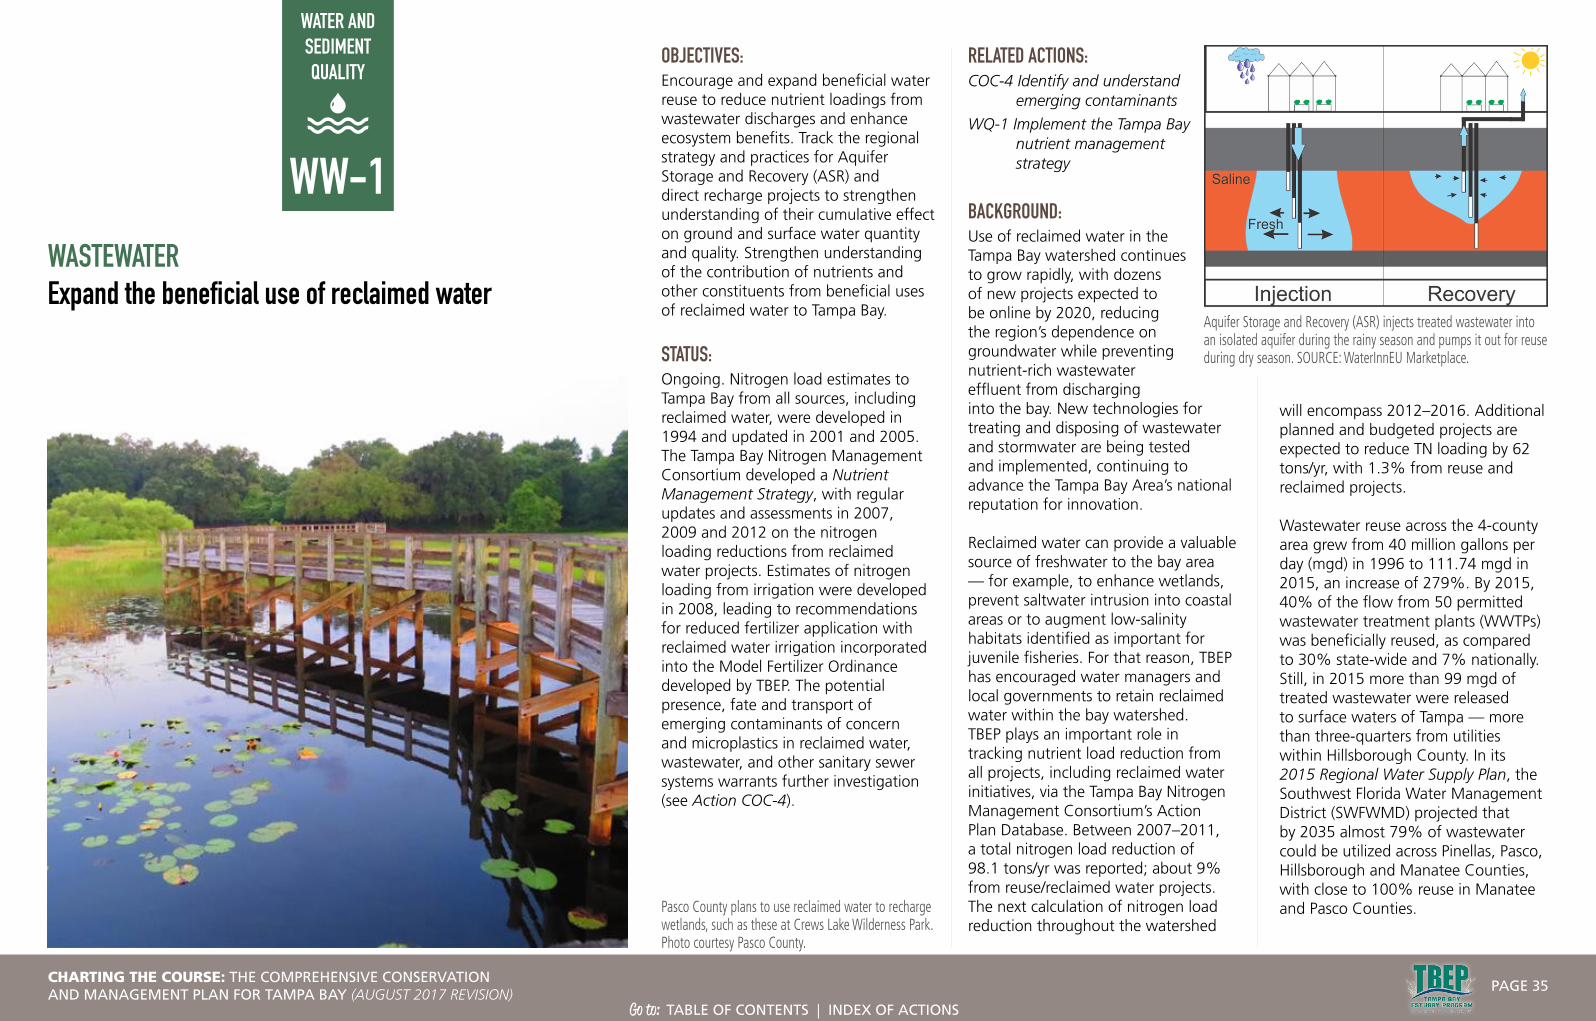
WATER AND SEDIMENT QUALITY
WASTEWATERExpand the beneficial use of reclaimed water
OBJECTIVES:Encourage and expand beneficial water reuse to reduce nutrient loadings from wastewater discharges and enhance ecosystem benefits. Track the regional strategy and practices for Aquifer Storage and Recovery (ASR) and direct recharge projects to strengthen understanding of their cumulative effect on ground and surface water quantity and quality. Strengthen understanding of the contribution of nutrients and other constituents from beneficial uses of reclaimed water to Tampa Bay.
STATUS: Ongoing. Nitrogen load estimates to Tampa Bay from all sources, including reclaimed water, were developed in 1994 and updated in 2001 and 2005. The Tampa Bay Nitrogen Management Consortium developed a Nutrient Management Strategy, with regular updates and assessments in 2007, 2009 and 2012 on the nitrogen loading reductions from reclaimed water projects. Estimates of nitrogen loading from irrigation were developed in 2008, leading to recommendations for reduced fertilizer application with reclaimed water irrigation incorporated into the Model Fertilizer Ordinance developed by TBEP. The potential presence, fate and transport of emerging contaminants of concern and microplastics in reclaimed water, wastewater, and other sanitary sewer systems warrants further investigation (see Action COC-4).
RELATED ACTIONS:COC-4 Identify and understand
emerging contaminants
WQ-1 Implement the Tampa Bay nutrient management strategy
BACKGROUND:Use of reclaimed water in the Tampa Bay watershed continues to grow rapidly, with dozens of new projects expected to be online by 2020, reducing the region’s dependence on groundwater while preventing nutrient-rich wastewater effluent from discharging into the bay. New technologies for treating and disposing of wastewater and stormwater are being tested and implemented, continuing to advance the Tampa Bay Area’s national reputation for innovation.
Reclaimed water can provide a valuable source of freshwater to the bay area — for example, to enhance wetlands, prevent saltwater intrusion into coastal areas or to augment low-salinity habitats identified as important for juvenile fisheries. For that reason, TBEP has encouraged water managers and local governments to retain reclaimed water within the bay watershed.TBEP plays an important role in tracking nutrient load reduction from all projects, including reclaimed water initiatives, via the Tampa Bay Nitrogen Management Consortium’s Action Plan Database. Between 2007–2011, a total nitrogen load reduction of 98.1 tons/yr was reported; about 9% from reuse/reclaimed water projects. The next calculation of nitrogen load reduction throughout the watershed
will encompass 2012–2016. Additional planned and budgeted projects are expected to reduce TN loading by 62 tons/yr, with 1.3% from reuse and reclaimed projects.
Wastewater reuse across the 4-county area grew from 40 million gallons per day (mgd) in 1996 to 111.74 mgd in 2015, an increase of 279%. By 2015, 40% of the flow from 50 permitted wastewater treatment plants (WWTPs) was beneficially reused, as compared to 30% state-wide and 7% nationally. Still, in 2015 more than 99 mgd of treated wastewater were released to surface waters of Tampa — more than three-quarters from utilities within Hillsborough County. In its 2015 Regional Water Supply Plan, the Southwest Florida Water Management District (SWFWMD) projected that by 2035 almost 79% of wastewater could be utilized across Pinellas, Pasco, Hillsborough and Manatee Counties, with close to 100% reuse in Manatee and Pasco Counties.
WW-1
Pasco County plans to use reclaimed water to recharge wetlands, such as these at Crews Lake Wilderness Park. Photo courtesy Pasco County.
Aquifer Storage and Recovery (ASR) injects treated wastewater into an isolated aquifer during the rainy season and pumps it out for reuse during dry season. SOURCE: WaterInnEU Marketplace.
CHARTING THE COURSE: THE COMPREHENSIVE CONSERVATION AND MANAGEMENT PLAN FOR TAMPA BAY (AUGUST 2017 REVISION)
PAGE 35
Go to: TABLE OF CONTENTS | INDEX OF ACTIONS
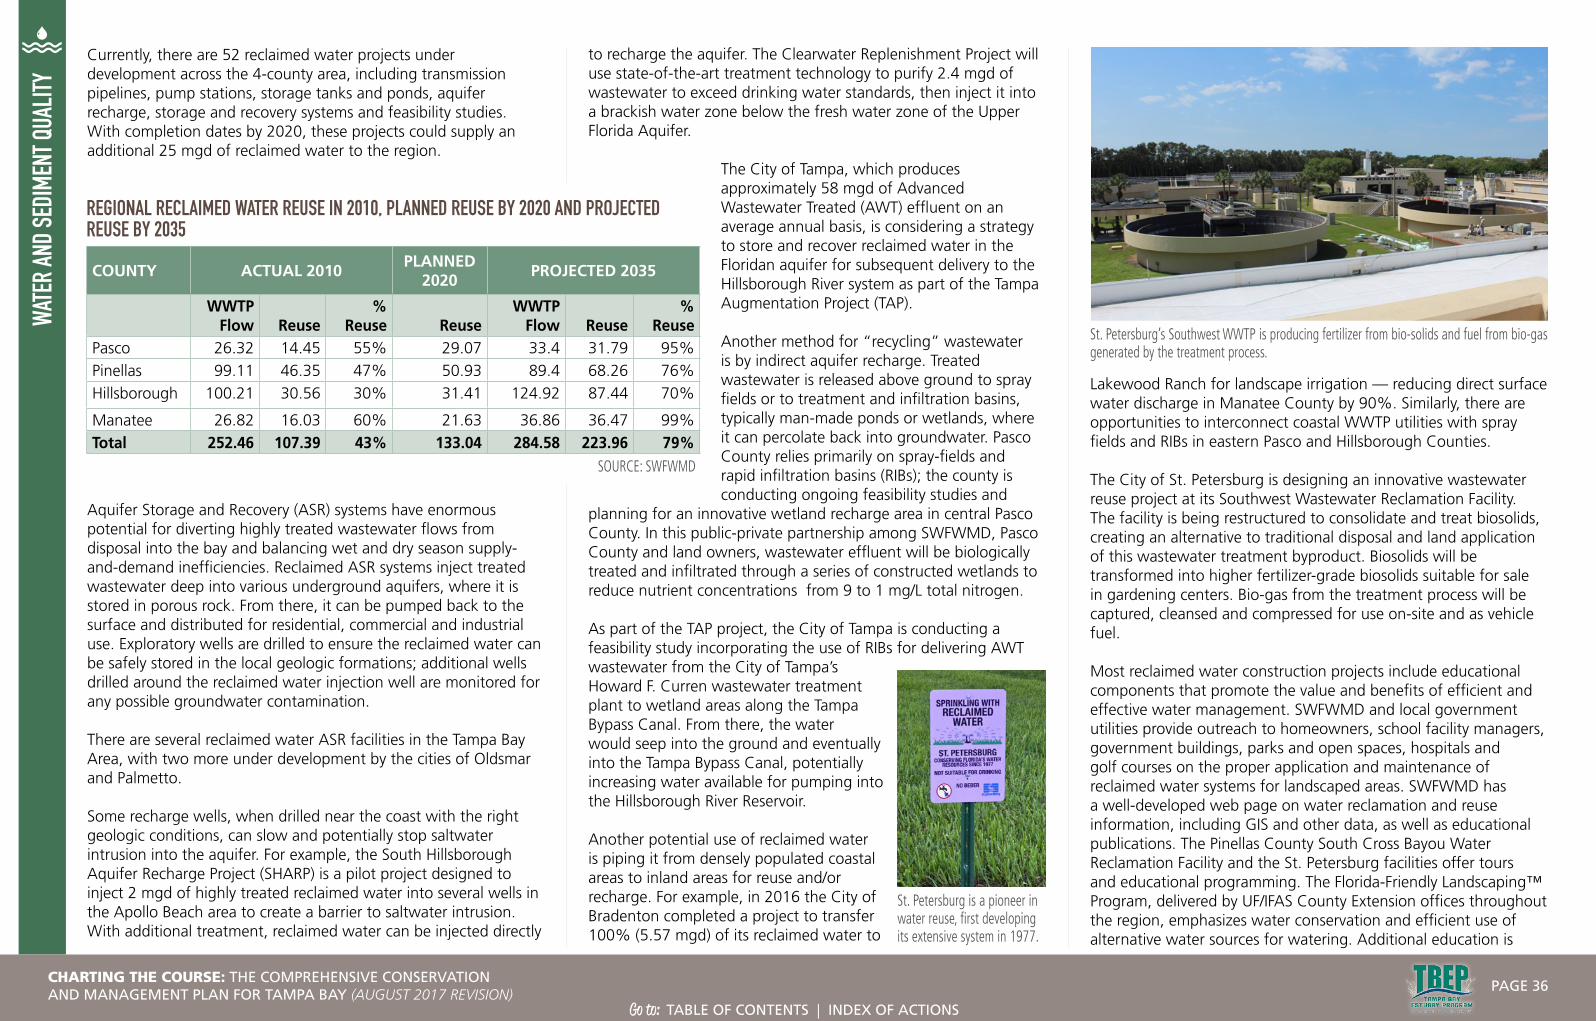
WATE
R AN
D SE
DIME
NT Q
UALIT
YCurrently, there are 52 reclaimed water projects under development across the 4-county area, including transmission pipelines, pump stations, storage tanks and ponds, aquifer recharge, storage and recovery systems and feasibility studies. With completion dates by 2020, these projects could supply an additional 25 mgd of reclaimed water to the region.
to recharge the aquifer. The Clearwater Replenishment Project will use state-of-the-art treatment technology to purify 2.4 mgd of wastewater to exceed drinking water standards, then inject it into a brackish water zone below the fresh water zone of the Upper Florida Aquifer.
The City of Tampa, which produces approximately 58 mgd of Advanced Wastewater Treated (AWT) effluent on an average annual basis, is considering a strategy to store and recover reclaimed water in the Floridan aquifer for subsequent delivery to the Hillsborough River system as part of the Tampa Augmentation Project (TAP).
Another method for “recycling” wastewater is by indirect aquifer recharge. Treated wastewater is released above ground to spray fields or to treatment and infiltration basins, typically man-made ponds or wetlands, where it can percolate back into groundwater. Pasco County relies primarily on spray-fields and rapid infiltration basins (RIBs); the county is conducting ongoing feasibility studies and
planning for an innovative wetland recharge area in central Pasco County. In this public-private partnership among SWFWMD, Pasco County and land owners, wastewater effluent will be biologically treated and infiltrated through a series of constructed wetlands to reduce nutrient concentrations from 9 to 1 mg/L total nitrogen.
As part of the TAP project, the City of Tampa is conducting a feasibility study incorporating the use of RIBs for delivering AWT wastewater from the City of Tampa’s Howard F. Curren wastewater treatment plant to wetland areas along the Tampa Bypass Canal. From there, the water would seep into the ground and eventually into the Tampa Bypass Canal, potentially increasing water available for pumping into the Hillsborough River Reservoir.
Another potential use of reclaimed water is piping it from densely populated coastal areas to inland areas for reuse and/or recharge. For example, in 2016 the City of Bradenton completed a project to transfer 100% (5.57 mgd) of its reclaimed water to
Lakewood Ranch for landscape irrigation — reducing direct surface water discharge in Manatee County by 90%. Similarly, there are opportunities to interconnect coastal WWTP utilities with spray fields and RIBs in eastern Pasco and Hillsborough Counties.
The City of St. Petersburg is designing an innovative wastewater reuse project at its Southwest Wastewater Reclamation Facility. The facility is being restructured to consolidate and treat biosolids, creating an alternative to traditional disposal and land application of this wastewater treatment byproduct. Biosolids will be transformed into higher fertilizer-grade biosolids suitable for sale in gardening centers. Bio-gas from the treatment process will be captured, cleansed and compressed for use on-site and as vehicle fuel.
Most reclaimed water construction projects include educational components that promote the value and benefits of efficient and effective water management. SWFWMD and local government utilities provide outreach to homeowners, school facility managers, government buildings, parks and open spaces, hospitals and golf courses on the proper application and maintenance of reclaimed water systems for landscaped areas. SWFWMD has a well-developed web page on water reclamation and reuse information, including GIS and other data, as well as educational publications. The Pinellas County South Cross Bayou Water Reclamation Facility and the St. Petersburg facilities offer tours and educational programming. The Florida-Friendly Landscaping™ Program, delivered by UF/IFAS County Extension offices throughout the region, emphasizes water conservation and efficient use of alternative water sources for watering. Additional education is
REGIONAL RECLAIMED WATER REUSE IN 2010, PLANNED REUSE BY 2020 AND PROJECTED REUSE BY 2035
COUNTY ACTUAL 2010PLANNED
2020PROJECTED 2035
WWTP
Flow Reuse%
Reuse ReuseWWTP
Flow Reuse%
ReusePasco 26.32 14.45 55% 29.07 33.4 31.79 95%Pinellas 99.11 46.35 47% 50.93 89.4 68.26 76%Hillsborough 100.21 30.56 30% 31.41 124.92 87.44 70%
Manatee 26.82 16.03 60% 21.63 36.86 36.47 99%Total 252.46 107.39 43% 133.04 284.58 223.96 79%
SOURCE: SWFWMD
Aquifer Storage and Recovery (ASR) systems have enormous potential for diverting highly treated wastewater flows from disposal into the bay and balancing wet and dry season supply-and-demand inefficiencies. Reclaimed ASR systems inject treated wastewater deep into various underground aquifers, where it is stored in porous rock. From there, it can be pumped back to the surface and distributed for residential, commercial and industrial use. Exploratory wells are drilled to ensure the reclaimed water can be safely stored in the local geologic formations; additional wells drilled around the reclaimed water injection well are monitored for any possible groundwater contamination.
There are several reclaimed water ASR facilities in the Tampa Bay Area, with two more under development by the cities of Oldsmar and Palmetto.
Some recharge wells, when drilled near the coast with the right geologic conditions, can slow and potentially stop saltwater intrusion into the aquifer. For example, the South Hillsborough Aquifer Recharge Project (SHARP) is a pilot project designed to inject 2 mgd of highly treated reclaimed water into several wells in the Apollo Beach area to create a barrier to saltwater intrusion. With additional treatment, reclaimed water can be injected directly
St. Petersburg’s Southwest WWTP is producing fertilizer from bio-solids and fuel from bio-gas generated by the treatment process.
St. Petersburg is a pioneer in water reuse, first developing its extensive system in 1977.
CHARTING THE COURSE: THE COMPREHENSIVE CONSERVATION AND MANAGEMENT PLAN FOR TAMPA BAY (AUGUST 2017 REVISION)
PAGE 36
Go to: TABLE OF CONTENTS | INDEX OF ACTIONS

WATE
R AN
D SE
DIME
NT Q
UALIT
Y
needed to inform residents, golf course and property managers that fertilizer application can be reduced or eliminated where reclaimed water is used for irrigation. This message was a key theme of TBEP’s Be Floridian fertilizer education campaign. Pinellas County currently provides an online map of reclaimed water service areas, with corresponding fertilizer recommendations.
STRATEGYActivity 1 Track the regional strategy and practices for beneficial
uses of reclaimed water to strengthen understanding of their cumulative effect on ground and surface water quantity and quality. Evaluate constituents of reclaimed water that would limit its beneficial use in the region.
Responsible parties: SWFWMD and FDEP (co-leads)
Timeframe: Every 5 years
Cost and potential funding sources: $ state funds
Location: Baywide
Benefit/Performance measure: Tracking ASR and recharge projects, including storage and recharge volumes, location and depth, treatment method, nitrogen load, and project status.
Results: A coordinated regional strategy for reducing nutrient input to the bay, while also safeguarding aquifer resources.
Deliverables: Summary reports of regional ASR and recharge projects with a 5-year reporting period.
Activity 2 Improve understanding of the contribution of nutrients to the bay from beneficial uses of reclaimed water. Encourage the highest level nutrient removal that is economically and technically feasible for reclaimed water to ensure compliance with nutrient criteria.
Responsible parties: Tampa Bay Nitrogen Management Consortium, FDEP, SWFWMD
Timeframe: Initiate by 2022
Cost and potential funding sources: $$ SWFWMD, TBERF, other grants
Location: Baywide
Benefit/Performance measure: Assessment of nutrient loading to the watershed.
Results: Updated nutrient loading estimates for watershed-applied reuse water.
Deliverables: Study results tracking the potential contribution of reclaimed water from wastewater plants to nutrient loads in surface and groundwater loading.
Activity 3 Encourage development of reclaimed water storage, transmission and recovery systems — including interconnections where feasible — as an efficient solution for balancing wet and dry season supply and demand inefficiencies throughout the region.
Responsible parties: SWFWMD, local utilities (co-leads)
Timeframe: Ongoing
Cost and potential funding sources: $$$$ SWFWMD, FDEP, utilities
Location: Baywide
Benefit/Performance measure: Investigation and facilitation of new reclaimed water projects that provide alternatives to address higher demands during the dry season and excess water availability during the wet season.
Results: Improved reclaimed water system efficiency.
Deliverables: Periodic updates on opportunities for local jurisdictions to develop new reclaimed water storage, transmission and recovery systems.
Activity 4 Update or modify Comprehensive Land Use Plans or Land Development policies addressing reclaimed water, where appropriate, to ensure protection of nutrient-sensitive watersheds and wellfield recharge areas, and prioritize use of reclaimed water to benefit the Tampa Bay watershed. Track and ensure compliance with state legislation regarding development and distribution of reclaimed water systems.
Responsible parties: Local cities and counties, TBEP (for incorporation into local plans and codes); FDEP, SWFWMD (for tracking and ensuring compliance with state legislation)
Timeframe: Ongoing
Cost and potential funding sources: No additional funds
Location: Baywide
Benefit/Performance measure: Addition of new policies or revision of current policies within local Comprehensive Land Use Plans and Land Development Codes.
Results: Reduced nitrogen loadings to the bay and contributing waters.
Deliverables: Modifications to Comp Plans or Land Development Codes.
More than 200 golf courses in West Central Florida are irrigated with reclaimed water. Photo courtesy Manatee County.
Reclaimed water pipes are painted purple for easy identification.
CHARTING THE COURSE: THE COMPREHENSIVE CONSERVATION AND MANAGEMENT PLAN FOR TAMPA BAY (AUGUST 2017 REVISION)
PAGE 37
Go to: TABLE OF CONTENTS | INDEX OF ACTIONS
WATE
R AN
D SE
DIME
NT Q
UALIT
YActivity 5 Continue developing and implementing education for
homeowners, managers of golf courses, residential and commercial properties and institutional facilities such as schools, parks and hospitals, on the proper application and maintenance of reclaimed water systems for landscaped areas. This educational/awareness effort should include the need to reduce fertilizer use where reclaimed water is applied, and provide support to the Florida-Friendly Landscaping™ Program of the UF/IFAS County Extension offices throughout the region.
Responsible parties: SWFWMD, UF/IFAS, TBEP, FDEP, local cities and counties, TBW
Timeframe: Ongoing
Cost and potential funding sources: $ SWFWMD, FDEP
Location: Baywide
Benefit/Performance measure: Development and implementation of educational programs via web, workshops and site visits for facilities managers and HOA managers to promote the value and benefits of wastewater reuse.
Results: Increased acceptance and adoption of reuse water as a safe and beneficial alternative.
Deliverables: Educational materials and metrics on number of people engaged.
CHARTING THE COURSE: THE COMPREHENSIVE CONSERVATION AND MANAGEMENT PLAN FOR TAMPA BAY (AUGUST 2017 REVISION)
PAGE 38
Go to: TABLE OF CONTENTS | INDEX OF ACTIONS

WATER AND SEDIMENT QUALITY
WASTEWATERExtend central sewer service to priority areas now served by septic systems
WW-2
At left: Expansion of Hillsborough’s South County WWTP will allow treatment of 10 million gallons of wastewater daily — enough to accommodate growth in the area through 2025. Photo courtesy Gresham Smith and Partners.
Locations of known and estimated septic systems in the Tampa Bay Watershed. SOURCE: FDOH.
OBJECTIVES: Identify and prioritize hotspots of nutrient and bacteria contamination from septic tanks and small package plants, and convert to central sewer as opportunities arise. Develop nitrogen loading estimates for septic systems in the Tampa Bay Area. Support adoption of new septic system nitrogen reduction technology and requirements for regular maintenance and inspection.
STATUS: Ongoing. Local municipal partners have mapped septic systems and made progress extending central sewer and converting septic systems strategically and opportunistically with land development. The Basin Area Management Action Plan (BMAP) process has helped identify hotspots and develop strategies to reduce bacterial loading (see Action PH-4).
RELATED ACTIONS:COC-4 Identify and understand
emerging contaminants
PH-4 Reduce fecal contamination from humans and pets in bay area waters
WQ-1 Implement the Tampa Bay nutrient management strategy
BACKGROUND:Overall, bay-wide nitrogen loadings from septic systems are minor when compared to other sources, such as stormwater and air pollution (see Action WQ-1). A 1995 study estimated the
total nitrogen loading to the bay from septic systems at 220 tons/yr, about 5% of the total.1 Nevertheless, septic tanks may have significant impact locally, especially for smaller streams and water body segments. While nitrogen loading from septic systems is a concern, so are other chemicals including phosphates and “emerging contaminants” such as pharmaceuticals, personal care products and microplastics (see Action COC-4), and bacterial pollution (see Action PH-4). Failed septic systems in residential or rural areas can contribute large numbers of coliform and other bacteria to surface and ground water, especially in areas with large concentrations of older septic systems more prone to malfunctioning. Poorly maintained package plants (small privately owned wastewater treatment plants (WWTPs)) are also of concern. Over the last decade, several of these have been closed and wastewater flow consolidated with larger, more efficient municipal WWTPs.
Based on permit data from the Florida Department of Health (FDOH), there may be as many as 250,000 septic systems in the four coastal counties of the bay area, almost half built before 1970. For many years, new developments within Urban Service Areas have been required to hook up to central sewer, and expansion of Urban Service Areas over time has facilitated conversion of additional properties to central sewer. Even so, thousands of new permits for septic systems have been issued in the last decade. FDOH’s state-wide Florida Water Management Inventory completed in 2016 documents and maps the wastewater treatment method and the drinking water source for the more than 6 million improved parcels in the
state. The study documented that in the three counties surrounding the bay, about 117,000 parcels have or likely have septic systems. This estimate does not include the portion of Pasco County within the bay watershed. More than half of all parcels in Pasco are on septic. Pinellas County has the fewest parcels served by septic systems (15,000 or 3.6%).2
Local government partners have basic inventories and maps of septic systems, and all have made good to substantial progress in converting septic systems to central sewer. Pinellas County and the Cities of Clearwater, Largo, St. Petersburg, Tampa and Lakeland all have ongoing projects to convert more septic systems to central sewer as opportunities arise. Projects are tracked in the Action Plan Database of the Tampa Bay Nitrogen Management Consortium (see Action WQ-1). Challenges remain with regard to
CHARTING THE COURSE: THE COMPREHENSIVE CONSERVATION AND MANAGEMENT PLAN FOR TAMPA BAY (AUGUST 2017 REVISION)
PAGE 39
Go to: TABLE OF CONTENTS | INDEX OF ACTIONS
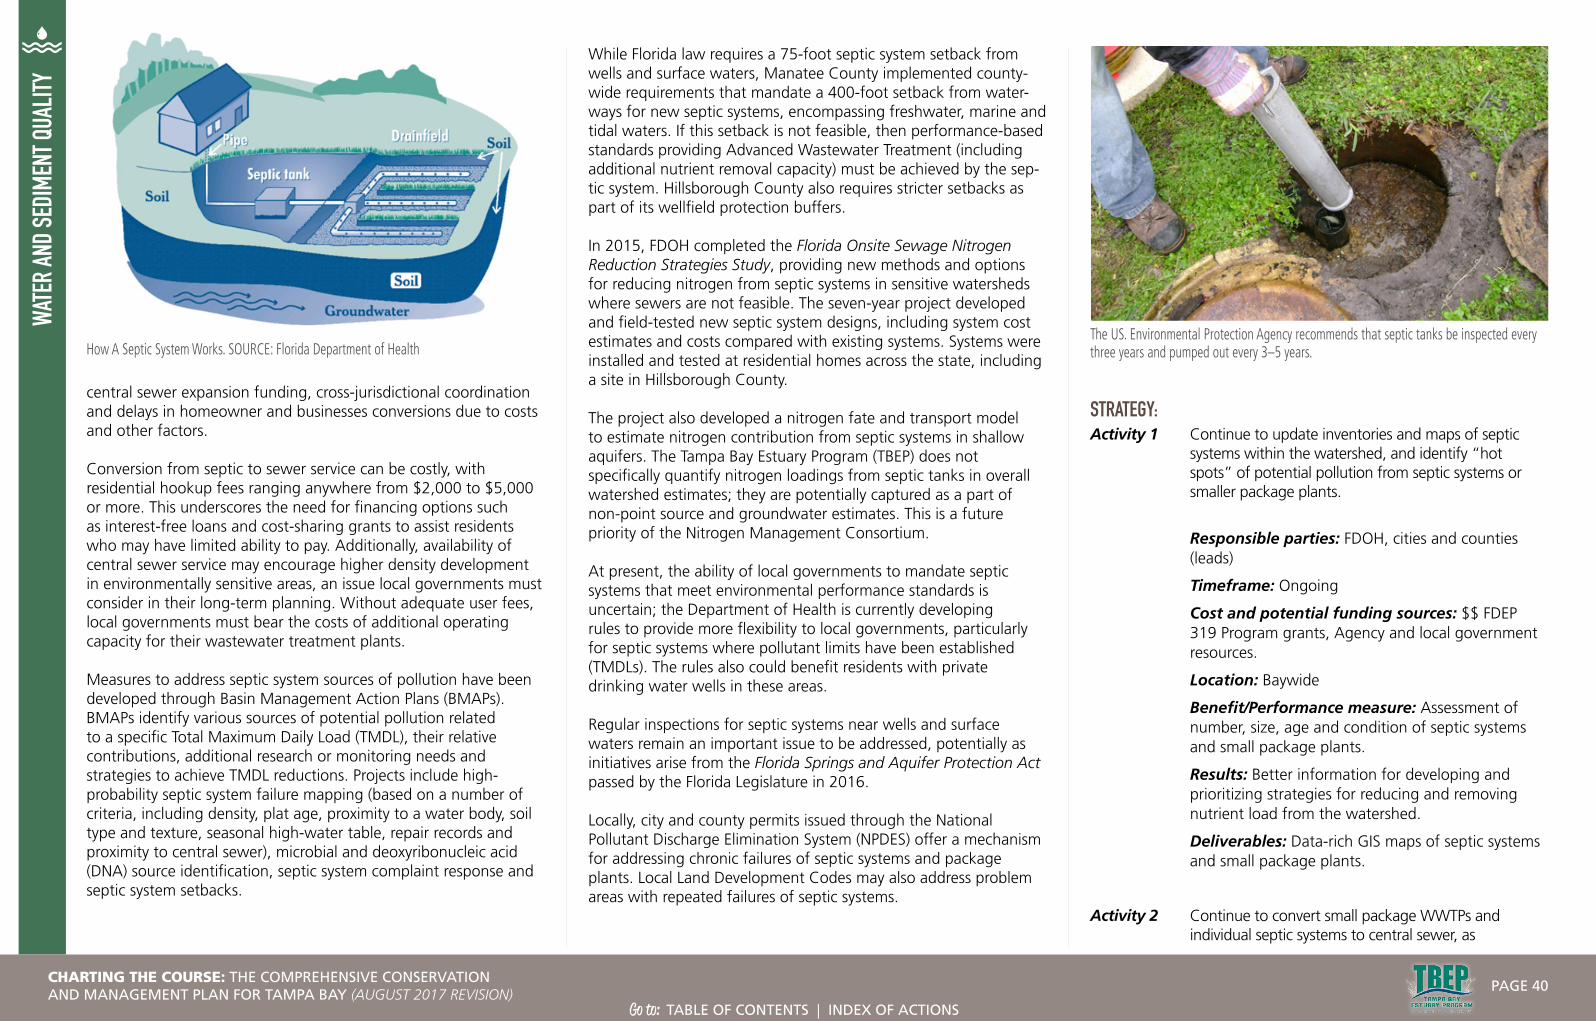
WATE
R AN
D SE
DIME
NT Q
UALIT
Y
central sewer expansion funding, cross-jurisdictional coordination and delays in homeowner and businesses conversions due to costs and other factors.
Conversion from septic to sewer service can be costly, with residential hookup fees ranging anywhere from $2,000 to $5,000 or more. This underscores the need for financing options such as interest-free loans and cost-sharing grants to assist residents who may have limited ability to pay. Additionally, availability of central sewer service may encourage higher density development in environmentally sensitive areas, an issue local governments must consider in their long-term planning. Without adequate user fees, local governments must bear the costs of additional operating capacity for their wastewater treatment plants.
Measures to address septic system sources of pollution have been developed through Basin Management Action Plans (BMAPs). BMAPs identify various sources of potential pollution related to a specific Total Maximum Daily Load (TMDL), their relative contributions, additional research or monitoring needs and strategies to achieve TMDL reductions. Projects include high-probability septic system failure mapping (based on a number of criteria, including density, plat age, proximity to a water body, soil type and texture, seasonal high-water table, repair records and proximity to central sewer), microbial and deoxyribonucleic acid (DNA) source identification, septic system complaint response and septic system setbacks.
While Florida law requires a 75-foot septic system setback from wells and surface waters, Manatee County implemented county-wide requirements that mandate a 400-foot setback from water-ways for new septic systems, encompassing freshwater, marine and tidal waters. If this setback is not feasible, then performance-based standards providing Advanced Wastewater Treatment (including additional nutrient removal capacity) must be achieved by the sep-tic system. Hillsborough County also requires stricter setbacks as part of its wellfield protection buffers.
In 2015, FDOH completed the Florida Onsite Sewage Nitrogen Reduction Strategies Study, providing new methods and options for reducing nitrogen from septic systems in sensitive watersheds where sewers are not feasible. The seven-year project developed and field-tested new septic system designs, including system cost estimates and costs compared with existing systems. Systems were installed and tested at residential homes across the state, including a site in Hillsborough County.
The project also developed a nitrogen fate and transport model to estimate nitrogen contribution from septic systems in shallow aquifers. The Tampa Bay Estuary Program (TBEP) does not specifically quantify nitrogen loadings from septic tanks in overall watershed estimates; they are potentially captured as a part of non-point source and groundwater estimates. This is a future priority of the Nitrogen Management Consortium.
At present, the ability of local governments to mandate septic systems that meet environmental performance standards is uncertain; the Department of Health is currently developing rules to provide more flexibility to local governments, particularly for septic systems where pollutant limits have been established (TMDLs). The rules also could benefit residents with private drinking water wells in these areas.
Regular inspections for septic systems near wells and surface waters remain an important issue to be addressed, potentially as initiatives arise from the Florida Springs and Aquifer Protection Act passed by the Florida Legislature in 2016.
Locally, city and county permits issued through the National Pollutant Discharge Elimination System (NPDES) offer a mechanism for addressing chronic failures of septic systems and package plants. Local Land Development Codes may also address problem areas with repeated failures of septic systems.
The US. Environmental Protection Agency recommends that septic tanks be inspected every three years and pumped out every 3–5 years.How A Septic System Works. SOURCE: Florida Department of Health
STRATEGY:Activity 1 Continue to update inventories and maps of septic
systems within the watershed, and identify “hot spots” of potential pollution from septic systems or smaller package plants.
Responsible parties: FDOH, cities and counties (leads)
Timeframe: Ongoing
Cost and potential funding sources: $$ FDEP 319 Program grants, Agency and local government resources.
Location: Baywide
Benefit/Performance measure: Assessment of number, size, age and condition of septic systems and small package plants.
Results: Better information for developing and prioritizing strategies for reducing and removing nutrient load from the watershed.
Deliverables: Data-rich GIS maps of septic systems and small package plants.
Activity 2 Continue to convert small package WWTPs and individual septic systems to central sewer, as
CHARTING THE COURSE: THE COMPREHENSIVE CONSERVATION AND MANAGEMENT PLAN FOR TAMPA BAY (AUGUST 2017 REVISION)
PAGE 40
Go to: TABLE OF CONTENTS | INDEX OF ACTIONS
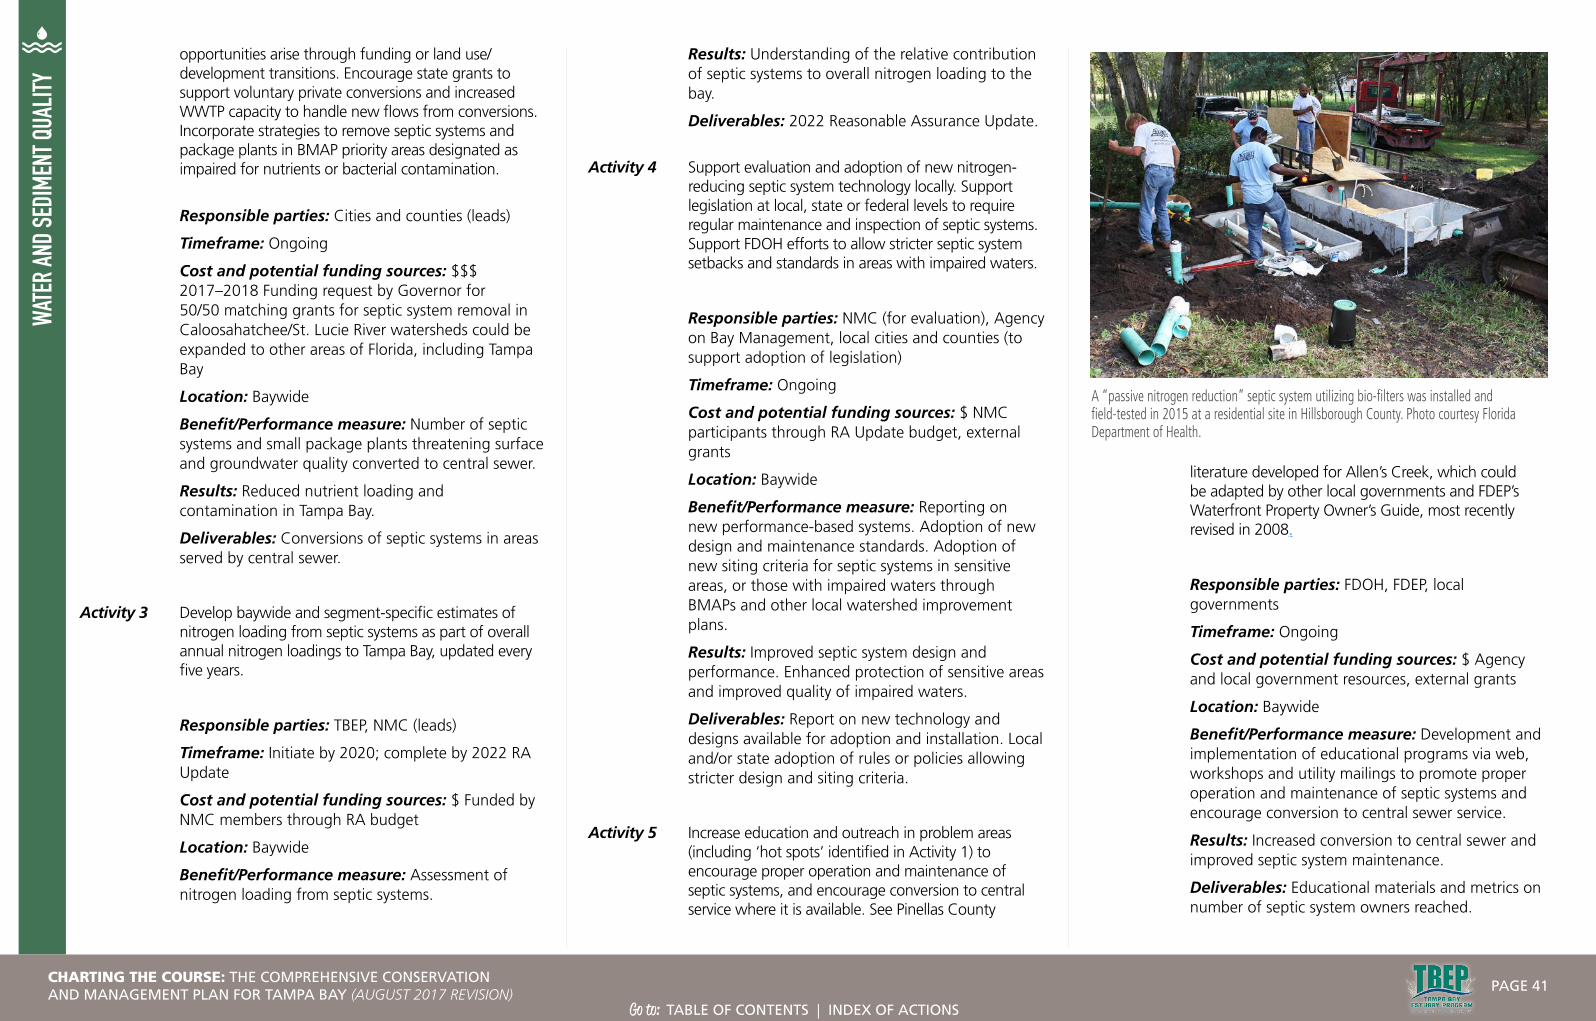
WATE
R AN
D SE
DIME
NT Q
UALIT
Yopportunities arise through funding or land use/development transitions. Encourage state grants to support voluntary private conversions and increased WWTP capacity to handle new flows from conversions. Incorporate strategies to remove septic systems and package plants in BMAP priority areas designated as impaired for nutrients or bacterial contamination.
Responsible parties: Cities and counties (leads)
Timeframe: Ongoing
Cost and potential funding sources: $$$ 2017–2018 Funding request by Governor for 50/50 matching grants for septic system removal in Caloosahatchee/St. Lucie River watersheds could be expanded to other areas of Florida, including Tampa Bay
Location: Baywide
Benefit/Performance measure: Number of septic systems and small package plants threatening surface and groundwater quality converted to central sewer.
Results: Reduced nutrient loading and contamination in Tampa Bay.
Deliverables: Conversions of septic systems in areas served by central sewer.
Activity 3 Develop baywide and segment-specific estimates of nitrogen loading from septic systems as part of overall annual nitrogen loadings to Tampa Bay, updated every five years.
Responsible parties: TBEP, NMC (leads)
Timeframe: Initiate by 2020; complete by 2022 RA Update
Cost and potential funding sources: $ Funded by NMC members through RA budget
Location: Baywide
Benefit/Performance measure: Assessment of nitrogen loading from septic systems.
Results: Understanding of the relative contribution of septic systems to overall nitrogen loading to the bay.
Deliverables: 2022 Reasonable Assurance Update.
Activity 4 Support evaluation and adoption of new nitrogen-reducing septic system technology locally. Support legislation at local, state or federal levels to require regular maintenance and inspection of septic systems. Support FDOH efforts to allow stricter septic system setbacks and standards in areas with impaired waters.
Responsible parties: NMC (for evaluation), Agency on Bay Management, local cities and counties (to support adoption of legislation)
Timeframe: Ongoing
Cost and potential funding sources: $ NMC participants through RA Update budget, external grants
Location: Baywide
Benefit/Performance measure: Reporting on new performance-based systems. Adoption of new design and maintenance standards. Adoption of new siting criteria for septic systems in sensitive areas, or those with impaired waters through BMAPs and other local watershed improvement plans.
Results: Improved septic system design and performance. Enhanced protection of sensitive areas and improved quality of impaired waters.
Deliverables: Report on new technology and designs available for adoption and installation. Local and/or state adoption of rules or policies allowing stricter design and siting criteria.
Activity 5 Increase education and outreach in problem areas (including ‘hot spots’ identified in Activity 1) to encourage proper operation and maintenance of septic systems, and encourage conversion to central service where it is available. See Pinellas County
literature developed for Allen’s Creek, which could be adapted by other local governments and FDEP’s Waterfront Property Owner’s Guide, most recently revised in 2008.
Responsible parties: FDOH, FDEP, local governments
Timeframe: Ongoing
Cost and potential funding sources: $ Agency and local government resources, external grants
Location: Baywide
Benefit/Performance measure: Development and implementation of educational programs via web, workshops and utility mailings to promote proper operation and maintenance of septic systems and encourage conversion to central sewer service.
Results: Increased conversion to central sewer and improved septic system maintenance.
Deliverables: Educational materials and metrics on number of septic system owners reached.
A “passive nitrogen reduction” septic system utilizing bio-filters was installed and field-tested in 2015 at a residential site in Hillsborough County. Photo courtesy Florida Department of Health.
CHARTING THE COURSE: THE COMPREHENSIVE CONSERVATION AND MANAGEMENT PLAN FOR TAMPA BAY (AUGUST 2017 REVISION)
PAGE 41
Go to: TABLE OF CONTENTS | INDEX OF ACTIONS
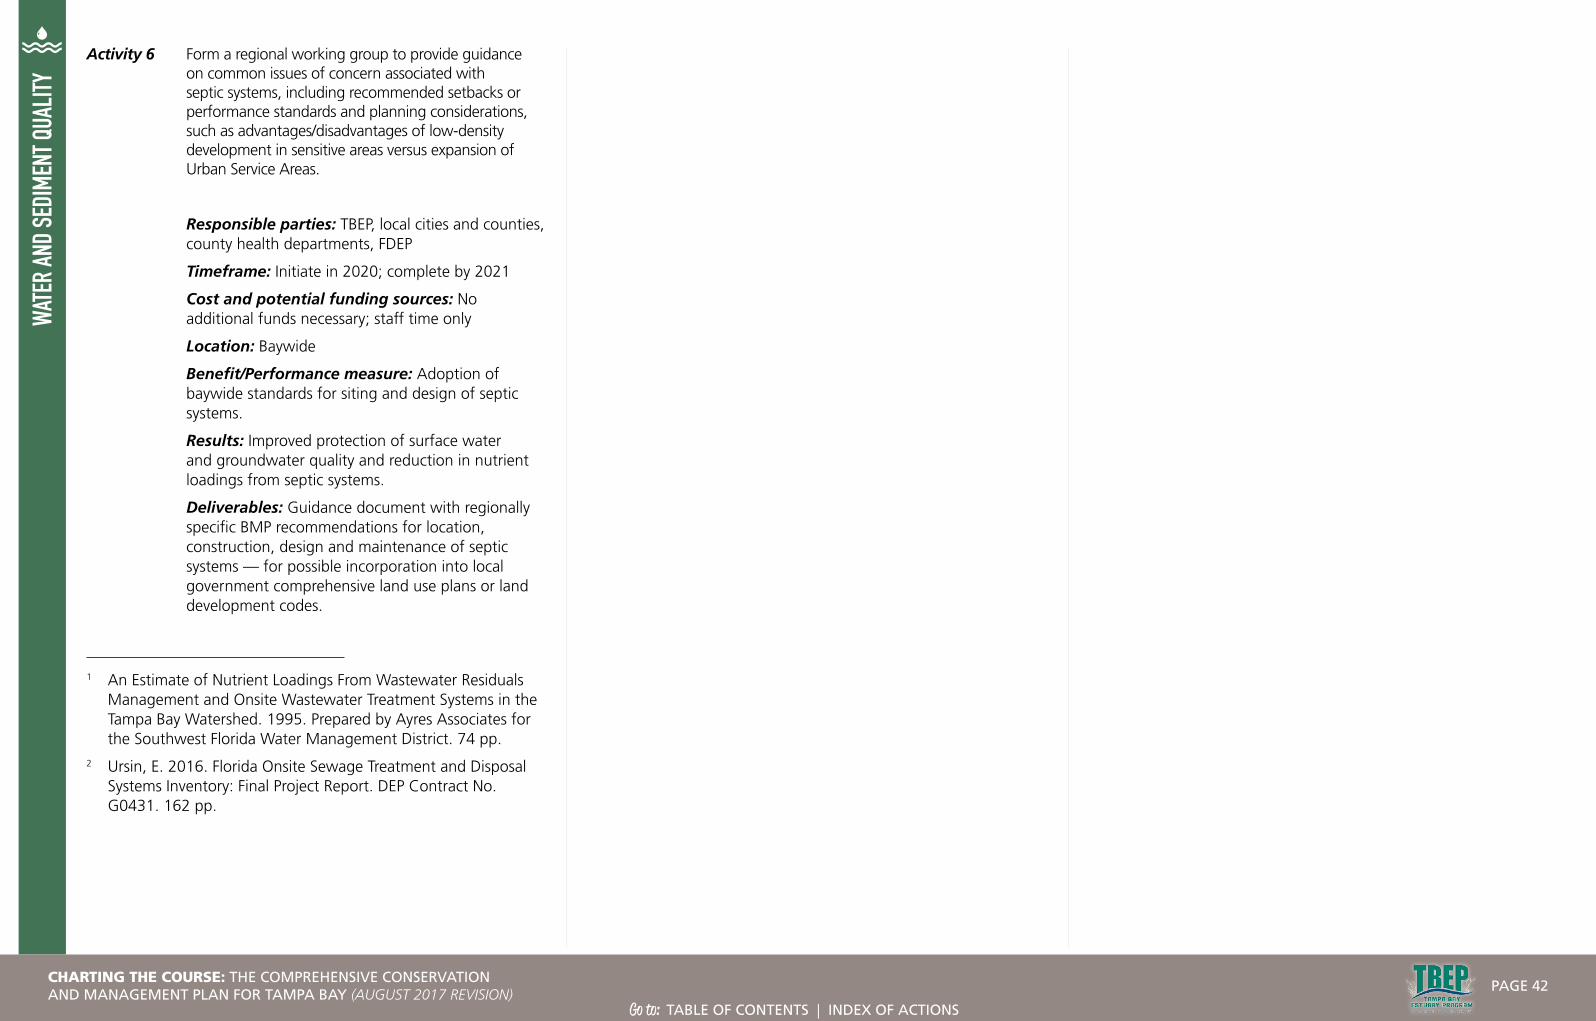
WATE
R AN
D SE
DIME
NT Q
UALIT
YActivity 6 Form a regional working group to provide guidance
on common issues of concern associated with septic systems, including recommended setbacks or performance standards and planning considerations, such as advantages/disadvantages of low-density development in sensitive areas versus expansion of Urban Service Areas.
Responsible parties: TBEP, local cities and counties, county health departments, FDEP
Timeframe: Initiate in 2020; complete by 2021
Cost and potential funding sources: No additional funds necessary; staff time only
Location: Baywide
Benefit/Performance measure: Adoption of baywide standards for siting and design of septic systems.
Results: Improved protection of surface water and groundwater quality and reduction in nutrient loadings from septic systems.
Deliverables: Guidance document with regionally specific BMP recommendations for location, construction, design and maintenance of septic systems — for possible incorporation into local government comprehensive land use plans or land development codes.
1 An Estimate of Nutrient Loadings From Wastewater Residuals Management and Onsite Wastewater Treatment Systems in the Tampa Bay Watershed. 1995. Prepared by Ayres Associates for the Southwest Florida Water Management District. 74 pp.
2 Ursin, E. 2016. Florida Onsite Sewage Treatment and Disposal Systems Inventory: Final Project Report. DEP Contract No. G0431. 162 pp.
CHARTING THE COURSE: THE COMPREHENSIVE CONSERVATION AND MANAGEMENT PLAN FOR TAMPA BAY (AUGUST 2017 REVISION)
PAGE 42
Go to: TABLE OF CONTENTS | INDEX OF ACTIONS

WATER AND SEDIMENT QUALITY
Monitoring Reports (DMRs), as required by their permits. All permitted facilities are required to monitor and report on the chemical composition of effluent discharges, but the specific parameters they monitor can vary from facility to facility, based on permit requirements. This is particularly problematic for estimating loadings from industrial WWTPs — their permits often require them to only report a subset of nutrient forms (e.g., ionized ammonia, orthophosphate), and often in a way (e.g., without concomitant flow data) that makes it difficult for resource managers to calculate accurate and timely loading estimates for core pollutants.
TBEP’s primary interest is consistent reporting of TN to accurately calculate loading estimates for the Reasonable Assurance process. Consistent reporting of TP, TSS and BOD as appropriate would also be helpful.
Another challenge to calculating accurate and timely pollutant loading estimates for WWTPs was that facilities traditionally could submit DMRs in hand-written or paper format. This required FDEP to enter data into databases by hand, which took time and could lead to data entry errors and significant lags in reporting data.
EPA recently promulgated E-reporting rule 80 FR 64063, which requires NPDES permitted facilities to electronically report and share data.
WASTEWATERRequire standardized monitoring and reporting of wastewater discharges
The Electronic Discharge Monitoring System (EzDMR) is an electronic reporting tool that saves time and reduces the potential for errors from manual entry of data. It provides instant access to a facility’s current reporting requirements, as well as the status and history of a facility’s reports.
OBJECTIVES:Require standardized monitoring and reporting of wastewater discharges to improve the accuracy and timeliness of pollutant loading estimates. Provide access to an up-to-date, publicly accessible database of industrial and domestic wastewater discharges. Develop and maintain an ongoing Tampa Bay-specific summary of information for loadings of core pollutants reported to the monitoring database.
STATUS:Ongoing. Action revised to incorporate new information on improvements to reporting of wastewater discharges.
RELATED ACTIONS:WQ-1 Implement the Tampa Bay
nutrient management strategy
WW-1 Expand the beneficial use of reclaimed water
BACKGROUND:Improved water quality has produced a resurgence of healthy seagrass meadows and associated fish and invertebrate communities in Tampa Bay. Protecting these gains requires diligent monitoring of pollutant inputs (loading) to the bay. The Tampa Bay Estuary Program (TBEP) regularly estimates loadings of core pollutants, including total nitrogen (TN), total phosphorus (TP), total suspended solids (TSS) and more recently, biochemical oxygen demand (BOD). Pollutant loadings are estimated from a variety of sources, including atmospheric deposition,
domestic and industrial point sources, groundwater, springs and nonpoint sources1. Accuracy and timeliness of pollutant loading calculations is critical to development of loading estimates used by the Tampa Bay Nitrogen Management Consortium (NMC) to prepare Tampa Bay Reasonable Assurance (RA) documents. These data also are needed for Basin Management Action Plans (BMAPs) and other documents necessary to meet regulatory requirements and for tracking the long-term recovery of the bay (see Action WQ-1).
Although improvements to domestic and industrial wastewater treatment plants (WWTPs) have significantly reduced their water quality impact, they remain a small, but significant source of pollutant loading. In 2015, approximately 122 million gallons of treated wastewater were discharged into Tampa Bay per day. From 2007-2011, industrial and domestic wastewater discharges contributed an average of 6% and 15% of total nitrogen loading to Tampa Bay, respectively.1,2
About a quarter of WWTPs in Florida are authorized to discharge treated wastewater (effluent) directly to surface waters under National Pollutant Discharge Elimination System (NPDES) permits. The remaining plants are authorized to discharge effluent to groundwater through land-application, beneficial use of reclaimed water or deep well injection (see Action WW-1).
Wastewater treatment plants self-monitor and report their own discharges to the Florida Department of Environmental Protection (FDEP) through monthly or quarterly Discharge
WW-3
At left: The South Cross Bayou Water Reclamation Facility is Pinellas County’s largest wastewater treatment plant. Photo courtesy Pinellas County.
CHARTING THE COURSE: THE COMPREHENSIVE CONSERVATION AND MANAGEMENT PLAN FOR TAMPA BAY (AUGUST 2017 REVISION)
PAGE 43
Go to: TABLE OF CONTENTS | INDEX OF ACTIONS
WATE
R AN
D SE
DIME
NT Q
UALIT
YThis improvement will enhance transparency by providing a timelier, complete, more accurate and nationally consistent set of data in a more accessible form. As of December 2016, FDEP requires all NPDES wastewater and stormwater facilities to submit DMRs through their web-based Electronic Discharge Monitoring Report System (EzDMR).
Compliance data from DMRs is accessible to the public through FDEP’s OCULUS website. Locally, the Environmental Protection Commission of Hillsborough County also maintains records of DMRs.
STRATEGY:Activity 1 Where historic data indicate wastewater discharges
contain significant concentrations of pollutants of concern to a waterbody, require standardized measurement and timely reporting of those parameters, particularly TN, and average daily or monthly flow from point-source facilities with defined load allocations in the 2012 Reasonable Assurance document adopted by FDEP. This includes all permittees discharging an average of 100,000 gallons or more of wastewater per day.
Responsible parties: FDEP (lead for data collection and database management)
Timeframe: Ongoing
Cost and potential funding sources: $ FDEP will implement the E-reporting rule and maintain database
Location: Baywide
Benefit/Performance measure: Standardized monitoring and reporting of significant discharges of TN and average daily or monthly flow will facilitate the accurate and timely calculations of total pollutant loading to Tampa Bay.
Results: Accurate and timely monitoring of total pollutant loading to Tampa Bay is essential to adaptive management and resource protection.
Deliverables: Standardized monitoring of significant discharges of TN and average daily or monthly flow. Other monitoring parameters may be included as needed to address specific waterbody
or estuary impairments. Standardized and timely reporting of these core parameters through FDEP’s EzDMR System and/or E-reporting rule implementation.
Activity 2 Improve access to FDEP’s permit compliance databases and wastewater spill databases. Improve the usability of these databases, reduce the need for duplicative reporting and keep databases up to date.
Responsible parties: FDEP (lead) with review by Tampa Bay NMC
Timeframe: Ongoing. As of December 2016, FDEP requires NPDES facilities to file DMRs electronically through a web-based EzDMR system.
Cost and potential funding sources: $$ FDEP
Location: Baywide
Benefit/Performance measure: Timely access to accurate, standardized pollution loading data from WWTPs will increase our understanding of the relationships between pollutant loading and water quality in Tampa Bay.
Results: Improved knowledge and understanding of pollutant loading and water quality will improve adaptive management and resource protection in Tampa Bay.
Deliverables: Improved access to online data provided in DMRs, data and database management and user interface.
Activity 3 Develop Tampa Bay-specific information from discharge monitoring reports that summarizes loading of core pollutants on an ongoing basis, to facilitate timely preparation of documents required for Reasonable Assurance assessments. This information also can be utilized by local governments to meet TMDLs and other water quality regulations, as well as in BMAPs.
Responsible parties: TBEP to facilitate in partnership with FDEP and with input and review from the NMC.
Timeframe: Ongoing
Cost and potential funding sources: $ NMC participant contributions to RA development once every 5 years
Location: Baywide
Benefit/Performance measure: Ability to archive and access accurate, timely and application-specific regional information necessary to inform regional initiatives, models and adaptive management.
Results: Improved resource management and protection in Tampa Bay.
Deliverables: Timely, updated loading summaries for core pollutants contained in DMRs.
1 TBEP (2013) Estimates of total nitrogen, total phosphorus, total suspended solids, and biochemical oxygen demand loadings to Tampa Bay, Florida: 2007-2011). Prepared by Janicki Environmental, Inc. 77pp.
2 Tampa Bay Nitrogen Management Strategy 2012 Reasonable Assurance Update Document. Tampa Bay Nitrogen Management Consortium, approved December 14, 2012. 55pp.
CHARTING THE COURSE: THE COMPREHENSIVE CONSERVATION AND MANAGEMENT PLAN FOR TAMPA BAY (AUGUST 2017 REVISION)
PAGE 44
Go to: TABLE OF CONTENTS | INDEX OF ACTIONS

WATER AND SEDIMENT QUALITY
WASTEWATERReduce the occurrence of sanitary sewer overflows to the bay
OBJECTIVES:Encourage proper operation, maintenance and replacement of deteriorating and failing sanitary sewer infrastructure owned by utilities and private property owners. Encourage and support efforts to reduce groundwater and stormwater inflow and infiltration to sanitary sewer systems. Support local government capacity to gain adequate funding for needed capital improvement projects. Encourage communication, coordination and cooperation among regional utilities. Support public education and outreach about best practices for proper use and maintenance of privately-owned lateral sanitary sewer infrastructure (i.e., pipes connecting homes and businesses to municipal lines).
STATUS:Ongoing. Previously Action PH-1, this action is updated to incorporate new information about operation, maintenance and replacement of sanitary sewer infrastructure in the Tampa Bay watershed. It includes new information about efforts to improve communication, coordination and cooperation among regional utilities and a public education component.
RELATED ACTIONS:WW-2 Extend central sewer service to
priority areas now served by septic systems
WW-3 Require standardized monitoring and reporting of wastewater discharges
BACKGROUND:Sanitary sewer systems are closed, underground conveyances designed to collect and transport domestic, commercial and industrial wastewater to centralized wastewater treatment plants (WWTPs). Occasionally, sanitary sewers can overflow and release untreated sewage into the environment — potentially contaminating surface waters and sediments and threatening public health. Reducing the occurrence of sanitary sewer overflows (SSOs) is important to maintaining and improving water quality in Tampa Bay.
Sanitary sewers can overflow for a number of reasons, including improper design and capacity, aging infrastructure, line blockages and breaks, infiltration and inflow of stormwater, and equipment and power failures. Addressing these challenges through proper operation and maintenance, capital improvement projects, education and enforcement will help reduce the incidence of sanitary sewer overflows.
Design Problems and Capacity Exceedance
While initial design and construction problems can underlie some SSOs, it is more common for ongoing urban development to exceed original system capacity and lead to overflows. Solutions include retrofitting existing systems with additional pipes, bigger interceptors, reduced wet weather infiltration and inflow, more underground storage or additional WWTP treatment capacity.
Aging infrastructure, Blockages and Breaks
Wastewater systems in the Tampa Bay
Area are showing their age. This is particularly true in older urban areas like the Cities of St. Petersburg and Tampa. Since 2010, the City of Tampa has rehabilitated more than 34 miles of gravity pipeline and 2,000 manholes. The City plans to rehabilitate another 19 miles of gravity pipeline and 500 manholes by 2018. Tampa also completed more than $15 million in maintenance projects at the Howard F. Curren Advanced WWTP. Another $36 M in facility improvements are either under construction, in design or planned. Elsewhere, Hillsborough County is retiring two aging WWTPs and consolidating treatment at the Northwest Regional Water Reclamation Facility to improve treatment efficiency and reduce power use.
Pipes can deteriorate and fail over time, especially those made from older, degradable materials like clay or Orangeburg — made of layers of wood pulp and pitch. For example, the volume of wastewater conveyed per person per day in Pinellas County is significantly higher in the South County system, where many pipes are made of vitrified clay, compared to the North County system, where the majority of pipes are made of PVC. This is likely due to the amount of infiltration and inflow
WW-5Heavy rains can add large volumes of stormwater to sewer systems, causing them to overflow.
At left: Sanitary sewer overflows may result in beaches being closed to swimming and fishing because of the potential for bacterial contamination.
CHARTING THE COURSE: THE COMPREHENSIVE CONSERVATION AND MANAGEMENT PLAN FOR TAMPA BAY (AUGUST 2017 REVISION)
PAGE 45
Go to: TABLE OF CONTENTS | INDEX OF ACTIONS

WATE
R AN
D SE
DIME
NT Q
UALIT
Yrehabilitation or replacement. A variety of leak detection technologies are available, including filling sections of pipe with smoke to help visualize breaks or using video cameras. There are newer, cheaper technologies (e.g., sonar) that can assist a utility in determining where to expend cleaning resources. Other “trenchless” technologies make repairs and rehabilitation easier, less expensive and cause less disturbance to the above-ground area.
Many utilities in the Tampa Bay Area have aggressive programs to replace older, deteriorating infrastructure. For example, Tampa invested $44 M to upgrade two master lift stations to improve wet-weather operations. Hillsborough Basin Management Action Plan participants committed to implement over 75 bacteria reduction projects, 45 of which were categorized as “wastewater infrastructure management” projects.1,2 Hillsborough County lined 214,000 feet of pipe with slip lining at a cost of $10 M, and the City of Largo invested $100 M for a new wet-weather force main. Pipes connecting homes and businesses to the municipal sewer system (private laterals) require similar attention, but are often neglected by property owners.
Inflow and Infiltration
Sanitary sewers in the Tampa Bay Area were not designed to transport groundwater and stormwater. Backups and overflows can occur when excessive amounts of groundwater and/or stormwater enter and overwhelm system capacity. This can result in sewage backups into homes, spills from manhole covers or lift stations or emergency discharges at WWTPs. Infiltration occurs when groundwater enters sanitary sewer systems through defective, permeable or broken pipes. Inflow occurs when stormwater enters the sanitary system through unauthorized connections (e.g., yard and roof drains, and submersible pumps). Sanitary sewer overflows due to inflow and infiltration are most commonly associated with rainstorms.
For example, unusually heavy rains in summer 2015 overwhelmed the City of St. Petersburg’s sanitary sewer system, and forced the city to discharge 31 million gallons of treated and untreated wastewater into Clam Bayou and Tampa Bay. The storm-related incident was compounded, in part, by loss of system capacity when the Albert Whitted WWTP was closed months earlier. Making matters worse, some homeowners associations, businesses and individual residents piped water out of flooded areas into the City’s sanitary sewers.
Stormwater entering sewer systems through old, permeable red clay or orangeburg pipes during high rainfall events is a significant contributor to sewage overflows.
entering via defects in the sanitary sewers. Between 2012 and 2015, Pinellas County completed 26 wastewater projects to reduce pollutant loading or SSOs at a cost of $7.6 M. Another seven projects totaling $16.4M are ongoing.
The City of Tampa has replaced pipes constructed of ductile iron that have failed due to corrosion, with new PVC pipes. Other infrastructure, including pumps, check valves and other moveable parts can also wear out, leading to mechanical failure. Older electric equipment or even lighting strikes can cause electrical failures at lift stations.
Blockages can occur due to tree roots entering sanitary sewer systems through defects, breaks or cracks. They can also be caused by improper disposal of items into sanitary drains, including fats, oils and grease (FOG), baby wipes, new ‘flushable wipes’ and sanitary products. According to the City of Tampa, the number one cause of sewer overflows in the city is grease blockages. Tampa adopted a Grease Management Ordinance in 2006 to regulate the disposal of grease by grease haulers and food facilities. The city also provides outreach and education to the public about ways residents can keep improper items out of the sewer system.
Breaks and blockages can also contribute to added hydraulic stress on other parts of the system and produce a series of cascading failures down the line. Solutions to aging infrastructure and blockages include routine maintenance, cleaning and
In retrospect, some overflows and releases due to the storm may have been avoidable if comprehensive system-wide action plans had been in place specifying emergency responses (similar to oil spill response plans), and if additional conveyance and storage capacity in neighboring utilities’ systems were made available. In Fall 2015, the Florida Department of Environmental Protection (FDEP) began convening regular meetings of regional utilities to improve communication, coordination and cooperation among them. One goal is to explore opportunities for cooperative resource and capacity-sharing among utilities during heavy storms or other emergencies.
Solutions to reducing inflow and infiltration include regular inspection, rehabilitation and maintenance of broken, failing infrastructure. For example, leaky manhole covers can be made less susceptible to stormwater leaks by sealing them with manhole inserts. Rigorous construction inspections can assist in identifying and preventing illicit connections to sanitary sewer systems.
The City of St. Petersburg will invest more than $300 million in improvements to its wastewater treatment system through the year 2021 – including additional deep injection wells to dispose of treated wastewater during heavy rain events, expansion of the city’s three remaining WWTPs, and lining or sealing of targeted pipes and manholes.
Equipment and Power Failures
Equipment failures and lack of backup power can also cause overflows. Regular inspections and maintenance are important preventative measures. For example, Tampa installed emergency generators at some of its pump stations.
Climate Change
Climate change will further strain aging wastewater infrastructure. Anticipated changes in storm intensity may escalate inflow and infiltration leading to more frequent sewer overflows and emergency releases. Rising sea levels and associated changes to groundwater may increase infiltration, corrode infrastructure and alter the effectiveness of wastewater treatment.3 As a result, climate change risks should be considered when planning new wastewater infrastructure. For example, planners may consider locating new wastewater treatment plants away from future surge and flood-prone areas and consider increasing capacity to accommodate anticipated increases in inflow and infiltration during more intense storms. Community resilience planning is underway in several municipalities in the bay watershed.
This education campaign in Largo informs homeowners not to flush wipes, cotton pads, feminine products and other personal care products down toilets to reduce sewer overflows.
CHARTING THE COURSE: THE COMPREHENSIVE CONSERVATION AND MANAGEMENT PLAN FOR TAMPA BAY (AUGUST 2017 REVISION)
PAGE 46
Go to: TABLE OF CONTENTS | INDEX OF ACTIONS

WATE
R AN
D SE
DIME
NT Q
UALIT
YSTRATEGY:Activity 1 Support local government efforts to acquire adequate
funding to replace substandard or aging facilities.
Responsible parties: Local governments, regional utilities (lead) with TBEP and agencies participating in identifying funding opportunities
Timeframe: Initiate in 2017
Cost and potential funding sources: $ Local government staff time for grant writing: EPA Climate Ready Estuaries grant fund, consider other sustainable funding sources such as user fees
Location: Baywide
Benefit/Performance measure: Replacing substandard or aging infrastructure will reduce occurrence of sanitary sewer overflows and pollutant loading to Tampa Bay waterbodies.
Results: Adequate funding to reduce pollutant loading will protect water quality and public health in the bay watershed.
Deliverables: Competitive grant proposals.
Activity 2 Encourage communication, coordination and cooperation among utilities. Support FDEP’s ongoing working group to convene and facilitate regular meetings among regional utilities. Examine how utilities here and elsewhere have responded to emergency discharges and incorporate lessons learned and applicable management strategies. Improve communication to residents regarding public health risks posed by sewer overflows, using quick-notification tools such as neighborhood-based web networks and mobile device applications.
Responsible parties: FDEP, regional utilities (lead) with TBEP and agencies participating
Timeframe: Ongoing
Cost and potential funding sources: $ FDEP and local government staff time
Location: Baywide
Benefit/Performance measure: Improved communication and cooperation among regional
utilities will improve best practices for operation and maintenance of regional wastewater systems. Cooperative assistance and agreements for capacity sharing during heavy rainstorms or other emergencies will increase resiliency and capacity of WWTPs and their collector networks. Improved communication with residents during emergency events will protect public health.
Results: Improved operating and maintenance BMPs and enhanced resiliency to storms will help reduce sanitary sewer overflows and protect water quality and public health in the Tampa Bay Area.
Deliverables: Facilitated meetings and other activities involving regional utilities. Memorandum of understanding or other agreement for cooperative assistance and capacity sharing among utilities during storms or other emergencies.
Activity 3 Encourage and support regional utility efforts to design, operate and maintain wastewater systems comprehensively, including:
• Reducing inflow and infiltration into sanitary sewer systems;
• Maintaining and replacing deteriorating and failing sewer lines owned by utilities and the private sector;
• Installing manhole inserts;
• Conducting regular line inspections and cleanouts;
• Enforcing grease ordinances;
• Identifying and eliminating illicit connections to sanitary sewer systems;
• Developing Actions Plans specifying protocols and responses during emergencies, including identification of nearby facilities with additional capacity, a plan for transporting wastewater to those facilities and timely and ongoing communication with residents in areas where emergency discharges occur;
• Considering impacts of climate change and sea level rise on performance of sewer system infrastructure.
Responsible parties: FDEP, regional utilities (lead) with TBEP and agencies participating
Timeframe: Initiate in 2017
Cost and potential funding sources: $ FDEP and regional utilities staff time
Location: Baywide
Benefit/Performance measure: Reduced incidences of sanitary sewer overflows.
Results: Better protection of water quality and public health in the Tampa Bay Area.
Deliverables: Comprehensive management plans for operation of wasterwater facilities.
Activity 4 Support public education and outreach about best practices for proper use and maintenance of private wastewater lateral systems. Outreach should address inappropriate items to flush down toilets or wash down sinks, especially information about proper disposal of fats, oils and grease. Education should also address proper maintenance and timely replacement of deteriorated sanitary sewer laterals on private property, and elimination of unauthorized connections.
Responsible parties: FDEP, regional utilities (lead) with participation by TBEP and agencies, governments can assist homeowners by identifying
A sewer pipe clogged with kitchen fats, oils and greases.
CHARTING THE COURSE: THE COMPREHENSIVE CONSERVATION AND MANAGEMENT PLAN FOR TAMPA BAY (AUGUST 2017 REVISION)
PAGE 47
Go to: TABLE OF CONTENTS | INDEX OF ACTIONS

WATE
R AN
D SE
DIME
NT Q
UALIT
Yfunding or incentive programs to assist with replacement of lateral lines
Timeframe: Initiate in 2018
Cost and potential funding sources: $ FDEP, regional utilities staff time
Location: Baywide
Benefit/Performance measure: Increased public knowledge about best practices for proper disposal of household and business wastes into sanitary sewers, reduction of unauthorized pipe connections and associated behavior change will help reduce blockages and overflows in sanitary sewer systems.
Results: Reduced sanitary sewer overflows will protect water quality and public health in the Tampa Bay Area.
Deliverables: Education materials and outreach about residential and business BMPs for proper use and maintenance of sanitary sewer systems. Surveys measuring behavior change.
1 2009 Hillsborough River Basin Management Action Plan for the Implementation of Total Maximum Daily Loads Adopted by the Florida Department of Environmental Protection in the Hillsborough River Basin for Fecal Coliform Bacteria. 2009. Developed by the Hillsborough River Basin Working Group in cooperation with the Florida Department of Environmental Protection. 149 pp.
2 2013 Progress Report for the Hillsborough River Basin Management Action Plan. 2014. Prepared by the Division of Environmental Assessment and Restoration Water Quality Restoration Program of the Florida Department of Environmental Protection. 16pp.
3 Bovarnick, B., Polefka, S. & Bhattacharyya, A. 2014. Rising Waters, Rising Threat – How Climate Change Endangers America’s Neglected Wastewater Infrastructure. Center for American Progress.19 pp.
CHARTING THE COURSE: THE COMPREHENSIVE CONSERVATION AND MANAGEMENT PLAN FOR TAMPA BAY (AUGUST 2017 REVISION)
PAGE 48
Go to: TABLE OF CONTENTS | INDEX OF ACTIONS

WATER AND SEDIMENT QUALITY
CONTAMINANTS OF CONCERNAddress hot spots of sediment contamination in the bay
OBJECTIVES:Identify and remediate priority “hot spots” of sediment contamination in the bay. Continue sediment quality and benthic monitoring in the bay and expand to tidal tributaries and rivers. Incorporate benthic community targets in management plans.
STATUS:Ongoing. Using the Tampa Bay Benthic Index, eight priority hot spots were identified in Tampa Bay. A Sediment Quality Action Plan was developed for the highest priority site, McKay Bay, and initial assessment has been completed.
RELATED ACTIONS:BH-1 Implement the Tampa Bay
Habitat Master Plan
BH-8 Continue and enhance habitat mapping and monitoring
programs
BH-9 Enhance ecosystem values of tidal tributaries
BACKGROUND:Monitoring of benthic, or bottom, habitats has been ongoing since 1993 with more than 1,500 samples analyzed for environmental contamination, including chemical and physical indicators and biological indicators like benthic community composition. The Environmental Protection Commission of Hillsborough County (EPCHC) coordinates the monitoring program with participation from Manatee and Pinellas Counties. Over the last 20 years, the condition of Tampa Bay
benthic communities baywide has been “Fair” to “Poor”, with “Good” conditions in Middle and Lower Tampa Bay in most years. Based on these long term monitoring data, increased benthic monitoring of major river systems (e.g., Hillsborough, Palm, Alafia and Little Manatee Rivers) and minor tidal tributaries is needed (see Action BH-8), and benthic community indicators and targets should be incorporated into tidal stream habitat management plans (see Actions BH-1 and BH-9).
Benthic monitoring is important for identifying hot spots of sediment contamination. Using monitoring data, the Tampa Bay Benthic Index (TBBI) provides a tool for assessing the health of benthic habitats. This index assesses the severity of contamination based on lack of diversity or abundance
of benthic organisms, low dissolved oxygen or high levels of contaminants of concern (COCs). COCs include toxic chemicals like heavy metals, polycyclic aromatic hydrocarbons (PAHs), polychlorinated biphenols (PCBs) and organic pesticides. Because COCs can persist for decades in aquatic sediments and some can bioaccumulate in the food web, these hot spots pose health risks to fish, wildlife and humans.
In 2007, the Sediment Quality Assessment Group identified eight priority “hot spot” areas in Tampa Bay with low TBBI scores, indicating elevated contamination and reduced benthic diversity. These are:
• McKay Bay
• East Bay
COC-1
Priority areas of sediment contamination in Tampa Bay. SOURCE: TBEP.
At left: Scientists prepare to sift through a sample of bay sediment to look for benthic invertebrates.
CHARTING THE COURSE: THE COMPREHENSIVE CONSERVATION AND MANAGEMENT PLAN FOR TAMPA BAY (AUGUST 2017 REVISION)
PAGE 49
Go to: TABLE OF CONTENTS | INDEX OF ACTIONS
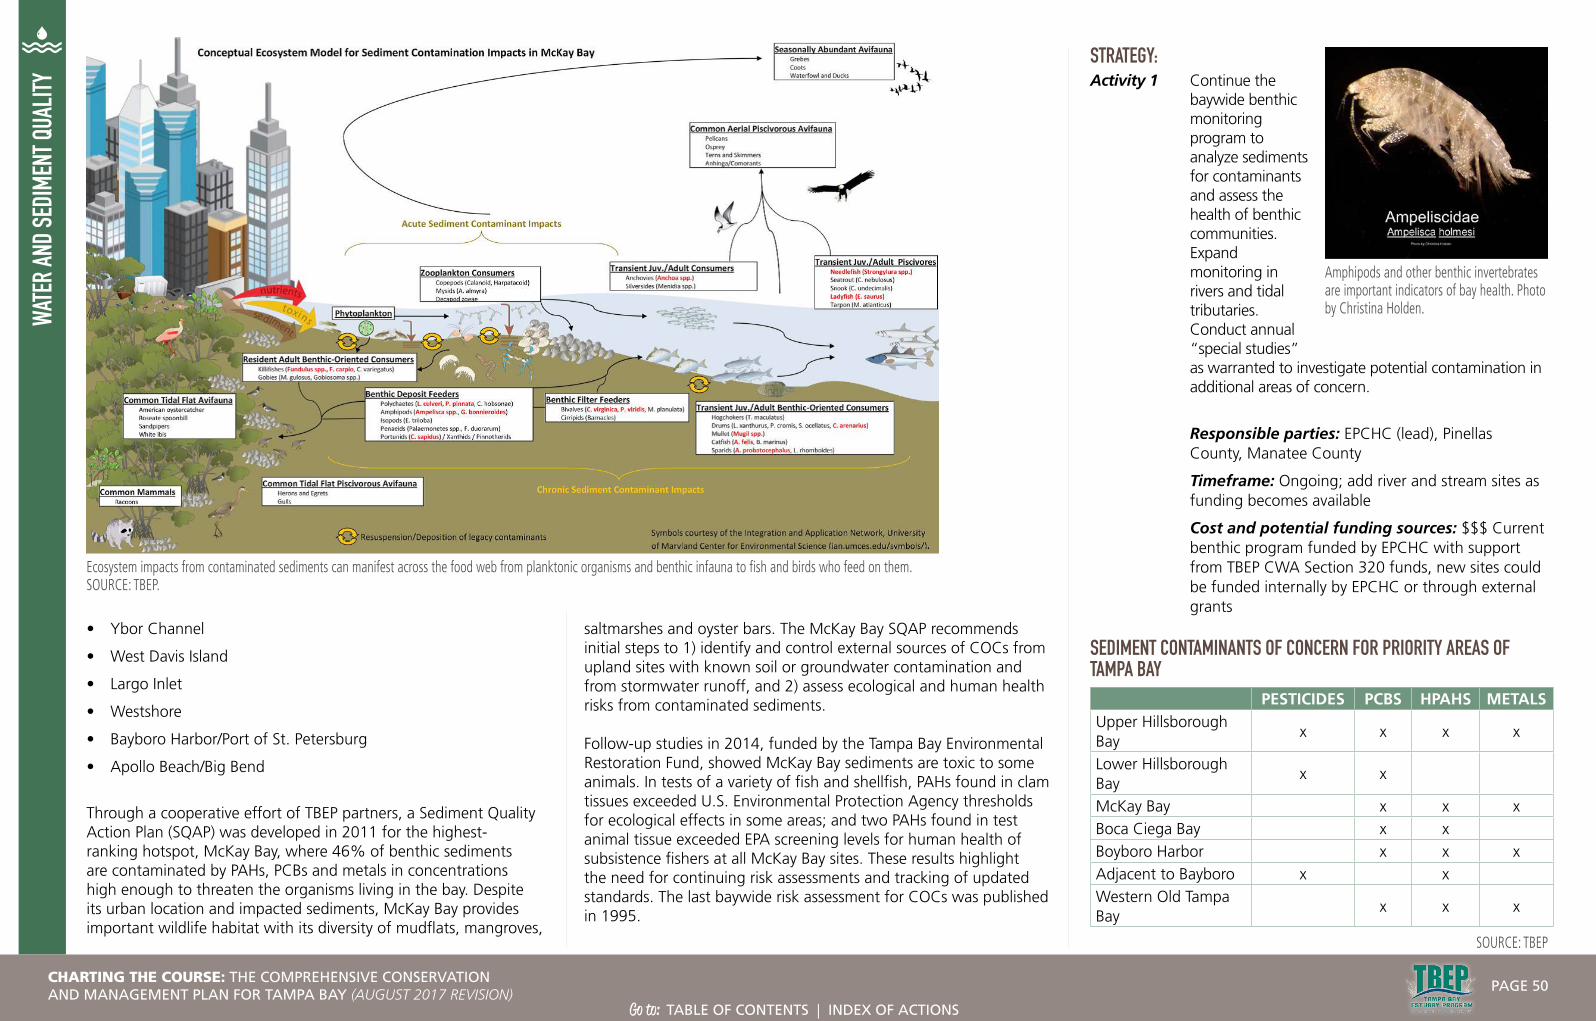
WATE
R AN
D SE
DIME
NT Q
UALIT
Y
• Ybor Channel
• West Davis Island
• Largo Inlet
• Westshore
• Bayboro Harbor/Port of St. Petersburg
• Apollo Beach/Big Bend
Through a cooperative effort of TBEP partners, a Sediment Quality Action Plan (SQAP) was developed in 2011 for the highest-ranking hotspot, McKay Bay, where 46% of benthic sediments are contaminated by PAHs, PCBs and metals in concentrations high enough to threaten the organisms living in the bay. Despite its urban location and impacted sediments, McKay Bay provides important wildlife habitat with its diversity of mudflats, mangroves,
STRATEGY:Activity 1 Continue the
baywide benthic monitoring program to analyze sediments for contaminants and assess the health of benthic communities. Expand monitoring in rivers and tidal tributaries. Conduct annual “special studies” as warranted to investigate potential contamination in additional areas of concern.
Responsible parties: EPCHC (lead), Pinellas County, Manatee County
Timeframe: Ongoing; add river and stream sites as funding becomes available
Cost and potential funding sources: $$$ Current benthic program funded by EPCHC with support from TBEP CWA Section 320 funds, new sites could be funded internally by EPCHC or through external grants
Ecosystem impacts from contaminated sediments can manifest across the food web from planktonic organisms and benthic infauna to fish and birds who feed on them. SOURCE: TBEP.
Amphipods and other benthic invertebrates are important indicators of bay health. Photo by Christina Holden.
SEDIMENT CONTAMINANTS OF CONCERN FOR PRIORITY AREAS OF TAMPA BAY
PESTICIDES PCBS HPAHS METALSUpper Hillsborough Bay
x x x x
Lower Hillsborough Bay
x x
McKay Bay x x xBoca Ciega Bay x xBoyboro Harbor x x xAdjacent to Bayboro x xWestern Old Tampa Bay
x x x
SOURCE: TBEP
saltmarshes and oyster bars. The McKay Bay SQAP recommends initial steps to 1) identify and control external sources of COCs from upland sites with known soil or groundwater contamination and from stormwater runoff, and 2) assess ecological and human health risks from contaminated sediments.
Follow-up studies in 2014, funded by the Tampa Bay Environmental Restoration Fund, showed McKay Bay sediments are toxic to some animals. In tests of a variety of fish and shellfish, PAHs found in clam tissues exceeded U.S. Environmental Protection Agency thresholds for ecological effects in some areas; and two PAHs found in test animal tissue exceeded EPA screening levels for human health of subsistence fishers at all McKay Bay sites. These results highlight the need for continuing risk assessments and tracking of updated standards. The last baywide risk assessment for COCs was published in 1995.
CHARTING THE COURSE: THE COMPREHENSIVE CONSERVATION AND MANAGEMENT PLAN FOR TAMPA BAY (AUGUST 2017 REVISION)
PAGE 50
Go to: TABLE OF CONTENTS | INDEX OF ACTIONS

WATE
R AN
D SE
DIME
NT Q
UALIT
YLocation: Baywide
Benefit/Performance measure: Number of monitoring sites analyzed.
Results: Expanded benthic monitoring in rivers and tidal tributaries will help identify additional hotspots.
Deliverables: Periodic benthic monitoring reports, incorporating additional sampling in rivers and tidal streams as feasible.
Activity 2 Incorporate benthic community targets in tidal stream habitat management plan.
Responsible parties: TBEP Sediment Quality Assessment Group
Timeframe: Following initiation of benthic sampling in tidal streams
Cost and potential funding sources: $ CWA Section 320 funds
Location: Baywide
Benefit/Performance measure: Benthic health targets established for tidal streams.
Results: Targets will help track progress in maintaining or restoring ecological health and diversity of tidal tributaries.
Deliverables: Tidal tributary management plan incorporating benthic targets.
Activity 3 Develop and implement Sediment Quality Action Plans for two priority hot spot areas: McKay Bay and Largo Inlet.
Responsible parties: EPCHC and Pinellas County
Timeframe: Initiate by 2018
Cost and potential funding sources: $$$ Potential funding sources include EPA Brownfields grant, TBERF, other federal, state or local grants
Location: McKay Bay (Hillsborough County) and Largo Inlet (Pinellas County)
Benefit/Performance measure: Risk assessment and source identification of toxic contaminants at upland sites draining to McKay Bay and Largo Inlet. Action plans addressing priority contaminated areas.
Results: Identification of land-based sources and relative contributions of toxic contaminants at two priority hot spots. Methods may serve as a model for remaining priority hot spots.
Deliverables: Reports assessing ecological and human health associated with upland sites.
Activity 4 Continue development and implementation of action plans addressing priority hot spots of contamination (as determined by the Tampa Bay Benthic Index), which may include toxicity tests on fish and wildlife. Pursue state or federal grants to implement Sediment Quality Action Plans. Identify most appropriate options to restore sediment quality in impacted areas, including in-bay remediation such as capping with clean fill or dredged material, as well as upland restoration.
Responsible parties: EPCHC, Pinellas County, Hillsborough County, SWFWMD, TBEP, Port Tampa Bay, USACE
Timeframe: Initiate by 2020
Cost and potential funding sources: $$–$$$$ Potential funding from external grants, or as part of broad multi-partner initiatives to restore habitat and use dredge material beneficially
Location: East Bay, Ybor Channel, West Davis Island, Westshore, Bayboro Harbor/Port of St. Petersburg, Apollo Beach/Big Bend
Benefit/Performance measure: Development and implementation of action plans addressing eight priority hot spots.
Results: Identification of site-specific strategies for restoring or remediating sediment quality in degraded areas.
Deliverables: Comprehensive action plans addressing priority hot spots of contamination.
Activity 5 Update risk assessments and impact levels for priority areas of contamination. Track new indicators and standards for human and ecological health and incorporate those into updated risk assessments. Incorporate applicable results and sampling techniques from McKay Bay-Largo Inlet Brownfield project in assessing additional bay sites with known or suspected toxic contamination.
Responsible parties: Potential implementing parties include EPCHC, Pinellas County, Hillsborough County, TBEP Sediment Quality Assessment Group
Timeframe: Following completion of McKay Bay-Largo Inlet Brownfields project
Cost and potential funding sources: $$–$$$ External grants
Location: Baywide, beginning with remaining priority hotspots
Benefit/Performance measure: Risk assessment of toxic contaminants at all eight priority hot spots, using existing EPA criteria where appropriate.
Results: Updated assessments of bay sediments will identify ongoing or new contaminants and quantify threats to ecological and human health.
Deliverables: Updated risk assessments utilizing revised standards for allowable levels of toxics deemed harmful for aquatic organisms and/or human health.
CHARTING THE COURSE: THE COMPREHENSIVE CONSERVATION AND MANAGEMENT PLAN FOR TAMPA BAY (AUGUST 2017 REVISION)
PAGE 51
Go to: TABLE OF CONTENTS | INDEX OF ACTIONS

WATER AND SEDIMENT QUALITY
CONTAMINANTS OF CONCERNIdentify and understand emerging contaminants
OBJECTIVES:Identify sources and understand impacts of contaminants found in pharmaceuticals, personal care products and microplastics. Promote education to reduce pollution from microplastics and emerging contaminants.
STATUS:New Action
RELATED ACTIONS:COC-1 Address hot spots of sediment
contamination
FW-5 Continue and expand the Critical Fisheries Monitoring Program
PE-1 Promote public involvement in bay restoration and protection
BACKGROUND:Aquatic environments are the ultimate reservoirs for many man-made chemical contaminants. The toxicity of pesticides and industrial chemicals, such as DDT, chlordane, dieldrin and PCBs, is well documented and their use banned or discontinued decades ago. Nevertheless, they persist in aquatic sediments and bioaccumulate in fish and wildlife in Tampa Bay (see Action COC-1).
The presence and potential effects of synthetic or natural endocrine or hormone disruptors is an emerging concern for fish and wildlife, as well as human health in Tampa Bay. Endocrine disrupting compounds (EDCs) mimic the functions of natural hormones,
affecting growth, reproduction and development in aquatic organisms, especially fish. They include polybrominated diphenyl ethers (PBDEs — used as a flame retardant in clothing, furniture and electronics) and bisphenol A (BPA — used to make plastic), which can be acutely toxic to fish and wildlife. Even at low levels these compounds can disrupt hormonal systems over time. Another class of EDCs comes from ethinyl estradiol — a synthetic estrogen used in oral contraceptives — which has been found in aquatic environments downstream of wastewater treatment plants. EDCs are also found in pesticides, insecticides and fungicides.
Additionally, a wide variety of pharmaceuticals and personal care products (PPCPs) — including lotions, shampoos, sunscreens, perfumes and cosmetics — contain constituents such as phthalates, parabens, glycol ethers, ultraviolet (UV) filters, polycyclic musks and antimicrobials, that have been linked to adverse endocrine or reproductive effects. Research has documented the presence of these chemical compounds in municipal waste effluent. At present, however, there is great uncertainty surrounding actionable levels of EDCs, and current toxicity testing required of chemical products does not evaluate endocrine-disrupting effects. Research also is needed to assess the efficacy of various wastewater treatment technologies at removing these contaminants prior to discharge or reuse.
Locally, a recent University of South Florida study1 quantified six estrogen-based EDCs in Tampa Bay Area water, sediment, and sewage influent and effluent. All targeted EDCs were present in 89% of sewage from sewer
plant discharge samples, while 100% of the samples contained at least one or more EDCs. The concentrations of EDCs in water and sediment samples tended to decrease with increasing distance from the wastewater treatment plant discharge site.
More research is needed to expand on these findings and to evaluate the ecological and human health implications of indirect reuse to augment ground water or surface water supplies in the Tampa Bay Area.
Microplastics are another emerging contaminant of concern in Tampa Bay. Generally between 1-5 millimeters in size, microplastics are small plastic particles usually derived from the breakdown of larger plastic marine debris. Another source is from the direct manufacture of microbeads, such as those found in cleansers and cosmetics. A 2015 Federal Law bans the addition of microbeads in rinse-off cosmetics by July 2017. In Tampa Bay, fibers derived from the washing of synthetic textiles (consistent with laundry lint) are the most common type of plastic particles.
COC-4
At left: Students from Eckerd College collect water samples to analyze for microplastics. Photo courtesy David Hastings.
Participants in a citizen-science workshop learn how to identify and document the presence of microplastics in bay water samples.
90% of coastal water samples in Florida contain at least one piece of plastic.
CHARTING THE COURSE: THE COMPREHENSIVE CONSERVATION AND MANAGEMENT PLAN FOR TAMPA BAY (AUGUST 2017 REVISION)
PAGE 52
Go to: TABLE OF CONTENTS | INDEX OF ACTIONS
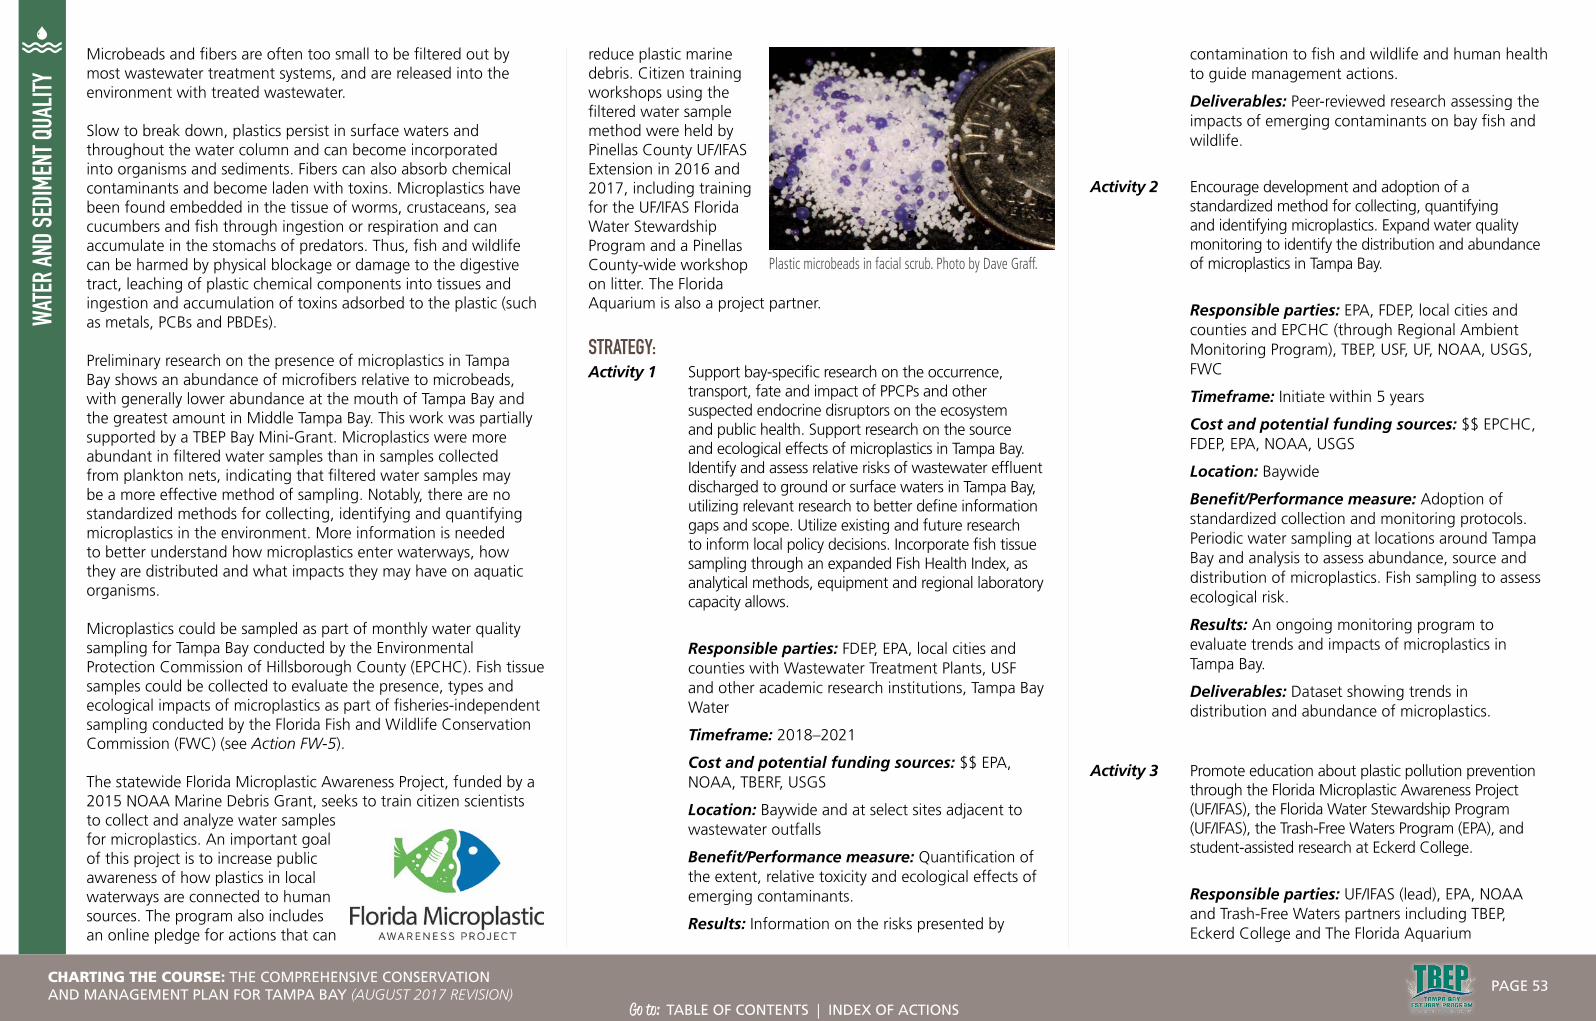
WATE
R AN
D SE
DIME
NT Q
UALIT
YMicrobeads and fibers are often too small to be filtered out by most wastewater treatment systems, and are released into the environment with treated wastewater.
Slow to break down, plastics persist in surface waters and throughout the water column and can become incorporated into organisms and sediments. Fibers can also absorb chemical contaminants and become laden with toxins. Microplastics have been found embedded in the tissue of worms, crustaceans, sea cucumbers and fish through ingestion or respiration and can accumulate in the stomachs of predators. Thus, fish and wildlife can be harmed by physical blockage or damage to the digestive tract, leaching of plastic chemical components into tissues and ingestion and accumulation of toxins adsorbed to the plastic (such as metals, PCBs and PBDEs).
Preliminary research on the presence of microplastics in Tampa Bay shows an abundance of microfibers relative to microbeads, with generally lower abundance at the mouth of Tampa Bay and the greatest amount in Middle Tampa Bay. This work was partially supported by a TBEP Bay Mini-Grant. Microplastics were more abundant in filtered water samples than in samples collected from plankton nets, indicating that filtered water samples may be a more effective method of sampling. Notably, there are no standardized methods for collecting, identifying and quantifying microplastics in the environment. More information is needed to better understand how microplastics enter waterways, how they are distributed and what impacts they may have on aquatic organisms.
Microplastics could be sampled as part of monthly water quality sampling for Tampa Bay conducted by the Environmental Protection Commission of Hillsborough County (EPCHC). Fish tissue samples could be collected to evaluate the presence, types and ecological impacts of microplastics as part of fisheries-independent sampling conducted by the Florida Fish and Wildlife Conservation Commission (FWC) (see Action FW-5).
The statewide Florida Microplastic Awareness Project, funded by a 2015 NOAA Marine Debris Grant, seeks to train citizen scientists to collect and analyze water samples for microplastics. An important goal of this project is to increase public awareness of how plastics in local waterways are connected to human sources. The program also includes an online pledge for actions that can
reduce plastic marine debris. Citizen training workshops using the filtered water sample method were held by Pinellas County UF/IFAS Extension in 2016 and 2017, including training for the UF/IFAS Florida Water Stewardship Program and a Pinellas County-wide workshop on litter. The Florida Aquarium is also a project partner.
STRATEGY:Activity 1 Support bay-specific research on the occurrence,
transport, fate and impact of PPCPs and other suspected endocrine disruptors on the ecosystem and public health. Support research on the source and ecological effects of microplastics in Tampa Bay. Identify and assess relative risks of wastewater effluent discharged to ground or surface waters in Tampa Bay, utilizing relevant research to better define information gaps and scope. Utilize existing and future research to inform local policy decisions. Incorporate fish tissue sampling through an expanded Fish Health Index, as analytical methods, equipment and regional laboratory capacity allows.
Responsible parties: FDEP, EPA, local cities and counties with Wastewater Treatment Plants, USF and other academic research institutions, Tampa Bay Water
Timeframe: 2018–2021
Cost and potential funding sources: $$ EPA, NOAA, TBERF, USGS
Location: Baywide and at select sites adjacent to wastewater outfalls
Benefit/Performance measure: Quantification of the extent, relative toxicity and ecological effects of emerging contaminants.
Results: Information on the risks presented by
contamination to fish and wildlife and human health to guide management actions.
Deliverables: Peer-reviewed research assessing the impacts of emerging contaminants on bay fish and wildlife.
Activity 2 Encourage development and adoption of a standardized method for collecting, quantifying and identifying microplastics. Expand water quality monitoring to identify the distribution and abundance of microplastics in Tampa Bay.
Responsible parties: EPA, FDEP, local cities and counties and EPCHC (through Regional Ambient Monitoring Program), TBEP, USF, UF, NOAA, USGS, FWC
Timeframe: Initiate within 5 years
Cost and potential funding sources: $$ EPCHC, FDEP, EPA, NOAA, USGS
Location: Baywide
Benefit/Performance measure: Adoption of standardized collection and monitoring protocols. Periodic water sampling at locations around Tampa Bay and analysis to assess abundance, source and distribution of microplastics. Fish sampling to assess ecological risk.
Results: An ongoing monitoring program to evaluate trends and impacts of microplastics in Tampa Bay.
Deliverables: Dataset showing trends in distribution and abundance of microplastics.
Activity 3 Promote education about plastic pollution prevention through the Florida Microplastic Awareness Project (UF/IFAS), the Florida Water Stewardship Program (UF/IFAS), the Trash-Free Waters Program (EPA), and student-assisted research at Eckerd College.
Responsible parties: UF/IFAS (lead), EPA, NOAA and Trash-Free Waters partners including TBEP, Eckerd College and The Florida Aquarium
Plastic microbeads in facial scrub. Photo by Dave Graff.
CHARTING THE COURSE: THE COMPREHENSIVE CONSERVATION AND MANAGEMENT PLAN FOR TAMPA BAY (AUGUST 2017 REVISION)
PAGE 53
Go to: TABLE OF CONTENTS | INDEX OF ACTIONS

WATE
R AN
D SE
DIME
NT Q
UALIT
YTimeframe: Ongoing
Cost and potential funding sources: $$ NOAA Marine Debris Grant, EPA, TBEP Bay Mini-Grant
Location: Baywide
Benefit/Performance measure: Public engagement on how to prevent plastic pollution.
Results: Reduction in plastic debris, microbeads and microfiber pollution.
Deliverables: Metrics on number of educational events held and citizens engaged.
Activity 4 Support legislation to reduce manufacture and use of household and personal care products containing toxic chemicals of concern and microplastics. Support legislation to require additional water or wastewater treatment to remove chemicals that pose a documented human or ecological threat.
Responsible parties: Agency on Bay Management
Timeframe: As needed
Cost and potential funding sources: No funding required
Location: Baywide
Benefit/Performance measure: Adoption of regulations phasing out production or sales of personal care products containing hormone/endocrine disruptors, microplastics and other contaminants of concern.
Results: Reduction in contaminants entering the environment directly or through municipal waste streams.
Deliverables: Adoption of laws to reduce manufacture and use of contaminants of concerns.
1 Cook, M.M. 2015. Endocrine-Disrupting Compounds: Measurement in Tampa Bay, Removal from Sewage and Development of an Estrogen Receptor Model. Graduate Theses and Dissertations.
CHARTING THE COURSE: THE COMPREHENSIVE CONSERVATION AND MANAGEMENT PLAN FOR TAMPA BAY (AUGUST 2017 REVISION)
PAGE 54
Go to: TABLE OF CONTENTS | INDEX OF ACTIONS
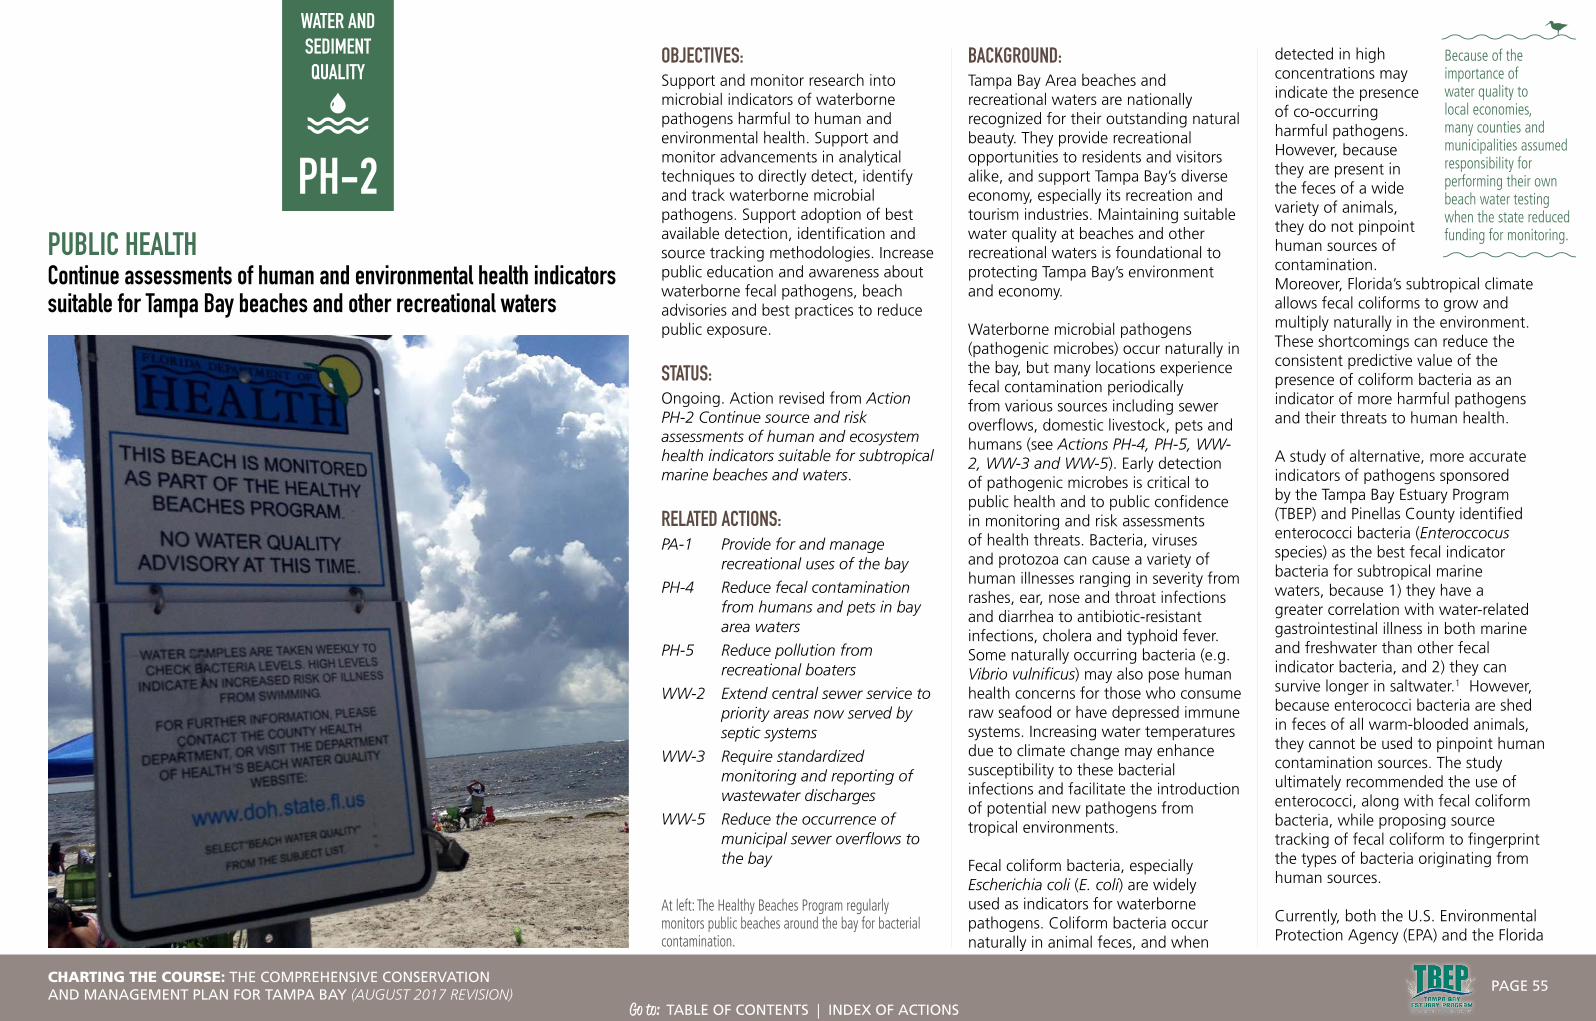
WATER AND SEDIMENT QUALITY
PUBLIC HEALTHContinue assessments of human and environmental health indicators suitable for Tampa Bay beaches and other recreational waters
Because of the importance of water quality to local economies, many counties and municipalities assumed responsibility for performing their own beach water testing when the state reduced funding for monitoring.
OBJECTIVES:Support and monitor research into microbial indicators of waterborne pathogens harmful to human and environmental health. Support and monitor advancements in analytical techniques to directly detect, identify and track waterborne microbial pathogens. Support adoption of best available detection, identification and source tracking methodologies. Increase public education and awareness about waterborne fecal pathogens, beach advisories and best practices to reduce public exposure.
STATUS:Ongoing. Action revised from Action PH-2 Continue source and risk assessments of human and ecosystem health indicators suitable for subtropical marine beaches and waters.
RELATED ACTIONS:PA-1 Provide for and manage
recreational uses of the bay
PH-4 Reduce fecal contamination from humans and pets in bay area waters
PH-5 Reduce pollution from recreational boaters
WW-2 Extend central sewer service to priority areas now served by septic systems
WW-3 Require standardized monitoring and reporting of wastewater discharges
WW-5 Reduce the occurrence of municipal sewer overflows to the bay
BACKGROUND:Tampa Bay Area beaches and recreational waters are nationally recognized for their outstanding natural beauty. They provide recreational opportunities to residents and visitors alike, and support Tampa Bay’s diverse economy, especially its recreation and tourism industries. Maintaining suitable water quality at beaches and other recreational waters is foundational to protecting Tampa Bay’s environment and economy.
Waterborne microbial pathogens (pathogenic microbes) occur naturally in the bay, but many locations experience fecal contamination periodically from various sources including sewer overflows, domestic livestock, pets and humans (see Actions PH-4, PH-5, WW-2, WW-3 and WW-5). Early detection of pathogenic microbes is critical to public health and to public confidence in monitoring and risk assessments of health threats. Bacteria, viruses and protozoa can cause a variety of human illnesses ranging in severity from rashes, ear, nose and throat infections and diarrhea to antibiotic-resistant infections, cholera and typhoid fever. Some naturally occurring bacteria (e.g. Vibrio vulnificus) may also pose human health concerns for those who consume raw seafood or have depressed immune systems. Increasing water temperatures due to climate change may enhance susceptibility to these bacterial infections and facilitate the introduction of potential new pathogens from tropical environments.
Fecal coliform bacteria, especially Escherichia coli (E. coli) are widely used as indicators for waterborne pathogens. Coliform bacteria occur naturally in animal feces, and when
detected in high concentrations may indicate the presence of co-occurring harmful pathogens. However, because they are present in the feces of a wide variety of animals, they do not pinpoint human sources of contamination. Moreover, Florida’s subtropical climate allows fecal coliforms to grow and multiply naturally in the environment. These shortcomings can reduce the consistent predictive value of the presence of coliform bacteria as an indicator of more harmful pathogens and their threats to human health.
A study of alternative, more accurate indicators of pathogens sponsored by the Tampa Bay Estuary Program (TBEP) and Pinellas County identified enterococci bacteria (Enteroccocus species) as the best fecal indicator bacteria for subtropical marine waters, because 1) they have a greater correlation with water-related gastrointestinal illness in both marine and freshwater than other fecal indicator bacteria, and 2) they can survive longer in saltwater.1 However, because enterococci bacteria are shed in feces of all warm-blooded animals, they cannot be used to pinpoint human contamination sources. The study ultimately recommended the use of enterococci, along with fecal coliform bacteria, while proposing source tracking of fecal coliform to fingerprint the types of bacteria originating from human sources.
Currently, both the U.S. Environmental Protection Agency (EPA) and the Florida
PH-2
At left: The Healthy Beaches Program regularly monitors public beaches around the bay for bacterial contamination.
CHARTING THE COURSE: THE COMPREHENSIVE CONSERVATION AND MANAGEMENT PLAN FOR TAMPA BAY (AUGUST 2017 REVISION)
PAGE 55
Go to: TABLE OF CONTENTS | INDEX OF ACTIONS

WATE
R AN
D SE
DIME
NT Q
UALIT
Y
Department of Environmental Protection (FDEP) use E. coli as an indicator of bacterial contamination in freshwater systems, and enterococci for marine waters.
Area county health departments collect water samples weekly at area beaches and analyze them for enterococci and fecal coliform bacteria. City and county water quality departments assist in collecting these samples. Area health departments issue advisories or warnings when conditions warrant, although a consistent link between exposure to indicator organisms and public health risk remains elusive.
Although great gains in protecting public health have been made using fecal indicator bacteria, viral pathogens may actually cause a significant portion of waterborne illness. Because viruses and bacteria respond differently to water treatment processes and environmental degradation, traditional fecal indicator bacteria may not be good indicators for their presence. Research into bacteriophages, or viruses that infect and replicate within bacteria, hold promise for developing better indicators of viral pathogens. EPA suggested that coliphages (viruses that infect and replicate within E. coli) may be better indicators of viruses in fecal contamination and may yield more accurate methodologies for evaluating water quality and protecting public health.2
Advances in direct pathogen identification methodologies coupled with microbial source tracking may soon revolutionize water quality analysis for human health risks. Locally, the Environmental Protection Commission of Hillsborough County (EPCHC) is funding a microbial source tracking study of fecal contamination in the Bullfrog Creek/Sweetwater Creek watersheds. Results will help pinpoint specific sources and inform reduction or prevention strategies.
New methodologies can now detect and identify the genetic material from multiple pathogens in water samples.3 This direct,
multi-target approach has the added benefit of eliminating false negatives (i.e., concluding waters are safe, when they may not be) from measuring the wrong indicator or pathogen.
Finally, advances in quantitative PCR (qPCR) as a rapid test for fecal contaminants enable same-day results, providing more timely information to beach-goers.
STRATEGY:Activity 1 Continue to support and monitor research into sources
and risks of waterborne fecal pathogens harmful to human and environmental health. Support and monitor research into new analytical techniques and indicators to directly detect and identify microbial pathogens.
• Investigate fecal indicators that more accurately indicate presence of waterborne pathogens harmful to human and environmental health.
• Investigate fecal indicators that provide information about contamination sources, i.e., methods that can discriminate between contamination from sewage versus animals (microbial source tracking).
• Explore the use of quantitative PCR (qPCR) as a rapid test to better protect public health.
• Evaluate the use of multi-target methods for detecting fecal indicators and pathogens, e.g., DNA sequencing and microarray.
• Evaluate coliphages as indicators of viral pathogens associated with fecal pollution.
• Better establish the link between exposure to certain pathogens and risk of disease — with special emphasis on at-risk populations (elderly, immunocompromised).
• Identify sources of fecal indicators (animal type, septic tank, boating, natural vegetation and sediments).
• Determine fate of fecal indicators and pathogens, i.e., how long a bacteria or virus persists before the risk becomes negligible.
• Predict weather and water conditions that
will intensify or diminish contamination.
• Evaluate the need to add additional areas to those currently monitored.
• Identify best practices to remediate fecal contamination.
Responsible parties: USF Healthy Beaches/Healthy Coasts, Florida Healthy Beaches Program (Florida Department of Health), Pinellas, Hillsborough and Manatee County health departments, FDEP, EPA, TBEP
Timeframe: Initiate in 2020, pending availability of funds
The harmful bacteria Vibrio vulnificus is transmitted by eating raw or undercooked shellfish or swimming in saltwater with an open wound. Photo from the Centers for Disease Control.
BEACHES MONITORED FOR WATER QUALITY IN THE TAMPA BAY AREA
Beaches monitored for water quality in the Tampa Bay Area. SOURCE: FDOH Florida Healthy Beaches Program.
CHARTING THE COURSE: THE COMPREHENSIVE CONSERVATION AND MANAGEMENT PLAN FOR TAMPA BAY (AUGUST 2017 REVISION)
PAGE 56
Go to: TABLE OF CONTENTS | INDEX OF ACTIONS
WATE
R AN
D SE
DIME
NT Q
UALIT
YCost and potential funding sources: $$ Federal funding agencies, including EPA, National Institutes of Health, National Science Foundation
Location: Research conducted in Tampa Bay Area waters
Benefit/Performance measure: Better understanding of sources and risks associated with fecal indicator bacteria and associated pathogens.
Results: Improved detection of pathogens in recreational waters. Improved public safety. Improved monitoring of stormwater and wastewater management in Tampa Bay watersheds.
Deliverables: Research and technical reports with recommendations for best indicators, relative risk by pathogen and tools for identifying sources of fecal indicator bacteria and pathogens.
Activity 2 Encourage adoption of best available detection, identification, source tracking and remediation techniques at state and national level. Locally, encourage use of FDEP guidance documents that present low-tech, operational practices, such as removing sediments in stormwater systems, that may substantially reduce bacteria loadings in wastewater and stormwater systems.
Responsible parties: USF Healthy Beaches/Healthy Coasts, Florida Healthy Beaches Program (Florida Department of Health), Pinellas, Hillsborough and Manatee County health departments, FDEP, EPA, TBEP
Timeframe: Initiate in 2017
Cost and potential funding sources: $–$$
Location: N/A
Benefit/Performance measure: Improved detection, identification and source tracking of pathogens in recreational waters. Improved public safety.
Results: Improved water quality analysis. Better understanding of fecal contamination sources. More relevant public notification and protection for public health.
Deliverables: Recommendations for best available water quality analysis methodologies.
Activity 3 Enhance public education and awareness about waterborne fecal pathogens, beach advisories and best practices to reduce public exposure. Post beach advisories and Healthy Beaches reports for Hillsborough, Pinellas and Manatee Counties on the Tampa Bay Water Atlas. Update the Is It Safe To Swim In The bay? fact sheet to include precautions against swimming in stormwater ponds and residential canals. Utilize rapid testing methods to provide same-day notification of contaminated water bodies.
Responsible parties: Florida Healthy Beaches Program, TBEP, Tampa Bay Water Atlas
Timeframe: Ongoing
Cost and potential funding sources: $ Federal, state or local grants
Location: Tampa Bay Area
Benefit/Performance measure: Better communication and coordination of public health notices/warnings.
Results: Improved public knowledge and safety.
Deliverables: Outreach on waterborne fecal pathogens, beach advisories and best practices to reduce public exposure. A local up-to-date, database of advisories.
1 Rose, J.B., J.H. Paul, M.R. McLaughlin, V.J. Harwood, S. Farrah, M. Tamplin, G. Lukaski, M.D. Flanery, P. Stanek, H. Greening and M. Hammond. 1999. Healthy Beaches Tampa Bay: Microbiological monitoring of water quality conditions and public health impacts. 204 pp.
2 US EPA. 2015. Review of coliphages as possible indicators of fecal contamination for ambient water quality.US EPA Office of Science and Technology, Office of Water. EPA-820-R-15-098. 119pp.
3 Li X, V.J. Harwood, B. Nayak, C. Staley, M.J. Sadowsky and J. Weidhaas. 2015. A novel microbial source tracking microarray for pathogen detection and fecal source identification in environmental systems. Environ Sci Technol 49(12):7319-29.
CHARTING THE COURSE: THE COMPREHENSIVE CONSERVATION AND MANAGEMENT PLAN FOR TAMPA BAY (AUGUST 2017 REVISION)
PAGE 57
Go to: TABLE OF CONTENTS | INDEX OF ACTIONS
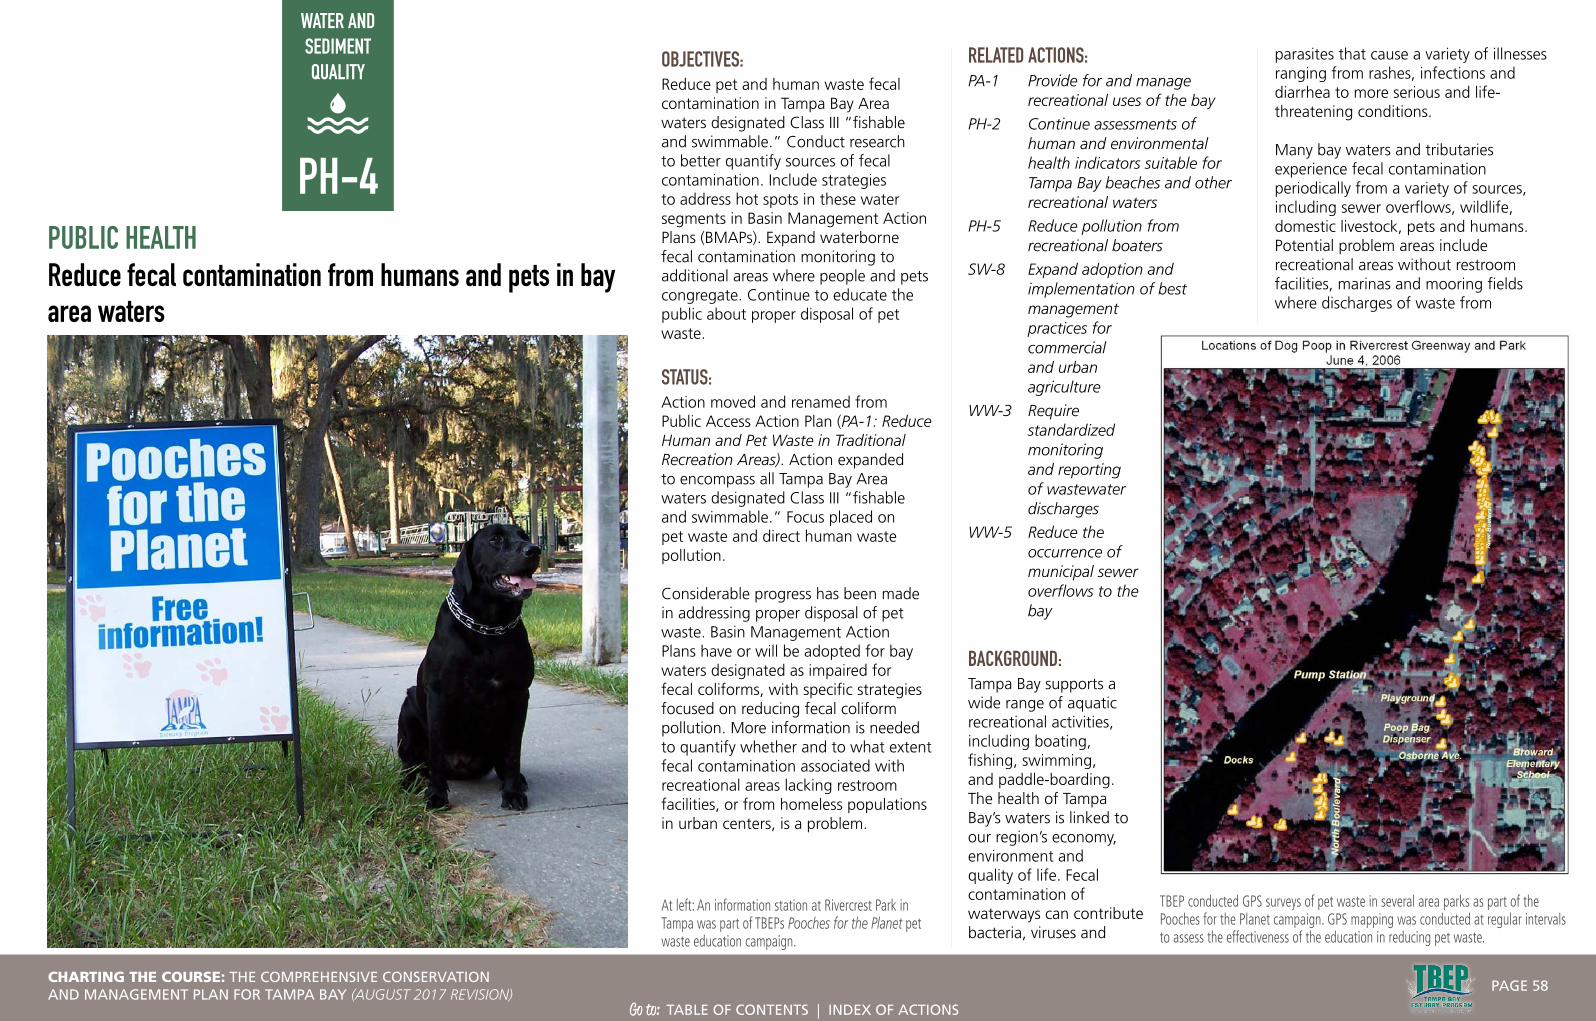
WATER AND SEDIMENT QUALITY
PUBLIC HEALTHReduce fecal contamination from humans and pets in bay area waters
OBJECTIVES:Reduce pet and human waste fecal contamination in Tampa Bay Area waters designated Class III “fishable and swimmable.” Conduct research to better quantify sources of fecal contamination. Include strategies to address hot spots in these water segments in Basin Management Action Plans (BMAPs). Expand waterborne fecal contamination monitoring to additional areas where people and pets congregate. Continue to educate the public about proper disposal of pet waste.
STATUS:Action moved and renamed from Public Access Action Plan (PA-1: Reduce Human and Pet Waste in Traditional Recreation Areas). Action expanded to encompass all Tampa Bay Area waters designated Class III “fishable and swimmable.” Focus placed on pet waste and direct human waste pollution.
Considerable progress has been made in addressing proper disposal of pet waste. Basin Management Action Plans have or will be adopted for bay waters designated as impaired for fecal coliforms, with specific strategies focused on reducing fecal coliform pollution. More information is needed to quantify whether and to what extent fecal contamination associated with recreational areas lacking restroom facilities, or from homeless populations in urban centers, is a problem.
RELATED ACTIONS:PA-1 Provide for and manage
recreational uses of the bay
PH-2 Continue assessments of human and environmental health indicators suitable for Tampa Bay beaches and other recreational waters
PH-5 Reduce pollution from recreational boaters
SW-8 Expand adoption and implementation of best management practices for commercial and urban agriculture
WW-3 Require standardized monitoring and reporting of wastewater discharges
WW-5 Reduce the occurrence of municipal sewer overflows to the bay
BACKGROUND:Tampa Bay supports a wide range of aquatic recreational activities, including boating, fishing, swimming, and paddle-boarding. The health of Tampa Bay’s waters is linked to our region’s economy, environment and quality of life. Fecal contamination of waterways can contribute bacteria, viruses and
parasites that cause a variety of illnesses ranging from rashes, infections and diarrhea to more serious and life-threatening conditions.
Many bay waters and tributaries experience fecal contamination periodically from a variety of sources, including sewer overflows, wildlife, domestic livestock, pets and humans. Potential problem areas include recreational areas without restroom facilities, marinas and mooring fields where discharges of waste from
PH-4
At left: An information station at Rivercrest Park in Tampa was part of TBEPs Pooches for the Planet pet waste education campaign.
TBEP conducted GPS surveys of pet waste in several area parks as part of the Pooches for the Planet campaign. GPS mapping was conducted at regular intervals to assess the effectiveness of the education in reducing pet waste.
CHARTING THE COURSE: THE COMPREHENSIVE CONSERVATION AND MANAGEMENT PLAN FOR TAMPA BAY (AUGUST 2017 REVISION)
PAGE 58
Go to: TABLE OF CONTENTS | INDEX OF ACTIONS

WATE
R AN
D SE
DIME
NT Q
UALIT
Yliveaboard boaters may occur (see Action PH-5) or urban waterfronts with large homeless populations.
Fecal matter from feral or free-roaming cats, or urban livestock may be a local or seasonal contributor (e.g., horse manure generated during racing season at Tampa Bay Downs). However, little is known about the magnitude of
these localized impacts; overall, bacterial levels in waste from these animals are lower than for dogs or humans. Farms and ranches in the upper parts of the watershed can be sources of fecal contamination in more rural areas of the watershed, as well as backyard chicken coops in urban areas (see Action SW-8).
Sewer overflows are addressed elsewhere in this Plan (see Actions WW-3 and WW-5), as is monitoring of formal swimming beaches by area health departments (see Action PH-2) and pollution from liveaboard boaters (see Action PH-5). This action focuses on pet waste and human waste stemming from unregulated or underserved waterways in the bay watershed.
Most surface waters in Florida are categorized as Class III waters, meaning they should be “fishable and swimmable” and support the propagation and maintenance of healthy, well-balanced populations of fish and wildlife. Under the Clean Water Act, states are required every two years to identify impaired waters that do not meet their designated uses, including those that exceed fecal coliform standards. The Florida Department of Environmental Protection (FDEP) develops a list of impaired waters in Florida and
adopts Total Maximum Daily Loads (TMDL) for priority waterbody segments it identifies as impaired. A TMDL is the maximum amount of an identified pollutant that a waterbody can assimilate while maintaining its designated uses.
Basin Management Action Plans: A Tool for Addressing Fecal Contamination
The Tampa Bay Estuary Program (TBEP) and its partners assisted FDEP in creating comprehensive Basin Management Action Plans (BMAPS) for major portions of the Hillsborough, Alafia and Manatee Rivers impaired by fecal contamination. BMAPS present locally-specific strategies to reduce pollutant loadings to levels below established TMDLs, including identifying and assessing the relative contributions of bacterial loadings from sources within a watershed, or watershed segment.
BMAPs identify projects in the following categories: Agricultural BMPs; Restoration and Water Quality Improvement Projects; Regulations, Ordinances, and Guidelines; Education and Outreach Efforts; Basic Stormwater Management Program Implementation; Wastewater Infrastructure Management, Maintenance Repair, and Upgrade; Special Studies, Planning, Monitoring, and Assessment.
The Hillsborough River BMAP (2009) was developed by FDEP in collaboration with TBEP; Hillsborough, Pasco and Polk Counties; the Cities of Plant City, Tampa, and Temple Terrace; the Environmental Protection Commission of Hillsborough County and Hillsborough County Health Department; the Florida Department
of Agriculture and Consumer Services, the Florida Department of Transportation, the Southwest Florida Water Management District and the University of Florida Institute of Food and Agricultural Sciences.
All surface waters in the Hillsborough River Basin are designated as Class III waters, with portions above the Hillsborough River Dam designated as Class 1 (potable water) and an Outstanding Florida Water. The Hillsborough River BMAP identified management strategies necessary to achieve the fecal coliform
TMDLs for six stream segments: Blackwater Creek, New River, Sparkman Branch, Baker Creek, Flint Creek and the Lower Hillsborough River.
The BMAP process in other urban areas has identified homeless populations as a potential contributor to fecal contamination. This possibility was discussed during development of the Hillsborough River BMAP; research is needed to quantify and address this sensitive issue.
Since BMAP implementation in 2009, fecal coliform levels (an indicator of fecal contamination) have generally improved in all the Hillsborough River sub-basins.1
The Alafia River BMAP (2014) is a collaborative ef-fort developed by FDEP with area-wide stakeholders, TBEP and the Tampa Bay Nitrogen Management Consortium. This BMAP addresses four water-body segments impaired for fecal coliform contamination: Turkey Creek, Mustang Ranch Creek, English Creek and Poley Creek.
The Manatee River BMAP (2014) is a collaborative effort devel-oped by FDEP with area-wide stakeholders, TBEP and the Tampa Bay Nitrogen Management Consortium. This BMAP addresses four waterbody segments impaired for fecal coliform contamination: Rattlesnake Slough, Cedar Creek, Nonsense Creek and Braden River above Evers Reservoir.
TBEP Education: Encouraging Proper Disposal of Pet WasteTBEP’s Pooches for the Planet pet waste education campaign, launched in 2006, has helped focus regional attention on a significant source of fecal coliform for which prevention is a cost-effective and simple solution.
Map showing basins impaired for fecal coliform. SOURCE: Florida Department of Environmental Protection.
TBEP continues to distribute “Getting the Scoop on Poop” doorhangers on request to neighborhoods, condo complexes and apartments.
CHARTING THE COURSE: THE COMPREHENSIVE CONSERVATION AND MANAGEMENT PLAN FOR TAMPA BAY (AUGUST 2017 REVISION)
PAGE 59
Go to: TABLE OF CONTENTS | INDEX OF ACTIONS
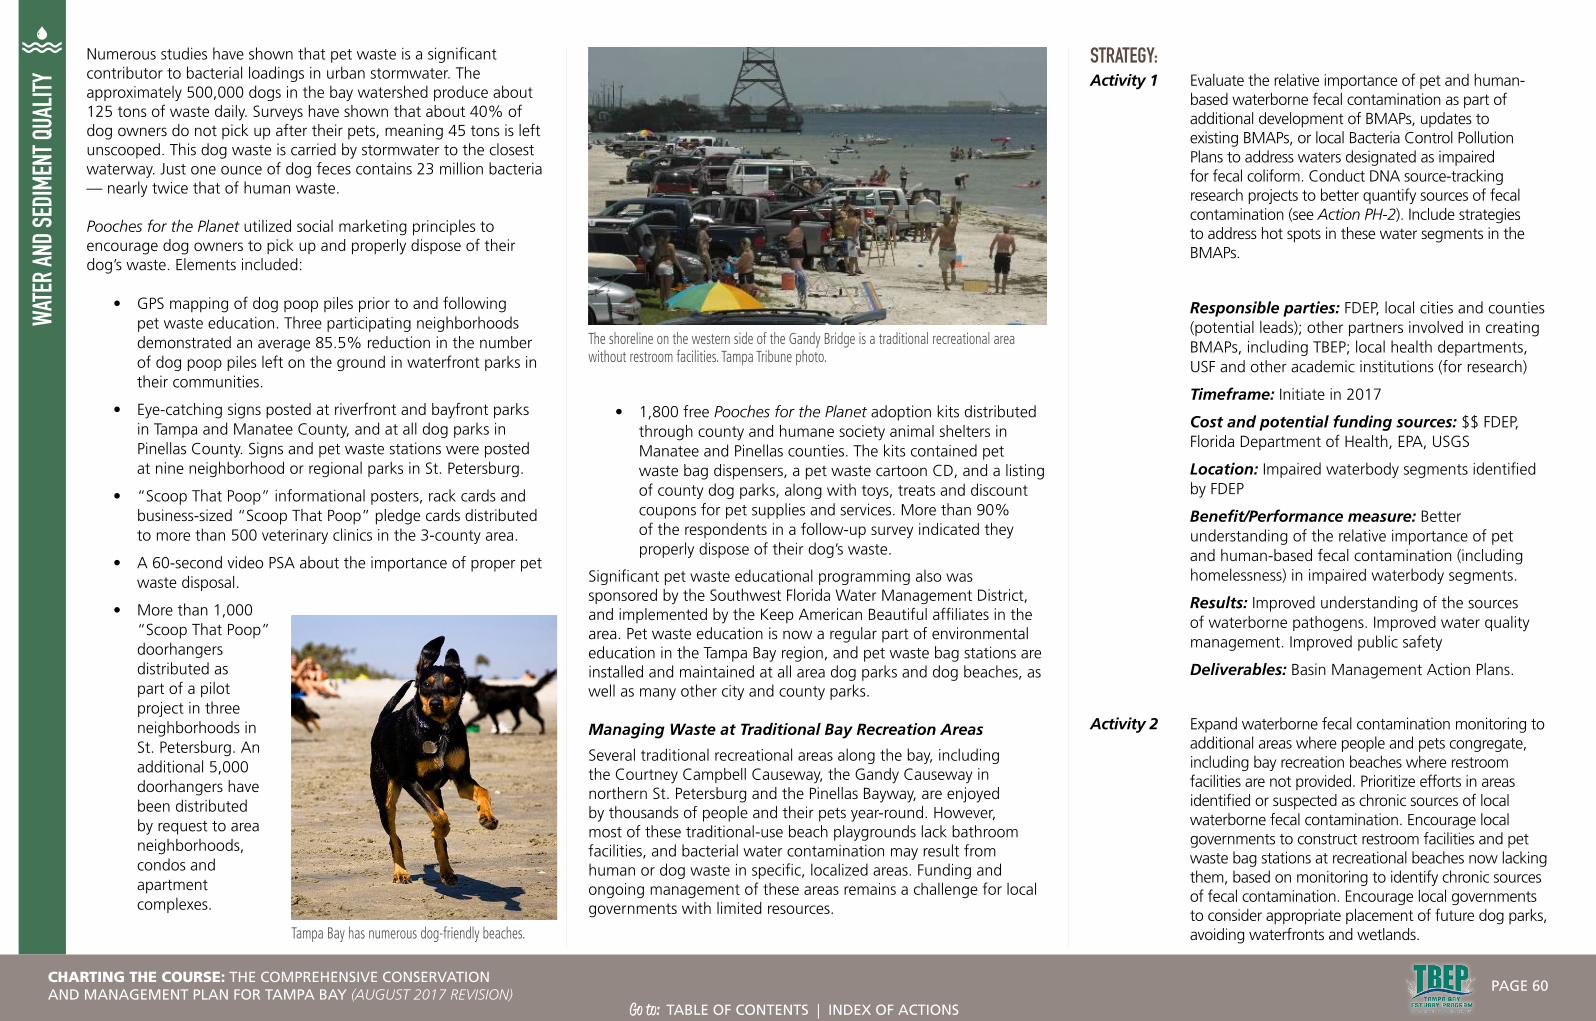
WATE
R AN
D SE
DIME
NT Q
UALIT
YNumerous studies have shown that pet waste is a significant contributor to bacterial loadings in urban stormwater. The approximately 500,000 dogs in the bay watershed produce about 125 tons of waste daily. Surveys have shown that about 40% of dog owners do not pick up after their pets, meaning 45 tons is left unscooped. This dog waste is carried by stormwater to the closest waterway. Just one ounce of dog feces contains 23 million bacteria — nearly twice that of human waste. Pooches for the Planet utilized social marketing principles to encourage dog owners to pick up and properly dispose of their dog’s waste. Elements included:
• GPS mapping of dog poop piles prior to and following pet waste education. Three participating neighborhoods demonstrated an average 85.5% reduction in the number of dog poop piles left on the ground in waterfront parks in their communities.
• Eye-catching signs posted at riverfront and bayfront parks in Tampa and Manatee County, and at all dog parks in Pinellas County. Signs and pet waste stations were posted at nine neighborhood or regional parks in St. Petersburg.
• “Scoop That Poop” informational posters, rack cards and business-sized “Scoop That Poop” pledge cards distributed to more than 500 veterinary clinics in the 3-county area.
• A 60-second video PSA about the importance of proper pet waste disposal.
• More than 1,000 “Scoop That Poop” doorhangers distributed as part of a pilot project in three neighborhoods in St. Petersburg. An additional 5,000 doorhangers have been distributed by request to area neighborhoods, condos and apartment complexes.
• 1,800 free Pooches for the Planet adoption kits distributed through county and humane society animal shelters in Manatee and Pinellas counties. The kits contained pet waste bag dispensers, a pet waste cartoon CD, and a listing of county dog parks, along with toys, treats and discount coupons for pet supplies and services. More than 90% of the respondents in a follow-up survey indicated they properly dispose of their dog’s waste.
Significant pet waste educational programming also was sponsored by the Southwest Florida Water Management District, and implemented by the Keep American Beautiful affiliates in the area. Pet waste education is now a regular part of environmental education in the Tampa Bay region, and pet waste bag stations are installed and maintained at all area dog parks and dog beaches, as well as many other city and county parks.
Managing Waste at Traditional Bay Recreation Areas
Several traditional recreational areas along the bay, including the Courtney Campbell Causeway, the Gandy Causeway in northern St. Petersburg and the Pinellas Bayway, are enjoyed by thousands of people and their pets year-round. However, most of these traditional-use beach playgrounds lack bathroom facilities, and bacterial water contamination may result from human or dog waste in specific, localized areas. Funding and ongoing management of these areas remains a challenge for local governments with limited resources.
STRATEGY:Activity 1 Evaluate the relative importance of pet and human-
based waterborne fecal contamination as part of additional development of BMAPs, updates to existing BMAPs, or local Bacteria Control Pollution Plans to address waters designated as impaired for fecal coliform. Conduct DNA source-tracking research projects to better quantify sources of fecal contamination (see Action PH-2). Include strategies to address hot spots in these water segments in the BMAPs.
Responsible parties: FDEP, local cities and counties (potential leads); other partners involved in creating BMAPs, including TBEP; local health departments, USF and other academic institutions (for research)
Timeframe: Initiate in 2017
Cost and potential funding sources: $$ FDEP, Florida Department of Health, EPA, USGS
Location: Impaired waterbody segments identified by FDEP
Benefit/Performance measure: Better understanding of the relative importance of pet and human-based fecal contamination (including homelessness) in impaired waterbody segments.
Results: Improved understanding of the sources of waterborne pathogens. Improved water quality management. Improved public safety
Deliverables: Basin Management Action Plans.
Activity 2 Expand waterborne fecal contamination monitoring to additional areas where people and pets congregate, including bay recreation beaches where restroom facilities are not provided. Prioritize efforts in areas identified or suspected as chronic sources of local waterborne fecal contamination. Encourage local governments to construct restroom facilities and pet waste bag stations at recreational beaches now lacking them, based on monitoring to identify chronic sources of fecal contamination. Encourage local governments to consider appropriate placement of future dog parks, avoiding waterfronts and wetlands. Tampa Bay has numerous dog-friendly beaches.
The shoreline on the western side of the Gandy Bridge is a traditional recreational area without restroom facilities. Tampa Tribune photo.
CHARTING THE COURSE: THE COMPREHENSIVE CONSERVATION AND MANAGEMENT PLAN FOR TAMPA BAY (AUGUST 2017 REVISION)
PAGE 60
Go to: TABLE OF CONTENTS | INDEX OF ACTIONS

WATE
R AN
D SE
DIME
NT Q
UALIT
YResponsible parties: Local cities and counties, FDEP, FDOT
Timeframe: Initiate planning in 2017
Cost and potential funding sources: $$ Local health departments and local stormwater departments
Location: Popular recreation areas and other areas that lack facilities where people and pets congregate, especially areas identified to be chronic sources of waterborne fecal contamination
Benefit/Performance measure: Restroom facilities and bag stations at popular outdoor areas where people and pets congregate will help prevent fecal contamination from entering the environment.
Results: Improved water quality and public health protection at popular recreation areas and other Class III waters.
Deliverables: Water quality monitoring results housed and available to the public on Tampa Bay Water Atlas. Restroom facilities connected to central sewer including toilets and sinks with soap and water. Pet waste bag stations and waste receptacles.
Activity 3 Continue public education campaigns to reduce pet waste in the bay watershed. Explore beneficial uses of pet waste; for example, small-scale energy generation using methane digesters to power lighting at dog parks. Expand education to include proper disposal of backyard dog waste in trash cans, and encourage cat owners to keep cats indoors and dispose of used cat litter in trash cans. Encourage best practices for small animal operations, such as horse farms and horse rental operations, that fall under existing regulatory thresholds. Encourage best practices for urban backyard chicken coops.
Responsible parties: Potential implementing entities include local cities and counties, FDEP (through state parks and preserves), FDOT (through rest stops), NGOs, TBEP, UF/IFAS
Timeframe: Ongoing
Cost and potential funding sources: $ Possible TBEP funding through Bay Mini-Grants or TBERF; grants from other sources
Location: Baywide
Benefit/Performance measure: Increased public participation in reducing pet waste in the watershed.
Results: Reduced fecal contamination from human and pet waste will improve water quality and reduce threats to public health and the environment.
Deliverables: Digital and printed public outreach tools, signs and pet waste bag stations.
1 Morrison, G., E.T. Sherwood, & H.S. Greening. 2013. Hillsborough River Fecal Coliform BMAP Update (2013). TBEP Tech Report #05-13.
CHARTING THE COURSE: THE COMPREHENSIVE CONSERVATION AND MANAGEMENT PLAN FOR TAMPA BAY (AUGUST 2017 REVISION)
PAGE 61
Go to: TABLE OF CONTENTS | INDEX OF ACTIONS

WATER AND SEDIMENT QUALITY
PUBLIC HEALTHReduce pollution from recreational boaters
OBJECTIVES: Continue to promote marina, boatyard and boater education and best practices. Increase availability of sewage pumpout stations and mobile pumpout vessels. Encourage creation of appropriately sited mooring fields near sewage pumpout facilities or services. Encourage enforcement of rules prohibiting sewage discharges, especially for liveaboards and unmaintained vessels outside of marinas or mooring fields. Survey and identify problem areas for unregulated liveaboards. Support state and local programs to remove derelict vessels.
STATUS: Moved from Action WQ-2 and revised to focus on waste management issues associated with recreational boats.
RELATED ACTIONS:BH-3 Reduce propeller scarring of
seagrass and pursue seagrass transplanting opportunities
FW-1 Increase on-water enforcement of environmental regulations
PA-1 Provide for and manage recreational uses of the bay
PE-1 Promote public involvement in bay restoration and protection
PH-4 Reduce fecal contamination from humans and pets in bay area waters
SP-2 Evaluate and update spill response plans for priority areas
BACKGROUND:More than 130,000 boats are registered in Hillsborough, Manatee, Pasco and Pinellas Counties, according to the Florida Department of Highway Safety and Motor Vehicles. Pinellas County ranked second and Hillsborough County fifth in number of registered boats statewide in 2015. The vast majority of these boats are 16 to 26 feet long. The popularity of recreational boating highlights the need for baywide adoption of responsible boating practices to protect water quality, human health and aquatic habitats.
The Florida Department of Environmental Protection (FDEP) promotes clean boating practices through a variety of programs, including the Clean Marina Program, Clean Boatyard Program, Clean Marine Retailer Program and Clean Boater Program. These voluntary recognition and designation programs provide no-cost assistance to marinas and boatyards in implementing Best Management Practices to protect sensitive habitats, manage waste and stormwater, prevent spills and prepare for emergencies. There are 45 designated Clean Marinas or Clean Boatyards in the Tampa Bay region.
Pollution resulting from improper boating practices includes sewage discharges, release of toxic chemicals, oil and fuel spills, stormwater runoff from marinas and boatyards, abandoned and derelict vessels, marine debris and discarded monofilament line or other fishing gear.
This action focuses on the need for additional sewage pumpout services for marinas, identification and management of liveaboards, removal of derelict vessels and continued education about clean boating practices for boaters, marinas and mooring fields.
Other boating impacts (such as handling of waste and monofilament line, and safe operation in manatee and seagrass areas) are addressed elsewhere in the CCMP (see Actions PE-1, PA-1, BH-3 and FW-1).
Regulating Sewage Discharges from Vessels
Discharging raw sewage into waterways threatens environmental and human health. The Clean Vessel Act of 1992 prohibits discharge of sewage into Florida’s inland and offshore waters extending nine miles out into the Gulf of Mexico. Boaters must legally store sewage generated onboard using an
2016 FLORIDA BOAT REGISTRATIONS BY COUNTY FOR DEALER, PLEASURE AND COMMERCIAL VESSELSCOUNTY DEALER PLEASURE COMMERCIAL TOTAL
Hillsborough 128 39,910 744 40,782Manatee 151 17,662 714 18527Pasco 87 23,643 406 24,136Pinellas 514 48,029 1,211 49,754Totals 880 129,244 3,0775 133,199
SOURCE: Florida Department of Highway Safety and Motor Vehicles
PH-5
At left: Removal of derelict vessels is often a lengthy and costly process for state and local agencies.
CHARTING THE COURSE: THE COMPREHENSIVE CONSERVATION AND MANAGEMENT PLAN FOR TAMPA BAY (AUGUST 2017 REVISION)
PAGE 62
Go to: TABLE OF CONTENTS | INDEX OF ACTIONS

WATE
R AN
D SE
DIME
NT Q
UALIT
Yapproved treatment device or holding tank and use an authorized waste dump receptacle, pumpout facility or pumpout vessel to permanently dispose of waste when in port.
Sewage Pumpout Services
Permits for new marinas and mooring fields, or renovations to existing ones, do not automatically require pumpout facilities or pumpout vessels. They are typically required, however, if the proposed marina or mooring field includes slips for liveaboards, or there are water quality issues in the area. Clean Marinas are encouraged, but not required, to provide pumpout facilities. As of summer 2017, pumpout facilities are available at 55 marinas in the four coastal counties of Tampa Bay, and 26 of these are Clean Marinas.
The Clean Vessel Act established a grant program administered by the U.S. Fish and Wildlife Service, which provides funding for purchase, installation, maintenance, repair and operation of boater pumpout and dump stations. The City of Clearwater purchased a pumpout vessel with Clean Vessel Act funding and provides mobile pumpout services one day a week. Facilities receiving funding from
the Act must make pumpout services available to the public for free, or for a nominal charge. As of December 2015, the Act has prevented more than 20 million gallons of sewage from contaminating Florida waterways.
Increasing access to authorized waste disposal receptacles and pumpout facilities and improving boater understanding
about the legal, environmental and human health consequences of illegal sewage discharges are important strategies to reduce sewage pollution from recreational boaters.
Illegal Discharges from Liveaboards
Special attention is required to identify and address illegal sewage discharges from liveaboards and unmaintained vessels outside of regulated marinas and mooring fields. A unified, shared spatial database of liveaboards or unmaintained boats across the Tampa Bay Area is needed to better understand the distribution and abundance of these vessels in the area and to prioritize management actions (e.g., enforcement, relocation to marinas, creation of regulated mooring fields or additional pump out vessels to service these locations) at local trouble spots.
Enforcement action is hampered by difficulties in catching violators in the act. Trouble spots may include areas around Hurricane Hole, Terra Ceia, Williams Park Boat Ramp, Clearwater Memorial Causeway and Davis Island Boat Ramp. Increasing the availability or capacity of appropriately sited mooring fields may reduce illegal sewage discharges by aggregating boats in managed areas with adjacent or mobile pumpout services.
Derelict Vessels
Abandoned and derelict vessels can cause environmental damage by physically impacting sensitive marine and coastal habitats (see Action BH-4) or by discharging sewage, oil, toxic chemicals and marine debris.
Vessels can be classified by law enforcement as “derelict” if they are “left, stored, or abandoned in a wrecked, junked, or substantially dismantled condition upon any public waters of this state, at any port in this state without the consent of the agency having jurisdiction thereof, or docked or grounded at or beached upon the property of another without the consent of the owner of the property.” Severe storms, such as hurricanes, are often a catalyst for the creation of additional derelict vessels.
It is unlawful in Florida to store, leave or abandon any derelict vessel in state waters. The Florida Fish and Wildlife Conservation Commission (FWC) or any law enforcement agency can relocate or remove any derelict vessel in the state and the vessel owner is liable for all costs. However, the time between initial identification of a derelict vessel and its eventual removal can be a long and drawn-out process, and removal is costly. For 2016, the Florida Legislature allocated $1.4 million for derelict vessel removal statewide. Hillsborough County owns its own salvage equipment for derelict vessel removal. Pinellas pays a per-foot removal fee to a contracted marine salvage company, with costs covered by the county’s share of boat registration fees.
Florida law defines a vessel at risk of becoming derelict as:
• One that is taking on or has taken on water without an effective means to get the water out;
• One with spaces that are designed to be enclosed but are incapable of being sealed off or remain open to the elements for extended periods of time;
• One that has broken loose or is in danger of breaking loose from its anchor;
• One that is left or stored aground unattended in such a condition to prevent the vessel from getting underway, or:
• One that is listing due to water intrusion, or is sunk or partially sunk.
A baywide inventory of liveaboards is needed to assist in identifying “hot spots” for sewage discharges. Photo by Nanette O’Hara
Marinas with pumpout facilities in the Tampa Bay Region. Designated Clean Marinas are encouraged but not required to provide pumpout stations. SOURCE: FDEP.
The Clean Vessel Act provides grants for sewage pumpout stations and mobile pumpout vessels. Photo courtesy BoatUS Foundation.
CHARTING THE COURSE: THE COMPREHENSIVE CONSERVATION AND MANAGEMENT PLAN FOR TAMPA BAY (AUGUST 2017 REVISION)
PAGE 63
Go to: TABLE OF CONTENTS | INDEX OF ACTIONS

WATE
R AN
D SE
DIME
NT Q
UALIT
YThe FWC’s At-Risk Vessel Program allows law enforcement agents to identify vessels at risk of becoming derelict, before they become a problem. Law enforcement officers can tag these vessels and issue violation notices to owners who refuse to improve a vessel’s seaworthiness and secure mooring or storage. At-risk vessels are tracked in a statewide database.
STRATEGY:Activity 1 Encourage greater participation in the Clean Vessel
Act grant program to finance sewage pumpout stations at marinas, or mobile pumpout services. Consider rulemaking or changes to comprehensive land use plans to require new and renovated marinas, as appropriate, to provide sewage pumpout facilities or pumpout services. Explore additional incentives to encourage operation and use of mobile pumpout services.
Responsible parties: FDEP, local governments for rulemaking or changes to local plans and promotion of Clean Vessel Act grant; Sea Grant to assist in outreach to marinas regarding the Clean Vessel Act.
Timeframe: Beginning 2017
Cost and potential funding sources: $ The Clean Vessel Act provides funding for purchase, installation, maintenance, repair and operation of boater pumpout and dump stations and for the purchase of pumpout vessels.
Location: Baywide
Benefit/Performance measure: Increased availability of sewage pumpout facilities in the Tampa Bay Area. Reduced sewage discharges from boaters.
Results: Improved water and habitat quality in Tampa Bay.
Deliverables: Sewage pumpout facilities and vessels.
Activity 2 Create a unified regional database of liveaboard vessels in the Tampa Bay Area to identify extent of problem and prioritize trouble spots. Increase enforcement of rules prohibiting sewage discharges, especially for liveaboards and unmaintained or potentially derelict vessels in trouble spots. Encourage creation
of appropriately sited mooring fields near sewage pumpout facilities or within service areas of pumpout vessels.
Responsible parties: FDEP, FWC, Coast Guard, Sea Grant, local governments, TBEP
Timeframe: Beginning 2017
Cost and potential funding sources: $ FWC; Federal, state or local grants
Location: Baywide, especially trouble spots.
Benefit/Performance measure: Relocation of boats anchored over or nearby sensitive habitat to regulated mooring fields. Reduced sewage discharges from boaters. Improved boater knowledge and bay stewardship.
Results: Improved water and habitat quality in Tampa Bay.
Deliverables: Increased availability of mooring fields. Boater education. Enforcement capacity and action.
Activity 3 Continue to promote marina, boatyard and boater outreach, education and best practices. Promote FDEP’s Clean Marina, Clean Boatyard and Clean Boater Programs. Support education and outreach to boaters about proper handling/prevention/disposal of marine debris, sewage and unwanted vessels.
Responsible parties: FDEP, local governments, Sea Grant. A new education center operated by St. Petersburg College may offer opportunities for students to assist in education of nearby boat owners and facility managers.
Timeframe: Ongoing
Cost and potential funding sources: $ Federal, state or local grants
Location: Baywide
Benefit/Performance measure: Improved boater knowledge. Reduced boater pollution. Reduced runoff pollution from marinas and boatyards.
Results: Improved water and habitat quality in Tampa Bay.
Deliverables: Education and outreach.
Activity 4 Support local and state programs to remove derelict vessels. Continue funding for At-Risk Vessel Program and derelict vessel identification and removal. Support education and outreach to prevent vessel abandonment.
Responsible parties: TBEP, FWC, local law enforcement
Timeframe: Beginning 2017
Cost and potential funding sources: $$ Local boat registration fees, state funding for FWC At-Vessel Risk Program.
Location: Baywide.
Benefit/Performance measure: Fewer derelict vessels. Less sewage, oil, toxic chemicals and marine debris discharged into the bay.
Results: Improved water and habitat quality in Tampa Bay.
Deliverables: Boater education. Derelict vessel removal.
CHARTING THE COURSE: THE COMPREHENSIVE CONSERVATION AND MANAGEMENT PLAN FOR TAMPA BAY (AUGUST 2017 REVISION)
PAGE 64
Go to: TABLE OF CONTENTS | INDEX OF ACTIONS
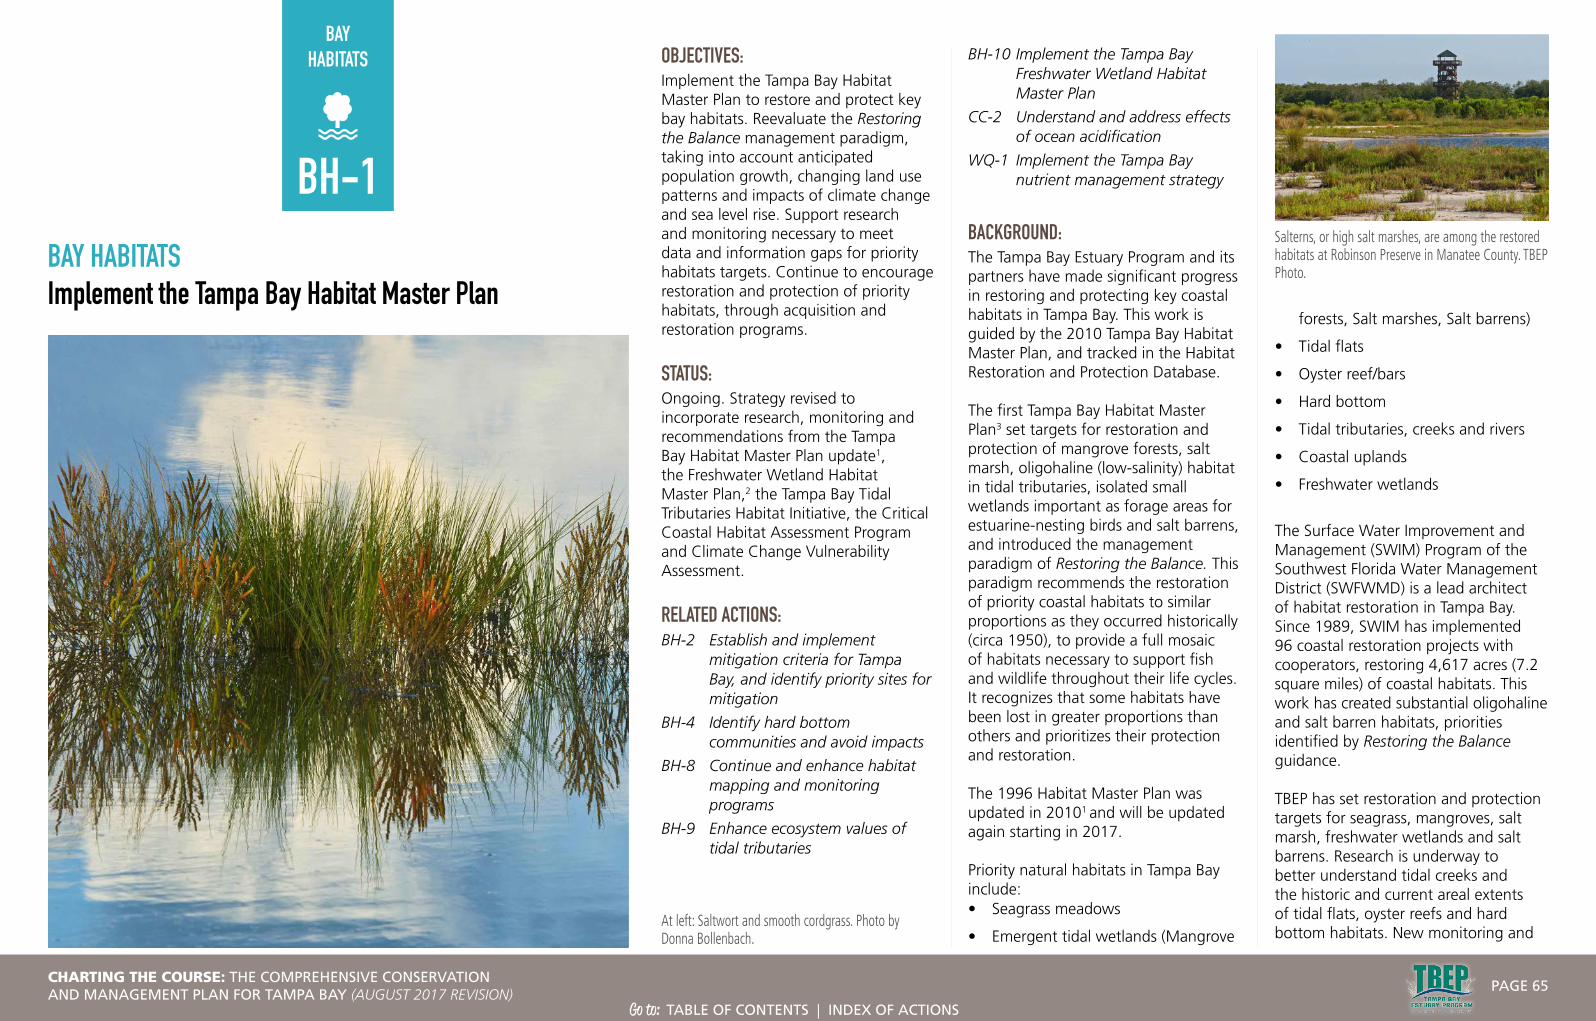
BAYHABITATS
BAY HABITATSImplement the Tampa Bay Habitat Master Plan
OBJECTIVES:Implement the Tampa Bay Habitat Master Plan to restore and protect key bay habitats. Reevaluate the Restoring the Balance management paradigm, taking into account anticipated population growth, changing land use patterns and impacts of climate change and sea level rise. Support research and monitoring necessary to meet data and information gaps for priority habitats targets. Continue to encourage restoration and protection of priority habitats, through acquisition and restoration programs.
STATUS:Ongoing. Strategy revised to incorporate research, monitoring and recommendations from the Tampa Bay Habitat Master Plan update1, the Freshwater Wetland Habitat Master Plan,2 the Tampa Bay Tidal Tributaries Habitat Initiative, the Critical Coastal Habitat Assessment Program and Climate Change Vulnerability Assessment.
RELATED ACTIONS:BH-2 Establish and implement
mitigation criteria for Tampa Bay, and identify priority sites for mitigation
BH-4 Identify hard bottom communities and avoid impacts
BH-8 Continue and enhance habitat mapping and monitoring programs
BH-9 Enhance ecosystem values of tidal tributaries
BH-10 Implement the Tampa Bay Freshwater Wetland Habitat Master Plan
CC-2 Understand and address effects of ocean acidification
WQ-1 Implement the Tampa Bay nutrient management strategy
BACKGROUND:The Tampa Bay Estuary Program and its partners have made significant progress in restoring and protecting key coastal habitats in Tampa Bay. This work is guided by the 2010 Tampa Bay Habitat Master Plan, and tracked in the Habitat Restoration and Protection Database.
The first Tampa Bay Habitat Master Plan3 set targets for restoration and protection of mangrove forests, salt marsh, oligohaline (low-salinity) habitat in tidal tributaries, isolated small wetlands important as forage areas for estuarine-nesting birds and salt barrens, and introduced the management paradigm of Restoring the Balance. This paradigm recommends the restoration of priority coastal habitats to similar proportions as they occurred historically (circa 1950), to provide a full mosaic of habitats necessary to support fish and wildlife throughout their life cycles. It recognizes that some habitats have been lost in greater proportions than others and prioritizes their protection and restoration.
The 1996 Habitat Master Plan was updated in 20101 and will be updated again starting in 2017.
Priority natural habitats in Tampa Bay include:• Seagrass meadows
• Emergent tidal wetlands (Mangrove
forests, Salt marshes, Salt barrens)
• Tidal flats
• Oyster reef/bars
• Hard bottom
• Tidal tributaries, creeks and rivers
• Coastal uplands
• Freshwater wetlands
The Surface Water Improvement and Management (SWIM) Program of the Southwest Florida Water Management District (SWFWMD) is a lead architect of habitat restoration in Tampa Bay. Since 1989, SWIM has implemented 96 coastal restoration projects with cooperators, restoring 4,617 acres (7.2 square miles) of coastal habitats. This work has created substantial oligohaline and salt barren habitats, priorities identified by Restoring the Balance guidance.
TBEP has set restoration and protection targets for seagrass, mangroves, salt marsh, freshwater wetlands and salt barrens. Research is underway to better understand tidal creeks and the historic and current areal extents of tidal flats, oyster reefs and hard bottom habitats. New monitoring and
At left: Saltwort and smooth cordgrass. Photo by Donna Bollenbach.
Salterns, or high salt marshes, are among the restored habitats at Robinson Preserve in Manatee County. TBEP Photo.
BH-1
CHARTING THE COURSE: THE COMPREHENSIVE CONSERVATION AND MANAGEMENT PLAN FOR TAMPA BAY (AUGUST 2017 REVISION)
PAGE 65
Go to: TABLE OF CONTENTS | INDEX OF ACTIONS

BAY H
ABITA
TSmapping approaches and techniques to capture large- and small-scale changes in coastal marshes and mangrove forests are being developed to better understand and potentially mitigate for climate change. Results from these ongoing projects will help managers set restoration and protection targets for tidal flats, oyster reef, hard bottom habitats and tidal tributaries, and better evaluate and track progress toward achieving targets for mangroves and coastal marshes. Standardized nomenclature to describe critical coastal habitats will be developed during the next update of the Habitat Master Plan.
Seagrass Meadows
Seagrasses are keystone species in Tampa Bay. Their lush meadows provide food, create habitat, stabilize bay bottom, filter nutrient pollution and reduce wave action and coastal erosion. They may also play an important role in creating micro-refugia from ocean acidification (see Action CC-2). Seagrasses require sufficient water clarity to receive sunlight. In Tampa Bay, water clarity is mostly affected by the density of suspended microscopic algae, which in turn is directly related to the availability of the most limiting nutrient — nitrogen. Between the 1950s and early 1980s, Tampa Bay lost nearly 20,000 acres of seagrass, mainly due to nutrient pollution and dredging.
In 1995, Tampa Bay Estuary Program set a baywide restoration target of 38,000 acres for seagrasses and implemented a strategy to improve water quality by reducing nitrogen inputs into the bay (see Action WQ-1). Since 1996, partners of the Tampa Bay
Nitrogen Management Consortium, an innovative public-private partnership, have implemented more than 500 projects to reduce nitrogen loading. Approximately 500 tons of nitrogen has been prevented from entering the bay. As a
result, water quality has improved and seagrasses are recovering. In 2015, for the first time since the 1950s, Tampa Bay achieved 40,295 acres of seagrass, surpassing the baywide target set in 1995. The target was surpassed again in 2017, when 41,655 acres of seagrass were observed.
Despite these momentous gains, seagrass communities remain vulnerable to environmental variability and human impacts. Continued biannual mapping of bay-wide seagrass coverage is necessary to identify and protect sensitive and impacted areas (see Action BH-8). Several studies have been conducted to support development of a Tampa Bay Seagrass Restoration and Protection Master Plan (to be developed as an element of the Habitat Master Plan), including a detailed analysis of historic seagrass change, species composition and condition throughout the bay, refined estimates of light requirements, estimates of wave energy and development of an initial bio-optical model. In addition, the relationship between longshore sand bars and seagrass has been studied and seagrass management areas have been established.
Emergent Tidal Wetlands (Mangrove forests, Salt marshes, Salt barrens)
Emergent tidal wetlands occur primarily along the intertidal perimeter of the bay and its tidal tributaries, and include mangrove forests, salt marshes and salt barrens. They provide food and habitat for hundreds of species of bay fish and wildlife, stabilize shoreline sediments and reduce erosion, and filter pollutants from runoff. Dominant threats to emergent tidal wetlands are dredge
and fill activities, sea level rise and modifications to bay hydrology.
From 1950-1990, almost 21 percent (4,984 acres) of emergent tidal wetlands were lost in Tampa Bay, with salt marshes and salt barrens showing the most disproportionate losses. Between 1995-2007, the areal extent of emergent tidal wetlands increased about 2% (433 acres), with mangroves showing the greatest increase (379 acres). Between 2007-2011, total emergent tidal wetlands increased by 3%, with mangroves again showing the largest gains. Over time, the relative proportion of mangroves in the bay has increased, while the proportions of salt marsh and salt barren have decreased. Rising sea level is expected to continue to drive these coastal habitat shifts with acreages of mangrove forests increasing at the expense of salt marshes and salt barrens (see Action CC-1).4
TBEP and its partners set restoration and protection targets for all three emergent tidal wetland habitats in the 2010 Habitat Master Plan. Since 2013, more than 1,050 acres and 1,000 linear feet of coastal habitat have been restored through the Tampa Bay Environmental Restoration Fund (TBERF).
Tidal Flats
Tidal flats are non-vegetated intertidal bay habitats composed of sand and organic sediments. They are found primarily along low-energy shorelines and sheltered backwaters. Tidal flats host dense assemblages of benthic invertebrates, which are an important food source for shorebirds and wading birds. SWFWMD has classified tidal flats as part of their biannual seagrass mapping
Hydroblasting with high-pressure water hoses is an efficient technique for removing spoil mounds from wetlands that were historically ditched and drained for mosquito control. Photo courtesy of SWFWMD.
Habitat restoration at the Cockroach Bay Aquatic Preserve in south Hillsborough features extensive tidal wetlands valuable as fish nurseries. Photo by Donna Bollenbach.
CHARTING THE COURSE: THE COMPREHENSIVE CONSERVATION AND MANAGEMENT PLAN FOR TAMPA BAY (AUGUST 2017 REVISION)
PAGE 66
Go to: TABLE OF CONTENTS | INDEX OF ACTIONS
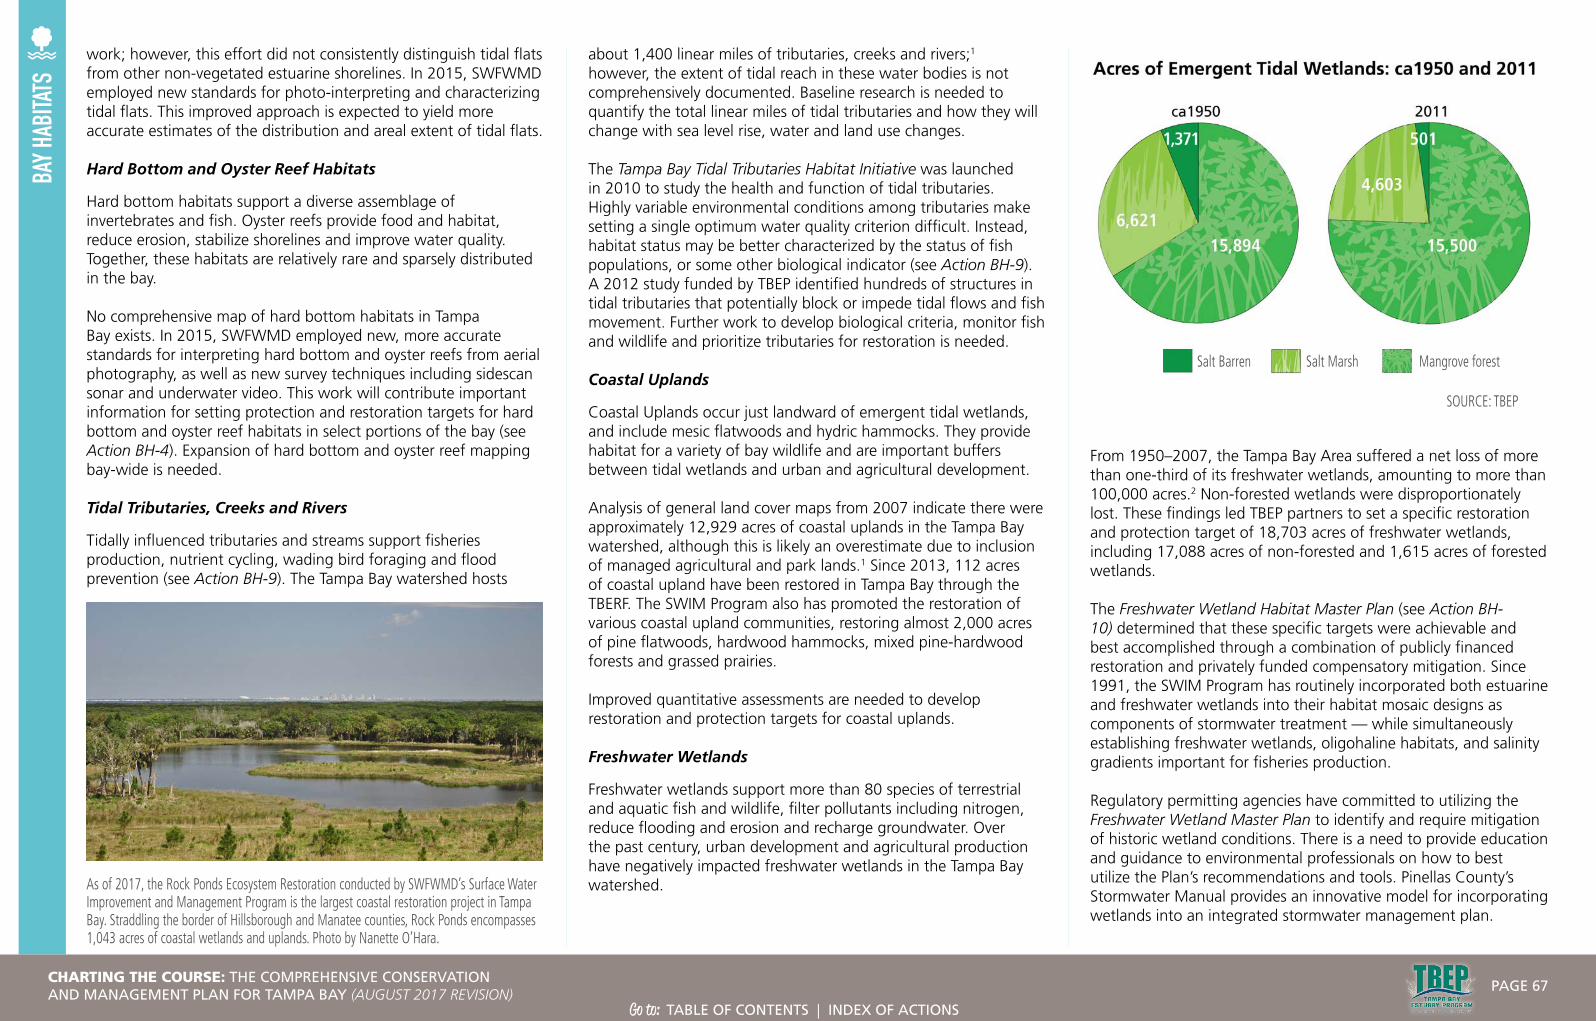
BAY H
ABITA
TSwork; however, this effort did not consistently distinguish tidal flats from other non-vegetated estuarine shorelines. In 2015, SWFWMD employed new standards for photo-interpreting and characterizing tidal flats. This improved approach is expected to yield more accurate estimates of the distribution and areal extent of tidal flats.
Hard Bottom and Oyster Reef Habitats
Hard bottom habitats support a diverse assemblage of invertebrates and fish. Oyster reefs provide food and habitat, reduce erosion, stabilize shorelines and improve water quality. Together, these habitats are relatively rare and sparsely distributed in the bay.
No comprehensive map of hard bottom habitats in Tampa Bay exists. In 2015, SWFWMD employed new, more accurate standards for interpreting hard bottom and oyster reefs from aerial photography, as well as new survey techniques including sidescan sonar and underwater video. This work will contribute important information for setting protection and restoration targets for hard bottom and oyster reef habitats in select portions of the bay (see Action BH-4). Expansion of hard bottom and oyster reef mapping bay-wide is needed.
Tidal Tributaries, Creeks and Rivers
Tidally influenced tributaries and streams support fisheries production, nutrient cycling, wading bird foraging and flood prevention (see Action BH-9). The Tampa Bay watershed hosts
about 1,400 linear miles of tributaries, creeks and rivers;1 however, the extent of tidal reach in these water bodies is not comprehensively documented. Baseline research is needed to quantify the total linear miles of tidal tributaries and how they will change with sea level rise, water and land use changes.
The Tampa Bay Tidal Tributaries Habitat Initiative was launched in 2010 to study the health and function of tidal tributaries. Highly variable environmental conditions among tributaries make setting a single optimum water quality criterion difficult. Instead, habitat status may be better characterized by the status of fish populations, or some other biological indicator (see Action BH-9). A 2012 study funded by TBEP identified hundreds of structures in tidal tributaries that potentially block or impede tidal flows and fish movement. Further work to develop biological criteria, monitor fish and wildlife and prioritize tributaries for restoration is needed.
Coastal Uplands
Coastal Uplands occur just landward of emergent tidal wetlands, and include mesic flatwoods and hydric hammocks. They provide habitat for a variety of bay wildlife and are important buffers between tidal wetlands and urban and agricultural development.
Analysis of general land cover maps from 2007 indicate there were approximately 12,929 acres of coastal uplands in the Tampa Bay watershed, although this is likely an overestimate due to inclusion of managed agricultural and park lands.1 Since 2013, 112 acres of coastal upland have been restored in Tampa Bay through the TBERF. The SWIM Program also has promoted the restoration of various coastal upland communities, restoring almost 2,000 acres of pine flatwoods, hardwood hammocks, mixed pine-hardwood forests and grassed prairies.
Improved quantitative assessments are needed to develop restoration and protection targets for coastal uplands.
Freshwater Wetlands
Freshwater wetlands support more than 80 species of terrestrial and aquatic fish and wildlife, filter pollutants including nitrogen, reduce flooding and erosion and recharge groundwater. Over the past century, urban development and agricultural production have negatively impacted freshwater wetlands in the Tampa Bay watershed.
From 1950–2007, the Tampa Bay Area suffered a net loss of more than one-third of its freshwater wetlands, amounting to more than 100,000 acres.2 Non-forested wetlands were disproportionately lost. These findings led TBEP partners to set a specific restoration and protection target of 18,703 acres of freshwater wetlands, including 17,088 acres of non-forested and 1,615 acres of forested wetlands.
The Freshwater Wetland Habitat Master Plan (see Action BH-10) determined that these specific targets were achievable and best accomplished through a combination of publicly financed restoration and privately funded compensatory mitigation. Since 1991, the SWIM Program has routinely incorporated both estuarine and freshwater wetlands into their habitat mosaic designs as components of stormwater treatment — while simultaneously establishing freshwater wetlands, oligohaline habitats, and salinity gradients important for fisheries production.
Regulatory permitting agencies have committed to utilizing the Freshwater Wetland Master Plan to identify and require mitigation of historic wetland conditions. There is a need to provide education and guidance to environmental professionals on how to best utilize the Plan’s recommendations and tools. Pinellas County’s Stormwater Manual provides an innovative model for incorporating wetlands into an integrated stormwater management plan.
As of 2017, the Rock Ponds Ecosystem Restoration conducted by SWFWMD’s Surface Water Improvement and Management Program is the largest coastal restoration project in Tampa Bay. Straddling the border of Hillsborough and Manatee counties, Rock Ponds encompasses 1,043 acres of coastal wetlands and uplands. Photo by Nanette O’Hara.
SOURCE: TBEP
Salt Barren Salt Marsh Mangrove forest
CHARTING THE COURSE: THE COMPREHENSIVE CONSERVATION AND MANAGEMENT PLAN FOR TAMPA BAY (AUGUST 2017 REVISION)
PAGE 67
Go to: TABLE OF CONTENTS | INDEX OF ACTIONS
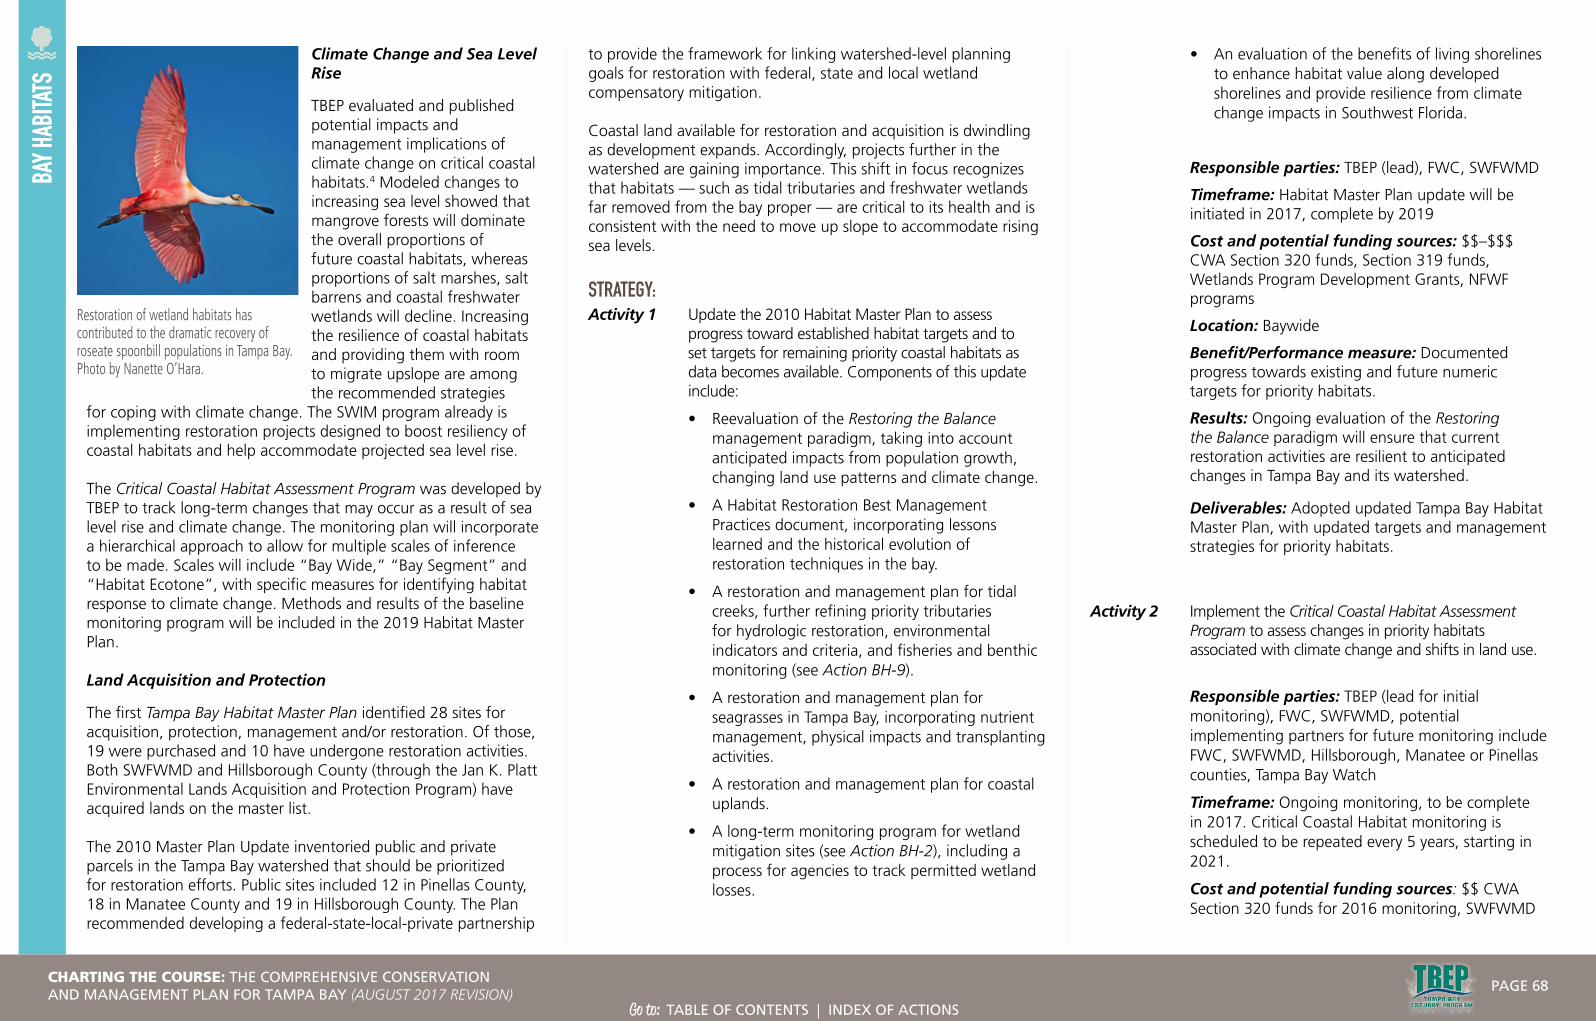
BAY H
ABITA
TSClimate Change and Sea Level Rise
TBEP evaluated and published potential impacts and management implications of climate change on critical coastal habitats.4 Modeled changes to increasing sea level showed that mangrove forests will dominate the overall proportions of future coastal habitats, whereas proportions of salt marshes, salt barrens and coastal freshwater wetlands will decline. Increasing the resilience of coastal habitats and providing them with room to migrate upslope are among the recommended strategies
for coping with climate change. The SWIM program already is implementing restoration projects designed to boost resiliency of coastal habitats and help accommodate projected sea level rise.
The Critical Coastal Habitat Assessment Program was developed by TBEP to track long-term changes that may occur as a result of sea level rise and climate change. The monitoring plan will incorporate a hierarchical approach to allow for multiple scales of inference to be made. Scales will include “Bay Wide,” “Bay Segment” and “Habitat Ecotone”, with specific measures for identifying habitat response to climate change. Methods and results of the baseline monitoring program will be included in the 2019 Habitat Master Plan.
Land Acquisition and Protection
The first Tampa Bay Habitat Master Plan identified 28 sites for acquisition, protection, management and/or restoration. Of those, 19 were purchased and 10 have undergone restoration activities. Both SWFWMD and Hillsborough County (through the Jan K. Platt Environmental Lands Acquisition and Protection Program) have acquired lands on the master list.
The 2010 Master Plan Update inventoried public and private parcels in the Tampa Bay watershed that should be prioritized for restoration efforts. Public sites included 12 in Pinellas County, 18 in Manatee County and 19 in Hillsborough County. The Plan recommended developing a federal-state-local-private partnership
to provide the framework for linking watershed-level planning goals for restoration with federal, state and local wetland compensatory mitigation.
Coastal land available for restoration and acquisition is dwindling as development expands. Accordingly, projects further in the watershed are gaining importance. This shift in focus recognizes that habitats — such as tidal tributaries and freshwater wetlands far removed from the bay proper — are critical to its health and is consistent with the need to move up slope to accommodate rising sea levels.
STRATEGY:Activity 1 Update the 2010 Habitat Master Plan to assess
progress toward established habitat targets and to set targets for remaining priority coastal habitats as data becomes available. Components of this update include:
• Reevaluation of the Restoring the Balance management paradigm, taking into account anticipated impacts from population growth, changing land use patterns and climate change.
• A Habitat Restoration Best Management Practices document, incorporating lessons learned and the historical evolution of restoration techniques in the bay.
• A restoration and management plan for tidal creeks, further refining priority tributaries for hydrologic restoration, environmental indicators and criteria, and fisheries and benthic monitoring (see Action BH-9).
• A restoration and management plan for seagrasses in Tampa Bay, incorporating nutrient management, physical impacts and transplanting activities.
• A restoration and management plan for coastal uplands.
• A long-term monitoring program for wetland mitigation sites (see Action BH-2), including a process for agencies to track permitted wetland losses.
• An evaluation of the benefits of living shorelines to enhance habitat value along developed shorelines and provide resilience from climate change impacts in Southwest Florida.
Responsible parties: TBEP (lead), FWC, SWFWMD
Timeframe: Habitat Master Plan update will be initiated in 2017, complete by 2019
Cost and potential funding sources: $$–$$$ CWA Section 320 funds, Section 319 funds, Wetlands Program Development Grants, NFWF programs
Location: Baywide
Benefit/Performance measure: Documented progress towards existing and future numeric targets for priority habitats.
Results: Ongoing evaluation of the Restoring the Balance paradigm will ensure that current restoration activities are resilient to anticipated changes in Tampa Bay and its watershed.
Deliverables: Adopted updated Tampa Bay Habitat Master Plan, with updated targets and management strategies for priority habitats.
Activity 2 Implement the Critical Coastal Habitat Assessment Program to assess changes in priority habitats associated with climate change and shifts in land use.
Responsible parties: TBEP (lead for initial monitoring), FWC, SWFWMD, potential implementing partners for future monitoring include FWC, SWFWMD, Hillsborough, Manatee or Pinellas counties, Tampa Bay Watch
Timeframe: Ongoing monitoring, to be complete in 2017. Critical Coastal Habitat monitoring is scheduled to be repeated every 5 years, starting in 2021.
Cost and potential funding sources: $$ CWA Section 320 funds for 2016 monitoring, SWFWMD
BAY H
ABITA
TS
Restoration of wetland habitats has contributed to the dramatic recovery of roseate spoonbill populations in Tampa Bay. Photo by Nanette O’Hara.
CHARTING THE COURSE: THE COMPREHENSIVE CONSERVATION AND MANAGEMENT PLAN FOR TAMPA BAY (AUGUST 2017 REVISION)
PAGE 68
Go to: TABLE OF CONTENTS | INDEX OF ACTIONS

BAY H
ABITA
TSBA
Y HAB
ITATS
Cooperative Funding, TBERF and other grants or funds.
Location: Baywide
Benefit/Performance measure: Evaluation of change in habitat extent and quality over time.
Results: Enhanced management decisions for critical bay habitats, including changes due to effects from climate change, land use changes, population growth and other factors.
Deliverables: Final report from initial monitoring, including consistent design for future use. Reports from future monitoring events evaluating changes observed every five years.
Activity 3 Continue to encourage restoration and protection of priority habitats through acquisition and restoration programs and incorporation into local comprehensive land use plans (see Action LI-1).
Responsible parties: TBEP, SWFWMD, Hillsborough County, Manatee County, Pinellas County, Pasco County; and the cities of Tampa, St. Petersburg and Clearwater; local and national land trusts (e.g., Trust for Public Lands, Tampa Bay Conservancy, The Nature Conservancy) and private landowners
Timeframe: Ongoing
Cost and potential funding sources: $$–$$$$ State or federal funds including 5-Star Restoration Grants, NFWF grant programs, local government land acquisition funds, grants, trust funds.
Location: Baywide
Benefit/Performance measure: Restored and/or protected habitat
Results: Increased quality and quantity of habitats in Tampa Bay and its watershed.
Deliverables: Annual Government Performance and Results Act (GPRA) reporting for protected and restored habitat. Maintenance of database of habitat restoration and protection projects in the Tampa Bay watershed. Updated priority acquisition list for bay and watershed.
1 Robison, D.E., Fouts, J, and Krebs A. 2010. Tampa Bay Estuary Program Habitat Master Plan Update. Tampa Bay Estuary Program Technical Publication #06-09. St. Petersburg, FL.
2 Ries, T. and Scheda, S. 2014. Master Plan for the Protection and Restoration of Freshwater Wetlands in the Tampa Bay Watershed, Florida. Tampa Bay Estuary Program Technical Publication #05-14. St. Petersburg, FL.
3 Lewis, R. R., and D. E. Robison. 1996. Setting priorities for Tampa Bay habitat protection and restoration: restoring the balance. Tampa Bay National Estuary Program Technical Publication #09-95. St. Petersburg, FL.
4 Sherwood, E.T. & Greening, H.S. Potential Impacts and Management Implications of Climate Change on Tampa Bay Estuary Critical Coastal Habitats. Environmental Management (2014) 53: 401.
CHARTING THE COURSE: THE COMPREHENSIVE CONSERVATION AND MANAGEMENT PLAN FOR TAMPA BAY (AUGUST 2017 REVISION)
PAGE 69
Go to: TABLE OF CONTENTS | INDEX OF ACTIONS

BAYHABITATS
BAY HABITATSEstablish and implement mitigation criteria
OBJECTIVES:Support progress toward habitat restoration goals by implementing mitigation criteria specific to Tampa Bay watersheds, for unavoidable wetland impacts. Identify priority sites for mitigation banks and off-site mitigation that help to achieve adopted targets for critical coastal habitats, including seagrasses, saltwater wetlands, freshwater wetlands and hard bottom habitats. Collaborate with the private sector to evaluate and improve mitigation. Establish long-term monitoring of mitigation sites across multiple habitats.
STATUS:Ongoing. Action expanded to include recommendations for on- and off-site mitigation developed through the Mitigation Criteria Working Group. The Freshwater Wetland Master Plan includes tools for directing future mitigation where most ecologically beneficial and to disproportionately impacted freshwater wetland habitats. Evaluations of mitigation success can provide a framework to improve permitting and monitoring programs across multiple habitats, with recommendations incorporated into the next update of the Tampa Bay Habitat Master Plan.
RELATED ACTIONS:BH-3 Reduce propeller scarring of
seagrass and pursue seagrass transplanting opportunities
BH-10 Implement the Tampa Bay Freshwater Wetland Habitat Master Plan
BACKGROUND:Mitigation involves restoring, enhancing, preserving or creating habitats to offset development-related impacts to wetlands, streams, seagrasses and other aquatic resources.
Unlike restoration or preservation done primarily to enhance or maintain habitat quantity and quality, mitigation is required for permitted impacts that damage or destroy wetlands and other aquatic habitats. Federal, state, regional and local agencies regulate mitigation activities.
Currently, mitigation can be achieved using three mechanisms:
• Mitigation banks (Large mitigation areas that offer “credits” for impacts. Banks must demonstrate successful restoration prior to releasing or selling credits).
• In-lieu fee programs (Monetary contributions to another entity to implement an identified large mitigation project).
• Permittee-responsible mitigation (The permit applicant conducts the mitigation activity).
Preservation, restoration and acquisition of existing wetlands is preferred. However, if wetland impacts are unavoidable, specific guidelines govern how, where and what type of mitigation must be conducted, and monitoring of project success. Mitigation may involve
creation, enhancement, restoration or preservation of habitats. It can occur on the same site as the development activities, if space allows; off-site at an appropriate location; or at a mitigation bank. Long-term success of mitigation projects is variable and highly dependent upon the location, size, type of habitat created and maintenance provided.
Regulatory agencies generally prefer mitigation banking or use of in-lieu fees because the larger scale and scope of these tools maximizes habitat benefits — especially when mitigation for smaller wetland mitigation projects (less than a few acres) can be bundled into larger parcels. There are multiple existing and planned mitigation banks in the bay watershed for both private and public development and infrastructure activities. The majority offer freshwater mitigation credits. Several mitigation banks are currently under review by regulatory agencies, but are not yet approved to release credits. Service areas for permitted mitigation banks generally encompass an entire watershed; applicants may
At left: An evaluation of freshwater wetland mitigation projects in Hillsborough County indicated that larger wetlands provided more ecosystem services and performed better than smaller wetlands surrounded by urban development. Photo by Nanette O’Hara.
Various fern species are common features of forested freshwater wetlands. Photo by Nanette O’Hara.
BH-2
CHARTING THE COURSE: THE COMPREHENSIVE CONSERVATION AND MANAGEMENT PLAN FOR TAMPA BAY (AUGUST 2017 REVISION)
PAGE 70
Go to: TABLE OF CONTENTS | INDEX OF ACTIONS
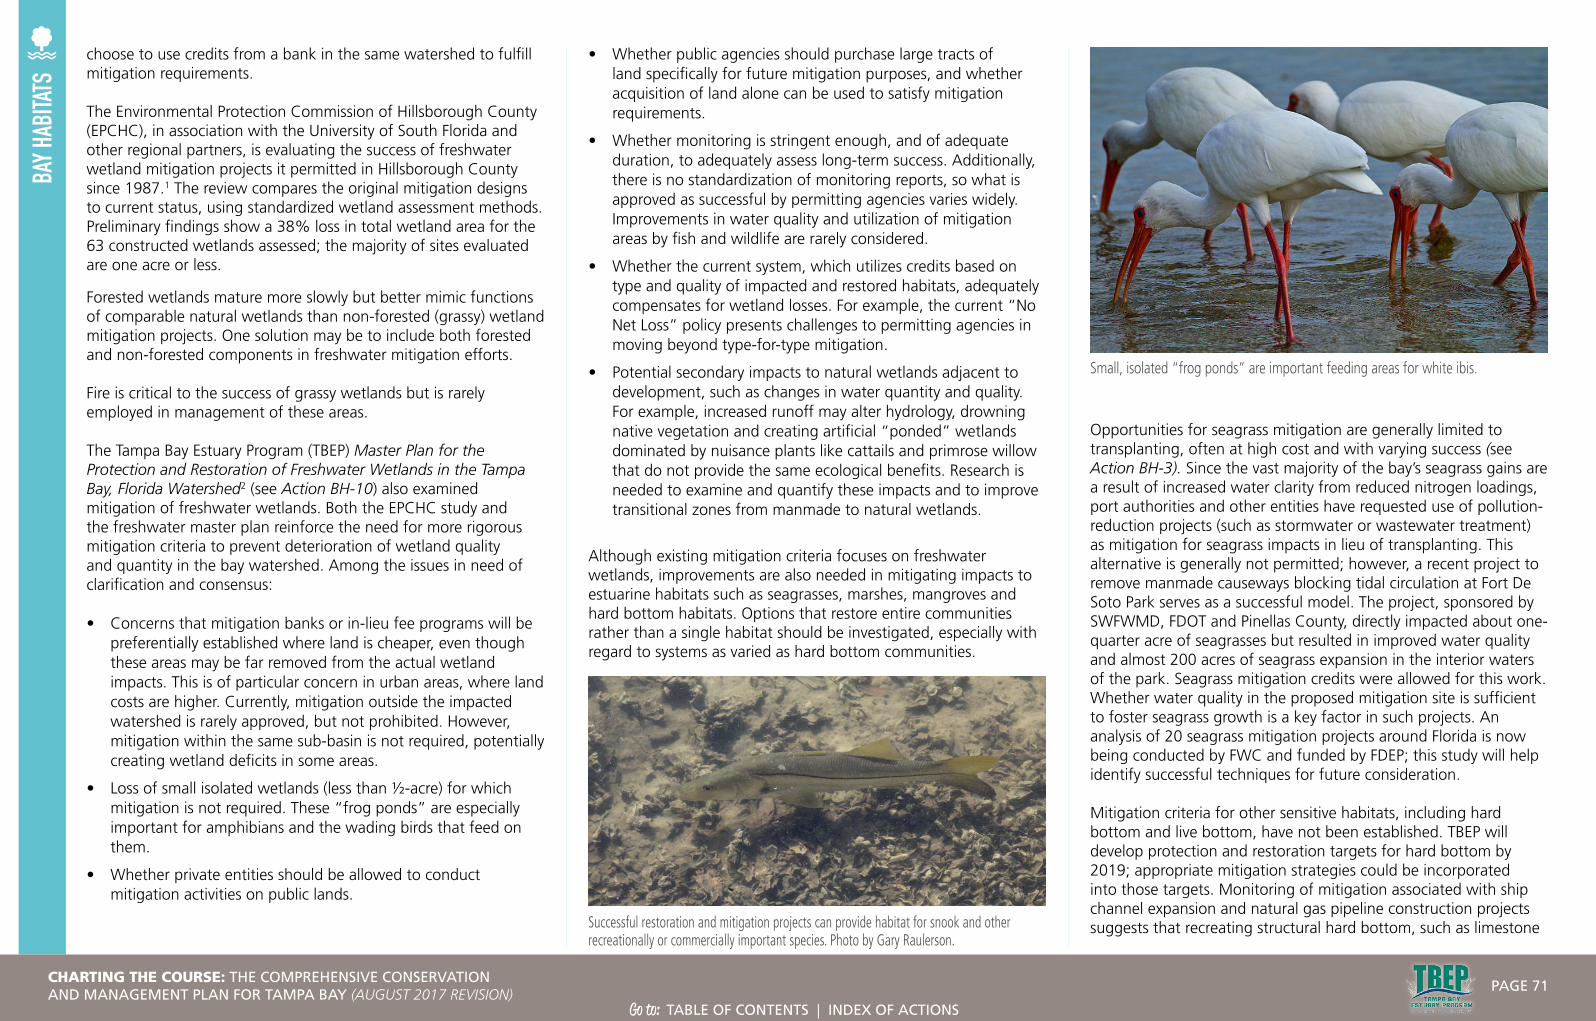
BAY H
ABITA
TSchoose to use credits from a bank in the same watershed to fulfill mitigation requirements.
The Environmental Protection Commission of Hillsborough County (EPCHC), in association with the University of South Florida and other regional partners, is evaluating the success of freshwater wetland mitigation projects it permitted in Hillsborough County since 1987.1 The review compares the original mitigation designs to current status, using standardized wetland assessment methods. Preliminary findings show a 38% loss in total wetland area for the 63 constructed wetlands assessed; the majority of sites evaluated are one acre or less.
Forested wetlands mature more slowly but better mimic functions of comparable natural wetlands than non-forested (grassy) wetland mitigation projects. One solution may be to include both forested and non-forested components in freshwater mitigation efforts.
Fire is critical to the success of grassy wetlands but is rarely employed in management of these areas.
The Tampa Bay Estuary Program (TBEP) Master Plan for the Protection and Restoration of Freshwater Wetlands in the Tampa Bay, Florida Watershed2 (see Action BH-10) also examined mitigation of freshwater wetlands. Both the EPCHC study and the freshwater master plan reinforce the need for more rigorous mitigation criteria to prevent deterioration of wetland quality and quantity in the bay watershed. Among the issues in need of clarification and consensus:
• Concerns that mitigation banks or in-lieu fee programs will be preferentially established where land is cheaper, even though these areas may be far removed from the actual wetland impacts. This is of particular concern in urban areas, where land costs are higher. Currently, mitigation outside the impacted watershed is rarely approved, but not prohibited. However, mitigation within the same sub-basin is not required, potentially creating wetland deficits in some areas.
• Loss of small isolated wetlands (less than ½-acre) for which mitigation is not required. These “frog ponds” are especially important for amphibians and the wading birds that feed on them.
• Whether private entities should be allowed to conduct mitigation activities on public lands.
• Whether public agencies should purchase large tracts of land specifically for future mitigation purposes, and whether acquisition of land alone can be used to satisfy mitigation requirements.
• Whether monitoring is stringent enough, and of adequate duration, to adequately assess long-term success. Additionally, there is no standardization of monitoring reports, so what is approved as successful by permitting agencies varies widely. Improvements in water quality and utilization of mitigation areas by fish and wildlife are rarely considered.
• Whether the current system, which utilizes credits based on type and quality of impacted and restored habitats, adequately compensates for wetland losses. For example, the current “No Net Loss” policy presents challenges to permitting agencies in moving beyond type-for-type mitigation.
• Potential secondary impacts to natural wetlands adjacent to development, such as changes in water quantity and quality. For example, increased runoff may alter hydrology, drowning native vegetation and creating artificial “ponded” wetlands dominated by nuisance plants like cattails and primrose willow that do not provide the same ecological benefits. Research is needed to examine and quantify these impacts and to improve transitional zones from manmade to natural wetlands.
Although existing mitigation criteria focuses on freshwater wetlands, improvements are also needed in mitigating impacts to estuarine habitats such as seagrasses, marshes, mangroves and hard bottom habitats. Options that restore entire communities rather than a single habitat should be investigated, especially with regard to systems as varied as hard bottom communities.
Opportunities for seagrass mitigation are generally limited to transplanting, often at high cost and with varying success (see Action BH-3). Since the vast majority of the bay’s seagrass gains are a result of increased water clarity from reduced nitrogen loadings, port authorities and other entities have requested use of pollution-reduction projects (such as stormwater or wastewater treatment) as mitigation for seagrass impacts in lieu of transplanting. This alternative is generally not permitted; however, a recent project to remove manmade causeways blocking tidal circulation at Fort De Soto Park serves as a successful model. The project, sponsored by SWFWMD, FDOT and Pinellas County, directly impacted about one-quarter acre of seagrasses but resulted in improved water quality and almost 200 acres of seagrass expansion in the interior waters of the park. Seagrass mitigation credits were allowed for this work. Whether water quality in the proposed mitigation site is sufficient to foster seagrass growth is a key factor in such projects. An analysis of 20 seagrass mitigation projects around Florida is now being conducted by FWC and funded by FDEP; this study will help identify successful techniques for future consideration.
Mitigation criteria for other sensitive habitats, including hard bottom and live bottom, have not been established. TBEP will develop protection and restoration targets for hard bottom by 2019; appropriate mitigation strategies could be incorporated into those targets. Monitoring of mitigation associated with ship channel expansion and natural gas pipeline construction projects suggests that recreating structural hard bottom, such as limestone Successful restoration and mitigation projects can provide habitat for snook and other
recreationally or commercially important species. Photo by Gary Raulerson.
Small, isolated “frog ponds” are important feeding areas for white ibis.
CHARTING THE COURSE: THE COMPREHENSIVE CONSERVATION AND MANAGEMENT PLAN FOR TAMPA BAY (AUGUST 2017 REVISION)
PAGE 71
Go to: TABLE OF CONTENTS | INDEX OF ACTIONS

BAY H
ABITA
TS
or rock reefs or outcroppings, is much simpler and more successful than transplanting the soft corals and sponges that grow on the hard substrates.
STRATEGY:Activity 1 Complete evaluation of long-term success of
constructed freshwater wetlands in Hillsborough County. Incorporate recommendations into future permitting guidance.
Responsible parties: EPCHC (lead for evaluation), SWFWMD, USF, USGS, FDEP, USACE
Timeframe: Evaluation to be completed in 2016. Recommendations to be implemented beginning in 2017.
Cost and potential funding sources: $$ Work funded by EPCHC through an EPA Region IV Wetland Development Grant
Location: Hillsborough County
Benefit/Performance measure: Increased percentage of freshwater wetland mitigation deemed successful through development and implementation of recommendations to improve long-term ecological viability.
Results: Improved long-term mitigation to achieve adopted targets for restoration and protection of freshwater wetlands, especially for non-forested freshwater wetlands that have been lost in greater proportion in the bay watershed.
Deliverables: Summary report of long-term success of constructed freshwater wetlands, including recommendations for improvement.
Activity 2 Establish a long-term monitoring program to evaluate mitigation success of freshwater wetlands, estuarine wetlands, hard bottom and other habitat types. Incorporate applicable methodologies from EPCHC’s freshwater wetland mitigation assessment. Consider criteria for utilization of mitigation sites by fish and wildlife as a measure of success. Identify funding sources and partners. Conduct monitoring, encompassing on- and off-site mitigation activities across multiple habitat types and mitigation strategies.
Responsible parties: TBEP’s TAC (lead on monitoring design), potential pilot implementing partners include EPCHC, SWFWMD, FDEP, FDOT
Timeframe: Develop monitoring protocols as part of the 2017–2019 Habitat Master Plan update. Conduct initial pilot monitoring project by 2020
Cost and potential funding sources: $$ Potential funding sources to conduct pilot monitoring include external grants such as EPA Region IV Wetland
Development Grant, TBERF or other research funds.
Location: Baywide
Benefit/Performance measure: Increased percentage of successful mitigation activities for coastal wetland habitats and other aquatic resources, such as seagrasses, mangroves and salt marshes.
Results: Enhanced long-term mitigation success contributing to achievement of protection and restoration targets.
Deliverables: Recommendations for long-term monitoring protocols for wetland and hard bottom mitigation sites. Monitoring reports.
Activity 3 Evaluate impacts to natural wetlands adjacent to development, considering changes to hydrology, vegetation and water quality. Design, implement and evaluate a pilot project. Develop long-term monitoring protocols to track changes in function and quality.
Responsible parties: TBEP’s TAC for project design to assess impacts to natural wetlands adjacent to development, potential pilot implementing partners include EPCHC, SWFWMD, FDEP, local cities and counties
Timeframe: Develop project design in 2020. Conduct pilot project by 2021.
Mitigation for forested freshwater wetlands, including mixed hardwood swamps, is generally less successful than for non-forested, grassy wetlands. Photo by Nanette O’Hara.
CHARTING THE COURSE: THE COMPREHENSIVE CONSERVATION AND MANAGEMENT PLAN FOR TAMPA BAY (AUGUST 2017 REVISION)
PAGE 72
Go to: TABLE OF CONTENTS | INDEX OF ACTIONS

BAY H
ABITA
TSCost and potential funding sources: $$–$$$ CWA Section 320 funds, potential external grants, such as EPA Regional Wetland Development grant
Location: Baywide
Benefit/Performance measure: Development of pilot project design. Completion of pilot project.
Results: Enhanced understanding of impacts to wetlands from adjacent development.
Deliverables: Report evaluating pilot project and recommendations for next steps. Recommendations for monitoring of development-related impacts to adjacent wetlands.
Activity 4 Host a workshop with local environmental managers and mitigation bankers to explore locations and opportunities for mitigation banks and/or regional off-site mitigation areas, especially in areas with wetland deficits and impaired waters. Create incentives such as streamlined permitting for smaller mitigation banks in targeted sub-basins.
Responsible parties: ABM (lead), SWFWMD, FDEP, EPCHC, USACE, Pinellas County, Manatee County, Hillsborough County, mitigation bankers, land trusts, non-profit restoration agencies
Timeframe: Workshop in 2018 with recommendations for rule revisions following
Cost and potential funding sources: $ Planning grants
Location: Baywide
Benefit/Performance measure: Identification of potential new mitigation banks and/or regional off-site mitigation areas throughout the bay watershed.
Results: Improved coordination among publicly- and privately-funded mitigation sponsors leading to achievement of protection and restoration targets.
Deliverables: Priority list of targeted sub-basins and suitable sites for mitigation banks and/or regional off-site mitigation areas.
Activity 5 Examine the use of water quality improvement projects in lieu of transplanting seagrass to mitigate development-related seagrass impacts. Using the Fort De Soto recirculation project as a model, develop guidelines, considerations and incentives for acceptable use of water quality enhancement projects as a mitigation tool by permitting agencies.
Responsible parties: Tampa Bay NMC (lead), permitting agencies
Timeframe: 2018
Cost and potential funding sources: $ CWA Section 320 funds for TBEP staff time, in-kind staff support from permitting agencies
Location: Baywide
Benefit/Performance measure: Regulatory flexibility in allowing water quality improvement projects as mitigation to offset seagrass impacts, where feasible and appropriate.
Results: Reduced nitrogen loading leading to natural recruitment and recovery of seagrasses.
Deliverables: Guidelines for appropriate use and incentives for utilizing water quality projects as a seagrass mitigation tool.
Activity 6 Develop and maintain a standardized regional database of mitigation projects that includes permitted mitigation designs and monitoring reports for critical coastal habitats, including seagrasses, hard bottom (including artificial reef balls as well as oyster reefs) and freshwater and saltwater wetlands. The analysis of 20 seagrass mitigation projects now underway could serve as the foundation of a statewide inventory.
Responsible parties: FDEP SW District, EPCHC (Leads), FDOT, USACE, SWFWMD, EPCHC, FWC (for seagrass mitigation evaluation), SW Florida Seagrass Working Group
Timeframe: FWC evaluation of 20 seagrass mitigation projects to be completed by 2017. Seagrass database could be developed in 2018, with
Mangroves quickly recruit into newly restored tidal wetlands in Tampa Bay. Photo by Nanette O’Hara.
input from SW Florida Seagrass Working Group, other databases to follow
Cost and potential funding sources: $ EPA Wetland Development Grant
Location: Baywide
Benefit/Performance measure: Standardized database(s) with timely, updated information about mitigation activities for a broad suite of habitats.
Results: Improved tracking and evaluation of mitigation activities that identify best practices and techniques leading to greatest ecological benefit.
Deliverables: Regional electronic databases with timely information about design and scope of permitted mitigation projects and monitoring results.
1 Brown, A. and Crisman, T. 2015. Long-Term Availability of Constructed Freshwater Wetlands in Hillsborough County. Presentation to 6th Bay Area Scientific Information Symposium.
2 Ries, T. and Scheda, S. 2014. Master Plan for the Protection and Restoration of Freshwater Wetlands in the Tampa Bay Watershed, Florida. Tampa Bay Estuary Program Technical Publication #05-14. St. Petersburg, FL.
CHARTING THE COURSE: THE COMPREHENSIVE CONSERVATION AND MANAGEMENT PLAN FOR TAMPA BAY (AUGUST 2017 REVISION)
PAGE 73
Go to: TABLE OF CONTENTS | INDEX OF ACTIONS

BAYHABITATS
BAY HABITATSReduce propeller scarring of seagrass and pursue seagrass transplanting opportunities
OBJECTIVES: Enhance seagrass recovery by reducing propeller scarring of seagrass; evaluate effectiveness of seagrass planting techniques; pursue seagrass restoration opportunities at appropriate sites and continue boater education.
STATUS: Ongoing. Action updated to reflect adoption of extensive manatee protection zones that also protect seagrasses. Action also updates propeller scarring and seagrass transplanting research. Strategy revised to focus scope of seagrass transplanting program, and to evaluate effectiveness of manatee zones in reducing propeller scarring. Targeted boater education is an important element of this Action.
RELATED ACTIONS:FW-1 Increase on-water enforcement
of environmental regulations
FW-6 Preserve the diversity and abundance of bay wildlife
PE-1 Promote public involvement in bay restoration and protection
PE-2 Promote public education about key issues affecting the bay
BACKGROUND:Seagrasses create important habitat and forage for many important bay species (see Action BH-1). Seagrass meadows are relatively fragile and can easily be damaged by human activity, such as careless boat operation that leaves propeller scars resembling plowed furrows.
Substantial progress has been made in implementing actions which may reduce seagrass scarring. An extensive network of year-round and seasonal slow speed zones established primarily for manatee protection also serves to safeguard seagrasses in shallow nearshore waters — although adequate enforcement of these zones remains a challenge (see Actions FW-1 and FW-6). Slow speed zones generally encompass waters 6 feet deep or less, mirroring the average depth range of seagrass beds in the bay.
No-motor or “poll and troll” zones at Weedon Island and sections of Fort De Soto Park also help protect manatees and seagrasses by restricting use of internal combustion engines in shallow waters. No-entry security zones around MacDill Air Force Base and Port Manatee provide de facto seagrass protection.
Although limited seagrass transplanting has been implemented in several areas around Tampa Bay, evaluation of
BH-3
A diver measures the width of a prop scar in a seagrass bed. Photo courtesy Florida Department of Environmental Protection.
Propeller scars in seagrasses in Lower Tampa Bay near Fort De Soto Park. Photo courtesy Tampa Bay Watch.
CHARTING THE COURSE: THE COMPREHENSIVE CONSERVATION AND MANAGEMENT PLAN FOR TAMPA BAY (AUGUST 2017 REVISION)
PAGE 74
Go to: TABLE OF CONTENTS | INDEX OF ACTIONS
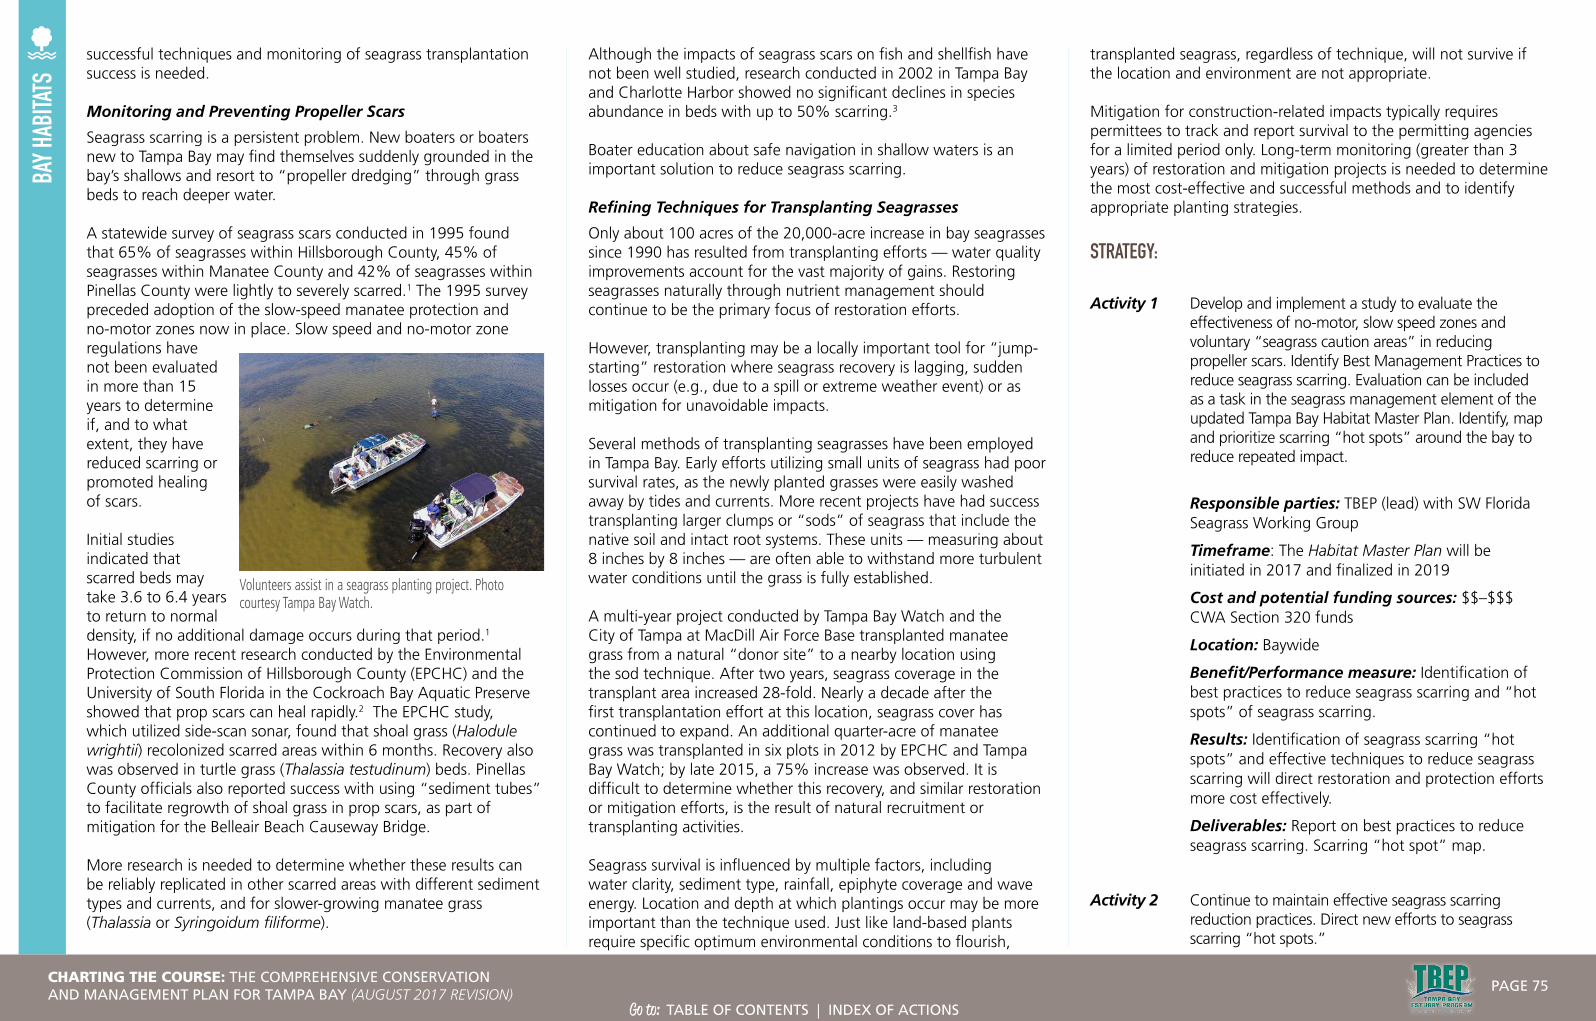
BAY H
ABITA
TSsuccessful techniques and monitoring of seagrass transplantation success is needed.
Monitoring and Preventing Propeller Scars
Seagrass scarring is a persistent problem. New boaters or boaters new to Tampa Bay may find themselves suddenly grounded in the bay’s shallows and resort to “propeller dredging” through grass beds to reach deeper water.
A statewide survey of seagrass scars conducted in 1995 found that 65% of seagrasses within Hillsborough County, 45% of seagrasses within Manatee County and 42% of seagrasses within Pinellas County were lightly to severely scarred.1 The 1995 survey preceded adoption of the slow-speed manatee protection and no-motor zones now in place. Slow speed and no-motor zone regulations have not been evaluated in more than 15 years to determine if, and to what extent, they have reduced scarring or promoted healing of scars.
Initial studies indicated that scarred beds may take 3.6 to 6.4 years to return to normal density, if no additional damage occurs during that period.1 However, more recent research conducted by the Environmental Protection Commission of Hillsborough County (EPCHC) and the University of South Florida in the Cockroach Bay Aquatic Preserve showed that prop scars can heal rapidly.2 The EPCHC study, which utilized side-scan sonar, found that shoal grass (Halodule wrightii) recolonized scarred areas within 6 months. Recovery also was observed in turtle grass (Thalassia testudinum) beds. Pinellas County officials also reported success with using “sediment tubes” to facilitate regrowth of shoal grass in prop scars, as part of mitigation for the Belleair Beach Causeway Bridge.
More research is needed to determine whether these results can be reliably replicated in other scarred areas with different sediment types and currents, and for slower-growing manatee grass (Thalassia or Syringoidum filiforme).
Although the impacts of seagrass scars on fish and shellfish have not been well studied, research conducted in 2002 in Tampa Bay and Charlotte Harbor showed no significant declines in species abundance in beds with up to 50% scarring.3 Boater education about safe navigation in shallow waters is an important solution to reduce seagrass scarring.
Refining Techniques for Transplanting Seagrasses
Only about 100 acres of the 20,000-acre increase in bay seagrasses since 1990 has resulted from transplanting efforts — water quality improvements account for the vast majority of gains. Restoring seagrasses naturally through nutrient management should continue to be the primary focus of restoration efforts.
However, transplanting may be a locally important tool for “jump-starting” restoration where seagrass recovery is lagging, sudden losses occur (e.g., due to a spill or extreme weather event) or as mitigation for unavoidable impacts.
Several methods of transplanting seagrasses have been employed in Tampa Bay. Early efforts utilizing small units of seagrass had poor survival rates, as the newly planted grasses were easily washed away by tides and currents. More recent projects have had success transplanting larger clumps or “sods” of seagrass that include the native soil and intact root systems. These units — measuring about 8 inches by 8 inches — are often able to withstand more turbulent water conditions until the grass is fully established.
A multi-year project conducted by Tampa Bay Watch and the City of Tampa at MacDill Air Force Base transplanted manatee grass from a natural “donor site” to a nearby location using the sod technique. After two years, seagrass coverage in the transplant area increased 28-fold. Nearly a decade after the first transplantation effort at this location, seagrass cover has continued to expand. An additional quarter-acre of manatee grass was transplanted in six plots in 2012 by EPCHC and Tampa Bay Watch; by late 2015, a 75% increase was observed. It is difficult to determine whether this recovery, and similar restoration or mitigation efforts, is the result of natural recruitment or transplanting activities.
Seagrass survival is influenced by multiple factors, including water clarity, sediment type, rainfall, epiphyte coverage and wave energy. Location and depth at which plantings occur may be more important than the technique used. Just like land-based plants require specific optimum environmental conditions to flourish,
transplanted seagrass, regardless of technique, will not survive if the location and environment are not appropriate.
Mitigation for construction-related impacts typically requires permittees to track and report survival to the permitting agencies for a limited period only. Long-term monitoring (greater than 3 years) of restoration and mitigation projects is needed to determine the most cost-effective and successful methods and to identify appropriate planting strategies.
STRATEGY:
Activity 1 Develop and implement a study to evaluate the effectiveness of no-motor, slow speed zones and voluntary “seagrass caution areas” in reducing propeller scars. Identify Best Management Practices to reduce seagrass scarring. Evaluation can be included as a task in the seagrass management element of the updated Tampa Bay Habitat Master Plan. Identify, map and prioritize scarring “hot spots” around the bay to reduce repeated impact.
Responsible parties: TBEP (lead) with SW Florida Seagrass Working Group
Timeframe: The Habitat Master Plan will be initiated in 2017 and finalized in 2019
Cost and potential funding sources: $$–$$$ CWA Section 320 funds
Location: Baywide
Benefit/Performance measure: Identification of best practices to reduce seagrass scarring and “hot spots” of seagrass scarring.
Results: Identification of seagrass scarring “hot spots” and effective techniques to reduce seagrass scarring will direct restoration and protection efforts more cost effectively.
Deliverables: Report on best practices to reduce seagrass scarring. Scarring “hot spot” map.
Activity 2 Continue to maintain effective seagrass scarring reduction practices. Direct new efforts to seagrass scarring “hot spots.”
Volunteers assist in a seagrass planting project. Photo courtesy Tampa Bay Watch.
CHARTING THE COURSE: THE COMPREHENSIVE CONSERVATION AND MANAGEMENT PLAN FOR TAMPA BAY (AUGUST 2017 REVISION)
PAGE 75
Go to: TABLE OF CONTENTS | INDEX OF ACTIONS

BAY H
ABITA
TS Responsible parties: Local and state governments including Pinellas, Hillsborough and Manatee counties and the Florida Department of Environmental Protection
Timeframe: Ongoing for current zones. New efforts, if warranted in “hot spots” initiated by 2023
Cost and potential funding sources: $$ Local government resources, FDEP boater registration revenues to help support law enforcement including patrolling slow speed zones
Location: Baywide
Benefit/Performance measure: Increased protection of seagrass beds from propeller scarring. Scar reduction in identified “hot spots.”
Results: Maintenance and enforcement of effective seagrass scarring reduction actions.
Deliverables: Report on ongoing and new seagrass scarring reduction efforts 5 years after the efforts are implemented.
Activity 3 Continue to refine and expand boater education programs to more effectively reach target audiences, including new boaters and boaters new to Tampa Bay. Improve boater education for rental boat operators and customers. Support and promote the use of digital technologies (including electronic chart displays, smartphones and other emerging platforms) to provide real-time information to boaters and alert them when they are entering slow-speed or no-motor zones (see Action FW-6).
Responsible parties: TBEP (lead, through the Manatee Awareness Coalition), FWC, FDEP (through its aquatic preserves and state parks)
Timeframe: Ongoing for TBEP education materials. Digital technologies initiating by 2023
Cost and potential funding sources: $ CWA Section 320 for Boaters Guides and other boater education materials. Bay Mini-Grants supported by Tampa Bay license plate revenues. Enhancement of digital technologies (product providers).
Location: Baywide
Benefit/Performance measure: Increased protection of seagrass beds from propeller scarring.
Results: Enhanced awareness of boaters regarding importance of seagrass and seagrass scarring reduction actions.
Deliverables: Boater education materials/Boaters Guides. Other education materials. Enhanced digital maps and technology.
Activity 4 Develop and implement a long-term monitoring program for seagrass transplanting and mitigation to assess optimal conditions and techniques for success. Develop a map of areas in Tampa Bay where seagrass transplanting could assist in jump-starting seagrass recovery.
Responsible parties: TBEP (lead), Tampa Bay Watch, FWC, SW Florida Seagrass Working Group members, FDEP, public or private entities conducting seagrass transplanting for mitigation
Timeframe: Develop monitoring design by 2019. Initiate monitoring program within 2 years of design completion. Evaluate monitoring results after 5
Seagrass for transplanting projects is typically harvested from healthy “donor beds.” Photo courtesy Tampa Bay Watch.
years of implementation. Create map of optimal transplant sites by 2025.
Cost and potential funding sources: $–$$ CWA Section 320 funds, local entity staff time
Location: Baywide
Benefit/Performance measure: Increased seagrass transplanting success.
Results: Coordinated, comprehensive approach to seagrass transplanting that employs most effective techniques in locations with the greatest likelihood of success.
Deliverables: Monitoring design document. Report on monitoring results after 5 years. Map of optimal seagrass transplanting sites.
1 Sargent, F.J., T.J. Leary, D.W. Crewz, and C.R. Kruer. 1995. Scarring of Florida’s seagrasses: assessment and management options. FMRI Tech. Rep. TR-1. Florida Marine Research Institute, St. Petersburg, Florida. 37 p. plus appendices.
2 Thorne et al. 2012. Improving Management of Seagrass Resources through Restoration and Assessment: Final Report to NOAA Community-based Restoration Program and Southeast Aquatic Resources Center.
3 Bell, S.S., M.O. Hall, S. Soffian, and K. Madley. 2002. Assessing the impact of boat propeller scars on fish and shrimp utilizing seagrass beds. Ecological Applications.
CHARTING THE COURSE: THE COMPREHENSIVE CONSERVATION AND MANAGEMENT PLAN FOR TAMPA BAY (AUGUST 2017 REVISION)
PAGE 76
Go to: TABLE OF CONTENTS | INDEX OF ACTIONS
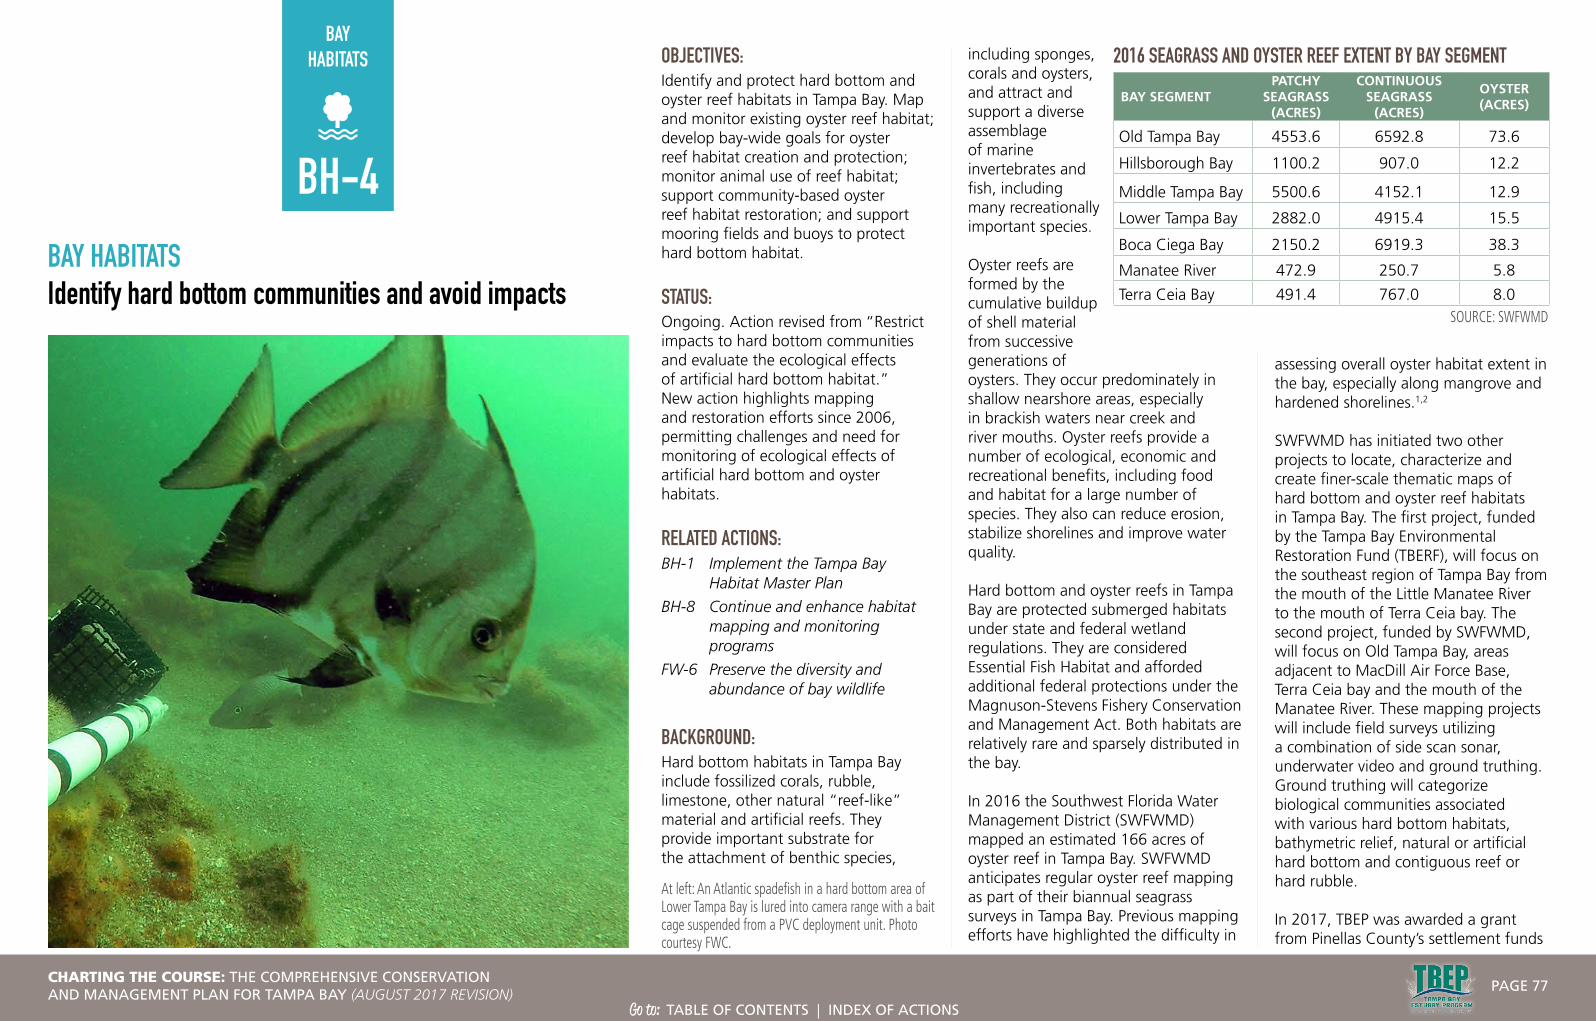
BAYHABITATS
BAY HABITATSIdentify hard bottom communities and avoid impacts
OBJECTIVES:Identify and protect hard bottom and oyster reef habitats in Tampa Bay. Map and monitor existing oyster reef habitat; develop bay-wide goals for oyster reef habitat creation and protection; monitor animal use of reef habitat; support community-based oyster reef habitat restoration; and support mooring fields and buoys to protect hard bottom habitat.
STATUS:Ongoing. Action revised from “Restrict impacts to hard bottom communities and evaluate the ecological effects of artificial hard bottom habitat.” New action highlights mapping and restoration efforts since 2006, permitting challenges and need for monitoring of ecological effects of artificial hard bottom and oyster habitats.
RELATED ACTIONS:BH-1 Implement the Tampa Bay
Habitat Master Plan
BH-8 Continue and enhance habitat mapping and monitoring programs
FW-6 Preserve the diversity and abundance of bay wildlife
BACKGROUND:Hard bottom habitats in Tampa Bay include fossilized corals, rubble, limestone, other natural “reef-like” material and artificial reefs. They provide important substrate for the attachment of benthic species,
including sponges, corals and oysters, and attract and support a diverse assemblage of marine invertebrates and fish, including many recreationally important species.
Oyster reefs are formed by the cumulative buildup of shell material from successive generations of oysters. They occur predominately in shallow nearshore areas, especially in brackish waters near creek and river mouths. Oyster reefs provide a number of ecological, economic and recreational benefits, including food and habitat for a large number of species. They also can reduce erosion, stabilize shorelines and improve water quality.
Hard bottom and oyster reefs in Tampa Bay are protected submerged habitats under state and federal wetland regulations. They are considered Essential Fish Habitat and afforded additional federal protections under the Magnuson-Stevens Fishery Conservation and Management Act. Both habitats are relatively rare and sparsely distributed in the bay.
In 2016 the Southwest Florida Water Management District (SWFWMD) mapped an estimated 166 acres of oyster reef in Tampa Bay. SWFWMD anticipates regular oyster reef mapping as part of their biannual seagrass surveys in Tampa Bay. Previous mapping efforts have highlighted the difficulty in
assessing overall oyster habitat extent in the bay, especially along mangrove and hardened shorelines.1,2
SWFWMD has initiated two other projects to locate, characterize and create finer-scale thematic maps of hard bottom and oyster reef habitats in Tampa Bay. The first project, funded by the Tampa Bay Environmental Restoration Fund (TBERF), will focus on the southeast region of Tampa Bay from the mouth of the Little Manatee River to the mouth of Terra Ceia bay. The second project, funded by SWFWMD, will focus on Old Tampa Bay, areas adjacent to MacDill Air Force Base, Terra Ceia bay and the mouth of the Manatee River. These mapping projects will include field surveys utilizing a combination of side scan sonar, underwater video and ground truthing. Ground truthing will categorize biological communities associated with various hard bottom habitats, bathymetric relief, natural or artificial hard bottom and contiguous reef or hard rubble.
In 2017, TBEP was awarded a grant from Pinellas County’s settlement funds
BH-4
2016 SEAGRASS AND OYSTER REEF EXTENT BY BAY SEGMENT
BAY SEGMENTPATCHY
SEAGRASS (ACRES)
CONTINUOUS SEAGRASS
(ACRES)
OYSTER (ACRES)
Old Tampa Bay 4553.6 6592.8 73.6
Hillsborough Bay 1100.2 907.0 12.2
Middle Tampa Bay 5500.6 4152.1 12.9
Lower Tampa Bay 2882.0 4915.4 15.5
Boca Ciega Bay 2150.2 6919.3 38.3
Manatee River 472.9 250.7 5.8
Terra Ceia Bay 491.4 767.0 8.0SOURCE: SWFWMD
At left: An Atlantic spadefish in a hard bottom area of Lower Tampa Bay is lured into camera range with a bait cage suspended from a PVC deployment unit. Photo courtesy FWC.
CHARTING THE COURSE: THE COMPREHENSIVE CONSERVATION AND MANAGEMENT PLAN FOR TAMPA BAY (AUGUST 2017 REVISION)
PAGE 77
Go to: TABLE OF CONTENTS | INDEX OF ACTIONS
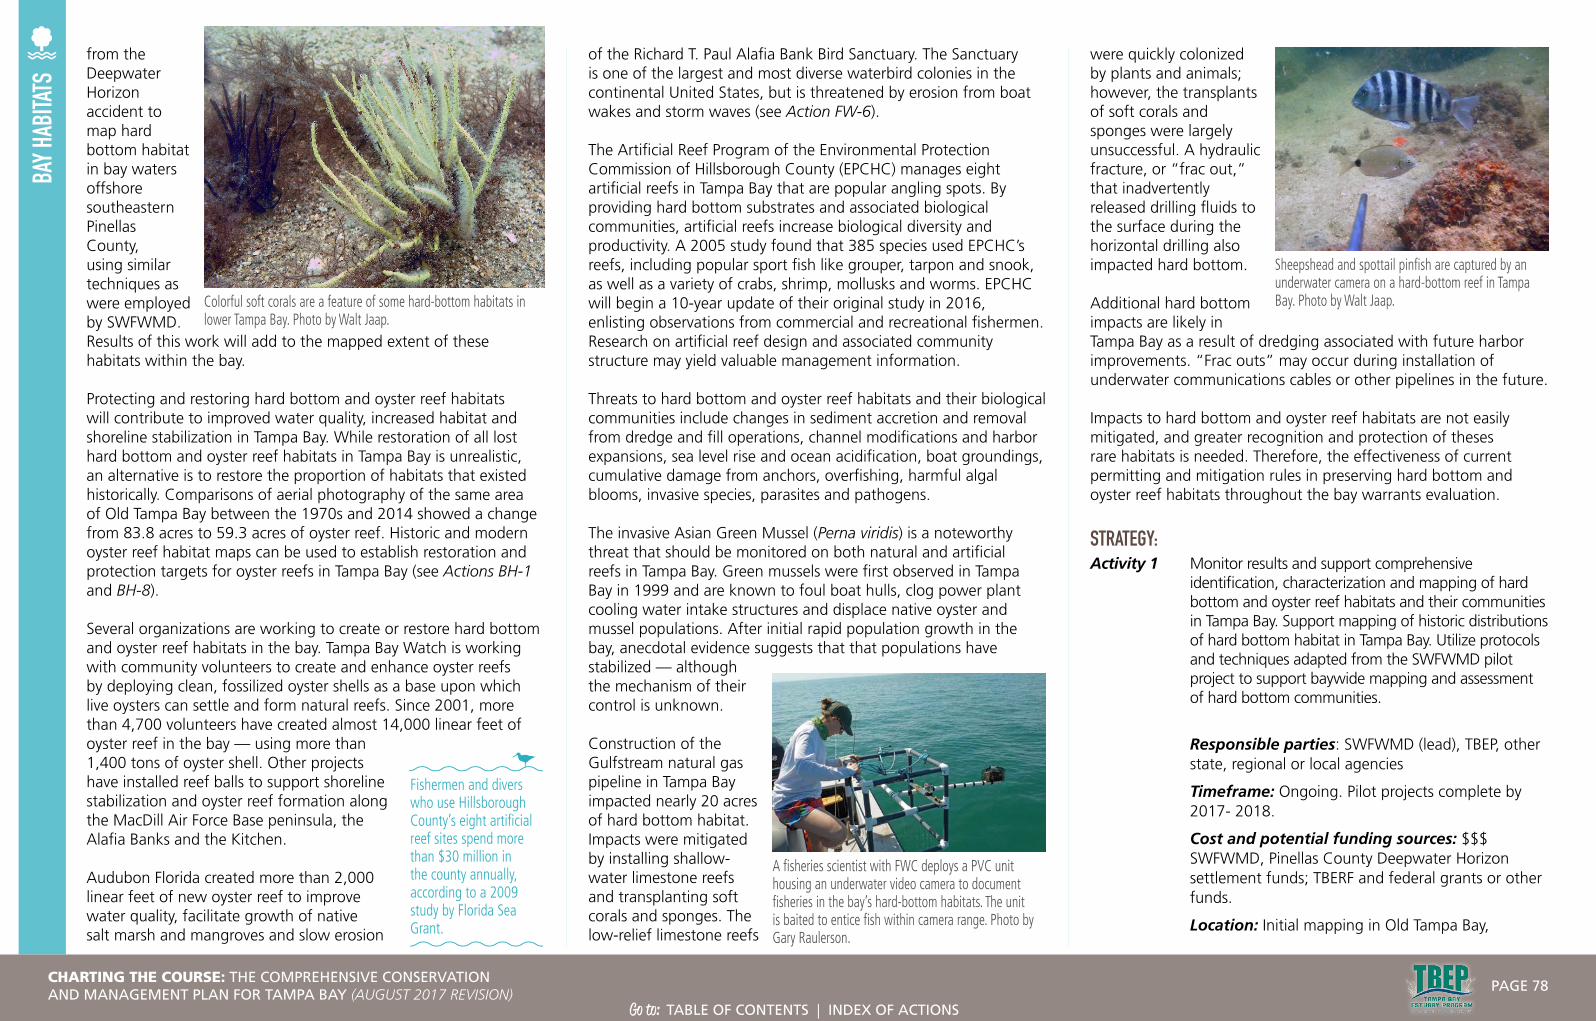
BAY H
ABITA
TSfrom the Deepwater Horizon accident to map hard bottom habitat in bay waters offshore southeastern Pinellas County, using similar techniques as were employed by SWFWMD. Results of this work will add to the mapped extent of these habitats within the bay.
Protecting and restoring hard bottom and oyster reef habitats will contribute to improved water quality, increased habitat and shoreline stabilization in Tampa Bay. While restoration of all lost hard bottom and oyster reef habitats in Tampa Bay is unrealistic, an alternative is to restore the proportion of habitats that existed historically. Comparisons of aerial photography of the same area of Old Tampa Bay between the 1970s and 2014 showed a change from 83.8 acres to 59.3 acres of oyster reef. Historic and modern oyster reef habitat maps can be used to establish restoration and protection targets for oyster reefs in Tampa Bay (see Actions BH-1 and BH-8).
Several organizations are working to create or restore hard bottom and oyster reef habitats in the bay. Tampa Bay Watch is working with community volunteers to create and enhance oyster reefs by deploying clean, fossilized oyster shells as a base upon which live oysters can settle and form natural reefs. Since 2001, more than 4,700 volunteers have created almost 14,000 linear feet of oyster reef in the bay — using more than 1,400 tons of oyster shell. Other projects have installed reef balls to support shoreline stabilization and oyster reef formation along the MacDill Air Force Base peninsula, the Alafia Banks and the Kitchen.
Audubon Florida created more than 2,000 linear feet of new oyster reef to improve water quality, facilitate growth of native salt marsh and mangroves and slow erosion
of the Richard T. Paul Alafia Bank Bird Sanctuary. The Sanctuary is one of the largest and most diverse waterbird colonies in the continental United States, but is threatened by erosion from boat wakes and storm waves (see Action FW-6).
The Artificial Reef Program of the Environmental Protection Commission of Hillsborough County (EPCHC) manages eight artificial reefs in Tampa Bay that are popular angling spots. By providing hard bottom substrates and associated biological communities, artificial reefs increase biological diversity and productivity. A 2005 study found that 385 species used EPCHC’s reefs, including popular sport fish like grouper, tarpon and snook, as well as a variety of crabs, shrimp, mollusks and worms. EPCHC will begin a 10-year update of their original study in 2016, enlisting observations from commercial and recreational fishermen. Research on artificial reef design and associated community structure may yield valuable management information.
Threats to hard bottom and oyster reef habitats and their biological communities include changes in sediment accretion and removal from dredge and fill operations, channel modifications and harbor expansions, sea level rise and ocean acidification, boat groundings, cumulative damage from anchors, overfishing, harmful algal blooms, invasive species, parasites and pathogens.
The invasive Asian Green Mussel (Perna viridis) is a noteworthy threat that should be monitored on both natural and artificial reefs in Tampa Bay. Green mussels were first observed in Tampa Bay in 1999 and are known to foul boat hulls, clog power plant cooling water intake structures and displace native oyster and mussel populations. After initial rapid population growth in the bay, anecdotal evidence suggests that that populations have stabilized — although the mechanism of their control is unknown.
Construction of the Gulfstream natural gas pipeline in Tampa Bay impacted nearly 20 acres of hard bottom habitat. Impacts were mitigated by installing shallow-water limestone reefs and transplanting soft corals and sponges. The low-relief limestone reefs
were quickly colonized by plants and animals; however, the transplants of soft corals and sponges were largely unsuccessful. A hydraulic fracture, or “frac out,” that inadvertently released drilling fluids to the surface during the horizontal drilling also impacted hard bottom.
Additional hard bottom impacts are likely in Tampa Bay as a result of dredging associated with future harbor improvements. “Frac outs” may occur during installation of underwater communications cables or other pipelines in the future.
Impacts to hard bottom and oyster reef habitats are not easily mitigated, and greater recognition and protection of theses rare habitats is needed. Therefore, the effectiveness of current permitting and mitigation rules in preserving hard bottom and oyster reef habitats throughout the bay warrants evaluation.
STRATEGY:Activity 1 Monitor results and support comprehensive
identification, characterization and mapping of hard bottom and oyster reef habitats and their communities in Tampa Bay. Support mapping of historic distributions of hard bottom habitat in Tampa Bay. Utilize protocols and techniques adapted from the SWFWMD pilot project to support baywide mapping and assessment of hard bottom communities.
Responsible parties: SWFWMD (lead), TBEP, other state, regional or local agencies
Timeframe: Ongoing. Pilot projects complete by 2017- 2018.
Cost and potential funding sources: $$$ SWFWMD, Pinellas County Deepwater Horizon settlement funds; TBERF and federal grants or other funds.
Location: Initial mapping in Old Tampa Bay,
Fishermen and divers who use Hillsborough County’s eight artificial reef sites spend more than $30 million in the county annually, according to a 2009 study by Florida Sea Grant.
Colorful soft corals are a feature of some hard-bottom habitats in lower Tampa Bay. Photo by Walt Jaap.
A fisheries scientist with FWC deploys a PVC unit housing an underwater video camera to document fisheries in the bay’s hard-bottom habitats. The unit is baited to entice fish within camera range. Photo by Gary Raulerson.
Sheepshead and spottail pinfish are captured by an underwater camera on a hard-bottom reef in Tampa Bay. Photo by Walt Jaap.
CHARTING THE COURSE: THE COMPREHENSIVE CONSERVATION AND MANAGEMENT PLAN FOR TAMPA BAY (AUGUST 2017 REVISION)
PAGE 78
Go to: TABLE OF CONTENTS | INDEX OF ACTIONS

BAY H
ABITA
TSsouthern reaches of the bay, and offshore of southeastern Pinellas County. Future mapping could be baywide.
Benefit/Performance measure: Understanding historic and baseline conditions will assist in setting restoration and protection targets.
Results: Better understanding of historic and current hard bottom and oyster reef habitat in Tampa Bay.
Deliverables: Comprehensive maps of historic and current hard bottom and oyster reef habitat.
Activity 2 Develop baywide goals for protection and restoration of hard bottom and oyster reef habitats. Incorporate into the Bay Habitat Master Plan. Track and consider implications of possible FDEP reclassification of bay waters as Class II (Suitable for shellfish propagation or harvesting). Ensure consistency in federal/state definitions used to describe hard bottom types.
Responsible parties: TBEP (lead), ABM, SWFWMD, local governments
Timeframe: Initiate in 2017
Cost and potential funding sources: $–$$ CWA Section 320 funds
Location: Baywide
Benefit/Performance measure: Measurable targets for hard bottom and oyster reef habitats in Tampa Bay.
Results: Protection and restoration targets will support the Restoring the Balance paradigm of natural resource management.
Deliverables: Targets adopted by the TBEP Management and Policy Boards. Technical memorandum.
Activity 3 Monitor community structure and population dynamics of species associated with natural and artificial hard bottom and oyster reef habitats. Incorporate monitoring of established mitigation sites (such as the limestone reefs created for the Gulfstream
pipeline). Monitor populations of the invasive Asian green mussel or other potential invasive species that may emerge.
Responsible parties: EPCHC, Tampa Bay Watch, FWC, Audubon Florida
Timeframe: Ongoing for some species
Cost and potential funding sources: $–$$ grants, TBERF, agency funds
Location: Baywide
Benefit/Performance measure: Greater understanding of the long-term ecosystem impacts of natural and artificial bottom habitats.
Results: Monitoring of habitats for invasive species may allow early risk detection and management.
Deliverables: Monitoring reports.
Activity 4 Support community-based oyster reef restoration activities and artificial reef creation. Streamline process and support research to aid in permitting restoration activities involving oyster reef and live bottom habitats. Support research on artificial reef design (e.g., high vs low relief structure; reef ball vs wave-attenuating devices vs oyster bags) and evaluate the ecological effects of artificial hard bottom habitats.
Responsible parties: Tampa Bay Watch, EPCHC, TBEP
Timeframe: Restoration projects are ongoing; specific research not yet funded, but projects could begin in FY 2017–2020
Cost and potential funding sources: $ CWA Section 320 funds, federal grants, TBERF
Location: Baywide in appropriate locations
Benefit/Performance measure: Comprehensive restoration of hard bottom habitats utilizing the most successful techniques and providing the greatest ecological benefit.
Results: Enhanced oyster reef and artificial reef habitats in Tampa Bay
Deliverables: Final project reports. Research results in technical documents.
Activity 5 Evaluate the effectiveness of current permitting and mitigation rules for hard bottom substrate impacts in Tampa Bay. Promote mooring fields and buoys where appropriate to minimize vessel and anchor damage to hard bottom.
Responsible parties: FDEP, FWC, Hard Bottom Working Group, EPCHC, SWFWMD
Timeframe: Initiate in FY 2017–2018
Location: Baywide
Cost and potential funding sources: $ Resource agency funding, local government funds
Benefit/Performance measure: Rule review and revisions, if appropriate, will improve the success of hard bottom creation and mitigation projects by ensuring that impacts to those habitats are adequately addressed.
Results: Additional protection of hard bottom habitat.
Deliverables: Revised permitting and mitigation rules if appropriate. Mooring fields and buoys if appropriate.
Researchers used sonar mapping to survey hard-bottom habitats in the bay. TBEP Photo.
CHARTING THE COURSE: THE COMPREHENSIVE CONSERVATION AND MANAGEMENT PLAN FOR TAMPA BAY (AUGUST 2017 REVISION)
PAGE 79
Go to: TABLE OF CONTENTS | INDEX OF ACTIONS

BAY H
ABITA
TSActivity 6 Assist in the development and implementation of
recommendations to protect hard bottom and oyster reef habitats and minimize or mitigate impacts to them (e.g., anchor damage, dredging and channel modification).
Responsible parties: US Army Corps of Engineers, TBEP, FDEP, FWC and EPCHC
Timeframe: Initiate by 2017-2018
Cost and potential funding sources: $ Resource management agencies, local government staff time
Location: Baywide
Benefit/Performance measure: Development and implementation of hard bottom habitat protection actions.
Results: Enhanced protection and restoration of natural hard bottom habitats in Tampa Bay.
Deliverables: Technical memorandum of recommendations.
Activity 7 Promote public understanding and stewardship of hard bottom and oyster reef habitats, especially among anglers and divers. Examples may include “Adopt A Reef” cleanup programs for artificial reefs and designation of “Snorkel Reefs” in shallow water that encourage the public to snorkel.
Responsible parties: Local cities and counties, EPCHC, TBEP, FDEP, FWC
Timeframe: Discussion can start in 2016–2017
Cost and potential funding sources: $ Responsible parties
Location: Baywide
Benefit/Performance measure: Enhanced public stewardship of hard bottom habitat.
Results: Potential reef cleanup programs and designated snorkel reefs to increase understanding and public access.
Deliverables: Potential stewardship programs.
1 Drexler, M. 2011. Population Biology, Ecology, and Ecosystem Contributions of the Eastern Oyster (Crassostrea virginica) from natural and artificial habitats in Tampa Bay, Florida. A thesis submitted in partial fulfillment of the requirements for the degree of Master of Science, College of Marine Science, University of South Florida. 109 p.
2 O’Keefe, K., W. Arnold and D. Reed. 2006. Tampa Bay oyster mapping and assessment: Prepared by Florida Fish and Wildlife Conservation Commission, Fish and Wildlife Research Institute: St. Petersburg, Tampa Bay Estuary Program Technical Publication 03–06, 38 p.
CHARTING THE COURSE: THE COMPREHENSIVE CONSERVATION AND MANAGEMENT PLAN FOR TAMPA BAY (AUGUST 2017 REVISION)
PAGE 80
Go to: TABLE OF CONTENTS | INDEX OF ACTIONS

BAYHABITATS
BAY HABITATSEncourage habitat enhancement along altered waterfront properties
OBJECTIVES:Expand use of living shorelines instead of traditional seawalls along waterfront properties. Support demonstration projects; explore regulatory rule revisions to support living shorelines; assess the use of living shorelines to mitigate climate change; and support education of waterfront homeowners about the benefits of living shorelines.
STATUS:Ongoing. Revised to broaden focus on softening shorelines of privately and publicly owned waterfront properties to address coastal erosion, as a preferred alternative to coastal armoring. Action also recognizes potential for living shorelines to bolster coastal resiliency to sea level rise.
RELATED ACTIONS:BH-1 Implement the Tampa Bay
Habitat Master Plan
BH-9 Enhance ecosystem values of tidal tributaries
PE-1 Promote public involvement in bay restoration and protection
PE-2 Promote public education about key issues affecting Tampa Bay
BACKGROUND:Extensive industrial, commercial and residential development has dramatically reshaped the bay’s natural shorelines, especially in urban areas. TBEP’s first assessment of habitat losses, conducted in the early 1990s, estimated that more than half of the natural shoreline of Boca Ciega bay was altered
by widespread dredging of hardened, finger-fill residential canals.
Although new “canal communities” are prohibited, the original developments remain, and vertical seawalls, revetments, riprap and bulkheads still dominate new waterfront development. Property owners in Florida are allowed to replace most existing seawalls without a permit.
A 2015 report from Restore America’s Estuaries, Living Shorelines: From Barriers to Opportunities, offers mounting evidence that hardened, artificial shorelines increase erosion, harm water quality and magnify storm damage and flooding. The report also notes that seawalls and other hardened shores provide poor habitat for fish and wildlife.
In contrast, living shorelines embrace “softer,” more natural materials that buffer wave action, absorb storm impacts, filter pollutants and provide food and shelter for fish, shellfish and
wading birds. Even “living seawalls” (habitat installed in front of existing seawalls) are preferable, as these are superior to a vertical wall structure alone.
Living shorelines also help to reduce impacts associated with climate change and sea level rise by buffering the effects of increased storm and floods. They protect dunes, mangrove forests and other coastal habitats that shield manmade infrastructure and support wildlife. Case studies illustrating how coastal communities throughout the Gulf of Mexico are incorporating living shorelines into habitat restoration and protection projects to improve long-term resiliency to sea level rise are presented in the Gulf Coast Community Handbook prepared by TBEP.
Accurately defining a living shoreline is critical to widespread use and acceptance by permitting agencies and the public. NOAA describes living shorelines as “a broad term that encompasses a range of shoreline
BH-6
Living shoreline continuum. Image courtesy of NOAA Office of Habitat Conservation.
At left: Natural recruitment of mangroves at a seawall enhancement project at Water Works Park in Tampa. Photo by Victoria Parsons.
CHARTING THE COURSE: THE COMPREHENSIVE CONSERVATION AND MANAGEMENT PLAN FOR TAMPA BAY (AUGUST 2017 REVISION)
PAGE 81
Go to: TABLE OF CONTENTS | INDEX OF ACTIONS

BAY H
ABITA
TS
stabilization techniques along estuarine coasts, bays, sheltered coastlines and tributaries. A living shoreline has a footprint that is made up mostly of native material. It incorporates vegetation or other living, natural “soft” elements alone or in combination with some type of harder shoreline structure (e.g., oyster reefs or rock sills) for added stability. Living shorelines maintain continuity of the natural land-water interface and reduce erosion while providing habitat value and enhancing coastal resilience.”
Examples in Tampa Bay include the Ulele Spring restoration in downtown Tampa (rock revetment and native plants); the MacDill Air Force Base Living Shoreline project (oyster reefs and salt marsh grass); and the oyster reef/breakwater along the Alafia Bank Bird Sanctuary. Examples of “living seawalls” include oyster domes along downtown St. Petersburg and Tampa waterfronts.
The 2015 Restore America’s Estuaries report identifies three major barriers to widespread use of living shorelines:
• Reliance among regulators on familiar, traditional shoreline stabilization techniques, and lack of information about both the shortcomings of those methods and the benefits of living shorelines.
• Lack of a wide-angle view of shoreline management, leading to site-specific permit reviews of individual applications that overlook the cumulative effects of hardening shores and the
potential values of living shorelines to mitigate habitat loss, flooding and sea level rise.
• Lack of a coordinated constituency to advocate for living shorelines.
Barriers are both institutional and educational. Creation of a living shoreline requires a permit; replacement of existing seawalls usually does not. In 2017, the U.S. Army Corps of Engineers authorized a new nationwide general permit for living shorelines, making the permitting process easier. However, few waterfront property owners know about eco-friendly alternatives to hard structures. The complex permitting process, length of time it takes to obtain a permit, and the need for a qualified contractor to design and install living shorelines effectively serve as a disincentive to their acceptance and use. In locations where living shorelines alone may not be appropriate, NOAA encourages placing habitat in front of existing seawalls, a so-called living seawall. Sarasota Bay Estuary Program’s Living on the Water’s Edge brochure is an example of practical information about this topic for citizens.
Hardened structures are often necessary to protect property in areas of high wave energy and will remain a visible feature along bay and river shorelines. This action seeks to expand use of living shorelines in areas of moderate to low wave energy.
STRATEGY: Activity 1 Support funding and implementation of
demonstration projects to provide tangible and diverse examples of the ecological and aesthetic values of living shorelines by a) giving priority to Tampa Bay Environmental Restoration Fund (TBERF) and Tampa Bay Estuary Program (TBEP) Bay Mini-Grant applicants that incorporate living shorelines; and b) exploring alternative mechanisms to allow private landowners to obtain grant funds for shoreline softening projects, such as the use of conservation easements or “block grants” to local governments to oversee projects in waterfront neighborhoods.
Responsible parties: TBEP, Southwest Florida Water Management District (SWFWMD), Environmental Protection Commission of Hillsborough County (EPCHC), US Fish and Wildlife Service (USFWS), US Environmental Protection Agency, local governments and regulatory agencies
Timeframe: Ongoing for prioritizing grant funding; exploring alternative mechanisms for funding private landowners initiated within 5 years
Cost and potential funding sources: $–$$$ TBEP TBERF and Bay Mini-Grants, SWFWMD Cooperative Funding, EPCHC Pollution Recovery Trust Fund, USFWS Community Grants, EPA Wetlands Development Grants
Location: Baywide
Benefit/Performance measure: Increased number of living shorelines in Tampa Bay.
Results: Improved understanding of the most cost-effective, ecologically beneficial and site-appropriate shoreline softening techniques.
Deliverables: Final reports from awarded grants.
Activity 2 Include living shorelines as a tool for mitigating habitat loss caused by sea level rise in the next update of the Habitat Master Plan. Support additional monitoring of current and future living shoreline projects to support habitat goals and climate resiliency.
Volunteers helped install bags of oysters along the shoreline at MacDill Air Force Base to reduce erosion and provide habitat. Photos courtesy of MacDill AFB.
CHARTING THE COURSE: THE COMPREHENSIVE CONSERVATION AND MANAGEMENT PLAN FOR TAMPA BAY (AUGUST 2017 REVISION)
PAGE 82
Go to: TABLE OF CONTENTS | INDEX OF ACTIONS
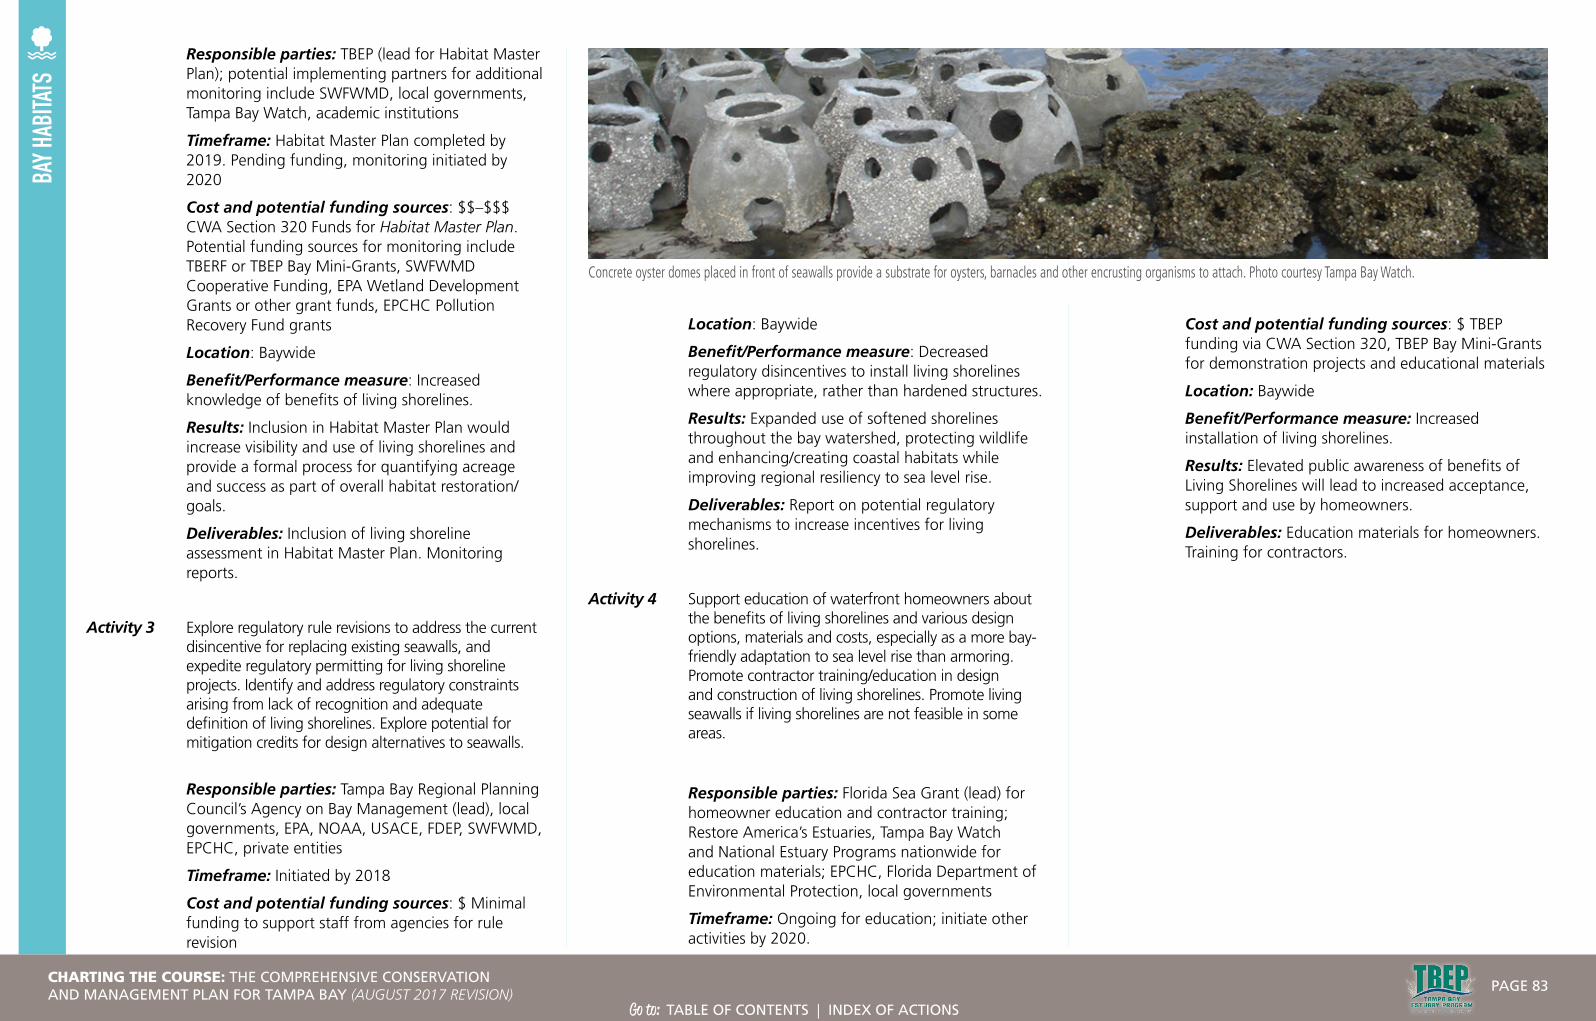
BAY H
ABITA
TSResponsible parties: TBEP (lead for Habitat Master Plan); potential implementing partners for additional monitoring include SWFWMD, local governments, Tampa Bay Watch, academic institutions
Timeframe: Habitat Master Plan completed by 2019. Pending funding, monitoring initiated by 2020
Cost and potential funding sources: $$–$$$ CWA Section 320 Funds for Habitat Master Plan. Potential funding sources for monitoring include TBERF or TBEP Bay Mini-Grants, SWFWMD Cooperative Funding, EPA Wetland Development Grants or other grant funds, EPCHC Pollution Recovery Fund grants
Location: Baywide
Benefit/Performance measure: Increased knowledge of benefits of living shorelines.
Results: Inclusion in Habitat Master Plan would increase visibility and use of living shorelines and provide a formal process for quantifying acreage and success as part of overall habitat restoration/goals.
Deliverables: Inclusion of living shoreline assessment in Habitat Master Plan. Monitoring reports.
Activity 3 Explore regulatory rule revisions to address the current disincentive for replacing existing seawalls, and expedite regulatory permitting for living shoreline projects. Identify and address regulatory constraints arising from lack of recognition and adequate definition of living shorelines. Explore potential for mitigation credits for design alternatives to seawalls.
Responsible parties: Tampa Bay Regional Planning Council’s Agency on Bay Management (lead), local governments, EPA, NOAA, USACE, FDEP, SWFWMD, EPCHC, private entities
Timeframe: Initiated by 2018
Cost and potential funding sources: $ Minimal funding to support staff from agencies for rule revision
Location: Baywide
Benefit/Performance measure: Decreased regulatory disincentives to install living shorelines where appropriate, rather than hardened structures.
Results: Expanded use of softened shorelines throughout the bay watershed, protecting wildlife and enhancing/creating coastal habitats while improving regional resiliency to sea level rise.
Deliverables: Report on potential regulatory mechanisms to increase incentives for living shorelines.
Activity 4 Support education of waterfront homeowners about the benefits of living shorelines and various design options, materials and costs, especially as a more bay-friendly adaptation to sea level rise than armoring. Promote contractor training/education in design and construction of living shorelines. Promote living seawalls if living shorelines are not feasible in some areas.
Responsible parties: Florida Sea Grant (lead) for homeowner education and contractor training; Restore America’s Estuaries, Tampa Bay Watch and National Estuary Programs nationwide for education materials; EPCHC, Florida Department of Environmental Protection, local governments
Timeframe: Ongoing for education; initiate other activities by 2020.
Cost and potential funding sources: $ TBEP funding via CWA Section 320, TBEP Bay Mini-Grants for demonstration projects and educational materials
Location: Baywide
Benefit/Performance measure: Increased installation of living shorelines.
Results: Elevated public awareness of benefits of Living Shorelines will lead to increased acceptance, support and use by homeowners.
Deliverables: Education materials for homeowners. Training for contractors.
Concrete oyster domes placed in front of seawalls provide a substrate for oysters, barnacles and other encrusting organisms to attach. Photo courtesy Tampa Bay Watch.
CHARTING THE COURSE: THE COMPREHENSIVE CONSERVATION AND MANAGEMENT PLAN FOR TAMPA BAY (AUGUST 2017 REVISION)
PAGE 83
Go to: TABLE OF CONTENTS | INDEX OF ACTIONS

BAYHABITATS
BAY HABITATSContinue and enhance habitat mapping and monitoring programs
OBJECTIVES:Expand habitat mapping and monitoring programs to assess extent and quality of bay habitats, including seagrass, benthic, hard-bottom, emergent coastal and associated upland habitats. Assess new technologies as they become available. Assess the need for additional monitoring of effects of emerging contaminants on benthic habitats and increased monitoring in tidal tributaries.
STATUS:Ongoing. Action is revised to recognize the evolving role of emerging technologies for habitat assessment (including remote sensing, sonar and digital imagery). Action also assesses the need for additional monitoring and laboratory analyses for emerging benthic contaminants, and monitoring needed to improve understanding of ecological function and stressors in tidal tributaries and river systems.
RELATED ACTIONS:BH-1 Implement the Tampa Bay
Habitat Master Plan
BH-4 Identify hard bottom communities and avoid impacts
BH-9 Enhance ecosystem values of tidal tributaries
BH-10 Implement the Tampa Bay Freshwater Wetland Habitat Master Plan
CC-1 Improve ability of bay habitats to adapt to a changing climate
COC-1 Address hot spots of contamination
COC-4 Identify and understand emerging contaminants
IS-2 Support prevention, eradication or management of invasive species in the Tampa Bay watershed
BACKGROUND:Substantial progress has been made to map and monitor bay habitats to inform habitat restoration and protection targets (see Action BH-1).
The Southwest Florida Water Management District (SWFWMD) continues to map seagrass acreage every two years using aerial photography, while local government partners have helped ground-truth seagrass quality at selected transects throughout the bay since 1988. In 2016, seagrass coverage measured 41,655 acres, surpassing the Tampa Bay Estuary Program (TBEP) initial goal of 38,000 acres. Despite these gains, seagrass communities are still vulnerable to environmental variability (such as heavy rainfall events) and human impacts (such as boat propellers and groundings). Although overall acreage has increased, there are still areas that experience swings in seagrass coverage due to variable annual conditions (e.g., Feather Sound, Bayshore Blvd. area in Hillsborough Bay). Continued biannual mapping of baywide seagrass coverage is necessary to identify and protect sensitive and impacted areas.
The Environmental Protection Commission of Hillsborough County (EPCHC) coordinates benthic monitoring of animals living on or in bay bottom sediments and chemical conditions, with participation from Manatee and Pinellas Counties. Benthic monitoring has been ongoing since 1993 with over 1500 samples analyzed. Overall, benthic conditions in the bay are considered “Fair” to “Poor” over the last 20 years, with “Good” conditions in Middle and Lower Tampa Bay in many years. There is continued need for benthic monitoring in Tampa Bay, especially in hot spots of contamination (see Action COC-1). Other recommendations include expanding laboratory analysis of sediment contaminants to include new or emerging compounds which
BH-8
At left: Biologists record the type and abundance of marsh plants in a sampling grid at Upper Tampa Bay Park, one of the long-term monitoring sites in TBEP’s Critical Coastal Habitat Assessment. Photo by Lindsay Cross.
Long-term monitoring sites for the Critical Coastal Habitat Assessment. SOURCE: TBEP.
CHARTING THE COURSE: THE COMPREHENSIVE CONSERVATION AND MANAGEMENT PLAN FOR TAMPA BAY (AUGUST 2017 REVISION)
PAGE 84
Go to: TABLE OF CONTENTS | INDEX OF ACTIONS
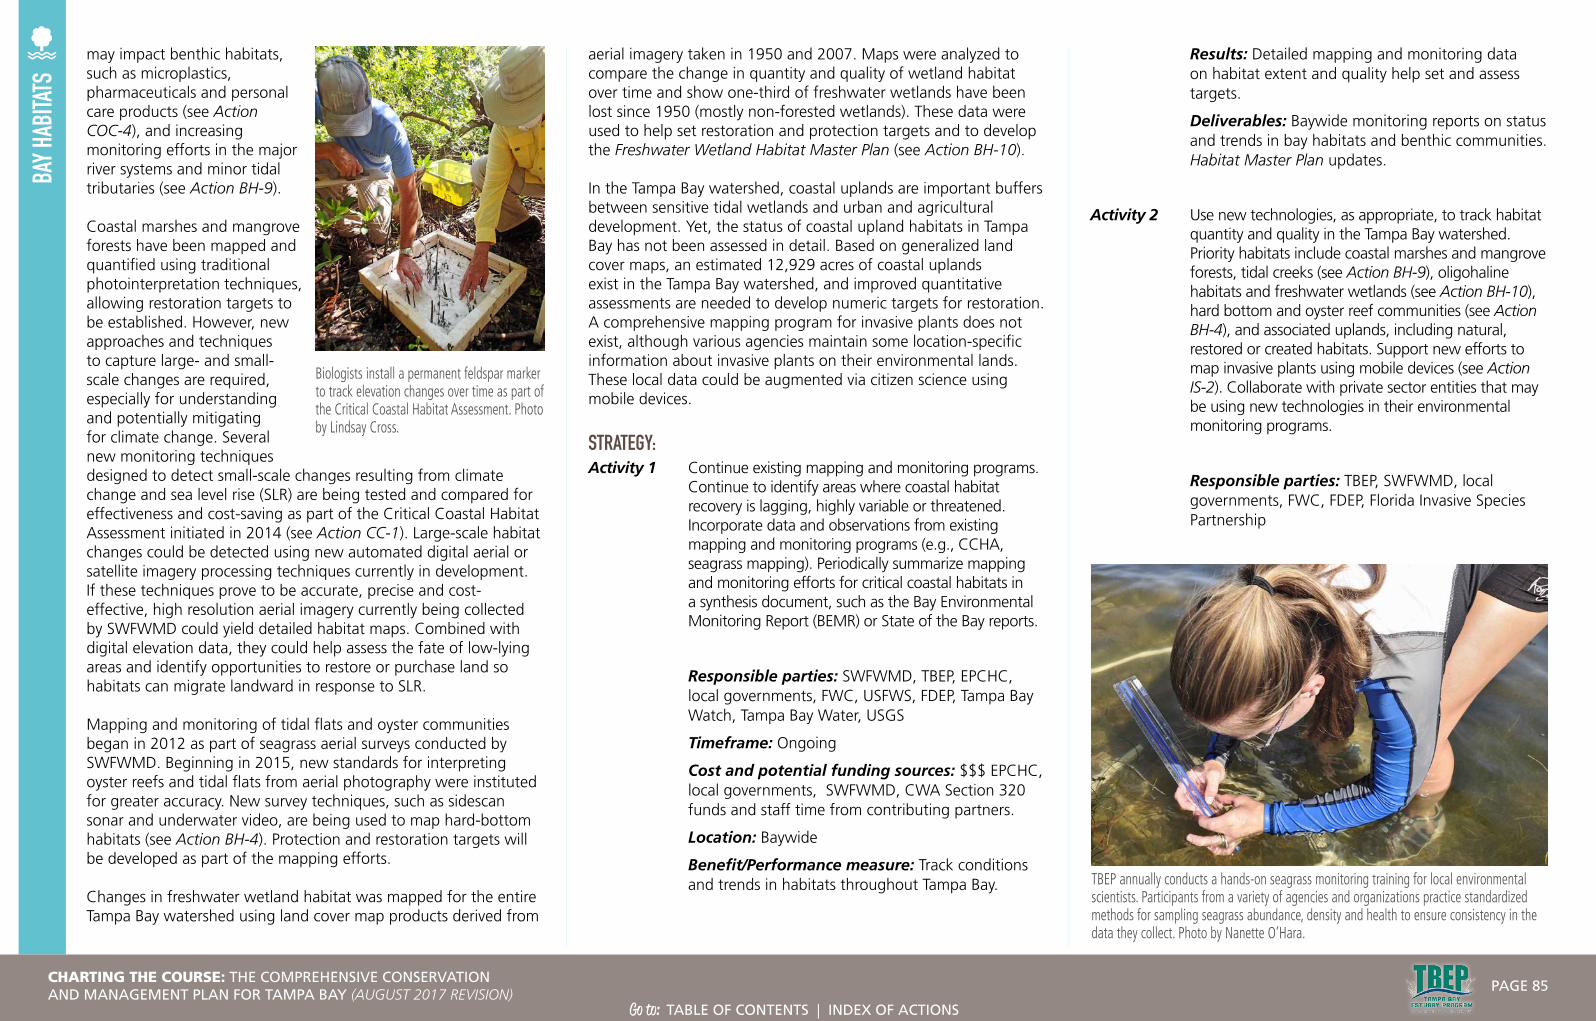
BAY H
ABITA
TSmay impact benthic habitats, such as microplastics, pharmaceuticals and personal care products (see Action COC-4), and increasing monitoring efforts in the major river systems and minor tidal tributaries (see Action BH-9).
Coastal marshes and mangrove forests have been mapped and quantified using traditional photointerpretation techniques, allowing restoration targets to be established. However, new approaches and techniques to capture large- and small-scale changes are required, especially for understanding and potentially mitigating for climate change. Several new monitoring techniques designed to detect small-scale changes resulting from climate change and sea level rise (SLR) are being tested and compared for effectiveness and cost-saving as part of the Critical Coastal Habitat Assessment initiated in 2014 (see Action CC-1). Large-scale habitat changes could be detected using new automated digital aerial or satellite imagery processing techniques currently in development. If these techniques prove to be accurate, precise and cost-effective, high resolution aerial imagery currently being collected by SWFWMD could yield detailed habitat maps. Combined with digital elevation data, they could help assess the fate of low-lying areas and identify opportunities to restore or purchase land so habitats can migrate landward in response to SLR.
Mapping and monitoring of tidal flats and oyster communities began in 2012 as part of seagrass aerial surveys conducted by SWFWMD. Beginning in 2015, new standards for interpreting oyster reefs and tidal flats from aerial photography were instituted for greater accuracy. New survey techniques, such as sidescan sonar and underwater video, are being used to map hard-bottom habitats (see Action BH-4). Protection and restoration targets will be developed as part of the mapping efforts.
Changes in freshwater wetland habitat was mapped for the entire Tampa Bay watershed using land cover map products derived from
aerial imagery taken in 1950 and 2007. Maps were analyzed to compare the change in quantity and quality of wetland habitat over time and show one-third of freshwater wetlands have been lost since 1950 (mostly non-forested wetlands). These data were used to help set restoration and protection targets and to develop the Freshwater Wetland Habitat Master Plan (see Action BH-10).
In the Tampa Bay watershed, coastal uplands are important buffers between sensitive tidal wetlands and urban and agricultural development. Yet, the status of coastal upland habitats in Tampa Bay has not been assessed in detail. Based on generalized land cover maps, an estimated 12,929 acres of coastal uplands exist in the Tampa Bay watershed, and improved quantitative assessments are needed to develop numeric targets for restoration. A comprehensive mapping program for invasive plants does not exist, although various agencies maintain some location-specific information about invasive plants on their environmental lands. These local data could be augmented via citizen science using mobile devices.
STRATEGY:Activity 1 Continue existing mapping and monitoring programs.
Continue to identify areas where coastal habitat recovery is lagging, highly variable or threatened. Incorporate data and observations from existing mapping and monitoring programs (e.g., CCHA, seagrass mapping). Periodically summarize mapping and monitoring efforts for critical coastal habitats in a synthesis document, such as the Bay Environmental Monitoring Report (BEMR) or State of the Bay reports.
Responsible parties: SWFWMD, TBEP, EPCHC, local governments, FWC, USFWS, FDEP, Tampa Bay Watch, Tampa Bay Water, USGS
Timeframe: Ongoing
Cost and potential funding sources: $$$ EPCHC, local governments, SWFWMD, CWA Section 320 funds and staff time from contributing partners.
Location: Baywide
Benefit/Performance measure: Track conditions and trends in habitats throughout Tampa Bay.
Results: Detailed mapping and monitoring data on habitat extent and quality help set and assess targets.
Deliverables: Baywide monitoring reports on status and trends in bay habitats and benthic communities. Habitat Master Plan updates.
Activity 2 Use new technologies, as appropriate, to track habitat quantity and quality in the Tampa Bay watershed. Priority habitats include coastal marshes and mangrove forests, tidal creeks (see Action BH-9), oligohaline habitats and freshwater wetlands (see Action BH-10), hard bottom and oyster reef communities (see Action BH-4), and associated uplands, including natural, restored or created habitats. Support new efforts to map invasive plants using mobile devices (see Action IS-2). Collaborate with private sector entities that may be using new technologies in their environmental monitoring programs.
Responsible parties: TBEP, SWFWMD, local governments, FWC, FDEP, Florida Invasive Species Partnership
Biologists install a permanent feldspar marker to track elevation changes over time as part of the Critical Coastal Habitat Assessment. Photo by Lindsay Cross.
TBEP annually conducts a hands-on seagrass monitoring training for local environmental scientists. Participants from a variety of agencies and organizations practice standardized methods for sampling seagrass abundance, density and health to ensure consistency in the data they collect. Photo by Nanette O’Hara.
CHARTING THE COURSE: THE COMPREHENSIVE CONSERVATION AND MANAGEMENT PLAN FOR TAMPA BAY (AUGUST 2017 REVISION)
PAGE 85
Go to: TABLE OF CONTENTS | INDEX OF ACTIONS

BAY H
ABITA
TSTimeframe: Ongoing
Cost and potential funding sources: $$–$$$ SWFWMD, EPA Wetland Development Grant funds and CWA Section 320 funds
Location: Baywide
Benefit/Performance measure: Apply new technologies to track conditions and trends in habitats throughout Tampa Bay.
Results: New technologies may result in more accurate and detailed data on habitat extent and quality to help set and assess targets.
Deliverables: Reports on the effectiveness of new technologies to track status and trends in bay habitats and benthic communities.
Activity 3 Evaluate the need and feasibility for additional monitoring for effects of emerging contaminants on benthic habitats (e.g., microplastics, pharmaceuticals, personal care products) and expanded monitoring in rivers and tidal tributaries.
Responsible parties: TBEP TAC to evaluate and prioritize additional monitoring needs and identify lead entities to implement additional monitoring
Timeframe: Initiate evaluations by 2020
Cost and potential funding sources: $-$$$ CWA Section 320 funds, Tampa Bay Environmental Restoration Funds, SWFWMD, USGS, EPA Wetland Development Grants
Location: Baywide
Benefit/Performance measure: Need and feasibility of additional monitoring will be assessed.
Results: New monitoring, if needed, may result in a better understanding of emerging contaminants and the function and condition of tidal tributaries.
Deliverables: Report on the need and feasibility of additional monitoring.
CHARTING THE COURSE: THE COMPREHENSIVE CONSERVATION AND MANAGEMENT PLAN FOR TAMPA BAY (AUGUST 2017 REVISION)
PAGE 86
Go to: TABLE OF CONTENTS | INDEX OF ACTIONS

BAYHABITATS
BAY HABITATSEnhance ecosystem values of tidal tributaries
OBJECTIVES: Improve the ecosystem value of tidal tributaries of Tampa Bay. Develop indicators of tidal tributary health and function. Continue monitoring in tidal tributaries. Identify and implement projects to remove artificial barriers in tidal tributaries. Improve public awareness of the value and benefits of healthy tidal tributaries.
STATUS: Ongoing. Originally added to the CCMP as a 2012 Amendment, this revision incorporates pilot projects to remove or modify structures, and monitor changes in water quality, vegetation and fisheries use. This update also summarizes new research to characterize tidal tributaries to facilitate development of numeric nutrient criteria.
RELATED ACTIONS:FW-5 Continue and expand the Critical
Fisheries Monitoring Program
BH-1 Implement the Tampa Bay Habitat Master Plan
BH-8 Continue and enhance habitat mapping and monitoring programs
BACKGROUND:Tidal tributaries are an important, diverse and often-neglected ecosystem in the bay watershed. Distinctly different from freshwater systems and the open bay, these variable-salinity streams, creeks and back-water systems serve an important niche in fisheries production, nutrient cycling, wading bird foraging and flood prevention or detention.
Since 2006, select tidal creeks of the Tampa Bay watershed have been monitored to evaluate tidal patterns, shoreline vegetation, fish populations, sediment quality and nutrient levels (see Action FW-5). Despite water quality often characterized by low dissolved oxygen levels and higher relative nutrient and chlorophyll levels, these systems have been shown to support high densities of juvenile fishes and baitfish species. Research coordinated by the Tampa Bay Estuary Program (TBEP) found that juvenile snook — a premier sport fish — were up to 36 times more abundant inside the sampled tributaries than outside.1
Current efforts include research supported by US Environmental Protection Agency (EPA) Wetlands Development Grants to develop environmental indicators of tidal tributary health and nursery function. Due to large differences from creek to creek, preliminary results suggest there
is no single optimum water quality criterion for setting appropriate nutrient targets and thresholds to maintain ecological productivity. Instead, tidal creek health may be more reliably predicted by the status of its fish populations, especially recruitment and survival of juvenile fishes. Continued and long-term tidal creek biological monitoring is warranted, especially expansion of monitoring efforts to inventory ecological conditions in unsampled creeks (see Action FW-5).
Most of the more than 100 tidal creeks in the bay watershed are less than six miles long and narrow, averaging about 75–150 feet wide. Many have been significantly altered by dredging, road construction, shoreline development and channelization to facilitate flood control. A 2012 inventory commissioned by TBEP identified 344 structures that are potentially blocking or impeding tidal flows and fish movement in bay tributaries.2 These barriers include water control structures, weirs, railroad bridges, culverts and road crossings. Fish and wildlife also are impacted by channelizing and ditching natural creeks for mosquito control, flood prevention and general upland development.
Removing some of these “salinity barriers” could benefit snook and other fish by promoting more natural fluctuations in water levels that occur with rising and falling tides, instead
BH-9
Tidal tributaries provide critical nursery habitat for snook, one of Florida’s most valuable sportfish.
Tidal creeks in the Tampa Bay Watershed. SOURCE: FWC.
At left: A typical tidal tributary in Tampa Bay. TBEP Photo.
CHARTING THE COURSE: THE COMPREHENSIVE CONSERVATION AND MANAGEMENT PLAN FOR TAMPA BAY (AUGUST 2017 REVISION)
PAGE 87
Go to: TABLE OF CONTENTS | INDEX OF ACTIONS
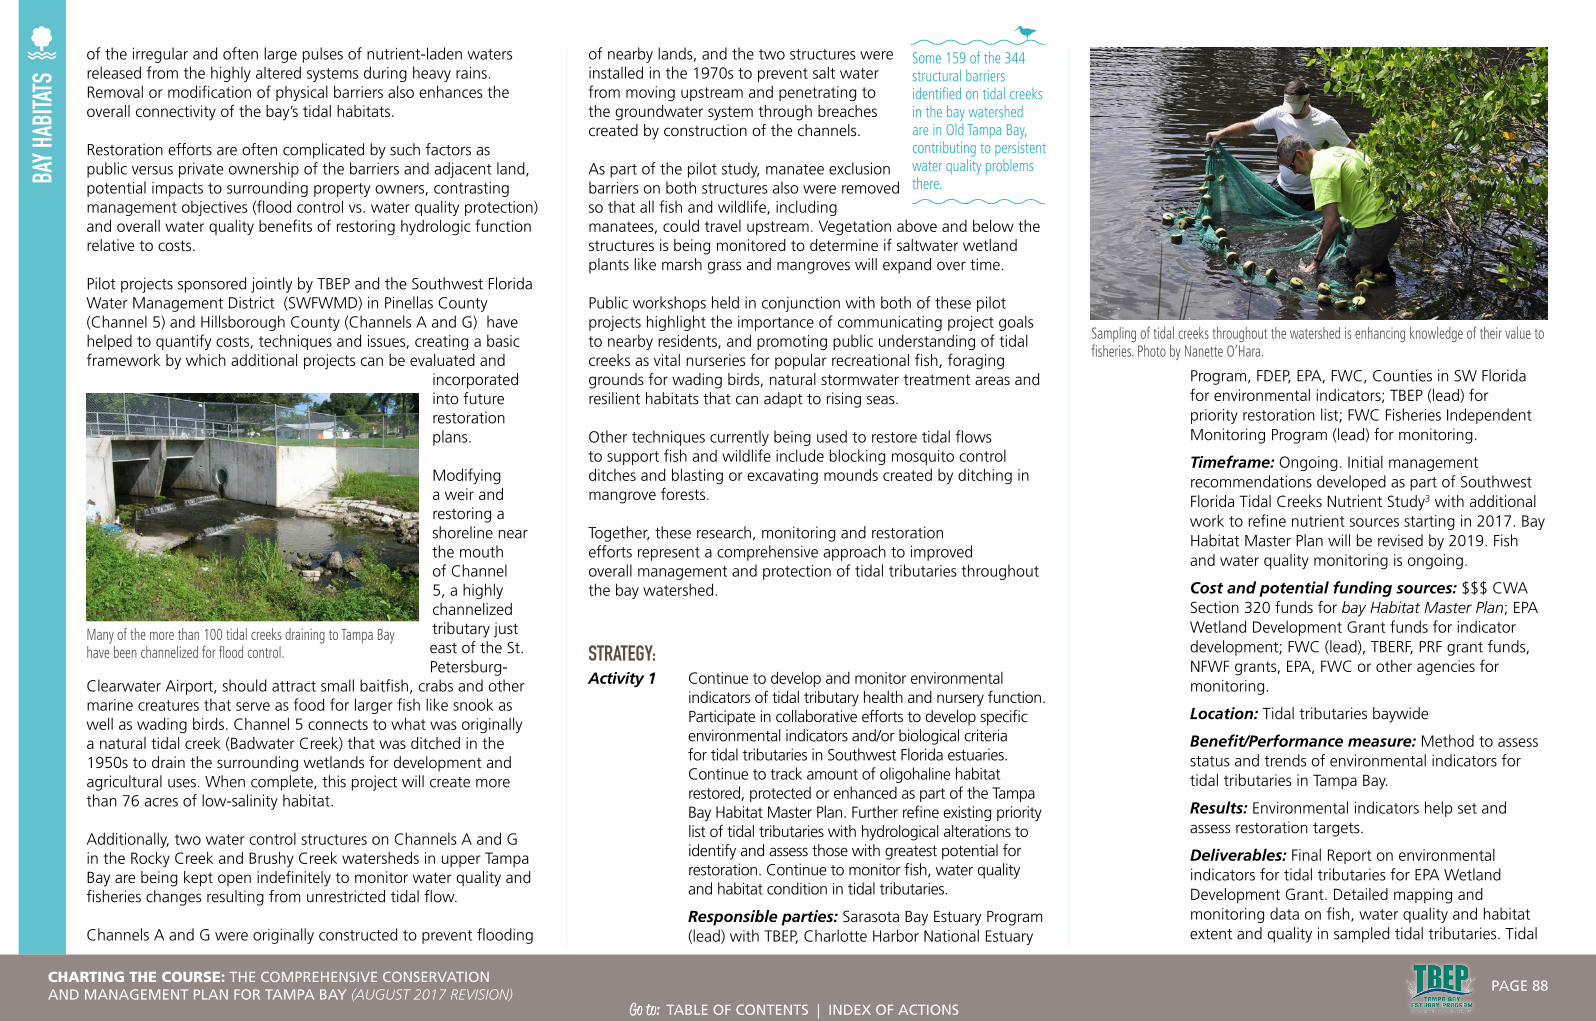
BAY H
ABITA
TSof nearby lands, and the two structures were installed in the 1970s to prevent salt water from moving upstream and penetrating to the groundwater system through breaches created by construction of the channels.
As part of the pilot study, manatee exclusion barriers on both structures also were removed so that all fish and wildlife, including manatees, could travel upstream. Vegetation above and below the structures is being monitored to determine if saltwater wetland plants like marsh grass and mangroves will expand over time.
Public workshops held in conjunction with both of these pilot projects highlight the importance of communicating project goals to nearby residents, and promoting public understanding of tidal creeks as vital nurseries for popular recreational fish, foraging grounds for wading birds, natural stormwater treatment areas and resilient habitats that can adapt to rising seas.
Other techniques currently being used to restore tidal flows to support fish and wildlife include blocking mosquito control ditches and blasting or excavating mounds created by ditching in mangrove forests.
Together, these research, monitoring and restoration efforts represent a comprehensive approach to improved overall management and protection of tidal tributaries throughout the bay watershed.
STRATEGY:Activity 1 Continue to develop and monitor environmental
indicators of tidal tributary health and nursery function. Participate in collaborative efforts to develop specific environmental indicators and/or biological criteria for tidal tributaries in Southwest Florida estuaries. Continue to track amount of oligohaline habitat restored, protected or enhanced as part of the Tampa Bay Habitat Master Plan. Further refine existing priority list of tidal tributaries with hydrological alterations to identify and assess those with greatest potential for restoration. Continue to monitor fish, water quality and habitat condition in tidal tributaries.
Responsible parties: Sarasota Bay Estuary Program (lead) with TBEP, Charlotte Harbor National Estuary
Some 159 of the 344 structural barriers identified on tidal creeks in the bay watershed are in Old Tampa Bay, contributing to persistent water quality problems there.
of the irregular and often large pulses of nutrient-laden waters released from the highly altered systems during heavy rains. Removal or modification of physical barriers also enhances the overall connectivity of the bay’s tidal habitats.
Restoration efforts are often complicated by such factors as public versus private ownership of the barriers and adjacent land, potential impacts to surrounding property owners, contrasting management objectives (flood control vs. water quality protection) and overall water quality benefits of restoring hydrologic function relative to costs.
Pilot projects sponsored jointly by TBEP and the Southwest Florida Water Management District (SWFWMD) in Pinellas County (Channel 5) and Hillsborough County (Channels A and G) have helped to quantify costs, techniques and issues, creating a basic framework by which additional projects can be evaluated and
incorporated into future restoration plans.
Modifying a weir and restoring a shoreline near the mouth of Channel 5, a highly channelized tributary just east of the St. Petersburg-
Clearwater Airport, should attract small baitfish, crabs and other marine creatures that serve as food for larger fish like snook as well as wading birds. Channel 5 connects to what was originally a natural tidal creek (Badwater Creek) that was ditched in the 1950s to drain the surrounding wetlands for development and agricultural uses. When complete, this project will create more than 76 acres of low-salinity habitat.
Additionally, two water control structures on Channels A and G in the Rocky Creek and Brushy Creek watersheds in upper Tampa Bay are being kept open indefinitely to monitor water quality and fisheries changes resulting from unrestricted tidal flow.
Channels A and G were originally constructed to prevent flooding
Program, FDEP, EPA, FWC, Counties in SW Florida for environmental indicators; TBEP (lead) for priority restoration list; FWC Fisheries Independent Monitoring Program (lead) for monitoring.
Timeframe: Ongoing. Initial management recommendations developed as part of Southwest Florida Tidal Creeks Nutrient Study3 with additional work to refine nutrient sources starting in 2017. Bay Habitat Master Plan will be revised by 2019. Fish and water quality monitoring is ongoing.
Cost and potential funding sources: $$$ CWA Section 320 funds for bay Habitat Master Plan; EPA Wetland Development Grant funds for indicator development; FWC (lead), TBERF, PRF grant funds, NFWF grants, EPA, FWC or other agencies for monitoring.
Location: Tidal tributaries baywide
Benefit/Performance measure: Method to assess status and trends of environmental indicators for tidal tributaries in Tampa Bay.
Results: Environmental indicators help set and assess restoration targets.
Deliverables: Final Report on environmental indicators for tidal tributaries for EPA Wetland Development Grant. Detailed mapping and monitoring data on fish, water quality and habitat extent and quality in sampled tidal tributaries. Tidal
Many of the more than 100 tidal creeks draining to Tampa Bay have been channelized for flood control.
Sampling of tidal creeks throughout the watershed is enhancing knowledge of their value to fisheries. Photo by Nanette O’Hara.
CHARTING THE COURSE: THE COMPREHENSIVE CONSERVATION AND MANAGEMENT PLAN FOR TAMPA BAY (AUGUST 2017 REVISION)
PAGE 88
Go to: TABLE OF CONTENTS | INDEX OF ACTIONS
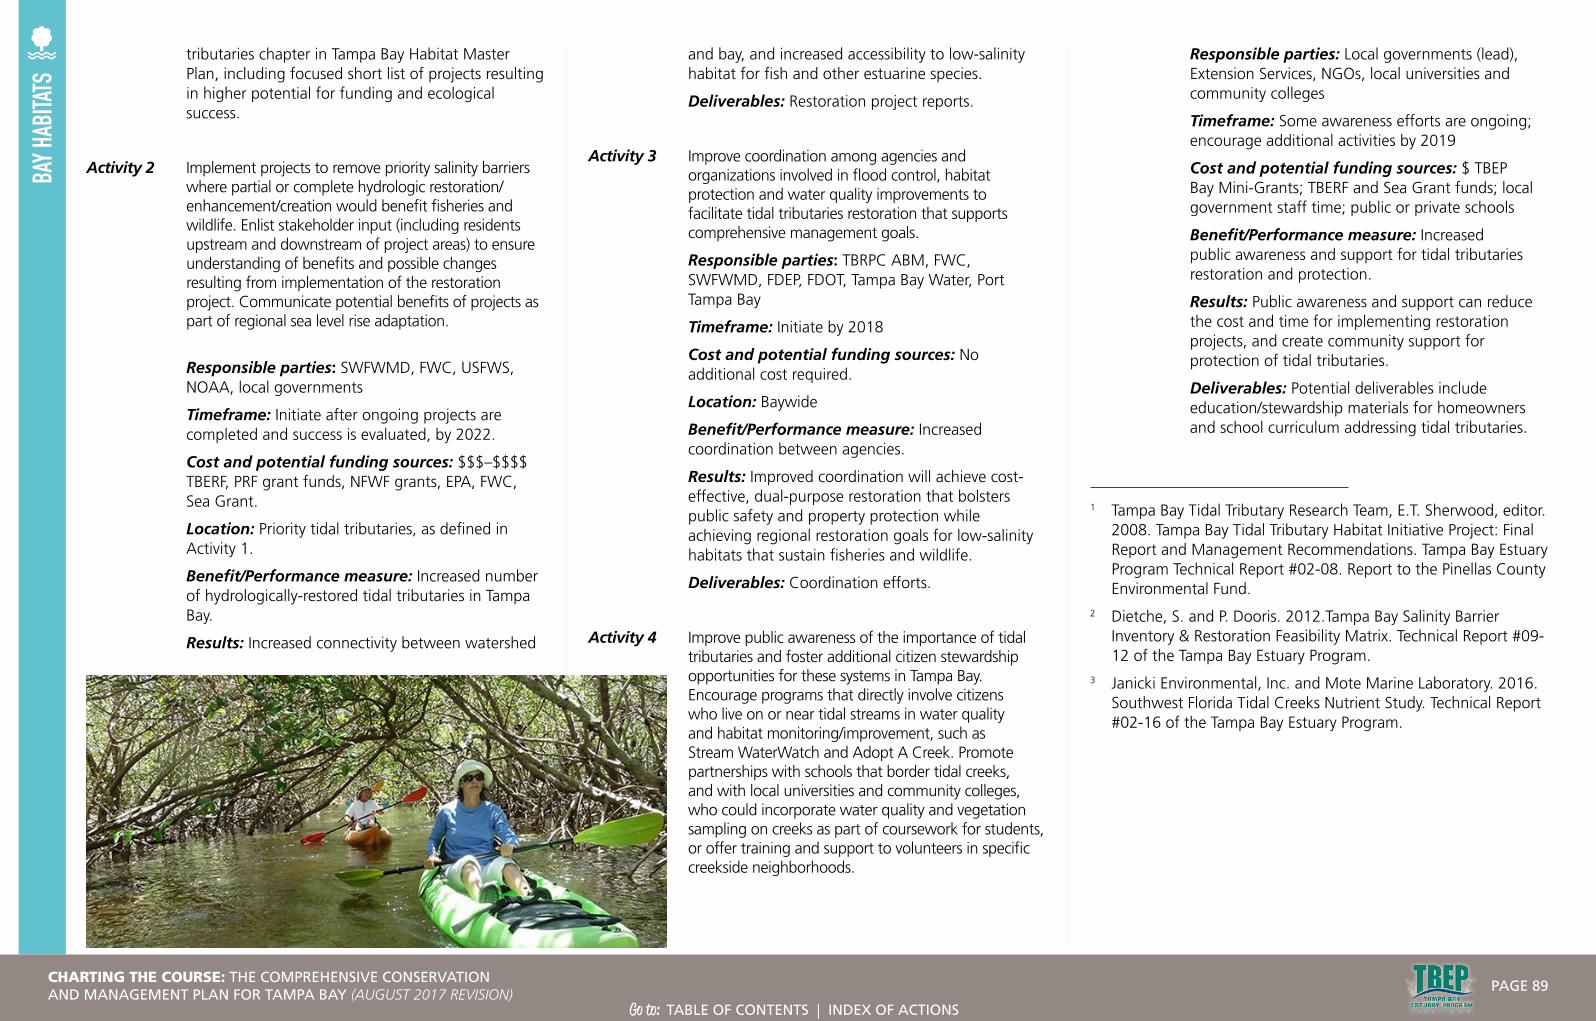
BAY H
ABITA
TStributaries chapter in Tampa Bay Habitat Master Plan, including focused short list of projects resulting in higher potential for funding and ecological success.
Activity 2 Implement projects to remove priority salinity barriers where partial or complete hydrologic restoration/enhancement/creation would benefit fisheries and wildlife. Enlist stakeholder input (including residents upstream and downstream of project areas) to ensure understanding of benefits and possible changes resulting from implementation of the restoration project. Communicate potential benefits of projects as part of regional sea level rise adaptation.
Responsible parties: SWFWMD, FWC, USFWS, NOAA, local governments
Timeframe: Initiate after ongoing projects are completed and success is evaluated, by 2022.
Cost and potential funding sources: $$$–$$$$ TBERF, PRF grant funds, NFWF grants, EPA, FWC, Sea Grant.
Location: Priority tidal tributaries, as defined in Activity 1.
Benefit/Performance measure: Increased number of hydrologically-restored tidal tributaries in Tampa Bay.
Results: Increased connectivity between watershed
and bay, and increased accessibility to low-salinity habitat for fish and other estuarine species.
Deliverables: Restoration project reports.
Activity 3 Improve coordination among agencies and organizations involved in flood control, habitat protection and water quality improvements to facilitate tidal tributaries restoration that supports comprehensive management goals.
Responsible parties: TBRPC ABM, FWC, SWFWMD, FDEP, FDOT, Tampa Bay Water, Port Tampa Bay
Timeframe: Initiate by 2018
Cost and potential funding sources: No additional cost required.
Location: Baywide
Benefit/Performance measure: Increased coordination between agencies.
Results: Improved coordination will achieve cost-effective, dual-purpose restoration that bolsters public safety and property protection while achieving regional restoration goals for low-salinity habitats that sustain fisheries and wildlife.
Deliverables: Coordination efforts.
Activity 4 Improve public awareness of the importance of tidal tributaries and foster additional citizen stewardship opportunities for these systems in Tampa Bay. Encourage programs that directly involve citizens who live on or near tidal streams in water quality and habitat monitoring/improvement, such as Stream WaterWatch and Adopt A Creek. Promote partnerships with schools that border tidal creeks, and with local universities and community colleges, who could incorporate water quality and vegetation sampling on creeks as part of coursework for students, or offer training and support to volunteers in specific creekside neighborhoods.
Responsible parties: Local governments (lead), Extension Services, NGOs, local universities and community colleges
Timeframe: Some awareness efforts are ongoing; encourage additional activities by 2019
Cost and potential funding sources: $ TBEP Bay Mini-Grants; TBERF and Sea Grant funds; local government staff time; public or private schools
Benefit/Performance measure: Increased public awareness and support for tidal tributaries restoration and protection.
Results: Public awareness and support can reduce the cost and time for implementing restoration projects, and create community support for protection of tidal tributaries.
Deliverables: Potential deliverables include education/stewardship materials for homeowners and school curriculum addressing tidal tributaries.
1 Tampa Bay Tidal Tributary Research Team, E.T. Sherwood, editor. 2008. Tampa Bay Tidal Tributary Habitat Initiative Project: Final Report and Management Recommendations. Tampa Bay Estuary Program Technical Report #02-08. Report to the Pinellas County Environmental Fund.
2 Dietche, S. and P. Dooris. 2012.Tampa Bay Salinity Barrier Inventory & Restoration Feasibility Matrix. Technical Report #09-12 of the Tampa Bay Estuary Program.
3 Janicki Environmental, Inc. and Mote Marine Laboratory. 2016. Southwest Florida Tidal Creeks Nutrient Study. Technical Report #02-16 of the Tampa Bay Estuary Program.
CHARTING THE COURSE: THE COMPREHENSIVE CONSERVATION AND MANAGEMENT PLAN FOR TAMPA BAY (AUGUST 2017 REVISION)
PAGE 89
Go to: TABLE OF CONTENTS | INDEX OF ACTIONS

BAYHABITATS for their young,
as their nestlings cannot tolerate saltwater prey species. Loss of freshwater marshes has contributed to declines in other bird populations that forage primarily in freshwater habitats, such as the glossy ibis, snowy egret, roseate spoonbill, American oystercatcher, and Caspian, royal and sandwich terns.
Setting Targets for Restoration
The Master Plan for the Protection and Restoration of Freshwater Wetlands in the Tampa Bay Watershed, Florida documented the historic and current extent of freshwater wetlands within the watershed, using the 1950s baseline used in the Restoring the Balance habitat restoration strategy.1 This research reported a net loss of more than 100,000 acres of freshwater wetlands from the 1950s to 2007.
Additionally, 36,200 acres changed wetland type, for example, transitioning from a grassy marsh to a forested marsh. This work led to the formal adoption by TBEP partners of specific restoration and protection targets for forested and non-forested freshwater
Analysis shows that non-forested, or grassy, wetlands have been lost in much greater proportions than forested wetlands. Both habitats are important for specific wildlife species at different life stages and provide different levels and types of ecological services.
OBJECTIVES: Increase acreage of freshwater wetlands in the Tampa Bay watershed through both publicly and privately funded protection, restoration and mitigation. Track freshwater wetland habitat losses and gains. Encourage use of wetland mitigation banks to assist in achieving freshwater wetland goals. Evaluate success of freshwater wetland mitigation.
STATUS:New action implementing key goal of TBEP Habitat Master Plan (see Action BH-1) to quantify freshwater wetland losses and current extent, and set restoration and protection targets.
RELATED ACTIONS:BH-1 Implement the Tampa Bay
Habitat Master Plan
BH-2 Establish and implement mitigation criteria
BACKGROUND:Most development-related wetland impacts in the Tampa Bay watershed since the 1950s occurred away from the water’s edge, in areas without a direct estuarine connection to the bay. During the nearly 60-year period from 1950–2007, more than 100,000 acres of freshwater wetlands were lost, compared with about 5,000 acres of coastal mangroves, salt marsh and salt barrens. Losses may have exceeded these estimates because 1950s aerial photographs were not available for
all portions of the watershed, and significant urban development already had occurred in the cities of Tampa and St. Petersburg. While direct impacts from development account for the majority of these losses, indirect impacts such as groundwater and surface water withdrawals for urban and agricultural use have also degraded wetlands.
Forested wetlands, such as cypress and maple swamps, and non-forested “grassy” wetlands dominated by rushes and low-profile plants provide significant ecosystem services. Healthy wetlands “fix” or capture carbon dioxide and mitigate the effects of climate change. Freshwater wetlands also absorb nitrogen and help filter stormwater runoff.
Freshwater wetlands provide habitat and food for more than 80 unique animals, including amphibians (e.g., salamanders, frogs and snakes), invertebrates (e.g., snails, clams and crayfish), and fish (e.g., bluegill and sunfish). Small, isolated wetlands are especially important for amphibian populations — and are often most at risk for degradation, since wetlands smaller than a half-acre are currently not protected by regulations.
Waterbirds and wading birds are particularly dependent on freshwater wetlands. Resident wading birds such as heron, ibis, egrets and endangered wood storks depend on the bay’s freshwater marshes year-round; they also host significant wintertime bird populations. White ibis populations have declined by about 80% in Florida since the 1940s. Adults nesting in Tampa Bay’s islands and coastal areas must nest within nine miles of freshwater marshes to provide food
BAY HABITATSImplement the Tampa Bay Freshwater Wetland Habitat Master Plan
BH-10
Cypress trees are found in forested wetlands, along streams and rivers, and in lakes and ponds throughout the bay area. Historic logging operations of the 19th and early 20th centuries harvested most old-growth cypress. Photo by Nanette O’Hara.
CHARTING THE COURSE: THE COMPREHENSIVE CONSERVATION AND MANAGEMENT PLAN FOR TAMPA BAY (AUGUST 2017 REVISION)
PAGE 90
Go to: TABLE OF CONTENTS | INDEX OF ACTIONS
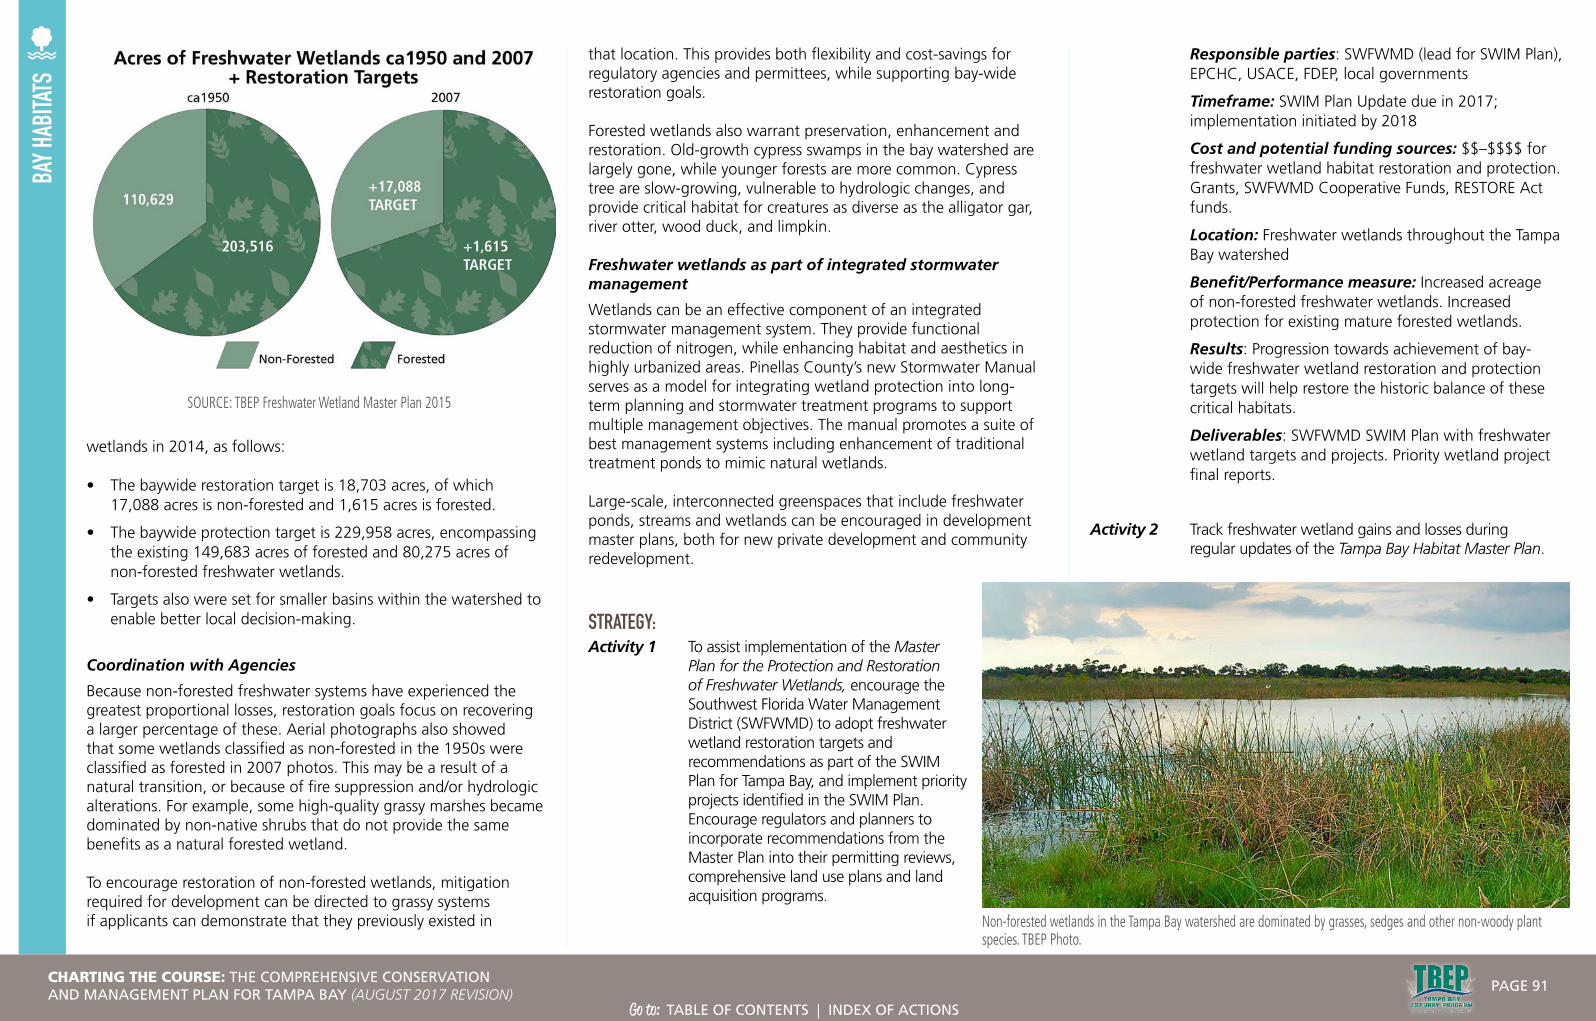
BAY H
ABITA
TS
wetlands in 2014, as follows:
• The baywide restoration target is 18,703 acres, of which 17,088 acres is non-forested and 1,615 acres is forested.
• The baywide protection target is 229,958 acres, encompassing the existing 149,683 acres of forested and 80,275 acres of non-forested freshwater wetlands.
• Targets also were set for smaller basins within the watershed to enable better local decision-making.
Coordination with Agencies
Because non-forested freshwater systems have experienced the greatest proportional losses, restoration goals focus on recovering a larger percentage of these. Aerial photographs also showed that some wetlands classified as non-forested in the 1950s were classified as forested in 2007 photos. This may be a result of a natural transition, or because of fire suppression and/or hydrologic alterations. For example, some high-quality grassy marshes became dominated by non-native shrubs that do not provide the same benefits as a natural forested wetland.
To encourage restoration of non-forested wetlands, mitigation required for development can be directed to grassy systems if applicants can demonstrate that they previously existed in
that location. This provides both flexibility and cost-savings for regulatory agencies and permittees, while supporting bay-wide restoration goals.
Forested wetlands also warrant preservation, enhancement and restoration. Old-growth cypress swamps in the bay watershed are largely gone, while younger forests are more common. Cypress tree are slow-growing, vulnerable to hydrologic changes, and provide critical habitat for creatures as diverse as the alligator gar, river otter, wood duck, and limpkin.
Freshwater wetlands as part of integrated stormwater management
Wetlands can be an effective component of an integrated stormwater management system. They provide functional reduction of nitrogen, while enhancing habitat and aesthetics in highly urbanized areas. Pinellas County’s new Stormwater Manual serves as a model for integrating wetland protection into long-term planning and stormwater treatment programs to support multiple management objectives. The manual promotes a suite of best management systems including enhancement of traditional treatment ponds to mimic natural wetlands.
Large-scale, interconnected greenspaces that include freshwater ponds, streams and wetlands can be encouraged in development master plans, both for new private development and community redevelopment.
STRATEGY:Activity 1 To assist implementation of the Master
Plan for the Protection and Restoration of Freshwater Wetlands, encourage the Southwest Florida Water Management District (SWFWMD) to adopt freshwater wetland restoration targets and recommendations as part of the SWIM Plan for Tampa Bay, and implement priority projects identified in the SWIM Plan. Encourage regulators and planners to incorporate recommendations from the Master Plan into their permitting reviews, comprehensive land use plans and land acquisition programs.
Responsible parties: SWFWMD (lead for SWIM Plan), EPCHC, USACE, FDEP, local governments
Timeframe: SWIM Plan Update due in 2017; implementation initiated by 2018
Cost and potential funding sources: $$–$$$$ for freshwater wetland habitat restoration and protection. Grants, SWFWMD Cooperative Funds, RESTORE Act funds.
Location: Freshwater wetlands throughout the Tampa Bay watershed
Benefit/Performance measure: Increased acreage of non-forested freshwater wetlands. Increased protection for existing mature forested wetlands.
Results: Progression towards achievement of bay-wide freshwater wetland restoration and protection targets will help restore the historic balance of these critical habitats.
Deliverables: SWFWMD SWIM Plan with freshwater wetland targets and projects. Priority wetland project final reports.
Activity 2 Track freshwater wetland gains and losses during regular updates of the Tampa Bay Habitat Master Plan.
SOURCE: TBEP Freshwater Wetland Master Plan 2015
Non-forested wetlands in the Tampa Bay watershed are dominated by grasses, sedges and other non-woody plant species. TBEP Photo.
CHARTING THE COURSE: THE COMPREHENSIVE CONSERVATION AND MANAGEMENT PLAN FOR TAMPA BAY (AUGUST 2017 REVISION)
PAGE 91
Go to: TABLE OF CONTENTS | INDEX OF ACTIONS

BAY H
ABITA
TSDetermine progress towards targets and whether current restoration and protection goals are appropriate. Monitor implementation status of the federal Waters of the United States rule, which clarifies and extends Clean Water Act protections to freshwater streams and wetlands.
Responsible parties: TBEP (lead), SWFWMD, EPCHC, local governments, EPA
Timeframe: 2017–2019 (Habitat Master Plan Update), then ongoing
Cost and potential funding sources: $$–$$$ TBEP funding via CWA Section 320
Location: Freshwater wetlands throughout the Tampa Bay watershed
Benefit/Performance measure: Change in freshwater wetland land uses over time.
Results: Ability to measure progress toward adopted freshwater wetland targets will help guide future freshwater wetland restoration and protection efforts.
Deliverables: Habitat Master Plan Update (2019, then every 5–7 years). Maps of freshwater wetlands throughout the Tampa Bay watershed (2019, then every 5-7 years).
Activity 3 Increase participation and involvement from wetland mitigation bankers in achieving freshwater wetland goals. Provide technical GIS tools to identify appropriate locations and types of freshwater wetland creation and mitigation. Highlight economic incentives of performing non-forested wetland mitigation when ecologically beneficial.
Responsible parties: Wetland regulatory agencies such as FDEP, SWFWMD, USACE, EPCHC and private sector mitigation bankers. GIS tools are available from TBEP. Partners to distribute include wetland regulatory agencies, TBRPC, local governments.
Timeframe: Ongoing
Cost and potential funding sources: $–$$ CWA Section 320 for Habitat Master Plan Update; $ for staff time for regulatory agencies
Location: Appropriate freshwater wetland locations throughout the Tampa Bay watershed
Benefit/Performance measure: Increase percentage of mitigation for non-forested freshwater wetlands within the Tampa Bay watershed.
Results: Wetland bankers can help achieve baywide and basin-specific targets, where appropriate and beneficial.
Deliverables: Chapter in the Tampa Bay Habitat Master Plan Update on freshwater wetlands.
Activity 4 Examine success of freshwater wetland mitigation at various time scales and recommend improvements to mitigation practices (see Action BH-2).
Responsible parties: EPCHC (lead), SWFWMD, USF and other wetland permitting agencies (USACE, FDEP)
Timeframe: 2016–2017
Cost and potential funding sources: $$–$$$ EPA Wetland Development Grant, EPCHC staff time
Location: Hillsborough County
Benefit/Performance measure: Assessment of success and failure rates of freshwater mitigation projects.
Results: Recommended improvements in mitigation practices will result in more successful long-term ecological benefits of freshwater wetland mitigation.
Deliverables: Final Report, including recommendations.
Activity 5 Incorporate creation of freshwater wetlands as an option for stormwater treatment. Encourage other local governments to adopt a BMP guide similar to the Pinellas County Stormwater Manual, to expand opportunities for wetland protection and creation in urbanized areas.
Responsible parties: Local governments
Timeframe: Initiate by 2018.
Cost and potential funding sources: $–$$ Grants, local government stormwater funds
Benefit/Performance measure: Stormwater manuals incorporating freshwater wetlands as an option for stormwater treatment.
Results: Enhanced restoration and creation of freshwater wetland systems in urban areas where natural wetlands are lacking.
Deliverables: BMP guides to expand opportunities for wetland protection and creation in urbanized areas.
1 Scheda Ecological Associates. 2014. Master Plan for the Protection and Restoration of Freshwater Wetlands in the Tampa Bay Watershed, Florida. Tampa Bay Estuary Program Technical Report #05-14.
Sagitaria lattifolia, commonly called arrowhead, is abundant in non-forested freshwater wetlands. Photo by Nanette O’Hara.
Limpkins feed on apple snails in freshwater marshes and swamps in the bay watershed. Photo by Nanette O’Hara.
CHARTING THE COURSE: THE COMPREHENSIVE CONSERVATION AND MANAGEMENT PLAN FOR TAMPA BAY (AUGUST 2017 REVISION)
PAGE 92
Go to: TABLE OF CONTENTS | INDEX OF ACTIONS

BAYHABITATS
BAY HABITATSMaintain seasonal freshwater flows in rivers
OBJECTIVES: Establish and maintain minimum seasonal freshwater flows in rivers by completing and fully implementing the Minimum Flows and Levels (MFLs) for Tampa Bay Area tributaries. Evaluate the ecological effects of MFLs on rivers and lakes in the watershed. Assess changes in freshwater inflows over time resulting from both consumptive water use and climate change.
STATUS: Ongoing. MFLs have been established and adopted for the Hillsborough River, Alafia River and Tampa Bypass Canal. MFLs for the Manatee River and lower Braden River are scheduled for adoption in 2017 and the Little Manatee River in 2020. Lower Hillsborough River minimum flow is currently managed under a recovery strategy with augmented flow from Sulphur Springs and the Tampa Bypass Canal.
RELATED ACTIONS:BH-9 Enhance ecosystem values of
tidal tributaries
WW-1 Expand the beneficial use of reclaimed water
BACKGROUND:Maintaining minimum seasonal freshwater flows and levels (MFLs) in rivers in the Tampa Bay watershed helps maintain the critical hydro-biological habitat characteristics of the estuary.
River water volume and flow rates govern depth, salinity, dissolved oxygen, pH, and water temperature, which in turn sustain biological communities.
The timing and volume of freshwater inflow is also critical to enhancing ecosystem services of tidal tributaries, especially as essential fish habitat (see Action BH-9).
State legislation enacted in 1996 directs Water Management Districts to set MFLs for rivers, lakes and springs that define the limits at which further withdrawals would be “significantly harmful to the water resources or ecology of the area.” MFLs are used in the Districts’ water supply planning, water use permitting and environmental resource permitting programs to ensure that withdrawals do not cause environmental harm. Each District takes into account timing and volume of freshwater inflows as well as minimum flows when developing MFLs. Regional water supply development and water reuse plans reflect the challenges of balancing water supply, wastewater disposal and ecological concerns (see Action WW-1).
The Southwest Florida Water Management District (SWFWMD) collects and analyzes a variety of data and seeks reviews from independent scientists and citizens on proposed MFLs and methods used to derive them. At the request of SWFWMD and Tampa Bay Water, the Tampa Bay Estuary Program (TBEP) convened workshops to obtain input from the bay management community on recommended MFLs for the Hillsborough River and the Alafia River.
SWFWMD has established MFLs for the Hillsborough River, Alafia River, Tampa Bypass Canal and for the upper portions of the Braden River. MFLs for the Manatee River and lower Braden River are scheduled for adoption in 2017. Little Manatee River is scheduled for MFL adoption in 2020. A Morris Bridge Sink water reservation has been adopted to contribute to the Lower Hillsborough River MFL. MFLs are re-evaluated as needed, depending on monitoring data and anticipated or changing environmental conditions. SWFWMD has begun incorporating climate change projections into MFL models using U.S. Army Corps of Engineers 20-year scenarios.
Minimum flows are continuously monitored at multiple locations on most rivers by SWFWMD and the U.S. Geological Survey through gauge stations that measure flow rates and conductivity. If actual flows are or anticipated to be (within 20 years) below established minimum flows, state law requires the Water Management Districts to develop a recovery or prevention strategy. Strategies might include alternative supply development, conservation measures, augmentation of flows or reductions in permitted withdrawals. Additional monitoring specific to the recovery strategy is usually required; for example, for water quality variables including nutrients and dissolved oxygen or biological communities. Other data are collected by SWFWMD and local partners as needs and opportunities arise.
FI-1
At left: The volume and timing of freshwater flows in the tidal stretches of rivers is essential to the ecology of the estuary. The tea-colored waters carry a rich soup of organic material to the lower river and bay. Photo of Alderman’s Ford on the Alafia River courtesy of SWFWMD.
Minimum flows and levels, or MFLs, are the lowest water flows and water levels that can occur in a water body without doing significant harm to the water resources or ecology of the area.
CHARTING THE COURSE: THE COMPREHENSIVE CONSERVATION AND MANAGEMENT PLAN FOR TAMPA BAY (AUGUST 2017 REVISION)
PAGE 93
Go to: TABLE OF CONTENTS | INDEX OF ACTIONS

BAY H
ABITA
TS
Activity 3 Periodically estimate total freshwater flow from all sources to the bay.
Responsible parties: TBEP (5-year hydrologic and nutrient loading updates as part of the Tampa Bay Reasonable Assurance updates) and SWFWMD
Timeframe: Ongoing. Every 5 years, starting in 2017
Cost and potential funding sources: $-$$ TBNMC contributions to support Reasonable Assurance updates
Location: Baywide
Benefit/Performance measure: Analysis of flow data from gauge stations.
Results: A comprehensive measure and ongoing record of total freshwater flow to the bay.
Deliverables: Total cumulative flow data reported every 5 years, as an element of the Tampa Bay Reasonable Assurance document.
TBEP facilitates development of estimated baywide hydrologic freshwater flow and nutrient loads every five years, as an element of the Tampa Bay Reasonable Assurance document.
As of early 2017, established minimum flows are being met for Crystal Springs, Upper Hillsborough River, Alafia River (including Lithia and Buckhorn Springs), Tampa Bypass Canal and upper Braden River. A 2015 assessment indicated minimum flow requirements for the Lower Hillsborough River are being met most of the time, with full achievement of minimum flows anticipated in 2017 with implementation of all projects identified in the current recovery strategy. Water from Sulphur Springs and the Tampa Bypass Canal has been used to supplement flows on the Lower Hillsborough since 2007-2008. By late 2017, the City of Tampa and SWFWMD will supplement flows by first pumping from Blue Sink, then from Morris Bridge Sink. The withdrawal permit issued by the Florida Department of Environmental Protection (FDEP) for Morris Bridge Sink requires baseline sampling and monitoring during pumping in order to detect any ecological harm to surrounding wetlands.
STRATEGY:Activity 1 Complete adoption of MFLs for priority water bodies in
the Tampa Bay watershed, including any recovery and prevention strategies identified to ensure that flows are being met.
Responsible parties: SWFWMD
Timeframe: Ongoing through 2020
Cost and potential funding sources: $$ SWFWMD
Location: Manatee River, Braden River and Little Manatee River
Benefit/Performance measure: Minimum flows and levels established for all priority water bodies in Tampa Bay.
Results: Appropriate minimum seasonal freshwater flow to Tampa Bay based upon best available data.
Deliverables: Adopted MFL limits from SWFWMD.
Activity 2 Assess status of MFLs implemented throughout the bay watershed (springs, rivers and lakes, wetlands and aquifers, if applicable). Summarize changes in consumptive water use. Utilize this data to develop strategies to plan for long-term implications of climate change on freshwater flows to the bay.
Responsible parties: SWFWMD (for assessment of MFLs and recovery strategies), TBEP, USACE for utilization of data to plan for climate-change impacts
Timeframe: Ongoing
Cost and potential funding sources: $$$ SWFWMD, TBERF and other grant funds
Location: Baywide
Benefit/Performance measure: Regular evaluations of MFLs and tracking of freshwater inflows to identify changes over time.
Results: Overall watershed monitoring of freshwater inflow volumes and uses and identification of ecological effects.
Deliverables: Periodic MFL evaluation reports. Periodic updates or projections of impacts of sea level rise on quantity and quality of surface and groundwater resources utilizing data from USACE, TBEP and others.
Managed freshwater discharges to the Hillsborough River just below the dam. Photo courtesy SWFWMD.
Sulphur Springs on the Hillsborough River was a popular swimming area for Tampa residents in the early 20th century. Photo from Hillsborough County Public Library System Burgert Brothers Collection.
CHARTING THE COURSE: THE COMPREHENSIVE CONSERVATION AND MANAGEMENT PLAN FOR TAMPA BAY (AUGUST 2017 REVISION)
PAGE 94
Go to: TABLE OF CONTENTS | INDEX OF ACTIONS
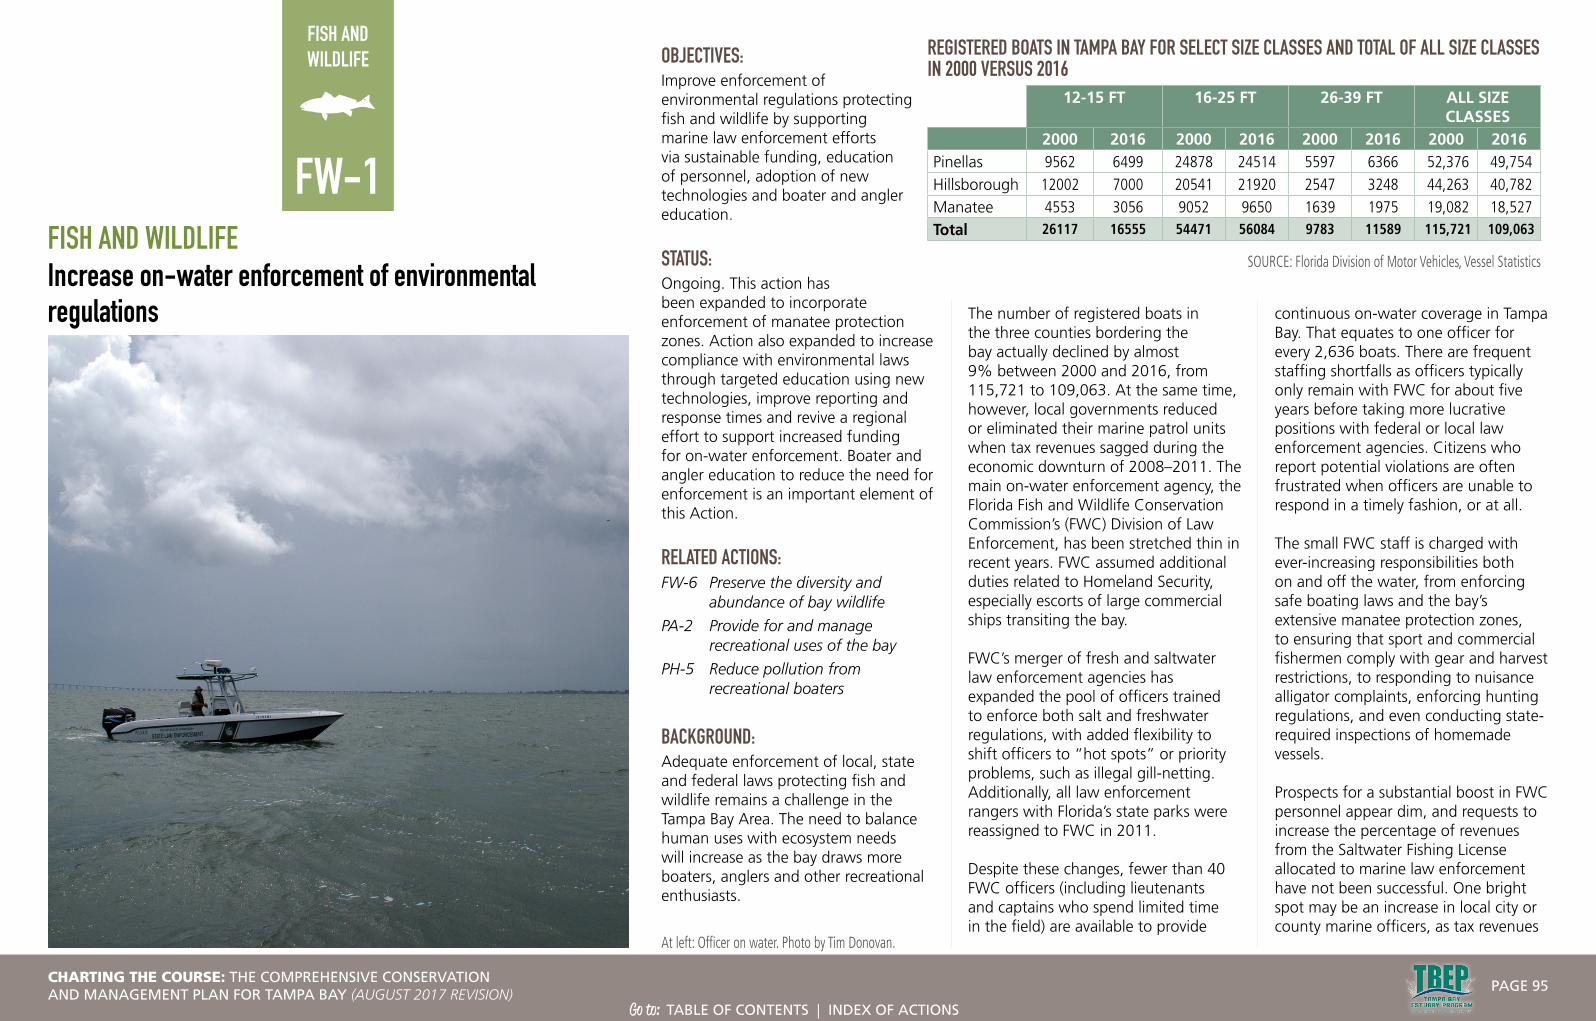
FISH AND WILDLIFE
FISH AND WILDLIFEIncrease on-water enforcement of environmental regulations
OBJECTIVES: Improve enforcement of environmental regulations protecting fish and wildlife by supporting marine law enforcement efforts via sustainable funding, education of personnel, adoption of new technologies and boater and angler education.
STATUS: Ongoing. This action has been expanded to incorporate enforcement of manatee protection zones. Action also expanded to increase compliance with environmental laws through targeted education using new technologies, improve reporting and response times and revive a regional effort to support increased funding for on-water enforcement. Boater and angler education to reduce the need for enforcement is an important element of this Action.
RELATED ACTIONS:FW-6 Preserve the diversity and
abundance of bay wildlife
PA-2 Provide for and manage recreational uses of the bay
PH-5 Reduce pollution from recreational boaters
BACKGROUND:Adequate enforcement of local, state and federal laws protecting fish and wildlife remains a challenge in the Tampa Bay Area. The need to balance human uses with ecosystem needs will increase as the bay draws more boaters, anglers and other recreational enthusiasts.
The number of registered boats in the three counties bordering the bay actually declined by almost 9% between 2000 and 2016, from 115,721 to 109,063. At the same time, however, local governments reduced or eliminated their marine patrol units when tax revenues sagged during the economic downturn of 2008–2011. The main on-water enforcement agency, the Florida Fish and Wildlife Conservation Commission’s (FWC) Division of Law Enforcement, has been stretched thin in recent years. FWC assumed additional duties related to Homeland Security, especially escorts of large commercial ships transiting the bay.
FWC’s merger of fresh and saltwater law enforcement agencies has expanded the pool of officers trained to enforce both salt and freshwater regulations, with added flexibility to shift officers to “hot spots” or priority problems, such as illegal gill-netting. Additionally, all law enforcement rangers with Florida’s state parks were reassigned to FWC in 2011.
Despite these changes, fewer than 40 FWC officers (including lieutenants and captains who spend limited time in the field) are available to provide
continuous on-water coverage in Tampa Bay. That equates to one officer for every 2,636 boats. There are frequent staffing shortfalls as officers typically only remain with FWC for about five years before taking more lucrative positions with federal or local law enforcement agencies. Citizens who report potential violations are often frustrated when officers are unable to respond in a timely fashion, or at all. The small FWC staff is charged with ever-increasing responsibilities both on and off the water, from enforcing safe boating laws and the bay’s extensive manatee protection zones, to ensuring that sport and commercial fishermen comply with gear and harvest restrictions, to responding to nuisance alligator complaints, enforcing hunting regulations, and even conducting state-required inspections of homemade vessels.
Prospects for a substantial boost in FWC personnel appear dim, and requests to increase the percentage of revenues from the Saltwater Fishing License allocated to marine law enforcement have not been successful. One bright spot may be an increase in local city or county marine officers, as tax revenues
At left: Officer on water. Photo by Tim Donovan.
FW-1
REGISTERED BOATS IN TAMPA BAY FOR SELECT SIZE CLASSES AND TOTAL OF ALL SIZE CLASSES IN 2000 VERSUS 2016
12-15 FT 16-25 FT 26-39 FT ALL SIZE CLASSES
2000 2016 2000 2016 2000 2016 2000 2016Pinellas 9562 6499 24878 24514 5597 6366 52,376 49,754 Hillsborough 12002 7000 20541 21920 2547 3248 44,263 40,782 Manatee 4553 3056 9052 9650 1639 1975 19,082 18,527 Total 26117 16555 54471 56084 9783 11589 115,721 109,063
SOURCE: Florida Division of Motor Vehicles, Vessel Statistics
CHARTING THE COURSE: THE COMPREHENSIVE CONSERVATION AND MANAGEMENT PLAN FOR TAMPA BAY (AUGUST 2017 REVISION)
PAGE 95
Go to: TABLE OF CONTENTS | INDEX OF ACTIONS
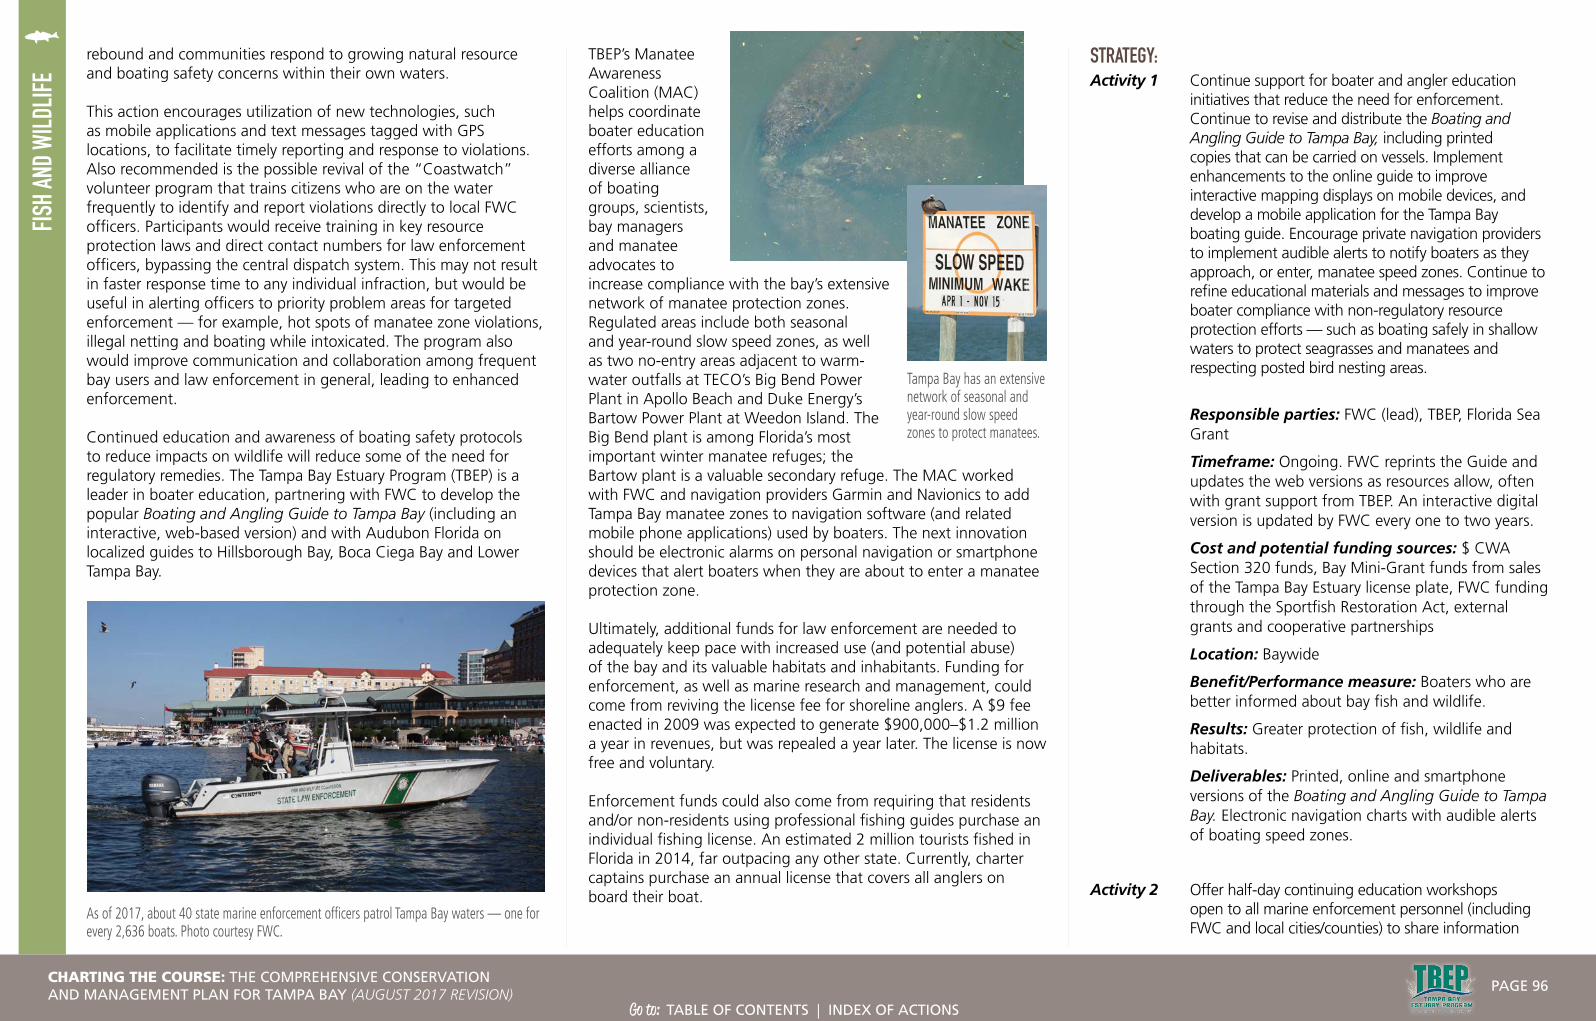
FISH
AND
WILD
LIFE
rebound and communities respond to growing natural resource and boating safety concerns within their own waters.
This action encourages utilization of new technologies, such as mobile applications and text messages tagged with GPS locations, to facilitate timely reporting and response to violations. Also recommended is the possible revival of the “Coastwatch” volunteer program that trains citizens who are on the water frequently to identify and report violations directly to local FWC officers. Participants would receive training in key resource protection laws and direct contact numbers for law enforcement officers, bypassing the central dispatch system. This may not result in faster response time to any individual infraction, but would be useful in alerting officers to priority problem areas for targeted enforcement — for example, hot spots of manatee zone violations, illegal netting and boating while intoxicated. The program also would improve communication and collaboration among frequent bay users and law enforcement in general, leading to enhanced enforcement.
Continued education and awareness of boating safety protocols to reduce impacts on wildlife will reduce some of the need for regulatory remedies. The Tampa Bay Estuary Program (TBEP) is a leader in boater education, partnering with FWC to develop the popular Boating and Angling Guide to Tampa Bay (including an interactive, web-based version) and with Audubon Florida on localized guides to Hillsborough Bay, Boca Ciega Bay and Lower Tampa Bay.
TBEP’s Manatee Awareness Coalition (MAC) helps coordinate boater education efforts among a diverse alliance of boating groups, scientists, bay managers and manatee advocates to increase compliance with the bay’s extensive network of manatee protection zones. Regulated areas include both seasonal and year-round slow speed zones, as well as two no-entry areas adjacent to warm-water outfalls at TECO’s Big Bend Power Plant in Apollo Beach and Duke Energy’s Bartow Power Plant at Weedon Island. The Big Bend plant is among Florida’s most important winter manatee refuges; the Bartow plant is a valuable secondary refuge. The MAC worked with FWC and navigation providers Garmin and Navionics to add Tampa Bay manatee zones to navigation software (and related mobile phone applications) used by boaters. The next innovation should be electronic alarms on personal navigation or smartphone devices that alert boaters when they are about to enter a manatee protection zone.
Ultimately, additional funds for law enforcement are needed to adequately keep pace with increased use (and potential abuse) of the bay and its valuable habitats and inhabitants. Funding for enforcement, as well as marine research and management, could come from reviving the license fee for shoreline anglers. A $9 fee enacted in 2009 was expected to generate $900,000–$1.2 million a year in revenues, but was repealed a year later. The license is now free and voluntary.
Enforcement funds could also come from requiring that residents and/or non-residents using professional fishing guides purchase an individual fishing license. An estimated 2 million tourists fished in Florida in 2014, far outpacing any other state. Currently, charter captains purchase an annual license that covers all anglers on board their boat.
STRATEGY: Activity 1 Continue support for boater and angler education
initiatives that reduce the need for enforcement. Continue to revise and distribute the Boating and Angling Guide to Tampa Bay, including printed copies that can be carried on vessels. Implement enhancements to the online guide to improve interactive mapping displays on mobile devices, and develop a mobile application for the Tampa Bay boating guide. Encourage private navigation providers to implement audible alerts to notify boaters as they approach, or enter, manatee speed zones. Continue to refine educational materials and messages to improve boater compliance with non-regulatory resource protection efforts — such as boating safely in shallow waters to protect seagrasses and manatees and respecting posted bird nesting areas.
Responsible parties: FWC (lead), TBEP, Florida Sea Grant
Timeframe: Ongoing. FWC reprints the Guide and updates the web versions as resources allow, often with grant support from TBEP. An interactive digital version is updated by FWC every one to two years.
Cost and potential funding sources: $ CWA Section 320 funds, Bay Mini-Grant funds from sales of the Tampa Bay Estuary license plate, FWC funding through the Sportfish Restoration Act, external grants and cooperative partnerships
Location: Baywide
Benefit/Performance measure: Boaters who are better informed about bay fish and wildlife.
Results: Greater protection of fish, wildlife and habitats.
Deliverables: Printed, online and smartphone versions of the Boating and Angling Guide to Tampa Bay. Electronic navigation charts with audible alerts of boating speed zones.
Activity 2 Offer half-day continuing education workshops open to all marine enforcement personnel (including FWC and local cities/counties) to share information
As of 2017, about 40 state marine enforcement officers patrol Tampa Bay waters — one for every 2,636 boats. Photo courtesy FWC.
Tampa Bay has an extensive network of seasonal and year-round slow speed zones to protect manatees.
CHARTING THE COURSE: THE COMPREHENSIVE CONSERVATION AND MANAGEMENT PLAN FOR TAMPA BAY (AUGUST 2017 REVISION)
PAGE 96
Go to: TABLE OF CONTENTS | INDEX OF ACTIONS
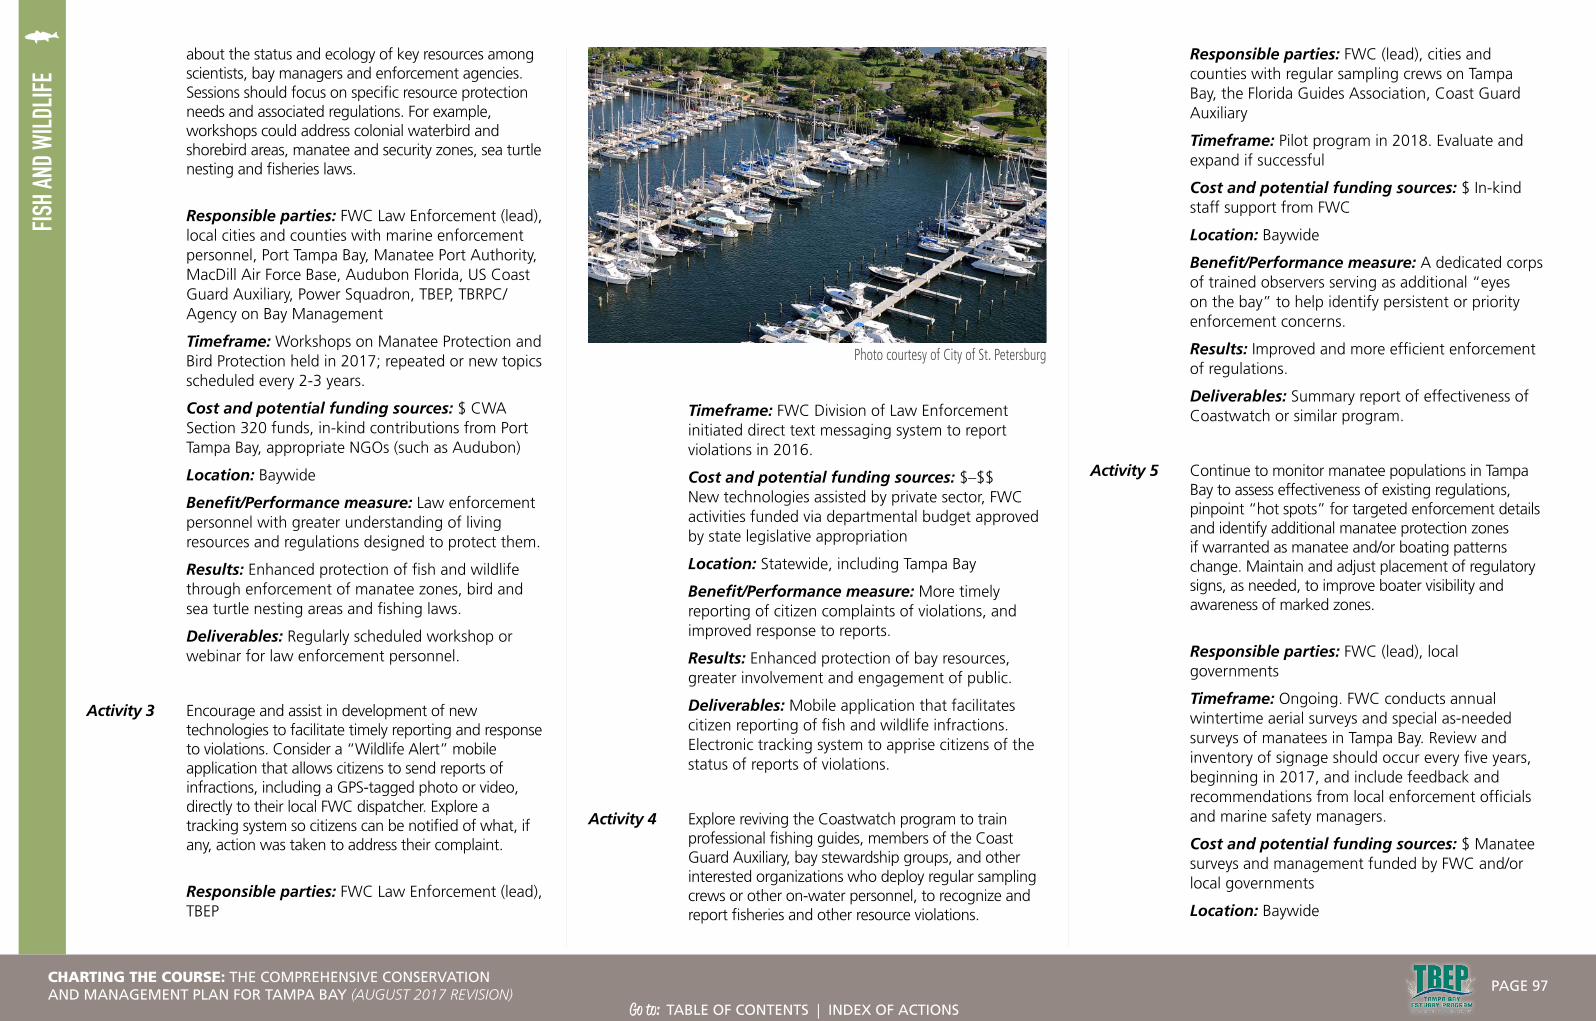
FISH
AND
WILD
LIFE
about the status and ecology of key resources among scientists, bay managers and enforcement agencies. Sessions should focus on specific resource protection needs and associated regulations. For example, workshops could address colonial waterbird and shorebird areas, manatee and security zones, sea turtle nesting and fisheries laws.
Responsible parties: FWC Law Enforcement (lead), local cities and counties with marine enforcement personnel, Port Tampa Bay, Manatee Port Authority, MacDill Air Force Base, Audubon Florida, US Coast Guard Auxiliary, Power Squadron, TBEP, TBRPC/Agency on Bay Management
Timeframe: Workshops on Manatee Protection and Bird Protection held in 2017; repeated or new topics scheduled every 2-3 years.
Cost and potential funding sources: $ CWA Section 320 funds, in-kind contributions from Port Tampa Bay, appropriate NGOs (such as Audubon)
Location: Baywide
Benefit/Performance measure: Law enforcement personnel with greater understanding of living resources and regulations designed to protect them.
Results: Enhanced protection of fish and wildlife through enforcement of manatee zones, bird and sea turtle nesting areas and fishing laws.
Deliverables: Regularly scheduled workshop or webinar for law enforcement personnel.
Activity 3 Encourage and assist in development of new technologies to facilitate timely reporting and response to violations. Consider a “Wildlife Alert” mobile application that allows citizens to send reports of infractions, including a GPS-tagged photo or video, directly to their local FWC dispatcher. Explore a tracking system so citizens can be notified of what, if any, action was taken to address their complaint.
Responsible parties: FWC Law Enforcement (lead), TBEP
Timeframe: FWC Division of Law Enforcement initiated direct text messaging system to report violations in 2016.
Cost and potential funding sources: $–$$ New technologies assisted by private sector, FWC activities funded via departmental budget approved by state legislative appropriation
Location: Statewide, including Tampa Bay
Benefit/Performance measure: More timely reporting of citizen complaints of violations, and improved response to reports.
Results: Enhanced protection of bay resources, greater involvement and engagement of public.
Deliverables: Mobile application that facilitates citizen reporting of fish and wildlife infractions. Electronic tracking system to apprise citizens of the status of reports of violations.
Activity 4 Explore reviving the Coastwatch program to train professional fishing guides, members of the Coast Guard Auxiliary, bay stewardship groups, and other interested organizations who deploy regular sampling crews or other on-water personnel, to recognize and report fisheries and other resource violations.
Responsible parties: FWC (lead), cities and counties with regular sampling crews on Tampa Bay, the Florida Guides Association, Coast Guard Auxiliary
Timeframe: Pilot program in 2018. Evaluate and expand if successful
Cost and potential funding sources: $ In-kind staff support from FWC
Location: Baywide
Benefit/Performance measure: A dedicated corps of trained observers serving as additional “eyes on the bay” to help identify persistent or priority enforcement concerns.
Results: Improved and more efficient enforcement of regulations.
Deliverables: Summary report of effectiveness of Coastwatch or similar program.
Activity 5 Continue to monitor manatee populations in Tampa Bay to assess effectiveness of existing regulations, pinpoint “hot spots” for targeted enforcement details and identify additional manatee protection zones if warranted as manatee and/or boating patterns change. Maintain and adjust placement of regulatory signs, as needed, to improve boater visibility and awareness of marked zones.
Responsible parties: FWC (lead), local governments
Timeframe: Ongoing. FWC conducts annual wintertime aerial surveys and special as-needed surveys of manatees in Tampa Bay. Review and inventory of signage should occur every five years, beginning in 2017, and include feedback and recommendations from local enforcement officials and marine safety managers.
Cost and potential funding sources: $ Manatee surveys and management funded by FWC and/or local governments
Location: Baywide
Photo courtesy of City of St. Petersburg
CHARTING THE COURSE: THE COMPREHENSIVE CONSERVATION AND MANAGEMENT PLAN FOR TAMPA BAY (AUGUST 2017 REVISION)
PAGE 97
Go to: TABLE OF CONTENTS | INDEX OF ACTIONS

FISH
AND
WILD
LIFE
Benefit/Performance measure: Identification and monitoring of problem areas of manatee/boater conflicts.
Results: Improved coordination between manatee researchers and enforcement personnel to identify problem areas of manatee/boater conflicts in a timely manner.
Deliverables: Annual manatee mortality reports to identify watercraft-related deaths. Annual synoptic surveys to estimate manatee populations in Tampa Bay in winter. Occasional, or as-needed, aerial surveys to estimate manatee distribution and habitat utilization in summer.
Activity 6 Form a task force of interested bay managers, bay users and others within the Agency on Bay Management to develop and implement a strategy to achieve enhanced funding for on-water enforcement — including support for a minimal shoreline fishing license ($5) with revenues directed toward resource enforcement, research and management. Examine additional funding sources, such as a requirement that anglers fishing aboard a charter boat in inshore waters obtain an individual license.
Responsible parties: Agency on Bay Management, TBEP Manatee Awareness Coalition, local governments
Timeframe: Task Force to be formed in 2018. Alternatively, ABM’s Legislative Affairs Committee could serve as the nucleus of a regional group. Outreach should focus on members of the Tampa Bay Legislative Delegation and key committee chairs in both the Florida House and Senate
Cost and potential funding sources: $ In-kind staff support from TBRPC and TBEP only
Location: Baywide
Benefit/Performance measure: Increase in number of on-water state or local law enforcement officers.
Results: Improved protection of bay fish and wildlife.
Deliverables: “White Paper” framing law enforcement resource limitations and sustainable funding sources. Ongoing progress reports from Task Force.
CHARTING THE COURSE: THE COMPREHENSIVE CONSERVATION AND MANAGEMENT PLAN FOR TAMPA BAY (AUGUST 2017 REVISION)
PAGE 98
Go to: TABLE OF CONTENTS | INDEX OF ACTIONS
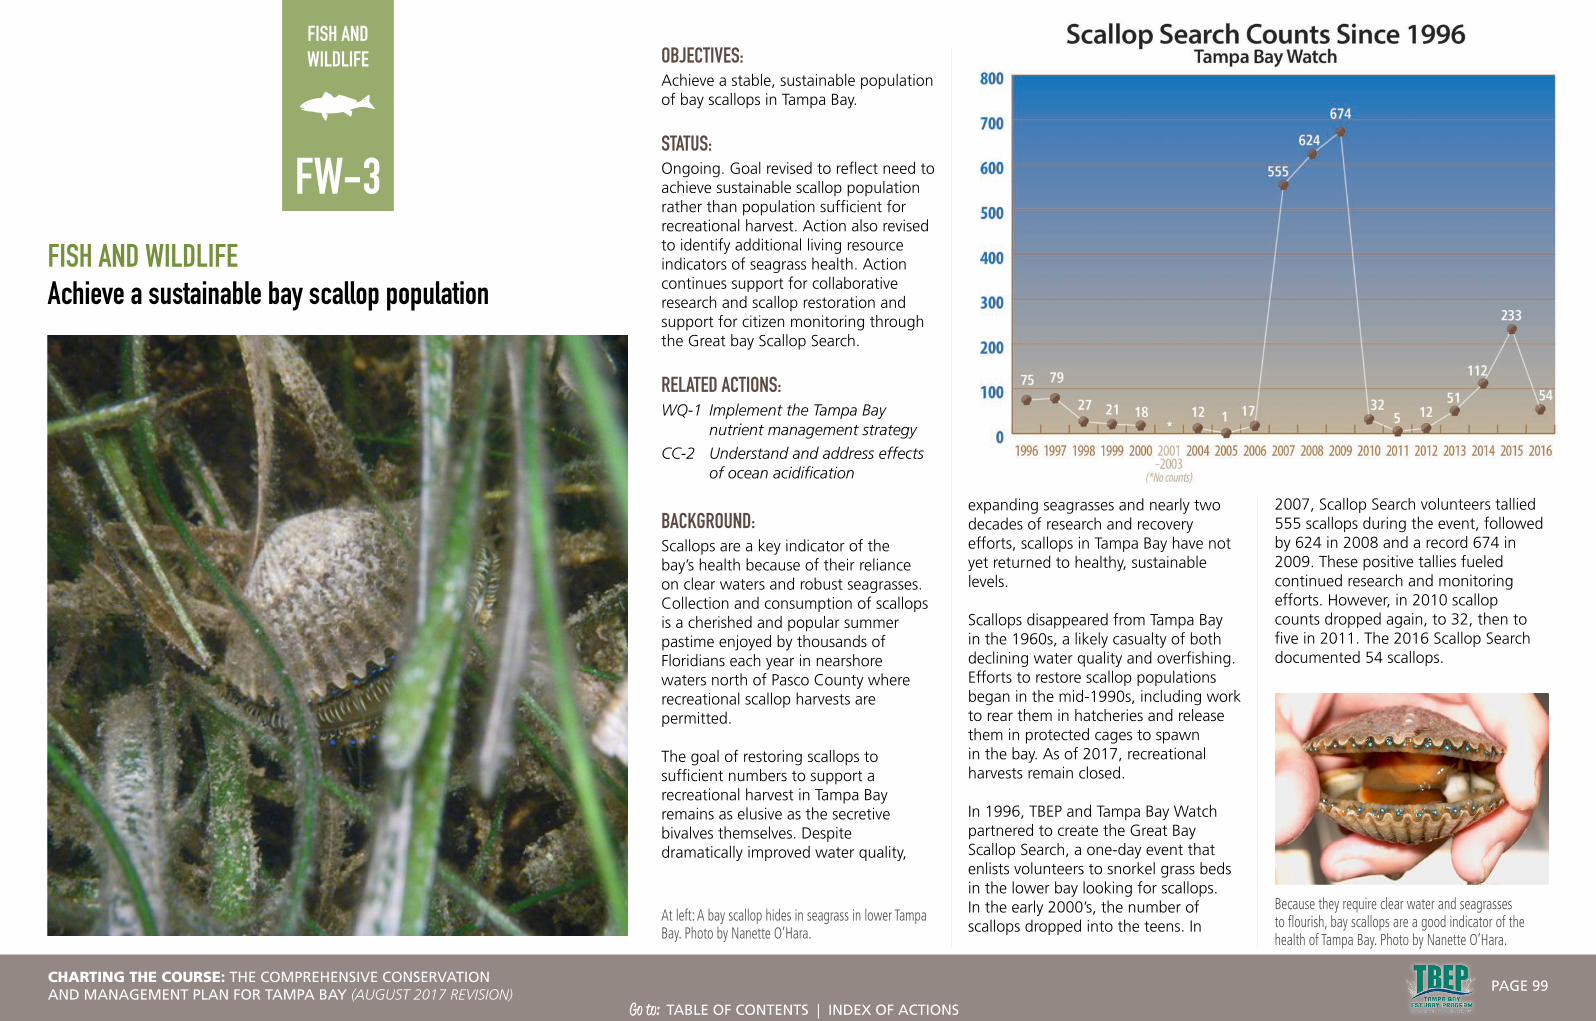
FISH AND WILDLIFE
2007, Scallop Search volunteers tallied 555 scallops during the event, followed by 624 in 2008 and a record 674 in 2009. These positive tallies fueled continued research and monitoring efforts. However, in 2010 scallop counts dropped again, to 32, then to five in 2011. The 2016 Scallop Search documented 54 scallops.
FISH AND WILDLIFEAchieve a sustainable bay scallop population
OBJECTIVES:Achieve a stable, sustainable population of bay scallops in Tampa Bay.
STATUS:Ongoing. Goal revised to reflect need to achieve sustainable scallop population rather than population sufficient for recreational harvest. Action also revised to identify additional living resource indicators of seagrass health. Action continues support for collaborative research and scallop restoration and support for citizen monitoring through the Great bay Scallop Search.
RELATED ACTIONS:WQ-1 Implement the Tampa Bay
nutrient management strategy
CC-2 Understand and address effects of ocean acidification
BACKGROUND:Scallops are a key indicator of the bay’s health because of their reliance on clear waters and robust seagrasses. Collection and consumption of scallops is a cherished and popular summer pastime enjoyed by thousands of Floridians each year in nearshore waters north of Pasco County where recreational scallop harvests are permitted.
The goal of restoring scallops to sufficient numbers to support a recreational harvest in Tampa Bay remains as elusive as the secretive bivalves themselves. Despite dramatically improved water quality,
expanding seagrasses and nearly two decades of research and recovery efforts, scallops in Tampa Bay have not yet returned to healthy, sustainable levels.
Scallops disappeared from Tampa Bay in the 1960s, a likely casualty of both declining water quality and overfishing. Efforts to restore scallop populations began in the mid-1990s, including work to rear them in hatcheries and release them in protected cages to spawn in the bay. As of 2017, recreational harvests remain closed.
In 1996, TBEP and Tampa Bay Watch partnered to create the Great Bay Scallop Search, a one-day event that enlists volunteers to snorkel grass beds in the lower bay looking for scallops. In the early 2000’s, the number of scallops dropped into the teens. In
At left: A bay scallop hides in seagrass in lower Tampa Bay. Photo by Nanette O’Hara.
Because they require clear water and seagrasses to flourish, bay scallops are a good indicator of the health of Tampa Bay. Photo by Nanette O’Hara.
FW-3
CHARTING THE COURSE: THE COMPREHENSIVE CONSERVATION AND MANAGEMENT PLAN FOR TAMPA BAY (AUGUST 2017 REVISION)
PAGE 99
Go to: TABLE OF CONTENTS | INDEX OF ACTIONS

FISH
AND
WILD
LIFE
bay scallops are extremely sensitive to changes in water clarity, salinity, temperature and red tide. Their limited life span of only 12-18 months complicates efforts to revive populations in the bay. Additionally, only one egg out of the 12 million or so produced by a single adult scallop may survive. Moreover, new research indicates that the success of scallop recruitment here may depend upon successful dispersal of larvae from important “source sites” in the Big Bend area of Florida, where scallops are most abundant, but harvest pressure is intense. Ocean acidification associated with climate change also may affect the future health of bay scallops and other mollusks by impairing their ability to form hard, calcified shells.
Scientists continue to survey scallop populations in Tampa Bay as part of a coordinated monitoring effort throughout Southwest Florida and to investigate innovative ways to improve spawning success and larval survival. A new restoration approach that encompasses all life-stages is being applied by scientists from Mote Marine Laboratory, the Sarasota Bay Estuary Program, Florida Fish and Wildlife Conservation Commission and volunteers with Sarasota Bay Watch. The team is testing several techniques to boost scallop populations. One method deploys scallop collectors made from mesh produce bags that give larvae an inviting place to settle. In some trials, larvae are raised to the juvenile stage then released into seagrass beds. Finally, adult scallops housed together in protective cages are temporarily located in seagrass beds during their spawning period.
In the next decade, it is unlikely that scallop populations in Tampa Bay will rebound to levels sufficient to support a recreational harvest season. Therefore, this action proposes a revised goal of restoring scallop stocks to a self-sustaining level, with enough adults surviving to spawn each year to create a stable population so larval seeding efforts may one day no longer be necessary.
STRATEGY:Activity 1 Continue to implement Action WQ-1 to ensure
sufficient water quality and seagrasses to foster scallop recovery.
Responsible parties: TBEP, All members of the Tampa Bay Nitrogen Management Consortium (NMC)
Timeframe: “Reasonable Assurance” documentation of reductions in nitrogen loadings and water quality monitoring to be submitted in 2017, and every five years thereafter, as required by the Florida Department of Environmental Protection
Cost and potential funding sources: $$$ CWA Section 320, Nitrogen Management contributions paid once every five years by all Consortium members
Location: Baywide
Benefit/Performance measure: Water clarity and nitrogen reduction goals being met.
Results: Reduction of nitrogen loadings and resulting water clarity sufficient to support seagrasses essential for scallops to thrive in Tampa Bay.
Deliverables: “Reasonable Assurance” document summarizing progress in achieving and maintaining nitrogen reductions goals for each bay segment. Annual water quality summary (the “Decision Matrix”) for four major bay segments, based on adopted segment-specific water clarity targets.
Activity 2 Continue participation in collaborative research, monitoring and restoration efforts in Tampa Bay and other SW Florida estuaries. Improve understanding of
the levels of spawning and recruitment necessary to establish a self-sustaining population of bay scallops in Tampa Bay.
Responsible parties: TBEP, SBEP, CHNEP, FWC, Mote Marine Laboratory, Tampa Bay Watch, Sarasota Bay Watch and other members of the SW Florida Scallop Restoration Working Group
Timeframe: Ongoing. Development of methods and benchmarks for promoting sustainable scallop populations to begin in 2017
Cost and potential funding sources: $ CWA Section 320 funds, external grant funds
Location: Collaborative effort throughout SW Florida, including Tampa Bay, Sarasota Bay and Charlotte Harbor
Benefit/Performance measure: Better understanding of the requirements for self-sustaining population of bay scallops in Tampa Bay.
Results: Stable, sustainable population of bay scallops in Tampa Bay and other estuaries throughout SW Florida.
Deliverables: Methodology for determining
Surveys conducted annually by state biologists provide important data about scallop abundance. Photo courtesy FWC.
Volunteers snorkel in seagrasses in Lower Tampa Bay to count scallops during the Great Bay Scallop Search. TBEP Photo.
CHARTING THE COURSE: THE COMPREHENSIVE CONSERVATION AND MANAGEMENT PLAN FOR TAMPA BAY (AUGUST 2017 REVISION)
PAGE 100
Go to: TABLE OF CONTENTS | INDEX OF ACTIONS

FISH
AND
WILD
LIFE
sustainable population of bay scallops. Recommendations for achieving a stable population, including additional research and monitoring needs, and restocking efforts.
Activity 3 Continue to conduct the Great Bay Scallop Search to foster citizen awareness of the bay’s value and to support monitoring to determine viable, sustainable populations in the bay once benchmarks are established.
Responsible parties: Tampa Bay Watch, TBEP
Timeframe: Scallop Search conducted annually, usually in August
Cost and potential funding sources: $ CWA Section 320 funds
Location: Lower Tampa Bay (specifically waters in and around Fort De Soto Park)
Benefit/Performance measure: Participation of citizens in monitoring boosts public appreciation of bay’s value and contributes to scientific understanding of scallops in Tampa Bay.
Results: Annual estimate of scallop abundance helps to identify long-term trends in scallop recovery.
Deliverables: Report summarizing abundance and distribution of scallops in Scallop Search monitoring area.
Activity 4 Identify appropriate additional living resource indicators of bay health, such as pink shrimp or spotted sea trout, which are less vulnerable to extreme yearly fluctuations. These species may provide a more comprehensive and accurate long-term portrait of bay health.
Responsible parties: TBEP, FWC-FWRI
Timeframe: Identification and assessment of additional suitable indicators in 2017
Cost and potential funding sources: $ CWA Section 320 funds
Location: Baywide
Benefit/Performance measure: Selection and adoption of monitoring protocols for one or more additional living resources indicators.
Results: Use of more predictable living resource indicators provides a more comprehensive assessment of bay health.
Deliverables: Report assessing viability and relative merits of additional living resource indicators. Monitoring reports incorporating status of selected indicators.
CHARTING THE COURSE: THE COMPREHENSIVE CONSERVATION AND MANAGEMENT PLAN FOR TAMPA BAY (AUGUST 2017 REVISION)
PAGE 101
Go to: TABLE OF CONTENTS | INDEX OF ACTIONS
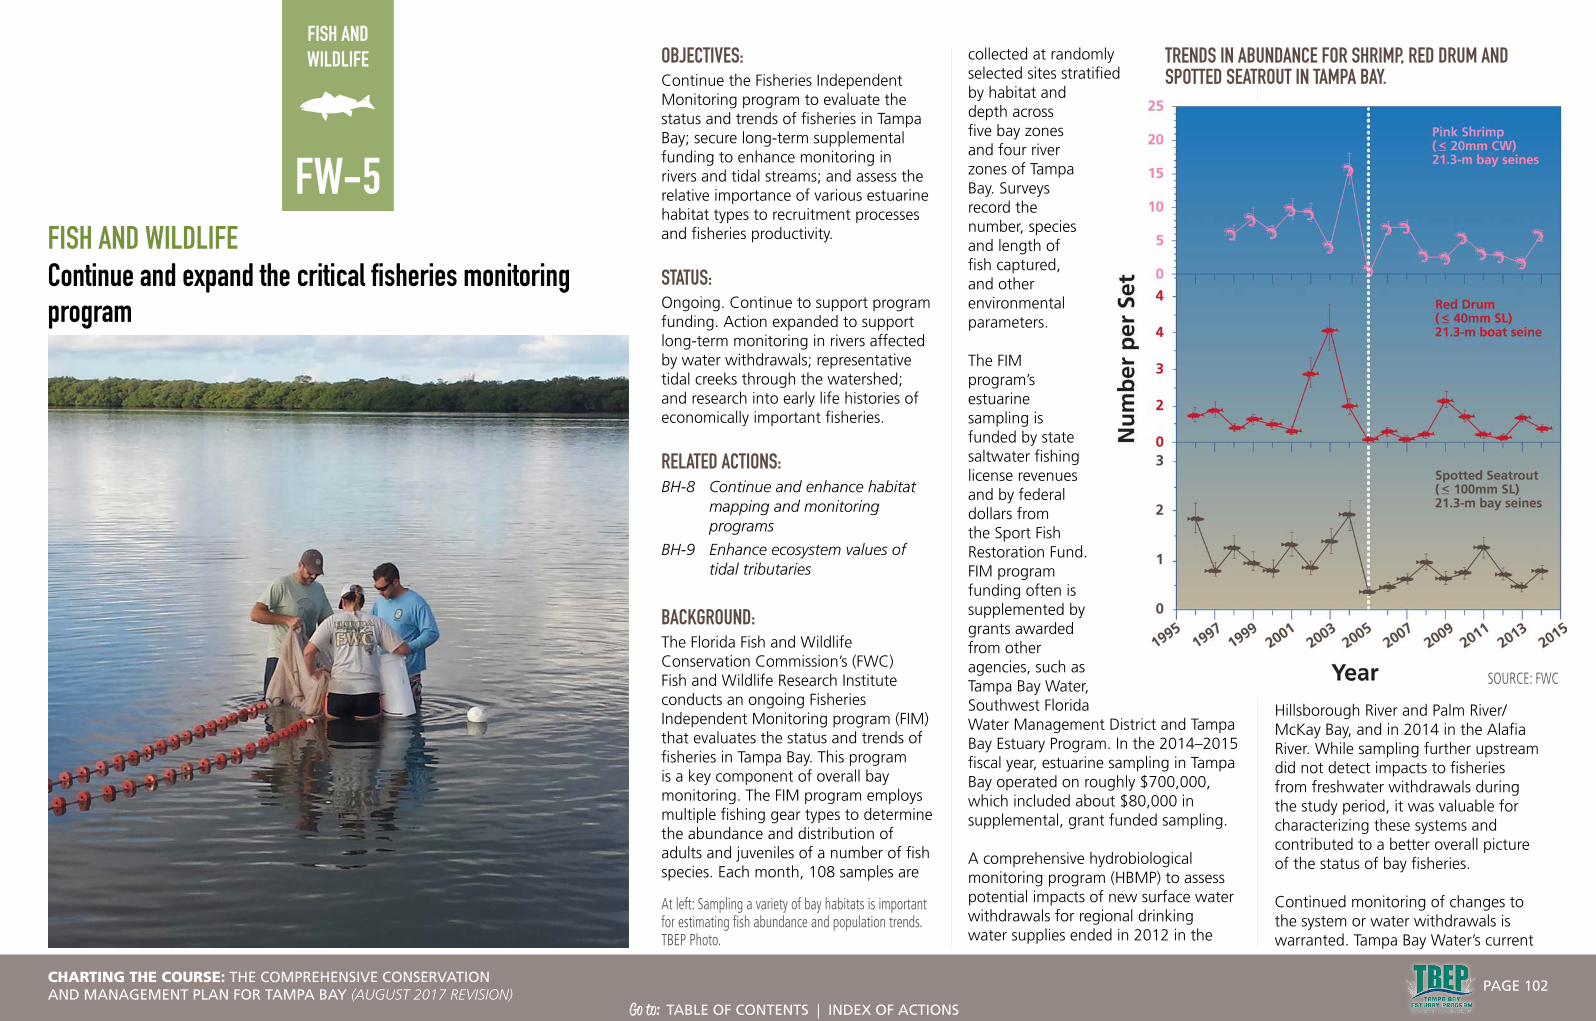
FISH AND WILDLIFE
FISH AND WILDLIFEContinue and expand the critical fisheries monitoring program
FW-5
At left: Sampling a variety of bay habitats is important for estimating fish abundance and population trends. TBEP Photo.
OBJECTIVES:Continue the Fisheries Independent Monitoring program to evaluate the status and trends of fisheries in Tampa Bay; secure long-term supplemental funding to enhance monitoring in rivers and tidal streams; and assess the relative importance of various estuarine habitat types to recruitment processes and fisheries productivity.
STATUS: Ongoing. Continue to support program funding. Action expanded to support long-term monitoring in rivers affected by water withdrawals; representative tidal creeks through the watershed; and research into early life histories of economically important fisheries.
RELATED ACTIONS: BH-8 Continue and enhance habitat
mapping and monitoring programs
BH-9 Enhance ecosystem values of tidal tributaries
BACKGROUND:The Florida Fish and Wildlife Conservation Commission’s (FWC) Fish and Wildlife Research Institute conducts an ongoing Fisheries Independent Monitoring program (FIM) that evaluates the status and trends of fisheries in Tampa Bay. This program is a key component of overall bay monitoring. The FIM program employs multiple fishing gear types to determine the abundance and distribution of adults and juveniles of a number of fish species. Each month, 108 samples are
collected at randomly selected sites stratified by habitat and depth across five bay zones and four river zones of Tampa Bay. Surveys record the number, species and length of fish captured, and other environmental parameters.
The FIM program’s estuarine sampling is funded by state saltwater fishing license revenues and by federal dollars from the Sport Fish Restoration Fund. FIM program funding often is supplemented by grants awarded from other agencies, such as Tampa Bay Water, Southwest Florida Water Management District and Tampa Bay Estuary Program. In the 2014–2015 fiscal year, estuarine sampling in Tampa Bay operated on roughly $700,000, which included about $80,000 in supplemental, grant funded sampling.
A comprehensive hydrobiological monitoring program (HBMP) to assess potential impacts of new surface water withdrawals for regional drinking water supplies ended in 2012 in the
Hillsborough River and Palm River/McKay Bay, and in 2014 in the Alafia River. While sampling further upstream did not detect impacts to fisheries from freshwater withdrawals during the study period, it was valuable for characterizing these systems and contributed to a better overall picture of the status of bay fisheries.
Continued monitoring of changes to the system or water withdrawals is warranted. Tampa Bay Water’s current
TRENDS IN ABUNDANCE FOR SHRIMP, RED DRUM AND SPOTTED SEATROUT IN TAMPA BAY.
CHARTING THE COURSE: THE COMPREHENSIVE CONSERVATION AND MANAGEMENT PLAN FOR TAMPA BAY (AUGUST 2017 REVISION)
PAGE 102
Go to: TABLE OF CONTENTS | INDEX OF ACTIONS
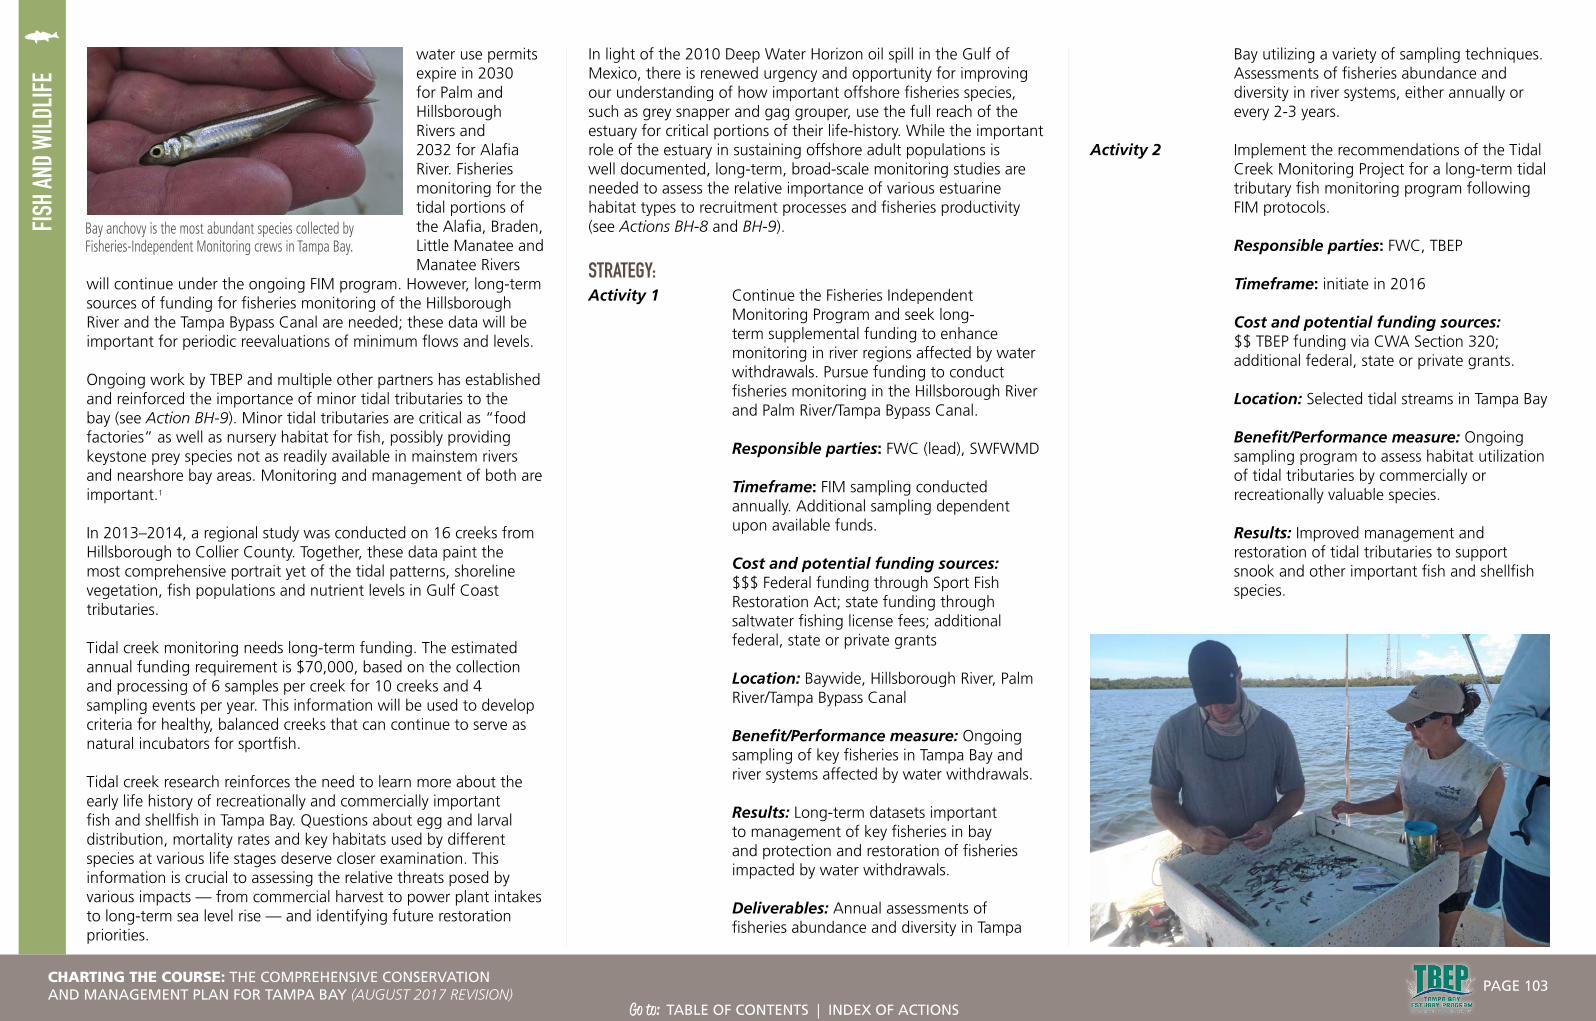
FISH
AND
WILD
LIFE
In light of the 2010 Deep Water Horizon oil spill in the Gulf of Mexico, there is renewed urgency and opportunity for improving our understanding of how important offshore fisheries species, such as grey snapper and gag grouper, use the full reach of the estuary for critical portions of their life-history. While the important role of the estuary in sustaining offshore adult populations is well documented, long-term, broad-scale monitoring studies are needed to assess the relative importance of various estuarine habitat types to recruitment processes and fisheries productivity (see Actions BH-8 and BH-9).
STRATEGY:Activity 1 Continue the Fisheries Independent
Monitoring Program and seek long-term supplemental funding to enhance monitoring in river regions affected by water withdrawals. Pursue funding to conduct fisheries monitoring in the Hillsborough River and Palm River/Tampa Bypass Canal.
Responsible parties: FWC (lead), SWFWMD
Timeframe: FIM sampling conducted annually. Additional sampling dependent upon available funds.
Cost and potential funding sources: $$$ Federal funding through Sport Fish Restoration Act; state funding through saltwater fishing license fees; additional federal, state or private grants
Location: Baywide, Hillsborough River, Palm River/Tampa Bypass Canal
Benefit/Performance measure: Ongoing sampling of key fisheries in Tampa Bay and river systems affected by water withdrawals.
Results: Long-term datasets important to management of key fisheries in bay and protection and restoration of fisheries impacted by water withdrawals.
Deliverables: Annual assessments of fisheries abundance and diversity in Tampa
Bay utilizing a variety of sampling techniques. Assessments of fisheries abundance and diversity in river systems, either annually or every 2-3 years.
Activity 2 Implement the recommendations of the Tidal Creek Monitoring Project for a long-term tidal tributary fish monitoring program following FIM protocols.
Responsible parties: FWC, TBEP
Timeframe: initiate in 2016
Cost and potential funding sources: $$ TBEP funding via CWA Section 320; additional federal, state or private grants.
Location: Selected tidal streams in Tampa Bay
Benefit/Performance measure: Ongoing sampling program to assess habitat utilization of tidal tributaries by commercially or recreationally valuable species.
Results: Improved management and restoration of tidal tributaries to support snook and other important fish and shellfish species.
water use permits expire in 2030 for Palm and Hillsborough Rivers and 2032 for Alafia River. Fisheries monitoring for the tidal portions of the Alafia, Braden, Little Manatee and Manatee Rivers
will continue under the ongoing FIM program. However, long-term sources of funding for fisheries monitoring of the Hillsborough River and the Tampa Bypass Canal are needed; these data will be important for periodic reevaluations of minimum flows and levels.
Ongoing work by TBEP and multiple other partners has established and reinforced the importance of minor tidal tributaries to the bay (see Action BH-9). Minor tidal tributaries are critical as “food factories” as well as nursery habitat for fish, possibly providing keystone prey species not as readily available in mainstem rivers and nearshore bay areas. Monitoring and management of both are important.1
In 2013–2014, a regional study was conducted on 16 creeks from Hillsborough to Collier County. Together, these data paint the most comprehensive portrait yet of the tidal patterns, shoreline vegetation, fish populations and nutrient levels in Gulf Coast tributaries.
Tidal creek monitoring needs long-term funding. The estimated annual funding requirement is $70,000, based on the collection and processing of 6 samples per creek for 10 creeks and 4 sampling events per year. This information will be used to develop criteria for healthy, balanced creeks that can continue to serve as natural incubators for sportfish.
Tidal creek research reinforces the need to learn more about the early life history of recreationally and commercially important fish and shellfish in Tampa Bay. Questions about egg and larval distribution, mortality rates and key habitats used by different species at various life stages deserve closer examination. This information is crucial to assessing the relative threats posed by various impacts — from commercial harvest to power plant intakes to long-term sea level rise — and identifying future restoration priorities.
Bay anchovy is the most abundant species collected by Fisheries-Independent Monitoring crews in Tampa Bay.
CHARTING THE COURSE: THE COMPREHENSIVE CONSERVATION AND MANAGEMENT PLAN FOR TAMPA BAY (AUGUST 2017 REVISION)
PAGE 103
Go to: TABLE OF CONTENTS | INDEX OF ACTIONS
FISH
AND
WILD
LIFE
Deliverables: Regular reports of monitoring in tidal streams on timetable recommended by research partners (Tidal Creeks Monitoring Program participants).
Activity 3 Support additional studies into the early life history of commercially and recreationally important species to better understand their growth and distribution, habitat utilization at various life stages and survival rates.
Responsible parties: FWC, NOAA (leads), USF
Timeframe: Initiate in 2017–2018 (dependent on funding availability)
Cost and potential funding sources: $$ Federal funding through Sport Fish Restoration Act; RESTORE Act; state funding through saltwater fishing license fees, additional federal, state or private grants
Location: Baywide, specific sampling sites to be identified when project initiated
Benefit/Performance measure: Identification of factors and habitats critical to recruitment, dispersal and survival of larval fish and shellfish species.
Results: Improved management of key fisheries across multiple habitats and at various life stages.
Deliverables: Reports with recommendations for improved management of fisheries, including habitats critical for larval and juvenile stages.
Activity 4 Improve and expand coordination for regional review of development and restoration projects that may impact federally designated Essential Fish Habitat in Tampa Bay.
Responsible parties: ABM (lead), NOAA, FWC, SWFWMD
Timeframe: Initiate in 2016; ongoing as needed to provide input to regional projects with fisheries impacts
Cost and potential funding sources: No additional cost
Location: Baywide
Benefit/Performance measure: Better communication and coordination of reviews of all major projects (including both privately and publicly financed development, infrastructure, and habitat restoration projects).
Results: Improved protection of Essential Fish Habitat for federally managed species in Tampa Bay.
Deliverables: Specific summary of recommendations by project submitted to permitting agencies and/or project sponsors.
Activity 5 Develop and implement supplemental sampling protocols for offshore species to better understand their use of estuarine habitats.
Responsible parties: FWC, NOAA
Timeframe: Initiate in 2019-2020
Cost and potential funding sources: $ Federal funding through Sport Fish Restoration Act; RESTORE Act; state funding through saltwater fishing license fees; additional federal, state or private grants
Location: Offshore waters in the Gulf of Mexico
Benefit/Performance measure: Identification of factors impacting health of fish and shellfish species utilizing both offshore and estuarine habitats at various life stages.
Results: Improved management of important fish and shellfish stocks throughout their life cycles and across multiple habitats
Deliverables: Sampling protocols for monitoring use of estuarine habitats by key offshore species.
1 Tampa Bay Tidal Tributary Research Team, E.T. Sherwood, editor. 2008. Tampa Bay Tidal Tributary Habitat Initiative Project: Final Report and Management Recommendations. Tampa Bay Estuary Program Technical Report #02-08. Report to the Pinellas County Environmental Fund. St. Petersburg, FL.
CHARTING THE COURSE: THE COMPREHENSIVE CONSERVATION AND MANAGEMENT PLAN FOR TAMPA BAY (AUGUST 2017 REVISION)
PAGE 104
Go to: TABLE OF CONTENTS | INDEX OF ACTIONS

FISH AND WILDLIFE
FISH AND WILDLIFEPreserve the diversity and abundance of bay wildlife
OBJECTIVES:An umbrella action to protect important fish and wildlife populations in the bay watershed, specifically by supporting research; habitat protection and restoration, compliance with laws to protect fish and wildlife; and education initiatives that foster species diversity and abundance. Support research, management and education to protect listed species and other important wildlife populations in the Tampa Bay watershed. Implement the Bay Habitats Action Plan to achieve targets and goals for critical fish and wildlife habitats. Continue and expand scientific and community-based wildlife monitoring programs. Give priority consideration to TBEP Bay Mini-Grant projects that address listed and potentially imperiled species. Identify species about which more data is needed to assess status.
STATUS:Ongoing. Action expanded to address a variety of threats to fish and wildlife, including climate change. Revised action specifically addresses colonial waterbirds and beach-nesting shorebirds. Strategy encourages support for research, management and monitoring of listed, threatened and endangered species, as well as unlisted species for which information gaps exist.
At left: A Least Tern parent and chick. Terns, plovers and other shorebirds nest on sandy beaches shared with people and their pets, making them extremely vulnerable to disturbance. Photo by Joan Miller.
FW-6
RELATED ACTIONS:FW-1 Increase on-water enforcement
of environmental regulations
FW-3 Achieve a sustainable bay scallop population
FW-5 Continue and expand the Critical Fisheries Monitoring Program
BH-1 Implement the Tampa Bay Habitat Master Plan
BH-2 Establish and implement mitigation criteria
BH-3 Reduce propeller scarring of seagrass and pursue seagrass transplanting opportunities
BH-9 Enhance ecosystem values of tidal tributaries
BH-10 Implement the Tampa Bay Freshwater Habitat Master Plan
DR-1 Implement beneficial uses of dredged material in Tampa Bay
DR-2 Continue to minimize impacts to wildlife and their habitats from dredging activities
IS-2 Support prevention, eradication or management of invasive species in Tampa Bay and its watershed
PA-1 Provide for and manage recreational uses of the bay
PE-1 Promote public involvement in bay restoration and protection
BACKGROUND:The Tampa Bay Area supports more than 40 species listed as Threatened or Endangered by the United States Fish and Wildlife Service (USFWS) or listed as Threatened or Species of Special Concern by the Florida Fish and Wildlife Conservation Commission (FWC). They inhabit a wide variety of habitats from the bay proper to its mangrove islands,
rivers, tidal streams, marshes, freshwater wetlands, sandy beaches and upland forests. Many species require different habitats at various life stages.
Many of the bay’s most visible and beloved species are well-documented. For example, Audubon first began protecting and monitoring colonial waterbird populations in 1934; Audubon staff currently manage and assess 30 nesting colonies on islands in and around Tampa Bay. Sea turtle nests on bay area beaches and barrier islands are surveyed and safeguarded annually. In 2016, 1595 loggerhead turtle nests were confirmed. Green and leatherback turtle nests are very rare on Tampa Bay area beaches. Research has shown that the bay itself is an important nursery area for juvenile Kemp’s ridley sea turtles, one of the world’s most endangered species.
The status of many other species is unclear, and basic population assessments are lacking. For example, little is known about diamondback terrapin populations in Tampa Bay because the animals are shy, reclusive and difficult to study.
Protecting and enhancing fish and wildlife populations requires a combination of management and educational strategies, including habitat protection and restoration, assessment and monitoring, enactment and enforcement of laws that protect vulnerable species, and education of citizens and visitors. These overall strategies ideally take into account multiple threats to the long-term health of the bay’s fish and wildlife:
• Habitat loss or degradation• Competition from invasive species• Overharvesting• Pollution• Natural disasters, such as hurricanes
CHARTING THE COURSE: THE COMPREHENSIVE CONSERVATION AND MANAGEMENT PLAN FOR TAMPA BAY (AUGUST 2017 REVISION)
PAGE 105
Go to: TABLE OF CONTENTS | INDEX OF ACTIONS

FISH
AND
WILD
LIFE ENDANGERED, THREATENED OR AT-RISK SPECIES IN THE TAMPA BAY
WATERSHEDFT = Federally Listed ThreatenedFE = Federally Listed EndangeredF exp = Federally listed Experimental PopulationFBCC = Federally Listed Birds of Conservation ConcernFT SoA = Federally listed Threatened (Similarity of Appearance)ST = State Listed ThreatenedSSSC = State Listed Species of Special ConcernSDL = State Delisted Species (2015)
COMMON NAME SCIENTIFIC NAME STATUSBirdsAudubon’s Crested Caracara Polyborus plancus audubonii FTEverglade Snail Kite Rostrhamus sociabilis plumbeus FEFlorida Grasshopper Sparrow Ammodramus savannarum
floridanusFE
Florida Scrub-jay Aphelocoma coerulescens FTIvory-billed Woodpecker Campephilus principalis FEPiping Plover Charadrius melodus FTRed Knot Calidris canutus rufa FTRed-cockaded Woodpecker Picoides borealis FEWhooping Crane Grus americana F expWood Stork Mycteria americana FTLittle Blue Heron Egretta caerulea STTricolored Heron Egretta tricolor STReddish Egret Egretta rufescens STRoseate Spoonbill Platalea ajaja STFlorida Sandhill Crane Grus canadensis pratensis STAmerican Oystercatcher Haematopus palliatus STSnowy Plover Charadrius nivosus STLeast Tern Sternula antillarum STBlack Skimmer Rynchops niger STFlorida Burrowing Owl Athene cunicularia floridana STSoutheastern American Kestral Falco sparverius paulus STAmerican Kestrel Falco sparverius paulus FBCCAmerican Oystercatcher Haematopus palliatus FBCCAmerican Bittern Botaurus lentiginosus FBCCBachman’s Sparrow Aimophila aestivalis FBCC
Bald Eagle Haliaeetus leucocephalus FBCCBlack Skimmer Rynchops niger FBCCBlack Rail Laterallus jamaicensis FBCCBlack-whiskered Vireo Vireo altiloquus FBCCBrown Booby Sula leucogaster FBCCBrown-headed Nuthatch Sitta pusilla FBCCChuck-will’s-widow Caprimulgus carolinensis FBCCCommon Ground-dove Columbina passerina exigua FBCCGull-billed Tern Gelochelidon nilotica FBCCHenslow’s Sparrow Ammodramus henslowii FBCCLe Conte’s Sparrow Ammodramus leconteii FBCCLeast Bittern Ixobrychus exilis FBCCLeast Tern Sterna antillarum FBCCLesser Yellowlegs Tringa flavipes FBCCLimpkin Aramus guarauna FBCCLoggerhead Shrike Lanius ludovicianus FBCCLong-billed Curlew Numenius americanus FBCCMagnificent Frigatebird Fregata magnificens FBCCMangrove Cuckoo Coccyzus minor FBCCMarbled Godwit Limosa fedoa FBCCNelson’s Sparrow Ammodramus nelsoni FBCCPeregrine Falcon Falco peregrinus FBCCPrairie Warbler Dendroica discolor FBCCProthonotary Warbler Protonotaria citrea FBCCRed Knot Calidris canutus rufa FBCCRed-headed Woodpecker Melanerpes erythrocephalus FBCCReddish Egret Egretta rufescens FBCCRoseate Spoonbill Platalea ajaja FBCCRusty Blackbird Euphagus carolinus FBCCSeaside Sparrow Ammodramus maritimus FBCCShort-billed Dowitcher Limnodromus griseus FBCCSmooth-billed Ani Crotophaga ani FBCCSnowy Plover Charadrius alexandrinus FBCCSwainson’s Warbler Limnothlypis swainsonii FBCCSwallow-tailed Kite Elanoides forficatus FBCCWhimbrel Numenius phaeopus FBCCWilson’s Plover Charadrius wilsonia FBCCWorm Eating Warbler Helmitheros vermivorum FBCCYellow Rail Coturnicops noveboracensis FBCC
Short-tailed Hawk Buteo brachyurus FBCCLimpkin Aramus guarauna SDLBrown pelican Pelecanus occidentalis SDLSnowy egret Egretta thula SDLWhite ibis Eudocimus albus SDLFishesAtlantic Sturgeon (gulf Subspecies) Acipenser oxyrinchus
(=oxyrhynchus) desotoiFT
Smalltooth Sawfish Pristis pectinata FEMangrove rivulus Kryptolebias marmoratus SDLInsectsHighlands Tiger Beetle Cicindelidia highlandensis F candidateMiami Blue Butterfly Cyclargus (=Hemiargus) thomasi
bethunebakeriFE
MammalsFlorida Bonneted Bat Eumops floridanus FEFlorida Panther Puma (=Felis) concolor coryi FEPuma (=mountain Lion) Puma (=Felis) concolor (all subsp.
except coryi)FT SoA
West Indian Manatee Trichechus manatus FEHomosassa Shrew Sorex longirostris eionis SSSCSherman’s Fox Squirrel Sciurus niger shermani SSSCFlorida mouse Podomys floridanus SDLReptilesAmerican Alligator Alligator mississippiensis FT SoAAmerican Crocodile Crocodylus acutus FTBluetail Mole Skink Eumeces egregius lividus FTEastern Indigo Snake Drymarchon corais couperi FTGreen Sea Turtle Chelonia mydas FEHawksbill Sea Turtle Eretmochelys imbricata FELeatherback Sea Turtle Dermochelys coriacea FESand Skink Neoseps reynoldsi FTFlorida Pine Snake Pituophis melanoleucus mugitus FTShort-tailed Snake Lampropeltis extenuata FTSuwannee cooter Pseudemys concinna suwanniensis SDL
SOURCE: USFWS, FWC
CHARTING THE COURSE: THE COMPREHENSIVE CONSERVATION AND MANAGEMENT PLAN FOR TAMPA BAY (AUGUST 2017 REVISION)
PAGE 106
Go to: TABLE OF CONTENTS | INDEX OF ACTIONS

FISH
AND
WILD
LIFE
• Climate change, including increased air and water temperatures, sea level rise, changes in precipitation and ocean acidification
Protecting and restoring key habitats, including priority nesting and nursery areas, seasonal refuges and critical travel or migration pathways, is a fundamental basis for sustaining diverse and abundant fish and wildlife populations. Restoration activities that create habitat mosaics of functional ecosystems will prove more resilient in the future (See Actions BH-1, BH-10 and CC-1).
Connecting Habitats and Wildlife
• Tidal streams are nursery areas for fish
More than 100 tidal streams flow to the bay from major rivers to tiny creeks a person could jump across. Many begin in the far reaches of the watershed. These streams are vitally important to foraging birds and juvenile fish, including snook. Researchers are working to identify tidal stream habitat features most favored by juvenile snook, and to test management techniques. Protecting and restoring tidal streams is expected to bolster the bay’s snook populations, which support a recreational fishery that generates more than $1 million in annual revenues (see Action BH-9).
• Beaches are vital for shorebirds
More than 45,000 pairs of beach-nesting birds, such as the snowy plover, American oystercatcher, black skimmer, laughing gull and least tern, lay their eggs and raise their young on area beaches. Fragmentation, degradation and erosion of suitable beach nesting habitat, and increased disturbance by recreational beachgoers, threaten the continued existence of these charismatic birds. FWC, Audubon Florida and Eckerd College staffs work with land managers to protect critical nesting areas at Egmont Key National Wildlife Refuge and Shell Key County Preserve. Volunteer “Bird Stewards” attend to vulnerable beach nesting colony sites on busy weekends, educating beachgoers about the need to steer clear of shorebird colonies.
Enforcement is also needed in critical nesting areas. People and their pets can trample nests and cause parent birds to take flight, leaving eggs or hatchlings vulnerable to predators and hot summer temperatures.
Beach renourishment, where and when appropriate, can help to maintain existing nest sites and create additional habitats. Man-made spoil islands used for disposal of material dredged from the bay bottom can serve a similar benefit (see Actions DR-1 and DR-2).
• Mangrove islands support colonial waterbirds
Bay mangrove islands support some of the most diverse waterbird nesting colonies in North America, annually hosting approximately 40,000 to 50,000 breeding pairs at nearly 30 estuary island sites and another 10 inland colony sites within the watershed. Some 23 species nest in colonies and another six species nest in or near bird colonies. Populations of several species (reddish egret, roseate spoonbill, American
oystercatcher) are stable or increasing, while others are in decline (snowy egret, little blue heron, tricolored heron and white ibis).
The two islands comprising the Richard T. Paul Alafia Bank Bird Sanctuary are among the
The diamondback terrapin is an example of a species whose status is uncertain. Photo by Kristen Hart.
The Richard T. Paul Alafia Banks Bird Sanctuary is among the nation’s most important nesting areas for colonial waterbirds such as roseate spoonbills. Photo courtesy Audubon Florida.
FLORIDA STATEWIDE TURTLE NESTING BEACH SURVEY: LOGGERHEAD NESTING 2012-2016
COUNTY 2012 2013 2014 2015 2016Manatee 634 690 539 691 1015Hillsborough 61 79 47 31 82Pinellas 316 385 363 420 498Totals 1011 1154 949 1142 1595
SOURCE: Florida Fish and Wildlife Conservation Commission
COLONIAL WATERBIRD NESTING IN THE TAMPA BAY WATERSHED, 2016SPECIES LISTING REGIONAL POPULATION (NESTS, PAIRS)
Brown Pelican 788
Double- Crested Cormorant 451
Anhinga 285
Great Blue Heron 177
Great Egret 654
Snowy Egret 333
Little Blue Heron T 323
Tricolored Heron T 324
Reddish Egret T 18
Cattle Egret 423
Green Heron 10
Black-crowned Night Heron 86
Yellow-crowned Night Heron 87
White Ibis 7,651
Glossy Ibis 155
Roseate Spoonbill T 187
Wood Stork T 474
Snowy Plover T 0
Wilson’s Plover 0
American Oystercatcher T 43
Black-necked Stilt 12
Willet 8
Laughing Gull 38,700
Gull-billed Tern 35
Caspian Tern 57
Royal Tern 6,500
Sandwich Tern 696
Least Tern T 23
Black Skimmer T 260
Total nesting pairs 58,760
T = Threatened Species SOURCE: Audubon Florida
CHARTING THE COURSE: THE COMPREHENSIVE CONSERVATION AND MANAGEMENT PLAN FOR TAMPA BAY (AUGUST 2017 REVISION)
PAGE 107
Go to: TABLE OF CONTENTS | INDEX OF ACTIONS

FISH
AND
WILD
LIFE
largest and most diverse waterbird colonies in the continental United States, with nearly 18,000 nesting pairs of 16 to 20 species of birds. Erosion, caused by storm waves and boat wakes, is a significant threat to these and other nesting island and shorelines in the watershed. More than 2,000 feet of oyster reef was created as a wave break for Alafia Bank to slow erosion, improve water quality, and promote growth of salt marsh and mangroves. Another 4,750 feet of living shoreline is being installed with funds from the federal RESTORE Act.
In November 2016, FWC created 13 new and five expanded Critical Wildlife Areas (CWA) in Florida, designed to protect important habitat sites where wildlife nest, breed and forage. A new CWA was established at Dot-Dash-Dit Island at the mouth of the Braden River, which hosts the bay’s only coastal colony of wood storks. The existing CWA at Alafia Bank was expanded. The designation creates a 100-foot buffer around these bird colonies with year-round closures to protect them.
Identification of suitable alternative colony nest sites is needed, as natural disasters may eliminate entire nesting populations or habitats. Additionally, colonies may abandon a nesting site for unknown reasons.
Assessment and Monitoring A variety of wildlife already is monitored in the bay watershed—from routine sampling of benthic creatures on the bay bottom by the Environmental Protection Commission of Hillsborough County (EPCHC), to stock assessments of popular sportfish by FWC, to manatee counts conducted in the winter when manatees congregate at power plants.
The Tampa Bay Estuary Program’s Bay Mini-Grant program has funded baseline surveys of seahorses and pipefish, neo-tropical migratory songbirds, diamondback terrapins and a rare freshwater turtle recently “re-discovered” in the Alafia River. Community-based programs enlist citizen volunteers to report sightings of mating horseshoe crabs (FWC), count bay scallops (Tampa Bay Watch), collect abandoned, derelict crab traps that continue to ‘ghost fish’ (Tampa Bay Watch), retrieve and recycle fishing line that can entangle and kill birds (Tampa Bay Watch, Audubon Florida), and train “Bird Stewards” to help protect posted shorebird nest sites.
In 2016, FWC adopted new rules for imperiled species detailed in a comprehensive Imperiled Species Management Plan (ISMP) which became effective January 2017. The ISMP addresses individual species in Action Plans containing specific conservation goals, objectives and actions. In addition, the ISMP describes integrated conservation strategies to benefit multiple species and their shared habitats. It focuses on 57 imperiled species in Florida.
Educational and Partnership Efforts
TBEP participates in collaborative partnerships within the Tampa Bay and Southwest Florida region to review and coordinate habitat restoration and protection initiatives (see Actions BH-1, BH-2, BH-3, BH-9 and BH-10). These initiatives include identification of priority sites for acquisition and mitigation. The Southwest Florida Regional Ecosystem Restoration Plan coordinated by the Tampa Bay, Sarasota Bay and Charlotte Harbor Estuary Programs presents a comprehensive inventory of proposed projects — many of which directly benefit fish and wildlife — that span Florida’s Gulf Coast from the Big Bend to Big Cypress Preserve.
TBEP has been a leader in educating bay users about responsible water recreation, through boating guides, ethical fishing information and sponsorship of “Leave No Trace” outdoor etiquette workshops. TBEP also informs waterfront homeowners about ways to enhance their shorelines for fish and wildlife, and about co-existing with wildlife.
STRATEGY:Activity 1 Implement the Bay Habitat Master Plan and relevant
CCMP actions to achieve targets and goals for critical fish and wildlife habitats, including Actions BH-1, BH-2, BH-9 and BH-10.
Responsible parties: TBEP (lead), FWC, NOAA, Local cities and counties, SWFWMD, The Nature Conservancy, Tampa Bay Conservancy, private entities
Timeframe: The Bay Habitat Master Plan will be revised in 2017-2018, with updated goals for restoration and preservation of marshes, mangroves, salt barrens and freshwater wetlands. The Master Plan will also establish initial numeric targets for tidal creeks, hard bottom habitats and coastal uplands.
Cost and potential funding sources: $$$$ CWA Section 320 funds to develop and update Bay Habitat Master Plan (TBEP); Cooperative funding from SWFWMD; external grants from NOAA Fisheries, USFWS, EPA, Tampa Bay Environmental Restoration Fund and others
Location: Baywide
Benefit/Performance measure: Assessment of progress in achieving adopted goals and targets for critical coastal habitats.
Dolphins are a familiar but always thrilling sight in Tampa Bay. Photo by Linda Arns.
Tampa Electric’s Big Bend Power Plant is an important warm-water refuge for manatees in the winter. Visitors from near and far come to see the animals in the discharge canal. Photos courtesy FWC.
CHARTING THE COURSE: THE COMPREHENSIVE CONSERVATION AND MANAGEMENT PLAN FOR TAMPA BAY (AUGUST 2017 REVISION)
PAGE 108
Go to: TABLE OF CONTENTS | INDEX OF ACTIONS

FISH
AND
WILD
LIFE
Results: Protection, enhancement or restoration of important bay habitats
Deliverables: Updated Tampa Bay Habitat Master Plan. Updated Freshwater Wetlands Habitats Master Plan.
Activity 2 Continue existing monitoring programs for key species and expand as needed to adapt to new conditions or threats, such as land use changes and climate change. Consider how best to incorporate the Imperiled Species Management Plan into the Tampa Bay Habitat Master Plan to support protection of listed species found in the Tampa Bay watershed.
Responsible parties: FWC, USFWS, Audubon Florida (leads), FDEP, EPCHC, TBEP, Tampa Bay Watch
Timeframe: Ongoing for existing monitoring programs. Incorporate relevant elements of ISMP into Tampa Bay Habitat Master Plan at next update, slated for completion in 2018.
Cost and potential funding sources: $ CWA 320 Funds; federal, state, and local governments or NGOs fund majority of wildlife monitoring
Location: Baywide
Benefit/Performance measure: Improved awareness and protection of listed species in the bay watershed. Local or regional implementation of statewide strategies to conserve wildlife that travel beyond watershed boundaries.
Results: Improved awareness and protection of listed species. Local or regional implementation of statewide strategies to conserve wildlife that travel
beyond watershed boundaries.
Deliverables: Monitoring reports assessing population status and trends. Incorporation of strategies to support protection of listed state species in Tampa Bay Habitat Master Plan.
Activity 3 Support protection and monitoring of Tampa Bay’s colonial waterbirds and beach-nesting shorebirds. Enhance existing rookeries, and identify and create additional habitat suitable for nesting colonies in the event of a natural disaster or widespread colony desertion. Explore beneficial uses of dredged material for habitat creation or restoration (see Actions DR-1 and DR-2). Continue and expand the Bird Steward Program to enlist and train interested citizens in safeguarding posted shorebird nesting areas. Continue and expand the Project Colony Watch Program to enlist and train volunteers to monitor inland nesting sites hosting wood storks, white ibis, and a variety of egrets and herons.
Responsible parties: Tampa Bay Dredging Advisory Group, Tampa Bay Migratory Bird Protection Committee, Agency on Bay Management Habitat Restoration Subcommittee, Port Tampa Bay, USACE, Audubon Florida, USFWS, FWC, Eckerd College, Audubon Florida and local Audubon chapters
Timeframe: Ongoing. Identification of new or alternate colony sites initiated in 2017
Cost and potential funding sources: $ No TBEP funds required for volunteer monitoring programs, although Bay Mini-Grants and the Tampa Bay Environmental Restoration Fund have supported waterbird conservation and monitoring programs; $$–$$$$ for enhancement of existing rookeries and creation of additional nesting areas as opportunities arise, with potential funding via federal, state or regional grants
Location: Baywide and known colonial waterbird and shorebird nesting colonies managed by Audubon, FWC or USFWS
Benefit/Performance measure: Preservation and enhancement of existing nesting sites. Creation of additional nesting sites to insulate populations from catastrophic losses due to storms, inundation or colony abandonment. Ecologically beneficial use of dredge spoil.
Results: Stable or increasing populations of colonial waterbirds and beach-nesting shorebirds.
Deliverables: Annual reports on nesting success. Beneficial use of dredge spoil to enhance or create nesting areas incorporated into Dredge Material Management Plan for Tampa Bay.
Activity 4 Give priority consideration to TBEP Bay Mini-Grant projects that address listed and potentially imperiled species. Refer to the state Imperiled Species Management Plan for guidance on vulnerable species.
Responsible parties: TBEP Community Advisory Committee
Timeframe: Initiate in FY 2017–2018 Bay Mini-Grant cycle
Cost and potential funding sources: $ based on allocating an average of 10% of annual Bay Mini-Grants, or 1-2 projects per year, to wildlife-related research, monitoring or conservation; TBEP funding for Bay Mini-Grants derived from sales of the Tampa Bay Estuary license plate
Location: Baywide
Benefit/Performance measure: 10% of Bay Mini-Grant projects devoted to projects addressing listed or imperiled species.
Results: Improved conservation of imperiled or potentially imperiled species.
Deliverables: Project reports submitted yearly by recipients of Bay Mini-Grant projects.
Activity 5 Support training workshops for FWC and other environmental enforcement personnel to review existing or new laws protecting listed species such as manatees, sea turtles, shorebirds and colonial waterbirds (see Actions FW-1 and FW-2).
CHARTING THE COURSE: THE COMPREHENSIVE CONSERVATION AND MANAGEMENT PLAN FOR TAMPA BAY (AUGUST 2017 REVISION)
PAGE 109
Go to: TABLE OF CONTENTS | INDEX OF ACTIONS

FISH
AND
WILD
LIFE
Responsible parties: FWC, Audubon Florida, Port Tampa Bay, TBEP
Timeframe: At least one workshop held annually beginning in 201
Cost and potential funding sources: $ CWA Section 320 funds for TBEP, additional funding from state or local governments and NGOs
Location: Baywide
Benefit/Performance measure: Number of law enforcement personnel attending workshops.
Results: Improved enforcement of manatee protection zones, waterbird breeding colonies, shorebird nest beaches and sea turtle nests.
Deliverables: Summary attendance reports from workshops.
Activity 6 Increase public awareness of the diversity and value of bay wildlife. Inform residents about actions they can take to protect native species and habitats (see Actions PI-1, IS-2 and PA-2). Support citizen-science and monitoring programs that foster appreciation of wildlife while enhancing scientific knowledge (see Actions FW-3 and IS-2).
Responsible parties: TBEP, Audubon Florida and local Audubon chapters, local governments, TBEP, FDEP Aquatic Preserves, FWC, USF, Keep America Beautiful affiliates and Tampa Bay Watch
Timeframe: Ongoing
Cost and potential funding sources: $ CWA Section 320 funds for TBEP funding of digital and/or printed information, or support of citizen monitoring; Potential funds from TBEP Bay Mini-Grants
Location: Baywide
Benefit/Performance measure: Assessment of impact of public educational programming (printed materials distributed, social media interaction, workshop or webinar participation, website or other digital platform usage). Participation in citizen monitoring programs.
Results: Citizens who value the bay’s fish and wildlife and are directly involved in protecting them in their own homes, neighborhoods and communities.
Deliverables: Targeted educational programs focused on recreational bay users, homeowners, realtors, students and other key population segments.
Activity 7 Develop a priority list of species about which more information is needed to assess status and trends, to assist in directing research and monitoring efforts by local agencies and universities. Promote the identified research needs to undergraduate and graduate students seeking research topics.
Responsible parties: TBEP, Audubon Florida, FWC, USFWS, local universities including USF, University of Tampa and Eckerd College
Timeframe: List of species and research needs to be developed in 2017–2018
Cost and potential funding sources: Staff time only
Location: Baywide
Benefit/Performance measure: List of priority species adopted and incorporated into existing monitoring and research programs. Studies addressing priority species and associated information gaps conducted by area undergraduate and graduate students.
Results: Improved understanding and conservation of fish and wildlife species that might otherwise be overlooked in research and monitoring programs.
A Great Egret in spectacular courtship display. Egrets, herons, ibis and other wading birds nest in colonies on mangrove islands in Tampa Bay. Photo by Gerold Morrison.
Deliverables: Priority “watchlist” of bay wildlife species for which significant information gaps exist (TBEP). Summary of recommended research needs to help with population and conservation assessments of “watchlist” species (TBEP).
CHARTING THE COURSE: THE COMPREHENSIVE CONSERVATION AND MANAGEMENT PLAN FOR TAMPA BAY (AUGUST 2017 REVISION)
PAGE 110
Go to: TABLE OF CONTENTS | INDEX OF ACTIONS
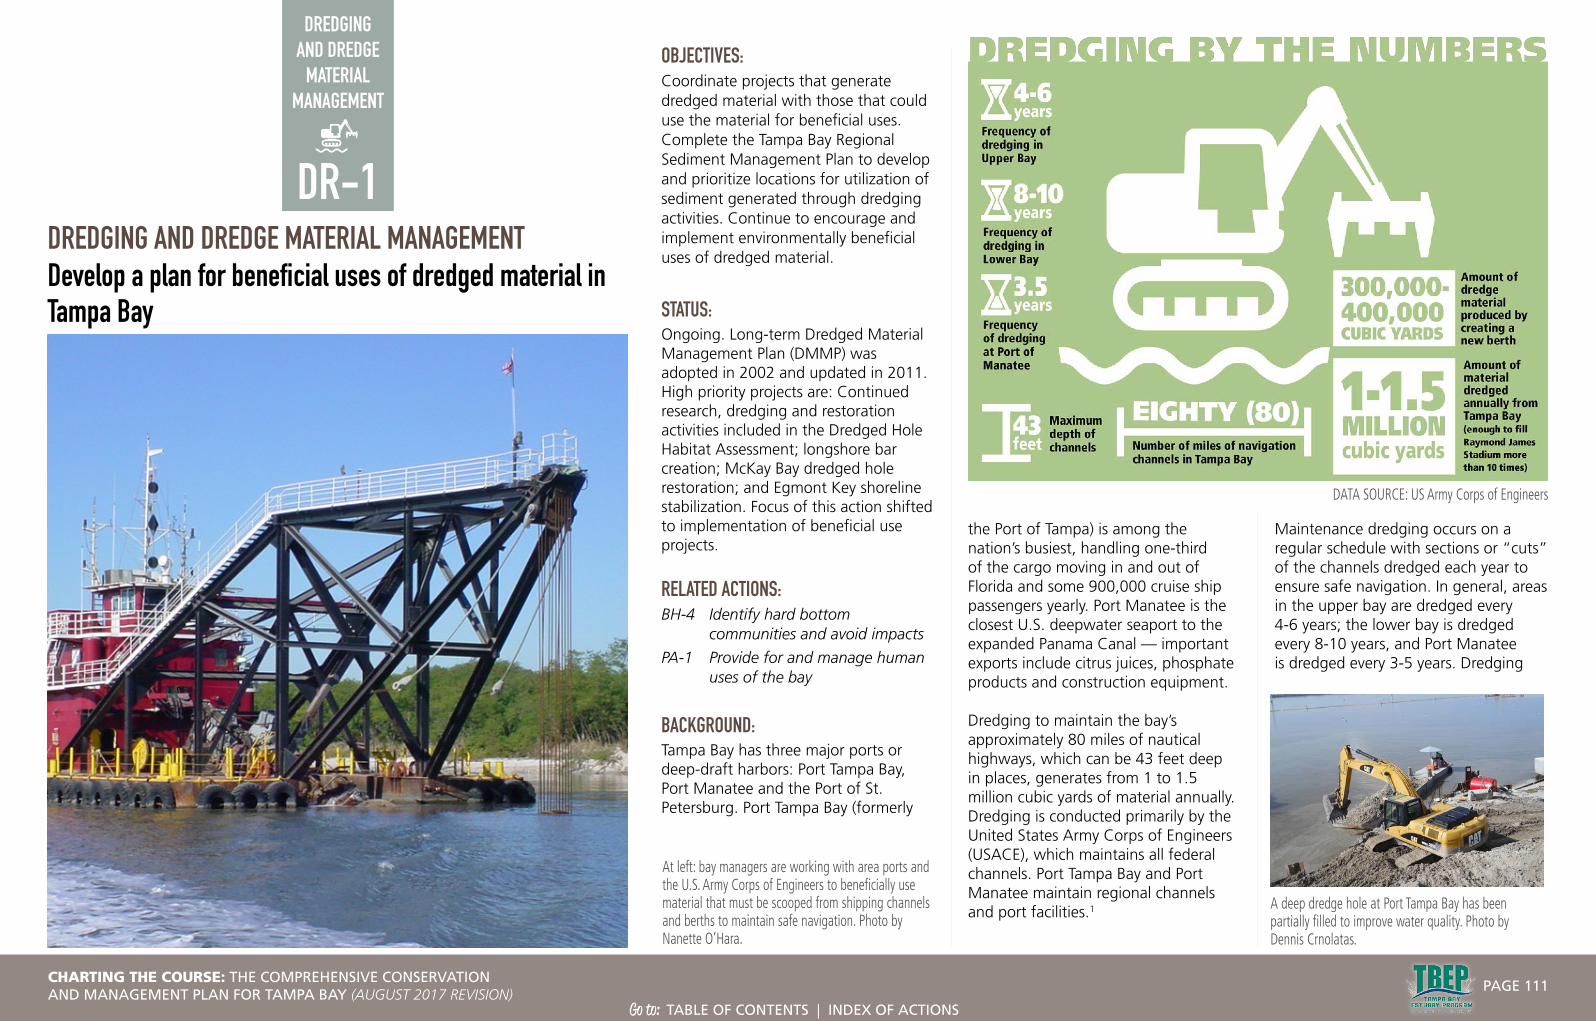
DREDGING AND DREDGE
MATERIAL MANAGEMENT
the Port of Tampa) is among the nation’s busiest, handling one-third of the cargo moving in and out of Florida and some 900,000 cruise ship passengers yearly. Port Manatee is the closest U.S. deepwater seaport to the expanded Panama Canal — important exports include citrus juices, phosphate products and construction equipment.
Dredging to maintain the bay’s approximately 80 miles of nautical highways, which can be 43 feet deep in places, generates from 1 to 1.5 million cubic yards of material annually. Dredging is conducted primarily by the United States Army Corps of Engineers (USACE), which maintains all federal channels. Port Tampa Bay and Port Manatee maintain regional channels and port facilities.1
DREDGING AND DREDGE MATERIAL MANAGEMENTDevelop a plan for beneficial uses of dredged material in Tampa Bay
OBJECTIVES: Coordinate projects that generate dredged material with those that could use the material for beneficial uses. Complete the Tampa Bay Regional Sediment Management Plan to develop and prioritize locations for utilization of sediment generated through dredging activities. Continue to encourage and implement environmentally beneficial uses of dredged material.
STATUS: Ongoing. Long-term Dredged Material Management Plan (DMMP) was adopted in 2002 and updated in 2011. High priority projects are: Continued research, dredging and restoration activities included in the Dredged Hole Habitat Assessment; longshore bar creation; McKay Bay dredged hole restoration; and Egmont Key shoreline stabilization. Focus of this action shifted to implementation of beneficial use projects.
RELATED ACTIONS: BH-4 Identify hard bottom
communities and avoid impacts
PA-1 Provide for and manage human uses of the bay
BACKGROUND:Tampa Bay has three major ports or deep-draft harbors: Port Tampa Bay, Port Manatee and the Port of St. Petersburg. Port Tampa Bay (formerly
Maintenance dredging occurs on a regular schedule with sections or “cuts” of the channels dredged each year to ensure safe navigation. In general, areas in the upper bay are dredged every 4-6 years; the lower bay is dredged every 8-10 years, and Port Manatee is dredged every 3-5 years. Dredging
A deep dredge hole at Port Tampa Bay has been partially filled to improve water quality. Photo by Dennis Crnolatas.
At left: bay managers are working with area ports and the U.S. Army Corps of Engineers to beneficially use material that must be scooped from shipping channels and berths to maintain safe navigation. Photo by Nanette O’Hara.
DR-1
DATA SOURCE: US Army Corps of Engineers
CHARTING THE COURSE: THE COMPREHENSIVE CONSERVATION AND MANAGEMENT PLAN FOR TAMPA BAY (AUGUST 2017 REVISION)
PAGE 111
Go to: TABLE OF CONTENTS | INDEX OF ACTIONS
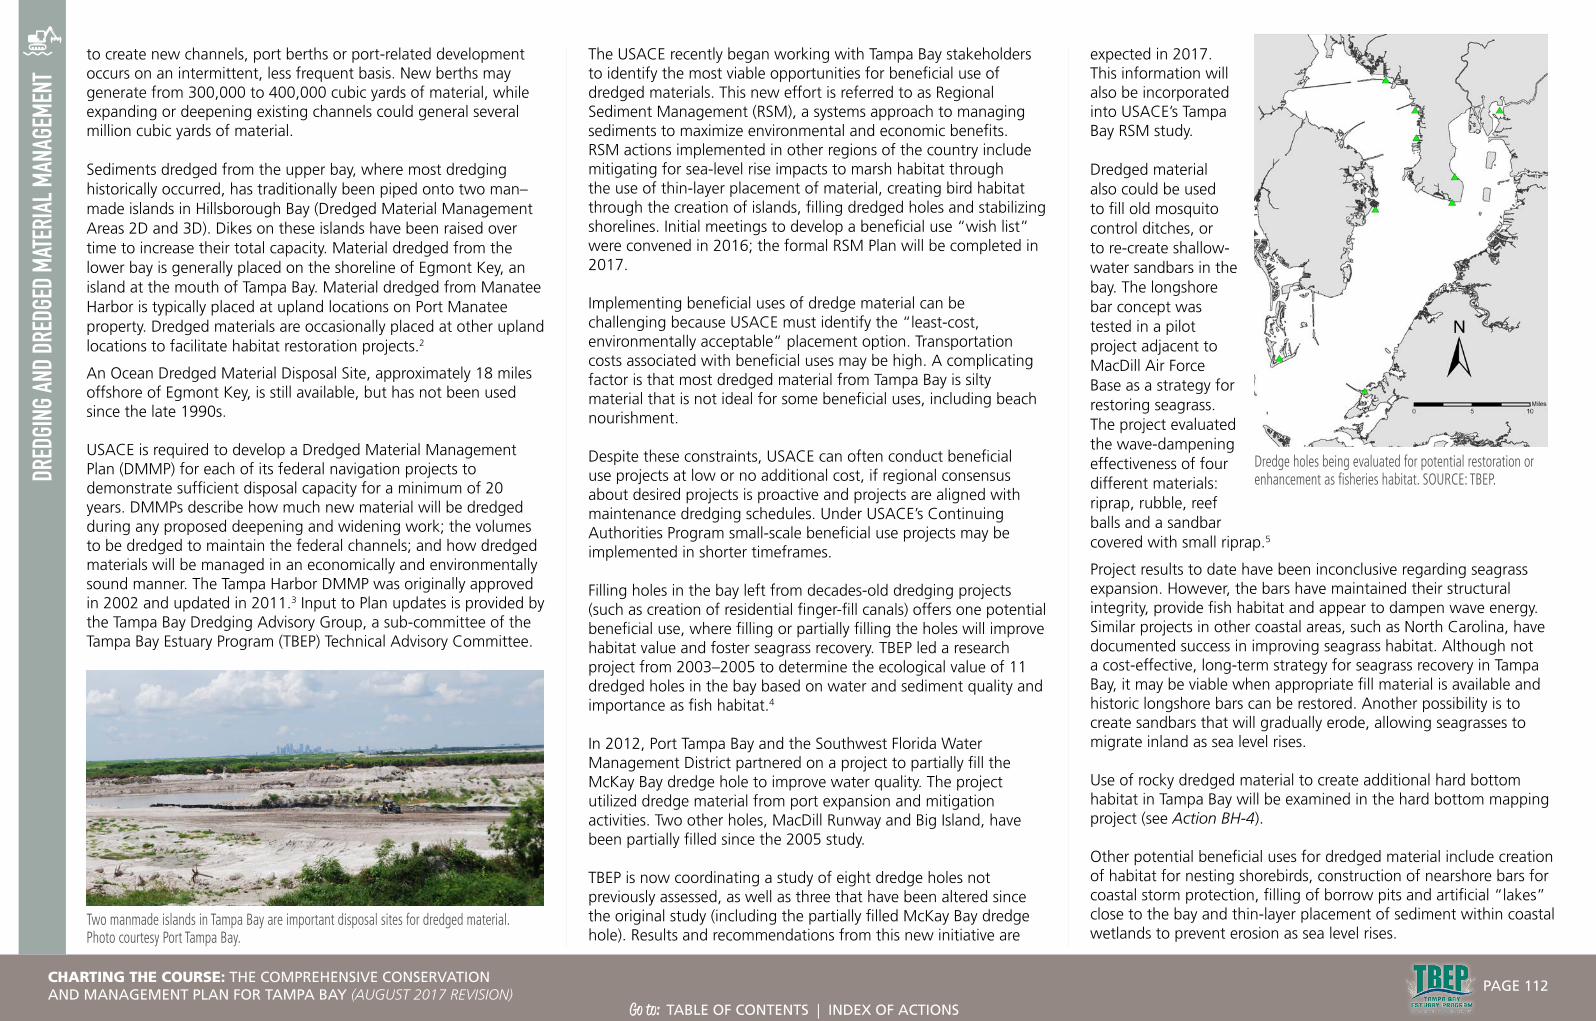
DRED
GING
AND
DRED
GED
MATE
RIAL
MAN
AGEM
ENT
to create new channels, port berths or port-related development occurs on an intermittent, less frequent basis. New berths may generate from 300,000 to 400,000 cubic yards of material, while expanding or deepening existing channels could general several million cubic yards of material.
Sediments dredged from the upper bay, where most dredging historically occurred, has traditionally been piped onto two man–made islands in Hillsborough Bay (Dredged Material Management Areas 2D and 3D). Dikes on these islands have been raised over time to increase their total capacity. Material dredged from the lower bay is generally placed on the shoreline of Egmont Key, an island at the mouth of Tampa Bay. Material dredged from Manatee Harbor is typically placed at upland locations on Port Manatee property. Dredged materials are occasionally placed at other upland locations to facilitate habitat restoration projects.2
An Ocean Dredged Material Disposal Site, approximately 18 miles offshore of Egmont Key, is still available, but has not been used since the late 1990s.
USACE is required to develop a Dredged Material Management Plan (DMMP) for each of its federal navigation projects to demonstrate sufficient disposal capacity for a minimum of 20 years. DMMPs describe how much new material will be dredged during any proposed deepening and widening work; the volumes to be dredged to maintain the federal channels; and how dredged materials will be managed in an economically and environmentally sound manner. The Tampa Harbor DMMP was originally approved in 2002 and updated in 2011.3 Input to Plan updates is provided by the Tampa Bay Dredging Advisory Group, a sub-committee of the Tampa Bay Estuary Program (TBEP) Technical Advisory Committee.
The USACE recently began working with Tampa Bay stakeholders to identify the most viable opportunities for beneficial use of dredged materials. This new effort is referred to as Regional Sediment Management (RSM), a systems approach to managing sediments to maximize environmental and economic benefits. RSM actions implemented in other regions of the country include mitigating for sea-level rise impacts to marsh habitat through the use of thin-layer placement of material, creating bird habitat through the creation of islands, filling dredged holes and stabilizing shorelines. Initial meetings to develop a beneficial use “wish list” were convened in 2016; the formal RSM Plan will be completed in 2017.
Implementing beneficial uses of dredge material can be challenging because USACE must identify the “least-cost, environmentally acceptable” placement option. Transportation costs associated with beneficial uses may be high. A complicating factor is that most dredged material from Tampa Bay is silty material that is not ideal for some beneficial uses, including beach nourishment.
Despite these constraints, USACE can often conduct beneficial use projects at low or no additional cost, if regional consensus about desired projects is proactive and projects are aligned with maintenance dredging schedules. Under USACE’s Continuing Authorities Program small-scale beneficial use projects may be implemented in shorter timeframes.
Filling holes in the bay left from decades-old dredging projects (such as creation of residential finger-fill canals) offers one potential beneficial use, where filling or partially filling the holes will improve habitat value and foster seagrass recovery. TBEP led a research project from 2003–2005 to determine the ecological value of 11 dredged holes in the bay based on water and sediment quality and importance as fish habitat.4
In 2012, Port Tampa Bay and the Southwest Florida Water Management District partnered on a project to partially fill the McKay Bay dredge hole to improve water quality. The project utilized dredge material from port expansion and mitigation activities. Two other holes, MacDill Runway and Big Island, have been partially filled since the 2005 study.
TBEP is now coordinating a study of eight dredge holes not previously assessed, as well as three that have been altered since the original study (including the partially filled McKay Bay dredge hole). Results and recommendations from this new initiative are
expected in 2017. This information will also be incorporated into USACE’s Tampa Bay RSM study.
Dredged material also could be used to fill old mosquito control ditches, or to re-create shallow-water sandbars in the bay. The longshore bar concept was tested in a pilot project adjacent to MacDill Air Force Base as a strategy for restoring seagrass. The project evaluated the wave-dampening effectiveness of four different materials: riprap, rubble, reef balls and a sandbar covered with small riprap.5
Project results to date have been inconclusive regarding seagrass expansion. However, the bars have maintained their structural integrity, provide fish habitat and appear to dampen wave energy. Similar projects in other coastal areas, such as North Carolina, have documented success in improving seagrass habitat. Although not a cost-effective, long-term strategy for seagrass recovery in Tampa Bay, it may be viable when appropriate fill material is available and historic longshore bars can be restored. Another possibility is to create sandbars that will gradually erode, allowing seagrasses to migrate inland as sea level rises.
Use of rocky dredged material to create additional hard bottom habitat in Tampa Bay will be examined in the hard bottom mapping project (see Action BH-4).
Other potential beneficial uses for dredged material include creation of habitat for nesting shorebirds, construction of nearshore bars for coastal storm protection, filling of borrow pits and artificial “lakes” close to the bay and thin-layer placement of sediment within coastal wetlands to prevent erosion as sea level rises.
Dredge holes being evaluated for potential restoration or enhancement as fisheries habitat. SOURCE: TBEP.
Two manmade islands in Tampa Bay are important disposal sites for dredged material. Photo courtesy Port Tampa Bay.
CHARTING THE COURSE: THE COMPREHENSIVE CONSERVATION AND MANAGEMENT PLAN FOR TAMPA BAY (AUGUST 2017 REVISION)
PAGE 112
Go to: TABLE OF CONTENTS | INDEX OF ACTIONS
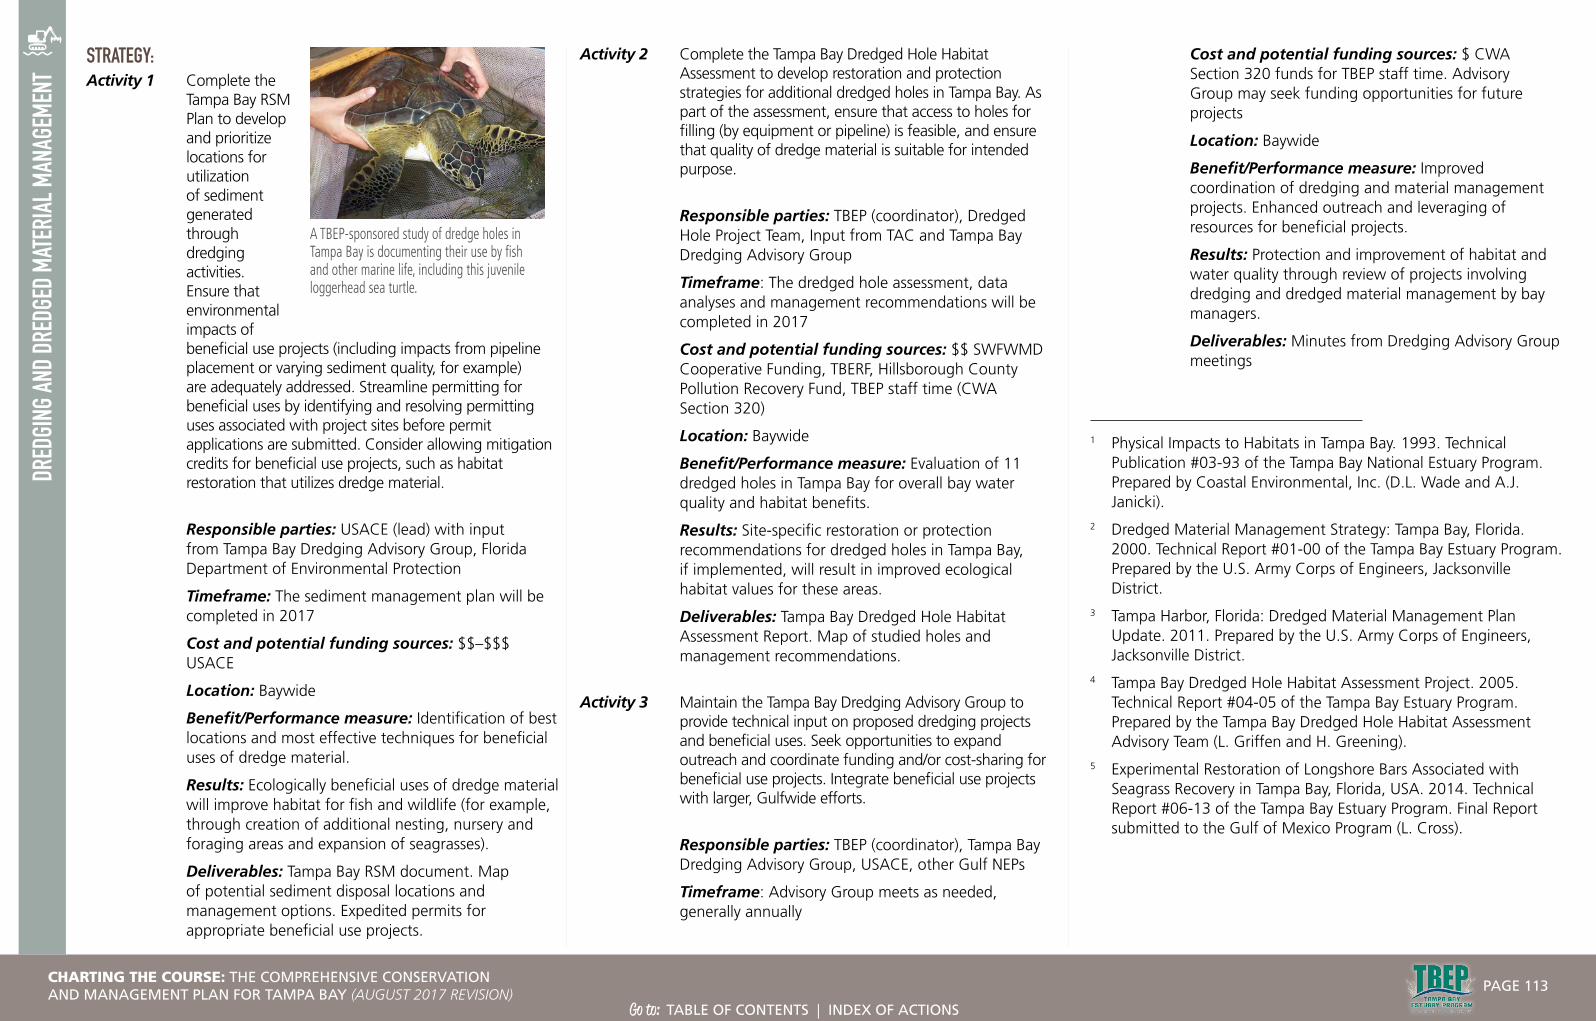
DRED
GING
AND
DRED
GED
MATE
RIAL
MAN
AGEM
ENT
STRATEGY:Activity 1 Complete the
Tampa Bay RSM Plan to develop and prioritize locations for utilization of sediment generated through dredging activities. Ensure that environmental impacts of beneficial use projects (including impacts from pipeline placement or varying sediment quality, for example) are adequately addressed. Streamline permitting for beneficial uses by identifying and resolving permitting uses associated with project sites before permit applications are submitted. Consider allowing mitigation credits for beneficial use projects, such as habitat restoration that utilizes dredge material.
Responsible parties: USACE (lead) with input from Tampa Bay Dredging Advisory Group, Florida Department of Environmental Protection
Timeframe: The sediment management plan will be completed in 2017
Cost and potential funding sources: $$–$$$ USACE
Location: Baywide
Benefit/Performance measure: Identification of best locations and most effective techniques for beneficial uses of dredge material.
Results: Ecologically beneficial uses of dredge material will improve habitat for fish and wildlife (for example, through creation of additional nesting, nursery and foraging areas and expansion of seagrasses).
Deliverables: Tampa Bay RSM document. Map of potential sediment disposal locations and management options. Expedited permits for appropriate beneficial use projects.
Activity 2 Complete the Tampa Bay Dredged Hole Habitat Assessment to develop restoration and protection strategies for additional dredged holes in Tampa Bay. As part of the assessment, ensure that access to holes for filling (by equipment or pipeline) is feasible, and ensure that quality of dredge material is suitable for intended purpose.
Responsible parties: TBEP (coordinator), Dredged Hole Project Team, Input from TAC and Tampa Bay Dredging Advisory Group
Timeframe: The dredged hole assessment, data analyses and management recommendations will be completed in 2017
Cost and potential funding sources: $$ SWFWMD Cooperative Funding, TBERF, Hillsborough County Pollution Recovery Fund, TBEP staff time (CWA Section 320)
Location: Baywide
Benefit/Performance measure: Evaluation of 11 dredged holes in Tampa Bay for overall bay water quality and habitat benefits.
Results: Site-specific restoration or protection recommendations for dredged holes in Tampa Bay, if implemented, will result in improved ecological habitat values for these areas.
Deliverables: Tampa Bay Dredged Hole Habitat Assessment Report. Map of studied holes and management recommendations.
Activity 3 Maintain the Tampa Bay Dredging Advisory Group to provide technical input on proposed dredging projects and beneficial uses. Seek opportunities to expand outreach and coordinate funding and/or cost-sharing for beneficial use projects. Integrate beneficial use projects with larger, Gulfwide efforts.
Responsible parties: TBEP (coordinator), Tampa Bay Dredging Advisory Group, USACE, other Gulf NEPs
Timeframe: Advisory Group meets as needed, generally annually
Cost and potential funding sources: $ CWA Section 320 funds for TBEP staff time. Advisory Group may seek funding opportunities for future projects
Location: Baywide
Benefit/Performance measure: Improved coordination of dredging and material management projects. Enhanced outreach and leveraging of resources for beneficial projects.
Results: Protection and improvement of habitat and water quality through review of projects involving dredging and dredged material management by bay managers.
Deliverables: Minutes from Dredging Advisory Group meetings
1 Physical Impacts to Habitats in Tampa Bay. 1993. Technical Publication #03-93 of the Tampa Bay National Estuary Program. Prepared by Coastal Environmental, Inc. (D.L. Wade and A.J. Janicki).
2 Dredged Material Management Strategy: Tampa Bay, Florida. 2000. Technical Report #01-00 of the Tampa Bay Estuary Program. Prepared by the U.S. Army Corps of Engineers, Jacksonville District.
3 Tampa Harbor, Florida: Dredged Material Management Plan Update. 2011. Prepared by the U.S. Army Corps of Engineers, Jacksonville District.
4 Tampa Bay Dredged Hole Habitat Assessment Project. 2005. Technical Report #04-05 of the Tampa Bay Estuary Program. Prepared by the Tampa Bay Dredged Hole Habitat Assessment Advisory Team (L. Griffen and H. Greening).
5 Experimental Restoration of Longshore Bars Associated with Seagrass Recovery in Tampa Bay, Florida, USA. 2014. Technical Report #06-13 of the Tampa Bay Estuary Program. Final Report submitted to the Gulf of Mexico Program (L. Cross).
A TBEP-sponsored study of dredge holes in Tampa Bay is documenting their use by fish and other marine life, including this juvenile loggerhead sea turtle.
CHARTING THE COURSE: THE COMPREHENSIVE CONSERVATION AND MANAGEMENT PLAN FOR TAMPA BAY (AUGUST 2017 REVISION)
PAGE 113
Go to: TABLE OF CONTENTS | INDEX OF ACTIONS
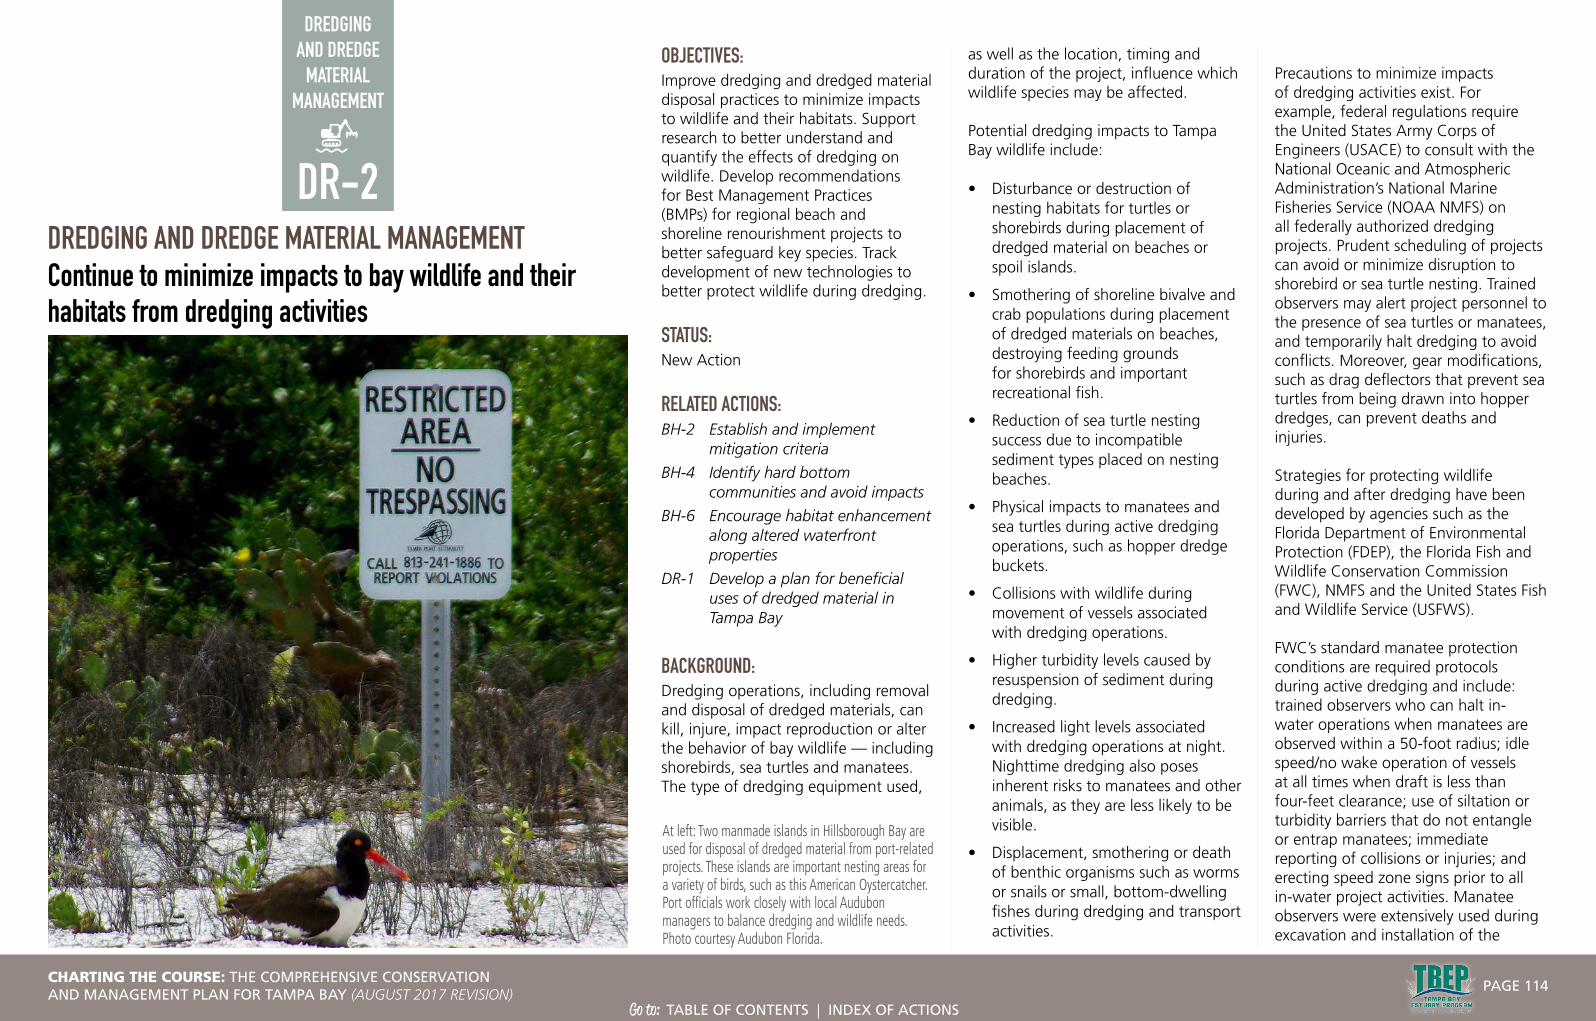
DREDGING AND DREDGE
MATERIAL MANAGEMENT
DREDGING AND DREDGE MATERIAL MANAGEMENTContinue to minimize impacts to bay wildlife and their habitats from dredging activities
OBJECTIVES: Improve dredging and dredged material disposal practices to minimize impacts to wildlife and their habitats. Support research to better understand and quantify the effects of dredging on wildlife. Develop recommendations for Best Management Practices (BMPs) for regional beach and shoreline renourishment projects to better safeguard key species. Track development of new technologies to better protect wildlife during dredging.
STATUS: New Action
RELATED ACTIONS:BH-2 Establish and implement
mitigation criteria
BH-4 Identify hard bottom communities and avoid impacts
BH-6 Encourage habitat enhancement along altered waterfront properties
DR-1 Develop a plan for beneficial uses of dredged material in Tampa Bay
BACKGROUND:Dredging operations, including removal and disposal of dredged materials, can kill, injure, impact reproduction or alter the behavior of bay wildlife — including shorebirds, sea turtles and manatees. The type of dredging equipment used,
as well as the location, timing and duration of the project, influence which wildlife species may be affected.
Potential dredging impacts to Tampa Bay wildlife include:
• Disturbance or destruction of nesting habitats for turtles or shorebirds during placement of dredged material on beaches or spoil islands.
• Smothering of shoreline bivalve and crab populations during placement of dredged materials on beaches, destroying feeding grounds for shorebirds and important recreational fish.
• Reduction of sea turtle nesting success due to incompatible sediment types placed on nesting beaches.
• Physical impacts to manatees and sea turtles during active dredging operations, such as hopper dredge buckets.
• Collisions with wildlife during movement of vessels associated with dredging operations.
• Higher turbidity levels caused by resuspension of sediment during dredging.
• Increased light levels associated with dredging operations at night. Nighttime dredging also poses inherent risks to manatees and other animals, as they are less likely to be visible.
• Displacement, smothering or death of benthic organisms such as worms or snails or small, bottom-dwelling fishes during dredging and transport activities.
Precautions to minimize impacts of dredging activities exist. For example, federal regulations require the United States Army Corps of Engineers (USACE) to consult with the National Oceanic and Atmospheric Administration’s National Marine Fisheries Service (NOAA NMFS) on all federally authorized dredging projects. Prudent scheduling of projects can avoid or minimize disruption to shorebird or sea turtle nesting. Trained observers may alert project personnel to the presence of sea turtles or manatees, and temporarily halt dredging to avoid conflicts. Moreover, gear modifications, such as drag deflectors that prevent sea turtles from being drawn into hopper dredges, can prevent deaths and injuries.
Strategies for protecting wildlife during and after dredging have been developed by agencies such as the Florida Department of Environmental Protection (FDEP), the Florida Fish and Wildlife Conservation Commission (FWC), NMFS and the United States Fish and Wildlife Service (USFWS).
FWC’s standard manatee protection conditions are required protocols during active dredging and include: trained observers who can halt in-water operations when manatees are observed within a 50-foot radius; idle speed/no wake operation of vessels at all times when draft is less than four-feet clearance; use of siltation or turbidity barriers that do not entangle or entrap manatees; immediate reporting of collisions or injuries; and erecting speed zone signs prior to all in-water project activities. Manatee observers were extensively used during excavation and installation of the
At left: Two manmade islands in Hillsborough Bay are used for disposal of dredged material from port-related projects. These islands are important nesting areas for a variety of birds, such as this American Oystercatcher. Port officials work closely with local Audubon managers to balance dredging and wildlife needs. Photo courtesy Audubon Florida.
DR-2
CHARTING THE COURSE: THE COMPREHENSIVE CONSERVATION AND MANAGEMENT PLAN FOR TAMPA BAY (AUGUST 2017 REVISION)
PAGE 114
Go to: TABLE OF CONTENTS | INDEX OF ACTIONS
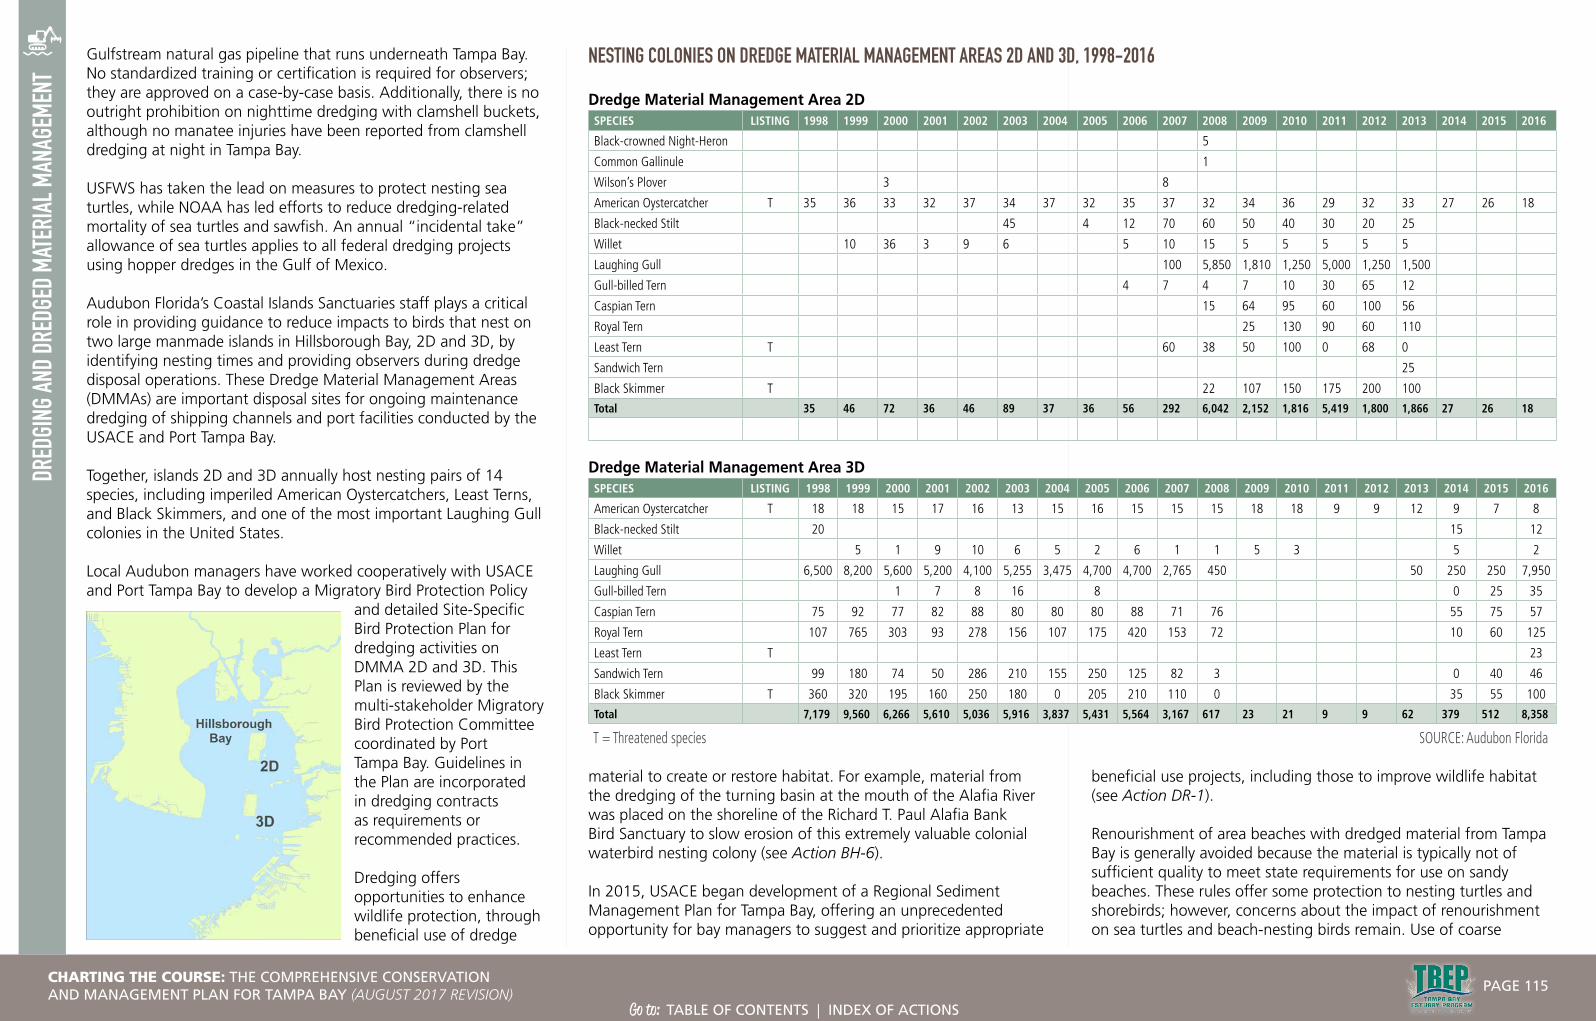
DRED
GING
AND
DRED
GED
MATE
RIAL
MAN
AGEM
ENT
Gulfstream natural gas pipeline that runs underneath Tampa Bay. No standardized training or certification is required for observers; they are approved on a case-by-case basis. Additionally, there is no outright prohibition on nighttime dredging with clamshell buckets, although no manatee injuries have been reported from clamshell dredging at night in Tampa Bay.
USFWS has taken the lead on measures to protect nesting sea turtles, while NOAA has led efforts to reduce dredging-related mortality of sea turtles and sawfish. An annual “incidental take” allowance of sea turtles applies to all federal dredging projects using hopper dredges in the Gulf of Mexico.
Audubon Florida’s Coastal Islands Sanctuaries staff plays a critical role in providing guidance to reduce impacts to birds that nest on two large manmade islands in Hillsborough Bay, 2D and 3D, by identifying nesting times and providing observers during dredge disposal operations. These Dredge Material Management Areas (DMMAs) are important disposal sites for ongoing maintenance dredging of shipping channels and port facilities conducted by the USACE and Port Tampa Bay.
Together, islands 2D and 3D annually host nesting pairs of 14 species, including imperiled American Oystercatchers, Least Terns, and Black Skimmers, and one of the most important Laughing Gull colonies in the United States.
Local Audubon managers have worked cooperatively with USACE and Port Tampa Bay to develop a Migratory Bird Protection Policy
and detailed Site-Specific Bird Protection Plan for dredging activities on DMMA 2D and 3D. This Plan is reviewed by the multi-stakeholder Migratory Bird Protection Committee coordinated by Port Tampa Bay. Guidelines in the Plan are incorporated in dredging contracts as requirements or recommended practices.
Dredging offers opportunities to enhance wildlife protection, through beneficial use of dredge
NESTING COLONIES ON DREDGE MATERIAL MANAGEMENT AREAS 2D AND 3D, 1998-2016
Dredge Material Management Area 2DSPECIES LISTING 1998 1999 2000 2001 2002 2003 2004 2005 2006 2007 2008 2009 2010 2011 2012 2013 2014 2015 2016
Black-crowned Night-Heron 5
Common Gallinule 1
Wilson’s Plover 3 8
American Oystercatcher T 35 36 33 32 37 34 37 32 35 37 32 34 36 29 32 33 27 26 18
Black-necked Stilt 45 4 12 70 60 50 40 30 20 25
Willet 10 36 3 9 6 5 10 15 5 5 5 5 5
Laughing Gull 100 5,850 1,810 1,250 5,000 1,250 1,500
Gull-billed Tern 4 7 4 7 10 30 65 12
Caspian Tern 15 64 95 60 100 56
Royal Tern 25 130 90 60 110
Least Tern T 60 38 50 100 0 68 0
Sandwich Tern 25
Black Skimmer T 22 107 150 175 200 100
Total 35 46 72 36 46 89 37 36 56 292 6,042 2,152 1,816 5,419 1,800 1,866 27 26 18
Dredge Material Management Area 3DSPECIES LISTING 1998 1999 2000 2001 2002 2003 2004 2005 2006 2007 2008 2009 2010 2011 2012 2013 2014 2015 2016
American Oystercatcher T 18 18 15 17 16 13 15 16 15 15 15 18 18 9 9 12 9 7 8
Black-necked Stilt 20 15 12
Willet 5 1 9 10 6 5 2 6 1 1 5 3 5 2
Laughing Gull 6,500 8,200 5,600 5,200 4,100 5,255 3,475 4,700 4,700 2,765 450 50 250 250 7,950
Gull-billed Tern 1 7 8 16 8 0 25 35
Caspian Tern 75 92 77 82 88 80 80 80 88 71 76 55 75 57
Royal Tern 107 765 303 93 278 156 107 175 420 153 72 10 60 125
Least Tern T 23
Sandwich Tern 99 180 74 50 286 210 155 250 125 82 3 0 40 46
Black Skimmer T 360 320 195 160 250 180 0 205 210 110 0 35 55 100
Total 7,179 9,560 6,266 5,610 5,036 5,916 3,837 5,431 5,564 3,167 617 23 21 9 9 62 379 512 8,358
T = Threatened species SOURCE: Audubon Florida
material to create or restore habitat. For example, material from the dredging of the turning basin at the mouth of the Alafia River was placed on the shoreline of the Richard T. Paul Alafia Bank Bird Sanctuary to slow erosion of this extremely valuable colonial waterbird nesting colony (see Action BH-6).
In 2015, USACE began development of a Regional Sediment Management Plan for Tampa Bay, offering an unprecedented opportunity for bay managers to suggest and prioritize appropriate
beneficial use projects, including those to improve wildlife habitat (see Action DR-1).
Renourishment of area beaches with dredged material from Tampa Bay is generally avoided because the material is typically not of sufficient quality to meet state requirements for use on sandy beaches. These rules offer some protection to nesting turtles and shorebirds; however, concerns about the impact of renourishment on sea turtles and beach-nesting birds remain. Use of coarse
CHARTING THE COURSE: THE COMPREHENSIVE CONSERVATION AND MANAGEMENT PLAN FOR TAMPA BAY (AUGUST 2017 REVISION)
PAGE 115
Go to: TABLE OF CONTENTS | INDEX OF ACTIONS

DRED
GING
AND
DRED
GED
MATE
RIAL
MAN
AGEM
ENT
material, along with compaction from heavy equipment, may prevent turtles or beach-nesting birds from successfully excavating nests; and the slope and elevation of the completed projects may inhibit nesting, or lead to flooding of nests. Placing fill on beaches during nesting periods may remove important nursery areas for all or a significant portion of that nesting season. Relocation, when necessary, may not be as successful.
In 2015, Egmont Key received dredged material that did not meet state criteria as an emergency measure to reduce erosion threatening historic structures on the island. USACE funded a study by Eckerd College researchers in summer 2016 to assess whether, and to what extent, turtle nesting was affected. Egmont Key also is an important and vulnerable nursery for beach-nesting birds, particularly Laughing Gulls and Royal and Sandwich Terns.
USACE is investigating improvements to operating procedures to better protect wildlife. Current initiatives include more advanced sighting techniques for marine mammals (such as thermal or infrared technology) that can be performed by human observers.
Improved coordination and communication about dredging activities, standardized training of on-water observers, and technological advances can enhance protection of bay wildlife during dredging and disposal activities in the future.
STRATEGY:Activity 1 Encourage continued use and compliance with
shorebird protection measures specified in the Site-
Specific Bird Protection Plan for dredging activities on Dredge Material Management Areas 2D and 3D. Review and update Plan as needed to improve or modify guidelines to avoid, minimize or mitigate impacts to nesting birds.
Responsible parties: Port Tampa Bay Migratory Bird Protection Committee and partners
Timeframe: Dredging schedule reviewed annually by Migratory Bird Protection Committee, with opportunity to amend plan prior to and following dredging
Cost and potential funding sources: $ Responsible parties
Location: Baywide
Benefit/Performance measure: Improved coordination of dredging activities and collaboration among Committee members.
Results: Reduced impact to nesting shorebirds due to scheduled dredging and disposal activities.
Deliverables: Updated Site-Specific Bird Protection Plan.
Activity 2 Support research to better understand, quantify and minimize or avoid impacts of dredging on wildlife, including impacts from use of dredge material to renourish beaches where sea turtles nest. Support development of alternative dredge techniques that reduce the potential impact on wildlife at the dredge location, such as: improved turtle-exclusion devices; advanced dewatering to make cutter heads more economical than clamshells for small dredging projects; and directional drilling or precision “plowing” of trenches for cables or submerged pipelines to avoid disturbance of live-bottom habitats.
Responsible parties: USACE, USFWS, FWC
Timeframe: 2016–2017 for Egmont Key sea turtle beach nesting assessment; other studies may be initiated by 2020
Cost and potential funding sources: $$ USACE research funds or external grants to researchers
Location: Baywide
Benefit/Performance measure: Improved understanding of current dredging practices and impacts to wildlife.
Results: Reduced death or injury of wildlife due to dredging and renourishment practices.
Deliverables: Research reports summarizing and comparing techniques to avoid or mitigate impacts.
Activity 3 Encourage dredging practices that avoid secondary impacts, promote the long-term viability of adjacent habitats or optimize the potential for habitats to form within the project area.
Responsible parties: USACE, USFWS, FWC, local port authorities
Timeframe: Ongoing
Cost and potential funding sources: $–$$$$ Funding from existing budgets for dredge projects
Location: Baywide
Benefit/Performance measure: Protection or creation or enhancement of underwater habitats
Clamshell dredging in Tampa Bay. This technique uses a “clamshell” bucket with hinged jaws, suspended from a crane aboard a barge. Photo by Nanette O’Hara.
The type of material used for beach renourishment, as well as timing and placement, may reduce the nesting success of sea turtles on barrier island beaches. Photo by Blair Witherington.
CHARTING THE COURSE: THE COMPREHENSIVE CONSERVATION AND MANAGEMENT PLAN FOR TAMPA BAY (AUGUST 2017 REVISION)
PAGE 116
Go to: TABLE OF CONTENTS | INDEX OF ACTIONS
DRED
GING
AND
DRED
GED
MATE
RIAL
MAN
AGEM
ENT
such as seagrasses and hard bottom.
Results: Increased populations of fish and other marine organisms (including benthic communities).
Deliverables: Post-project monitoring reports assessing habitat health and utilization.
Activity 4 Encourage and support development of statewide recommendations for Best Management Practices (BMPs) for beach and shoreline renourishment projects to improve protection of key species during and after renourishment. BMPs could include: timing and location of projects to avoid placement during peak nesting seasons; design considerations, including quality of material used for placement and profile or elevation of renourished shoreline; and monitoring and relocation protocols.
Responsible parties: USACE, NMFS, FWC and FWS (potential leads) with input from Tampa Bay Dredging Advisory Group and Tampa Bay Estuary Program Technical Advisory Committee
Timeframe: Begin in 2017 following results of Eckerd College sea turtle nesting study
Cost and potential funding sources: $–$$ External grants; staff time for responsible parties
Location: Baywide
Benefit/Performance measure: Identification or adoption of BMPs to reduce impacts to wildlife.
Results: Reduced impacts to wildlife associated with dredging operations.
Deliverables: BMPs guidance document.
Activity 5 Track development of new technologies and improvements for training of official observers to better protect wildlife during dredging. Encourage use of new technologies, such as sonar, thermal or infrared imaging, to detect sea turtles, sawfish and marine mammals near active dredging operations, to supplement human spotters. Support improvements to FWC’s manatee observer program and the USFWS
Marine Mammal Observer program, including a standardized training program. Consider incorporation of recommendations from NOAA’s Protected Species Observer program for geological and geophysical surveys regarding experience, qualifications and standardized data collection and reporting protocols.
Responsible parties: USACE Research and Development Center (lead), with input from NMFS, FWC, USFWS, Tampa Bay Dredging Advisory Group and Manatee Awareness Coalition
Timeframe: Research and testing of imaging technology is ongoing
Cost and potential funding sources: $$ USACE
Location: Baywide
Benefit/Performance measure: Widespread adoption of supplemental imaging tools and enhanced training of trained observers.
Results: Reduced impact to wildlife during in-water dredging operations.
Deliverables: Guidelines for and implementation of supplemental imaging tools. Standard training, performance and reporting requirements for marine mammal observers.
Activity 6 Continue to avoid and minimize dredging impacts to seagrasses, mangroves and hard bottom communities in the bay. Develop and implement recommendations to mitigate or offset unavoidable impacts from dredging (see Actions BH-2 and BH-4).
Responsible parties: USACE, local port authorities (leads for operational dredging practices); TBEP and local government and agency partners (for mitigation recommendations)
Timeframe: TBEP Habitat Master Plan incorporating mitigation guidance initiated in 2017, complete in 2019. Habitat Master Plan is updated every 5-8 years.
Cost and potential funding sources: $$–$$$ TBEP funding through CWA Section 320 funds
Location: Baywide
Benefit/Performance measure: Protection and restoration of habitats from dredging impacts will support the goals of TBEP’s Habitat Master Plan.
Results: Measurable goals adopted by the TBEP Policy Board for hard bottom habitat.
Deliverables: Tampa Bay Habitat Master Plan with recommendations for avoiding or minimizing impacts of dredging on underwater habitats. TBEP adoption of measurable goals for hard bottom habitats.
CHARTING THE COURSE: THE COMPREHENSIVE CONSERVATION AND MANAGEMENT PLAN FOR TAMPA BAY (AUGUST 2017 REVISION)
PAGE 117
Go to: TABLE OF CONTENTS | INDEX OF ACTIONS
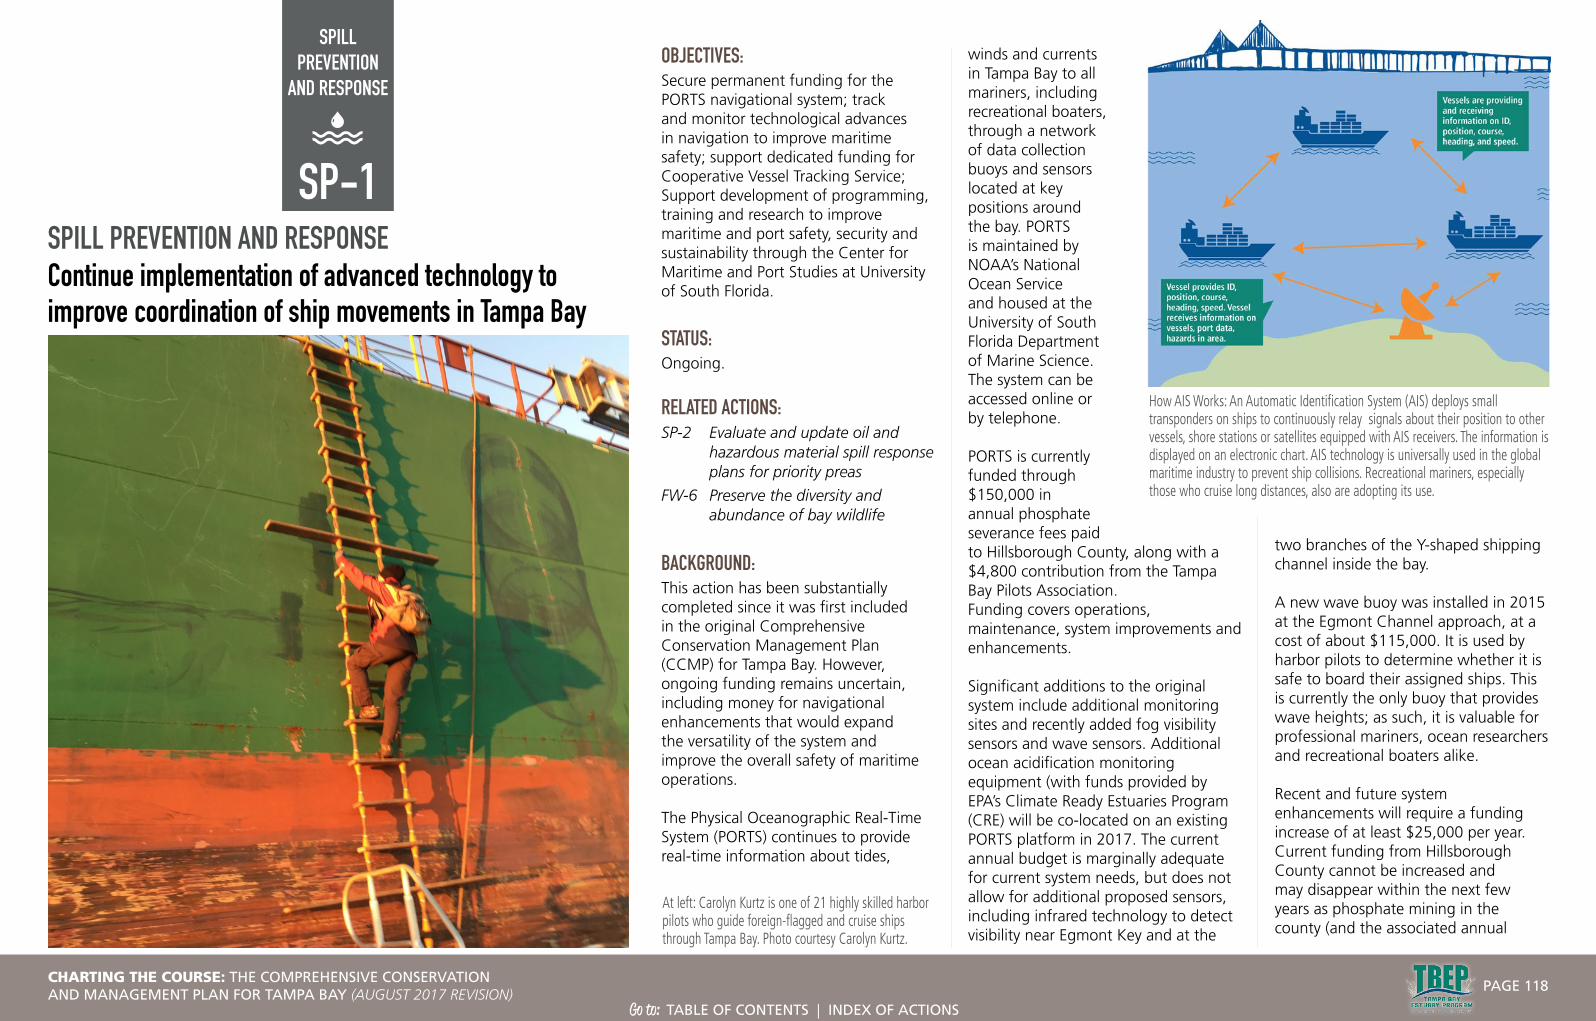
SPILL PREVENTION
AND RESPONSE
SPILL PREVENTION AND RESPONSEContinue implementation of advanced technology to improve coordination of ship movements in Tampa Bay
At left: Carolyn Kurtz is one of 21 highly skilled harbor pilots who guide foreign-flagged and cruise ships through Tampa Bay. Photo courtesy Carolyn Kurtz.
How AIS Works: An Automatic Identification System (AIS) deploys small transponders on ships to continuously relay signals about their position to other vessels, shore stations or satellites equipped with AIS receivers. The information is displayed on an electronic chart. AIS technology is universally used in the global maritime industry to prevent ship collisions. Recreational mariners, especially those who cruise long distances, also are adopting its use.
OBJECTIVES: Secure permanent funding for the PORTS navigational system; track and monitor technological advances in navigation to improve maritime safety; support dedicated funding for Cooperative Vessel Tracking Service; Support development of programming, training and research to improve maritime and port safety, security and sustainability through the Center for Maritime and Port Studies at University of South Florida.
STATUS: Ongoing.
RELATED ACTIONS:SP-2 Evaluate and update oil and
hazardous material spill response plans for priority preas
FW-6 Preserve the diversity and abundance of bay wildlife
BACKGROUND:This action has been substantially completed since it was first included in the original Comprehensive Conservation Management Plan (CCMP) for Tampa Bay. However, ongoing funding remains uncertain, including money for navigational enhancements that would expand the versatility of the system and improve the overall safety of maritime operations.
The Physical Oceanographic Real-Time System (PORTS) continues to provide real-time information about tides,
winds and currents in Tampa Bay to all mariners, including recreational boaters, through a network of data collection buoys and sensors located at key positions around the bay. PORTS is maintained by NOAA’s National Ocean Service and housed at the University of South Florida Department of Marine Science. The system can be accessed online or by telephone.
PORTS is currently funded through $150,000 in annual phosphate severance fees paid to Hillsborough County, along with a $4,800 contribution from the Tampa Bay Pilots Association.Funding covers operations, maintenance, system improvements and enhancements.
Significant additions to the original system include additional monitoring sites and recently added fog visibility sensors and wave sensors. Additional ocean acidification monitoring equipment (with funds provided by EPA’s Climate Ready Estuaries Program (CRE) will be co-located on an existing PORTS platform in 2017. The current annual budget is marginally adequate for current system needs, but does not allow for additional proposed sensors, including infrared technology to detect visibility near Egmont Key and at the
two branches of the Y-shaped shipping channel inside the bay.
A new wave buoy was installed in 2015 at the Egmont Channel approach, at a cost of about $115,000. It is used by harbor pilots to determine whether it is safe to board their assigned ships. This is currently the only buoy that provides wave heights; as such, it is valuable for professional mariners, ocean researchers and recreational boaters alike.
Recent and future system enhancements will require a funding increase of at least $25,000 per year. Current funding from Hillsborough County cannot be increased and may disappear within the next few years as phosphate mining in the county (and the associated annual
SP-1
CHARTING THE COURSE: THE COMPREHENSIVE CONSERVATION AND MANAGEMENT PLAN FOR TAMPA BAY (AUGUST 2017 REVISION)
PAGE 118
Go to: TABLE OF CONTENTS | INDEX OF ACTIONS

SPILL
PREV
ENTIO
N AN
D RE
SPON
SEphosphate severance funds provided to the County) winds down. The Tampa Bay Harbor Safety and Security Committee (THSSC) is spearheading the search for permanent funding.
In addition to PORTS, maritime safety has been greatly enhanced by the implementation of a coordinated Cooperative Vessel Traffic Service (CVTS), staffed 24/7 by either Coast Guard or Port Tampa Bay personnel. The CVTS automatically identifies, locates and tracks ships by electronically exchanging data with other nearby ships, base stations, and satellites, similar to an air traffic control system. This information supplements marine radar, which continues to be the primary marine navigation technology. Transitioning the system to a full vessel traffic service, which has greater authority than the current voluntary system, would require additional staff, which are not currently allocated and would require dedicated funding by the Coast Guard.
Tampa Bay is on the cutting edge of another evolution in maritime navigation: Virtual, or electronic, Aids to Navigation (ATONs). Virtual channel markers, linked to transponders and Automatic Identification System (AIS) displays now on all large vessels, may eventually replace physical buoys and markers, with their ongoing maintenance/repair costs and safety concerns. Tampa Bay is one of a handful of pilot sites where the Coast Guard is testing virtual ATONs. Full implementation throughout the bay would cost an estimated $4 million, and likely would require funding through federal sources other than the Coast Guard, or through the local port/maritime community. The cost for smaller commercial vessels (such as charter fishing or sailing boats) and recreational boaters to upgrade to the AIS-integrated navigation systems necessary to utilize virtual ATONs is an important consideration.
Research into future tools to reduce the potential for ship groundings or collisions; improve port and vessel security; and foster the overall, long-term sustainability of Tampa Bay’s economically important maritime commerce is being assisted by the development of a new Center for Maritime and Port Studies at University of South Florida. The Center will support research into maritime technologies and train the next generation of maritime professionals, with environmental sustainability as a key component of instruction.
STRATEGY:
Activity 1 Continue to track and support permanent funding and enhancement of PORTS through local, state, federal or private funding sources.
• Explore potential for funding by all three counties bordering the bay, by consortium of maritime industries and area ports, through state-administered sources such as the Coastal Protection Trust Fund, or a combination of those. Stopgap temporary operating expenses could be sought through RESTORE Act funding components.
• Leverage maintenance and operation of existing PORTS stations with enhancements to other needed monitoring programs, such as monitoring of ocean acidification or the Gulfwide sampling network coordinated by the Gulf of Mexico Alliance.
Responsible parties: Tampa Harbor Safety and Security Committee (lead), Port Tampa Bay, Port Manatee, Port of St. Petersburg, Tampa Bay Pilots Association, Hillsborough, Pinellas and Manatee counties, maritime industries, USF College of Marine Science (PORTS ocean acidification monitoring platform), Agency on Bay Management (advocacy and support for funding)
Timeframe: Ongoing
Cost and potential funding sources: $$$ Trust funds, grant funds, permanent funding from responsible parties; EPA CRE funds for ocean acidification monitoring
A PORTS tide monitoring station at Port Manatee. The PORTS network collects real-time information on winds, tides and currents to improve safe navigation for mariners. Photo by Mark Luther.
Location: Baywide
Benefit/Performance measure: Safe maritime operations and vessel movements; in-bay monitoring from PORTS platforms
Results: Improved protection of bay waters, wildlife and economy by avoiding ship groundings and collisions; improved understanding of water quality status from mid-bay continuous monitoring
Deliverables: Annual report on status of operation and funding of PORTS presented to ABM (concurrent with report on CVTS as noted in Step 1)
Activity 2 Continue to monitor implementation of Cooperative
Vessel Traffic Service. Explore potential for full-time dedicated staffing.
Responsible parties: Coast Guard (lead), Port Tampa Bay, Agency on Bay Management advocacy and support for funding
Timeframe: Ongoing
Cost and potential funding sources: $$$-$$$$ based on salary estimates for 3-4 civilian positions to implement and maintain the Cooperative Vessel Traffic Service; possible funding through Coast Guard
Location: Baywide
Benefit/Performance measure: Safe maritime operations and vessel movements
Results: Improved protection of bay waters, wildlife and economy
Deliverables: Annual report on CVTS presented to ABM (possibly concurrent with annual report on status and needs of PORTS)
Activity 3 Support implementation of new navigation technologies, including use of electronic, or “virtual” channel markers, as appropriate in Tampa Bay.
Responsible parties: Coast Guard (lead), HSSC, Port Tampa Bay, Port Manatee, Port of St. Petersburg, Tampa Bay Pilots Association
CHARTING THE COURSE: THE COMPREHENSIVE CONSERVATION AND MANAGEMENT PLAN FOR TAMPA BAY (AUGUST 2017 REVISION)
PAGE 119
Go to: TABLE OF CONTENTS | INDEX OF ACTIONS
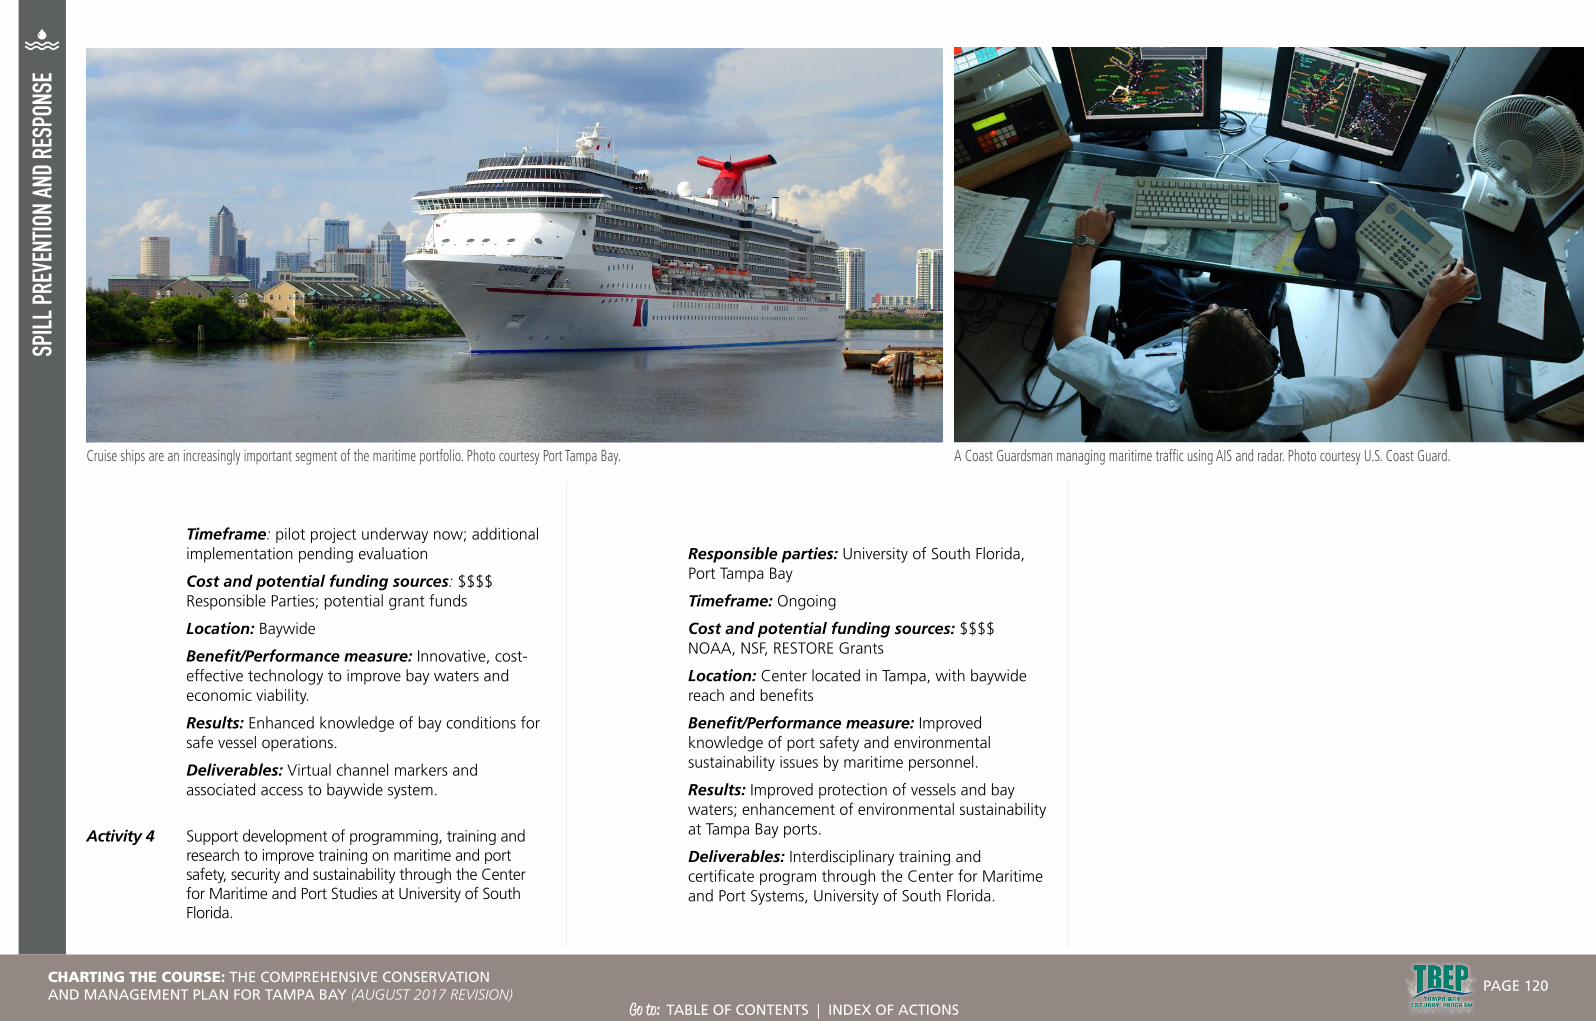
SPILL
PREV
ENTIO
N AN
D RE
SPON
SE
Timeframe: pilot project underway now; additional implementation pending evaluation
Cost and potential funding sources: $$$$ Responsible Parties; potential grant funds
Location: Baywide
Benefit/Performance measure: Innovative, cost-effective technology to improve bay waters and economic viability.
Results: Enhanced knowledge of bay conditions for safe vessel operations.
Deliverables: Virtual channel markers and associated access to baywide system.
Activity 4 Support development of programming, training and research to improve training on maritime and port safety, security and sustainability through the Center for Maritime and Port Studies at University of South Florida.
Cruise ships are an increasingly important segment of the maritime portfolio. Photo courtesy Port Tampa Bay. A Coast Guardsman managing maritime traffic using AIS and radar. Photo courtesy U.S. Coast Guard.
Responsible parties: University of South Florida, Port Tampa Bay
Timeframe: Ongoing
Cost and potential funding sources: $$$$ NOAA, NSF, RESTORE Grants
Location: Center located in Tampa, with baywide reach and benefits
Benefit/Performance measure: Improved knowledge of port safety and environmental sustainability issues by maritime personnel.
Results: Improved protection of vessels and bay waters; enhancement of environmental sustainability at Tampa Bay ports.
Deliverables: Interdisciplinary training and certificate program through the Center for Maritime and Port Systems, University of South Florida.
CHARTING THE COURSE: THE COMPREHENSIVE CONSERVATION AND MANAGEMENT PLAN FOR TAMPA BAY (AUGUST 2017 REVISION)
PAGE 120
Go to: TABLE OF CONTENTS | INDEX OF ACTIONS
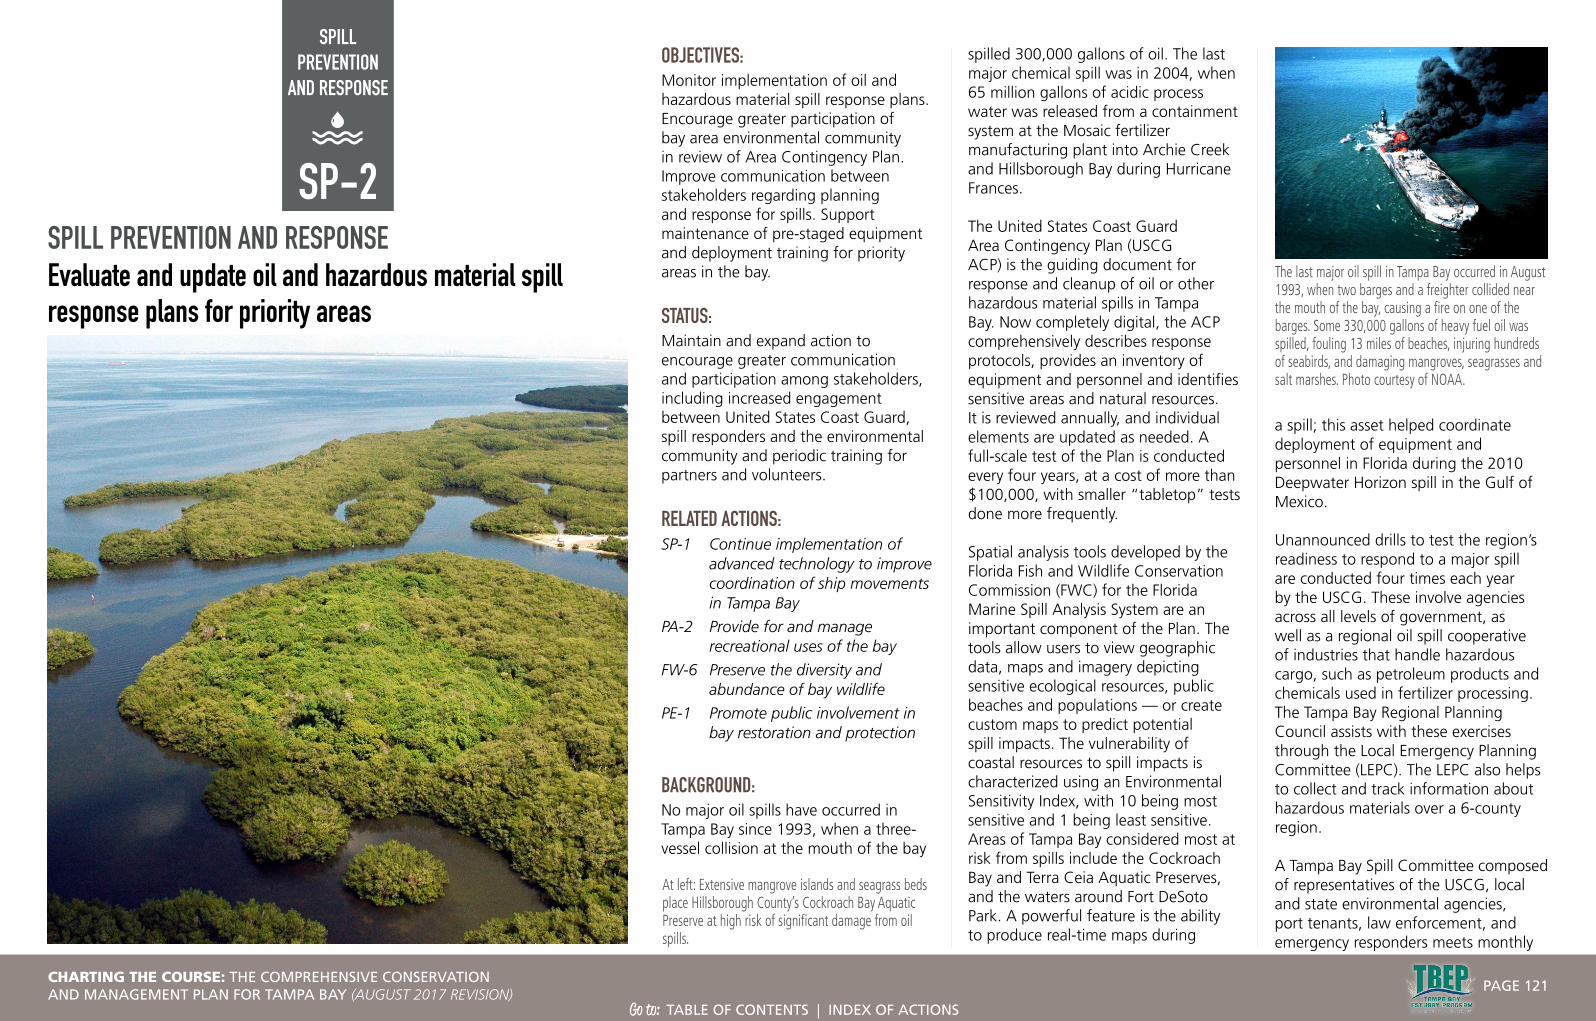
SPILL PREVENTION
AND RESPONSE
SPILL PREVENTION AND RESPONSEEvaluate and update oil and hazardous material spill response plans for priority areas
At left: Extensive mangrove islands and seagrass beds place Hillsborough County’s Cockroach Bay Aquatic Preserve at high risk of significant damage from oil spills.
SP-2
OBJECTIVES: Monitor implementation of oil and hazardous material spill response plans. Encourage greater participation of bay area environmental community in review of Area Contingency Plan. Improve communication between stakeholders regarding planning and response for spills. Support maintenance of pre-staged equipment and deployment training for priority areas in the bay.
STATUS: Maintain and expand action to encourage greater communication and participation among stakeholders, including increased engagement between United States Coast Guard, spill responders and the environmental community and periodic training for partners and volunteers.
RELATED ACTIONS:SP-1 Continue implementation of
advanced technology to improve coordination of ship movements in Tampa Bay
PA-2 Provide for and manage recreational uses of the bay
FW-6 Preserve the diversity and abundance of bay wildlife
PE-1 Promote public involvement in bay restoration and protection
BACKGROUND:No major oil spills have occurred in Tampa Bay since 1993, when a three-vessel collision at the mouth of the bay
spilled 300,000 gallons of oil. The last major chemical spill was in 2004, when 65 million gallons of acidic process water was released from a containment system at the Mosaic fertilizer manufacturing plant into Archie Creek and Hillsborough Bay during Hurricane Frances.
The United States Coast Guard Area Contingency Plan (USCG ACP) is the guiding document for response and cleanup of oil or other hazardous material spills in Tampa Bay. Now completely digital, the ACP comprehensively describes response protocols, provides an inventory of equipment and personnel and identifies sensitive areas and natural resources. It is reviewed annually, and individual elements are updated as needed. A full-scale test of the Plan is conducted every four years, at a cost of more than $100,000, with smaller “tabletop” tests done more frequently.
Spatial analysis tools developed by the Florida Fish and Wildlife Conservation Commission (FWC) for the Florida Marine Spill Analysis System are an important component of the Plan. The tools allow users to view geographic data, maps and imagery depicting sensitive ecological resources, public beaches and populations — or create custom maps to predict potential spill impacts. The vulnerability of coastal resources to spill impacts is characterized using an Environmental Sensitivity Index, with 10 being most sensitive and 1 being least sensitive. Areas of Tampa Bay considered most at risk from spills include the Cockroach Bay and Terra Ceia Aquatic Preserves, and the waters around Fort DeSoto Park. A powerful feature is the ability to produce real-time maps during
a spill; this asset helped coordinate deployment of equipment and personnel in Florida during the 2010 Deepwater Horizon spill in the Gulf of Mexico.
Unannounced drills to test the region’s readiness to respond to a major spill are conducted four times each year by the USCG. These involve agencies across all levels of government, as well as a regional oil spill cooperative of industries that handle hazardous cargo, such as petroleum products and chemicals used in fertilizer processing. The Tampa Bay Regional Planning Council assists with these exercises through the Local Emergency Planning Committee (LEPC). The LEPC also helps to collect and track information about hazardous materials over a 6-county region.
A Tampa Bay Spill Committee composed of representatives of the USCG, local and state environmental agencies, port tenants, law enforcement, and emergency responders meets monthly
The last major oil spill in Tampa Bay occurred in August 1993, when two barges and a freighter collided near the mouth of the bay, causing a fire on one of the barges. Some 330,000 gallons of heavy fuel oil was spilled, fouling 13 miles of beaches, injuring hundreds of seabirds, and damaging mangroves, seagrasses and salt marshes. Photo courtesy of NOAA.
CHARTING THE COURSE: THE COMPREHENSIVE CONSERVATION AND MANAGEMENT PLAN FOR TAMPA BAY (AUGUST 2017 REVISION)
PAGE 121
Go to: TABLE OF CONTENTS | INDEX OF ACTIONS
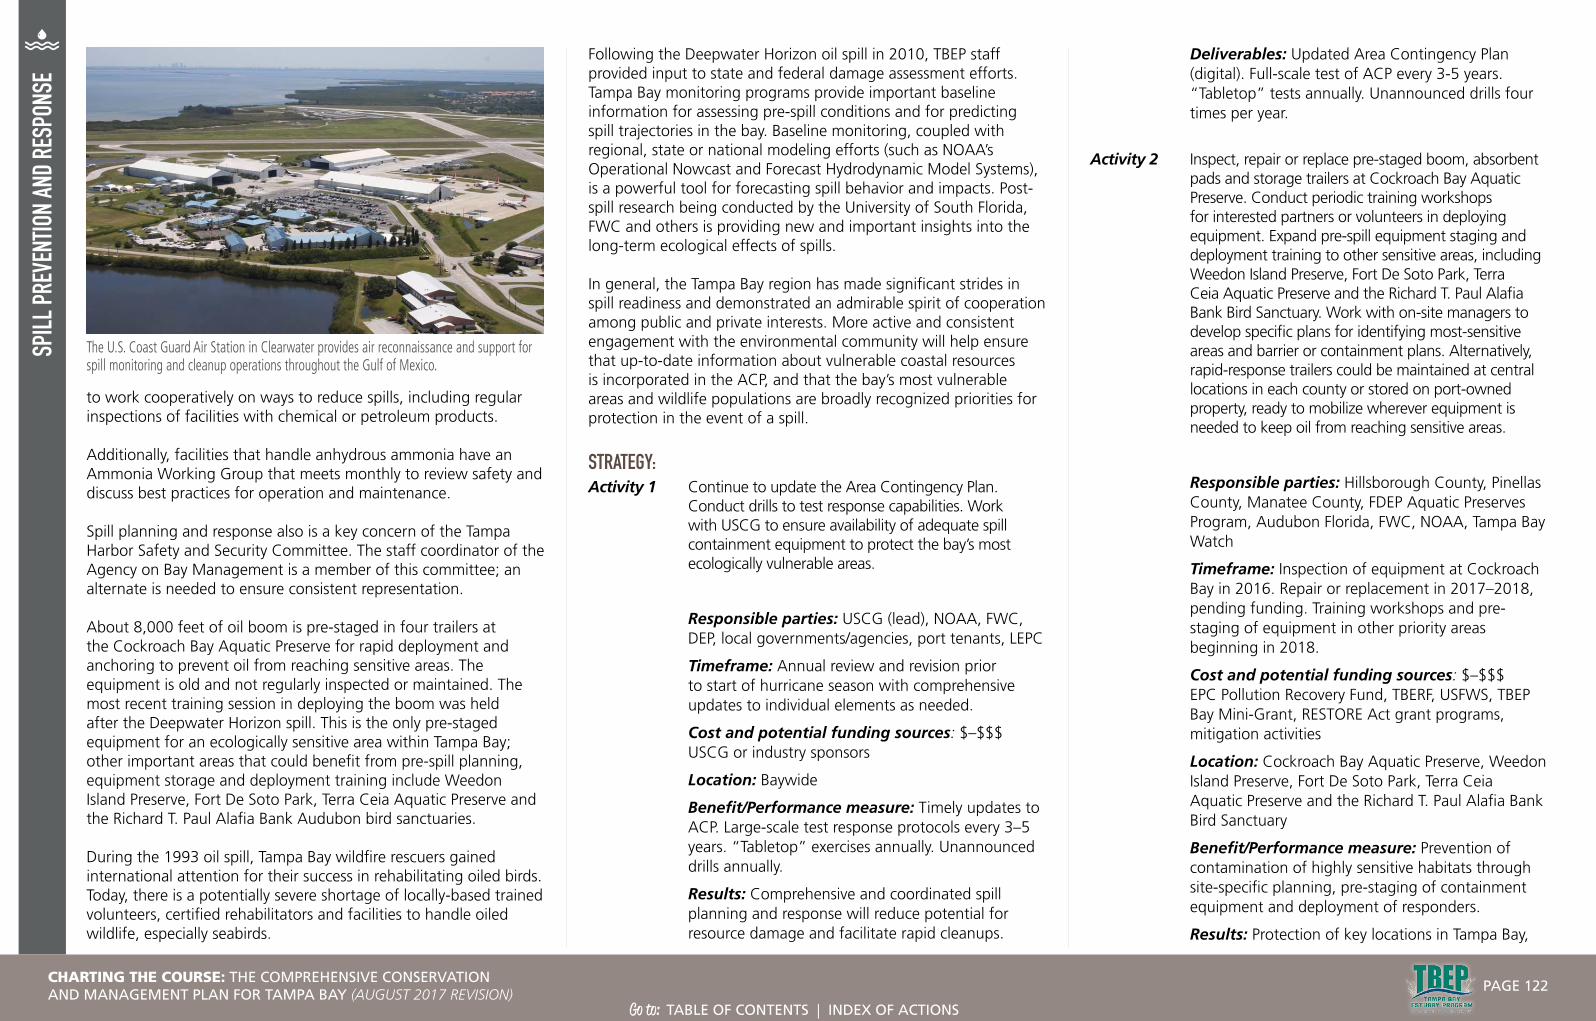
SPILL
PREV
ENTIO
N AN
D RE
SPON
SE
to work cooperatively on ways to reduce spills, including regular inspections of facilities with chemical or petroleum products.
Additionally, facilities that handle anhydrous ammonia have an Ammonia Working Group that meets monthly to review safety and discuss best practices for operation and maintenance.
Spill planning and response also is a key concern of the Tampa Harbor Safety and Security Committee. The staff coordinator of the Agency on Bay Management is a member of this committee; an alternate is needed to ensure consistent representation.
About 8,000 feet of oil boom is pre-staged in four trailers at the Cockroach Bay Aquatic Preserve for rapid deployment and anchoring to prevent oil from reaching sensitive areas. The equipment is old and not regularly inspected or maintained. The most recent training session in deploying the boom was held after the Deepwater Horizon spill. This is the only pre-staged equipment for an ecologically sensitive area within Tampa Bay; other important areas that could benefit from pre-spill planning, equipment storage and deployment training include Weedon Island Preserve, Fort De Soto Park, Terra Ceia Aquatic Preserve and the Richard T. Paul Alafia Bank Audubon bird sanctuaries. During the 1993 oil spill, Tampa Bay wildfire rescuers gained international attention for their success in rehabilitating oiled birds. Today, there is a potentially severe shortage of locally-based trained volunteers, certified rehabilitators and facilities to handle oiled wildlife, especially seabirds.
Following the Deepwater Horizon oil spill in 2010, TBEP staff provided input to state and federal damage assessment efforts. Tampa Bay monitoring programs provide important baseline information for assessing pre-spill conditions and for predicting spill trajectories in the bay. Baseline monitoring, coupled with regional, state or national modeling efforts (such as NOAA’s Operational Nowcast and Forecast Hydrodynamic Model Systems), is a powerful tool for forecasting spill behavior and impacts. Post-spill research being conducted by the University of South Florida, FWC and others is providing new and important insights into the long-term ecological effects of spills.
In general, the Tampa Bay region has made significant strides in spill readiness and demonstrated an admirable spirit of cooperation among public and private interests. More active and consistent engagement with the environmental community will help ensure that up-to-date information about vulnerable coastal resources is incorporated in the ACP, and that the bay’s most vulnerable areas and wildlife populations are broadly recognized priorities for protection in the event of a spill.
STRATEGY:Activity 1 Continue to update the Area Contingency Plan.
Conduct drills to test response capabilities. Work with USCG to ensure availability of adequate spill containment equipment to protect the bay’s most ecologically vulnerable areas.
Responsible parties: USCG (lead), NOAA, FWC, DEP, local governments/agencies, port tenants, LEPC
Timeframe: Annual review and revision prior to start of hurricane season with comprehensive updates to individual elements as needed.
Cost and potential funding sources: $–$$$ USCG or industry sponsors
Location: Baywide
Benefit/Performance measure: Timely updates to ACP. Large-scale test response protocols every 3–5 years. “Tabletop” exercises annually. Unannounced drills annually.
Results: Comprehensive and coordinated spill planning and response will reduce potential for resource damage and facilitate rapid cleanups.
Deliverables: Updated Area Contingency Plan (digital). Full-scale test of ACP every 3-5 years. “Tabletop” tests annually. Unannounced drills four times per year.
Activity 2 Inspect, repair or replace pre-staged boom, absorbent pads and storage trailers at Cockroach Bay Aquatic Preserve. Conduct periodic training workshops for interested partners or volunteers in deploying equipment. Expand pre-spill equipment staging and deployment training to other sensitive areas, including Weedon Island Preserve, Fort De Soto Park, Terra Ceia Aquatic Preserve and the Richard T. Paul Alafia Bank Bird Sanctuary. Work with on-site managers to develop specific plans for identifying most-sensitive areas and barrier or containment plans. Alternatively, rapid-response trailers could be maintained at central locations in each county or stored on port-owned property, ready to mobilize wherever equipment is needed to keep oil from reaching sensitive areas.
Responsible parties: Hillsborough County, Pinellas County, Manatee County, FDEP Aquatic Preserves Program, Audubon Florida, FWC, NOAA, Tampa Bay Watch
Timeframe: Inspection of equipment at Cockroach Bay in 2016. Repair or replacement in 2017–2018, pending funding. Training workshops and pre-staging of equipment in other priority areas beginning in 2018.
Cost and potential funding sources: $–$$$ EPC Pollution Recovery Fund, TBERF, USFWS, TBEP Bay Mini-Grant, RESTORE Act grant programs, mitigation activities
Location: Cockroach Bay Aquatic Preserve, Weedon Island Preserve, Fort De Soto Park, Terra Ceia Aquatic Preserve and the Richard T. Paul Alafia Bank Bird Sanctuary
Benefit/Performance measure: Prevention of contamination of highly sensitive habitats through site-specific planning, pre-staging of containment equipment and deployment of responders.
Results: Protection of key locations in Tampa Bay,
The U.S. Coast Guard Air Station in Clearwater provides air reconnaissance and support for spill monitoring and cleanup operations throughout the Gulf of Mexico.
CHARTING THE COURSE: THE COMPREHENSIVE CONSERVATION AND MANAGEMENT PLAN FOR TAMPA BAY (AUGUST 2017 REVISION)
PAGE 122
Go to: TABLE OF CONTENTS | INDEX OF ACTIONS
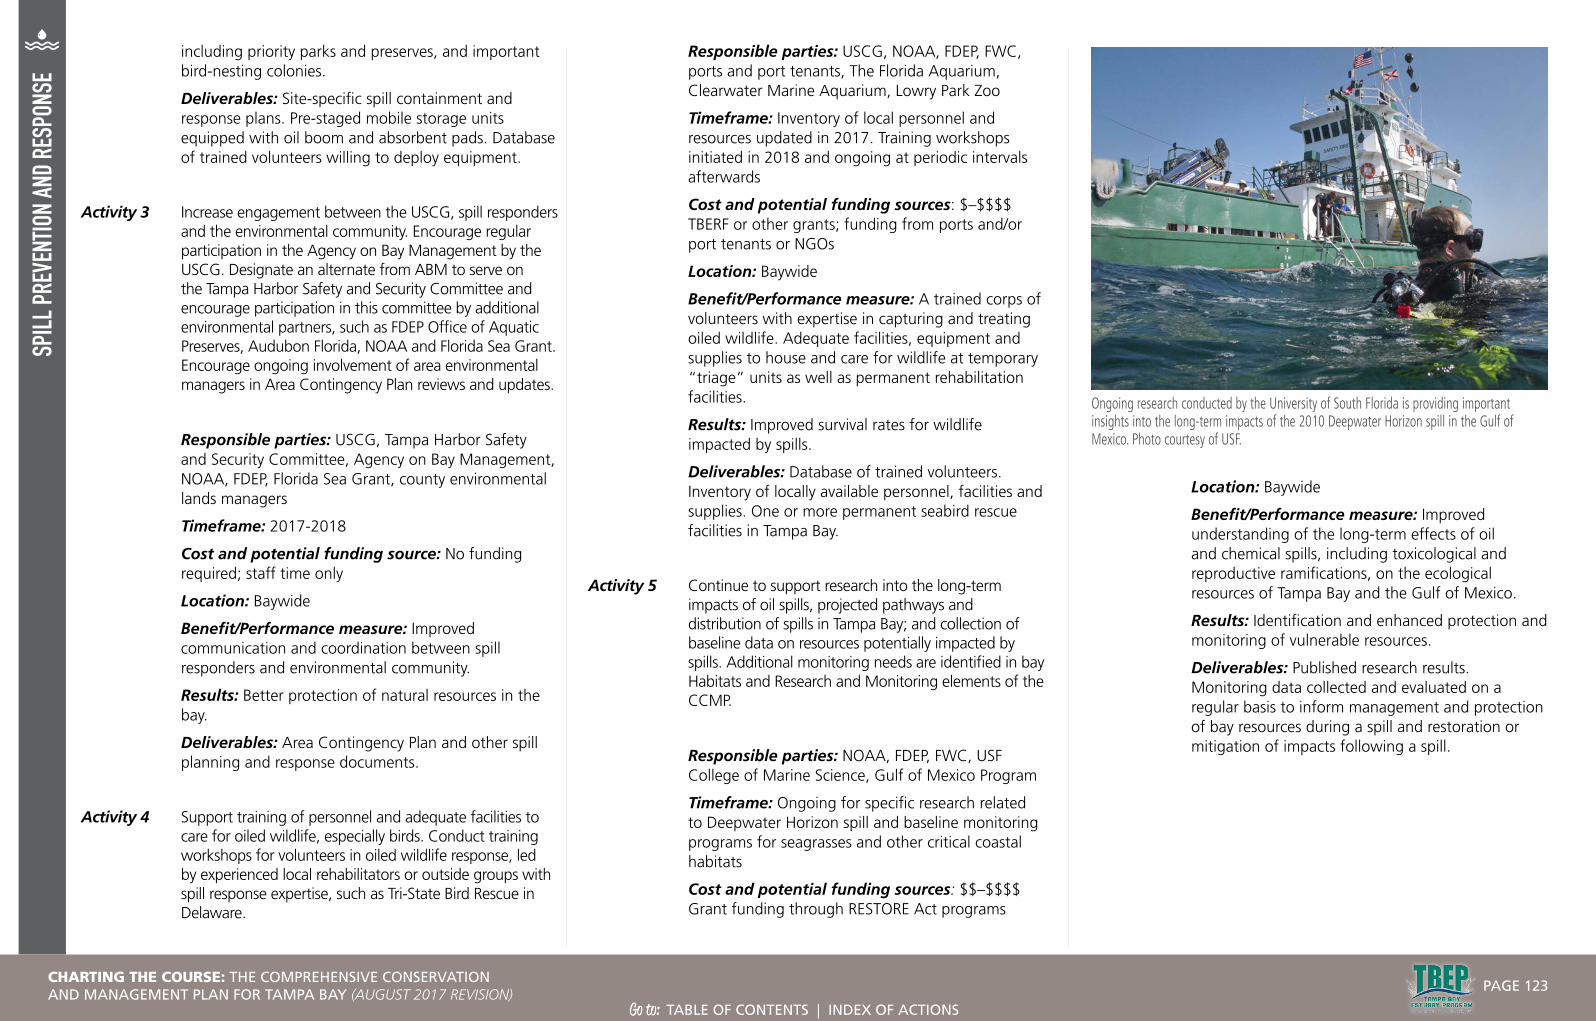
SPILL
PREV
ENTIO
N AN
D RE
SPON
SEincluding priority parks and preserves, and important bird-nesting colonies.
Deliverables: Site-specific spill containment and response plans. Pre-staged mobile storage units equipped with oil boom and absorbent pads. Database of trained volunteers willing to deploy equipment.
Activity 3 Increase engagement between the USCG, spill responders and the environmental community. Encourage regular participation in the Agency on Bay Management by the USCG. Designate an alternate from ABM to serve on the Tampa Harbor Safety and Security Committee and encourage participation in this committee by additional environmental partners, such as FDEP Office of Aquatic Preserves, Audubon Florida, NOAA and Florida Sea Grant. Encourage ongoing involvement of area environmental managers in Area Contingency Plan reviews and updates.
Responsible parties: USCG, Tampa Harbor Safety and Security Committee, Agency on Bay Management, NOAA, FDEP, Florida Sea Grant, county environmental lands managers
Timeframe: 2017-2018
Cost and potential funding source: No funding required; staff time only
Location: Baywide
Benefit/Performance measure: Improved communication and coordination between spill responders and environmental community.
Results: Better protection of natural resources in the bay.
Deliverables: Area Contingency Plan and other spill planning and response documents.
Activity 4 Support training of personnel and adequate facilities to care for oiled wildlife, especially birds. Conduct training workshops for volunteers in oiled wildlife response, led by experienced local rehabilitators or outside groups with spill response expertise, such as Tri-State Bird Rescue in Delaware.
Responsible parties: USCG, NOAA, FDEP, FWC, ports and port tenants, The Florida Aquarium, Clearwater Marine Aquarium, Lowry Park Zoo
Timeframe: Inventory of local personnel and resources updated in 2017. Training workshops initiated in 2018 and ongoing at periodic intervals afterwards
Cost and potential funding sources: $–$$$$ TBERF or other grants; funding from ports and/or port tenants or NGOs
Location: Baywide
Benefit/Performance measure: A trained corps of volunteers with expertise in capturing and treating oiled wildlife. Adequate facilities, equipment and supplies to house and care for wildlife at temporary “triage” units as well as permanent rehabilitation facilities.
Results: Improved survival rates for wildlife impacted by spills.
Deliverables: Database of trained volunteers. Inventory of locally available personnel, facilities and supplies. One or more permanent seabird rescue facilities in Tampa Bay.
Activity 5 Continue to support research into the long-term impacts of oil spills, projected pathways and distribution of spills in Tampa Bay; and collection of baseline data on resources potentially impacted by spills. Additional monitoring needs are identified in bay Habitats and Research and Monitoring elements of the CCMP.
Responsible parties: NOAA, FDEP, FWC, USF College of Marine Science, Gulf of Mexico Program
Timeframe: Ongoing for specific research related to Deepwater Horizon spill and baseline monitoring programs for seagrasses and other critical coastal habitats
Cost and potential funding sources: $$–$$$$ Grant funding through RESTORE Act programs
Ongoing research conducted by the University of South Florida is providing important insights into the long-term impacts of the 2010 Deepwater Horizon spill in the Gulf of Mexico. Photo courtesy of USF.
Location: Baywide
Benefit/Performance measure: Improved understanding of the long-term effects of oil and chemical spills, including toxicological and reproductive ramifications, on the ecological resources of Tampa Bay and the Gulf of Mexico.
Results: Identification and enhanced protection and monitoring of vulnerable resources.
Deliverables: Published research results. Monitoring data collected and evaluated on a regular basis to inform management and protection of bay resources during a spill and restoration or mitigation of impacts following a spill.
CHARTING THE COURSE: THE COMPREHENSIVE CONSERVATION AND MANAGEMENT PLAN FOR TAMPA BAY (AUGUST 2017 REVISION)
PAGE 123
Go to: TABLE OF CONTENTS | INDEX OF ACTIONS
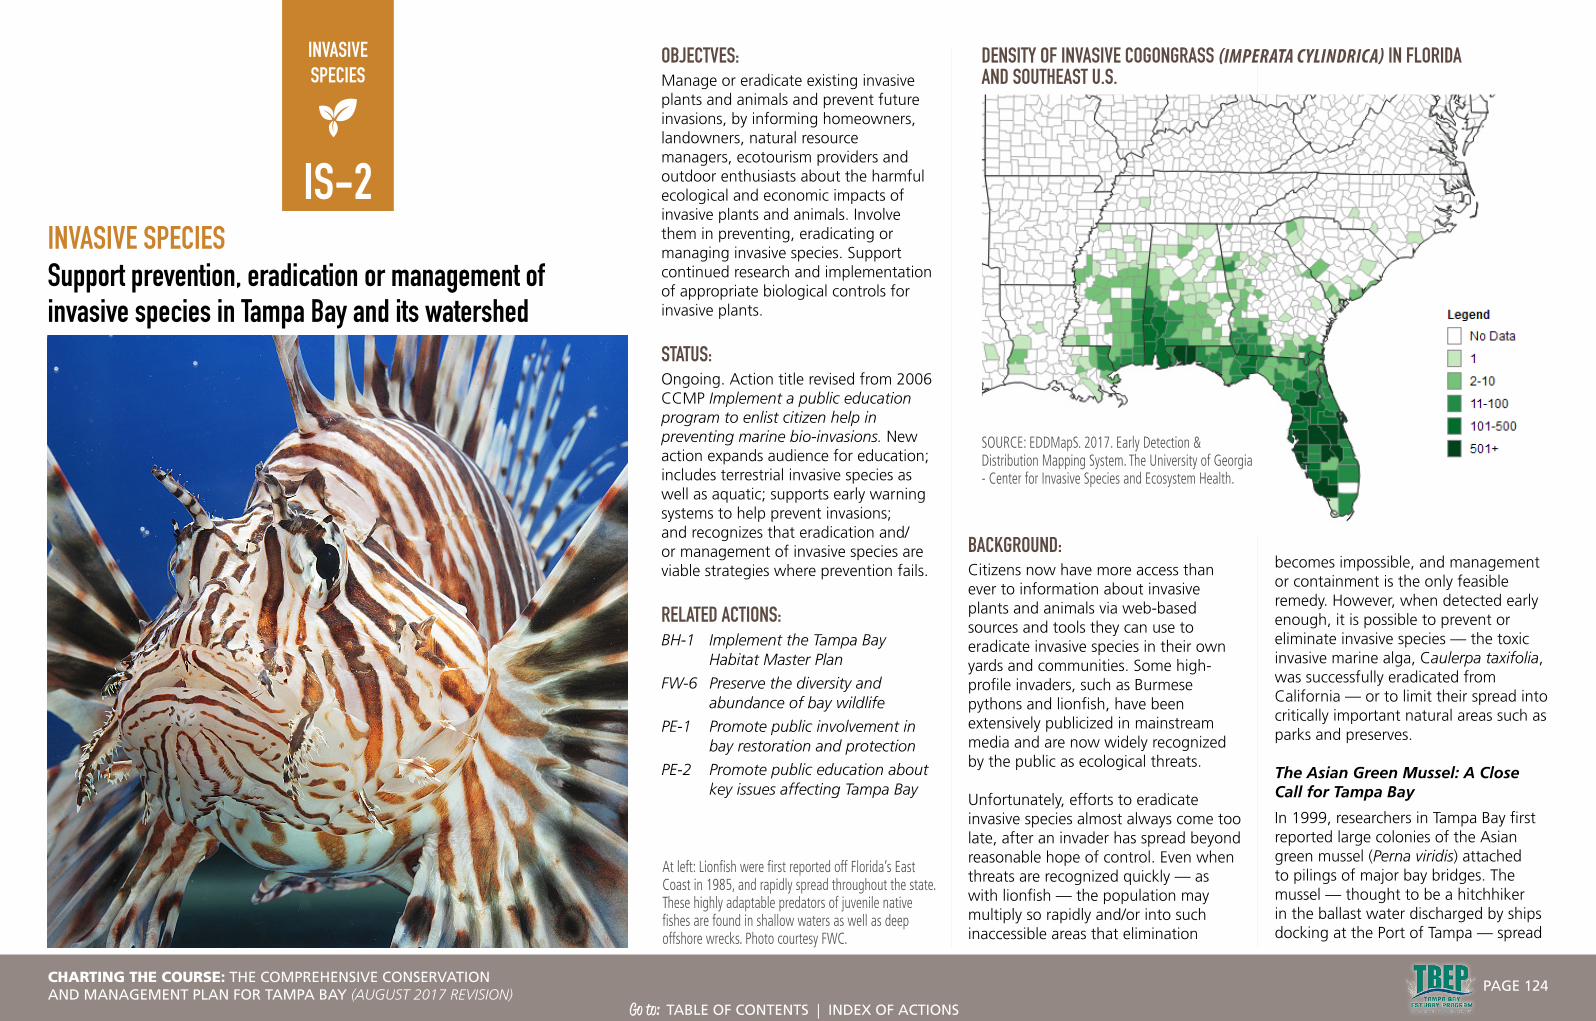
INVASIVESPECIES
INVASIVE SPECIESSupport prevention, eradication or management of invasive species in Tampa Bay and its watershed
At left: Lionfish were first reported off Florida’s East Coast in 1985, and rapidly spread throughout the state. These highly adaptable predators of juvenile native fishes are found in shallow waters as well as deep offshore wrecks. Photo courtesy FWC.
IS-2
OBJECTVES:Manage or eradicate existing invasive plants and animals and prevent future invasions, by informing homeowners, landowners, natural resource managers, ecotourism providers and outdoor enthusiasts about the harmful ecological and economic impacts of invasive plants and animals. Involve them in preventing, eradicating or managing invasive species. Support continued research and implementation of appropriate biological controls for invasive plants.
STATUS:Ongoing. Action title revised from 2006 CCMP Implement a public education program to enlist citizen help in preventing marine bio-invasions. New action expands audience for education; includes terrestrial invasive species as well as aquatic; supports early warning systems to help prevent invasions; and recognizes that eradication and/or management of invasive species are viable strategies where prevention fails.
RELATED ACTIONS:BH-1 Implement the Tampa Bay
Habitat Master Plan
FW-6 Preserve the diversity and abundance of bay wildlife
PE-1 Promote public involvement in bay restoration and protection
PE-2 Promote public education about key issues affecting Tampa Bay
BACKGROUND:Citizens now have more access than ever to information about invasive plants and animals via web-based sources and tools they can use to eradicate invasive species in their own yards and communities. Some high-profile invaders, such as Burmese pythons and lionfish, have been extensively publicized in mainstream media and are now widely recognized by the public as ecological threats.
Unfortunately, efforts to eradicate invasive species almost always come too late, after an invader has spread beyond reasonable hope of control. Even when threats are recognized quickly — as with lionfish — the population may multiply so rapidly and/or into such inaccessible areas that elimination
becomes impossible, and management or containment is the only feasible remedy. However, when detected early enough, it is possible to prevent or eliminate invasive species — the toxic invasive marine alga, Caulerpa taxifolia, was successfully eradicated from California — or to limit their spread into critically important natural areas such as parks and preserves.
The Asian Green Mussel: A Close Call for Tampa Bay
In 1999, researchers in Tampa Bay first reported large colonies of the Asian green mussel (Perna viridis) attached to pilings of major bay bridges. The mussel — thought to be a hitchhiker in the ballast water discharged by ships docking at the Port of Tampa — spread
DENSITY OF INVASIVE COGONGRASS (IMPERATA CYLINDRICA) IN FLORIDA AND SOUTHEAST U.S.
SOURCE: EDDMapS. 2017. Early Detection & Distribution Mapping System. The University of Georgia - Center for Invasive Species and Ecosystem Health.
CHARTING THE COURSE: THE COMPREHENSIVE CONSERVATION AND MANAGEMENT PLAN FOR TAMPA BAY (AUGUST 2017 REVISION)
PAGE 124
Go to: TABLE OF CONTENTS | INDEX OF ACTIONS
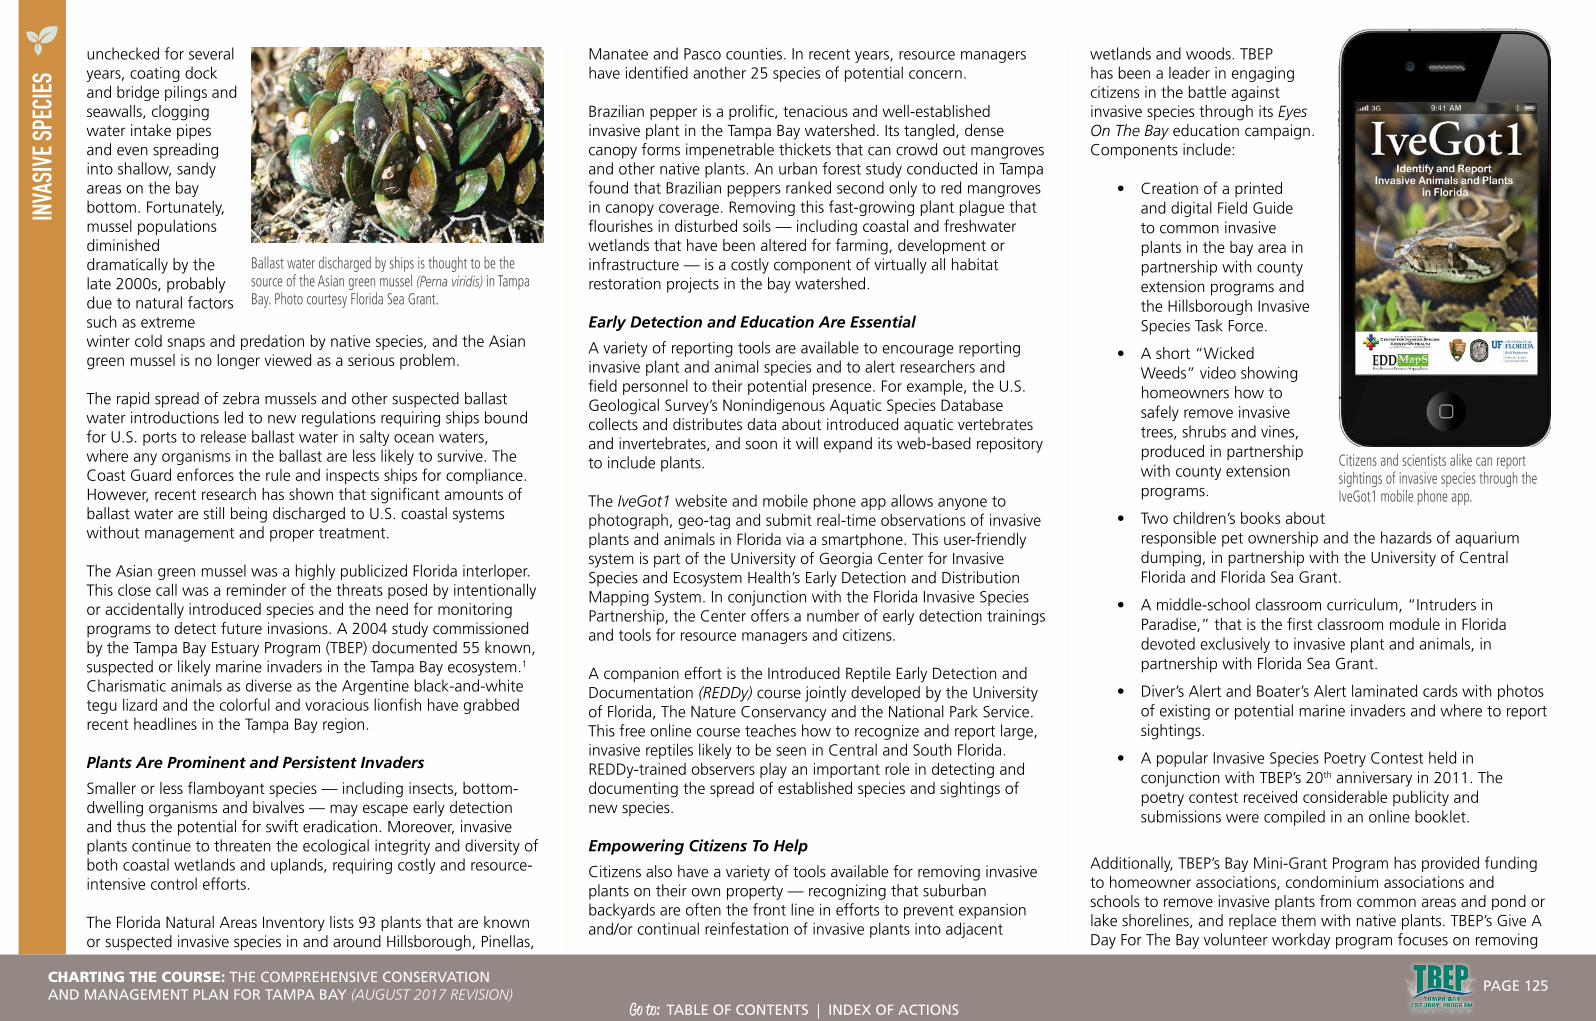
INVA
SIVE
SPEC
IESunchecked for several years, coating dock and bridge pilings and seawalls, clogging water intake pipes and even spreading into shallow, sandy areas on the bay bottom. Fortunately, mussel populations diminished dramatically by the late 2000s, probably due to natural factors such as extreme winter cold snaps and predation by native species, and the Asian green mussel is no longer viewed as a serious problem.
The rapid spread of zebra mussels and other suspected ballast water introductions led to new regulations requiring ships bound for U.S. ports to release ballast water in salty ocean waters, where any organisms in the ballast are less likely to survive. The Coast Guard enforces the rule and inspects ships for compliance. However, recent research has shown that significant amounts of ballast water are still being discharged to U.S. coastal systems without management and proper treatment.
The Asian green mussel was a highly publicized Florida interloper. This close call was a reminder of the threats posed by intentionally or accidentally introduced species and the need for monitoring programs to detect future invasions. A 2004 study commissioned by the Tampa Bay Estuary Program (TBEP) documented 55 known, suspected or likely marine invaders in the Tampa Bay ecosystem.1
Charismatic animals as diverse as the Argentine black-and-white tegu lizard and the colorful and voracious lionfish have grabbed recent headlines in the Tampa Bay region.
Plants Are Prominent and Persistent Invaders
Smaller or less flamboyant species — including insects, bottom-dwelling organisms and bivalves — may escape early detection and thus the potential for swift eradication. Moreover, invasive plants continue to threaten the ecological integrity and diversity of both coastal wetlands and uplands, requiring costly and resource-intensive control efforts.
The Florida Natural Areas Inventory lists 93 plants that are known or suspected invasive species in and around Hillsborough, Pinellas,
Manatee and Pasco counties. In recent years, resource managers have identified another 25 species of potential concern.
Brazilian pepper is a prolific, tenacious and well-established invasive plant in the Tampa Bay watershed. Its tangled, dense canopy forms impenetrable thickets that can crowd out mangroves and other native plants. An urban forest study conducted in Tampa found that Brazilian peppers ranked second only to red mangroves in canopy coverage. Removing this fast-growing plant plague that flourishes in disturbed soils — including coastal and freshwater wetlands that have been altered for farming, development or infrastructure — is a costly component of virtually all habitat restoration projects in the bay watershed.
Early Detection and Education Are Essential
A variety of reporting tools are available to encourage reporting invasive plant and animal species and to alert researchers and field personnel to their potential presence. For example, the U.S. Geological Survey’s Nonindigenous Aquatic Species Database collects and distributes data about introduced aquatic vertebrates and invertebrates, and soon it will expand its web-based repository to include plants.
The IveGot1 website and mobile phone app allows anyone to photograph, geo-tag and submit real-time observations of invasive plants and animals in Florida via a smartphone. This user-friendly system is part of the University of Georgia Center for Invasive Species and Ecosystem Health’s Early Detection and Distribution Mapping System. In conjunction with the Florida Invasive Species Partnership, the Center offers a number of early detection trainings and tools for resource managers and citizens.
A companion effort is the Introduced Reptile Early Detection and Documentation (REDDy) course jointly developed by the University of Florida, The Nature Conservancy and the National Park Service. This free online course teaches how to recognize and report large, invasive reptiles likely to be seen in Central and South Florida. REDDy-trained observers play an important role in detecting and documenting the spread of established species and sightings of new species.
Empowering Citizens To Help
Citizens also have a variety of tools available for removing invasive plants on their own property — recognizing that suburban backyards are often the front line in efforts to prevent expansion and/or continual reinfestation of invasive plants into adjacent
wetlands and woods. TBEP has been a leader in engaging citizens in the battle against invasive species through its Eyes On The Bay education campaign. Components include:
• Creation of a printed and digital Field Guide to common invasive plants in the bay area in partnership with county extension programs and the Hillsborough Invasive Species Task Force.
• A short “Wicked Weeds” video showing homeowners how to safely remove invasive trees, shrubs and vines, produced in partnership with county extension programs.
• Two children’s books about responsible pet ownership and the hazards of aquarium dumping, in partnership with the University of Central Florida and Florida Sea Grant.
• A middle-school classroom curriculum, “Intruders in Paradise,” that is the first classroom module in Florida devoted exclusively to invasive plant and animals, in partnership with Florida Sea Grant.
• Diver’s Alert and Boater’s Alert laminated cards with photos of existing or potential marine invaders and where to report sightings.
• A popular Invasive Species Poetry Contest held in conjunction with TBEP’s 20th anniversary in 2011. The poetry contest received considerable publicity and submissions were compiled in an online booklet.
Additionally, TBEP’s Bay Mini-Grant Program has provided funding to homeowner associations, condominium associations and schools to remove invasive plants from common areas and pond or lake shorelines, and replace them with native plants. TBEP’s Give A Day For The Bay volunteer workday program focuses on removing
Citizens and scientists alike can report sightings of invasive species through the IveGot1 mobile phone app.
Ballast water discharged by ships is thought to be the source of the Asian green mussel (Perna viridis) in Tampa Bay. Photo courtesy Florida Sea Grant.
CHARTING THE COURSE: THE COMPREHENSIVE CONSERVATION AND MANAGEMENT PLAN FOR TAMPA BAY (AUGUST 2017 REVISION)
PAGE 125
Go to: TABLE OF CONTENTS | INDEX OF ACTIONS

INVA
SIVE
SPEC
IESinvasive plants at area parks and preserves.
The Florida Fish and Wildlife Conservation Commission (FWC) has dramatically expanded its invasive species outreach to Floridians, sponsoring or co-sponsoring innovative citizen involvement events like the Python Hunt in the Everglades and Lionfish Roundups around the state.
FWC also is utilizing citizen volunteers to assist with research into the distribution and ecological impacts of specific invaders, such as the Argentine tegu lizard, which has an established breeding population in Hillsborough County.
UF’s Institute of Food and Agricultural Sciences (UF/IFAS), and its affiliated Sea Grant and county extension programs, are important sources of research-based information. IFAS research has led to early success in using a biological control, the air potato beetle, to manage the highly invasive air potato vine. Local extension programs routinely educate residents about invasive plants and eco-friendly alternatives, as part of the Florida-Friendly Landscaping™ program.
New Partnership Promotes Regional Cooperation
The 2012 formation of a multi-county, multi-agency Suncoast Cooperative Invasive Species Management Area (CISMA) offers a promising forum for regional education and coordination among a diverse coalition of stakeholders. Sponsored by the multi-agency Florida Invasive Species Partnership, 17 regional CISMAs coordinate broad-based efforts to address invasive species issues across public and private boundaries. The Suncoast CISMA encompasses Pinellas, Hillsborough, Manatee and Sarasota counties. Members include local and state park and preserve staff, natural resource managers, researchers and education specialists.
CISMA’s early accomplishments include a successful Exotic Pet Amnesty Day; multi-agency, multi-jurisdictional workdays at parks
and preserves; public seminars on “invaders of interest” (such as channeled apple snails, tegu lizards and Japanese climbing fern); and creation of an initial inventory of existing educational materials produced by member organizations, including TBEP. CISMA also offered training opportunities that satisfied CEU requirements for field personnel.
Sustaining momentum and interest has been a challenge, as the CISMA has no formal funding or support; it is entirely a volunteer effort led by staff from the agencies, local governments and non-profit organizations that form its core membership. A formal commitment by policymakers or key managers in member organizations to allocate staff time for participation would be beneficial. This top-down support greatly contributed to the success of a similar group, the Hillsborough Invasive Species Task Force.
Collaborative and consistent messaging to successfully prevent or minimize the impacts of invasive plant and animals will remain a priority need, especially as new residents, unfamiliar with Florida’s unique climate and natural systems and extreme vulnerability to invaders, continue to move to the Tampa Bay region.
This action supports early detection networks and seeks to expand opportunities for scientists, resource managers, resource users and the public to share information about potentially devastating invasions and to work cooperatively to prevent or limit their ecological impact.
STRATEGY:Activity 1 Support continued operation of the Suncoast CISMA
or a similar regional alliance focused on invasive species research, management and education. Secure commitments from member organizations to actively participate in the CISMA. Explore potential for a key CISMA member to provide staff support for the group, including meeting organization and communication, on a long-term or rotating basis.
Responsible parties: All Suncoast CISMA partners, including TBEP
Timeframe: Ongoing. Strategy to formalize participation in CISMA developed in 2018, letters of commitment to be provided by end of 2019
Cost and potential funding sources: $ In-kind staff support from CISMA member organizations
Location: Baywide
Benefit/Performance measure: Stakeholder collaboration through maintenance of CISMA.
Results: Improved invasive species education, training and eradication.
Deliverables: Education and training materials.
Activity 2 Host, maintain and update a regional inventory of existing educational materials, via downloadable digital files, on a central website accessible to all. This could be done by expanding the existing Florida CISMA website, currently maintained by the University of Georgia’s Center for Invasive Species and Ecosystem Health, or via another existing or new website maintained by a local or regional organization such as USF’s web-based Water Atlas or the Science and Environment Council of Southwest Florida.
Responsible parties: Suncoast CISMA, TBEP, USF
Timeframe: Initial inventory compiled, organized and distributed by TBEP in 2013. Additional education materials identified for website inclusion
Exotic Pet Amnesty Days offer pet owners an opportunity to relinquish exotic animals, like this green iguana, they can no longer keep. The pets can be adopted by new owners pre-certified by state wildlife officials. Photo by Nanette O’Hara.
Brazilian pepper is a prolific plant invader of disturbed coastal habitats in the Tampa Bay watershed.
CHARTING THE COURSE: THE COMPREHENSIVE CONSERVATION AND MANAGEMENT PLAN FOR TAMPA BAY (AUGUST 2017 REVISION)
PAGE 126
Go to: TABLE OF CONTENTS | INDEX OF ACTIONS

INVA
SIVE
SPEC
IESby CISMA in 2015. Inventory should be updated every other year and posted on standalone or existing website starting in 2017
Cost and potential funding sources: $ Possible TBEP contribution via CWA Section 320 funds
Location: CISMA website
Benefit/Performance measure: Central website of regional inventory of educational materials addressing invasive species, accessible to citizens, scientists and resource managers.
Results: Improved sharing of educational materials will increase awareness of techniques for managing invasive species.
Deliverables: Central website.
Activity 3 Conduct a symposium to update our knowledge of existing or likely invasive plants and animals, innovative treatment and management technologies and monitoring needs. Provide recommendations for improved detection and monitoring of high-priority existing or potential invaders. Incorporate findings into existing bay monitoring programs to track the spread of existing invasive species and provide early warning of new invasive species.
Responsible parties: TBEP (lead), FWC, EPCHC, FDEP, U.S. Geological Survey, Florida Sea Grant, Port Tampa Bay, Port Manatee, local cities and counties
Timeframe: Symposium conducted in FY 2018-2019; monitoring recommendations incorporated beginning in FY 2019-2020
Cost and potential funding sources: $ TBEP contribution via CWA Section 320 funds.
Location: Baywide
Benefit/Performance measure: Regional symposium on invasive species.
Results: Technology transfer highlighting new technologies available to prevent, manage or eradicate invasive species. Monitoring recommendations can be incorporated into existing bay monitoring programs.
Deliverables: Symposium presentations and results of discussion posted on central website and published in a newsletter or other format for distribution.
Activity 4 Increase awareness and use of existing early warning tools by bay managers and citizens. Incorporate information about tools into existing educational initiatives. Make information available to outdoor enthusiasts at venues such as state and county parks and preserves, through ecotourism providers and municipal communication platforms, including websites and social media channels. Expand reporting tools available on mobile platforms and other appropriate platforms as they develop.
Responsible parties: TBEP, EPCHC, FWC, Suncoast CISMA, FDEP
Timeframe: Initiate in 2018 following symposium
Cost and potential funding sources: $ Possible TBEP contribution through CWA Section 320 funds.
Location: Baywide
Air potato beetles are a useful tool for biological control of air potato on both public and private lands. Photo courtesy Florida Invasive Species Partnership.
Benefit/Performance measure: Increased use of early warning tools.
Results: More widespread reporting will improve timely detection, allowing for rapid response and better management and eradication.
Deliverables: Educational materials.
Activity 5 Continue to provide seed funding for community-based invasive species education and removal initiatives, through the Bay Mini-Grants, Give A Day For The Bay workday program and TBEP outreach funds. Maximize cost-effectiveness by collaborating with others engaged in invasive species outreach, such as county extension programs and FWC.
Responsible parties: TBEP
Timeframe: Mini-Grants and Give A Day programs funded annually as appropriate projects and partnerships are identified
Cost and potential funding sources: $ TBEP funding for volunteer workdays and outreach programming via CWA Section 320. Funds for Bay Mini-Grants from sales of the Tampa Bay Estuary license plate
Location: Baywide
Benefit/Performance measure: Measurable removal of invasive species.
Results: Reduced abundance and extent of invasive species.
Deliverables: Annual volunteer workdays throughout the watershed.
Activity 6 Support continued research and implementation of appropriate biological controls for invasive plants, through UF/IFAS or other research institutes.
Responsible parties: Suncoast CISMA, FDEP, TBEP
Timeframe: Ongoing
CHARTING THE COURSE: THE COMPREHENSIVE CONSERVATION AND MANAGEMENT PLAN FOR TAMPA BAY (AUGUST 2017 REVISION)
PAGE 127
Go to: TABLE OF CONTENTS | INDEX OF ACTIONS

INVA
SIVE
SPEC
IESCost and potential funding sources: $ Potential funding through university appropriation, supplemented by external research grants to university researchers
Location: Baywide
Benefit/Performance measure: Increased identification and successful use of biological control methods, especially for invasive plants.
Results: Use of biological control methods will have less environmental impact and be more cost-effective than chemical controls.
Deliverables: New biological control methods.
1 Baker, P., Baker., S.M. and Fajans, J. 2004. Nonindigenous Marine Species in the Greater Tampa Bay Ecosystem. Literature Review and Field Survey of Tampa Bay for Nonindigenous Marine and Estuarine Species. Technical Report #02-04 of the Tampa Bay Estuary Program.
CHARTING THE COURSE: THE COMPREHENSIVE CONSERVATION AND MANAGEMENT PLAN FOR TAMPA BAY (AUGUST 2017 REVISION)
PAGE 128
Go to: TABLE OF CONTENTS | INDEX OF ACTIONS

PUBLIC EDUCATION AND INVOLVEMENT
PUBLIC EDUCATION AND INVOLVEMENTPromote public involvement in bay restoration and protection
At left: A volunteer plants salt marsh grass. TBEP Photo.
PE-1
OBJECTIVES: Increase direct citizen involvement in restoring and protecting Tampa Bay via volunteer programs that provide opportunities for citizens to participate in bay restoration, cleanup and monitoring.
STATUS: Ongoing. TBEP awards about $90,000 in grants annually to support volunteer-based environmental education and restoration projects. In addition, TBEP organizes about six volunteer work days each year for restoration projects at parks and preserves in the Tampa Bay watershed. Numerous non-profit and government partners sponsor environmental volunteer activities as well.
RELATED ACTIONS:BH-6 Encourage habitat
enhancement along altered waterfront properties
FW-1 Increase on-water enforcement of environmental regulations on the bay
PA-2 Provide for and manage recreational uses of the bay
PE-2 Promote public education about key issues affecting Tampa Bay
PH-4 Reduce fecal contamination from humans and pets in Tampa Bay Area waters
PH-5 Reduce pollution from recreational boaters
SW-1 Reduce nitrogen runoff from urban landscapes
SW-10 Expand use of Green Pnfrastructure practices
BACKGROUND:Direct community involvement in protecting the environment empowers citizens to become better stewards of the bay. Engaging citizens in restoring and protecting Tampa Bay can increase support for and confidence in government actions to fund and regulate natural resource protection. Furthermore, directly involving citizens in restoration provides critically needed labor and materials required to manage thousands of acres of land, wetlands and waters across the region. The Tampa Bay Estuary Program and its government and non-profit partners actively sponsor volunteer programs that provide opportunities for citizens to participate in bay restoration, cleanup and monitoring.
The TBEP Bay Mini-Grant program fosters public participation in bay restoration by awarding grants of up to $5,000 to neighborhoods, schools and non-profit organizations for environmental education, restoration and pollution prevention projects. The grant funds are generated by sales of the Tampa Bay Estuary license plate; more than $1.6 million has been distributed to the community as of 2015.
On average, 20 projects are funded each year with about $90,000 in grants, including habitat restoration projects such as stormwater pond improvements, removal of invasive plants and shoreline plantings. Projects typically occur in neighborhoods, schools or on publicly owned lands. A “Golden Mangrove Award” is given every year to the outstanding Mini-Grant project, as determined by the TBEP Community Advisory Committee (CAC).
In 2015, the CAC embarked on its own initiative to build connections with local college students, both to increase appreciation of the bay’s value and to involve more college students in bay clean-up and restoration (see Action PE-2).
TBEP also organizes the Give A Day For The Bay volunteer program. Each year, workdays involving about 250 volunteers are held at parks and preserves across the watershed. Activities include invasive plant removal, oyster reef building, planting native shoreline plants and trail maintenance. In FY 2015, Give A Day volunteers restored 12 acres, removing 2000 pounds of invasive plants, installing 15,000 plants, creating 150 linear feet of shoreline and building 1,600 square feet of oyster reefs with 20 tons of shell. TBEP works with local non-
David Westmark, a member of TBEP’s Community Advisory Committee, cleans out a trash-collecting “Water Goat” on Bayboro Harbor in St. Petersburg.
CHARTING THE COURSE: THE COMPREHENSIVE CONSERVATION AND MANAGEMENT PLAN FOR TAMPA BAY (AUGUST 2017 REVISION)
PAGE 129
Go to: TABLE OF CONTENTS | INDEX OF ACTIONS
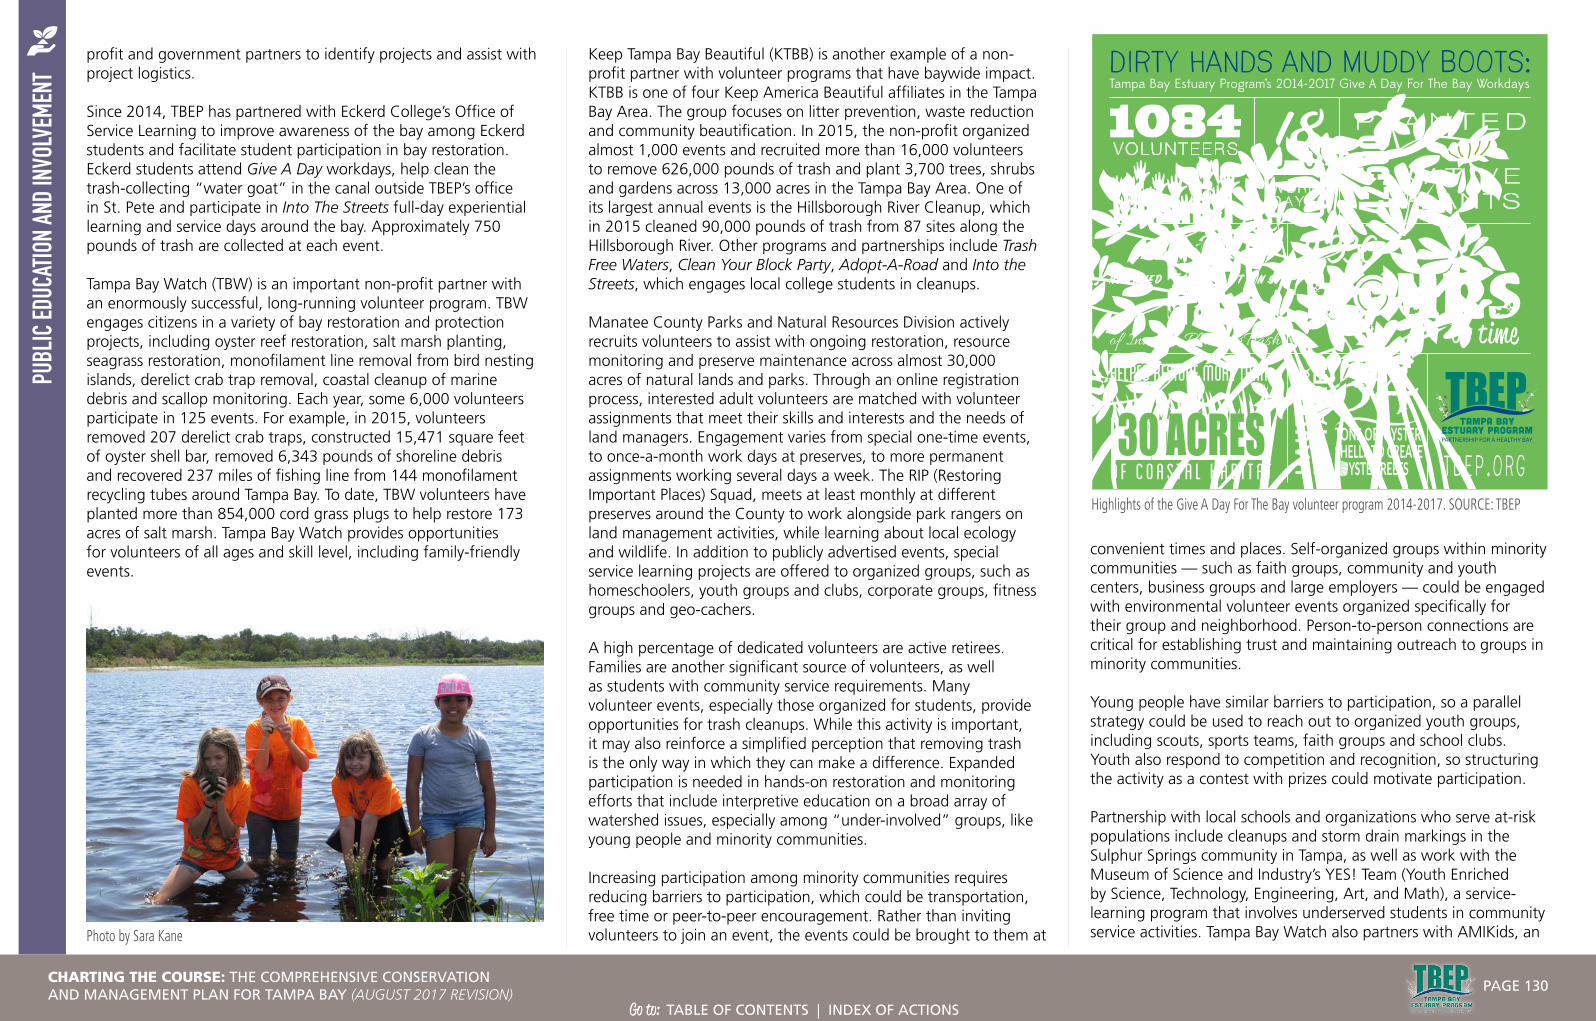
PUBL
IC ED
UCAT
ION
AND
INVO
LVEM
ENT
profit and government partners to identify projects and assist with project logistics.
Since 2014, TBEP has partnered with Eckerd College’s Office of Service Learning to improve awareness of the bay among Eckerd students and facilitate student participation in bay restoration. Eckerd students attend Give A Day workdays, help clean the trash-collecting “water goat” in the canal outside TBEP’s office in St. Pete and participate in Into The Streets full-day experiential learning and service days around the bay. Approximately 750 pounds of trash are collected at each event.
Tampa Bay Watch (TBW) is an important non-profit partner with an enormously successful, long-running volunteer program. TBW engages citizens in a variety of bay restoration and protection projects, including oyster reef restoration, salt marsh planting, seagrass restoration, monofilament line removal from bird nesting islands, derelict crab trap removal, coastal cleanup of marine debris and scallop monitoring. Each year, some 6,000 volunteers participate in 125 events. For example, in 2015, volunteers removed 207 derelict crab traps, constructed 15,471 square feet of oyster shell bar, removed 6,343 pounds of shoreline debris and recovered 237 miles of fishing line from 144 monofilament recycling tubes around Tampa Bay. To date, TBW volunteers have planted more than 854,000 cord grass plugs to help restore 173 acres of salt marsh. Tampa Bay Watch provides opportunities for volunteers of all ages and skill level, including family-friendly events.
Keep Tampa Bay Beautiful (KTBB) is another example of a non-profit partner with volunteer programs that have baywide impact. KTBB is one of four Keep America Beautiful affiliates in the Tampa Bay Area. The group focuses on litter prevention, waste reduction and community beautification. In 2015, the non-profit organized almost 1,000 events and recruited more than 16,000 volunteers to remove 626,000 pounds of trash and plant 3,700 trees, shrubs and gardens across 13,000 acres in the Tampa Bay Area. One of its largest annual events is the Hillsborough River Cleanup, which in 2015 cleaned 90,000 pounds of trash from 87 sites along the Hillsborough River. Other programs and partnerships include Trash Free Waters, Clean Your Block Party, Adopt-A-Road and Into the Streets, which engages local college students in cleanups.
Manatee County Parks and Natural Resources Division actively recruits volunteers to assist with ongoing restoration, resource monitoring and preserve maintenance across almost 30,000 acres of natural lands and parks. Through an online registration process, interested adult volunteers are matched with volunteer assignments that meet their skills and interests and the needs of land managers. Engagement varies from special one-time events, to once-a-month work days at preserves, to more permanent assignments working several days a week. The RIP (Restoring Important Places) Squad, meets at least monthly at different preserves around the County to work alongside park rangers on land management activities, while learning about local ecology and wildlife. In addition to publicly advertised events, special service learning projects are offered to organized groups, such as homeschoolers, youth groups and clubs, corporate groups, fitness groups and geo-cachers.
A high percentage of dedicated volunteers are active retirees. Families are another significant source of volunteers, as well as students with community service requirements. Many volunteer events, especially those organized for students, provide opportunities for trash cleanups. While this activity is important, it may also reinforce a simplified perception that removing trash is the only way in which they can make a difference. Expanded participation is needed in hands-on restoration and monitoring efforts that include interpretive education on a broad array of watershed issues, especially among “under-involved” groups, like young people and minority communities.
Increasing participation among minority communities requires reducing barriers to participation, which could be transportation, free time or peer-to-peer encouragement. Rather than inviting volunteers to join an event, the events could be brought to them at
convenient times and places. Self-organized groups within minority communities — such as faith groups, community and youth centers, business groups and large employers — could be engaged with environmental volunteer events organized specifically for their group and neighborhood. Person-to-person connections are critical for establishing trust and maintaining outreach to groups in minority communities.
Young people have similar barriers to participation, so a parallel strategy could be used to reach out to organized youth groups, including scouts, sports teams, faith groups and school clubs. Youth also respond to competition and recognition, so structuring the activity as a contest with prizes could motivate participation.
Partnership with local schools and organizations who serve at-risk populations include cleanups and storm drain markings in the Sulphur Springs community in Tampa, as well as work with the Museum of Science and Industry’s YES! Team (Youth Enriched by Science, Technology, Engineering, Art, and Math), a service-learning program that involves underserved students in community service activities. Tampa Bay Watch also partners with AMIKids, an Photo by Sara Kane
Highlights of the Give A Day For The Bay volunteer program 2014-2017. SOURCE: TBEP
CHARTING THE COURSE: THE COMPREHENSIVE CONSERVATION AND MANAGEMENT PLAN FOR TAMPA BAY (AUGUST 2017 REVISION)
PAGE 130
Go to: TABLE OF CONTENTS | INDEX OF ACTIONS

PUBL
IC ED
UCAT
ION
AND
INVO
LVEM
ENT
alternative education program offering experiential training and activities associated with marine industries.
Rollout of a 2-year Let’s Move! Outside initiative in Tampa Bay occurred in 2016. Led by the U.S. Department of Interior and facilitated by public-private partnerships at all levels of government, Let’s Move! Outside inspires millions of young people to play, learn, serve and work outdoors. A major goal is to involve urban and underserved communities in outdoor activities on public lands (including trails, parks, playgrounds and green spaces) which promote health and wellness. This promising collaboration may help environmental groups increase diversity in their volunteer programs, by connecting Boys and Girls Clubs, YMCAs and community centers with state and local parks and preserves.
Recognition also is an important component of successful volunteer programs, through volunteer appreciation events or awards. TBEP honors outstanding volunteers annually. Tampa Bay Watch, the Keep America Beautiful affiliates, The Florida Aquarium and many other organizations have annual volunteer awards and/or thank-you events.
STRATEGY:Activity 1 Continue to provide opportunities for hands-on citizen
involvement in bay restoration. Participate in initiatives such as Let’s Move! Outside to expand participation by youth and minority communities.
Responsible parties: U.S. Department of Interior, TBEP, Tampa Bay Watch, Keep America Beautiful affiliates, local governments
Timeframe: Ongoing
Cost and potential funding sources: $–$$$ Section 320 CWA funds for TBEP activities, non-profit organizations receive funding from memberships, donations and grants
Location: Baywide
Benefit/Performance measure: Varied hands-on volunteer activities with a diverse volunteer base that helps implement restoration and conservation goals.
Results: Citizen engagement will build community support for Tampa Bay environmental stewardship
and contribute valuable labor resources.
Deliverables: Volunteer-based restoration and conservation activities organized and completed by TBEP and partners.
Activity 2 Continue to support community-level restoration and improvement activities through the Bay Mini-Grant program. Coordinate grants with resource managers and Management Board members to ensure projects have net environmental benefit and do not conflict with local government objectives. Continue to explore ways to involve diverse segments of the community in grant submissions and implementation.
Responsible parties: TBEP
Timeframe: Ongoing
Cost and potential funding sources: $$ Tampa Bay Estuary license plate fund
Location: Baywide
Benefit/Performance measure: Percent of Bay Mini-Grants completed and final reports submitted. Percent of grants awarded to recipients representing or involving key underserved, under-involved communities.
Results: Completion of community-based restoration, education and pollution prevention projects that directly contribute to attainment of CCMP habitat and water quality goals.
Deliverables: Final reports from completed grant projects detailing expenditures, volunteer engagement and measurable results.
Activity 3 Implement the CAC Action Plan to increase engagement and environmental volunteerism among college students. Encourage and support volunteerism from community and corporate groups. Provide opportunities for out-of-state or international students and visitors to participate in bay restoration.
Responsible parties: TBEP CAC (for implementation of CAC Action Plan), non-profits, educational institutions and local parks and preserve programs for broad-based volunteer initiatives
Timeframe: Initiative launched in 2015, implementation ongoing, aided by development of a strategic communications plan in 2016 and 2017
Cost and potential funding sources: $$ unencumbered Tampa Bay Estuary license plate funds to support development of Communications Plan
Location: Baywide
Benefit/Performance measure: Number of students involved in TBEP or partner volunteer workdays. Number of colleges represented by student volunteers.
Results: Increased participation of college students in bay improvement activities, fostering their continued involvement in community service after graduation as young working adults in the Tampa Bay region or wherever they may relocate.
Deliverables: Annual report highlighting CAC progress toward implementation of Action Plan.
Give A Day For The Bay volunteers often remove invasive plants like air potato from area preserves. TBEP Photo.
CHARTING THE COURSE: THE COMPREHENSIVE CONSERVATION AND MANAGEMENT PLAN FOR TAMPA BAY (AUGUST 2017 REVISION)
PAGE 131
Go to: TABLE OF CONTENTS | INDEX OF ACTIONS

PUBLIC EDUCATION AND INVOLVEMENT
PUBLIC EDUCATION AND INVOLVEMENTPromote public education about key issues affecting the bay
At left: Teachers use dip nets to collect fish and shellfish from waters around Weedon Island Preserve as part of a training workshop sponsored by TBEP.
PE-2
OBJECTIVES: Educate citizens about key problems facing the bay and how they can participate in solutions.
STATUS: Ongoing. TBEP has implemented regional education campaigns addressing invasive plants and animals; bay-friendly boating; manatee protection; pet waste disposal; and fertilizer use. TBEP’s varied communication tools have included boating guides; doorhangers; posters; children’s books; classroom teaching modules; field trips and workshops on specific topics; and a host of social media tools. TBEP has been a regional leader in development of educational programs utilizing principles of social marketing to drive behavior change.
RELATED ACTIONS:BH-6 Encourage habitat
enhancement along altered waterfront properties
FW-1 Increase on-water enforcement of environmental regulations on the bay
PA-2 Provide for and manage recreational uses of the bay
PE-1 Promote public involvement in bay restoration and protection
PH-4 Reduce fecal contamination from humans and pets in Tampa Bay Area waters
PH-5 Reduce pollution from recreational boaters
SW-1 Reduce nitrogen runoff from urban landscapes
SW-10 Expand use of Green Infrastructure practices
SW-8 Expand adoption and implementation of Best Management Practices for commercial and urban agriculture
WW-2 Extend central sewer service to priority areas now served by septic systems
WW-5 Reduce the occurrence of municipal sewer overflows to the bay
BACKGROUND:The Tampa Bay Estuary Program continues to emphasize the importance of environmental education to the long-term health of the bay by creating a constituency of informed, involved citizens. This mission is aided by a Community Advisory Committee (CAC) composed of residents from a variety of backgrounds and interests who support TBEP’s community outreach.
With limited staff and financial resources, TBEP has adopted a strategic approach to educational programming:
• Identify and close gaps in environmental education
• Emphasize cost-effectiveness
• Maximize partnerships
This three-pronged guidance has allowed TBEP to develop highly focused, innovative and measurable education programs, including the Pooches for the Planet pet waste disposal initiative, the Be Floridian fertilizer education campaign, and most
recently, #LoveTampaBay, a multimedia social sharing campaign.
Closing Gaps in Educational Programming
TBEP strives to avoid duplication of educational programming already being successfully delivered by other agencies or organizations with greater personnel and financial resources. Instead, TBEP focuses on audiences and issues that other organizations are not addressing, specifically emerging issues that have been identified as important to bay improvement. In this way, TBEP’s efforts serve as pilot or foundational programs that can be adopted and adapted by TBEP partners.
Recent examples of key issues for which TBEP has provided regional leadership in education include:
• Be Floridian Fertilizer Education Campaign
TBEP was tasked by its Policy Board to develop a regional campaign to support local fertilizer ordinances. Be Floridian implemented and evaluated a 5-year behavior change marketing campaign in Manatee, Pinellas and Tampa using multiple
Estuary Academy participants learn how to build and operate simple Remote Underwater Vehicles. TBEP Photo.
CHARTING THE COURSE: THE COMPREHENSIVE CONSERVATION AND MANAGEMENT PLAN FOR TAMPA BAY (AUGUST 2017 REVISION)
PAGE 132
Go to: TABLE OF CONTENTS | INDEX OF ACTIONS

PUBL
IC ED
UCAT
ION
AND
INVO
LVEM
ENT
tools — including billboards, bus wraps, digital ads and retail store outreach — to reduce use of nitrogen lawn and landscape fertilizers in the summer rainy season. The campaign has since been adopted by Pinellas and Sarasota counties, and the Indian River Lagoon watershed, with elements incorporated in other statewide and national stormwater education programs. (see Action SW-1).
• Pooches for the Planet Pet Waste Education
This innovative campaign encourages dog owners to bag and properly dispose of pet waste to prevent harmful bacteria and excess nutrients from entering the bay (see Action PH-4). The campaign utilized pledges, signs, pet waste bag stations, partnerships with animal shelters, pet-related businesses and neighborhoods, direct outreach to veterinary clinics, and GPS mapping of dog waste piles in several parks and preserves to document a positive change over time as a result of these educational efforts.
• Wild and Wonderful Tampa Bay Training Workshops for Recreation Departments
TBEP developed a one-week module for recreation department summer camps using fun, hands-on activities to provide basic information about our local environment, and individual actions to protect it, to urban kids who might not otherwise have access to these lessons (see Action PE-1). TBEP also held workshops to train recreation department instructors and other informal environmental educators in using the module and activities.
Emphasizing Cost-Effectiveness
TBEP’s outreach has always sought to be cost-effective. In recent years, evolving digital technology has led to a dramatic shift in the way people receive and share information. TBEP now prints far fewer educational materials such as brochures, boating guides and teacher curricula, and makes most new materials available exclusively via the web.
Entire campaigns have and will continue to rely primarily on multimedia web delivery, with increasing use of mobile-friendly design, applications and social media platforms to deliver messaging that targets specific audiences. Social research prior to campaign development, testing of message effectiveness
and evaluation/modification to ensure success are cost-effective investments that ensure TBEP education efforts are reaching the appropriate audience and making a measurable difference. For example, Be Floridian targeted its messages to homeowners who maintain their own yards or pay a landscape professional to do so.
The #LoveTampaBay campaign, launched in late 2016, is exclusively a digital initiative to boost awareness of the bay’s prominent role in our economic and emotional well-being. A simple, visually compelling interactive website houses digital postcards of people and places in Tampa Bay, grouped around five major themes (Community, Science, Jobs, Art and Home). Users can share these postcards on social media platforms, and also upload and share their own images to the website, cell phones and tablets.
Maximizing Partnerships
TBEP seeks out and collaborates with partners who have specific expertise and resources to contribute to key education initiatives. These partnerships amplify and expand the reach of our messaging, while ensuring a strong scientific foundation.
A recent example is Eyes On The Bay (see Action IS-2). TBEP developed this comprehensive, multi-year project to enlist citizens’
help in preventing and managing plant and animal bio-invasions. Eyes On The Bay targeted specific audiences with tailored information and tools. Products included:
• A compact, spiral-bound field guide to invasive plants in the bay watershed;
• The Wicked Weeds DVD for homeowners with step-by-step instruction in eradicating common backyard invasive plants;
• Laminated Boaters Alert and Divers Alert waterproof cards for boaters and divers on existing and potential marine invaders, with info on how to report sightings;
• Intruders in Paradise, an in-depth classroom module for middle-school students; and
• Two children’s books about the hazards of dumping aquarium fish into marine waters, one for children in pre-K through 2nd grade, and the other for grades 3-5.
Key partners joining TBEP in development and distribution of these products included Florida Sea Grant, Hillsborough County Extension, the University of Central Florida, the Florida Native Plant Society and the Hillsborough Invasive Species Task Force.
CAC Action Plan
TBEP’s Community Advisory Committee provides important support for educational efforts. CAC members contribute a wide range of services, such as:
• Reviewing Bay Mini-Grant applications annually;
• Selecting the winner of the Golden Mangrove award for most outstanding Mini-Grant project;
• Participating in Give A Day For The Bay workdays;
TBEP’s Bay Mini-Grant program provides funding for community-based restoration and education programs, including hands-on learning opportunities for children.
A high school teaching module brought TBEP’s hour-long documentary film, “Tampa Bay: A Living Legacy” into area classrooms.
CHARTING THE COURSE: THE COMPREHENSIVE CONSERVATION AND MANAGEMENT PLAN FOR TAMPA BAY (AUGUST 2017 REVISION)
PAGE 133
Go to: TABLE OF CONTENTS | INDEX OF ACTIONS

PUBL
IC ED
UCAT
ION
AND
INVO
LVEM
ENT
• Representing TBEP at tabling events such as community festivals;
• Providing input on TBEP goals and programs; and
• Serving as a liaison between the Program and the public.
CAC members may be appointed by Policy Board members, or elected to at-large posts by the committee members. A maximum of 27 CAC members are allowed. In 2015, Policy Board approved the CAC’s proposal to develop a specific plan to engage local students in volunteering to improve the bay. CAC members are currently building a pilot community engagement effort to involve Eckerd College students in bay restoration. Long-range goals are for this effort to become a self-sustaining partnership and continue to find partners at local universities (see Action PE-1).
In 2017, as part of its Strategic Plan, TBEP contracted an evaluation of the effectiveness of the Program’s education and outreach. Recommendations will be considered by Policy Board as part of a 5-Year Communication Plan for priorities and CAC involvement.
As education will always be needed, this action should remain in the CCMP in perpetuity. Future implementation should capitalize on existing programs and partnerships wherever possible, but TBEP should also continue its leadership role in identifying areas of need and developing innovative, effective and measurable programs to inform citizens about the bay and involve them in its protection.
STRATEGY:Activity 1 Continue to provide education and key messages
tailored to the demographic, cultural and generational characteristics of key audiences, utilizing social science research methods to analyze and understand audiences and develop messages. Improve evaluation of the effectiveness of products and programs. Implement a long-range Communications Plan to assist in prioritizing and implementing educational programs and enlisting partners, including the CAC.
Responsible parties: TBEP, TBEP Community Advisory Committee
Timeframe: Communications Plan to be finalized in 2017
Cost and potential funding sources: $-$$$ CWA
Section 320 funds, federal or state education grants
Location: Baywide
Benefit/Performance measure: Number of people reached. Number of people engaging in recommended behaviors.
Results: Educational programs that engage diverse audiences in meaningful, relevant and measurable ways.
Deliverables: Approved Communications Plan. Communication tools such as websites, online guides and web-based multimedia materials targeting key audiences. Social media channels, short videos.
Activity 2 Continue to deliver targeted messages via diverse methods to diverse audiences by incorporating evolving communication tools to reach people effectively, including expanded use of platforms and applications designed for mobile devices, video storytelling and learning, mapping and virtual reality experiences. Coordinate and share lessons learned and new technologies through a regional education group.
Responsible parties: TBEP, FWC, FDEP, EPCHC, FIO, The Florida Aquarium, local cities and counties with environmental education programs; TBRPC Agency on Bay Management Public Information Committee could assist with regional coordination
Timeframe: Ongoing
Cost and potential funding sources: $-$$ CWA Section 320 funds
Location: Baywide
Benefit/Performance measure: Number of people reached. Number of people engaging in recommended behaviors.
Results: Increased cost-efficiency and overall effectiveness of educational programming.
Deliverables: Evaluation summaries analyzing audiences reached and success of various communication tools and programs for informing and fostering behavior changes to benefit the bay.
Activity 3 Expand availability of educational messaging in Spanish or other languages as appropriate to target key demographic sectors in the Tampa Bay community.
Responsible parties: TBEP, FWC, FDEP, EPCHC, local cities and counties
Timeframe: Ongoing
Cost and potential funding sources: $-$$ CWA Section 320 funds
Location: Baywide
Benefit/Performance measure: Number of products and programs available in Spanish and other languages.
Results: Educational programming that reaches the full diversity of the Tampa Bay community.
Deliverables: Communication and education programs and tools in multiple languages.
Activity 4 Allocate a portion of the annual Bay Mini-Grant funding to help meet priority outreach needs identified
TBEP has supported production of several educational materials in Spanish, including this Boating Guide to Hillsborough Bay.
CHARTING THE COURSE: THE COMPREHENSIVE CONSERVATION AND MANAGEMENT PLAN FOR TAMPA BAY (AUGUST 2017 REVISION)
PAGE 134
Go to: TABLE OF CONTENTS | INDEX OF ACTIONS

PUBL
IC ED
UCAT
ION
AND
INVO
LVEM
ENT
in TBEP’s Communications Plan and Workplan. See Action FW-1 for recommendation to allocate percentage of Mini-Grants to address management of imperiled species in bay watershed, including education about them.
Responsible parties: TBEP, TBEP’s Community Advisory Committee
Timeframe: Beginning in 2018
Cost and potential funding sources: $–$$ Revenues from sales of Tampa Bay Estuary License Plate
Location: Baywide
Benefit/Performance measure: Percentage of Bay Mini-Grant funding dedicated to priority needs.
Results: Implementation of priority educational initiatives.
Deliverables: Final reports from each Mini-Grant recipient summarizing project, community involvement, educational metrics achieved and environmental benefits.
CHARTING THE COURSE: THE COMPREHENSIVE CONSERVATION AND MANAGEMENT PLAN FOR TAMPA BAY (AUGUST 2017 REVISION)
PAGE 135
Go to: TABLE OF CONTENTS | INDEX OF ACTIONS

PUBLICACCESS
PUBLIC ACCESSProvide for and manage recreational uses of the bay
Fishing from boats, kayaks, piers or shore is the most popular water-based recreational activity in the bay area. Photo by Neil Taylor.
PA-1
OBJECTIVES:Provide adequate and appropriate public access to the bay, and support responsible recreational use and enjoyment.
STATUS:New Action
RELATED ACTIONS:BH-3 Reduce propeller scarring of
seagrass and pursue seagrass transplanting opportunities
BH-4 Identify hard bottom communities and avoid impacts
COC-4 Identify and understand emerging contaminants
FW-1 Increase on-water enforcement of environmental regulations
FW-6 Preserve the diversity and abundance of bay wildlife
PE-1 Promote public involvement in bay restoration and protection
PE-2 Promote public education about key issues affecting Tampa Bay
PH-5 Reduce pollution from recreational boaters
BACKGROUND: Tampa Bay is renowned for its spectacular waters, bay habitats and fish and wildlife. It provides popular recreational opportunities to residents and visitors alike and is foundational to the community’s quality of life. Every year, outdoor recreation in Florida generates over $38 billion in consumer spending, resulting in over 329,000 direct jobs, $10.7 billion in wages and
salaries and $2.5 billion in state and local taxes.1,2
Almost 3 million residents call the Tampa-St. Petersburg-Clearwater Metropolitan Area home.3 Another 5 million people visit the area each year. Continued growth of resident and tourist populations will create challenges for managers to ensure adequate and appropriate public access, while managing suitable and responsible recreational uses, natural resource protection and user conflicts.
Public Access
Providing adequate and appropriate access to recreational opportunities in Tampa Bay is essential to supporting the economy and quality of life of residents. Nurturing interest and personal connections to the bay is important to building public support and partnerships for community-based stewardship. In addition, preserving coastal habitats and open space will be critical over the long term for maintaining options to adapt and respond to sea level rise and other climate change stressors.
Private ownership and development of bay shorelines must be balanced with adequate opportunities for public access in appropriate locations. Recreational opportunities should be accessible to residents of all physical abilities and income levels; important
fishing piers and shoreline fishing areas, for example, have been lost in recent years, decreasing opportunities for anglers without boats.
Cities like Tampa, Bradenton and St. Petersburg are leveraging their public waterfronts as recreational and cultural centerpieces and seeking to expand access to them. Use of the area’s impressive network of city, county, and state parks and conservation lands is increasing as the region’s population surges. Encroaching development presents challenges in maintaining the integrity of these green spaces. Furthermore, conservation and recreation lands are often managed by the same staff, creating potential conflicts in stewardship of those lands.
Acquisition of Parks and Preserves
The State of Florida, Southwest Florida Water Management District (SWFWMD) and local government land-buying programs in Hillsborough, Pinellas, Manatee and Pasco Counties work to secure public access and responsible recreational opportunities in Tampa Bay.
Multi-use paved trails open scenic bay vistas to cyclists, runners and walkers.
CHARTING THE COURSE: THE COMPREHENSIVE CONSERVATION AND MANAGEMENT PLAN FOR TAMPA BAY (AUGUST 2017 REVISION)
PAGE 136
Go to: TABLE OF CONTENTS | INDEX OF ACTIONS

PUBL
IC AC
CESS
The State of Florida has a long history of citizen-driven and bipartisan political support for purchasing conservation land.4 The Florida Legislature created the Land Acquisition Trust Fund in 1963 to acquire and improve natural areas, including conservation easements, wildlife management areas, wetlands, forests, beaches and shores, recreation trails and parks, urban open space and lands protecting water. The Fund also improves public access and recreational use of conservation lands.
Florida Forever, the state’s signature conservation and recreation lands acquisition program, together with its predecessor Preservation 2000, has purchased more than 2.4 million acres of environmentally sensitive and recreational lands. On average, these programs spent $275 million a year from 1990 to 2008. In 2009, the Legislature did not fund Florida Forever, and between then and 2016 an average of only $129 million per year has been allocated to the program, despite a large back-log of priority projects.
In 2014, seeking to restore greater funding for acquiring conservation lands, 75% of Florida voters approved an amendment to the Florida Constitution to direct 33% of net revenue from the existing excise tax on documents to the Land Acquisition Trust Fund. Despite this historic intervention, funding for acquisition and restoration of conservation and recreation lands has not increased.
In recent years, most acquisition within the Tampa Bay watershed has been accomplished by Southwest Florida Water Management District (SWFWMD) or local government partners:
• Every year, about 2.5 million people visit public conservation lands acquired by the SWFWMD and its partners to protect Florida’s water resources. Many state and local parks are owned by SWFWMD and managed cooperatively for recreational uses with local or state government agencies. Those uses are as wide-ranging as hunting, hiking, wildlife watching, bicycling and picnicking.
• Hillsborough County’s nationally recognized, voter-approved Jan K. Platt Environmental Lands Acquisition and Protection Program (ELAPP) manages more than 61,000 acres of environmentally sensitive wildlife habitat and corridors. ELAPP is the largest local environmental land acquisition program in Florida.
• Manatee County has provided notable leadership in expanding its popular network of coastal nature preserves, such as Perico, Robinson, Neal, Rye and others. Manatee also has constructed dedicated nature centers that offer
citizens opportunities to learn about and enjoy bay habitats and wildlife.
• Pinellas County has a parks network that is a model nationwide, and its two major preserves, Brooker Creek and Weedon Island, provide access to the largest remaining tracts of undeveloped land in the county. Large education centers at Brooker Creek and Weedon Island deliver a variety of educational programs and guided outdoor experiences, and support training for citizen-science monitoring efforts. In FY 2015, Brooker Creek Preserve hosted 21,158 visitors to its Education Center and 6,315 program attendees. Weedon Island Preserve hosted 12,391 visitors at the Education Center and 5,114 program participants.
Water Access via Boat and Kayak Launches
Boat ramps are typically funded by local governments and the state Boating Improvement Trust Fund. Local governments have expanded existing ramps with additional launch bays (e.g., Fort De Soto and Salty Sol at Gandy Bridge); however, on fair-weather weekends the ramps are often full to capacity, so more ramp capacity or additional access points will be needed to satisfy demand.
The Florida Fish and Wildlife Conservation Commission (FWC) maintains an online Public Boat Ramp Finder, which provides important information for hundreds of boat ramps in Florida. The Finder includes information about 44 ramps in Pinellas County, 22 in Manatee County, 33 in Hillsborough County and 13 in Pasco County. The Tampa Bay Boating and Angling Guide also lists boat ramps and marinas. Bay Area counties provide web-based maps and information about paddling trails and kayak launch sites.
FWC’s Boating and Waterways Section works to identify sites for potential new boat ramps and those in need of renovation or expansion. FWC also builds and renovates boat ramps on state-
owned lands and administers grant programs for ramps and other boating-related activities. Identifying sites for new boat ramps must take into consideration potential impacts to adjacent natural areas, as well as proper storage of waste, fuels and oil from vessels (see Action PH-5). Prioritizing areas where shoreline or development impacts have already occurred is one solution.
The federal Sport Fish Restoration Act uses taxes collected on fishing tackle and motor fuels and import duties on tackle and yachts to fund research, management and development of activities related to sport fishing and boater access. Federal law stipulates that 15% of these funds go to building and repairing boat ramps. Some funds are also used for boater and angler education.
Responsible Enjoyment of the Bay
A wide range of recreational opportunities exist in Tampa Bay, including wildlife viewing and photography, boating, kayaking, paddle-boarding, fishing, diving and snorkeling. Public land managers address issues as diverse as illegal hunting and fishing; damage to plant and wildlife from users who ignore access restrictions and stray from marked trails; illegal dumping; and release of unwanted pets and/or invasive species into conservation areas. Emerging issues include use of drones that may disturb wildlife or recreational users.
Kayakers explore Clam Bayou, a restored habitat spanning Gulfport and St. Petersburg. Photo by Marcia Biggs
CHARTING THE COURSE: THE COMPREHENSIVE CONSERVATION AND MANAGEMENT PLAN FOR TAMPA BAY (AUGUST 2017 REVISION)
PAGE 137
Go to: TABLE OF CONTENTS | INDEX OF ACTIONS
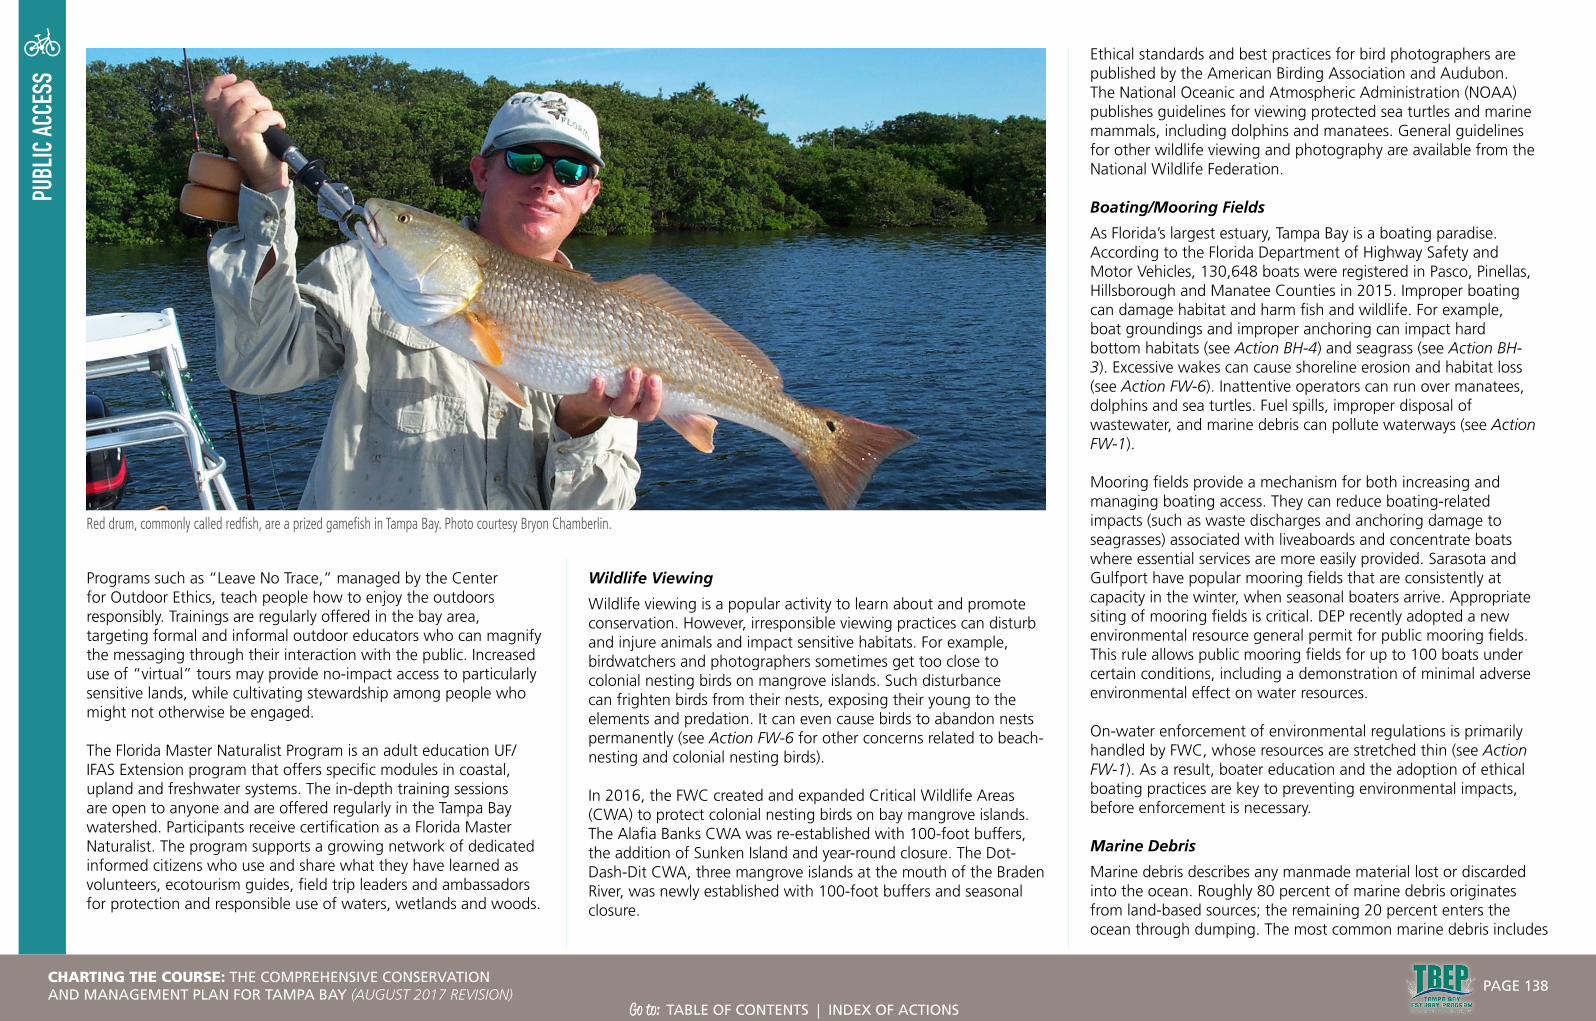
PUBL
IC AC
CESS
Programs such as “Leave No Trace,” managed by the Center for Outdoor Ethics, teach people how to enjoy the outdoors responsibly. Trainings are regularly offered in the bay area, targeting formal and informal outdoor educators who can magnify the messaging through their interaction with the public. Increased use of “virtual” tours may provide no-impact access to particularly sensitive lands, while cultivating stewardship among people who might not otherwise be engaged.
The Florida Master Naturalist Program is an adult education UF/IFAS Extension program that offers specific modules in coastal, upland and freshwater systems. The in-depth training sessions are open to anyone and are offered regularly in the Tampa Bay watershed. Participants receive certification as a Florida Master Naturalist. The program supports a growing network of dedicated informed citizens who use and share what they have learned as volunteers, ecotourism guides, field trip leaders and ambassadors for protection and responsible use of waters, wetlands and woods.
Wildlife Viewing
Wildlife viewing is a popular activity to learn about and promote conservation. However, irresponsible viewing practices can disturb and injure animals and impact sensitive habitats. For example, birdwatchers and photographers sometimes get too close to colonial nesting birds on mangrove islands. Such disturbance can frighten birds from their nests, exposing their young to the elements and predation. It can even cause birds to abandon nests permanently (see Action FW-6 for other concerns related to beach-nesting and colonial nesting birds).
In 2016, the FWC created and expanded Critical Wildlife Areas (CWA) to protect colonial nesting birds on bay mangrove islands. The Alafia Banks CWA was re-established with 100-foot buffers, the addition of Sunken Island and year-round closure. The Dot-Dash-Dit CWA, three mangrove islands at the mouth of the Braden River, was newly established with 100-foot buffers and seasonal closure.
Ethical standards and best practices for bird photographers are published by the American Birding Association and Audubon. The National Oceanic and Atmospheric Administration (NOAA) publishes guidelines for viewing protected sea turtles and marine mammals, including dolphins and manatees. General guidelines for other wildlife viewing and photography are available from the National Wildlife Federation.
Boating/Mooring Fields
As Florida’s largest estuary, Tampa Bay is a boating paradise. According to the Florida Department of Highway Safety and Motor Vehicles, 130,648 boats were registered in Pasco, Pinellas, Hillsborough and Manatee Counties in 2015. Improper boating can damage habitat and harm fish and wildlife. For example, boat groundings and improper anchoring can impact hard bottom habitats (see Action BH-4) and seagrass (see Action BH-3). Excessive wakes can cause shoreline erosion and habitat loss (see Action FW-6). Inattentive operators can run over manatees, dolphins and sea turtles. Fuel spills, improper disposal of wastewater, and marine debris can pollute waterways (see Action FW-1).
Mooring fields provide a mechanism for both increasing and managing boating access. They can reduce boating-related impacts (such as waste discharges and anchoring damage to seagrasses) associated with liveaboards and concentrate boats where essential services are more easily provided. Sarasota and Gulfport have popular mooring fields that are consistently at capacity in the winter, when seasonal boaters arrive. Appropriate siting of mooring fields is critical. DEP recently adopted a new environmental resource general permit for public mooring fields. This rule allows public mooring fields for up to 100 boats under certain conditions, including a demonstration of minimal adverse environmental effect on water resources.
On-water enforcement of environmental regulations is primarily handled by FWC, whose resources are stretched thin (see Action FW-1). As a result, boater education and the adoption of ethical boating practices are key to preventing environmental impacts, before enforcement is necessary.
Marine Debris
Marine debris describes any manmade material lost or discarded into the ocean. Roughly 80 percent of marine debris originates from land-based sources; the remaining 20 percent enters the ocean through dumping. The most common marine debris includes
Red drum, commonly called redfish, are a prized gamefish in Tampa Bay. Photo courtesy Bryon Chamberlin.
CHARTING THE COURSE: THE COMPREHENSIVE CONSERVATION AND MANAGEMENT PLAN FOR TAMPA BAY (AUGUST 2017 REVISION)
PAGE 138
Go to: TABLE OF CONTENTS | INDEX OF ACTIONS

PUBL
IC AC
CESS
plastics, glass, metals, paper, cloth, rubber and wood. Plastics, which are durable and slow to degrade, make up about 60 to 80 percent of floating marine debris. Every year, about 8 million metric tons of plastic become marine debris in the world’s oceans. As plastics degrade, they may release toxic pollution or promote adhesion of toxins to small debris, which can be consumed and accumulate in the marine food chain. Most plastics do not fully degrade in the ocean, but instead break down into smaller and smaller pieces (see Action COC-4).
Marine debris can scour, break and smother important marine habitat. Wildlife can ingest marine debris, causing malnutrition, internal injury or blockage, leading to starvation and death. Wildlife can also become entangled in marine debris, especially derelict fishing gear like abandoned nets, traps and monofilament fishing line, leading to injury, illness, suffocation, starvation and death. Federal law prohibits dumping of any plastic in U.S. waters. Keep America Beautiful Affiliates, Tampa Bay Watch and other local non-profits engage citizen volunteers to clean up marine debris and derelict fishing gear (see Action PE-1).
Ethical Recreational Fishing
Florida is world-renowned for its recreational fishing. In 2012, recreational anglers in Florida spent nearly $5 billion, supporting more than 80,000 jobs. Overfishing has imperiled many fish populations, resulting in adoption of strict fishing regulations. Both NOAA and FWC promote ethical fishing and boating practices, including catch-and-release of valuable sportfish, proper disposal of monofilament line and tackle, and proper stowage and disposal of trash.
The Tampa Bay Estuary Program (TBEP) has been a leader in providing boater and angler education, partnering with FWC, Audubon and other organizations to produce printed and web-based boating and angling guides to the bay; an Ethical Angler Wallet Card showing harvest and bag limits for popular sportfish, in both English and Spanish; and Bay-Friendly Boater Kits coordinated by TBEP’s Manatee Awareness Coalition (see Actions PE-2, FW-1 and FW-6).
Hunting
Hunting is an important outdoor sport in areas of the bay watershed. As waterfowl populations have increased, duck hunting has become a popular activity in southern Hillsborough County from the Bullfrog Creek area south to the Little Manatee
River. Hunters can be important advocates for land acquisition and management; however, conflicts between hunters, fishermen and even waterfront residents in duck-hunting areas will need to be addressed with growth and increased recreational use of the bay’s southeast shore.
STRATEGY:Activity 1 Support adequate and appropriate public access to
fish, paddle, sail, view wildlife, hike, hunt or simply enjoy unobstructed natural and scenic views of the bay and its watershed. Support acquisition, restoration and comprehensive management of conservation and
Excerpt from Tampa Bay Boater’s Guide showing boat launches, bridge clearance heights, marinas, fishing piers, seagrasses and other features in lower Tampa Bay.
CHARTING THE COURSE: THE COMPREHENSIVE CONSERVATION AND MANAGEMENT PLAN FOR TAMPA BAY (AUGUST 2017 REVISION)
PAGE 139
Go to: TABLE OF CONTENTS | INDEX OF ACTIONS
PUBL
IC AC
CESS
recreational lands. Support appropriately sited boat and kayak launches, mooring fields and paved or unpaved trails. Collect data necessary to identify areas where additional access is warranted.
Responsible parties: Local government partners, SWFWMD, FWC, FDEP (for mooring fields, state parks and preserves), TBEP, Florida Sea Grant (potential partner for research on boating patterns and needs analysis of marinas, boat ramps, mooring fields)
Timeframe: Ongoing
Cost and potential funding sources: $$$$ Florida Land Acquisition Trust Fund, Florida Forever, ELAPP, Florida Boating Improvement Trust Fund, city- and county-directed ad valorem revenues, Deepwater Horizon economic damage recovery funds
Location: Baywide
Benefit/Performance measure: Adequate and appropriate public access to Tampa Bay for recreational uses.
Results: Improved public access to Tampa Bay. Increased public awareness of bay habitats, fish and wildlife. Protection and restoration of important bay habitats and populations of fish and wildlife. Increased support for bay management.
Deliverables: Improved public access to Tampa Bay through additional public lands, kayak launches, boat ramps and mooring fields. Maps of public access paired with recreational activities.
Activity 2 Support existing initiatives that foster ethical outdoor recreation, including Leave No Trace, the Florida Master Naturalist Program and youth programming provided by FWC’s Youth Conservation Center in Apollo Beach. Support responsible enjoyment of the bay through demographically and culturally targeted outreach and education to residents and visitors, as well as research and enforcement including:
• Fishing: fishing regulations, ethical fishing
practices including proper catch and release procedures and monofilament and trash disposal.
• Wildlife Viewing: ethical wildlife interactions with birds, manatees, dolphins, sea turtles and other wildlife.
• Boating: safe boating practices, fuel spill prevention, observed speed zones, reduced impacts to habitats including prop-scar damage to seagrass and impacts to hard bottom communities, boater pollution prevention including wastewater discharge, marine debris and derelict vessels.
Responsible parties: FWC, TBEP, local government partners, tourism agencies such as Visit St. Pete/Clearwater and Visit Tampa Bay for messages about responsible enjoyment for visitors
Timeframe: Ongoing
Cost and potential funding sources: $$–$$$
Location: Baywide
Benefit/Performance measure: Improved public understanding about best practices regarding recreational uses of the bay including wildlife viewing, boating and fishing. Behavior changes resulting in reduced per capita impacts to bay resources from improper recreational practices.
Results: Reduced damage and loss of bay habitats and fish and wildlife. Increased public awareness and support for bay management.
Deliverables: Research, education, outreach and enforcement of best management practices and regulations for responsible recreational uses.
Activity 3 Support education, outreach and enforcement to reduce user conflicts among competing uses (e.g., kayakers versus boaters versus personal watercraft enthusiasts, commercial versus recreational users, hunters versus hikers or anglers, public versus private access and use.)
Responsible parties: Local governments, FWC, UF/IFAS Extension (for FMNP), UF/IFAS Sea Grant, Tampa Harbor and Safety Security Committee, Tampa Bay Harbor Pilots, special interest groups such as boating, fishing, paddling and hunting clubs
Timeframe: Ongoing
Cost and potential funding sources: $–$$
Location: Baywide
Benefit/Performance measure: Reduced user conflicts in the bay.
Results: Responsible recreational uses of the bay. Increased public awareness and support for bay management.
Deliverables: Identification of user conflicts. Policies to reduce user conflicts. Targeted outreach, education and enforcement of policies to reduce user conflicts.
1 Outdoor Industry Association 2013. Florida Outdoor Recreational Economy State Report.
2 Tampa Bay Estuary Program & Tampa Bay Regional Planning Council 2014. Economic Valuation of Tampa Bay. 91 pp.
3 US Census Bureau 2015 estimate for Tampa-St. Petersburg-Clearwater, FL Metro Area is 2,975,225 people.
4 Farr, J.A. & O.G. Brock. 2006. Florida’s Landmark Programs for Conservation and Recreation Land Acquisition. Sustain Volume 14.
CHARTING THE COURSE: THE COMPREHENSIVE CONSERVATION AND MANAGEMENT PLAN FOR TAMPA BAY (AUGUST 2017 REVISION)
PAGE 140
Go to: TABLE OF CONTENTS | INDEX OF ACTIONS

CLIMATECHANGE
CLIMATE CHANGEImprove ability of bay habitats to adapt to a changing climate
At left: A lifeguard station during a King Tide at Fort De Soto Park provides a preview of rising sea levels. Photo by Holly Greening.
CC-1
OBJECTIVES: Identify coastal habitats vulnerable to climate change and potential buffer areas upslope of coastal habitats. Identify methods to improve the resiliency of vulnerable bay habitats to sea level rise. Continue to investigate the carbon sequestration benefits of coastal habitats (“blue carbon”). Enhance community understanding of the potential impacts of changing climate on coastal habitats, and encourage actions to help mitigate effects.
STATUS: New action adopted in 2014 to support ongoing and future research and restoration or mitigation of sea level rise and other projected climate change impacts on coastal habitats.
RELATED ACTIONS: BH-1 Implement the Tampa Bay
Habitat Master Plan
BH-6 Encourage habitat enhancement along altered waterfront properties
BH-8 Expand habitat mapping and monitoring programs
BH-9 Enhance ecosystem values of tidal tributaries
CC-2 Understand and address effects of ocean acidification
BACKGROUND:Estuaries like Tampa Bay are particularly vulnerable to many climate change stressors, such as sea level rise (SLR), ocean acidification (see Action CC-2),
Tampa Bay Climate Science Advisory Panel Relative Sea Level Change Projections
warming temperatures and changes in precipitation and storm intensity. These stressors pose a variety of risks to coastal habitats. Sea level rise may increase shoreline erosion and lead to loss of beaches, salt marshes and coastal wetlands. As higher salinity waters move upslope and upstream, plant zonation will shift; where adjacent areas are developed and there is no room to migrate, coastal wetlands will become submerged. Warmer waters may promote the spread of existing or new invasive species, increased algal growth rates, decreased water clarity and low dissolved oxygen. Frequent drought or extreme flooding may alter hydrologic conditions resulting in changes to species composition and ecological function of habitats. Increased storm intensity may lead to increased nutrient pollution to the bay and shoreline erosion.
Blue Carbon
Coastal habitats are among the first to experience these impacts, but also have an important role in mitigating their effects. Tidal wetlands and seagrass habitats take up carbon dioxide and store so-called “blue carbon” in plant biomass and associated wet soils. Blue carbon ecosystems — seagrass beds, mangroves and salt marshes — store carbon at roughly 25 times the annual rate of temperate and tropical forests. This is due to high primary productivity and efficiency in trapping sediments and associated carbon transported by runoff and tidal flow.1 In addition, seagrass beds may have a localized mitigating effect on ocean acidification (see Action CC-2).
CHARTING THE COURSE: THE COMPREHENSIVE CONSERVATION AND MANAGEMENT PLAN FOR TAMPA BAY (AUGUST 2017 REVISION)
PAGE 141
Go to: TABLE OF CONTENTS | INDEX OF ACTIONS
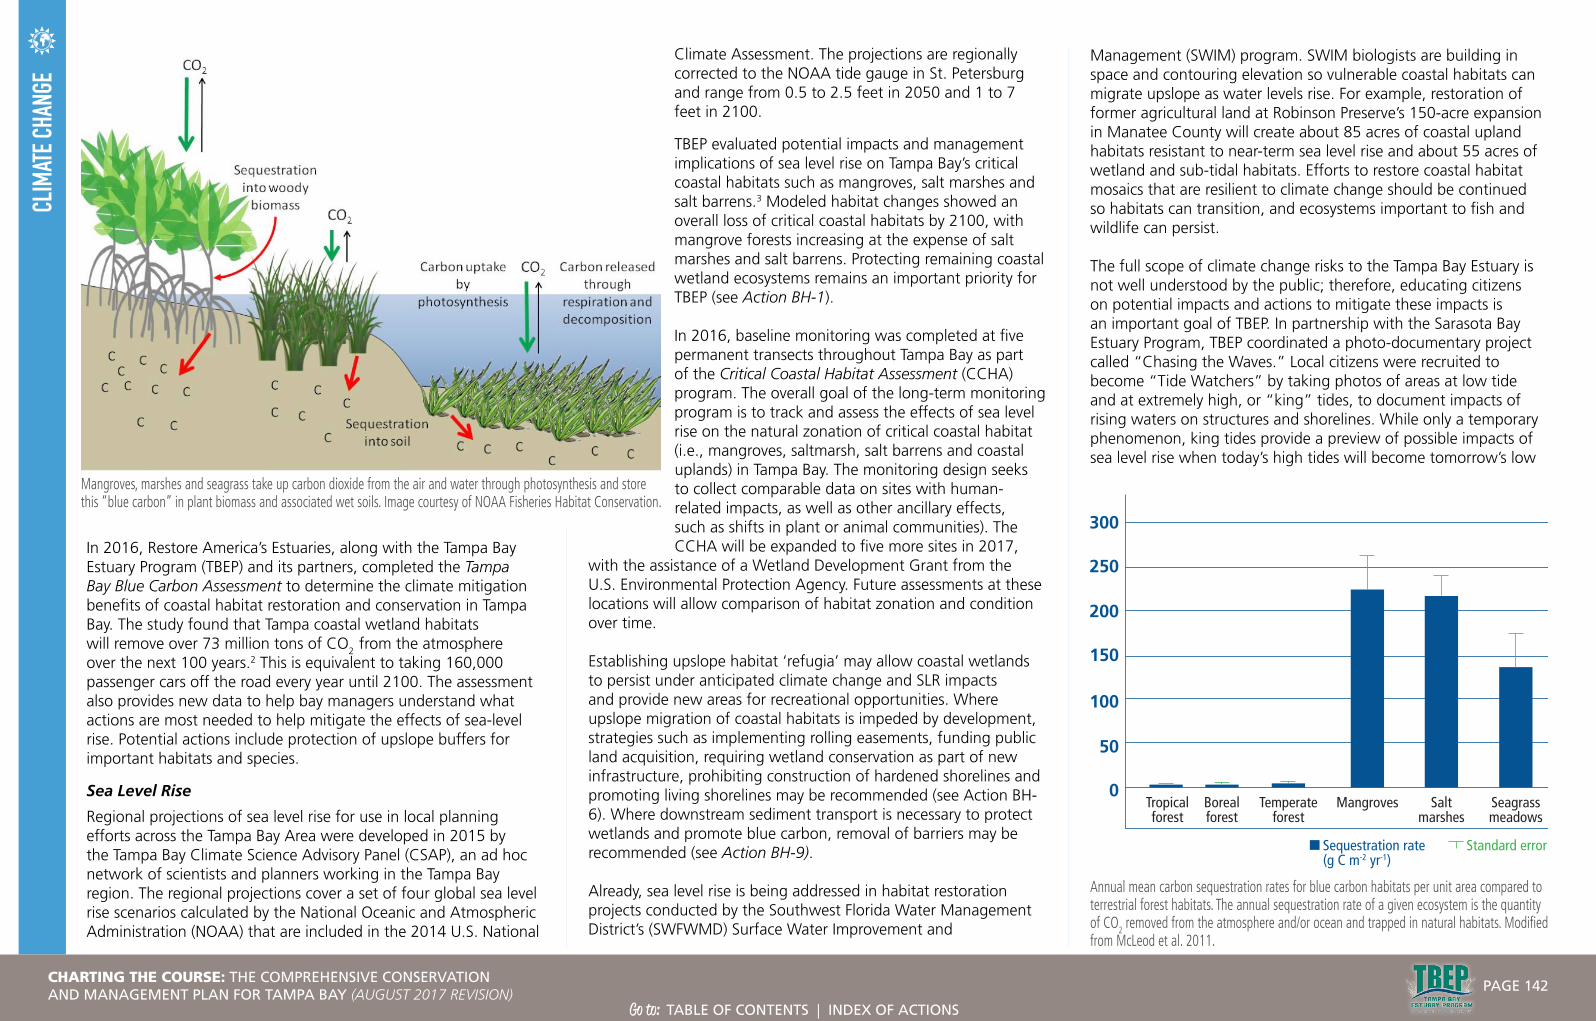
CLIM
ATE C
HANG
E
In 2016, Restore America’s Estuaries, along with the Tampa Bay Estuary Program (TBEP) and its partners, completed the Tampa Bay Blue Carbon Assessment to determine the climate mitigation benefits of coastal habitat restoration and conservation in Tampa Bay. The study found that Tampa coastal wetland habitats will remove over 73 million tons of CO2 from the atmosphere over the next 100 years.2 This is equivalent to taking 160,000 passenger cars off the road every year until 2100. The assessment also provides new data to help bay managers understand what actions are most needed to help mitigate the effects of sea-level rise. Potential actions include protection of upslope buffers for important habitats and species.
Sea Level Rise
Regional projections of sea level rise for use in local planning efforts across the Tampa Bay Area were developed in 2015 by the Tampa Bay Climate Science Advisory Panel (CSAP), an ad hoc network of scientists and planners working in the Tampa Bay region. The regional projections cover a set of four global sea level rise scenarios calculated by the National Oceanic and Atmospheric Administration (NOAA) that are included in the 2014 U.S. National
Climate Assessment. The projections are regionally corrected to the NOAA tide gauge in St. Petersburg and range from 0.5 to 2.5 feet in 2050 and 1 to 7 feet in 2100.
TBEP evaluated potential impacts and management implications of sea level rise on Tampa Bay’s critical coastal habitats such as mangroves, salt marshes and salt barrens.3 Modeled habitat changes showed an overall loss of critical coastal habitats by 2100, with mangrove forests increasing at the expense of salt marshes and salt barrens. Protecting remaining coastal wetland ecosystems remains an important priority for TBEP (see Action BH-1).
In 2016, baseline monitoring was completed at five permanent transects throughout Tampa Bay as part of the Critical Coastal Habitat Assessment (CCHA) program. The overall goal of the long-term monitoring program is to track and assess the effects of sea level rise on the natural zonation of critical coastal habitat (i.e., mangroves, saltmarsh, salt barrens and coastal uplands) in Tampa Bay. The monitoring design seeks to collect comparable data on sites with human-related impacts, as well as other ancillary effects, such as shifts in plant or animal communities). The CCHA will be expanded to five more sites in 2017,
with the assistance of a Wetland Development Grant from the U.S. Environmental Protection Agency. Future assessments at these locations will allow comparison of habitat zonation and condition over time.
Establishing upslope habitat ‘refugia’ may allow coastal wetlands to persist under anticipated climate change and SLR impacts and provide new areas for recreational opportunities. Where upslope migration of coastal habitats is impeded by development, strategies such as implementing rolling easements, funding public land acquisition, requiring wetland conservation as part of new infrastructure, prohibiting construction of hardened shorelines and promoting living shorelines may be recommended (see Action BH-6). Where downstream sediment transport is necessary to protect wetlands and promote blue carbon, removal of barriers may be recommended (see Action BH-9).
Already, sea level rise is being addressed in habitat restoration projects conducted by the Southwest Florida Water Management District’s (SWFWMD) Surface Water Improvement and
Management (SWIM) program. SWIM biologists are building in space and contouring elevation so vulnerable coastal habitats can migrate upslope as water levels rise. For example, restoration of former agricultural land at Robinson Preserve’s 150-acre expansion in Manatee County will create about 85 acres of coastal upland habitats resistant to near-term sea level rise and about 55 acres of wetland and sub-tidal habitats. Efforts to restore coastal habitat mosaics that are resilient to climate change should be continued so habitats can transition, and ecosystems important to fish and wildlife can persist.
The full scope of climate change risks to the Tampa Bay Estuary is not well understood by the public; therefore, educating citizens on potential impacts and actions to mitigate these impacts is an important goal of TBEP. In partnership with the Sarasota Bay Estuary Program, TBEP coordinated a photo-documentary project called “Chasing the Waves.” Local citizens were recruited to become “Tide Watchers” by taking photos of areas at low tide and at extremely high, or “king” tides, to document impacts of rising waters on structures and shorelines. While only a temporary phenomenon, king tides provide a preview of possible impacts of sea level rise when today’s high tides will become tomorrow’s low
Mangroves, marshes and seagrass take up carbon dioxide from the air and water through photosynthesis and store this “blue carbon” in plant biomass and associated wet soils. Image courtesy of NOAA Fisheries Habitat Conservation.
Annual mean carbon sequestration rates for blue carbon habitats per unit area compared to terrestrial forest habitats. The annual sequestration rate of a given ecosystem is the quantity of CO2 removed from the atmosphere and/or ocean and trapped in natural habitats. Modified from McLeod et al. 2011.
CHARTING THE COURSE: THE COMPREHENSIVE CONSERVATION AND MANAGEMENT PLAN FOR TAMPA BAY (AUGUST 2017 REVISION)
PAGE 142
Go to: TABLE OF CONTENTS | INDEX OF ACTIONS

CLIM
ATE C
HANG
Etides. Citizen photos were featured on a photo-sharing website, and a traveling exhibition was viewed by more than 155,000 people at county buildings, libraries and museums throughout the Tampa Bay watershed.
STRATEGY:Activity 1 Identify coastal habitats most vulnerable to impacts of
climate change and potential buffer areas upslope of coastal habitats. Identify effective methods to improve the resiliency of vulnerable bay habitats to sea level rise.
Responsible parties: TBEP (lead), SWFWMD, USFWS, local governments
Timeframe: Initiated in 2017, through the Tampa Bay Habitat Masterplan
Cost and potential funding sources: $$ CWA Section 320 funds, RESTORE Act, local partners
Location: Baywide
Benefit/Performance measure: Evaluation of coastal and adjacent upland habitat quality and methods for conservation and restoration
appropriate to projected sea level rise scenarios.
Results: Better information for management decisions on critical bay habitats.
Deliverables: Updated list of vulnerable areas to be prioritized for acquisition and restoration activities. Report on best practices for habitat conservation and restoration in the face of sea level rise.
Activity 2 Continue to implement Critical Coastal Habitat Assessment monitoring at permanent transects to track long-term changes from climate change and other stressors to coastal habitats and species.
Responsible parties: TBEP (lead), local government and agency partners
Timeframe: Finalize baseline data collection in 2017, then every 5 years after that
Cost and potential funding sources: $$$ CWA Section 320 funds, grants
Location: Permanent transects throughout the bay
Benefit/Performance measure: Evaluation of change in habitat extent and quality over time.
Results: Proactive management decisions for critical bay habitats that consider climate change, land use changes and effects from other factors.
Deliverables: Final report of initial baseline monitoring, then reports evaluating successive changes observed every five years.
Activity 3 Support and assist with purchase, protection and/or restoration of priority sites to serve as climate change refuges and upslope buffers for critically important habitats and species. Support adoption of land management strategies such as rolling easements, coastal construction setbacks and living shorelines.
Responsible parties: SWFWMD, USFWS, FDEP, other state, federal and local government land acquisition programs and land trusts; FDOT, CSX, TECO and other entities that own or manage
linear properties, easements or infrastructure, as appropriate
Timeframe: Priority list of environmental lands is updated every 10 years as part of the update to the Habitat Master Plan, scheduled for completion in 2018
Cost and potential funding sources: $$$–$$$$ federal, state, regional and local land acquisition programs, grants
Location: Baywide
Benefit/Performance measure: Restored and protected habitat used by fish and wildlife and for recreational opportunities resilient to near-term sea level rise projections.
Results: Increased quantity and quality of climate-resilient coastal habitats.
Deliverables: Annual reporting of protected and restored habitat, as required by the Government Performance and Results Act.
Activity 4 Continue to identify carbon sequestration benefits and economic incentives to preserve coastal habitats through voluntary carbon markets or other mechanisms. Assist land management agencies in developing site management plans that maximize carbon sequestration benefits of appropriate coastal habitats held in preservation or conservation.
Responsible parties: Restore America’s Estuaries, TBEP, academic institutions, SWFMWD, local governments, FDEP
Timeframe: Initiate by 2019
Cost and potential funding sources: $$$ External grants, TBERF, EPA CRE
Location: Baywide
Benefit/Performance measure: Evaluation of blue carbon cost-benefit solutions.
Results: Better information for management decisions and incentives for conserving and restoring critical bay habitats.
Coastal squeeze occurs when upslope migration of habitat is impeded by development. Image courtesy of news.caloosahatchee.org.
CHARTING THE COURSE: THE COMPREHENSIVE CONSERVATION AND MANAGEMENT PLAN FOR TAMPA BAY (AUGUST 2017 REVISION)
PAGE 143
Go to: TABLE OF CONTENTS | INDEX OF ACTIONS

CLIM
ATE C
HANG
E Deliverables: Updated report on blue carbon storage potential for Tampa Bay habitats. Site management plans for maximizing carbon sequestration benefits of coastal habitats.
Activity 5 Enhance community understanding of the potential impacts of climate change on coastal habitats, and encourage actions by state and local entities and citizens to help adapt to or mitigate effects. Develop metrics to measure citizen outreach effectiveness.
Responsible parties: Florida Sea Grant, local government sustainability programs, TBEP, UF/IFAS Extension, St. Petersburg College Sea Level Rise Group
Timeframe: Ongoing
Cost and potential funding sources: $$ Operating budgets of partner organizations; CWA Section 320 funds and/or Bay Mini-Grants for TBEP activities, other grants
Location: Baywide
Benefit/Performance measure: Public education and outreach programs with metrics for
engagement and behavior change.
Results: Citizen engagement in habitat restoration volunteer projects and behavior changes to adopt recommended mitigation actions.
Deliverables: Educational outreach materials and program metrics.
1 McLeod, E., Chmura, G.L., Bouillon, S., Slam, R., Bjork, M., Duarte, C.M., Lovelock, C.E., Schlesinger, W.H., and Silliman, B.R. 2011. A blueprint for blue carbon: toward an improved understanding of the role of vegetated coastal habitats in sequestering CO2. Front. Ecol. Environ. 9(10): 552-560.
2 Sheehan, L., Crooks, S. et al. Tampa Bay Blue Carbon Assessment. 2016. Technical Report #07-16 of the Tampa Bay Estuary Program.
3 Sherwood, E.T. & Greening, H.S. Potential Impacts and Management Implications of Climate Change on Tampa Bay Estuary Critical Coastal Habitats. Environmental Management (2014) 53: 401. (Tampa Bay Estuary Program Technical Reports #03-12 and #07-14)
CHARTING THE COURSE: THE COMPREHENSIVE CONSERVATION AND MANAGEMENT PLAN FOR TAMPA BAY (AUGUST 2017 REVISION)
PAGE 144
Go to: TABLE OF CONTENTS | INDEX OF ACTIONS
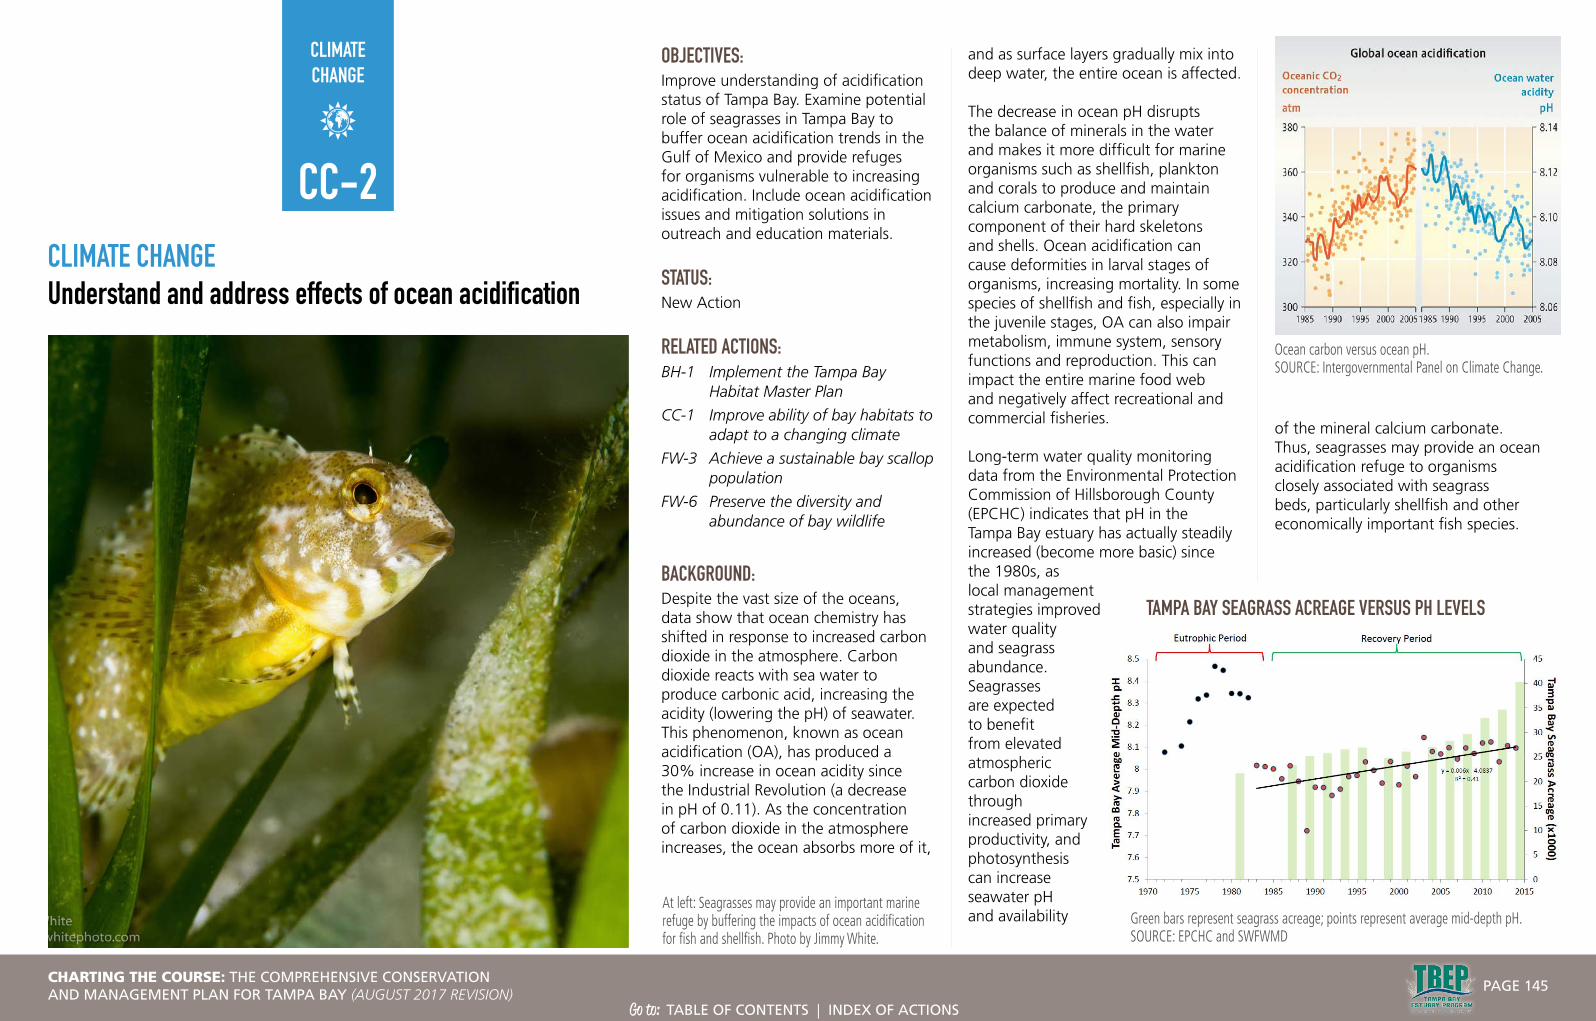
CLIMATECHANGE
CLIMATE CHANGEUnderstand and address effects of ocean acidification
At left: Seagrasses may provide an important marine refuge by buffering the impacts of ocean acidification for fish and shellfish. Photo by Jimmy White.
CC-2
OBJECTIVES: Improve understanding of acidification status of Tampa Bay. Examine potential role of seagrasses in Tampa Bay to buffer ocean acidification trends in the Gulf of Mexico and provide refuges for organisms vulnerable to increasing acidification. Include ocean acidification issues and mitigation solutions in outreach and education materials.
STATUS: New Action
RELATED ACTIONS:BH-1 Implement the Tampa Bay
Habitat Master Plan
CC-1 Improve ability of bay habitats to adapt to a changing climate
FW-3 Achieve a sustainable bay scallop population
FW-6 Preserve the diversity and abundance of bay wildlife
BACKGROUND:Despite the vast size of the oceans, data show that ocean chemistry has shifted in response to increased carbon dioxide in the atmosphere. Carbon dioxide reacts with sea water to produce carbonic acid, increasing the acidity (lowering the pH) of seawater. This phenomenon, known as ocean acidification (OA), has produced a 30% increase in ocean acidity since the Industrial Revolution (a decrease in pH of 0.11). As the concentration of carbon dioxide in the atmosphere increases, the ocean absorbs more of it,
and as surface layers gradually mix into deep water, the entire ocean is affected.
The decrease in ocean pH disrupts the balance of minerals in the water and makes it more difficult for marine organisms such as shellfish, plankton and corals to produce and maintain calcium carbonate, the primary component of their hard skeletons and shells. Ocean acidification can cause deformities in larval stages of organisms, increasing mortality. In some species of shellfish and fish, especially in the juvenile stages, OA can also impair metabolism, immune system, sensory functions and reproduction. This can impact the entire marine food web and negatively affect recreational and commercial fisheries.
Long-term water quality monitoring data from the Environmental Protection Commission of Hillsborough County (EPCHC) indicates that pH in the Tampa Bay estuary has actually steadily increased (become more basic) since the 1980s, as local management strategies improved water quality and seagrass abundance. Seagrasses are expected to benefit from elevated atmospheric carbon dioxide through increased primary productivity, and photosynthesis can increase seawater pH and availability
of the mineral calcium carbonate. Thus, seagrasses may provide an ocean acidification refuge to organisms closely associated with seagrass beds, particularly shellfish and other economically important fish species.
Ocean carbon versus ocean pH. SOURCE: Intergovernmental Panel on Climate Change.
Green bars represent seagrass acreage; points represent average mid-depth pH. SOURCE: EPCHC and SWFWMD
TAMPA BAY SEAGRASS ACREAGE VERSUS PH LEVELS
CHARTING THE COURSE: THE COMPREHENSIVE CONSERVATION AND MANAGEMENT PLAN FOR TAMPA BAY (AUGUST 2017 REVISION)
PAGE 145
Go to: TABLE OF CONTENTS | INDEX OF ACTIONS

CLIM
ATE C
HANG
EIn 2016, Tampa Bay Estuary Program (TBEP) along with the United States Geological Survey (USGS), Florida Fish and Wildlife Commission’s Fish and Wildlife Research Institute (FWC FWRI) and University of South Florida (USF) College of Marine Science (with equipment funded by a U.S. Environmental Protection Agency grant) initiated an intensive OA monitoring program in Tampa Bay. The program will examine the extent to which seagrass recovery has helped buffer the chemical impacts of ocean acidification.
Sampling in seagrass beds and adjacent bare substrates will evaluate the role of seagrass beds in maintaining and elevating pH. Spatial and temporal differences within the estuary, as well as the effects of inflow and circulation, will be evaluated. Additionally, a continuous pH monitoring system will be co-located with an existing monitoring platform in the middle of the bay; a companion station is proposed for Gulf waters near Port Manatee. Results from these studies will be useful to examine implications for Tampa Bay shellfish populations, identify potential habitat protection and restoration activities and support regional and Gulfwide ocean acidification assessments.
Actions already being taken to reduce CO2 emissions from the burning of fossil fuels will help slow the effects of ocean acidification. Furthermore, conserving and restoring marine habitats will strengthen ecosystem resilience to climate change and enhance ecosystem health (See Actions CC-1, BH-1, FW-3 and FW-6).
Reducing nutrient loading to estuaries can also help prevent acidification caused by excess CO2 production when nutrient-fueled algal blooms die and decay. Continuing to manage nutrient loading to Tampa Bay is therefore an important action that also helps address global ocean acidification (see Actions WQ-1, WQ-3, SW-1, SW-8 and SW-10).
STRATEGY:Activity 1 Improve understanding of ocean acidification levels in
Tampa Bay. Establish at least one long term monitoring station within the Tampa Bay estuary and one directly outside the bay to track changes in Tampa Bay estuarine and Gulf of Mexico pH conditions. Co-locate stations with existing ecological or meteorological monitoring platforms.
Responsible parties: USGS (lead), USF College of Marine Sciences, FWC FWRI, TBEP
Timeframe: Initiated in 2016. Funding for bay pH monitoring station through 2018; funding not yet secured for Gulf of Mexico pH monitoring station.
Cost and potential funding sources: $$ EPA grants, additional federal grants, TBERF
Location: Baywide
Benefit/Performance measure: Long-term measurements of seawater pH inside and outside the bay.
Results: Better understanding of environmental conditions important for conservation and restoration of critical habitats, fish and shellfish populations.
Deliverables: Periodic reports on water quality parameters tracking long-term changes in pH.
Activity 2 Investigate the potential role of seagrass in Tampa Bay to buffer ocean acidification trends in the open Gulf and provide refuge to organisms vulnerable to acidification.
Responsible parties: USGS (lead), USF College of Marine Science, FWC FWRI, TBEP, academic and agency partners
Timeframe: Initiate in 2017
Cost and potential funding sources: $$ federal grants, TBERF
Location: Baywide
Benefit/Performance measure: Measures of water chemistry in seagrass beds and adjacent bare substrates over time.
Results: Increased seagrass coverage may provide OA refugia and contribute to the overall resilience and health of the bay’s ecosystem as climate changes.
Deliverables: Reports evaluating the spatial and temporal effect of seagrass buffering.
Activity 3 Expand education about ocean acidification, including economic impacts related to OA, such as reduced shellfish harvest, reduced blue crab or stone crab harvests, impact on oyster and scallop restoration efforts and reduced fitness of important juvenile fishery species.
Increasing acidification of coastal waters can affect the viability of oysters and other organisms that produce calcium carbonate for their shells. Photo by Nanette O’Hara.
CHARTING THE COURSE: THE COMPREHENSIVE CONSERVATION AND MANAGEMENT PLAN FOR TAMPA BAY (AUGUST 2017 REVISION)
PAGE 146
Go to: TABLE OF CONTENTS | INDEX OF ACTIONS

CLIM
ATE C
HANG
E Responsible parties: Florida Sea Grant, TBEP
Timeframe: Initiated by 2018
Cost and potential funding sources: $ Grant funds, staff time
Location: Baywide
Benefit/Performance measure: Public education and outreach programs with metrics for engagement and behavior change.
Results: Citizen engagement in habitat restoration projects and community behavior changes that adopt recommended, locally-relevant mitigation.
Deliverables: Education and outreach materials and program metrics.
CHARTING THE COURSE: THE COMPREHENSIVE CONSERVATION AND MANAGEMENT PLAN FOR TAMPA BAY (AUGUST 2017 REVISION)
PAGE 147
Go to: TABLE OF CONTENTS | INDEX OF ACTIONS
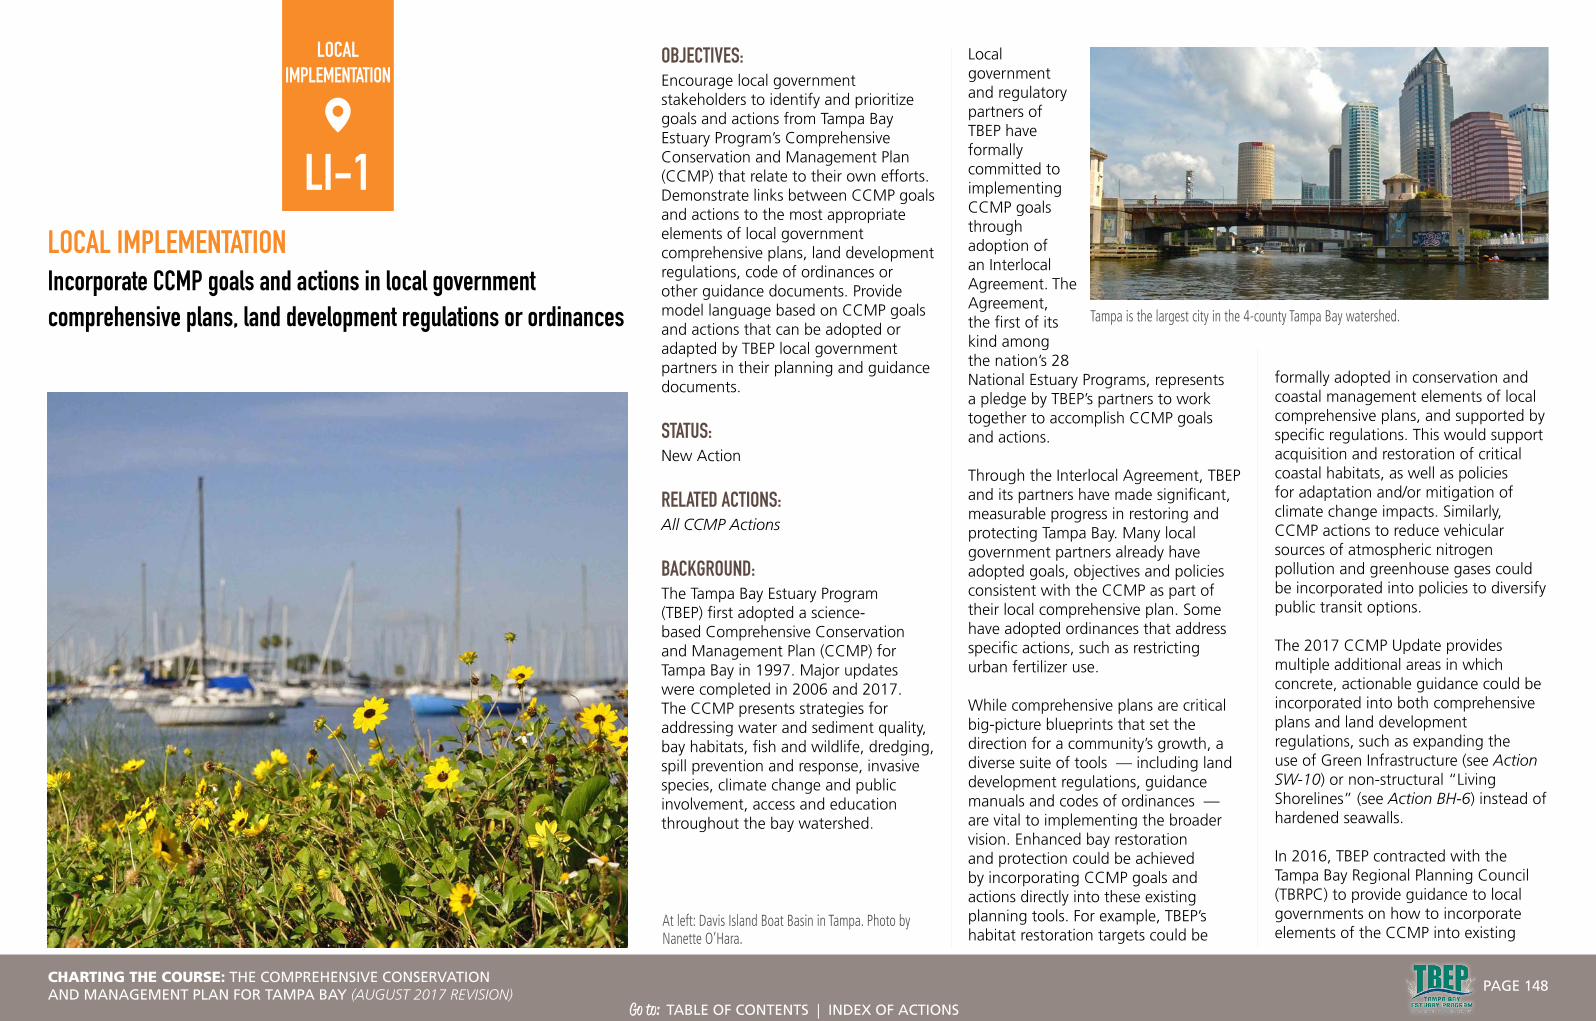
LOCAL IMPLEMENTATION
LOCAL IMPLEMENTATIONIncorporate CCMP goals and actions in local government comprehensive plans, land development regulations or ordinances
At left: Davis Island Boat Basin in Tampa. Photo by Nanette O’Hara.
LI-1
OBJECTIVES: Encourage local government stakeholders to identify and prioritize goals and actions from Tampa Bay Estuary Program’s Comprehensive Conservation and Management Plan (CCMP) that relate to their own efforts. Demonstrate links between CCMP goals and actions to the most appropriate elements of local government comprehensive plans, land development regulations, code of ordinances or other guidance documents. Provide model language based on CCMP goals and actions that can be adopted or adapted by TBEP local government partners in their planning and guidance documents.
STATUS: New Action
RELATED ACTIONS:All CCMP Actions
BACKGROUND:The Tampa Bay Estuary Program (TBEP) first adopted a science-based Comprehensive Conservation and Management Plan (CCMP) for Tampa Bay in 1997. Major updates were completed in 2006 and 2017. The CCMP presents strategies for addressing water and sediment quality, bay habitats, fish and wildlife, dredging, spill prevention and response, invasive species, climate change and public involvement, access and education throughout the bay watershed.
Local government and regulatory partners of TBEP have formally committed to implementing CCMP goals through adoption of an Interlocal Agreement. The Agreement, the first of its kind among the nation’s 28 National Estuary Programs, represents a pledge by TBEP’s partners to work together to accomplish CCMP goals and actions.
Through the Interlocal Agreement, TBEP and its partners have made significant, measurable progress in restoring and protecting Tampa Bay. Many local government partners already have adopted goals, objectives and policies consistent with the CCMP as part of their local comprehensive plan. Some have adopted ordinances that address specific actions, such as restricting urban fertilizer use.
While comprehensive plans are critical big-picture blueprints that set the direction for a community’s growth, a diverse suite of tools — including land development regulations, guidance manuals and codes of ordinances — are vital to implementing the broader vision. Enhanced bay restoration and protection could be achieved by incorporating CCMP goals and actions directly into these existing planning tools. For example, TBEP’s habitat restoration targets could be
formally adopted in conservation and coastal management elements of local comprehensive plans, and supported by specific regulations. This would support acquisition and restoration of critical coastal habitats, as well as policies for adaptation and/or mitigation of climate change impacts. Similarly, CCMP actions to reduce vehicular sources of atmospheric nitrogen pollution and greenhouse gases could be incorporated into policies to diversify public transit options.
The 2017 CCMP Update provides multiple additional areas in which concrete, actionable guidance could be incorporated into both comprehensive plans and land development regulations, such as expanding the use of Green Infrastructure (see Action SW-10) or non-structural “Living Shorelines” (see Action BH-6) instead of hardened seawalls.
In 2016, TBEP contracted with the Tampa Bay Regional Planning Council (TBRPC) to provide guidance to local governments on how to incorporate elements of the CCMP into existing
Tampa is the largest city in the 4-county Tampa Bay watershed.
CHARTING THE COURSE: THE COMPREHENSIVE CONSERVATION AND MANAGEMENT PLAN FOR TAMPA BAY (AUGUST 2017 REVISION)
PAGE 148
Go to: TABLE OF CONTENTS | INDEX OF ACTIONS

LOCA
L IMP
LEME
NTAT
ION
planning tools. The resulting Comprehensive Conservation & Management Plan – Local Government Comprehensive Plan Crosswalk Project aims to 1) prioritize CCMP goals and actions suitable for inclusion in local government comprehensive plans, land development regulations or other guidance documents, 2) identify relevant elements, goals, objectives and policies in local government regulatory frameworks to serve as the most appropriate vehicle for incorporating CCMP priority goals and actions, and 3) provide model language based on CCMP goals and actions for local government consideration.
The Crosswalk Project will share final recommendations and model language with local government officials, planners and resource managers at a regional workshop in 2018. Ongoing technical assistance will be provided to local governments as they consider adapting and adopting these recommendations in their comprehensive plans, land development regulations and other guidance documents.
STRATEGY:Activity 1 Engage local government stakeholders to identify
and prioritize CCMP goals and actions and create a matrix that relates those goals and actions to the most appropriate elements of local government comprehensive plans, land development regulations or other guidance documents.
Responsible parties: TBRPC (lead), TBEP, local government partners (Hillsborough, Pinellas, Manatee and Pasco counties and the cities of Tampa, St. Petersburg and Clearwater)
Timeframe: 2017
Cost and potential funding sources: $$ TBEP, TBRPC
Location: Baywide
Benefit/Performance measure: Coordination and facilitation of incorporation of CCMP goals and actions in local government comprehensive plans, land development regulations or other guidance documents.
Results: Improved coordination and implementation of CCMP goals and actions by local government partners to restore and protect Tampa Bay Area natural resources.
Deliverables: Stakeholder meetings providing directed technical assistance to local governments and professional planners regarding strategies to integrate relevant goals and actions of the CCMP into comprehensive plans, land development codes or other guidance documents. A matrix of actions and goals from the CCMP cross-referenced with the appropriate elements, goals, objectives and policies of local government comprehensive plans.
Activity 2 Recommend model language, based on CCMP goals and actions, that can be adopted or adapted by TBEP local government partners in their comprehensive plans, land development regulations or other guidance documents.
Responsible parties: TBRPC (lead), TBEP, local government partners (Hillsborough, Pinellas, Manatee and Pasco Counties and the cities of Tampa, St. Petersburg and Clearwater)
Timeframe: 2018
Cost and potential funding sources: No additional cost, staff time only
Location: Baywide
Benefit/Performance measure: Coordination and facilitation to incorporate CCMP goals and actions in local government comprehensive plans, land development regulations or other guidance documents. Number of model goals, objectives and policies (GOPs) developed for consideration by local governments. Number of model GOPs incorporated into comprehensive plans, land development codes or other guidance documents. Number of participating local government partners.
Results: Improved coordination and implementation of CCMP goals and actions by local government partners to restore and protect Tampa Bay Area natural resources.
Deliverables: Stakeholder meeting to review Crosswalk Project and draft model language. Report summarizing project process, Crosswalk Project and model language recommendations. Presentations to TBEP Management and Policy Boards.
Activity 3 Conduct a regional workshop to provide technical assistance to local governments and professional planners regarding strategies to incorporate relevant portions of the CCMP into comprehensive plans, land development codes or other guidance documents.
Responsible parties: TBRPC (lead), TBEP, local government and agency partners
Timeframe: 2018
TBEP’s Board meetings provide a forum for regional collaboration to advance bay improvement.
Tampa Bay is a diverse region, with a unique history that includes the Florida Maritime Heritage community of Cortez in Manatee County. Photo by Nanette O’Hara.
CHARTING THE COURSE: THE COMPREHENSIVE CONSERVATION AND MANAGEMENT PLAN FOR TAMPA BAY (AUGUST 2017 REVISION)
PAGE 149
Go to: TABLE OF CONTENTS | INDEX OF ACTIONS
LOCA
L IMP
LEME
NTAT
ION
Cost and potential funding sources: $ CWA Section 320 funds
Location: Baywide
Benefit/Performance measure: Number of representatives of TBEP partner agencies and organizations participating. Number of CCMP goals, objectives and policies subsequently adopted as part of local government/agency planning tools and regulatory frameworks.
Results: Enhanced protection and restoration of bay habitats and water quality.
Deliverables: Report summarizing workshop, including matrix of goals and actions and suggested model language.
CHARTING THE COURSE: THE COMPREHENSIVE CONSERVATION AND MANAGEMENT PLAN FOR TAMPA BAY (AUGUST 2017 REVISION)
PAGE 150
Go to: TABLE OF CONTENTS | INDEX OF ACTIONS

This chapter describes how Charting The Course: The Comprehensive Conservation and Management Plan for Tampa Bay will be implemented by local governments, agencies and other bay stakeholders, and discusses financing mechanisms to ensure that the goals of the Plan are achieved.
THE INTERLOCAL AGREEMENT
In 1998, local government and regulatory partners of the Tampa Bay Estuary Program formally affirmed their commitment to implementing the goals of Charting The Course through the adoption of a precedent-setting Interlocal Agreement.
The agreement, the first of its kind among the nation’s 28 NEPs, represented a binding pledge by TBEP’s major partners to work together to achieve bay recovery targets. The 1998 Interlocal Agreement also established the Tampa Bay Estuary Program as an Independent Special District under Florida Statutes; spelled out the governance structure of the program, and established funding contributions by the signatories based on population.
In 2015, the Interlocal Agreement was revised and restated to update or delete components deemed necessary by the Policy Board. In late 2015, Pasco County and the Manatee County Port Authority joined TBEP by executing a Joinder to the 2015 Interlocal Agreement, further strengthening the regional partnership. A key component of the update included a revised funding schedule and dues of our local government partners. The changes in funding are listed elsewhere in this section.
IMPLEMENTING AND FINANCING THE PLAN
OTHER HIGHLIGHTS OF THE 2015 AGREEMENT INCLUDE:
• Participation by local governments, regulatory agencies and other organizations with a stake in the bay’s health. The seven largest local governments in the Tampa Bay region — the counties of Hillsborough, Pinellas, Manatee and Pasco and the cities of Tampa, St. Petersburg and Clearwater — are parties to the agreement, along with the Southwest Florida Water Management District, and the Florida Department of Environmental Protection. The Tampa Port Authority, Environmental Protection Commission of Hillsborough County, Florida Wildlife Commission’s Florida Fish and Wildlife Research Institute, Tampa Bay Water, Tampa Bay Regional Planning Council and Manatee County Port Authority are also signatories. A separate agreement was signed by the Region 4 of the U.S. Environmental Protection Agency, defining its support for implementing the Plan.
• The TBEP partners agreed to work together to collectively address CCMP Goals, and adopted measurable and achievable goals to maintain important water quality and seagrass gains.
FINANCING THE PLAN
TBEP has historically and will continue to pursue at least eight separate avenues to secure funding or in-
kind support to finance operation of the base program and to advance implementation of the CCMP. The updated financing plan includes a balance of both dedicated and variable funding sources at federal, state, and local levels as well as private and non-profit sources.
The major objectives of the financing strategy are:
• Developing dedicated sources of funding to sustain the base operations of the TBEP, including personnel, administrative cost, community outreach, environmental monitoring and technical support.
• Securing dedicated and variable sources of funding that enhance implementation of the CCMP and maintain adequate progress toward bay restoration goals.
Dedicated Funding SourcesCurrently, the following four funding sources provide dedicated or reasonably secure funding to support the base program and/or enhance CCMP implementation, over both the short-term and long-term.
• Federal NEP Funding . Each action plan in the Revised CCMP indicates whether it will be funded under the Clean Water Act Section 320, versus other funding sources. While the specific future annual appropriations under Section 320 are uncertain, there is strong Congressional support for the community-based conservation efforts of Tampa Bay and the 27 other estuaries that are part of
CHARTING THE COURSE: THE COMPREHENSIVE CONSERVATION AND MANAGEMENT PLAN FOR TAMPA BAY (AUGUST 2017 REVISION)
PAGE 151
Go to: TABLE OF CONTENTS | INDEX OF ACTIONS

the NEP. In 2016, Congress and the President signed into law the first reauthorization of the National Estuary Program (NEP) since it expired in 2010. The new law authorizes spending up to $26.5 million per year nationwide for the next five years, with 80% of the annual appropriations dedicated for NEP Programs. This reauthorization equates to a maximum of about $757,000 per NEP per year for the next 5 years, if annual appropriations equaled the authorized amount.
• Funding Commitments in 2015 Interlocal Agreement . The Interlocal Agreement (IA) through which the CCMP is implemented obligates local government and agency partners to fund TBEP costs approved by the Policy Board in the annual program budget.
A key component of the 2015 IA update included a revised funding schedule and dues from local partners. The revised funding strategy calls for a minimum increase in annual dues of 2.5% per year for 5 years for those member governments contributing to the Tampa Bay Environmental Restoration Fund, and slightly higher annual dues for those members that do not contribute to TBERF. This funding commitment will allow TBEP to keep up with inflation and continue to provide support to our partners. When coupled with the anticipated federal NEP allocation administered through EPA and other external grants, local government and agency cash contributions are expected to meet the amount required to fully support program operations through 2021.
• Specialty License Plate . Revenue from the Tampa Bay Estuary specialty license plate has generated more than $2,000,000 since 2000, the first full year of plate sales. The Policy Board is authorized under the state law that created the Tampa Bay Estuary plate to use those funds for any types of projects that contribute to CCMP implementation. Over the last 10 years, the majority of these funds have been authorized to support TBEP’s successful Bay Mini-Grant Program. Bay Mini-Grants generate tens of thousands of dollars in matching funds and in-kind services. Up to 10% of TBEP’s annual portion of the Tampa Bay Estuary tag revenues can be used for administration of the grant program (typically about $8,000 per year).
• Tampa Bay Environmental Restoration Fund . TBERF is a partnership of Tampa Bay Estuary Program, Restore America’s Estuaries, local governments and private industry. TBERF was created to raise funds for projects that help advance implementation of the CCMP. From 2013-2016, TBERF awarded more than $2.8 million in grants for projects throughout the bay area that contribute to CCMP implementation. These projects leveraged an additional $8 million in project implementation costs. TBEP staff are actively exploring opportunities to increase contributions to the Fund from public and private entities in the Tampa Bay region. TBERF administrative fees have generated between $30,000 and $40,000 per year since 2014.
Variable Funding SourcesThe following funding sources supplement CCMP implementation through local action plans of TBEP partners, grants, cooperative agreements and other mechanisms. While variable from year to year, they represent significant funding sources to support both short- and long-term resource needs as identified in the CCMP Actions for TBEP and its partners.
• External Grants and Cooperative Agreements . TBEP staff have had significant success partnering with federal, state and local agencies to secure hundreds of thousands of dollars in grants for developing management tools and for research, environmental monitoring, habitat restoration, water quality improvement and environmental education projects as called for in the CCMP. Funding sources for these external grants include FDOT, USFWS, NOAA, EPA and SWFWMD. TBEP will continue to pursue these opportunities as a means of financing priority research, monitoring, and resource management needs.
• RESTORE funds from Deepwater Horizon oil spill fines and penalties . As of 2017, TBEP has five projects on the “approved priority funding list” for RESTORE funds, with another project in the planning phase. The six projects total $1,630,000 and include funds for TBEP as project coordinators. Several of our local partners have also submitted projects for other RESTORE funds that meet our CCMP objectives.
• Non-Federal Overmatch Fund . TBEP maintains a Non-Federal Overmatch Fund that provides a source of matching funds for grants helping to implement the CCMP and serves as a contingency fund for continuing program operations in the event a major funding source is lost. Expenses which cannot be paid for with federal money such as the program’s dues to the Association of National Estuary Programs are also funded from the Overmatch Fund. The fund balance as of May 2017 was about $389,000.
IMPL
EMEN
TING
AND
FINAN
CING
THE P
LAN
CHARTING THE COURSE: THE COMPREHENSIVE CONSERVATION AND MANAGEMENT PLAN FOR TAMPA BAY (AUGUST 2017 REVISION)
PAGE 152
Go to: TABLE OF CONTENTS | INDEX OF ACTIONS

HIGH PRIORITY RESEARCH & MONITORING TOPICSFINALRANK
TOPIC CATEGORY
1Continue to assess the water quality, sediment quality and habitat of tidal tributaries in Tampa Bay. Build a database on information for smaller tributaries to support existing management strategies.
Existing Priority
2Implement habitat mitigation & restoration within the watershed that provides multiple benefits. Further assess the effectiveness and functionality of mitigation and restoration projects.
Existing/New Priority
3 Evaluate potential effects of climate change on Tampa Bay’s ecology. Identify framework to assess CC impacts and integrate into new management strategies.Existing Priority
4Improve monitoring of pollutant loading (particularly nutrients) from the entire watershed (i.e. in both gaged and ungaged basins) to better understand loading contributions. Deploy additional continuous water quality and flow monitors in the watershed, considering new technologies.
Existing Priority
5Better understand the status, trends and restoration progress of critical coastal habitats currently lacking complete information (e.g. oysters, hard/live bottom, tidal flats, artificial habitats, tidal creeks & coastal uplands).
New Priority
6Develop & implement a long-term monitoring program to track coastal habitat quantity & quality. Incorporate new technologies, as appropriate, to monitor coastal habitats. Frequent, on-the-ground assessments preferred.
Existing Priority
7Determine existing and predicted impacts of watershed development on estuarine resources and processes (e.g, hydrological changes, hurricane vulnerability, progress in implementing OneBay initiative, evaluating Ecosystem Services, & coastal habitat change).
Existing Priority
8Better understand community awareness of the bay’s health & recreation, economic & ecological value, to identify & overcome barriers to involvement in bay restoration. Improve the effectiveness of outreach & education products, programs & restoration activities for the bay’s inhabitants & visitors.
New Priority
9Better understand distribution and impacts of septic systems in the Tampa Bay watershed. Identify any nutrient load reduction benefits of septic-sewer conversions in the watershed.
New Priority
9Better understand & monitor emerging contaminants of concern in groundwater & surface water. (e.g. PAHs from coal-tar based sealants & mobile sources, PPCPs, endocrine disruptors, microplastics, etc.)
New Priority
11 Identify causes of seagrass recovery slowdown or seagrass loss in “problem areas” representing at least 10% of a bay segment.Existing Priority
RESEARCH AND MONITORING PRIORITIES
CHARTING THE COURSE: THE COMPREHENSIVE CONSERVATION AND MANAGEMENT PLAN FOR TAMPA BAY (AUGUST 2017 REVISION)
PAGE 153
Go to: TABLE OF CONTENTS | INDEX OF ACTIONS

RESE
ARCH
AND
MONI
TORI
NG PR
IORI
TIES 12 Better quantify fertilizer use within the watershed and reductions in watershed nitrogen loadings that may result from reduced fertilizer use. New Priority
13Better understand the current factors contributing to harmful algal blooms in the bay, and potential problem species in the future due to changing climate. Leverage existing model platforms. Research trophic links with other species, including drift algae, zooplankton, fish & wildlife.
New Priority
14 Better understand the contribution of nutrients from reclaimed water to the bay. New Priority
15Better understand the causes of sanitary sewer overflows and other unanticipated releases that occur throughout the watershed. Better estimate the nitrogen loadings that result from these events.
New Priority
16Better understand the distribution and effectiveness of agricultural BMPs in reducing nutrient loadings throughout the Tampa Bay watershed, including any new urban farming BMPs.
New Priority
MODERATE PRIORITY RESEARCH & MONITORING TOPICSRANK TOPIC CATEGORY
1Improve linkages between watershed & hydrodynamic models to better predict water quality, hydrology, sediment transport & circulation in the bay and resulting impacts to habitat & biota. Refine for shallow areas.
Existing Priority
2 Facilitate the development of Total Nitrogen TMDLs and BMAPs for waterbodies within the watershed.Existing Priority
3 Determine the assimilative capacity for nutrients in the Tampa Bay estuary.Existing Priority
4 Evaluate and monitor living shoreline techniques that potentially improve habitat and ecosystem value of altered Tampa Bay shorelines. New Priority
5 Better quantify ecosystem services of critical coastal habitats occurring within Tampa Bay, including carbon/nutrient cycling, ecosystem function assessments & biota use. New Priority
6 Re-evaluate the “Restoring the Balance” paradigm, considering habitat changes from population growth, climate change and sea level rise impacts. New Priority
6 Quantify ungaged streamflow and groundwater flow to Tampa Bay, and develop estimates of surface and groundwater flux to Tampa Bay.Existing Priority
6Determine important resources affected by changes in FW inflow. Mine existing data sources to examine effects of FW inflow changes on fisheries & other biological resources. Assess potential effects of MFLs on habitat & biota.
Existing Priority
9Better evaluate alternative sediment management/disposal techniques and restoration concepts to identify options for future disposal methods (e.g. dredge hole filling, marsh spraying, etc.).
New Priority
10 Evaluate new on-site disposal system technologies for reducing nutrient loads within the Tampa Bay watershed. New Priority
11Develop a best management practices (BMP) document for coastal habitat restoration in Tampa Bay that builds upon the lessons-learned & emerging techniques utilized in coastal habitat restoration projects.
New Priority
12Conduct early life history studies on important Gulf of Mexico commercial, recreational or priority fishery species (e.g. groupers, snappers, etc.) that utilize Tampa Bay as nursery habitat.
New Priority
13 Build-upon existing hydrodynamic models to estimate and forecast harmful algal bloom dynamics. New Priority
14 Better understand how coastal development impacts wetland habitat function and quality. New Priority
CHARTING THE COURSE: THE COMPREHENSIVE CONSERVATION AND MANAGEMENT PLAN FOR TAMPA BAY (AUGUST 2017 REVISION)
PAGE 154
Go to: TABLE OF CONTENTS | INDEX OF ACTIONS

RESE
ARCH
AND
MONI
TORI
NG PR
IORI
TIES 15 Better census environmentally sensitive habitats and wildlife for inclusion into baseline databases to improve modeling of spill trajectories for emergency response. New Priority
15Better understand the demographics, distribution & magnitude of human recreational use within the bay & watershed. Identify conflicts. If warranted, determine appropriate human access points with minimal impacts to the bay & its watershed.
New Priority
17 Determine other biotic indicators (e.g. sentinel fish or benthic invertebrate communities) that could describe Tampa Bay ecologic/habitat health. New Priority
18 Evaluate new/alternative technologies that decrease impacts to habitat and wildlife during dredging. New Priority
19 Improve monitoring, detection & tracking for high-priority existing or potential invasive species (e.g. lionfish, snakehead, pythons, tegu, etc.). New Priority
20 Determine bay scallop population estimates for Tampa Bay that would lead to sustainable, annual populations occurring in Tampa Bay. New Priority
CHARTING THE COURSE: THE COMPREHENSIVE CONSERVATION AND MANAGEMENT PLAN FOR TAMPA BAY (AUGUST 2017 REVISION)
PAGE 155
Go to: TABLE OF CONTENTS | INDEX OF ACTIONS

COMMUNICATIONS PLANTBEP is developing a new 5-year Communications Plan for consideration and approval by the Policy Board in 2018. This task is being supported by a contractor working with a Communications Committee composed of CAC members, staff and Board members.
THIS PLAN WILL: • Identify and rank appropriate public education and communications issues for TBEP to continue, expand or
initiate.
• Evaluate existing TBEP education and engagement programs and products, and identify how existing education campaigns and programs can be enhanced or strengthened.
• Identify and rank potential new education/social marketing campaigns which support CCMP goals and priorities, to be considered for implementation within the next 5 years.
• Include goals and objectives, target audiences, activities and implementers, key deliverables, budget and timeframe.
TBEP’s existing Communications Strategy, as of 2017, is detailed in Action PE-2.
CHARTING THE COURSE: THE COMPREHENSIVE CONSERVATION AND MANAGEMENT PLAN FOR TAMPA BAY (AUGUST 2017 REVISION)
PAGE 156
Go to: TABLE OF CONTENTS | INDEX OF ACTIONS

ACRONYMS FOR CCMP
ABM Agency on Bay Management
ACP Area Contingency Plan
AIS Automatic Identification System
ASR Aquifer Storage and Recovery
ATON Aids To Navigation
AWT Advanced Wastewater Treatment
BASIS Bay Area Science and Information Symposium
BPA Bisphenol A
BMAP Basin Management Action Plan
BMP Best Management Practice
BOD Biochemical Oxygen Demand
BRACE Bay Region Atmospheric Chemistry Experiment
CAC Community Advisory Committee (TBEP)
CAFE Corporate Average Fuel Economy
CAFO Concentrated Animal Feeding Operation
CARES County Alliance for Responsible Environmental Stewardship
CCHA Critical Coastal Habitat Assessment
CCMP Comprehensive Conservation and Management Plan
CHNEP Charlotte Harbor National Estuary Program
CISMA Cooperative Invasive Species Management Area
COC Contaminant of Concern
CRE Climate Ready Estuaries
CSAP Tampa Bay Climate Science Advisory Panel
CVIS Cooperative Vessel Tracking Service
CWA Clean Water Act
CWA Critical Wildlife Area (FWC)
DMMA Dredged Material Management Areas
DMMP Dredged Material Management Plan
DMR Discharge Monitoring Report
EDC Endocrine Disrupting Compound
ELAPP Environmental Lands Acquisition and Protection Program
EPA United States Environmental Protection Agency
EPCHC Environmental Protection Commission of Hillsborough County
ERP Environmental Resource Permit
EzDMR Electronic Discharge Monitoring Reporting system
FAC Florida Administrative Code
FARMS Facilitating Agricultural Resource Management System
FDACS Florida Department of Agriculture and Consumer Services
FDEP Florida Department of Environmental Protection
FDOH Florida Department of Health
FDOT Florida Department of Transportation
FIM Fisheries Independent Monitoring Program
FIO Florida Institute of Oceanography
FNMP Florida Master Naturalist Program
FOG Fats, Oils and Grease
FPL Florida Power and Light
FWC Florida Fish and Wildlife Conservation Commission
FWRI Fish and Wildlife Research Institute
FY&N Florida Yards and Neighborhoods
GCOOS Gulf of Mexico Coastal Ocean Observing System
GIS Geographic Information System
GOMA Gulf of Mexico Alliance
GPRA Government Performance and Results Act
HAB Harmful Algal Bloom
HBMP Hydro-Biological Monitoring Program
IRL Indian River Lagoon
ISMP Imperiled Species Management Plan
CHARTING THE COURSE: THE COMPREHENSIVE CONSERVATION AND MANAGEMENT PLAN FOR TAMPA BAY (AUGUST 2017 REVISION)
PAGE 157
Go to: TABLE OF CONTENTS | INDEX OF ACTIONS

KTTB Keep Tampa Bay Beautiful
LEPC Local Emergency Planning Committee
LID Low Impact Development
MAC Manatee Awareness Committee
MFL Minimum Flows and Levels
MGD Million Gallons Per Day
MPO Metropolitan Planning Organization
NFWF National Fish and Wildlife Foundation
NGO Non-Governmental Organization
NIH National Institutes of Health
NMFS National Marine Fisheries Service
NSF National Science Foundation
NOAA National Oceanic and Atmospheric Administration
NOx Nitrogen Oxide
NPDES National Pollutant Discharge Elimination System
OA Ocean Acidification
OAWP Office of Agricultural Water Policy
PAH Polycyclic Aromatic Hydrocarbon
PBDE Polybrominated Diphenyl Ether
PCB Polychlorinated Biphenols
PORTS Physical Oceanographic Real-Time System
PPCP Pharmaceuticals and Personal Care Products
PRF Pollution Recovery Fund
PSA Public Service Announcement
PV Photo Voltaic
RA Reasonable Assurance document
REDDy Introduced Reptile Early Detection and Documentation
RIB Rapid Infiltration Basin
RSM Regional Sediment Management
SBEP Sarasota Bay Estuary Program
SHARP South Hillsborough Aquifer Recharge Project
SLR Sea Level Rise
SQAP Sediment Quality Action Plan
SSO Sanitary Sewer Overflow
SWFWMD Southwest Florida Water Management District
SWIM Surface Water Improvement and Management Plan
TAC Technical Advisory Committee (TBEP)
TAP Tampa Augmentation Project
TBARTA Tampa Bay Area Regional Transit Authority
TBBI Tampa Bay Benthic Index
TBERF Tampa Bay Environmental Restoration Fund
TBEP Tampa Bay Estuary Program
TBNEP Tampa Bay National Estuary Program
TBNMC Tampa Bay Nitrogen Management Consortium
TBRPC Tampa Bay Regional Planning Council
TBW Tampa Bay Watch
TECO Tampa Electric Company
THSSC Tampa Bay Harbor Safety and Security Committee
TMDL Total Maximum Daily Load
TN Total Nitrogen
TP Total Phosphorus
TSS Total Suspended Solids
UCF University of Central Florida
UF University of Florida
UF/IFAS University of Florida Institute of Food and Agricultural Sciences
USACE U.S. Army Corps of Engineers
USCG United States Coast Guard
USF University of South Florida
USFWS United States Fish and Wildlife Service
USGS United States Geologic Survey
WWTP Wastewater Treatment Plant
ACRO
NYMS
FOR
CCMP
CHARTING THE COURSE: THE COMPREHENSIVE CONSERVATION AND MANAGEMENT PLAN FOR TAMPA BAY (AUGUST 2017 REVISION)
PAGE 158
Go to: TABLE OF CONTENTS | INDEX OF ACTIONS
Related Documents


