Chart Pack Chart Pack Review of the Commonwealth Government Review of the Commonwealth Government Securities market Securities market Discussion Paper, October 2002 Discussion Paper, October 2002

Chart Pack Review of the Commonwealth Government Securities market Discussion Paper, October 2002.
Dec 16, 2015
Welcome message from author
This document is posted to help you gain knowledge. Please leave a comment to let me know what you think about it! Share it to your friends and learn new things together.
Transcript

Chart PackChart Pack
Review of the Commonwealth Government Review of the Commonwealth Government
Securities market Securities market
Discussion Paper, October 2002Discussion Paper, October 2002

Chart 1: Commonwealth general Chart 1: Commonwealth general government net debtgovernment net debt
0
2
4
6
8
10
12
14
16
18
20
1991-92 1993-94 1995-96 1997-98 1999-00 2001-02
0
2
4
6
8
10
12
14
16
18
20
Net debt CGS on issue
Per cent of GDP Per cent of GDP
Source: Commonwealth of Australia Budget Strategy and Outlook 2002-03, Budget Paper No. 1; Commonwealth of Australia Final Budget Outcome 2001-02; and Australian Office of Financial Management, 2002.

Chart 2: Fixed coupon bonds Chart 2: Fixed coupon bonds outstanding by issuer type (June 2002)outstanding by issuer type (June 2002)
Commonw ealth 33%
State/Territory 31%
Corporate 36%
Source: Reserve Bank of Australia, 2002 (unpublished).

Chart 3: Benchmark Treasury Fixed Chart 3: Benchmark Treasury Fixed Coupon Bonds outstanding (June 2002)Coupon Bonds outstanding (June 2002)
0
2
4
6
8
10%Oct 02
9.5%Aug 03
9% Sep 04
7.5% J ul 05
6.75% Nov 06
10% Oct 07
8.75% Aug 08
7.5% Sep 09
5.75% J un 11
6.5% May 13
6.25% Apr 15
0
2
4
6
8$billion $billion
Source: Australian Office of Financial Management, 2002.

Chart 4: Treasury Indexed Bonds Chart 4: Treasury Indexed Bonds outstanding (June 2002)outstanding (June 2002)
0
1
2
3
4% Aug 05
4% Aug 10
4% Aug 15
4%Aug 20
0
1
2
3$billion $billion
Source: Australian Office of Financial Management, 2002.

Chart 5: Net short-term assets and Chart 5: Net short-term assets and Treasury Notes outstanding in 2001Treasury Notes outstanding in 2001
-4
-2
0
2
4
6
8
10
12
14
16
18
Jan-01 Feb-01 Mar-01 Apr-01 May-01 Jun-01 Jul-01 Sep-01 Oct-01 Nov-01 Dec-01
-4
-2
0
2
4
6
8
10
12
14
16
18
Treasury Notes Net short-term assets
$billion $billion
Source: Australian Office of Financial Management, 2002 (unpublished).

Chart 6: State and Territory bonds Chart 6: State and Territory bonds outstanding (June 2002)outstanding (June 2002)
0
2
4
6
8
10
12
14
16
1-3 year 3-5 year 5-7 year 7-10 year 10+ year
years to maturity
0
2
4
6
8
10
12
14
16$billion $billion
Source: Salomon Smith Barney (2002) AusBIG Profile Report, August 2002, Australia.

Chart 7: Corporate bonds outstanding Chart 7: Corporate bonds outstanding by issuerby issuer
Non-residents32%
Industrial/Other2%
Media1%
Transport4%
Mining3%
Financials38%
Telecos4%
Property8%
Retail2%
Utilities6%
Source: Reserve Bank of Australia, 2002 (unpublished).

Chart 8: Maturity profile of corporate fixed Chart 8: Maturity profile of corporate fixed coupon bonds outstanding (June 2002)coupon bonds outstanding (June 2002)
0
5
10
15
20
25
1-3 year 3-5 year 5-7 year 7-10 year 10+ year
years to maturity
0
5
10
15
20
25$billion $billion
Source: Salomon Smith Barney (2002) AusBIG Profile Report, August 2002, Australia.

Chart 9: History of outstanding bondsChart 9: History of outstanding bonds
0
20
40
60
80
100
120
1990 1991 1992 1993 1994 1995 1996 1997 1998 1999 2000 2001 2002
0
20
40
60
80
100
120
Commonw ealth
State
Corporate
$billion $billion
Note: The figures for the Commonwealth include indexed bonds and exclude the Commonwealth's own holdings. Corporate estimates include floating-rate bonds but exclude asset-back securities.Source: Reserve Bank of Australia, 2002.
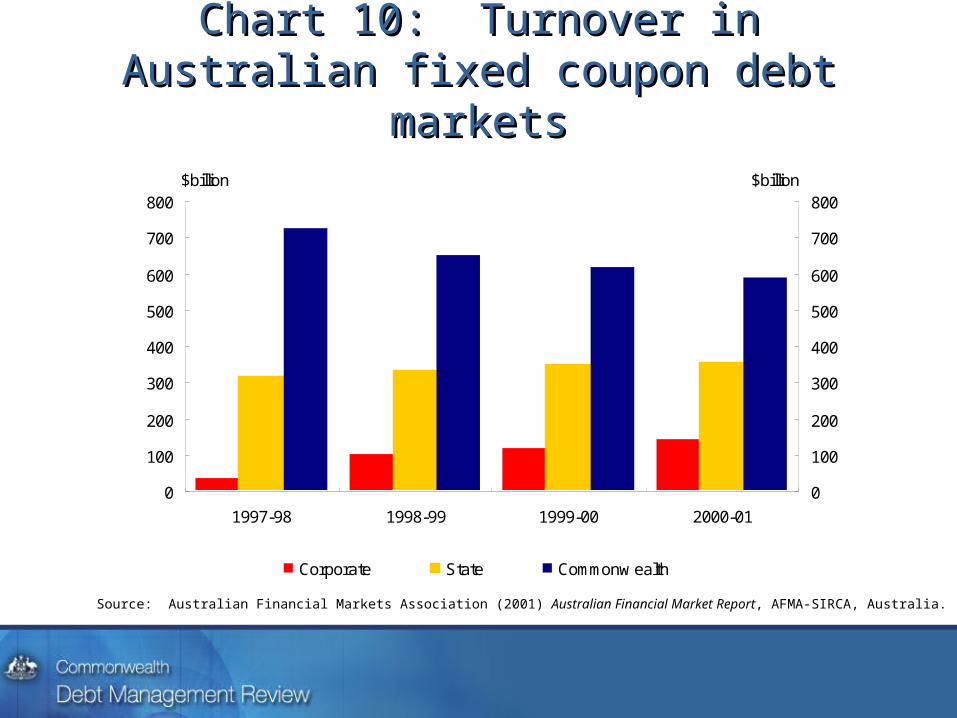
Chart 10: Turnover in Australian fixed Chart 10: Turnover in Australian fixed coupon debt marketscoupon debt markets
0
100
200
300
400
500
600
700
800
1997-98 1998-99 1999-00 2000-01
0
100
200
300
400
500
600
700
800
Corporate State Commonw ealth
$billion $billion
Source: Australian Financial Markets Association (2001) Australian Financial Market Report, AFMA‑SIRCA, Australia.

Chart 11: Turnover of Treasury bonds Chart 11: Turnover of Treasury bonds and Treasury bond futures contractsand Treasury bond futures contracts
0
200
400600
800
1000
1200
14001600
1800
2000
1996-97 1997-98 1998-99 1999-00 2000-01
0
200
400600
800
1000
1200
14001600
1800
2000
Treasury bonds Treasury bond futures
$billion $billion
Source: Australian Financial Markets Association (2001) Australian Financial Market Report, AFMA‑SIRCA, Australia.

Chart 12: Turnover of Treasury bonds Chart 12: Turnover of Treasury bonds and interest rate swapsand interest rate swaps
0
200
400
600
800
1000
1200
1996-97 1997-98 1998-99 1999-00 2000-01
0
200
400
600
800
1000
1200
Treasury bonds Interest rate sw aps
$billion $billion
Source: Australian Financial Markets Association (2001) Australian Financial Market Report, AFMA‑SIRCA, Australia.

Chart 13: Turnover in the repurchase Chart 13: Turnover in the repurchase market by instrumentmarket by instrument
0
500
1000
1500
2000
2500
3000
3500
4000
4500
1998-99 1999-00 2000-01
0
500
1000
1500
2000
2500
3000
3500
4000
4500
Corporate State Commonw ealth
$billion $billion
Source: Australian Financial Markets Association (2001) Australian Financial Market Report, AFMA‑SIRCA, Australia.

Chart 14: Commonwealth Government Chart 14: Commonwealth Government Securities yield curve (June 2002)Securities yield curve (June 2002)
5.0
5.2
5.4
5.6
5.8
6.0
6.2
1 2 3 4 5 6 7 9 11 13
Years to maturity
5.0
5.2
5.4
5.6
5.8
6.0
6.2Yield (per cent) Yield (per cent)
Source: Bloomberg, 2002.
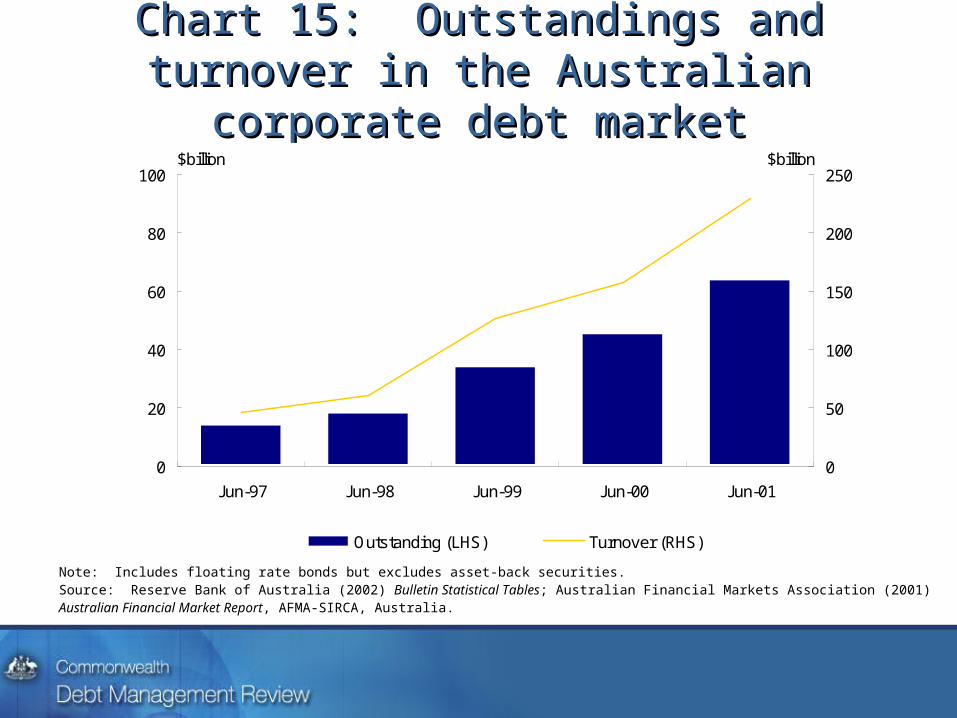
Chart 15: Outstandings and turnover in Chart 15: Outstandings and turnover in the Australian corporate debt marketthe Australian corporate debt market
0
20
40
60
80
100
Jun-97 Jun-98 Jun-99 Jun-00 Jun-01
0
50
100
150
200
250
Outstanding (LHS) Turnover (RHS)
$billion $billion
Note: Includes floating rate bonds but excludes asset-back securities.Source: Reserve Bank of Australia (2002) Bulletin Statistical Tables; Australian Financial Markets Association (2001) Australian Financial Market Report, AFMA‑SIRCA, Australia.

Chart 16: The interest rate swap curve Chart 16: The interest rate swap curve (June 2002)(June 2002)
Source: Bloomberg, 2002.
5.0
5.2
5.4
5.6
5.8
6.0
6.2
6.4
6.6
1 2 3 4 5 6 7 8 9 10
Years to maturity
5.0
5.2
5.4
5.6
5.8
6.0
6.2
6.4
6.6Yield (per cent) Yield (per cent)
Chart 17: Spread of corporate bonds to Chart 17: Spread of corporate bonds to Treasury bondsTreasury bonds
0
20
40
60
80
100
120
Jul-97 Mar-98 Nov-98 Jul-99 Mar-00 Nov-00 Jul-01 Mar-02
0
20
40
60
80
100
120
AAA AA A
Basis points Basis points
Note: Bonds with three years to maturity.Source: Reserve Bank of Australia (2002) Bulletin Statistical Tables.

Chart 18: US corporate-government Chart 18: US corporate-government bond spread and Dow Jones Indexbond spread and Dow Jones Index
2.7
2.8
2.9
3
3.1
3.2
3.3
3.4
3.5
3.6
03/09/2001 03/11/2001 03/01/2002 03/03/2002 03/05/2002 03/07/2002
8000
8500
9000
9500
10000
10500
11000
Credit spread (LHS) Dow Jones (RHS)
Enron
Percentage points Index
Note: Credit spread = ten-year BAA minus ten-year US Treasuries.Source: Datastream, 2002.

Chart 19: Australia’s current account Chart 19: Australia’s current account balancebalance
-7
-6
-5
-4
-3
-2
-1
0
1
2
1960-61 1965-66 1970-71 1975-76 1980-81 1985-86 1990-91 1995-96 2000-01
-7
-6
-5
-4
-3
-2
-1
0
1
2Per cent of GDP Per cent of GDP
Source: Australian Bureau Statistics (2002) Australian System of National Accounts, Cat. No. 5204, AusStats Time Series Spreadsheets, ABS, Canberra.

Chart 20: CGS outstanding if retired at Chart 20: CGS outstanding if retired at maturity and no further issuancematurity and no further issuance
0
20
40
60
80
1996-97 1998-99 2000-01 2002-03 2004-05 2006-07 2008-09
0
20
40
60
80Outcomes Projections
$billion $billion
Note: Refers to Treasury bonds outstanding.Source: Australian Office of Financial Management and Treasury projections, 2002 (unpublished).

Chart 21: Growing the CGS market in Chart 21: Growing the CGS market in line with nominal growth in GDPline with nominal growth in GDP
Note: Refers to Treasury bonds outstanding.Source: Australian Office of Financial Management and Treasury projections, 2002 (unpublished).
0
20
40
60
80
1996-97 1998-99 2000-01 2002-03 2004-05 2006-07 2008-09
0
20
40
60
80
Additional f inancial assets CGS on issue
$billion $billion
Outcomes Projections
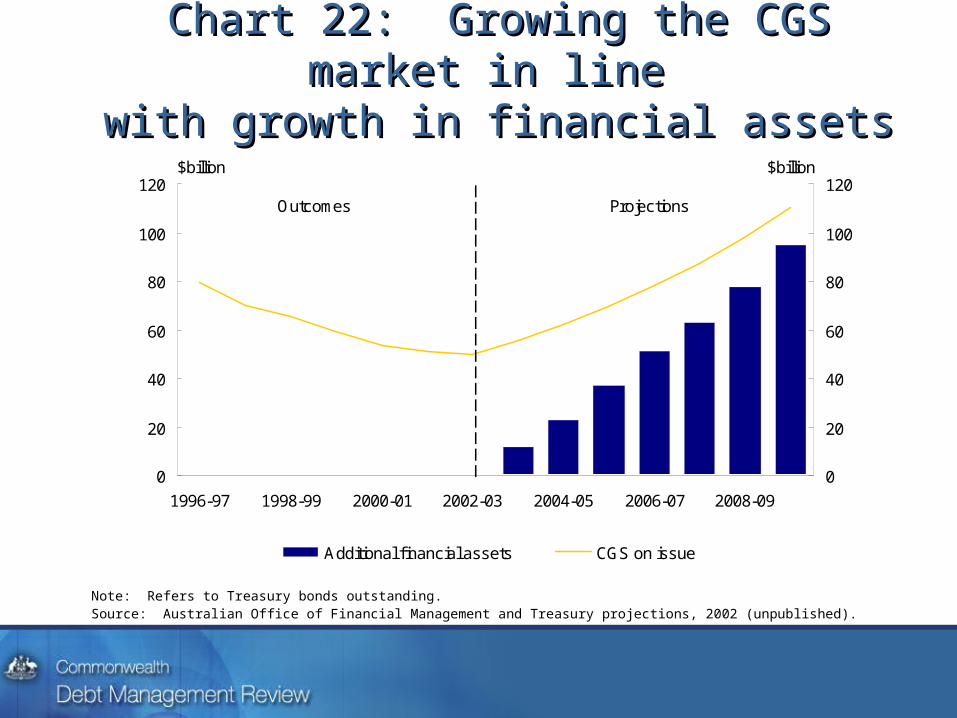
Chart 22: Growing the CGS market in line Chart 22: Growing the CGS market in line
with growth in financial assetswith growth in financial assets
Note: Refers to Treasury bonds outstanding.Source: Australian Office of Financial Management and Treasury projections, 2002 (unpublished).
0
20
40
60
80
100
120
1996-97 1998-99 2000-01 2002-03 2004-05 2006-07 2008-09
0
20
40
60
80
100
120
Additional f inancial assets CGS on issue
$billion $billion
Outcomes Projections

Chart 23: Australia’s financial asset Chart 23: Australia’s financial asset market size (June 2002)market size (June 2002)
0
100
200
300
400
500
600
700
800
State bonds State & AAAcorporate
bonds
All investmentgrade bonds
ASX100 &investment
grade bonds
ASX 200 &investment
grade bonds
ASX 300 &investment
grade bonds
0
100
200
300
400
500
600
700
800
Debt Equity
$billion $billion
Note: Investment grade bonds refer to debt securities with a credit rating of BBB or higher.Source: Salomon Smith Barney (2002) AusBIG Profile Report, August 2002, Australia; and Bloomberg, 2002.

Chart 24: Size of Government investment Chart 24: Size of Government investment possible with investment limitspossible with investment limits
Source: Salomon Smith Barney (2002) AusBIG Profile Report, August 2002, Australia; and Bloomberg, 2002.
0
5
10
15
20
25
30
35
40
45
50
State bonds State & AAAcorporate
bonds
All investmentgrade bonds
ASX100 &investment
grade bonds
ASX 200 &investment
grade bonds
ASX 300 &investment
grade bonds
0
5
10
15
20
25
30
35
40
45
50$billion $billion
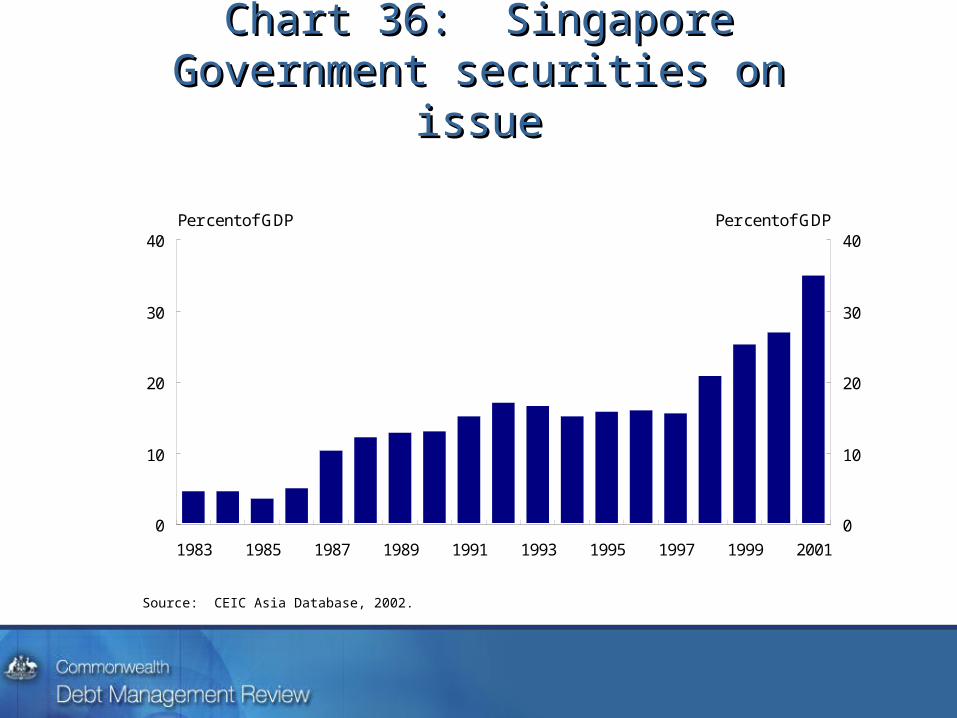
Chart 36: Singapore Government Chart 36: Singapore Government securities on issuesecurities on issue
0
10
20
30
40
1983 1985 1987 1989 1991 1993 1995 1997 1999 2001
0
10
20
30
40Per cent of GDP Per cent of GDP
Source: CEIC Asia Database, 2002.

Chart 37: Hong Kong Government Chart 37: Hong Kong Government securities on issuesecurities on issue
0
2
4
6
8
10
1990 1991 1992 1993 1994 1995 1996 1997 1998 1999 2000 2001
0
2
4
6
8
10Per cent of GDP Per cent of GDP
Source: CEIC Asia Database, 2002.
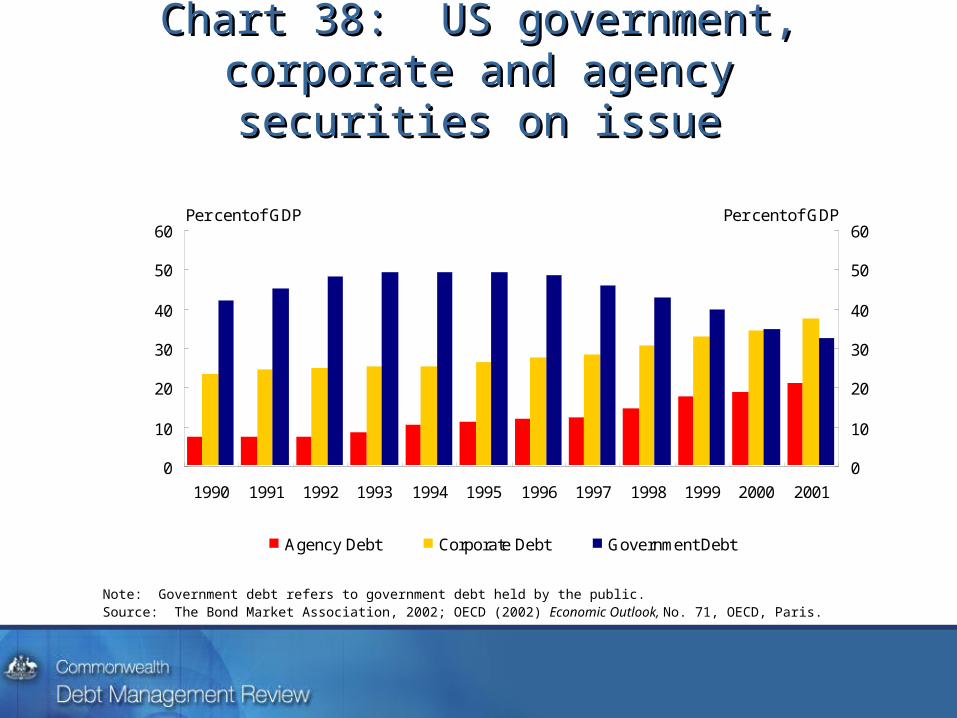
Chart 38: US government, corporate Chart 38: US government, corporate and agency securities on issueand agency securities on issue
0
10
20
30
40
50
60
1990 1991 1992 1993 1994 1995 1996 1997 1998 1999 2000 2001
0
10
20
30
40
50
60
Agency Debt Corporate Debt Government Debt
Per cent of GDP Per cent of GDP
Note: Government debt refers to government debt held by the public.Source: The Bond Market Association, 2002; OECD (2002) Economic Outlook, No. 71, OECD, Paris.

Chart 39: Korean government and Chart 39: Korean government and corporate securities on issuecorporate securities on issue
0
5
10
15
20
25
30
1987 1989 1991 1993 1995 1997 1999 2001
0
5
10
15
20
25
30
Treasury Bonds Total Government Bonds Corporate Bonds
Per cent of GDP Per cent of GDP
Note: Total Government bonds comprise of Treasury Bonds, Foreign Exchange Stabilisation Bonds, National Housing Bonds and Grain Securities. Source: Korea National Statistics Office, 2002.

Chart 40: New Zealand Government Chart 40: New Zealand Government asset portfolios: 2002 to 2006asset portfolios: 2002 to 2006
0
2
4
6
8
10
GovernmentSuperannuation Fund
EarthquakeCommission
AccidentCompensationCommission
New ZealandSuperannuation Fund
0
2
4
6
8
10$billion $billion
Note: A number of other substantial asset portfolios are held by the Government, including assets held by the Reserve Bank of New Zealand, and the New Zealand Debt Management Office.Source: New Zealand Treasury, (2002) Budget Economic and Fiscal Update.
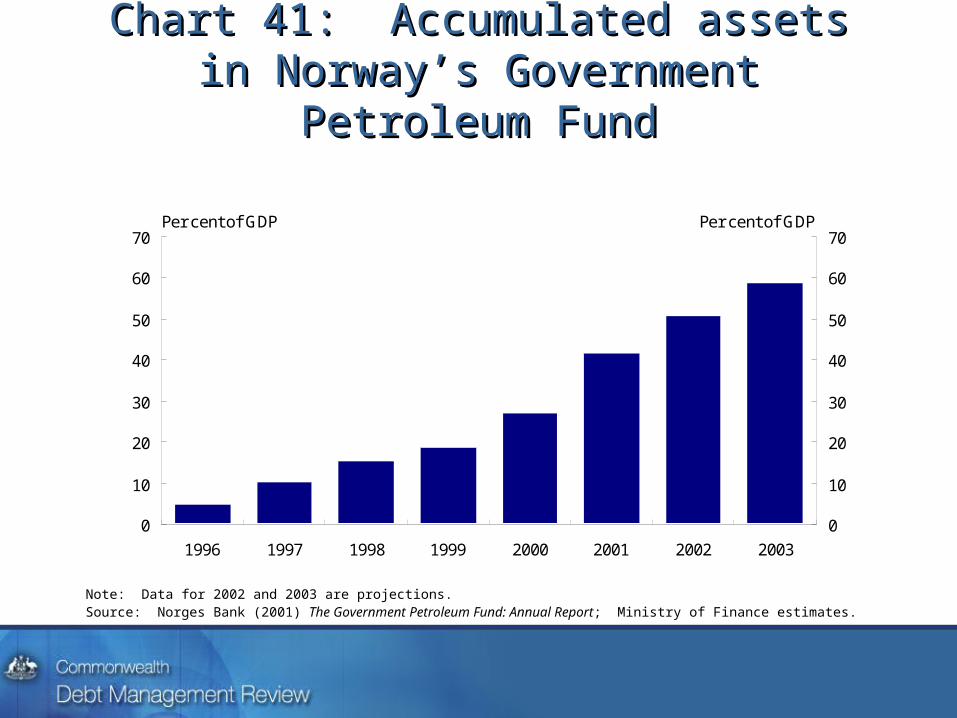
Chart 41: Accumulated assets in Chart 41: Accumulated assets in Norway’s Government Petroleum FundNorway’s Government Petroleum Fund
0
10
20
30
40
50
60
70
1996 1997 1998 1999 2000 2001 2002 2003
0
10
20
30
40
50
60
70Per cent of GDP Per cent of GDP
Note: Data for 2002 and 2003 are projections.Source: Norges Bank (2001) The Government Petroleum Fund: Annual Report; Ministry of Finance estimates.

Chart 42: Canadian Pension Plan Chart 42: Canadian Pension Plan asset holdingsasset holdings
0
10
20
30
40
50
60
1999 2000 2001 2002
0
10
20
30
40
50
60
CPP Investment Board Canadian Pension Plan (CPP) Total
$billion $billion
Source: Canadian Pension Plan Annual Report, various years, Government of Canada; Canadian Pension Plan Investment Board, Annual Report, various years.

Chart 43: Accumulated assets in Chart 43: Accumulated assets in Ireland’s National Pension Reserve FundIreland’s National Pension Reserve Fund
0
2
4
6
8
10
2000 2001
0
2
4
6
8
10
Accumulated Government contributions Total assets
€ billion € billion
Source: National Pension Reserve Fund Commission, 2001.

Table 1: Commonwealth Government Table 1: Commonwealth Government Securities outstandingSecurities outstanding
1996 1997 1998 1999 2000 2001 2002$b $b $b $b $b $b $b
Treasury Fixed Coupon Bonds (a) 77.1 79.5 70.0 65.2 59.1 53.7 51.1Treasury Indexed Bonds 3.7 4.5 5.2 5.6 5.9 6.2 6.4Treasury Notes 15.8 13.3 10.3 7.0 5.8 5.1 4.2Treasury Adjustable Rate Bonds 7.1 8.0 4.3 4.3 2.5 0.0 0.0Other 0.3 0.8 0.8 0.8 0.5 0.3 0.4Total 103.9 106.1 90.6 82.9 73.8 65.3 62.1
30 June
Note: Net of Commonwealth holdings and debt on issue for the States and Territories.Source: Australian Office of Financial Management, 2002.

Table 2: Correlation of changes in interest Table 2: Correlation of changes in interest rate swap rate with other debt security yieldsrate swap rate with other debt security yields
AAA AA ACommonw ealth Government Securities 0.990 0.974 0.972Interest rate sw ap 0.975 0.969 0.966
Corporate yields
Note: Correlation calculations based on monthly yield data fro three-year fixed coupon bonds over the period August 1997 to June 2002.Source: Treasury calculations based on data from Bloomberg, 2002.

Table 3: Holdings of CGS by sectorTable 3: Holdings of CGS by sector
1997-98 1998-99 1999-00 2000-01 2001-02$b $b $b $b $b
Central bank 11.5 10.2 14.9 14.6 10.4Banks and other depository corporations 10.2 7.7 6.0 3.3 3.6Life insurance corporations 12.4 12.4 10.0 8.5 7.8Other insurance corporations 7.0 7.0 5.6 4.7 4.4Pension funds 15.1 13.8 14.2 12.3 11.6Financial intermediaries 1.8 3.4 3.2 1.9 1.6Households 0.2 0.1 0.1 0.1 0.1Central borrow ing authorities 1.0 1.5 1.7 0.9 0.5Rest of w orld 37.8 31.5 22.3 23.0 23.8Total 97.0 87.8 78.1 69.4 63.9
Note: Amount outstanding at the end of the June quarter. Estimates for 2001-02 are for the end of the March quarter.Source: Australian Bureau of Statistics (2002) Financial Accounts, Cat. No. 5232, March quarter.
Related Documents