© February 2014 | 2000 Daniel Island Drive, Charleston, SC 29492 T 800.443.9441 E [email protected] W www.blackbaud.com Charitable Giving Report How Nonprofit Fundraising Performed in 2013 Presented by Steve MacLaughlin, Director, Blackbaud Idea Lab FEATURING A CLOSER LOOK BY TODD COHEN, FOUNDER, PHILANTHROPY NORTH CAROLINA

Welcome message from author
This document is posted to help you gain knowledge. Please leave a comment to let me know what you think about it! Share it to your friends and learn new things together.
Transcript

© February 2014 | 2000 Daniel Island Drive, Charleston, SC 29492 T 800.443.9441 E [email protected] W www.blackbaud.com
Charitable Giving Report How Nonprofit Fundraising Performed in 2013
Presented bySteve MacLaughlin, Director, Blackbaud Idea Lab
FEATURING A CLOSER LOOK BY TODD COHEN, FOUNDER, PHILANTHROPY NORTH CAROLINA

© February 2014 | 2000 Daniel Island Drive, Charleston, SC 29492 T 800.443.9441 E [email protected] W www.blackbaud.com 1
2013 Charitable Giving Report
The Charitable Giving Report leverages findings from The Blackbaud Index to provide the
largest analysis of actual overall charitable giving and online giving data in the nonprofit
sector. The aim of the Report is to provide a benchmark for giving and help inform
nonprofits’ fundraising strategies in 2014. It also provides valuable insight from experts in
the field, exploring trends and successful fundraising tactics in the A Closer Look section.
The Charitable Giving Report, derived from The Blackbaud Index,
includes overall giving data from 4,129 nonprofit organizations
representing $12.5 billion in total fundraising from 2013. The Report
also includes online giving data from 3,359 nonprofits representing
$1.7 billion in online fundraising from 2013. This year’s report
features the addition of overall charitable giving data from 985
organizations and online giving data from 778 organizations.
Significant work has gone into building the analysis model and
making sure the data meets strict requirements. This includes
collecting giving data on a monthly basis over a period of 24
months, checking and rechecking for anomalies, classifying each
organization by sector using the National Taxonomy of Exempt
Entities (NTEE) code, matching and retrieving reported total revenue
information, and applying statistical expertise to the data.
In addition to this year-in-review report, The Blackbaud Index is
updated on a monthly basis to showcase the latest charitable giving
trends. Visit www.blackbaud.com/blackbaudindex for additional
insight, to chart your organization’s performance against the Index,
and to sign up for free monthly fundraising alerts.
SUMMARY OF RESEARCH FINDINGS
In 2013, overall charitable giving in the United States was up 4.9% on
a year-over-year basis. Large organizations grew by 5.7%, medium
organizations grew 3.8%, and small nonprofits grew 3.6%
compared to the same time period in 2013. 2013 marked
the largest year-over-year increase in overall charitable
giving since the recession.
Giving to International Affairs organizations grew 13.2%,
accounting for the largest year-over-year increase by any
sector in the analysis. This was a complete turnaround
for this sector from 2012, which saw the largest decrease
in fundraising results. In 2012, International Affairs organizations
returned to pre-disaster levels and in 2013 experienced fundraising
growth once again.
Every sector had year-over-year fundraising growth in 2013. This includes
strong growth by environment and animal welfare organizations, as well as
education institutions. Healthcare, human services, international affairs, and
public and society organizations all returned to positive growth compared
to 2012. This indicates strong momentum heading into 2014, especially for
some sectors that have struggled in recent years.
2013 really showed that the fundraising environment is
continuing to improve for the vast majority of organizations.
The combination of growth across organizations of all
sizes and a reversal of negative trends by all sectors
contributed to a positive year.
Online giving grew 13.5% in 2013 compared to 2012.
Large organizations grew by 12.7%, medium organizations grew 11.3%,
and small nonprofits grew 18.4% on a year-over-year basis. That’s a
further increase over 2012’s 10.7% growth rate and shows that online
giving is still thriving.
This is the second consecutive year that online giving has experienced
double-digit growth rates. Six of the nine sectors in the analysis had
Overall giving grew 4.9% in
2013 compared to 2012.

© February 2014 | 2000 Daniel Island Drive, Charleston, SC 29492 T 800.443.9441 E [email protected] W www.blackbaud.com 2
2013 Charitable Giving Report
2013 GIVING TRENDS
Overall giving in 2013 grew 4.9% on a year-over-year basis for the
4,129 nonprofit organizations in the analysis. This was an increase
over the 2012 growth rate and points to positive signs that giving in
the United States is returning to pre-recession levels.
Fundraising by large organizations, with annual total fundraising more
than $10 million, was up by 5.7%. This was a significant rebound from
2012 and was the highest growth rate among organizations in the
analysis. Medium organizations, with annual total fundraising between
$1 million and $10 million, had an increase of 3.8% in 2013. Small
nonprofits, with annual total fundraising less than $1 million, grew their
fundraising 3.6% compared to 2012.
Online giving in 2013 grew 13.5% year-over-year for the 3,359
nonprofit organizations in the analysis. Online fundraising continues to
be a growth engine for nonprofit organizations, and there is no reason
to expect this growth to slow for the foreseeable future.
year-over-year growth over 10%, with faith-based organizations having the
largest increase.
There was a decrease in the percentage of giving that comes from online
donations. In 2013, approximately 6.4% of overall fundraising revenue,
excluding grants, was raised online.
The continued increases in both overall and online giving are positive
signs for the nonprofit sector. Investments made in people, process, and
technology during the recession helped many organizations. Improving
economic conditions, a robust stock market, and other factors all
contributed to fundraising growth in 2013.
KEY FINDINGS The Charitable Giving Report analyzes trends from more than $12.5 billion in fundraising revenue from 2013. Here are some key findings:
1. Overall charitable giving grew 4.9% in 2013, while online giving grew 13.5%.
2. Online giving accounted for 6.4% of all charitable giving in 2013.
3. Large organizations had the greatest increase in overall charitable giving in 2013, while small organizations had the greatest increase in online giving during 2013.
4. International affairs organizations had the greatest increase in overall charitable giving in 2013 (13.2%), while faith-based organizations had the greatest increase in online giving in 2013 (18.1%).
5. More than one-third (33.6%) of overall charitable giving happens in the last three months of the year, with the highest percentage (17.5%) coming in December.
Overall Giving Trends by Organization Size
Size YOY % Change
Small (Less than $1M) 3.6%
Medium ($1M - $10M) 3.8%
Large ($10M+) 5.7%
Total 4.9%
Online Giving Trends by Organization Size
Size YOY % Change
Small (Less than $1M) 18.4%
Medium ($1M - $10M) 11.3%
Large ($10M+) 12.7%
Total 13.5%

© February 2014 | 2000 Daniel Island Drive, Charleston, SC 29492 T 800.443.9441 E [email protected] W www.blackbaud.com 3
2013 Charitable Giving Report
Nonprofit organizations of all sizes grew their online giving in 2013,
and their growth rates exceeded 2012 growth levels across the
board. Small nonprofits, with annual total fundraising less than
$1 million, grew their online fundraising 18.4% compared to 2012.
Medium nonprofits, with annual total fundraising between $1 million
and $10 million, had a year-over-year increase of 11.3% in their online
fundraising. Large organizations, with annual total fundraising more
than $10 million, grew their online fundraising by 12.7% in 2013
compared to 2012.
GIVING TRENDS BY NONPROFIT SECTOR
Each organization in The Blackbaud Index is categorized by one of
nine sectors using its National Taxonomy of Exempt Entities — or
NTEE code — as reported on its 990 tax return. These sectors
are arts and culture, education (predominantly higher education
and K-12 independent schools), environment and animal welfare,
faith-based, healthcare, human services, international affairs, and
public and society benefit. Each sector is weighted based on Giving
USA data to ensure that no individual organization or sector is
overrepresented in the analysis.
International affairs groups had the largest increase in fundraising,
with 13.2% year-over-year growth. Environment and animal welfare
organizations were runners-up,
with an 8.6% growth rate, followed by education institutions, which
grew by 6.5% in 2013.
In an effort to provide the most useful data for organizations in
the healthcare field, Blackbaud has split the healthcare sector
into two groups. The healthcare sector now tracks fundraising
revenue for hospitals, nursing facilities, psychiatric facilities, and
other healthcare centers, while the medical research sector tracks
fundraising revenue for organizations that raise money to fund
medical research, as well as medical education and advocacy.
In 2013, this split revealed that healthcare organizations grew by 3.6%,
while medical research organizations grew by 1.4% in overall giving.
This sector had the smallest year-over-year growth in the analysis.
Online giving to faith-based organizations grew the most in 2013 with
an 18.1% year-over-year increase. This is the first year that we have
included faith-based organizations in the published report. Healthcare
(14.5%), education (14.4%), and environment and animal welfare
(13.3%) organizations all had very positive online giving growth in 2013.
Arts and culture, public and society benefit, and medical research
nonprofits had single-digit
growth rates in 2013. The
medical research sector had
the smallest growth rate, with
a 4.9% increase in online
giving. This reflects the trend in
overall giving to these types of
organizations.
Online giving in 2013
represented a growth
opportunity for the nonprofit
organizations in the analysis.
Specific events – like the Boston
Marathon bombings, Midwest
storms, and Philippines typhoon
disaster – clearly drove online
giving during the year. End-of-
year giving was boosted by an
increase in #GivingTuesday
donations. This is a trend
to watch over time as the
movement grows.
International affairs groups had the largest
increase in fundraising, with 13.2% year-over-
year growth.

© February 2014 | 2000 Daniel Island Drive, Charleston, SC 29492 T 800.443.9441 E [email protected] W www.blackbaud.com 4
2013 Charitable Giving Report
5%
4%
3%
2%
1%
6%
11%
10%
9%
8%
7%
12%
13%
5%
4%
3%
2%
1%
6%
MEDICALRESEARCH
PUBLIC/SOCIETYBENEFIT
ARTS &CULTURE FAITH-BASED EDUCATIONHUMAN SERVICES HEALTHCARE
ENVIRONMENT/ANIMAL WELFARE
2013 OVERALL GIVING TRENDS BY SECTOR
3.6%
8.6%
INCREASE
3.1%3.5%
INTERNATIONALAFFAIRS
6.5%
11%
10%
9%
8%
7%
12%
13% 13.2%
1.4%1.8%
3.6%
5%
10%
15%
20%
5%
10%
15%
20%
2013 ONLINE GIVING TRENDS BY SECTOR
PUBLIC/SOCIETYBENEFIT
ARTS &CULTURE HUMAN SERVICES
INTERNATIONALAFFAIRS
ENVIRONMENT/ANIMAL WELFARE EDUCATION HEALTHCARE FAITH-BASED
13.3%
18.1%
11.8%12.9%
14.4%
MEDICAL RESEARCH
4.9%
7.2%8.5%
14.5%

© February 2014 | 2000 Daniel Island Drive, Charleston, SC 29492 T 800.443.9441 E [email protected] W www.blackbaud.com 5
2013 Charitable Giving Report
GIVING TRENDS BY MONTH
The analysis looked at the distribution of giving across all of 2013.
More than one-third of all charitable giving happens in the last three
months of the year, and this trend has remained consistent for several
years now. We did see a decrease in December giving, from 18% in
2012 to 17.5% in 2013.
There continues to be a spike in giving during June that happens
because of a focus by some nonprofit organizations on end-of-fiscal-
year giving. This trend continues to support the belief that nonprofit
organizations can diversify their giving across the calendar year with
the right amount of focus.
Online giving also has a significant amount of fundraising taking place
during the final months of the year. Just over 35% of online giving
happened during October, November, and December of 2013. Both
human services and public and society benefit organizations had very
high concentration of online giving at year’s end.
Almost every sector raised more than 20% of its annual online giving
during December. The exception was medical research, which raised
just 5.6% of its total online giving in December. This might seem
puzzling considering that medical research organizations raised 22.5%
of their entire fundraising in the last month of the year. This contrast
is likely because the vast majority of online giving to medical research
organizations is through peer-to-peer fundraising events. These run,
walk, and ride events are often held throughout the year and very few
happen during the month of December.
OCTNOV
DEC
Online giving also reached the year’s high in December – accounting for 18.8% of 2013’s online gifts. January was the slowest month of the year for online giving, bringing in only 4.8% of the year’s online donations.
DECEMBER
18.8%
JANUARY
4.8%Overall giving reached the year’s high in December – accounting for 17.5% of 2013’s total gifts. February was the slowest month of the year for overall giving, bringing in only 5.8% of the year’s total charitable contributions.
DECEMBER
17.5%
FEBRUARY
5.8%

© February 2014 | 2000 Daniel Island Drive, Charleston, SC 29492 T 800.443.9441 E [email protected] W www.blackbaud.com 6
2013 Charitable Giving Report
2013 Overall Giving Distribution by Month by Sector
Sector Jan Feb Mar Apr May Jun Jul Aug Sept Oct Nov Dec
Arts and Culture 7.2% 7.0% 8.3% 7.3% 8.1% 9.8% 6.4% 6.4% 7.4% 8.4% 7.1% 16.5%
Education 8.3% 5.6% 7.2% 7.2% 7.5% 10.3% 6.3% 6.2% 7.2% 8.1% 7.0% 18.9%
Environment, Animals 6.8% 5.8% 7.7% 8.1% 7.8% 9.4% 9.0% 6.3% 7.2% 7.5% 7.4% 17.0%
Healthcare 7.9% 5.6% 6.9% 7.7% 7.7% 8.4% 7.7% 6.5% 7.9% 8.9% 8.2% 16.7%
Human Services 7.5% 5.8% 6.6% 7.2% 7.5% 8.7% 8.9% 7.0% 6.6% 7.4% 9.9% 16.7%
International Affairs 6.7% 5.1% 6.2% 18.5% 5.3% 6.2% 5.4% 6.9% 6.7% 7.4% 10.4% 15.4%
Medical Research 8.4% 5.2% 8.0% 6.6% 5.7% 10.5% 4.9% 6.3% 6.2% 9.4% 6.2% 22.5%
Public/Society Benefit 9.1% 5.6% 8.8% 8.0% 7.9% 6.9% 7.8% 6.7% 6.4% 8.0% 7.2% 17.7%
Faith-based 6.0% 6.6% 8.0% 7.8% 8.8% 9.8% 7.4% 6.5% 7.1% 7.5% 6.3% 18.3%
All Sectors 7.6% 5.8% 7.2% 8.5% 7.5% 9.0% 7.3% 6.6% 7.0% 8.0% 8.1% 17.5%
2013 Online Giving Distribution by Month by Sector
Sector Jan Feb Mar Apr May Jun Jul Aug Sept Oct Nov Dec
Arts and Culture 6.0% 6.4% 10.6% 8.2% 6.7% 7.6% 4.7% 6.1% 6.0% 9.1% 6.8% 21.8%
Education 5.4% 7.4% 7.8% 8.4% 9.3% 9.5% 5.0% 4.7% 5.9% 7.4% 6.8% 22.5%
Environment, Animals 5.7% 6.2% 8.1% 8.9% 7.4% 6.3% 5.6% 6.1% 6.4% 6.1% 6.8% 26.4%
Healthcare 7.1% 7.9% 6.7% 6.8% 6.8% 5.0% 5.3% 5.7% 9.3% 9.4% 7.5% 22.6%
Human Services 5.5% 5.8% 6.0% 6.7% 7.5% 5.8% 4.9% 4.9% 6.3% 6.3% 11.5% 28.9%
International Affairs 4.1% 3.9% 6.3% 7.9% 12.5% 4.3% 4.9% 6.8% 5.3% 6.2% 14.1% 23.7%
Medical Research 3.5% 6.0% 10.0% 15.6% 12.5% 7.3% 5.7% 7.4% 11.8% 10.8% 3.8% 5.6%
Public/Society Benefit 4.9% 4.8% 6.6% 6.4% 6.3% 6.4% 5.3% 5.2% 6.5% 6.8% 11.5% 29.3%
Faith-based 6.0% 6.3% 6.8% 7.6% 7.5% 6.0% 5.9% 5.8% 6.1% 6.5% 15.0% 20.6%
All Sectors 4.8% 5.9% 7.9% 10.1% 10.0% 6.5% 5.3% 6.2% 7.9% 8.1% 8.5% 18.8%
Based on Blackbaud’s online giving data from more than 3,800 customers who received an online donation Tuesday, December 3:
• Online giving on #GivingTuesday 2013 was up 90% compared to 2012. Blackbaud processed more than $19.2 million in online donations.
• The average online gift Tuesday, December 3, was $142.05, which was significantly up from $101.60 in 2012.

© February 2014 | 2000 Daniel Island Drive, Charleston, SC 29492 T 800.443.9441 E [email protected] W www.blackbaud.com 7
2013 Charitable Giving Report
TRENDS BY PERCENTAGE OF TOTAL FUNDRAISING FROM ONLINE GIVING
Blackbaud has been measuring the percentage of total fundraising
that comes from online giving for many years now. This metric can
be used by nonprofit organizations to benchmark their online giving
performance against peer organizations within each sector or of a
similar size.
Blackbaud used data from The Blackbaud Index over the past year
to examine percentage of total fundraising that came from online
giving. We looked at total giving for 3,135 organizations with $10.5
billion in total fundraising and found that, on average, online donations
accounted for 6.4% of overall fundraising.
This was a decrease from 2012, when giving towards Hurricane
Sandy relief efforts caused a surge in online fundraising. This metric
has moved up and down since 2010, and we expect these types of
fluctuations to continue in the future. Because online giving is the first-
response channel of choice for donors during episodic giving, there
will be times when online giving spikes.
Small organizations continue to lead the way with 7.8%, followed by
large nonprofits with 6.8%, and medium organizations with 5.4% of
total fundraising coming from online giving.
By splitting out healthcare organizations from medical research
institutions, a dramatic trend appears. Medical research groups raise
18.2% of their total fundraising from online giving, but healthcare
nonprofits raise only 3.5%. This highlights a key contrast between
organizations raising a significant amount of funds from peer-to-
peer events and the more traditional major gift focus of a healthcare
organization.
Over time, the increase in online giving by donors to the faith-based,
education, and human services sectors will drive the percentage of
overall fundraising that comes from online donations.
Percentage of Total Fundraising from Online Giving
Size YOY % Change
Small (Less than $1M) 7.8%
Medium ($1M - $10M) 5.4%
Large ($10M+) 6.8%
Total 6.4%
6.4%
In 2013, online giving accountedfor 6.4% of all charitable giving.
EDUCATIONARTS/CULTUREENVIRONMENT/
ANIMAL WELFARE FAITH-BASED HEALTHCAREHUMAN
SERVICESINTERNATIONAL
AFFAIRS
5.6% 3.5% 9.3% 18.2%6.8% 4.3%
MEDICALRESEARCH
PUBLIC/SOCIETYBENEFIT
4.9%4.2% 4.5%
© February 2014 | 2000 Daniel Island Drive, Charleston, SC 29492 T 800.443.9441 E [email protected] W www.blackbaud.com 8
2013 Charitable Giving Report
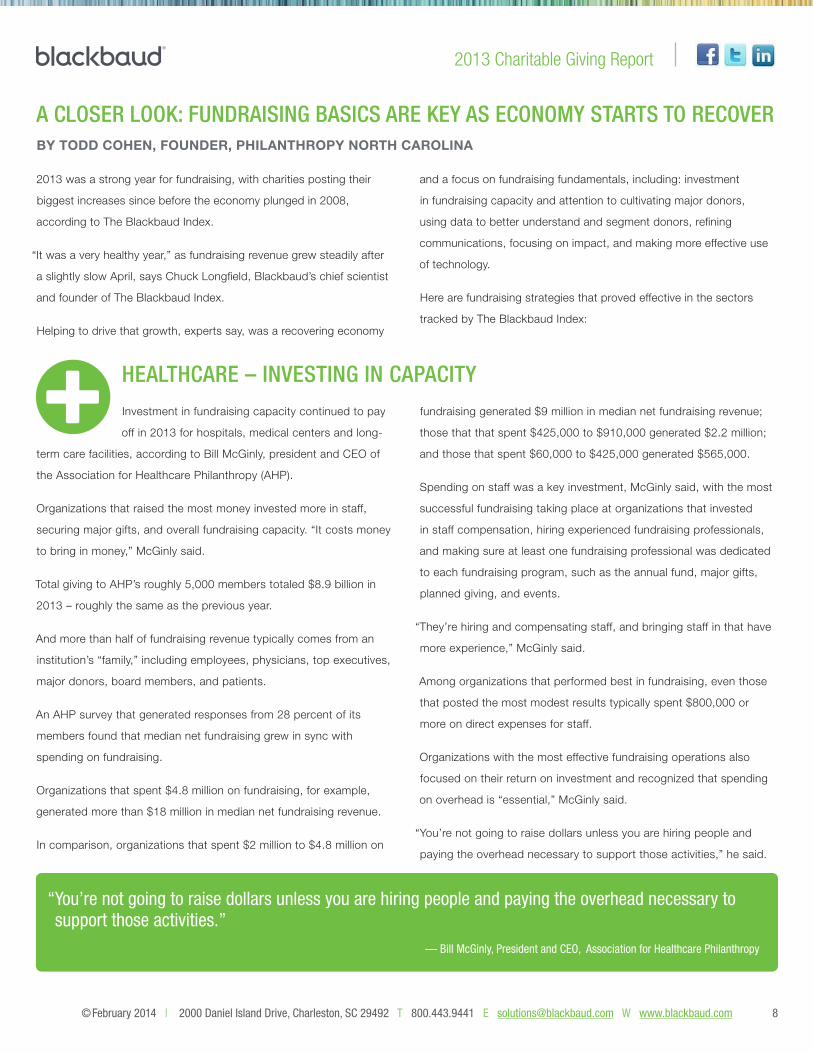
A CLOSER LOOK: FUNDRAISING BASICS ARE KEY AS ECONOMY STARTS TO RECOVER BY TODD COHEN, FOUNDER, PHILANTHROPY NORTH CAROLINA
2013 was a strong year for fundraising, with charities posting their
biggest increases since before the economy plunged in 2008,
according to The Blackbaud Index.
“It was a very healthy year,” as fundraising revenue grew steadily after
a slightly slow April, says Chuck Longfield, Blackbaud’s chief scientist
and founder of The Blackbaud Index.
Helping to drive that growth, experts say, was a recovering economy
and a focus on fundraising fundamentals, including: investment
in fundraising capacity and attention to cultivating major donors,
using data to better understand and segment donors, refining
communications, focusing on impact, and making more effective use
of technology.
Here are fundraising strategies that proved effective in the sectors
tracked by The Blackbaud Index:
HEALTHCARE – INVESTING IN CAPACITY
Investment in fundraising capacity continued to pay
off in 2013 for hospitals, medical centers and long-
term care facilities, according to Bill McGinly, president and CEO of
the Association for Healthcare Philanthropy (AHP).
Organizations that raised the most money invested more in staff,
securing major gifts, and overall fundraising capacity. “It costs money
to bring in money,” McGinly said.
Total giving to AHP’s roughly 5,000 members totaled $8.9 billion in
2013 – roughly the same as the previous year.
And more than half of fundraising revenue typically comes from an
institution’s “family,” including employees, physicians, top executives,
major donors, board members, and patients.
An AHP survey that generated responses from 28 percent of its
members found that median net fundraising grew in sync with
spending on fundraising.
Organizations that spent $4.8 million on fundraising, for example,
generated more than $18 million in median net fundraising revenue.
In comparison, organizations that spent $2 million to $4.8 million on
fundraising generated $9 million in median net fundraising revenue;
those that that spent $425,000 to $910,000 generated $2.2 million;
and those that spent $60,000 to $425,000 generated $565,000.
Spending on staff was a key investment, McGinly said, with the most
successful fundraising taking place at organizations that invested
in staff compensation, hiring experienced fundraising professionals,
and making sure at least one fundraising professional was dedicated
to each fundraising program, such as the annual fund, major gifts,
planned giving, and events.
“They’re hiring and compensating staff, and bringing staff in that have
more experience,” McGinly said.
Among organizations that performed best in fundraising, even those
that posted the most modest results typically spent $800,000 or
more on direct expenses for staff.
Organizations with the most effective fundraising operations also
focused on their return on investment and recognized that spending
on overhead is “essential,” McGinly said.
“You’re not going to raise dollars unless you are hiring people and
paying the overhead necessary to support those activities,” he said.
“You’re not going to raise dollars unless you are hiring people and paying the overhead necessary to support those activities.”
— Bill McGinly, President and CEO, Association for Healthcare Philanthropy

© February 2014 | 2000 Daniel Island Drive, Charleston, SC 29492 T 800.443.9441 E [email protected] W www.blackbaud.com 9
2013 Charitable Giving Report
AHP has encouraged its members to develop “dashboards” that track net
fundraising revenue, return on investment, and the cost to raise a dollar.
Organizations can use that data to measure gains and successes,
providing their executives and boards with information they need to
make decisions about fundraising strategies and investments.
While the cost of raising a dollar measures efficiency, McGinly said,
investment in overhead is equally important.
“A lot of organizations that are efficient aren’t raising the dollars they
need,” he said. “They lose an opportunity because they’re afraid to
take a risk or take advantage of something that’s really going to give
them a return.”
HIGHER EDUCATION – CULTIVATING MAJOR GIFTS
A rebounding economy and long-term investment
in major gift donors paid off for colleges and
universities in 2013, said John Lippincott, president of the Council
for Advancement and Support of Education (CASE).
Schools that have shown fundraising success are also doing a good
job in their stewardship of donors, including younger donors, by
engaging them in their institutions in ongoing ways, he said.
In a CASE survey a year ago, members said they expected 5.8
percent growth in giving in 2013 compared to 2012, a projected pace
roughly equivalent to the 20-year average growth for CASE members.
“We are now back to normal rates of growth in the aftermath of the
recession,” Lippincott said.
Driving that growth has been the recovering economy and the
cultivation of major gift donors, or those making gifts of seven figures
or more, he said.
In a fundraising campaign with a goal of $1 billion or more, 87 percent
of funds typically are given by one percent of donors, and those major
gifts generally are a function of “the number of
times you ask,” he said.
“What is accounting for the kind of success
people are anticipating comes down to the
development of the relationships with the
major donor community,” Lippincott said.
“Those donors are giving as a result of the
long-term relationships they have with the
institutions.”
Institutions that are doing well “are the ones that spent a lot of time
listening to their donors during the worst of the recession,” he said.
“And they’re reaping the benefits now.”
Key to cultivating those donors is finding ways to meet the growing
expectation of major donors to have “a level of engagement with the
institution beyond simply the transaction of the gift,” he said.
That kind of stewardship, which often can lead to future gifts, typically
involves inviting major donors to serve, either formally or informally, in
an advisory or governance role at the school so they truly become key
advisers and “stakeholders” in the institution, Lippincott said.
Colleges and universities are also looking for ways to maintain
relationships with major donors.
Scholarships represent a good opportunity to develop those
relationships by providing donors with ongoing interaction with
scholarship students, with the donors often serving as mentors for
the students.
Schools also have been working to better engage younger donors.
Research shows Millennial donors – or
those born between the early 1980s and
the early 2000s – are as generous as other
generations were at the same age, but that
they are “much more focused on wanting
to support the things that matter to them,”
Lippincott said.
“The appeal that institutions often will make is
a very specific appeal to people several years
“What is accounting for the kind of success people are anticipating comes down to the development of the relationships with the major donor community.”
— John Lippincott President,
CASE

© February 2014 | 2000 Daniel Island Drive, Charleston, SC 29492 T 800.443.9441 E [email protected] W www.blackbaud.com 10
2013 Charitable Giving Report
out of the institution,” he said, so those young alumni “can see how
this is going to have a meaningful and immediate impact,” he said.
A school might ask recent graduates and even current students to support
a bike-sharing program on campus, for example, because it’s “something
real that they can relate to, rather than a general appeal,” he said.
In comparison, said Lippincott, a 1971 graduate of Wesleyan
University, his annual gifts to his alma mater are made “out of a sense
of general obligation, rather than what my money is actually going to.”
Schools are also increasing use of digital media to more effectively
reach donors, and not only younger alumni, he said.
For younger donors, who handle many if not all of their transactions
online, digital media represents a natural platform for giving.
For those donors, social media also represent a platform that is
“more important for donor acquisition than it is for dollar acquisition,”
Lippincott said.
“Even if gifts from recent graduates are $10 or $25 gifts using social
media, it’s as important that you’ve gotten those recent graduates
into the habit of giving, and acquired information about what they’re
interested in, and can use that to sharpen the appeal,” he said.
Planned giving also has become a key fundraising program at many
colleges and universities.
Major donors, who account for most of the recent growth in
fundraising revenue, often want to make their gifts through planned
giving vehicles, Lippincott said.
And at a time of low interest rates, he said, donors often prefer planned
giving strategies, such as annuities that make regular payments to
donors, with the remainder of the gift going to the college or university.
“Those annuity payments now are quite appealing,” he said, “because
they frequently pay significantly higher interest rates, rather than
people parking their money in any fixed income asset.”
K-12 – DRIVEN BY DATA
Attention to data is driving fundraising at independent
schools, which have seen steady growth in
fundraising revenue since 2000, said Donna Orem, chief operating
officer at the National Association of Independent Schools (NAIS).
“The best schools have always been doing a lot of prospect
research and then looking at data and having it guide much of their
fundraising,” she said.
Median fundraising revenue grew to nearly $600,000 in the 2012-13
school year, up from about $500,000 in 2000, according to a survey of
NAIS member schools that generated responses from 970 institutions.
That growth was consistent for the period, except for a slight blip
during the recession, but even then many schools found they could
turn to a small number of donors who had the capacity to dig deeper
and who “understood the challenges schools were facing,” Orem said.
Schools are using data to better understand donors based on
factors such as gender and race, segmenting their base of donors
and prospects.
“The fundraiser today in an independent school does his or her
homework to really understand those nuances,” Orem said. And
with 10 percent of donors typically accounting for 90 percent of
“Most schools understand they have to have a very effective major gifts program, have to do research to understand who their best donors are, and have to have effective major gifts fundraisers who understand how to engage those donors, who need ongoing cultivation.”
— Donna Orem CEO,
National Association of Independent Schools (NAIS)

© February 2014 | 2000 Daniel Island Drive, Charleston, SC 29492 T 800.443.9441 E [email protected] W www.blackbaud.com 11
2013 Charitable Giving Report
fundraising revenue, she said, schools are focusing most of their
efforts in major-gift fundraising.
“Most schools understand they have to have a very effective major
gifts program, have to do research to understand who their best
donors are, and have to have effective major gifts fundraisers
who understand how to engage those donors, who need ongoing
cultivation,” she said.
And donors increasingly want to “be involved in the life of the school,”
she said, and to “understand how their money has been used, and
what the outcomes are.”
Schools also are looking for ways to cultivate students and young
alumni, and increasingly they are focusing on online and social media to
connect with them. And they are investing more in cultivating alumni.
Citing a groundbreaking 1998 study by Stanford University on alumni
giving, Orem said alumni who give the most “are those who feel most
connected to the school of today.”
Schools understand that “if the only time alumni hear from the school
is when they need money, they won’t get money,” she said.
So schools are developing programs to engage alumni, such as
programs in cities with large concentrations of alumni and travel
opportunities. They are also using social media to build alumni
communities.
Recognizing that grandparents increasingly are involved in their
grandchildren’s education, and often paying for it, schools also are
developing programs to engage grandparents in the life of the school.
A big challenge for independent schools, Orem said, is a shortage of
experienced development officers. With more nonprofits looking for
development officers, the recession prompting many development
officers to stay in their jobs, and older Baby Boomers beginning to retire,
schools have found it tougher and more expensive to fill openings.
Ultimately, whether a school is large or small, the key to effective
fundraising is to “create a culture of philanthropy,” Orem said.
“Just throwing people at the operation tends not to be so successful,”
she said.
What works, she said, is helping members of the school community
“understand why giving to the school is important to the life of the school,
and understanding that most schools don’t charge what it costs to
educate a child, and one of the most significant ways to make up those
dollars is through giving.”
INTERNATIONAL AFFAIRS – REFINING THE MESSAGE
With serious disasters abroad in 2013 eclipsing
those in the U.S., international aid organizations
showed an enhanced focus on disaster planning and preparation
before disasters, said Bob Ottenhoff, president and CEO of the
Center for Disaster Philanthropy.
International aid groups also have focused more attention on post-
disaster recovery and rebuilding, and they have turned increasingly to
social media to help educate donors about disaster needs, he said.
“We’re trying to help donors understand that if we can do better
planning, if we can help countries build and plan better, and if we can
put people and supplies in place before disasters,” he said, “we can
do a much more effective job. By getting people back into their homes,
kids back into school, and people back to work faster, we can reduce
the overall impact of a disaster.”
Traditionally, Ottenhoff said, 90 percent of donations for disaster relief
are made within 90 days of the event, with few donations being made
after that.
As a result, relief groups are working to help donors understand “there’s a
full arc of disaster relief” that includes pre-positioning supplies and people,
building connections with local relief groups, and preparing for post-
disaster recovery.
To help deliver that message, he said, international relief organizations are
making creative use of digital technology.
To “engage donors more in the unfolding of the story,” for example,
organizations are sending staff members into the field in disaster areas

© February 2014 | 2000 Daniel Island Drive, Charleston, SC 29492 T 800.443.9441 E [email protected] W www.blackbaud.com 12
2013 Charitable Giving Report
to file daily reports, often featuring video, to create a “more personal
engagement” with donors, Ottenhoff said.
International groups also have increased their engagement with local
teams of non-governmental organizations, or NGOs, that are much closer
to the areas hit by disasters and more familiar with events on the ground.
And international groups increasingly are functioning as “re-granters,”
passing on some of the funds they raise to local indigenous groups that
have experience working on the ground in the affected countries.
A big challenge for disaster philanthropy in recent years, Ottenhoff said, has
been to deal with “growing uneasiness about where the money’s going.”
In the immediate wake of disasters, donors often make contributions “in
the emotion of the moment, after watching television,” he said, “and
they’re not exactly sure where the money is going or what it will do.”
Months or years later, if they hear news reports that people in the
disaster area still are without homes, or that their lives have not been
rebuilt, he said, donors may become skeptical about making gifts for
relief in future disasters.
What donors may not understand, he said, is that disasters simply can
compound pre-existing and underlying problems.
The 2010 earthquake in Haiti is a perfect example, he said. “Haiti
was a vulnerable country with vulnerable populations well before that
earthquake hit,” he said. “Its problems didn’t start with the earthquake.”
To address donors’ skepticism, he said, “NGOs are trying to do a better
job of telling a fuller narrative about what’s involved in disaster relief.”
FAITH-BASED – FOCUS ON FUNDAMENTALS
For those faith-based-affiliated charities that are
increasing revenue, fundraising fundamentals
continue to drive that increase, said Rick Dunham, president and
CEO of Dunham & Company, a fundraising firm in Plano, Texas, with
just over 50 clients, including 30 based in the United States.
Those fundamentals include effective integration of communications
using multiple channels. Among them are direct mail, online
communications, and the use of telephone communications to
support those appeals. Other key fundamentals include attention to
major-donor development and a focus on the cause and the people
affected by the work of the charity.
That focus on fundamentals powered a strong year in 2013 for his
clients, some who saw fundraising revenue grow 25 percent to 30
percent, Dunham said.
Consistency in message across communications channels is critical,
he said. If a donor receives an appeal by email or direct mail,
for example, the message on the nonprofit’s website and in its
electronic communications should be consistent with the message
in those appeals.
Major donor development also should be integrated into a nonprofit’s
overall fundraising strategy, Dunham said.
Rather than treating them separately from other donors, he said,
organizations should make sure major donors receive the same types
of communications and messages that other donors receive, while
ensuring that those messages are customized in the communications
aimed at major donors.
Equally important, and where appropriate, Dunham said, nonprofits
should challenge donors with the potential to make significant
gifts, while integrating those challenges with other fundraising
communications.
Major donors should “experience the same communications as other
donors, but at a much higher level and customized to their significant
relationship with the charity,” Dunham said.
Direct mail appeals continue to be more effective at generating
contributions than online appeals, Dunham said. “A truly effective direct-
mail strategy will always outperform an online appeal strategy,” he said.
But when both strategies are integrated, a growing number of
donors prefer to fulfill their gift online using their credit card. “That’s
why you want to make sure the donor experiences the same
messaging” online that they get through direct mail, Dunham said.

© February 2014 | 2000 Daniel Island Drive, Charleston, SC 29492 T 800.443.9441 E [email protected] W www.blackbaud.com 13
2013 Charitable Giving Report
For year-end appeals in 2013, he said, some of his clients used
a “takeover” strategy for their websites, with the messaging that
donors were receiving through direct mail and email taking over the
organization’s websites and becoming the main message donors
were finding online.
“It’s not a driver to income,” he said. “Such a strategy helps ensure
that when a person comes to the charity’s website, there’s not
confusion with the message but consistency through all channels.”
Dunham said his clients also used a phone strategy to set up
year-end appeals by thanking donors for previous support and then
reinforcing year-end gifts with follow-up calls after gifts were made –
all with consistent messages across all platforms.
And whatever the particular focus of a multi-channel appeal, faith-
based nonprofits should focus on the “why” of the organization, the
cause, the people affected…not the “what,” Dunham said.
“The fact that we’re doing a specific project is not what motivates
the most significant support,” he said, “but ‘why’ we’re doing that
project – to transform lives and the way such a project helps people.”
ARTS AND CULTURE – GIVING FOR IMPACT
Museums have shifted the focus of their fundraising
to better address demand from donors who want to
know the difference their gift makes, said Ford Bell, president of the
American Alliance of Museums.
“It’s not enough to say we want another picture or exhibit,” he said of
fundraising appeals by museums. “Donors want to know our impact
on the community.”
With donors receiving a growing number of funding requests from
nonprofits that address basic needs such as shelter, food, and
clothing, Bell said, museums have been doing a much better job
talking about the diverse roles they play in their communities.
The 17,500 museum institutions in the U.S. that range from art
museums to zoos provide 18 million instructional hours a year, often
offering targeted programs for a broad range of audiences.
Those audiences, to name just a few, include
patients with Alzheimer’s disease and their
caregivers; children on the autism spectrum;
new Americans; children and families involved
in the juvenile justice system; and people
concerned with hunger and food security.
“Museums are engaged in a wide variety of community issues today,”
Bell said. “We really have hidden our light under a bushel. People
don’t think of us as educational institutions.”
Museums also are using a variety of fundraising strategies, depending
on donors’ age, interests, and capacity to give.
Recognizing that younger donors are looking for results and want to
be involved in the organizations they support, for example, museums
are creating “an experience that’s meaningful and relevant for them,”
Bell said. “Museums need those younger generations to feel the
museum is a place they want to be part of.”
So museums are offering travel opportunities, taking people to
lunch, meeting with them personally, and inviting them to serve on
the board. And donors who make larger gifts are receiving more
personal attention, including events designed specifically for them.
Whether targeting younger donors or major donors, museums
increasingly are using digital and social media to communicate, and
refining their message to be more relevant, Bell said.
The key is to “show them what you’re doing
in the community, and also to engage them
in that work,” Bell said. “There’s still a
problem in the museum field. People still feel
we hang stuff on walls. People have to see
we’re making a difference in the community.”
Whether for young adults or new Americans, he says, “we’re trying to
get them in the door.”
“We really have hidden our light under a bushel.”
— Ford Bell President,
American Alliance of Museums

© February 2014 | 2000 Daniel Island Drive, Charleston, SC 29492 T 800.443.9441 E [email protected] W www.blackbaud.com 14
2013 Charitable Giving Report
PUBLIC SOCIETY BENEFIT – DIVERSIFICATION AND IMPACT
With growth in fundraising increasing only modestly
in recent years, United Way has been diversifying its
fundraising and focusing on its impact, said Sherrie Brach, executive
vice president of investor relations at United Way Worldwide.
That strategy has included targeting women, young professionals,
and major donors; engaging workplace donors as volunteers;
focusing on solving community problems; and “productizing” priority
community initiatives to generate new investment opportunities for
individuals, corporations, and foundations, Brach said.
United Way also has made it a priority over the next two to three
years to use mobile and social media strategies to engage donors.
United Way affiliates throughout the world raised a total of $5.2
billion in 2012, reflecting overall growth of 1 percent to 1.5 percent in
the United States and seven percent outside the United States, said
Brach, a former CEO of United Way of Greater Richmond
and Petersburg.
“In 2013, we anticipate the trend to continue in overall fundraising,”
she said. “We are experiencing slow but steady growth.”
Workplace campaigns remain United Way’s biggest channel for
giving, with corporations representing the biggest sources of revenue
through corporate gifts and access to employee giving.
But United Way no longer is relying only on “transactional” fundraising
through workplace giving, and in recent years has segmented its
fundraising by types of donors and tried “to connect more directly with
individuals than through the workplace channel,” Brach said.
Ten years ago, in Greensboro, North Carolina, United Way launched
its first affinity group for women, an effort that has been adopted
at many affiliates and been expanded to include affinity groups for
young professionals.
Those efforts, along with efforts to generate “leadership” gifts of
$1,000 or more, and “Tocqueville” gifts of $10,000 or more, have
represented most of the growth in United Way giving, which has
increased at a rate of one-to-two percent a year since the economy
collapsed in 2008, Brach said.
United Way also is partnering with companies to connect with
individual donors, often by providing opportunities to volunteer for
community projects that are in sync with the companies’ business.
And by setting education, income, and health as priority community
needs, as well as creating special initiatives to address those needs,
United Way has created new opportunities both for volunteerism and
for giving.
“It’s a holistic strategic approach to solving community problems, and
you can create investment opportunities for individuals, high-end
donors, corporations, and foundations that bring investment into our
work,” Brach said.
Local United Ways that have taken that approach have developed
more diversified funding streams, and while their campaigns have
been growing only modestly, those new sources of income have
grown more dramatically, Brach said.
In addition to $79.5 million raised through its annual workplace
campaign and corporate giving, for example, Wells Fargo also has
contributed a $5 million grant to develop a “Financial Capability
Network” in partnership with United Way.
“We don’t just measure the annual campaign,” Brach said. “We’re
now looking at total current-year support.”
A handful of local United Ways also have begun large endowment
campaigns focused on their community initiatives, and some have
received six-figure and eight-figure gifts to support them.
Now, United Way is looking at ways to use digital media more
strategically to engage donors. “That’s the only way we’re going
to connect with young people and individuals,” Brach said. “The
challenge we have is how to articulate and communicate and
represent our work through online engagement in a way that
connects quickly with donors.”
© February 2014 | 2000 Daniel Island Drive, Charleston, SC 29492 T 800.443.9441 E [email protected] W www.blackbaud.com 15
2013 Charitable Giving Report
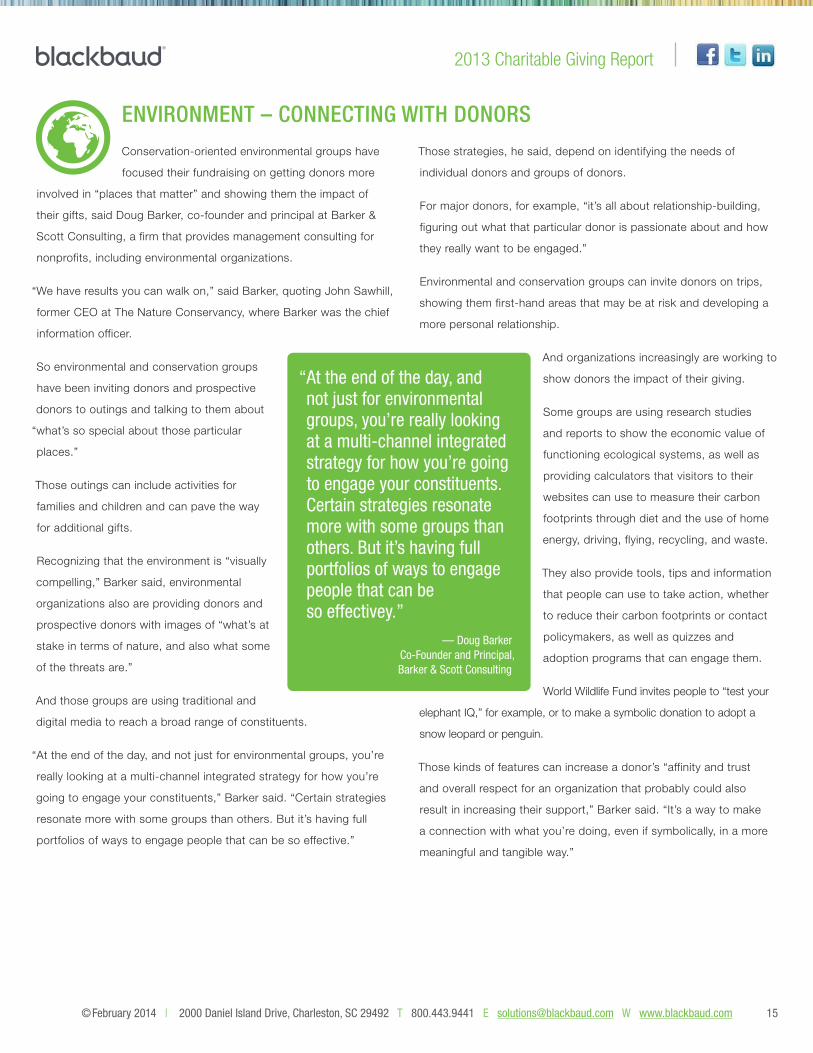
ENVIRONMENT – CONNECTING WITH DONORS
Conservation-oriented environmental groups have
focused their fundraising on getting donors more
involved in “places that matter” and showing them the impact of
their gifts, said Doug Barker, co-founder and principal at Barker &
Scott Consulting, a firm that provides management consulting for
nonprofits, including environmental organizations.
“We have results you can walk on,” said Barker, quoting John Sawhill,
former CEO at The Nature Conservancy, where Barker was the chief
information officer.
So environmental and conservation groups
have been inviting donors and prospective
donors to outings and talking to them about
“what’s so special about those particular
places.”
Those outings can include activities for
families and children and can pave the way
for additional gifts.
Recognizing that the environment is “visually
compelling,” Barker said, environmental
organizations also are providing donors and
prospective donors with images of “what’s at
stake in terms of nature, and also what some
of the threats are.”
And those groups are using traditional and
digital media to reach a broad range of constituents.
“At the end of the day, and not just for environmental groups, you’re
really looking at a multi-channel integrated strategy for how you’re
going to engage your constituents,” Barker said. “Certain strategies
resonate more with some groups than others. But it’s having full
portfolios of ways to engage people that can be so effective.”
Those strategies, he said, depend on identifying the needs of
individual donors and groups of donors.
For major donors, for example, “it’s all about relationship-building,
figuring out what that particular donor is passionate about and how
they really want to be engaged.”
Environmental and conservation groups can invite donors on trips,
showing them first-hand areas that may be at risk and developing a
more personal relationship.
And organizations increasingly are working to
show donors the impact of their giving.
Some groups are using research studies
and reports to show the economic value of
functioning ecological systems, as well as
providing calculators that visitors to their
websites can use to measure their carbon
footprints through diet and the use of home
energy, driving, flying, recycling, and waste.
They also provide tools, tips and information
that people can use to take action, whether
to reduce their carbon footprints or contact
policymakers, as well as quizzes and
adoption programs that can engage them.
World Wildlife Fund invites people to “test your
elephant IQ,” for example, or to make a symbolic donation to adopt a
snow leopard or penguin.
Those kinds of features can increase a donor’s “affinity and trust
and overall respect for an organization that probably could also
result in increasing their support,” Barker said. “It’s a way to make
a connection with what you’re doing, even if symbolically, in a more
meaningful and tangible way.”
“At the end of the day, and not just for environmental groups, you’re really looking at a multi-channel integrated strategy for how you’re going to engage your constituents. Certain strategies resonate more with some groups than others. But it’s having full portfolios of ways to engage people that can be so effectivey.”
— Doug Barker Co-Founder and Principal, Barker & Scott Consulting

© February 2014 | 2000 Daniel Island Drive, Charleston, SC 29492 T 800.443.9441 E [email protected] W www.blackbaud.com 16
2013 Charitable Giving Report
HUMAN SERVICES – COMMUNICATION AND PLANNING
Human services organizations, faced with uncertain
government funding, are turning increasing attention
to communicating more effectively and planning more strategically, said
Michael Nilsen, vice president for public affairs at the Association of
Fundraising Professionals.
That includes rebranding themselves, telling their stories more
effectively, assessing the impact of their programs, making better
use of digital technology, and turning to donors for advice, he said.
While human services nonprofits typically depend on government
funds for much of their budgets, smaller organizations generally lack
the resources of larger organizations and need to be more nimble in
adjusting to changes in government support, Nilsen said.
With cuts and instability in government funding, he said, many
human-services groups are looking at ways to communicate more
effectively and to reposition themselves in their communities. And
their need to better define their programs and impact is critical.
“They took their donors for granted, and in doing so they failed to
really connect with donors and tell them how they’re impacting the
community, so now that’s a huge priority,” Nilsen said.
Now, he said, human services groups are “changing what they’re saying
and focusing on impact, storytelling, and direct connection with donors.”
With the number of human services groups growing and often
competing for contributed income, Nilsen said, they need to do a
better job differentiating themselves.
Human services organizations in general, he said, tend to lag behind
in their branding, storytelling, and ability to communicate their impact
“because they haven’t had to because of government funds,” he said.
All nonprofits, including those that focus on human services, are also
increasing their use of special events to generate revenue – a trend
that most likely reflects a rebound in the overall economy, Nilsen said.
And as human services groups work to rebrand and differentiate
themselves, they are looking “to diversify, but stay focused,”
experimenting to identify what works, and then setting priorities
based on “what brings the best return,” he said.
“They can’t just keep programs going that aren’t working,” he said.
Nonprofits also are looking for ways to make more effective use of
social media, and particularly videos, he said. Plus, they increasingly
are involving donors as a “springboard for ideas,” asking them for
feedback and advice “about where to go, not just with programs, but
also with fundraising.”
Critical to the health of human services nonprofits, Nilsen said, is
planning that is intentional and strategic.
“We’ve gotten out of the worst” of the economic decline, “and if we
are going to really make it and be successful, we’ve got to move,
but quickly and nimbly, with real purpose,” he said. “We’re at a
crossroads. With the economy expected to improve, if you miss this
boat, you’re not going to do well over the next couple of years.”
MEDICAL RESEARCH: PEER-TO-PEER FUNDRAISING
Smaller nonprofits increasingly are using readily
available technology to engage peer networks to
raise money through athletic events, said David Hessekiel, president of
The Run Walk Ride Fundraising Council.
In 2012, the top 30 peer-to-peer fundraising programs raised a total
of $1.68 billion for nonprofits, with the overwhelming majority of
those groups involved in health and medical research, he said.
Peer-to-peer fundraising events generally fall into three categories, he
said, including “proprietary,” “endurance,” and “independent” programs.
Proprietary programs are those that are created and managed by
nonprofits. The top three are the American Cancer Society’s Relay
for Life, Susan G. Komen Race for the Cure, and March of Dimes’
March for Babies.

© February 2014 | 2000 Daniel Island Drive, Charleston, SC 29492 T 800.443.9441 E [email protected] W www.blackbaud.com 17
2013 Charitable Giving Report
“They have created their own entity, a walk or a run, that they invite
supporters to participate in,” Hessekiel said, “and those supporters –
whether participating as individuals or members of a team – ask their
friends and acquaintances to give money in honor of the effort they
are supporting.”
Endurance fundraising focuses on engaging supporters to participate
in “third-party” programs, such as the Team in Training program of
the Leukemia & Lymphoma Society.
“Thousands of people each year run in marathons and half-marathons
and do triathalons,” Hessekiel said. “They’re participating in events
that nonprofits do not own.”
But Team in Training and other endurance programs “provide various
forms of support for participants to train for endurance events and
fundraise,” he said. “They leverage the popularity of events like the Rock
‘n’ Roll Marathon and the New York Marathon to get people involved.”
Independent fundraising consists of supporters “approaching
charities and saying, ‘We want to support you, but we want to do it
in our own way,’” Hessekiel said.
That could involve anything from staging a walk, run, climb, swim,
dance, marathon, or other type of physical event, to throwing a party
and inviting people to come and make a contribution.
“More and more of this is taking place, thanks to technology that
makes it easy for people to raise money online and for organizations
to communicate with those fundraisers,” Hessekiel said.
The last five years have seen a flowering of smaller peer-to-peer
fundraising programs, he said.
“Because of the democratization of peer-to-peer fundraising – the
lowering of fundraising and communications barriers for nonprofits and
individuals – the number of programs has been increasing,” he said.
Still, while the number of new peer-to-peer programs has grown,
fundraising revenue that big proprietary programs generate has remained
flat, he said. Nonprofits considering peer-to-peer programs should set
realistic goals and recognize the costs that will required, Hessekiel said.
“I run The Run Walk Ride Council, but I’m a big proponent of ‘crawl,
walk, and then run,’” he said.
Organizations that create their own proprietary programs “are
responsible for everything, from making sure there are portable
toilets on site to getting permits to take over streets, and it’s a major
investment,” he said. “Those programs usually take several years to
actually be profitable for the organization.”
And while they can be highly successful for an organization, he said,
“the marketplace for traditional walks is quite crowded.”
Technology, however, now makes it easy to create “a structure for your
most passionate supporters to be able to run their own events,” he said.
“If you have passionate supporters, you can also give them the tools
they need to do endurance fundraising on your behalf,” he said. “The
startup costs and risk involved with those programs are far smaller
than creating your own proprietary programs. It’s a lower-risk way of
getting a feel for this form of fundraising.”
Increasingly for smaller organizations, he said, “experimenting with
and benefiting from peer-to-peer fundraising is another tool in their
development chest.”
“I run The Run Walk Ride Council, but I’m a big proponent of ‘crawl, walk, and then run’.”— David Hessekiel
President, The Run Walk Ride Fundraising Council

© February 2014 | 2000 Daniel Island Drive, Charleston, SC 29492 T 800.443.9441 E [email protected] W www.blackbaud.com 18
2013 Charitable Giving Report
ABOUT THE 2013 CHARITABLE GIVING REPORT
The findings in this Report are based on giving data from 4,129 nonprofit organizations and more than $12.5 billion in fundraising revenue. The online
fundraising findings are based on data from 3,359 nonprofit organizations and more than $1.7 billion in online fundraising revenue.
To be included in the analysis, these organizations needed to have 24 months of complete giving data with no gaps or missing information. Each
organization was then classified by sector using its NTEE code as reported on its 990 tax return. (If you are not sure what sector your organization is
classified as, you may refer to your 990 to find your NTEE code. Visit http://nccs.urban.org/classification/NTEE.cfm for a complete listing of sectors.)
Organizations were then grouped into three size categories: total annual fundraising less than $1 million (small), total annual fundraising between $1
million and $10 million (medium), and total annual fundraising exceeding $10 million (large). This is based on recorded giving in their fundraising systems,
reported fundraising in IRS Form 990 data, and matching done through the National Center for Charitable Statistics.
Organizations without all the research criteria were not included in this analysis. Organizations based outside the United States were excluded from this
analysis. We do not include the unfulfilled portion of pledge gifts. Giving USA data is used to weight the data to ensure that no individual organization or
sector is overrepresented in the analysis.
The percentage of total fundraising from online giving is based on 3,135 nonprofits in The Blackbaud Index. These organizations represent $10.8 billion
in total fundraising.
This Report would not be possible without the statistical number crunching muscle of Jim O’Shaughnessy, the dexterous design of Lucy Meyer, the
industrious interviewing of Todd Cohen, the eagle-eye editing of Melanie Mathos and Heather Friedrichs Lyman, and the wisdom and support of Chuck
Longfield. A big thank you to each and everyone involved in making it happen.
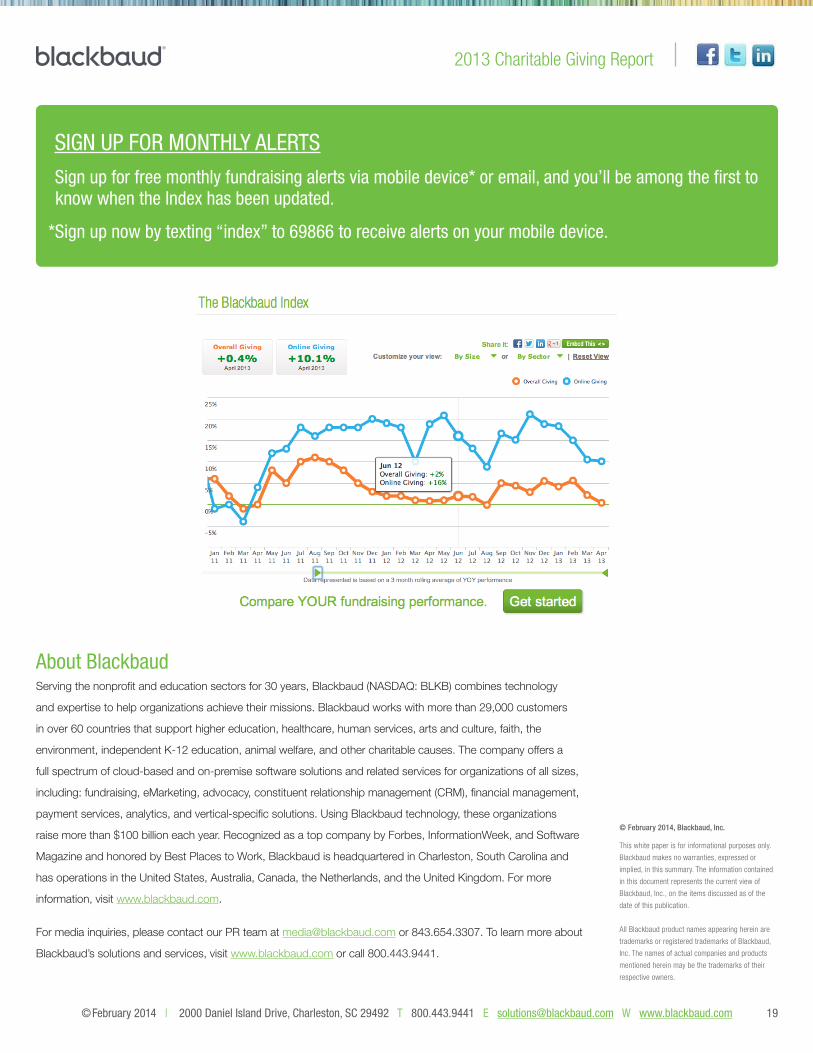
ABOUT THE BLACKBAUD INDEX
Economic conditions, natural disasters, and market fluctuations have made it extremely difficult for nonprofits to make fundraising decisions
informed by the latest donor behavior. That is why we created The Blackbaud Index in 2010 — to provide insight into what happened in the
prior few weeks and valuable analysis by leaders in the sector into what fundraisers can learn from it.
The Blackbaud Index brings you the most up-to-date information on charitable giving today. Tracking approximately $13 billion in US-based
charitable giving, the Index is updated on the first of each month and is based on year-over-year percent changes. Featuring overall and online
giving, the Index can be viewed by size and sub-sectors of the nonprofit industry. Visit www.blackbaud.com/blackbaudindex to experience the
recently-enhanced interactive Index charts, where you can easily compare by size or sector and view historical performance.
© February 2014 | 2000 Daniel Island Drive, Charleston, SC 29492 T 800.443.9441 E [email protected] W www.blackbaud.com 19
2013 Charitable Giving Report
© February 2014, Blackbaud, Inc.
This white paper is for informational purposes only.
Blackbaud makes no warranties, expressed or
implied, in this summary. The information contained
in this document represents the current view of
Blackbaud, Inc., on the items discussed as of the
date of this publication.
All Blackbaud product names appearing herein are
trademarks or registered trademarks of Blackbaud,
Inc. The names of actual companies and products
mentioned herein may be the trademarks of their
respective owners.
About BlackbaudServing the nonprofit and education sectors for 30 years, Blackbaud (NASDAQ: BLKB) combines technology
and expertise to help organizations achieve their missions. Blackbaud works with more than 29,000 customers
in over 60 countries that support higher education, healthcare, human services, arts and culture, faith, the
environment, independent K-12 education, animal welfare, and other charitable causes. The company offers a
full spectrum of cloud-based and on-premise software solutions and related services for organizations of all sizes,
including: fundraising, eMarketing, advocacy, constituent relationship management (CRM), financial management,
payment services, analytics, and vertical-specific solutions. Using Blackbaud technology, these organizations
raise more than $100 billion each year. Recognized as a top company by Forbes, InformationWeek, and Software
Magazine and honored by Best Places to Work, Blackbaud is headquartered in Charleston, South Carolina and
has operations in the United States, Australia, Canada, the Netherlands, and the United Kingdom. For more
information, visit www.blackbaud.com.
For media inquiries, please contact our PR team at [email protected] or 843.654.3307. To learn more about
Blackbaud’s solutions and services, visit www.blackbaud.com or call 800.443.9441.
SIGN UP FOR MONTHLY ALERTS
Sign up for free monthly fundraising alerts via mobile device* or email, and you’ll be among the first to know when the Index has been updated.
*Sign up now by texting “index” to 69866 to receive alerts on your mobile device.
Related Documents